 Creating the Premier Commercial Bank in Southern California June 3, 2014 NASDAQ: CUNB OTCQB: FENB Exhibit 99.2 |
 Forward-Looking Statements This presentation includes forward-looking statements within the meaning of the “Safe-Harbor” provisions of the Private Securities Litigation Reform Act of 1995, which management believes are a benefit to shareholders. These statements are necessarily subject to risk and uncertainty and actual results could differ materially due to certain risk factors, including those set forth from time to time in CU Bancorp’s filings with the SEC. You should not place undue reliance on forward-looking statements and we undertake no obligation to update any such statements. Specific risks in this presentation include whether shareholders approve the merger, whether the companies receive regulatory approvals, the timing of closing, whether the companies have accurately predicted acquisition and consolidation expenses, the timing and amount of savings from consolidation, the expected earnings contributions of both companies and management’s ability to effectively integrate the companies. This presentation may be deemed to be offering or solicitation materials of CU Bancorp and 1st Enterprise Bank in connection with the proposed merger of 1st Enterprise Bank with and into California United Bank. Shareholders of both companies are urged to read the joint proxy statement/prospectus that will be included in the registration statement on Form S-4, which CU Bancorp will file with the SEC in connection with the proposed acquisition, because it will contain important information about CU Bancorp, 1st Enterprise Bank, the acquisition and related matters. The directors and executive officers of CU Bancorp and 1st Enterprise Bank may be deemed to be participants in the solicitation of proxies from their respective shareholders. Information regarding CU Bancorp and security holdings of its officers, directors and principal shareholders can be found in CU Bancorp’s most recent Form 10-KA filed with the SEC. Information as to both CU Bancorp and 1st Enterprise Bank and the securities holdings of their respective officers, directors and principal shareholders will be included in the joint proxy statement/prospectus when it is filed with the SEC. All documents which are filed with the SEC in connection with this transaction are or will be available for free, both on the SEC web site (http://www.sec.gov) and from CU Bancorp by directing a request to CU Bancorp 15821 Ventura Boulevard, Suite 100, Encino, California; Attention: Corporate Secretary and from 1st Enterprise Bank by directing a request to 1st Enterprise Bank at 818 West 7th Street, Suite 220, Los Angeles, CA, Attention: Corporate Secretary. Pro forma, projected and estimated numbers are used for illustrative purposes only and are not forecasts, and actual results may differ materially. 2 |
 3 Transaction Rationale Combination to create a $2.2 billion “pure play” business bank in Southern California Both companies have a track record of strong organic growth Scarcity value for a business banking franchise in Southern California Southern California offers an unparalleled opportunity for middle market business banks Cultural similarities Focused on small to mid-sized businesses as target clients High quality deposit base (> 50% noninterest bearing deposits and 0.11% cost of deposits) Conservative credit cultures and similar loan portfolio mix (> 50% combined C&I and OO CRE) Performance driven business development philosophy Management team comprised of veteran Southern California business bankers Complementary strengths provide opportunities for revenue synergies Partnership approach to create the “best-in-class” group of banking professionals for the pro forma company Pro forma branch network covers the greater Los Angeles market Leverages capital and increases liquidity Draws on CUNB’s strong track record of transaction execution Financially compelling projected pro forma results Strategic Partnership Enhances Value of Both Franchises Source: SNL Financial as of March 31, 2014 |
 Summary of Terms Name: CU Bancorp / California United Bank Headquarters: Downtown Los Angeles (Current FENB headquarters) Management: Chairman and CEO, David I. Rainer (current Chairman, President and CEO of CUNB) Board Composition: 8 CUNB / 4 FENB Ownership: 68% CUNB / 32% FENB Consideration: 1.3450 shares of CUNB stock for each FENB share 100% stock consideration; fixed exchange ratio Equivalent to $24.47 per FENB share ¹ 13% premium to FENB’s last closing price ² Deal value of approximately $103 million ¹ 16.9x 2014 analyst EPS estimate 172% of tangible book value per share ³ Timing: Expected to close in Q4 2014 1 Based on CUNB closing price of $18.19 on June 2, 2014 2 Based on FENB closing price of $21.75 on June 2, 2014 3 As of March 31, 2014 4 President, K. Brian Horton (current President of FENB) Chief Financial Officer, Karen A. Schoenbaum (current CFO of CUNB) |
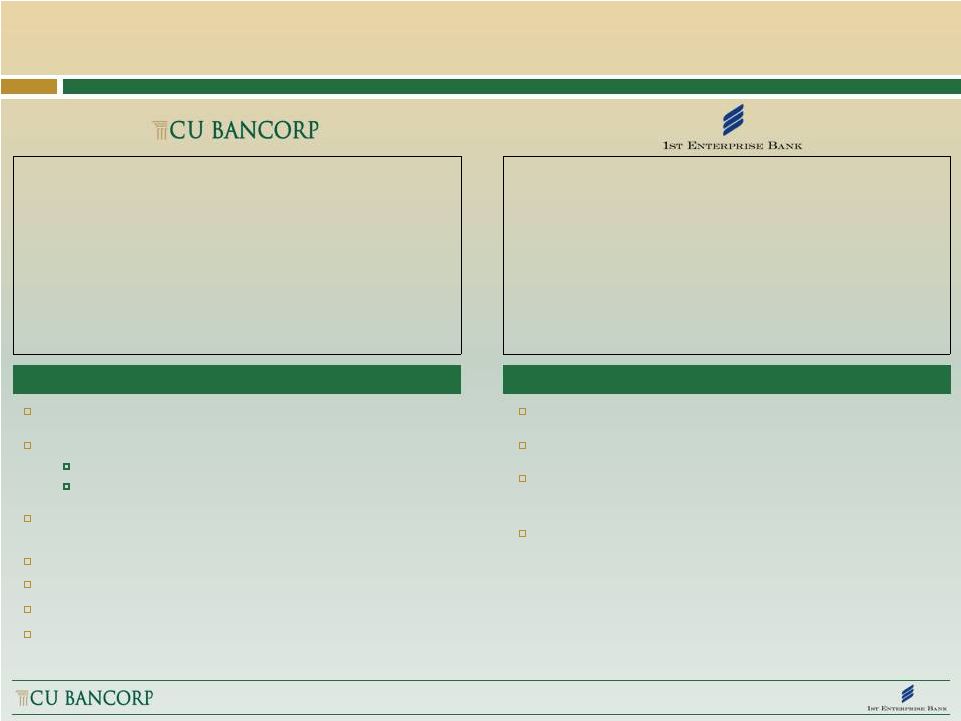 5 Company Overviews Established in 2005 Completed two accretive transactions California Oaks State Bank (12/31/10) Premier Commercial Bancorp (7/31/12) Raised $22.0 million and $10.3 million of common equity in 2006 and 2011, respectively Listed on NASDAQ Capital Market in October 2012 Added to Russell 3000 Index in June 2013 12.1% insider ownership ¹ 36.4% institutional ownership ¹ Established in 2006 Raised $12.5 million of common equity in 2012 Funded $16.4 million of SBLF preferred equity in 2011 17.8% insider ownership ² Company Highlights Company Highlights 1 Source: SNL Financial as of June 2, 2014 2 Source: Company information, as of May 15, 2014 Headquarters Encino, CA Branches 8 Total Assets ($mm) $1,382 Gross Loans ($mm) $946 Total Deposits ($mm) $1,203 Noninterest Bearing Deposits (%) 54% C&I + Own. Occ. CRE (%) 52% NPAs / Assets (%) 0.60% LTM Net Income to Common ($mm) $10.3 Headquarters Los Angeles, CA Branches 3 + 1 LPO Total Assets ($mm) $776 Gross Loans ($mm) $513 Total Deposits ($mm) $652 Noninterest Bearing Deposits (%) 49% C&I + Own. Occ. CRE (%) 59% NPAs / Assets (%) 0.57% LTM Net Income to Common ($mm) $5.3 |
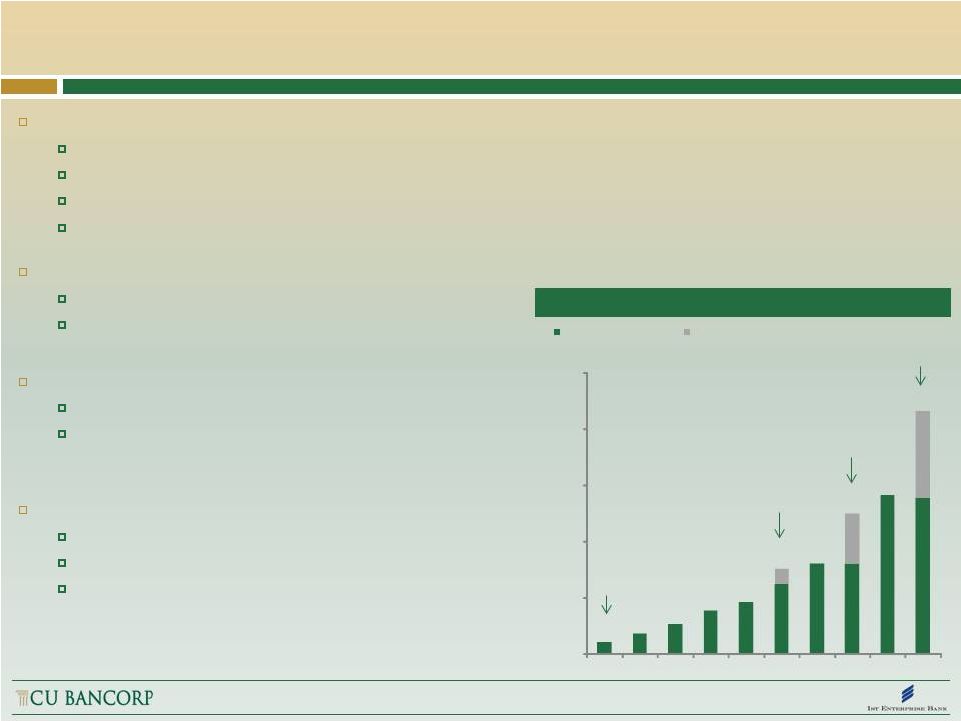 Creating the Premier Commercial Bank in Southern California Strategic branch locations in growth markets with enormous potential customer base Branches offer full array of banking services with easy freeway access and good visibility Footprint over four Southern California counties: Los Angeles, Orange, San Bernardino and Ventura Los Angeles County is the largest manufacturing center in the U.S. ¹ Four-county area is home to more than 550,000 small- to mid-sized businesses – core of the Southern CA economy² Solid core deposits > 50% non-interest bearing $100 million+ target size for branches Diversification of loan type and customer base C&I and Own. Occ. CRE loans represent > 50% of total loans Typical customers represent manufacturing, distribution and services industries Strong leadership with deep roots in the community Experienced teams live and work in community Advisory boards composed of local business and civic leaders Supporting nonprofits strengthens ties to customers and community 1 Source: LAEDC Kyser Center for Economic Research 2 Source: California Employment Development Department. Includes businesses with 1-499 workers $102 $178 $260 $379 $457 $756 $800 $1,250 $1,408 $2,158 $0 $500 $1,000 $1,500 $2,000 $2,500 2005 2006 2007 2008 2009 2010 2011 2012 2013 Q1'14 Organic Assets ($mm) Assets Acquired in Year ($mm) California Oaks State Bank acquisition closes ($137 Million) Premier Commercial Bank acquisition closes ($450 Million) FENB acquisition ($776 Million) CUNB Asset Growth Since Inception 6 IPO |
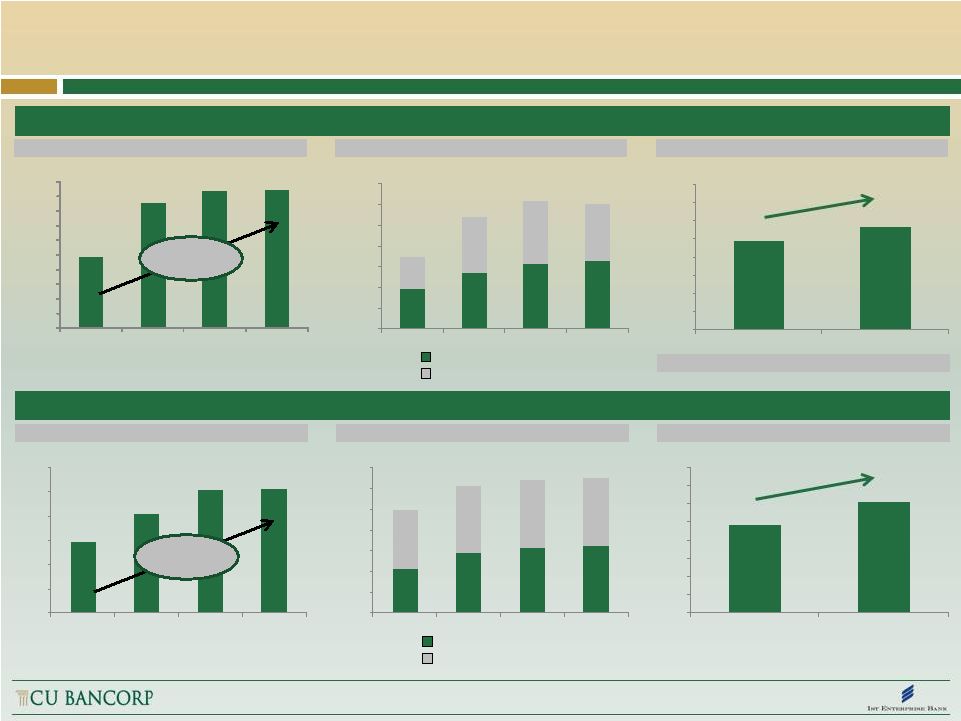 7 $4.8 $6.1 $0.0 $1.0 $2.0 $3.0 $4.0 $5.0 $6.0 $7.0 $8.0 2013 2014E² $9.8 $11.3 $0.0 $2.0 $4.0 $6.0 $8.0 $10.0 $12.0 $14.0 $16.0 2013 2014E Combination of Two Growth-Oriented Franchises Source: SNL Financial 1 Mean analyst estimate as of June 2, 2014 2 Analyst estimate as of June 2, 2014 CUNB Performance FENB Performance Gross Loans ($mm) Total Deposits ($mm) Net Income to Common ($mm) Gross Loans ($mm) Total Deposits ($mm) Net Income to Common ($mm) 26% 2013 represents 1st full year impact of PCB 16% Noninterest bearing deposits Interest bearing deposits $489 $855 $933 $946 $0 $100 $200 $300 $400 $500 $600 $700 $800 $900 $1,000 2011 2012 2013 Q12014 $381 $544 $632 $652 $309 $535 $600 $552 $691 $1,078 $1,232 $1,203 $0 $200 $400 $600 $800 $1,000 $1,200 $1,400 2011 2012 2013 Q12014 $215 $287 $316 $322 $282 $325 $327 $330 $497 $612 $643 $652 $0 $100 $200 $300 $400 $500 $600 $700 2011 2012 2013 Q12014 $293 $409 $505 $513 $0 $100 $200 $300 $400 $500 $600 2011 2012 2013 Q12014 Noninterest bearing deposits Interest bearing deposits 34% CAGR 28% CAGR 1 |
 8 Attractive Footprint and Large Branch Size CUNB (8 branches) FENB (3 branches; 1 LPO) Inland Empire: FENB: $81 million Downtown LA: FENB: $331 million Irvine/Newport Beach: CUNB: $148 million FENB: $240 million Pro Forma: $388 million Santa Clarita Valley: CUNB: $94 million Simi Valley: CUNB: $14 million Conejo Valley: CUNB: $229 million West LA: CUNB: $256 million San Fernando Valley: CUNB: $207 million Anaheim: CUNB: $191 million $100 Million+ Branches Source: CUNB and FENB; branch deposits data as of March 31, 2014 Woodland Hills LPO South Bay: CUNB: $55 million Pro forma average branch size of approx. $185 million in deposits 6 of 10 pro forma branches with deposits greater than $100 million Expands CUNB’s branch presence to Downtown LA (pro forma headquarters) and Inland Empire Branch consolidation in Irvine Woodland Hills LPO to be consolidated into a CUNB branch |
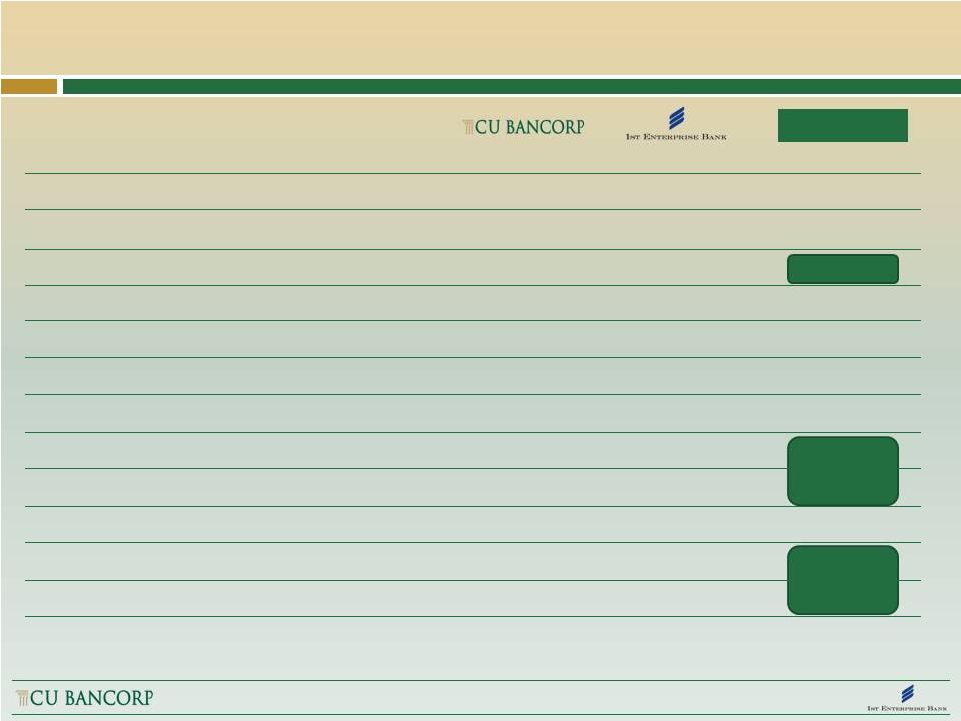
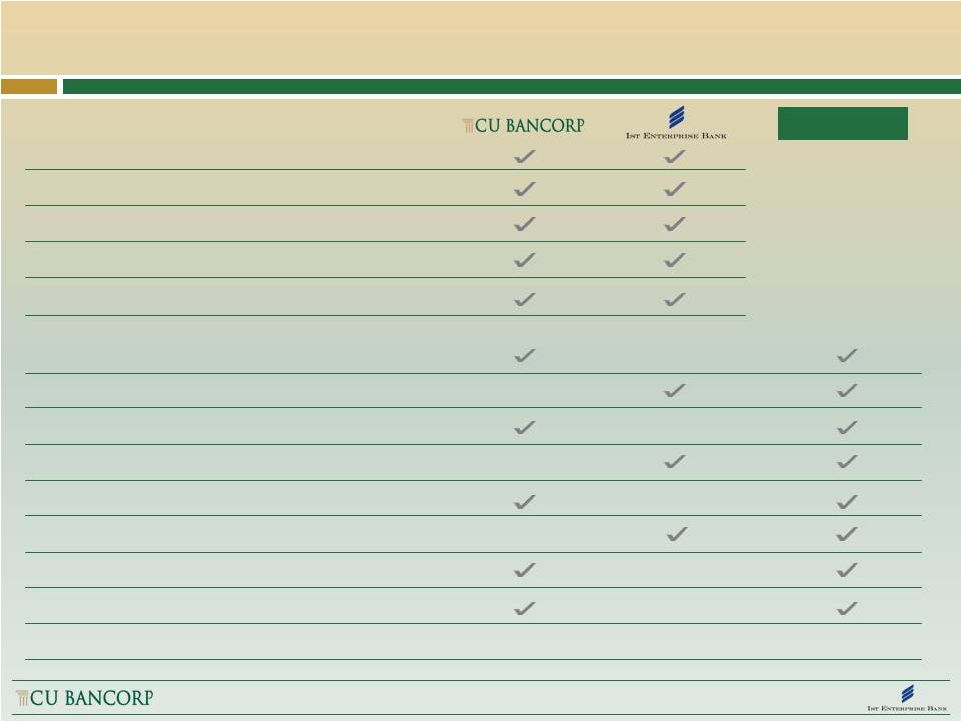 9 Similar Strengths, Complementary Differences Loan CAGR (‘09-’13) > 30% NPAs/assets < 1.0% C&I and Owner-Occupied CRE > 50% Noninterest bearing deposits ~ 50% Deep roots in local business community Lobby level branches Corporate suite branches SBA lending platform Interest rate swaps (fee income) Advisory boards Downtown LA financial center presence Acquisition and integration experience NASDAQ traded Research analyst coverage Pro Forma 5 1 5 |
 10 C&I 31% CRE- Owner Occupied 21% CRE-Non Owner Occupied 30% C&D 6% 1-4 Family 6% Multifamily 4% Other 2% Pro Forma Loans and Deposits (As of March 31, 2014) Source: SNL Financial Nonint- Bear Demand 52% Int-Bear Trans 9% MMDA & Sav. 35% Time 4% Nonint- Bear Demand 49% Int-Bear Trans 7% MMDA & Sav. 42% Time 2% Nonint- Bear Demand 54% Int-Bear Trans 10% MMDA & Sav. 31% Time 5% C&I 32% CRE- Owner Occupied 22% CRE-Non Owner Occupied 29% C&D 4% 1-4 Family 8% Multifamily 3% Other 2% C&I 35% CRE- Owner Occupied 24% CRE-Non Owner Occupied 27% C&D 0% 1-4 Family 11% Multifamily 1% Other 2% Loan portfolio Deposit base CUNB FENB Pro Forma CUNB FENB Pro Forma $946 million loans 5.24% yield on loans (Q1’14) $513 million loans 4.13% yield on loans (Q1’14) $1,459 million loans 4.80% yield on loans (Q1’14) $1,203 million deposits 0.12% cost of deposits (Q1’14) $652 million deposits 0.11% cost of deposits (Q1’14) $1,855 million deposits 0.11% cost of deposits (Q1’14) |
 11 Key Merger Assumptions Cost savings Approximately 20% of FENB noninterest expense base Anticipate that 70% of cost savings will be realized in 2015; 100% phased-in by 2016 Consolidation of FENB’s Woodland Hills LPO Revenue synergies: opportunities identified but none assumed One-time charges: approximately $7.9 million pre-tax Preferred stock: $16.4 million of FENB SBLF preferred stock to remain outstanding 1% preferred dividend thru March 1, 2016; 9% thereafter $0.5 million initial write-down; 4 year impact using constant yield method (7.3%) Core deposit intangible: 1.1% ($7.4 million); amortized over 10 years (sum-of-the-years digits methodology) Loan mark: Credit mark write-down of 1.9% of gross loans ($10.0 million) Rate mark write-down of 0.8% of gross loans ($4.3 million) |
 12 Financially Compelling Combination High single digits in 2015 1 >10% in 2016 with fully-phased in cost savings ~ 7% TBVPS dilution at close ~ 3.5 year TBVPS earn back 2 Pro forma capital ratios at close TCE: 8.1% Tier I Leverage: 9.6% Total Risk-Based Capital: 11.5% While there are no near term plans to redeem FENB’s preferred stock, CUNB will continually evaluate the cost and amount of capital required to support the pro forma balance sheet Earnings Accretion Tang. Book Value Impact Pro Forma Capital Position Projected results supported by CUNB’s strong history of transaction execution and CUNB management’s significant transaction integration experience over the course of their careers 1 Excluding transaction expenses 2 Earn back period is defined as the number of years for pro forma tangible book value per share to exceed stand-alone projected tangible book value per share |
 13 Pro Forma Financial Profile Pro Forma Total assets Total loans Total deposits Market capitalization Number of branches Tang. common equity ratio Tier I leverage ratio Total risk-based ratio Noninterest bearing demand (%) Cost of deposits (Q1 2014) (%) Nonperforming assets/total assets (%) LTM ROAA (%) LTM ROATCE (%) $1.4bn $0.9bn $1.2bn $204mm 2 8 9.3% 10.2% 13.0% 54% 0.12% 0.60% 0.76% 8.7% $0.8bn $0.5bn $0.7bn $84mm 2 3 + LPO 7.1% 9.5% 12.2% 49% 0.11% 0.57% 0.76% 10.1% $2.2bn $1.5bn $1.9bn 10 + LPO 8.1% 3 9.6% 3 11.5% 3 0.59% 1 Based on financial information as of March 31, 2014, unless otherwise noted 2 Based on market data as of June 2, 2014 3 Projected at close 4 Projected 2016 results with fully phased-in cost savings $298mm 2 52% 0.11% 0.9-1.1% 4 11-12% 4 1 |
 14 Uniquely Attractive Southern California Franchise 1 Market cap based on CUNB closing price on June 2, 2014; balance sheet and deposit franchise data as of March 31, 2014 Source: SNL Financial; peer data based on March 31, 2014 financial data Pro forma company will be 1 of 7 commercial banks headquartered in Southern California and traded on NASDAQ or NYSE with total assets of $2.0 - $10.0 billion Pro forma Company is a uniquely attractive franchise within this market Business banking focus Growth profile (balance sheet and EPS) Stellar funding base (loan/deposit ratio, deposit composition and deposit cost) Large branch size Balance Sheet Loan Portfolio Deposit Franchise MRQ Non- Avg. Market Total Loans / C&I+ CRE Cost of Interest Branch Cap. Assets Deposits OO CRE NOO Deposits Bearing Deposits Company ($mm) ($bn) (%) (%) (%) (%) (%) ($mm) CVB Financial Corp. 1,566 6.9 67 30 39 0.10 53 104 BBCN Bancorp Inc. 1,228 6.7 97 49 44 0.52 27 105 Opus Bank 850 4.0 107 19 10 0.52 18 49 Banc of California Inc. 328 4.0 77 12 12 0.76 14 173 Wilshire Bancorp Inc. 801 3.6 98 42 44 0.51 30 81 Hanmi Financial Corp. 691 3.1 91 51 38 0.52 33 93 Pro Forma CUNB 1 298 2.2 79 54 29 0.11 52 185 |
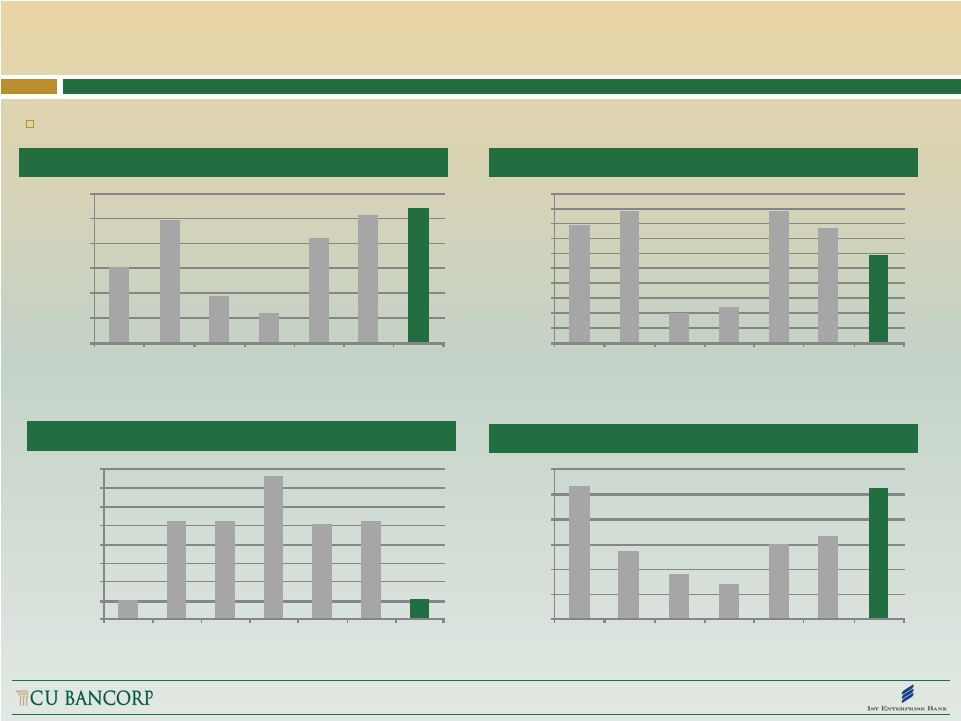 Uniquely Attractive Southern California Franchise “Pure play” business banking franchise on both sides of the balance sheet Source: SNL Financial as of March 31, 2014 C&I + Owner Occ. CRE (% of Total) Non Owner Occ. CRE (% of Total) MRQ Cost of Deposits Noninterest Bearing Deposits (% of Total) 39% 44% 10% 12% 44% 38% 29% 0% 5% 10% 15% 20% 25% 30% 35% 40% 45% 50% CVBF BBCN OPB BANC WIBC HAFC Pro Forma CUNB 30% 49% 19% 12% 42% 51% 54% 0% 10% 20% 30% 40% 50% 60% CVBF BBCN OPB BANC WIBC HAFC Pro Forma CUNB 0.10% 0.52% 0.52% 0.76% 0.51% 0.52% 0.11% 0.00% 0.10% 0.20% 0.30% 0.40% 0.50% 0.60% 0.70% 0.80% CVBF BBCN OPB BANC WIBC HAFC Pro Forma CUNB 53% 27% 18% 14% 30% 33% 52% 0% 10% 20% 30% 40% 50% 60% CVBF BBCN OPB BANC WIBC HAFC Pro Forma CUNB 15 |
 16 Benefits to All Stakeholders Scarcity value of $2.2 billion asset SoCal business banking platform Financially compelling projected pro forma results Enhanced trading liquidity with larger pro forma market capitalization Broadened investor base Shared high standard for the quality of customer service Expanded footprint and market reach Larger lending base Broader product offerings Partnership approach to forming pro forma management team Partnership of both boards of directors with strong ties to community Branch consolidation in Irvine Shareholders Customers Employees |
 17 David I. Rainer Chairman, President & CEO (818) 257-7700 drainer@cunb.com Karen A. Schoenbaum Executive VP & CFO (818) 257-7700 kschoenbaum@cunb.com John C. Black CEO (213) 430-7070 jblack@1stenterprisebank.com David C. Holman Chairman (949) 399-5075 dholman@1stenterprisebank.com |