
Exhibit 99.2 Carlyle Secured Lending, Inc. Quarterly Earnings Presentation June 30, 2024 1
Disclaimer and Forward-Looking Statement This presentation (the “Presentation”) has been prepared by Carlyle Secured Lending, Inc. (together with its consolidated subsidiaries, “we,” “us,” “our,” “CGBD” or the “Company”) (NASDAQ: CGBD) and may only be used for informational purposes only. This Presentation should be viewed in conjunction with the earnings conference call of the Company held on August 5, 2024 and the Company’s Annual Report on Form 10-K for the year ended December 31, 2023. The information contained herein may not be used, reproduced, referenced, quoted, linked by website, or distributed to others, in whole or in part, except as agreed in writing by the Company. This Presentation does not constitute a prospectus and should under no circumstances be understood as an offer to sell or the solicitation of an offer to buy our common stock or any other securities nor will there be any sale of the common stock or any other securities in any state or jurisdiction in which such offer, solicitation or sale would be unlawful prior to the registration or qualification under the securities laws of such state or jurisdiction. This Presentation provides limited information regarding the Company and is not intended to be taken by, and should not be taken by, any individual recipient as investment advice, a recommendation to buy, hold or sell, or an offer to sell or a solicitation of offers to purchase, our common stock or any other securities that may be issued by the Company, or as legal, accounting or tax advice. An investment in securities of the type described herein presents certain risks. This Presentation may contain forward-looking statements that involve substantial risks and uncertainties. Some of the statements in this communication constitute forward-looking statements because they are not historical facts, but instead relate to future events, future performance or financial condition or the merger of Carlyle Secured Lending III ( CSL III ) with and into CGBD (collectively, the “Mergers” ). The forward-looking statements may include statements as to: future operating results of CGBD and CSL III and distribution projections; business prospects of CGBD and CSL III and the prospects of their portfolio companies; and the impact of the investments that CGBD and CSL III expect to make. You can identify these statements by the use of forward-looking terminology such as “anticipates,” “believes,” “expects,” “intends,” “will,” “should,” “may,” “plans,” “continue,” “believes,” “seeks,” “estimates,” “would,” “could,” “targets,” “projects,” “outlook,” “potential,” “predicts” and variations of these words and similar expressions to identify forward-looking statements, although not all forward-looking statements include these words. The forward-looking statements contained in this Presentation involve risks and uncertainties. Certain factors could cause actual results and conditions to differ materially from those projected, including the uncertainties associated with (i) the timing or likelihood of the Mergers closing; (ii) the expected synergies and savings associated with the Mergers; (iii) the ability to realize the anticipated benefits of the Mergers, including the expected elimination of certain expenses and costs due to the Mergers; (iv) the percentage of CGBD stockholders voting in favor of the proposals submitted for their approval; (v) the possibility that competing offers or acquisition proposals will be made; (vi) the possibility that any or all of the various conditions to the consummation of the Mergers may not be satisfied or waived; (vii) risks related to diverting management’s attention from ongoing business operations; (viii) the risk that stockholder litigation in connection with the Mergers may result in significant costs of defense and liability; (ix) changes in the economy, financial markets and political environment, including the impacts of inflation and rising interest rates; (x) risks associated with possible disruption in the operations of CGBD and CSL III or the economy generally due to terrorism, war or other geopolitical conflict (including the uncertainty surrounding Russia’s military invasion of Ukraine and the impact of geopolitical tensions in other regions such as the Middle East, and developing tensions between China and the United States); (xi) future changes in laws or regulations (including the interpretation of these laws and regulations by regulatory authorities); (xii) conditions in CGBD’s and CSL III’s operating areas, particularly with respect to business development companies or regulated investment companies; and (xiii) other considerations that may be disclosed from time to time in CGBD’s and CSL III’s publicly disseminated documents and filings. CGBD and CSL III have based the forward-looking statements included in this Presentation on information available to them on the date hereof, and they assume no obligation to update any such forward-looking statements. You should read statements that contain these words carefully because they discuss our plans, strategies, prospects and expectations concerning our business, operating results, financial condition and other similar matters. We believe that it is important to communicate our future expectations to our investors. There may be events in the future, however, that we are not able to predict accurately or control. You should not place undue reliance on these forward-looking statements, which speak only as of the date on which we make it. Factors or events that could cause our actual results to differ, possibly materially from our expectations, include, but are not limited to, the risks, uncertainties and other factors we identify in the sections entitled “Risk Factors” and “Cautionary Statement Regarding Forward-Looking Statements” in filings we make with the Securities and Exchange Commission, and it is not possible for us to predict or identify all of them. Although CGBD and CSL III undertake no obligation to update or revise any forward-looking statements, whether as a result of new information, future events or otherwise, you are advised to consult any additional disclosures that they may make directly to you or through reports that CGBD and CSL III have filed or in the future may file with the Securities and Exchange Commission (“SEC”), including the Proxy Statement and the Registration Statement (each as defined below), annual reports on Form 10-K, quarterly reports on Form 10-Q and current reports on Form 8-K. 2
Disclaimer and Forward-Looking Statement Information throughout the Presentation provided by sources other than the Company (including information relating to portfolio companies) has not been independently verified and, accordingly, the Company makes no representation or warranty in respect of this information. The following slides contain summaries of certain financial and statistical information about the Company. The information contained in this Presentation is summary information that is intended to be considered in the context of our SEC filings and other public announcements that we may make, by press release or otherwise, from time to time. We undertake no duty or obligation to publicly update or revise the information contained in this Presentation. CGBD is managed by Carlyle Global Credit Investment Management L.L.C. (the “Investment Adviser” or CGCIM ), an SEC-registered investment adviser and a wholly owned subsidiary of The Carlyle Group Inc. (together with its affiliates, “Carlyle”). This Presentation contains information about the Company and certain of its affiliates and includes the Company’s historical performance. You should not view information related to the past performance of the Company as indicative of the Company’s future results, the achievement of which is dependent on many factors, many of which are beyond the control of the Company and the Investment Adviser and cannot be assured. There can be no assurances that future dividends will match or exceed historical rates or will be paid at all. Further, an investment in the Company is discrete from, and does not represent an interest in, any other Carlyle entity. Nothing contained herein shall be relied upon as a promise or representation whether as to the past or future performance of the Company or any other Carlyle entity. Additional Information and Where to Find It In connection with the Mergers, CGBD plans to file with the SEC and mail to its stockholders a proxy statement on Schedule 14A (the “Proxy Statement”), CSL III plans to file with the SEC and mail to its shareholders an information statement (the “Information Statement”), and CGBD plans to file with the SEC a registration statement on Form N-14 (the “Registration Statement”) that will include the Proxy Statement, the Information Statement and a prospectus of CGBD. The Proxy Statement, Information Statement and the Registration Statement will each contain important information about CGBD, CSL III, the Mergers and related matters. This Presentation does not constitute an offer to sell or the solicitation of an offer to buy any securities or a solicitation of any vote or approval. No offer of securities shall be made except by means of a prospectus meeting the requirements of Section 10 of the Securities Act. STOCKHOLDERS OF CGBD AND SHAREHOLDERS OF CSL III ARE URGED TO READ THE PROXY STATEMENT, THE INFORMATION STATEMENT AND REGISTRATION STATEMENT, AND OTHER DOCUMENTS THAT ARE FILED OR WILL BE FILED WITH THE SEC, AS WELL AS ANY AMENDMENTS OR SUPPLEMENTS TO THESE DOCUMENTS, CAREFULLY AND IN THEIR ENTIRETY WHEN THEY BECOME AVAILABLE BECAUSE THEY WILL CONTAIN IMPORTANT INFORMATION ABOUT CSL III, CGBD, THE MERGERS AND RELATED MATTERS. Investors and security holders will be able to obtain the documents filed with the SEC free of charge at the SEC's web site at http://www.sec.gov or, for documents filed by CGBD, from CGBD's website at carlylesecuredlending.com. Participants in the Solicitation CGBD, its directors, certain of its executive officers and certain employees and officers of CGCIM and its affiliates may be deemed to be participants in the solicitation of CGBD proxies in connection with the Mergers. Information about the directors and executive officers of CGBD is set forth in its proxy statement for its 2024 Annual Meeting of Stockholders, which was filed with the SEC on April 26, 2024. CSL III, its trustees, certain of its executive officers and certain employees and officers of CSL III Advisor, LLC (together with CGCIM, the Advisors ) and its affiliates may be deemed to be participants in the solicitation of CGBD proxies in connection with the Mergers. Information about the trustees and executive officers of CSL III is set forth in its annual report on Form 10-K, which was filed with the SEC on March 12, 2024. Information regarding the persons who may, under the rules of the SEC, be considered participants in the solicitation of the CGBD stockholders in connection with the Mergers will be contained in the Proxy Statement when such document becomes available. These documents may be obtained free of charge from the sources indicated above. No Offer or Solicitation This Presentation is not, and under no circumstances is it to be construed as, a prospectus or an advertisement and the communication of this Presentation is not, and under no circumstances is it to be construed as, an offer to sell or a solicitation of an offer to purchase any securities in CGBD, CSL III or in any fund or other investment vehicle managed by the Advisors or any of their respective affiliates. 3
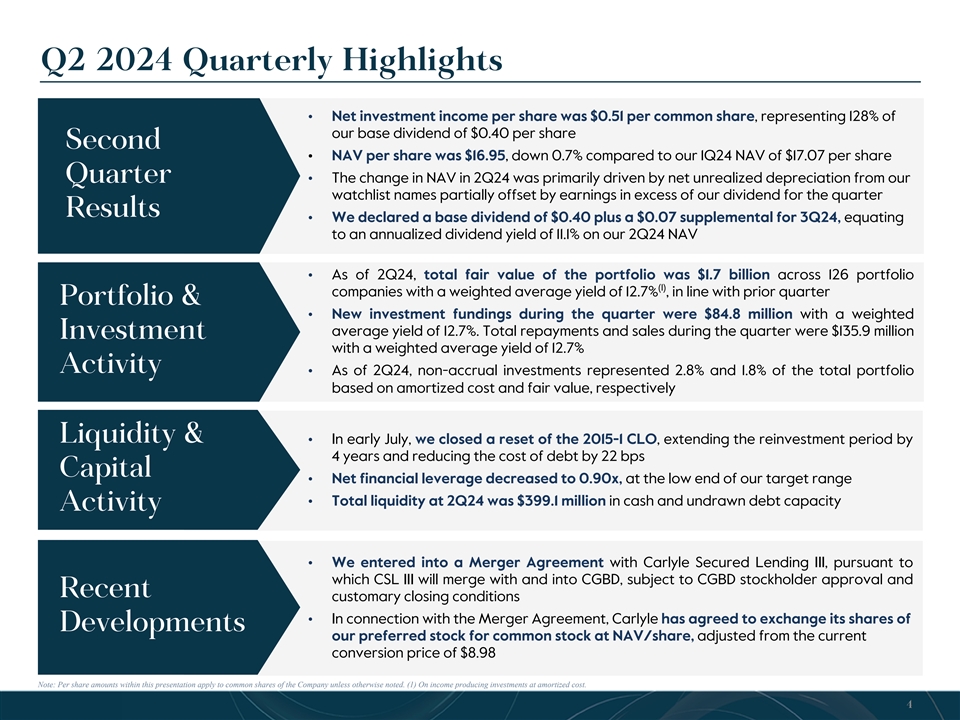
Q2 2024 Quarterly Highlights • Net investment income per share was $0.51 per common share, representing 128% of our base dividend of $0.40 per share Second • NAV per share was $16.95, down 0.7% compared to our 1Q24 NAV of $17.07 per share Quarter • The change in NAV in 2Q24 was primarily driven by net unrealized depreciation from our watchlist names partially offset by earnings in excess of our dividend for the quarter Results • We declared a base dividend of $0.40 plus a $0.07 supplemental for 3Q24, equating to an annualized dividend yield of 11.1% on our 2Q24 NAV • As of 2Q24, total fair value of the portfolio was $1.7 billion across 126 portfolio (1) companies with a weighted average yield of 12.7% , in line with prior quarter Portfolio & • New investment fundings during the quarter were $84.8 million with a weighted average yield of 12.7%. Total repayments and sales during the quarter were $135.9 million Investment with a weighted average yield of 12.7% Activity • As of 2Q24, non-accrual investments represented 2.8% and 1.8% of the total portfolio based on amortized cost and fair value, respectively Liquidity & • In early July, we closed a reset of the 2015-1 CLO, extending the reinvestment period by 4 years and reducing the cost of debt by 22 bps Capital • Net financial leverage decreased to 0.90x, at the low end of our target range • Total liquidity at 2Q24 was $399.1 million in cash and undrawn debt capacity Activity • We entered into a Merger Agreement with Carlyle Secured Lending III, pursuant to which CSL III will merge with and into CGBD, subject to CGBD stockholder approval and Recent customary closing conditions • In connection with the Merger Agreement, Carlyle has agreed to exchange its shares of Developments our preferred stock for common stock at NAV/share, adjusted from the current conversion price of $8.98 Note: Per share amounts within this presentation apply to common shares of the Company unless otherwise noted. (1) On income producing investments at amortized cost. 4
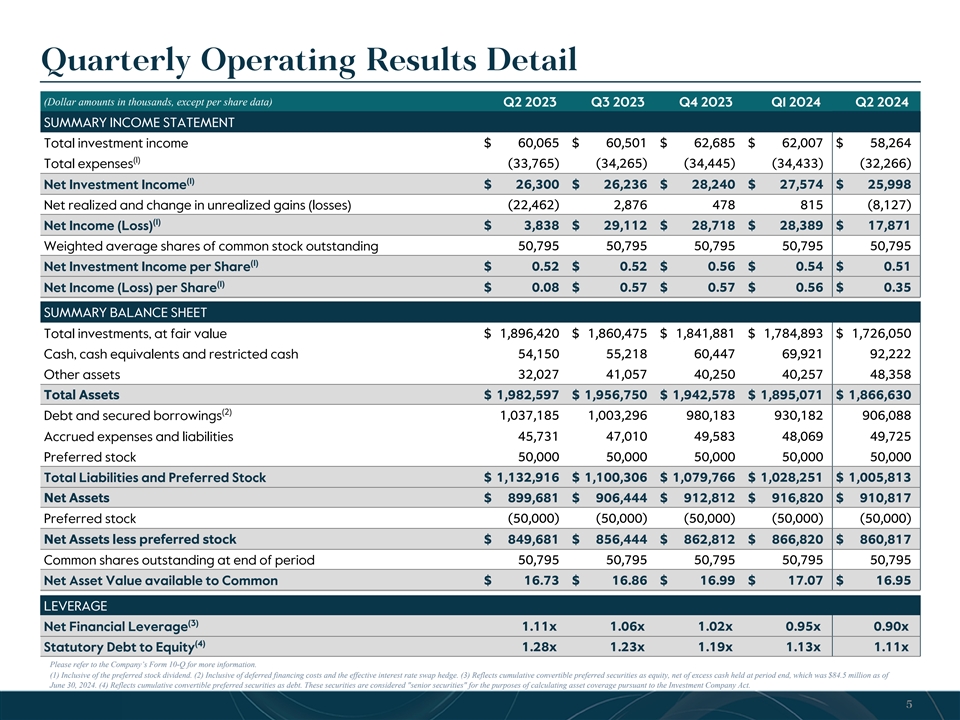
Quarterly Operating Results Detail (Dollar amounts in thousands, except per share data) Q2 2023 Q3 2023 Q4 2023 Q1 2024 Q2 2024 SUMMARY INCOME STATEMENT Total investment income $ 60,065 $ 60,501 $ 62,685 $ 62,007 $ 58,264 (1) Total expenses (33,765) (34,265) (34,445) (34,433) (32,266) (1) Net Investment Income $ 26,300 $ 26,236 $ 28,240 $ 27,574 $ 25,998 Net realized and change in unrealized gains (losses) (22,462) 2,876 478 815 (8,127) (1) $ 3,838 $ 29,112 $ 28,718 $ 28,389 $ 17,871 Net Income (Loss) Weighted average shares of common stock outstanding 50,795 50,795 50,795 50,795 50,795 (1) Net Investment Income per Share $ 0.52 $ 0.52 $ 0.56 $ 0.54 $ 0.51 (1) Net Income (Loss) per Share $ 0.08 $ 0.57 $ 0.57 $ 0.56 $ 0.35 SUMMARY BALANCE SHEET $ 1,896,420 $ 1,860,475 $ 1,841,881 $ 1,784,893 $ 1,726,050 Total investments, at fair value Cash, cash equivalents and restricted cash 54,150 55,218 60,447 69,921 92,222 Other assets 32,027 41,057 40,250 40,257 48,358 Total Assets $ 1,982,597 $ 1,956,750 $ 1,942,578 $ 1,895,071 $ 1,866,630 (2) Debt and secured borrowings 1,037,185 1,003,296 980,183 930,182 906,088 Accrued expenses and liabilities 45,731 47,010 49,583 48,069 49,725 Preferred stock 50,000 50,000 50,000 50,000 50,000 $ 1,132,916 $ 1,100,306 $ 1,079,766 $ 1,028,251 $ 1,005,813 Total Liabilities and Preferred Stock Net Assets $ 899,681 $ 906,444 $ 912,812 $ 916,820 $ 910,817 Preferred stock (50,000) (50,000) (50,000) (50,000) (50,000) Net Assets less preferred stock $ 849,681 $ 856,444 $ 862,812 $ 866,820 $ 860,817 50,795 50,795 50,795 50,795 50,795 Common shares outstanding at end of period Net Asset Value available to Common $ 16.73 $ 16.86 $ 16.99 $ 17.07 $ 16.95 LEVERAGE (3) Net Financial Leverage 1.11x 1.06x 1.02x 0.95x 0.90x (4) Statutory Debt to Equity 1.28x 1.23x 1.19x 1.13x 1.11x Please refer to the Company’s Form 10-Q for more information. (1) Inclusive of the preferred stock dividend. (2) Inclusive of deferred financing costs and the effective interest rate swap hedge. (3) Reflects cumulative convertible preferred securities as equity, net of excess cash held at period end, which was $84.5 million as of June 30, 2024. (4) Reflects cumulative convertible preferred securities as debt. These securities are considered senior securities for the purposes of calculating asset coverage pursuant to the Investment Company Act. 5
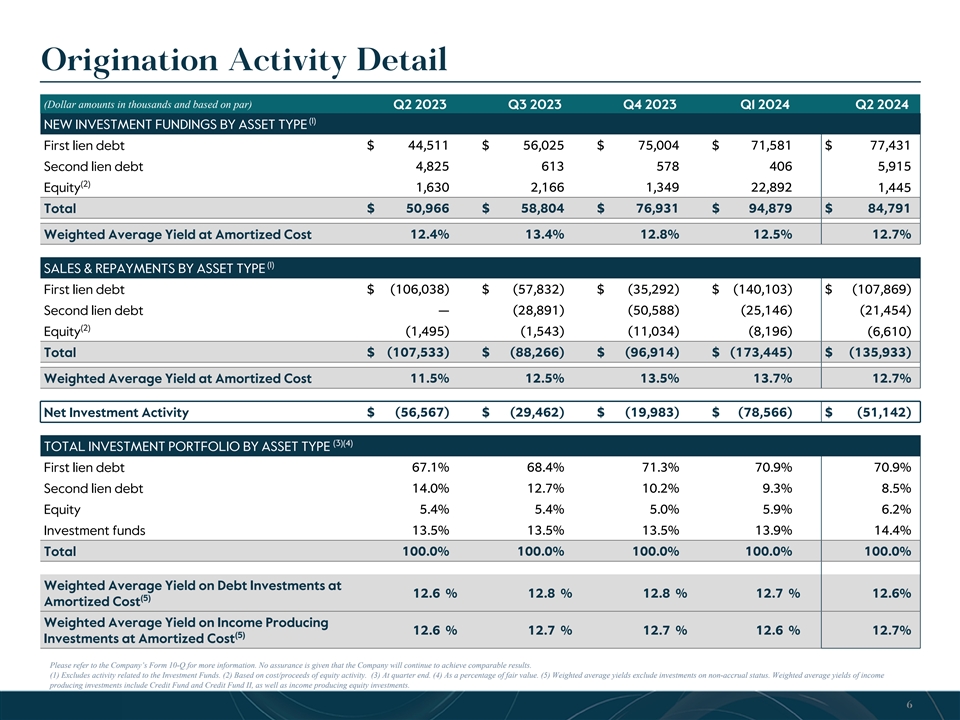
Origination Activity Detail (Dollar amounts in thousands and based on par) Q2 2023 Q3 2023 Q4 2023 Q1 2024 Q2 2024 (1) NEW INVESTMENT FUNDINGS BY ASSET TYPE $ 44,511 $ 56,025 $ 75,004 $ 71,581 $ 77,431 First lien debt Second lien debt 4,825 613 578 406 5,915 (2) Equity 1,630 2,166 1,349 22,892 1,445 Total $ 50,966 $ 58,804 $ 76,931 $ 94,879 $ 84,791 Weighted Average Yield at Amortized Cost 1 2.4 % 1 3.4% 1 2.8% 1 2.5% 1 2.7% (1) SALES & REPAYMENTS BY ASSET TYPE $ (106,038) $ (57,832) $ (35,292) $ (140,103) $ (107,869) First lien debt Second lien debt — (28,891) (50,588) (25,146) (21,454) (2) Equity (1,495) (1,543) (11,034) (8,196) (6,610) Total $ (107,533) $ (88,266) $ (96,914) $ (173,445) $ (135,933) Weighted Average Yield at Amortized Cost 1 1.5% 1 2.5% 13.5 % 1 3.7 % 1 2.7% Net Investment Activity $ (56,567) $ (29,462) $ (19,983) $ (78,566) $ (51,142) (3)(4) TOTAL INVESTMENT PORTFOLIO BY ASSET TYPE First lien debt 6 7.1% 6 8.4 % 7 1.3% 7 0.9% 70.9% Second lien debt 14.0 % 1 2.7 % 10.2 % 9.3% 8.5% 5 .4 % 5.4 % 5 .0% 5 .9 % 6.2 % Equity Investment funds 1 3.5% 1 3.5% 13.5 % 13.9 % 14.4% Total 100.0 % 1 00.0 % 100.0% 100.0% 100.0 % Weighted Average Yield on Debt Investments at 12.6 % 12.8 % 12.8 % 12.7 % 1 2.6% (5) Amortized Cost Weighted Average Yield on Income Producing 1 2.6 % 1 2.7 % 1 2.7 % 12.6 % 12.7% (5) Investments at Amortized Cost Please refer to the Company’s Form 10-Q for more information. No assurance is given that the Company will continue to achieve comparable results. (1) Excludes activity related to the Investment Funds. (2) Based on cost/proceeds of equity activity. (3) At quarter end. (4) As a percentage of fair value. (5) Weighted average yields exclude investments on non-accrual status. Weighted average yields of income producing investments include Credit Fund and Credit Fund II, as well as income producing equity investments. 6
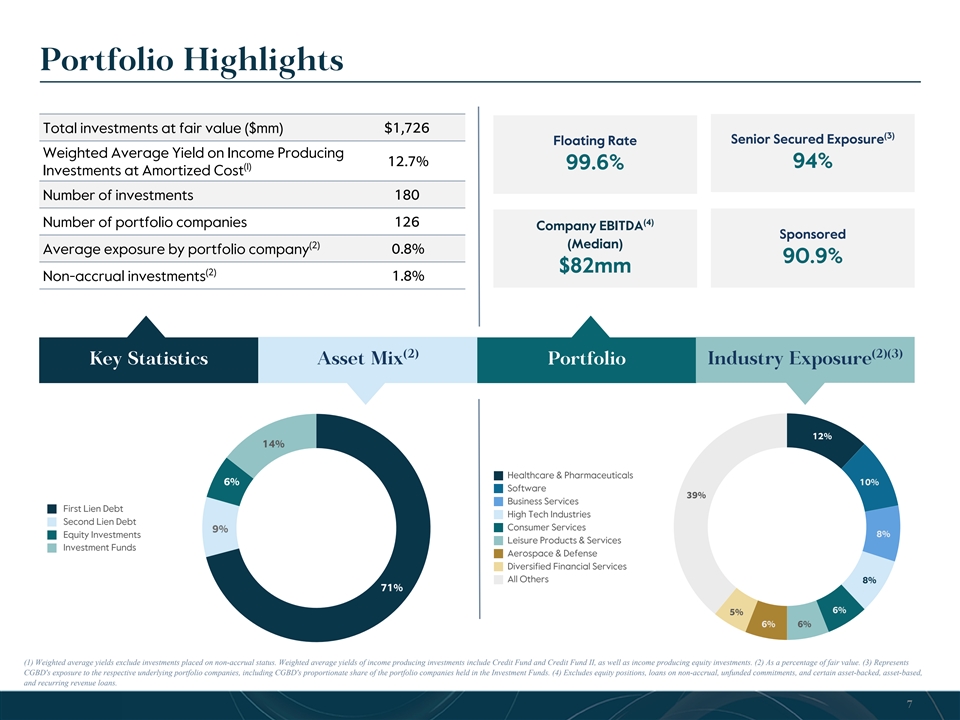
Portfolio Highlights Total investments at fair value ($mm) $1,726 (3) Senior Secured Exposure Floating Rate Weighted Average Yield on Income Producing 12.7% 94% (1) 99.6% Investments at Amortized Cost Number of investments 180 (4) Number of portfolio companies 126 Company EBITDA Sponsored (2) (Median) 0.8% Average exposure by portfolio company 90.9% $82mm (2) Non-accrual investments 1.8% (2) (2)(3) Asset Mix Industry Exposure Key Statistics Portfolio 12% 14% Healthcare & Pharmaceuticals 6% 10% Software 39% Business Services First Lien Debt High Tech Industries Second Lien Debt Consumer Services 9% Equity Investments 8% Leisure Products & Services Investment Funds Aerospace & Defense Diversified Financial Services All Others 8% 71% 6% 5% 6% 6% (1) Weighted average yields exclude investments placed on non-accrual status. Weighted average yields of income producing investments include Credit Fund and Credit Fund II, as well as income producing equity investments. (2) As a percentage of fair value. (3) Represents CGBD's exposure to the respective underlying portfolio companies, including CGBD's proportionate share of the portfolio companies held in the Investment Funds. (4) Excludes equity positions, loans on non-accrual, unfunded commitments, and certain asset-backed, asset-based, and recurring revenue loans. 7
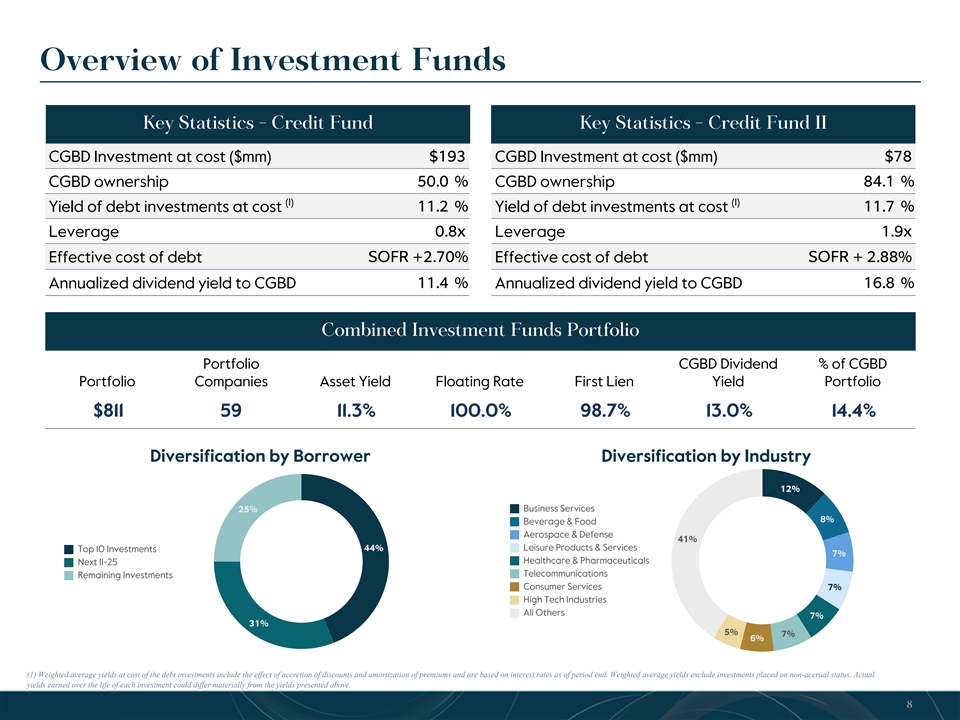
Overview of Investment Funds Key Statistics - Credit Fund Key Statistics - Credit Fund II $193 $78 CGBD Investment at cost ($mm) CGBD Investment at cost ($mm) CGBD ownership 5 0.0 % CGBD ownership 84.1 % (1) (1) Yield of debt investments at cost 11.2 % Yield of debt investments at cost 11.7 % Leverage 0.8x Leverage 1.9x Effective cost of debt SOFR +2.70% Effective cost of debt SOFR + 2.88% 11.4 % 1 6.8 % Annualized dividend yield to CGBD Annualized dividend yield to CGBD Combined Investment Funds Portfolio Portfolio CGBD Dividend % of CGBD Portfolio Companies Asset Yield Floating Rate First Lien Yield Portfolio $811 59 11.3% 100.0% 98.7% 13.0% 14.4% Diversification by Borrower Diversification by Industry 12% Business Services 25% 8% Beverage & Food Aerospace & Defense 41% Leisure Products & Services Top 10 Investments 44% 7% Healthcare & Pharmaceuticals Next 11-25 Telecommunications Remaining Investments Consumer Services 7% High Tech Industries All Others 7% 31% 5% 7% 6% (1) Weighted average yields at cost of the debt investments include the effect of accretion of discounts and amortization of premiums and are based on interest rates as of period end. Weighted average yields exclude investments placed on non-accrual status. Actual yields earned over the life of each investment could differ materially from the yields presented above. 8
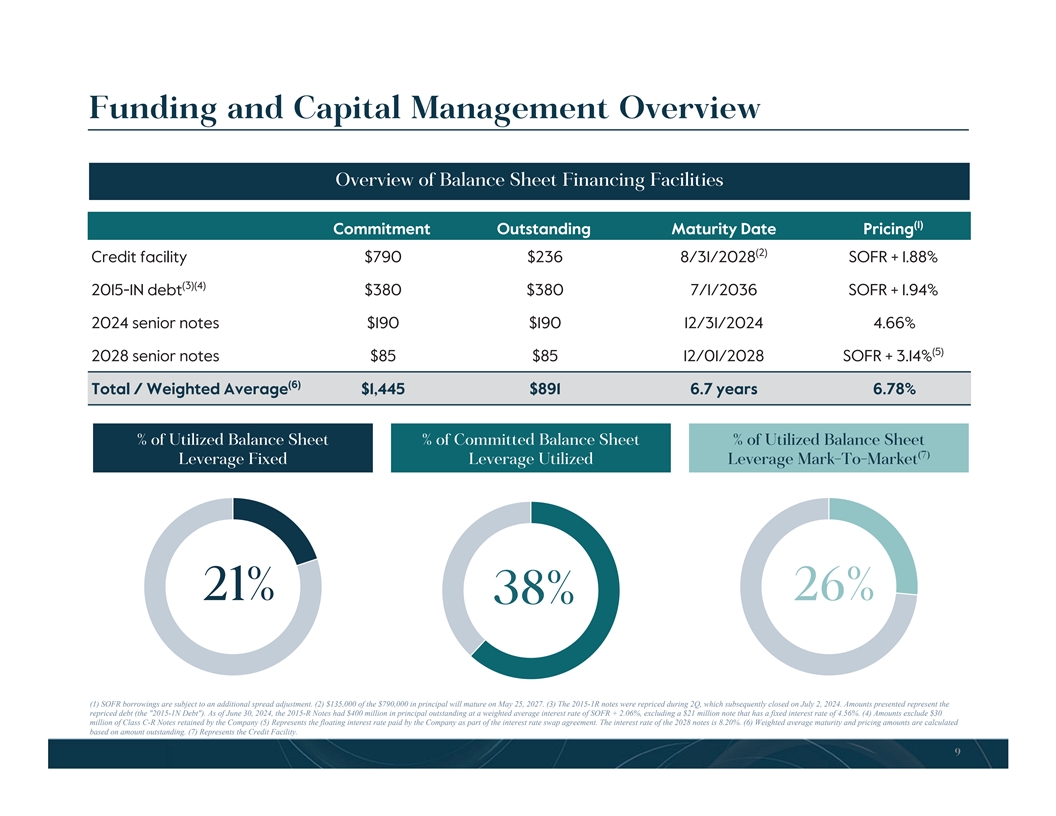
-,>0/:9,8:@9?:@?>?,9/492 '0;=0>09?>?30=0/4?,.474?D >,=0.,7.@7,?0/:?0>4> +0423?0/,A0=,208,?@=4?D,9/;=4.492,8:@9?049?0=0>?=,?0>B,;,2=00809? )3049?0=0>?=,?0:1?30 9?>?3017:,?49249?0=0>?=,?0;,4/-D?30:8;,9D,>;,=?:1?384774:9:17,>> '#:?0>=0?,490/-D?30:8;,9D'0;=0>09 4:99:?0?3,?3,>,14C0/49?0=0>?=,?0:1 8:@9?>0?0/,A0=,2049?0=0>?=,?0:1($' 0C.7@/492,8477 '#:?0>3,/ 84774:949;=49.4;,7:@?>?,9/492,?,B0423=0;=4.0//0-??30 #0-? >:1!@90 ?30 >09??30.3>@->0<@09?7D.7:>0/:9!@7D 8:@9?>;=0>09?0/=0;=0,D )30 '9:?0>B0=0=0;=4.0//@=492& B3409? :1?30 49;=49.4;,7B4778,?@=0:9 ($'-:==:B492>,=0>@-50.??:,9,//4?4:9,7>;=0,/,/5@>?8 C.7@/0 ,(+ 1) 6,.,<('$.$0&( +((6 (8(4$*($4-!1$4-(6 ,(+ D1-=> ,(+ $=5/593 !-?@=5?D-?1 (8(4$*( 6,.,<(' 1)1//,66('$.$0&( +((6 #@?>?-90593 8(48,(91)$.$0&( +((6,0$0&,0*$&,.,6,(5 :885?819? (8(4$*(,:(' 1) 6,.,<('$.$0&( +((6 D76;F835;>;FK '674FE7@;AD@AF7EE7@;AD@AF7E(:?-7 +1534?10A1=-31 5/&+/)#/�+4#-#/#)'.'/46'26+'7
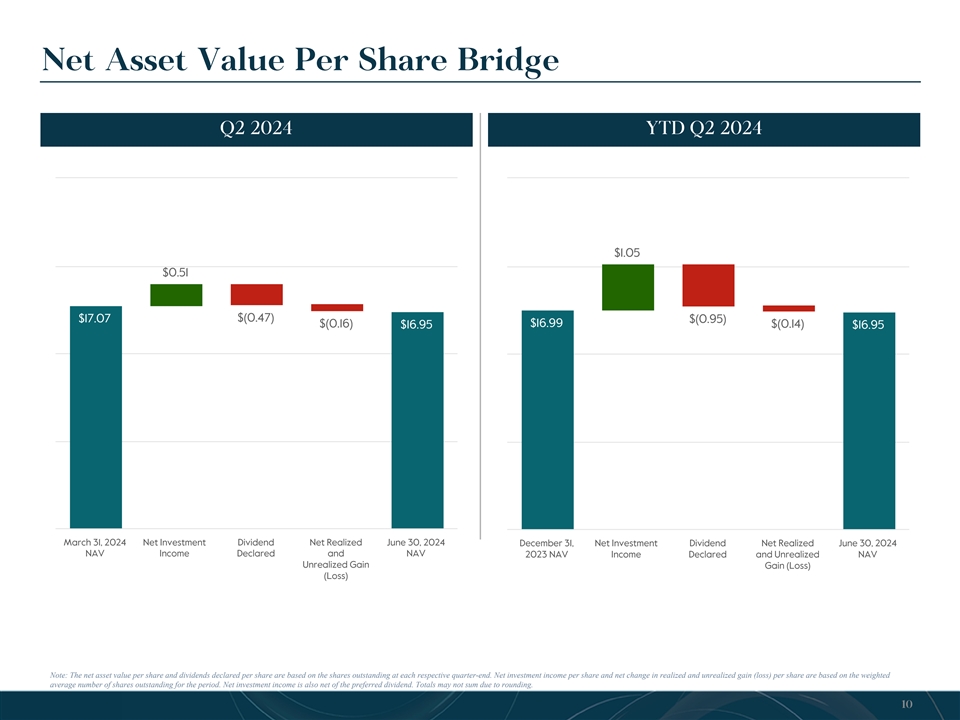
Net Asset Value Per Share Bridge Q2 2024 YTD Q2 2024 $1.05 $0.51 $(0.47) $17.07 $(0.95) $16.99 $(0.16) $(0.14) $16.95 $16.95 March 31, 2024 Net Investment Dividend Net Realized June 30, 2024 December 31, Net Investment Dividend Net Realized June 30, 2024 NAV Income Declared and NAV 2023 NAV Income Declared and Unrealized NAV Unrealized Gain Gain (Loss) (Loss) Note: The net asset value per share and dividends declared per share are based on the shares outstanding at each respective quarter-end. Net investment income per share and net change in realized and unrealized gain (loss) per share are based on the weighted average number of shares outstanding for the period. Net investment income is also net of the preferred dividend. Totals may not sum due to rounding. 10
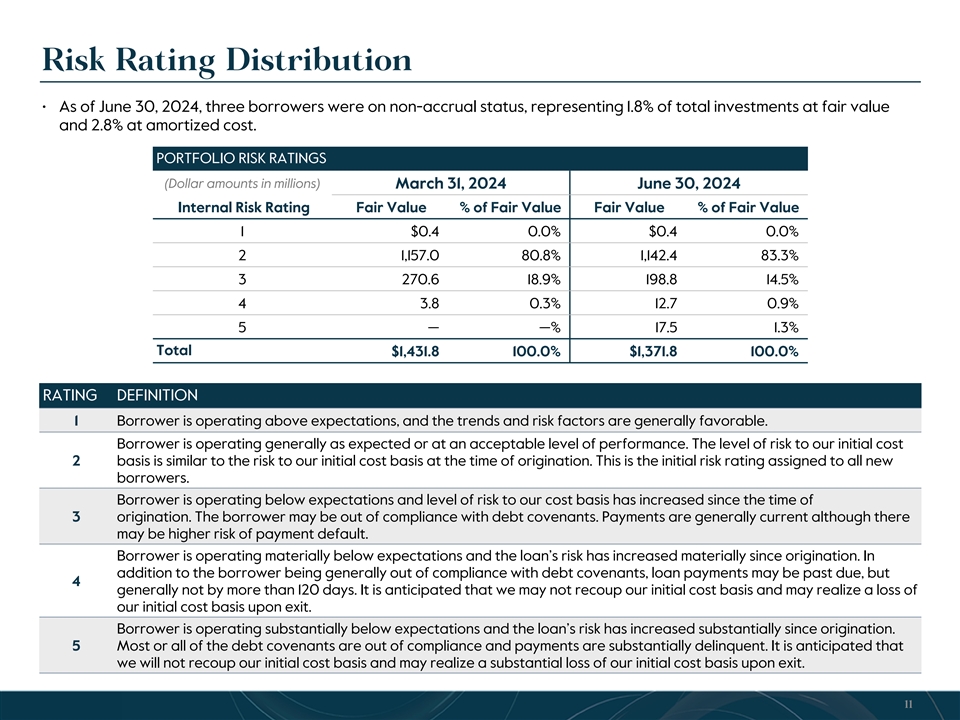
Risk Rating Distribution • As of June 30, 2024, three borrowers were on non-accrual status, representing 1.8% of total investments at fair value and 2.8% at amortized cost. PORTFOLIO RISK RATINGS (Dollar amounts in millions) March 31, 2024 June 30, 2024 Internal Risk Rating Fair Value % of Fair Value Fair Value % of Fair Value 1 $0.4 0 .0% $0.4 0 .0% 2 1,157.0 80.8% 1,142.4 8 3.3 % 3 270.6 18.9 % 198.8 14.5% 4 3.8 0 .3% 12.7 0 .9% 5 — — % 17.5 1 .3 % Total $1,431.8 1 00.0 % $1,371.8 1 00.0% RATING DEFINITION 1 Borrower is operating above expectations, and the trends and risk factors are generally favorable. Borrower is operating generally as expected or at an acceptable level of performance. The level of risk to our initial cost 2 basis is similar to the risk to our initial cost basis at the time of origination. This is the initial risk rating assigned to all new borrowers. Borrower is operating below expectations and level of risk to our cost basis has increased since the time of 3 origination. The borrower may be out of compliance with debt covenants. Payments are generally current although there may be higher risk of payment default. Borrower is operating materially below expectations and the loan’s risk has increased materially since origination. In addition to the borrower being generally out of compliance with debt covenants, loan payments may be past due, but 4 generally not by more than 120 days. It is anticipated that we may not recoup our initial cost basis and may realize a loss of our initial cost basis upon exit. Borrower is operating substantially below expectations and the loan’s risk has increased substantially since origination. 5 Most or all of the debt covenants are out of compliance and payments are substantially delinquent. It is anticipated that we will not recoup our initial cost basis and may realize a substantial loss of our initial cost basis upon exit. 11
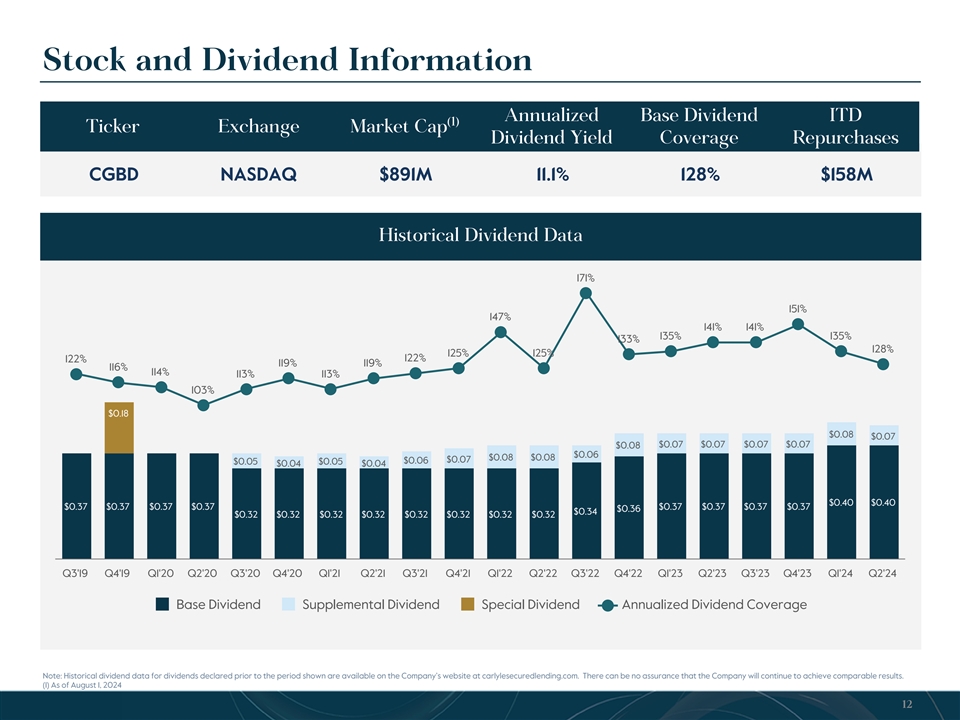
Stock and Dividend Information Annualized Base Dividend ITD (1) Ticker Exchange Market Cap Dividend Yield Coverage Repurchases CGBD NASDAQ $891M 11.1% 128% $158M Historical Dividend Data HISTORICAL DIVIDEND DATA 171% 151% 147% 141% 141% 135% 135% 133% 128% 125% 125% 122% 122% 119% 119% 116% 114% 113% 113% 103% $0.18 $0.08 $0.07 $0.07 $0.07 $0.07 $0.07 $0.08 $0.06 $0.08 $0.08 $0.07 $0.06 $0.05 $0.05 $0.04 $0.04 $0.40 $0.40 $0.37 $0.37 $0.37 $0.37 $0.37 $0.37 $0.37 $0.37 $0.36 $0.34 $0.32 $0.32 $0.32 $0.32 $0.32 $0.32 $0.32 $0.32 Q3'19 Q4'19 Q1'20 Q2'20 Q3'20 Q4'20 Q1'21 Q2'21 Q3'21 Q4'21 Q1'22 Q2'22 Q3'22 Q4'22 Q1'23 Q2'23 Q3'23 Q4'23 Q1'24 Q2'24 Base Dividend Supplemental Dividend Special Dividend Annualized Dividend Coverage Note: Historical dividend data for dividends declared prior to the period shown are available on the Company’s website at carlylesecuredlending.com. There can be no assurance that the Company will continue to achieve comparable results. (1) As of August 1, 2024 12

Appendix 13
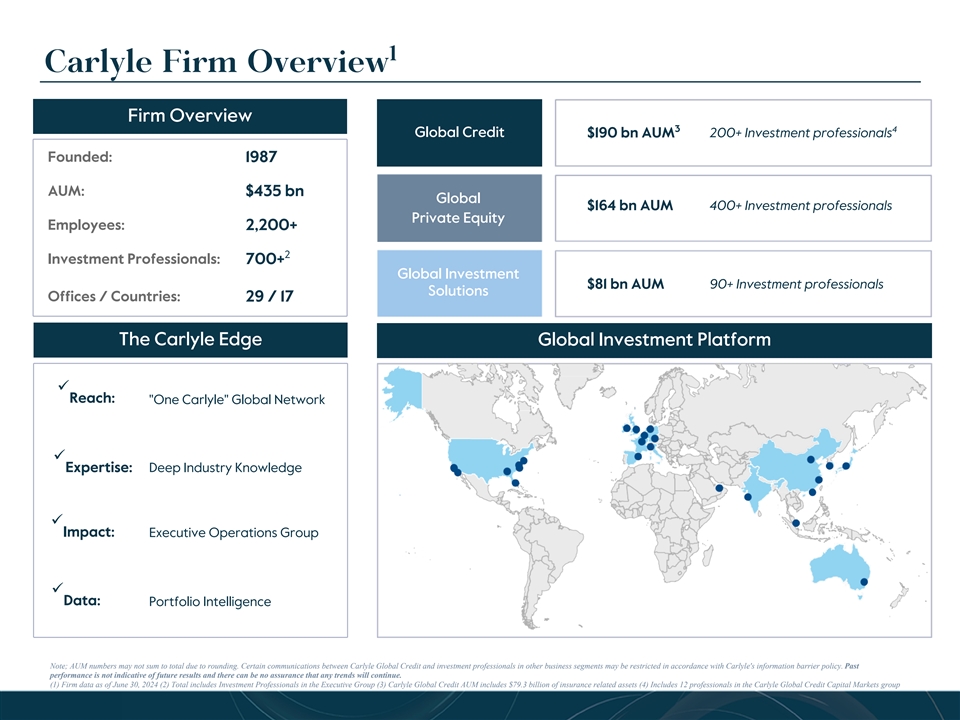
1 Carlyle Firm Overview Firm Overview 3 4 Global Credit $190 bn AUM 200+ Investment professionals Founded: 1987 AUM: $435 bn Global $164 bn AUM 400+ Investment professionals Private Equity Employees: 2,200+ 2 Investment Professionals: 700+ Global Investment $81 bn AUM 90+ Investment professionals Solutions Offices / Countries: 29 / 17 The Carlyle Edge Global Investment Platform ü Reach: One Carlyle Global Network ü Expertise: Deep Industry Knowledge ü Impact: Executive Operations Group ü Data: Portfolio Intelligence Note; AUM numbers may not sum to total due to rounding. Certain communications between Carlyle Global Credit and investment professionals in other business segments may be restricted in accordance with Carlyle's information barrier policy. Past performance is not indicative of future results and there can be no assurance that any trends will continue. (1) Firm data as of June 30, 2024 (2) Total includes Investment Professionals in the Executive Group (3) Carlyle Global Credit AUM includes $79.3 billion of insurance related assets (4) Includes 12 professionals in the Carlyle Global Credit Capital Markets group
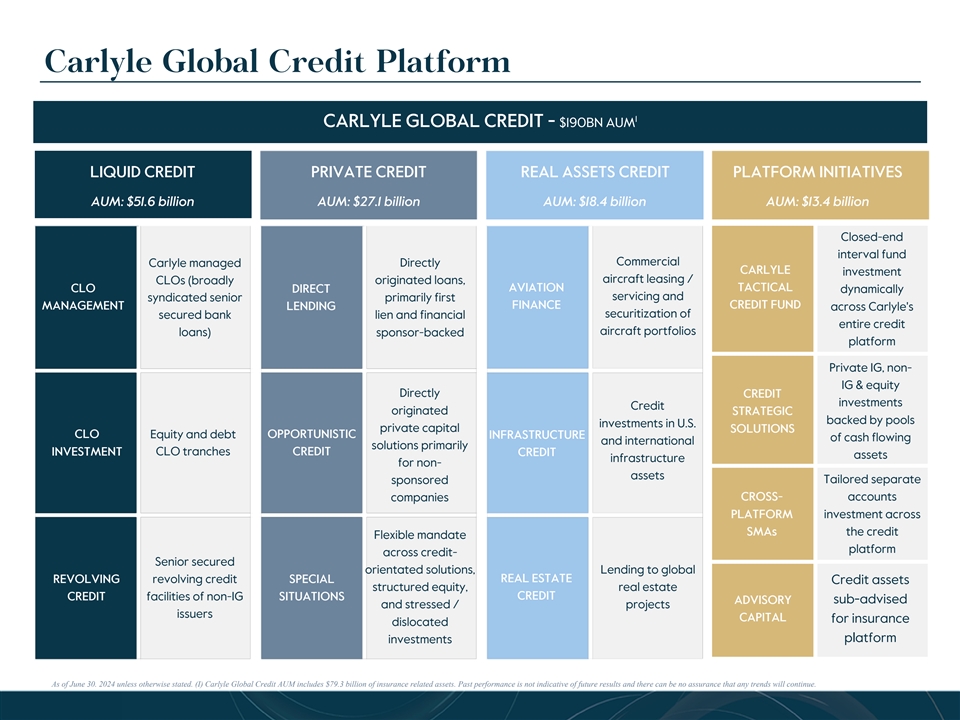
Carlyle Global Credit Platform 1 CARLYLE GLOBAL CREDIT - $190BN AUM LIQUID CREDIT PRIVATE CREDIT REAL ASSETS CREDIT PLATFORM INITIATIVES AUM: $51.6 billion AUM: $27.1 billion AUM: $18.4 billion AUM: $13.4 billion Closed-end interval fund Commercial Carlyle managed Directly CARLYLE investment aircraft leasing / CLOs (broadly originated loans, CLO AVIATION TACTICAL DIRECT dynamically servicing and syndicated senior primarily first MANAGEMENT FINANCE CREDIT FUND LENDING across Carlyle's securitization of secured bank lien and financial entire credit aircraft portfolios loans) sponsor-backed platform Private IG, non- IG & equity Directly CREDIT investments Credit originated STRATEGIC backed by pools investments in U.S. private capital SOLUTIONS CLO Equity and debt OPPORTUNISTIC INFRASTRUCTURE of cash flowing and international solutions primarily INVESTMENT CLO tranches CREDIT CREDIT assets infrastructure for non- assets sponsored Tailored separate companies CROSS- accounts PLATFORM investment across SMAs the credit Flexible mandate platform across credit- Senior secured orientated solutions, Lending to global REVOLVING revolving credit SPECIAL REAL ESTATE Credit assets structured equity, real estate CREDIT facilities of non-IG SITUATIONS CREDIT ADVISORY sub-advised and stressed / projects issuers CAPITAL for insurance dislocated platform investments As of June 30. 2024 unless otherwise stated. (I) Carlyle Global Credit AUM includes $79.3 billion of insurance related assets. Past performance is not indicative of future results and there can be no assurance that any trends will continue.
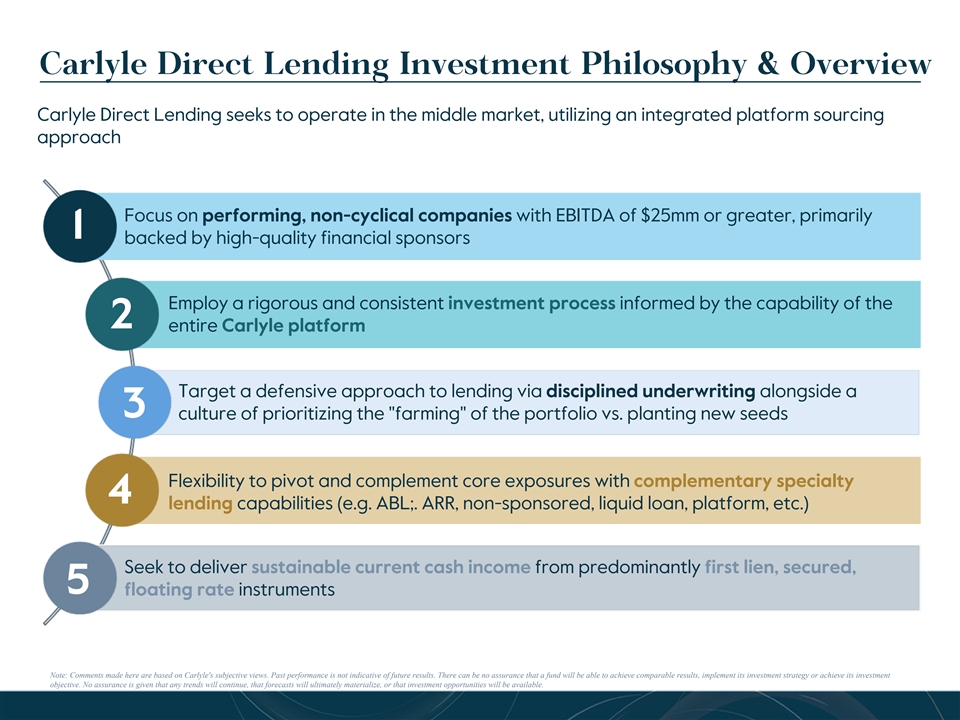
Carlyle Direct Lending Investment Philosophy & Overview Carlyle Direct Lending seeks to operate in the middle market, utilizing an integrated platform sourcing approach Focus on performing, non-cyclical companies with EBITDA of $25mm or greater, primarily backed by high-quality financial sponsors Employ a rigorous and consistent investment process informed by the capability of the entire Carlyle platform Target a defensive approach to lending via disciplined underwriting alongside a culture of prioritizing the farming of the portfolio vs. planting new seeds Flexibility to pivot and complement core exposures with complementary specialty lending capabilities (e.g. ABL;. ARR, non-sponsored, liquid loan, platform, etc.) Seek to deliver sustainable current cash income from predominantly first lien, secured, floating rate instruments Note: Comments made here are based on Carlyle's subjective views. Past performance is not indicative of future results. There can be no assurance that a fund will be able to achieve comparable results, implement its investment strategy or achieve its investment objective. No assurance is given that any trends will continue, that forecasts will ultimately materialize, or that investment opportunities will be available.
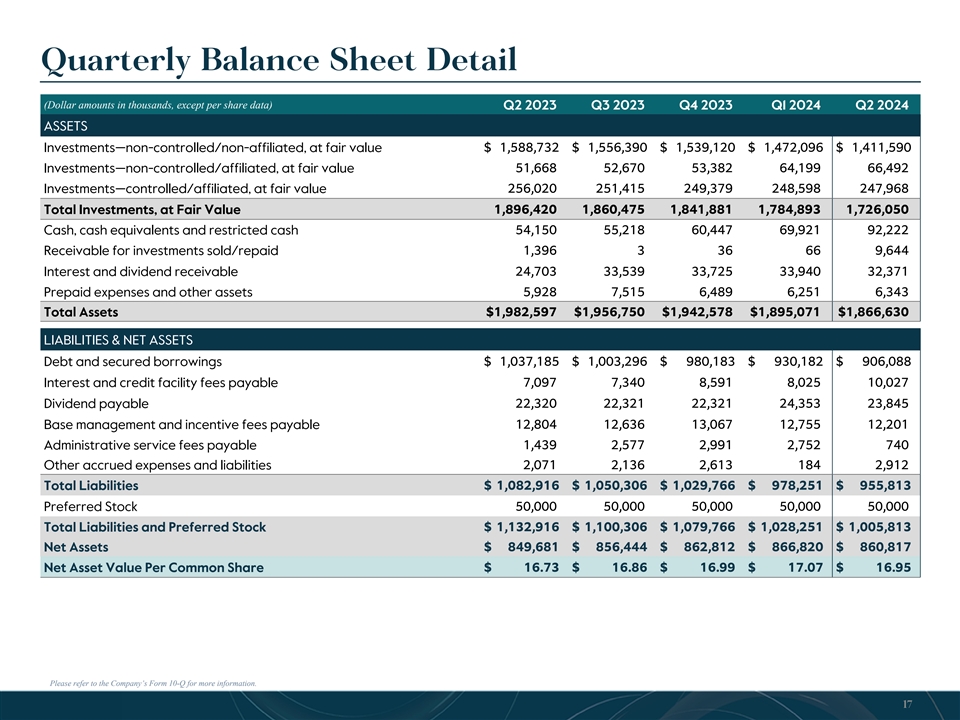
Quarterly Balance Sheet Detail (Dollar amounts in thousands, except per share data) Q2 2023 Q3 2023 Q4 2023 Q1 2024 Q2 2024 ASSETS Investments—non-controlled/non-affiliated, at fair value $ 1,588,732 $ 1,556,390 $ 1,539,120 $ 1,472,096 $ 1,411,590 51,668 52,670 53,382 64,199 66,492 Investments—non-controlled/affiliated, at fair value Investments—controlled/affiliated, at fair value 256,020 251,415 249,379 248,598 247,968 1,896,420 1,860,475 1,841,881 1,784,893 1,726,050 Total Investments, at Fair Value Cash, cash equivalents and restricted cash 54,150 55,218 60,447 69,921 92,222 Receivable for investments sold/repaid 1,396 3 36 66 9,644 Interest and dividend receivable 24,703 33,539 33,725 33,940 32,371 5,928 7,515 6,489 6,251 6,343 Prepaid expenses and other assets $1,982,597 $1,956,750 $1,942,578 $1,895,071 $1,866,630 Total Assets LIABILITIES & NET ASSETS $ 1,037,185 $ 1,003,296 $ 980,183 $ 930,182 $ 906,088 Debt and secured borrowings Interest and credit facility fees payable 7,097 7,340 8,591 8,025 10,027 Dividend payable 22,320 22,321 22,321 24,353 23,845 Base management and incentive fees payable 12,804 12,636 13,067 12,755 12,201 Administrative service fees payable 1,439 2,577 2,991 2,752 740 Other accrued expenses and liabilities 2,071 2,136 2,613 184 2,912 $ 1,082,916 $ 1,050,306 $ 1,029,766 $ 978,251 $ 955,813 Total Liabilities Preferred Stock 50,000 50,000 50,000 50,000 50,000 Total Liabilities and Preferred Stock $ 1,132,916 $ 1,100,306 $ 1,079,766 $ 1,028,251 $ 1,005,813 Net Assets $ 849,681 $ 856,444 $ 862,812 $ 866,820 $ 860,817 Net Asset Value Per Common Share $ 16.73 $ 16.86 $ 16.99 $ 17.07 $ 16.95 Please refer to the Company’s Form 10-Q for more information. 17
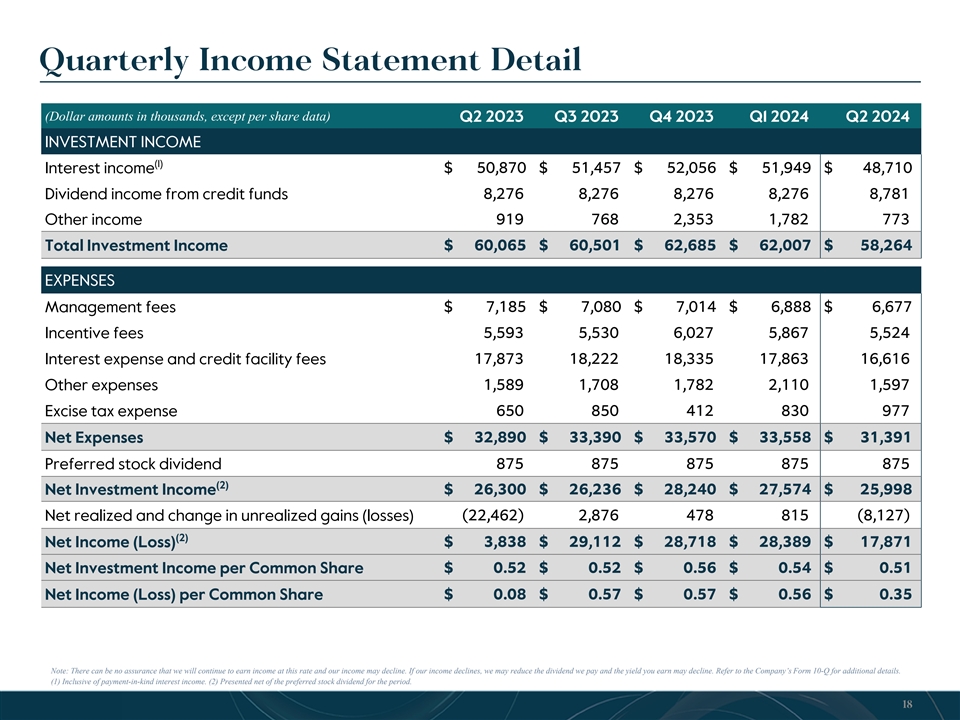
Quarterly Income Statement Detail (Dollar amounts in thousands, except per share data) Q2 2023 Q3 2023 Q4 2023 Q1 2024 Q2 2024 INVESTMENT INCOME (1) Interest income $ 50,870 $ 51,457 $ 52,056 $ 51,949 $ 48,710 8,276 8,276 8,276 8,276 8,781 Dividend income from credit funds 919 768 2,353 1,782 773 Other income Total Investment Income $ 60,065 $ 60,501 $ 62,685 $ 62,007 $ 58,264 EXPENSES Management fees $ 7,185 $ 7,080 $ 7,014 $ 6,888 $ 6,677 Incentive fees 5,593 5,530 6,027 5,867 5,524 Interest expense and credit facility fees 17,873 18,222 18,335 17,863 16,616 Other expenses 1,589 1,708 1,782 2,110 1,597 Excise tax expense 650 850 412 830 977 Net Expenses $ 32,890 $ 33,390 $ 33,570 $ 33,558 $ 31,391 Preferred stock dividend 875 875 875 875 875 (2) Net Investment Income $ 26,300 $ 26,236 $ 28,240 $ 27,574 $ 25,998 (22,462) 2,876 478 815 (8,127) Net realized and change in unrealized gains (losses) (2) $ 3,838 $ 29,112 $ 28,718 $ 28,389 $ 17,871 Net Income (Loss) Net Investment Income per Common Share $ 0.52 $ 0.52 $ 0.56 $ 0.54 $ 0.51 Net Income (Loss) per Common Share $ 0.08 $ 0.57 $ 0.57 $ 0.56 $ 0.35 Note: There can be no assurance that we will continue to earn income at this rate and our income may decline. If our income declines, we may reduce the dividend we pay and the yield you earn may decline. Refer to the Company’s Form 10-Q for additional details. (1) Inclusive of payment-in-kind interest income. (2) Presented net of the preferred stock dividend for the period. 18