Filed by Engility Holdings, Inc. and New East Holdings, Inc. pursuant to Rule 425 under the Securities Act of 1933 and deemed filed pursuant to Rule 14a-12 of the Securities Exchange Act of 1934
Subject Company: Engility Holdings, Inc., New East Holdings, Inc. and TASC Parent Corporation Registration No. 333-200384
|
BUILT FOR TODAY
DESIGNED FOR TOMORROW
Lender Presentation
November 2014
Your Mission. Our commitment
|
Management Presenters
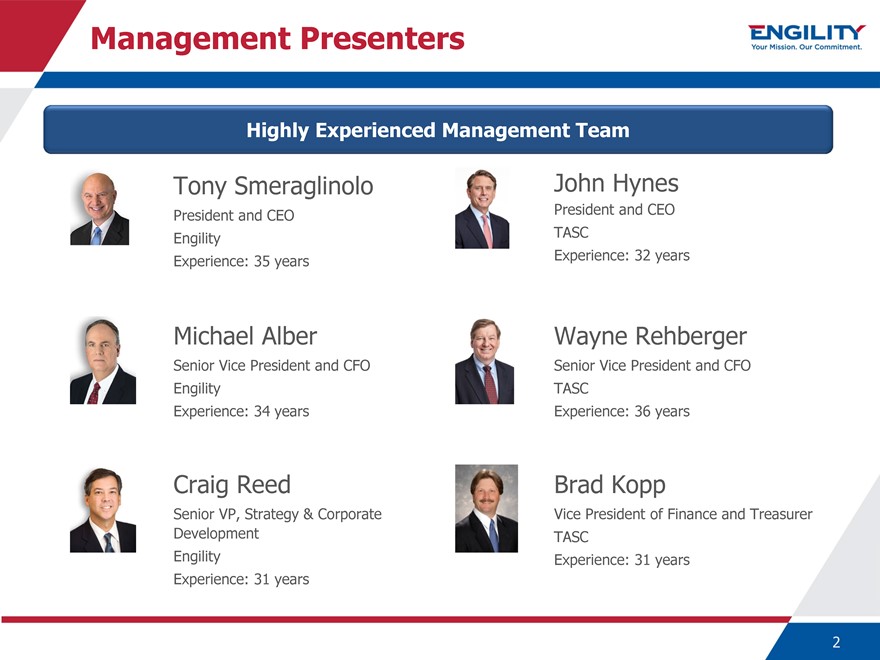
Highly Experienced Management Team
Tony Smeraglinolo
President and CEO Engility Experience: 35 years
Michael Alber
Senior Vice President and CFO Engility Experience: 34 years
Craig Reed
Senior VP, Strategy & Corporate Development Engility Experience: 31 years
John Hynes
President and CEO TASC
Experience: 32 years
Wayne Rehberger
Senior Vice President and CFO TASC
Experience: 36 years
Brad Kopp
Vice President of Finance and Treasurer TASC
Experience: 31 years
2
|
Agenda
I. Transaction Overview II. Industry Overview III. Engility Overview IV. TASC Overview V. Combination Rationale VI. Transaction Details
3
|

Transaction Overview
|
Executive Summary
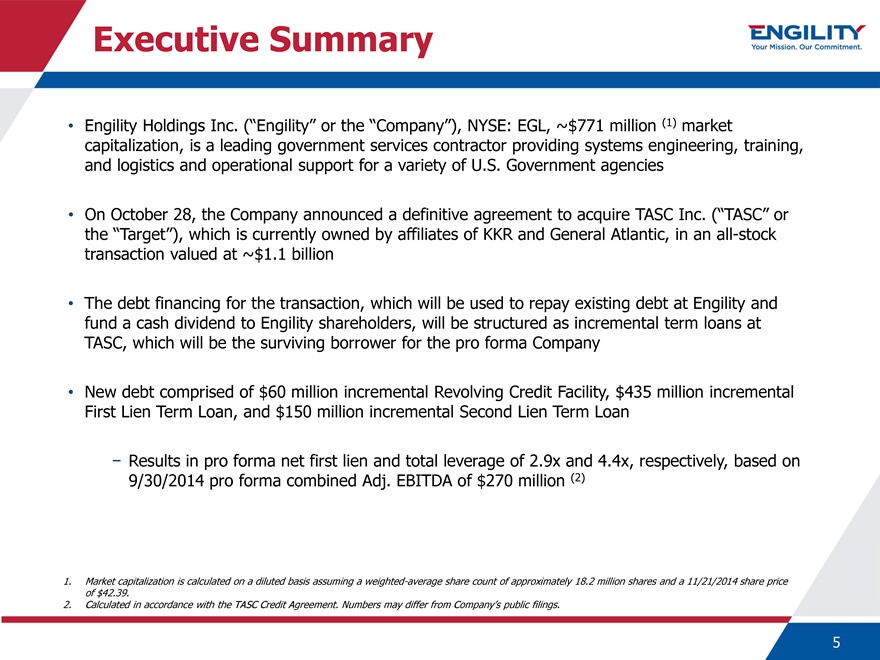
Engility Holdings Inc. (“Engility” or the “Company”), NYSE: EGL, ~$771 million (1) market capitalization, is a leading government services contractor providing systems engineering, training, and logistics and operational support for a variety of U.S. Government agencies
On October 28, the Company announced a definitive agreement to acquire TASC Inc. (“TASC” or the “Target”), which is currently owned by affiliates of KKR and General Atlantic, in an all-stock transaction valued at ~$1.1 billion
The debt financing for the transaction, which will be used to repay existing debt at Engility and fund a cash dividend to Engility shareholders, will be structured as incremental term loans at TASC, which will be the surviving borrower for the pro forma Company
New debt comprised of $60 million incremental Revolving Credit Facility, $435 million incremental First Lien Term Loan, and $150 million incremental Second Lien Term Loan
- Results in pro forma net first lien and total leverage of 2.9x and 4.4x, respectively, based on 9/30/2014 pro forma combined Adj. EBITDA of $270 million (2)
1. Market capitalization is calculated on a diluted basis assuming a weighted-average share count of approximately 18.2 million shares and a 11/21/2014 share price of $42.39.
2. Calculated in accordance with the TASC Credit Agreement. Numbers may differ from Company’s public filings.
5
|
Transaction Overview
Overview
Transaction Structure
Leadership Team
Approvals and Timing
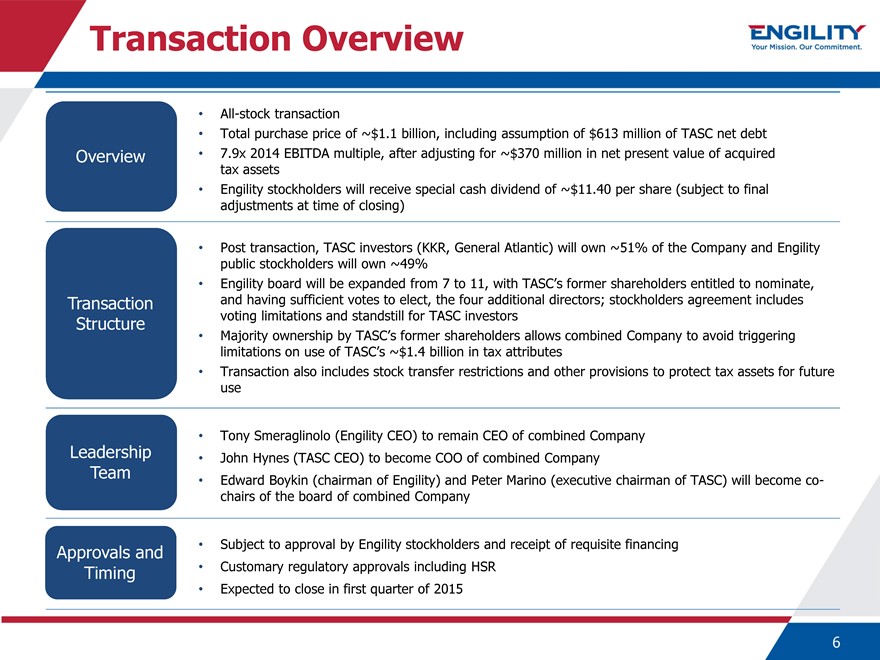
All-stock transaction
Total purchase price of ~$1.1 billion, including assumption of $613 million of TASC net debt
7.9x 2014 EBITDA multiple, after adjusting for ~$370 million in net present value of acquired tax assets Engility stockholders will receive special cash dividend of ~$11.40 per share (subject to final adjustments at time of closing)
Post transaction, TASC investors (KKR, General Atlantic) will own ~51% of the Company and Engility public stockholders will own ~49% Engility board will be expanded from 7 to 11, with TASC’s former shareholders entitled to nominate, and having sufficient votes to elect, the four additional directors; stockholders agreement includes voting limitations and standstill for TASC investors Majority ownership by TASC’s former shareholders allows combined Company to avoid triggering limitations on use of TASC’s ~$1.4 billion in tax attributes Transaction also includes stock transfer restrictions and other provisions to protect tax assets for future use
Tony Smeraglinolo (Engility CEO) to remain CEO of combined Company John Hynes (TASC CEO) to become COO of combined Company
Edward Boykin (chairman of Engility) and Peter Marino (executive chairman of TASC) will become co-chairs of the board of combined Company
Subject to approval by Engility stockholders and receipt of requisite financing Customary regulatory approvals including HSR
Expected to close in first quarter of 2015
6
|
Sources & Uses / Pro Forma Capitalization
Sources & Uses
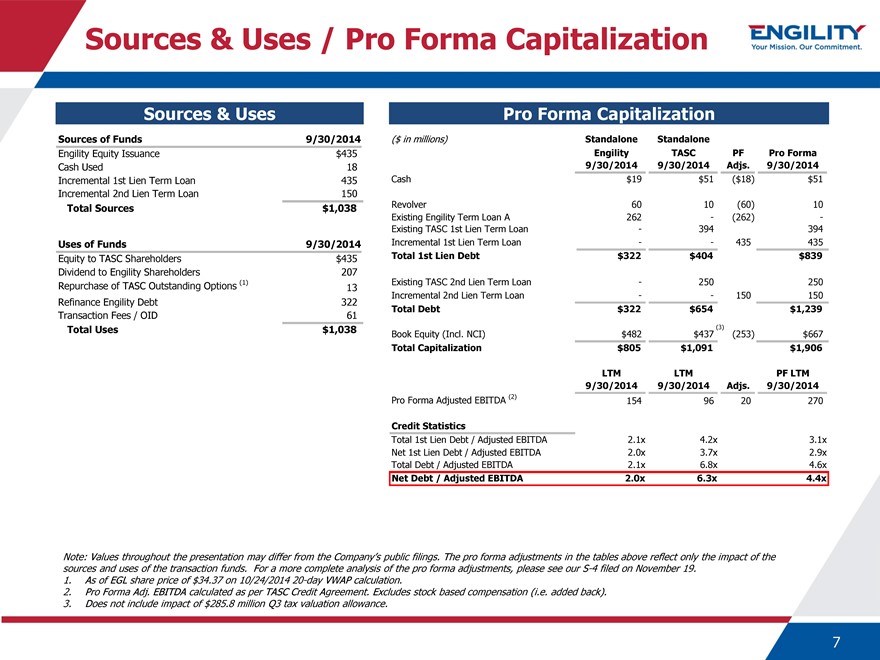
Sources of Funds 9/30/2014
Engility Equity Issuance $435
Cash Used 18
Incremental 1st Lien Term Loan 435
Incremental 2nd Lien Term Loan 150
Total Sources $1,038
Uses of Funds 9/30/2014
Equity to TASC Shareholders $435
Dividend to Engility Shareholders 207
Repurchase of TASC Outstanding Options (1) 13
Refinance Engility Debt 322
Transaction Fees / OID 61
Total Uses $1,038
Note: Values throughout the presentation may differ from the Company’s public filings. The pro forma adjustments in the tables above reflect only the impact of the sources and uses of the transaction funds. For a more complete analysis of the pro forma adjustments, please see our S-4 filed on November 19.
1. As of EGL share price of $34.37 on 10/24/2014 20-day VWAP calculation.
2. Pro Forma Adj. EBITDA calculated as per TASC Credit Agreement. Excludes stock based compensation (i.e. added back).
3. Does not include impact of $285.8 million Q3 tax valuation allowance.
7
|

Industry Overview
|
Industry Executive Summary
After several years of declining spending driven by reductions in Overseas Contingency Operations (“OCO”) funding and sequestration budget cuts, USG services spending appears to be on a path to stabilize over the next 5 years
- Expect some continued run off of OCO spending, mitigated by real requirements and fears driven by continuing international tensions
- Shorter cycle services spending was the first area to face cuts but also has the potential to be the first budget area to recover
Large contractor-addressable USG services market (~$250 billion) significantly greater than USG spending for products and systems
Secular shift in funding ultimately needs to be addressed by cuts to platforms and force structure
- Current system sustainment creates enduring demand for engineering & technical services
- Government workforce demographics creates sustained demand for program management, Systems Engineering & Technical Assistance (“SETA”) and technical consulting support
Agencies that previously were less price sensitive now placing increasing value on cost-efficient delivery of quality services
Competitive intensity is high among industry players trying to maintain market share in industry that is facing contraction after years of expansion
9
|
Intelligence Community (IC)
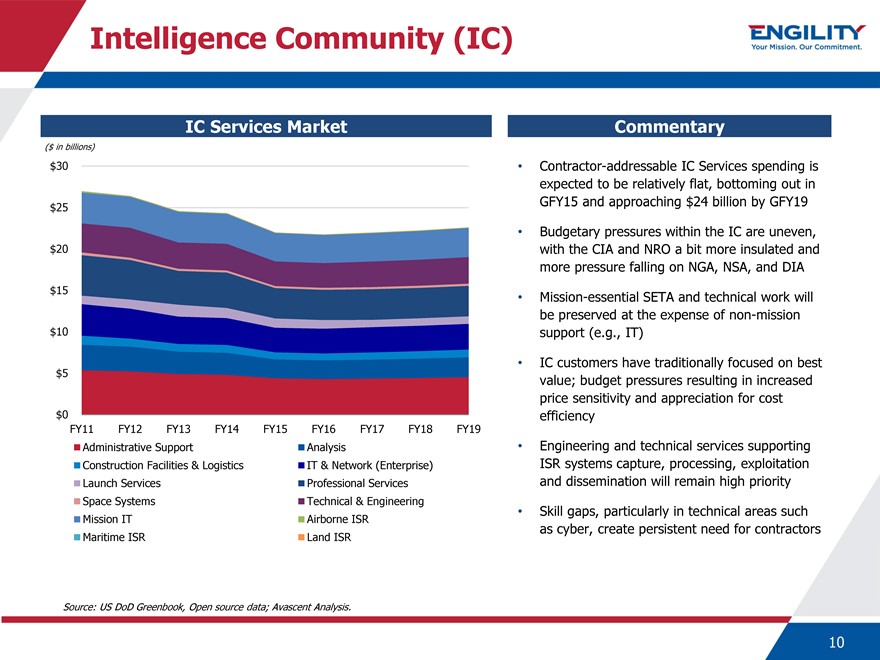
IC Services Market
($ in billions)
$30
$25
$20
$15
$10
$5
$0
FY11 FY12 FY13 FY14 FY15 FY16 FY17 FY18 FY19
Administrative Support Analysis
Construction Facilities & Logistics IT & Network (Enterprise)
Launch Services Professional Services
Space Systems Technical & Engineering
Mission IT Airborne ISR
Maritime ISR Land ISR
Commentary
Contractor-addressable IC Services spending is expected to be relatively flat, bottoming out in GFY15 and approaching $24 billion by GFY19 Budgetary pressures within the IC are uneven, with the CIA and NRO a bit more insulated and more pressure falling on NGA, NSA, and DIA Mission-essential SETA and technical work will be preserved at the expense of non-mission support (e.g., IT) IC customers have traditionally focused on best value; budget pressures resulting in increased price sensitivity and appreciation for cost efficiency Engineering and technical services supporting ISR systems capture, processing, exploitation and dissemination will remain high priority Skill gaps, particularly in technical areas such as cyber, create persistent need for contractors
Source: US DoD Greenbook, Open source data; Avascent Analysis.
10
|
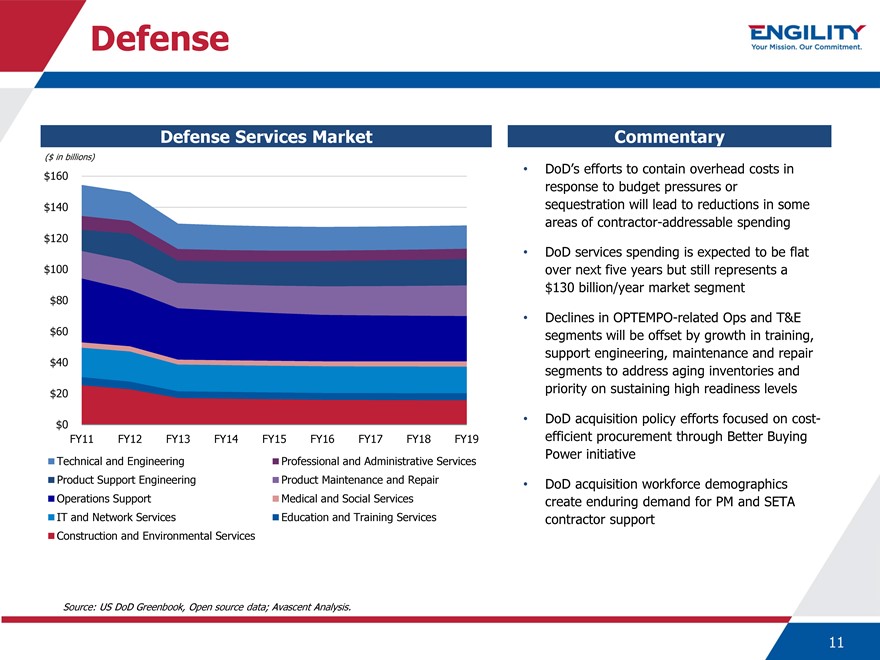
Defense
Defense Services Market
($ in billions)
$160
$140
$120
$100
$80
$60
$40
$20
$0
FY11 FY12 FY13 FY14 FY15 FY16 FY17 FY18 FY19
Technical and Engineering Professional and Administrative Services
Product Support Engineering Product Maintenance and Repair
Operations Support Medical and Social Services
IT and Network Services Education and Training Services
Construction and Environmental Services
Source: US DoD Greenbook, Open source data; Avascent Analysis.
Commentary
DoD’s efforts to contain overhead costs in response to budget pressures or sequestration will lead to reductions in some areas of contractor-addressable spending DoD services spending is expected to be flat over next five years but still represents a $130 billion/year market segment Declines in OPTEMPO-related Ops and T&E segments will be offset by growth in training, support engineering, maintenance and repair segments to address aging inventories and priority on sustaining high readiness levels DoD acquisition policy efforts focused on cost-efficient procurement through Better Buying Power initiative DoD acquisition workforce demographics create enduring demand for PM and SETA contractor support
11
|
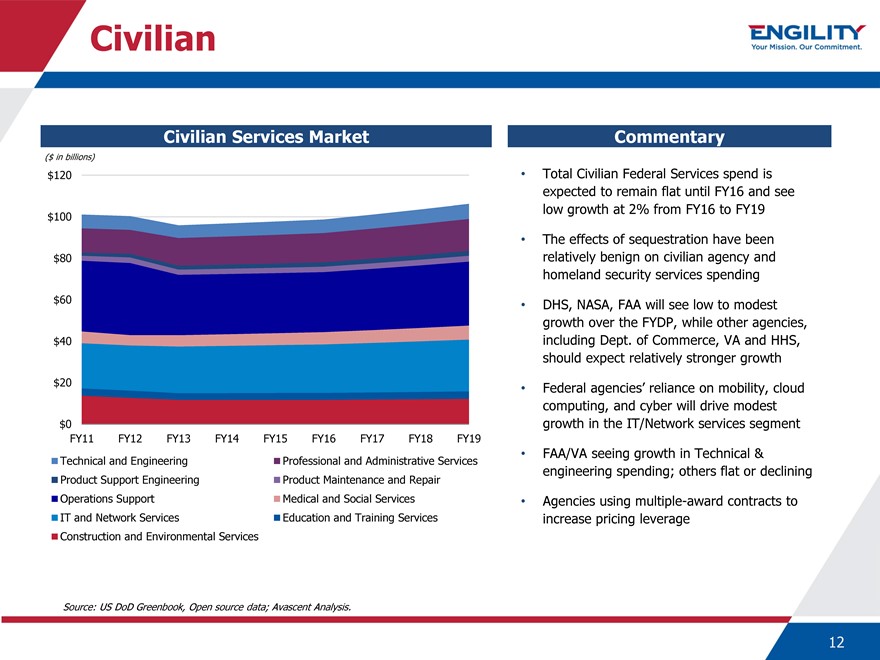
Civilian
Civilian Services Market
($ in billions) $120
$100 $80 $60 $40 $20
$0
FY11 FY12 FY13 FY14 FY15 FY16 FY17 FY18 FY19 Technical and Engineering Professional and Administrative Services Product Support Engineering Product Maintenance and Repair Operations Support Medical and Social Services IT and Network Services Education and Training Services Construction and Environmental Services
Source: US DoD Greenbook, Open source data; Avascent Analysis.
Commentary
Total Civilian Federal Services spend is expected to remain flat until FY16 and see low growth at 2% from FY16 to FY19 The effects of sequestration have been relatively benign on civilian agency and homeland security services spending DHS, NASA, FAA will see low to modest growth over the FYDP, while other agencies, including Dept. of Commerce, VA and HHS, should expect relatively stronger growth Federal agencies’ reliance on mobility, cloud computing, and cyber will drive modest growth in the IT/Network services segment FAA/VA seeing growth in Technical & engineering spending; others flat or declining Agencies using multiple-award contracts to increase pricing leverage
12
|
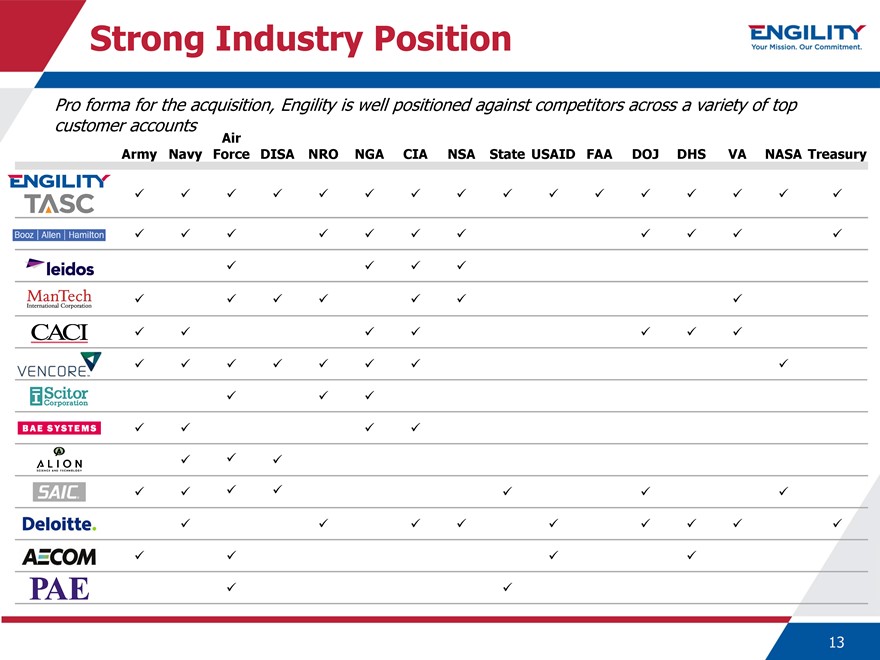
Strong Industry Position
Pro forma for the acquisition, Engility is well positioned against competitors across a variety of top customer accounts
Air
Army Navy Force DISA NRO NGA CIA NSA State USAID FAA DOJ DHS VA NASA Treasury
13
|

Engility Overview
|
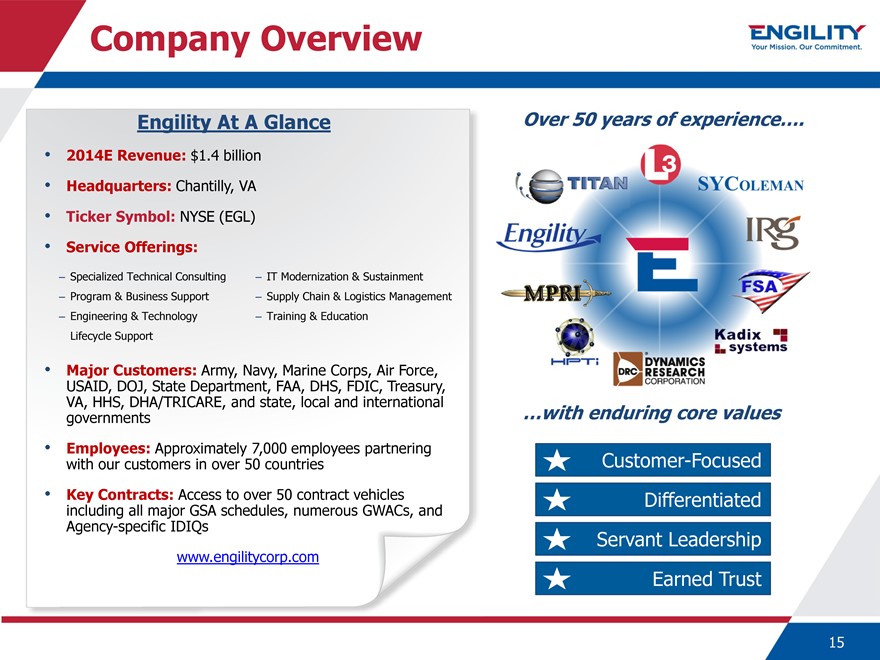
Company Overview
Engility At A Glance
2014E Revenue: $1.4 billion
Headquarters: Chantilly, VA
Ticker Symbol: NYSE (EGL)
Service Offerings:
– Specialized Technical Consulting – IT Modernization & Sustainment
– Program & Business Support – Supply Chain & Logistics Management
– Engineering & Technology – Training & Education Lifecycle Support
Major Customers: Army, Navy, Marine Corps, Air Force, USAID, DOJ, State Department, FAA, DHS, FDIC, Treasury, VA, HHS, DHA/TRICARE, and state, local and international governments
Employees: Approximately 7,000 employees partnering with our customers in over 50 countries
Key Contracts: Access to over 50 contract vehicles including all major GSA schedules, numerous GWACs, and Agency-specific IDIQs www.engilitycorp.com
Over 50 years of experience….
…with enduring core values
Customer-Focused Differentiated Servant Leadership Earned Trust
15
|

Engility Transformation
2012 2013 Jan. 2014 H2 2014 Oct. 2014
Spin-off “One” DRC Significant TASC from L-3 Engility Acquisition Award Wins Acquisition
Formed in July 2012 with a “clean sheet of paper” approach; opportunities to duplicate success Strong program performance and reputation for customer success Enhanced competitiveness with streamlined cost structure Price disruptive model gaining traction
– Significant new contract wins and momentum in 2H 2014 Consistent approach to capital deployment and M&A strategy
– Strong track record of developing and executing integration strategies that drive meaningful top-and bottom-line savings (spin-off and DRC acquisition)
– Acquisition positions Engility to accelerate the execution of its strategy
16
|
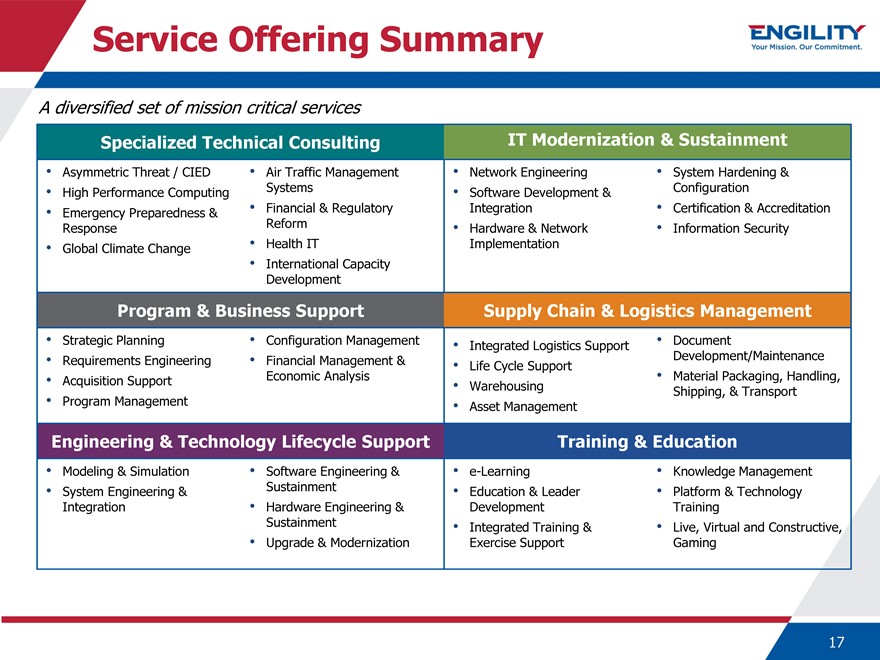
Service Offering Summary
A diversified set of mission critical services
Specialized Technical Consulting
Asymmetric Threat / CIED Air Traffic Management
High Performance Computing Systems
Emergency Preparedness & Financial & Regulatory Response Reform
Global Climate Change Health IT
International Capacity Development
Program & Business Support
Strategic Planning Configuration Management
Requirements Engineering Financial Management &
Acquisition Support Economic Analysis
Program Management
Engineering & Technology Lifecycle Support
Modeling & Simulation Software Engineering &
System Engineering & Sustainment
Integration • Hardware Engineering & Sustainment
Upgrade & Modernization
IT Modernization & Sustainment
Network Engineering • System Hardening & Software Development & Configuration Integration • Certification & Accreditation Hardware & Network • Information Security Implementation
Supply Chain & Logistics Management
Integrated Logistics Support • Document
Development/Maintenance Life Cycle Support
Material Packaging, Handling, Warehousing Shipping, & Transport Asset Management
Training & Education
e-Learning • Knowledge Management Education & Leader • Platform & Technology Development Training Integrated Training & • Live, Virtual and Constructive, Exercise Support Gaming
17
|
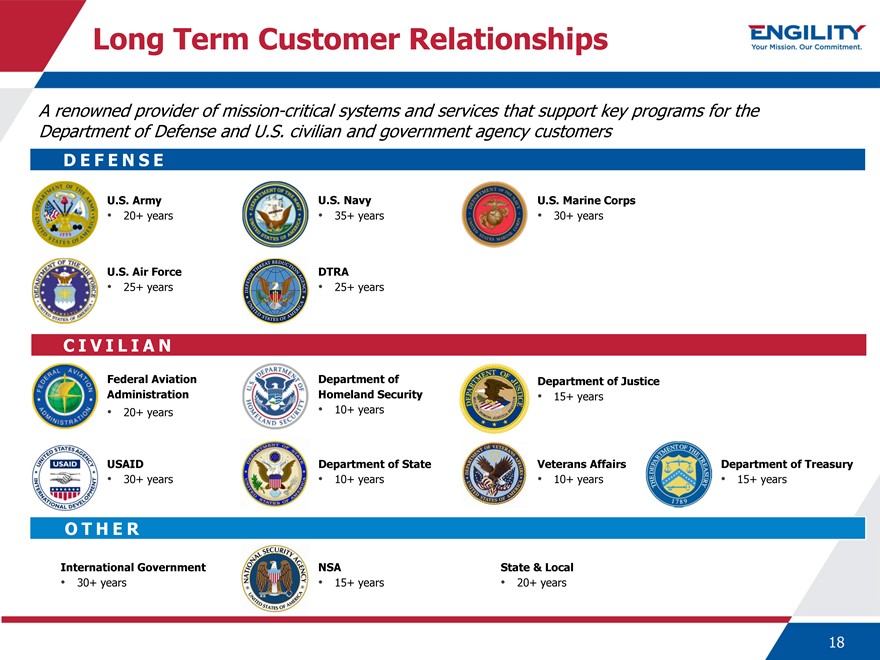
Long Term Customer Relationships
A renowned provider of mission-critical systems and services that support key programs for the Department of Defense and U.S. civilian and government agency customers
DEFENSE
U.S. Army U.S. Navy U.S. Marine Corps
20+ years 35+ years 30+ years
U.S. Air Force DTRA
25+ years 25+ years
Federal Aviation Department of Department of Justice Administration Homeland Security • 15+ years
20+ years 10+ years
USAID Department of State Veterans Affairs Department of Treasury
30+ years 10+ years 10+ years 15+ years
OTHER
International Government NSA State & Local
30+ years 15+ years 20+ years
18
|
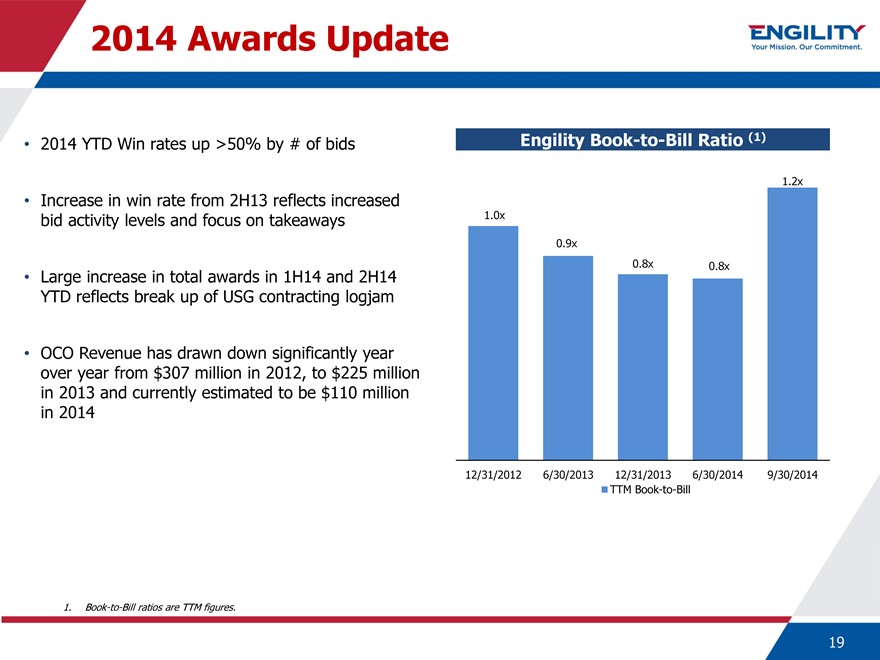
2014 Awards Update
2014 YTD Win rates up >50% by # of bids
Increase Incremental in win Opportunities rate from 2H13 = ~5% reflects increased
bid activity levels and focus on takeaways
Large increase in total awards in 1H14 and 2H14
YTD reflects break up of USG contracting logjam
OCO Revenue has drawn down significantly year
over year from $307 million in 2012, to $225 million
in 2013 and currently estimated to be $110 million
in 2014
Engility Book-to-Bill Ratio (1)
1.2x
1.0x
0.9x
0.8x 0.8x
12/31/2012 6/30/2013 12/31/2013 6/30/2014 9/30/2014 TTM Book-to-Bill
1. Book-to-Bill ratios are TTM figures.
19
|
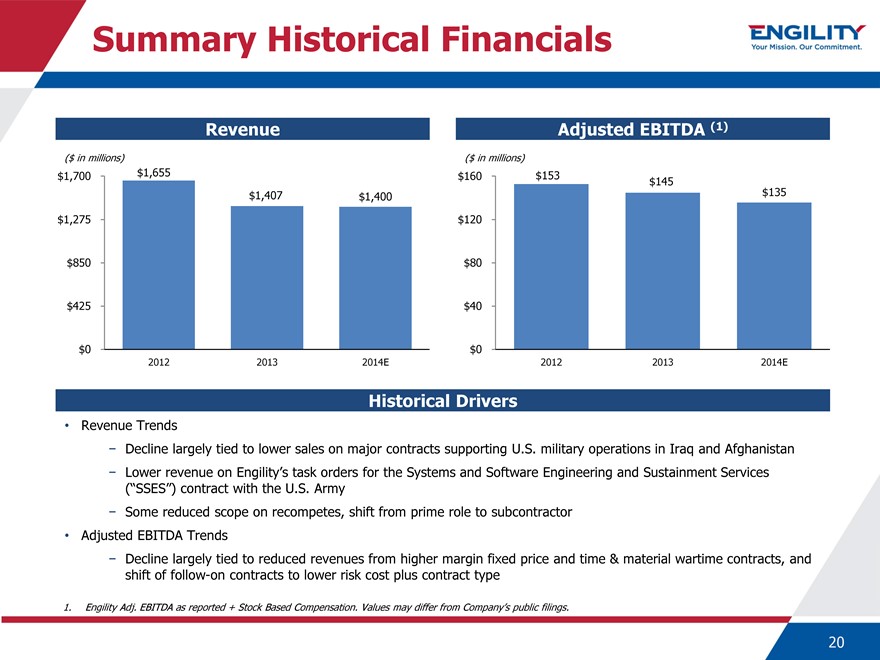
Summary Historical Financials
Revenue
($ in millions) $1,700 $1,655 $1,407 $1,400 $1,275
$850
$425
$0
2012 2013 2014E
Adjusted EBITDA (1)
($ in millions) $160 $153 $145 $135 $120
$80
$40
$0
2012 2013 2014E
Historical Drivers
Revenue Trends
- Decline largely tied to lower sales on major contracts supporting U.S. military operations in Iraq and Afghanistan
- Lower revenue on Engility’s task orders for the Systems and Software Engineering and Sustainment Services (“SSES”) contract with the U.S. Army
- Some reduced scope on recompetes, shift from prime role to subcontractor
Adjusted EBITDA Trends
- Decline largely tied to reduced revenues from higher margin fixed price and time & material wartime contracts, and shift of follow-on contracts to lower risk cost plus contract type
1. Engility Adj. EBITDA as reported + Stock Based Compensation. Values may differ from Company’s public filings.
20
|

TASC Overview
|
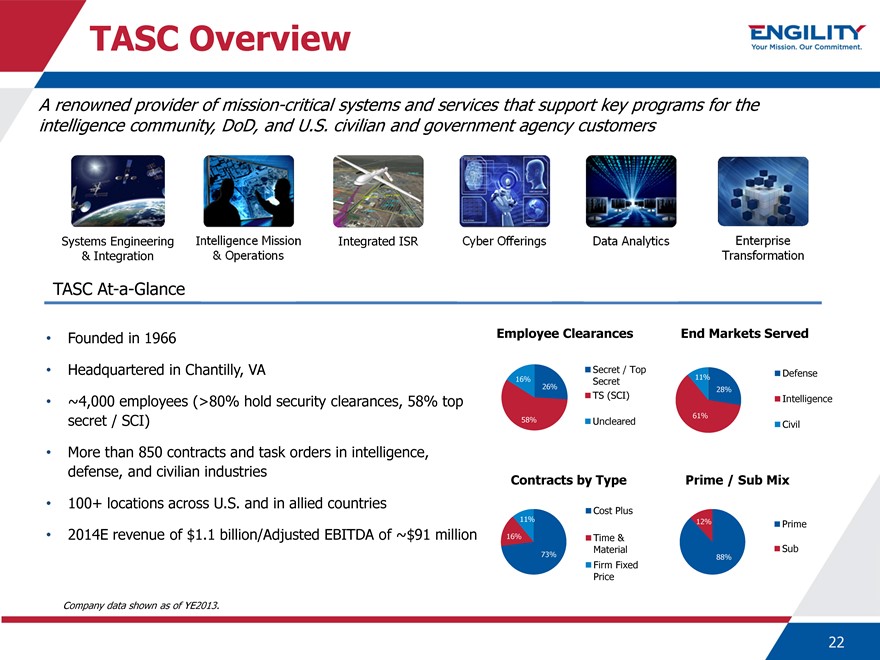
TASC Overview
A renowned provider of mission-critical systems and services that support key programs for the intelligence community, DoD, and U.S. civilian and government agency customers
Systems Engineering
& Integration
Intelligence Mission & Operations
Integrated ISR
Cyber Offerings
Data Analytics
Enterprise TransformationTASC At-a-Glance
Founded in 1966
Headquartered in Chantilly, VA
~4,000 employees (>80% hold security clearances, 58% top secret / SCI)
More than 850 contracts and task orders in intelligence, defense, and civilian industries
100+ locations across U.S. and in allied countries
2014E revenue of $1.1 billion/Adjusted EBITDA of ~$91 million
Company data shown as of YE2013.
Employee Clearances End Markets Served
Secret / Top 0%
11% Defense
16% 26% Secret
28%
TS (SCI) Intelligence
61%
58% Uncleared Civil
Contracts by Type Prime / Sub Mix
11% Cost Plus
12% Prime 16% Time & Material Sub
73% 88%
Firm Fixed Price
22
|
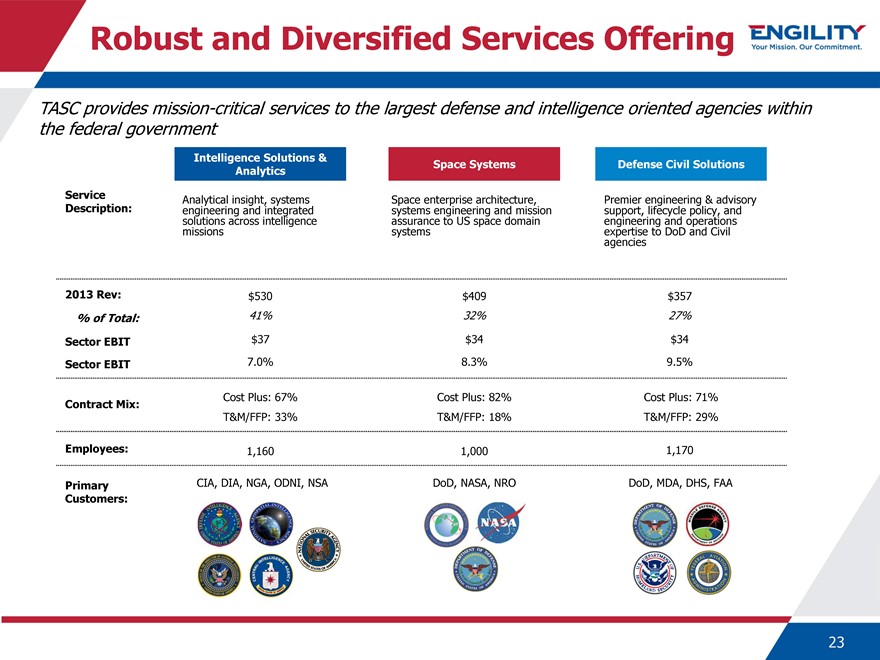
Robust and Diversified Services Offering
TASC provides mission-critical services to the largest defense and intelligence oriented agencies within the federal government
Intelligence Solutions &
Space Systems Defense Civil Solutions Analytics Service Analytical insight, systems Space enterprise architecture, Premier engineering & advisory Description: engineering and integrated systems engineering and mission support, lifecycle policy, and solutions missions across intelligence systems assurance to US space domain engineering expertise to and DoD operations and Civil agencies
2013 Rev: $530 $409 $357
% of Total: 41% 32% 27%
Sector EBIT $37 $34 $34
Sector EBIT 7.0% 8.3% 9.5%
Contract Mix: Cost Plus: 67% Cost Plus: 82% Cost Plus: 71%
T&M/FFP: 33% T&M/FFP: 18% T&M/FFP: 29%
Employees: 1,160 1,000 1,170
Primary CIA, DIA, NGA, ODNI, NSA DoD, NASA, NRO DoD, MDA, DHS, FAA
Customers:
23
|
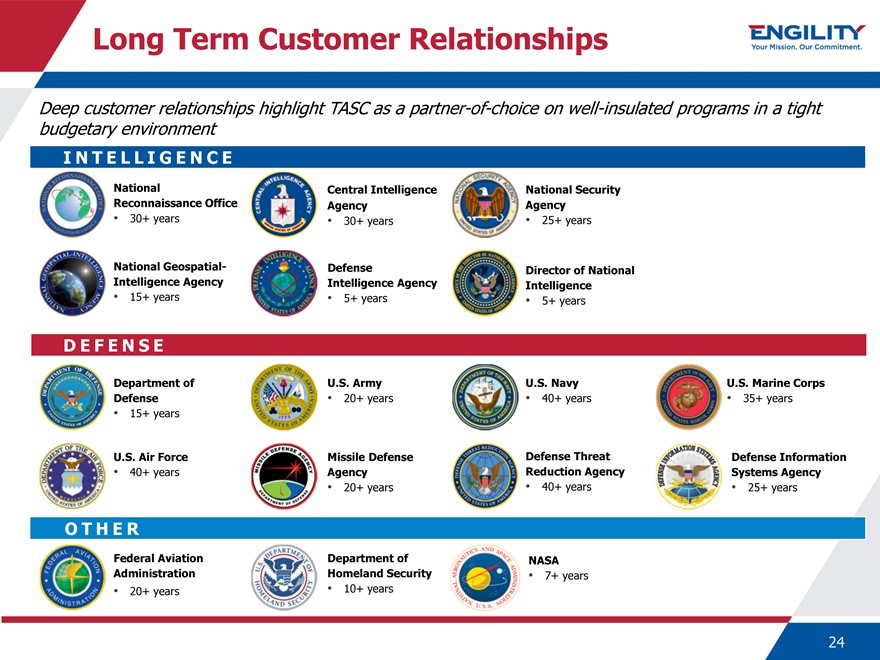
Long Term Customer Relationships
Deep customer relationships highlight TASC as a partner-of-choice on well-insulated programs in a tight budgetary environment
INTELLIGENCE
National Central Intelligence National Security Reconnaissance Office Agency Agency
30+ years 30+ years 25+ years
National Geospatial- Defense Director of National Intelligence Agency Intelligence Agency Intelligence
15+ years 5+ years 5+ years
DEFENSE
Department of U.S. Army U.S. Navy U.S. Marine Corps Defense • 20+ years • 40+ years • 35+ years
15+ years
U.S. Air Force Missile Defense Defense Threat Defense Information
• 40+ years Agency Reduction Agency Systems Agency
20+ years 40+ years 25+ years
OTHER
Federal Aviation Department of NASA Administration Homeland Security • 7+ years
20+ years 10+ years
24
|
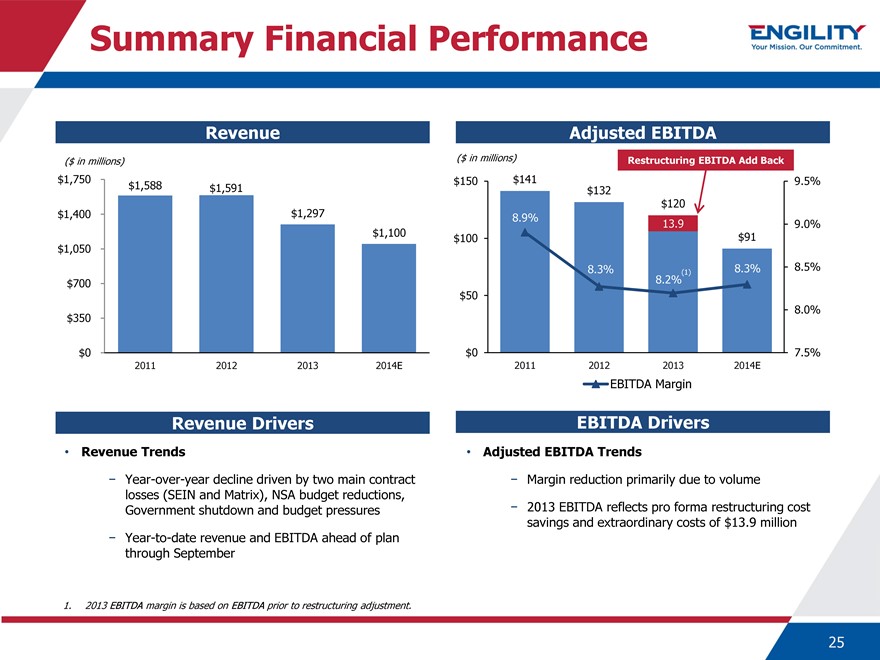
Summary Financial Performance
Revenue
($ in millions) $1,750 $1,588 $1,591 $1,400 $1,297 $1,100 $1,050
$700
$350
$0
2011 2012 2013 2014E
Adjusted EBITDA
($ in millions) Restructuring EBITDA Add Back $150 $141 $132 9.5% $120
8.9%
13.9 9.0% $100 $91
8.3% 8.3% 8.5%
(1)
8.2% $50
8.0%
$0 7.5%
2011 2012 2013 2014E
EBITDA Margin
Revenue Drivers
• Revenue Trends
- Year-over-year decline driven by two main contract losses (SEIN and Matrix), NSA budget reductions, Government shutdown and budget pressures
- Year-to-date revenue and EBITDA ahead of plan through September
EBITDA Drivers
• Adjusted EBITDA Trends
- Margin reduction primarily due to volume
- 2013 EBITDA reflects pro forma restructuring cost savings and extraordinary costs of $13.9 million
1. 2013 EBITDA margin is based on EBITDA prior to restructuring adjustment.
25
|
Summary Financial Performance
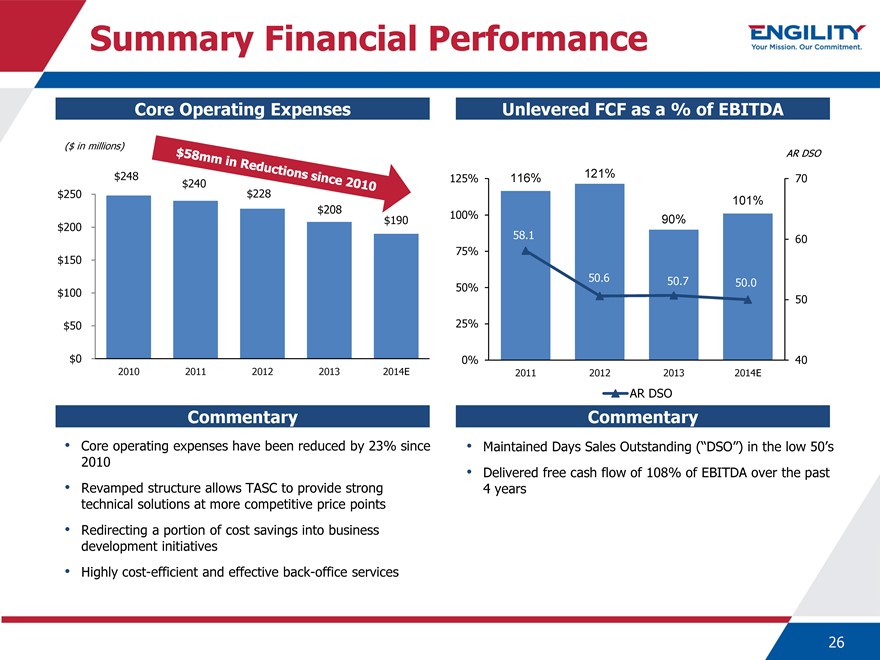
Core Operating Expenses
($ in millions)
$248 $240 $250 $228 $208 $190 $200
$150 $100 $50
$0
2010 2011 2012 2013 2014E
Unlevered FCF as a % of EBITDA
AR DSO
125% 116% 121% 70 101%
100% 90%
58.1 60 75%
50.6 50.7 50.0 50%
50 25%
0% 40
2011 2012 2013 2014E
AR DSO
Commentary
Core operating expenses have been reduced by 23% since 2010
Revamped structure allows TASC to provide strong technical solutions at more competitive price points
Redirecting a portion of cost savings into business development initiatives
Highly cost-efficient and effective back-office services
Commentary
Maintained Days Sales Outstanding (“DSO”) in the low 50’s
Delivered free cash flow of 108% of EBITDA over the past 4 years
26
|
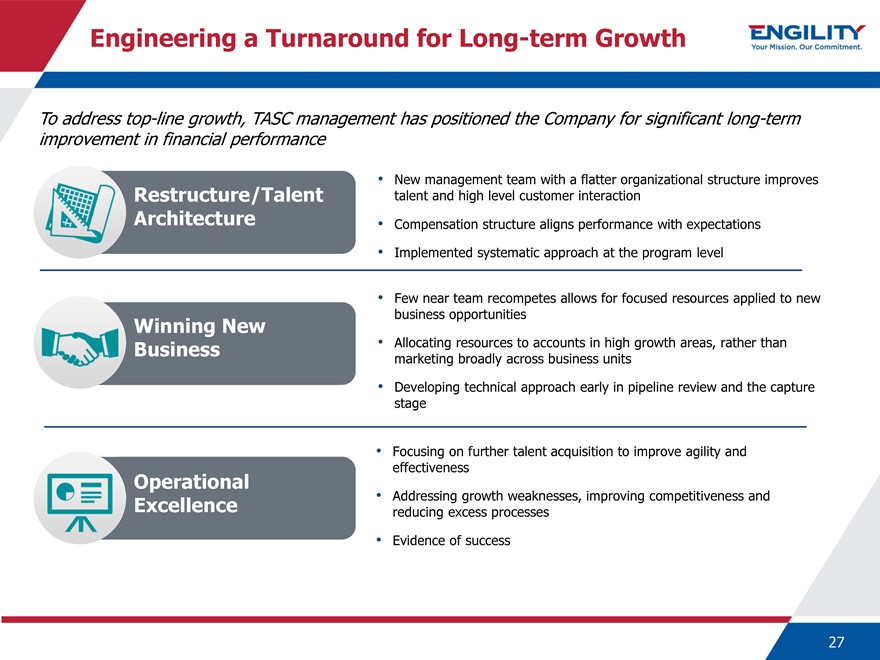
Engineering a Turnaround for Long-term Growth
To address top-line growth, TASC management has positioned the Company for significant long-term improvement in financial performance
Restructure/Talent Architecture
Winning New Business
Operational Excellence
New management team with a flatter organizational structure improves talent and high level customer interaction Compensation structure aligns performance with expectations Implemented systematic approach at the program level
Few near team recompetes allows for focused resources applied to new business opportunities Allocating resources to accounts in high growth areas, rather than marketing broadly across business units Developing technical approach early in pipeline review and the capture stage
Focusing on further talent acquisition to improve agility and effectiveness Addressing growth weaknesses, improving competitiveness and reducing excess processes Evidence of success
27
|
Restructure / Talent Architecture
Restructured management team has rationalized TASC’s workforce and improved talent at a lower cost
New President/CEO and most line leaders
Flatter organizational structure brings managers closer to customer accounts with accountability shifted to sector leaders and decision makers
Compensation structure re-aligns performance with long-term goals
Implemented Talent Architecture at the Program Level
A proprietary, systematic approach to staffing that meets customers’ capability and cost needs without compromising mission excellence
Diagnostic: Dialogue to project emerging technical capability requirements and future cost-reduction requirements; SWOT analysis to identify competitive issues
Workforce assessment: Analysis of workforce skill sets and costs; analysis translated into talent map that shows issues and opportunities
Action plan: Plan for architecting workforce based on specific program and budget needs; addresses recruiting world-class subject-matter experts and lower-cost program-support personnel
28
|
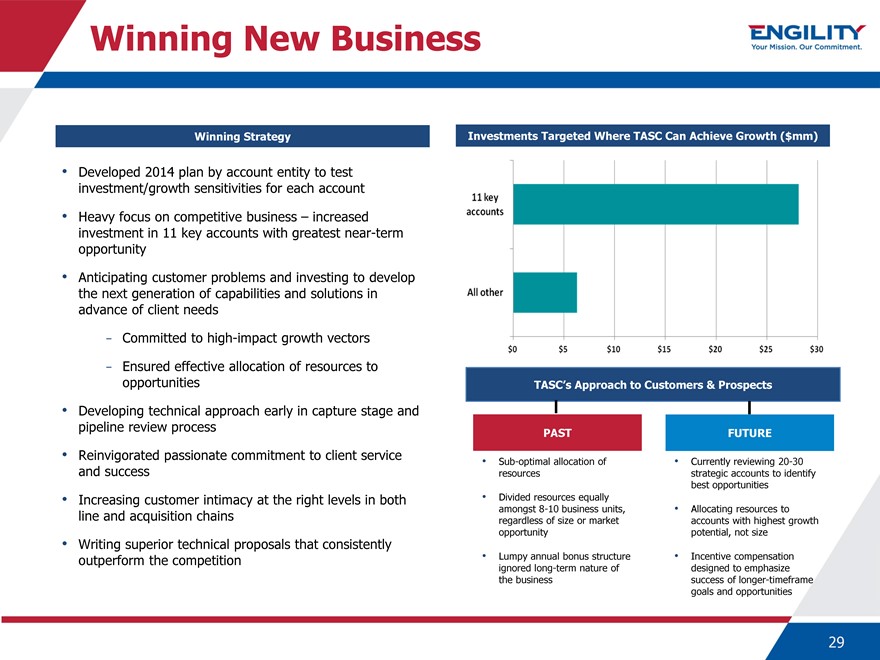
Winning New Business
Winning Strategy
Developed 2014 plan by account entity to test investment/growth sensitivities for each account
Heavy focus on competitive business – increased investment in 11 key accounts with greatest near-term opportunity
Anticipating customer problems and investing to develop the next generation of capabilities and solutions in advance of client needs
- Committed to high-impact growth vectors
- Ensured effective allocation of resources to opportunities
Developing technical approach early in capture stage and pipeline review process
Reinvigorated passionate commitment to client service and success
Increasing customer intimacy at the right levels in both line and acquisition chains
Writing superior technical proposals that consistently outperform the competition
Investments Targeted Where TASC Can Achieve Growth ($mm)
11 key accounts
All other
$0 $10 $15 $20 $25 $30
TASC’s Approach to Customers & Prospects
PAST FUTURE
Sub-optimal allocation of Currently reviewing 20-30 resources strategic accounts to identify best opportunities
Divided resources equally amongst 8-10 business units, Allocating resources to regardless of size or market accounts with highest growth opportunity potential, not size
Lumpy annual bonus structure Incentive compensation ignored long-term nature of designed to emphasize the business success of longer-timeframe goals and opportunities
29
|
Early Evidence of Success
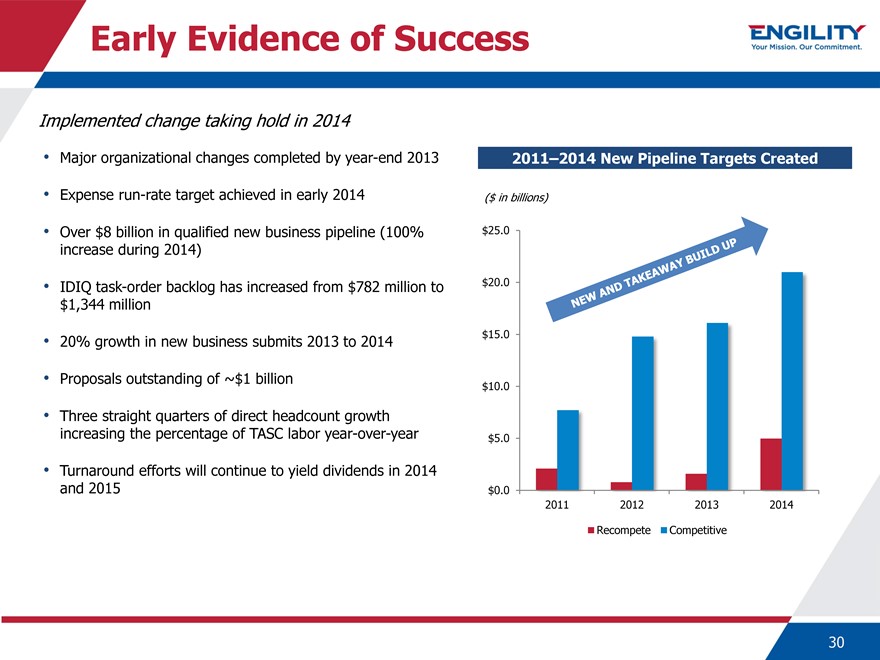
Implemented change taking hold in 2014
Major organizational changes completed by year-end 2013
Expense run-rate target achieved in early 2014
Over $8 billion in qualified new business pipeline (100% increase during 2014)
IDIQ task-order backlog has increased from $782 million to $1,344 million
20% growth in new business submits 2013 to 2014
Proposals outstanding of ~$1 billion
Three straight quarters of direct headcount growth increasing the percentage of TASC labor year-over-year
Turnaround efforts will continue to yield dividends in 2014 and 2015
2011–2014 New Pipeline Targets Created
($ in billions)
$25.0
$20.0
$15.0
$10.0
$5.0
$0.0
2011 2012 2013 2014
Recompete Competitive
30
|
Combination Rationale
|
Executive Summary
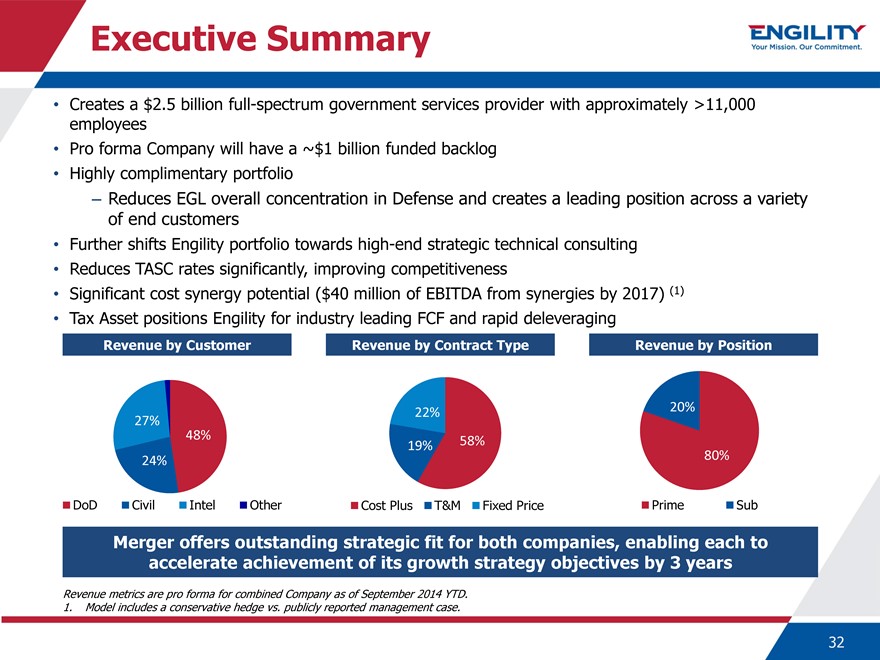
Creates a $2.5 billion full-spectrum government services provider with approximately >11,000 employees
Pro forma Company will have a ~$1 billion funded backlog
Highly complimentary portfolio
– Reduces EGL overall concentration in Defense and creates a leading position across a variety of end customers
Further shifts Engility portfolio towards high-end strategic technical consulting
Reduces TASC rates significantly, improving competitiveness
Significant cost synergy potential ($40 million of EBITDA from synergies by 2017) (1)
Tax Asset positions Engility for industry leading FCF and rapid deleveraging
Revenue by Customer Revenue by Contract Type Revenue by Position
20% 22% 27% 48% 19% 58% 24% 80%
DoD Civil Intel Other Cost Plus T&M Fixed Price Prime Sub
Merger offers outstanding strategic fit for both companies, enabling each to accelerate achievement of its growth strategy objectives by 3 years
Revenue metrics are pro forma for combined Company as of September 2014 YTD.
1. Model includes a conservative hedge vs. publicly reported management case.
32
|

Pro Forma Credit Highlights Summary
$2.5 billion, Top Tier Government Services Provider Highly Diversified by Customer, Service Offering and Contract Substantial Synergy Potential Significant Tax Attributes Strong Financial Profile Highly Experienced Management Team
33
|
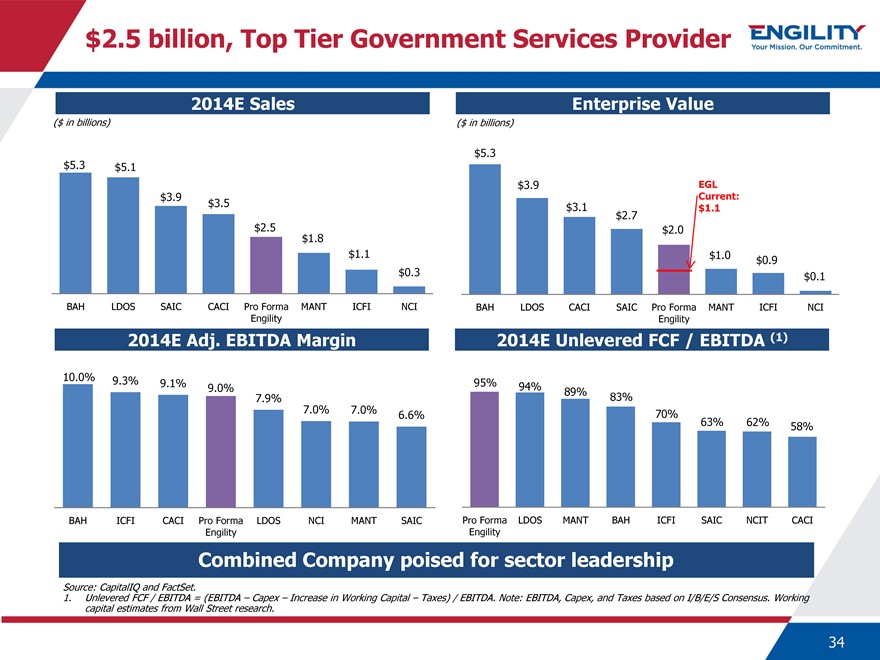
$2.5 billion, Top Tier Government Services Provider
2014E Sales
($ in billions)
$5.3 $5.1
$3.9
$3.5
$2.5 $1.8
$1.1
$0.3
BAH LDOS SAIC CACI Pro Forma MANT ICFI NCI Engility
2014E Adj. EBITDA Margin
10.0% 9.3%
9.1% 9.0%
7.9% 7.0%
7.0% 6.6%
BAH ICFI CACI Pro Forma LDOS NCI MANT SAIC Engility
Enterprise Value
($ in billions)
$5.3
$3.9 EGL
$3.1 Current:
$1.1
$2.7
$2.0
$1.0 $0.9
$0.1
BAH LDOS CACI SAIC Pro Forma MANT ICFI NCI Engility
2014E Unlevered FCF / EBITDA (1)
95% 94%
89% 83%
70%
63% 62% 58%
Pro Forma LDOS MANT BAH ICFI SAIC NCIT CACI Engility
Combined Company poised for sector leadership
Source: CapitalIQ and FactSet.
1. Unlevered FCF / EBITDA = (EBITDA – Capex – Increase in Working Capital – Taxes) / EBITDA. Note: EBITDA, Capex, and Taxes based on I/B/E/S Consensus. Working capital estimates from Wall Street research.
34
|
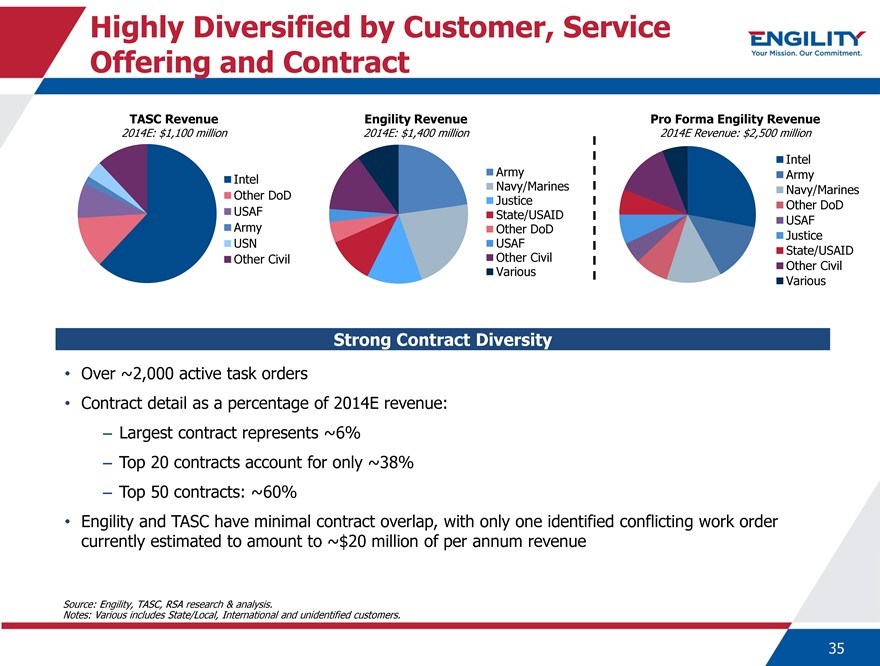
Highly Diversified by Customer, Service Offering and Contract
TASC Revenue Engility Revenue Pro Forma Engility Revenue
2014E: $1,100 million 2014E: $1,400 million 2014E Revenue: $2,500 million
Army Intel Intel Navy/Marines Army Other DoD Navy/Marines Justice Other DoD USAF State/USAID
USAF Army Other DoD
Justice USN USAF
State/USAID Other Civil Other Civil Various Other Civil Various
Strong Contract Diversity
Over ~2,000 active task orders
Contract detail as a percentage of 2014E revenue:
– Largest contract represents ~6%
– Top 20 contracts account for only ~38%
– Top 50 contracts: ~60%
Engility and TASC have minimal contract overlap, with only one identified conflicting work order currently estimated to amount to ~$20 million of per annum revenue
Source: Engility, TASC, RSA research & analysis.
Notes: Various includes State/Local, International and unidentified customers.
35
|
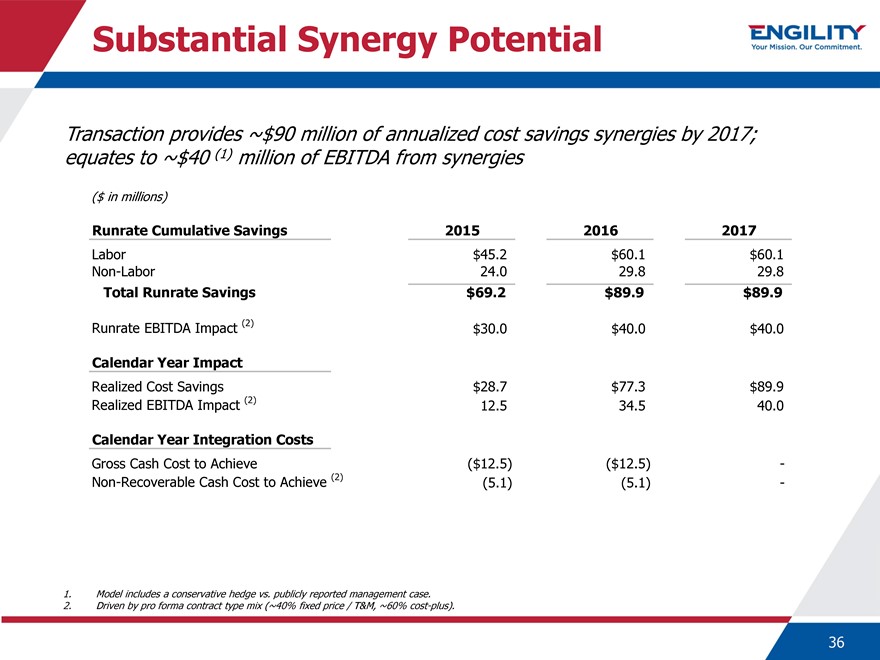
Substantial Synergy Potential
Transaction provides ~$90 million of annualized cost savings synergies by 2017;
equates to ~$40 (1) million of EBITDA from synergies
($ in millions)
Runrate Cumulative Savings 2015 2016 2017
Labor $45.2 $60.1 $60.1
Non-Labor 24.0 29.8 29.8
Total Runrate Savings $69.2 $89.9 $89.9
Runrate EBITDA Impact (2) $30.0 $40.0 $40.0
Calendar Year Impact
Realized Cost Savings $28.7 $77.3 $89.9
Realized EBITDA Impact (2) 12.5 34.5 40.0
Calendar Year Integration Costs
Gross Cash Cost to Achieve($12.5)($12.5) -
Non-Recoverable Cash Cost to Achieve (2)(5.1)(5.1) -
1. Model includes a conservative hedge vs. publicly reported management case.
2. Driven by pro forma contract type mix (~40% fixed price / T&M, ~60% cost-plus).
36
|
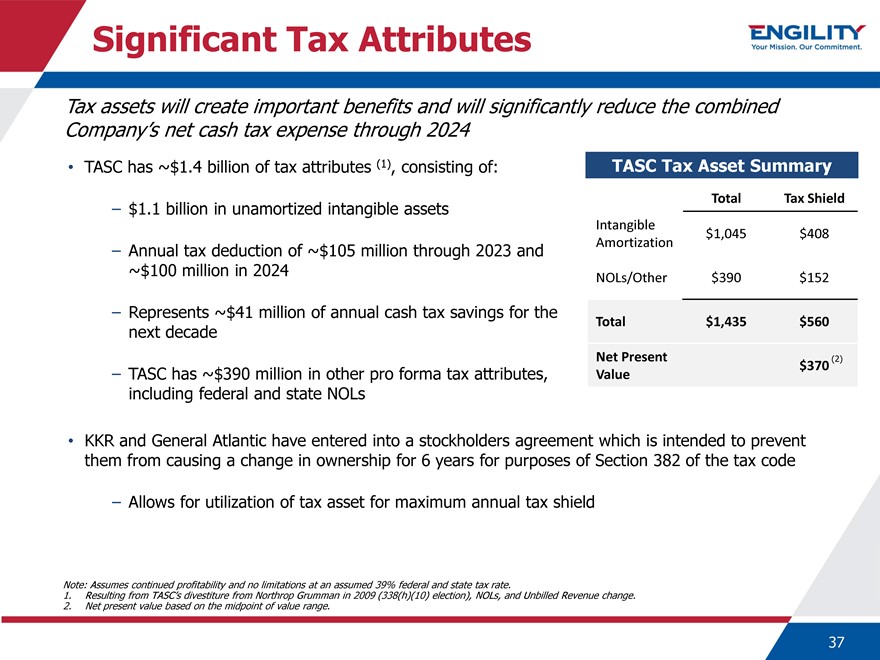
Significant Tax Attributes
Tax assets will create important benefits and will significantly reduce the combined Company’s net cash tax expense through 2024
TASC has ~$1.4 billion of tax attributes (1), consisting of:
– $1.1 billion in unamortized intangible assets
– Annual tax deduction of ~$105 million through 2023 and
~$100 million in 2024
– Represents ~$41 million of annual cash tax savings for the next decade
– TASC has ~$390 million in other pro forma tax attributes, including federal and state NOLs
KKR and General Atlantic have entered into a stockholders agreement which is intended to prevent them from causing a change in ownership for 6 years for purposes of Section 382 of the tax code
– Allows for utilization of tax asset for maximum annual tax shield
TASC Tax Asset Summary
Total Tax Shield
Intangible
$1,045 $ 408
Amortization
NOLs/Other $390 $ 152
Total $1,435 $ 560
Net Present(2)
$ 370
Value
Note: Assumes continued profitability and no limitations at an assumed 39% federal and state tax rate.
1. Resulting from TASC’s divestiture from Northrop Grumman in 2009 (338(h)(10) election), NOLs, and Unbilled Revenue change.
2. Net present value based on the midpoint of value range.
37
|
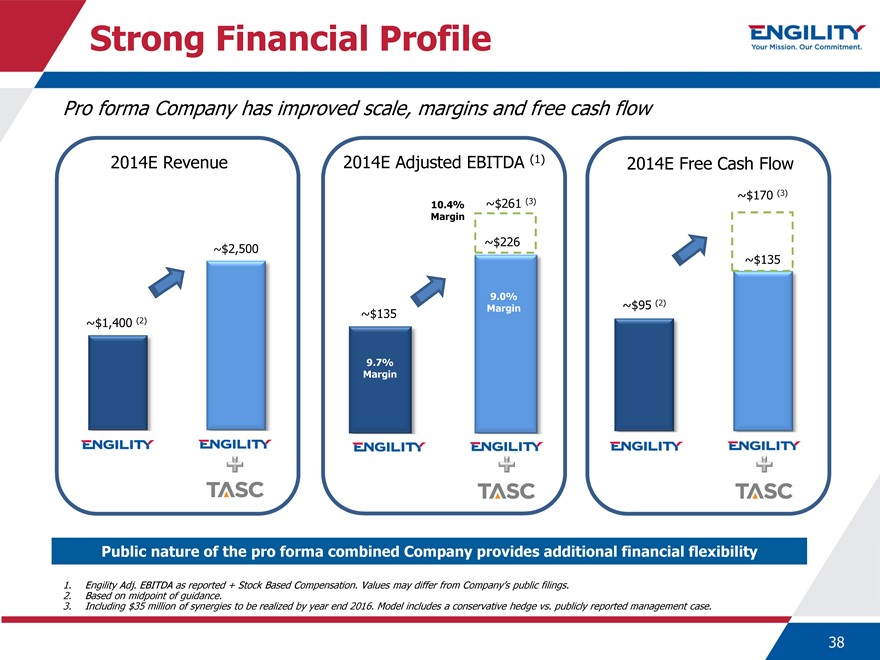
Strong Financial Profile
Pro forma Company has improved scale, margins and free cash flow
2014E Revenue 2014E Adjusted EBITDA (1) 2014E Free Cash Flow
~$261 (3) ~$170 (3)
10.4% Margin
~$226
~$2,500
~$135
9.0%
~$95 (2)
~$135 Margin
~$1,400 (2)
9.7% Margin
Public nature of the pro forma combined Company provides additional financial flexibility
1. Engility Adj. EBITDA as reported + Stock Based Compensation. Values may differ from Company’s public filings.
2. Based on midpoint of guidance.
3. Including $35 million of synergies to be realized by year end 2016. Model includes a conservative hedge vs. publicly reported management case.
38
|
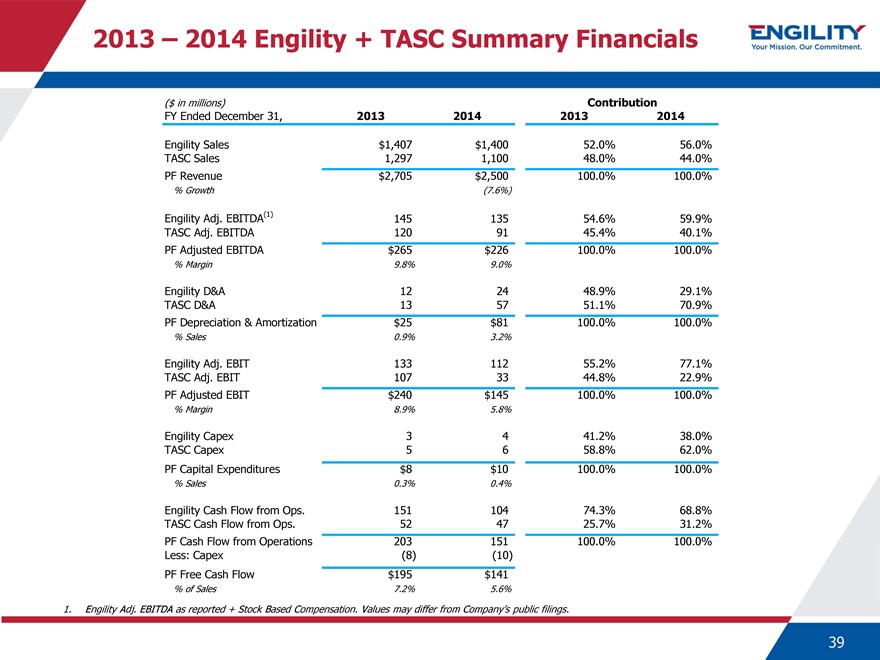
2013 – 2014 Engility + TASC Summary Financials
($ in millions) Contribution
FY Ended December 31, 2013 2014 2013 2014
Engility Sales $1,407 $1,400 52.0% 56.0% TASC Sales 1,297 1,100 48.0% 44.0% PF Revenue $2,705 $2,500 100.0% 100.0%
% Growth (7.6%)
Engility Adj. EBITDA(1) 145 135 54.6% 59.9% TASC Adj. EBITDA 120 91 45.4% 40.1% PF Adjusted EBITDA $265 $226 100.0% 100.0%
% Margin 9.8% 9.0%
Engility D&A 12 24 48.9% 29.1% TASC D&A 13 57 51.1% 70.9% PF Depreciation & Amortization $25 $81 100.0% 100.0%
% Sales 0.9% 3.2%
Engility Adj. EBIT 133 112 55.2% 77.1% TASC Adj. EBIT 107 33 44.8% 22.9% PF Adjusted EBIT $240 $145 100.0% 100.0%
% Margin 8.9% 5.8%
Engility Capex 3 4 41.2% 38.0% TASC Capex 5 6 58.8% 62.0% PF Capital Expenditures $8 $10 100.0% 100.0%
% Sales 0.3% 0.4%
Engility Cash Flow from Ops. 151 104 74.3% 68.8% TASC Cash Flow from Ops. 52 47 25.7% 31.2% PF Cash Flow from Operations 203 151 100.0% 100.0% Less: Capex (8) (10) PF Free Cash Flow $195 $141
% of Sales 7.2% 5.6%
1. Engility Adj. EBITDA as reported + Stock Based Compensation. Values may differ from Company’s public filings.
39
|
Pro Forma Credit Highlights Summary
$2.5 billion, Top Tier Government Services Provider Highly Diversified by Customer, Service Offering and Contract Substantial Synergy Potential Significant Tax Attributes Strong Financial Profile Highly Experienced Management Team
40
|

Transaction Details
|
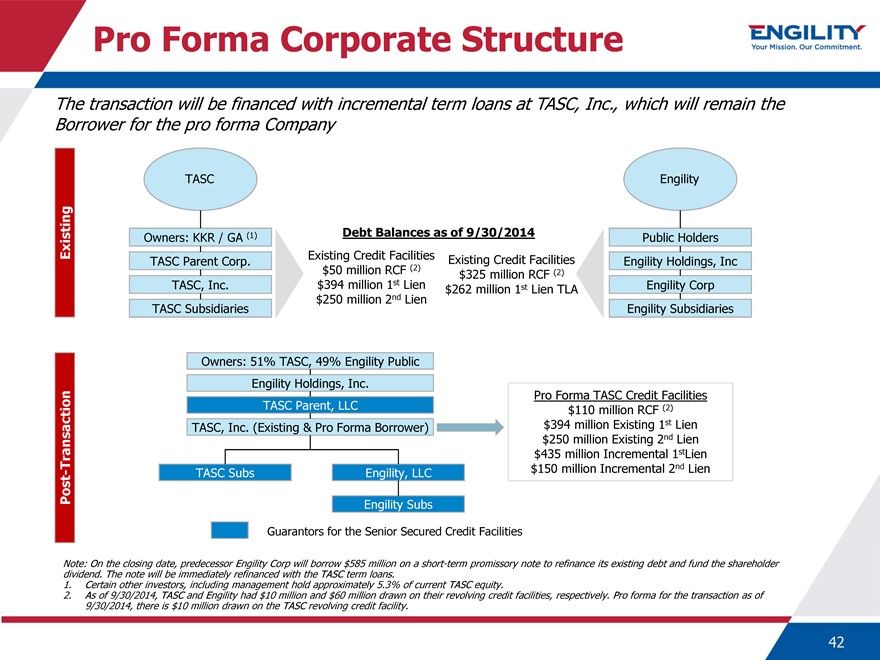
The transaction will be financed with incremental term loans at TASC, Inc., which will remain the Borrower for the pro forma Company
TASC Engility
Owners: KKR / GA (1) Debt Balances as of 9/30/2014 Public Holders Existing TASC Parent Corp. Existing Credit Facilities Existing Credit Facilities Engility Holdings, Inc $50 million RCF (2) $325 million RCF (2) TASC, Inc. $394 million 1st Lien Engility Corp $262 million 1st Lien TLA $250 million 2nd Lien TASC Subsidiaries Engility Subsidiaries
Owners: 51% TASC, 49% Engility Public
Engility Holdings, Inc. Pro Forma TASC Credit Facilities TASC Parent, LLC $110 million RCF (2) TASC, Inc. (Existing & Pro Forma Borrower) $394 million Existing 1st Lien $250 million Existing 2nd Lien $435 million Incremental 1stLien Transaction—TASC Subs Engility, LLC $150 million Incremental 2nd Lien Post Engility Subs
Guarantors for the Senior Secured Credit Facilities
Note: On the closing date, predecessor Engility Corp will borrow $585 million on a short-term promissory note to refinance its existing debt and fund the shareholder dividend. The note will be immediately refinanced with the TASC term loans.
1. Certain other investors, including management hold approximately 5.3% of current TASC equity.
2. As of 9/30/2014, TASC and Engility had $10 million and $60 million drawn on their revolving credit facilities, respectively. Pro forma for the transaction as of 9/30/2014, there is $10 million drawn on the TASC revolving credit facility.
Pro forma Corporate Structure
42
|
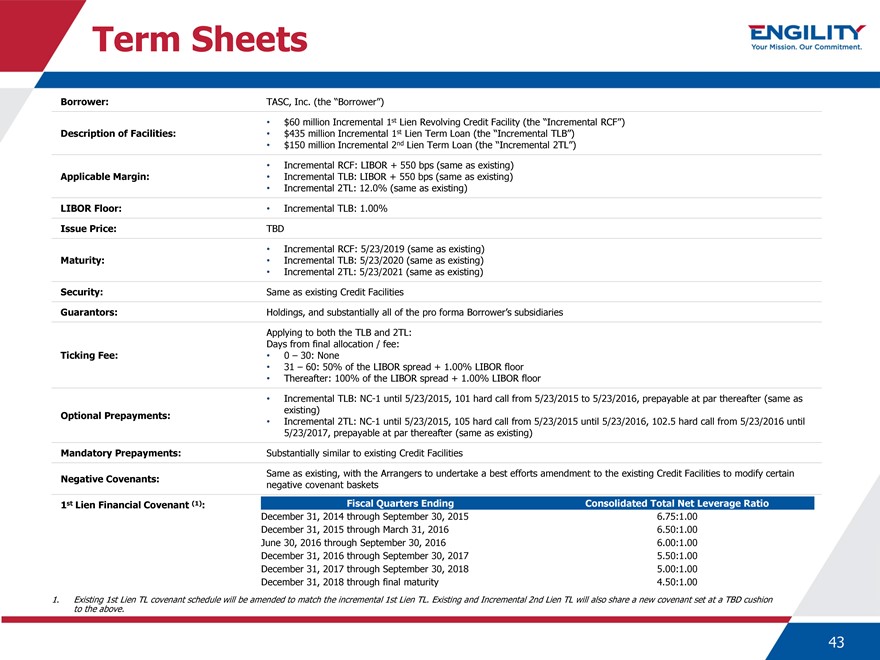
Term Sheets
Borrower: TASC, Inc. (the “Borrower”)
• $60 million Incremental 1st Lien Revolving Credit Facility (the “Incremental RCF”)
Description of Facilities: • $435 million Incremental 1st Lien Term Loan (the “Incremental TLB”)
• $150 million Incremental 2nd Lien Term Loan (the “Incremental 2TL”)
• Incremental RCF: LIBOR + 550 bps (same as existing)
Applicable Margin: • Incremental TLB: LIBOR + 550 bps (same as existing)
• Incremental 2TL: 12.0% (same as existing)
LIBOR Floor: • Incremental TLB: 1.00%
Issue Price: TBD
• Incremental RCF: 5/23/2019 (same as existing)
Maturity: • Incremental TLB: 5/23/2020 (same as existing)
• Incremental 2TL: 5/23/2021 (same as existing)
Security: Same as existing Credit Facilities
Guarantors: Holdings, and substantially all of the pro forma Borrower’s subsidiaries
Applying to both the TLB and 2TL:
Days from final allocation / fee:
Ticking Fee: • 0 – 30: None
• 31 – 60: 50% of the LIBOR spread + 1.00% LIBOR floor
• Thereafter: 100% of the LIBOR spread + 1.00% LIBOR floor
• Incremental TLB: NC-1 until 5/23/2015, 101 hard call from 5/23/2015 to 5/23/2016, prepayable at par thereafter (same as
Optional Prepayments: existing)
• Incremental 2TL: NC-1 until 5/23/2015, 105 hard call from 5/23/2015 until 5/23/2016, 102.5 hard call from 5/23/2016 until
5/23/2017, prepayable at par thereafter (same as existing)
Mandatory Prepayments: Substantially similar to existing Credit Facilities
Negative Covenants: Same as existing, with the Arrangers to undertake a best efforts amendment to the existing Credit Facilities to modify certain
negative covenant baskets
1st Lien Financial Covenant (1): Fiscal Quarters Ending Consolidated Total Net Leverage Ratio
December 31, 2014 through September 30, 2015 6.75:1.00
December 31, 2015 through March 31, 2016 6.50:1.00
June 30, 2016 through September 30, 2016 6.00:1.00
December 31, 2016 through September 30, 2017 5.50:1.00
December 31, 2017 through September 30, 2018 5.00:1.00
December 31, 2018 through final maturity 4.50:1.00
1. Existing 1st Lien TL covenant schedule will be amended to match the incremental 1st Lien TL. Existing and Incremental 2nd Lien TL will also share a new covenant set at a TBD cushion
to the above.
43
|
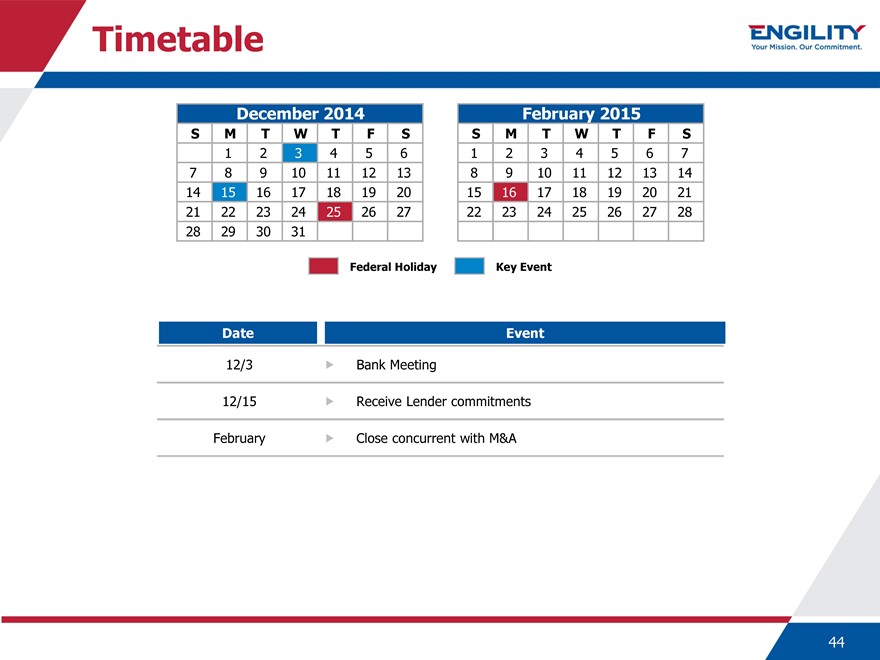
Timetable
December 2014 February 2015
SM T W T F S S M T W T F S
1 2 3 4 5 6 1 2 3 4 5 6 7
7 8 9 10 11 12 13 8 9 10 11 12 13 14
14 15 16 17 18 19 20 15 16 17 18 19 20 21
21 22 23 24 25 26 27 22 23 24 25 26 27 28
28 29 30 31
Federal Holiday Key Event
Date Event
12/3 Bank Meeting
12/15 Receive Lender commitments
February Close concurrent with M&A
44
|
Appendix
|
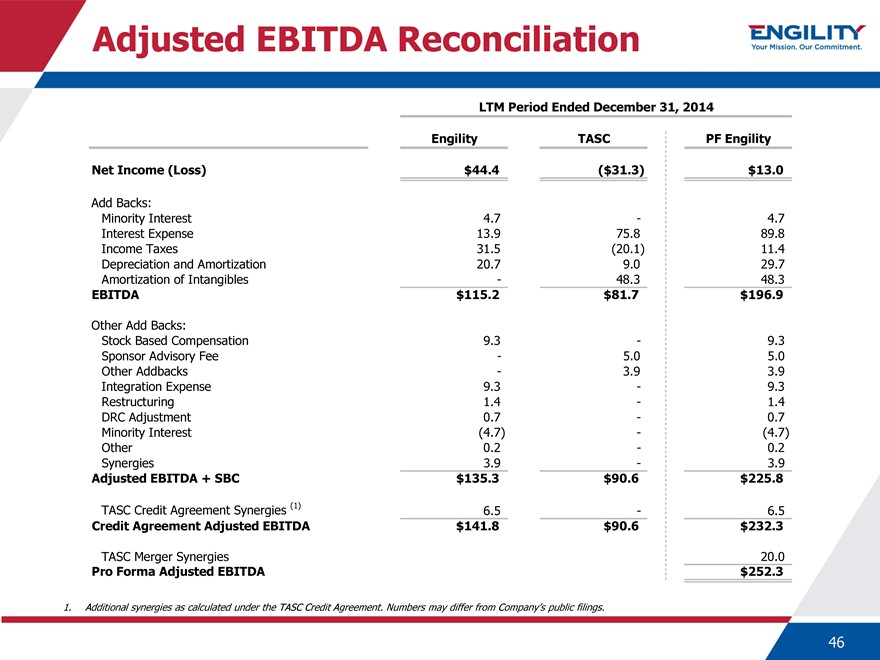
Adjusted EBITDA Reconciliation
LTM Period Ended December 31, 2014
Engility TASC PF Engility
Net Income (Loss) $44.4($31.3) $13.0
Add Backs:
Minority Interest 4.7—4.7
Interest Expense 13.9 75.8 89.8
Income Taxes 31.5(20.1) 11.4
Depreciation and Amortization 20.7 9.0 29.7
Amortization of Intangibles—48.3 48.3
EBITDA $115.2 $81.7 $196.9
Other Add Backs:
Stock Based Compensation 9.3—9.3
Sponsor Advisory Fee—5.0 5.0
Other Addbacks—3.9 3.9
Integration Expense 9.3—9.3
Restructuring 1.4—1.4
DRC Adjustment 0.7—0.7
Minority Interest(4.7) -(4.7)
Other 0.2—0.2
Synergies 3.9—3.9
Adjusted EBITDA + SBC $135.3 $90.6 $225.8
TASC Credit Agreement Synergies (1) 6.5—6.5
Credit Agreement Adjusted EBITDA $141.8 $90.6 $232.3
TASC Merger Synergies 20.0
Pro Forma Adjusted EBITDA $252.3
1. Additional synergies as calculated under the TASC Credit Agreement. Numbers may differ from Company’s public filings.
46
|
Disclaimer
This confidential information (“Information”) is based on information provided by Engility, Inc. (“EGL” or the “Company”) and TASC, Inc. (“TASC” or the “Target”). Information is being furnished on a confidential basis solely for use by the recipient in making its own evaluation of EGL and TASC and each company’s business, assets, financial condition and prospects.
This Information does not purport to contain all of the information that may be required or desired by a recipient to evaluate EGL and TASC. In all cases, interested parties should conduct their own independent investigation and analysis of EGL and its business, assets, financial condition and prospects. By accepting this Information, the recipient agrees (in addition to any obligations it may have under any confidentiality agreement) that neither it nor its agents, representatives, directors, officers, affiliates or employees will copy, reproduce or distribute to others this Information, in whole or in part, at any time without the prior written consent of EGL or TASC and that it will keep permanently confidential all information contained herein not already in the public domain. The recipient should become familiar with this and other obligations to which the recipient is subject pursuant to any confidentiality agreement. Upon request, the recipient will promptly return all material received from EGL and TASC (including this Information) without retaining any copies thereof.
The financial projections and other estimates contained herein are forward-looking statements with respect to the anticipated performance of EGL and TASC and each company’s respective affiliates. Such financial projections and estimates reflect various assumptions of management of EGL and TASC concerning the future performance of EGL and TASC and are subject to significant business, financial, economic, operating, competitive and other risks and uncertainties and contingencies (many of which are difficult to predict and beyond the control of EGL and TASC) that could cause actual results to differ materially from the statements included herein. In addition, such financial projections and estimates were not prepared with a view to public disclosure or compliance with published guidelines of the U.S. Securities and Exchange Commission, the guidelines established by the American Institute of Certified Public Accountants or U.S. generally accepted accounting principles. Accordingly, although EGL and TASC’s management believes the financial projections and estimates contained herein represent a reasonable estimate of EGL and TASC’s projected financial condition and results of operations, there can be no assurance as to the reliability or correctness of such financial projections and estimates, nor should any assurances be inferred, and actual results may vary materially from those projected.
Neither Engility nor TASC nor any of each company’s respective affiliates, representatives or advisors assumes any responsibility for, and makes no representation or warranty (express or implied) as to, the reasonableness, completeness, accuracy or reliability of the financial projections, estimates and other information contained herein, which speak only as of the date identified on cover page of this presentation. EGL and TASC and each company’s respective affiliates, representatives and advisors expressly disclaim any and all liability based, in whole or in part, on such information, errors therein or omissions therefrom. Neither EGL nor TASC nor any of each company’s respective affiliates, representatives or advisors intends to update or otherwise revise the financial projections, estimates and other information contained herein to reflect circumstances existing after the date identified on the cover page of this presentation to reflect the occurrence of future events even if any or all of the assumptions, judgments and estimates on which the information contained herein is based are shown to be in error.
47
|
Additional Information for Stockholders
ADDITIONAL INFORMATION FOR STOCKHOLDERS
In connection with the proposed merger, Engility Holdings, Inc. (“Engility”) and New East Holdings, Inc., a wholly owned subsidiary of Engility (“New Engility”), have filed with the SEC a registration statement on Form S-4 which includes a preliminary joint proxy/consent solicitation statement of Engility and TASC Parent Corporation (“TASC”) and a preliminary prospectus of New Engility, as well as other relevant documents concerning the proposed transaction. The registration statement has not yet become effective. Engility will mail the definitive joint proxy/consent solicitation statement/prospectus to the Engility and TASC stockholders. STOCKHOLDERS OF ENGILITY AND TASC ARE URGED TO READ THE REGISTRATION STATEMENT AND THE DEFINITIVE JOINT PROXY/CONSENT SOLICITATION STATEMENT/PROSPECTUS REGARDING THE PROPOSED MERGER WHEN IT BECOMES AVAILABLE AND ANY OTHER RELEVANT DOCUMENTS FILED WITH THE SEC, AS WELL AS ANY AMENDMENTS OR SUPPLEMENTS TO THOSE DOCUMENTS, BECAUSE THEY WILL CONTAIN IMPORTANT INFORMATION. Investors and security holders may obtain a free copy of the definitive joint proxy/consent solicitation statement/prospectus (when available) and other filings containing information about Engility at the SEC’s website at www.sec.gov. The definitive joint proxy/consent solicitation statement/prospectus (when available) and the other filings may also be obtained free of charge at Engility’s website at www.Engilitycorp.com under the tab “Investor Relations,” and then under the heading “SEC Filings.”
Engility and certain of its directors and executive officers, under the SEC’s rules, may be deemed to be participants in the solicitation of proxies of Engility stockholders in connection with the proposed merger. Information about the directors and executive officers of Engility and their ownership of Engility common stock is set forth in the proxy statement for Engility’s 2014 annual meeting of stockholders, as filed with the SEC on Schedule 14A on April 11, 2014.
Additional information regarding the interests of those participants and other persons who may be deemed participants in the transaction may be obtained by reading the definitive joint proxy/consent solicitation statement/prospectus regarding the proposed merger when it becomes available. Free copies of this document may be obtained as described in the preceding paragraphs.
NO OFFERS OR SOLICITATIONS
This communication is for informational purposes only and is neither an offer to purchase, nor a solicitation of an offer to sell, subscribe for or buy any securities or the solicitation of any vote in any jurisdiction pursuant to the proposed transaction or otherwise, nor shall there be any sale, issuance or transfer of securities in any jurisdiction in contravention of applicable law. No offer of securities shall be made except by means of a prospectus meeting the requirements of Section 10 of the Securities Act of 1933, as amended.
48