UNITED STATES
SECURITIES AND EXCHANGE COMMISSION
Washington, D.C. 20549
Form 20-F
| ¨ | REGISTRATION STATEMENT PURSUANT TO SECTION 12(b) OR (g) OF THE SECURITIES EXCHANGE ACT OF 1934 |
OR
| x | ANNUAL REPORT PURSUANT TO SECTION 13 or 15(d) OF THE SECURITIES EXCHANGE ACT OF 1934 |
FOR THE FISCAL YEAR ENDED ON DECEMBER 31, 2014
OR
| ¨ | TRANSITION REPORT PURSUANT TO SECTION 13 OR 15(d) OF THE SECURITIES EXCHANGE ACT OF 1934 |
FOR THE TRANSITION PERIOD FROM TO
OR
| ¨ | SHELL COMPANY REPORT PURSUANT TO SECTION 13 OR 15(d) OF THE SECURITIES EXCHANGE ACT OF 1934 |
Date of event requiring this shell company report
COMMISSION FILE NUMBER: 001-35575
Cencosud S.A.
(Exact name of Registrant as specified in its charter)
N/A
(Translation of Registrant’s name into English)
Republic of Chile
(Jurisdiction of incorporation or organization)
Av. Kennedy 9001, Piso 6
Las Condes, Santiago, Chile
+56 (2) 2959-0804
(Address of principal executive offices)
Maria Soledad Fernández / Natalia Nacif / Ignacio Reyes
Av. Kennedy 9001 6th Floor
Email: IR@cencosud.cl / Mariasoledad.fernandez@cencosud.cl
Tel: +56229590545 / +56229590368
(Name, Telephone, E-Mail and/or Facsimile number and Address of Company Contact Person)
Securities registered or to be registered pursuant to Section 12(b) of the Act:
| | |
Title of Each Class | | Name of Each Exchange on Which Registered |
| American Depositary Shares | | New York Stock Exchange |
| Common Shares, no par value | | New York Stock Exchange |
Securities registered or to be registered pursuant to Section 12(g) of the Act:
None
Securities for which there is a reporting obligation pursuant to Section 15(d) of the Act:
None
The number of outstanding shares of each of the issuer’s classes of capital stock as of December 31, 2014: 2,828,723,963 Common Shares, no par value
Indicate by check mark if the registrant is a well-known seasoned issuer, as defined in Rule 405 of the Securities Act Yes ¨ No x
If this report is an annual or transition report, indicate by check mark if the registrant is not required to file reports pursuant to Section 13 or 15(d) of the Securities Exchange Act of 1934 Yes ¨ No x
Indicate by check mark whether the Registrant (1) has filed all reports required to be filed by Section 13 or 15(d) of the Securities Exchange Act of 1934 during the preceding 12 months (or for such shorter period that the Registrant was required to file such reports) and (2) has been subject to such filing requirements for the past 90 days. Yes x No ¨
Indicate by check mark whether the registrant has submitted electronically and posted on its corporate Web site, if any, every Interactive Data File required to be submitted and posted pursuant to Rule 405 of Regulation S-T (§232.405 of this chapter) during the preceding 12 months (or for such shorter period that the registrant was required to submit and post such files). Yes ¨ No ¨
Indicate by check mark whether the registrant is a large accelerated filer, an accelerated filer, or non-accelerated filer. See definition of “accelerated filer and large accelerated filer” in Rule 12b-2 of the Exchange Act. (Check one):
Large accelerated filer x Accelerated filer ¨ Non-accelerated filer ¨
Indicate by check mark which basis of accounting the registrant has used to prepare the financial statements included in this filing:
| | | | |
U.S. GAAP ¨ | | International Financial Reporting Standards as issued by the International Accounting Standards Board x | | Other ¨ |
If “Other” has been checked in response to the previous question, indicate by check mark which financial statement item the Registrant has elected to follow: Item 17 ¨ Item 18 ¨
If this is an annual report, indicate by check mark whether the registrant is a shell company (as defined in Rule 12b-2 of the Exchange Act). Yes ¨ No x
TABLE OF CONTENTS
FORWARD-LOOKING STATEMENTS
This annual report contains forward-looking statements that are based on our current expectations, assumptions, estimates and projections about us and our industry. These forward-looking statements can be identified by words or phrases such as “anticipate,” “believe,” “continue,” “estimate,” “expect,” “intend,” “is/are likely to,” “may,” “plan,” “should,” “would,” or other similar expressions. The forward-looking statements included in this annual report relate to, among others:
| | • | | changes in general economic, business or political or other conditions in Chile, Argentina, Brazil, Peru, Colombia or elsewhere in Latin America or the global markets; |
| | • | | changes in capital markets in general that may affect policies or attitudes towards investing in Chile, Argentina, Brazil, Peru, Colombia or securities issued by companies in such countries; |
| | • | | the monetary and interest rate policies of the Central Banks of Chile, Argentina, Brazil, Peru and Colombia; or elsewhere in Latin American or global markets. |
| | • | | high levels of inflation or deflation; |
| | • | | unanticipated increases in financing and other costs or our inability to obtain additional debt or equity financing on attractive terms; |
| | • | | movements in interest and/or foreign exchange rates, and movements in equity prices or other rates or prices; |
| | • | | changes in, or failure to comply with, applicable regulations, or changes in taxes; |
| | • | | loss of market share or changes in competition and pricing environments in the industries in which we operate; |
| | • | | difficulties in successfully integrating recent and future acquisitions into our operations; |
| | • | | our inability to hedge certain risks economically; |
| | • | | changes in consumer spending and saving habits; |
| | • | | implementation of new technologies; |
| | • | | limitations on our ability to open new stores and operate them profitably; |
| | • | | difficulties in completing proposed store openings, expansions or remodelings; |
| | • | | difficulties in acquiring and developing land in Chile, Argentina, Brazil, Peru or Colombia, and restrictions on opening new large stores in any such countries; and |
| | • | | the factors discussed under the section entitled “Risk Factors” in this annual report as well as risks included in the Company’s other filings and submissions with the United States Securities and Exchange Commission. |
These forward-looking statements involve various risks and uncertainties. Although we believe that the expectations expressed in these forward-looking statements are reasonable, our expectations may turn out to be incorrect. Our actual results could be materially different from our expectations. In light of the risks and uncertainties described above, the estimates and forward-looking statements discussed in this annual report might not occur, and our future results and our performance may differ materially from those expressed in these forward-looking statements due to, including, but not limited to, the factors mentioned above. Because of these uncertainties, you should not make any investment decision based on these estimates and forward-looking statements.
The forward-looking statements made in this annual report relate only to events or information as of the date on which the statements are made. We undertake no obligation to update any forward-looking statements to reflect events or circumstances after the date on which the statements are made or to reflect the occurrence of unanticipated events.
1
PRESENTATION OF FINANCIAL AND OTHER INFORMATION
General
In this annual report, unless otherwise specified or if the context so requires:
| | • | | References to the terms “Cencosud S.A.,” “we,” “us,” “our,” and “our company” refer to the registrant, Cencosud S.A., a corporation organized under the form of asociedad anónima under the laws of Chile, and its consolidated subsidiaries, unless otherwise indicated. |
| | • | | References to “$,” “U.S.$,” “U.S. dollars,” “dollars” and “USD” are to U.S. dollars. |
| | • | | References to “Chilean pesos” or “Ch$” are to Chilean pesos, the official currency of Chile. |
| | • | | References to “Argentine pesos” or “Ar$” are to Argentine pesos, the official currency of Argentina. |
| | • | | References to “Brazilian Real,” “Real,” “Reais” or “R$” are to the Brazilian real, the official currency of Brazil. |
| | • | | References to “Nuevo Sol,” “Nuevos Soles” or “S/.” are to Peruvian nuevos soles, the official currency of Peru. |
| | • | | References to “Colombian pesos” or “Col$” are to Colombian pesos, the official currency of Colombia. |
| | • | | References to “UF” are toUnidades de Fomento. The UF is an inflation-indexed Chilean monetary unit with a value in Chilean pesos that is adjusted daily to reflect changes in the official Consumer Price Index (“CPI”) of theInstituto Nacional de Estadísticas (the “Chilean National Institute of Statistics”). The UF is adjusted in monthly cycles. Each day in the period beginning on the tenth day of the current month through the ninth day of the succeeding month, the nominal peso value of the UF is indexed up (or down in the event of deflation) in order to reflect a proportionate amount of the change in the Chilean consumer price index during the prior calendar month. As of December 31, 2014, UF1.00 was equivalent to U.S.$40.58 and Ch$24,627.101, in each case based on the observed exchange rate reported by the Central Bank of Chile. |
This annual report contains translations of certain Chilean peso amounts into U.S. dollars at specified rates solely for the convenience of the reader. These translations should not be construed as representations that the Chilean peso amounts actually represent such U.S. dollar amounts or could be converted into U.S. dollars at the rates indicated, at any particular rate or at all. Unless otherwise indicated, the exchange rate used in converting Chilean pesos into U.S. dollars for amounts presented as of and for the year ended December 31, 2014 is based on the observed exchange rate (dólar observado) reported by the Central Bank of Chile (the “Chilean Central Bank”) for December 31, 2014, which was Ch$606.75 per U.S.$1.00. The rates reported by the Chilean Central Bank for December 31, 2014 are based upon the observed exchange rate published by the Chilean Central Bank on the first business day following the respective period. The Federal Reserve Bank of New York does not report a noon buying rate for Chilean pesos.
Financial Statements
The financial information contained in this annual report includes our audited consolidated financial statements as of December 31, 2014 and 2013 and for the years ended December 31, 2014, 2013 and 2012 together with the notes thereto, prepared in accordance with International Financial Reporting Standards (“IFRS”) issued by the International Accounting Standards Board (the “IASB”), which we refer to in this annual report as our “Audited Consolidated Financial Statements.” Our date of adoption of IFRS was January 1, 2010.
Our Audited Consolidated Financial Statements have been audited by PricewaterhouseCoopersConsultores, Auditores y Compañia Limitada, an independent registered public accounting firm, whose report on our Audited Consolidated Financial Statements appears elsewhere in this annual report. We maintain our books and records in Chilean pesos and prepare consolidated financial statements in accordance with IFRS.
Unless otherwise noted, the financial data presented herein as of and for each of the five years ended December 31, 2014 is stated in Chilean pesos, our functional and reporting currency.
2
Our audited consolidated financial statements have been prepared on the accrual basis of accounting, except for those items accounted for at fair value (for example, investment properties and certain financial assets, such as options and derivative financial instruments), and include the accounts of the Company and its subsidiaries, including Banco Paris. All significant inter-company balances and transactions have been eliminated in consolidation.
The financial statements as of and for the year ended December 31, 2013 presented in this form 20-F differ from the local financial statements as of and for the year ended December 31, 2013 published in Chile on March 28, 2014 and furnished to the SEC on form 6K on March 31, 2014, due to the inclusion in this report of a Ch$20,000 million lawsuit provision related to the April 24, 2013 ruling from the Chilean Supreme Court on the Class action suit filed by theServicio Nacional del Consumidor (the National Consumer Service) against Cencosud Administradora de Tarjetas S.A. (“CAT”). For further information on this matter, please see “Item 8. Financial Information—A. Consolidated Statements and Other Financial Information—Legal and Administrative Proceedings” in this Annual Report. Financial statements presented in this annual report also differ due to the inclusion of the effect on deferred income tax liabilities of the Chilean tax reform that took place in 2014 as an effect on equity for the financial statements filed with our regulator in Chile in accordance with regulator issue Circular 856 dated October of 17, 2014. The effect of the Chilean tax reform on the financial statements included herein was against the company’s results in accordance with IAS 12. Please see Note 2 of the Financial Statements.
On June 20, 2014, Cencosud, together with its subsidiaries Cencosud Retail S.A. and Easy S.A., entered into a framework agreement (the “Joint Venture Framework Agreement”) with The Bank of Nova Scotia (“BNS”) and its wholly owned subsidiary Scotiabank Chile, to further develop, on a joint basis, the retail finance business in Chile (hereinafter, the “Business”). The Joint Venture Framework Agreement provides that the Business shall be operated through (i) Cencosud Administradora de Tarjetas S.A. (“CAT”), a subsidiary of Cencosud that is in the business of issuing credit cards, and (ii) Cencosud Administradora de Procesos S.A., Cencosud Servicios Integrales S.A. and Cencosud Corredores de Seguros y Servicios Ltda., or other companies to be established by Cencosud for purposes of the Joint Venture Framework Agreement, to assist in developing the Business, including information processing and collection activities related thereto (together with CAT, hereinafter, the “Subject Companies”). As part of the agreement, Scotiabank Chile will acquire a fifty-one percent (51%) controlling interest of each of the Subject Companies, with Cencosud retaining the remaining forty-nine percent (49%) non-controlling interest of each of the Subject Companies. This framework agreement has a lifespan of 15 years.
Cencosud prepares and reports its financial statements under IFRS. Under IFRS Standard N 5 (“IFRS 5”), “Disposal of subsidiaries, business and non-current assets”, the Subject Companies, which comprise the Chilean portion of our financial services segment, are considered as of June 20, 2014, to be “Assets held for sale” as a result of Cencosud’s commitment to sell a controlling interest to an unrelated party under the Joint Venture Framework Agreement, the occurrence of which received Chilean regulatory approval for its full execution on April 13, 2015. We expect full execution of the framework agreement in early May 2015.
IFRS 5 requires that (a) assets that meet the criteria to be classified as held for sale be measured at the lower of carrying amount andfair value lesscosts to sell, and depreciation on such assets shall cease; and (b) assets that meet the criteria to be classified as held for sale be presented separately in the statement of financial position and the results of discontinued operations, net of tax, and be presented separately in the statement of comprehensive income. Net cash flows attributable to the operating, investing and financing activities of discontinued operations are required to be disclosed either in the notes to the financial statements or in the financial statements themselves. IFRS 5 requires that a company “re-present” its financial disclosure of discontinued operations for all prior periods presented in the financial statements so that the disclosures relate to all operations that have been discontinued by the end of the reporting period for the latest period presented.
Special Note Regarding Non-IFRS Financial Measures
This annual report makes reference to certain non-IFRS measures, namely EBIT, EBITDA and Adjusted EBITDA from continuing operations. These non-IFRS measures are not recognized measures under IFRS, do not have a standardized meaning prescribed by IFRS and are therefore unlikely to be comparable to similar measures presented by other companies. Rather, these measures are provided as additional information to complement IFRS measures by providing further understanding of the Company’s results of operations from management’s perspective. Accordingly, they should not be considered in isolation nor as a substitute for analysis of our financial information reported under IFRS.
EBIT represents profit attributable to controlling shareholders before net interest expense and income taxes. EBITDA represents EBIT plus depreciation and amortization expense. Adjusted EBITDA represents EBITDA as further adjusted to reflect items set forth in the table below. We have included EBIT, EBITDA and Adjusted EBITDA to provide investors with a supplemental measure of our operating performance.
We believe EBIT, EBITDA and Adjusted EBITDA are an important supplemental measure of operating performance because they eliminate items that have less bearing on our operating performance and thus highlight trends in our core business that may not otherwise be apparent when relying solely on IFRS financial measures. We also believe that securities analysts, investors and other interested parties frequently use EBITDA in the evaluation of issuers, many of which present EBITDA when reporting their results.
3
Our management also uses EBITDA and Adjusted EBITDA in order to facilitate operating performance comparisons from period to period, prepare annual operating budgets, assess our ability to meet our future debt service, capital expenditure and working capital requirements and assess our ability to pay dividends on our capital stock.
EBIT, EBITDA and Adjusted EBITDA have important limitations as analytical tools. For example, neither EBIT, EBITDA nor Adjusted EBITDA reflect (a) our cash expenditures, or future requirements for capital expenditures or contractual commitments; (b) changes in, or cash requirements for, our working capital needs; (c) the significant interest expense, or the cash requirements necessary to service interest or principal payments, on our debt; and (d) tax payments or distributions to our parent to make payments with respect to taxes attributable to us that represent a reduction in cash available to us. Although we consider the items excluded in the calculation of non-IFRS measures to be less relevant to evaluate our performance, some of these items may continue to take place and accordingly may reduce the cash available to us.
We believe that the presentation of the non-IFRS measures described above is appropriate. However, these non-IFRS measures have important limitations as analytical tools, and you should not consider them in isolation, or as substitutes for analysis of our results as reported under IFRS. Because of these limitations, we primarily rely on our results as reported in accordance with IFRS and use EBIT, EBITDA and Adjusted EBITDA only supplementally. In addition, because other companies may calculate EBITDA and Adjusted EBITDA differently than we do, EBITDA may not be, and Adjusted EBITDA as presented in this report is not, comparable to similarly titled measures reported by other companies.
A reconciliation of our profit (loss) attributable to controlling shareholders, the most directly comparable IFRS financial measure, to EBITDA and to Adjusted EBITDA is set forth below:
| | | | | | | | | | | | | | | | | | | | | | | | |
| | | Year ended December 31, | |
| | | 2014 | | | 2014 | | | 2013 | | | 2012 | | | 2011 | | | 2010 | |
| | | (in millions of U.S.$) | | | (in millions of Ch$) | |
Profit attributable to controlling shareholders | | | 251 | | | | 152,233 | | | | 241,408 | | | | 216,911 | | | | 241,329 | | | | 258,384 | |
Profit attributable to non-controlling shareholders | | | (1 | ) | | | (748 | ) | | | 166 | | | | 2,851 | | | | 10,559 | | | | 10,220 | |
Profit from Continuing Operations | | | 250 | | | | 151,485 | | | | 241,573 | | | | 219,762 | | | | 251,888 | | | | 268,604 | |
Financial expense (net) | | | 355 | | | | (215,456 | ) | | | (217,857 | ) | | | (170,399 | ) | | | (105,054 | ) | | | (59,680 | ) |
Income tax charge | | | (208 | ) | | | (125,932 | ) | | | (94,068 | ) | | | (92,226 | ) | | | (111,305 | ) | | | (67,361 | ) |
EBIT from Continuing Operations | | | 812 | | | | 492,872 | | | | 553,498 | | | | 482,387 | | | | 468,247 | | | | 395,645 | |
Depreciation and amortization | | | (330 | ) | | | (200,043 | ) | | | (189,038 | ) | | | (138,941 | ) | | | (117,498 | ) | | | (162,995 | ) |
EBITDA from Continuing Operations | | | 1,142 | | | | 692,915 | | | | 742,536 | | | | 713,553 | | | | 585,745 | | | | 558,639 | |
Exchange differences | | | (39 | ) | | | (23,643 | ) | | | (25,054 | ) | | | (12,053 | ) | | | (1,577 | ) | | | (2,051 | ) |
Increase on revaluation of investment properties(1) | | | 166 | | | | 100,773 | | | | 95,110 | | | | 98,633 | | | | 72,798 | | | | 37,573 | |
Losses from indexation | | | (65 | ) | | | (39,576 | ) | | | (18,885 | ) | | | (23,538 | ) | | | (27,641 | ) | | | (16,705 | ) |
Adjusted EBITDA from Continuing Operations | | | 1,080 | | | | 655,361 | | | | 691,365 | | | | 650,510 | | | | 539,011 | | | | 502,310 | |
As a % of revenues | | | | | | | | |
Profit from Continuing Operations | | | 1.4 | % | | | 1.4 | % | | | 2.4 | % | | | 2.5 | % | | | 3.3 | % | | | 4.3 | % |
Financial income (expenses) | | | (2.0 | )% | | | (2.0 | )% | | | (2.1 | )% | | | (1.9 | )% | | | (1.4 | )% | | | (1.0 | )% |
Income tax charge | | | (1.2 | )% | | | (1.2 | )% | | | (0.9 | )% | | | (1.0 | )% | | | (1.5 | )% | | | (1.1 | )% |
EBIT from Continuing Operations | | | 4.6 | % | | | 4.6 | % | | | 5.5 | % | | | 5.4 | % | | | 6.2 | % | | | 6.6 | % |
Depreciation and amortization | | | (1.9 | )% | | | (1.9 | )% | | | (1.9 | )% | | | (1.6 | )% | | | (1.5 | )% | | | (2.7 | )% |
EBITDA from Continuing Operations | | | 6.5 | % | | | 6.5 | % | | | 7.3 | % | | | 8.0 | % | | | 7.7 | % | | | 9.3 | % |
Exchange differences | | | (0.2 | )% | | | (0.2 | )% | | | (0.2 | )% | | | (0.1 | )% | | | (0.0 | )% | | | (0.0 | )% |
Increase on revaluation of investment properties(1) | | | 0.9 | % | | | 0.9 | % | | | 0.9 | % | | | 1.1 | % | | | 1.0 | % | | | 0.6 | % |
Losses from indexation | | | (0.4 | )% | | | (0.4 | )% | | | (0.2 | )% | | | (0.3 | )% | | | (0.4 | )% | | | (0.3 | )% |
Adjusted EBITDA from Continuing Operations | | | 6.1 | % | | | 6.1 | % | | | 6.8 | % | | | 7.3 | % | | | 7.1 | % | | | 8.3 | % |
| (1) | Represents a fair value adjustment of investment properties, as calculated using the discounted cash flows valuation method. |
4
A reconciliation of our profit (loss) attributable to controlling shareholders, the most directly comparable IFRS financial measure, to EBITDA from continuing operations and to Adjusted EBITDA from continuing operations per business segment is included below:
| | | | | | | | | | | | | | | | | | | | | | | | | | | | |
Information by segment | | Supermarkets | | | Shopping
centers | | | Home
improvement
stores | | | Department
stores | | | Financial
services | | | Other | | | Consolidated
total | |
| | | | | | | | | | | | | | | Continuing
Operations | | | | | | Continuing
Operations | |
| | | Year ended December 31, 2014 (in millions of Ch$) | |
Profit (loss) attributable to controlling shareholders | | | 289,603 | | | | 259,362 | | | | 98,786 | | | | (4,575 | ) | | | 36,100 | | | | (527,042 | ) | | | 152,233 | |
Profit attributable to non-controlling shareholders | | | — | | | | — | | | | — | | | | — | | | | — | | | | (748 | ) | | | (748 | ) |
Profit from Continuing Operations | | | 289,603 | | | | 259,362 | | | | 98,786 | | | | (4,575 | ) | | | 36,100 | | | | (527,790 | ) | | | 151,485 | |
| | | | | | | |
Financial expense (net) | | | | | | | | | | | | | | | | | | | | | | | (215,456 | ) | | | (215,456 | ) |
| | | | | | | |
Income tax charge | | | | | | | | | | | | | | | | | | | | | | | (125,932 | ) | | | (125,932 | ) |
| | | | | | | |
EBIT from continuing operations | | | 289,603 | | | | 259,362 | | | | 98,786 | | | | (4,575 | ) | | | 36,100 | | | | (186,403 | ) | | | 492,872 | |
| | | | | | | |
Depreciation and amortization | | | (134,505 | ) | | | (5,488 | ) | | | (20,363 | ) | | | (26,429 | ) | | | (1,942 | ) | | | (11,316 | ) | | | (200,043 | ) |
| | | | | | | |
EBITDA from continuing operations | | | 424,108 | | | | 264,849 | | | | 119,148 | | | | 21,854 | | | | 38,042 | | | | (175,087 | ) | | | 692,915 | |
| | | | | | | |
Exchange differences | | | | | | | | | | | | | | | | | | | | | | | (23,643 | ) | | | (23,643 | ) |
| | | | | | | |
Increase on revaluation of investment properties(1) | | | | | | | 114,438 | | | | | | | | | | | | | | | | | | | | 114,438 | |
| | | | | | | |
Losses from indexation | | | | | | | | | | | | | | | | | | | | | | | (39,576 | ) | | | (39,576 | ) |
| | | | | | | |
Adjusted EBITDA from continuing operations | | | 424,108 | | | | 150,412 | | | | 119,148 | | | | 21,854 | | | | 38,042 | | | | (111,868 | ) | | | 641,696 | |
| | | | | | | |
As a % of revenues | | | 5.2 | % | | | 70.0 | % | | | 9.8 | % | | | 2.2 | % | | | 32.3 | % | | | N.A. | | | | 6.0 | % |
| (1) | Represents a fair value adjustment of investment properties, as calculated using the discounted cash flows valuation method. |
| | | | | | | | | | | | | | | | | | | | | | | | | | | | |
Information by segment | | Supermarkets | | | Shopping
centers | | | Home
improvement
stores | | | Department
stores | | | Financial
services | | | Other | | | Consolidated
total | |
| | | | | | | | | | | | | | | Continuing
Operations | | | | | | Continuing
Operations | |
| | | Year ended December 31, 2013 (in millions of Ch$) | |
Profit (loss) attributable to controlling shareholders | | | 304,654 | | | | 247,586 | | | | 80,042 | | | | 24,754 | | | | 40,046 | | | | (455,510 | ) | | | 241,573 | |
Profit attributable to non-controlling shareholders | | | — | | | | — | | | | — | | | | — | | | | — | | | | (165 | ) | | | (165 | ) |
Profit from Continuing Operations | | | 304,654 | | | | 247,586 | | | | 80,042 | | | | 24,754 | | | | 40,046 | | | | (455,675 | ) | | | 241,408 | |
| | | | | | | |
Financial expense (net) | | | — | | | | — | | | | — | | | | — | | | | — | | | | (217,857 | ) | | | (217,857 | ) |
| | | | | | | |
Income tax charge | | | — | | | | — | | | | — | | | | — | | | | — | | | | (94,068 | ) | | | (94,068 | ) |
| | | | | | | |
EBIT from continuing operations | | | 304,654 | | | | 247,586 | | | | 80,042 | | | | 24,754 | | | | 40,046 | | | | (143,750 | ) | | | 553,333 | |
| | | | | | | |
Depreciation and amortization | | | (130,205 | ) | | | (3,950 | ) | | | (19,481 | ) | | | (24,610 | ) | | | (4,238 | ) | | | (6,554 | ) | | | (189,038 | ) |
| | | | | | | |
EBITDA from continuing operations | | | 434,859 | | | | 251,536 | | | | 99,523 | | | | 49,364 | | | | 44,284 | | | | (137,196 | ) | | | 742,371 | |
| | | | | | | |
Exchange differences | | | — | | | | — | | | | — | | | | — | | | | — | | | | (25,054 | ) | | | (25,054 | ) |
| | | | | | | |
Increase on revaluation of investment properties(1) | | | — | | | | 95,110 | | | | — | | | | — | | | | — | | | | — | | | | 95,110 | |
| | | | | | | |
Losses from indexation | | | — | | | | — | | | | — | | | | — | | | | — | | | | (18,885 | ) | | | (18,885 | ) |
| | | | | | | |
Adjusted EBITDA from continuing operations | | | 434,859 | | | | 156,426 | | | | 99,523 | | | | 49,364 | | | | 44,284 | | | | (93,257 | ) | | | 691,200 | |
| | | | | | | |
As a % of revenues | | | 5.7 | % | | | 76.2 | % | | | 8.5 | % | | | 5.1 | % | | | 54.2 | % | | | N.A. | | | | 6.8 | % |
| (1) | Represents a fair value adjustment of investment properties, as calculated using the discounted cash flows valuation method. |
5
| | | | | | | | | | | | | | | | | | | | | | | | | | | | |
Information by segment | | Supermarkets | | | Shopping
Centers | | | Home
improvement
stores | | | Department
stores | | | Financial
services | | | Other | | | Consolidated
total | |
| | | | | | | | | | | | | | | Continuing
Operations | | | | | | Continuing
Operations | |
| | | Year ended December 31, 2012 (in millions of Ch$) | |
Profit (loss) attributable to controlling shareholders | | | 314,538 | | | | 222,701 | | | | 73,646 | | | | 20,231 | | | | (9,431 | ) | | | (404,773 | ) | | | 216,911 | |
Profit attributable tonon-controlling shareholders | | | — | | | | — | | | | — | | | | — | | | | — | | | | 2,851 | | | | 2,851 | |
Profit from Continuing Operations | | | 314,538 | | | | 222,701 | | | | 73,646 | | | | 20,231 | | | | (9,431 | ) | | | (401,923 | ) | | | 219,762 | |
| | | | | | | |
Financial expense (net) | | | — | | | | — | | | | — | | | | — | | | | — | | | | (170,399 | ) | | | (170,399 | ) |
| | | | | | | |
Income tax charge | | | — | | | | — | | | | — | | | | — | | | | — | | | | (92,226 | ) | | | (92,226 | ) |
| | | | | | | |
EBIT from continuing operations | | | 314,538 | | | | 222,701 | | | | 73,646 | | | | 20,231 | | | | (9,431 | ) | | | (139,298 | ) | | | 482,387 | |
| | | | | | | |
Depreciation and amortization | | | (89,454 | ) | | | (2,606 | ) | | | (17,740 | ) | | | (22,896 | ) | | | (955 | ) | | | (5,290 | ) | | | (138,941 | ) |
| | | | | | | |
EBITDA from continuing operations | | | 403,992 | | | | 225,307 | | | | 91,386 | | | | 43,127 | | | | (8,476 | ) | | | (134,008 | ) | | | 621,328 | |
| | | | | | | |
Exchange differences | | | — | | | | — | | | | — | | | | — | | | | — | | | | (12,053 | ) | | | (12,053 | ) |
| | | | | | | |
Increase on revaluation of investment properties(1) | | | — | | | | 98,633 | | | | — | | | | — | | | | — | | | | — | | | | 98,633 | |
| | | | | | | |
Losses from indexation | | | — | | | | — | | | | — | | | | — | | | | — | | | | (23,538 | ) | | | (23,538 | ) |
| | | | | | | |
Adjusted EBITDA from continuing operations | | | 403,992 | | | | 126,674 | | | | 91,386 | | | | 43,127 | | | | (8,476 | ) | | | (98,418 | ) | | | 558,285 | |
| | | | | | | |
As a % of revenues | | | 6.0 | % | | | 73.6 | % | | | 8.6 | % | | | 4.9 | % | | | (14.5 | )% | | | N/A | | | | 6.3 | % |
| (1) | Represents a fair value adjustment of investment properties, as calculated using the discounted cash flows valuation method. |
| | | | | | | | | | | | | | | | | | | | | | | | | | | | |
Information by segment | | Supermarkets | | | Shopping
centers | | | Home
improvement
stores | | | Department
stores | | | Financial
services | | | Other | | | Consolidated
total | |
| | | | | | | | | | | | | | | Continuing
Operations | | | | | | Continuing
Operations | |
| | | Year ended December 31, 2011 (in millions of Ch$) | |
Profit (loss) attributable to controlling shareholders | | | 299,605 | | | | 170,391 | | | | 67,291 | | | | 29,698 | | | | 6,964 | | | | (332,621 | ) | | | 241,329 | |
Profit attributable to non-controlling shareholders | | | — | | | | — | | | | — | | | | — | | | | — | | | | 10,559 | | | | 10,559 | |
Profit from Continuing Operations | | | 299,605 | | | | 170,391 | | | | 67,291 | | | | 29,698 | | | | 6,964 | | | | (322,062 | ) | | | 251,888 | |
| | | | | | | |
Financial expense (net) | | | — | | | | — | | | | — | | | | — | | | | — | | | | (105,054 | ) | | | (105,054 | ) |
| | | | | | | |
Income tax charge | | | — | | | | — | | | | — | | | | — | | | | — | | | | (111,305 | ) | | | (111,305 | ) |
| | | | | | | |
EBIT from continuing operations | | | 299,605 | | | | 170,391 | | | | 67,291 | | | | 29,698 | | | | 6,964 | | | | (105,703 | ) | | | 468,247 | |
Depreciation and amortization | | | (76,559 | ) | | | (2,344 | ) | | | (16,501 | ) | | | (17,292 | ) | | | (261 | ) | | | (4,541 | ) | | | (117,498 | ) |
EBITDA from continuing operations | | | 376,164 | | | | 172,735 | | | | 83,792 | | | | 46,990 | | | | 7,225 | | | | (101,162 | ) | | | 585,745 | |
Exchange differences | | | — | | | | — | | | | — | | | | — | | | | — | | | | (1,577 | ) | | | (1,577 | ) |
| | | | | | | |
Increase on revaluation of investment properties(1) | | | — | | | | 72,798 | | | | — | | | | — | | | | — | | | | — | | | | 72,798 | |
Losses from indexation | | | — | | | | — | | | | — | | | | — | | | | — | | | | (27,641 | ) | | | (27,641 | ) |
Adjusted EBITDA from continuing operations | | | 376,164 | | | | 99,937 | | | | 83,792 | | | | 46,990 | | | | 7,225 | | | | (75,097 | ) | | | 539,011 | |
As a % of revenues | | | 6.8 | % | | | 77.0 | % | | | 8.8 | % | | | 6.8 | % | | | 2.7 | % | | | N/A | | | | 7.1 | % |
| (1) | Represents a fair value adjustment of investment properties, as calculated using the discounted cash flows valuation method. |
6
| | | | | | | | | | | | | | | | | | | | | | | | | | | | |
Information by segment | | Supermarkets | | | Shopping
centers | | | Home
improvement
Stores | | | Department
stores | | | Financial
services
continuing
operations | | | Other | | | Consolidated
total
continuing
operations | |
| | | Year ended December 31, 2010 (in millions of Ch$) | |
| | | | | | | |
Profit (loss) attributable to controlling shareholders | | | 249,364 | | | | 122,349 | | | | 53,352 | | | | 24,584 | | | | 36,162 | | | | (227,427 | ) | | | 258,384 | |
Profit attributable to non-controlling shareholders | | | — | | | | — | | | | — | | | | — | | | | — | | | | 10,220 | | | | 10,220 | |
Net Income | | | 249,364 | | | | 122,349 | | | | 53,352 | | | | 24,584 | | | | 36,162 | | | | (217,207 | ) | | | 268,604 | |
Financial Expense (net) | | | — | | | | — | | | | — | | | | — | | | | — | | | | (59,680 | ) | | | (59,680 | ) |
Income tax charge | | | | | | | | | | | | | | | | | | | | | | | (67,361 | ) | | | (67,361 | ) |
EBIT from continuing operations | | | 249,364 | | | | 122,349 | | | | 53,352 | | | | 24,584 | | | | 36,162 | | | | (90,166 | ) | | | 395,645 | |
Depreciation and amortization | | | (58,347 | ) | | | (4,300 | ) | | | (16,435 | ) | | | (16,211 | ) | | | (181 | ) | | | (67,520 | ) | | | (162,995 | ) |
EBITDA from continuing operations | | | 307,711 | | | | 126,649 | | | | 69,787 | | | | 40,795 | | | | 36,343 | | | | (22,646 | ) | | | 558,639 | |
Exchange differences | | | — | | | | — | | | | — | | | | — | | | | — | | | | (2,051 | ) | | | (2,051 | ) |
Increase on revaluation of investment properties(1) | | | — | | | | 37,573 | | | | — | | | | — | | | | — | | | | | | | | 37,573 | |
Losses from indexation | | | | | | | | | | | | | | | | | | | | | | | (16,705 | ) | | | (16,705 | ) |
Adjusted EBITDA from continuing operations | | | 307,711 | | | | 89,076 | | | | 69,787 | | | | 40,795 | | | | 36,343 | | | | (41,402 | ) | | | 502,310 | |
As a % of revenues | | | 6.9 | % | | | 76.1 | % | | | 8.5 | % | | | 6.6 | % | | | 170.8 | % | | | N/A | | | | 8.3 | % |
| (1) | Represents a fair value adjustment of investment properties, as calculated using the discounted cash flows valuation method. |
Rounding
Certain figures included in this annual report and in our financial statements have been rounded for ease of presentation. Percentage figures included in this annual report have not in all cases been calculated on the basis of such rounded figures but on the basis of such amounts prior to rounding. For this reason, percentage amounts in this annual report may vary from those obtained by performing the same calculations using the figures in our financial statements. Certain other amounts that appear in this annual report may not sum due to rounding.
Operating Data
Calculations of revenues from ordinary activities for our shopping centers presented in this annual report exclude inter-company lease payments to our shopping centers from stores owned by us. Unless otherwise noted, calculations of gross leasable area for our shopping centers do not include the square meters occupied by our stores.
As used herein, the term “same-store sales” reflects the sales of our stores operating throughout the same months of both financial periods being compared. If a store did not operate for a full month of either of the financial periods being compared, we exclude its sales for such month from both financial periods. For example, if a new store was opened on July 1, 2012 and operated throughout the last six months of 2012, (i) our “same-store sales” data would include the sales of that store for the last six months of 2012 and the last six months of 2013 and (ii) we would account for the sales of the new store during the first six months of 2013 as sales from a newly opened store. Our calculations of same-store sales data may differ from same-store sales calculations of other retailers. Unless otherwise noted, we have presented calculations of same-store sales in nominal local currency.
7
Industry and Market Data
None of the Argentine, Brazilian, Chilean, Peruvian or Colombian governments publish definitive data regarding the supermarket, home improvement store, department store, shopping center or financial services industries.
General
This annual report contains data related to the economic conditions in the markets in which we operate. Unless otherwise indicated, information in this annual report concerning economic conditions is based on publicly available information from third-party sources which we believe to be reasonable. The economic conditions in the markets in which we operate may deteriorate, and those economies may not grow at the rates projected by market data, or at all. The deterioration of the economic conditions in the markets in which we operate may have a material adverse effect on our business, results of operations, financial condition and the market price of our shares of common stock and American Depositary Shares (“ADSs”).
Chile
Market data and other statistical information (other than with respect to our financial results and performance) used throughout this annual report are based on independent industry publications, government publications, reports by market research firms or other published independent sources, such as theInstituto Nacional de Estadísticas (the Chilean National Institute of Statistics, or “INE”), a governmental agency that publishes information based on its independent data, theAsociación Gremial de Supermercados de Chile (the Chilean Supermarkets Association, or “ASACH”), which publishes certain data with respect to supermarkets in Chile, and A.C. Nielsen Chile S.A., which publishes data with respect to the supermarket industry in Chile. Certain other shopping center statistics for Chile are published by the International Council for Shopping Centers.
Argentina
Market data and other statistical information (other than with respect to our financial results and performance) used throughout this annual report are based on independent industry publications, government publications, reports by market research firms or other published independent sources, such as theInstituto Nacional de Estadísticas y Censos (the Argentine National Institute of Statistics and Census, or “INDEC”), a governmental agency that publishes information based on its independent data, and A.C. Nielsen Argentina, which publishes market share data with respect to the supermarket industry in Argentina. In addition, theCamara Argentina de Shopping Centers (the Argentine Chamber of Shopping Centers, or “CASC”) currently publishes market share data with respect to shopping centers in Argentina. Certain other shopping center statistics for Argentina are published by the International Council for Shopping Centers.
Brazil
We have included certain information with respect to Brazil based on reports prepared by established public sources, such as the Central Bank of Brazil, theInstituto Brasileiro de Geografia e Estatística (the Brazilian Institute of Geography and Statistics, or “IBGE”), theInstituto de Pesquisa Econômica Aplicada (the Institute of Applied Economic Research, or “IPEA”), theAssociação Brasileira de Supermercados (the Brazilian Association of Supermarkets, or “ABRAS”), and theFundação Getúlio Vargas (the Getúlio Vargas Foundation). Unless otherwise indicated, all macroeconomic information relating to Brazil was obtained from the Central Bank of Brazil, IBGE and the Getúlio Vargas Foundation.
Peru
Macroeconomic data from Peru included in this annual report is derived from public entities, such as the Central Bank of Peru, the Instituto Nacional de Estadísitcas e Informática (the National Institute of Statistics and Computing, or “INEI”),Corporación de Compañías de Research (Research Companies Corporation, or “CCR”) or by Apoyo Consulting. Some data are also based on our estimates, which are derived from our review of internal surveys, as well as independent sources. Although we believe these sources are reliable, we have not independently verified the information provided by third parties. In addition, these sources may use different definitions of the relevant markets than those we present. Data regarding our industry are intended to provide general guidance but are inherently imprecise.
Colombia
Market and certain other data relating to Colombia used in this annual report was obtained from our own research, surveys or studies conducted by third parties and industry or general publications and other publicly available sources. Industry and general publications and surveys generally state that they have obtained information from sources believed to be reliable, but do not guarantee the accuracy and completeness of such information. Certain data is based on published information made available by the Colombian
8
government and its agencies, such as theDepartamento Administrativo Nacional de Estadística (the National Administrative Department of Statistics, or “DANE”) and theBanco de la Republica (“Colombian Central Bank”). Although we believe these sources to be reliable, we do not guarantee the accuracy of the information.
Other Information
According to the ASACH, “hypermarkets” are defined as retail stores with more than 10,000 square meters of selling space, offering more than 25,000 products and having more than 40 cashiers. ASACH defines “supermarkets” as retail stores having up to 6,000 square meters of selling space, between 400 and 10,000 products and ten to 25 cashiers. We consolidate the results of our supermarkets and hypermarkets under our “supermarkets” segment. Therefore, unless otherwise noted, our discussions of “supermarkets” in this annual report include ourSanta Isabel supermarkets,Jumbohypermarkets and supermarkets in Chile,DiscoandSuper Vea supermarkets andJumbohypermarkets and supermarkets in Argentina,Bretas, GBarbosa,Mercantil Rodrigues,Perini andPrezunic supermarkets in Brazil,Jumbo andMetro supermarkets in Colombia andWong andMetro supermarkets and hypermarkets in Peru. By “home improvement” stores we mean retail establishments that sell a wide assortment of building materials and home improvement and lawn and garden products and provide certain related services. Our “home improvement stores” refer to our home improvement stores operated under theEasyandBlaistenbrand names, including ourEasy stores in Chile, Argentina and Colombia. By “department stores” we mean retail establishments that market a varied assortment of apparel, electronic and household goods. These stores currently operate in Chile and Peru under ourParis andJohnson brands. References to “stores” refer collectively to our hypermarkets, supermarkets, department stores and home improvement stores.
One meter equals approximately 3.3 feet or 1.1 yards and one square meter equals approximately 10.8 square feet.
We own or have rights to use the trademarks, service marks and trade names that we use in conjunction with the operation of our business. Some of the more important trademarks that we own or have rights to use that appear in this annual report include: Jumbo®, Jumbo Más®, Easy®, Más Easy®, Santa Isabel®, Disco®, Vea®, Super Vea®, Blaisten®, Johnson®, Paris®, Más Paris®, Seguros Cencosud®, Banco Paris®, Circulo Más®, Wong®, Metro®, GBarbosa®, Perini®, Bretas®, Mercantil Rodrigues®, Nectar® , which is replaced by the brandCencosud Puntos® as our loyalty program as of March 31, 2014 in Chile and Colombia) , Tarjeta Cencosud®, Banco Cencosud®, Costaner Center®, Vive Chevere® and Prezunic®, each of which may be registered or trademarked in any of Argentina, Brazil, Chile, Colombia, Peru or other jurisdictions. Solely for convenience, we may refer to our trademarks, service marks and trade names in this annual report without the ™ and® symbols, but such references are not intended to indicate, in any way, that we will not assert, to the fullest extent permitted under applicable law, our rights to our trademarks, service marks and trade names. Each trademark, trade name or service mark of any other company appearing in this annual report is, to our knowledge, owned by such other company.
PART I
Item 1. Identity of Directors, Senior Management and Advisers
Not applicable.
Item 2. Offer Statistics and Expected Timetable
Not applicable.
Item 3. Key Information
A. SELECTED FINANCIAL DATA
Selected Financial and Operating Data
The following tables set forth our summary consolidated financial information under IFRS. You should read the information contained in these tables in conjunction with “Item 5. Operating and Financial Review and Prospects,” “Item 8. Financial Information,” “Item 18. Financial Statements.” and the consolidated financial statements and the accompanying notes included elsewhere in this annual report.
The financial information as of December 31, 2014 and 2013 and for the years ended December 31, 2014, 2013 and 2012 has been derived from our Audited Consolidated Financial Statements included elsewhere in this annual report. The selected statement of
9
operations data with respect to fiscal year ended December 31, 2011 and 2010 and the selected balance sheet data as of December 31, 2012 have been derived from the Company’s consolidated financial statements not included herein. We maintain our books and records in Chilean pesos and prepare consolidated financial statements in accordance with IFRS. Our date of adoption of IFRS was January 1, 2010. The following financial and operating information should be read in conjunction with, and is qualified in its entirety by reference to, our Audited Consolidated Financial Statements included elsewhere in this annual report.
Unless otherwise noted, U.S. dollar amounts have been translated from Chilean pesos based on thedólar observado, or observed exchange rate of Ch$606.75 per U.S.$1.00 as of December 31, 2014, as reported by the Chilean Central Bank. We make no representation that the Chilean peso or the U.S. dollar amounts referred to herein actually represent, could have been or could be converted into U.S. dollars or Chilean pesos, as the case may be, at the rates indicated, at any particular rate or at all.
In our opinion, the summary consolidated financial data presented in the tables below includes all adjustments necessary to present fairly in all material respects our financial condition and results of operations at the dates and the periods presented. The results of operations presented below are not necessarily indicative of future performance.
| | | | | | | | | | | | | | | | | | | | | | | | |
| | | Year ended December 31, | |
Income statement data: | | 2014 | | | 2014 | | | 2013 | | | 2012 | | | 2011 | | | 2010 | |
| | | (in millions of
U.S.$) | | | | | | | | | (in millions of Ch$) | | | | | | | |
Revenues from ordinary activities, continuing operations: | | | | | | | | | | | | | | | | | | | | | | | | |
Supermarkets | | | 13,447 | | | | 8,159,237 | | | | 7,682,993 | | | | 6,733,610 | | | | 5,556,271 | | | | 4,452,759 | |
Home improvement stores | | | 2,019 | | | | 1,225,616 | | | | 1,176,890 | | | | 1,063,086 | | | | 948,641 | | | | 819,838 | |
Department stores | | | 1,634 | | | | 991,442 | | | | 970,360 | | | | 886,075 | | | | 690,772 | | | | 622,719 | |
Shopping Centers | | | 354 | | | | 214,850 | | | | 205,332 | | | | 172,104 | | | | 129,727 | | | | 116,991 | |
Financial Services | | | 194 | | | | 117,679 | | | | 81,651 | | | | 58,454 | | | | 267,874 | | | | 21,283 | |
Other(1) | | | 4 | | | | 2,205 | | | | 16,932 | | | | 12,022 | | | | 11,520 | | | | 3,657 | |
Total revenues from ordinary activities | | | 17,653 | | | | 10,711,029 | | | | 10,134,158 | | | | 8,925,351 | | | | 7,604,806 | | | | 6,236,974 | |
| | | | | | | | | | | | | | | | | | | | | | | | |
| | | | | | | | | | | | | | | | | | | | | | | | |
| | | Year ended December 31, | |
Income statement data: | | 2014 | | | 2014 | | | 2013 | | | 2012 | | | 2011 | | | 2010 | |
| | | (in millions of U.S.$) | | | (in millions of Ch$) | |
Cost of sales: | | | | | | | | | | | | | | | | |
Supermarkets | | | (10,225 | ) | | | (6,204,110 | ) | | | (5,782,590 | ) | | | (5,057,477 | ) | | | (4,177,664 | ) | | | (3,355,796 | ) |
Home improvement stores | | | (1,319 | ) | | | (800,342 | ) | | | (787,402 | ) | | | (711,500 | ) | | | (647,337 | ) | | | (561,006 | ) |
Department stores | | | (1,222 | ) | | | (741,279 | ) | | | (701,530 | ) | | | (644,668 | ) | | | (499,413 | ) | | | (446,769 | ) |
Shopping Centers | | | (46 | ) | | | (28,029 | ) | | | (23,341 | ) | | | (27,213 | ) | | | (19,448 | ) | | | (17,858 | ) |
Financial Services | | | (64 | ) | | | (39,046 | ) | | | (25,938 | ) | | | (21,082 | ) | | | (14,028 | ) | | | (6,102 | ) |
Other (1) | | | (3 | ) | | | (1,967 | ) | | | (3,451 | ) | | | (2,294 | ) | | | (5,421 | ) | | | (5,343 | ) |
Total cost of sales | | | (12,880 | ) | | | (7,814,773 | ) | | | (7,324,252 | ) | | | (6,464,234 | ) | | | (5,363,313 | ) | | | (4,392,874 | ) |
Gross profit: | | | | | | | | | | | | | | | | | | | | |
Supermarkets | | | 3,222 | | | | 1,955,127 | | | | 1,900,404 | | | | 1,676,133 | | | | 1,378,607 | | | | 1,096,963 | |
Home improvement stores | | | 701 | | | | 425,275 | | | | 389,487 | | | | 351,586 | | | | 301,303 | | | | 258,832 | |
Department stores | | | 412 | | | | 250,163 | | | | 268,830 | | | | 241,407 | | | | 191,359 | | | | 175,950 | |
Shopping Centers | | | 308 | | | | 186,821 | | | | 181,991 | | | | 144,891 | | | | 110,278 | | | | 99,133 | |
Financial Services | | | 130 | | | | 78,632 | | | | 55,713 | | | | 37,372 | | | | 31,286 | | | | 15,181 | |
Other(1) | | | 0 | | | | 238 | | | | 13,481 | | | | 9,728 | | | | 6,099 | | | | (1,686 | ) |
Total gross profit | | | 4,773 | | | | 2,896,256 | | | | 2,809,907 | | | | 2,461,117 | | | | 2,018,933 | | | | 1,644,373 | |
Administrative expenses, distribution costs and other expenses | | | (4,113 | ) | | | (2,495,436 | ) | | | (2,357,582 | ) | | | (2,048,390 | ) | | | (1,602,881 | ) | | | (1,371,074 | ) |
Other revenues by function | | | 189 | | | | 114,438 | | | | 108,291 | | | | 107,011 | | | | 85,107 | | | | 43,871 | |
Participation in earnings of associates | | | 10 | | | | 6,208 | | | | 10,289 | | | | 5,642 | | | | 5,779 | | | | 7,514 | |
Financial income | | | 11 | | | | 6,709 | | | | 5,999 | | | | 8,231 | | | | 10,713 | | | | 14,754 | |
Financial expenses | | | (366 | ) | | | (222,165 | ) | | | (223,856 | ) | | | (178,631 | ) | | | (115,767 | ) | | | (84,693 | ) |
Other earnings | | | 57 | | | | 34,624 | | | | 26,366 | | | | (7,403 | ) | | | (12,626 | ) | | | 13,786 | |
Exchange differences | | | (39 | ) | | | (23,643 | ) | | | (25,054 | ) | | | (12,053 | ) | | | 1,577 | | | | (2,055 | ) |
Losses from indexation | | | (65 | ) | | | (39,576 | ) | | | (18,885 | ) | | | (23,538 | ) | | | (27,641 | ) | | | (16,747 | ) |
Income (loss) before taxes | | | 457 | | | | 277,416 | | | | 335,476 | | | | 311,988 | | | | 363,193 | | | | 326,713 | |
Income tax charge | | | (208 | ) | | | (125,932 | ) | | | (94,068 | ) | | | (92,226 | ) | | | (111,305 | ) | | | (72,856 | ) |
Profit from Continuing Operations | | | 251 | | | | 151,485 | | | | 241,408 | | | | 219,762 | | | | 251,888 | | | | 253,858 | |
10
| | | | | | | | | | | | | | | | | | | | | | | | |
| | | Year ended December 31, | |
Income statement data: | | 2014 | | | 2014 | | | 2013 | | | 2012 | | | 2011 | | | 2010 | |
| | | (in millions of U.S.$) | | | (in millions of Ch$) | |
Profit from Discontinued Operations | | | 21 | | | | 12,662 | | | | 8,357 | | | | 33,047 | | | | | | | | 52,623 | |
Net Income | | | 271 | | | | 164,146 | | | | 249,765 | | | | 252,809 | | | | | | | | 296,261 | |
Profit attributable to non-controlling shareholders | | | 1 | | | | (748 | ) | | | (165 | ) | | | 2,851 | | | | 33,004 | | | | 10,220 | |
Profit attributable to controlling shareholders | | | 272 | | | | 164,894 | | | | 249,930 | | | | 249,958 | | | | 284,892 | | | | 296,261 | |
Net earnings attributable to shareholders per share for continuing operations: | | | | | | | | | | | | | | | | | | | | | | | | |
Basic(2) | | | 0.0887 | | | | 53.8 | | | | 87.4 | | | | 93.20 | | | | 106.60 | | | | 130.85 | |
Diluted(2) | | | 0.0887 | | | | 53.8 | | | | 86.8 | | | | 92.30 | | | | 105.50 | | | | 129.56 | |
Net earnings attributable to shareholders per share for discontinued operations: | | | | | | | | | | | | | | | | | | | | | | | | |
Basic(2) | | | 0.0074 | | | | 4.50 | | | | 3.0 | | | | 14.2 | | | | 14.6 | | | | 130.85 | |
Diluted(2) | | | 0.0074 | | | | 4.50 | | | | 3.0 | | | | 14.2 | | | | 14.4 | | | | 129.56 | |
Number of Shares | | | | | | | | | | | | | | | | | | | | | | | | |
Total number of Shares | | | 2,828,723,963 | | | | 2,828,723,963 | | | | 2,828,723,963 | | | | 2,507,103,215 | | | | 2,264,103,215 | | | | 2,264,103,215 | |
Dividends per share: | | | | | | | | | | | | | | | | | | | | | | | | |
Basic(2) | | | 0.0402 | | | | 21.09 | | | | 28.85 | | | | 22.88 | | | | 34.65 | | | | 24.26 | |
Diluted(2) | | | 0.0398 | | | | 20.93 | | | | 28.64 | | | | 22.66 | | | | 34.31 | | | | 24.26 | |
| (1) | Includes the results of our Aventura entertainment centers, our loyalty programs and corporate back-office operations. See “Item 4. Information on the Company—B. Business Overview—Our Company.” |
| (2) | In U.S. dollars U.S. dollars and Chilean pesos. |
In November 2012, we completed the acquisition of Carrefour Societe Anonyme’s (Carrefour) supermarket operations in Colombia See “Item 4. Information on the Company—A. History and Development of the Company—History.”
| | | | | | | | | | | | | | | | | | | | | | | | |
| | | As of December 31, | |
Balance sheet data: | | 2014 | | | 2014 | | | 2013 | | | 2012(1) | | | 2011 | | | 2010 | |
| | | (in millions of U.S.$) | | | (in millions of Ch$) | |
Total current assets | | | 4,948 | | | | 3,002,468 | | | | 2,425,219 | | | | 2,316,812 | | | | 2,085,636 | | | | 1,582,309 | |
Property, plant, equipment and investment property net | | | 7,702 | | | | 4,673,321 | | | | 4,670,316 | | | | 4,605,872 | | | | 3,538,672 | | | | 2,913,644 | |
Other assets | | | 5,011 | | | | 3,040,715 | | | | 2,969,699 | | | | 2,820,906 | | | | 2,019,780 | | | | 1,839,516 | |
Total assets | | | 17,662 | | | | 10,716,503 | | | | 10,065,234 | | | | 9,743,590 | | | | 7,644,088 | | | | 6,335,469 | |
Total current liabilities | | | 5,173 | | | | 3,138,770 | | | | 2,951,699 | | | | 3,336,630 | | | | 2,331,280 | | | | 1,919,094 | |
| |
| | | As of December 31, | |
| Balance sheet data: | | 2014 | | | 2014 | | | 2013 | | | 2012(1) | | | 2011 | | | 2010 | |
Total non-current liabilities | | | 5,416 | | | | 3,286,247 | | | | 2,852,168 | | | | 3,008,748 | | | | 2,362,201 | | | | 1,726,781 | |
Total liabilities | | | 10,589 | | | | 6,425,017 | | | | 5,803,867 | | | | 6,345,378 | | | | 4,693,482 | | | | 3,645,876 | |
Non-controlling interest | | | (1 | ) | | | (832 | ) | | | 100 | | | | 678 | | | | 87,750 | | | | 74,886 | |
Net equity attributable to controlling shareholders | | | 7,074 | | | | 4,292,318 | | | | 4,261,267 | | | | 3,397,534 | | | | 2,862,856 | | | | 2,614,707 | |
Total net equity and liabilities | | | 17,662 | | | | 10,716,503 | | | | 10,065,234 | | | | 9,743,590 | | | | 7,644,088 | | | | 6,335,469 | |
| | | | | | | | | | | | | | | | | | | | | | | | |
| (1) | Assets for the 2012 period were adjusted as goodwill related to the Johnson acquisition was adjusted. |
11
| | | | | | | | | | | | | | | | | | | | | | | | |
| | | Year ended December 31, | |
Other financial data: | | 2014 | | | 2014 | | | 2013 | | | 2012 | | | 2011 | | | 2010 | |
| | | (in millions of U.S.$)(1) | | | (in millions of Ch$)(1) | |
Cash Flow Data | | | | | | | | | | | | | | | | | | | | | | | | |
Net cash provided by (used in): | | | | | | | | | | | | | | | | | | | | | | | | |
Operating activities | | | 643 | | | | 390,239 | | | | 364,782 | | | | 718,715 | | | | 567,739 | | | | 407,174 | |
Investing activities | | | (385 | ) | | | (233,396 | ) | | | (320,507 | ) | | | (1,873,568 | ) | | | (623,753 | ) | | | (413,676 | ) |
Financing activities | | | (185 | ) | | | (112,378 | ) | | | (107,029 | ) | | | 1,246,077 | | | | 89,607 | | | | 5,086 | |
Other Financial Information | | | | | | | | | | | | | | | | | | | | | | | | |
Capital expenditures | | | (607 | ) | | | (227,423 | ) | | | (317,709 | ) | | | (573,650 | ) | | | (616,336 | ) | | | (349,793 | ) |
Depreciation and amortization | | | (333 | ) | | | (202,343 | ) | | | (191,500 | ) | | | (141,450 | ) | | | (120,174 | ) | | | (162,995 | ) |
Adjusted EBITDA from continuing operations(2) | | | 1,057 | | | | 641,696 | | | | 691,200 | | | | 558,285 | | | | 539,011 | | | | 502,310 | |
Financial Ratios | | | | | | | | | | | | | | | | | | | | | | | | |
Gross margin(3) | | | 27.0 | % | | | 27.0 | % | | | 27.7 | % | | | 27.6 | % | | | 26.5 | % | | | 26.4 | % |
Net margin(4) | | | 1.4 | % | | | 1.4 | % | | | 2.4 | % | | | 2.5 | % | | | 3.3 | % | | | 4.9 | % |
Current ratio(5) | | | 0.96 | x | | | 0.96 | x | | | 0.82 | x | | | 0.77 | x | | | 0.88 | x | | | 0.92 | x |
| (1) | Except financial ratios. |
| (2) | See “Presentation of Financial and Other Information” for the definition of Adjusted EBITDA and the reconciliation of Adjusted EBITDA to IFRS measures. |
| (3) | Consolidated gross profit divided by consolidated revenues from ordinary activities. |
| (4) | Consolidated net income divided by consolidated revenues from ordinary activities. |
| (5) | Consolidated current assets divided by consolidated current liabilities. |
| | | | | | | | | | | | | | | | | | | | | | | | |
| | | Year ended December 31, | |
Comprehensive income: | | 2014 | | | 2014 | | | 2013 | | | 2012 | | | 2011 | | | 2010 | |
| | | (in millions of U.S.$) | | | (in millions of Ch$) | |
Comprehensive income attributable to controlling shareholders | | | 125 | | | | 76,055 | | | | 94,725 | | | | 34,002 | | | | 357,049 | | | | 201,686 | |
Comprehensive (loss) income attributable to non-controlling shareholders | | | (1 | ) | | | (881 | ) | | | (168 | ) | | | (5,354 | ) | | | 12,865 | | | | 253 | |
Total comprehensive income | | | 124 | | | | 75,174 | | | | 94,557 | | | | 28,648 | | | | 369,913 | | | | 201,939 | |
| | | | | | | | | | | | | | | | | | | | | | | | |
| | | | | | | | | | | | | | | | | | | | |
| | | Year ended December 31, | |
Operating data: | | 2014 | | | 2013 | | | 2012 | | | 2011 | | | 2010 | |
Number of Stores | | | | | | | | | | | | | | | | | | | | |
Supermarkets: | | | | | | | | | | | | | | | | | | | | |
Chile | | | 224 | | | | 224 | | | | 214 | | | | 189 | | | | 163 | |
Argentina | | | 290 | | | | 290 | | | | 288 | | | | 269 | | | | 256 | |
Brazil | | | 219 | | | | 221 | | | | 204 | | | | 152 | | | | 130 | |
Peru | | | 87 | | | | 87 | | | | 86 | | | | 74 | | | | 64 | |
Colombia | | | 100 | | | | 100 | | | | 96 | | | | 0 | | | | 0 | |
Supermarkets subtotal | | | 922 | | | | 922 | | | | 888 | | | | 684 | | | | 613 | |
Home Improvement Stores: | | | | |
Chile | | | 32 | | | | 32 | | | | 31 | | | | 29 | | | | 29 | |
Argentina | | | 48 | | | | 48 | | | | 47 | | | | 48 | | | | 49 | |
Colombia | | | 9 | | | | 9 | | | | 4 | | | | 4 | | | | 4 | |
Home improvement stores subtotal | | | 89 | | | | 89 | | | | 82 | | | | 81 | | | | 82 | |
Department Stores: | | | | | | | | | | | | | | | | | | | | |
Chile | | | 77 | | | | 77 | | | | 78 | | | | 35 | | | | 34 | |
Peru | | | 6 | | | | 6 | | | | 0 | | | | 0 | | | | 0 | |
Department stores subtotal | | | 83 | | | | 83 | | | | 78 | | | | 35 | | | | 34 | |
Shopping Centers: | | | | | | | | | | | | | | | | | | | | |
Chile | | | 25 | | | | 25 | | | | 9 | | | | 9 | | | | 9 | |
Argentina | | | 18 | | | | 18 | | | | 18 | | | | 14 | | | | 14 | |
Peru | | | 4 | | | | 3 | | | | 2 | | | | 2 | | | | 2 | |
Colombia | | | 2 | | | | 2 | | | | 0 | | | | 0 | | | | 0 | |
Shopping centers subtotal | | | 48 | | | | 48 | | | | 29 | | | | 25 | | | | 25 | |
Total | | | 1123 | | | | 1123 | | | | 1076 | | | | 825 | | | | 754 | |
12
| | | | | | | | | | | | | | | | | | | | |
| | | Year ended December 31, | |
Operating data: | | 2014 | | | 2013 | | | 2012 | | | 2011 | | | 2010 | |
| Total Selling Space(1) | | (in square meters) | |
Supermarkets: | | | | | | | | | | | | | | | | | | | | |
Chile | | | 546,236 | | | | 546,236 | | | | 524,677 | | | | 463,834 | | | | 406,555 | |
Argentina | | | 519,171 | | | | 519,171 | | | | 522,270 | | | | 502,682 | | | | 455,808 | |
Brazil | | | 602,194 | | | | 596,746 | | | | 552,764 | | | | 391,485 | | | | 332,626 | |
Peru | | | 259,360 | | | | 259,360 | | | | 258,762 | | | | 233,331 | | | | 209,642 | |
Colombia | | | 428,469 | | | | 428,469 | | | | 416,699 | | | | 0 | | | | 0 | |
Supermarkets subtotal | | | 2,386,981 | | | | 2,349,981 | | | | 2,275,172 | | | | 1,591,332 | | | | 1,404,631 | |
| | | | | | | | | | | | | | | | | | | | |
| | | Year ended December 31, | |
Operating data: | | 2014 | | | 2013 | | | 2012 | | | 2011 | | | 2010 | |
Home Improvement Stores: | | | | | | | | | | | | | | | | | | | | |
Chile | | | 307,853 | | | | 307,853 | | | | 299,806 | | | | 276,325 | | | | 273,625 | |
Argentina | | | 373,490 | (2) | | | 373,490 | (2) | | | 369,067 | (2) | | | 391,485 | | | | 392,645 | |
Colombia | | | 75,732 | | | | 75,732 | | | | 37,060 | | | | 35,360 | | | | 34,309 | |
Home improvement stores subtotal | | | 757,074 | | | | 757,074 | | | | 705,933 | | | | 703,170 | | | | 700,579 | |
Department Stores: | | | | | | | | | | | | | | | | | | | | |
Chile | | | 371,891 | | | | 371,891 | | | | 377,191 | | | | 272,388 | | | | 234,489 | |
Peru | | | 32,222 | | | | 32,222 | | | | 0 | | | | 0 | | | | 0 | |
Department stores subtotal | | | 404,113 | | | | 404,113 | | | | 377,191 | | | | 272,388 | | | | 234,489 | |
Shopping Centers:(3) | | | | | | | | | | | | | | | | | | | | |
Chile | | | 433,053 | | | | 412,418 | | | | 410,117 | | | | 282,693 | | | | 273,983 | |
Argentina | | | 241,410 | | | | 241,410 | | | | 241,410 | | | | 227,396 | | | | 214,002 | |
Peru | | | 15,514 | | | | 58,388 | | | | 41,303 | | | | 54,750 | | | | 54,750 | |
Colombia | | | 14,514 | | | | 14,514 | | | | 0 | | | | 0 | | | | 0 | |
Shopping centers subtotal | | | 800,272 | | | | 756,264 | | | | 692,830 | | | | 564,839 | | | | 542,735 | |
Total | | | 4,237,899 | | | | 4,237,899 | | | | 4,051,126 | | | | 3,131,729 | | | | 2,882,434 | |
| |
| Average Selling Space per Store(4) | | (in square meters) | |
Supermarkets: | | | | | | | | | | | | | | | | | | | | |
Chile | | | 2,439 | | | | 2,439 | | | | 2,452 | | | | 2,454 | | | | 2,494 | |
Argentina | | | 1,790 | | | | 1,790 | | | | 1,813 | | | | 1,869 | | | | 1,781 | |
Brazil | | | 2,700 | | | | 2,700 | | | | 2,710 | | | | 2,576 | | | | 2,559 | |
Peru | | | 2,981 | | | | 2,981 | | | | 3,009 | | | | 3,153 | | | | 3,276 | |
Colombia | | | 4,285 | | | | 4,285 | | | | 0 | | | | 0 | | | | 0 | |
Supermarkets subtotal | | | 2,549 | | | | 2,549 | | | | 2,562 | | | | 2,327 | | | | 2,291 | |
Home Improvement Stores: | | | | | | | | | | | | | | | | | | | | |
Chile | | | 9,620 | | | | 9,620 | | | | 9,671 | | | | 9,528 | | | | 9,435 | |
Argentina | | | 7,781 | | | | 7,781 | | | | 7,852 | | | | 8,156 | | | | 7,435 | |
Colombia | | | 8,415 | | | | 8,415 | | | | 9,265 | | | | 8,840 | | | | 8,577 | |
Home improvement stores subtotal | | | 8,506 | | | | 8,506 | | | | 8,609 | | | | 8,681 | | | | 8,198 | |
Department Stores: | | | | | | | | | | | | | | | | | | | | |
Chile | | | 4,830 | | | | 4,830 | | | | 4,836 | | | | 7,783 | | | | 6,897 | |
Peru | | | 5,370 | | | | 5,370 | | | | 0 | | | | 0 | | | | 0 | |
Department stores subtotal | | | 4,869 | | | | 4,869 | | | | 4,836 | | | | 7,783 | | | | 6,897 | |
Shopping Centers: | | | | | | | | | | | | | | | | | | | | |
Chile | | | 17,322 | | | | 16,497 | | | | 42,987 | | | | 31,410 | | | | 30,443 | |
Argentina | | | 12,796 | | | | 13,412 | | | | 15,761 | | | | 16,243 | | | | 15,286 | |
Peru | | | 17,798 | | | | 19,463 | | | | 16,839 | | | | 27,375 | | | | 27,375 | |
Colombia | | | 7,257 | | | | 7,257 | | | | 0 | | | | 0 | | | | 0 | |
Shopping centers subtotal | | | 15,099 | | | | 15,140 | | | | 25,620 | | | | 22,594 | | | | 21,709 | |
| |
| Average Sales per Store(5) | | (in millions of Ch$) | |
Supermarkets: | | | | | | | | | | | | | | | | | | | | |
Chile | | | 9,894 | | | | 9,943 | | | | 9,617 | | | | 9,662 | | | | 10,371 | |
Argentina | | | 6,254 | | | | 6,162 | | | | 6,083 | | | | 5,776 | | | | 5,352 | |
Brazil | | | 9,837 | | | | 9,067 | | | | 10,270 | | | | 10,211 | | | | 6,484 | |
Peru | | | 9,617 | | | | 8,569 | | | | 8,360 | | | | 8,439 | | | | 8,744 | |
Colombia | | | 9,999 | | | | 9,185 | | | | 1,189 | (6) | | | 0 | | | | 0 | |
Supermarkets subtotal | | | 8,736 | | | | 8,228 | (7) | | | 8,356 | (7) | | | 8,123 | | | | 7,276 | |
13
| | | | | | | | | | | | | | | | | | | | |
| | | Year ended December 31, | |
Operating data: | | 2013 | | | 2013 | | | 2012 | | | 2011 | | | 2010 | |
| | | (in millions of Ch$) | |
Home Improvement Stores: | | | | | | | | | | | | | | | | | | | | |
Chile | | | 14,107 | | | | 14,022 | | | | 12,915 | | | | 12,672 | | | | 11,577 | |
Argentina | | | 13,859 | | | | 14,209 | | | | 13,191 | | | | 11,287 | | | | 9,205 | |
Colombia | | | 6,717 | | | | 9,449 | (8) | | | 10,682 | | | | 9,845 | | | | 8,272 | |
Home improvement stores subtotal | | | 13,179 | | | | 13,858 | | | | 12,964 | | | | 11,712 | | | | 9,998 | |
Department Stores: | | | | | | | | | | | | | | | | | | | | |
Chile | | | 12,053 | | | | 12,413 | | | | 11,360 | | | | 19,736 | | | | 18,315 | |
Peru | | | 4,360 | | | | 2,430 | | | | | | | | | | | | | |
Department stores subtotal | | | 11,945 | | | | 11,691 | | | | 11,360 | | | | 19,736 | | | | 18,315 | |
14
| | | | | | | | | | | | | | | | | | | | |
| | | Year ended December 31, | |
Operating data: | | 2014 | | | 2013 | | | 2012 | | | 2011 | | | 2010 | |
| | | (in millions of Ch$) | |
Shopping Centers: | | | | | | | | | | | | | | | | | | | | |
Chile | | | 11,284 | | | | 11,284 | | | | 9,309 | | | | 7,167 | | | | 6,095 | |
Argentina | | | 4,620 | | | | 4,620 | | | | 4,365 | | | | 4,262 | | | | 3,810 | |
Peru | | | 4,852 | | | | 4,852 | | | | 2,301 | | | | 2,783 | | | | 4,401 | |
Colombia | | | 8,642 | | | | 8,642 | | | | | | | | | | | | | |
Shopping centers subtotal | | | 7,080 | | | | 7,080 | | | | 5,939 | | | | 5,189 | | | | 4,680 | |
| |
| Increase (Decrease) in Same-Store Sales(9) | | (%) | |
Supermarkets: | | | | | | | | | | | | | | | | | | | | |
Chile | | | 4.3 | % | | | 1.6 | % | | | 4.8 | % | | | 4.7 | % | | | 5.9 | % |
Argentina | | | 29.0 | % | | | 17.3 | % | | | 18.5 | % | | | 22.5 | % | | | 25.2 | % |
Brazil | | | (0.6 | )% | | | (0.5 | )% | | | 0.5 | % | | | 1.4 | % | | | 7.1 | % |
Peru | | | 4.6 | % | | | 1.5 | % | | | 4.2 | % | | | 6.5 | % | | | (2.3 | %) |
Colombia | | | (1.5 | )% | | | (7.4 | )% | | | | | | | | | | | | |
Home Improvement Stores: | | | | | | | | | | | | | | | | | | | | |
Chile | | | 2.7 | % | | | 6.1 | % | | | 6.3 | % | | | 4.9 | % | | | 23.7 | % |
Argentina | | | 27.5 | % | | | 30.3 | % | | | 26.6 | % | | | 32.3 | % | | | 27.8 | % |
Colombia | | | (3.4 | )% | | | 0.3 | % | | | 4.1 | % | | | 11.8 | % | | | (3.6 | %) |
Department Stores: | | | | | | | | | | | | | | | | | | | | |
Chile | | | (0.5 | )% | | | 4.7 | % | | | 5.3 | % | | | 5.2 | % | | | 19.7 | % |
| |
| Sales per Square Meter(10) | | (in millions of Ch$) | |
Supermarkets: | | | | | | | | | | | | | | | | | | | | |
Chile | | | 4.15 | | | | 4.08 | | | | 3.92 | | | | 3.94 | | | | 4.13 | |
Argentina | | | 3.43 | | | | 3.44 | | | | 3.35 | | | | 3.09 | | | | 3.01 | |
Brazil | | | 3.58 | | | | 3.36 | | | | 3.79 | | | | 4.08 | | | | 2.53 | |
Peru | | | 3.20 | | | | 2.87 | | | | 2.78 | | | | 2.68 | | | | 2.67 | |
Colombia | | | 2.35 | | | | 2.14 | | | | 0.28 | (11) | | | | | | | | |
Supermarkets subtotal | | | 3.42 | | | | 3.52 | | | | 3.56 | (12) | | | 3.52 | | | | 3.17 | |
Home Improvement Stores: | | | | | | | | | | | | | | | | | | | | |
Chile | | | 1.48 | | | | 1.46 | | | | 1.34 | | | | 1.33 | | | | 1.23 | |
Argentina | | | 1.81 | | | | 1.83 | | | | 1.68 | | | | 1.38 | | | | 1.24 | |
Colombia | | | 1.04 | (13) | | | 1.04 | (13) | | | 1.15 | | | | 1.11 | | | | 0.96 | |
Home improvement stores subtotal | | | 1.57 | | | | 1.62 | | | | 1.51 | | | | 1.35 | | | | 1.22 | |
Department Stores: | | | | | | | | | | | | | | | | | | | | |
Chile | | | 2.54 | | | | 2.57 | | | | 2.35 | | | | 2.54 | | | | 2.66 | |
Peru | | | 0.10 | | | | 0.45 | | | | 0 | | | | 0 | | | | 0 | |
Department stores subtotal | | | 2.36 | (14) | | | 2.57 | (14) | | | 2.35 | | | | 2.54 | | | | 2.66 | |
Shopping Centers: | | | | | | | | | | | | | | | | | | | | |
Chile | | | 0.28 | | | | 0.26 | | | | 0.22 | | | | 0.23 | | | | 0.20 | |
Argentina | | | 0.24 | | | | 0.29 | | | | 0.28 | | | | 0.26 | | | | 0.25 | |
Peru | | | 0.24 | | | | 0.24 | | | | 0.14 | | | | 0.10 | | | | 0.16 | |
Colombia | | | 0.70 | | | | 0.30 | | | | | | | | | | | | | |
Shopping centers subtotal | | | 0.27 | | | | 0.27 | | | | 0.23 | | | | 0.23 | | | | 0.20 | |
Total number of store employees(15) | | | 153,234 | | | | 154,603 | | | | 146,424 | | | | 131,505 | | | | 126,485 | |
| (1) | In square meters at period end. |
| (2) | Due to change in criteria for selling space 2012 figures were modified in order to have comparable figures for 2012 and subsequent periods. This new criteria excludes check-out area and aisles. |
| (3) | Total leasable space for shopping centers does not include selling space occupied by related parties in our shopping centers. |
| (4) | Total square meters of selling space or leasable space, as applicable, at the fiscal period end divided by the total number of stores or shopping centers, as applicable, at period end. |
| (5) | Sales for the fiscal period divided by the number of stores or shopping centers, as applicable, at the end of the fiscal period. |
| (6) | This value takes into consideration only one month of sales for our supermarket operation in Colombia for the 2012 fiscal period. |
15
| (7) | This average does not include sales and stores of our Colombian supermarket operations. |
| (8) | This value does not take into consideration stores opened in Colombia in the month of December 2013. |
| (9) | Reflects the sales of our stores operating throughout the same months of both financial periods being compared. If a store did not operate for a full month of either of the financial periods being compared, we exclude its sales for such month from both financial periods. For example, if a new store was opened on July 1, 2013 and operated throughout the last six months of 2013, (i) “same-store sales” would include the sales of that store for the last six months of 2013 and the last six months of 2014 and (ii) we would consider the sales of the new store during the first six months of 2014 as sales from a newly opened store. Calculated in local currency. |
| (10) | Sales for the period divided by the square meters of selling space or leasable space, as applicable, at the end of each month during the period. |
| (11) | Data for sales in Colombia only reflect the operational result for the month of December 2012 as the former operations of Carrefour in the country were consolidated into Cencosud’s financial statements as of November 30, 2012. |
| (12) | Average sales per square meter exclude sales and selling space for the Colombian supermarket operations. |
| (13) | Excludes stores opened in December 2013. |
| (14) | Excludes Paris Peru Stores |
| (15) | Number of full-time employee equivalents at period end. |
Exchange Rates
Chile
Chile has two currency markets, theMercado Cambiario Formal (the “Formal Exchange Market”) and theMercado Cambiario Informal (the “Informal Exchange Market”). The Formal Exchange Market is comprised of banks and other entities authorized by the Chilean Central Bank. The Informal Exchange Market is comprised of entities that are not expressly authorized to operate in the Formal Exchange Market, such as certain foreign exchange houses and travel agencies, among others. The Chilean Central Bank is empowered to require that certain purchases and sales of foreign currencies be carried out on the Formal Exchange Market. See also “Item 10. Additional Information—D. Exchange Controls—Foreign Exchange Controls—Chile.”
Both the Formal and Informal Exchange Markets are driven by free market forces. Current regulations require that the Chilean Central Bank be informed of certain transactions and that they be effected through the Formal Exchange Market.
The U.S. dollar observed exchange rate (dólar observado), which is reported by the Chilean Central Bank and published daily in the Official Gazette (Diario Oficial), is the weighted average exchange rate of the previous business day’s transactions in the Formal Exchange Market. The Chilean Central Bank has the power to intervene by buying or selling foreign currency on the Formal Exchange Market to attempt to maintain the observed exchange rate within a desired range. During the past few years the Chilean Central Bank has attempted to keep the observed exchange rate within a certain range only under special circumstances. Although the Chilean Central Bank is not required to purchase or sell dollars at any specific exchange rate, it generally uses spot rates for its transactions. Other banks generally carry out authorized transactions at spot rates as well.
The Informal Exchange Market reflects transactions carried out at an informal exchange rate (the “informal exchange rate”). There are no limits imposed on the extent to which the rate of exchange in the Informal Exchange Market can fluctuate above or below the observed exchange rate. In recent years, the variation between the observed exchange rate and the informal exchange rate has not been significant.
The following table sets forth the annual low, high, average and period end observed exchange rate for U.S. dollars for the periods presented, as reported by the Chilean Central Bank. The Federal Reserve Bank of New York does not report a noon buying rate for Chilean pesos.
| | | | | | | | | | | | | | | | |
| | | Daily observed exchange rate Ch$ per U.S.$ | |
| | | High(1) | | | Low(1) | | | Average(2) | | | Period end(3) | |
Year ended December 31, | | | | | | | | | | | | | | | | |
2010 | | | 549.17 | | | | 468.01 | | | | 510.21 | | | | 468.01 | |
2011 | | | 533.74 | | | | 455.91 | | | | 483.57 | | | | 519.20 | |
2012 | | | 519.69 | | | | 469.65 | | | | 486.59 | | | | 479.96 | |
2013 | | | 533.95 | | | | 466.50 | | | | 495.18 | | | | 524.61 | |
2014 | | | 621.41 | | | | 527.53 | | | | 570.33 | | | | 606.75 | |
Month end | | | | | | | | | | | | | | | | |
October 31, 2014 | | | 598.64 | | | | 527.53 | | | | 538.36 | | | | 553.84 | |
November 30, 2014 | | | 605.46 | | | | 580.62 | | | | 593.91 | | | | 605.46 | |
16
| | | | | | | | | | | | | | | | |
| | | Daily observed exchange rate Ch$ per U.S.$ | |
| | | High(1) | | | Low(1) | | | Average(2) | | | Period end(3) | |
December 31, 2014 | | | 621.41 | | | | 606.75 | | | | 612.98 | | | | 606.75 | |
January 31, 2015 | | | 632.03 | | | | 612.47 | | | | 622.11 | | | | 632.03 | |
February 28, 2015 | | | 632.19 | | | | 616.86 | | | | 622.95 | | | | 618.76 | |
March 31, 2015 | | | 642.18 | | | | 617.38 | | | | 628.86 | | | | 626.58 | |
April 2015 (through April 17, 2015) | | | 621.10 | | | | 610.74 | | | | 614.84 | | | | 612.30 | |
Source: Chilean Central Bank.
| (1) | Exchange rates are the actual low and high, on a daily basis for each period. |
| (2) | The yearly average rate is calculated as the average of the exchange rates on the last day of each month during the period. |
| (3) | Each year period ends on December 31, and the respective period-end exchange rate is published by the Chilean Central Bank on the first business day of the following year. Each month period ends on the last calendar day of such month, and the respective period end exchange rate is published by the Chilean Central Bank on the first business day of the following month. |
Argentina
From April 1, 1991 until the end of 2001, the Convertibility Law No. 23,928 and Regulatory Decree No. 529/91 (together, the “Convertibility Law”) established a fixed exchange rate under which the Central Bank of Argentina was obliged to sell U.S. dollars at a fixed rate of one Argentine peso per U.S. dollar. On January 6, 2002, the Argentine Congress enacted the Public Emergency Law, which suspended certain provisions of the Convertibility Law, including the fixed exchange rate of Ar$1.00 to U.S.$1.00, and granted the executive branch of the Argentine government the power to set the exchange rate between the Argentine peso and foreign currencies and to issue regulations related to the foreign exchange market. Following a brief period during which the Argentine government established a temporary dual exchange rate system, pursuant to the Public Emergency Law, the Argentine peso has been allowed to float freely against other currencies since February 2002. For the last few years the Argentine government has maintained a policy of intervention in foreign exchange markets, conducting periodic transactions for the sale and purchase of U.S. dollars. There is no way to foresee if this could continue in the future. See also “Item 10. Additional Information—D. Exchange Controls—Foreign Exchange Controls—Argentina.”
The following table sets forth the annual high, low, average and period-end exchange rates for the periods indicated, expressed in Argentine pesos per U.S. dollar and not adjusted for inflation as reported by the Central Bank of Argentina. The Federal Reserve Bank of New York does not report a noon buying rate for Argentine pesos.
| | | | | | | | | | | | | | | | |
| | | Daily observed exchange rate Ar$ per U.S.$ | |
| | | High | | | Low | | | Average(1) | | | Period end | |
Year ended December 31, | | | | | | | | | | | | |
2010 | | | 3.988 | | | | 3.794 | | | | 3.913 | | | | 3.976 | |
2011 | | | 4.304 | | | | 3.972 | | | | 4.131 | | | | 4.304 | |
2012 | | | 4.917 | | | | 4.304 | | | | 4.552 | | | | 4.917 | |
2013 | | | 6.518 | | | | 4.923 | | | | 5.479 | | | | 6.518 | |
2014 | | | 8.556 | | | | 6.543 | | | | 8.119 | | | | 8.552 | |
Month end | | | | | | | | | | | | | | | | |
October 31, 2014 | | | 8.503 | | | | 8.448 | | | | 8.480 | | | | 8.502 | |
November 30, 2014 | | | 8.526 | | | | 8.507 | | | | 8.514 | | | | 8.526 | |
December 31, 2014 | | | 8.556 | | | | 8.526 | | | | 8.550 | | | | 8.552 | |
January 31, 2015 | | | 8.640 | | | | 8.554 | | | | 8.602 | | | | 8.640 | |
February 28, 2015 | | | 8.726 | | | | 8.649 | | | | 8.686 | | | | 8.724 | |
March 31, 2015 | | | 8.820 | | | | 8.736 | | | | 8.781 | | | | 8.820 | |
April 2015 (through April 17, 2015) | | | 8.867 | | | | 8.826 | | | | 8.848 | | | | 8.867 | |
Source: Central Bank of Argentina.
| (1) | Represents the daily average exchange rate during each of the relevant periods. |
Brazil
The Central Bank of Brazil allows the real/U.S. dollar exchange rate to float freely and has intervened occasionally to control unstable fluctuations in foreign exchange rates. We cannot predict whether the Central Bank of Brazil or the Brazilian government will continue to let the real float freely or will intervene in the exchange rate market through a currency band system or otherwise. The Brazilian real may depreciate or appreciate substantially against the U.S. dollar in the future. Exchange rate fluctuations may adversely affect our financial condition. See also “Item 10. Additional Information—D. Exchange Controls—Foreign Exchange Controls—Brazil.”
17
Prior to March 14, 2005, under Brazilian regulations, foreign exchange transactions were carried out on either the commercial rate exchange market or the floating rate exchange market. Rates in the two markets were generally the same. On March 14, 2005, the National Monetary Council of Brazil (Conselho Monetário Nacional) unified the two markets.
The following table sets forth the exchange selling rates expressed in Brazilian reais per U.S. dollar for the periods indicated, as reported by the Central Bank of Brazil through the Central Bank System (Sistema do Banco Central) using PTAX 800, option 5.
| | | | | | | | | | | | | | | | |
| | | Daily observed exchange rate R$ per U.S.$ | |
| | | High | | | Low | | | Average | | | Period end | |
Year ended December 31, | | | | | | | | | | | | | | | | |
2010 | | | 2.4218 | | | | 1.7024 | | | | 1.9935 | | | | 1.7412 | |
2011 | | | 1.8811 | | | | 1.6554 | | | | 1.7593 | | | | 1.6662 | |
2012 | | | 1.9016 | | | | 1.5345 | | | | 1.6746 | | | | 1.8758 | |
2013 | | | 2.1121 | | | | 1.7024 | | | | 1.9550 | | | | 2.0435 | |
2014 | | | 2.7403 | | | | 2.1974 | | | | 2.3547 | | | | 2.6562 | |
Month end | | | | | | | | | | | | | | | | |
October 31, 2014 | | | 2.5341 | | | | 2.3914 | | | | 2.4483 | | | | 2.4442 | |
November 30, 2014 | | | 2.6136 | | | | 2.4839 | | | | 2.5484 | | | | 2.5601 | |
December 31, 2014 | | | 2.7403 | | | | 2.5607 | | | | 2.6394 | | | | 2.6562 | |
January 31, 2015 | | | 2.7107 | | | | 2.5754 | | | | 2.6342 | | | | 2.6623 | |
February 28, 2015 | | | 2.8811 | | | | 2.6894 | | | | 2.8165 | | | | 2.8782 | |
March 31, 2015 | | | 3.2683 | | | | 2.8655 | | | | 3.1395 | | | | 3.2080 | |
April 2015 (through April 17, 2015) | | | 3.1556 | | | | 3.0249 | | | | 3.0889 | | | | 3.0544 | |
Source: Central Bank of Brazil.
| (1) | Represents the daily average exchange rate during each of the relevant periods. |
Peru
Currently, Peruvian law does not impose any restrictions on the ability of companies having operations in Peru to transfer foreign currencies from Peru to other countries, to convert nuevos soles into any foreign currency or to convert any foreign currency into nuevos soles. Companies may freely remit interest and principal payments abroad and investors may repatriate capital from liquidated investments. We cannot assure you, however, that Peruvian law will continue to permit such payments, transfers, conversions or remittances without restrictions. Exchange rates for the Peruvian Nuevo sol have been relatively stable in recent years. See also “Item 10. Additional Information—D. Exchange Controls—Foreign Exchange Controls—Peru.”
The following table sets forth the Central Bank of Peru’s period-average and period-end buying rates for U.S. dollars for the periods indicated.
| | | | | | | | | | | | | | | | |
| | | Daily observed exchange rate S/. per U.S.$ | |
| | | High | | | Low | | | Average(1) | | | Period end | |
Year ended December 31, | | | | | | | | | | | | | | | | |
2010 | | | 3.258 | | | | 2.851 | | | | 3.011 | | | | 2.888 | |
2011 | | | 2.880 | | | | 2.786 | | | | 2.824 | | | | 2.808 | |
2012 | | | 2.832 | | | | 2.693 | | | | 2.754 | | | | 2.695 | |
2013 | | | 2.709 | | | | 2.549 | | | | 2.638 | | | | 2.549 | |
2014 | | | 2.987 | | | | 2.760 | | | | 2.838 | | | | 2.981 | |
Month end | | | | | | | | | | | | | | | | |
October 31, 2014 | | | 2.920 | | | | 2.890 | | | | 2.905 | | | | 2.920 | |
November 30, 2014 | | | 2.933 | | | | 2.909 | | | | 2.924 | | | | 2.918 | |
December 31, 2014 | | | 2.987 | | | | 2.925 | | | | 2.960 | | | | 2.981 | |
January 31, 2015 | | | 3.056 | | | | 2.981 | | | | 3.004 | | | | 3.056 | |
February 28, 2015 | | | 3.094 | | | | 3.057 | | | | 3.077 | | | | 3.091 | |
March 31, 2015 | | | 3.100 | | | | 3.064 | | | | 3.090 | | | | 3.094 | |
April 2015 (through April 17, 2015) | | | 3.124 | | | | 3.089 | | | | 3.111 | | | | 3.124 | |
Source: Central Bank of Peru.
| (1) | Calculated as the average of the month-end exchange rates during the relevant period. |
18
Colombia
Since September 1999, the Central Bank of Colombia has allowed the Colombian peso to float freely, intervening only when there are steep variations in the Colombian peso’s value relative to the U.S. dollar (referred to as the “representative market rate”) to control volatility. Different mechanisms have been used for this purpose. Currently, the Central Bank is intervening directly by purchasing variable amounts of foreign currency in the exchange markets.
This intervention mechanism is only used to control the international reserves of Colombia or in case the average of a specified rate (referred to as the “representative market rate”) for the preceding twenty days exceeds 5% of that day’s representative market rate. Upon the occurrence of such an event, the Central Bank of Colombia sells call options, whereby the purchaser is entitled to buy from the Central Bank of Colombia, on a future date, a specified amount of U.S. dollars at a pre-established exchange rate, thus reducing the volatility of the exchange rate. As of October 28, 2009, the call option mechanism can only be used to control the international reserves of Colombia. See also “Item 10. Additional Information—D. Exchange Controls—Foreign Exchange Controls—Colombia.”
Although the foreign exchange market is allowed to float freely, there are no guarantees that the Central Bank of Colombia or the Colombian government will not intervene in the exchange market in the future. The Federal Reserve Bank of New York does not report a rate for Colombian pesos. TheSuperintendencia Financiera de Colombia calculates the representative market rate based on the weighted averages of the buy/sell foreign exchange rates quoted daily by certain financial institutions for the purchase and sale of foreign currency.
The following table sets forth the average Colombian peso/U.S. dollar representative market rate for the periods indicated, calculated by using the average of the exchange rates on the last day of each month during the period.
| | | | | | | | | | | | | | | | |
| | | Daily observed exchange rate Col$ per U.S.$ | |
| | | High | | | Low | | | Average(1) | | | Period end | |
Year ended December 31, | | | | | | | | | | | | | | | | |
2010 | | | 2,074.40 | | | | 2,021.49 | | | | 2,048.57 | | | | 2,050.52 | |
2011 | | | 2,206.19 | | | | 2,061.92 | | | | 2,128.68 | | | | 2,206.19 | |
2012 | | | 2,446.35 | | | | 2,206.19 | | | | 2,342.25 | | | | 2,392.46 | |
2013 | | | 2,452.11 | | | | 2,361.54 | | | | 2,397.26 | | | | 2,441.10 | |
2014 | | | 2,446.35 | | | | 1,846.12 | | | | 2,000.33 | | | | 2,392.46 | |
Month end | | | | | | | | | | | | | | | | |
October 31, 2014 | | | 2,074.40 | | | | 2,021.49 | | | | 2,048.57 | | | | 2,050.52 | |
November 30, 2014 | | | 2,206.19 | | | | 2,061.92 | | | | 2,128.68 | | | | 2,206.19 | |
December 31, 2014 | | | 2,446.35 | | | | 2,206.19 | | | | 2,342.25 | | | | 2,392.46 | |
January 31, 2015 | | | 2,452.11 | | | | 2,361.54 | | | | 2,397.26 | | | | 2,441.10 | |
February 28, 2015 | | | 2,500.59 | | | | 2,371.31 | | | | 2,420.67 | | | | 2,496.99 | |
March 31, 2015 | | | 2,677.97 | | | | 2,496.99 | | | | 2,585.36 | | | | 2,576.05 | |
April 2015 (through April 21, 2015 | | | 2,598.36 | | | | 2,490.90 | | | | 2,539.52 | | | | 2,493.93 | |
Source: Central Bank of Colombia.
| (1) | Calculated as the average of the month-end exchange rates during the relevant period. |
B. CAPITALIZATION AND INDEBTEDNESS
Not Applicable.
C. REASONS FOR THE OFFER AND USE OF PROCEEDS
Not Applicable.
D. RISK FACTORS
You should carefully consider the risks and uncertainties described below and the other information in this annual report. The risks described below are not the only ones facing our company or investments in the countries in which we operate. Our business, financial condition or results of operations could be materially and adversely affected by any of these risks. Additional risks not presently known to us or that we currently deem immaterial may also impair our business operations. This annual report also contains forward-looking statements that involve risks and uncertainties. See “Forward-Looking Statements.” The market price of our common shares and ADSs may decrease due to any of these risks or other factors, and you may lose all or part of your investment. Our actual results could differ materially and adversely from those anticipated in these forward-looking statements as a result of certain factors, including the risks facing our company described below and elsewhere in this annual report.
19
Risks Related to Our Business and Our Industries
Economic conditions that impact consumer spending could materially affect us.
Ongoing economic uncertainty in the world economy could negatively affect consumer confidence and spending, including discretionary spending. We may be materially affected by changes in economic conditions in the markets or in the regions in which we operate that impact consumer confidence and spending, including discretionary spending. This risk may be exacerbated if customers choose lower-cost alternatives to our product offerings in response to economic conditions. In particular, a decrease in discretionary spending could materially and adversely impact sales of certain of our high-margin product offerings. Future economic conditions affecting disposable consumer income, such as employment levels, business conditions, changes in housing market conditions, the availability of credit, interest rates, tax rates and fuel and energy costs, could also reduce overall consumer spending or cause consumers to shift their spending to lower-priced competitors. In addition, inflation or deflation can impact our business. Deflation in food prices could reduce sales growth and earnings, while inflation in food prices, combined with reduced consumer spending, could reduce our margins. Accordingly, we cannot assure you that in the event of an increase in inflation we will be able to pass on a price increase to our customers, which could have a material adverse effect on us.
We face intense competition in each of our markets.
The retail industry in Chile, Argentina, Brazil, Peru and Colombia is characterized by intense competition and increasing pressure on profit margins. The number and type of competitors and the degree of competition experienced by individual stores varies by location. Competition occurs on the basis of price, location, quality of products and service, product variety and store conditions. We face strong competition from international and domestic operators of supermarkets, home improvement stores, department stores and shopping centers, including Carrefour, Walmart, Falabella and Casino, and providers of financial services, and it is possible that in the future other large international retailers or financial services providers may enter the markets in which we compete, either through joint ventures or directly. Some of our competitors have significantly greater financial resources than we do and could use these resources to take steps that could have a material and adverse effect on us. We also compete with numerous local and regional supermarket and retail store chains, as well as with small, family-owned neighborhood stores, informal markets, and street vendors. See “Item 4. Information on the Company—B. Business Overview—Competition” and “—Industry Overview and Competition.”
Increasing competition may cause us to lower our prices, increase expenditures and take other actions that could have a material adverse effect on us or compel us to reduce our planned growth, acquisitions and capital expenditures. As other retailers expand their operations in Chile, Argentina, Brazil, Peru and Colombia, and other international retailers enter these markets, competition will continue to intensify. Our inability to respond effectively to competitive pressures and changes in the retail markets could have a material adverse effect on us, including as a result of our losing market share.
Our traditional retail stores, supermarkets and shopping centers face increasing competition from internet sales which may negatively affect sales of traditional channels.
In recent years, retail sales of food, clothing and home improvement products over the internet have increased significantly in each of the countries in which we operate. Internet retailers are able to sell directly to consumers, diminishing the importance of traditional distribution channels such as supermarkets and retail stores. Certain internet food retailers have significantly lower operating costs than traditional hypermarkets and supermarkets because they do not rely on an expensive network of retail points of sale or a large sales force. As a result, such internet food retailers are able to offer their products at lower costs than we do and in certain cases are able to bypass retailing intermediaries and deliver particularly high-quality, fresh products to consumers. We believe that our consumers are increasingly using the internet to shop electronically for food and other retail goods, and that this trend is likely to continue. If internet sales continue to grow, consumers’ reliance on traditional distribution channels such as our supermarkets, home improvement stores, department stores and shopping centers could be materially diminished, which could have a material adverse effect on us.
Our markets are undergoing rapid consolidation.
Over the last several years, the food, department store and home improvement retail sectors in Chile, Argentina, Brazil, Peru and Colombia have been undergoing consolidation as large retail chains have gained market share at the expense of small, independently owned and operated stores, and large local and international supermarket chains have consolidated. We believe that further consolidation will likely occur in all of these markets as competition intensifies and economies of scale become increasingly important. Some of our competitors are larger and better capitalized than we are and as a result are likely to be better positioned to take advantage of strategic acquisition opportunities. We cannot assure you that such market consolidation will not occur to the material detriment of our market position or that such developments will not have a material adverse effect on us.
20
Our growth in recent years has been due to a series of significant acquisitions that are not likely to be repeated in future periods.
We may not be able to successfully execute our growth strategy through acquisitions as done in the past. As a result of the consolidation that has occurred in the retail industry, a significant component of our growth in recent years has occurred through acquisitions. In particular, we acquired various supermarket and department store chains in recent years, including Paris in Chile in 2005, GBarbosa in Brazil in 2007, Wong in Peru in 2008, Perini, Super Familia and Bretas in Brazil in 2010, Cardoso in Brazil and Johnson in Chile in 2011, and Prezunic in Brazil and Carrefour’s supermarket operations in Colombia in 2012. See “Item 4. Information on the Company—A. History and Development of the Company—History.” As noted above, we believe that further consolidation is likely to occur in the industries in which we operate. However, some of our principal competitors are larger than we are and are likely to be better positioned to take advantage of strategic acquisition and consolidation opportunities. We cannot assure you that in the future there will be continued availability of suitable acquisition candidates at favorable prices and upon advantageous terms and conditions or that we will be able to compete with our competitors for any future acquisitions. As a result, our growth rate is likely to be significantly lower than it has been in recent years, which may have a material adverse effect on us.
A failure to successfully integrate acquired businesses may have a material adverse effect on us.
Over the past several years, we have completed a number of important acquisitions and may continue to make acquisitions in the future. We believe that these acquisitions provide strategic growth opportunities for us. Achieving the anticipated benefits of these acquisitions will depend in part upon our ability to integrate these businesses in an efficient and effective manner. The challenges involved in successfully integrating acquisitions include: we may find that the acquired company or assets do not further our business strategy, that we overestimated the expected benefits to be derived from the acquisitions, we discover new contingencies not identified through the due diligence process, or that economic conditions have changed, all of which may result in a future impairment charge; we may have difficulty integrating the operations and personnel of the acquired business and may have difficulty retaining the customers and/or the key personnel of the acquired business; we may have difficulty incorporating and integrating acquired technologies into our business; our ongoing business and management’s attention may be disrupted or diverted by transition or integration issues and the complexity of managing diverse locations; we may have difficulty maintaining uniform standards, controls, procedures and policies across locations; an acquisition may result in litigation from terminated employees of the acquired business or third parties; and we may experience significant problems or liabilities associated with technology and legal contingencies of the acquired business. These factors could have a material adverse effect on us, particularly in the case of a larger acquisition or multiple acquisitions in a short period of time. Our inability to successfully integrate our acquisitions could have a material adverse effect on us.
The expansion of our business through acquisitions poses risks that may reduce the benefits we anticipate from these transactions.
As part of our business strategy, we have grown significantly through acquisitions. Our decision to pursue an acquisition is based on our belief that such acquisition will complement our business strategy and grow our business. However, our management is unable to predict whether or when any prospective acquisitions will occur, or the likelihood of a certain transaction being completed on favorable terms and conditions. Our ability to continue to expand our business successfully through acquisitions depends on many factors, including our ability to identify acquisitions, the ability to negotiate favorable transaction terms and our ability to finance any such acquisition from internal or external sources. Even if we are able to identify acquisition targets and obtain the necessary financing to make these acquisitions, it is possible that the cost of doing so, taken together with possible adverse market conditions and resulting loss of revenues or net income, could financially overextend us.
Acquisitions also expose us to the risk of successor liability relating to litigation, tax claims or other actions involving an acquired company, its management or contingent liabilities incurred before the acquisition. The due diligence we conduct in connection with an acquisition, and any contractual guarantees or indemnities that we receive from the sellers of acquired companies, may not be sufficient to protect us from, or compensate us for, actual or potential liabilities. Any material liability associated with an acquisition could have a material adverse effect on us, including our reputation, and reduce the benefits of such acquisition.
Antitrust laws in Chile, Argentina, Brazil, Peru or Colombia could limit our ability to expand our business through acquisitions or joint ventures.
Chilean, Argentine, Brazilian, and Colombian antitrust laws contain provisions that require authorization by the antitrust authorities in those countries for the acquisition of, or entering into joint venture agreements with, companies with a relevant market
21
share. Such authorizations have been denied in some cases involving the industries in which we operate, as occurred in Chile with the denial by theTribunal de Defensa de la Libre Competencia (the Chilean Antitrust Court) of the merger between Distribucion y Servicio D&S S.A. (“D&S”) and Falabella in January 2008. Peru does not currently apply such controls, but we cannot assure you that it will not impose them in the future. Accordingly, our ability to expand our business through acquisitions in Chile, Argentina, Brazil, Peru and Colombia may be limited.
Currently, Cencosud is restricted from acquiring any supermarkets in Chile, as a consequence of a settlement it reached in 2008 with the antitrust authorities. As part of the settlement, Cencosud needs prior authorization from the Chilean Antitrust Court before engaging in any supermarket acquisition. This restriction can only be lifted by means of a consultation before the Chilean Antitrust Court.
Moreover, on December 14, 2011, the Chilean antitrust authority (Fiscalía Nacional Económica, or “FNE”) announced an investigation into anti-competitive practices in the food retail industry including several local operators such as Cencosud. Details of the investigation have not been made public. However, Cencosud believes that it has complied with all applicable regulations in conducting its business. While the investigation may result in the imposition of fines on the parties being investigated, including Cencosud, Cencosud does not believe that such fines, if any, would have a material effect on its results of operations. However, we cannot assure you that this investigation, or future investigations, will not result in a material adverse effect on us, including financial and reputational harm.
We may not be able to generate or obtain the capital we need for further expansion.
We expect to continue to have substantial liquidity and capital resource requirements to finance our business. We intend to rely upon internally generated cash from our operations and, if necessary, the proceeds of debt and/or equity offerings in the domestic and international capital markets and bank debt. We cannot assure you, however, that we will be able to generate sufficient cash flows from operations or obtain sufficient funds from external sources to fund our capital expenditure requirements.
Our future ability to access financial markets in sufficient amounts and at acceptable costs and terms to finance our operations, fund our proposed capital expenditures and pay dividends will depend to a large degree on prevailing capital and financial market conditions over which we have no control, and accordingly we cannot assure you that we will be able to do so. Our failure to generate sufficient cash flows from operations or to be able to obtain third-party financing could cause us to delay or abandon some or all of our planned expansion, including capital expenditures, which, in turn, could have a material adverse effect on us.
Our operating income is sensitive to conditions that affect the cost of the products we sell in our stores.
Our business is characterized by relatively high inventory turnover with relatively low profit margins. We make a significant portion of our sales at prices that are based on the cost of products we sell plus a percentage markup. As a result, our profit levels may be materially affected during periods of decreasing prices. In addition, our business could be materially and adversely affected by other factors, including inventory control, competitive price pressures, severe weather conditions and unexpected increases in fuel or other transportation related costs which increase the cost of the products we sell in our stores. If we are unable to pass along these cost increases to our customers, our profit margin will decrease resulting in a material adverse effect on us.
Our retail results are highly seasonal and therefore any circumstance that negatively impacts our retail business during our seasons of high demand may materially and adversely affect us.
We have historically experienced seasonality in our retail sales in Chile, Argentina, Brazil, Peru and Colombia, principally due to stronger sales during the Christmas and New Year holiday season and during the beginning of each school year in March, and reduced sales during the months of January and February due to the summer holidays. For example, in 2014, 2013 and 2012, 28%, 27.7% and 28.5% of our consolidated revenues were generated during the fourth quarter, respectively. Any economic slowdown, interruption to our business or to the business of our suppliers, or the occurrence of any other circumstance that may impact our business during the first or last quarter of any fiscal year may therefore have a material adverse effect on us.
In addition, in preparation for our seasons of high demand, we must increase inventory to levels substantially higher than those maintained during the rest of the year, and hire temporary staff for our stores. Any unforeseen reduction in demand, mistake in our demand forecasts or product selection, or delay by our suppliers in meeting our demand during these seasons could force us to sell inventory at significantly lower prices, which would also materially and adversely affect us.
The clothing retail industry is negatively affected by decreases in the purchasing power of middle- and low-income consumers resulting from unfavorable economic cycles.
The success of our department stores operations depends largely on factors relating to the stability or increase of consumer spending, especially by members of middle- and low-income socioeconomic groups. Historically, the purchasing power of such
22
groups has been significantly correlated with factors that affect income, such as interest rates, inflation, availability of consumer credit, taxation, employment levels, consumer confidence and salary levels. Therefore, in times of economic downturns, the purchasing power of such groups decreases as their income decreases. In addition, our middle- and low-income customers are likely to consider clothing purchases superfluous during periods of reduced income which would most likely lead to a decrease in demand for our clothing products from this group. Such a decrease in the demand of our middle- and low-income customers coupled with a general decrease in their purchasing power could materially and adversely affect us.
Changes in suppliers’ allowances and promotional incentives could impact profitability and have a material adverse effect on us.
We receive from our suppliers rebates, allowances and promotional incentives that reduce our cost of inventories and related costs of goods sold, improving our gross margins. For example, commercial allowances from suppliers include fees from suppliers for the sale of their products in our stores, supplier rebates and bonuses, supplier promotional allowances and fees, and fees from publicity activities carried out for third parties using our proprietary customer information. For the year ended December 31, 2014, supplier allowances and promotional incentives amounted to 13.3% of sales in our supermarket division and 5.2% of sales for our department store division. For the years ended December 31, 2013 and 2012, the amount of these allowances and promotional incentives amounted to Ch$2,200 million and Ch$858 million, respectively, and were recorded as a reduction to inventory costs and related costs of sales. We cannot assure you that we will be able to obtain a similar level of such fees, rebates, bonuses or allowances in the future. Should any of our key suppliers reduce or otherwise eliminate these arrangements, our profit margin for the affected products could be impacted, which could in turn have a material adverse effect on us.
Our current strategy may not have the expected results on our profitability.
Our strategy aims to provide our customers with a superior shopping experience, delivering a greater variety of quality products and services than our competitors. This strategy is based on savings achieved through operational efficiencies that are transferable to the customer. We couple this strategy with a focus on expanding our position both in Chile and other markets in Latin America that we believe offer attractive prospects for growth. The long-term success of our strategy is subject to significant risks, including failure to generate the expected number of additional sales volume and to reduce selling and administrative expenses; price reductions by competitors; difficulties in obtaining additional vendor allowances from suppliers in the expected amounts and necessary timeframe; difficulties in expanding operations due to adverse economic scenarios; difficulties in finding employees and delays in implementing our strategy. Any one of these factors could have a material adverse effect on us.
We are subject to risks affecting shopping centers that may materially and adversely affect us.
Our operation of our shopping centers (which lease spaces to third parties) is subject to various factors that affect their development, administration and profitability. These factors include the accessibility and the attractiveness of the area where the shopping center is located and of the shopping center itself; the flow of people and the level of sales of each shopping center rental unit; oversupply of retail space or a reduction in demand for retail space which could result in lower rent prices and lower revenues; increases in competition from other shopping centers which drive down our prices and profits; our inability to collect rents due to bankruptcy, insolvency of tenants or otherwise; the ability of our tenants to provide adequate maintenance and insurance; and fluctuations in occupancy levels in our shopping centers.
Many of our hypermarket, supermarket, department stores and home improvement stores are located in shopping centers, and as a result a substantial portion of our revenues is sensitive to factors affecting these and other shopping centers. Also, an economic downturn in the countries or regions in which our shopping centers are located could lead to the bankruptcy of our tenants and a reduction in our shopping center sales due to a decrease in disposable income, which could have a material adverse effect on us.
We are subject to risks that changing shopping trends that could materially and adversely affect us.
In developed markets consumers have begun to express a preference for small-box stores shunning away from traditional big-box outlets. This trend in markets such as the U.S. and the U.K. has been more evident in fresh, on-the-go foods and the grocery channel. As a consequence retailers in these markets such as Walmart, Tesco and Target have responded by turning to small-box stores as drivers for growth, as a means to target a more urban consumer and as an engine for revenue expansion. This has led to the rolling out of new formats such as Walmart Express, Tesco Express and Fresh and Easy Express in formats of 1,400 square meters distancing themselves from the traditional big-box 10,000 square meters outlets. We are currently undertaking a strategy that includes all types of formats in order to cater to a wide range of consumers. If such trend favoring small-box stores were to materialize in the markets in which we operate, it could materially and adversely affect our results of operations and financial condition.
23
Our development activities depend on finding attractive real estate locations at reasonable prices.
An important part of our growth strategy rests on our ability to develop and open new stores. We face intense competition from both other retail operators and also real estate developers for new sites for our stores. Accordingly, we may be unable to find attractive real estate locations at reasonable prices to sustain our growth, which could have a material adverse effect on us.
We are subject to risks associated with development and construction activities.
The development, renovation and construction of our hypermarkets, supermarkets, department stores, home improvement stores and shopping centers involve certain risks such as failure to correctly anticipate construction costs, lower than anticipated occupancy rates and rents at newly completed projects, failure to obtain financing on favorable terms, delays in construction and lease-up, and failure to obtain necessary zoning, land use, building, occupancy and other required governmental permits and authorizations.
We are currently in the process of constructing several projects. In 2012 we completed construction of Costanera Center Shopping mall in Santiago, Chile, part of a development including two towers one of which we believe will be the tallest building in South America. We face certain risks associated with the large-scale nature of the project, such as occupancy rates and rents not being sufficient to make the project profitable and the fact that we may be unable to obtain or may face delays in obtaining all necessary approvals for a necessary transit mitigation program or municipal reception related to these works. Any such delays, or other substantial unanticipated delays or expenses related to the Costanera Center office tower or other future construction or renovation projects may reduce our net income for the relevant periods and could have a material adverse effect on us.
Our development activities depend on our ability to obtain and maintain zoning, environmental, land-use and other governmental approvals which we may not be able to get.
Our activities are subject to national, federal, state and municipal laws, and to regulations, authorizations and licenses required with respect to construction, zoning, use of the soil, environmental protection and historical heritage, consumer protection and other requirements in Chile, Argentina, Brazil, Peru and Colombia, all of which affect our ability to acquire land, develop and build projects and negotiate with customers. In the case of non-compliance with such laws, regulations, licenses and authorizations, we may face fines, project shutdowns, cancellation of licenses and revocation of authorizations.
In addition, the regulation of matters relating to the protection of the environment is not as well developed in Argentina, Brazil, Chile, Peru and Colombia as in the United States and certain other countries. Accordingly, we anticipate that additional laws and regulations should be enacted over time in these countries with respect to environmental matters. If public authorities issue new and stricter standards, or enforce or interpret existing laws and regulations in a more restrictive manner, we may be forced to make expenditures to comply with such new rules.
Our credit card and banking operations expose us to increased credit and financial risks which may have a material adverse effect on us.
Although not a part of our core business, our credit card and consumer finance operations in Chile, Argentina, Peru, Colombia and Brazil are a growing segment of our business. We currently bear all of the credit risk associated with our credit cards in Chile, Argentina and Peru. In Brazil, where we operate our credit card through a joint venture with Brazil’s Banco Bradesco, we bear 50% of the credit risk associated with our cards, including defaults in payment and losses with Banco Bradesco bearing the remaining risk. In Colombia we are currently engaged in a joint venture with Colombia´s Banco Colpatria through which we bear 50% of the credit risk associated with issued credit cards. Results of our financial business in Colombia for the years ended December 31, 2014 and 2013 were included in the Financial Services segment. See “Item 4. Information on the Company—B. Business Overview—Financial Services—Brazil” for additional details related to our joint venture with Banco Bradesco and Banco Colpatria.
Our credit card and consumer finance business can be materially and adversely affected by delinquency on credit card accounts, defaults in payments by credit card holders, extensive judicial processes enforcing the collection of payments, doubtful accounts or losses on receivables. Furthermore, the actual rates of delinquency, collection proceedings and losses on receivables may vary and be affected by numerous factors, which among others include:
| | • | | adverse changes in regional economies; |
| | • | | acceptance of applicants with poor credit records; |
| | • | | inability to predict future charge-offs; |
| | • | | changes in credit card use; |
| | • | | increase of unemployment; and |
| | • | | loss of value of actual salaries. |
24
These and other factors may have a negative effect on present rates of delinquency, collection proceedings and losses, any one or more of which could have a material adverse effect on us. In particular, our credit card business has grown significantly in recent years and in connection with such growth, our past due credit card receivables have also grown. We cannot assure you that our present rates of delinquency will not increase, and if they do, that it would not have a material adverse effect on us.
Further, to boost our retail volume sales, one of our business goals is to promote greater use of our credit cards and other financing activities in Chile, Argentina, Peru, Colombia and Brazil. As a result, our exposure to the credit risk of our cardholders and banking customers is likely to increase in the near future. We cannot assure you that any expansion of our credit card operations (including the assumption of account approval and credit risk by us) or our other lending operations, such as the cash advances and consumer loans we offer to our credit card customers, will not result in an impairment of the credit portfolio of our credit card and banking business in Chile, Argentina, Peru, Colombia and Brazil. Any such impairment would have a material adverse effect on us. See “Item 4. Information on the Company—B. Business Overview—Financial Services” for additional details related to our credit card and consumer loan operations.
Our credit card and banking activities depend on our ability to comply with current or future government regulations, as well as our ability to obtain and maintain governmental approvals.
Our credit card and banking operations are subject to substantial regulation. We must comply with national, state and municipal laws, and with regulations, authorizations and licenses required with respect to credit card and banking activities. We invest financial and managerial resources to comply with these laws and related permit requirements.
Our failure to comply with credit card and banking laws and related permit requirements could subject us to investigations, enforcement actions, fines or penalties. For example, on April 24, 2013, the Supreme Court of Chile ruled on the class action suit filed by theServicio Nacional del Consumidor(the National Consumer Service, or “SERNAC”), a Chilean government entity, against Cencosud Administradora de Tarjetas S.A. (“CAT”), ordering CAT to reimburse certain cardholders for excess monthly maintenance fees charged since 2006 plus adjustments for inflation and interest. As of December 31, 2014, the company continues to have a provision for Ch$1,887 million for such principal amount and Ch$760 million tied to inflation and interests related to future disbursements tied to this class action.
Moreover, if applicable laws and regulations, or the interpretation or enforcement thereof, become more stringent in the future, our capital or operating costs could increase beyond what we currently anticipate, and the process of obtaining or renewing licenses for our activities could be hindered or even opposed by the competent authorities. We cannot assure you that regulators will not impose more restrictive limitations on the activities of our credit card or bank operations in the future than those currently in effect. Any such change could have a material adverse effect on us.
Our food retail business sources fresh products from local producers, climate changes may affect their ability to produce, and consequently may affect our capacity to offer such products.
There are indicators of a current climate change happening worldwide. Changes in temperatures and precipitation patterns may negatively affect the capacity of certain regions to produce fresh products such as fresh fruits and vegetables and dairy products.
We have a significant focus on perishable products. Sales of perishable products accounted for approximately 37.1%, 36.1%, and 36.8% of our total sales in 2014, 2013 and 2012, respectively. As we source part of our fresh products from local producers, such changes in climate could impair or limit our ability to source such products, thus affecting our capacity to offer the full assortment of products that we normally carry. Any such disruption could have a material adverse effect on us.
We are dependent on key personnel.
Our and our subsidiaries’ development, operation and growth have depended significantly upon the efforts and experience of our board of directors and our senior management. If for any reason, including retirement, the services of such persons, were to become unavailable and we fail to find and retain an adequate replacement for such persons on a timely basis, there could be a material adverse effect on our operations.
25
Certain of our debt instruments impose significant operating and financial restrictions and in the event of a default, all of our borrowings could become immediately due and payable.
The terms of our financial indebtedness impose, and the terms of our future financial indebtedness may impose, significant operating and other restrictions on us and many of our subsidiaries. The agreements governing our credit facilities and corporate bond issuances contain restrictive covenants and a requirement that we comply with a number of financial “maintenance” covenants, including ratios of total debt to equity, total liabilities to net worth and net financial debt to equity, as well as minimum levels of total assets and unencumbered assets. Our ability to comply with these ratios may be affected by events beyond our control. These restrictions and financial ratios could limit our ability to plan for or react to market conditions, otherwise restrict our activities or business plans and could have a material adverse effect on us, including our ability to finance ongoing operations or strategic investments or to engage in other business activities.
A significant portion of our financial indebtedness is also subject to cross default provisions. Our breach of any of these restrictive covenants or our inability to comply with the financial maintenance ratios would result in a default under other applicable debt instruments. If any such default occurs, the lenders may elect to declare all outstanding borrowings, together with accrued interest and other fees, to be immediately due and payable. If we are unable to repay outstanding borrowings when due, the lenders will have the right to exercise their rights and remedies against us, and we cannot assure you that our assets would be sufficient to repay in full our obligations. Our inability to repay our obligations could have a material adverse effect on us.
A downgrade in our credit rating could materially and adversely affect our obligations under existing credit support commitments and credit facilities.
We have entered into thirteen credit support agreements in connection with derivative transactions with different international and local financial intuitions. Each credit support agreement provides collateral obligations between swap counterparties to mitigate the existing credit risk inherent to operation. If a credit downgrade event occurs, it could result in our having to post additional collateral in connection with a “Margin Call” and us having to pay cash or any other eligible collateral to cover the incurred liabilities at a given valuation date. As of December 31, 2014, notional amounts in cross currency swaps with different counterparties stood at approximately more than USD 1.9 billion.
In addition certain of our bank loans contain a “rating grid” structure. Under such grids, costs of our credit facilities could be adjusted depending on our rating. If a credit rating downgrade occurs, there could be an increase in our debt service costs.
A downgrade in our credit rating could negatively impact our cost of and ability to access capital.
Our credit ratings are an important part of maintaining our liquidity. Any downgrade in credit ratings could potentially increase our borrowing costs, or, depending on the severity of the downgrade, substantially limit our access to capital markets, require us to make cash payments or post collateral and permit termination by counterparties of certain significant contracts. Factors that may impact our credit ratings include, among others, debt levels, planned asset purchases or sales, and near-term and long-term growth opportunities. Factors such as liquidity, asset quality, cost structure, product mix, and others are also considered by the rating agencies. A ratings downgrade could adversely impact our ability to access debt markets in the future, increase the cost of future debt, and potentially require us to post letters of credit for certain obligations.
We have a significant amount of financial indebtedness outstanding with instruments maturing every year
As part of our financial strategy we fund our assets with a combination of both equity and debt. Our portfolio of financial indebtedness has maturities and amortizations applicable every year. As we devote a significant portion of our free cash flow to finance our capital expenditures, we are required to refinance these obligations and therefore we face refinancing risk, especially in times of liquidity restrictions in the financial markets.
Furthermore, our major market for funding is Chile, including both the debt capital market and the local banks. As we are among the largest corporations in Chile and among the largest local issuers, we have become one of the largest investments (in terms of equity and debt holdings) in the local institutional investors’ portfolio, limiting our ability for further issuances in the local market. Likewise, some local banks in Chile have large loan exposure to Cencosud, and have reached the legal limits of maximum exposure to us, limiting our ability to secure future funding from them in the future.
Although we believe we have a sound financial strategy and we have structured our maturities and amortizations in a way that reduces the refinancing needs in a single year we cannot assure you that we will be able to obtain funding in the future to fulfill our financial obligations. If we are unable to obtain such funding, we will need to reduce our capital expenditures to devote a larger portion of our free cash flow to serve our financial obligations, thus reducing our growth prospects, and possibly face a potential event of default with respect to our financial obligations.
26
If any such default occurs, the lenders may elect to declare all outstanding borrowings, together with accrued interest and other fees, to be immediately due and payable. If we are unable to repay outstanding borrowings when due, the lenders will have the right to exercise their rights and remedies against us, and we cannot assure you that our assets would be sufficient to repay in full our obligations. Our inability to repay our obligations could have a material adverse effect on us.
We are subject to risks associated with real estate investments.
Our real estate investments are subject to risks common to commercial and residential properties in general, many of which are not within our control. For example, the yields available from equity investments in real estate depend on the level of sales or rental income generated and expenses incurred. In addition, our ability to generate sufficient income from our properties to service our debt and cover other expenses may be materially and adversely affected by the following factors, among others, some of which we cannot control:
| | • | | downturns in a national, regional and local economic climate; |
| | • | | changes in interest rates and availability of financing; |
| | • | | civil disturbances, earthquakes and other natural disasters, or terrorist acts or acts of war which may result in uninsured or underinsured losses; |
| | • | | changes in our ability or our tenants’ ability to provide for adequate maintenance and insurance, possibly decreasing the useful life of and revenue from property; |
| | • | | law reforms and governmental regulations (such as those governing usage, zoning and real property taxes); |
| | • | | oversupply of retail space or a reduction in demand for retail space, which could result in lower rent prices and lower revenues for us; |
| | • | | increased competition from other real estate operators which might drive down our prices and profits; |
| | • | | increased operating costs due to inflation and other factors such as insurance expense, utilities, real estate taxes, state and local taxes and heightened security and cleaning costs; |
| | • | | the inability to collect rents due to bankruptcy or insolvency of tenants or otherwise; |
| | • | | the need to periodically renovate, repair and release space, and the higher costs thereof; |
| | • | | the inability to revise the commercial terms of our lease agreements to reflect high inflation or exchange rates fluctuations in markets where our leases are based on local nominal currency or in foreign currency; |
| | • | | bankruptcy of tenants and reduction in shopping center sales due to lower disposable income; |
| | • | | exercise by our tenants of their legal right to terminate their leases early; and |
| | • | | the inability to find new tenants as leases on our properties expire or terminate early. |
The occurrence of any combination of the factors listed above could significantly decrease the income we receive from our real estate investments, which in turn could have a material adverse effect on us.
Eviction proceedings in Chile, Argentina, Colombia and Peru are difficult and time consuming, and as a result we may not be able to evict defaulting tenants from our shopping centers.
In our shopping center business, we hold several commercial leases with third party lessees. Although Chilean, Argentine and Peruvian laws allow a summary proceeding to collect unpaid rent and a special proceeding to evict tenants, eviction proceedings in these countries are difficult and time-consuming. Eviction proceedings generally take between six months and two years from the date of filing of the suit to the time of actual eviction, as the heavy workload of the courts and the numerous procedural steps required have generally delayed landlords’ efforts, including ours, to evict tenants. Historically, delinquency regarding our office rental space has been low, and we have usually attempted to negotiate the termination of lease agreements with defaulting tenants after the first few months of non-payment in order to avoid legal proceedings.
We cannot assure you, however, that delinquency rates in the future will not increase significantly, or that our negotiations with tenants will prove to be as successful as they have been in the past, which could have a material adverse effect on us.
27
Any disruption in the operations of our distribution centers may have a material adverse effect on us.
A substantial part of the products we sell in our stores are distributed through our distribution centers. Should any of these distribution centers experience an interruption in operations, we may not be able to effectively distribute the products we sell, which may have a material adverse effect on us.
Additionally, our growth strategy contemplates the opening of new stores in the countries where we operate, which may require an increase in the capacity of our distribution centers, the reorganization of our existing distribution centers or the establishment of new distribution centers. Should we fail to locate adequate properties on which to build new distribution centers, or fail to effectively integrate new, or expand existing, distribution centers, we may not be able to deliver inventory to our stores in a timely manner, which may have a material adverse effect on us.
Certain of our stores rely heavily on sales of perishable products, and ordering errors or product supply disruptions may have a material adverse effect on us.
Our hypermarkets and supermarkets have a significant focus on perishable products. Sales of perishable products accounted for approximately 37.2%, 36.1% and 36.8% of our total sales in 2014, 2013 and 2012, respectively. We rely on various suppliers and vendors to provide and deliver our product inventory on a continuous basis. We could suffer significant perishable product inventory losses in the event of the loss of a major supplier or vendor, disruption of our distribution network, extended power outages, natural disasters or other catastrophic occurrences. We have implemented certain systems to ensure our ordering is in line with demand. We cannot assure you, however, that our ordering systems will always work efficiently, in particular in connection with the opening of new stores, which have no, or a limited, ordering history. If we were to over-order, we could suffer inventory losses, which could have a material adverse effect on us.
An increase in export or import duties and controls may have a material adverse effect on us.
Our future success depends on our ability to select and purchase quality merchandise at attractive prices. While we have historically been able to locate and purchase quality merchandise at good prices, such merchandise may become subject to higher import taxes than currently apply. The Argentine government requires importers to maintain a balance of payments requiring them to export equivalent amounts of merchandise. In response to that we have succeeded in placing Argentine made products throughout our stores in the markets in which we operate. Since 2002 the Argentine government has imposed duties on the exports of various primary and manufactured products, including some of those that are sold in our stores. Such duties have undergone significant increases, reaching a maximum of 35% for certain items. We cannot assure you that there will not be further increases in the export taxes or the new export or import taxes or quotas will not be imposed by the government of Argentina or that similar measure could be taken by other countries in which we operate.
In addition, foreign trade policies, tariffs and other impositions and requirements on imported goods, which may depend on the product’s place of origin or on the product’s nature and specifications, as well as other factors relating to the foreign trade of the countries in which we operate are beyond our control and could result in difficulties in obtaining quality, low-cost merchandise from these countries and consequently could have a material adverse effect on us.
Labor relations may have a material adverse effect on us.
As of December 31, 2014, approximately 37.5% of our retail store employees were represented by unions under several collective bargaining agreements. Although we currently enjoy good relations with our employees and their unions, we have experienced labor strikes in the past and we cannot assure you that labor relations will continue to be positive or that deterioration in labor relations will not have a material adverse effect on us. See “Item 4. Information on the Company—B. Business Overview” and “Item 6.Directors, Senior Management and Employees—D. Employees.”
We could be harmed by a failure or interruption of our information technology or administrative systems.
We rely on our information technology and administrative systems to effectively manage our business data, communications, supply chain, pricing, order entry and fulfillment and other business processes. We use different world-class IT platforms in our retail and financial services segments in all countries in which we operate. Even advanced technology systems, however, are subject to defects, interruptions and breakdowns. The failure of our information technology or administrative systems to perform as we anticipate could disrupt our business and result in transaction errors, processing inefficiencies and the loss of sales and customers, which in turn could result in decreased revenue, increased overhead costs and excess or out-of-stock inventory levels resulting in a material adverse effect on us.
In addition, our information technology and administrative systems may be vulnerable to damage or interruption from circumstances beyond our control, including fire, natural disasters, systems failures, viruses and security breaches, including breaches
28
of our transaction processing or other systems that could result in the compromise of confidential customer data. Any such damage or interruption could have a material adverse effect on us, including as a result of our facing significant fines, customer notice obligations or costly litigation, harming our reputation with our customers or requiring us to expend significant time and expense developing, maintaining or upgrading our information technology or administrative systems, or preventing us from paying our suppliers or employees, receiving payments from our customers or performing other information technology or administrative services on a timely basis.
We are currently in the process of upgrading our IT infrastructure, during the implementation and transition period, we could face delays and unexpected challenges that could affect our operations.
Further, while we have some backup data-processing systems that could be used in the event of a catastrophe or a failure of our primary systems, we do not yet have an integrated disaster recovery plan nor a backup data center that covers all regions in which we operate. While we endeavor to prepare for failures of our network by providing backup systems and procedures, we cannot guarantee that our current backup systems and procedures will operate satisfactorily in the event of a regional emergency. Any substantial failure of our back-up systems to respond effectively or on a timely basis could have a material and adverse effect on us.
If we experience a data security breach and confidential customer information is disclosed, we may be subject to penalties and experience negative publicity, which could affect our customer relationships and have a material adverse effect on us.
We and our customers could suffer harm if customer information were accessed by third parties due to a security failure in our systems. The collection of data and processing of transactions require us to receive and store a large amount of personally identifiable data. This type of data is subject to legislation and regulation in various jurisdictions. Recently, data security breaches suffered by well-known companies and institutions have attracted a substantial amount of media attention, prompting U.S. state and federal legislative proposals addressing data privacy and security. If similar proposals are adopted in the countries in which we operate, we may be subject to more extensive requirements to protect the customer information that we process in connection with the purchases of our products.
In April 2014, we experienced a security breach whereby several company websites in Chile were attacked by an organized group of hackers. As a consequence of this most of the sites were taken offline. We experienced data breaches at two websites whereby access to our server was obtained, but with low impact and no client information was obtained. We have since made arrangements to remediate security weaknesses in our websites, including through testing security for our websites by a third party, strengthening security protocols and procedures providing relevant technical training to IT administrators, increasing periodic testing by third party specialized teams and engaging real-time monitoring security services for our critical websites in order to remain alert to any malicious activity. However, these events, as well as future security breaches, may diminish customers’ trust in us and harm our reputation, and expose us to potential liabilities.
We may become exposed to potential liabilities with respect to the data that we collect, manage and process, and may incur legal costs if our information security policies and procedures are not effective or if we are required to defend our methods of collection, processing and storage of personal data. Future investigations, lawsuits or adverse publicity relating to our methods of handling personal data could have a material adverse effect on our business, results of operations, financial condition and cash flows due to the costs and negative market reaction relating to such developments.
Chile, Argentina, Peru and Colombia are located in a seismically active region.
Chile, Argentina, Peru and Colombia are prone to earthquakes due to their location in the proximity of several major fault lines. A major earthquake, like the one that struck Chile in 2010, could have significant negative consequences for our operations and for the general infrastructure in Chile or any of the other countries that were abovementioned, such as roads, rail and access to goods. Even though we maintain insurance policies standard for this industry with earthquake coverage, we cannot assure you that a future seismic event will not have a material adverse effect on us.
Economic and social unrest in the countries where we operate and government measures to address them may adversely affect the regional economy and thereby have a material adverse effect on us.
Despite the economic recovery and relative stabilization since the early 2000’s, social and political tensions and high levels of poverty and unemployment continue throughout Latin America. If growth were to slow in the countries in which we operate, this could result in heightened political tension and protests, similar to the recent Agricultural strikes in Colombia, civil unrest in Brazil and Argentina). If these situations were to become widespread and government measures to reduce inequality failed, they could have an adverse effect on our business.
29
Development of our internet sales capabilities is subject to technology and other risks.
We are currently in the process of making significant enhancements to our internet sales capabilities, with the goal of solidifying internet sales as part of our business. However, we face competition from existing internet retailers, many of whom have more experience in distributing through the internet. Furthermore, we may experience system interruptions and delays that make our websites and services unavailable or slow to respond and prevent us from efficiently fulfilling orders, which may reduce our sales and the attractiveness of our products. The cost of upgrading our systems and network infrastructure, and taking any other steps to improve the efficiency of our internet retailing systems, may be substantial, and such initiatives may divert the time and attention of management.
Our computer and communications systems and operations could be damaged or interrupted by fire, flood, power loss, telecommunications failures, earthquakes, acts of war or terrorism, acts of God, computer viruses, physical or electronic break-ins, and similar events or disruptions. Any of these events could cause system interruption, delays, and loss of critical data, and could prevent us from accepting and fulfilling customer orders, which could make our product offerings less attractive and subject us to liability. Any of these events could damage our reputation, and accordingly, may have an adverse effect on our sales and results of operations.
Natural disasters could disrupt our business and affect our results of operations.
We are exposed to natural disasters in the countries where we operate such as earthquakes, volcanic eruptions, floods, tropical storms and hurricanes. In the event of a natural disaster, our disaster recovery plans may prove to be ineffective, which could have a material adverse effect on our ability to conduct our business, particularly if such an occurrence affects computer-based data processing, transmission, storage and retrieval systems or destroys customer or other data. In addition, if a significant number of our employees and senior managers were unavailable because of a natural disaster, our ability to conduct our business could be compromised. Natural disasters or similar events could also result in substantial volatility in our results for any fiscal quarter or year.
Chile’s recently enacted tax reform legislation may increase our operating and compliance costs.
On September 29, 2014, Chile enacted Law No. 20,780 (the “Tax Reform Act”). The Tax Reform Act introduced changes to the corporate tax rate, mandating a gradual increase of the rate from 20% to 25% or 27% in certain cases, the rules regarding minimum capitalization, and the taxation of Chilean investments abroad (the controlled-foreign-corporation rules), among others. The new rules are set to come into effect gradually, with the implementation process having commenced on October 1, 2014 and set to be completed by January 1, 2018. The effects of this tax reform may increase our operating and compliance costs, which could negatively affect our financial results and our ability to grow our business. Furthermore, we cannot assure you that the corporate income tax rates will not be raised further in the future resulting in a material adverse effect on us.
New tax reform legislation in Peru and Colombia may affect the operating results of, and reduce the amount of dividends we receive from, our Peruvian and Colombian subsidiaries.
In December 2014, Peru enacted Law No. 4007, reforming the national tax regime. The new law, which came into effect on January 1, 2015, mandates a gradual decrease in the corporate income tax rate but also an increase in the tax rates for dividends distributed by Peruvian companies to Chilean shareholders. As a result, the current tax rate applicable to Peruvian corporate income distributed to Chilean shareholders will increase from the current applicable rate of 34.1%, to 34.8% for 2015 and 2016, 35% for 2017 and 2018, and 35.3% for 2019 and onward. As a result, the new Peruvian tax regime is expected to decrease the amount of dividends we receive from our Peruvian subsidiaries.
In addition, in December 2014, Colombia’s legislative branch approved a tax reform bill that came into effect on January 1, 2015. According to the new tax bill, Colombian companies will have to pay an annual wealth tax (between 0.2% and 1.5%, depending on the taxable base) and a higher CREE income tax (3% surcharge for the 2015, 2016, 2017 and 2018 tax years). The resulting increase in the tax liability of our Colombian subsidiaries is expected to decrease the amount of income available for dividends.
Our growth in recent years has been due to a series of significant acquisitions and strong organic capital expenditures, imposing pressure on our procedures, controls and systems.
In recent years, we have grown our business through a series of acquisitions and strong organic capital expenditures, expanding our geographical business scope and increasing the size and complexity of our operations. As a consequence, our internal controls, systems and procedures may not be appropriate to support the scope and complexity of our operations. The existence of multiple legacy systems from the acquired operations and the complexities of the business integration process may adversely affect our Company. As part of the process of integrating the operations, systems, processes and controls that are part of the acquired businesses, we identified a material weakness in our internal control over financial reporting during 2013, which has since been remediated. See Item 15 Controls and Procedures.
30
There can be no assurance that other material weaknesses or significant deficiencies will not arise in the future, and if they do arise there could be a negative impact in investor confidence and in the reliability of our financial statements, which may result in a decline in our share price and/or lawsuits being filed against us by our shareholders, and we may have to incur increased costs in connection with hiring additional staff or implementing controls to remediate such material weakness.
Risks Related to Chile
Our growth and profitability depend on the level of economic activity in Chile and other markets.
36.3%, 36.9% and 38.5% of our revenues from ordinary activities in the years ended December 31, 2014, 2013 and 2012, respectively, were derived from revenues in Chile. Accordingly, our results of operations and financial condition are dependent to a significant extent on the level of economic activity in Chile. The Chilean economy has been influenced, to varying degrees, by economic conditions in other emerging market countries. We cannot assure you that the Chilean economy will continue to grow in the future or that future developments in or affecting the Chilean economy, including further consequences of economic difficulties in Brazil, Argentina and other emerging markets, will not have a material adverse effect on us.
In September 2008, the housing crisis in the United States sparked a series of financial institution failures throughout the globe. This resulted in a liquidity crisis and a reduction in growth of the global economy as financial institutions tightened risk policies and reduced lending to banks, corporations and individuals. Consequently, Chile was adversely affected by a strong decrease in growth during the fourth quarter of 2008 and during 2009 as its trading partners entered into recession, which affected local sales, employment levels, plans for investment and the price of exports. Lingering negative effects of the global recession may continue to adversely affect the Chilean economy and unfavorable general economic conditions could negatively affect the affordability of and demand for some of our products and services and our ability to access the capital markets. In difficult economic conditions, consumers may seek to reduce discretionary spending by forgoing purchases of some of our products, electing to use fewer higher-margin services or obtaining products and services under lower-cost programs offered by competitors. If any of these events were to occur, it could have a material adverse effect on us.
In spite of the recent growth of the Chilean economy, we cannot assure you that Chile’s economy will continue to grow in the future, nor can we assure you that future developments in or affecting the Chilean economy will not impair our ability to proceed with our business plan or have a material adverse effect on us.
Economic and political problems encountered by other countries may adversely affect the Chilean economy, and, as a result, our business and results of operations and the market value of our securities.
The prices of securities issued by Chilean companies are to varying degrees influenced by economic and market considerations in other countries. We cannot assure you that future developments in or affecting the Chilean economy, including consequences of economic difficulties in other markets, will not have a material adverse effect on us.
We are also directly exposed to risks related to the weakness and volatility of the economic and political situation in Asia, the United States, Europe, Brazil, Argentina and other nations. If these nations’ economic conditions deteriorate, the economy in Chile, as either a neighboring country or a trading partner, could also be affected and could experience slower growth than in recent years with possible adverse impact on our customers and suppliers. The crises and political uncertainties in other Latin American countries could also have an adverse effect on the Chilean economy, and, as a result, our results of operations and the market value of our securities.
Chile is currently involved in litigation at the international court at The Hague with its neighboring country Bolivia over its current borders. Chile was also involved in an international litigation with Peru regarding maritime borders, which was resolved in 2013 at the international court at The Hague, and has had other conflicts with neighboring countries in the past. We cannot assure you that crisis and political uncertainty in other Latin American countries will not have a material adverse effect on the Chilean economy, and, as a result, our results of operations and the market value of our securities.
The Chilean supermarket and department store industries show signs of saturation which could impair our ability to grow profitably in Chile.
We believe that in Santiago, the Chilean supermarket industry shows certain signs of saturation. As a result newly opened stores cannibalize the sales of existing stores to some extent. Our growth prospects in the Chilean food retailing sector are likely to depend to a large extent on future growth in Chilean GDP or acquisitions of other supermarket chains, and we cannot assure you that either will in fact occur. As a result, we cannot assure you that in the future we will be able to achieve real growth in same-store sales in Chile. We believe that the Chilean department store industry has also shown signs of saturation as a result of a very aggressive expansion in past years by the industry’s main participants.
31
In addition, good locations are increasingly difficult to find, particularly for our big-box stores. Most major retailers have locked up key mall properties and control large land banks, and as a result we have faced difficulties in finding acceptable sites because we are more likely to open mid- to large-size supermarkets. We may be vulnerable to the expansion by “small box” supermarkets, such as convenience stores, who may more readily find suitable properties.
Inflation and government measures to curb inflation may adversely affect the Chilean economy and have a material adverse effect on us.
Chile has experienced high levels of inflation in the past when compared to the country´s Central Bank inflationary target, including increases in the Chilean consumer price index of 7.8%, and 7.1%, in 2007 and 2008, respectively. Chile experienced deflation of 1.4% during 2009, inflation of 3.0% during 2010, inflation of 4.4% during 2011, inflation of 1.6% in 2012, inflation of 3.0% in 2013 and inflation of 4.4% in 2014 according to the Central Bank of Chile.
The measures taken by the Chilean Central Bank to control inflation have often included maintaining a tight monetary policy with high interest rates, thereby restricting the availability of credit and retarding economic growth. Inflation, measures to combat inflation and public speculation about possible additional actions have also contributed materially to economic uncertainty in Chile and to heightened volatility in its securities markets. Periods of higher inflation may also slow the growth rate of the Chilean economy, which could lead to reduced demand for our products and services and decreased sales. Inflation is also likely to increase some of our costs and expenses, given that the majority of our supply contracts are denominated inUnidades de Fomento or are indexed to the Chilean consumer price index, and we may not be able to fully pass any such increases on to our customers, which could have a material adverse effect on us. Furthermore, at December 31, 2014, approximately 22% of our outstanding debt was UF-denominated. As a result, severe increases in inflation could affect the Chilean economy and could have a material adverse effect on us.
Currency devaluations and foreign exchange fluctuations may have a material adverse effect on us.
The Chilean peso has been subject to large devaluations and appreciations in the past and could be subject to significant fluctuations in the future. The main driver of exchange rate volatility in the past years was the significant devaluations in other Latin American countries, mainly Brazil, as well as general uncertainty and trade imbalances in the global markets. In 2007, the Chilean peso appreciation was driven by an improvement in Chilean economic indicators and record commodities prices, together with a weak performance of the U.S. dollar. More recently, the primary driver of exchange rate volatility has been the substantial depreciation of Latin American currencies, including the Chilean peso, against the U.S. dollar. The value of the Chilean peso against the U.S. dollar may continue to fluctuate significantly in the future. See “Item 10. Additional Information—D. Exchange Controls—Foreign Exchange Controls—Chile” and “Item 3. Key Information—A. Selected Financial Data—Exchange Rates—Chile.”
Historically, a significant portion of our indebtedness has been denominated in U.S. dollars, while a substantial part of our revenues and operating expenses has been denominated in Chilean pesos. If the Chilean peso’s value declines against the dollar, we will need more Chilean pesos to repay the same amount of dollar-denominated debt. As a result, fluctuations in the Chilean peso to U.S. dollar exchange rate may affect us. As of December 31, 2014, after cross currency swaps and forward exchange agreements that fully hedge against the variation between the Chilean peso and the U.S. dollar, 11% of our net financial debt (bank loans and bonds) was denominated in U.S. dollars. The remainder of our interest-bearing debt is primarily UF- or Chilean peso-denominated and therefore not subject to exchange rate risk. Our hedging policy against foreign exchange fluctuations is disclosed in “Item 11. Quantitative and Qualitative Disclosure About Market Risk—Foreign Currency Risk.” We cannot assure you that our hedging policies will avoid future losses related to exchange rate variations.
In addition in February 2015 the company accessed the international debt markets through a dual-tranche bond issuance. This new issuance significantly increased Cencosud´s exposure to the U.S. dollar. Due to market depth constraints for the Chilean swap market Cencosud could be delayed in hedging its foreign currency exposure under this issuance in order to return to historical U.S. dollar debt levels after cross currency swaps.
Any significant currency devaluation or foreign exchange fluctuation in the future may adversely affect the performance of the Chilean economy and have a material adverse effect on us.
Chile has different corporate disclosure and accounting standards than those you may be familiar with in the United States.
Financial reporting and securities disclosure requirements in Chile differ in certain significant respects from those required in the United States. There are also material differences between IFRS and U.S. GAAP. Accordingly, the information about Cencosud S.A. available to you will not be the same as the information available to holders of shares issued by a U.S. company. In addition, the
32
Chilean Securities Market Law, which governs open or publicly listed companies, such as us, imposes disclosure requirements that are more limited than those in the United States in certain important respects. In addition, although Chilean law imposes restrictions on insider trading and price manipulation, applicable Chilean laws are different from those in the United States, and the Chilean securities markets are not as highly regulated and supervised as the U.S. securities markets.
Possible changes resulting from a proposed labor reform bill in Chile may have a material adverse effect on our operations and financial results.
On December 29, 2014 the executive branch of the Chilean government, led by President Michelle Bachelet, signed an extensive labor reform bill which was sent to the Chilean Congress for parliamentary proceedings and approval. In light of the executive branch of the Chilean government having majority support at both houses of the Chilean Congress, we expect that the proposed bill will be approved as drafted or under some amended form following debate of the bill in both houses.
Under the current draft the proposed bill contemplates several amendments to the existing labor framework in Chile, including, among other points: collective bargaining coverage is expanded to certain employees who were prevented from exercising this right, such as apprentices, temporary workers and others.
| | • | | Unions are recognized as the only party entitled to exercise the right to collectively bargain on behalf of the workers. |
| | • | | Benefits obtained by a union in the course of a negotiation are extended for the benefit of any worker joining that union after the negotiation has concluded. The extension of said benefits to employees would be contingent to the assent of each union. |
| | • | | Collective bargaining agreements currently in effect would constitute a floor for the negotiation of new conditions of employment. The financial situation of the company or business as of the date of discussions for a new agreement would not have any bearing on ongoing negotiations. |
| | • | | The employer’s right to replace those workers participating in a strike with current or new employees while the strike is taking place is curtailed and replaced with an obligation from unions to provide the personnel required to comply with “minimum services” through “emergency teams.” |
| | • | | Matters that may be subject to collective bargaining agreements are expanded, allowing the negotiation of more flexible workdays, adaptable systems and others. |
| | • | | Unions may annually request from large companies information regarding the remunerations and duties associated with each category of employees. |
Approval and implementation of the proposed bill, which increases the collective bargaining power of labor unions, or similar reforms may have adverse effects on our overall employment and operating costs and may increase the likelihood of business disruptions on our various activities in Chile, which could negatively affect our financial results and our ability to grow our business.
Risks Related to Argentina
Argentine economic and political conditions and perceptions of these conditions in international markets may have a direct impact on our business and our access to international capital markets, and could have a material and adverse effect on us.
24.7%, 25.7% and 27.9% of our revenues from ordinary activities in the years ended December 31, 2014, 2013 and 2012, respectively, were derived from revenues in Argentina and an important share of our land bank is located in Argentina. Accordingly, our results of operations and financial condition are affected to a significant extent by the level of economic activity in Argentina. The Argentine economy has experienced significant volatility in recent decades, characterized by periods of low or negative growth, high and variable levels of inflation and currency devaluation. Argentina’s sovereign credit default swap (CDS) spreads are currently among the highest in the world. In 2002, enactment of Law No. 25,561 (the “Public Emergency Law”) ended more than a decade of uninterrupted Argentine peso/U.S. dollar parity and the Argentine peso has fluctuated significantly since then. See “Item 10. Additional Information—D. Exchange Controls—Foreign Exchange Controls—Argentina” and “Item 3. Key Information—A. Selected Financial Data—Exchange Rates—Argentina.”
Although general economic conditions in Argentina have recovered significantly during recent years, there is uncertainty as to whether this growth is sustainable. This is mainly because the economic growth was initially dependent on a significant devaluation of the Argentine peso and a high excess production capacity derived after a long period of deep recession, and was favored by high commodity prices. The global economic crisis of 2008 has led to a sudden deceleration of the economy, accompanied by political and social unrest, inflationary and Argentine peso depreciation pressures and lack of consumer and investor confidence. According to theInstituto National de Estadísticas y Censos (the Argentine National Institute of Statistics and Census, or “INDEC”), Argentina’s gross domestic product, in real terms, grew by 0.1% in 2009, 9.4% in 2010 and is estimated to have grown 8.5%, 0.9% and 2.9% in 2011, 2012 and 2013, respectively while expanding 0.5% in 2014. We cannot assure you that GDP will increase or remain stable in the
33
future. Economic growth in Argentina could face challenges related to its balance of payments and levels of reserves during 2014. During 2013, foreign currency restrictions in Argentina became more stringent in a government effort to curb their drain. There is a high degree of uncertainty regarding Argentina´s future ability to access the international capital markets and the status of its negotiations with holdouts. The aforementioned factors in conjunction with less favorable prices for Argentina´s main agricultural exports could have a negative effect on economic growth and could have a material adverse effect on us.
Argentina’s limited ability to obtain financing from international markets and limited economic growth could have a material adverse effect on us.
Argentina’s 2001 default and its failure to fully restructure its sovereign debt and fully negotiate with the holdout creditors may limit Argentina’s ability to reenter the international capital markets. Litigation initiated by holdout creditors as well as claims with the International Centre for Settlement of Investment Disputes (ICSID) have resulted and may continue to result in judgments against the Argentine government which, if not paid, could prevent Argentina from obtaining credit from multilateral organizations. Judgment creditors have sought and may continue to seek attachment orders or injunctions relating to assets of Argentina that the government intended for other uses. As a result, the government may not have the financial resources necessary to implement reforms and foster economic growth, which, in turn, could have a material adverse effect on Argentina’s economy and, consequently, on us. Furthermore, Argentina’s inability to obtain credit could have a material adverse effect on our Argentine subsidiaries, including their ability to access international credit markets, either for working capital requirements or to repay their debt at maturity.
Adverse court rulings in the United States could have a material and adverse impact in the Argentine economy and us.
In 2012, holdouts from the 2001 Argentine debt-swap commenced legal proceedings against the Argentine Republic demanding full repayment of the principal amount owed under the issued notes and have made attempts to seize assets of Argentina held offshore. These holdouts were given a favorable court ruling on November 22, 2012 from the United States District Court for the Southern District of New York, who ordered Argentina to make repayments at the same pace it is repaying those who agreed to enter the 2001 debt-swap by enforcing thepari passuprovision under the issued notes. Argentina and holders who participated in the debt-swap are appealing the ruling. On September 3, 2013, the District Court granted requests made by plaintiffs for discovery on Argentina and the assets of certain financial institutions. Litigation by holdout creditors resulted in material judgments against the Argentine government and could result in attachments of or injunctions relating to assets of or deemed owned by Argentina, which could have a material adverse effect on the country’s economy.
Inflation may continue to increase, causing adverse effects on the Argentine long-term credit markets as well as the Argentine economy, its growth and our activities in Argentina.
After several years of price stability, the devaluation of the Argentine peso in January 2002 created pressures on the domestic price system that generated high inflation in 2002 before substantially stabilizing in 2003. However, consumer prices increased by 7.7% in 2009, 10.9% in 2010, 9.5% in 2011, 10.8% in 2012, 10.9% in 2013 and 24% in 2014 according to the INDEC, and private institutes estimate that consumer prices have increased significantly more than official estimates. A return to a high inflation environment would also undermine Argentina’s foreign competitiveness in international trade by diluting the effects of the Argentine peso devaluation and could have a material adverse effect on us.
Significant devaluation or appreciation of the Argentine peso against the U.S. dollar and other foreign currencies may adversely affect the Argentine economy, its growth and our activities in Argentina.
The depreciation of the Argentine peso in 2002 had positive effects on the competitiveness of certain sectors of the Argentine economy, but it also had a negative impact on the financial condition of Argentine businesses and individuals. The devaluation adversely affected the Chilean peso and the U.S. dollar value of our assets and earnings in Argentina and, thus, has had a negative effect on our financial condition. Moreover, the devaluation of the Argentine peso had a negative impact on the ability of Argentine businesses to honor their foreign currency-denominated debt, led to very high inflation initially, significantly reduced real wages, had a negative impact on businesses whose success is dependent on domestic market demand, and adversely affected the federal and provincial governments’ ability to honor their foreign debt obligations. If the Argentine peso experiences another significant devaluation, it may have a materially adverse effect on the local economy and on our business.
Furthermore, a substantial increase in the value of the Argentine peso against foreign currencies would adversely affect exports and could have a negative effect on the Argentine economy, with material and adverse consequences on us.
There are concerns about the accuracy of the Argentine INDEC’s measurements and thus its impact on us.
In January 2007, the INDEC modified its methodology used in calculating the consumer price index. At the same time, the Argentine government also replaced several key personnel at the INDEC, prompting complaints of government interference from the
34
technical staff at the INDEC. In addition, the IMF requested that the government clarify its inflation rates. In June 2008, the INDEC published a new consumer price index that eliminated nearly half of the items included in previous surveys and introduced adjustable weightings for fruit, vegetables and clothing, which have seasonal cost variations.
The new index has been criticized by economists and investors after its initial report found prices rising well below expectations. These events have affected the credibility of the consumer price index published by INDEC, as well as other index published by INDEC that use the consumer price index in their calculation, including the poverty index, the unemployment index and real GDP. On February 1, 2013 Argentina became the first member nation of the IMF to be censured due to concerns that it may be underreporting inflation and GDP figures. The IMF gave Argentina a deadline of September 29, 2013 to take “remedial measures” to boost the accuracy of the data provided. In January 2014 the Argentine government revealed a new inflation index based on a new calculation methodology. The IMF reacted cautiously to the index stating that it would continue to review progress made by the Republic of Argentina revising inflation and gross domestic product statistics later in the year. The new measure revealed consumer prices increased at a 24% rate in 2014.
Intervention by the Argentine government in the Argentine economy has increased and may have a direct impact on our prices and sales.
The Argentine government has in the past set certain industry market conditions and prices. In March 2002, the Argentine Government fixed the price for milk after a conflict among producers. Further government intervention in the economy could have an adverse effect on the levels of foreign investment in Argentina, Argentine companies’ access to international capital markets and trade and diplomatic relations between Argentina and other countries, which in turn could result in a material adverse effect on Argentina’s economy and, therefore, our business, financing capabilities, results of operations and financial condition. We cannot assure you that the Argentine government will not interfere in other areas in the retail industry in which we operate by setting prices or regulating other market conditions. Accordingly, we cannot assure you that the prices or other market conditions that the Argentine government might impose will allow us to freely negotiate the prices of our products, all of which could have a material adverse effect on us.
Currently price controls in the Republic of Argentina are enforced under the “Precios Cuidados” program, an agreement between the government and retailers. This program reflects the basic basket of products for the country´s population and as of April 12, 2014 is comprised of 308 products in supermarkets and 113 products in the home improvement industry. If these programs were to be expanded, they could have a materially adverse effect on us.
Economic and social unrest in Argentina and government measures to address them may adversely affect the Argentine economy and thereby have a material adverse effect on us.
Despite the economic recovery and relative stabilization since 2003, social and political tensions and high levels of poverty and unemployment continue. In 2008, Argentina faced nationwide strikes and protests from farmers due to increased export taxes on agricultural products, which disrupted economic activity and have heightened political tensions. In November 2013, there were massive protests against the government. Provincial police forces in Cordoba and other provinces went on strike. The social unrest increased during the last months of 2013, and in December 2013, there were new riots and lootings to shops and supermarkets in various cities around the country. In addition to new spontaneous public protests against the government, the agricultural sector and some workers´ unions called for new strikes. In December 2013 our distribution center in the Argentine city of Cordoba was stormed and damaged in the course of civil unrest that was occurring in the city as a result of a civil servant strike. While the distribution center has been restored, with losses partially covered by our insurance, if such civil unrest were to occur again it may have an effect on our business, results of operations and financial condition.
Future government policies to preempt, or respond to, social unrest may include expropriation, nationalization, forced renegotiation or modification of existing contracts, suspension of the enforcement of creditors’ rights and shareholders’ rights, increase in export taxes, new taxation policies, including royalty and tax increases and retroactive tax claims, and changes in laws, regulations and policies affecting foreign trade and investment. For example, on April 16, 2012, the Argentine government announced its intention to expropriate YPF S.A. (“YPF”), the largest oil and gas company in Argentina, which was controlled by Repsol YPF S.A., a Spanish integrated oil and gas company. On May 4, 2012 the Argentine Congress approved the expropriation of 51% of YPF’s capital stock. The nationalized capital stock was distributed as follows: 49% to certain Argentine provinces and the remaining 51% to the national government. The Argentine government has compensated Repsol SA for the expropriation of its interests in the abovementioned company. These policies could destabilize the country, both socially and politically, and have a material adverse effect on the Argentine economy and other Latin American economies and, consequently, on us.
35
The Argentine government may order salary increases to be paid to employees in the private sector, which would increase our operating costs.
In the past, the Argentine government has passed laws, regulations and decrees requiring companies in the private sector to maintain minimum wage levels and provide specified benefits to employees and may do so again in the future. In the aftermath of the Argentine economic crisis, employers both in the public and private sectors have experienced significant pressure from their employees, unions and labor organizations to increase wages and to provide additional employee benefits. Due to the high levels of inflation, the employees and labor organizations have begun again demanding significant wage increases. It is possible that the Argentine government could adopt measures mandating salary increases and/or the provision of additional employee benefits, including mandatory profit sharing, in the future. Any such measures could have a material adverse effect on us.
Argentine lease laws impose restrictions that limit our flexibility.
Argentine laws governing leases impose certain restrictions, including prohibition of inflation adjustment clauses, mandatory minimum and maximum duration, and statutory tenants’ rights to rescind commercial lease agreements after the initial six months. These restrictions could have a material adverse effect on our Argentine operations. In the past, in response to housing shortages, high rates of inflation and difficulties in obtaining credit, the Argentine government imposed more strict and burdensome regulations regarding leases. Such regulations limited or prohibited increases on rental prices and prohibited eviction of tenants, even for failure to pay rent. We cannot assure you that the Argentine government will not impose similar or more stringent regulations in the future, any of which could have a material and adverse effect on us.
Exchange controls could restrict the inflow and outflow of funds in Argentina and may have a material adverse effect on us.
In 2001 and 2002, the Argentine government implemented a number of monetary and currency exchange control measures that included restrictions on the withdrawal of funds deposited with banks and stringent restrictions on the outflow of foreign currency from Argentina, including funds for purposes of paying principal and interest on debt and distributing dividends.
Although many of these restrictions have been eased in some respects, some restrictions on the transfer of funds from Argentina (e.g., to make payments of principal and interest) still remain in effect and other controls on capital inflows have been established. Further, similar or new restrictions relating to the purchase of foreign currency and its transfer abroad for the payment of dividends, which were significantly eased in 2003, could be reinstated in the future. If that were to occur, we may default in the payment of external debt obligations from Argentina, we may not be able to fund and/or finance our operations in Argentina, and/or we may not be able to distribute dividends from Argentina, which could have a material adverse effect on us. These existing controls and restrictions on the foreign exchange market in Argentina, as well as any additional restrictions that may be imposed in the future, could impair our ability to transfer funds generated by our Argentine operations in U.S. dollars outside Argentina to fund the payment of dividends or other amounts, including payments required to be made by our Argentine subsidiaries to foreign creditors in respect of the guarantee of outstanding obligations denominated in U.S. dollars.
In addition, pursuant to Resolutions AFIP N° 3210/2011 and N° 3212/2011 and Communication “A” 5245, enacted in late 2011, prior to authorizing the sale of foreign currency to make portfolio investments abroad or similar investments, the local bank must obtain prior clearance from an online database run by the Argentina federal tax authority (Administración Federal de Ingresos Públicos, or “AFIP”). This database must confirm whether an individual or entity has sufficient declared assets or funds to make the purchase of foreign currency. In the event that such declared assets or funds are not sufficient, the bank may not sell foreign currency to such individual or entity. This requirement may affect the ability of our Argentine subsidiaries to make or manage their foreign currency investments or to transfer funds abroad. See also “Item 10. Additional Information—D. Exchange Controls—Foreign Exchange Controls—Argentina” and “Item 3. Key Information—A. Selected Financial Data—Exchange Rates—Argentina.”
We may experience significant adverse effects from delays or restrictions on our ability to receive imported products.
The National Industry Ministry recently issued several resolutions implementing various governmental measures to restrict imports, including the application of non-tariff barriers to imports, such as non-automatic licenses (which are not subject to an obligation of being granted) introducing the obligation to file import products certificates.
Pursuant to General Resolution 3252, theAdministración Federal de Ingresos Públicos(AFIP) implemented (effective from February 1, 2012) a system whereby, prior to issuing purchase orders (or any similar document), importers must complete aDeclaración Jurada Anticipada de Importación(“Advanced Sworn Import Affidavit”), so that information is available in a registry of imports in order to comply with import requirements for companies and foreign trade operators. As a result of these and other measures, certain sectors have experienced difficulties or delays in importing products into Argentina. Such restrictions or delays could have a material adverse effect on the domestic Argentine market, production, consumption levels and the Argentine economy.
36
Risks Related to Brazil
Brazilian economic and political conditions and perceptions of these conditions in international markets have a direct impact on our business and our access to international capital and debt markets and could have a material adverse effect on us.
In the years ended December 31, 2014, 2013, and 2012 our operations in Brazil represented 20.1% 19.8% and 23.5% of our consolidated revenues from ordinary activities for such periods, respectively. Accordingly, our financial condition and results of operations are dependent on economic conditions in Brazil. The Brazilian economy has experienced significant volatility in recent decades, characterized by periods of low or negative growth, high and variable levels of inflation and currency devaluation. Brazil’s gross domestic product, in real terms, decreased 0.3% in 2009, grew 7.5% in 2010, 2.9% in 2011 and 1.9% in 2012, according to the Central Bank of Brazil. The Brazilian central bank currently estimates gross domestic product experienced expansion of approximately 2.3% in 2013, and a decrease of 0.2% in 2014. We cannot assure you that GDP will increase or remain stable in the future. Future developments in the Brazilian economy may affect Brazil’s growth rates and, consequently, the consumption of our products. As a result, these developments could have a material adverse effect on us.
Historically, Brazil’s political situation has influenced the performance of the Brazilian economy, and political crises have affected the confidence of investors and the general public, which resulted in economic deceleration and heightened volatility in the securities issued abroad by Brazilian companies. Future developments in policies of the Brazilian government and/or the uncertainty of whether and when such policies and regulations may be implemented, all of which are beyond our control, could have a material adverse effect on us.
Changes in Brazilian tax laws may increase our tax burden.
The Brazilian government frequently implements changes to tax regimes that may affect us and our customers. These changes include changes in prevailing tax rates and, occasionally, enactment of temporary taxes, the proceeds of which are earmarked for designated governmental purposes. Some of these changes may result in increases in our tax payments, which could adversely affect industry profitability and increase the prices of our products, restrict our ability to do business in our existing and target markets and have a material adverse effect on us. We cannot assure you that we will be able to maintain our projected cash flow and profitability following any increases in Brazilian taxes applicable to us.
The Brazilian government has exercised, and continues to exercise, significant influence over the Brazilian economy.
The Brazilian government frequently intervenes in the Brazilian economy and occasionally makes significant changes in policies and regulations. The Brazilian government’s actions to control inflation and other policies and regulations have often involved, among other measures, increases in interest rates, changes in tax policies, price controls, currency devaluations, capital controls and limits on export and imports. We may be materially and adversely affected by changes in policies or regulations involving or affecting factors such as:
| | • | | exchange controls and restrictions on remittances abroad; |
| | • | | liquidity of domestic capital and financial markets; |
| | • | | other political, social and economic policies or developments in or affecting Brazil. |
Uncertainty over whether the Brazilian government will implement changes in policies or regulations affecting these or other factors in the future may contribute to economic uncertainty in Brazil. As a result, these uncertainties and other future developments in the Brazilian economy may have a material adverse effect on us.
Inflation, and the Brazilian government’s measures to combat inflation, may generate economic uncertainty in Brazil.
Brazil has historically experienced high rates of inflation. In the recent past, inflation, as well as government efforts to combat inflation have had significant negative effects on the Brazilian economy and contributed to heightened volatility in the Brazilian securities market. The Brazilian government’s measures to control inflation have often included maintaining a tight monetary policy with high interest rates, thereby restricting the availability of credit and reducing economic growth. As a result, interest rates have
37
fluctuated significantly. The Special System for Settlement and Custody (Sistema Especial de Liquidação e Custódia, or “SELIC”) interest rate in Brazil at December 31 was 7.25% in 2012, 10.0% in 2013 and 11.75% in 2014, as determined by the Central Bank of Brazil’s Monetary Policy Committee (Comitê de Política Monetária do Banco Central).
Brazilian government actions, including interest rate changes, intervention in the foreign exchange market, fiscal policy expansion and actions to adjust or fix the value of the Real may trigger increases in inflation. If Brazil experiences substantial inflation in the future, the consequences may include greater economic uncertainty and increased costs for us, which may have a material adverse effect on us.
Exchange rate instability may adversely affect the Brazilian economy and us.
The Brazilian currency has historically suffered frequent fluctuations. In the past, the Brazilian government has implemented various economic plans and adopted a number of exchange rate policies, including sudden devaluations, periodic mini-devaluations (during which the frequency of adjustments has ranged from daily to monthly), floating exchange rate systems, exchange controls and dual exchange rate markets. There have often been significant fluctuations in the exchange rate between the Brazilian currency, the U.S. dollar, the euro and other currencies. This volatility may affect our consolidated financial statements, due to the growing importance of our Brazilian operations in our business portfolio, which could have a material adverse effect on us. See “Item 10. Additional Information—D. Exchange Controls—Foreign Exchange Controls—Brazil” and “Item 3. Key Information—A. Selected Financial Data—Exchange Rates—Brazil.”
Our business in Brazil is subject to governmental regulation.
Our Brazilian operations are subject to a variety of national, state, and local laws and regulations, including environmental, agricultural, health and safety and labor laws. We invest financial and managerial resources to comply with these laws and related permit requirements. Our failure to do so could subject us to fines or penalties, enforcement actions, claims for personal injury or property damages, or obligations to investigate and/or remediate damage or injury. Moreover, if applicable laws and regulations, or the interpretation or enforcement thereof, become more stringent in the future, our capital or operating costs could increase beyond what we currently anticipate, and the process of obtaining or renewing licenses for our activities could be hindered or even opposed by the competent authorities.
The regular operation of our stores and distribution centers depend on public services, including electricity, and the implementation of broad electricity conservation plans as a result of unfavorable hydrological or other factors could have a negative effect on consumer demand and also have a materially adverse effect on our operations and inventory management.
Brazil’s power generation sector relies on, among others, hydroelectric plants, whose generation levels are affected by prevailing hydrological conditions, which are dependent on rainfall levels and heat levels. If hydrological conditions result in a low supply of electricity in Brazil, that could cause, among other things, the implementation of broad electricity conservation programs, including mandatory reductions in electricity generation or consumption. The most recent period of extremely low rainfall in a large portion of Brazil was in the years immediately prior to 2001, and as a result, the Brazilian Government instituted a program to reduce electricity consumption from June 1, 2001 to February 28, 2002. Hydrological conditions in late 2007 and early 2008 have also been poor, particularly impacting reservoir levels in the northeastern and southeastern regions of Brazil. More recently, Brazil has experienced record heat levels in January 2014 which, coupled with a prolonged lack of rain, have left hydroelectric reservoirs at low levels. The recurrence in the future of unfavorable hydrological conditions could lead to the implementation of broad electricity conservation programs. In the event of electricity shortages, our operations and inventory management could be materially and adversely affected. This may in turn adversely affect our financial conditions and results from operations.
Risks Related to Peru
Economic, social and political developments in Peru, including political instability, inflation and unemployment, could have a material adverse effect on us.
Our operations in Peru represented 8.7%, 7.9% and 8.3% in 2014, 2013 and 2012, respectively, of our consolidated revenues from ordinary activities. Our results of operations and financial condition may be affected by changes in economic and other policies of the Peruvian government, which has exercised and continues to exercise substantial influence over many aspects of the private sector, and by other economic, social and political developments in Peru, including devaluation, currency exchange controls and economic growth. Previous Peruvian governments have imposed controls on prices, exchange rates, local and foreign investment and international trade, restricted the ability of companies to dismiss employees, expropriated private sector assets and prohibited the remittance of profits to foreign investors.
38
In the past, Peru has suffered through periods of high inflation, which materially undermined the Peruvian economy and the government’s ability to create conditions that would support economic growth. A return to a high inflation environment would also undermine Peru’s foreign competitiveness, with negative effects on the level of economic activity and employment and on us.
A devaluation of Peru’s currency or unexpected changes in exchange controls could have a material adverse effect on us.
The Peruvian currency has historically experienced a significant number of devaluations and, as a result, the Peruvian government has adopted and operated under various exchange rate control practices and determination policies, ranging from strict control to market determination of exchange rates. More recently, the Nuevo Sol appreciated against the U.S. dollar by 8.0% in 2009, 2.8% in 2010, 4.1% in 2011 and 5.7% in 2012 and depreciated against the U.S. dollar by 9.6% in 2013 and 6.7% in 2014. As the Peruvian economy is partially dollarized, devaluation of the Nuevo Sol against the U.S. dollar could have a negative impact on the economy. Therefore, any significant devaluation of the Nuevo Sol against the U.S. dollar could have a material adverse effect on us.
Risks Related to Colombia
We are highly dependent on economic and political conditions in Colombia in connection with our supermarket and retail operations in Colombia.
As a result of our acquisition of supermarket operation in Colombia, the Colombian market has become a significant part of our supermarket business and related results of operations. Colombia has suffered periods of significant economic and political instability in the past. Colombia represented 10.2%, 9.7% and 1.8% of total consolidated revenues for 2014, 2013 and 2012, respectively.
Our revenues earned from our operations in Colombia depend to a significant extent on macroeconomic and political conditions in Colombia. Decreases in the growth rate, periods of negative growth, changes in law, increases in inflation, changes in regulation or policy, or future judicial rulings and interpretations of policies involving exchange controls and other matters, such as (but not limited to) currency depreciation, interest rates, inflation, taxation, banking laws and regulations and other political or economic developments, in or affecting Colombia may affect the overall business environment and could, in turn, impact our financial condition and results of operations.
Colombia’s fiscal deficit and growing public debt could adversely affect the Colombian economy. The Colombian fiscal deficit was 4.0% of GDP in 2012, 4.5% of GDP in 2013 and 3.5% in 2014.
Despite the recovery of Colombia’s economy over the past several years, we cannot assure you that such growth and relative stability will be sustained. If the condition of the Colombian economy were to deteriorate, we would likely be adversely affected.
The Colombian government frequently intervenes in Colombia’s economy and from time to time makes significant changes in monetary, fiscal and regulatory policy. Our business and results of operations and financial condition may be adversely affected by changes in government or fiscal policies, and other political, diplomatic, social and economic policies that may affect Colombia. We cannot predict what policies will be adopted by the Colombian government and whether those policies would have a negative impact on the Colombian economy or our business and financial performance.
The Colombian government and the Colombian Central Bank may seek to implement new policies aimed at controlling further fluctuation of the Colombian peso against the U.S. Dollar and fostering domestic price stability. The Colombian Central Bank may impose certain mandatory deposit requirements in connection with foreign-currency denominated loans obtained by Colombian residents, including us. Although no mandatory deposit requirement is currently in effect, a mandatory deposit requirement was set at 40% in 2008 after the Colombian peso appreciated against foreign currencies. We cannot predict or control future actions by the Colombian Central Bank in respect of such deposit requirements, which may involve the establishment of a different mandatory deposit percentage. The use of such measures by the Colombian Central Bank may be a disincentive for us to obtain loans denominated in a foreign currency. We cannot predict the effects that such policies will have on the Colombian economy. In addition, we cannot assure you that the Colombian peso will not depreciate or appreciate relative to other currencies in the future.
Our assets located in Colombia are subject to various risks associated with emerging market countries, such as Colombia.
Asset ownership in Colombia, as is the case in other emerging market countries, is subject to political, economic and other uncertainties, including expropriation, nationalization, renegotiation or nullification of existing contracts, currency exchange restrictions and international monetary fluctuations. We cannot assure you that our operating results will not be affected by the occurrence of any such events.
39
Colombian government policies will likely significantly affect the economy and, as a result, our business and operations in Colombia.
The Colombian government has historically exercised substantial influence over the Colombian economy, and its policies are likely to continue to have an important effect on our operations in Colombia. Our business in Colombia could be adversely affected by changes in policy, or future judicial interpretations of such policies, involving exchange controls and other matters such as currency devaluation, inflation, interest rates, taxation, regulations and other political or economic developments in or affecting Colombia.
Although Colombia has maintained stable economic growth since 2003 and an inflation rate below 8% during the last 10 years, in the past, economic growth has been negatively affected by lower foreign direct investment and high inflation rates and the perception of political instability. We cannot assure you that growth achieved in recent years by the Colombian economy will continue in future periods. If the perception of improved overall stability in Colombia deteriorates or if foreign direct investment declines, the Colombian economy may face a downturn, which could negatively affect our results of operations.
Colombia’s economy remains vulnerable to external shocks that could be caused by its major regional trading partners experiencing significant economic difficulties or by more general “contagion” effects, which could have a material adverse effect on Colombia’s economic growth and its ability to service its debt.
The Colombian government has indicated that tightening credit conditions in financial markets could have a potential, although limited, negative impact on Colombian economy mainly through lower foreign direct investment flows. A significant decline in the economic growth of any of Colombia’s major trading partners, such as the United States and Venezuela, could have a material adverse impact on Colombia’s balance of trade and adversely affect Colombia’s economic growth. According to the Colombian Ministry of Commerce, the United States is Colombia’s largest export market. Colombia was the United States’ 22nd largest supplier of goods imports in 2013. U.S. goods imports from Colombia totaled $21.6 billion in 2013, a 12.2% decrease ($3.0 billion) from 2012, but up 239% from 2003. U.S. imports from Colombia are down 6.5% since 2011 (pre-FTA). U.S. imports to Colombia accounted for 1.0% of overall imports in 2013. A decline in U.S. demand could have a material adverse effect on Colombian exports and Colombia’s economic growth, which could, in turn, likely have detrimental results on our business activities. Colombia’s volatile diplomatic relations with Venezuela, Colombia’s major trading partner of non-traditional products, and Venezuela’s recent political crisis may adversely affect the levels of Colombian exports to Venezuela.
Colombia has experienced several periods of violence and instability and such violence instability could affect the economy and our operations.
Colombia has experienced several periods of criminal violence over the past four decades, primarily due to the activities of guerilla, paramilitary groups and drug cartels. In remote regions of the country, where governmental presence is minimal, these groups have exerted influence over the local population and funded their activities by protecting and rendering services to drug traffickers. In response, the Colombian government has implemented various security measures and has strengthened its military and police forces, including the creation of specialized units. Despite these efforts, drug-related crime and guerrilla and paramilitary activity continue to exist in Colombia. Any possible escalation in the violence associated with these activities may have a negative impact on the Colombian economy in the future. In the context of any political instability, allegations have been made against members of the Colombian government concerning possible ties with paramilitary groups. These allegations may have a negative impact on the Colombian government’s credibility, which could in turn have a negative impact on the Colombian economy or our operations there in the future.
Colombia’s diplomatic relations with Venezuela and Ecuador may affect the Colombian economy and, consequently, our results of operations and financial condition.
Diplomatic relations with Venezuela and Ecuador, two of Colombia’s main trading partners, have from time to time been tense, and have been affected by events surrounding the armed conflict with the Revolutionary Armed Forces of Colombia, or the FARC (Fuerzas Armadas Revolucionarias de Colombia), particularly on Colombia’s borders with Venezuela and Ecuador. Any further deterioration in relations of Colombia with Venezuela and Ecuador may result in the closing of borders, the imposition of trade barriers or a breakdown of diplomatic ties, any of which could have a negative effect on Colombia’s trade balance, economy and national security, which may adversely affect our results of operations.
Natural disasters in Colombia could disrupt our business and affect our results of operations in Colombia.
We are exposed to natural disasters in Colombia, such as earthquakes, volcanic eruptions, floods, tropical storms and hurricanes. In the event of a natural disaster, our disaster recovery plans may prove to be ineffective, which could have a material adverse effect on our ability to conduct our business in Colombia, particularly if such an occurrence affects computer-based data processing, transmission, storage and retrieval systems or destroys customer or other data. In addition, if a significant number of our employees
40
and senior managers were unavailable because of a natural disaster, our ability to conduct our business could be compromised. Natural disasters or similar events could also result in substantial volatility in our results of our Colombian operations for any fiscal quarter or year.
Our Colombian operations are subject to regulation.
The supermarket business in Colombia is mainly regulated by the Colombian Consumer Protection Bureau and the free market. Nevertheless, the Colombian Superintendence of Industry and Commerce (the “Superintendencia de Industria y Comercio”) acts as the supervisory agency for the enforcement of regulations issued by the Colombian Consumer Protection Bureau. The Colombian Ministry of Industry and Tourism also plays an import role in the industry as it has within its reach ability to take any required measure to ensure the protection of the local market for domestic industry. In the past the ministry has relied on a wide array of measures to achieve this goal which have included the creation of product specific duties or price controls.
Furthermore, all corporations are regulated by the Colombia Superintendence of Corporations (“Superintendencia de Sociedades”). This government body oversees and approves corporate events such as mergers, acquisitions and bankruptcies. All corporations under the scope of this body in Colombia must file annual financial statements therewith.
New or higher taxes resulting from changes in tax laws and regulations in Colombia or the interpretation thereof could adversely affect our results of operations in Colombia.
The enactment of new tax laws and regulations, and uncertainties with respect to the application or interpretations of future tax policies, pose risks to us. In recent years, Colombian tax authorities have imposed additional taxes in a variety of areas, such as taxes on financial transactions and other taxes on net worth, have modified income tax withholding rates and have eliminated certain tax benefits.
The Colombian government could seize or expropriate our assets under certain circumstances.
Pursuant to Article 58 of the Colombian constitution, the Colombian government may exercise its eminent domain powers in respect of our assets in the event such action is required in order to protect the public interest. According to Law 388 of 1997, the eminent domain power may be exercised through: (i) an ordinary expropriation proceeding (expropiación ordinaria), (ii) an administrative expropriation proceedings (expropriación administrativa) or (iii) an expropriation for war reasons (expropiación en caso de guerra). In all cases, we would be entitled to a fair indemnification for the expropriated assets as described below. Also, as a general rule, indemnification must be paid before the asset is effectively expropriated.
Under an ordinary expropriation proceeding, the Colombian government may expropriate any asset. Before expropriating, the Colombian government must offer to purchase the asset from its owner at market value as determined by an independent appraiser. If no agreement is reached by the parties after 30 days of such offering, the Colombian government may initiate a judicial procedure. Under the procedure, the relevant court would decide on the validity of the expropriation and the amount of the indemnification.
An administrative expropriation proceedings may occur when the factors supporting the expropriation represent an imminent risk affecting public interest. Before conducting an administrative expropriation, the Colombian government must offer to purchase the asset from its owner at market value as determined by an independent appraiser. If no agreement is reached by the parties after 30 days of such offering, the Colombian government may expropriate the asset directly (i.e., without having to conduct a judicial proceeding) and establish the indemnification amount based on the asset’s market value. After the expropriation, the parties may challenge the validity of the expropriation and the amount of the indemnification granted through a judicial process.
In an expropriation by reason of war, the Colombian government may expropriate personal property without the need to pay any indemnification prior to the expropriation and temporarily occupy real property for as long as national security matters require. Possession of real property expropriated must be returned to its original owner once the necessity for expropriation by reason of war ceases to exist.
Exchange rate fluctuations could adversely affect the Colombian economy, and therefore, us.
The Colombian peso is a highly volatile currency that has been subject to significant devaluations and appreciations in the past and may be subject to similar fluctuations in the future. A significant devaluation or appreciation of the Colombian peso in relation to the U.S. dollar could adversely affect the Colombian economy and, as a result, our operating results.
41
High rates of inflation may have an adverse impact us.
Rates of inflation in Colombia have been historically high, and we cannot assure you that inflation will not return to high levels. Inflation rates were 2.4% for 2012, 1.9% for 2013 and 4.56% for 2014. Inflationary pressures may, among other things, reduce consumers’ purchasing power and we cannot assure you that measures taken by the Colombian government and Colombian Central Bank will suffice to curb inflation. A return to high inflation in Colombia may harm our results of operations.
Risks Related to our Shares and the ADSs
Our ADSs have a limited trading history and market volatility may affect our stock price and the value of your investment.
Our ADSs began to trade on the New York Stock Exchange on June 22, 2012, and as a result have a limited trading history. We cannot predict the extent to which investor interest in our company will maintain an active trading market on the NYSE, or how liquid that market will be in the future. The market price of our ADSs may be volatile and may be influenced by many factors, some of which are beyond our control, including:
| | • | | the failure of financial analysts to cover the ADSs or our common stock or changes in financial estimates by analysts; |
| | • | | actual or anticipated variations in our operating results or the operating results of our competitors; |
| | • | | changes in financial estimates by financial analysts, or any failure by us to meet or exceed any such estimates, or changes in the recommendations of any financial analysts that elect to follow the ADSs or shares of common stock or the shares of common stock of our competitors; |
| | • | | announcements by us or our competitors of significant contracts or acquisitions; |
| | • | | future sales of the ADSs and shares of common stock, including sales by our controlling shareholder; |
| | • | | investor perceptions of us and the industries in which we operate; |
| | • | | failure of any of our initiatives to achieve commercial success; |
| | • | | fluctuations in stock market prices and trading volumes of securities of similar companies; |
| | • | | general market conditions and overall fluctuations in U.S. equity markets; |
| | • | | changes in our financial guidance to investors and analysts; |
| | • | | delays in, or out failure to provide financial guidance; |
| | • | | additions or departures of any of our key personnel; |
| | • | | changes in accounting principles or methodologies; |
| | • | | changing legal or regulatory developments in the United States and other countries, including the countries in which we operate; and |
| | • | | discussion of us or our stock price by the financial press and in online investor communities. |
In addition, the stock market in general has experienced substantial price and volume fluctuations that have been unrelated to the operating performance of particular companies affected. These broad market and industry factors may materially harm the market price of the ADSs and shares of common stock, regardless of our operating performance. In the past, following periods of volatility in the market price of certain companies’ securities, securities class-action litigation has been instituted against these companies. Such litigation, if instituted against us, could result in substantial expenses and the diversion of our management’s attention from our business, and could have a material adverse effect on us.
There may be a lack of liquidity and market for our shares of common stock and the ADSs in Chile.
Our shares of common stock are listed and traded on the Santiago Stock Exchange, the Chile Electronic Stock Exchange and the Valparaíso Stock Exchange, which we collectively refer to as the “Chilean Stock Exchanges.” Although ADS holders are entitled to withdraw shares of common stock underlying the ADSs from The Bank of New York Mellon (the “Depositary”) at any time, the Chilean Stock Exchanges are substantially smaller, less liquid and more volatile than major securities markets in the United States. Although our shares of common stock are traded on the Chilean Stock Exchanges, there can be no assurance that a liquid trading market for our shares of common stock will continue to exist. As of the date of this annual report, our non-controlling shareholders hold approximately 39% of our outstanding shares of common stock. A limited trading market in general and our concentrated ownership in particular may impair the ability of an ADS holder to sell in the Chilean market any shares of common stock obtained upon withdrawal of such shares from the ADS facility in the amount and at the price and time such holder desires, and could increase volatility of the price of the ADSs.
42
Holders of ADSs may find it difficult to exercise voting rights at our shareholders’ meetings.
Holders of ADSs will not be direct shareholders of our company and will be unable to enforce directly the rights of shareholders under ourestatutos (“Bylaws”) and the laws of Chile. Holders of ADSs may exercise voting rights with respect to the shares of common stock represented by ADSs only in accordance with the deposit agreement governing the ADSs. Holders of ADSs will face practical limitations in exercising their voting rights because of the additional steps involved in our communications with ADS holders. Holders of our shares of common stock will be able to exercise their voting rights by attending a shareholders’ meeting in person or voting by proxy. By contrast, holders of ADSs will receive notice of a shareholders’ meeting by mail from the Depositary following our notice to the Depositary requesting the Depositary to do so. To exercise their voting rights, holders of ADSs must instruct the Depositary on a timely basis on how they wish to vote. This voting process necessarily will take longer for holders of ADSs than for holders of our common stock. If the Depositary fails to receive timely voting instructions for all or part of the ADSs, the Depositary will assume that the holders of those ADSs are instructing it to give a discretionary proxy to a person designated by us to vote with respect to their ADSs, except in limited circumstances.
Holders of ADSs also may not receive the voting materials in time to instruct the Depositary to vote the common stock underlying their ADSs. In addition, the Depositary and its agents are not responsible for failing to carry out voting instructions of the holders of ADSs or for the manner of carrying out those voting instructions. Accordingly, holders of ADSs may not be able to exercise voting rights, and they will have little, if any, recourse if the shares of common stock underlying their ADSs are not voted as requested.
The significant control over the majority of our shares by our founding shareholder may have a material adverse effect on the future market price of the ADSs and our shares of common stock.
We are currently controlled by our founder, Mr. Horst Paulmann, who beneficially owns and controls 58.5% of our shares, through Inversiones Quinchamali Ltda., Inversiones Latadía Ltda. and Inversiones Tano Ltda, as of the date of this annual report. A disposition by our controlling shareholder of a significant number of our shares, or the perception that such a disposition might occur, could materially and adversely affect the trading price of our shares of common stock on the Santiago Stock Exchange as well as the market price of the ADSs on the New York Stock Exchange.
Our controlling shareholder is able to exercise significant control over our company, and also controls a significant minority interest in many of our international subsidiaries which could result in conflicts of interest.
Our controlling shareholder is in a position to direct our management and to determine the result of substantially all matters to be decided by majority vote of our shareholders, including the election of a majority of the members of our board of directors, determining the amount of dividends distributed by us (subject to the legally mandated minimum of 30% of distributable net income), adopting certain amendments to our Bylaws, including the issuance of new shares, enforcing or waiving our rights under existing agreements, leases and contractual arrangements and entering into agreements with entities affiliated with us. As a result, circumstances may occur in which our controlling shareholder’s interests could be in conflict with your interests as holder of the ADSs. Our controlling shareholder may have interests in pursuing or preventing acquisitions, divestitures or other transactions where, in his judgment, such action would be in our best interests, even though such action may not be in the best interests of our minority shareholders.
Our status as a foreign private issuer exempts us from certain of the corporate governance standards of the NYSE, limiting the protections afforded to investors.
We are a “foreign private issuer” within the meaning of the NYSE corporate governance standards. Under the NYSE listing rules, a foreign private issuer may elect to comply with the practice of its home country and not to comply with certain NYSE corporate governance requirements, including the requirements that (1) a majority of the board of directors consist of independent directors, (2) a nominating and corporate governance committee be established that is composed entirely of independent directors and has a written charter addressing the committee’s purpose and responsibilities, (3) a compensation committee be established that is composed entirely of independent directors and has a written charter addressing the committee’s purpose and responsibilities, and (4) an annual performance evaluation of the nominating and corporate governance and compensation committees be undertaken. Therefore, you will not have the same protections afforded to shareholders of companies that are subject to all New NYSE corporate governance requirements.
For example, in reliance on the foreign private issuer exemption to the NYSE listing rules a majority of our board of directors may not consist of independent directors; our board’s approach may therefore be different from that of a board with a majority of independent directors, and as a result, the management oversight of our Company may be more limited than if we were subject to the NYSE listing rules.
43
U.S. securities laws do not require us to disclose as much information to investors as a U.S. issuer is required to disclose, and you may receive less information about us than you might otherwise receive from a comparable U.S. company.
The corporate disclosure requirements applicable to us may not be equivalent to the requirements applicable to a U.S. company and, as a result, you may receive less information about us than you might otherwise receive in connection with a comparable U.S. company. We are subject to the periodic reporting requirements of the Exchange Act of 1934, as amended (the “Exchange Act”) that apply to “foreign private issuers.” The periodic disclosure required of foreign private issuers under the Exchange Act is more limited than the periodic disclosure required of U.S. issuers. For example, we will be required only to file an annual report on Form 20-F, but we are not required to file any quarterly reports. A U.S. registrant must file an annual report on Form 10-K and three quarterly reports on Form 10-Q. In addition, we will be required to file current reports on Form 6-K, but the information that we must disclose in those reports is governed primarily by Chilean law disclosure requirements and may differ from Form 8-K’s current reporting requirements imposed on a U.S. issuer. Finally, we are not subject to the proxy requirements of Section 14 of the Exchange Act and our officers, directors and principal shareholders are not subject to the short swing insider trading reporting and recovery requirements under Section 16 of the Exchange Act.
Chilean law provides for fewer and less well-defined shareholders’ rights.
Our corporate affairs are governed by our Bylaws (which serve the combined function of the articles of incorporation and the bylaws of a U.S. corporation), and the laws of Chile. Under such laws and our Bylaws, our shareholders may have fewer or less well-defined rights than they might have as shareholders of a corporation incorporated in a U.S. jurisdiction. For example, our shareholders would not be entitled to redemption rights in the event of a merger or other business combination undertaken by us. Persons or entities who seek to acquire control of a publicly-held Chilean corporation through a tender offer (oferta pública de adquisición de acciones), must make an offer to any and all shareholders of such company. See “Item 10. Additional Information—B. Memorandum and Articles of Association—Right of dissenting shareholders to tender their shares” and “—Dividend and liquidation rights.”
Our recent transformation as a U.S. public company may increase our costs and disrupt the regular operations of our business.
Our recent initial public offering has had a significant transformative effect on us. We have incurred and expect to incur additional legal, accounting, reporting and other expenses as a result of having an ADS program. We will also incur costs which we have not incurred previously, including, but not limited to, increased costs and expenses for directors’ fees, increased directors and officers insurance, increased investor relations, and various other incremental costs related to having an ADS program traded in the United States.
We also anticipate that we will incur costs associated with corporate governance requirements, including requirements under the Sarbanes-Oxley Act of 2002, as amended, as well as rules implemented by the Securities and Exchange Commission (the “SEC”) and NYSE. We expect these rules and regulations to increase our legal and financial compliance costs and make some management and corporate governance activities more time-consuming and costly. These rules and regulations may make it more difficult and more expensive for us to obtain director and officer liability insurance, and we may be required to accept reduced policy limits and coverage or incur substantially higher costs to obtain the same or similar coverage. This could have a material adverse impact on our ability to recruit and bring on a qualified independent board. We cannot predict or estimate the amount of additional costs we may incur as a result of these requirements or the timing of such costs.
Chile imposes controls on foreign investment and repatriation of investments that may affect your investment in, and earnings from, the ADSs, and may impose additional controls or restrictions in the future.
Equity investments into Chile from abroad are subject to the requirement that investors provide Chile’s Central Bank with information related to such equity investments and conduct any operations in connection with the repatriation of investments and earnings on them within Chile’sMercado Cambiario Formal, or Formal Exchange Market. See “Item 10. Additional Information—D. Exchange Controls—Foreign Exchange Controls—Chile.”
Holders of ADSs are entitled to receive dividends on the underlying shares to the same extent as the holders of shares. Dividends received by holders of ADSs will be converted into U.S. dollars and distributed net of foreign currency exchange fees and expenses and fees of the Depositary and will be subject to Chilean withholding tax, currently imposed at a rate of 35% (subject to credits in certain cases as described under “Item 10. Additional Information—E. Taxation—General—Material United States Federal Income Tax Considerations”). If for any reason, including changes in Chilean laws or regulations, the Depositary were unable to convert Chilean pesos to U.S. dollars, investors may receive dividends and other distributions, if any, in Chilean pesos.
44
Additional Chilean restrictions applicable to the holders of the ADSs and other foreign investors in Chile could be imposed in the future. The Central Bank of Chile has the authority to impose at any time certain controls, restrictions or obligations on foreign investors in Chile. Such restrictions could include, but are not limited to, the requirement to obtain the Central Bank of Chile’s prior approval for the repatriation of the proceeds from the disposition of shares underlying the ADSs or the payment of dividends. We cannot advise you as to the duration or impact of any such restrictions if imposed.
Currency devaluations, foreign exchange fluctuations and foreign currency conversion costs may have a material adverse effect on our stock price and on the U.S. dollar value of any cash distributions made to ADS holders in respect of ADSs.
As our operations are denominated in local currencies (Chilean Peso, Brazilian Real, Peruvian Sol, Argentinian Peso and Colombian Peso), changes in the currency parities may affect our recognition of results. Furthermore, as our stocks are primarily traded at the Santiago Stock Exchange, our stock is traded and listed in Chilean pesos. Therefore, changes in the Chilean Peso versus the U.S. Dollar parity may affect the value of your investment when measured in U.S. Dollars.
If the value of the Chilean peso falls relative to the U.S. dollar, the value of the ADSs and any distributions to be received from the Depositary for the ADSs could be materially and adversely affected. Cash distributions made in respect of the ADSs are received by the Depositary in Chilean pesos, are then converted by the Depositary into U.S. dollars at the then prevailing exchange rate and distributed to the holders of ADSs. In addition, the Depositary will incur foreign currency conversion costs (to be borne by the holders of the ADSs) in connection with the foreign currency conversion and subsequent distribution of dividends or other payments with respect to ADSs.
ADS holders may not be able to effect service of process on, or enforce judgments or bring original actions against, us, our directors or our executive officers, which may limit the ability of holders of ADSs to seek relief against us.
We are a Chilean corporation. None of our directors are residents of the United States and most of our executive officers reside outside the United States. In addition, a substantial portion of our assets and the assets of our directors and executive officers are located outside the United States. As a result, it may be difficult for ADS holders to effect service of process outside Chile upon us or our directors and executive officers or to bring an action against us or such persons in the United States or Chile to enforce liabilities based on U.S. federal securities laws. It may also be difficult for ADS holders to enforce in the United States or in Chilean courts money judgments obtained in United States courts against us or our directors and executive officers based on civil liability provisions of the U.S. federal securities laws. If a U.S. court grants a final money judgment in an action based on the civil liability provisions of the federal securities laws of the United States, enforceability of this money judgment in Chile will be subject to the obtaining of the relevant “exequatur” (i.e., recognition and enforcement of the foreign judgment) according to Chilean civil procedure law currently in force, and consequently, subject to the satisfaction of certain factors. The most important of these factors are the existence of reciprocity, the absence of a conflicting judgment by a Chilean court relating to the same parties and arising from the same facts and circumstances and the Chilean courts’ determination that the U.S. courts had jurisdiction, that process was appropriately served on the defendant and that enforcement would not violate Chilean public policy. Failure to satisfy any of such requirements may result in non-enforcement of your rights.
Preemptive rights may be unavailable to ADS holders or U.S. holders of shares in certain circumstances and, as a result, U.S. owners of shares or ADSs would be subject to potential dilution.
TheLey sobre Sociedades Anónimas No. 18,046 and theReglamento de Sociedades Anónimas, which we refer to in this document collectively as the “Chilean Corporations Law,” require us, whenever we issue new shares for cash and sell treasury shares, to grant preemptive rights to all of our shareholders (including shares represented by ADSs), giving them the right to purchase a sufficient number of shares to maintain their existing ownership percentage. It is possible that, in connection with any future issuances of shares, we may not be able to offer shares to U.S. holders of shares or ADSs pursuant to preemptive rights granted to our shareholders and, as a result such U.S. holders of shares or ADSs would be subject to potential dilution.
We will not be able to offer shares to ADS holders or U.S. holders of shares pursuant to preemptive rights that we grant to our shareholders in connection with any future issuance of shares or sale of treasury shares unless a registration statement under the U.S. Securities Act of 1933, as amended (the “Securities Act”), is effective with respect to such rights and shares, or an exemption from the registration requirements of the Securities Act is available.
Such a registration statement may not be filed and an exemption from the registration requirements of the Securities Act may not be available. If owners of ADSs are unable to exercise preemptive rights because a registration statement has not been filed, the Depositary will attempt to sell such owners’ preemptive rights and distribute the net proceeds of the sale (net of the depositary’s fees and expenses) to the holders of the ADSs, provided that a secondary market for such rights exists and a premium can be recognized over the cost of any such sale. It is possible that a secondary market in preemptive rights may not develop in connection with any future issuance of shares or, if such a market does develop, a premium may not be able to be realized on their sale.
45
If preemptive rights cannot be sold, they will expire, and holders of ADSs will not realize any value from the grant of such preemptive rights. In either case, the equity interest in us of the holders of ADSs would be diluted proportionately.
ADS holders may not be able to exercise redemption rights that are granted by the Chilean corporations Law to registered shareholders of publicly traded Chilean corporations.
UnderLey sobre Sociedades Anónimas No. 18,046, as amended (the “Chilean Corporations Law”), if any of the following resolutions is adopted by our shareholders at any extraordinary shareholders meeting, dissenting shareholders have the right of redemption and can require us to repurchase their shares, subject to the fulfillment of certain terms and conditions. A dissenting shareholder is a shareholder who either attends the shareholders meeting and votes against a resolution which results in a redemption right or, if absent from the shareholders meeting, a shareholder who notifies the company in writing within 30 days of the shareholders meeting of his opposition to the resolution and that he is exercising his redemption right.
The resolutions that result in a shareholder’s redemption right are the following:
| | • | | our transformation into a different type of legal entity; |
| | • | | our merger with or into another company; |
| | • | | the disposition of 50% or more of our assets, whether or not that sale includes our liabilities or the proposal or amendment of any business plan involving the transfer of more than 50% of our assets; the sale of 50% or more of the assets of an affiliate which represents at least 20% of the assets of the corporation, as well as any sale of its shares which would result in us ceasing to be in control of such subsidiary; |
| | • | | the granting of security interests or personal guarantees to secure or guarantee third parties’ obligations exceeding 50% of our assets, except with regard to security interests or personal guarantees are granted to secure or guarantee obligations of our subsidiaries; |
| | • | | the creation of preferential rights for a class of shares or an amendment to those already existing, in which case the redemption right only accrues to dissenting shareholders of the class or classes of shares adversely affected; |
| | • | | the amendment of our Bylaws to correct any formal defect in our incorporation, which might cause our Bylaws to be null and void, or any amendment of our Bylaws that grants a shareholder a redemption right; |
| | • | | the approval by our shareholders of our ceasing to be subject to the regulations applicable to publicly held corporations in the event we no longer meet the requirements under Chilean law to qualify as such a corporation; and |
| | • | | any other causes as may be established by Chilean law and our Bylaws (our Bylaws currently do not establish any instances). |
In addition, shareholders of a publicly held corporation have a redemption right if a person acquires two-thirds or more of the outstanding voting stock of the company and does not make a tender offer for the remaining shares within 30 days of that acquisition at a price not lower than the price that would be paid shareholders exercising their redemption rights. However, the right of redemption described in the previous sentence does not apply in the event the company reduces its capital as a result of not having fully subscribed and paid an increase of capital within the statutory term.
Finally, shareholders of a publicly held corporation have the right of redemption within 30 days after the date when the controller acquires more than 95% of the shares of the company. These redemption rights must be exercised within 30 days.
ADS holders own a beneficial interest in shares held by the Depositary and, accordingly, they are not shareholders of the Company. The Depositary will not exercise redemption rights on behalf of ADS holders. Accordingly, in order to ensure a valid exercise of redemption rights, an ADS holder would have to cancel his ADSs and become a registered shareholder of the Company no later than the date which is five Chilean business days before the shareholders’ meeting at which the vote which would give rise to redemption rights is taken, or the applicable record date for redemption rights that arise other than as a result of a shareholder vote. Redemption rights must then be exercised in the manner prescribed in the notice to shareholders that is required to be sent to shareholders of Chilean public companies advising such holders of their right of redemption. If an event occurs that gives rise to redemption rights, ADS holders will have a limited time to cancel their ADSs and to become registered shareholders of the Company prior to the record date for the shareholders meeting or other event giving rise to such redemption rights. If an ADS holder does not become a registered shareholder of the Company prior to such record date he will not be able to exercise the redemption rights available to registered shareholders.
46
Item 4. Information on the Company
A. HISTORY AND DEVELOPMENT OF THE COMPANY
General Information
We are a publicly-held stock corporation (sociedad anónima abierta) organized under the laws of Chile and have an indefinite corporate duration. We were incorporated by a public deed dated November 10, 1978. This abstract is recorded on page 13808 No. 7412 of theRegistro de Comercio de Santiago (Commercial Registry of Santiago) for the year 1978. Our legal name is “Cencosud S.A.” Our registered office is located at Av. Kennedy 9001, Piso 6, Las Condes, Santiago, Chile and our main telephone number is 56 (2) 2959-0000.
History
Our history has been one demonstrating organic growth as well as significant, ongoing acquisitions designed to enhance our footprint in the industries in which we operate and increase our market share and brand recognition.
1960—2001
We trace our origins to the opening in 1960 of our first supermarket, with a selling area of 160 square meters, in Temuco, Chile. In the mid-1970s, we expanded our business by opening the first Jumbo hypermarket in Chile, with a selling space of 7,000 square meters, located on Kennedy Avenue in Santiago.
In 1982, we began our operations in Argentina with the opening of Argentina’s first Jumbo hypermarket which had a selling space of 9,282 square meters. We continued to expand in Argentina with the construction of Unicenter in 1988, Argentina’s largest shopping center. In 1993, we opened Lomas Center, the first shopping center in the south of the Buenos Aires metropolitan area. In 1994, we opened San Martin Factory (an outlet shopping center). In 1996, we opened Palermo shopping center in Buenos Aires. Between 1997 and 2003, we opened Quilmes Factory (an outlet shopping center), Palmas de Pilar and El Portal de Escobar, all of which are located in Greater Buenos Aires.
In 1993, we expanded our shopping center business in Chile by opening Alto Las Condes. In the same year, we expanded our line of business by opening Easy home improvement stores in Chile and Argentina which offer products required to improve and maintain a home, as well as construction materials and design and decoration products. That year, we opened our first Easy home improvement stores in the Alto Las Condes shopping center in Chile and in the Parque Brown Factory shopping center in Argentina.
2002—2006
In 2002, we continued our expansion in Chile by opening three new Jumbo hypermarkets, four new Easy home improvement stores and the Portal La Reina shopping center. In November 2002, we significantly expanded our presence in the Chilean home improvement sector through the acquisition of Proterra, a small chain of do-it-yourself stores in southern Chile, and converted its seven stores to our Easy home improvement stores. In 2002, we acquired the operations of Home Depot (Argentina).
In 2003, we acquired the supermarket chain Santa Isabel making us the second-largest supermarket operator in Chile in terms of revenues according to our estimations. We also opened two new shopping centers, the Florida Center and Portal La Dehesa, both in Santiago. We also started our credit card business with the incorporation of our Cencosud Administradora de Tarjetas de Crédito S.A. subsidiary, and the launching of the Jumbo Más credit card.
In April 2004, we acquired Las Brisas supermarket chain, which enhanced our geographical coverage in several areas including Valparaíso and Concepción through the addition of 17 new stores. In May 2004, we completed our initial public offering in Chile and were listed on the Santiago Stock Exchange. At the same time, we issued ADSs in the international capital markets in a private offering pursuant to Rule 144A and Regulation S, raising over U.S.$330 million. In November 2004, through the acquisition of the supermarket chain Montecarlo, we consolidated our position as the second-largest supermarket operator in Chile. In November 2004, we also acquired the supermarket chain Disco in Argentina, one of Argentina’s largest supermarket chains, which we believe consolidated our position as the second-largest supermarket operator in that country in terms of revenues. Moreover, in October 2004, we opened a new shopping center in Argentina, Portal de Rosario, which we believe currently is the largest in the Rosario area in terms of revenues.
In March 2005, we entered into the department stores business through the acquisition of Empresas Almacenes Paris S.A., one of Chile’s most important department stores chains and which also operated a travel agency, an insurance broker, Banco Paris and Administradora de Créditos Comerciales ACC S.A. In September 2005, we rebranded our Las Brisas and Montecarlo brands under Santa Isabel brand, in order to consolidate and enhance our supermarket business.
47
2007—Present
In June 2007, we acquired other two supermarket chains in Chile, Infante which operates in the city of Antofagasta and Economax with a significant presence in Santiago’s downtown, adding in total 16 new stores to our supermarket business. Likewise, we expanded our retail department store business by acquiring the Foster and Eurofashion clothing store chain which sells the popular clothing brands Foster, JJO and Maritimo. In November 2007, we acquired the GBarbosa supermarket and hypermarket chain which operated both formats in the northeast region of Brazil with a total of 46 stores.
In December 2007, we entered into an agreement to acquired GSW S.A., the operator of the Wong chain of supermarkets, hypermarkets and shopping centers in Peru. Pursuant to this agreement the Wong family acquired a percentage of our shares and consequently became one of our main shareholders.
In May 2007, we entered into a joint venture agreement with Casino Guichard-Perrachon S.A. (“Casino”) in order to develop the home improvement store business in Colombia. Pursuant to the joint venture, initially we had a 70% interest in the joint venture and were in charge of the operational administration of Easy Colombia S.A., with Casino owning the remaining 30%. In April 2009, we acquired Casino’s shares in the joint venture, increasing our ownership stake to 100%.
In 2008, we entered the financing business in Argentina, with the launch of the Cencosud credit card and the opening of an insurance brokerage company in Argentina. In September 2008, we acquired Blaisten, a professional do-it-yourself store in Argentina.
In 2010, we expanded our footprint in the Brazilian market through the acquisition of three supermarket chains. In March 2010, we acquired the four-store Super Familia supermarket chain which we estimate to be the third-largest in the city of Fortaleza, in the state of Ceara. In April 2010, we entered the high-end retail market in Brazil with the acquisition of Perini Comercial do Alimento Ltda., operator of the four-store chain of Perini supermarkets in the city of Salvador, in the state of Bahia. Perini is a well-known brand in Brazil with 46 years in the market and complements our existing operations in Brazil. In October 2010, we acquired what we estimated to be the largest supermarket chain in the Brazilian state of Minas Gerais, Bretas, with 62 stores in three Brazilian states at the time of acquisition: Minas Gerais, Goias and Bahia. With the Bretas acquisition, we consolidated our position as Brazil’s fourth-largest supermarket operator in terms of revenues, as measured by ABRAS.
At the beginning of 2011 we issued U.S.$750 million aggregate principal amount of bonds due 2021 in a 144A/Reg-S offering in the international capital market, with a fixed interest rate of 5.50%. Additionally, in June 2011 we issued a local bond in Chilean pesos, for the amount of Ch$54,000 million aggregate principal amount of bonds due 2031 in the local Chilean market, with a fixed interest rate of 7.40%.
In March 2011, UBS AG London Branch (“UBS”) executed a shareholders agreement to purchase from certain investors a 38.636% stake in Cencosud’s subsidiary Jumbo Retail Argentina, which operates our supermarkets in Argentina, for U.S.$442 million.
In August 2011, Cencosud Brasil Comercial Ltda. (“Cencosud Brasil Comercial”), Irmãos Bretas, Filhos e Cia. Ltda. (“Bretas”), Mercantil Rodrigues Comercial, Ltda. (“Mercantil Rodrigues”), Perini Comercial de Alimentos Ltda. (“Perini”) and Cencosud Brasil entered into an agreement with Banco Bradesco pursuant to which Banco Bradesco agreed to render financial services in Cencosud stores in Brazil, particularly regarding the exclusive issuance and operation of the Cencosud Card credit card (Cartão Cencosud), as well as the offer, within Cencosud stores in Brazil, of consumer loans, purchase financing and insurance products. Prezunic is currently not included in this venture.
In 2011, we continued expanding into the Brazilian market through the acquisition of Cardoso. Cardoso was at that time a three-store supermarket chain in the state of Bahia, with net sales of approximately R$60 million (U.S.$35.9 million) in 2011. Cencosud paid a purchase price of U.S.$11.3 million. We have converted the acquired stores to the GBarbosa format and are now operating under this brand.
In December 2011, we acquired 85.58% of the capital stock of in Johnson’s S.A. for an aggregate purchase price of Ch$32,606 million. Johnson is a department store with 39 stores throughout Chile using the Johnson brand and 13 stores using the FES brand. FES stores were closed during the 2013 period. In December 2013 Cencosud executed its option to purchase the remaining shares that were not held by it and paid UF 315,935.76 in connection therewith.
48
Johnson’s retail financing arm has been migrated to our Cencosud format and all clients have been brought on to Tarjeta Cencosud. Clients of former Johnson’s retail financing arm are now offered the same services as all other Cencosud clients. With the acquisition of Johnson we are able to target low and middle income market segments, in a similar fashion as with the acquisition of Santa Isabel in the supermarkets division, as Johnson stores are smaller, targeted to low and mid income consumers and better located to target that market segment.
On January 2, 2012, we acquired 100% of the capital stock of Prezunic. The aggregate purchase price of the operation was R$875 million (or approximately Ch$242,690 million), payable as follows: R$580 million on the closing date of the transaction (January 2, 2012), with the balance to be paid as follows: R$80 million, R$85 million, R$80 million and R$50 million, on the first, second, third and fourth anniversary of the closing date, respectively. We estimate that Prezunic is the third-largest supermarket chain in Rio de Janeiro with 31 stores.
On June 13, 2012, we opened Costanera Center shopping mall, the largest shopping center in Chile a landmark development for the city of Santiago. On June 29, 2012, we repurchased 38.636% of the capital stock of Jumbo Retail Argentina from UBS. On July 3, 2012, we completed our SEC-registered initial public equity offering of 105,000,000 common shares in the form of common shares and ADSs listed on the New York Stock Exchange.
On November 30, 2012, we completed the acquisition of the former operation of Carrefour Colombia for a total purchase price equal to €2 billion subject to adjustments pursuant to the stock purchase agreement related thereto. The Acquired Companies operated supermarkets under the “Carrefour” and “Maxi” brand names in Colombia.
The acquisition included the purchase of 92 total stores, including 72 hypermarket stores, 16 convenience stores, and four cash and carry stores and gas stations. The stores acquired are located in nine of the ten largest cities in Colombia. We believe this transaction placed Cencosud as the second largest supermarket operator in Colombia in terms of sales and consolidates the existing presence of the Company’s Easy stores in Colombia. However, since the acquisition, Cencosud has become the third largest supermarket player in the Colombian Market as per data made available by Nielsen. All such supermartket stores had dropped the Carrefour brand and have been operating under the Jumbo and Metro brands since May 31, 2013.
To finance the acquisition of Carrefour’s Colombian operations, on October 17, 2012, the Company entered into a bridge loan agreement with a syndicate of banks in the amount of U.S.$2,500 million (the “Bridge Loan Agreement”). The Bridge Loan Agreement has a maturity date of April 15, 2014 and bears an interest rate of LIBOR plus a margin of 1.50% for the first sixth months, 1.75% for the following three months, 2.20% for the following three months, 2.25% for the following three months, and 2.75% thereafter. The full amount under the Bridge Loan Agreement was disbursed on October 17, 2012 and used by us to fund the purchase of Carrefour’s Colombian operations in escrow. On December 6, 2012, the Company issued U.S.$1,200 million aggregate principal amount of bonds due 2023 in a Rule 144A and Regulation S offering in the international capital markets. The bonds due 2023 accrue interest at a fixed rate of 4.875%. The proceeds of that offering were used to repay in part amounts outstanding under the Bridge Loan Agreement. The remaining outstanding amount of our Bridge loan facility was repaid with proceeds of the capital increase that was successfully completed on March 14, 2013.
In February 2013, we announced a preemptive rights offering in the Chilean market pursuant to a capital increase for the amount of U.S.$1,600 million. Proceeds of this offering were used for the prepayment of the outstanding bridge loan facility we incurred to finance our acquisition of Carrefour’s operations in Colombia in the amount of US$1,500 million, with the remainder to repay other short term liabilities, including debt facilities related to our Brazilian operations. This offering was completed on March 14, 2013, raising Ch$770,647 million (98.9% subscription). The remainder of the offered shares were successfully auctioned at the Santiago stock exchange.
On June 20, 2014, BNS and Scotiabank Chile S.A. (together “Scotiabank”) and the Company together with its subsidiaries, Cencosud Retail S.A. and Easy S.A., executed the Joint Venture Framework Agreement whereby, subject to certain conditions and governmental approvals, Scotiabank will purchase 51% of the shares in the Subject Companies for the amount of U.S.$280 million and will also provide financing for 100% of CAT’s financial services portfolio in Chile, which currently amounts to approximately U.S.$1.0 billion. The Joint Venture Framework Agreement contemplates that the parties will develop, on a joint basis, the retail finance business in Chile. The Joint Venture Framework Agreement provides that the Business shall be operated through (i) CAT, a subsidiary of Cencosud that is in the business of issuing credit cards, and (ii) Cencosud Administradora de Procesos S.A., Cencosud Servicios Integrales S.A., and Cencosud Corredores de Seguros y Servicios Ltda., or other companies to be established by Cencosud for purposes of the Joint Venture Framework Agreement, to assist in developing the Business, including information processing and collection activities related thereto. Under this agreement, we believe that 2.5 million cardholders will benefit from easier access to new products and financial services and the expertise of Scotiabank, while receiving the Company’s client benefits at our Jumbo, Santa Isabel, Easy, Paris and Johnson stores and shopping centers. In addition to numerous benefits to clients, the new company will seek to achieve synergies that we believe should result in lower operational costs. This association is framed within the Company’s
49
long term strategic plan to boost financial services offered to clients without utilizing Company capital, implementing the same model that has already been successful in our Brazil and Colombia operations. This transaction received regulatory approval for the full implementation of the joint venture framework agreement on April 13, 2015.
On September 4, 2014, the holders of the Series E and F bonds issued by the Company registered in the Securities Registry of theSuperintendencia de Valores y Seguros (Superintendency of Securities and Insurance) under number 530 (“Issuance No. 530”), approved the amendment of the Bond Issuance Line of Debt Title that regulates the terms and conditions of said Issuance No. 530 (the “Indenture for Series E and F”). The amendments allow the Company to reduce its equity participation in CAT to as low as 45% of said equity. The aforementioned amendments were intended to prevent a default under the Indenture for Series E and F in connection with the consummation of the transactions contemplated in the Joint Venture Framework Agreement.
On October 17, 2014, the Company announced that it was calling its Series A, C and D bonds issued under the number 443 (“Issuance No. 443”) of the securities registry for early redemption, and communicated the same to theSuperintendencia de Valores y Seguros. As specified in the announcement, the Issuance No. 443 bonds were scheduled to be redeemed on November 19, 2014. Issuance No. 443 bonds totaled an aggregate amount of UF 10,000,000. Payment for the bonds was to be made in Chilean pesos according to the value of the UF on the redemption date. The Company had previously sought, but failed to obtain, the consent of its Issuance No. 443 bondholders for amendments to the related Bond Issuance Line of Debt Title on September 4, 2014 that would have allowed it to reduce its equity participation in CAT to as low as 45% of said equity, which was necessary for the Company to consummate the transactions contemplated in the Joint Venture Framework Agreement.
On November 13, 2014 the Company entered into a bridge loan agreement for a total amount of U.S.$400 million with BNS and HSBC Bank USA, N.A. (the “Bridge Loan”). A total amount of U.S.$400 million was drawn on November 17, 2014 under the Bridge Loan, which amount was used by the Company to prepay all the Issuance No. 443 bonds. Such prepayment took place and was completed on November 19, 2014. The redemption of the Issuance No. 443 bonds was expected to pave the way, pending regulatory approval, for the full implementation of the Joint Venture Framework Agreement.
On January 30, 2015, the board of directors of the Company resolved to evaluate a potential initial public offering of the Company’s shopping centers division, focusing on Chile, Peru and Colombia, the Company probably would maintain a majority stake in the entity. This evaluation process is in the preliminary stages, and any transaction ultimately undertaken with respect thereto will be subject to approvals required under applicable law.
On February 12, 2015, the Company successfully accessed the international debt capital markets and issued U.S.$1,000 million of debt securities in a two-tranche offering in an effort to refinance liabilities including the repayment of the aforementioned bridge loan facility with BNS and HSBC Bank USA, N.A. The balance of the proceeds were used to refinance certain outstanding liabilities. This refinancing is expected to allow the Company to proceed with its organic expansion program released on January 30, 2014 for years 2015 through 2018.
Principal Capital Expenditures for Organic Expansion
Capital expenditures totaled Ch$227,423 million, Ch$317,710 million and Ch$573,650 million for the years ended December 31, 2014, 2013 and 2012, respectively. For a discussion of our capital expenditures and future projections, see “Item 5. Operating and Financial Review and Prospects—B. Liquidity and Capital Resources—Capital Expenditures and permanent investments.”
B. BUSINESS OVERVIEW
Our Company
We believe we are one of the leading multi-brand retailers in South America, based on revenues, selling space, number of stores and gross leasable area in the sectors and countries in which we operate. See “—Industry Overview and Competition” for more explanation on the methodology we use to calculate our market position in such sectors and countries. We operate through a number of formats, including supermarkets, home improvement stores, shopping centers and department stores. We are headquartered in Chile and have operations in Chile, Argentina, Brazil, Colombia and Peru. Our business consists of five segments, including four retail segments, which allows us to reach a wide range of customers offering various combinations of products, price, quality and service. The company believes Brazil, Peru and Colombia are high growth and underpenetrated markets due to their favorable demographics, sustainable household consumption growth and low formal retail penetration as described in herein and in “Industry Overview and Competition.” As a complement to our core retailing business, we are actively involved across the region in the commercial real estate development business, particularly in Chile, Argentina, Colombia and Peru, with 53 shopping malls representing 800,272 square meters of gross leasable area as of December 31, 2014, and we also offer private label credit cards, consumer loans and limited financial services to our retail customers.
50
For the year ended December 31, 2014, we had 1,168 stores and shopping centers with an aggregate of 4,387,088 square meters of selling space and had assets of Ch$ 10,716,503 million, liabilities of Ch$ 6,425,017 million, net earnings attributable to controlling shareholders of Ch$ 164,894 million, and shareholders’ equity of Ch$ 4,291,486 million.
Throughout our 50-year history of growth we have developed, acquired, integrated and expanded several retail businesses with strong brands in the various markets where we operate. Since January 1, 2005, we have grown our total number of stores and shopping centers from 425 to 1,168 as of December 31, 2014 and the total selling space of our retail stores and shopping centers from 1,433,838 to 4,387,088 square meters as of December 31, 2014. In addition, over the same period, we completed several strategic acquisitions that have significantly increased the size and geographic scope of our operations.
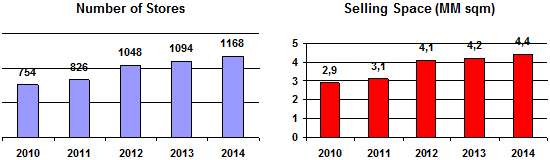
In February 2014, we revised our internal corporate management structure to capitalize on the synergies between our retail business lines, consolidating the management of all of our retail business lines (Supermarkets, Department Stores, and Home Improvement) into one division under a new Corporate Retail Managing Director. This reorganization is expected to facilitate the exchange of better business practices among our business lines and divisions across the various countries in which we operate.
We believe that our strategy of operating as an integrated multi-format and multi-brand retailer, combined with our broad product offering and portfolio of brands has been one of the key strategic advantages in the successful growth of our businesses. Today we operate a diversified operational and geographic footprint across South American markets with highly attractive demographics and strong macroeconomic fundamentals. We believe that our broad presence and our competitive position across key markets will continue to allow us to consolidate the retail market and to benefit from the expected strong growth in underpenetrated retail markets such as Brazil, Colombia and Peru.
The following table presents our total number of stores and shopping centers by country as of December 31, 2014:
| | | | | | | | | | | | | | | | | | | | | | | | |
| | | Chile | | | Argentina | | | Brazil | | | Peru | | | Colombia | | | Total | |
Supermarkets | | | 238 | | | | 290 | | | | 219 | | | | 87 | | | | 100 | | | | 934 | |
Home improvement stores | | | 33 | | | | 50 | | | | — | | | | — | | | | 10 | | | | 93 | |
Department stores | | | 79 | | | | — | | | | — | | | | 9 | | | | — | | | | 88 | |
Shopping centers | | | 25 | | | | 22 | | | | — | | | | 4 | | | | 2 | | | | 53 | |
Total | | | 375 | | | | 362 | | | | 219 | | | | 96 | | | | 112 | | | | 1,168 | |
| | | | | | | | | | | | | | | | | | | | | | | | |
In summary, highlights of our commercial activities include:
| | • | | 1,168 stores and shopping centers as of December 31, 2014. |
| | • | | 4.387 million square meters of selling space as of December 31, 2014. |
| | • | | A total of 6.0 million active credit cards issued and U.S. $1.6 billion in credit card operations as of December 31, 2014 |
51
The following table indicates the percentages of revenues from ordinary activities and gross profit that each of our geographical markets represented for the period indicated:
| | | | | | | | | | | | | | | | | | | | |
| | | Year Ended December 31, 2014 | |
| | | Chile | | | Argentina | | | Brazil | | | Peru | | | Colombia | |
| | | (in millions of Ch$) | |
Revenues from ordinary activities (continuing operations) | | | 3,892,561 | | | | 2,643,819 | | | | 2,158,155 | | | | 937,004 | | | | 1,079,489 | |
Gross profit | | | 1,081,358 | | | | 929,227 | | | | 437,338 | | | | 226,509 | | | | 221,822 | |
We are organized in six business segments: supermarkets, home improvement stores, department stores, shopping centers and financial services, plus complementary activities described as “Other.”
Supermarkets. We operate 934 supermarkets throughout Chile, Argentina, Brazil, Peru and Colombia as of December 31, 2014, selling a wide variety of name brand and private label products. We believe that we are the second-largest supermarket operator in Chile, in terms of revenues, based on our comparisons against information from public filings of our main competitors as of December 31, 2014, the second largest in Argentina and the largest in Peru, based also on information provided by a third-party market researcher, Nielsen. We pioneered the hypermarket format in Chile with the opening of our first Jumbo hypermarket in 1976. Since then, we have expanded and grown our supermarkets division, and as of December 31, 2014 we operated a total of 201 supermarkets and 37 hypermarkets in Chile under the Santa Isabel and Jumbo brands. We operate 20 hypermarkets and 270 supermarkets under Jumbo, Disco and Super Vea brands in Argentina, as of December 31, 2014.
In Brazil, as a result of our acquisitions, we are now the fourth-largest supermarket operator in terms of revenues, according to the ABRAS. We believe we are the largest operator in the state of Minas Gerais, the second-largest in the northeast of Brazil, and we estimate we are the third-largest in the state of Rio de Janeiro (after the acquisition of Prezunic in January 2012), all in terms of sales. In January 2012 we acquired Prezunic, the operator of a supermarket chain of 31 stores in the state of Rio de Janeiro, in Brazil, thus further expanding our presence in the Brazilian market. Our operations in Brazil comprise 178 supermarkets and 41 hypermarkets. According to Apoyo, a Peruvian Rating Agency associated with Fitch, Inc., we are the largest supermarket operator in Peru in terms of sales, with 87 stores as of December 31, 2014.
On November 30, 2012, we completed the acquisition of Carrefour’s operations in Colombia, and currently stand as the third largest player in Colombia in the food retailing industry according to Nielsen data as of December 31, 2014. Our operations in the country comprise 21 supermarkets operating under the Metro Express brand and 79 Hypermarkets that operate under Metro and Jumbo brands. See “—A. History and Development of the Company—History.”
Home improvement stores. We believe we are the second-largest home improvement store operator in Chile and the largest in Argentina in terms of revenues based on our comparison against publically filed information from our main competitors as of December 31, 2014. We sell a wide variety of building and other materials, including name brand and private label products. As of December 31, 2014, we have 33 Easy home improvement stores and 313,500 square meters of home improvement store selling space in Chile and 42 Easy and 8 Blaisten home improvement stores and 383,786 square meters of home improvement store selling space in Argentina. In October 2008, we opened the first home improvement store in Colombia and as of December 31, 2014 we have 10 Easy home improvement stores and 82,320 square meters of selling space in Colombia.
Department stores. We believe that we are the second-largest department store operator in Chile, in terms of revenues based on our comparison against information from public filings of our main competitors as of December 31, 2014. We also believe we have the largest selling space for department stores in Chile. We operate 79 department stores in Chile under the Paris and Johnson brands with 375,586 square meters of total selling space as of December 31, 2014 and 9 Paris stores in Peru with selling space of 45,232 square meters. Our Paris stores sell a wide variety of merchandise such as apparel, home furnishings, electronics and sporting goods, including name brand and private label products. We began the use of a two-brand strategy in Chile after acquiring an 85.58% interest in Johnson, which at the time operated 39 stores throughout Chile under the Johnson brand and an additional 13 stores using the FES brand with a total selling space of 117,569 square meters. This acquisition added 43.2% of selling space over our existing Paris stores. FES stores were closed during the 2013 period. We completed the acquisition of the remainder of outstanding shares of Johnson on December 18, 2013.
Shopping centers. We believe that we are the second-largest operator of shopping centers in each of Chile and the largest Argentina, in terms of total leasable area based on our comparisons against publically filed information from our main competitors as of December 31, 2014. As of December 31, 2014, we own and manage 25 shopping centers in Chile, 22 in Argentina 4 in Peru and 2 in Colombia with a total gross leasable area to third parties of 800,272 square meters. In Chile and Argentina, each of our shopping centers contains a Jumbo hypermarket, an Easy home improvement store and, in Chile, a Paris department store as well as other third-party-owned businesses intended to attract customers and enhance their overall shopping experience.
Financial services. We established our financial services division in 2003 when we launched our “Jumbo Más” credit card to facilitate in-store purchases and, since then, have significantly increased our credit card operations in Chile, Argentina, Brazil, Colombia and Peru. We have grown both through our own private-label cards and joint ventures with third party bank issuers of credit cards, primarily to finance customers’ purchases in our stores. We also own Banco Paris, a specialty retail consumer bank in Chile, which provides a wide range of consumer and financial services. In August 2010, we launched our own private label credit card in
52
Peru and we are expanding our offerings of financial services. In 2011, we established Banco Cencosud in Peru and in June 2012 we received the operation license from the banking superintendence (Superintendencia de Bancos y Seguros), and started operations in August 2012 through our Cencosud credit card. In 2011, we entered into an agreement with a major Brazilian bank, Banco Bradesco, to offer financial services for all our stores in Brazil, namely the exclusive issuance and operation of the Cencosud Card credit card (Cartão Cencosud), as well as the offer, within Cencosud stores in Brazil, of consumer loans, purchase financing and insurance products. Prezunic is currently not a participant in the above-mentioned joint venture.
As of December 31, 2014, we had a total of 6 million credit cards and other accounts in Chile, Argentina, Brazil, Colombia and Peru. As of December 31, 2014, we also had U.S.$1.1 billion in customer loans outstanding. Our financial services segment also includes our insurance brokerage services in Argentina, Chile, Brazil and Peru.
Other. In our “Other” segment we include the results of our Chile-based Aventura entertainment centers, which offer families the ability to enjoy different entertainment activities, such as electronic games, bowling and birthday parties; our frequent purchaser loyalty programs, which provide discounts and other promotions for our customers; and our corporate back-office, treasury and other operations.
For the years ended December 31, 2014, 2013 and 2012, results from our “Other” segment represented 0.2%, 0.2% and 0.1%, respectively, of our consolidated revenues.
See also, “Item 5. Operating and Financial Review and Prospects—A. Operating Results—Trends and Factors Affecting Our Results of Operations—Impact of Acquisitions” for additional details regarding our acquisition activities in recent years.
| | | | | | | | | | | | | | | | | | | | | | | | |
| | | Year Ended December 31, 2014 | |
| | | Supermarkets | | | Home
improvement | | | Department
stores | | | Shopping
centers | | | Financial
services
continuing
operations | | | Other(1) | |
| | | (in millions of Ch$) | |
Revenues from ordinary activities | | | 8,159,237 | | | | 1,225,616 | | | | 991,442 | | | | 214,850 | | | | 117,679 | | | | 2,205 | |
Gross profit | | | 1,955,126 | | | | 425,274 | | | | 250,163 | | | | 186,821 | | | | 78,632 | | | | 238 | |
Adjusted EBITDA for continuing operations(2) | | | 424,108 | | | | 119,148 | | | | 21,854 | | | | 150,412 | | | | 38,042 | | | | (111,868 | ) |
| (1) | See “—Our Company” for a description of our “Other” segment. |
| (2) | See “Presentation of Financial and Other Information” for the definition of Adjusted EBITDA and the reconciliation of Adjusted EBITDA to IFRS measures. |
We serve several markets through our extensive network of stores and shopping centers in South America under six diversified business segments. Our five principal segments are: supermarkets, home improvement stores, department stores, shopping centers and financial services. Through our various store formats and our numerous brands, we offer a full range of products intended to appeal to all types of consumers. The merchandise we carry includes one or more of the leading manufacturers in each category complemented by our offerings of our own private label brands. We believe the diversity and strength of our brands and our varied store formats allows us to compete effectively against our competitors, which range from traditional independent grocery stores and food specialists to mass market retailers.
53
As of December 31, 2014, our brand portfolio includes the following principal brands:
We believe we have established a positive record in the operation of our businesses. The following table sets forth certain performance metrics related to our consolidated growth for the periods presented:
| | | | | | | | | | | | |
| | | Year Ended December 31, | |
| | | 2014 | | | 2013 | | | 2012 | |
| | | (in millions of Ch$)(1) | |
Number of retail stores(2) | | | 1,115 | | | | 1,094 | | | | 952 | |
Total store area (square meters)(2) | | | 3,586,816 | | | | 3,514,342 | | | | 2,941,597 | |
Net sales(2) | | | 10,176,675 | | | | 9,640,294 | | | | 8,694,793 | |
Adjusted EBITDA for continuing operations(3) | | | 424,108 | | | | 434,859 | | | | 403,992 | |
| (1) | Except numbers of stores and selling space. |
| (2) | Excluding shopping centers and Financial Services. |
| (3) | See “Presentation of Financial and Other Information” for the definition of Adjusted EBITDA and the reconciliation of Adjusted EBITDA to IFRS measures. |
Supermarkets
General
We pioneered the hypermarket format in Chile with the opening of our first Jumbo hypermarket in 1976. Since then, we have expanded and grown our supermarkets division, and at December 31, 2014 we owned a total of 37 hypermarkets and 201 supermarkets in Chile operating under the Jumbo and Santa Isabel brands. We opened our first Jumbo hypermarket in Argentina in
54
1982 and in 2004 acquired the Disco supermarket chain, significantly enhancing our presence in Argentina and at December 31, 2014 we operated 20 Jumbo hypermarkets and 270 Disco and Super Vea supermarkets in Argentina. We estimate that we are the second largest operator in Argentina and Chile in terms of sales.
In recent years, we have expanded beyond our traditional supermarket presence in Chile and Argentina and have made sizeable acquisitions in Brazil and Peru. As a result, at December 31, 2014 we operated 219 supermarket and hypermarket stores in Brazil under the brands GBarbosa, Mercantil Rodrigues, Perini, Bretas and Prezunic. With our acquisition of Prezunic in January 2012, we consolidated our position as Brazil’s fourth-largest supermarket operator, in terms of revenues, according to ABRAS. Regionally, we estimate that we are the second-largest operator in the northeast of Brazil, the largest operator in Minas Gerais in Brazil and, following the acquisition of Prezunic, the third-largest operator in Rio de Janeiro, in terms of sales. In Peru, we operated 87 Metro and Wong hypermarkets and supermarkets at December 31, 2014. According to Apoyo, we are the largest supermarket operator in Peru in terms of sales. In 2012, we entered the Colombian supermarket industry inorganically through the purchase of the second largest player in the country, Carrefour. Our supermarket operations in the country dropped the use of their former brand and were rebranded Jumbo and Metro. In 2013, the rebranding process was completed and Cencosud has focused on building brand awareness. According to information received from Nielsen we estimate that we are the third largest player in the Colombian market. For the year ended December 31, 2014, our supermarkets generated revenues from ordinary activities, gross profit and Adjusted EBITDA of Ch$8,159,237 million, Ch$1,955,127 million and Ch$424,108 million, respectively.
As noted under “Item 4. Information on the Company—A. History and Development of the Company—History” above, our supermarket operations have expanded through organic growth and several acquisitions over the past few years. The following table sets forth, for the periods indicated, the effect of the expansion of our supermarket operations:
| | | | | | | | | | | | |
| | | Year ended December 31, | |
| | | 2014 | | | 2013 | | | 2012 | |
| | | (in millions of Ch$)(1) | |
Number of stores | | | 934 | | | | 922 | | | | 888 | |
Total selling space (square meters) | | | 2,386,391 | | | | 2,353,168 | | | | 2,275,172 | |
Average sales per store | | | 8,228 | (2) | | | 8,228 | (2) | | | 8,356 | (2) |
Sales per square meter | | | 2.40 | (2) | | | 2.14 | (2) | | | 0.28 | (2) |
| (1) | Except numbers of stores and selling space. |
| (2) | Does not include Colombian Supermarket operations |
The following table sets forth, for the periods indicated, the revenues from ordinary activities of our supermarkets per country:
| | | | | | | | | | | | |
| | | Year ended December 31, | |
Revenues from ordinary activities | | 2014 | | | 2013 | | | 2012 | |
| | | (in millions of Ch$) | |
Chile | | | 2,354,805 | | | | 2,227,303 | | | | 2,057,975 | |
Argentina | | | 1,813,585 | | | | 1,786,933 | | | | 1,751,868 | |
Brazil | | | 2,154,313 | | | | 2,003,898 | | | | 2,095,104 | |
Peru | | | 836,676 | | | | 745,470 | | | | 713,307 | |
Colombia | | | 999,857 | | | | 919,390 | | | | 115,354 | |
Total | | | 8,159,237 | | | | 7,682,994 | | | | 6,733,610 | |
Chile
At December 31, 2014, we operated 238 supermarkets in Chile, which together had 567,873 square meters of total selling space.
55
The following table sets forth certain information regarding our supermarkets in Chile as of and for the periods indicated:
| | | | | | | | | | | | |
| | | Year ended December 31, | |
| | | 2014 | | | 2013 | | | 2012 | |
Number of stores | | | 224 | | | | 224 | | | | 214 | |
Total selling space (square meters) | | | 546,236 | | | | 546,236 | | | | 524,677 | |
Hypermarkets. Our Jumbo hypermarkets are our largest stores in Chile and have selling areas ranging from 6,000 square meters to 11,816 square meters. At December 31, 2014, we operated 37 Jumbo hypermarkets Chile with total selling space of 279,575 square meters.
The following table sets forth certain information related to our Jumbo hypermarkets in Chile for the periods presented:
| | | | | | | | | | | | |
| | | Year ended December 31, | |
| | | 2014 | | | 2013(*) | | | 2012 | |
Number of stores | | | 37 | | | | 37 | | | | 43 | |
Total selling space (square meters) | | | 279,575 | | | | 279,085 | | | | 286,664 | |
| (*) | the number of hypermarkets has been adjusted in 2013 due to new standards for their classification. Previously some new Jumbo stores of a smaller format (app. 2,500 sq. meters) were classified as hypermarkets. The current presentation separates stores by format (supermarket and hypermarkets) instead of by brand. |
Our Jumbo hypermarkets are primarily oriented towards middle and upper-middle income consumers and are designed to provide a “one-stop” shopping experience by offering a wide selection of quality products with a high level of service. We tailor the product mix of each Jumbo hypermarket according to the preferences of consumers of each specific community. In recent years, we believe Chilean consumers have shown an increasing preference for food stores that offer not only a wide variety of traditional food and non-food items, but also an expanded assortment of prepared items and fresh fruits and vegetables. To respond to this trend, we have decided to upgrade, and continue to upgrade existing departments with product categories, such as the textiles, electronics and home appliance departments. This strategy allows us to provide consumers with a wider selection of food products and services, while shifting our sales mix toward higher-margin products.
Supermarkets At December 31, 2014, we operated 201 supermarkets in Chile under the Santa Isabel and Jumbo Express brands with selling areas ranging from 350 square meters to 3,000 square meters, and total selling space of 279,575 square meters.
The following table sets forth certain information related to our supermarkets in Chile for the periods presented:
| | | | | | | | | | | | |
| | | Year ended December 31 | |
| | | 2014 | | | 2013(*) | | | 2012 | |
Number of stores | | | 201 | | | | 187 | | | | 171 | |
Total selling space (square meters) | | | 272,881 | | | | 266,661 | | | | 238,013 | |
| (*) | the number of supermarkets has been adjusted in 2013 due to new standards for their classification. Previously some new Jumbo stores of a smaller format (app. 2,500 sq. meters) were classified as hypermarkets. The current presentation separates stores by format (supermarket and hypermarkets) instead of by brand. |
We operate our supermarkets in Chile mainly under our Santa Isabel brand, which is primarily aimed at the low- to middle-income segment of the Chilean population. Our Santa Isabel stores sell a wide variety of food products and general merchandise items similar to that offered by our Jumbo hypermarkets; however, Santa Isabel stores also offer higher quality merchandise, and convenient locations. In addition, certain Santa Isabel stores feature higher margin specialty departments such as prepared foods, fresh seafood and bakery departments. Santa Isabel also offers products such as alcohol, cosmetics, household and other non-food items. We recently began using our Jumbo brand to open supermarkets aimed at a middle and upper-middle income consumers interested in quality products and a high level of service. These stores mainly market food items with a special focus on fresh fruits and vegetables while offering a wide array of ready-made foods.
56
Argentina
General
We operated 290 supermarkets in Argentina at December 31, 2014, which together had 529,428 square meters of total selling space. Of our 290 supermarkets in Argentina, 20 were hypermarkets and 270 were supermarkets as of December 31, 2014.
The following table sets forth certain information regarding our supermarkets in Argentina as of and for the periods indicated:
| | | | | | | | | | | | |
| | | Year ended December 31, | |
| | | 2014 | | | 2013 | | | 2012 | |
Number of stores | | | 290 | | | | 290 | | | | 288 | |
Total selling space (square meters) | | | 529,428 | | | | 524,921 | | | | 522,416 | |
Hypermarkets. We opened our first Jumbo hypermarket in Argentina in 1982. Our Jumbo hypermarkets and supermarkets are our largest stores in Argentina and have selling areas ranging from 3,000 square meters to 12,223 square meters. As of December 31, 2013, we operated 20 Jumbo hypermarkets in Argentina, 18 of which are located in the Buenos Aires metropolitan area.
The following table sets forth certain information related to our hypermarkets in Argentina for the periods presented:
| | | | | | | | | | | | |
| | | Year ended December 31, | |
| | | 2014 | | | 2013 (*) | | | 2012 | |
Number of stores | | | 20 | | | | 21 | | | | 24 | |
Total selling space (square meters) | | | 163,068 | | | | 154,100 | | | | 162,499 | |
| (*) | The number of hypermarkets has been adjusted in 2013 due to new standards for their classification. Previously some new Jumbo stores of a smaller format (app. 2,500 sq. meters) were classified as hypermarkets. The current presentation separates stores by format (supermarket and hypermarkets) instead of by brand. |
As in Chile and Colombia, the target market of our Jumbo hypermarkets in Argentina is primarily the middle to upper-middle income segment of the Argentine population. Our Jumbo hypermarkets are generally open 14 to 15 hours per day, depending on location, and have flexible closing hours to accommodate the requirements of the local community. In recent years, upper- and middle-class consumers have shown an increasing preference for food stores that offer not only a wide variety of traditional food and non-food items, but also an expanded assortment of prepared items and fresh fruits and vegetables. Thus, we choose our product mix according to the socioeconomic make-up of the customers at each hypermarket. Each of our Jumbo hypermarkets in Argentina has an area dedicated to customer parking.
As in Chile, our Jumbo hypermarkets in Argentina offer a wide range of food and non-food items, including fresh fruits and vegetables, baked goods, fresh meats and other grocery items. We select our products according to quality and value rather than looking to offer the lowest price products in the market.
Supermarkets. Our supermarkets in Argentina operate under the Disco and Super Vea brands. Disco was founded in 1961 as a small grocery store and was acquired by Ahold in 1998. We acquired Disco on November 1, 2004 for approximately U.S.$315 million. This acquisition added 234 strategically located supermarkets to our operations in Argentina, thus adding an important presence in the city of Buenos Aires. Disco’s strategy has been to segment its stores into “service-oriented” (Disco) and “price-oriented” (Super Vea) formats. Disco also operates a virtual supermarket (Disco Virtual) which allows customers to place orders by telephone and over the internet for home delivery in the Buenos Aires and Córdoba metropolitan areas.
The following table sets forth certain performance metrics related to our supermarkets in Argentina for the periods presented:
| | | | | | | | | | | | |
| | | Year ended December 31, | |
| | | 2014 | | | 2013(*) | | | 2012 | |
Number of stores | | | 270 | | | | 269 | | | | 266 | |
Total selling space (square meters) | | | 366,360 | | | | 365,071 | | | | 359,917 | |
| (*) | The number of supermarkets was adjusted in 2013 due to new standards for their classification. Previously some new Jumbo stores of a smaller format (app. 2,500 sq. meters) were classified as hypermarkets. The current presentation separates stores by format (supermarket and hypermarkets) instead of by brand. |
The target market of our Disco stores is primarily the middle- and high-income segment of the Argentine population. Disco has a service-oriented format and offers a wide variety of products and services to our customers. This format caters to more affluent customers who are willing to pay a premium for higher quality products, a more personalized service and a broader product
57
assortment. To emphasize the service concept, Disco offers a wide variety of services, including internet purchasing options (Disco Virtual), photo developing services (Disco Foto), an in-store credit card (Discocard or Válida), a loyalty program (Discollus) and a system for customers to pay their utility bills at the checkout (Discolago).
We also operate price-oriented stores under the Super Vea brand, which targets primarily the low- and middle-income segment of the Argentine population. Super Vea stores are primarily concentrated in the Cuyo (San Juan and Mendoza) and Northwest (Tucumán, Salta, Catamarca and Santiago del Estero) regions of Argentina and offer a lower level of services with a higher proportion of secondary brands and private labels.
Disco offers a wide range of food and non-food items, including fresh fruits and vegetables, baked goods, fresh meats, cleaning, health and beauty products and other grocery and supermarket items. In addition to general food and non-food items, Super Vea also sells a variety of home appliances, including televisions and refrigerators, as well as other household consumer products.
Brazil
In November 2007, we expanded our supermarket operations into Brazil with the acquisition of the GBarbosa chain of hypermarkets, supermarkets and electronics stores in the North-East region of Brazil, specifically in the states of Alagoas, Bahia and Sergipe. GBarbosa traces its origins to the opening of its first store in the city of Aracaju in July 1955 by its founder, Mr. Gentil Barbosa.
In 2010, we further expanded our operations in Brazil with the acquisitions of the Super Familia supermarket chain and the Perini supermarket chain. Our expansion continued in 2011, with the acquisition of Cardoso, a three-store supermarket chain in the state of Bahia. In 2012, we acquired Prezunic which we estimate is the third-largest supermarket chain in Rio de Janeiro.
As of December 31, 2014, we operated 219 stores in Brazil that together had 602,194 square meters of total selling space. In addition to these, we also operate 152 locations in numerous formats such as Eletro-show stores, pharmacies, gas station and delicatessen under our GBarbosa, Bretas and Perini brands in Brazil. For the year ended December 31, 2014, our supermarkets in Brazil generated revenues from ordinary activities of Ch$2,003,898 million, representing 19.4% of our consolidated revenues from ordinary activities for such period.
The following table sets forth certain information related to our supermarkets in Brazil for the periods presented:
| | | | | | | | | | | | |
| | | Year ended December 31, | |
| | | 2014 | | | 2013 | | | 2012 | |
Number of stores | | | 219 | | | | 221 | | | | 204 | |
Total selling space (square meters) | | | 602,194 | | | | 596,746 | | | | 552,764 | |
| * | Excluding Eletro-show stores and pharmacies operating under the GBarbosa brand. See “—Other Operations—Electronic Stores” and “—Other Operations—Pharmacies.” |
GBarbosa. Our GBarbosa supermarkets represent our largest store format in Brazil. Our GBarbosa supermarkets have selling areas ranging from 400 to 8,000 square meters. GBarbosa supermarkets sell products such as fresh fruit and vegetables, meat, poultry, dairy products, alcoholic beverages, textiles, cosmetics and cleaning products, in addition to more gourmet items, such as delicatessen products, fresh fish and bakery items. Our GBarbosa supermarkets also offer a wide range of non-food products, such as electronics, home appliances and textiles, which represent an important share of its sales.
Mercantil Rodrigues. At December 31, 2014, we also owned and operated Mercantil Rodrigues cash and carry in Brazil. Mercantil Rodrigues offer a wide range of food items, including fresh fruits and vegetables, baked goods, fresh meats and other grocery items.
Super Familia. On March 23, 2010, we acquired 100% of the outstanding shares of Super Família Comercial de Alimentos Ltda., operator of the Super Familia supermarket chain in Brazil, for approximately U.S.$33.1 million (approximately Ch$17,396 million). We acquired four Super Familia stores in the city of Fortaleza, with a total sales area of 7,000 square meters, and two distribution centers. In 2011, we rebranded the Super Familia stores into the GBarbosa brand.
Perini. On July 5, 2010, we acquired 100% of the outstanding shares of Perini Comercial do Alimento Ltda., operator of the four-store chain of Perini supermarkets in the city of Salvador da Bahia in Brazil, for approximately U.S.$27.7 million (approximately Ch$14,899 million). Perini is a well-known brand in Brazil with 47 years in the market that targets the high-end retail customer segment and complements our business portfolio in Brazil. In addition to the four Perini stores in the city of Salvador da Bahia, we also acquired four additional points of sales inside shopping centers, with a total sales area of 4,900 square meters, and two distribution centers. In 2012, we opened a new Perini store in the city of Recife inside the Riomar shopping center and closed one distribution center. We currently operate five stores that are serviced by a single distribution center.
58
Bretas. On October 31, 2010, we acquired 100% of the outstanding shares of Irmaos Bretas Filhos e Cía. Ltda., operator of the 63-store chain of Bretas supermarkets in the state of Minas Gerais in Brazil, for approximately U.S.$705 million (approximately Ch$336,630 million). Bretas is a well-known brand in Brazil with 56 years in the supermarket industry. In addition to the 63 Bretas stores, we also acquired 10 additional gas stations, and two distribution centers.
Cardoso. In October 2011, we acquired Cardoso, a three-store supermarket chain in the state of Bahia, with annual net sales of approximately R$60 million (U.S.$35.9 million) in 2011. We agreed to pay the purchase price of R$18 million (approximately U.S.$11.3 million or Ch$5,429 million) in three installments, 60% on the closing of the transaction, 20% on the six-month anniversary of the closing date and the remaining 20% on the first year anniversary of the closing date. We have converted the acquired stores to the GBarbosa format and are now operating them under that brand.
Prezunic. On January 2, 2012, pursuant to a stock purchase agreement executed on November 16, 2011, Cencosud Brasil acquired from the Dias Da Cunha family 100% of the capital stock of Prezunic. We estimate that Prezunic is the third-largest supermarket chain in Rio de Janeiro with 31 stores and net sales of approximately R$2.2 billion in 2011. The aggregate purchase price of the operation was R$875 million (or approximately Ch$242,690 million), payable as follows: R$580 million on the closing date of the transaction (January 2, 2012), from which R$190 million were deducted as working capital adjustments, with the balance to be paid as follows: R$80 million, R$85 million, R$80 million and R$50 million, on the first, second, third and fourth anniversary of the closing date, respectively. Pursuant to the stock purchase agreement, Cencosud Brasil was also granted a preferential right from third-party landowners to acquire or lease two supermarket properties that were not owned by Prezunic at the time of the transaction, but were instead leased. Under the terms of this agreement, Cencosud S.A. serves as guarantor of Cencosud Brazil.
Peru
On January 31, 2008, we acquired 100% of the shares of GSW S.A., operating under the brand name Wong in Peru, for approximately U.S.$467 million (approximately Ch$217,295 million). As of December 31, 2014, we operated 87 Wong and Metro hypermarkets and supermarkets in Peru which together had 261,700 square meters of total retail selling space. For the year ended December 31, 2014, our stores in Peru generated revenues from ordinary activities of Ch$745,470 million, representing 7.2% our consolidated revenues from ordinary activities for such period.
The following table sets forth certain information related to our Wong and Metro supermarkets and hypermarkets in Peru for the periods presented:
| | | | | | | | | | | | |
| | | Year ended December 31, | |
| | | 2014 | | | 2013 | | | 2012 | |
Number of stores | | | 87 | | | | 87 | | | | 86 | |
Total selling space (square meters) | | | 261,700 | | | | 259,360 | | | | 258,762 | |
Hypermarkets. As of December 31, 2014 we operated 73 hypermarkets mainly under our Metro brand in Peru, which had an average selling area of 2,962 square meters. Metro stores carry our full line of products and brands, at a variety of price points. The target market of our Metro stores is primarily the middle- and low-income segment of the Peruvian population.
Supermarkets. As of December 31, 2014 we operated 14 supermarkets in Peru mainly under our Wong brand, which had an average selling area of 2,310 square meters. Our Wong stores carry our full line of products and brands, at a variety of price points. In addition, some Wong stores contain separate specialty retail facilities operated by third parties. The target market of our Wong stores is primarily the middle- and high-income segment of the Peruvian population.
Colombia
On November 30, 2012, we completed the acquisition of Carrefour’s supermarket operations in Colombia, for a total purchase price equal to €2 billion. Carrefour previously operated supermarkets under the “Carrefour” and “Maxi” brand names in Colombia, including 72 hypermarket stores, 16 convenience stores, and four cash and carry stores and gas stations. See “Item 4. Information on the Company—A. History and Development of the Company—History.”
59
The following table sets forth certain information related to our supermarkets and hypermarkets in Colombia for the periods presented:
| | | | | | | | | | | | |
| | | Year ended December 31, | |
| | | 2014 | | | 2013 | | | 2012 | |
Number of stores | | | 100 | | | | 100 | | | | 96 | |
Total selling space (square meters) | | | 425,196 | | | | 425,908 | | | | 416,699 | |
As of December 31, 2014 the hypermarkets we operated in Colombia had an average selling space 4,252 square meters. These stores carry a varied assortment of goods at a variety of price points. Cencosud completed the rebranding of these supermarkets in the third quarter of 2013, bringing to the Colombian market its Jumbo and Metro brands. As in the other countries where we operate, Jumbo hypermarkets are primarily targeted at the upper- to middle-income segment of the population offering a wide range of imported products with high quality standards for its perishables and service. As in Peru our Metro hypermarkets target the mid to lower income segment of the population and have a more promotional approach offering a combination of competitive pricing through specific promotional activities and lower degree of service relative to Jumbo while trying to offer the highest quality product available at those prices.
Hypermarkets. As in Chile and Argentina, the target market of our Jumbo hypermarkets in Colombia is primarily the middle to upper-middle income segment of the Colombian population. Our Jumbo hypermarkets are generally open 14 to 15 hours per day, depending on location, and have flexible closing hours to accommodate the requirements of the local community. After the acquisition of Carrefour´s supermarket operations in Colombia Cencosud chose to rebrand locations aimed at this time of consumer under its flagship Jumbo brand. Cencosud aims to take best practices from its operations in Chile and Argentina to Colombia, taking its focus on food and particularly perishable items in conjunction to its service focus to the Colombian consumer. Our Jumbo locations are usually situated in areas of the country that support the need for an upper-middle income focused store and they adapt their product assortment to the needs of each community.
In addition to its Jumbo hypermarket operations in Colombia, Cencosud also operates hypermarkets under its Metro brand. These hypermarkets have a greater focus on the middle-low income segment of the population. These stores are usually open 14 to 15 hours a day, depending on location and have flexible closing hours to accommodate the needs of the local community. Unlike Jumbo hypermarkets, Metro has a greater focus on promotional strategies for its clients and is aimed at those that value price without neglecting quality.
Total selling space for our hypermarkets in Colombia is 425,196 square meters.
Supermarket. Our supermarkets in Colombia operate under the Metro Express brand. These locations are aimed at a consumer that values proximity to a “one-stop shop” location. As of December 31, 2014, Cencosud operated 21 stores under this brand with a total selling space of 4,065 square meters. These supermarkets offer a limited variety of products due to the size of the locations.
Home improvement stores
General
In 1993 we opened our first Easy home improvement store segment in Chile and, since 2002, we have rapidly expanded our home improvement operations. As of December 31, 2014, we operated 93 Easy home improvement stores in Argentina, Chile and Colombia dedicated to home improvement, hobbies and construction. We believe we are the second-largest home improvement store operator in Chile and the largest in Argentina in terms of selling space, based on our comparisons against information from public filings of our main competitors as of December 31, 2014, and on information provided in the report by Planet Retail, a third-party research company, dated as of that date. In October 2008, we opened the first home improvement store in Colombia, where we operated ten stores and 82,320 square meters of selling space as of December 31, 2014. For the year ended December 31, 2014, our home improvement stores generated revenues from ordinary activities, gross profit and Adjusted EBITDA of Ch$1,225,616 million, Ch$425,275 million and Ch$119,148 million, respectively.
Our home improvement operations have expanded through organic growth and several acquisitions over the past three years. The following table sets forth, for the periods indicated, information regarding the expansion of our home improvement operations:
| | | | | | | | | | | | |
| | | Year ended December 31, | |
| | | 2014 | | | 2013 | | | 2012 | |
Number of stores | | | 93 | | | | 89 | | | | 82 | |
Total selling space (square meters) | | | 779,606 | | | | 757,074 | | | | 705,933 | |
60
The following table sets forth, for the periods indicated, the revenues from ordinary activities of our home improvement stores per country:
| | | | | | | | | | | | |
| | | Year ended December 31, | |
| | | 2014 | | | 2013 | | | 2012 | |
| | | (in millions of Ch$) | |
Revenues from ordinary activities | | | | |
Chile | | | 465,520 | | | | 448,703 | | | | 400,375 | |
Argentina | | | 692,925 | | | | 682,010 | | | | 619,985 | |
Colombia | | | 67,171 | | | | 46,177 | | | | 42,727 | |
Total | | | 1,225,616 | | | | 1,176,890 | | | | 1,063,086 | |
| | | | | | | | | | | | |
Chile
In Chile, we operate our home improvement store business through 33 Easy home improvement stores. For the years ended December 31, 2014, 2013 and 2012, Easy home improvement stores in Chile generated revenues from ordinary activities of Ch$465,520, Ch$ 448,703 million and Ch$ 400,375 million, respectively, representing 4.3%, 4.4% and 4.4% of our consolidated revenues from ordinary activities during those periods.
The following table sets forth certain information related to our Easy home improvement stores in Chile for the periods presented:
| | | | | | | | | | | | |
| | | Year ended December 31, | |
| | | 2014 | | | 2013 | | | 2012 | |
Number of stores | | | 33 | | | | 32 | | | | 31 | |
Total selling space (square meters) | | | 313,500 | | | | 307,853 | | | | 299,806 | |
Our Easy home improvement stores are oriented toward three groups of consumers: professional construction contractors and home improvement professionals, people interested in “do-it-yourself” projects and hobby enthusiasts. Each store is designed to provide customers with a “one-stop” shopping experience for home improvement needs. Our Easy home improvement stores offer a wide variety of home improvement items, including hardware, tools, construction and plumbing materials, electrical products, sporting goods, gardening supplies and other household wares. To complement our products and enhance service, each of our Easy home improvement stores also provides for free, or at a nominal charge, technical advice, home delivery, recommended contractors or builders, and cutting of wood and steel. Additionally, Easy allows customers to return unused products for any reason within a certain period of time.
Easy has a centralized purchasing model based on demand forecasting. However, each store can generate its own supplementary purchases. Price and commercial terms are overseen by different business managers in charge of negotiating with major providers. The product mix is determined based on the needs of the particular community that the store serves. Each year a commercial agreement is signed with each of our suppliers. These commercial agreements are standard for all suppliers and cover the terms on which goods are bought by Easy including volume, discounts, marketing expenses born by the supplier, fees charged for the use of space in the store, logistics expenses, and space in new stores. At December 31, 2014, our Easy home improvement stores in Chile have an average selling area of ranging from 3,266 square meters to 14,469 square meters, with an average of 9,500 square meters of selling area. Each of our Easy home improvement stores has easily accessible car parking and many are located at our shopping centers. Our Easy home improvement stores offer a variety of products, including (i) flooring, paints, bath and kitchen materials; (ii) home, furniture, garden and hobby materials; (iii) hardware, electrical and plumbing materials; (iv) building and wholesale construction materials; and (v) agricultural products.
Argentina
In Argentina, we operate our home improvement store business through 50 Easy and Blaisten home improvement stores, which had 383,786 square meters of total selling space as of December 31, 2014. For the year ended December 31, 2014, our home improvement stores in Argentina generated revenues from ordinary activities of Ch$ 692,925 million, representing 6.5% of our consolidated revenues from ordinary activities during such period.
61
The following table sets forth certain information related to our Easy home improvement stores in Argentina for the periods presented:
| | | | | | | | | | | | |
| | | Year ended December 31, | |
| | | 2014 | | | 2013 | | | 2012 | |
Number of stores | | | 50 | | | | 48 | | | | 47 | |
Total selling space (square meters) | | | 383,786 | | | | 373,490 | (1) | | | 369,067 | |
| (1) | Methodology for the calculation of selling space was modified in 2013 to exclude aisles and cashier space. |
Our home improvement business in Argentina has expanded rapidly over the past few years, primarily through the acquisition of four former Home Depot stores in 2002 and nine Blaisten stores in 2008. Our home improvement stores are located in 14 provinces of Argentina and include 11 stores in the Buenos Aires federal district and 23 in the Buenos Aires province. At December 31, 2014, our Easy and Blaisten home improvement stores in Argentina have an average of 7,676 square meters of selling space. Each of our Easy home improvement stores in Argentina has easily accessible car parking and many are located at our shopping centers.
Our Easy home improvement stores in Argentina offer a variety of products, including (i) flooring, paints, bath and kitchen materials; (ii) home, furniture, garden and hobby materials; (iii) hardware, electrical and plumbing materials and (iv) building and wholesale construction materials.
Colombia
In May 2007, we entered into a joint venture with Casino to develop the home improvement store business in Colombia, and subsequently acquired 100% ownership of the joint venture. In October 2008, we opened our first Easy home improvement store in Bogota, and as of December 31, 2014 we operated ten Easy home improvement stores. For the year ended December 31, 2014, our Easy home improvement stores in Colombia generated revenues from ordinary activities of Ch$67,171 million, representing 0.6% of our consolidated revenues from ordinary activities for such period. Nine of our Easy home improvement stores are located in Bogota and one is located in the city of Medellin.
The following table sets forth certain information related to our Easy home improvement stores in Colombia for the periods presented:
| | | | | | | | | | | | |
| | | Year ended December 31, | |
| | | 2014 | | | 2013 | | | 2012 | |
Number of stores | | | 10 | | | | 9 | | | | 4 | |
Total selling space (square meters) | | | 82,320 | | | | 75,733 | | | | 37,060 | |
Our Easy home improvement stores in Colombia have selling areas ranging from 8,168 square meters to 9,895 square meters, with an average selling area of 8,232 square meters. Each of our Easy home improvement stores has easily accessible car parking.
Our Easy home improvement stores in Colombia offer a variety of products, including (i) flooring, paints, bath and kitchen materials; (ii) home, furniture, garden and hobby materials; (iii) hardware, electrical and plumbing materials; (iv) building and wholesale construction materials and (v) agricultural products.
62
Department Stores
We entered the department store business in March 2005 through the acquisition of Empresas Almacenes Paris S.A., one of Chile’s leading department stores in terms of sales and number of stores. The principal activity of Paris is the retail sale of clothing products (including clothes for women, men and children, shoes and accessories) which represent approximately 55% of Paris’ sales, as well as of household goods, electronics and technology products which represent the other 45% of Paris’ sales, each as of December 31, 2014. As of December 31, 2014, we estimate that we were the second-largest department store operator in Chile, in terms of sales. Based on our comparison against information from public filings of our main competitors as of December 31, 2014, we also believe we have the largest selling space for department stores in Chile.
As of December 31, 2014, we operated 79 department stores in Chile, which together had 375,586 square meters of total selling space. In Peru, our Paris store operations comprise 9 stores with 45,232 square meters of selling space. For the years ended December 31, 2014, 2013 and 2012, our department stores generated revenues from ordinary activities of Ch$ 991,442 million, Ch$ 970,360 million, and Ch$886,075 million, respectively, representing 9.3%, 9.4% and 9.7% of our consolidated revenues from ordinary activities for such periods.
The following table sets forth certain information related to our department stores in Chile for the periods presented:
| | | | | | | | | | | | |
| | | Year ended December 31, | |
| | | 2014 | | | 2013 | | | 2012 | |
Number of stores | | | 79 | | | | 77 | | | | 78 | |
Total selling space (square meters) | | | 375,586 | | | | 371,891 | | | | 377,191 | |
Chile
Our Paris department stores in Chile have selling areas ranging from 2,568 square meters to 11,872 square meters, with an average selling area of 6,704 square meters. In our Johnson format in Chile, we have selling areas ranging from 454 square meters to 5,718 square meters, with an average selling area of 2,967 square meters.
Our Paris department stores carry a variety of products, including (i) clothing, (ii) accessories and cosmetics, (iii) home décor, (iv) electronic and household appliances, (v) sporting goods, and (vi) footwear. Our Paris department stores currently carry private label products under the brands Opposite, Alaniz, Tribu, Attimo, Rainforest, Greenfield, Suburbia, Muv, Fes, Yoko and Aussie, among others.
Peru
The following table sets forth certain information related to our department stores in Peru for the periods presented:
| | | | | | | | | | | | |
| | | Year ended December 31, | |
| | | 2014 | | | 2013 | | | 2012 | |
Number of stores | | | 9 | | | | 6 | | | | — | |
Total selling space (square meters) | | | 45,232 | | | | 32,208 | | | | — | |
Our Paris department stores operations in Peru were launched in 2013 and have selling areas ranging from 3,543 square meters to 7,970 square meters, with an average selling area of 5,026 square meters.
Shopping Centers
General
We are a regional operator of shopping centers in Latin America with operations in Chile, Argentina, Peru and Colombia. We are the largest operator of shopping centers in Argentina and the second in Chile in terms of total area for lease, on the basis of our comparisons with public information of our main competitors. We had a total leasable area of 800,272 square meters December 31, 2014. We are owners and operators of 25 shopping centers in Chile, 22 in Argentina and four in Peru, in addition to having the majority stake in two shopping centers in Colombia.
Within the shopping center business, we operate the following formats:
| | • | | Mega Center (1): Shopping Centers over 100,000 square meters of gross leasable area, or GLA, containing mixed-use space, anchor stores, satellite shops, medical centers, offices and hotels. |
63
| | • | | Regional (3): Shopping Centers up to 100,000 square meters of GLA with impact on multiple geographic areas, anchors, satellites and medical centers. |
| | • | | Neighborhood (20): Shopping Malls with up 70,000 square meters of GLA with areas of influence in the surrounding communities, with anchors, satellites and in some cases medical centers. |
| | • | | Factory (3): Shopping Centers for discount brands. |
| | • | | Power Centers (17): Centers of up to 35,000 square meters of GLA including a maximum of two Anchor stores and a small number of local satellite stores. |
| | • | | Strip Centers (2): Centers with up to 10,000 square meters of GLA with one anchor store with a maximum of 5,000 square meters, plus an additional satellite store. |
In Chile and Argentina, almost all of our shopping center formats host a Jumbo hypermarket, an Easy home improvement store, and in Chile and Peru they host a Paris department store while also housing other third party business. Cencosud seeks to attract more traffic by meeting the consumers’ needs in a better fashion and by improving the overall shopping experience.
The following table sets forth, for the periods indicated, the revenues from ordinary activities of our shopping centers per country:
| | | | | | | | | | | | |
| | | Year ended December 31, | |
| | | 2014 | | | 2013 | | | 2012 | |
| | | (in millions of Ch$) | |
Revenues from ordinary activities | | | | | | | | | | | | |
Chile | | | 120,734 | | | | 112,838 | | | | 93,091 | |
Argentina | | | 66,589 | | | | 69,297 | | | | 65,468 | |
Peru | | | 17,438 | | | | 14,555 | | | | 12,726 | |
Colombia | | | 10,089 | | | | 8,642 | | | | 819 | |
Total | | | 214,850 | | | | 205,332 | | | | 172,104 | |
| | | | | | | | | | | | |
Chile
In Chile, Cencosud is the second largest mall operator, and owns and operates 25 shopping centers with 98% occupancy and with over 1 million square meters in total GLA, under the following formats Mega Center, Regional, Neighborhood, Strip Centers and Power Centers.
The shopping centers are located throughout Chile, having nine shopping centers located in Santiago and 16 other regions. During 2012 we opened Costanera Center, the first mixed-use Mega Center in Chile and one of the largest and most successful in the Latin American shopping center industry. The waterfront project also comprises four office towers and a hotel, within the project. The mall itself is six stores high with segmented levels by categories, which marks another step towards the innovation taken by Cencosud in the industry. The Shopping center boasts a marketable area of 152,667 square meters and over 300 stores.
Additionally Cencosud operates a mega center in Santiago, eight regional shopping centers, fifteen neighborhood shopping centers in Santiago and the rest of the country under the brand Portal (e.g. La Dehesa, La Florida, Nuñoa and La Reina, Bellotto, Rancagua, Talcahuano, Temuco, Osorno) and one Power Center.
The following table shows certain information regarding the shopping centers we own in Chile as of and for the year ended December 31, 2014.
| | | | | | | | | | | | | | | | |
Chile | | Number
of Malls | | | GLA
Total | | | GLA
Third Party | | | GLA Related
Party | |
| | | | | | (square meters) | |
Mega Center | | | 1 | | | | 152,667 | | | | 115,740 | | | | 36,927 | |
Regional | | | 8 | | | | 471,603 | | | | 221,501 | | | | 250,102 | |
Neighborhood | | | 15 | | | | 360,871 | | | | 21,253 | | | | 339,618 | |
Power Center | | | 1 | | | | 117,920 | | | | 74,559 | | | | 43,362 | |
| | | | | | | | | | | | | | | | |
Total | | | 25 | | | | 1,103,061 | | | | 433,053 | | | | 670,008 | |
64
Argentina
Cencosud is the first shopping center operator in Argentina, with a market share estimated at 36%, and a total GLA of over 700,000 square meters in the country, with 22 shopping centers with 97% occupancy.
In Argentina, Cencosud owns and operates five different formats: regional, neighborhood, factory, power centers and strip center.
Unicenter, based in Buenos Aires, is the main regional shopping center in the country. Cencosud also operates 6 neighborhood shopping centers under the brand Portal, 1 factory, 3 power centers and 11 strip centers.
Marketing strategies and advertising, along with the creation of an attractive and efficient operational mix, have positioned us at the top in terms of brand recognition as evidenced by the rankings compiled by various industry magazines.
Each of our shopping centers in Argentina has a Jumbo hypermarket or a Disco or Super Vea supermarket, and all except Unicenter have an Easy home improvement store. We seek to “anchor” shopping centers around Jumbo and Easy stores and to promote the flow of consumers to such destinations by including other tenants that complement the services and merchandise offered by Jumbo and Easy stores. Since 2002, we have also actively worked to promote this flow with the launch of our Aventura family entertainment centers. Unlike Chilean shopping centers, shopping centers in Argentina typically do not have anchor department store tenants.
The following table presents certain information regarding the shopping centers we own in Argentina as of December 31, 2014.
| | | | | | | | | | | | | | | | |
Argentina | | Number
of Malls | | | GLA
Total | | | GLA
Third Parties | | | GLA
Related
Parties | |
| | | | | | (square meters) | |
Regional | | | 1 | | | | 98,374 | | | | 74,632 | | | | 23,741 | |
Neighborhood | | | 6 | | | | 102,888 | | | | 15,748 | | | | 87,140 | |
Factory | | | 1 | | | | 5,229 | | | | 492 | | | | 4,737 | |
Power Center | | | 3 | | | | 117,632 | | | | 37,073 | | | | 80,559 | |
Strip Center | | | 11 | | | | 422,616 | | | | 153,569 | | | | 269,047 | |
| | | | | | | | | | | | | | | | |
Total | | | 22 | | | | 746,739 | | | | 281,515 | | | | 465,225 | |
Peru
In Peru, Cencosud owns and operates three malls, with a GLA of 123,144 square meters, a regional shopping center called Plaza Lima Sur located in Lima, a neighborhood mall in the city of Arequipa, called Arequipa Center and two Strip Centers in Lima.
The following table presents certain information regarding the shopping centers we own in Peru as of December 31, 2014:
| | | | | | | | | | | | | | | | |
Peru | | Number
of Malls | | | GLA
Total | | | GLA
Third Parties | | | GLA
Related
Parties | |
| | | (square meters) | |
Regional | | | 1 | | | | 75,897 | | | | 43,634 | | | | 32,263 | |
Neighborhood | | | 1 | | | | 30,280 | | | | 17,075 | | | | 13,204 | |
Strip Center | | | 2 | | | | 16,968 | | | | 10,481 | | | | 6,486 | |
| | | | | | | | | | | | | | | | |
Total | | | 4 | | | | 123,144 | | | | 71,191 | | | | 51,953 | |
Colombia
In Colombia, Cencosud has a majority stake in two shopping centers, El Limonar Shopping Center in the city of Cali with 154 stores and Shopping Center Santa Ana with 54 stores in the city of Bogotá, altogether totaling 34,094 square meters of GLA.
| | | | | | | | | | | | | | | | |
Colombia | | Number
of Malls | | | GLA
Total | | | GLA
Third Parties | | | GLA
Related
Parties | |
| | | (square meters) | |
Local | | | 2 | | | | 34,094 | | | | 14,514 | | | | 19,580 | |
Total | | | 2 | | | | 34,094 | | | | 14,514 | | | | 19,580 | |
| | | | | | | | | | | | | | | | |
65
Financial Services
General
Our financial services division was established in 2003 when we launched our “Jumbo Más” credit card. With our acquisition of Paris in 2005, we obtained our predecessor’s credit card accounts and thus significantly expanded our credit card business. We rolled out a single Cencosud brand for our credit cards throughout our operations in South America, which will allow us to take a greater advantage of the “Cencosud” brand as well as to achieve greater operational efficiencies, and will make us able to consolidate under one common database all relevant information for our customers. Through this strategy, we expect to achieve higher penetration of our credit card business as we encourage consumers to use our credit cards rather than third-party cards, such as Visa or MasterCard. In Chile, during the year ended December 31, 2014, 43.0% of total sales in department stores, 13.2% in supermarkets and 20.5% in home improvement stores, were paid with one of our credit cards. As of December 31, 2014, we had over 6 million active credit card accounts. Our financial services operations also include joint ventures in Brazil and Colombia and an insurance brokerage in Chile.
The following table sets forth, for the periods indicated, the revenues from ordinary activities from our financial services operations per country, as of December 31, 2014:
| | | | | | | | | | | | |
| | | Year ended December 31, | |
| | | 2014 | | | 2013 | | | 2012 | |
| | | (in millions of Ch$) | |
Revenues from ordinary activities (continuing operations) | | | | | | | | | | | | |
Chile | | | 330 | | | | 0 | | | | 0 | |
Argentina | | | 62,596 | | | | 44,740 | | | | 41,238 | |
Brazil(1) | | | 3,843 | | | | 3,983 | | | | 3,676 | |
Peru | | | 42,814 | | | | 25,347 | | | | 13,115 | |
Colombia(2) | | | 8,095 | | | | 7,581 | | | | 425 | |
Total | | | 117,679 | | | | 81,651 | | | | 58,453 | |
| | | | | | | | | | | | |
| (1) | Joint venture with Banco Bradesco |
| (2) | Joint Venture with Colpatria |
Credit Risk from the credit card business.
Given the relative importance of our exposure to the credit card business as compared to total maximum credit risk exposure, Cencosud has targeted its credit risk management toward developing a management model for its own credit cards as well as the banking business that is consistent with the Company’s strategic guidelines and the profiles of its credit transactions. The model takes into consideration the large-scale and fragmented nature of the cardholder portfolio and is structured in terms of cardholder selection, portfolio management and recovery of cardholders in default.
Business Definition
The financial services business is defined as one more element of Cencosud’s value offering, which complements the comprehensive product and service offerings the Company provides through each of its retail business units and is aimed at building long-term relationships with our customers. The largest percentage of the financial retail business corresponds to the Cencosud Credit Card in Chile, which has been operating for more than 20 years. In order to continue the development of this business the Company entered the Joint Venture Framework Agreement. In other markets the Company had already established joint ventures in order to complement its value offering for consumers in Brazil with Banco Bradesco, and in Colombia with Banco Colpatria. Compared to Chile, the card’s market penetration is less pronounced in other countries, such as Peru where it has been available for three years and for one year under the name of Banco Cencosud Peru.
Risk Model
Foundations:
The Risk Management Model is tightly linked to the large-scale and fragmented nature of the retail cardholder portfolio with a very large volume of cardholders (more than 6,000,000 in the region).
In this context, the challenge lies in managing the cardholder portfolio and its associated risk, building long-term relationships with cardholders and making the value proposition and the retail business sustainable over time. Risk management is structured to ensure:
| | • | | Optimum cardholder selection. |
66
| | • | | Optimum portfolio management, which involves activating, strengthening, retaining, reducing and containing the portfolio card holders. |
| | • | | Optimum collections management for cardholders in default, maximizing recovery with high standards of quality and service, without affecting the comprehensive bond with Cencosud’s customers. |
Cardholder management efforts are broadly targeted to include all customers, from our target market to prospective customers, including those with or without retail purchases, with or without credit card movements and with or without payments in default.
a. Key Risk Management Factors
The large-scale and fragmented nature of the business determines portfolio management, in which the following key risk management factors are key:
| | • | | Automation and centralization of decision making. |
| | • | | Management of information and earnings projections. |
| | • | | Collections management. |
| | • | | Large-scale and selective control model for credit and collections circuit. |
| | • | | Provision models to cover portfolio risk in line with Basel II standards. |
Automation and centralization of decision making: credit and collections decisions are large-scale and automated and only specific cases are analyzed by very specialized personnel. The Company features world class risk management and collections systems, including Capstone Decision Accelerator (CDA), TRIAD, Model Builder (from Fair Isaac Corporation - FICO) and Cyber Financial (from Inffinix), among others.
Customer segmentation: processes are segmented, differentiated by strategy and action tactics per risk profile, activity level and likelihood of occurrence, among others.
Management of information and earnings projections: the Company manages comprehensive information and statistical models on all relevant business and customer variables, which allows it to make timely, prognostic decisions.
Collections management: the Company has one sole collections model for managing collections for retail cards, which uses an outsourcing collection model to efficiently recover debt through quality management of debtors.
Large-scale and selective control model for credit and collections circuit: the Company has large-scale controls over all phases of the credit and collections process, from its centralized processes to its point-of-sale and collections processes.
Provision models to cover portfolio risk in line with Basel II standards: the Company has different provisions models that adhere to local regulations in each country as well as Basel II standards, in order to most adequately reflect cardholder portfolio risk. External variables which affect payment behavior are also included in statistical models for estimating provisions. The Company is making progress in each country on implementing anti-cyclical provisions based on industry best practices, having started with Chile and Peru and, in 2012, Argentina. It also uses back testing to periodically monitor the sufficiency of the provisions it establishes.
Lastly, the Company has a corporate governance strategy that includes, among others, local Risk Committees for each country and a Corporate Risk Committee in which directors and senior executives participate. These committees have the following objectives, among others:
| | • | | Monitor the business’s main risk indicators. |
| | • | | Monitor the correct functioning of policies and credit and collections processes. |
| | • | | Authorize entry into new markets and/or new products that impact risk. |
| | • | | Authorize provisions models and monitor sufficiency. |
67
Chile
Credit cards
We are engaged in the credit card business in Chile through the issuance of our private label Cencosud credit card, which has a strong presence in our stores and can be used at a variety of affiliated businesses and by offering cards under the Visa and Mastercard banners. As of December 31, 2014, we had approximately 2,069 million active credit card accounts in Chile. Through our Cencosud card, we have increased the purchasing power of our middle- and low-income clients, who generally do not have credit offers with other institutions, and are generally unable to bear the fixed costs charged by other credit cards.
In addition to increasing sales and traffic in our stores, we also seek to achieve a financial return by facilitating access to credit for an underserved segment of the population. We target all customers of our stores as well as customers in affiliated businesses. Many of our credit card customers also have access to cash advances they can access from tellers at Jumbo, Santa Isabel, Paris, Easy and Turbus stores or from the ATM network of Banco Santander, allowing them to make cash withdrawals in many points of Chile.
Our Cencosud credit cards offer a single credit card with features including monthly payments of minimum charge, revolving credit and installment loans. In addition, when using our Cencosud credit cards, customers also receive added benefits such as access to discounts and special offers and accumulation of points, which are usable in our loyalty program and can later be used to make purchases in our stores. Cardholders are charged administrative fees, and interest charges are based on individual extensions of credit. The average monthly interest rate charged to cardholders as of December 31, 2014, 2013 and, 2012 was 2.90%, 3.35% and 3.27% respectively. We adjust the interest rates on our credit cards regularly in response to costs of funding and standard rates in the industry. The revolving interest rates charged to cardholders are floating.
The following table sets forth the credit cards sales by Jumbo, Santa Isabel, Easy and Paris in Chile and the percentage that such sales represent of each store’s total sales for the periods presented:
| | | | | | | | | | | | | | | | | | | | | | | | |
| | | Year ended December 31, | |
| | | 2014 | | | 2013 | | | 2012 | |
| | | Sales | | | % | | | Sales | | | % | | | Sales | | | % | |
| | | (in millions of Ch$)(1) | |
Jumbo | | | 293,222 | | | | 17.5 | % | | | 276,449 | | | | 17.6 | % | | | 264,586 | | | | 18.58 | % |
Santa Isabel | | | 69,978 | | | | 6.2 | % | | | 74,470 | | | | 6.8 | % | | | 83,146 | | | | 8.04 | % |
Easy | | | 115,262 | | | | 20.7 | % | | | 109,803 | | | | 20.5 | % | | | 95,517 | | | | 19.95 | % |
Paris | | | 400,536 | | | | 43.6 | % | | | 426,533 | | | | 46.0 | % | | | 430,019 | | | | 49.42 | % |
Johnson | | | 47,948 | | | | 26.8 | % | | | 46,384 | | | | 26.9 | % | | | 0 | | | | 0 | |
Total(2) | | | 926,946 | | | | 21.2 | % | | | 933,639 | | | | 21.7 | % | | | 873,269 | | | | 22.94 | % |
| | | | | | | | | | | | | | | | | | | | | | | | |
| (2) | Includes value added taxes. |
The table below sets forth information with respect to our credit card receivables in Chile:
| | | | | | | | | | | | |
| | | Year ended December 31, | |
| | | 2014 | | | 2013 | | | 2012 | |
| | | (in millions of Ch$)(1) | |
Portfolio Status | | | | | | | | | | | | |
Performing(2) | | | 351,532 | | | | 406,239 | | | | 401,360 | |
Past due: | | | | | | | | | | | | |
31-89 days | | | 18,425 | | | | 20,542 | | | | 25,116 | |
90-180 days | | | 14,752 | | | | 17,106 | | | | 20,923 | |
181-365 days | | | | | | | | | | | — | |
Total | | | 384,709 | | | | 443,888 | | | | 447,400 | |
Over 365 days and legal proceedings(3) | | | | | | | | | | | — | |
Loan loss allowance as % of past due loans | | | 61.9 | % | | | 77.01 | % | | | 67.2 | % |
Loan loss allowance as % of all loans(4) | | | 5.3 | % | | | 6.53 | % | | | 6.9 | % |
| (2) | Performing loans not past due more than 30 days. |
| (3) | Entire portfolio written off. These claims are subject to a 100% allowance. |
| (4) | Loan loss allowance does not include Ch$3,533 million of anti-cyclical provisions |
68
The following table sets forth certain information regarding our non-performing loans and write-offs, for the periods indicated:
| | | | | | | | | | | | |
| | | Year ended December 31, | |
| | | 2014 | | | 2013 | | | 2012 | |
| | | (in millions of Ch$)(1) | |
Non-performing loans as % of total loans | | | 8.6 | % | | | 8.48 | % | | | 10.29 | % |
Total write-offs | | | 41,382 | | | | 57,018 | | | | 69,980 | |
Average monthly write-offs as % of total loans | | | 0.9 | % | | | 1.07 | % | | | 1.30 | % |
On June 20, 2014, we entered into the Joint Venture Framework Agreement with Scotiabank to develop, on a joint basis, the retail finance business in Chile. Under this agreement, we believe that 2.5 million cardholders will benefit from easier access to new products and financial services and the expertise of Scotiabank, while receiving the Company’s client benefits at our Jumbo, Santa Isabel, Easy, Paris and Johnson stores and shopping centers. See “Item 4. Information on the Company – A. History and Development of the Company – History.”
Insurance brokerage
We entered into the insurance business to complement our credit card offerings, offering extended warranties for certain of the electronic products sold at our stores. We also offer other attractive insurance plans to our existing retail customers. Our insurance activities focus on the sale of life, medical, unemployment, home and car insurance, in simple formats and at accessible rates focusing on underserved socio-economic segments. Our insurance products are sold through our distribution channels and are supported by telemarketing and personalized marketing to customers in Paris and Jumbo stores. During the years ended December 31, 2014, 2013 and 2012, our insurance activities in Chile generated revenues from ordinary activities of Ch$11,438 million, Ch$ 21,513 million and Ch$25,769 million, respectively, representing approximately 0.2% of our consolidated revenues from ordinary activities for such periods. These figures do not include extended warranty proceeds, which are booked in the retail division.
Argentina
Credit cards
In Argentina we operate a credit card business for each of our retail brands. The Argentine market for financial services is served by domestic and foreign private banks, public sector banks, credit card operators and retailers. In April 2007, we entered the financial services and insurance markets in Argentina through the launch of our “Tarjeta Más.” As of December 31, 2014, we had issued 1.169 million active credit cards. For the year ended December 31, 2014, revenues from our proprietary cards in Argentina represented 0.6% of our total revenue. Through our Cencosud credit card, we have increased the purchasing power of our middle and low-income clients, who generally do not have credit with other institutions, and are generally unable to bear the fixed costs charged by other credit cards. The following table sets forth the credit cards sales by Jumbo, Disco and Vea, and Easy in Argentina and the percentage that such sales represent of each store’s total sales for the periods presented:
| | | | | | | | | | | | | | | | | | | | | | | | |
| | | Year ended December 31, | |
| | | 2014 | | | 2013 | | | 2012 | |
| | | Sales | | | % | | | Sales | | | % | | | Sales | | | % | |
| | | (in millions of Ch$)(1) | |
Jumbo | | | 115.071,39 | | | | 20,8 | % | | | 131,306 | | | | 23.9 | % | | | 116,142 | | | | 21.4 | % |
Disco and Vea | | | 90.474,10 | | | | 5,4 | % | | | 92,378 | | | | 5.5 | % | | | 75,455 | | | | 3.9 | % |
Easy(2) | | | 158.058,90 | | | | 21,3 | % | | | 141,033 | | | | 21.2 | % | | | 113,925 | | | | 18.0 | % |
Total | | | 363.604,39 | | | | 12,2 | % | | | 364,717 | | | | 12.6 | % | | | 305,522 | | | | 10.9 | % |
| (2) | Does not include Blaisten |
69
The following table sets forth certain information regarding our non-performing loans and write-offs in Argentina, for the periods indicated.
| | | | | | | | | | | | |
| | | Year ended December 31, | |
| | | 2014 | | | 2013 | | | 2012 | |
| | | (in millions of Ch$)(1) | |
Non-performing loans as % of total loans | | | 3.8 | % | | | 3.8 | % | | | 6.4 | % |
Total write-offs | | | 7,104 | | | | 7,226 | | | | 7,251 | |
Average monthly write-offs as % of total loans | | | 0.30 | % | | | 0.36 | % | | | 0.47 | % |
The table below sets forth information with respect to our credit card receivables in Argentina:
| | | | | | | | | | | | |
| | | Year ended December 31, | |
| | | 2014 | | | 2013 | | | 2012 | |
| | | (in millions of Ch$)(1) | |
Portfolio Status | | | | | | | | | | | | |
Performing(2) | | | 211,169 | | | | 163,092 | | | | 120,956 | |
Past due: | | | | | | | | | | | — | |
31-89 days | | | 5,855 | | | | 4,471 | | | | 4,618 | |
90-180 days | | | 2,590 | | | | 1,524 | | | | 2,136 | |
181-365 days | | | — | | | | 0.81 | | | | 1,486 | |
Total | | | 219,615 | | | | 169,088 | | | | 129,198 | |
Over 365 days and legal proceedings(3) | | | 364 | | | | 364 | | | | 370 | |
Loan loss allowance as % of past due loans | | | 110 | % | | | 93.8 | % | | | 99.1 | % |
Loan loss allowance as % of all loans | | | 4.2 | % | | | 3.3 | % | | | 6.3 | % |
| (2) | Performing loans not past due more than 30 days. |
| (3) | Entire portfolio written off. These claims are subject to a 100% allowance. |
Insurance brokerage
We entered into the insurance business to complement our credit card offerings, offer extended warranties for certain of the electronic products sold at our stores and to offer other attractive insurance plans to our existing retail customers. In Argentina we offer insurance brokerage in the following areas: personal coverage, life insurance, homeowners and renters insurance, auto insurance, fraud insurance, health insurance, unemployment insurance, extended warranty coverage, pet insurance and others. The products are sold in our own retail chains and are also available via telemarketing through our call center. The insurance business has experienced substantial growth in recent years, and we believe it will continue to grow as new products are introduced and use of insurance in Argentina becomes more widespread. At December 31, 2014, our insurance brokerage operations in Argentina accounted for less than 1.0% of our consolidated revenues from ordinary activities.
Brazil
In Brazil we operate our financial services through a joint venture with Brazil’s Banco Bradesco, under which they operate our Credi-Hiper card, one of the largest private label credit cards in the northern region of Brazil. In 2011, we also granted Banco Bradesco the exclusive right to issue and operate our Cencosud Card (Cartão Cencosud) within our stores in Brazil, consumer loans, purchase financing and insurance products.
Our relationship with Banco Bradesco began in May 2006, when GBarbosa entered into a five-year operating agreement with Banco Bradesco to jointly operate Credi-Hiper. Credi-Hiper was developed 29 years ago as a key tool used to maintain the loyalty of GBarbosa’s clients and generate a significant portion of GBarbosa’s revenues. In August 2011, GBarbosa amended and restated the agreement with Banco Bradesco and expanded its scope.
Pursuant to the amended and restated agreement, Cencosud Brasil Comercial, which operates our GBarbosa stores in Brazil, Bretas, Mercantil Rodrigues, Perini and Cencosud Brasil entered into a joint venture agreement with Banco Bradesco pursuant to which Banco Bradesco agreed to offer financial services in Cencosud stores in Brazil. Banco Bradesco was also granted a right of first refusal, subject to certain limitations, if we decide to offer certain additional financial services in its stores in Brazil. Banco Bradesco also has the right to require Cencosud Brasil to engage Banco Bradesco to manage all of its payroll processing and related services, as long as the price, terms and conditions of such payroll services are competitive, as assessed by us. Additionally, the parties agreed to enter into an agreement setting forth terms and conditions for our stores to operate as Banco Bradesco representatives for processing payment of credit card bills. We also granted to Banco Bradesco a limited, non-assignable, trademark license, for the use of certain of our trademarks on the Cencosud Card.
70
As consideration for Banco Bradesco’s rights under this agreement, Banco Bradesco agreed to pay up to R$300 million including an upfront payment of R$100 million and two other R$100 million payments that are subject to reaching certain goals with respect to Cencosud credit card revenues. Additionally, with the exception of certain fees charged by Banco Bradesco from customers, the net revenue from the Cencosud credit card operation and the provision of certain other financial services is to be shared equally between Banco Bradesco and us, and we bear 50% of the credit risk associated with the credit cards operated pursuant to this agreement, including defaults in payment and losses. The term of this agreement is 16 years from the execution date, but it can be terminated at any time subject to the payment of certain penalties.
We believe our long-term partnership with Banco Bradesco facilitates the sustainable growth of our financial services segment in Brazil by providing a number of competitive financing alternatives and affordable financial services products to our clients. As of December 31, 2014, we had approximately 1.209 million active credit card accounts in Brazil.
In the year ended December 31, 2014, 0.04% of our gross revenues in Brazil were derived from our financial services business carried out throughCartão Cencosud cards. Through these cards, we have increased the purchasing power of our middle-income and low-income clients, who generally do not have credit with other institutions, and are generally unable to bear the fixed costs charged by other credit cards. These cards do not currently have administrative fees, are accepted only in our stores and allow our clients to purchase food and non-food products. We believe that without access to these cards, many of our clients would not be able to afford purchases of higher-priced non-food items. Despite the poor credit background of some of our clients, these cards have low delinquency rates.
Colombia
In Colombia, we operate our financial services through a joint venture with Colombia’s Banco Colpatria “Colpatria”. Under this agreement, Colpatria is entitled to market private label and cobranded cards in all of Colombia. Private label cards are only accepted in Cencosud Colombia stores while those that are co-branded are internationally accepted. This agreement commenced prior to our acquisition of Carrefour’s supermarket operation in Colombia. Pursuant to the agreement, Colpatria is given selling space in all of our stores to market its financial services to store costumers. Promotional and marketing efforts for this joint venture are carried out by both parties.
Colpatria is responsible for all administrative processes related to the execution of the business such as the approval and upkeep of all credit facilities granted to clients and collection of receivables. Handling of the loan portfolio is the responsibility of Colpatria and all related efforts must be carried out in compliance with rules and under the supervision of the Superintendencia Financiera de Colombia (“SuperFinanciera”) or any other regulatory body governing the business being carried out. Results from the financial business in Colombia for the year ended December 31, 2014 were included in the supermarket segment.
Profits or losses derived from this joint venture are distributed equally between the parties on a quarterly basis. This joint venture has a term of five years from 2012 being automatically extendable for an additional one year if neither party notifies the other six months prior to the original termination date. Our financial services operations have a total of 593 thousand active credit cards in Colombia.
Peru
We aim to provide financial solutions to our customers in order to make our private label cards the primary form of payment used in our supermarkets in Peru.
In August 2011, we launched our own private label credit card in Peru and we are expanding our offerings of financial services. The credit cards are operated through our supermarkets in Peru. In 2011, Cencosud created Banco Cencosud in Peru. In June 2012, we received the operation license from the SBS, and started operations in August 2012 through our Cencosud credit card. Our financial services segment also includes insurance brokerage services in Argentina, Chile, Brazil and Peru. Cencosud has a total of 478 thousand active credit cards in Peru. In addition to our private label cards, Cencosud offers Visa and Mastercard credit cards. Currently 66.8% of our portfolio is under this type of card.
71
The following table sets forth the credit cards sales by Paris, Metro and Wong in Peru and the percentage that such sales represent of each store’s total sales for the periods presented:
| | | | | | | | | | | | | | | | | | | | | | | | |
| | | Year ended December 31, | |
| | | 2014 | | | 2013 | | | 2012 | |
| | | Sales | | | % | | | Sales | | | % | | | Sales | | | % | |
| | | (in millions of Ch$)(1) | |
Paris | | | 16,428 | | | | 35,4 | % | | | 4,556 | | | | 26.58 | % | | | 0 | | | | 0 | |
Metro | | | 91,246 | | | | 15,5 | % | | | 77,164 | | | | 14.46 | % | | | 64,183 | | | | 12.45 | % |
Wong | | | 3,950 | | | | 1,1 | % | | | 3,906 | | | | 1.27 | % | | | 2,901 | | | | 0.99 | % |
Total(2) | | | 111,625 | | | | 11,3 | % | | | 85,626 | | | | 100 | % | | | 67,084 | | | | 8.28 | % |
| | | | | | | | | | | | | | | | | | | | | | | | |
| (2) | Includes value added taxes. |
Other Operations
Electronic stores
As of December 31, 2014 we also operated 77 Eletro-show electronic goods stores in the state of Sergipe in Brazil, through which we sell non-food items. The first Eletro-show store was opened in December 2005. Our Eletro-show stores are operated in small cities where the opening of a traditional store is not viable. This original and cheap format of store contributes to the enhancement of the GBarbosa brand in cities where we do not have other GBarbosa stores.
Our Eletro-show stores consist of small show rooms with up to a dozen products on display plus an online catalogue accessible at the store through in-store computers. Eletro-show stores have an average selling space per store of less than 100 square meters. The main target market is low- and middle-income classes of consumers, who do not have access to internet at home, are not used to making virtual purchases, and do not reside near one of our traditional stores. The store has a number of computers where potential clients can access a wide range of products. Our sales people are available to support the customers in the selection and purchase of desired products. We only sell non-food products in the kiosk. Once a customer places an order for products, we assure delivery within 48 hours. The Eletro-show stores have a separate space for community activities, which enables us to attract more customers. We intend to continue installing kiosks in select locations where there is appropriate demand. At December 31, 2014, our Eletro-show stores accounted for less than 1.0% of our consolidated revenues from ordinary activities.
The results of our Eletro-show stores are reported under our “supermarkets” segment in our financial statements.
Pharmacies
We also operated 62 pharmacies in Brazil under the GBarbosa brand as of December 31, 2014, which are located inside or adjacent to our GBarbosa supermarkets. At December 31, 2014, our GBarbosa pharmacies accounted for less than 1% of our consolidated revenues from ordinary activities. The results of our GBarbosa pharmacies are reported under our “supermarkets” segment in our financial statements.
As of December 31, 2014, we operated 47 pharmacies in Peru under the Punto Farma Wong and Punta Farma Metro brands, which are located inside or adjacent to our Wong and Metro supermarkets. At December 31, 2014, our Punto Farma pharmacies accounted for less than 0.2% of our consolidated revenues from ordinary activities. The results of our Punto Farma pharmacies are reported under our “supermarkets” segment in our financial statements.
As of December 31, 2014, we operated 39 pharmacies in Colombia under the FarmaSanitas brand, which are located inside or adjacent to our supermarkets acquired from Carrefour in Colombia. At December 31, 2014, our FarmaSanitas pharmacies accounted for less than 0.2% of our consolidated revenues from ordinary activities. The results of our FarmaSanitas pharmacies are reported under our “supermarkets” segment in our financial statements.
Gas stations
We also operate 11 gas stations in Brazil, under the Bretas brand, which are located inside or adjacent to our Bretas supermarkets. At December 31, 2014, our Bretas gas stations accounted for less than 1.0% of our consolidated revenues from ordinary activities. The results of our Bretas gas stations are reported under our “supermarkets” segment in our financial statements.
We also operate 40 gas stations in Colombia, under the Terpel, Chevron and Biomax brands, which are located inside or adjacent to our supermarkets in Colombia. At December 31, 2014, our gas stations in Colombia accounted for less than 1.0% of our consolidated revenues from ordinary activities. The results of our gas stations in Colombia are reported under our “supermarkets” segment in our financial statements.
72
Entertainment centers
In Chile and Argentina, we operate twelve family entertainment centers under the Aventura brand. Our Aventura entertainment centers offer arcade games, mechanical games, bowling lines, 3D games and even an indoor roller coaster in our Aventura center at Florida Center in Santiago. At December 31, 2014, our Aventura entertainment centers accounted for less than 1.0% of our consolidated revenues from ordinary activities. The results of our Aventura entertainment centers are reported under our “Other” segment in our financial statements.
Loyalty programs
General
For the last 14 years we have invested in loyalty programs designed to reward, retain and attract new customers. Our loyalty programs allow us to develop customer consumption databases which enable us to enhance our merchandise selection and to more effectively target our marketing efforts. Further, our loyalty programs allow us to enhance customer retention by improving our understanding of the buying patterns and preferences of our customers.
Our loyalty programs allow customers to benefit by accumulating points from the purchases they make in our different stores as well as purchases they make with our affiliates, which can then be used to acquire products listed in special catalogues and sold in our stores. In 1999, we started with Jumbo Más and, in 2006, after significant growth in our operations due to several acquisitions, we migrated to a multi-sponsor program named Circulo Más. In 2010, we launched the Nectar loyalty program through a partnership with Groupe Aeroplan Inc. (“Groupe Aeroplan”), a leading loyalty management and customer insights company.
Nectar was created in the United Kingdom in 2002 and has become one of the largest loyalty programs in the world. Through our partnership with Groupe Aeroplan, we are able to utilize some of the most sophisticated loyalty and customer intelligence experience from over 15 countries provided by leading retailers like Sainsbury’s, one of the United Kingdom’s leading food retailer, Auchan, the Italian hypermarkets operator, and CVS Caremark, one of the largest pharmacy health care provider in the United States. Nectar allows us to enhance our customers’ experience by providing a generous, flexible, every-day rewards program, reduces our overall operating costs as some costs are shared by the group of businesses that participate in the program, and provides us with a large and rich customer consumption database that allows us to better understand a large number of our customers.
We believe that our loyalty programs strengthen our relationship with our customers and believe that a substantial majority of our sales come from loyalty clients.
In 2014, the alliance between Cencosud – and Aeroplan changed regarding the use of the brand. We decided to develop our own loyalty program, Puntos Cencosud, which was launched on March 28, 2014 with new benefits for customers: including simplifying the redemption system by allowing consumers to redeem loyalty benefits by presenting their ID cards and, the incorporation of Johnson department stores as well as Eurofashion with its brands Umbrale, Foster, Topshop, Topman, u*Kids, Moon by Foster, JJO, Legacy and Women´Secret, as new sponsors. Starting April 1, 2014 customers will earn additional loyalty points at these locations and will be able to redeem their points during the second semester. The new program additionally offers extra bonus points for the use of Cencosud´s private label credit card.
The program is already operating in Colombia and Chile. We are currently planning to replicate the business model in the other countries of the region.
The results of our loyalty programs are reported under our “Other” segment in our financial statements.
Chile
We offer our Puntos Cencosud loyalty programs in Chile. As of December 31, 2014, we had over 3 million active loyalty members in Chile, and as of the same date, 75% of our sales in Chile came from loyalty club members.
73
The following table sets forth certain information regarding our loyalty program sales by each of our divisions in Chile, for the periods indicated.
| | | | | | | | | | | | | | | | | | | | | | | | |
| | | Year ended December 31, | |
| | | 2014 | | | 2013 | | | 2012 | |
| | | Sales
(W/tax) | | | %(1) | | | Sales
(W/tax) | | | %(1) | | | Sales
(W/tax) | | | %(1) | |
| | | (in millions of Ch$, except percentages) | |
Jumbo | | | 1,673,103 | | | | 84 | % | | | 1,570,694 | | | | 83 | % | | | 1,428,399 | | | | 84 | % |
Santa Isabel | | | 1,133,754 | | | | 62 | % | | | 1.081,17 | | | | 62 | % | | | 1,034,326 | | | | 63 | % |
Easy | | | 442,895 | | | | 68 | % | | | 436,352 | | | | 65 | % | | | 381,974 | | | | 66 | % |
Paris | | | 922,445 | | | | 79 | % | | | 933,451 | | | | 80 | % | | | 875,538 | | | | 80 | % |
Total | | | 4,172,197 | | | | 75 | % | | | 4,021,670 | | | | 74 | % | | | 3,720,237 | | | | 76 | % |
| | | | | | | | | | | | | | | | | | | | | | | | |
| (1) | Percentage that such sales represent of total sales by each of our stores in Chile. |
Argentina
In Argentina we also offer our Jumbo Más and Vea Ahorro loyalty programs. As of December 31, 2014, we had over 2 million loyalty club members in Argentina and, as of the same date, 59.0 % of our supermarket sales in Argentina came from loyalty club members.
The following table sets forth certain information regarding our loyalty program sales by each of our divisions in Argentina, for the periods indicated.
| | | | | | | | | | | | | | | | | | | | | | | | |
| | | Year ended December 31, | |
| | | 2014 | | | 2013 | | | 2012 | |
| | | Sales
(W/tax) | | | %(1) | | | Sales
(W/tax) | | | %(1) | | | Sales
(W/tax) | | | %(1) | |
| | | (in millions of nominal Ar$, except percentages) | |
Jumbo | | | 5,005 | | | | 63 | % | | | 3,979 | | | | 65 | % | | | 3,333 | | | | 65 | % |
Disco | | | 4,935 | | | | 63 | % | | | 3,892 | | | | 63 | % | | | 3,722 | | | | 66 | % |
Vea | | | 3,517 | | | | 50 | % | | | 1,744 | | | | 35 | % | | | 494 | | | | 31 | % |
Total | | | 13,457 | | | | 59 | % | | | 9,615 | | | | 55 | % | | | 7,549 | | | | 61 | % |
| | | | | | | | | | | | | | | | | | | | | | | | |
| (1) | Percentage that such sales represent of total sales by each of our stores in Argentina. |
Peru
In Peru, we are members of the Bonus loyalty program, with a 42.5% ownership. Bonus is a leading multi-participant loyalty program that develops and manages loyalty and incentives programs through a system that rewards customers by giving them points for their purchases in any of our stores that later can be exchanged for other products. At the same time, it allows us to administer a database for marketing campaigns directed to specific segments.
The following table sets forth certain information regarding our loyalty program sales by each of our divisions in Peru, for the periods indicated.
| | | | | | | | | | | | | | | | | | | | | | | | |
| | | Year ended December 31, | |
| | | 2014 | | | 2013 | | | 2012 | |
| | | Sales
(W/tax) | | | %(1) | | | Sales
(W/tax) | | | %(1) | | | Sales
(W/tax) | | | %(1) | |
| | | (in millions of S/., except percentages) | |
Wong | | | 1,407 | | | | 80 | % | | | 1,337 | | | | 80 | % | | | 1,302 | | | | 81.0 | % |
Metro | | | 2,203 | | | | 73 | % | | | 2,158 | | | | 73 | % | | | 2,230 | | | | 79.0 | % |
Total | | | 3,610 | | | | 76 | % | | | 3,495 | | | | 76 | % | | | 3,532 | | | | 80.0 | % |
| | | | | | | | | | | | | | | | | | | | | | | | |
| (1) | Percentage that such sales represent of total sales by each of our stores in Peru. |
Colombia
In Colombia we launched our loyalty program in February 2014 with 100% percent ownership of the program. Our loyalty program in Colombia has quickly become widely used by our shoppers achieving very impressive penetration levels with 76% of our
74
sales coming from loyalty members. This program manages loyalty and incentives programs through a system that rewards customers by giving them points for their purchases in any of our stores that later can be exchanged for other products. At the same time, it allows us to administer a database for marketing campaigns directed to specific segments.
The following table sets forth certain information regarding our loyalty program sales by each of our divisions in Colombia, for the periods indicated.
| | | | | | | | |
| | | Year ended December 31, | |
| | | 2014 | |
| | | Sales (W/tax) | | | %(1) | |
| | | (in millions of COP/., except percentages) | |
Jumbo | | | 1,337 | | | | 80 | % |
Metro | | | 2,158 | | | | 73 | % |
Total | | | 3,495 | | | | 76 | % |
| | | | | | | | |
| (1) | Percentage that such sales represent of total sales by each of our stores in Colombia. |
Retail Consumer Banking
Banco Paris
Since 2005, we have owned Banco Paris, a specialty retail consumer bank in Chile. Banco Paris was formerly the Santiago Express division of Banco Santander Santiago, which we acquired in 2005 and registered as a separate bank under the Banco Paris brand with theSuperintendencia de Bancos e Instituciones Financieras (the Superintendency of Banks and Financial Institutions, or “SBIF”).
Banco Paris’ lending and credit activities are primarily aimed at satisfying the demands for financial services of individuals. Banco Paris offers its individual customers a range of products and services aimed at satisfying their financial service needs, including consumer loans, credit cards and residential mortgage loans. In keeping with its orientation to the retail banking market, Banco Paris offers a range of traditional deposit instruments, including savings and time deposits. Banco Paris also offers its customers life and homeowner’s insurance.
As of December 31, 2014, Banco Paris served more than 400,781 individual customers, with loans outstanding to approximately 350,973 debtors, including approximately 315,373 consumer loans and 87,276 credit card accounts. At the same date, Banco Paris had 1,235 time deposits.
To evaluate a customer’s credit risk, Banco Paris uses scoring and other automated systems to determine the customer’s profile and payment capacity in terms of income, education, family obligations, other financial obligations and other factors.
To evaluate a customer’s credit risk, Banco Paris uses scoring and other automated systems to determine the customer’s profile and payment capacity in terms of income, education, family obligations, other financial obligations and other factors.
The table below sets forth information with respect to our Banco Paris loan portfolio:
| | | | | | | | | | | | |
| | | Year ended December 31, | |
| | | 2014 | | | 2013 | | | 2012 | |
| | | (in millions of Ch$)(1) (2) | |
Portfolio Status | | | | |
Performing(3) | | | 214,332 | | | | 239,986 | | | | 195,293 | |
Past due: | | | | | | | | | | | | |
31-89 days | | | 8,549 | | | | 4,375 | | | | 6,719 | |
90-180 days(4) | | | 6,620 | | | | 2,996 | | | | 5,354 | |
+ 180 days | | | 499 | | | | 456 | | | | 660 | |
Total | | | 230,000 | | | | 247,813 | | | | 208,025 | |
Loan loss allowance as % of past due loans | | | 85 | % | | | 79 | % | | | 84 | % |
Loan loss allowance as % of all loans | | | 6 | % | | | 3 | % | | | 5 | % |
75
| (1) | Includes activities from postponed commissions. |
| (3) | Performing loans not past due more than 30 days. Excludes Chilean credit card portfolio. |
| (4) | Entire portfolio written off. These claims are subject to a 100% allowance. |
Banco Cencosud
In 2011, we established Banco Cencosud in Peru and in June 2012 we received the operation license from the SBS, and started operations in August 2012 through our Cencosud credit card. Banco Cencosud is regulated by the banking, insurance and pensions superintendence of Peru (Superintendencia de Bancos, Seguros y Pensiones).
The tables below sets forth information with respect to our credit card receivables in Peru:
| | | | |
| | | 2014 | |
| | | (in millions of S.$)(1) (2) | |
Portfolio Status | | | | |
Performing(3) | | | 64,189 | |
Past due: | | | | |
31-89 days | | | 3,564 | |
90-180 days | | | 2,142 | |
181-365 days | | | 27 | |
Total | | S,$ | 69,923 | |
Over 365 days and legal proceedings(4) | | | | |
Loan loss allowance as % of past due loans | | | 277.1 | % |
| (1) | Includes activities from postponed commissions. |
| (3) | Performing loans not past due more than 30 days. |
| (4) | Entire portfolio written off. These claims are subject to a 100% allowance. |
The table below sets forth information with respect to our credit card receivables in Peru:
| | | | |
| | | 2014 | |
| | | (in millions of S.$)(1) (2) | |
Non-performing loans as % of total loans | | | 8.2 | % |
Total write-offs | | Ch$ | 15,889 | |
Average monthly write-offs as % of total loans | | | 1.9 | % |
Prices
Our price strategy varies depending on the format, market and business unit. For our high-end formats, we seek to offer quality and service while for our mid- and low-income formats; we seek to offer competitive prices without compromising service and quality. In addition, for seasonal items, our strategy is to periodically mark down these items until we have sold all seasonal stock. To ensure the maintenance of competitive market prices, we monitor periodically the prices of our competitors and position our prices to keep our competitiveness. Finally, we also support our prices with special offers and also with discounts through our private label credit cards.
Purchasing
We purchase our products from approximately 13,000 suppliers. No single supplier or group of related suppliers accounts for more than 10% of the total products purchased by us in 2014 on a consolidated basis. In addition to local and regional suppliers, we are also able to import products directly from Asia, where we are able to obtain more favorable pricing, and which in turn allows us to negotiate improved purchasing terms with certain suppliers. We believe that the sources and availability of materials for our retail store operations are adequate and will continue to be so for the foreseeable future. We have not experienced any difficulty in obtaining the types or quantities of the merchandise we require on a timely basis and believe that, if any of our current sources of supplies were to become unavailable, alternative sources could be obtained without any material disruption to our business.
76
Private Label Business
Private label products are those manufactured by one company for offer under another company’s brand. We carry our own private label program in both our food-retail and non-food-retail businesses, which allows us to offer a variety of products using our own portfolio of brands rather than third-party brands. The main objectives of our private label program are:
| | • | | to provide differentiation and uniqueness to our stores by offering a unique set of products available only in our stores; and |
| | • | | to achieve incremental margin versus the national brands. |
In 2008, we started to optimize and streamline our brand portfolio from 70 to 53 brands. We also established a private brand development process, a key performance index (KPI), toured retailers worldwide searching for benchmarks, and created network of suppliers, agencies, consultants and research companies to help develop our private label brands. Our Paris department stores currently carry private label products under the brands Tribu, Opposite, Aussy, Greenfield and Alaniz. We have also developed the URB and NEXT brands for our supermarket and home improvement operations. Our strategy is to develop a portfolio of private brands shared across all countries and business units and to cover the most important categories and developing value added (70%) and first price (30%) brands. To achieve this, in 2009, we assembled a corporate private label team consisting of former employees of consumer goods companies, such as L’Oreal, Unilever, P&G and Nestlé.
As a result of these actions, our private label brands continue to grow two to three times faster than the rest of our business, and we expect this trend to continue, not only in term of shares of sales but also in incremental profitability to our business.
| | | | | | | | | | | | | | | | |
| Country | | Supermarkets-
Food | | | Supermarkets -
Non-Food | | | Home Improvement-
Non-Food | | | Department Stores –
Non-Food | |
| | | | |
Argentina | | | 2.8 | % | | | 20.4 | % | | | 10.2 | % | | | | |
Brazil | | | 0.4 | % | | | 3.5 | % | | | | | | | | |
Chile | | | 4.5 | % | | | 27.4 | % | | | 16.5 | % | | | 30.4 | % |
Colombia | | | 6.4 | % | | | 8.7 | % | | | 5.9 | % | | | | |
Peru | | | 5.1 | % | | | 28.4 | % | | | | | | | 54.9 | % |
| | | | | | | | | | | | | | | | |
Total | | | 3.3 | % | | | 15.5 | % | | | 10.6 | % | | | 30.4 | % |
| | | | | | | | | | | | | | | | |
Distribution
General
Some of our products are delivered directly to our stores by our major suppliers and others are sent to our distribution centers. The use of our own distribution centers allows us to achieve operational efficiencies as suppliers can deliver their products to centralized locations rather than to our many store locations and we can benefit from economies of scale. In the event we experience significant growth outside our current geographic area, however, we may choose to lease additional facilities under similar terms or seek alternatives in order to recognize certain cost efficiencies.
Supermarkets
Chile
For fast-moving and high-volume sales merchandise, national suppliers distribute products directly to each store. For slow-moving groceries, perishable fruits and vegetables and imported products and meat, distribution is centralized through our distribution centers and delivered by third-party transportation companies. Sales from products delivered to our distribution centers accounted for approximately 39.0% of our sales at December 31, 2014.
We operate in three distribution sites in the Santiago metropolitan region from which we conduct all centralized deliveries to our Jumbo and Santa Isabel stores, including:
| | • | | A 41,000 square meter distribution center that operates in three shifts six days a week and is used to deliver non-perishable products, perishable fruits, vegetables and other refrigerated food categories to Santa Isabel and Jumbo stores. |
77
| | We use a cross-docking system for fresh products that allows fresh products to reach stores in 24 hours. Cross-docking is the practice of receiving goods at a distribution center, which are immediately consolidated with other goods for quick distribution to stores. |
| | • | | A 90,000 square meter distribution site used to deliver non-perishable, non-food and textile products. Three quarters of the distribution center are dedicated to imported products and the remainder is used for a cross-docking system of national products that allows products to be shipped in less than 24 hours. |
| | • | | A 2,500 square meter distribution center that is used for storage and delivery of imported fresh meat. |
As of the second quarter of 2013, our 3,000 square meter cross-docking center in Concepcion was fully operational, servicing our 19 stores in the city, thus improving our lead time and service with smaller local trucks.
Frozen products (imported and national) are stored and delivered using a third-party logistics provider.
In order to achieve operational efficiencies, during 2011 we increased the use of our centralized distribution system for Jumbo stores in the Santiago metropolitan region, primarily for non-perishable products and fruit and vegetables. During 2013 we finished the implementation of McKinsey’s “Lean Logistics Project,” which reviewed and rationalized our warehouse procedures. We use a SAP-based automatic replenishment system for all products stored in our distribution centers with the goal of increasing availability of products and maintaining lower inventories. During 2013 we improved our fresh products picking with Voice Picking technology obtaining a more accurate delivery.
Deliveries are made using external carriers. Freight contracts are generally signed for three- or four-year periods, and include a rate adjustment based on changes in oil prices, exchange rates and other factors.
Argentina
Distribution to our stores in Argentina is centralized from three distribution centers located in Buenos Aires, Cuyo and Córdoba, and a transfer site in Tucuman totaling 153,000 square meters, which together accounted for 80.0% of our supermarket sales in Argentina in 2014, including meat and bakery products. Approximately 20% of our products are distributed to our stores directly by our suppliers.
Each distribution center supports between 60 and 120 specific stores in a five to six days a week basis, running both a stock operation of national and imported products and a cross-docking operation for fresh vegetable and fruits, and a share of groceries received from national suppliers. All operations are supported by a warehouse management system and radio frequency technology (consisting of a special chip attached to our products which can be later detected by antennas, allowing real-time knowledge about the location of our products). During 2013 we conducted an important nationwide upgrade of our communication hardware. We also completed and modernized our forklift park.
Real-time order information is transmitted from stores to distribution centers and subsequently to suppliers via our intranet site. This real-time system allows us to optimize product availability and delivery time. In addition, our distribution centers in Argentina have an automatic replenishment system to manage all non-perishable goods, including discount and seasonal goods, which helps maintain proper inventory levels and avoid shortages.
In order to increase our capacity and productivity, we rolled out the voice picking software to the Mendoza Distribution Center. This technology gives our employees free use of their hands, thus improving their productivity and safety.
All trucks are provided by third-party companies pursuant to one- to three-year contracts.
In December 2013, our distribution center in the Argentine city of Cordoba was stormed and damaged in the middle of civil unrest that was occurring in the city as a product of a civil servant strike. Losses from this were partially covered by insurance, and were in our profit (loss) line for the period. No insurance payments were received during the 2013 period. This distribution center has since resumed operations.
Brazil
We currently use three distribution centers for our GBarbosa stores in the north east of Brazil, totaling approximately 51,000 square meters. They are located in Aracaju (32,000 square meters), Salvador da Bahia (21,000 square meters) and Fortaleza (8,000 square meters). Our distribution centers accounted for approximately 80% of our sales as of December 31, 2014. The GBarbosa distribution centers run a dry and fresh goods stock operation. The rented distribution Center in Salvador was increased to 21,000
78
square meters in order to support our increased operations in the State of Bahia in 2013, and reduce transportation costs from other distribution centers. Deliveries to GBarbosa stores are made primarily through external carriers although we do own a small fleet of delivery vehicles. Home deliveries are handled entirely by external carriers.
Bretas stores in central Brazil are supported by two distribution centers, totaling approximately 40,000 square meters and a 6,000 square meters warehouse for fresh vegetables in the city of Uberlandia. The two large distribution centers are located in Belo Horizonte (30,000 square meters) and Goiania (10,000 square meters). Both distribution centers store dry goods, vegetables and fresh goods operations. Both distribution centers have staple stock (storage) and cross-docking capabilities, which enable goods received at the distribution center to be stocked and distributed at a later time or distributed immediately to our stores. Currently, the distribution centers include electronic goods for store and home delivery. Products stored in our distribution centers accounted for approximately 60 % of our sales in 2014. Distribution to stores and home deliveries are made entirely by external carriers.
Perini stores in Salvador da Bahia also have their own distribution center located in one store, because of their smaller scale and the higher-quality fresh products offered, Perini stores also receive direct deliveries from suppliers. Perini owns a small fleet of vehicles for distribution to its stores.
Mercantil Rodrigues are stores with high rotation food goods, such as fresh fruits and vegetables, meat and poultry, dairy and others. These stores receive direct deliveries from suppliers.
Our 31 Prezunic stores in the city of Rio de Janeiro were served by a rented distribution center. This distribution center is located in Rio de Janeiro city’s center, has an area of 45,000 square meters and has facilities for dry goods, chilled goods and frozen goods. The distribution to stores are made by a standardized fleet of 21 trucks, which we own, with a complete GPS monitoring system, and a fleet rented from a third party contractor for the peak season. During 2013, we began delivering to nine former Bretas Stores in the Minas Gerais State from our Rio de Janeiro facility.
During the fourth quarter of 2013 we completed the rollout of the SAP ERP to all of the Distribution Centers in Brazil, replacing different legacy systems.
Peru
We operate three distribution centers and three warehouses, which support both Wong and Metro supermarkets and hypermarket stores. The main distribution center is a 26,248 square meter site, owned and used for the cross-docking of fresh vegetables, meat and other food products. Additional rented distribution centers add 29,200 square meters of storage area, for non-food, textile, imported goods, and for home delivery operations of home appliances and other large sized items. During the second quarter of 2013 an important upgrade of SAP warehouse management software and administrative procedures was done, achieving more speed and increasing throughput of our logistic operation in Lima.
Two of the other facilities are situated on the northern coast, and the last one is situated in Lima for storage of frozen and refrigerated goods. Centralized distribution accounts for approximately 76% of Peru supermarkets sales.
Cross-docking of national groceries and fresh-products represents approximately 80% of centralized distribution while a regular in-stock operation is used for distribution of imported products and some categories of national non-food products. We use a SAP-based warehouse management system for our operations. Deliveries are made using external carriers and delivery contracts are negotiated periodically.
Colombia
Our distribution operations in Colombia are conducted through a third party that offers storage services and handling of products. Approximately 60% of our goods sold are handled through one of the three different platforms used by our third-party contractor.
Cross docking is used in the cities of Bogota, Cali, Bucaramanga, Barranquilla and Medellin. This service has no charge for Cencosud as suppliers carry the cost of these operations and each negotiates on an ad hoc basis. Both perishable and non-food items are handled through this platform. Cencosud assumes logistical costs associated with the handling of perishable goods. Imported goods are handled by a specific platform in Bogota from which goods are distributed to our stores.
Department stores
We operate one 80,137 square meter distribution center located in Santiago that services all our Paris department stores in Chile. Centralized distribution accounts for nearly all of our Paris sales. We use a warehouse management system, RF technology and an
79
automated sorter for cases and certain textiles. In addition, we have another operation in the same distribution center for internet sales and offer special value-added services (packing, gift wrapping and gift cards and others) and deliver the products directly to our customers’ homes.
Deliveries are made using external carriers. We have different contracts for each distribution zone and type of service required. Contracts are generally negotiated on a two- to three-year basis.
For the Johnson department store chain, we operate a 21,175 square meter rented distribution center located in Santiago. Centralized distribution accounts for all sales. The distribution is made by third-party contractors. Home delivery operations are shared nationwide with Paris delivery routes and fleet.
Distribution for our Paris stores in Peru is handled by a third party due to the size of the operations.
Home improvement stores
Chile
Our 90,000 square meters distribution center is located in Santiago and accounted for approximately 65% of our Easy sales in 2014. Centralized distribution is mainly supported by a cross-docking system that operates with more than 450 vendors and accounts for two thirds of the distribution operations, while the rest arises from imported stored goods.
Transportation is handled by external carriers. Home delivery transportation contracts are signed for a one- to two-year period. Distribution center-to-store transportation contracts are signed for four years because of the high investment required to customize trucks for optimal load capacity. Special two-story trucks with side load compartments are designed to transport irregular-shape products that are commonly sold in our Easy stores.
An automatic replenishment system manages the stock levels in stores in order to maximize service level and optimize inventory turnover.
Argentina
We operate three distribution centers located in Buenos Aires for our Easy and Blaisten operations, totaling 59,000 square meters. Easy Argentina also relies on direct deliveries from suppliers to stores.
Centralized distribution includes a regular warehouse operation from stocked merchandise (imported and domestic goods) and a growing cross-docking operation with more than 600 vendors. There is also a home delivery operation which accounted for approximately 15.0% of sales in 2014.
Transportation is handled by external carriers. Distribution center-to-store transportation and home delivery transportation contracts are negotiated every two years.
Marketing
During 2013, we worked to further develop our Cencosud brand, with two main objectives: (i) consolidating Cencosud as a strong brand, widely recognized across socioeconomic groups and across regions, and (ii) creating a family of brands recognized and valued by our customers, with the endorsement of Cencosud as a seal of quality and reliability.
Our aim is to develop strong brands prepared for competition with global brands, but with an appeal to local consumers. For this, we have an internal consumer research unit that allows us to better understand our consumers’ behaviors, attitudes, demographics and trends, providing us with important and valuable information necessary to adjust our marketing strategy in each of our business units in all the countries in which we operate.
Supermarkets
Chile
Consistent with our business strategy, our marketing plan is directed at projecting our image as a hypermarket and supermarket chain which offers value through a combination of high-quality service and competitive prices. In Chile, Jumbo is one of the most valued brands, mainly for its association with quality, variety and service. Our principal marketing themes for our Jumbo hypermarkets in Chile and Argentina are “Jumbo te da más” (“Jumbo gives you more”). Santa Isabel is a supermarket based on the concept of familiarity and closeness with our customers. Our principal marketing theme for our Santa Isabel supermarkets is “Santa Isabel te Conoce” (“Santa Isabel knows you”).
80
We operate separate, marketing programs for our Jumbo hypermarkets and Santa Isabel supermarkets. Our primary advertising outlets, in addition to point-of-sale marketing, are mass marketing, mainly television and radio, nationwide and regional press, brochures and magazine-type inserts in major newspapers, and we are investing strongly and steadily in digital marketing, including social networks and email marketing. We receive fees from our Chilean suppliers for access to selling space in our hypermarkets and supermarkets and in connection with special promotions and other marketing programs.
Argentina
As in Chile, our marketing strategy in Argentina is directed primarily at increasing net sales and projecting our image as a hypermarket chain which offers high-quality service and competitive prices. Our marketing efforts for Jumbo and Disco in Argentina are, however, aimed more at consumers in the middle and higher income levels. For lower income levels, we operate Super Vea supermarkets. Located mainly in the provinces, Super Vea supermarkets are focused on the concept of value priced products and, consequently, financial saving to the retail customer. Our primary advertising outlets in Argentina, in addition to point of sale marketing, are mass marketing, mainly television and radio, nationwide and regional press, brochures and magazine-type inserts in major newspapers, and we are investing strongly and steadily in digital marketing, and email marketing.
Brazil
We believe we have a very positive image in the eyes of our clients in the locations we operate, due to our low prices, the high quality of services we offer, and the wide range and superior quality of products. During 2014 the Company decided to take marketing to a regional level in Brazil, allowing for greater flexibility in all campaigns launched in the country to better target each core target audience. Brazil is the only country where Cencosud currently operates with regional marketing due to the structure of its operations there.
Our marketing department and external advertising agencies meet on a periodic basis to analyze and develop our marketing strategies, product development and advertising campaigns. As a result, we are able to customize and adjust our marketing strategy to local traditions and ethnical backgrounds, adding significant value. Our GBarbosa Brand sponsors traditional Brazilian northeastern celebrations of “Sao Joao” (St. John’s Day) and “Carnaval” (summer carnival).
For higher income consumers, we operate Perini supermarkets, offering a wide variety of delicatessen and premium products, and in-store produced food and pastries. Perini communication is mainly direct. Each client segment receives tailored communication, with activities and events of interest. We focus our marketing and advertising efforts on regional television advertisements, local press and also on the distribution of promotional flyers in our stores. Since a significant number of our clients are from middle- and low-income segments, and the majority is middle-aged housewives, television advertising is our main marketing tool.
We have included Cartao Cencosud (our private label card) in our advertising campaigns for GBarbosa, as it is one of the main drivers of our clients’ loyalty. In 2014, we held our anniversary sale commemorating Cencosud´s arrival to the Brazilian market. These celebrations were accompanied by special sales in selected products across our operations in Brazil. The result of these efforts was an immediate increase in traffic and sales for the products encompassed in the offers.
Peru
Our marketing strategy in Peru is segmented. Our marketing strategy for our Wong brand, which primarily targets the upper-income consumer, relies heavily on well-known newspapers and sponsors and promotes Peruvian products and festivities such as “El Corso,” “Evento del Pisco” and others. Our marketing strategy for the Metro brand relies more on mass media, mainly television, which allows us to broadly communicate our offers and value proposition to middle-income families, a growing segment in the Peruvian market. As in Chile, we receive fees from our Peruvian suppliers for access to selling space in our Peruvian stores and in connection with special promotions and other marketing programs.
Colombia
2013 was the year when Jumbo and Metro arrived to Colombia. This entailed the transformation of stores according to each brand’s identity and their launch to the market.
In 2014, with the brands already established, our challenge was to work for recognition and to position Jumbo and Metro within each target audience and begin their consolidation. Accordingly, we planned to focus on the following areas:
1. Establishing and strengthening the value proposal for each brand through the attributes that distinguish them leveraging on Cencosud´s own prestige and recognition among Latin American consumers.
81
2. Building “price image” for both brands, acknowledging that factor as a vital driver for the Colombian market.
3. Customizing Jumbo and Metro to Colombian expectations and regionalizing communication in order to better relate to the needs of customers and become ingrained in Colombian society.
4. Enhancing the relationship with customers to establish a rapport with consumers and better funnel marketing investments.
Home improvement stores
Chile
Our home improvement marketing efforts are directed at projecting our image as provider of everything necessary for small to large construction projects under one roof to the general population, including professional contractors and homeowners. Our marketing strategy reinforces our commitment to offer the best solutions for our customers at the best prices. Our marketing strategy relies heavily on mass media and recently, but with growing importance, on digital media. Consistent with our policy of customer satisfaction, we guaranty the lowest price in the market and accept returned products if the client is not satisfied.
Argentina
In Argentina, in addition to traditional mailings and catalogues similar to Chile, we conduct programming through our website, www.easy.com.ar, television and radio that teaches our clients how to use our products. We also educate clients through practical classes at our store locations. Our television and radio programming runs continuously on local channels. In Argentina, we also guarantee customer satisfaction and accept any returns within the timeframes established by the consumer protection guidelines currently in place.
Department stores
Our Paris department stores have a complete marketing calendar, with a strong and consistent investment in mass media as well as digital media. Our Paris Facebook page has more than 1 million fans. Paris has pioneered the creation of special events for its fans and social media followers. Paris has advertising contracts with well-known celebrities in the local community, positioning Paris as a fashionable, modern and women-oriented brand.
Since 2010, Paris, concerned about its social impact on stakeholders, has organized various projects that positively impacted the community and the environment. “Paris Parade” has become of a fixture of the city of Santiago for the month of December. This event, similar to the Macy’s Thanksgiving Day Parade in New York, draws over 1 million people to Santiago’s Main Avenue to watch a parade of large inflatable balloons. Additionally, in 2013, Paris launched a CSR program called “Ropa x Ropa,” or clothes for clothes, to encourage garment recycling, turning the department store into one of the main recycling institution in South America.
Shopping centers
Marketing activities and programs for our shopping centers are conducted by each individual shopping center. Our principal marketing objective is to attract customers to our shopping centers through traditional publicity on television, radio and in newspaper announcements as well as through special events at the shopping centers, including fashions shows, concerts, theater productions, wine tastings, cooking classes and aerobics classes. In addition, we regularly give away gifts through lotteries that customers can enter by purchasing a product from one of our shopping center retailers.
All shopping center promotional and marketing costs are paid by our tenants as part of their monthly maintenance fees. Each tenant’s contribution is proportional to its sales.
Competition
The retail industry is highly competitive and characterized by high inventory turnover, controlled operating expenses and small profit margins as a percentage of sales. Earnings primarily depend upon the maintenance of high per-store sales volumes, efficient product purchasing and distribution and cost-effective store operations and inventory management. Advertising and promotional expenses are necessary to maintain our competitive position in our major markets. We compete principally on the basis of price and, to a lesser extent, location, selection of merchandise, quality of merchandise (in particular perishables), service, store conditions and promotions. We face strong competition from international and domestic operators of supermarkets, department stores, home improvement stores and shopping centers, including Casino, Carrefour, Wal-Mart, and Falabella.
82
The following table provides a brief overview of our competitive position in each of our principal markets as of December 31, 2014:
| | | | | | | | | | | | | | | | | | | | |
| | | Chile | | | Argentina | | | Brazil | | | Peru | | | Colombia | |
Supermarkets | | | 2nd | | | | 2nd | | | | 4th | | | | 1st | | | | 3rd | |
Department stores | | | 2nd | | | | — | | | | — | | | | | * | | | — | |
Home improvement | | | 2nd | | | | 1st | | | | — | | | | — | | | | — | |
Shopping centers | | | 2nd | | | | 2nd | | | | — | | | | — | | | | — | |
Source: ASACH, ABRAS, Nielsen, competitors’ press releases, and company estimates.
| * | our Paris department stores operations are now starting up. |
See “—Industry Overview and Competition” below for more information about the markets in which we compete.
Management Information Systems
Our management information systems include technology that permits us to automate our back office, distribution, checkout operations and analytics. Our technology department is responsible for technical support, operations, development and maintenance of our management information systems and infrastructure. Our team specializes in providing company-wide business intelligence according to our business strategy to achieve a competitive advantage.
We have made significant investments in maintaining and updating our technology infrastructure and systems applications and business solutions. Our customized information systems have contributed significantly to our competitiveness and growth to date, however, they have been also diverse, complicated, increasingly expensive and of limited flexibility in respect of evolving technology and growth of our business. Therefore, starting in 2010, we began simplifying our systems architecture. For example, last year we started integrating the operations of our supermarkets in Brazil, under SAP Retail and the POS application, resulting in operating efficiencies and cost savings. We have also been working on the integration of SAP FICO on a regional level in Argentina and Colombia since 2012 and in Peru since 2013. Finally, all of our entities including newly acquired ones are operating over the same data network, sharing network services, IP phone and video conferencing services, as well as information technology security tools and protocols, allowing us to operate at lower costs and setting the ground for wide-scale Information Technology (“IT”) integration across the regions in which we operate.
We are in the process of a company-wide roll out of single business solutions for each of our business segments, which will simplify the current processes and further enable our growth strategy. The business solutions are based in technology obtained through a strategic agreement with SAP A.G. These projects are expected to improve financial control, inventory optimization, store operations and supply chain planning and execution. Furthermore, it will facilitate and simplify the incorporation of new stores, allowing us to maintain competitiveness and quickly adapt to trends and our customers’ needs. We expect to have the totality of our supermarket division on the regional SAP platform by 2016. For our home improvement stores segment, the platform roll-out began in 2011 in Chile and was completed for Argentina and Colombia in 2012. We estimate to conclude the same process for our department store segment in 2016, with Paris in Peru having already completed implementation in 2013. For the financial services division in Peru, we have rolled out the necessary systems to support the opening of Banco Cencosud and provide the necessary systems to support the daily operations of our financial arm in the country.
As part of the process of integrating the operations, systems, processes and controls that are part of the businesses we have acquired, we are working to strengthen existing control mechanisms in accordance with the provisions of Section 404 of the Sarbanes Oxley Act. In connection therewith, we created a new area in our IT department whose role is to lead all IT initiatives related to upgrading our internal controls and complying with the requirements and standards of the Sarbanes Oxley Act. Currently, the work is focused on improvements to our systems in order to gather the general control information in an efficient manner.
In the case of logistics, we started to implement SAP WMS (Warehouse Management System) in Brazil. The first implementation was started in our Aracayú distribution center; we plan to finish all distribution centers in Brazil by 2015.
We are implementing infrastructure improvements to be better prepared in the event of a catastrophe or a failure of our key systems. During 2013, we established two datacenters in Santiago and Buenos Aires with the assistance of global service providers, replaced the infrastructure of our key systems in order to have redundancy and updated our key systems in both datacenters. Our key systems (ERPs) are already on the new platforms.
83
Cyber security
Our security platform allows us to manage user identities, allocate resources to users and secure access to corporate resources. Our Information Security Department and Corporate Audit Department review segregation of duties. We have an access management process for all the key applications that support business units based in Chile, Argentina, Peru, Brazil and Colombia.
Cyber-attack detection systems are currently in place, including firewalls and intrusion prevention systems. We have deployed antivirus solutions for endpoints and servers, antispam and antivirus for corporate e-mail and a web filtering solution to secure internet access. Security infrastructure is deployed in Chile, Argentina, Peru, Brazil and Colombia.
All policies, procedures and tools described above are also used in credit card and banking operations. Additionally, in 2011 we initiated a program to ensure our compliance with the Payment Card Industry Data Security Standard (PCI DSS), an information security standard for organizations that handle cardholder information for the major debit, credit, prepaid, e-purse, ATM, and POS cards. Defined by the Payment Card Industry Security Standards Council, the standard was created to increase controls around cardholder data to reduce credit card fraud via its exposure. Validation of compliance is done annually—by an external Qualified Security Assessor (QSA) for organizations handling large volumes of transactions, or by a Self-Assessment Questionnaire (SAQ) for companies handling smaller volumes.
All of our distribution centers have a backup network link, uninterruptible power supply and emergency power systems in order to be protected from link cuts and main power disruptions. We also use a daily data backup system and have service contracts in place to repair any hardware failures.
In April 2009, the home page for our Unicenter Shopping Center in Argentina was hacked. As a result, our customers were unable to access the home page for a brief period. There were no material disruptions to our business operations. In response to this event, and to prevent any future disruptions, we have defined more stringent security recommendations for software development. Software is subjected to an exhaustive security test before the application is moved to the production environment and ethical hacking activities are performed periodically to ensure security.
In April 2014, we experienced a security breach whereby several company websites in Chile were attacked by an organized group of hackers. As a consequence of this most of the sites were taken offline. We experienced data breaches at two websites whereby access to our server was obtained, but with low impact and no client information was obtained. We have since made arrangements to remediate security weaknesses in our websites, including through testing security for our websites by a third party, strengthening security protocols and procedures, providing relevant technical training to IT administrators, increasing periodic testing by third party specialized teams, and engaging real-time monitoring security services for our critical websites in order to remain alert to any malicious activity.
Property, Plants and Equipment
Our properties include hypermarkets, supermarkets, home improvement stores, department stores, shopping centers and land reserves for the construction of stores and shopping centers. All of our properties are located in Argentina, Brazil, Chile, Colombia and Peru. We believe that all of our facilities are adequate for our present need and suitable for their intended purposes.
We own our headquarters, located at Av. Kennedy 9001, Las Condes, Santiago, Chile.
The following table sets forth certain information with respect to our facilities at December 31, 2014:
| | | | | | | | | | | | | | |
Segment | | Country | | Number of
stores | | | Area(1) | | | % Leased | |
Supermarkets | | Chile | | | 201 | | | | 272 | | | | 68 | % |
Hypermarkets | | Chile | | | 37 | | | | 279 | | | | 16 | % |
Supermarkets | | Peru | | | 73 | | | | 167 | | | | 51 | % |
Hypermarkets | | Peru | | | 14 | | | | 94 | | | | 38 | % |
Supermarkets | | Argentina | | | 270 | | | | 366 | | | | 57 | % |
Hypermarkets | | Argentina | | | 20 | | | | 163 | | | | 16 | % |
Supermarkets | | Brazil | | | 178 | | | | 434 | | | | 96 | % |
Hypermarkets | | Brazil | | | 41 | | | | 167 | | | | 73 | % |
Supermarkets | | Colombia | | | 21 | | | | 4 | | | | 100 | % |
Hypermarkets | | Colombia | | | 79 | | | | 421 | | | | 15 | % |
Home Improvement | | Argentina | | | 50 | | | | 383 | | | | 28 | % |
84
| | | | | | | | | | | | | | |
Segment | | Country | | Number of
stores | | | Area(1) | | | % Leased | |
Home Improvement | | Chile | | | 33 | | | | 313 | | | | 3 | % |
Home Improvement | | Colombia | | | 10 | | | | 82 | | | | 30 | % |
Department Stores | | Chile | | | 79 | | | | 375 | | | | 73 | % |
Shopping Centers | | Argentina | | | 22 | | | | 746 | | | | 13 | % |
Shopping Centers | | Chile | | | 25 | | | | 1,103 | | | | 27 | % |
Shopping Centers | | Peru | | | 4 | | | | 123 | | | | 0 | % |
Distribution Centers | | Argentina | | | 14 | | | | 227 | | | | 29 | % |
Distribution Centers | | Brazil | | | 12 | | | | 147 | | | | 100 | % |
Distribution Centers | | Chile | | | 9 | | | | 334 | | | | 78 | % |
Distribution Centers | | Colombia | | | 9 | | | | 33 | | | | 100 | % |
Distribution Centers | | Peru | | | 6 | | | | 55 | | | | 100 | % |
| (1) | In thousands of square meters. |
In addition, we routinely purchase undeveloped properties that we anticipate to use for future supermarket construction, home improvement stores and shopping centers. As of December 31, 2014, we had the following undeveloped properties:
| | | | | | | | | | | | |
Country | | Number of
properties(1) | | | Total area
(in square
meters) | | | Ownership | |
Argentina | | | 26 | | | | 1,439,357 | | | | Owned | |
Brazil | | | 25 | | | | 354,253 | | | | Owned | |
Brazil | | | 21 | | | | 173,958 | | | | Leased | |
Chile | | | 35 | | | | 2,461,171 | | | | Owned | |
Chile | | | 7 | | | | 301,828 | | | | Leased | |
Colombia | | | 4 | | | | 89,953 | | | | Owned | |
Peru | | | 29 | | | | 148,210 | | | | Owned | |
Peru | | | 11 | | | | 21,230 | | | | Leased | |
Total | | | 158 | | | | 4,989,960 | | | | | |
| (1) | Includes properties where construction is ongoing. |
Intellectual Property
The principal trade names and service marks used in our business areJumbo, Jumbo Más, Easy, Más Easy, Santa Isabel, Disco, Vea, Paris, Más Paris, Paris Corredores de Seguros, Banco Paris, Johnson, Puntos Cencosud, Wong, Metro, GBarbosa,and Prezunic among others, and their respective logos, covering all major South American markets. We own or have the rights to use the trade names and service marks and the respective logos related to all our marks. We believe that our trademarks, trade names and service marks are valuable assets to us which successfully differentiate us from our competitors.
Insurance
We maintain insurance policies covering, among other things, fires, earthquakes, floods, acts of terrorism and general business liability. Business interruption insurance is not currently available in Chile on terms we consider commercially attractive. Management believes that our insurance coverage is adequate for our business.
Material Agreements
For a description of the material agreements relating to our indebtedness, please see “Item 5.—Operating and Financial Review and Prospects—B. Liquidity and Capital Resources—Indebtedness.”
On November 30, 2012, Cencosud S.A. completed the acquisition of Carrefour supermarket operations in Colombia, for a total purchase price equal to €2 billion. The company rebranded all acquired stores to Cencosud formats in 2013. See “Item 4. Information on the Company—A. History and Development of the Company—History.”
85
Industry Overview and Competition
Our countries of operation—Argentina, Brazil, Chile, Colombia and Peru—represent a combined population of approximately 331.0 million, according to each country’s statistics agency as of 2014. Chile, our largest market in terms of revenues from ordinary activities, has a population of approximately 16.5 million and experienced GDP growth of, 6.0% in 2011, 5.5% in 2012 and is estimated to have expanded 4.7% in 2013 and 1.8% in 2014, as reported by the Central Bank of Chile. Argentina, our second-largest market in terms of revenues from ordinary activities, has a population of approximately 41.0 million and, according to the Central Bank of Argentina, experienced annual GDP growth of 1.9% in 2012, 5.3% in 2013 and 0.5% in 2014, as reported by the Argentine Ministry of Economy. Brazil, our third-largest market in terms of revenues from ordinary activities, has a population of approximately 196.5 million and, according to the Central Bank of Brazil, experienced annual GDP growth of approximately 0.9% in 2012, 1.9% in 2013 and GDP contraction of -0.9% in 2014.
We have supermarkets in Argentina, Brazil, Chile, Peru and Colombia; home improvement stores in Argentina, Chile and Colombia; shopping centers in Argentina, Chile and Peru; and department stores in Chile. During the year ended December 31, 2014, 76.2% of our revenues from ordinary activities came from our supermarket operations, 11.4% came from home improvement operations, 9.4% from our department stores, 2.0% from our shopping centers and 3.0% from our financial services.
| | | | | | | | | | | | | | | | | | | | | | | | |
| | | Year Ended December 31, 2014 | |
| | | Supermarkets | | | Home
improvement | | | Department
stores | | | Shopping
centers | | | Financial
services
continuing
operations | | | Other(1) | |
Revenues from ordinary activities | | | 8,159,237 | | | | 1,225,616 | | | | 991,442 | | | | 214,850 | | | | 117,679 | | | | 2,205 | |
Gross profit | | | 1,955,126 | | | | 425,274 | | | | 250,163 | | | | 186,821 | | | | 78,632 | | | | 238 | |
Adjusted EBITDA from continuing operations(2) | | | 424,108 | | | | 119,148 | | | | 21,854 | | | | 150,412 | | | | 38,042 | | | | (111,868 | ) |
| (1) | See “Item 4. Information on the Company—B. Business Overview” for a description of our “Other” segment. |
| (2) | See “Presentation of Financial Information” for the definition of Adjusted EBITDA and the reconciliation of Adjusted EBITDA to IFRS measures. |
The Supermarket Industry
Chile
As of December 31, 2013, we estimate that the Chilean supermarket industry is composed of approximately 1,372 stores nationwide, including hypermarkets and supermarkets. As of December 31, 2014, total net sales by supermarkets in Chile grew by 3.9% as compared to the same period in 2013, according to the Chilean National Institute of Statistics. During the last three years, nominal same-store sales at our supermarkets grew by 4.3%, 1.6%, and 4.8% in 2014, 2013 and 2012, respectively.
The Chilean supermarket industry had been characterized by the construction of larger stores (including more hypermarkets), both on a free-standing basis and within shopping centers and other commercial developments, and consolidation of ownership in fewer, larger supermarket chains. Current trends in the industry include increased differentiation among competitors, with some supermarket chains emphasizing a low price/low service strategy, while others have pursued a strategy of moderate or higher prices with higher levels of service. Other recent trends in the Chilean supermarket industry have include the development of specialized internet sale channels by major players, increased funding of marketing costs by suppliers, expansion by chains outside the Santiago metropolitan region and to urban areas with lower purchasing power, the growth of private label products, and increased demand for organic products and prepared foods.
As noted above, we believe that the Chilean supermarket industry in Santiago shows certain signs of saturation, and as a result newly opened stores to some extent cannibalize the sales of existing stores. As of December 31, 2014, we estimate that the four largest supermarket operators in Chile represented over 90% of the industry in terms of net revenues. Our growth prospects in the Chilean food retailing sector are likely to depend to a large extent on future growth in Chilean GDP or acquisitions of other supermarket chains, and we cannot assure you that either will in fact occur. Our competitors include hypermarkets, supermarkets, hard discount stores, self-service stores, traditional, family-owned neighborhood grocers and open markets. Although competition is already intense in many locations, we believe that competition is likely to intensify further as existing competitors expand the number of their stores and improve the quality of their operations and as new competitors enter the market. Competition is based on price, quality, variety, customer service and store location, with various competitors emphasizing these factors to varying degrees.
86
The following table presents certain information about us and our principal competitors in the Chilean supermarket industry as of December 31, 2014:
| | | | | | | | | | | | | | | | |
| | | Wal-Mart
Chile | | | Cencosud | | | SMU | | | Falabella
(Tottus) | |
Number of stores | | | 380 | | | | 238 | | | | 393 | | | | 52 | |
Total selling space (square meters) | | | 890,000 | | | | 567,873 | | | | 575,00 | | | | 182,892 | |
Market share(1) | | | 38.1 | % | | | 33.1 | % | | | 22.9 | % | | | 6.0 | % |
Source: Public filings, INE, ASACH, Nielsen.
| (1) | As of December 31, 2014, based on reported net revenues from supermarket operations in Chile. |
We estimate that Walmart Chile is the largest supermarket chain in Chile in terms of net revenues and, at December 31, 2014, it operated 380 stores in Chile. Walmart Chile operates four different sizes of stores under different brands, allowing it to target different segments of the market offering a combination of everyday low prices, service and proximity. Walmart Chile entered the Chilean market in January 2008, and due to its association with Wal-Mart, we believe it has greater leverage with its suppliers than us or its other competitors. As a result, it is able to obtain more favorable purchasing terms than us.
Recent efforts by Chilean retail holding company SMU S.A. (“SMU”) to consolidate over 50 regional food retailers in Chile into a single integrated rival threaten to increase competition in the Chilean supermarket industry. Additionally, in September 2011 SMU announced it had acquired rival Supermercados del Sur, which we estimate was the fourth-largest supermarket chain in Chile in terms of revenues at the time. These consolidation efforts have not yet had a material impact, but we perceive increased risk over the intermediate-to-longer term. We see similar consolidation efforts targeting smaller hardware stores and “do-it-yourself” retailers in the home improvement industry, such as the SMU’s acquisition of Construmart, the third-largest retailer in the Chilean home improvement industry in terms of revenues in our estimation. During 2013 SMU had to amend its financial statements to better reflect lease agreements for its operations. This led to a restructuring of their liabilities. SMU further announced it had resolved to sell Construmart and Monserrat in Chile and Mayorsa in Peru, in addition to several supermarket stores operated under the Unimarc brand. We believe other regional rivals could emerge in the future. In December, 2014 SMU announced it had successfully divested from its 40% stake in supermarket chain Montserrat for a price of U.S.$ 44.3 million.
Moreover, on December 14, 2011, theFiscalía Nacional Económica, or “FNE”, announced an investigation into anti-competitive practices in the food retail industry including several local operators such as Cencosud. Details of the investigation have not been made public. However, Cencosud believes that it has complied with all applicable regulations in conducting its business. The investigation may result in the imposition of fines on the parties being investigated.
We generally perceive homogeneity in retail pricing and terms. Chile’s vendor base is largely consolidated, and characterized by oligopoly and monopoly structures that have generally limited procurement power among retailers, despite their perceived scale advantages.
Argentina
Historically, the Argentine supermarket industry was dominated by traditional, family-owned neighborhood grocers (almacenes). In the 1980s, supermarkets began to proliferate and the first hypermarkets appeared, a trend that accelerated in the early 1990s with significant expansion of modern supermarket operations, including minimarkets, supermarkets and hypermarkets in urban areas. During the 1990s, consumer grocery purchases at almacenes declined. Since 1999, the level of market penetration has remained relatively stable. The Argentine supermarket industry is highly competitive and fragmented, and we estimate that the four largest supermarket chains in Argentina account for approximately 68% of total supermarket net sales as of December 31, 2014. In Argentina, where foreign food retailers have an established presence and we are a smaller competitor, we face a very different competitive atmosphere than in Chile. We believe that some of these food retail companies have substantially greater financial resources than us. In addition, there is strong competition from small independent stores and individual, non-chain stores that represent a significant and growing part of the food and grocery business in Argentina.
For many years, large international retail chains, such as Wal-Mart, the largest U.S. retailer based on market capitalization, and Carrefour have operated in the Argentine market. When Wal-Mart entered the Argentine retail market in 1995, it implemented a strategy of low food prices that was aimed at capturing market share from large hypermarkets such as Carrefour. As a result, the rate of industry consolidation increased substantially during recent years, as larger store formats have been increasing their market share at the expense and through the purchase of smaller store formats.
87
The following table presents certain information about us and our principal competitors in Argentina as of December 31, 2014:
| | | | | | | | | | | | | | | | |
| | | Cencosud | | | Carrefour | | | Wal-Mart | | | Coto | |
Number of stores | | | 290 | | | | 442 | (2) | | | 100 | (3) | | | 130 | |
Market share(1) | | | 17.3 | % | | | 22.5 | % | | | 15.3 | % | | | 14.8 | % |
Source: Public Filings, INDEC, Planet Retail.
| (2) | Includes Express format |
| (3) | Walmart & Changomas stores |
Our main competitor in Argentina is Carrefour. At December 31, 2014, Carrefour operated 442 stores. Part of Carrefour’s competitive advantage arises from its low prices and aggressive promotional campaigns around special seasonal events coupled with a multiformat strategy.
We expect this highly competitive environment to continue to exert pressure on our results of operations in this market.
Brazil
The Brazilian food retail industry is highly fragmented. Despite consolidation within the Brazilian food retail industry, according to ABRAS, in 2012, the twenty largest supermarket chains represented only approximately 76% of the food retail industry. According to ABRAS our stores accounted for approximately 4.2% of the gross sales of the entire Brazilian food retail industry in 2013. We believe that future acquisitions will mainly involve smaller-sized stores. Another trend in the retail food industry is large chains migrating to smaller local, such as Tesco Express and Sainsbury’s Local.
As set forth in the following table, according to ABRAS data, in 2013, the ten largest retailers recorded revenues of approximately R$140 billion, conducting business in approximately 3,301 stores
| | | | | | | | | | | | | | | | | | | | | | | | |
Company | | Gross revenues | | | Number of
Stores | | | Space
available
for sales
(square meters) | | | Number of
Checkouts | | | Employees | |
| | (R$ million) | | | % | | | | | |
Companhia Brasileira de Distribuicao | | | 64,405 | | | | 27.76 | % | | | 14,993 | | | | 2,752,860 | | | | 16,079 | | | | 156,342 | |
Carrefour | | | 34,012 | | | | 14.66 | % | | | 241 | | | | NA | | | | NA | | | | 64,776 | |
Wal-Mart Brasil | | | 28,477 | | | | 12.27 | % | | | 544 | | | | 1,544,074 | | | | 9,381 | | | | 75,475 | |
Cencosud Brasil | | | 9,811 | | | | 4.23 | % | | | 221 | | | | 596,746 | | | | 2,962 | | | | 35,133 | |
Zaffari | | | 3,765 | | | | 1.62 | % | | | 30 | | | | 132,454 | | | | 852 | | | | 9,691 | |
Total—five largest | | | 140,472 | | | | 60.55 | % | | | 3,035 | | | | 5,026,134 | | | | 29,274 | | | | 341,417 | |
Condor Super Center Ltda | | | 3,190 | | | | 1.38 | % | | | 918 | | | | 128,024 | | | | 852 | | | | 9,716 | |
Irmao Muffato & Cia | | | 3,111 | | | | 1.34 | % | | | 820 | | | | 131,295 | | | | 1,003 | | | | 9,115 | |
Supermercados BH | | | 2,848 | | | | 1.23 | % | | | 1,120 | | | | 113,340 | | | | 1,300 | | | | 12,200 | |
Sonda | | | 2,639 | | | | 1.14 | % | | | 847 | | | | 86,428 | | | | 905 | | | | 8,075 | |
A Angeloni | | | 2,364 | | | | 1.02 | % | | | 652 | | | | 107,096 | | | | 691 | | | | 9,547 | |
Total—ten largest | | | 154,626 | | | | 66.65 | % | | | 33,451 | | | | 5,592,317 | | | | 34,025 | | | | 390,070 | |
Source: ABRAS.
| * | Denotes sales for companies during the 2013 period |
Our main competitor in Brazil is Bompreço, a company controlled by Wal-Mart. It ranks third in sales in Brazil, according to ABRAS. Bompreço is the largest retailer in the Northeast of Brazil, where we believe we hold the number two position in terms of sales, and is our competitor in the states of Sergipe, Bahia and Alagoas, with six, 54 and eight stores, respectively. We also compete against Companhia Brasileira de Distribuição, through its brands Extra, Assai and Pao de Azucar, across several of our markets. In Minas Gerais, we also compete against Carrefour through its Carrefour and Atacadao brands. We believe we hold the number one position in terms of sales in that state. In Rio de Janeiro, where we believe we hold the number three position in terms of sales, we compete against Guanabara and Mundial. We also compete against open fairs and small- and medium-sized retailers that buy their products from informal distribution networks to obtain prices lower than the prices charged by our suppliers.
88
Peru
As of December 31, 2014, we estimate that the Peruvian supermarket industry was composed of approximately 237 stores nationwide, including hypermarkets and supermarkets. We believe supermarket penetration for the Lima metropolitan area was approximately 35.0 % resulting in a country average of less than 20.0 %. A large percentage of consumption in Peru is still served by informal trade. Smaller grocery stores, convenience stores and open air markets play an important role in this industry with roughly 75% of the market share as of 2014. The level of competition and the identity of competitors have changed over the last several years.
The following table presents certain information about us and our principal competitors in Peru as of December 31, 2014:
| | | | | | | | | | | | |
| | | Cencosud | | | Supermercados
Peruanos | | | Tottus
(Falabella) | |
Number of stores | | | 87 | | | | 101 | | | | 40 | |
Total selling space (square meters) | | | 261,700 | | | | 269,718 | | | | 182,892 | |
Source: Public filings.
For the year ended December 31, 2014, we believe we were the largest operator of supermarkets in Peru in terms of net sales based on our comparisons against information from public filings of our main competitors as of December 31, 2014. Our principal competitors in the hypermarket format are InRetail, controlled by the Rodriguez Pastor family, who also control the Peruvian financial group Intergroup, through its brands Plaza Vea, Plaza Vea Super and Vivanda and Tottus, controlled by Falabella.
Colombia
The Colombian retail market is driven principally by the general level of economic activity and the growth of per capita available income in Colombia. Since emerging from recession in the early 2000s, the Colombian economy has experienced significant growth, and improved security conditions. According to DANE, total retail sales including formal and informal trade and other channels, such as on-premise food outlets and drugstores, stood at U.S.$15 billion in 2012 with 76% of total sales made by the formal market being controlled by the four largest players in the country. We believe future growth in the retail sector will be driven by, among other things, economic expansion and increasing credit availability to consumers in Colombia
The Colombian retail food sector comprises various types of stores, including privately-owned supermarkets, limited assortment stores and convenience stores, government-subsidized merchandising cooperatives known ascajas de compensación, specialty stores (such as butcher shops and bakeries) and delivery operations. A large number of Colombians also shop through informal channels, such as neighborhood grocery stores and outdoor food markets.
The positive macroeconomic environment in recent years has contributed to the growth of both the formal and informal markets. In the past several years, the formal market has grown at a faster pace than the informal market driven mainly by increased purchasing power, aggressive penetration strategies by well-capitalized formal retailers which has reduced the proximity advantage of informal outlets, greater packaging options in the formal channels including better presentations at competitive prices, and growing credit product offerings by large retailers. The formal retail market is expected to continue growing in the medium term due to the strong macroeconomic outlook, increasing market consolidation and relatively low penetration when compared with other countries. We believe the growth of the formal market will also be driven by the increasing concentration of Colombia’s population in urban centers. Colombia has a population of approximately 47 million, 46% of which is 25 years old or younger. The food and merchandise retail business in Colombia is highly competitive and is characterized by increasing pressure on profit margins. The number and type of competitors and the degree of competition experienced by each of our stores vary by location. Competition occurs principally on the basis of price, location, selection of merchandise, quality of merchandise (in particular for perishables such as produce), service, store conditions and promotions.
The following table presents certain information about us and our principal competitors in Colombia as of December 31, 2014:
| | | | | | | | | | | | |
| | | Cencosud | | | Exito | | | Olimpica | |
Number of stores | | | 100 | | | | 537 | | | | 260 | |
Total selling space (square meters) | | | 425,196 | | | | 818,132 | | | | 282,980 | |
Source: Public filings.
89
The Home Improvement Industry
Chile
We believe the Chilean home improvement industry is the most developed in South America. However, this is still highly fragmented among big-box operators and several hardware stores (some of which have teamed up in associations such as MTS and Chilemat), according to our estimates. Growth of the industry’s main players has been based on expansion of Chile’s construction and housing industries, as well as sector consolidation.
The Chilean home improvement industry is highly competitive and has been subject to increased consolidation. In 1998, Home Depot entered the Chilean market and was subsequently acquired by Falabella, through its Home Store subsidiary in 2001. In November 2002, we purchased the Chilean home improvement stores and agricultural product chain, Proterra. In January 2011, the Chilean retail holding company SMU acquired the entire share capital of the hardware store chain Construmart, operating a number of stores under the brand Construmart with an average size of 2,500 square meters being the third most relevant player in the home improvement market.
The home improvement industry caters to home improvement, repairs and maintenance, and new construction. Customers in this sector include homeowners, small contractors and large construction companies seeking building materials for new projects. The sector is characterized by high price sensitivity and demand for high levels of product variety.
The following table presents certain information about us and our major competitors in Chile, as of December 31, 2014:
| | | | | | | | |
| | | Sodimac | | | Cencosud | |
Number of stores | | | 84 | | | | 33 | |
Total selling space (square meters) | | | 689,217 | | | | 313,500 | |
Source: Public filings, Internal estimates.
For the year ended December 31, 2014, we estimate that we were the second-largest operator of home improvement stores in Chile in terms of net sales based on our comparison against publically filed information from our main competitors as of December 31, 2014. At December 31, 2014, Sodimac operated 84 home improvement stores with a total of 689,217 square meters of selling space. Its competitive advantage arises from its multi-format structure, with its Sodimac Homecenter stores that are similar to our Easy home improvement stores, as well as its Sodimac Constructor stores that cater to professional builders and its Sodimac Empresas warehouses that facilitate efficient delivery of construction materials in Antofagasta, Viña del Mar, Santiago and Talcahuano primarily used for large construction companies. Sodimac also accepts Falabella’s widely-used store credit card CMR that has significant more penetration in the market than our Cencosud credit card.
Argentina
We believe the Argentine home improvement industry is composed of more than 70 home improvements stores nationwide, of which we operated 50 as of December 31, 2014. The remaining stores are operated by Sodimac, Hiper Tehuelche and Barugel Azulay. There are also various small more specialized hardware and construction supply stores. Prior to 2002, we faced competition from Home Depot (Argentina) until our acquisition of its Argentine operations in February 2002. We face strong competition from other hardware stores and specialty stores dedicated to specific areas of construction and home improvement. Until 2007, when Sodimac entered the market, we were the sole big-box home improvement chain in Argentina, with 17% market share, according to our estimates. We believe that the Argentine home improvement market still offers plenty of room for consolidation, leaving enough space for us to grow over the coming years.
The following table presents certain information about us and Sodimac, our main competitor in Argentina, as of December 31, 2014:
| | | | | | | | |
| | | Cencosud | | | Sodimac | |
Number of stores | | | 50 | | | | 8 | |
Total selling space (square meters) | | | 383,786 | | | | 84,289 | |
Source: Falabella’s public filings, internal estimates.
90
For the year ended December 31, 2014, we estimate that we were the largest operator of home improvement stores in Argentina in terms of net sales based on our comparison against publically filed information from our main competitors as of December 31, 2014. Our principal competitor in Argentina is also Sodimac, which operated 8 home improvement stores with a total of 84,289 square meters of selling space at December 31, 2014.
Colombia
We believe the Colombian home improvement industry is the most underdeveloped in the countries where we compete. For the year ended December 31, 2014, there were 44 home improvement stores. Hence, the industry is highly fragmented and composed of both general and specialized retailers.
Our main competitor is Sodimac HomeCenter, which is a joint venture between Colombian Grupo Corona (51%) and Chilean Falabella (49%), competing in the home improvement market in Colombia since 1993.
The following table presents certain information about us and Home Center, our main competitor in Colombia, as of December 31, 2014:
| | | | | | | | |
| | | Sodimac
Home Center | | | Cencosud | |
Number of stores | | | 34 | | | | 10 | |
Total selling space (square meters) | | | 331,441 | | | | 82,319 | |
Source: Falabella’s public filings, internal estimates.
The Chilean Department Store Industry
The department store industry in Chile traces its origins to 1889, when Salvatore Falabella opened a tailor shop in Chile following his arrival from Italy. Our Department store operations can trace their origins to the founding of Mueblería Paris, a furniture store founded in 1900 by José María Couso. The store later changed its name to Almacenes Paris due to the incorporation of additional product lines to its assortment. Since then, other companies have entered the Chilean market and the industry has experienced intense consolidation. Almacenes Paris was a pioneer in its industry launching in the 1970s the first credit card issued by a retailer, a move that was soon followed by Falabella and smaller competitor Ripley. In the 1990s, following the bankruptcy of Muricy, Almacenes Paris acquired prime locations in shopping center Parque Arauco and Mall Plaza Vespucio. In 1996, Almacenes Paris became a publicly listed company at the Santiago Stock Exchange. Empresas Almacenes Paris S.A. was later acquired by Cencosud in March 2005.
Our principal competitor in Chile is Falabella, which is larger than Paris and Johnson in terms of revenues. The department store industry in Chile is very mature and highly competitive. We compete for customers with specialty retailers, traditional and high-end department stores, national apparel chains, vendor-owned proprietary boutiques, individual specialty apparel stores and direct marketing firms. We compete for customers principally on the basis of quality and fashion, customer service, value, assortment and presentation of merchandise, marketing and customer loyalty programs. Some of these competitors have greater financial resources than we do.
The following table presents certain information about us and our main competitors as of December 31, 2014:
| | | | | | | | | | | | | | | | |
| | | Falabella | | | Cencosud | | | Ripley | | | La Polar | |
Number of stores | | | 45 | | | | 79 | | | | 43 | | | | 38 | |
Total selling space (square meters) | | | 304,994 | | | | 375,586 | | | | 276,080 | | | | 159,000 | |
Source: Falabella’s public filings, Ripley’s public filings and internal estimates.
For the year ended December 31, 2014, we believe we were the second-largest operator of department stores in Chile in terms of net sales based on our comparison against publically filed information from our main competitor as of the same date. Based on that comparison, we estimate that Falabella is the largest department store operator in Chile in terms of revenues and, at December 31 2014, operated 45 department stores with a total of 304,994 square meters of selling space. Falabella’s credit cards and loyalty programs are well-known in the market. On the same basis, we believe Ripley is the third-largest department store operator and, at December 31 2014, operated 43 department stores with a total of 276,080 square meters of selling space. Many of our competitors have active financial services divisions that support their retail activities, and both Falabella and Ripley operate banks focused on consumer lending.
91
The Shopping Center Industry
Chile
The first shopping center in Chile, Cosmocentro Apumanque, opened in 1981. Shopping center sales as a percentage of total retail sales in the country have increased continuously since then, according to the Chilean Council of Shopping Centers. However, a majority of retail sales in Chile still take place in standalone stores, according to the International Council of Shopping Centers. We entered the shopping mall industry in Chile in the early 1990s with the Alto Las Condes shopping mall.
The Chilean shopping center industry is highly competitive and, at December 31, 2014, was composed of more than 45 shopping centers nationwide, the majority of which are operated by us, Grupo Plaza (controlled by Falabella), Parque Arauco and Espacio Urbano (controlled by Walmart Chile), according to public and internal estimates. Shopping centers not only compete with other shopping centers, but also with an increasing number of individual retail stores.
The following table provides certain information about us and our competitors in Chile at December 31, 2013:
| | | | | | | | |
| | | Gross leasable area(1) | | | Market share | |
GrupoPlaza (Falabella) | | | 832 | | | | 22 | % |
Espacio Urbano(2) (Wal-Mart) | | | 615 | | | | 16 | % |
Cencosud(2) | | | 1,103 | | | | 29 | % |
Parque Arauco S.A.(3) | | | 306 | | | | 10 | % |
Source: Chilean Council of Shopping Centers and public filings by Falabella, Parque Arauco and Walmart Chile, as well as internal estimates.
| (1) | In thousands of square meters. |
| (2) | Includes area leased to related companies. |
| (3) | Gross leasable area adjusted to reflect proportional ownership participation in each shopping center. |
At December 31, 2014, we were the largest shopping center operator in Chile in terms of gross leasable space based on our comparison against publically filed information from our main competitor as of December 31, 2014. As noted in the table above, our principal competitors include GrupoPlaza, Espacio Urbano and Parque Arauco. Parque Arauco’s shopping center Parque Arauco is located close to and directly competes with two of our largest shopping centers, Alto Las Condes and Costanera Center. Parque Arauco offers many of the same services as Alto Las Condes and Costanera Center, including ample parking and major department stores.
On June 13, 2012, we opened the Costanera Center shopping mall, a land mark development for the city of Santiago, with a total gross leasable of 140,000 square meters. As of December 31, 2014, occupancy at this shopping center was 98% and it had over 3 million visitors a month.
Argentina
In 2014, the Argentine shopping center industry was composed of more than 36 shopping centers, the majority of which are operated by IRSA Inversiones Representaciones S.A. (“IRSA”) and Cencosud. As in Chile, shopping centers are relatively new to the market in Argentina, and most retail sales still take place at individual retail stores, according to the International Council of Shopping Centers.
The following table presents certain information about us and our main competitor in Argentina, IRSA, as of December 31, 2014:
| | | | | | | | |
| | | Market share | | | Gross leasable area(1) | |
IRSA | | | 17 | % | | | 311 | |
Cencosud | | | 41 | % | | | 747 | |
Source: Cencosud and IRSA.
| (1) | Includes area used by affiliate companies. |
92
At December 31, 2014, we were the first shopping center operator in Argentina in terms of gross leasable space, with a market share of 41% based on our comparison against publically filed information from our main competitor as of December 31, 2014. Our principal competitor in Argentina’s shopping center market is IRSA which owns and operates the Abasto Shopping Center, Alto Palermo, Alto Avellandeda, Paseo Alcorta and Patio Bullrich, among others.
Peru
In 2014, we estimate the Peruvian shopping center industry was composed of more than 30 shopping centers, the majority of which are operated by Real Plaza (associated with the Interbank Group that also operates Supermercados Peruanos), Falabella, Aventura Plaza, Parque Arauco and Jokey Plaza. The shopping center industry is relatively new to the market in Peru, and most retail sales still take place at individual retail stores.
The following table sets forth the market shares held by the major shopping center operators in Peru as of December 31, 2014:
| | | | | | | | |
| | | Gross leasable area(1) | | | Market share(2) | |
Real Plaza (Interbank) | | | 613 | | | | 20.3 | % |
Aventura Plaza | | | 234 | | | | 9.1 | % |
Open Plaza | | | 274 | | | | 10.7 | % |
Jockey Plaza | | | 156 | | | | 6.1 | % |
Parque Arauco | | | 124 | | | | 9.9 | % |
Cencosud | | | 123 | | | | 4.8 | % |
Source: Company filings
| (1) | In thousands of square meters. |
| (2) | Based on gross leasable area and including only the operators shown. |
Our principal shopping center in Peru is Plaza Lima Sur with a supermarket and leasable area of 40,160 square meters, resulting in a market share of approximately 4.8% of the shopping center market, based on gross leasable area at December 31, 2014. We believe that the shopping center market in Peru has a high potential for growth, and we are currently developing additional shopping centers in Peru.
In June 2012, we opened an additional shopping center in Peru, located in the Miraflores section of Lima, with a 100% occupancy rate, 19 stores and a gross leasable area of 1,196 square meters. In 2013, we opened another shopping center in the city of Arequipa called the Cerro Colorado Shopping Center.
Environmental Regulations and Compliance
In each of Argentina, Brazil, Chile, Colombia and Peru, we are subject to the full range of governmental regulation and supervision generally applicable to companies engaged in business in each country, including labor laws, social security laws, public health, consumer protection and environmental laws, securities laws and antitrust laws. These include regulations to ensure sanitary and safe conditions in facilities for the sale and distribution of foodstuffs and requirements to obtain construction permits for our new facilities. We believe that we are in compliance in all material respects with all applicable statutory and administrative regulations with respect to our business in each of the countries in which we operate, including applicable environmental regulations.
The regulation of matters relating to the protection of the environment is not as well developed in Argentina, Brazil, Chile, Colombia and Peru as in the United States and certain other countries. Accordingly, we anticipate that additional laws and regulations will be enacted over time in these countries with respect to environmental matters. We believe that there are no material judicial or administrative proceedings pending against us with respect to any environmental matter and that we are in compliance in all material respects with all applicable environmental regulations in Argentina, Brazil, Chile, Colombia and Peru. We cannot assure you that future legislative or regulatory developments will not impose restrictions on us that would be material.
Chile
We and all of our subsidiaries with operations in Chile are subject to theLey de Protección al Consumidor. Compliance with the Ley de Protección al Consumidor is enforced by SERNAC. Other than as described in “Item 8. Financial Information—A. Consolidated Statements and Other Financial Information—Legal and Administrative Proceedings,” we do not have any material proceedings arising from theLey de Protección al Consumidor, and we believe we are in compliance with all material aspects of such law.
93
Our supermarkets are subject to inspection by the correspondingSecretaría Regional Ministerial de Salud (the Regional Sanitary Authority or “SEREMI de Salud”) which inspects supermarkets on a regular basis and takes samples for analysis. We regularly hire a private inspection company to undertake private inspections of our facilities to ensure that they meet or surpass all Chilean health standards. Our supermarkets are also subject to inspection by theServicio Agrícola y Ganadero (the Agricultural and Livestock Service or “SAG”). Concessionaires that operate pharmacies within some of our supermarkets are also subject to licensing and inspection by the SEREMI de Salud. Except for government licenses required for the sale of alcoholic beverages, baked goods, pharmaceuticals, seafood and vegetables and customary business licenses required by local governmental authorities, there are no special governmental licenses or permits required for the sale and distribution of foodstuffs or other products sold by us.
Additionally, the Chilean antitrust authorities have broad regulatory powers and have authority to deny acquisitions which they consider will have adverse competitive effects on the relevant market or will promote anticompetitive behavior. The antitrust authorities have, from time to time, denied authorization for certain acquisitions, such as the denial of the proposed Falabella acquisition of D&S in January 2008.
Banco Paris and CAT are under the supervision of the SBIF, and Paris Corredores de Seguros Limitada is under the supervision of the SVS. Additionally,Banco Paris is subject to theLey General de Bancos (the General Banking Law) and its regulations, and is inspected by the SBIF at least once a year. The inspection includes a review of the bank’s credit risk policies and procedures, operational risks and control policies and other issues such as customer service, accounting rules, interest rates, information and technology and financial operations.Banco Paris is in compliance in all material respects to the regulations to which it is subject.
CAT started its credit card operations in 2003 and until 2006 was not subject to any special regulation. In 2006 the SBIF issued a set of special regulations targeting the credit card business and placing under its supervision companies engaged in the issuance or operation of credit cards, including CAT, or any other similar systems, where the operator assumes monetary obligations to the public. Moreover the SERNAC regulates credit cards issued by retailers in matters related to consumers’ protection. There is a maximum interest rate that can be charged, but there are certain other fees that are not considered for such purposes which allow retail credit card issuers to increase margins.
Cencosud Administradora de Tarjetas S.A. (“CAT”) was a defendant in a class action suit filed by SERNAC. On April 24, 2013, the Supreme Court of Chile ruled for SERNAC ordering CAT to reimburse certain cardholders for excess maintenance fees charged since 2006 plus adjustments for inflation and interest. As of December 31, 2014 the company continues to have a provision for Ch$1,887 million for reimbursement of principal in connection with this class action suit in addition to Ch$759 million for interest and inflation.
In December 13, 2013, an amendment to Law No. 18,010 (governing credit operations) became effective. The amendment resulted in several modifications to the then existing rules, including: (i) the establishment of lower limits on interest charged to outstanding amounts below UF 200, (ii) reductions in the amount of fees charged for prepayment, and (iii) an increase in the minimum period before early payment could be demanded for transactions of UF 200 or below, to 60 days.
Paris Corredores de Seguros Limitada obtained in 1998 an insurance brokerage company authorization with the SVS and is subject to its supervision and regulations. Paris Corredores de Seguros Limitada is in compliance in all material respects with the regulations to which it is subject.
We are required to obtain a series of permits and authorizations to operate our shopping centers, which include the approval of the correspondingDirección de Obras Municipales (Municipal Works Bureau), among others. Additionally, we are required to obtain for every new project a construction permit and be in compliance with a series of land use, commercial real estate and environmental regulations.
In an initiative by President Michelle Bachelet the Chilean Congress approved a modification to the Chilean labor codes amending the regulation governing employment by retail establishments on Sundays and holidays. Both houses agreed to add 7 Sundays a year to the required days off by entities governed by the regulation. This amendment increased days off from the 2 Sundays a month already contemplated in the Chilean labor code for such entities. Hourly wages were also amended by this initiative implementing a minimum 30% surcharge on already agreed upon wages for hours worked on Sundays. Commissions and bonuses are not taken into consideration when calculating said surcharge. The right of an employee to have designated Sundays off cannot be negotiated by employers, and employers cannot compensate employees in cash or by rolling over the number of Sundays from one year to the next.
This bill is currently pending presidential approval. At this point Cencosud does anticipate that the enactment of this bill will have a materially adverse effect on our operations or financial condition.
94
Argentina
We and all of our subsidiaries with operations in Argentina are subject to the Consumer Protection Law. Compliance with the said law is enforced by theSecretaría de Comercio Interior on a national level. On the provincial and municipal level, there are numerous agencies that also enforce violations. We do not have any material proceedings arising from theLey de Proteccion al Consumidor, and we believe we are in compliance with all material aspects of such law.
Our supermarkets are subject to inspection by national, provincial and municipal authorities, including theServicio Nacional de Sanidad y Calidad Agroalimentaria, Administración Nacional de Medicamentos, Alimentos y Tecnología Médica (“ANMAT”) and the Secretaría de Comercio Interior. We regularly hire a private inspection company to undertake private inspections of our facilities to ensure that we meet or surpass all Argentine health standards. Concessionaires that operate pharmacies within some of our supermarkets are also subject to licensing and inspection by the ANMAT. Except for government licenses required for the sale of alcoholic beverages, baked goods, pharmaceuticals, meat, seafood and vegetables and customary business licenses required by local governmental authorities, there are no special governmental licenses or permits required for the sale and distribution of foodstuffs or other products sold in our stores. Our supermarkets, shopping centers and home improvement stores in Argentina are required to have a series of authorizations and permits to operate. Also, our new projects in the province of Buenos Aires are required to comply with law 12.573 on major commercial areas to obtain the necessary authorizations. All existing and projected supermarkets are required to comply with the regulations concerning land use, commercial real estate and the environment.
Our credit card operations are subject to the Credit Card Law and its regulations, enforced by theSecretaría de Comercio Interior. We are also subject to regulations issued by the Central Bank of Argentina.
Additionally, the Argentine Antitrust Commission has broad regulatory powers and has authority to deny acquisitions which it considers will have adverse competitive effects on the relevant market or will promote anticompetitive behavior.
Brazil
We are subject to a wide range of governmental regulation and supervision generally applicable to companies engaged in business in Brazil, including federal, state and municipal regulations, such as labor laws, public health and environmental laws. In order to open and operate our stores in Brazil, we need a business permit and site approval, an inspection certificate from the local fire department as well as health and safety permits. Our stores are subject to inspection by municipal authorities. We believe that we are in compliance in all material respects with all statutory and administrative regulations applicable to our business.
Our business operations in Brazil are primarily affected by a set of consumer protection rules regulating matters such as advertising, labeling and consumer credit. We believe we are in compliance in all material respects with these consumer protection regulations.
As a result of significant inflation during long periods in the past, it was common practice in Brazil not to label individual items. However, a federal regulation establishes that products exposed to consumers must contain information about prices (for instance price tags, signs or bar codes which can be read with scanners) in order to facilitate the identification of prices of each product by the consumer. Pursuant to these new rules, pricing information must be physically attached or adjacent to the product. When bar codes are used, the commercial establishment is required to provide easily accessible scanners. We believe that we are in compliance with these provisions in all material aspects.
The Brazilian Congress is discussing a bill requiring a prior assessment of the impact of the construction of a hypermarket in excess of 1,000 square meters on the relevant neighborhood. The proposed regulation is intended to protect traditional family-owned retailers that have increasingly lost market share in Brazil to the larger chains and hypermarkets. Regulations of this type already exist at the municipal level. For example, governmental authorities in the city of Porto Alegre in the State of Rio Grande do Sul issued a city ordinance in January 2001 prohibiting the construction of food retail stores with a selling area greater than 1,500 square meters, which in May 2005, was amended as to increase from 1,500 to 2,500 squares meters the selling area of food retail stores. Other Brazilian regions may adopt similar laws, and, if the bill pending before the Brazilian Congress becomes law, our future expansion and growth may be subject to significant constraints.
Additionally, the Brazilian antitrust authorities have broad regulatory powers and have authority to deny acquisitions which they consider will have adverse competitive effects on the relevant market or will promote anticompetitive behavior.
Pharmacies. Pharmacies owned or operated by us are subject to the control and monitoring of the Brazilian National Health Surveillance Agency (“ANVISA”) and public state and municipal health authorities. According to Law No. 6,360, of September 23, 1976, and Decree No. 79,049, of January 5, 1977, ANVISA has the power to control, monitor and issue authorizations to companies to
95
legally extract, produce, pack, import, export, and store medications, pharmaceutical items, drugs and related products, cosmetics, personal hygiene products, perfumes and similar products, domestic cleaning products and beauty products. The authorization issued by ANVISA enables those kinds of companies to have operations in Brazil, as a whole, during an indeterminate period of time. The ANVISA authorization must be renewed whenever there is a change in a company’s activities, shareholders, officers or managers. Moreover, each establishment selling therapeutic, pharmaceutical, cosmetic and/or personal hygiene products, or developing any of the above-mentioned activities must also be licensed by the competent state or municipal sanitary authority, and have a technically responsible person duly authorized by the Pharmacy Regional Committee. On August 17, 2009, ANVISA enacted Regulation No. 44, which made significant changes to existing regulations establishing the (i) types of products that can be commercialized; (ii) how such product are displayed; (iii) pharmaceutical services offered; and (iv) internet sales.
Peru
Our subsidiaries with operations in Peru are subject to the Antitrust Law and the Consumer Protection Law. Compliance with these laws is enforced by the Instituto Nacional de Defensa de la Competencia y de la Protección de la Propiedad Intelectual (“INDECOLI”), the Peruvian public antitrust and consumer protection agency. Acquisitions are not subject to authorization from INDECOLI.
In addition to government licenses required for the sale of alcoholic beverages, baked goods, pharmaceuticals, seafood and vegetables and customary business licenses required by governmental authorities, such as the Agriculture Ministry, there are special governmental licenses or permits required for the sale and distribution of foodstuffs or other products sold at our stores. Our supermarkets are subject to inspection by theDirección General de Salud (the General Health Office), a governmental office of the Health Ministry, which verifies the quality of our products. The sanitary inspection of our supermarkets is in charge of the local municipality. Concessionaires that operate pharmacies within some of our supermarkets are also subject to licensing and inspection by theDirección Regional de Medicamentos, Insumos y Drogas. We believe that we are in compliance in all material respects with all applicable statutory and administrative regulations with respect to our business.
Our shopping centers are required to obtain a series of authorizations, such as an operation license from the local municipality, to operate. Additionally, we are required to obtain for every new project a construction permit and license from the local authority. We believe that we are in compliance in all material respects with these requirements.
Colombia
In Colombia, we are subject to laws that regulate competition and consumer protection. These laws include theLey de Protección al Consumidor (Consumer Protection Law), which is enforced by theSuperintendencia de Industria y Comercio (Superintendency of Industry and Commerce).
Additionally, mergers and acquisitions are reviewed by the Superintendency of Industry and Commerce and by the Colombian Superintendency of Companies for compliance with antitrust and general corporate law requirements.
We are required to obtain a series of permits and authorizations to operate our businesses depending on the type of products and services that are offered to the public, but generally we are required to seek the approval of local and national agencies for sales of pet supplies, personal consumer products whether imported or of domestic origin, and compliance with noise and energy regulations. Each business we operate is also required to obtain environmental approvals. In addition, we are also subject to environmental regulation in respect of waste disposal at each of our stores. Consumer finance and credit card operations are also subject to approval by theSuperintendencia Financiera de Colombia (Colombian Financial Superintendency).
Pharmacies.
Pharmacies owned or operated by us are subject to the control and monitoring of the Superintendencia Nacional de Salud (“SUPERSALUD”) through the Instituto Nacional de Vigilancia de Medicamentos y Alimentos (“INVIMA”) and city health authorities. According to Law No. 100, of 1993, art. 245, INVIMA has the power to control, monitor and issue authorizations to companies to legally extract, produce, pack, import, export, and store medications, pharmaceutical items, drugs and related products, cosmetics, personal hygiene products, perfumes and similar products, domestic cleaning products and beauty products. The authorization issued by INVIMA enables those kinds of companies to have operations in Colombia, as a whole, during an indeterminate period of time. The INVIMA authorization must be renewed whenever there is a change in a company’s activities, shareholders, officers or managers.
96
Gas stations
According to section 212 of the Petroleum Code and Law 39 of 1987, distribution of liquid fuels and their derivatives is considered a public utility activity. Consequently, individuals or entities that engage in these activities are subject to regulations issued by the government in the interest of Colombian citizens. The Colombian government has the power to determine quality standards, measurement and control of liquid fuels, and establish penalties that may apply to dealers who do not observe such rules.
The Ministry of Mines and Energy of Colombia is the entity that controls and exercises technical supervision over the distribution of liquid fuels derived from petroleum, including the refining, importing, storage, transport and distribution in the country. Law 812 of 2003 identified the agents of the supply chain of petroleum-derived liquid fuels.
The distribution of liquid fuels, except LPG, is regulated by Decree 4299 of 2005, as modified by Decrees 1333 and 1717 of 2007 and 2008, respectively, which establish the requirements, obligations and penalties applicable to supply agents in the distribution, refining, import, storage, wholesale, transport, retail sale and consumption of liquid fuels.
Decrees 283 of 1990 and 1521 of 1998, and their modifications, establish minimum technical requirements for the construction of storage plants and service stations. The Decrees also regulate the distribution of liquid fuels, establishing the minimum requirements for distributors and the activities and types of agreements permitted for these agents. The Ministry of Mines and Energy also regulates the types of liquid fuels that can be sold and purchased and the penalties for noncompliance with governmental regulations.
As of May 2012, the CREG (Comision de Regulacion de Energia y Gas) determines the prices for regulated crude oil by-products, except for gasoline, diesel and biofuels (all of which are determined by the Ministry of Mines and Energy). The ANH (Agencia Nacional de Hidrocarburos) determines the price for crude oil corresponding to royalty payments. Jet fuel prices are determined according to Law 1450 of 2011.
The distribution of fuels in areas near Colombian borders is subject to specific regulations that impose stringent control procedures and requirements. Currently, Ecopetrol is no longer responsible for fuel distribution in these areas. That responsibility was transferred to the Ministry of Mines and Energy, pursuant to Law 1430 of 2010.
Regulation of Biofuel and Related Activities
The sale and distribution of biofuels is regulated by the Ministry of Mines and Energy. Regulations establish the quality and pricing standards for biofuels and impose minimum requirements for mixing ethanol with gasoline and biodiesel with diesel.
C. ORGANIZATIONAL STRUCTURE
Organizational Structure
The following is a simplified organizational chart showing our company and our principal operating divisions as of December 31, 2014.
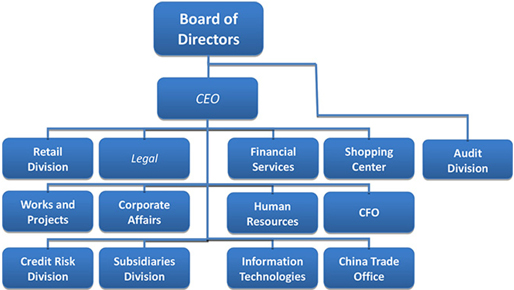
97
Our Subsidiaries
The following are our direct and indirect majority-owned subsidiaries as of December 31, 2014:
| | | | | | | | |
Country | | Controlling Stake | | | Chilean
Tax ID number | | Company name |
Chile | | | 99.9 | % | | 81.201.000-K | | Cencosud Retail S.A. |
Chile | | | 99.9 | % | | 76.365.580-6 | | Jumbo Administradora Norte S.A. |
Chile | | | 99.9 | % | | 99.571.870-7 | | Jumbo Administradora Temuco S.A. |
Chile | | | 99.9 | % | | 76.819.580-3 | | Santa Isabel Administradora Norte Ltda. |
Chile | | | 99.9 | % | | 76.819.500-5 | | Santa Isabel Administradora Sur Ltda. |
Chile | | | 99.9 | % | | 76.062.794-1 | | Santa Isabel Administradora S.A. |
Chile | | | 99.9 | % | | 78.448.780-6 | | Paris Administradora Sur Ltda. |
Chile | | | 99.9 | % | | 77.779.000-5 | | Paris Administradora Ltda. |
Chile | | | 99.9 | % | | 77.301.910-K | | Logística y Distribución Paris Ltda. |
Chile | | | 99.9 | % | | 77.251.760-2 | | Jumbo Supermercados Administradora Ltda. |
Chile | | | 99.9 | % | | 77.218.570-7 | | Cencosud Corredores de Seguros y Servicios S.A. |
Chile | | | 99.9 | % | | 77.312.480-9 | | Administradora de Servicios Cencosud Ltda. |
Chile | | | 99.9 | % | | 99.586.230-1 | | Viajes Paris S.A. |
Chile | | | 99.9 | % | | 79.829.500-4 | | Eurofashion Ltda. |
Chile | | | 99.9 | % | | 76.116.801-3 | | Administradora TMO S.A. |
Chile | | | 99.9 | % | | 76.168.900-2 | | Meldar Capacitación Ltda. |
Chile | | | 99.9 | % | | 77.566.430-4 | | Sociedad Comercializadora de Vestuarios FES Ltda. |
Chile | | | 99.9 | % | | 99.512.750-4 | | MegaJohnsons Puente Alto S.A. |
Chile | | | 99.9 | % | | 96.953.470-3 | | MegaJohnsons S.A. |
Chile | | | 99.9 | % | | 96.973.670-5 | | MegaJohnsons Maipú S.A. |
Chile | | | 99.9 | % | | 96.988.680-4 | | MegaJohnsons Puente S.A. |
Chile | | | 99.9 | % | | 96.989.640-0 | | MegaJohnsons Viña del Mar S.A. |
Chile | | | 99.9 | % | | 96.988.700-2 | | Johnson Administradora Ltda. |
Chile | | | 99.9 | % | | 96.988.690-1 | | MegaJohnsons Quilin S.A. |
Chile | | | 99.9 | % | | 76.398.410-9 | | Johnsons Mega San Bernardo S.A. |
Chile | | | 99.9 | % | | 76.190.379-9 | | Cencosud Retail Administradora Ltda. |
Chile | | | 99.6 | % | | 96.671.750-5 | | Easy S.A. |
Chile | | | 99.6 | % | | 76.365.590-3 | | Easy Administradora Norte S.A. |
Chile | | | 99.9 | % | | 99.500.840-8 | | Cencosud Administradora de Tarjetas S.A. |
Chile | | | 99.9 | % | | 76.023.825-2 | | Cencosud Servicios Integrales S.A. |
Chile | | | 99.9 | % | | 94.226.000-8 | | Cencosud Shopping Centers S.A. |
Chile | | | 99.9 | % | | 88.235.500-4 | | Sociedad Comercial de Tiendas S.A. |
Chile | | | 99.9 | % | | 84.658.300-9 | | Inmobiliaria Bilbao Ltda. |
Chile | | | 44.9 | % | | 78.409.990-8 | | ACC Alto las Condes Ltda. |
Chile | | | 99.9 | % | | 76.433.310-1 | | Costanera Center S.A. |
Chile | | | 99.9 | % | | 96.732.790-5 | | Inmobiliaria Santa Isabel S.A. |
Chile | | | 99.9 | % | | 76.203.299-6 | | Comercializadora Costanera Center S.P.A. |
Chile | | | 99.9 | % | | 99.565.970-0 | | Banco Paris S.A. |
Chile | | | 99.9 | % | | 76.099.893-1 | | Banparis Corredores de Seguros Ltda. |
Chile | | | 99.9 | % | | 96.978.180-8 | | Cencosud Internacional Ltda. |
Chile | | | 99.9 | % | | 76.258.307-0 | | Jumbo Argentina S.P.A. |
Chile | | | 99.9 | % | | 76.258.309-7 | | Cencosud Internacional Argentina S.P.A |
| | | | | | |
| Country | | | | Chilean
Tax ID number | | Company name |
Argentina | | 99.9% | | Foreign | | Cencosud S.A. (Argentina) |
Argentina | | 99.9% | | Foreign | | Unicenter S.A. |
Argentina | | 99.9% | | Foreign | | Jumbo Retail Argentina S.A. |
Argentina | | 87.4% | | Foreign | | Agrojumbo |
Argentina | | 99.9% | | Foreign | | Blaisten S.A. |
Argentina | | 99.9% | | Foreign | | Cavas y Viñas El Acequion S.A. |
Argentina | | 50.0% | | Foreign | | Carnes Huinca S.A. |
Argentina | | 99.9% | | Foreign | | Agropecuaria Anjullon S.A. |
| | | |
Argentina | | 99.9% | | Foreign | | Corminas S.A |
Argentina | | 99.9% | | Foreign | | Invor S.A. |
Argentina | | 99.9% | | Foreign | | Pacuy S.A. |
Argentina | | 99.9% | | Foreign | | Supermercados Dave S.A. |
Uruguay | | 100% | | Foreign | | SUDCO Servicios Regionales S.A. |
Colombia | | 99.9% | | Foreign | | Cencosud Colombia S.A. |
Brazil | | 99.9% | | Foreign | | Cencosud Brasil S.A. |
U.S.A | | 99.9% | | Foreign | | Gbarbosa Holding LLC |
Brazil | | 99.9% | | Foreign | | Gbarbosa Holding S.A |
Brazil | | 99.9% | | Foreign | | Cencosud Brasil Comercial Ltda. |
98
| | | | | | | | |
Country | | Controlling Stake | | | Chilean
Tax ID number | | Company name |
Brazil | | | 99.9 | % | | Foreign | | Mercantil Rodrigues Comercial Ltda. |
Brazil | | | 99.9 | % | | Foreign | | Perini Comercial de Alimentos Ltda. |
Peru | | | 99.9 | % | | Foreign | | Cencosud Perú |
Peru | | | 99.9 | % | | Foreign | | Teledistribución S.A. |
Peru | | | 99.9 | % | | Foreign | | Almacenes Metro S.A. |
Peru | | | 99.9 | % | | Foreign | | E. Wong S.A. |
Peru | | | 99.9 | % | | Foreign | | Cencosud Retail Peru S.A. |
Peru | | | 99.9 | % | | Foreign | | Tres Palmeras S.A. |
Peru | | | 99.9 | % | | Foreign | | Las Hadas Inversionistas S.A. |
Peru | | | 99.9 | % | | Foreign | | Cinco Robles SAC |
Peru | | | 99.9 | % | | Foreign | | ISMB Supermercados S.A. |
Peru | | | 99.9 | % | | Foreign | | Travel International Partners Perú S.A. |
Peru | | | 99.9 | % | | Foreign | | Banco Cencosud S.A. |
D. PROPERTY, PLANTS AND EQUIPMENT
See “—B. Business Overview—Property, Plants and Equipment.”
Item 4A. Unresolved Staff Comments
Not applicable.
Item 5. Operating and Financial Review and Prospects
We believe we are one of the leading multi-brand retailers in South America, based on revenues, selling space, number of stores and gross leasable area in the sectors and countries in which we operate. We operate through a number of formats, including supermarkets, home improvement stores, shopping centers and department stores. We seek to increase operations through organic growth and acquisitions in Brazil, Peru and Colombia, which the Company believes are high growth and underpenetrated markets due to their favorable demographics, sustainable household consumption growth, low formal retail penetration, and strong macroeconomic environments, as described in “Item 4. Information on the Company—B. Business Overview—Our Company” and “—Industry Overview and Competition.” As a complement to our core retailing business, we are actively involved across the region in the commercial real estate development business, particularly in Chile, Argentina, Colombia and Peru, with 53 shopping malls representing 800,272 square meters of gross leasable area for third parties as of December 31, 2014. We also offer private label credit cards, consumer loans and limited financial services to our retail customers.
A. OPERATING RESULTS
Trends and Factors Affecting Our Results of Operations
Our results of operations have been influenced and will continue to be influenced by the following factors:
Developments in the Chilean economy
Our operations in Chile accounted for 36.3% of our consolidated revenues from ordinary activities for the year ended December 31, 2014. Consequently, our financial condition and results of operations are substantially dependent on economic conditions prevailing in Chile. In 2010, the Chilean economy began to recover following the 2009 recession. As reported by the Central Bank of Chile, GDP contracted 1.0% in 2009, but increased by 6.1% in 2010, 6.0% in 2011, 5.5% in 2012 and is estimated to have grown 4.2% in 2013 as reported by the Central Bank of Chile. According to ILACAD World Retail (“ILACAD”), an international consulting company that monitors the retail industry, the Chilean formal retail sector, which consists of business that are taxed and that employ formal labor, accounts for 63% of the retail sector, a relatively high number in comparison to the other countries in which we operate, but low in comparison to the United States, where the formal sector accounts for 92% of the retail sector, according to the U.S. Census Bureau, as of 2013.
The recovery of the Chilean economy in 2010 was led in part by a recovery of the prices of Chile’s exports, which according to the World Bank contributed 32.6% of GDP in the 2010-2014 period. As a result of the economic recovery, the Consumer Price Index (“CPI”) inflation increased 4.6% in 2014, 3.0% in 2013 and 1.5% in 2012, according to the Central Bank of Chile. Inflation began to accelerate during 2014 following less favorable copper prices and increased international oil prices, a lower real interest rate and expectations of monetary policy tightening in the U.S.
99
During 2014, the Chilean Central bank began a process of loosening monetary policy in response to weaker economic activity with the aim of boosting growth. Local output, demand and employment indicators continued to show softer dynamics in the economy during this period. These factors, in conjunction with timid global growth prospects, led the bank to cut its benchmark rate for the fourth consecutive time to 3% during its October 16, 2014 meeting. The unemployment rate increased to 6.7% as of December 31, 2014, as internal demand cooled and output decreased, from 5.6% in December 2013, and was 6.1% in December 2012, 6.6% in December 2011, 7.1% in December 2010 and 10.0% in December 2009, according to the Central Bank of Chile. See “Item 3. Key Information - D. Risk Factors . Risks Related to Chile.”
Chile maintains one of the highest foreign currency credit ratings in Latin America, currently rated AA- by Standard & Poor’s Financial Services LLC, (“S&P”), Aa3 by Moody’s Investors Service, Inc. (“Moody’s”) and A+ by Fitch, Inc. (“Fitch”), as of December 31, 2014. The future economic, social and political developments in Chile, over which we have no control, could have a material adverse effect on us, including impairing our business, financial condition or results of operations. Credit ratings are subject to periodic review and we cannot assure you that the current ratings will not be revised or lowered in the future.
On September 29, 2014, Chile enacted Law No. 20,780 (the “Tax Reform Act”). The Tax Reform Act introduced changes to the corporate tax rate, mandating a gradual increase of the rate from 20% to 25% or 27% in certain cases, the rules regarding minimum capitalization, and the taxation of Chilean investments abroad (the controlled-foreign-corporation rules), among others. The new rules are set to come into effect gradually, with the implementation process having commenced on October 1, 2014 and set to be completed by January 1, 2018. The effects of this tax reform may increase our operating and compliance costs, which could negatively affect our financial results and our ability to grow our business.
Developments in the Argentine economy
Our operations in Argentina accounted for 24.7% of our consolidated revenues from ordinary activities for the year ended December 31, 2014. Accordingly, the Company is sensitive to macroeconomic conditions in Argentina.
From late 1998 to 2002, the Argentine economy went through an economic recession marked by reduced levels of consumption and investment and an elevated unemployment rate. As reported by the INDEC (Statistics and Census National Bureau), Argentina’s GDP decreased by 0.8% in 2000, 4.4% in 2001 and 10.9% in 2002. In December 2001, a deep economic and political crisis forced Argentina to declare a suspension on payment of its foreign debt. In early 2002, the government released the Argentine peso from its one-to-one peg to the U.S. dollar and allowed the exchange rate to float, resulting in a 49.6% devaluation of the Argentine peso from January 1, 2002 to December 31, 2002, according to the Central Bank of Argentina. From 2003 to 2010, economic indicators showed signs of recovery, guided by a competitive exchange rate, a healthier international context, higher commodity prices and expansionary fiscal and monetary policies. In 2005, Argentina completed the restructuring of most of its 2001 defaulted public debt, which in turn reduced significantly the risk premium on its outstanding bonds. The government recently completed negotiations to serve the remaining debt owed to the Paris Club. As a consequence, Argentina was able to decrease its public-to-GDP ratio from 139% in 2003 to around 45% in 2014, as reported by the Ministry of Economy.
According to the INDEC, the Argentine economy grew by 9.2% in 2005, 8.5% in 2006, 8.7% in 2007 and 6.8% in 2008. Due to the global financial crisis, Argentina’s GDP according to the World Bank, expanded by only 0.1% in 2009, while it showed strong signs of recovery in 2010 and 2011, growing by 9.1%, and 8.6%, respectively. During 2012 and 2013 Argentina’s GDP grew by 0.9%, and 3.0%, respectively, also according to the World Bank. Unemployment levels also improved, from 8.6% and 7.7% in the fourth quarter of 2009 and 2010, respectively, to 7.2% and 6.8% in the fourth quarter of 2011 and 2012, respectively, as reported by the World Bank. According to INDEC unemployment for 2013 stood at 7.2%. As of December 2014, the unemployment rate was 6.9%. Argentina’s retail market is an underpenetrated sector, as the formal retail sector accounts for 42% of the retail sector, according to ILACAD, as of 2012. As an effect of high consumption, however, the country has experienced inflation of 11% in 2010, 10% in 2011, 11% in 2012 and 10.5% in 2013, as reported by INDEC, exceeding that of other countries in South America, according to publicly available information. In response to demands from international investors and the International Monetary Fund, the government of Argentina introduced a new methodology for the calculation of price variations in the domestic economy. The new index revealed a price increase of 23.9% as of December 2014. As per the Central Bank of Argentina, international reserves reached a record-high of over U.S.$52 billion in 2010, U.S.$46 billion in 2011 and U.S.$43 billion in 2012 before falling to U.S.$30 billion by the end of 2013. International reserves held by the Central Bank of Argentina stood as U.S.$31.4 billion as of December 31, 2014.
After several years of price stability, the devaluation of the Argentine peso in January 2002 created pressures on the domestic price system that generated high inflation in 2002 before substantially stabilizing in 2003. The local interest rate, the BAIBAR, was 9.45%, 10.11%, 9.08%, 12.10% and 30.14% on December 31, 2009, December 31, 2010, December 31, 2011, December 31, 2012 and December 31, 2013, respectively, as reported by the Central Bank. The BAIBAR stood at 10.21% on September 30, 2014.
100
Argentina is rated SD by S&P, Caa1 by Moody’s with negative outlook and RD by Fitch, as of September 30, 2014. The future economic, social and political developments in Argentina, over which we have no control, could impair business, financial condition or results of operations. Credit ratings are subject to periodic review and we cannot assure you that the current ratings will not be revised or lowered in the future. See “Item 3. Key Information - D. Risk Factors . Risks Related to Argentina.”
Developments in the Brazilian economy
Our operations in Brazil accounted for 20.1% of our consolidated revenues from ordinary activities for the year ended December 31, 2014. Accordingly, the Company is sensitive to macroeconomic conditions in Brazil.
In recent years, we have benefited from Brazil’s reasonably stable economic environment. In 2009, the Brazilian economy stagnated in the wake of the global economic and financial crisis; however, by the second quarter of 2009 the Brazilian economy had emerged from recession and started to regain its growth momentum. To mitigate the impact of the global economic and financial crisis, the Central Bank of Brazil responded in 2009 with a number of measures. Besides reducing the SELIC rate, the Central Bank of Brazil deployed part of its international reserves to replace international credit lines impacted by the Lehman bankruptcy and reduced reserve requirements with the specific purpose of acquiring assets from small banks and increasing the insurance limit for small banks’ time deposits. These initiatives, along with fiscal measures, contributed to keeping the recession relatively brief (mostly concentrated between the fourth quarter of 2008 and the first quarter of 2009) and ensured a strong recovery in the second half of 2009, as reported by the Central Bank of Brazil.
The unemployment rate in Brazil has decreased significantly in the past decade from 10.5% at December 2002 to 4.8% as of December 31, 2014, as reported by the Central Bank of Brazil, a record low for the month in the face of weak economic expansion. At the same time, private consumption has followed a similar positive trend. The decrease in unemployment and increase in private consumption drove growth for the Brazilian economy as pent up demand by a growing middle class was being satisfied. The Brazilian retail market is an underpenetrated sector as 48% of the sector is informal according to Credit Suisse Research estimates, as of 2013.
The Brazilian economy has slowed its rate of expansion in the recent past with GDP growth of 2.7% for 2011 and 0.9% in 2012, according to the Central Bank of Brazil, reflecting past policy tightening to contain inflation risks and, more recently, the weaker external environment. Growth during 2013 stood at 1.9%, below consensus for the year. Sluggish growth continued throughout most of 2014, with the Brazilian government cutting its expected growth for the year to 0.9%, which is above the market consensus of 0.3% for the year. The Brazilian government had set early in 2014 a primary surplus goal of 1.9% of GDP for the year which it was forced to reduce several times in the year to 1.3%. Brazil, continues to be a member of the Group of Twenty, leading advanced and emerging economies. It has undergone a remarkable social and economic transformation over the past decade. Income inequality has decreased and the government has adopted a strong policy framework—most notably, fiscal responsibility laws, inflation targeting, and a flexible exchange rate
The Brazilian Central Bank began interest rate hikes in order to protect the Brazilian Real against capital outflows and to reign in inflation, taking its reference rate on the SELIC to 11.75% by December 31, 2014 from 7.25% in 2013 after disappointing growth and inflation above the Central Bank target. Annual inflation rates are measured in Brazil through the Brazilian Extended Consumer Price Index (Índice de Preços ao Consumidor Amplo), or IPCA, as calculated by the IBGE. The IPCA inflation rate was 4.3% in 2009, 5.9% in 2010, 6.5% in 2011, 5.8% in 2012 and 5.9% in 2013, as measured by the IPCA. According to “Boletim focus do Banco Central,” the IPCA closed 2014 at 6.41% after increasing 0.78% in the month of December 2014, driven upwards by increases in transportation, food and beverages, housing and apparel.
S&P downgraded Brazil on March 24, 2014 citing deterioration in government accounts, rising debt levels and weakening growth. The nation currently holds a BBB- rating from S&P. On September 9, 2014, Moody’s changed its outlook on Brazil´s credit rating to negative from stable; while affirming it at Baa2 as a result of reduced economic growth, negative investor sentiment affecting the generation of fixed capital in the country and the fiscal challenges that could arise from the aforementioned. Fitch currently rates Brazil at BBB, with stable outlook. Credit ratings are subject to periodic review and we cannot assure you that the current ratings will not be revised or lowered in the future. The future economic, social and political developments in Brazil, over which we have no control, could impair our business, financial condition or results of operations. See “Risk Factors – Risks Related to Brazil.”
Developments in the Peruvian economy
Our operations in Peru accounted for 8.7% of our consolidated revenues from ordinary activities for the year ended December 31, 2014. Accordingly, the Company is sensitive to macroeconomic conditions in Peru.
According to the Central Bank of Peru, Peruvian GDP grew 5.8% 6.0%, 6.9% and 8.8% in 2013, 2012, 2011 and 2010, respectively. The Peruvian economy expanded 2.4% in 2014, a level well below the 5.8% seen in 2013 and at the slowest rate since 2009. This was on the back of a lower contribution to GDP from investments, particularly in its mining sector, and subdued private consumption. Falling exports were the main culprit for these two effects. Peru´s external accounts and exports were affected by
101
weaker global demand and lower commodity prices. A mild recovery for its mining sector is expected to take place this year. The government of Peru is also being proactive in developing anticyclical measures to boost growth with a series of large infrastructure projects.
Urban unemployment rates have remained at stable and low levels during recent years. According to the INEI, in 2009, 2010, 2011, 2012 and 2013 the unemployment rate was 5.3%, 5.9%, 7.0%, 5.6% and 5.7%, respectively. As of December 31, 2014, the unemployment rate in the Lima metropolitan area stood at 5.6%. At its December 2014 meeting, the Central Bank of Peru kept its reference rate at 3.5% in light of the monetary authority’s inflation expectation of 2.0% for 2015. The CPI index increased from 2.1% in 2010 to 4.7% in 2011 and decreased to 2.8% in 2012 and 2.8% in 2013, as reported by INEI. The central bank estimates accumulated inflation for the twelve months ended December 31, 2014 to have been at 3.2%. Interest rates were later reduced in January 2015 following the Central Bank´s view that inflation was rapidly converging to its target rate of 2.0% for 2015 on the back of below potential growth, anchored inflation expectations, an uneven economic recovery among Peru´s trading partners, a higher volatility in international financial markets and lower oil prices.
The Peruvian government’s commitment to the current economic, fiscal and monetary policies supported economic growth in 2014. S&P upgraded Peru’s credit rating from BBB to BBB+ in August 2013. In October 2013, Fitch upgraded Peru’s credit rating from BBB to BBB+. In July 2014, Moody’s upgraded Peru’s credit rating from Baa2 to A3. Credit ratings are subject to periodic review and we cannot assure you that the current ratings will not be revised or lowered in the future. Peru is currently rated BBB+, A3 and BBB+ by S&P, Moody´s and Fitch, respectively.
According to the World Bank, following a decade of record-high growth, Peru’s economy has remained strong and resilient despite the persistent global uncertainty, thanks to strong fundamentals, supportive terms of trade and sound policy management. Over the 2010-2014 period, the Peruvian economy experienced GDP growth at an average annual rate of 5.8%, and the average annual inflation rate fell to 2.8% in the same period. For 2015 the International Monetary Fund expects real GDP growth to stand at around 5.1%.
On the downside, the economy is most vulnerable in the short term to a global growth shock that permeates through lower commodity prices. A prolonged period of low growth in the U.S. economy could also hamper Peru’s economy over the medium term.
On the upside, upward momentum to growth and inflation could come from large capital inflows and strong credit dynamics in the context of ample global liquidity and continued low growth in advanced economies.
In December 2014, Peru enacted Law No. 4007, reforming the national tax regime. The new law, which came into effect on January 1, 2015, mandates a gradual decrease in the corporate income tax rate and an increase in the tax rates for dividends distributed by Peruvian companies to Chilean shareholders. As a result, the current tax rate applicable to Peruvian corporate income distributed to Chilean shareholders will increase from the current applicable rate of 34.1%, to 34.8% for 2015 and 2016, 35% for 2017 and 2018, and 35.3% for 2019 and onward. As a result, the new Peruvian tax regime is expected to decrease the amount of dividends we receive from our Peruvian subsidiaries.
The future economic, social and political developments in Peru, over which we have no control, could have a material adverse effect on us. See “Item 3. Key Information – D. Risk Factors - Risks Related to Peru.”
Developments in the Colombian economy
Our operations in Colombia accounted for 10.1% of our consolidated revenues from ordinary activities for the year ended December 31, 2014. Accordingly, the Company is sensitive to macroeconomic conditions in Colombia.
Beginning in 2007 Colombia grew rapidly, attracting a record U.S.$10.6 billion in foreign direct investment in 2008 according to the World Bank. However, Colombia’s credit rating was not raised to investment grade by Moody’s and S&P until 2011, when economic growth accelerated and the threat posed by guerrilla groups and organized crime receded. Moody’s upgraded Colombia from Baa3 to Baa2, two notches above junk grade, with a stable outlook on July 28, 2014. Credit ratings are subject to periodic review and we cannot assure you that the current ratings will not be revised or lowered in the future.
The credit upgrade put Colombia’s rating on par with Brazil, Latin America’s largest economy, based on strong growth dynamics supported by government infrastructure programs encompassed in the “4G” plan, while noting moderate fiscal deficits. Security concerns, historically a major issue for Colombia, have not disappeared, but have been waning after several major government wins against domestic guerrilla groups. Colombia has cut its intentional homicide rate by almost half since 2002, when former President Alvaro Uribe took office, according to the World Bank, and increased investor confidence by sustaining moderate fiscal deficits, maintaining inflation stable and increasing economic growth according to Moody’s.
102
In October 2012 the US granted congressional approval to the implementation of the United States-Colombia Trade Promotion Agreement under which over 80% of U.S. exports of consumer and industrial products to Colombia will become duty free immediately, with remaining tariffs phased out over 10 years. The U.S.–Colombia Trade Promotion Agreement (TPA) should have beneficial effects over both the U.S. and Colombian economies. Both economies are highly complementary according to the signatories. Between June 2012 and February 2013, compared to the previous year, two-way trade accounted for U.S.$28.5 billion, an increase of five percent. During that period of time, U.S. exports to Colombia increased 20%, including significant increases in oil and derivatives, aircraft and parts, electric machinery, iron and steel products, cereals, soybean products and pharmaceutical products – accounting for U.S.$11.4 billion. U.S. agricultural exports alone increased by 68% during that period.
We believe Colombia will be able to respond with both fiscal and monetary countercyclical policies if the international outlook further deteriorates. The most severe risks to the Colombian economy continue to be external; the consequences on the real economy of the sovereign debt crisis in Europe coupled with moderate growth in the United States may affect commodity prices and foreign investment inflows to emerging markets. Domestically, the most significant risk is the failure to execute important public works that are part of the set of infrastructure projects the country desperately needs and for which resources are available. See “Risk Factors – Risks Related to Colombia”
GDP is expected to have grown 3.5% in the fourth quarter of 2014, and has grown 4.5% in 2013 and 4.0% in 2012, and retail sales are estimated to have increased 4.7% in 2012, 4.1% in 2013 and 5.2% as of the third quarter of 2014 according to DANE. The retail sector in Colombia is underpenetrated with 51% of the retail sector being informal according to Credit Suisse Research, as of 2013.
Private consumption has recovered since 2009 as illustrated by the real growth rates of 0.9% and 5.0% in 2009 and 2010, respectively, and estimated growth rates of 4.3%, 4.0% and 4.0% for 2011, 2012 and 2013, according to DANE. We believe this increase in real growth rate has been a key driver in retail growth in Colombia.
Unemployment has gradually decreased in the last few years. According to the Central Bank of Colombia, the unemployment rate was 11.3%, 11.1%, 10.8%, 10.4% and 8.4% in 2009, 2010, 2011, 2012 and 2013, respectively. The unemployment rate was 8.7% as of December 31, 2014.
One factor which differentiates the Colombian recovery from its Latin American peers we believe has been the favorable behavior of inflation, which has been well within the inflation target band of 2-4% set up by the Central Bank of Colombia. Headline inflation ended at 3.7% for 2011, 2.4% for 2012 and 1.9% for 2013.
On the fiscal front, 2013 finished with a fiscal deficit of 2.4%, in line with government estimates and beating the end of year result of 2012 which stood at a deficit of 2.5%. This lower deficit is expected to have improved government debt to GDP ratios which stood at 32.3% in 2013. Government estimates currently place the 2014 government deficit at 2.3%.
In December 2014, Colombia’s legislative branch approved a tax reform bill that came into effect on January 1, 2015. According to the new tax bill, Colombian companies will have to pay an annual wealth tax (between 0.2% and 1.5%, depending on the taxable base) and a higher CREE income tax (3% surcharge for the 2015, 2016, 2017 and 2018 tax years). The resulting increase in the tax liability of our Colombian subsidiaries is expected to decrease the amount of income available for dividends.
The future economic, social and political developments in Colombia, over which we have no control, could impair our business, financial condition or results of operations. See “Item 3. Key Information – D Risk Factors. Risks Related to Colombia”
Expansion activities
A significant proportion of our expected revenue growth is based on our expansion activities, including acquisitions and organic growth. We forecast that our revenue for 2015 will be between U.S.$19.3 billion and U.S.$21.3 billion based on the company’s expected revenue growth, due primarily to our expansion activities and growing same store sales. For the same period we expect to invest U.S.$545 million. This entails planned capex of U.S.$230 million for new stores and shopping center investments, U.S.$100 million on IT and related systems, U.S.$15 million on additional nonretail development of the Costanera Center for the hotel and for traffic mitigation works, U.S.$100 million for maintenance and U.S.$100 for remodeling of existing stores.
Impact of acquisitions
Recent acquisitions include:
Acquisition of Bretas Stores in Brazil. On October 29, 2010, pursuant to a stock purchase agreement executed on October 15, 2010, through our subsidiary GBarbosa Comercial Ltda. (“GBarbosa”), we acquired 100% of the outstanding shares of Fag
103
Participaçoes Ltda. and Bretas, Filhos e Cia Ltda. (the “Sellers”), which together owned and operated the Brazilian supermarket chain Bretas, which operates 81 supermarkets, 2 distribution centers and 12 gas stations in Central and northern Brazil as of December 31, 2012. The aggregate purchase price of the acquisition was R$1.17 billion (approximately U.S.$705 million or Ch$336,630 million), payable as follows: R$820 million on October 29, 2010 (the closing date of the transaction) and R$100 million on December 31, 2011. The balance of R$250 million will be paid on December 31, 2014. Pursuant to the stock purchase agreement, the Sellers committed to make their best efforts to maintain, for a period of 20 years from the closing date of the transaction, the leases of premises to be opened during the end of 2010 and beginning of 2011 as well as the leases of properties that were leased by the Sellers at the time of the transaction. Under the terms of the acquisition transaction Cencosud S.A. serves as guarantor of GBarbosa in the acquisition transaction. The acquisition was financed with internal cash resources and bank debt totaling U.S.$290 million.
Acquisition of Cardoso Stores in Brazil. In October 2011, we continued expanding into the Brazilian market through the acquisition of Cardoso. Cardoso is a three-store supermarket chain in the state of Bahia, with net sales of approximately R$60 million (U.S.$35.9 million) in 2011. Cencosud negotiated the payment of the purchase price of R$18 million (approximately U.S.$11.3 million or Ch$5,429 million) in three installments, 60% on the closing of the transaction, 20% on the 6-month anniversary of the closing date and the remaining 20% on the first year anniversary of the closing date. We have converted the acquired stores to the GBarbosa format and are now operating those stores under this brand. We consolidated the results of Cardoso into our results of operation since the date of acquisition.
Acquisition of Johnson Stores in Chile. In December 2011, we entered into an agreement with Johnson’s Inversiones S.A. (“Johnson Inversiones”) and Inversiones Bujorico Limitada (“Bujorico” and together with Johnson Inversiones, the “Johnson Entities”), who together owned Johnson. Pursuant to this agreement we acquired an 85.58% interest in Johnson for an aggregate purchase price of Ch$32,606 million. In December 2013 Cencosud executed its option to purchase the remaining shares that were not held by it and paid UF 315,935.76 in connection therewith.
Johnson is a department store with 39 stores throughout Chile under the Johnson brand and an additional 13 stores under the FES brand, with a total of 117,569 square meters of selling space. In 2011, Johnson registered sales of Ch$118,447 million from its retail operations. All FES stores were closed during the 2013 period.
During 2012 all former clients of Johnson’s consumer financing arm were migrated to our Tarjeta Cencosud format. With the acquisition of Johnson we are now able to target the low- and middle-income market segments in Chile.
Acquisition of Prezunic in Brazil. On January 2, 2012, pursuant to a stock purchase agreement executed on November 16, 2011, Cencosud Brasil S.A. (“Cencosud Brasil”) acquired from the Dias Da Cunha family 100% of the capital stock of Prezunic. We estimate that Prezunic is the third-largest supermarket chain in Rio de Janeiro, with 31 stores and net sales of approximately R$2.2 billion in 2011.
The aggregate purchase price of the operation was R$875 million (or approximately Ch$242,690 million), payable as follows: R$580 million on the closing date of the transaction (January 2, 2012), from which R$190 million were deducted as working capital adjustments. The balance will be paid as follows: R$80 million, R$85 million, R$80 million and R$50 million, on the first, second, third and fourth anniversary of the closing date, respectively. Pursuant to the stock purchase agreement, Cencosud Brasil, considered a national supermarket operator, therefore able to get better terms from suppliers, was also granted a preferential right from third-party landowners to acquire or lease two supermarket properties that were not owned by Prezunic at the time of the transaction, but were instead leased. Under the terms of this agreement, Cencosud S.A. serves as guarantor of Cencosud Brasil.
Through this strategic acquisition we entered the Brazilian state of Rio de Janeiro. The acquisition of Prezunic consolidated our position as Brazil’s fourth-largest supermarket operator in terms of revenues, as measured by ABRAS. We consolidated the results of Prezunic into our results of operations since the date of acquisition.
Acquisition of Carrefour Colombia. On November 30, 2012, Cencosud S.A. completed the acquisition of Carrefour supermarket operations in Colombia, for a total purchase price equal to €2 billion. The acquired companies operate supermarkets under the “Carrefour” and “Maxi” brand names in Colombia, including 72 hypermarket stores, 16 convenience stores, and four cash and carry stores and gas stations. All stores were migrated to Jumbo and Metro brands during the third quarter of 2013 after dropping the Carrefour brand on May 31,,2013. See “Item 4. Information on the Company—A. History and Development of the Company—History”
In order to finance the purchase of the acquisition of Carrefour’s operations in Colombia, on October 17, 2012, the Company entered into the Bridge Loan Agreement with a syndicate of banks in the amount of U.S.$2,500 million. As of December 31, 2013 this loan had been repaid. See “—B. Liquidity and Capital Resources—Indebtedness, and B. Liquidity and Capital Resources—Recent Acquisitions” below.
104
No additional acquisitions were made in the 2013 or 2014 fiscal periods.
Impact of organic expansion
During the year ended December 31, 2014, (a) in Chile, we opened 14 new stores in our supermarket division adding 21,637 square meters of selling space, we added one new store in our home improvement division with an additional 5,648 square meters of selling space, and we added 2 stores in our department stores division with an additional 3,695 square meters of selling space; (b) in Argentina, we opened 2 home improvement stores that added selling space for 10,297 square meters; (c) in Brazil, we had a net closing of 2 stores but expanded selling space by 5,448 square meters; (d) in Peru, we had no net openings in our supermarkets division but expanded selling space by 2,340 square meters and we opened 3 new department stores that added selling space of 13,025 square meters; (e) in Colombia, we opened one Easy store that added selling space of 6,587. In addition, Maintenance expenditures for existing stores are estimated to have been at U.S.$75 million in 2014. In our shopping centers division we had investments that added GLA in excess of 20,635 square meters in Chile, 40,105 square meters in Argentina and 12,803 square meters in Peru, totaling 73,543 square meters.
During the year ended December 31, 2013, we opened 2 supermarkets in Argentina, 10 in Chile, 1 in Peru, 3 in Colombia and 17 in Brazil. We opened 6 department stores in Peru and 5 home improvement stores in Colombia, four of these stores were cash & carry stores that have been refurbished and converted into home improvement stores following the Carrefour acquisition, while the same division opened one store in Argentina and one in Chile. During the year ended December 31, 2013, we also opened 1 shopping center in Peru.
During the year ended December 31, 2012, we opened 20 supermarkets in Argentina, 25 in Chile, 12 in Peru and 22 in Brazil. We opened 4 department stores in Chile and 2 shopping centers in Chile and 1 in Peru. During the year ended December 31, 2012, we also opened 2 home improvement stores in Chile.
As a general matter, we believe that a period of several years is frequently required after opening or inauguration for a store or shopping center to mature and achieve its full potential to generate sales. As a result, the increasing maturation of a newly opened store may need to be taken into account when comparing period-to-period store sales. The following tables present a breakdown of our store and shopping center expansion activities for the periods indicated:
| | | | | | | | | | | | | | | | | | | | |
| | | 2014 | |
| | | Total 2013 | | | Openings | | | Closings | | | Acquisitions | | | Total 2014 | |
Chile | | | | | | | | | | | | | | | | | | | | |
Supermarkets | | | 224 | | | | 14 | | | | 1 | | | | — | | | | 238 | |
Home Improvement Stores | | | 32 | | | | 1 | | | | — | | | | — | | | | 33 | |
Department Stores | | | 77 | | | | 2 | | | | — | | | | — | | | | 79 | |
Shopping Centers | | | 25 | | | | — | | | | — | | | | — | | | | 25 | |
Total Chile | | | 358 | | | | 17 | | | | 1 | | | | — | | | | 375 | |
Argentina | | | | | | | | | | | | | | | — | | | | | |
Supermarkets | | | 290 | | | | 1 | | | | 1 | | | | — | | | | 290 | |
Home Improvement Stores | | | 48 | | | | 2 | | | | — | | | | — | | | | 50 | |
Shopping Centers | | | 18 | | | | 4 | | | | — | | | | — | | | | 22 | |
Total Argentina | | | 356 | | | | 9 | | | | 1 | | | | — | | | | 362 | |
Brazil | | | | | | | | | | | | | | | — | | | | | |
Supermarkets | | | 221 | | | | 3 | | | | 5 | | | | — | | | | 221 | |
Total Brazil | | | 221 | | | | 3 | | | | 5 | | | | — | | | | 221 | |
Peru | | | | | | | | | | | | | | | — | | | | | |
Supermarkets | | | 87 | | | | 1 | | | | 1 | | | | — | | | | 87 | |
Department Stores | | | 6 | | | | — | | | | — | | | | — | | | | 9 | |
Shopping Centers | | | 3 | | | | 1 | | | | — | | | | — | | | | 4 | |
Total Peru | | | 96 | | | | 2 | | | | 1 | | | | — | | | | 100 | |
Colombia | | | | | | | | | | | | | | | — | | | | | |
Home Improvement Stores | | | 9 | | | | 1 | | | | — | | | | — | | | | 10 | |
Supermarkets | | | 100 | | | | 2 | | | | 2 | | | | — | | | | 100 | |
Shopping Centers | | | 2 | | | | — | | | | — | | | | — | | | | 2 | |
Total Colombia | | | 111 | | | | 1 | | | | 2 | | | | — | | | | 112 | |
Total | | | 1,142 | | | | 13 | | | | 8 | | | | — | | | | 1,168 | |
| | | | | | | | | | | | | | | | | | | | |
| | | 2013 | |
| | | Total 2012 | | | Openings | | | Closings | | | Acquisitions | | | Total 2013 | |
Chile | | | | | | | | | | | | | | | | | | | | |
Supermarkets | | | 214 | | | | 9 | | | | 1 | | | | 0 | | | | 222 | |
Home Improvement | | | 31 | | | | 1 | | | | 0 | | | | 0 | | | | 32 | |
Department Stores | | | 77 | | | | 1 | | | | 2 | | | | 0 | | | | 78 | |
105
| | | | | | | | | | | | | | | | | | | | |
| | | 2014 | |
| | | Total 2013 | | | Openings | | | Closings | | | Acquisitions | | | Total 2014 | |
Shopping Centers | | | 23 | | | | 0 | | | | 0 | | | | 0 | | | | 25 | |
Total Chile | | | 345 | | | | 11 | | | | 3 | | | | 0 | | | | 357 | |
Argentina | | | | | | | | | | | | | | | | | | | | |
Supermarkets | | | 288 | | | | 5 | | | | 3 | | | | 0 | | | | 290 | |
Home Improvement | | | 47 | | | | 1 | | | | 0 | | | | 0 | | | | 48 | |
Shopping Centers | | | 18 | | | | 0 | | | | 0 | | | | 0 | | | | 18 | |
Total Argentina | | | 353 | | | | 6 | | | | 3 | | | | 0 | | | | 356 | |
Brazil | | | | | | | | | | | | | | | | | | | | |
Supermarkets | | | 204 | | | | 11 | | | | 0 | | | | 0 | | | | 221 | |
Total Brazil | | | 204 | | | | 11 | | | | 0 | | | | 0 | | | | 221 | |
Peru | | | | | | | | | | | | | | | | | | | | |
Supermarkets | | | 86 | | | | 1 | | | | 0 | | | | 0 | | | | 87 | |
Department Stores | | | 0 | | | | | | | | | | | | | | | | 6 | |
Shopping Centers | | | 3 | | | | 1 | | | | 0 | | | | 0 | | | | 2 | |
Total Peru | | | 89 | | | | 2 | | | | 0 | | | | 0 | | | | 95 | |
Colombia | | | | | | | | | | | | | | | | | | | | |
Home Improvement | | | 4 | | | | 5 | | | | 0 | | | | 0 | | | | 9 | |
Supermarkets | | | 96 | | | | 4 | | | | 0 | | | | 0 | | | | 100 | |
Shopping Centers | | | 0 | | | | 9 | | | | 0 | | | | 1 | | | | 2 | |
Total Colombia | | | 100 | | | | 9 | | | | 0 | | | | 1 | | | | 111 | |
Total | | | 1091 | | | | 39 | | | | 6 | | | | 1 | | | | 1142 | |
| | | | | | | | | | | | | | | | | | | | |
| | | | | | | | | | | | | | | | | | | | |
| | | 2012 | |
| | | Total 2011 | | | Openings | | | Closings | | | Acquisitions | | | Total 2012 | |
Chile | | | | | | | | | | | | | | | | | | | | |
Supermarkets | | | 190 | | | | 28 | | | | 3 | | | | 0 | | | | 214 | |
Home Improvement | | | 29 | | | | 2 | | | | 0 | | | | 0 | | | | 31 | |
Department Stores | | | 35 | | | | 4 | | | | 0 | | | | 39 | | | | 78 | |
Shopping Centers | | | 9 | | | | 2 | | | | 0 | | | | 0 | | | | 23 | |
Total Chile | | | 262 | | | | 36 | | | | 3 | | | | 39 | | | | 349 | |
Argentina | | | | | | | | | | | | | | | | | | | | |
Supermarkets | | | 269 | | | | 21 | | | | 2 | | | | 0 | | | | 288 | |
Home Improvement | | | 48 | | | | 0 | | | | 1 | | | | 0 | | | | 47 | |
Shopping Centers | | | 14 | | | | 1 | | | | 0 | | | | 0 | | | | 18 | |
Total Argentina | | | 331 | | | | 22 | | | | 3 | | | | 0 | | | | 353 | |
Brazil | | | | | | | | | | | | | | | | | | | | |
Supermarkets | | | 152 | | | | 21 | | | | 0 | | | | 31 | | | | 204 | |
Total Brazil | | | 152 | | | | 21 | | | | 0 | | | | 31 | | | | 204 | |
Peru | | | | | | | | | | | | | | | | | | | | |
Supermarkets | | | 74 | | | | 13 | | | | 1 | | | | 0 | | | | 86 | |
Shopping Centers | | | 2 | | | | 1 | | | | 0 | | | | 0 | | | | 2 | |
Total Peru | | | 76 | | | | 14 | | | | 1 | | | | 0 | | | | 88 | |
Colombia | | | | | | | | | | | | | | | | | | | | |
Home Improvement | | | 4 | | | | 0 | | | | 0 | | | | 0 | | | | 4 | |
Supermarkets | | | 0 | | | | 0 | | | | 4 | | | | 101 | | | | 96 | |
Total Colombia | | | 4 | | | | 0 | | | | 4 | | | | 101 | | | | 100 | |
Total | | | 826 | | | | 93 | | | | 11 | | | | 171 | | | | 826 | |
Impact of exchange rate fluctuations
The Chilean peso, as well as the currencies of the countries in which we operate, has been subject to large volatility in the past and could be subject to significant fluctuations in the future. During 2014 and 2013, the value of the Chilean peso relative to the U.S. dollar appreciated approximately 15.7% and 8.2%, respectively; the Argentine Peso depreciated approximately 31.2% and 32.6% against the U.S. dollar, respectively; the Brazilian Real depreciated approximately 13.4% and 14.6% against the U.S. dollar, respectively; the Peruvian Sol depreciated approximately 6.7% and depreciated 9.6% against the U.S. dollar, respectively, and the Colombian peso depreciated 24.2% and 9.0% against the U.S. dollar, respectively. The observed exchange rate for the Chilean peso on January 2, 2015 was Ch$606.75 per U.S.$1.00. See “Item 3. Key Information—A. Selected Financial Data—Exchange Rates” and “Item 10. Additional Information—D. Exchange Controls.”
Our sales in each of our countries of operations are priced in local currencies. To the extent that the Chilean peso depreciates against the U.S. dollar or the currencies of any of our countries of operation, our revenues may be adversely affected when expressed in Chilean pesos. The effect of exchange rate fluctuations is partially offset by the fact that certain of our operating expenses are denominated in Chilean pesos (such as our corporate overhead) and a significant part of our indebtedness is denominated in Chilean pesos. As of December 31, 2014, 11% of our interest-bearing debt was denominated in U.S. dollars, after taking into account cross-currency swaps, and the remainder of our interest-bearing debt was primarily UF- or Chilean peso-denominated.
106
Impact of the 2010 earthquake and tsunami
On February 27, 2010, an 8.8 magnitude earthquake struck the central and central south regions of Chile. The quake epicenter was located 200 miles southwest of Santiago and 70 miles north of Concepción, Chile’s second-largest city. The regions of Bío Bío and Maule were the most severely affected regions especially in the coastal area, which, shortly after the earthquake, was hit by a tsunami that significantly damaged cities and port facilities. The regions of Valparaíso and the Santiago Metropolitan area were also severely affected. At least 1,500,000 homes were damaged and more than 500 people were killed. According to an initial assessment by the government of Chile, the repair of the resulting damage, excluding damage to port facilities, is likely to take between three and four years and the preliminary assessments of reconstruction costs indicate that they could total approximately U.S.$30 billion.
The February 2010 earthquake and tsunami’s primary impact on us was Ch$32,919 million relating primarily to damage to infrastructure, inventory destruction and business interruptions. Our insurance policies cover losses arising from the earthquake and tsunami, amounting to Ch$21,893 million. The primary financial impact of the earthquake and tsunami on our results of operations was Ch$4,865 million. The difference between the impact and the claim is related to the depreciation of certain assets at the time of the earthquake, resulting in a claim that is higher than the book value of such assets.
Conversely, following the February 2010 earthquake, during the second and third quarter of 2010 we experienced a 29.4% increase in revenues in our home improvement stores segment, as compared to second and third quarter of 2009.
As a result of the February 2010 earthquake and tsunami, the Chilean government raised the corporate income tax rate in order to pay for reconstruction following the earthquake and tsunami. Such legislation increased the general corporate tax rate from its historic rate of 17.0% to 20.0% for the income accrued in the 2011 commercial year (año comercial),which is declared and paid in the 2012 tax year (año tributario). On September 27, 2012, Law No. 20,630 introduced new amendments to existing tax legislation. Among the amendments introduced, the corporate income tax was permanently maintained at 20% effective as of the 2013 tax year. On September 29, 2014, Chile enacted Law No. 20,780. The Tax Reform Act introduced changes to the corporate tax rate, mandating a gradual increase of the rate from 20% to 25% or 27% in certain cases, the rules regarding minimum capitalization, and the taxation of Chilean investments abroad (the controlled-foreign-corporation rules), among others. The new rules are set to come into effect gradually, with the implementation process having commenced on October 1, 2014 and set to be completed by January 1, 2018.
According to the Chilean administration, rebuilding efforts after the earthquake were 97% concluded by May 2013.
Impact of the April 24, 2013 Supreme Court ruling on litigation on credit card fees.
On April 24, 2013, the Supreme Court of Chile ruled on the class action suit filed by SERNAC against Cencosud Administradora de Tarjetas S.A. (“CAT”). The court ruled for the plaintiff and at this junction no further appeals are available. In its ruling, the court determined that CAT included certain clauses in its 2006 contracts that were abusive to consumers. Said clauses allowed CAT to charge an incremental maintenance fee of Ch$530 per month to credit cardholders with a card usage under Ch$50 thousand per month, without written consent from cardholders as required by theLey de Proteccion al Consumidor. In the ruling the court ordered CAT to pay a fine of approximately Ch$ 2 million and to reimburse certain cardholders for the excess maintenance fees charged since 2006 plus adjustments for inflation and interest. We have provisioned Ch$ 20,000 million for this ruling in our 2012 financial statements. As of December 31, 2014, Ch$1,887 million were still provisioned in terms of principal reimbursements tied to this ruling and Ch$759 million tied to interest and inflation.
Impact of the 2014 earthquake and tsunami
On April 1, 2014 an earthquake with a magnitude of 8.2 on the Richter scale hit the north of Chile. The epicenter of the earthquake was approximately 95 kilometers (59 mi) northwest of Iquique and 914 miles north of Santiago. The regions of Parinacota and Tarapacá were the most affect by the quake. The quake and the following tsunami warning resulted in the evacuation of approximately one million people along the Chilean coastline, according to the Chilean Minister of Interior. Both regions were declared disaster areas with the military being sent over to ensure order.
Seasonality
Historically, we have experienced distinct seasonal sales patterns at our supermarkets due to heightened consumer activity throughout the Christmas and New Year holiday season, as well as during the beginning of each school year in March. During these periods, we promote the sale of non-food items particularly by discounting imported goods, such as toys throughout the Christmas holiday season, and school supplies during the back-to-school period. Conversely, we usually experience a decrease in sales during the summer vacation months of January and February. Our sales for the first and fourth quarters of 2014 represented 23.4% and 27.5% respectively, of our total sales for such year.
107
We do not experience significant seasonality in the home improvement sector. Home improvement store sales for the first and fourth quarters of 2014 represented 23.8% and 29.0% of our total home improvement sales.
Our department stores have also experienced historically distinct seasonal sales patterns due to heightened consumer activity throughout the Christmas and New Year holiday season. As a result, the strongest quarter in terms of sales is the fourth quarter, which represented 32.3% of total sales for the year 2014, while the first quarter represented 21.6% of total annual sales, respectively.
Our shopping center revenues generally increase during the Christmas and New Year holiday season, reflecting the seasonal sales peak for our shopping centers. For example, during the fourth quarter of 2014 our Chile shopping center revenues represented 29.5% of total Chile shopping center revenues for the year. We generally charge our shopping center tenants double rent for the month of December which is payable in February of the following year when they will have realized collections in respect of most holiday season sales.
Joint Venture
On June 20, 2014, the Company, together with its subsidiaries Cencosud Retail S.A. and Easy S.A., entered into the Joint Venture Framework Agreement with BNS and its wholly owned subsidiary Scotiabank Chile, to further develop, on a joint basis, the retail finance business in Chile. As part of the agreement, Scotiabank Chile will acquire a fifty-one percent (51%) controlling interest of each of the Subject Companies, with Cencosud retaining the remaining forty-nine percent (49%) non-controlling interest of each of the Subject Companies. On April 13, 2015, the Superintendency of Banks and Financial Institutions of Chile announced its approval of the joint venture between the Company and ScotiaBank.
Under IFRS 5, “Disposal of subsidiaries, business and non-current assets”, the Subject Companies are considered as from June 20, 2014, as “Assets held for sale” as a result of Cencosud’s commitment to sell a controlling interest to an unrelated party under the Joint Venture Framework Agreement and the occurrence of such transaction is deemed highly probable by management. IFRS 5 requires that (a) assets that meet the criteria to be classified as held for sale be measured at the lower of carrying amount andfair value lesscosts to sell, and depreciation on such assets shall cease; and (b) assets that meet the criteria to be classified as held for sale be presented separately in the statement of financial position and the results of discontinued operations, net of tax, and be presented separately in the statement of comprehensive income. Net cash flows attributable to the operating, investing and financing activities of discontinued operations are required to be disclosed either in the notes to the financial statements or in the financial statements themselves. Accordingly, our consolidated financial information for the three years ended December 31, 2013, 2012 and 2011 has been revised to present the result of operations of the financial services segment in Chile as discontinued operations.
Potential Initial Public Offering of the Shopping Centers Division
On January 30, 2015, the board of directors of the Company resolved to evaluate a potential initial public offering of the Company’s shopping centers division, focusing on Chile, Peru and Colombia, with the Company maintaining a majority position in the resulting entity. This evaluation process is in the preliminary stages, and any transaction ultimately undertaken with respect thereto will be subject to approval by the board of directors of the Company as well as the procurement of any other regulatory approvals required under applicable law.
Cost of Sales
Cost of sales reflects the costs of goods sold. Gross profit, defined as revenues from ordinary activities less cost of sales, is lower in our supermarkets segment due to higher turnover of our supermarket inventory, which includes primarily basic and staple goods. In our other segments, namely department stores and home improvement stores, we do not experience high inventory turnover and therefore have higher gross profits.
Loan Provisioning
Provision models to cover portfolio risk in line with Basel II standards: the Company has different provisions models that adhere to local regulations in each country as well as Basel II standards in order to most adequately reflect cardholder portfolio risk. External variables that affect payment behavior are also included in statistical models for estimating provisions. The Company is making progress in each country on implementing anti-cyclical provisions based on industry best practices, having started with Chile and Peru and, in 2012, Argentina. It also uses back testing to periodically monitor the sufficiency of the provisions it establishes.
108
Critical Accounting Policies and Estimates
A summary of our significant accounting policies is included in Note 2 to our Audited Consolidated Financial Statements included elsewhere in this annual report. We believe that the consistent application of these policies enables us to provide readers of our consolidated financial statements with more useful and reliable information about our operating results and financial condition.
The following policies are the accounting policies that we believe to be the most important in the portrayal of our financial condition and results of operations and require management’s most difficult, subjective or complex judgments.
Estimate of impairment of assets with indefinite useful lives
We assess annually, or when there is a triggering event, whether goodwill has experienced any impairment, according to the accounting policy described in Note 2.11 of the annual financial statements. The recoverable balances of the cash generating units have been determined from the base of their value in use. The methodology of discounting cash flows at a real pre-tax discount rate calculated for each country is applied. The projection of cash flows is carried out by each country and by business segment. Using the functional currency of each country and the projection considered a horizon of 5 years perpetuity, unless they justify a different horizon. The projections are the historical information of the last year and the main macroeconomic variables that affect the markets. In addition projections considered a moderate organic growth and recurring investments needed to keep generating capacity of flow of each segment.
The assets measured correspond mainly to trademarks and goodwill arising from past business combinations. The measurements are performed for each operating segment representing the cash generating unit determined to carry out the annual impairment test. The projected cash flows in each segment are allocated initially to identifiable tangible and intangible assets and the exceeding portion is allocated to goodwill. The valuation review of the trademarks incorporates among other factors the market analysis, financial projections and the determination of the role that brand has in the generation of sales. For more information please refer to note 4.1 of our audited consolidated financial statements.
Impairment of accounts receivable
We assesses the impairment of accounts receivable when there is objective evidence that we will not be able collect all the amounts according to the original terms of the account receivable. For further information on our accounts receivable, please see Note 8 to our Audited Consolidated Financial Statements.
Investment property
a) Fair value measurement for lands
The fair value for land was determined by external and independent property valuers, having an appropriate recognized professional qualification and recent experience in the location and category of the property being valued.
The methodology used in determining the fair value of lands was the market approach, which consists of determining the fair value based on recent transactions occurred in the market.
b) Fair value measurements for investment properties other than land.
The Company’s finance department is responsible for determining fair value measurements included in the financial statements
The Company’s finance department includes a valuations team that prepares a valuation for each investment property every quarter. The valuation team reports directly to the Chief Financial Officer (CFO) and the Audit Committee (AC). Discussions of valuation processes, key inputs and results are held between the CFO, AC and the valuation team at least once every quarter, in line with the Company’s quarterly reporting dates.
The fair value measurement for this type of investment has been categorized as a level III fair value based on the inputs used in the valuation technique. Investment properties are valued on a highest and best use basis. Changes in Level 3 fair values are analyzed at each reporting date during the quarterly valuation discussions between the CFO, AC and the valuation team. As part of this discussion, the team presents a report that explains the reasons for the fair value movements.
109
For all of the Company’s investment properties, the current use is considered to be the highest and best use.
The Company’s policy is to recognize transfers into and transfers out of fair value hierarchy levels as of the date of the event or change in circumstances that caused the transfer. There were no transfers in or out of Level 3 fair value measurements for investment properties during the period, nor transfers between Level 1 and Level 2 of the fair value hierarchy.
For investment property the methodology of the discounted future cash flows uses a country-specific WACC post- tax rate, measured in real terms and differentiated by country. The rates used at December 31, 2014 were 7.09% in Chile, 22.53% in Argentina, 7.8% in Peru and 7.7% in Colombia (at December 31, 2013: 7.82% in Chile, 20.08% in Argentina, 8.38% in Peru and 8.24% in Colombia). To this effect, a calculation is performed to obtain the net revenues that correspond to the lease income minus the direct costs and operating expenses. Additionally, the projected cash flows used the historical information of the recent years and the projected macroeconomic variables that will affect each country. As a result of the project of tax reform in Chile enacted in the second half of the year 2014, the company conducted an assessment of changes in the legislation and included such in determining the fair value of the investment properties from June 30, 2014. For more information related to cash flows and main variables used please refer to note 4.3 of our audited consolidated financial statements.
Fair value of derivatives
The fair value of financial instruments that are not traded in an active market as it is the case of the over-the-counter derivatives is determined by using valuation techniques. The company uses its judgement to select a variety of methods and makes assumptions that are mainly based on market conditions existing at the end of each reporting period. The company has used discounted cash flows analysis for various foreign exchange contracts and interest rate contracts that are not traded in active markets. For more information please refer to note 4.4 of our audited consolidated financial statements.
Operating Segments
For purposes of our Audited Consolidated Financial Statements and our Unaudited Interim Consolidated Financial Statements, IFRS 8 “Operating Segments” requires an entity to report financial and descriptive information about its reportable segments, which are operating segments or aggregations of operating segments that meet specified criteria. Operating segments are components of an entity about which separate financial information is available that is evaluated regularly by the chief operating officer in deciding how to allocate resources and in assessing performance.
For management purposes, we are organized into six operating segments:
| | • | | “supermarkets,” which includes the results of our: Jumbo, Santa Isabel, Disco, Vea, Wong, Metro, GBarbosa, Perini, Bretas and Prezunic supermarkets and hypermarkets in Chile, Argentina, Brazil, Colombia and Peru, our Eletro-show stores, GBarbosa pharmacies in Brazil and Colombia and gas stations in Brazil and Colombia; |
| | • | | “shopping centers,” which includes the results of our shopping centers in Chile, Argentina, Colombia and Peru; |
| | • | | “home improvement stores,” which includes the results of our Easy and Blaisten home improvement stores in Chile, Argentina and Colombia; |
| | • | | “department stores,” which includes the results of our Paris and Johnson department stores in Chile and Paris in Peru; |
| | • | | “financial services,” which primarily includes the results of our credit card businesses and consumer loans, as well as our limited insurance brokerage operations in Chile, Argentina, and Peru and through joint ventures in Brazil with Banco Bradesco and Colpatria in Colombia; and |
| | • | | “other,” which includes the results of our entertainment centers, loyalty programs and our corporate back-office operations. |
We base operations and resource allocation decisions on these six segments. The operating segments are disclosed in a coherent way consistent with the presentation of internal reports we use in our internal controls and disclosure processes. These operating segments derive their revenues primarily from the sale of products and rendering of services to retail consumers.
110
Year Ended December 31, 2014 Compared to Year Ended December 31, 2013
The following table presents, for the periods indicated, certain items of our statement of income:
| | | | | | | | | | | | |
| | | Year Ended December 31, | | | | |
| | | 2014 | | | 2013 | | | % Change | |
| | | (in millions of Ch$) | | | | |
Revenues from ordinary activities: | | | | | | | | | | | | |
Supermarkets | | | 8,159,237 | | | | 7,682,993 | | | | 6.2 | % |
Home improvement stores | | | 1,225,616 | | | | 1,176,890 | | | | 4.1 | % |
Department stores | | | 991,442 | | | | 970,360 | | | | 2.2 | % |
Shopping centers | | | 214,850 | | | | 205,332 | | | | 4.6 | % |
Financial services | | | 117,679 | | | | 81,651 | | | | 44.1 | % |
Other | | | 2,205 | | | | 16,932 | | | | (87.0 | )% |
Total revenues from ordinary activities | | | 10,711,029 | | | | 10,134,158 | | | | 5.7 | % |
Cost of sales: | | | | | | | | | | | | |
Supermarkets | | | (6,204,110 | ) | | | (5,782,590 | ) | | | 7.3 | % |
Home improvement stores | | | (800,342 | ) | | | (787,402 | ) | | | 1.6 | % |
Department stores | | | (741,279 | ) | | | (701,530 | ) | | | 5.7 | % |
Shopping centers | | | (28,029 | ) | | | (23,341 | ) | | | 20.1 | % |
Financial services | | | (39,046 | ) | | | (25,938 | ) | | | 50.5 | % |
Other | | | (1,967 | ) | | | (3,451 | ) | | | (43.0 | )% |
Total cost of sales | | | (7,814,773 | ) | | | (7,324,252 | ) | | | 6.7 | % |
Gross profit: | | | | | | | | | | | | |
Supermarkets | | | 1,955,127 | | | | 1,900,404 | | | | 2.9 | % |
Home improvement stores | | | 425,275 | | | | 389,487 | | | | 9.2 | % |
Department stores | | | 250,163 | | | | 268,830 | | | | (6.9 | )% |
Shopping centers | | | 186,821 | | | | 181,991 | | | | 2.7 | % |
Financial services | | | 78,632 | | | | 55,713 | | | | 41.1 | % |
Other | | | 238 | | | | 13,481 | | | | (98.2 | )% |
Total gross profit | | | 2,896,256 | | | | 2,809,907 | | | | 3.1 | % |
Administrative expenses, distribution costs and other expenses | | | (2,495,436 | ) | | | (2,357,582 | ) | | | 5.8 | % |
Other revenues by function | | | 114,438 | | | | 108,291 | | | | 5.7 | % |
Participation in earnings of associates | | | 6,208 | | | | 10,289 | | | | (39.7 | )% |
Financial income | | | 6,709 | | | | 5,999 | | | | 11.8 | % |
Financial expenses | | | (222,165 | ) | | | (223,856 | ) | | | (0.8 | )% |
Other earnings | | | 34,624 | | | | 26,366 | | | | 31.3 | % |
Exchange differences | | | (23,643 | ) | | | (25,054 | ) | | | (5.6 | )% |
Losses from indexation | | | (39,576 | ) | | | (18,885 | ) | | | 109.6 | % |
Income (loss) before taxes | | | 277,416 | | | | 335,476 | | | | (17.3 | )% |
Income tax charge | | | (125,932 | ) | | | (94,068 | ) | | | 33.9 | % |
Profit from continuing operations | | | 151,485 | | | | 241,408 | | | | (37.2 | )% |
Profit from discontinued operations | | | 12,662 | | | | 8,357 | | | | 51.5 | % |
Net income | | | 164,146 | | | | 249,765 | | | | (34.3 | )% |
Profit attributable to non-controlling shareholders | | | (748 | ) | | | (165 | ) | | | 353.3 | % |
Profit attributable to controlling shareholders | | | 164,894 | | | | 249,930 | | | | (34.0 | )% |
Revenues from ordinary activities
Our consolidated revenues from ordinary activities increased Ch$576,871 million, or 5.7%, to Ch$10,711,029 million for the year ended December 31, 2014, from Ch$10,134,158 million for the same period in 2013, as a result of positive contributions from all business segments, with the largest increase in financial services as a result of the growth of our loan portfolio, followed by supermarkets, home improvement, shopping centers and department stores.
Supermarkets
Our consolidated revenue from ordinary activities from our supermarkets increased Ch$476,244 million, or 6.2%, to Ch$8,159,237 million for the year ended December 31, 2014, from Ch$7,682,993 million for the same period in 2013, primarily due to (i) a revenue increase of Ch$150,415 million, or 7.5%, in our Brazilian operations, resulting from a 2.5% depreciation of the CLP against the BRL and positive same stores sales, (ii) an increase of Ch$127,502 million in our Chilean supermarket operations due to a 4.3% increase in same store sales related to the improved performance of our Santa Isabel format and the steady performance of our Jumbo operations in the country, as well as the addition of 14 new stores compared to the same period in 2013, (iii) a 4.6% increase in same stores sales in Peru which increased revenues by Ch$91,207 million, or 12.2%, in that region, and (iv) an increase of Ch$80,467 million in revenues from our Colombian operations due to positive same store sales in the second half of the year and increases in perishable products. Our Argentine operations posted a revenue increase of 1.5%, or Ch$26,653 million on the back of positive same store sales of 29.0% in local currency, which were partially offset by an 11.8% depreciation in the AR$ against the CLP in the period.
111
Home improvement stores
Our consolidated revenue from ordinary activities from our home improvement stores increased Ch$48,726 million, or 4.1%, to Ch$1,225,616 million for the twelve months ended December 31, 2014, from Ch$1,176,890 million for the same period in 2013, primarily due to (i) an increase in revenues from our Colombian operations of Ch$20,994 million, or 45%, due to an 8.7% increase in selling space as a result of the opening of 1 store and due to CLP variations against the COP during the period, (ii) an increase in revenues of Ch$16,817 million, or 4% in Chile resulting from a 2.7% increase in same store sales and the addition of one new store (iii) an increase of Ch$10,915 million, or 2%, in our Argentine operations as a result of a 27.5% increase in same store sales which was partially offset by the 11.8% depreciation in the ARS against the Chilean peso in the period.
Department stores
Our consolidated revenue from ordinary activities from our department stores increased Ch$21,082 million, or 2.2%, to Ch$991,442 million for the twelve months ended December 31, 2014, from Ch$970,360 million for the same period in 2013, primarily due to an increase in the number of our Peruvian stores, jumping from six stores to nine, increasing the selling space by 40.4%, and resulted in a revenue increase of Ch$24,656 million, or 169% which was offset by a decline in revenues from our Chilean department store operations of Ch$3,573 million, or 0.3%, as a result of a 0.5% decrease in same store sales for 2014 compared to 2013.
Shopping centers
Our consolidated revenue from ordinary activities from our shopping centers increased Ch$9,518 million, or 4.6%, to Ch$214,850 million for the twelve months ended December 31, 2014, from Ch$205,332 million for the same period in 2013, primarily due to (i) an increase in revenues from our Chilean operations of Ch$7,895 million, or 7%, as a result of the improved performance of our flagship development Costanera Center, (ii) an increase in revenues from our Peruvian operations of Ch$2,883 million, or 20%, as a result of an increase in occupancy rates at our developments in the country from 87.0% to 89.0%, and (iii) an increase in revenues from our Colombian operations of Ch$1,447 million or an increase of 19.1%, primarily due to the reclassification of revenues derived from ancillary stores from the supermarket segment to real estate. These increases were partially offset by a 4% decrease in revenues from our Argentina division as a result of sluggish spending in the country and the depreciation of the ARS during period as described above.
Financial services
Our consolidated revenue from ordinary activities from our financial services increased Ch$36,028 million, or 44.1%, to Ch$117,679 million for the twelve months ended December 31, 2014, from Ch$81,651 million for the same period in 2013, primarily due to (i) an increase in revenues of Ch$17,467 million, or 69%, from our Peruvian operations as a result of portfolio expansion from the growth of our department store business, (ii) an increase in revenues from our Argentine operations of Ch$17,857 million, or 40%, as a result of an increase in the size of our loan portfolio and (iii) an increase in revenues from our Colombian operations of Ch$514 million, or 7%, also due to the increase in the size of our loan portfolio and the addition of new product offerings. These increases were partially offset by a decrease of Ch$140 million, or 4%, in Brazil, from Ch$3,983 million to Ch$3,843 million for the twelve months of 2013 and 2014, respectively, due to a decrease in the size of our loan portfolio in the country.
Cost of sales
Our consolidated cost of sales increased Ch$490,521 million, or 6.7%, to Ch$7,814,773 million for the twelve months ended December 31, 2014 from Ch$7,324,252 million for the same period in 2013, primarily due to an increase in sales of 5.7%.
Supermarkets
Our consolidated cost of sales in our supermarkets increased Ch$421,520 million, or 7.3%, to Ch$6,204,110 million for the twelve months ended December 31, 2014 from Ch$5,782,590 million for the same period in 2013, due to (i) an increase in cost of sales in Brazil of Ch$170,154 million, or 11%, as a result of a 7.5% increase in sales; (ii) an increase of Ch$98,232 million, or 5.9%, in Chile which was in line with the sales growth the country experienced, (iii) an increase of Ch$75,182 million in Peru as a result of an increase of 12.2% in sales as well as increased costs in connection with increased promotional pricing activities, (iv) a Ch$66,305 million, or 9.0%, increase in cost of sales in Colombia due to a 8.8% increase in sales and (v) an increase in cost of sales in Argentina of Ch$11,648 million or 0.9%.
112
Home improvement stores
Our consolidated cost of sales in home improvement stores increased Ch$12,940 million, or 1.6%, to Ch$800,342 million for the twelve months ended December 31, 2014 from Ch$787,402 million for the same period in 2013, mainly due to (i) an increases in cost of sales in Colombia of Ch$16,361 million, or 49%, as a result of the expansion of our operations in the country together with an increase of Ch$10,400, or 3%, in cost of sales in Chile which was in line with the sales growth in our Chilean business. These effects were partially offset by a decrease in cost of sales in Argentina of Ch$13,822 million or 3% as a result of improved terms with suppliers. Costs as a percentage of sales decreased to 65.3% in the twelve months of 2014, compared to 66.9% for 2013, due to more favorable commercial terms with suppliers due to contract renegotiations, a more flexible pricing environment in Argentina and a greater retail consumer mix, that has higher margin customers, versus wholesale in Chile.
Department stores
Our consolidated cost of sales in our department stores increased Ch$39,749 million, or 5.7%, to Ch$741,279 million for the twelve months ended December 31, 2014 from Ch$701,530 million for the same period in 2013, due to (i) an increase of Ch$21,655 million, or 178%, in cost of sales in Peru as a result of the abovementioned expansion of the department store business in the country and (ii) an increase in cost of sales in Chile of Ch$18,095 million, or 3%, as a result of increased promotional activities. Costs as a percentage of sales increased 250 basis points due to the deterioration of the consumer environment in Chile.
Shopping centers
Our consolidated cost of sales, primarily depreciation and expenses, from our shopping centers increased Ch$4,688 million, or 20.1%, to Ch$28,029 million for the twelve months ended December 31, 2014 from Ch$23,341 million for the same period in 2013, due to (i) an increase in Argentina of Ch$4,843 million, or 35%, as a result of increased operational expenses related to the renegotiation of collective bargaining agreements, (ii) an increase of Ch$483 million or 7% in cost of sales for our Chilean operations in line with sales growth for the period and (iii) an increase in cost of sales in Colombia as a result of the inclusion of supermarket ancillary stores into this segment of Ch$21 million, or 6%. These effects were partially offset by a decrease in cost of sales in Peru of Ch$659 million, or 35%, due to cost reductions and efficiencies.
Financial services
Our consolidated cost of sales, primarily provisions for bad debts and collection and processing costs, from our financial services division increased 50.5%, or Ch$13,108 million, to Ch$39,046 million for the twelve months ended December 31, 2014 from Ch$25,938 million for the same period in 2013, due to (i) an increase of Ch$8,008 million, or 55%, in Peru as a result of the growth of our loan portfolio and (ii) an increase of Ch$4,840 million, or 46%, in Argentina also due to the growth of our business during the period.
Gross profit
Our consolidated gross profit increased 3.1%, or Ch$86,349 million, to Ch$2,896,256 million for the twelve months ended December 31, 2014 from Ch$2,809,907 million for the same period in 2013, primarily due to gross profit improvement in the supermarket and home improvement segments.
Our consolidated gross profit as a percentage of revenues from ordinary activities decreased 70 bps to 27.0% for the twelve months ended December 31, 2014 from 27.7% for the same period in 2013.
Supermarkets
Our consolidated gross profit in our supermarkets increased Ch$54,723 million, or 2.9%, to Ch$1,955,127 million for the twelve months ended December 31, 2014 from Ch$1,900,404 million for the same period in 2013, as a result of (i) an increase in gross profit of Ch$29,270 million, or 5.2%, in Chile as a result of the improved performance of our Santa Isabel format and the steady performance of our Jumbo operations in the country, (ii) an increase in gross profit of Ch$16,025 million, or 9.6%, in Peru as a result of a 12.2% increase in sales, (iii) an increase of Ch$15,005 million, or 2.8%, in Argentina as a result of sales growth and improved inventory management and (iv) an increase in gross profit in Colombia of Ch$14,162 million or 7.9%, in line with sales growth experienced. Gross profit as a percentage of revenues from ordinary activities decreased for the supermarkets segment to 24.0% for the twelve months ended December 31, 2014 compared to 24.7% for the same period of 2013 as a result of a lower gross profit in our Brazilian operations due to increased inventory shrinkage for the operation, and as a result of increased cost of sales in Peru and Colombia due to increased promotional activities to better position our brands and support our market share in those regions.
113
Home improvement stores
Our consolidated gross profit in our home improvement stores increased Ch$35,788 million, or 9.2%, to Ch$425,275 million for the twelve months ended December 31, 2014 from Ch$389,487 million for the same period in 2013. Gross profit as a percentage of revenues from ordinary activities increased to 34.6% for the twelve months ended December 31, 2014, compared to 33.9% for the same period in 2013, primarily as a result of improved margins in Chile and Argentina: (i) gross profit as a percentage of revenues from ordinary activities in Argentina increased the most to 39.3% from 36.2% as a result of a more flexible pricing environment in light of government mandated price controls being limited to a reduced share of products sold and inventory accumulation preceding a high inflation period, (ii) gross profit as a percentage of revenues from ordinary activities in Chile increased to 29.2% from 28.8% as a result of having a larger base of retail clients in the sales mix leading to better profit margins and (iii) improvements in the scale of our Colombian operations, which went from 9 to10 stores adding 6,587 m2 of selling space, which resulted in better terms with suppliers as a result of greater purchased volumes increasing gross profit by 37%, or Ch$4,633 million; however, this effect was offset by inventory clearance sales during the period reducing gross profit as a percentage of revenues from ordinary activities from 26.9% to 25.4% in the country.
Department stores
Our consolidated gross profit in our department stores decreased Ch$18,667 million, or 6.9%, to Ch$250,163 million for the twelve months ended December 31, 2014 from Ch$268,830 million for the same period in 2013. The deterioration in the Chilean economy and reduced consumer spending led to an expansion of our promotional activities, resulting in a decrease in gross profit of Ch$21,668 million, or 8%, during the twelve months ended December 31, 2014 as compared to the same period in 2013. In Peru, gross profit in Chile increased Ch$3,001 million, or 124%, as a result of the increase in sales of 169% due to the increase in size of the operation, which went from 6 to 9 stores. Our consolidated gross profit as a percentage of revenues from ordinary activities decreased to 25.2% for the twelve months ended December 31, 2014 from 27.7% for the same period in 2013.
Shopping centers
Our consolidated gross profit in our shopping centers increased Ch$4,830 million, or 2.7%, to Ch$186,821 million for the twelve months ended December 31, 2014 from Ch$181,991 million for the same period in 2013, as a result of (i) an increase in gross profit in Chile of Ch$7,413 million, or 7% related to the improved performance of our developments in the country, in particular our Costanera Center, (ii) an increase in gross profit in Peru of Ch$3,542 million, or 29%, as a result of improved occupancy rates at Arequipa Center and Plaza Lima Sur and (iii) an increase in gross profit in Colombia of Ch$1,426 million, or 17%, mainly due to the reclassification of the activities of ancillary stores that were previously included under supermarkets into this segment. These increases were partially offset by a decline in gross profit in Argentina of Ch$7,551 million, or 14%, as a result of lower sales made by tenants at our shopping centers as well as the depreciation of the ARS during the period.
As a result of the foregoing factors, our consolidated gross profit as a percentage of revenues from ordinary activities in our shopping centers decreased to 86.9% for the twelve months ended December 31, 2014 compared to 88.6% for the same period in 2013.
Financial services
Our consolidated gross profit in our financial services segment increased Ch$22,919 million, or 41.1%, to Ch$78,632 million for the twelve months ended December 31, 2014 from Ch$55,713 million for the same period in 2013, as a result of (i) a larger loan portfolio and improved risk management activities at our Argentine operations, which increased gross profit in Argentina by Ch$13,018 million, or 39%, (ii) growth of our loan portfolio in Peru as a result of the development of our department store business, which fueled portfolio growth by financing in-store purchases, increasing gross profit by Ch$9,459 million and (iii) the expansion of our Colombian operations, increasing gross profit in Colombia by Ch$514 million, or 7%.
Other revenues by function
Our consolidated other revenues by function increased by Ch$6,147 million, or 5.7%, to Ch$114,438 million for the twelve months ended December 31, 2014 from Ch$108,291 million for the same period in 2013, as a result of an increase in the fair value of properties in the period and a lower discount rate used in the twelve month period ended December 31, 2014 when compared to the same period in 2013 partially offset by the negative effect of rising tax rates on our cash flow model.
Administrative expenses, distribution costs and other expenses
Our consolidated administrative expenses, distribution costs and other expenses increased Ch$137,854 million, or 5.8%, to Ch$2,495,436 million for the twelve months ended December 31, 2014 from Ch$2,357,582 million for the same period in 2013. This increase was in line with the related 5.7% increase in revenue from ordinary activities.
114
Results from financial and other activities
The following table presents, for the periods indicated, a breakdown of our consolidated results from financial, tax and other activities, as well as the percentage variation from period to period:
| | | | | | | | | | | | |
| | | As of December 31, | | | | |
| | | 2014 | | | 2013 | | | % Change | |
| | | (in millions of Ch$) | | | | |
Other gains (losses) | | | 34,624 | | | | 26,366 | | | | 31.3 | % |
Financial income | | | 6,709 | | | | 5,999 | | | | 11.8 | % |
Financial expenses | | | (222,165 | ) | | | (223,856 | ) | | | (0.8 | )% |
Exchange differences | | | (23,643 | ) | | | (25,054 | ) | | | (5.6 | )% |
Losses from indexation | | | (39,576 | ) | | | (18,885 | ) | | | 109.6 | % |
Total losses from financial and other activities | | | (244,050 | ) | | | (235,430 | ) | | | 3.7 | % |
| | | | | | | | | | | | |
Our consolidated losses from financial and other activities remained essentially flat for the twelve month period ended December 31, 2014 compared to the same period in 2013, in light of the following factors:
| | • | | An increase in Other gains (losses) of Ch$8,258 million, resulting mainly from favorable fair value of derivative contracts in connection with our hedging activities of our U.S.$ denominated debt (please see note 3 to our financial statements for further details on our hedging activities); and |
| | • | | A decrease in financial expenses of Ch$1,691 million, resulting in a financial expense of Ch$222,165 million for the twelve months ended December 31, 2014 compared to a financial expense of Ch$223,856 million for the same period of 2013 as a result of lower variable interest rates. As presented, financial expenses were reduced as a result of a lower debt load, despite greater working capital needs; and |
| | • | | A decrease in exchange differences of Ch$1,411 million, resulting in exchange losses of Ch$23,643 million for the twelve month period ended December 31, 2014 compared to exchange losses of Ch$25,054 million for the same period of 2013 as a result of a lower CLP/USD depreciation. |
which were offset by;
| | • | | An increase in losses stemming from indexation of Ch$20,691 million as a result of a higher inflation rate in Chile, resulting in a loss of Ch$39,576 million for the twelve months ended December 31, 2014, compared to a loss of Ch$18,885 million for the same period of 2013. |
Income tax charge
For the twelve month period ended December 31, 2014, we had an income tax expense of Ch$125,932 million, compared to an income tax expense of Ch$94,068 million for the same period in 2013. This increase of Ch$31,861 million was primarily due to a higher corporate tax rate during the 2014 period.
On September 29, 2014, Chile enacted the Tax Reform Act. The Tax Reform Act introduced changes to the corporate tax rate, mandating a gradual increase of the rate from 20% to 25% or 27% in certain cases, the rules regarding minimum capitalization, and the taxation of Chilean investments abroad (thecontrolled-foreign-corporation rules), among others. The new rules are set to come into effect gradually, with the implementation process having commenced on October 1, 2014 and set to be completed by January 1, 2018.
Profit (loss) from continuing operations
As a result of the above factors, our net earnings decreased Ch$89,923 million, or 37.2%, to Ch$151,485 million for the twelve months ended December 31, 2014 from Ch$241,408 million for the same period in 2013. Our net earnings, as a percentage of revenues from ordinary activities, decreased to 1.4% for the twelve months ended December 31, 2014 from 2.4% for the same period in 2013.
115
Year Ended December 31, 2014 Compared to Year Ended December 31, 2013 for Discontinued Operations
The following table presents, for the periods indicated, certain items of the statement of income for our discontinued operations:
| | | | | | | | | | | | |
| | | Year Ended
December 31, | | | | |
| | | 2014 | | | 2013 | | | % Change | |
| | | (in millions of Ch$) | | | | |
Revenues from discontinued operations: | | | | | | | | | | | | |
Total revenues | | | 201,826 | | | | 206,882 | | | | (2.4 | )% |
Cost of sales from discontinued operations: | | | | | | | | | | | | |
Total cost of sales | | | (55,799 | ) | | | (59,817 | ) | | | (6.7 | )% |
Gross profit from discontinued operations: | | | | | | | | | | | | |
Total gross profit | | | 146,027 | | | | 147,065 | | | | (0.7 | )% |
| | | |
Administrative expenses, distribution costs and other expenses | | | (55,460 | ) | | | (60,174 | ) | | | (7.8 | )% |
Other expenses by function | | | (13,670 | ) | | | (30,166 | ) | | | (54.7 | )% |
Other revenues by function | | | 191 | | | | 423 | | | | (54.9 | )% |
Other gains (losses) | | | 35 | | | | 16 | | | | 118.8 | % |
Results from operating activities | | | 77,123 | | | | 57,164 | | | | 34.9 | % |
Financial income | | | 260 | | | | 145 | | | | 79.3 | % |
Financial expenses | | | (38,953 | ) | | | (34,829 | ) | | | 11.8 | % |
Exchange differences | | | (19,199 | ) | | | (9,670 | ) | | | 98.5 | % |
Losses from indexation | | | (4,970 | ) | | | (2,074 | ) | | | 139.6 | % |
Income (loss) before taxes | | | 14,261 | | | | 10,447 | | | | 36.5 | % |
Income tax charge | | | (1,599 | ) | | | (2,089 | ) | | | 23.5 | % |
Profit (loss) | | | 12,662 | | | | 8,357 | | | | 51.2 | % |
Basic earnings (loss) per share | | | 3.0 | | | | 14.2 | | | | (78.9 | )% |
Diluted earnings (loss) per share | | | 3.0 | | | | 14.2 | | | | (78.9 | )% |
Revenues from discontinued operations
Discontinued operations
Our consolidated revenue from discontinued operations decreased Ch$5,056 million, or 2.4%, to Ch$201,826 million for the twelve months ended December 31, 2014, from Ch$206,882 million for the same period in 2013, primarily due to the effects of legal interest rate caps (Tasa Maxima Convencional) being applied in Chile as part of a regulatory framework developed in 2013.
Cost of sales
Discontinued operations
Our consolidated cost of sales from discontinued operations, primarily provisions for bad debts and collection and processing costs, decreased 6.7%, or Ch$4,018 million, to Ch$55,799 million for the twelve months ended December 31, 2014 from Ch$59,817 million for the same period in 2013, due to improved risk management activities as a lower percentage of our Chile loan portfolio was provisioned for non-performing loans.
Gross profit
Discontinued operations
Our consolidated gross profit from discontinued operations decreased Ch$1,038 million, or 0.7%, to Ch$146,027 million for the twelve months ended December 31, 2014 from Ch$147,065 million for the same period in 2013, as a result of the enactment of interest rate caps and a reduction in the number of cardholders with payments in arrears, which reduced revenues from overdue payments.
Other revenues by function
Our consolidated other revenues by function from discontinued operations decreased by Ch$232 million, or 54.9%, to Ch$191 million for the twelve months ended December 31, 2014 from Ch$423 million for the same period in 2013, as a result of an increase in the recovery of commission fees.
Administrative expenses, distribution costs and other expenses
Our consolidated administrative expenses, distribution costs and other expenses from discontinued operations decreased Ch$4,714 million, or 7.8%, to Ch$55,460 million for the twelve months ended December 31, 2014 from Ch$60,174 million for the same period in 2013. This decrease was above the related revenue contraction of 7.8%, and was due to cost cutting, expense control and enhanced productivity initiatives across our business divisions.
116
Results from financial and other activities
The following table presents, for the periods indicated, a breakdown of our consolidated results from financial, tax and other activities from discontinued operations, as well as the percentage variation from period to period:
| | | | | | | | | | | | |
| | | As of December 31, | | | | |
| | | 2014 | | | 2013 | | | % Change | |
| | | (in millions of Ch$) | | | | |
Other gains (losses) | | | 35 | | | | 16 | | | | 118.8 | % |
Financial income | | | 260 | | | | 145 | | | | 79.3 | % |
Financial expenses | | | (38,953 | ) | | | (34,829 | ) | | | 11.8 | % |
Exchange differences | | | (19,199 | ) | | | (9,670 | ) | | | 98.5 | % |
Losses from indexation | | | (4,970 | ) | | | (2,074 | ) | | | 139.6 | % |
Total losses from financial and other activities | | | (62,827 | ) | | | (46,412 | ) | | | 35.4 | % |
| | | | | | | | | | | | |
Our consolidated losses from financial and other activities from discontinued operations increased 14% for the twelve month period ended December 31, 2014 compared to the same period in 2013, in light of the following factors:
| | • | | An increase in financial expenses of Ch$4,124 million, resulting in a financial expense of Ch$38,953 million for the twelve months ended on December 31, 2014, compared to a financial expense of Ch$34,829 million for the same period of 2013 as a result of portfolio expansion in the period; |
| | • | | An increase in exchange rate differences of Ch$9,529 million, resulting in a loss of Ch$19,199 million for the twelve months ended on December 31, 2014 compared to a loss of Ch$9,670 million for the same period in 2013 as a result of the devaluation of local currencies against the U.S. dollar; and |
| | • | | An increase in losses stemming from indexation of Ch$2,896 million as a result of a higher inflation rate in Chile, resulting in a loss of Ch$4,970 million for the twelve months ended on December 31, 2014, compared to a loss of Ch$2,074 million for the same period of 2013, |
which were partially offset by:
| | • | | An increase in Other gains (losses) of Ch$19 million, from Ch$16 million for the twelve months ended December 31, 2013 to Ch$35 million in the same period of 2014 due to the fair value of derivative contracts, and; |
| | • | | An increase in financial income from Ch$145 million for the twelve months ended December 31, 2013 to Ch$260 million for the same period in 2014 due to investments made by the Company with excess cash. |
Income tax charge
For the twelve months ended December 31, 2014, we had an income tax expense of Ch$1,599 million, compared to an income tax expense of Ch$2,089 million for the same period in 2013. This decrease of Ch$490 million was a consequence of the tax reform enacted in Chile during 2014. The application of the Chilean tax reform resulted in a profit over the equity held by our financial services business in Chile. This profit due to the application of the tax reform in Chile resulted in a reduction in our effective tax rate in Chile (See Note 26 to our audited financial statements).
Profit (loss) from discontinued operations
As a result of the above factors, our net earnings from discontinued operations increased Ch$3,052 million, or 36.5%, to Ch$11,409 million for the twelve months ended December 31, 2014 from Ch$8,357 million for the same period in 2013. Our net earnings, as a percentage of revenues from ordinary activities, increased to 5.7% for the twelve months ended December 31, 2014 from 4.0% for the same period in 2013.
Year ended December 31, 2013 as compared to year ended December 31, 2012
The following table presents, for the periods indicated, certain items of our statement of income:
| | | | | | | | | | | | |
| | | Year ended
December 31, | | | | |
| | | 2013 | | | 2012 | | | % Change | |
| | | (in millions of Ch$) | | | | |
Revenues from ordinary activities: | | | | | | | | | | | | |
Supermarkets | | | 7,682,064 | | | | 6,733,610 | | | | 14.1 | % |
Home improvement stores | | | 1,176,890 | | | | 1,063,086 | | | | 10.7 | % |
117
| | | | | | | | | | | | |
| | | Year ended
December 31, | | | | |
| | | 2013 | | | 2012 | | | % Change | |
| | | (in millions of Ch$) | | | | |
Department stores | | | 970,360 | | | | 886,075 | | | | 9.5 | % |
Shopping centers | | | 205,332 | | | | 172,104 | | | | 19.3 | % |
Financial services | | | 81,651 | | | | 58,454 | | | | 39.7 | % |
Other | | | 17,861 | | | | 12,022 | | | | 48.6 | % |
Total revenues from ordinary activities | | | 10,134,158 | | | | 8,925,351 | | | | 13.5 | % |
| | | | | | | | | | | | |
Cost of sales: | | | | | | | | | | | | |
Supermarkets | | | (5,782,590 | ) | | | (5,057,477 | ) | | | 14.3 | % |
Home improvement stores | | | (787,402 | ) | | | (711,500 | ) | | | 10.7 | % |
Department stores | | | (701,530 | ) | | | (644,668 | ) | | | 8.8 | % |
Shopping centers | | | (23,341 | ) | | | (27,213 | ) | | | (14.2 | )% |
Financial services | | | (25,938 | ) | | | (21,082 | ) | | | 23.0 | % |
Other | | | (3,451 | ) | | | (2,294 | ) | | | 50.4 | % |
Total cost of sales | | | (7,324,252 | ) | | | (6,464,234 | ) | | | 13.3 | % |
| | | | | | | | | | | | |
Gross profit: | | | | | | | | | | | | |
Supermarkets | | | 1,900,404 | | | | 1,676,133 | | | | 13.4 | % |
Home improvement stores | | | 389,487 | | | | 351,586 | | | | 10.8 | % |
Department stores | | | 268,830 | | | | 241,407 | | | | 11.4 | % |
Shopping centers | | | 181,991 | | | | 144,891 | | | | 25.6 | % |
Financial services | | | 55,713 | | | | 37,372 | | | | 49.1 | % |
Other | | | 13,481 | | | | 9,728 | | | | 38.6 | % |
Total gross profit | | | 2,809,907 | | | | 2,461,117 | | | | 14.2 | % |
| | | | | | | | | | | | |
Administrative expenses, distribution costs and other expenses | | | (2,357,582 | ) | | | (2,048,390 | ) | | | 15.1 | % |
Other revenues by function | | | 108,291 | | | | 107,011 | | | | 1.2 | % |
Participation in earnings of associates | | | 10,289 | | | | 5,642 | | | | 82.4 | % |
Financial income | | | 5,999 | | | | 8,231 | | | | (27.1 | )% |
Financial expenses | | | (223,856 | ) | | | (178,631 | ) | | | 25.3 | % |
Other earnings | | | 26,366 | | | | (7,403 | ) | | | N/A | |
Exchange differences | | | (25,054 | ) | | | (12,053 | ) | | | 107.9 | % |
Losses from indexation | | | (18,885 | ) | | | (23,538 | ) | | | (19.8 | )% |
Income (loss) before taxes | | | 335,476 | | | | 311,988 | | | | 7.5 | % |
Income tax charge | | | (94,068 | ) | | | (92,226 | ) | | | 2.0 | % |
Profit from continuing operations | | | 241,408 | | | | 219,762 | | | | 9.8 | % |
Profit from discontinued operations | | | 8,357 | | | | 33,047 | | | | (74.7 | )% |
Net income | | | 249,765 | | | | 252,809 | | | | (1.2 | )% |
Profit attributable to non-controlling shareholders | | | (165 | ) | | | 2,851 | | | | (105.8 | )% |
Profit attributable to controlling shareholders | | | 249,930 | | | | 249,959 | | | | 0.0 | % |
Revenues from ordinary activities
Our consolidated revenues from ordinary activities increased Ch$1,208,807 million, or 13.5%, to Ch$10,134,158 million for the year ended December 31, 2013, from Ch$8,925,351 million for the same period in 2012, as a result of (i) an increase of Ch$948,454 million, or 14.1%, in revenue in the supermarket segment, (ii) an increase of Ch$113,804 million, or 10.7%, in revenue in our home improvement stores, (iii) an increase of Ch$84,285 million, or 9.5%, in revenue in our department store business, (iv) an increase of Ch$33,228 million, or 19.3%, in revenue from our shopping center segment and (v) an increase of Ch$23,197 million, or 39.7%, in revenue in our financial services business as a result of its expansion in Peru and the addition of financial services in Colombia to the segment.
Supermarkets
Our consolidated revenue from ordinary activities from our supermarkets increased Ch$948,454 million, or 14.1%, to Ch$7,682,064 million for the year ended December 31, 2013 from Ch$6,733,610 million for the same period in 2012, primarily due to (i) the consolidation of Colombian supermarket operations for the entire 12-month period of 2013 versus only one month in 2012, (ii) an increase of Ch$169,327 million, or 8.2%, in sales in Chile as a result of positive same-store sales and the addition of 10 new stores across the country, (iii) and revenue expansion of Ch$35,064 million or 2.0% in Argentina as a consequence of 17.3% same-store sales growth in local currency and an increase of Ch$26,530 or 4.0% in Peru, also aided by the opening one store and 1.5% same-store sales growth in local currency. All of the above were partially offset by a decrease in revenues in Brazil of Ch$91,206 million, or of 4.4%, as a result of decreasing same-store sales of 0.5% in local currency.
118
Home improvement stores
Our consolidated revenues from ordinary activities from our home improvement stores increased Ch$113,804 million, or 10.7%, to Ch$1,176,890 million for the year ended December 31, 2013 from Ch$1,063,086 million for the same period in 2012, primarily due to (i) an increase of Ch$48,328 million, or 12.4%, resulting from an increase in revenues in Chile driven by an increase insame-store sales in local currency of 6.1% and improved terms from suppliers, (ii) an increase of Ch$62,025, or 10.0%, million in revenues, in Argentina driven by an increase in same-store sales in local currency of 30.3% and an increase in sales resulting from the opening of one new store and (iii) an increase of Ch$3,450 million, or 8.1%, in revenues in Colombia driven by an increase of 0.1% in same stores sales in local currency and the opening of 5 new stores in the period.
Department stores
Our consolidated revenues from ordinary activities from our department stores increased Ch$84,285 million, or 9.5%, in 2013 compared to 2012, as a result of (i) an increase of Ch$69,702 million, or 7.9%, to Ch$955,777 million of revenues from Chile for the year ended December 31, 2013 from Ch$886,075 million for the same period in 2012, primarily due to an increase in same-store sales of 4.7% and (ii) increased revenues in Peru as a result of the opening of six new Paris stores in the country during the period that contributed Ch$14,583 million.
Shopping centers
Our consolidated revenues from ordinary activities from our shopping centers increased Ch$33,228 million, or 19.3%, to Ch$205,332 million for the year ended December 31, 2013 from Ch$172,104 million for the same period in 2012, primarily due to: (i) an increase of Ch$19,748 million, or 21.2%, resulting from growth in revenues in Chile due to the improved performance posted by all of our properties in the country, particularly Costanera Center and the shopping center’s full year contribution to the division; (ii) an increase of Ch$3,828 million, or 5.8%, resulting from growth in revenues in Argentina due to improved performance, (iii) revenue growth in Peru in the segment of 111%% for the year ended December 31, 2013 attributable to the opening of a shopping center in the city of Arequipa (iv) and the consolidation of the Colombian real estate division.
Financial services
Our consolidated revenues from ordinary activities from our financial services increased Ch$23,197 million, or 39.7%, to Ch$81,651 million for the year ended December 31, 2013 from Ch$58,454 million for the same period in 2012, due to portfolio expansion in our markets.
Cost of sales
Our consolidated cost of sales increased Ch$860,018 million, or 13.3%, to Ch$7,324,252 million for the year ended December 31, 2013 from Ch$6,464,234 million for the same period in 2012, primarily due to the increase in sales reported in the period. The main increase was seen in our supermarket segment following the consolidation of our Colombian operations. Cost of sales as a percentage of sales decreased by 0.3% in 2013 compared to 2012 as a result of better cost management by our shopping center and department store segments.
Supermarkets
Our consolidated cost of sales in our supermarkets increased Ch$725,113 million, or 14.3%, to Ch$5,782,590 million for the year ended December 31, 2013 from Ch$5,057,477 million for the same period in 2012, due to (i) cost of sales of Ch$654,338 million attributable to the consolidation of 12 months of Colombian supermarket operations; (ii) an increase in cost of sales in Chile of Ch$107,579 million, or 6.9%, as a result of the opening of 10 new stores and (iii) an increase of Ch$26,862 million, or 5.0%, for cost of sales in our Peruvian supermarkets. The above were partially offset by a decrease in cost of sales in Brazil of Ch$89,129 million, or 5.4%, as a result of improved terms with suppliers.
Home improvement stores
Our consolidated cost of sales in home improvement stores increased Ch$75,902 million, or 10.7%, to Ch$787,402 million for the year ended December 31, 2013 from Ch$711,500 million for the same period in 2012, primarily due to (i) an increase of cost of sales in Argentina of Ch$39,615 million (ii) an increase of cost of sales in Chile of Ch$33,864 million, or 12%, and (iii) an increase of Ch$2,424 in Colombia. Costs as percentage of sales remained flat due to better terms resulting from negotiations with our suppliers.
119
Department stores
Our consolidated cost of sales in our department stores increased Ch$56,862 million, or 8.8%, to Ch$701,530 million for the year ended December 31, 2013 from Ch$644,668 million for the same period in 2012, primarily due to an increase in sales in the period of 9.5%. Costs as a percentage of sales decreased marginally by 0.5% due to greater synergies in our dealings with suppliers and improved margins at our Johnson stores. Cost of Sales in Chile grew 6.9% while the start up of department stores in Peru resulted an increase in cost of sales of Ch$12,170 million.
Shopping centers
Our consolidated cost of sales, primarily depreciation and expenses, from our shopping centers decreased Ch$3,872 million, or 14.2%, to Ch$23,341 million for the year ended December 31, 2013 from Ch$27,213 million for the same period in 2012, due to; (i) a decrease in cost of sales in Peru in the amount of Ch$1,266 million (ii) a decrease in Chile of Ch$1,382 million, or 16.8%, due to higher expenses being recorded in 2012 for the opening of Costanera Center, and (iii) a decline in Argentina of Ch$666 million, or 4.6%. These were partially offset by the consolidation of our shopping center business in Colombia.
Financial services
Our consolidated cost of sales, primarily provisions for bad debts and collection and processing costs, from our financial services segment increased 23.0%, or Ch$4,856 million, to Ch$25,938 million for the year ended December 31, 2013 from Ch$21,082 million for the same period in 2012, due to portfolio expansion.
Gross profit
Our consolidated gross profit increased 14.2%, or Ch$348,790 million, to Ch$2,809,907 million for the year ended December 31, 2013 from Ch$2,461,117 million for the same period in 2012, primarily due to gross profit improvements in all segments.
Our consolidated gross profit as a percentage of revenues from ordinary activities increased 0.1% to 27.7% for the year ended December 31, 2013 from 27.6% for the same period in 2012.
Supermarkets
Our consolidated gross profit in our supermarkets increased Ch$224,271 million, or 13.4%, to Ch$1,900,404 million for the year ended December 31, 2013 from Ch$1,676,133 million for the same period in 2012, as a result of margin improvements in all of our markets except for Brazil. Gross profit as a percentage of sales remained flat for the overall division at 24.9%. This was a result of (i) the addition of 12 months of operation of our Colombian supermarket operation that contributed Ch$148,769 million in gross profit; (ii) gross profit in Chile increasing Ch$61,749 million, or 12.4%, reflecting the maturing of continued investments in distribution centers; and (iii) expanding gross profit in Ch$25,373 million in Argentina, or 4.9%, as a result of a more flexible pricing environment combined with an improved commercial strategy. These were partially offset by a decrease in gross profit from Brazil of Ch$2,077 million, or 0.5%.
Home improvement stores
Our consolidated gross profit in our home improvement stores increased Ch$37,901 million, or 10.8%, to Ch$389,487 million for the year ended December 31, 2013 from Ch$351,586 million for the same period in 2012. Cost of sales as a percentage of sales remained flat in the period at 33.1% when compared against the same period 2012. The increase was a result of: (i) an increase in Argentina operations of Ch$22,411, or 10%, in line with sales growth for the division, (ii) Chile growing Ch$14,465 million, or 12.6%, as a result of higher sales with increased gross margins for the operation and (iii) an increase in our Colombian operations of Ch$1,026 million, or 9.0%, with an increase of 0.3% in gross margin for the operation as a result of greater volumes, which diluted expenses.
Department stores
Our consolidated gross margin in our department stores increased Ch$27,423million, or 11.4%, to Ch$268,830 million for the year ended December 31, 2013 from Ch$241,407 million for the same period in 2012. In Chile, the improvement resulted from better inventory management and sales mix particularly at our Johnson operations. Our consolidated gross profit as a percentage of revenues from ordinary activities increased by 0.5% to 27.7% for the year ended December 31, 2013 from 27.2% for the same period in 2012. Our Peruvian start up contributed Ch$2,413 million in gross profit to this division.
120
Shopping centers
Our consolidated gross margin in our shopping centers increased Ch$37,100 million, or 25.6%, to Ch$181,991 million for the year ended December 31, 2013 from Ch$144,891 million for the same period in 2012, as a result of (i) an increase in Chile of Ch$21,129 million reflecting a full year contribution of Costanera Center as well as high occupancy levels for that property and Portal Osorno, (ii) the addition of Colombian real estate operations that contributed Ch$7,502 million in gross profit and (iii) an increase in Argentina of Ch$4,494 million.
As a result of the foregoing factors, our consolidated gross profit as a percentage of revenues from ordinary activities in our shopping centers increased to 88.63% for the year ended December 31, 2013 from 84.2% for the same period in 2012.
Financial services
Our consolidated gross profit in our financial services segment increased Ch$18,341 million, or 49.1%, to Ch$55,713 million for the year ended December 31, 2013 from Ch$37,372 million for the same period in 2012, as a result of (i) an increase of Ch$7,996 million in Peru as a result of a greater loan portfolio and (ii) the greater contribution to financial services from our Colombian operations, which added Ch$7,156 million as a result of having a full year´s contribution to the segment.
Other revenues by function
Our consolidated other revenues by function increased by Ch$1,280 million, to Ch$108,291 million for the year ended December 31, 2013 from Ch$107,011 million for the same period in 2012, as a result of an increase in the fair value of investment properties in 2013 when compared to 2012.
Administrative expenses, distribution costs and other expenses
Our consolidated administrative expenses, distribution costs and other expenses increased Ch$309,192 million, or 15.1%, to Ch$2,357,582 million for the year ended December 31, 2013 from Ch$2,048,390 million for the same period in 2012, which exceeded the revenue increase from ordinary activities of 13.5% as a result of real wage increases in the period in most of our segments.
Results from financial and other activities
The following table presents, for the periods indicated, a breakdown of our consolidated results from financial and other activities, as well as the percentage variation from period to period:
| | | | | | | | | | | | |
| | | Year ended December 31, | | | | |
| | | 2013 | | | 2012 | | | % Change | |
| | | (in millions of Ch$) | | | | |
Other earnings (losses) | | | 26,366 | | | | (7,403 | ) | | | 456.2 | % |
Financial income | | | 5,999 | | | | 8,231 | | | | (27.1 | )% |
Financial expenses | | | (223,856 | ) | | | (178,631 | ) | | | 25.3 | % |
Exchange differences | | | (25,054 | ) | | | (12,053 | ) | | | 107.9 | % |
Losses from indexation | | | (18,885 | ) | | | (23,538 | ) | | | (19.8 | )% |
Total losses from financial and other activities | | | (235,430 | ) | | | (213,394 | ) | | | 10.3 | % |
Our consolidated losses from financial and other activities increased by Ch$22,036 million, to a loss of Ch$235,430 million for the year ended December 31, 2013 from a loss of Ch$213,394 million for the same period in 2012. This increase was primarily due to the following factors:
| | • | | An increase in financial expenses of Ch$45,225 million, resulting in financial expenses of Ch$223,856 for the year ended December 31, 2013 compared to financial expenses of Ch$178,631 million for the same period of 2012 as a result of lower cash on hand, and a higher debt load used to fund the company’s growth strategy, which mainly related to acquisitions; and |
| | • | | An increase in exchange rate differences of Ch$13,001 million, resulting in a loss of Ch$25,054 million for the year ended December 31, 2013 compared to a loss of Ch$12,053 for the same period in 2012, as a result of the devaluation of local currencies against the U.S. dollar; |
121
which were partially offset by:
| | • | | A decrease in losses stemming from indexation of Ch$4,653 million, resulting in a loss of Ch$18,885 million for the year ended December 31, 2013, compared to a loss of Ch$23,538 for the same period of 2012, as a result of a lower inflation rate in Chile; and |
| | • | | Higher earnings related to the fair value of cross currency swaps being booked under other earnings (losses) connected to the hedging of our U.S.$ denominated debt. |
Income tax charge
For the year ended December 31, 2013, we had an income tax expense of Ch$94,068 million, compared to an income tax expense of Ch$92,226 million for the same period in 2012. This increase of Ch$1,842 million was due to better business performance.
Profit (loss) from continuing operations
As a result of the above factors, our net earnings increased Ch$21,646 million, or 9.8%, to Ch$241,408 million for the year ended December 31, 2013 from Ch$219,762 million for the same period in 2012. Our net earnings, as a percentage of revenues from ordinary activities, decreased to 2.4% for the year ended December 31, 2013 from 2.5% for the same period in 2012.
Year ended December 31, 2013 as compared to year ended December 31, 2012 for Discontinued Operations
The following table presents, for the periods indicated, certain items of the statement of income for our discontinued operations:
| | | | | | | | | | | | |
| | | Year Ended December 31, | | | | |
| | | 2013 | | | 2012 | | | % Change | |
| | | (in millions of Ch$) | | | | |
Revenues from discontinued operations: | | | | | | | | | | | | |
Total revenues | | | 206,882 | | | | 223,726 | | | | (7.5 | )% |
Cost of sales from discontinued operations: | | | | | | | | | | | | |
Total cost of sales | | | (59,817 | ) | | | (83,598 | ) | | | 28.4 | % |
Gross profit from discontinued operations: | | | | | | | | | | | | |
Total gross profit | | | 147,065 | | | | 140,129 | | | | 4.9 | % |
| | | |
Administrative expenses, distribution costs and other expenses | | | (90,339 | ) | | | (73,432 | ) | | | 23 | % |
Other revenues by function | | | 423 | | | | 99 | | | | 327.2 | % |
Other gains (losses) | | | 16 | | | | 34 | | | | (53 | )% |
Results from operating activities | | | 57,164 | | | | 66,830 | | | | (14 | )% |
Financial income | | | 145 | | | | (121 | ) | | | 219.8 | % |
Financial expenses | | | (34,829 | ) | | | (32,391 | ) | | | 7.5 | % |
Participation in profit or loss of equity method associates | | | — | | | | (2,695 | ) | | | N/A | |
Exchange differences | | | (9,670 | ) | | | 9,373 | | | | 203 | % |
Losses from indexation | | | (2,074 | ) | | | (2,378 | ) | | | (12.8 | )% |
Income (loss) before taxes | | | 10,447 | | | | 41,310 | | | | (75 | )% |
Income tax charge | | | (2,089 | ) | | | (8,262 | ) | | | (75 | )% |
Profit (loss) | | | 8,357 | | | | 33,047 | | | | (75 | )% |
Revenues from discontinued operations
Our consolidated revenues from discontinued operations decreased Ch$16,844 million, or 7.5%, to Ch$206,882 million for the year ended December 31, 2013, from Ch$223,726 million for the same period in 2012, primarily due a smaller credit card receivables portfolio in Chile and the effects of interest rate caps over already extended loans.
On June 20, 2014, Cencosud S.A. and its affiliates Cencosud Retail S.A. and Easy S.A. entered into the Joint Venture Framework Agreement with The Bank of Nova Scotia and Scotiabank Chile S.A., related to the development of financial services in Chile, previously disclosed by Cencosud S.A. in its reports on Form 6-K dated June 23, 2014 and June 25, 2014. Pursuant to the Joint Venture Framework Agreement, Scotiabank Chile or its affiliated entities will acquire a fifty-one percent (51%) of each of the Subject Companies, with the remaining forty-nine percent (49%) owned by us or our affiliates. We and Scotiabank Chile or its affiliates will enter into corresponding shareholder agreements with respect to each of the Subject Companies. We will also enter into a joint venture agreement that will govern the relationship between the parties in regards to the development of the financial retail business in Chile, with the agreement having an exclusivity period of 15 years from the date of the closing under the Joint Venture Framework Agreement. CAT and Scotiabank Chile will, at such closing date or within three days of having constituted CAT as a supporting
122
company for bank transfers, enter into a line-of-credit agreement for Scotiabank Chile’s portion of the financing of the Chilean retail finance business. At the end of the 15-year period, we will have an option to repurchase Scotiabank Chile’s 51% ownership interest in the Subject Companies. On April 13, 2015, the Superintendency of Banks and Financial Institutions of Chile announced its approval of the joint venture between the Company and Scotiabank.
Cost of sales from discontinued operations
Our consolidated cost of sales from discontinued operations, primarily provisions for bad debts and collection and processing costs, decreased Ch$23,781 million, or 28.4%, as a result of better risk management activities in Chile.
Gross profit from discontinued operations
Our consolidated gross profit from discontinued operations increased Ch$6,936 million, or 4.9%, as a result of lower provisions for the loan portfolio due to better risk management activities in Chile.
Other revenues by function from discontinued operations
Our consolidated other revenues by function for discontinued operations increased by Ch$324 million, or 327.2%, to Ch$423 million for the year ended December 31, 2013 from Ch$99 million for the same period in 2012, as a result of an increase in the recovery of commission fees.
Administrative expenses, distribution costs and other expenses from discontinued operations
Our consolidated administrative expenses, distribution costs and other expenses from discontinued operations increased Ch$16,907 million, or 23%, to Ch$90,339 million for the year ended December 31, 2013 from Ch$73,432 million for the same period in 2012. This increase was above the related revenue growth of 7.5%, and was mainly due to expenses related to the transaction with Scotiabank.
Results from financial and other activities from discontinued operations
The following table presents, for the periods indicated, a breakdown of our consolidated results from financial, tax and other activities, as well as the percentage variation from period to period:
| | | | | | | | | | | | |
| | | Year ended December 31, | | | | |
| | | 2013 | | | 2012 | | | % Change | |
| | | (in millions of Ch$) | | | | |
Other gains (losses) | | | 16 | | | | 34 | | | | (53 | )% |
Financial income | | | 145 | | | | (121 | ) | | | 219.8 | % |
Financial expenses | | | (34,829 | ) | | | (32,391 | ) | | | 7.5 | % |
Exchange differences | | | (9,670 | ) | | | 9,373 | | | | (203 | )% |
Losses from indexation | | | (2,074 | ) | | | (2,378 | ) | | | (12.8 | %) |
Total losses from financial and other activities | | | (46,412 | ) | | | (25,483 | ) | | | 82.1 | % |
| | | | | | | | | | | | |
Our consolidated losses from financial and other activities increased by 83% for the year ended December 31, 2013 compared to the same period in 2012, primarily due to the following factors:
| | • | | A decrease in Other gains (losses) of Ch$18 million, going from Ch$34 million for the year ended December 31, 2012 to Ch$16 million in the same period of 2013; |
| | • | | An increase in financial expenses of Ch$2,438 million, resulting in financial expenses of Ch$34,829 million for the year ended December 31, 2013 compared to Ch$32,391 million for the same period in 2012, as a result of loan portfolio expansion in the period, and; |
| | • | | An increase in exchange rate differences of Ch$19,043 million, resulting in a loss of Ch$9,670 million for the year ended December 31, 2013 compared to a gain of Ch$9,373 million for the same period in 2012 as a result of the devaluation of local currencies against the U.S. dollar; |
which were partially offset by:
| | • | | A decrease in losses stemming from indexation of Ch$304 million as a result of a lower inflation rate in Chile, resulting in a loss of Ch$2,074 million for the year ended December 31, 2013 compared to a loss of Ch$2,378 million for the same period of 2012. |
123
Income tax charge from discontinued operations
For the year ended December 31, 2013 we had an income tax expense of Ch$2,089 million, compared to an income tax expense of Ch$8,262 million for the same period in 2012. This decrease of Ch$6,173 million is attributed to lower profit in the period.
Profit (loss) from discontinued operations
As a result of the above factors, our net earnings decreased Ch$24,690 million, or 75%, to Ch$8,357 million for the year ended December 31, 2013 from Ch$33,047 million for the same period in 2012. Our net earnings, as a percentage of revenues from ordinary activities, decreased to 4.0% for 2013 from 15.0% for 2012.
B. LIQUIDITY AND CAPITAL RESOURCES
General
Our principal sources of liquidity have historically been:
| | • | | cash generated by operations; |
| | • | | short-term credit extended by suppliers; |
| | • | | cash from borrowings and financing arrangements; and |
| | • | | financing provided to us by sellers of businesses we have acquired. |
Our principal cash requirements or uses (other than in connection with our operating activities) have historically been:
| | • | | acquisition of, or investments in, companies engaged in the retail business; and |
| | • | | capital expenditures for property, plant and equipment. |
The Joint Venture transaction with Scotiabank for the Credit Card business in Chile will also allow the Company to reduce the use of funds devoted to fund the increase in the portfolio in Chile.
At December 31, 2014 we had a positive working capital (defined as total current assets, excluding cash and cash equivalents and other financial assets, minus total current liabilities, excluding other current financial liabilities) of Ch$311 million.
At December 31, 2013 we had a positive working capital of Ch$596 million.
At December 31, 2012, we had a negative working capital current of Ch$146,574 million.
On April 1, 2014, we refinanced liabilities in a collective amount of approximately U.S.$770 million, reducing liquidity needs for the next 24 months. This debt roll-over operation had the support of 10 regional Banks: BBVA, Banco de Bogotá, Bradesco, Banco del Estado de Chile, HSBC, Mizuho Bank, Banco Popular de Colombia, Rabobank, Santander and Sumitomo Mitsui Banking Corporation, in addition to other competitive offers. Proceeds were used to refinance liabilities in Chile, Brazil, Peru and Colombia with new terms ranging from 3 to 6 years, as follows: U.S.$270 million in Chile, U.S.$60 million in Peru, U.S.$144 million in Brazil and U.S.$179 million in Colombia. As a result of this refinancing, the average maturity of our outstanding debt was extended while its terms and conditions remained unchanged. This refinancing is in line with the company’s financial strategy, seeking to extend payment terms for its debt, shifting focus to the operation and ultimately deleverage the company.
We believe that our cash from operations, current financing initiatives and cash and cash equivalents are sufficient to satisfy our capital expenditures and debt service obligations in 2015. We anticipate financing any future acquisitions or capital expenditures for property, plant and equipment with cash from operations and additional indebtedness.
124
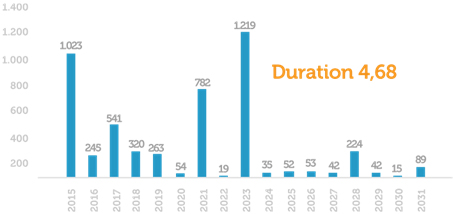
Leverage
Our objective regarding capital management is to safeguard our capacity to continue ensuring appropriate returns for our shareholders and benefits for other stakeholders, and maintaining an optimum capital structure while reducing capital costs.
In line with the industry, we monitor our capital using a leverage ratio calculation. This ratio is calculated by dividing net financial debt by total capital. Net financial debt corresponds to total indebtedness (including current and non-current debt) less cash and cash equivalents. Total capital corresponds to total equity as shown in the consolidated statement of financial position plus net debt.
In accordance with the above, we combine different financing sources, such as: capital increases, operating cash flows, bank loans and bonds.
Seasonality
Historically, we have experienced distinct seasonal patterns to our liquidity needs, which are highest in the first and second quarters of our fiscal year. Liquidity needs are higher in the first quarter primarily because payment becomes due for goods purchased in the previous quarter for the Christmas and New Year holidays. We also experience greater liquidity needs in the second quarter, as dividends and taxes are paid during this period.
During the periods when we have increased liquidity needs, we obtain funding primarily through short-term bank borrowings, overdraft lines of credit and by reducing our cash outflows, primarily by reducing or suspending advance payments to suppliers.
Indebtedness
At December 31, 2014, financial liabilities not including Cencosud´s banking operations reached Ch$3,107,487 million, a 13.1% increase when compared to December 31, 2013. As of December 31, 2014 our net financial debt, not considering Cencosud´s banking activities) was Ch$2,587,834 million, up from Ch$ 2,457,125 million as of December 31, 2013.
Our total financial debt includes both fixed-rate and variable-rate debt. Taking into account the effects of cross currency swaps, excluding Banco Paris indebtedness, at December 31, 2014, approximately 49% of our debt was variable-rate, and the remainder was fixed-rate. At December 31, 2014, approximately 11% of our debt was denominated in U.S. dollars, approximately 22% in UF, approximately 50% in Chilean pesos, approximately 2% in Argentine pesos, approximately 2% in Peruvian nuevos soles, approximately 6% in Brazilian reais and approximately 6% in Colombian Pesos. As part of our financial management policies, from time to time we enter into swaps and other derivative transactions to hedge our interest rate and exchange rate risk. See “Item 11. Quantitative and Qualitative Disclosures About Market Risk.” Our strategy is to hold the majority of our debt in local currencies, with a target ratio of debt denominated in foreign currency of 10% to 15% of our total debt.
In order to fund our growth plans, improve our amortization profile and reduce our cost of debt, in 2011 we issued bonds with an aggregate principal amount of US$750 million due 2021 in a 144A/Reg-S offering in the international capital markets, with a fixed interest rate of 5.5% (the “2011 144A/Reg-S Bond”). We have hedged the currency risk associated with this issuance throughcross-currency swaps with a nominal amount of U.S.$535 million. Additionally, in June 2011, we issued in the Chilean debt capital market bonds due 2031 with an aggregate principal amount of Ch$54,000 million, with a fixed interest rate of 7.40%. This was the first bond
125
issuance in the Chilean debt capital market with a maturity of 20 years. As a result of these issuances, we were able to extend the duration of our debt (from approximately 4.8 years at the end of 2010 to over 7.5 years at the end of 2011) and streamline our debt amortization schedule.
On October 17, 2012, the Company entered into the Bridge Loan Agreement with a syndicate of banks, in the amount of U.S.$2,500 million to finance the purchase of Carrefour’s Colombian operations.
On December 6, 2012, the Company issued U.S.$1,200 million aggregate principal amount of bonds due 2023 in a Rule 144A and Regulation S offering in the international capital markets (the “2023 144A/Reg-S Bond”). The 2023 144A/Reg S Bond accrues interest at a fixed rate of 4.875%. The Company applied part of the proceeds of the 2023 144A/Reg-S Bond to repay U.S.$1,000 million outstanding under the Bridge Loan Agreement.
In March, 2013 we completed a preemptive rights offering in the Chilean market that raised U.S.$1,600 million, and used the proceeds from that capital increase to prepay the outstanding amount of the Bridge Loan Agreement of U.S.$1,500 million. The rest of the proceeds of the capital increase were used to pay other short term liabilities.
On September 4, 2014, the holders of the Series E and F bonds issued by the Company registered in the Securities Registry of the Superintendencia de Valores y Seguros (Superintendency of Securities and Insurance) as “Issuance No. 530”, approved the amendment of the Indenture for Series E and F. The amendments allow the Company to reduce its equity participation in CAT to as low as 45% of said equity. The aforementioned amendments were intended to prevent a default under the Indenture for Series E and F in connection with the consummation of the transactions contemplated in the Joint Venture Framework Agreement.
On October 17, 2014, the Company announced that it was calling its Series A, C and D bonds issued under Issuance No. 443 of the securities registry for early redemption, and communicated the same to the Superintendencia de Valores y Seguros. As specified in the announcement, the Issuance No. 443 bonds were scheduled to be redeemed on November 19, 2014. Issuance No. 443 bonds totaled an aggregate amount of UF 10,000,000. Payment for the bonds was to be made in Chilean pesos according to the value of the UF on the redemption date. The Company had previously sought, but failed to obtain, the consent of its Issuance No. 443 bondholders for amendments to the related Bond Issuance Line of Debt Title on September 4, 2014 that would have allowed it to reduce its equity participation in CAT to as low as 45% of said equity, which was necessary for the Company to consummate the transactions contemplated in the Joint Venture Framework Agreement.
On November 13, 2014 the Company entered into the Bridge Loan agreement for a total amount of U.S.$400 million with BNS and HSBC Bank USA, N.A. A total amount of U.S.$400 million was drawn on November 17, 2014 under the Bridge Loan, which amount was used by the Company to prepay all the Issuance No. 443 bonds. Such prepayment took place and was completed on November 19, 2014. The redemption of the Issuance No. 443 bonds was expected to pave the way, pending regulatory approval, for the full implementation of the Joint Venture Framework Agreement.
On February 12, 2015, the Company successfully accessed the international debt capital markets and issued U.S.$1,000 million of debt securities in a two-tranche offering in an effort to refinance certain outstanding liabilities including the repayment of the Bridge Loan. This refinancing is expected to allow the Company to proceed with its organic expansion program for 2015 through 2018.
Credit facilities (Banks loans and bonds)
At December 31, 2014, our principal bank credit facilities and bonds (including interest) consisted of the following:
| | | | | | | | | | | | |
| | | As of December 31, 2014 | |
| Banks: | | Currency | | Amount Outstanding (in U.S.$) | | | Maturity Date | | Amount Outstanding (in Ch$ Th) | |
Chile | | | | | | | | | | | | |
BANCO BICE | | CLP | | | 31,751,935 | | | 09-16-2016 | | | 19,265,487 | |
BANCO DE CHILE | | CLP | | | 80,756,891 | | | 10-12-2015 | | | 48,999,244 | |
BANCO DE CHILE | | CLP | | | 34,571,694 | | | 12-30-2015 | | | 20,976,375 | |
BANCO ESTADO | | CLP | | | 131,213,487 | | | 06-28-2019 | | | 79,613,783 | |
BBVA CHILE | | CLP | | | 116,984,565 | | | 09-07-2017 | | | 70,980,385 | |
BBVA CHILE | | CLP | | | 58,538,897 | | | 02-02-2021 | | | 35,518,476 | |
BBVA CHILE | | CLP | | | 6,641,044 | | | N/A * | | | 4,029,453 | |
BCI | | CLP | | | 20,824,947 | | | 10-13-2015 | | | 12,635,537 | |
Bonos | | CLP | | | 89,606,613 | | | 06-01-2031 | | | 54,368,812 | |
HSBC | | USD | | | 400,052,787 | | | 02-18-2015 | | | 242,732,029 | |
126
| | | | | | | | | | | | |
MIZUHO BANK | | USD | | | 50,223,639 | | | 03-27-2019 | | | 30,473,193 | |
RABOBANK | | USD | | | 45,415,219 | | | 10-04-2018 | | | 27,555,684 | |
RABOBANK | | USD | | | 50,257,387 | | | 03-26-2020 | | | 30,493,670 | |
SANTANDER CHILE | | CLP | | | 55,038,700 | | | 09-02-2016 | | | 33,394,731 | |
SANTANDER CHILE | | CLP | | | 83,819,968 | | | 03-29-2019 | | | 50,857,766 | |
SCOTIABANK | | USD | | | 100,359,536 | | | 10-23-2017 | | | 60,893,148 | |
SCOTIABANK CHIL | | CLP | | | 99,013,282 | | | 01-09-2015 | | | 60,076,309 | |
SUMITOMO | | USD | | | 50,212,415 | | | 04-01-2019 | | | 30,466,383 | |
| | | | | | | | | | | | |
Total Chile | | | | | 1,505,283,006 | | | | | | 913,330,464 | |
| | | | | | | | | | | | |
| | | | |
Peru | | | | | | | | | | | | |
BANK TOKYO NY | | USD | | | 35,005,551 | | | 03-28-2017 | | | 21,239,618 | |
BBVA CONTINENT | | PEN | | | 29,566,456 | | | 04-04-2017 | | | 17,939,447 | |
BBVA CONTINENT | | USD | | | 17,291,833 | | | 09-04-2017 | | | 10,491,820 | |
BBVA CONTINENT | | USD | | | 17,291,833 | | | 09-04-2017 | | | 10,491,820 | |
BBVA NY | | USD | | | 9,901,940 | | | 11-16-2015 | | | 6,008,002 | |
BBVA NY | | USD | | | 5,941,164 | | | 11-16-2015 | | | 3,604,801 | |
BCP | | PEN | | | 23,623,020 | | | 01-07-2019 | | | 14,333,267 | |
BCP | | PEN | | | 7,545,087 | | | 03-19-2018 | | | 4,577,982 | |
BIF LEASING | | PEN | | | 125,915 | | | 03-02-2015 | | | 76,399 | |
BIF LEASING | | PEN | | | 291,068 | | | 06-02-2015 | | | 176,606 | |
BIF LEASING | | PEN | | | 249,372 | | | 12-02-2015 | | | 151,306 | |
SCOTIABANK | | PEN | | | 14,056,178 | | | 12-27-2017 | | | 8,528,586 | |
| | | | | | | | | | | | |
Total Peru | | | | | 160,889,417 | | | | | | 97,619,654 | |
| | | | | | | | | | | | |
| | | | |
Brazil | | | | | | | | | | | | |
BANCO DO BRASIL | | BRL | | | 16,075,132 | | | 06-04-2015 | | | 9,753,586 | |
BANCO NORDESTE | | BRL | | | 2,363,515 | | | 12-16-2018 | | | 1,434,063 | |
BRADESCO | | BRL | | | 75,627,150 | | | 03-30-2015 | | | 45,886,773 | |
BRADESCO | | BRL | | | 2,839,780 | | | 02-23-2015 | | | 1,723,037 | |
BRADESCO | | BRL | | | 4,543,648 | | | 02-23-2015 | | | 2,756,858 | |
BRADESCO | | BRL | | | 4,922,285 | | | 02-23-2015 | | | 2,986,596 | |
BRADESCO | | BRL | | | 27,712,771 | | | 02-13-2017 | | | 16,814,724 | |
BRADESCO | | BRL | | | 3,958,968 | | | 02-13-2017 | | | 2,402,104 | |
BRADESCO | | BRL | | | 19,794,837 | | | 02-13-2017 | | | 12,010,517 | |
BRADESCO | | BRL | | | 7,719,986 | | | 02-13-2017 | | | 4,684,102 | |
BRADESCO | | BRL | | | 3,167,173 | | | 02-13-2017 | | | 1,921,682 | |
BRADESCO | | BRL | | | 1,781,536 | | | 02-13-2017 | | | 1,080,947 | |
BRADESCO | | BRL | | | 1,741,945 | | | 02-13-2017 | | | 1,056,925 | |
BRADESCO | | BRL | | | — | | | 01-12-2015 | | | — | |
HSBC BRASIL | | BRL | | | 5,764,524 | | | 02-10-2017 | | | 3,497,625 | |
HSBC BRASIL | | BRL | | | 5,764,524 | | | 02-10-2017 | | | 3,497,625 | |
HSBC BRASIL | | BRL | | | 8,838,936 | | | 02-10-2017 | | | 5,363,024 | |
HSBC BRASIL | | BRL | | | 6,533,127 | | | 02-10-2017 | | | 3,963,975 | |
HSBC BRASIL | | BRL | | | 1,037,615 | | | 02-10-2017 | | | 629,573 | |
HSBC BRASIL | | BRL | | | 960,753 | | | 02-10-2017 | | | 582,937 | |
HSBC BRASIL | | BRL | | | 807,033 | | | 02-10-2017 | | | 489,667 | |
HSBC BRASIL | | BRL | | | 1,268,195 | | | 02-10-2017 | | | 769,477 | |
HSBC BRASIL | | BRL | | | 17,293,571 | | | 02-10-2017 | | | 10,492,874 | |
HSBC BRASIL | | BRL | | | 38,430,157 | | | 02-10-2017 | | | 23,317,498 | |
HSBC BRASIL | | BRL | | | 11,905,492 | | | N/A * | | | 7,223,657 | |
HSBC BRASIL | | BRL | | | 4,617,431 | | | N/A * | | | 2,801,626 | |
SAFRA | | BRL | | | 18,978,137 | | | 03-02-2015 | | | 11,514,985 | |
SAFRA | | BRL | | | 26,532,824 | | | 03-02-2015 | | | 16,098,791 | |
SANTANDER BR | | BRL | | | 18,933,845 | | | 02-23-2015 | | | 11,488,110 | |
SANTANDER BR | | BRL | | | 26,483,155 | | | 02-23-2015 | | | 16,068,654 | |
SANTANDER BR | | BRL | | | 18,916,540 | | | 02-23-2015 | | | 11,477,611 | |
| | | | | | | | | | | | |
Total Brazil | | | | | 385,314,585 | | | | | | 233,789,624 | |
| | | | | | | | | | | | |
| | | | |
Argentina | | | | | | | | | | | | |
BANCO CIUDAD AR | | ARS | | | 5,817,655 | | | N/A * | | | 3,529,862 | |
BANCO GALICIA | | ARS | | | 802,733 | | | 11-16-2015 | | | 487,058 | |
BANCO GALICIA | | ARS | | | 1,088,282 | | | 10-05-2015 | | | 660,315 | |
BANCO GALICIA | | ARS | | | 2,990,484 | | | N/A * | | | 1,814,476 | |
BANCO GALICIA | | ARS | | | 16,789 | | | N/A * | | | 10,187 | |
BANCO ITAU AR | | ARS | | | 23,602,269 | | | N/A * | | | 14,320,677 | |
BAPRO | | ARS | | | 1,471,046 | | | N/A * | | | 892,557 | |
BBVA FRANCES | | ARS | | | 185,925 | | | N/A * | | | 112,810 | |
ICBC ARGENTINA | | ARS | | | 802,733 | | | 11-16-2015 | | | 487,058 | |
IFC | | USD | | | 15,493,031 | | | 08-16-2016 | | | 9,400,397 | |
| | | | | | | | | | | | |
Total Argentina | | | | | 52,270,947 | | | | | | 31,715,397 | |
| | | | | | | | | | | | |
127
| | | | | | | | | | | | |
Colombia | | | | | | | | | | | | |
BANCO DE BOGOTA | | COP | | | 1,674,910 | | | 02-12-2015 | | | 1,016,252 | |
BANCO DE BOGOTA | | COP | | | 3,011,679 | | | 02-20-2017 | | | 1,827,336 | |
BANCO DE BOGOTA | | COP | | | 33,417,918 | | | 02-25-2019 | | | 20,276,322 | |
BANCO DE BOGOTA | | COP | | | 21,950,829 | | | 02-25-2019 | | | 13,318,665 | |
BANCO DE BOGOTA | | COP | | | 6,015,485 | | | 03-04-2019 | | | 3,649,896 | |
BANCO DE BOGOTA | | COP | | | 44,248,758 | | | 03-04-2019 | | | 26,847,934 | |
BANCO POPULAR | | COP | | | 19,467,824 | | | 03-06-2017 | | | 11,812,102 | |
BBVA COLOMBIA | | COP | | | 28,848,212 | | | 02-28-2019 | | | 17,503,653 | |
COLPATRIA | | COP | | | 929,873 | | | N/A * | | | 564,200 | |
CORPBANCA COL | | COP | | | 16,270,536 | | | 12-30-2015 | | | 9,872,148 | |
CORPBANCA COL | | COP | | | 7,357,860 | | | N/A * | | | 4,464,382 | |
DAVIVIENDA | | COP | | | 1,757,653 | | | N/A * | | | 1,066,456 | |
| | | | | | | | | | | | |
Total Colombia | | | | | 184,951,537 | | | | | | 112,219,345 | |
| | | | | | | | | | | | |
| | | | |
Bonds: | | | | | | | | | | | | |
Bonos | | CLF | | | 10,195,980 | | | 05-28-2015 | | | 6,186,411 | |
Bonos | | PEN | | | 44,750,819 | | | 08-12-2017 | | | 27,152,559 | |
Bonos | | PEN | | | 94,676,661 | | | 05-05-2018 | | | 57,445,064 | |
Bonos | | CLF | | | 81,688,451 | | | 05-07-2018 | | | 49,564,468 | |
Bonos | | USD | | | 768,447,917 | | | 01-20-2021 | | | 466,255,774 | |
Bonos | | USD | | | 1,226,162,500 | | | 01-20-2023 | | | 743,974,097 | |
Bonos | | CLF | | | 84,637,587 | | | 09-01-2026 | | | 51,353,856 | |
Bonos | | CLF | | | 183,933,682 | | | 05-07-2028 | | | 111,601,762 | |
Bonos | | CLF | | | 123,344,745 | | | 10-15-2029 | | | 74,839,424 | |
Bonos | | CLF | | | 183,626,065 | | | 05-28-2030 | | | 111,415,115 | |
| | | | | | | | | | | | |
Total Bonds | | | | | 2,801,464,407 | | | | | | 1,699,788,529 | |
| | | | | | | | | | | | |
| * | Non-committed overdraft credit facilities with no set maturity. |
In addition, at December 31, 2014, we had Ch$23,110 million in financial leasings.
At December 31, 2014 we had over Ch$ 352,869 million in uncommitted lines of credit with the regional banks that we work with. We deal with a wide diversity of banks around the world. We believe, if necessary, we can reopen our existing international bonds or issue one or more new series of bonds as appropriate, or can obtain commercial paper in the Chilean market.
Our loan agreements and outstanding bonds contain a number of covenants requiring us to comply with certain financial ratios and other tests. The most restrictive financial covenants under these loan agreements and bonds require us to maintain:
| | • | | a ratio of consolidated Net Financial Debt to consolidated net worth not exceeding 1.2 to 1; |
| | • | | a ratio of consolidated Net Financial Debt to EBITDA (as defined in the relevant credit agreements) for the most recent four consecutive fiscal quarters for such period of less than 5.25 to 1; |
| | • | | unencumbered assets in an amount equal to at least 120% of the outstanding principal amount of total liabilities; |
| | • | | minimum consolidated assets of at least UF 50.5 million; and |
| | • | | minimum consolidated net worth of at least UF 28.0 million. |
As of the date of this annual report, we are in compliance with all of our loan and debt instruments.
Leases
We have significant operating lease obligations. At December 31, 2014, 44% of our total selling space was located on leased properties. Our store leases typically have a term ranging from 10 to 32 years and provide for both monthly fixed and variable lease payments. Our shopping center leases typically have terms of more than 30 years and provide for fixed monthly rent payments.
Acquisitions
On January 2, 2012, we acquired 100% of the capital stock of Prezunic. In order to finance our acquisition of Prezunic, on January 2, 2012 we entered into a Ch$127.73 billion short-term facility with Banco Santander Chile, as lender, bearing interest at an annual rate of the TAB plus 0.4% with a maturity date of December 28, 2012, which we repaid with proceeds of our SEC-registered public offering.
128
On October 18, 2012, Cencosud S.A. signed the Stock Purchase Agreement with the Seller in respect of the purchase of 100% of the capital stock of Carrefour’s operations in Colombia, for a total purchase price equal to €2 billion subject to adjustments pursuant to the Stock Purchase Agreement. The acquired companies operated supermarkets under the “Carrefour” and “Maxi” brand names in Colombia. See “Item 4. Information on the Company—A. History and Development of the Company—History—Acquisition of Carrefour’s Operations in Colombia.” In order to finance the purchase of the acquisition of Carrefour’s operations in Colombia, on October 17, 2012, the Company entered into the Bridge Loan Agreement with a syndicate of banks in the amount of U.S.$2,500 million, which we repaid with proceeds of our 2023 144A/Reg-S Bond and with the 2013 follow on capital Increase.
No acquisitions were completed during the 2013 and 2014 fiscal periods.
Analysis of cash flows
The following table summarizes our generation and use of cash for the periods presented for continuing operations.
| | | | | | | | | | | | |
| | | Year ended December 31, | |
| | | 2014 | | | 2013 | | | 2012 | |
| | | (in millions of Ch$) | |
Net cash from operating activities | | | 375,656 | | | | 302,066 | | | | 668,273 | |
Net cash used in investing activities | | | (235,392 | ) | | | (309,367 | ) | | | (1,876,091 | ) |
Net cash (used in) from financing activities | | | (31,798 | ) | | | (115,918 | ) | | | 1,255,427 | |
Cash flows for year ended December 31, 2014 compared to year ended December 31, 2013 for continuing operations.
Taking into account our cash flows from operations, cash flows from financing activities and cash used in investing activities, we had a net cash inflow of Ch$108,466 million for the year ended December 31, 2014 compared to a net cash outflow of Ch$123,219 million for the year ended December 31, 2013.
Operating activities. Our net cash flows from operations increased to Ch$375,656 million for the year ended December 31, 2014 from Ch$302,066 million for the year ended December 31, 2013. The increase was primarily attributable to our supermarket division, where cash flows increased to Ch$352,955 million from Ch$297,980 million as a result of a higher contribution from Chile, Peru and Colombia, partially offset by a lower contribution from Argentina and Brazil. All other divisions also saw improvement in their cash flows from operations with cash flows from home improvement operations improving to Ch$ (7,610) million for the year ended December 31, 2014 from Ch$ (11,153) million for the year ended December 31, 2013. Net cash flow from department store operations increased to Ch$ 31,121 million for the year ended December 31, 2014 from Ch$ 23,490 million for the year ended December 31, 2013 as a result of better inventory management. Net cash flow from shopping center operations increased to Ch$ 124,890 million for the year ended December 31, 2014 from Ch$ 116,801 million for the year ended December 31, 2013 as a result of greater EBITDA contribution from Chile, Colombia and Peru. Net cash flow from financial service operations increased to Ch$ 31,803 million for the year ended December 31, 2014 from Ch$ (1,250) million for the year ended December 31, 2013 due to a 47.3% and a 13.3% portfolio growth in Argentina and Peru, respectively.
Investing activities. Net cash flow from investing activities amounted to Ch$ (235,392) million for the year ended in December 31, 2014 from Ch$ (309,367) million for the year ended December 31, 2013. This change was mainly due to net cash flow from supermarket investing activities amounting to Ch$ (154,641) million for the year ended December 31, 2014 from Ch$ (250,967) million for the year ended December 31, 2013. 80% of the variation is explained by lower investment in Property, Plant and Equipment driven by lower investments in Brazil and Chile, partially offset by higher investments in Argentina, Colombia and Peru. Net cash flow from home improvement investing activities amounted to Ch$ (22,076) million for the year ended December 31, 2014 from Ch$ (27,988) million for the year ended December 30, 2013. The variation was primarily due to lower organic growth in the region during 2014 compared to 2013. Net cash flow from department store investing activities amounted to Ch$ (15,108) million for the year ended December 31, 2014 from Ch$ (14,195) million for the year ended December 31, 2013. The variation was primarily because of higher investments in Properties, Plant and Equipment for the net opening of 2 stores in Chile and 3 stores in Peru compared to December 2013. Net cash flow from shopping center investing activities amounted to Ch$ (33,155) million for the year ended December 31, 2014 from Ch$ (56,305) million for the year ended December 31, 2013. The variation was primarily due to lower investments for Costanera Center and the remodeling of our shopping centers. Net cash flow from financial services investing activities amounted to Ch$ (253) million for the year ended December 31, 2014 from Ch$ (86) million for the year ended December 31, 2013, due to less cash invested in the other retail businesses and in mutual funds.
Financing activities. Net cash flows from financing activities amounted to Ch$ (31,798) million for the year ended December 31, 2014 from Ch$ (115,918) million, for the year ended December 31, 2013. This change was primarily due to net cash flows from supermarket financing activities amounting to Ch$ (177,846) million for the year ended December 31, 2014 from Ch$ (78,033)
129
million for the year ended December 31, 2013. The variation was related to lower inflows from loans as a consequence of reduced capex and higher outflows for the payment of loans due to the refinancing of debt to improve liquidity. Net cash flows from home improvement financing activities decreased to Ch$ 33,326 million for the year ended December 31, 2014 from Ch$ 34,736 million for the year ended December 31, 2013 due to lower financing need of working capital. Net cash flows from department store financing activities amounted to Ch$ (2,624) million for the year ended December 31, 2014 from Ch$ (24,551) million for the year ended December 31, 2013. This was due to Paris growth in Peru during 2013. Net cash flows from shopping center financing activities amounted to Ch$ (89,306) million for the year ended December 31, 2014 from Ch$ (63,008) million for the year ended December 31, 2013 due to higher needs of capital investments for maintenance. Net cash flows from financial service financing activities increased to Ch$ 32,862 million for the year ended December 31, 2014 from Ch$ (68,830) million for the year ended December 31, 2013 due to lower financing needs for portfolio growth.
Cash flows for year ended December 31, 2013 compared to year ended December 31, 2012 for continuing operations
Taking into account our cash flows from operations, cash flows from financing activities and cash used in investing activities, we had a net cash outflow of Ch$123,219 million for the year ended December 31, 2013 compared to a net cash inflow of Ch$47,608 million for the year ended December 31, 2012.
Operating activities. Our net cash flows from operations decreased 55% to Ch$302,066 million for the year ended December 31, 2013 from Ch$668,273 million for the year ended December 31, 2012. The decrease was primarily attributable to our supermarket segment, where cash fell 42% as a result of increased working capital needs particularly from Colombia and Peru. Inventory in Colombia increased by Ch$25,893 million while Peru posted an increase in accounts receivables of Ch$37,332 million and an inventory increase of Ch$31,035 million. Our home improvement segment had a Ch$71,052 million decrease in cash flows as a result of larger tax expenses in Argentina when compared to the 2012 period. Our Department store segment had a decrease in cash flows of Ch$14,310 million as a result of larger inventories in Chile and the startup of our Peruvian operations.
Investing activities. Our net cash outflows from investing activities decreased 84% to Ch$309,367 million for the year ended December 31, 2013 from Ch$1,876,091 million for the year ended December 31, 2012 due to the higher comparison basis for the 2012 period as a result of the inorganic expansion of the supermarket business into Colombia in addition to organic expansion that the company experienced throughout its markets in 2012 due to the opening of 117 stores and 3 shopping centers in 2012 versus the opening of 46 stores in 2013. During 2012, the company invested Ch$1,535,105 million for the purchase of subsidiaries and to obtain control of other companies such as our supermarket operations in Colombia for Ch$1,179,000 million, the initial payment for Johnson of Ch$243,000 million and Prezunic of Ch$102,000 million. Additionally, the company made investments in property, plants and equipment, mainly in Chile, of Ch$268,000 million for our shopping centers, supermarkets and home improvement segments. In Brazil we made investments in property, plants and equipment of Ch$96,000 million and in Argentina of Ch$88,000 million.
Financing activities. Our net cash flows from financing activities decreased 109%, to outflows of Ch$115,918 million for the year ended December 31, 2013 compared to inflows of Ch$1,255,427 million for the year ended December 31, 2012. This was due to higher financial expense resulting from the inorganic expansion of our supermarket business into Colombia. During 2012, the company received inflows in the amount of Ch$632,987 million resulting from a capital increase. During 2013, the company performed an additional capital increase for Ch$818,871 million. The company had interest payments and principal amortizations of Ch$1,181,329 million in 2013 over the amount paid during 2012. Additionally the company had financing inflows of Ch$573,866 million less than the amount raised during the 2012 period. During 2012, the company secured the Bridge Loan Facility with JP Morgan Chase to finance the acquisition of supermarket operations in Colombia in combination with raising US$1,200 million in a 144A/Reg S bond issuance.
Analysis of cash flows for discontinued operations
The following table summarized our generation and use of cash for the periods presented for discontinued operations.
| | | | | | | | | | | | |
| | | Year ended December 31, | |
| | | 2014 | | | 2013 | | | 2012 | |
| | | (in millions of Ch$) | |
Net cash from operating activities | | | 14,583 | | | | 62,717 | | | | 50,441 | |
Net cash from/(used in) investing activities | | | 1,996 | | | | (11,140 | ) | | | 2,523 | |
Net cash from/(used in) financing activities | | | (80,580 | ) | | | 8,888 | | | | 9,349 | |
130
Cash flows for year ended December 31, 2014 compared to year ended December 31, 2013 from discontinued operations
Taking into account our cash flows from operations, cash flows from financing activities and cash used in investing activities, we had a net cash outflow of Ch$64,001 million for the year ended December 31, 2014 compared to a net cash inflow of Ch$60,465 million for the year ended December 31, 2013.
Operating activities. Our net cash flows from operations decreased 77% to Ch$14,583 million for the year ended December 31, 2014 from Ch$62,717 million for the year ended December 31, 2013. The increase was primarily attributable to improved business performance.
Investing activities. Our net cash flows from investing activities increased to inflows of Ch$1,996 million for the year ended December 31, 2014 from outlfows of Ch$11,141 million for the year ended December 31, 2013. The decrease was primarily attributable to higher portfolio growth financed by the holding company.
Financing activities. Our net cash flows from financing activities increased to outflows of Ch$80,580 million for the year ended December 31, 2014 from outflows of Ch$8,888 million for the year ended December 31, 2013. The decrease was primarily attributable to lower portfolio growth at Banco Paris.
Cash flows for year ended December 31, 2013 compared to year ended December 31, 2012 from discontinued operations
Taking into account our cash flows from operations, cash flows from financing activities and cash used in investing activities, we had a net cash inflow of Ch$60,465 million for the year ended December 31, 2013 compared to a net cash inflow of Ch$62,313 million for the year ended December 31, 2012.
Operating activities. Our net cash flows from operations increased 24% to Ch$62,717 million for the year ended December 31, 2013 from Ch$50,441 million for the year ended December 31, 2012. The increase was primarily attributable to improved business performance.
Investing activities. Our net cash flows from investing activities decreased to outflows of Ch$11,140 million for the year ended December 31, 2013 from inflows of Ch$2,523 million for the year ended December 31, 2012. The decrease was primarily attributable to higher portfolio growth financed by the holding company.
Financing activities. Our net cash flows from financing activities increased to inflows of Ch$8,888 million for the year ended December 31, 2013 from outflows of Ch$9,349 million for the year ended December 31, 2012. The decrease was primarily attributable to lower portfolio growth at Banco Paris.
Capital expenditures and permanent investments
The following table presents our capital expenditures for the periods indicated:
| | | | | | | | | | | | |
| | | Years ended December 31, | |
| | | 2014 | | | 2013 | | | 2012 | |
| | | (in millions of Ch$) | |
Capital expenditures(1) | | | (227,433 | ) | | | (317,710 | ) | | | (573,650 | ) |
Permanent investments(2) | | | — | | | | — | | | | (1,535,105 | ) |
Total | | | (227,433 | ) | | | (317,710 | ) | | | (2,108,755 | ) |
| | | | | | | | | | | | |
| (1) | Purchase of property, plant and equipment. |
| (2) | Primarily investments in acquired companies. See “—A. Trends and Factors Affecting Our Results of Operations—Impact of Acquisitions” above for additional details regarding our acquisition activities in recent years. |
Our total capital expenditures were approximately Ch$227,433 million, Ch$317,710 million and Ch$573,650 million in 2014, 2013 and 2012, respectively. In each of these years, our capital expenditures were made primarily to develop and expand our stores and shopping centers. In addition to our capital expenditures, we invested in permanent investments Ch$1,535,105 million in 2012. In 2014 and 2013 we had no permanent investments as there were no acquisitions made in the period. In the past, permanent investments were primarily related to acquisitions.
131
In 2014, we invested approximately Ch$227,433 million to open new supermarkets, department stores, home improvement stores and shopping centers. In Chile, we opened 14 new stores in our supermarket division adding 21,637 square meters of selling space, we added one new store in our home improvement division with an additional 5,648 square meters of selling space, and we added 2 stores in our department stores division with an additional 3,695 square meters of selling space. In Argentina, we opened 2 home improvement stores that added selling space for 10,297 square meters. In Brazil, we had a net closing of 2 stores but expanded selling space by 5,448 square meters. In Peru, we had no net openings in our supermarkets division but expanded selling space by 2,340 square meters and we opened 3 new department stores that added selling space of 13,025 square meters. In Colombia, we opened one Easy store that added selling space of 6,587. In addition, Maintenance expenditures for existing stores are estimated to have been at U.S.$75 million in 2014. In our shopping centers division we had investments that added GLA in excess of 20,635 square meters in Chile, 40,105 square meters in Argentina and 12,803 square meters in Peru, totaling 73,543 square meters.
During 2013, our organic expansion included the opening of 46 new stores and the addition of 5 new shopping centers. This represented selling space growth of 788,212 square meters. Our supermarket division saw the opening of 34 new stores with focus on Brazil with the opening of 17 new stores, or 43,982 square meters of selling space, followed by Chile with 10 new stores, a selling space expansion of 21,559 square meters. Our home improvement division opened 7 new stores, with most of our growth coming from Colombia where we opened 5 stores adding 38,665 square meters of selling space. Lastly, as a greenfield project, our department store division opened 6 new stores in Peru to take the division to the Peruvian market, resulting in a selling space of 32,222 square meters. Our shopping center division opened 5 new shopping centers with Chile leading the way with one new neighborhood mall and a new powercenter, adding 2,301 square meters. Peru followed with the opening of a neighborhood mall that added 17,085 square meters of gross leasable area. Finally, Colombia added two new local shopping centers that added 14,514 square meters of gross leasable area. See “—A. Trends and Factors Affecting Our Results of Operations—Impact of Acquisitions” above for additional details regarding our acquisition activities in recent years.
In 2015, we expect to invest U.S.$545 million. This entails planned capex of U.S.$230 million for new stores and shopping center investments, U.S.$100 million on IT and related systems, U.S.$15 million on additional nonretail development of the Costanera Center for the hotel and for traffic mitigation works, U.S.$100 million for maintenance and U.S.$100 for remodeling of existing stores.
Our projected capital expenditures may vary substantially from the numbers set forth above as a result of a variety of factors including competition and the cost, currencies and availability of the necessary funds.
We expect to finance our future capital expenditures with our operating cash flow and with bank loans.
C. RESEARCH AND DEVELOPMENT, PATENTS AND LICENSES, ETC.
We have not had significant research and development activities for the past three years. See “Item 4. Information on the Company—B. Business Overview—Our Company—Intellectual Property” for a brief discussion of our trade names and service marks.
D. TREND INFORMATION
See “—A. Operating Results—Trends and Factors Affecting Our Results of Operations.”
E. OFF-BALANCE SHEET ARRANGEMENTS
For any of the periods presented, we did not have any off-balance sheet transactions, arrangements or obligations with unconsolidated entities or otherwise that are reasonably likely to have a material effect on our financial condition, results of operations or liquidity.
132
F. TABULAR DISCLOSURE OF CONTRACTUAL OBLIGATIONS
The following table summarizes our significant contractual obligations and commitments as of December 31, 2014:
| | | | | | | | | | | | | | | | | | | | |
| | | Less than
One Year | | | One to Three
Years | | | Three to Five
Years | | | Thereafter | | | Total | |
| | | (in millions of U.S.$) | |
Long-term debt obligations (1) | | | 0 | | | | 545,627 | | | | 322,214 | | | | 2,049,265 | | | | 2,917,106 | |
Short-term debt obligations (1) | | | 595,179 | | | | 0 | | | | 0 | | | | 0 | | | | 595,179 | |
Time deposits and other Bank Balances | | | 155,728 | | | | 56,120 | | | | 2,009 | | | | 11,139 | | | | 224,996 | |
Leases obligations and other financial liabilities (1) | | | 204,878 | | | | 533,091 | | | | 6,874 | | | | 1,347,201 | | | | 2,092,044 | |
Commercial loans | | | 2,006,359 | | | | 74,430 | | | | 0 | | | | — | | | | 2,080,788 | |
Tax Liabilities | | | 63,131 | | | | 0 | | | | 0 | | | | 0 | | | | 63,131 | |
| | | | | | | | | | | | | | | | | | | | |
Total | | | 3,025,275 | | | | 1,209,268 | | | | 331,096 | | | | 3,407,606 | | | | 7,973,245 | |
| | | | | | | | | | | | | | | | | | | | |
| (1) | Short-term obligations include the short-term portion of the long-term debt and accrued interest expenses (the latest variable rate is considered to calculate the accrued interest expenses; local rates such as TAB (tasa camara) are set at the end of the period). |
G. SAFE HARBOR
See section entitled “Forward-Looking Statements” in this annual report for forward-looking statement safe harbor provisions.
Item 6. Directors, Senior Management and Employees
A. DIRECTORS AND SENIOR MANAGEMENT
Board of Directors
The following table sets forth information for our directors as of the date of this annual report:
| | | | | | | | | | | | |
Name | | Position | | | Age | | | Years at Cencosud(1) | |
Horst Paulmann Kemna(2) | | | Chairman of the Board | | | | 80 | | | | 50 | |
Heike Paulmann Koepfer(2) | | | Director | | | | 45 | | | | 15 | |
Peter Paulmann Koepfer(2) | | | Director | | | | 46 | | | | 20 | |
Richard Büchi Buc | | | Director | | | | 62 | | | | 2 | |
Cristián Eyzaguirre | | | Director | | | | 66 | | | | 10 | |
David Gallagher | | | Director | | | | 70 | | | | 4 | |
Julio Moura | | | Director | | | | 63 | | | | 3 | |
Roberto Philipps | | | Director | | | | 68 | | | | 13 | |
Erasmo Wong | | | Director | | | | 71 | | | | 6 | |
| (1) | Including years in other positions at Cencosud. |
| (2) | Horst Paulmann Kemna is the father of Heike Paulmann Koepfer and Peter Paulmann Koepfer. |
A description of the main tasks currently performed by each director as well as a description of each director’s employment history and education follows:
Horst Paulmann Kemna. Mr. Paulmann is our Chairman of the Board and founder of Cencosud S.A. He has served on our Board since November 1978. He has served as a Director of the Chilean—German Chamber of Commerce (CAMCHAL) and the Chilean Chamber of Commerce.
Heike Paulmann Koepfer. Mrs. Paulmann has been a member of our Board of Directors since April 1999. She has a degree in business from theUniversidad de Chile and an MBA fromUniversidad Adolfo Ibañez.
Peter Paulmann Koepfer. Mr. Paulmann has been a member of our Board of Directors since September 1996. Mr. Paulmann currently is the Chief Executive Officer for Importadora y Comercial Regen Ltda. and has also served as Director of our shopping center division in Chile since 2002. He has a degree in business from thePontificia Universidad Católica de Chile.
Richard Büchi Buc.Mr. Büchi was elected an independent member of the board in April, 2013. He holds a civil engineering degree fromUniversidad de Chile and an MBA from the Wharton School of Business from the University of Pennsylvania. On March 2013 he took over the executive vice-presidency of ENTEL’s mobile phone division after having acted as the company’s CEO for 18 years. Additionally, Mr. Büchi was chairman of the board of Entel PCS and Entelphone.
133
Cristián Eyzaguirre.Mr. Eyzaguirre has been a member of our Board of Directors since 2005. He has an economics degree from Universidad de Chile and a Master of Arts in Economics from The University of California, Berkeley. Mr. Eyzaguirre is the former Chief Executive Officer of Banco Bice and Chief Financial Officer of Empresas CMPC S.A., and was a professor of Economics at the Universidad de Chile. He is currently a Director of Besalco, E-CL, Agunsa, Grupo GTD Teleductos, Teléfonica del Sur, IPAL, Banco París, Banco Cencosud (Perú) and Wenco. He also is Vice chairman of the advisory committee for the Chilean sovereign investment fund.
David Gallagher. Mr. Gallagher has been a member of the Board of Directors since April 2011. He has an MA in Modern Languages from Oxford University. He is Chairman and Founding Partner of ASSET Chile S.A, and is a director and Executive Committee member of theCentro de Estudios Publicos. Prior to founding ASSET Chile in 1984, Mr. Gallagher spent 10 years at Morgan Grenfell, where he became head of Latin American investment banking and director of Morgan Grenfell International.
Julio Moura. Mr. Moura has been a member of our Board of Directors since September 2011. Mr. Moura also serves as a director of Natura Cosméticos, Adecoagro and Brinox and as Chairman of Instituto Arapyaú. Prior to joining Cencosud, Mr. Moura served as Chairman of Masisa from 2002 to 2007 and as Executive Vice President of Schindler Group, Switzerland, from 1992 to 1997. Mr. Moura holds a Master’s Degree from MIT’s Sloan School of Management and an Engineering Degree from the Swiss Federal Institute of Technology (ETH).
Roberto Philipps. Mr. Philipps has been a member of our Board of Directors since 2003. He has held several executive positions with the Techint Organization and previously with Exxon Corporation. He is a former President of the Argentine Financial Executives Association and serves on the board of companies in Chile and Argentina. Mr. Philipps has a degree in business administration and accounting from theUniversidad de Buenos Aires and completed the Advanced Executive Program at the Kellogg School, Northwestern University.
Erasmo Wong. Mr. Wong has been a member of our Board of Directors since 2008. Mr. Wong has a civil engineering degree from the National University of Engineering in Peru and post graduate degrees from the High Management Program and the First Program for Presidents, both from the University of Piura. He has been President of GSI Association (Formerly EAN Peru) and is currently Vice-president of the Marketing Association of Peru and the Retail and Department Stores Association. Prior to joining Cencosud, Mr. Wong was the president for Supermercados Wong in Peru until 2008, when it was acquired by Cencosud.
Executive Officers
The following table shows certain information with respect to our senior management as of the date of this annual report:
| | | | | | | | | | |
Name | | Position | | Age | | | Years at Cencosud(1) | |
Jaime Soler(2) | | Chief Executive Officer | | | 42 | | | | 10 | |
Juan Manuel Parada | | Chief Financial Officer | | | 40 | | | | 8 | |
Carlos Mechetti | | General Counsel | | | 44 | | | | 20 | |
Stefan Krause | | Projects Managing Director | | | 59 | | | | 31 | |
Rodrigo Larrain | | Real Estate Managing Director | | | 42 | | | | 2 | |
Bronislao Jandzio | | Audit Managing Director | | | 59 | | | | 16 | |
Patricio Rivas | | Financial Retail Managing Director | | | 51 | | | | 12 | |
Marcelo Reyes | | Corporate Risk Managing Director | | | 47 | | | | 12 | |
Carlos Wulf | | Home Improvement Stores Managing Director | | | 61 | | | | 10 | |
Andrés Artigas | | Chief Information Officer | | | 48 | | | | 9 | |
Rodrigo Hetz | | Human Resources Managing Director | | | 39 | | | | 3 | |
Renato Fernandez | | Corporate Affairs Managing Director | | | 40 | | | | 3 | |
Ricardo Bennett | | Department Stores Managing Director | | | 39 | | | | 10 | |
| (1) | Including years in other positions at Cencosud. |
| (2) | Mr. Daniel Rodriguez resigned from this position effective December 31, 2014 to pursue other business ventures, and this position was subsequently filled by Mr. Jaime Soler. |
Jaime Soler. Mr. Soler was named Chief Executive Officer effective as of January 1, 2015. Previously he was appointed as our Corporate Retail Managing Director from February 2014. Prior to his appointment as head of that division, Mr. Soler had worked as our Department Stores Managing Director since 2008, and successfully commanded the turnaround process for our Johnson acquisition in Chile. He received his degree in Commercial Engineering from the Universidad de Chile and an MBA from The Kellogg School of Management.
134
Juan Manuel Parada. Mr. Parada has been our Chief Financial Officer since 2012. Between 2008 and 2012, he was General Manager of our supermarkets operations in Peru. Prior to 2008, Mr. Parada worked in various leadership roles in Cencosud. Mr. Parada has also served as Regional Manager for Airports at Lan Airlines and as a senior consultant at Accenture, based in Buenos Aires and London. Mr. Parada has a degree in Business Administration from Universidad Blas Pascal of Cordoba and an MBA from the MIT Sloan School of Management.
Carlos Mechetti. Mr. Mechetti has been our General Counsel since 1999. He graduated from Universidad del Museo Social Argentino in 1993 and joined us in 1994 as counsel to our shopping center division in Argentina. Mr. Mechetti has taken different post graduate courses at UBA, UADE, CEMA and Harvard University.
Stefan Krause. Has been Corporate Manager of Works and Projects since July 2013. He holds a degree in Business Engineering from the University of Concepción. He previously served as General Manager of Jumbo (1983-2003) for both Argentina and Chile and Jumbo Retail Argentina (2005 to 2009). Mr. Krause is also a member of the board of several subsidiaries of Cencosud in Argentina, Colombia and Chile.
Rodrigo Larrain. Mr. Larrain has been our Real Estate Managing Director since March 2013. He has a degree in civil engineering and an MBA from the University of Michigan, Ross School of Business and also completed the school´s General Management program. Prior to joining Cencosud he worked as Chief Financial and Investment officer at Enjoy S.A. Mr. Larrain also has over 10 years of work experience in corporate and investment banking at Citigroup and BBVA.
Bronislao Jandzio. Mr. Jandzio has been our Audit Managing Director since 1998. Before joining Cencosud, he was the Regional Chief for the Global Accounting Department for the Deutsche Bank Group in Frankfurt, Germany. Mr. Jandzio has a Banklehre diploma from the German Banking Academy.
Patricio Rivas. Mr. Rivas has been our Financial Retail Managing Director since 2011. Previously he served as our Corporate Risk Managing Director from 2010 to 2011. He graduated with a degree in Business Administration from the Pontificia Universidad Católica de Chile.
Marcelo Reyes. Mr. Reyes has been our Corporate Risk Managing Director since December 2011. He has previously served as Risk Director of Credit Card Business in Chile. He graduated with a degree in Business Administration from the Pontificia Universidad Católica de Valparaíso and earned an MBA degree from Tulane University, New Orleans, and from the Universidad de Chile.
Carlos Wulf. Mr. Wulf had been our Home Improvement Stores Managing Director since October 2008. He joined Cencosud in July 2004. He graduated as a Naval Engineer from the Academia Politécnica Naval in 1982. Mr. Wulf tendered his resignation effective as of March 31, 2015 to pursue personal ventures.
Andres Artigas. Mr. Artigas has been our Chief Information Officer since 2011. Prior to this he was our Information Officer for our operations in Chile and in 2005 for our Department Store business. Prior to joining Cencosud he had worked as IT Manager for Principal Financial Group in Chile, IT and Marketing for British American Tobacco in Chile as well. Mr. Artigas has a degree in industrial engineering with a major in Computer sciences and electronics from Pontificia Universidad Catolica de Chile.
Rodrigo Hetz. Mr. Hetz has been our Human Resources Director since April 2011. He has a degree in Industrial Engineering from Universidad de Chile and an MBA from the University of California—Berkeley. He also worked at McKinsey & Co. from 2006 to 2011, advising companies in different countries on strategy and organizational effectiveness. From 1999 to 2004, Mr. Hetz worked at Citibank in Human Resources management roles including Senior HR generalists, compensation & benefits, M&A/Integration, and organizational development positions.
Renato Fernandez. Mr. Fernandez has been our Corporate Affairs Manager since 2011 when he joined Cencosud. Prior to that, he served as Communications Director at Endesa Chile. He received his degree in Journalism from Universidad Gabriela Mistral.
Ricardo Bennett.Mr. Bennett was appointed as our Department Store Managing Director in February 2014. He joined Cencosud in 2008 as Department Store Business Development Manager. Mr. Bennett holds a degree in civil engineering and an MBA from ESADE, Barcelona, Spain. Prior to joining Cencosud Mr. Bennett was a buyer at Falabella.
135
B. COMPENSATION
Compensation of Directors and Executive Officers
For 2014, the aggregate amount of compensation we paid to executive officers was Ch$5,808 million. We do not disclose to our shareholders or otherwise make public information as to the compensation of any individual executive officers.
In accordance with Article 33 of Law N° 18,046 in Chile governing corporations, at the Ordinary Shareholders’ Meeting held on April 24, 2015, the following Director compensation amounts were set for the 2014 period:
| • | | Fees paid for attending Board meetings: payment of UF330 (equivalents to ThCh$8,127) each month for those holding the position of Director and twice this amount for the Chairman of the Board, provided they attend a minimum of 10 ordinary meetings each year. |
| • | | Fees paid for attending the Directors’ Committee meetings: payment to each Director of UF110 (equivalents to ThCh$2,709) for each meetings they attend. |
The details of the amounts paid to our directors for the years ended December 31, 2014, 2013 and 2012, are as follows:
| | | | | | | | | | | | | | |
| | | | | For the year ended December 31, | |
Name | | Role | | 2014 | | | 2013 | | | 2012 | |
| | | | | ThCh$ | | | ThCh$ | | | ThCh$ | |
Horst Paulmann Kemna | | Chairman | | | 184,487 | | | | 147,291 | | | | 104,146 | |
Heike Paulmann Koepfer | | Director | | | 92,243 | | | | 73,646 | | | | 57,292 | |
Peter Paulmann Koepfer | | Director | | | 92,243 | | | | 73,646 | | | | 52,072 | |
Cristián Eyzaguirre Johnston | | Director | | | 92,243 | | | | 79,771 | | | | 69,453 | |
Roberto Oscar Philipps | | Director | | | 122,991 | | | | 98,225 | | | | 69,453 | |
Sven von Appen Behmann | | Director | | | — | | | | 18,283 | | | | 52,072 | |
Erasmo Wong Lu Vega | | Director | | | 92,243 | | | | 73,646 | | | | 52,072 | |
David Gallagher Patrickson | | Director | | | 122,991 | | | | 98,225 | | | | 69,453 | |
Julio Moura | | Director | | | 92,243 | | | | 73,646 | | | | 52,072 | |
Richard Bûchi Buc | | Director | | | 122,991 | | | | 73,816 | | | | — | |
| | | | | | | | | | | | | | |
Total | | | | | 1,014,675 | | | | 810,195 | | | | 578,085 | |
| | | | | | | | | | | | | | |
None of our non-executive directors has a service contract with us that provides for benefits upon termination of employment.
Executive stock option plans
In order to reward commitment and with the goal of retaining executives, the board has approved the terms and conditions of three compensation plans titled “Plan 2015”, “Plan 2014” and “Plan Adicional” on September 26, 2015, March 22, 2013 and April 26, 2013, respectively.
The objective of our incentive plans is to motivate executive performance over the long term, thereby increasing the long-term value of the Company, as measured by the Company’s EBITDA. The multiple stock option plans are awarded in accordance with the EBITDA increase percentage actually achieved by each one of the divisions.
Executives can only exercise their options under the incentive plans if they are employed by the Company at the specific subscription dates under “Plan 2015”, “Plan 2014” and “Plan Adicional” or by any of its subsidiaries in Chile or abroad without any interruption in its employment relationship. In order to be eligible to receive a share payment no executive can be found in serious breach of its employment duties from the date of signing of the stock option contract until the exercise date. The determination of a serious breach is at the Company´s sole discretion.
As ratified, the incentive plans include 349 company executives as of December 31, 2014, segregating them according to management level and position within the company, and make available a total of 32 million shares for awards. The shares being made available under these incentive plans reflect shares that were reserved for this specific purpose and were issued in capital increases approved by Cencosud SA shareholders during extraordinary shareholder meetings held on April 29, 2011 and November 20, 2012.
The “Plan 2015” grants each executive the right to subscribe shares in four installments, with 25% of their total subscription rights entitlements available each year from 2015 to 2018. “Plan 2015” grants executives the right to subscribe shares at a set price of Ch$1,646 throughout the entire duration of the incentive plan as long as the required employment conditions are fulfilled within the period.
136
The “Plan 2014” grants each executive the right to subscribe shares in four installments, with 25% of their total subscription rights entitlements available each year from 2014 to 2017. The “Plan Adicional” grants each executive the right to subscribe shares in different quantities between 2014 and 2016.
Both incentive plans grant executives the right to subscribe shares at a set Price of Ch$2,600 throughout the entire period of the respective incentive plan as long as employment conditions for the executive are met within each subscription period.
As of December 31, 2014, a total of 349 executives had subscribed contracts for the executive stock option plan.
The following table sets forth, as of December 31, 2014, the total number of shares of common stock to be issued upon exercise of the options granted to each of our executive officers under ourPlan 2014 and ourPlan Adicional the exercise price of such options, the date of grant and the date of expiration:
| | | | | | | | | | | | | | | | |
Plan under which options were awarded | | Number of
Shares | | | Exercise
price | | | Date of
grant | | | Expiration date | |
Plan 2015 | | | 10,057,500 | | | Ch$ | 1,646 | | | | September 26, 2014 | | | | February 28, 2018 | |
Plan 2014 | | | 10,352,720 | | | Ch$ | 2,600 | | | | March 22, 2013 | | | | October 31, 2017 | |
Plan Adicional | | | 11,124,784 | | | Ch$ | 2,600 | | | | April 26, 2013 | | | | October 31, 2016 | |
Total | | | 31,535,004 | | | | | | | | | | | | | |
C. BOARD PRACTICES
Board practices
Our Bylaws provide that shareholders elect nine regular directors. Directors are elected at the annual shareholders’ meeting for terms of three years. The legal responsibilities of each board member are established in accordance with the Chilean Corporations Law.
By virtue of his position as our controlling shareholder, Mr. Horst Paulmann has the power to nominate 5 directors to our Board of Directors. However, in 2013, in an effort to bolster corporate governance, Mr. Horst Paulmann chose to only nominate 4 directors at our shareholders’ meeting, essentially giving the right to nominate one additional director to our remaining shareholders.
Directors’ Committee
As required under Chilean law, we have established a Directors’ Committee composed of three directors. The following are the current members of our Directors’ Committee: David Gallagher (President), Roberto Philipps (Secretary) and Richard Büchi. The Directors’ Committee has the following principal duties:
| | • | | reviewing external audit reports and financial statements and providing its opinion regarding such items prior to their submission to the shareholders for approval; |
| | • | | proposing to the board of directors the names of independent external auditors and credit rating agencies that will be submitted for approval at the annual shareholders’ meeting; |
| | • | | reviewing related party transactions for potential conflict of interest and providing reports as required in certain defined cases; |
| | • | | reviewing the salary and compensation benefits for officers and senior management; preparing an annual report of the board’s activities, which will include its main recommendations to shareholders; |
| | • | | advising the board as to the hiring of external auditors to perform non-audit services, particularly whether such services might be prohibited in accordance with article 242 of the Chilean Securities Market Law as such services could jeopardize the independence of such external auditor; and |
| | • | | performing any other responsibility entrusted to the Directors’ Committee by the Chilean Corporations Law, our Bylaws, the shareholders’ meeting or the board of directors. |
137
Audit Committee
We have established an audit committee, comprised of three non-management members of our Board of Directors. The members of the audit committee are David Gallagher, Roberto Philipps and Cristián Eyzaguirre, each of whom is independent within the meaning of the SEC corporate governance rules. Our board of directors has determined that Roberto Philipps is “audit committee financial expert” as defined by the SEC.
The audit committee’s primary responsibilities are:
| | • | | Assist the Board of Directors in fulfilling its oversight responsibilities relating to the integrity of the Company’s financial statements, including periodically reporting to the Board of Directors on its activity and the adequacy of the Company’s systems of internal controls over financial reporting; |
| | • | | Make recommendations for the appointment, compensation, retention and oversight of, and consider the independence of, the Company’s external auditors; |
| | • | | Review material transactions between the Company or its subsidiaries with related parties to determine whether their terms are consistent with market conditions or are otherwise fair to the Company and its subsidiaries; and |
| | • | | Perform such other duties imposed on it by the laws and regulations of the regulated market(s) on which the shares of the Company are listed, applicable to the Company, as well as any other duties entrusted to it by the Board of Directors. |
The audit committee’s purpose and responsibilities, including those outlined above, have been set forth in the charter of the audit committee.
D. EMPLOYEES
General
At December 31, 2014, we had a total of 153,234 employees, of which approximately 40.2% were in Chile, 17.9% in Argentina, 10.4% in Peru, 21.9% in Brazil and 9.5% in Colombia. Approximately 37.5% of our store employees were represented by unions under several collective bargaining agreements. We do not employ a significant number of temporary employees.
We operate a merit-based bonus program for our managers both at the headquarters and store levels as well as for department heads at each store. In general, the bonus fluctuates between one and six monthly salaries and is determined in accordance with clearly defined criteria, including our overall performance, the performance of the employee’s store, the employee’s performance relative to specific targets established at the beginning of the year and more subjective standards such as fostering an open, constructive working environment.
Chile
At December 31, 2014, we had a total of 61,635 employees in Chile. Of these employees, 55,409 were employed in our stores, 2,844 were employed in the distribution facilities (our distribution center, warehouses and transportation), and 3,382 were employed in our headquarters.
At December 31, 2014, approximately 62.82% of our Chile employees were represented by 106 independent unions currently party to 113 different collective bargaining contracts. In addition, some of these independent unions have collective contracts with non-unionized employees of the company which generally have a term of two to four years.
Our Chile employees receive benefits established by the collective bargaining agreements and salaries in accordance with our own policies, benefits provided for by Chilean law (including disability insurance) and certain additional benefits provided by us. Among these benefits, we provide educational training for our employees and opportunities for their families (including educational scholarships for children of employees).
Argentina
At December 31, 2014, we had a total of 27,479 employees in Argentina. Of these employees, 24,032 were employed in our stores, 1,286 were employed in the distribution facilities (the distribution center, warehouses and transportation), and 2,161 were employed in the headquarters.
At December 31, 2014, approximately 86.2 % of our Argentina employees were under a single collective bargaining agreement with the Sindicato de Comercio (“Commerce Union”), but only 44.71% of such employees are members of the Commerce Union. There is only one collective bargaining agreement (mandatory by law) for all the non-management employees which has been in effect since 1975. We have experienced two strikes at our Jumbo stores, each lasting less than one day. However, none of these strikes have materially affected our overall operations.
138
Our Argentina employees receive benefits established by this collective bargaining agreement and salaries established according to our policies, benefits provided for by Argentinean law (including disability insurance) and certain additional benefits provided by us, including educational training.
Brazil
At December 31, 2014, we had a total of 33,346 employees in Brazil. Of these employees 29,374 were employed in our stores, 1,922 were employed in the distribution facilities (the distribution center, warehouses and transportation), and 2,250 were employed in the headquarters.
Our employees in Brazil are represented by different trade unions. Although less than 3% of our employees are affiliated with these trade unions, all employees are entitled to the benefits set forth in our collective labor agreements, as determined by applicable labor legislation. We believe that all 10 of the largest supermarket chains in Brazil are bound by the same collective labor agreements entered into with their respective trade unions. We believe that we have a good relationship with our employees and related trade unions, and our Brazilian operations have not recorded any significant strikes or stoppages over the last three years.
Peru
At December 31, 2014, we had a total of 16,008 employees in Peru. Of these employees, 13,389 were employed in our stores, 1,367 were employed in the distribution facilities (the distribution center, warehouses and transportation), and 1,251 were employed in the headquarters.
At December 31, 2014, approximately 0.99 % of our Peruvian employees were unionized or were party to collective bargaining agreements. We have not had any strikes that have materially affected our operations in Peru.
Our Peru employees receive standard benefits and salaries established according to our policies, benefits provided for by Peruvian law (including disability insurance) and certain additional benefits provided by us, including discounts on products purchased at our stores, educational training and certain merit-based bonuses.
Colombia
At December 31, 2014, we had a total of 14,566 employees in Colombia. Of these employees, 13,485 were employed in our stores, 882 were employed in the headquarters and 199 in distribution facilities.
As of December 31, 2014 approximately a 34.34% of our employees in Colombia were unionized or were party to collective bargaining agreements. We have not had any strikes that have materially affected our operations in the country.
Our Colombia employees receive standard benefits and salaries established according to our policies, benefits provided for by Colombia law (including disability insurance) and certain additional benefits provided by us, including discounts on products purchased at our stores and educational training for our employees.
E. SHARE OWNERSHIP
See table in “Item 7. Major Shareholders and Related Party Transactions” for information regarding share ownership by our directors and executive officers.
Item 7. Major Shareholders and Related Party Transactions
A. MAJOR SHAREHOLDERS
The following table sets forth information with respect to the beneficial ownership of our shares of common stock, as of the date of this annual report, for:
| | • | | each person known to us to own beneficially more than 5% of our shares of common stock; and |
| | • | | our directors and executive officers as a group. |
139
| | | | | | | | |
Shareholder | | Number of Shares
of Common Stock | | | Percentage Beneficial
Ownership | |
Principal Shareholders(1) | | | | | | | | |
Inversiones Quinchamali Limitada(2) | | | 573,754,802 | | | | 20.3 | % |
Inversiones Latadia Limitada(3) | | | 550,823,211 | | | | 19.5 | % |
Inversiones Tano Limitada(4) | | | 457,879,800 | | | | 16.2 | % |
Directors and Executive Officers | | | | | | | | |
Horst Paulmann Kemna(5) | | | 1,652,794,386 | | | | 58.5 | % |
Peter Paulmann Koepfer(6) | | | | * | | | | * |
Heike Paulmann Koepfer(7) | | | | * | | | | * |
David Gallagher | | | — | | | | — | |
Erasmo Wong | | | — | | | | — | |
Roberto Philipps | | | — | | | | — | |
Cristián Eyzaguirre | | | — | | | | — | |
Richard Büchi Buc | | | | * | | | | * |
Julio Moura | | | — | | | | — | |
Juan Manuel Parada | | | | * | | | | * |
Rodrigo Hetz | | | | * | | | | * |
| | |
| Shareholder | | Number of Shares of Common Stock | | | Percentage Beneficial
Ownership | |
Carlos Mechetti | | | | * | | | | * |
Andrés Artigas | | | | * | | | | * |
Bronislao Jandzio | | | | * | | | | * |
Carlos Wulf | | | | * | | | | * |
Jaime Soler | | | | * | | | | * |
Patricio Rivas | | | | * | | | | * |
Marcelo Reyes | | | | * | | | | * |
Renato Fernandez | | | — | | | | — | |
Ricardo Bennett | | | | * | | | | * |
Stefan Krause | | | | * | | | | * |
Rodrigo Larrain | | | | * | | | | * |
Total shares of common stock issued and outstanding | | | 2,828,723,963 | | | | 100.0 | % |
| * | Represents beneficial ownership of less than one percent of ordinary shares outstanding. |
| (1) | Our principal shareholders do not have different voting rights than other shareholders. All holders of our shares of common stock are entitled to one vote per share of common stock in all shareholders’ meetings. |
| (2) | Inversiones Quinchamali Limitada is a Chilean company controlled by Horst Paulmann Kemna, our Chairman of the Board, who is the largest shareholder therein, with the remainder owned by members of the Paulmann family. Members of the Paulmann family include Horst Paulmann Kemna, Manfred Paulmann Koepfer, Peter Paulmann Koepfer and Heike Paulmann Koepfer. The address for Inversiones Quinchamali Limitada is Avenida Kennedy 9001, Piso 7, Las Condes, Santiago, Chile. |
| (3) | Inversiones Latadia Limitada is a Chilean company majority owned by Inversiones Quinchamali Limitada, with the remainder owned indirectly by members of the Paulmann family. Its address is Avenida Kennedy 9001, Piso 7, Las Condes, Santiago, Chile. |
| (4) | Inversiones Tano Limitada is a Chilean company majority owned by Inversiones Quinchamali Limitada, with the remainder owned by Inversiones Latadia Limitada and Horst Paulmann Kemna. Its address is Avenida Kennedy 9001, Piso 7, Las Condes, Santiago, Chile. |
| (5) | Horst Paulmann Kemna owns 2.49% of our shares of common stock directly and the remaining amount through direct and indirect ownership in Inversiones Quinchamali Limitada, Inversiones Latadia Limitada and Inversiones Tano Limitada. |
Horst Paulmann Kemna, our Chairman of the Board, is the father of Heike Paulmann Koepfer and Peter Paulmann Koepfer, who both serve on our Board of Directors. See “Item 6. Directors, Senior Management and Employees.”
| (6) | Peter Paulmann Koepfer owns 0.5% of our shares of common stock. |
Horst Paulmann Kemna, our Chairman of the Board, is the father of Heike Paulmann Koepfer and Peter Paulmann Koepfer, who both serve on our Board of Directors. See “Item 6. Directors, Senior Management and Employees.”
| (7) | Heike Paulmann Koepfer owns 0.5% of our shares of common stock. |
Horst Paulmann Kemna, our Chairman of the Board, is the father of Heike Paulmann Koepfer and Peter Paulmann Koepfer, who both serve on our Board of Directors. See “Item 6. Directors, Senior Management and Employees.”
140
Differences in Voting Rights
Our major shareholders do not have different voting rights.
Controlling Shareholder
In 2012 and 2013, we experienced a significant change in the percentage of shares beneficially owned and controlled by our major shareholder as a result of our initial public offering and follow-on offering. Prior to our initial public offering, our founder, Mr. Horst Paulmann, beneficially owned 64.9% of our shares, directly and indirectly, through Inversiones Quinchamali Ltda., Inversiones Latadia Ltda. and Inversiones Tano Ltda. As of the date of this annual report, Mr. Horst Paulmann beneficially owns 58.5% of our shares. See “—Major Shareholders” above.
By virtue of this position as our controlling shareholder, Mr. Horst Paulmann has the power to nominate 5 directors to our Board of Directors. However, in 2013, in an effort to bolster corporate governance, Mr. Horst Paulmann chose to only nominate 4 directors at our shareholders’ meeting, essentially giving the right to nominate one additional director to our remaining shareholders.
Securities Held in Host Country
As of December 31, 2014, the most recent practicable date, 6,435,429 ADSs (equivalent to 19,306,287 shares, or 0.6% of the total outstanding shares of our common stock) were outstanding and held of record by 1 holder. We are aware that many ADSs are held of record by brokers and other nominees, and accordingly the above numbers are not necessarily representative of the actual number of U.S. persons who are beneficial holders of ADSs or the number of ADSs beneficially held by such persons.
B. RELATED PARTY TRANSACTIONS
Chilean Regulations
In the ordinary course of our business, we may incur related party indebtedness in the future on fair market terms. Articles 146 et seq of the Chilean Corporations Law regulate related party transactions to be incurred by publicly held corporations and its subsidiaries. Article 147 of the Chilean Corporations Law requires our transactions with related parties be on similar terms to those customarily prevailing in the market and to be beneficial to the interest of the company. Article 147 requires us to compare the terms of any such transaction to those prevailing in the market at the date the transaction is approved. For a related party transaction to be entered into, the approval of the board of directors is required. Directors of companies that violate Article 147 are jointly and severally liable for damages and losses resulting from such violation. In addition, Article 147 of the Chilean Corporations Law provides that any transaction in which a director has a personal interest or is participating in negotiations leading to a related party transaction must be previously approved by the board of directors, with the exclusion of the interested director. The board of directors will approve the transaction only when it has been informed of such director’s interest, the transaction is beneficial to the company and the terms of such transaction are similar to those prevailing in the market. All resolutions approving such transactions must be reported to the Company’s shareholders at the next annual shareholders meeting. If the majority of the directors are interested parties, the transaction may be entered into if approved unanimously by non-interested directors, or by two-thirds or more of the votes at a special shareholders’ meeting. If a special shareholders’ meeting is called, the board shall appoint two independent evaluators, who will inform the shareholders of the terms and conditions of the transaction, its effects and the potential impact in the Company. The evaluators’ final conclusions must be made available to shareholders and directors the day after the company receives such report. The report will be available for a period of at least 15 business days following the company’s receipt of the evaluator’s report and notice shall be provided to the shareholders by means of an hecho esencial.
General
The following related party transactions may be entered into without complying with the aforementioned requirements and with only the approval of the board of directors:
| | • | | The transaction does not involve an amount considered to be material. A transaction involves a material amount if: |
| | • | | the transaction amount is more than 1% of the company’s net worth, provided such transaction amount exceeds the equivalent of 2,000 UF, or |
| | • | | the transaction amount exceeds the equivalent to 20,000 UF. |
| | • | | The transaction is in the ordinary course of business, as determined by the corporation’s policies regarding such matters. |
| | • | | The transaction is with a related party which the company owns at least 95% of, either directly or indirectly. |
141
Violation of Article 146 et seq may result in administrative or criminal sanctions and civil liability to shareholders or third parties who suffer losses as a result of such violation. We believe that we have complied with the requirements of Articles 146 et seq in all transactions with related parties. See “Item 10.—B. Memorandum and Articles of Association—Director Requirements.”
Related Party Transactions
Below is a description of the outstanding transactions between us and our related parties, including the respective outstanding amounts, for the years ended December 31, 2014, 2013 and 2012.
Purchase and sale agreements
During 2014, 2013 and 2012, we purchased general merchandise in the amount of Ch$1,916 million, Ch$ 2,506 million and Ch$ 2,272 million, respectively, from Wenco S.A. (“Wenco”), a Chilean plastic goods manufacturer on whose board Mr. Cristián Eyzaguirre, one of our directors, serves as a director. In 2014, 2013 and 2012, we also sold general merchandise in the amount of Ch$64,398 million, Ch$3 million and Ch$401 million, respectively, to Wenco.
Cencosud also purchased merchandise from Industria Productos Alimenticios S.A., on whose board Mr. Cristián Eyzaguirre also serves, in the amount of Ch$ 1,062 million, Ch$1,245 million and Ch$1,138 million during 2014, 2013 and 2012, respectively. We also sold merchandise to Agencias Universales SA in the amount of Ch$18 million, Ch$22 million and Ch$19 million in 2014, 2013 and 2012, respectively, on whose board Mr. Cristián Eyzaguirre also serves. The same company provided services to Cencosud S.A. in the amount of Ch$ 598 million, Ch$616 million and Ch$384 million during 2014, 2013 and 2012, respectively.
Cencosud S.A. also sold merchandise in the amount of Ch$828 thousand and Ch$139 thousand during 2013 and 2012, respectively, to Maxi Kioskos Chile S.A., a Chilean convenience store operator owned by and on whose board of directors sits Mr. Manfred Paulmann Koepfer, the son of Mr. Horst Paulmann Kemna (our controlling shareholder).
Cencosud also purchased general merchandise from Importadora y Comercial Regen Ltda, a Chilean retailer of imported toys controlled by Mr. Peter Paulmann Koepfer, one of our directors, in the amount of Ch$538 million, Ch$386 million and Ch$499 million for the years 2014, 2013 and 2012, respectively. During 2014, Cencosud SA also sold goods to Importadora y Comercial Regen Ltda. in de amount of Ch$19 million.
During 2014 and 2013, Teleductos SA, on whose board Mr. Cristián Eyzaguirre also serves, provided services to Cencosud in the amount of Ch$704 million and Ch$939 million, respectively.
During 2014 and 2013, Manquehue Net SA, on whose board Mr. Cristián Eyzaguirre also serves, provided services to Cencosud in the amount of Ch$7 million and Ch$8 million, respectively.
During 2014 and 2013, Cia Nacional De Telefonos, Telefonica del Sur S.A., on whose board Mr. Cristián Eyzaguirre also serves, provided services to Cencosud in the amount of Ch$103 million and Ch$6 million, respectively.
During 2014, Mr. Cristian Eyzaguirre received Ch$103 million from our subsidiary Cencosud Administradora de Tarjetas S.A. in connection with his service on its board of directors.
During 2014 and 2013, Besalco S.A. on whose board Mr. Cristian Eyzaguirre also serves, provided services to Cencosud SA in the amount of Ch$1 million and Ch$0.3 million, respectively.
During 2014 and 2013, Empresa Nacional de Telecomunicaciones S.A. on whose board Mr. Richard Büchi Buc also serves, provided services to Cencosud in the amount of Ch$1,013 million and Ch$738 million, respectively.
During 2014 and 2013, Empresa El Mercurio S.A.P. on whose board Mr. Richard Büchi Buc also serves, provided services to Cencosud in the amount of Ch$2,820 million and Ch$2,064 million, while goods were sold to Empresa El Mercurio S.A.P. in the amount of Ch$25 million and Ch$5 million, respectively.
During 2014 and 2013, Entel Telefonia Local S.A. on whose board Mr. Richard Büchi Buc also serves, provided services to Cencosud in the amount of Ch$49 million and Ch$18 million, respectively.
During 2014 and 2013, Entel PCS Telecomunicaciones S.A on whose board Mr. Richard Büchi Buc also serves, provided services to Cencosud in the amount of Ch$8,484 million and Ch$12,887 million, respectively.
142
During 2014 and 2013, Asset-Chile S.A. on whose board Mr. David Gallagher also serves, purchased merchandise from Cencosud SA in the amount of Ch$5 million and Ch$0.9 million, respectively.
Leases
We lease space in several of our shopping centers in Chile to Maxi Kioskos Chile, S.A., a Chilean convenience store operator on whose board Manfred Paulmann Koepfer serves as a director. Lease payments during 2014, 2013 and 2012 amounted to Ch$ 402 million, Ch$478 million and Ch$149 million, respectively.
In addition, we lease space in several of our shopping centers in Chile to Importadora y Comercial Regen Ltda. Lease payments during 2014, 2013 and 2012 amounted to Ch$188 million, Ch$231 million and Ch$142 million, respectively.
We lease space in several of our shopping centers in Chile to Empresa el Mercurio S.A.P. Lease payments during the 2014 period amounted to Ch$203 million.
The above described transactions were entered into pursuant to our Bylaws and applicable Chilean laws and regulations.
For information concerning other transactions such as services rendered please see Notes 9.1 to 9.3 to our Audited Consolidated Financial Statements.
C. INTERESTS OF EXPERTS AND COUNSEL
Not applicable.
Item 8. Financial Information
A. CONSOLIDATED STATEMENTS AND OTHER FINANCIAL INFORMATION.
Financial Statements
See “Item 18. Financial Statements” and pages F-1 through F-219 for our consolidated financial statements prepared in accordance with IFRS.
Legal and Administrative Proceedings
We are party to certain legal proceedings in Argentina, Brazil, Chile, Colombia and Peru arising in the normal course of our business, which we believe are routine in nature and incidental to the operation of our business. We do not believe that the outcome of the proceedings to which we currently are party will have a material effect upon our operations or financial condition.
Our subsidiary, Cencosud Administradora de Tarjetas S.A. (“CAT”), was a defendant in a class action suit initiated by SERNAC. On April 24, 2013, the Supreme Court of Chile ruled for the plaintiff and at this junction no further appeals are available. In its ruling, the court determined that CAT included certain clauses in its 2006 contracts that were abusive to consumers. Said clauses allowed CAT to charge an incremental maintenance fee of Ch$530 per month to cardholders with a usage under Ch$50 thousand per month, without written consent from cardholders as required by theLey de Proteccion al Consumidor. In the ruling the court ordered CAT to pay a fine of approximately Ch$ 2 million and to reimburse certain cardholders for the excess maintenance fees charged since 2006 plus adjustments for inflation and interests. We made payments in connection with this ruling that amounted to Ch$17,974 million as of December 31, 2013. As of December 31, 2014, Ch$1,887 million were still provisioned in terms of principal reimbursements tied to this ruling and Ch$759 million tied to interest and inflation.
Dividends and Dividend Policy
Our dividend policy is determined from time to time by our board of directors. It is the Company’s general practice to pay interim and annual dividends in November and May. Dividends are paid to shareholders of record on the fifth Chilean business day preceding the date for the payment of the dividend.
As required by the Chilean Corporations Law, unless otherwise approved by unanimous vote of holders of all of our issued and subscribed shares, we must distribute a cash dividend in an amount no less than 30% of the Company’s consolidated net income for that year, unless and except to the extent we have a deficit in retained earnings. We may distribute a cash dividend in an amount greater than 30% if approved by a majority vote of shareholders.
143
Shareholders who are not residents of Chile must register as foreign investors under one of the foreign investment regimes contemplated by Chilean law to receive dividends, sale proceeds or other amount with respect to their shares remitted outside Chile through the Formal Market Exchange. See “Item 10. Additional Information—D. Exchange Controls.” Dividends received in respect of shares of common shares by holders are subject to Chilean withholding tax. See “Item 10. Additional Information—E. Taxation.”
B. SIGNIFICANT CHANGES
Except as otherwise disclosed in this annual report, there has been no undisclosed significant change since the date of the annual financial statements.
Item 9. The Offer and Listing
A. OFFER AND LISTING DETAILS
Our ADSs have been listed on the NYSE under the symbol “CNCO” since June 22, 2012. The table below sets forth the trading volume and the high and low closing prices in U.S. dollars of our ADSs on the New York Stock Exchange as reported by the New York Stock Exchange.
| | | | | | | | | | | | |
| | | New York Stock Exchange
(in U.S.$ per ADS)(1) | |
| | | Trading volume | | | High | | | Low | |
Year | | | | | | | | |
2012 (since June 22, 2012) | | | 16,315,454 | | | | 20.99 | | | | 15.10 | |
2013 | | | 17,843,014 | | | | 17.01 | | | | 10.33 | |
2014 | | | 19,283,969 | | | | 10.71 | | | | 6.94 | |
Quarter | | | | | | | | |
First Quarter, 2013 | | | 6,751,880 | | | | 19.85 | | | | 16.77 | |
Second Quarter, 2013 | | | 12,840,749 | | | | 18.43 | | | | 13.53 | |
Third Quarter, 2013 | | | 7,708,576 | | | | 14.55 | | | | 11.83 | |
Fourth Quarter, 2013 | | | 3,634,050 | | | | 13.59 | | | | 10.33 | |
First Quarter 2014 | | | 5,989,568 | | | | 10.66 | | | | 8.05 | |
Second Quarter, 2014 | | | 3,770,570 | | | | 10.71 | | | | 9.26 | |
Third Quarter, 2014 | | | 4,611,953 | | | | 10.16 | | | | 8.70 | |
Fourth Quarter, 2014 | | | 4,911,878 | | | | 9.50 | | | | 6.94 | |
First Quarter 2015 | | | 5,596,774 | | | | 7.90 | | | | 6.25 | |
Month | | | | | | | | |
October 2014 | | | 1,729,726 | | | | 9.03 | | | | 8.20 | |
November 2014 | | | 1,814,814 | | | | 9.50 | | | | 7.82 | |
December 2014 | | | 1,340,338 | | | | 7.80 | | | | 6.94 | |
January 2015 | | | 820,215 | | | | 7.53 | | | | 6.26 | |
February 2015 | | | 2,261,714 | | | | 7.9 | | | | 7.39 | |
March 2015 | | | 2,514,845 | | | | 7.35 | | | | 6.25 | |
April 2015 (through April 24, 2015) | | | 2,954,182 | | | | 7.99 | | | | 7.27 | |
Source:New York Stock Exchange.
| (1) | Except trading volume. |
B. PLAN OF DISTRIBUTION
Not applicable.
C. MARKETS
Our common stock is currently traded on the Santiago Stock Exchange and the Chile Electronic Stock Exchange under the symbol “CENCOSUD.” The Santiago Stock Exchange accounted for approximately 90%, 89% and 90% of the trading volume of our common stock in Chile in 2013, 2012 and 2011, respectively. On April 24, 2015, the last reported sale price of the shares on the Santiago Stock Exchange and theBolsa Electronica de Chile was Ch$1,635 and Ch$1,602 per share, respectively. Our Common stock traded on the Valparaiso Stock Exchange until September 10, 2013.
144
Price history of our common shares
The table below sets forth the trading volume and the high and low closing sales prices for our common shares on the Santiago Stock Exchange for the periods indicated.
| | | | | | | | | | | | |
| | | Santiago stock exchange
(in Ch$ per common share)(1) | |
| | | Trading volume | | | High | | | Low | |
Year | | | | | | | | | | | | |
2010 | | | 735,020,230 | | | | 3,900 | | | | 1,700 | |
2011 | | | 577,949,277 | | | | 3,745 | | | | 2,450 | |
2012 | | | 690,328,658 | | | | 3,256 | | | | 2,490 | |
2013 | | | 632,394,407 | | | | 3,064 | | | | 1,824 | |
2014 | | | 508,711,690 | | | | 1,980 | | | | 1,410 | |
Quarter | | | | | | | | | | | | |
First Quarter, 2013 | | | 215,929,897 | | | | 3,085 | | | | 2,594 | |
Second Quarter, 2013 | | | 169,157,706 | | | | 2,958 | | | | 2,286 | |
Third Quarter, 2013 | | | 142,189,960 | | | | 2,595 | | | | 1,970 | |
Fourth Quarter, 2013 | | | 103,553,285 | | | | 2,280 | | | | 1,812 | |
First Quarter, 2014 | | | 192,170,246 | | | | 1,924 | | | | 1,442 | |
Second Quarter, 2014 | | | 116,061,456 | | | | 1,980 | | | | 1,689 | |
Third Quarter, 2014 | | | 83,617,139 | | | | 1,865 | | | | 1,715 | |
Fourth Quarter, 2014 | | | 116,862,849 | | | | 1,770 | | | | 1,410 | |
First Quarter, 2015 | | | 242,882,182 | | | | 1,628 | | | | 1,305 | |
Month | | | | | | | | | | | | |
October 2014 | | | 24,455,955 | | | | 1,770 | | | | 1,598 | |
November 2014 | | | 53,172,479 | | | | 1,699 | | | | 1,539 | |
December 2014 | | | 39,234,415 | | | | 1,580 | | | | 1,410 | |
January 2015 | | | 51,098,843 | | | | 1,551 | | | | 1,305 | |
February 2015 | | | 58,105,279 | | | | 1,628 | | | | 1,511 | |
March 2015 | | | 132,097,635 | | | | 1,497 | | | | 1,331 | |
April 2015 (through April 24, 2015) | | | 44,870,199 | | | | 1,635 | | | | 1,498 | |
Source:Santiago Stock Exchange.
| (1) | Except trading volume. |
The table below sets forth the high and low closing sales prices for our common shares on theBolsa Electronica de Chile for the periods indicated.
| | | | | | | | | | | | |
| | | Chile electronic stock exchange
(in Ch$ per common share)(1) | |
| | | Trading volume | | | High | | | Low | |
Year | | | | | | | | | | | | |
2010 | | | 66,025,944 | | | | 3,870 | | | | 1,700 | |
2011 | | | 63,461,270 | | | | 3,740 | | | | 2,530 | |
2012 | | | 80,841,749 | | | | 5,569 | | | | 1,365 | |
2013 | | | 24,770,549 | | | | 3,080 | | | | 1,820 | |
2014 | | | 41,869,662 | | | | 1,980 | | | | 1,417 | |
Quarter | | | | | | | | | | | | |
First Quarter, 2013 | | | 30,197,513 | | | | 3,080 | | | | 2,590 | |
Second Quarter, 2013 | | | 37,367,989 | | | | 2,935 | | | | 2,290 | |
Third Quarter, 2013 | | | 22,164,899 | | | | 2,660 | | | | 1,989 | |
Fourth Quarter, 2013 | | | 9,351,794 | | | | 2,441 | | | | 1,820 | |
First Quarter, 2014 | | | 18,324,003 | | | | 1,931 | | | | 1,471 | |
Second Quarter, 2014 | | | 10,260,879 | | | | 1,980 | | | | 1,694 | |
Third Quarter, 2014 | | | 5,994,191 | | | | 1,886 | | | | 1,721 | |
Fourth Quarter, 2014 | | | 7,290,589 | | | | 1,767 | | | | 1,417 | |
First Quarter, 2015 | | | 5,733,361 | | | | 1,628 | | | | 1,310 | |
Month | | | | | | | | | | | | |
October 2014 | | | 1,625,948 | | | | 1,742 | | | | 1,604 | |
November 2014 | | | 4,227,787 | | | | 1,665 | | | | 1,548 | |
December 2014 | | | 2,077,146 | | | | 1,535 | | | | 1,424 | |
January 2015 | | | 1,527,178 | | | | 1,499 | | | | 1,310 | |
February 2015 | | | 3,157,906 | | | | 1,628 | | | | 1,510 | |
March 2015 | | | 1,048,277 | | | | 1,503 | | | | 1,344 | |
April 2015 (through April 24, 2015) | | | 2,117,852 | | | | 1,608 | | | | 1,493 | |
145
Source: Bolsa Electronica de Chile.
| (1) | Except trading volume. |
D. SELLING SHAREHOLDERS
Not applicable.
E. DILUTION
Not applicable.
F. EXPENSES OF THE ISSUE
Not applicable.
Item 10. Additional Information
A. SHARE CAPITAL
Not applicable.
146
B. MEMORANDUM AND ARTICLES OF ASSOCIATION
Set forth below is material information concerning our share capital and a brief summary of the significant provisions of our Bylaws and Chilean law. As explained above, our Bylaws effectively serve the purpose of both the articles or certificate of incorporation and the bylaws of a company incorporated in the United States. This description contains all material information concerning shares of our common stock, including summaries of certain provisions of our Bylaws and applicable Chilean law in effect on the date of this annual report. They do not, however, describe every aspect of our shares of common stock, our Bylaws or Chilean law. You are encouraged to review ourestatutos (an English translation of which has been filed as an exhibit to this annual report), the Chilean Corporations Law and the Securities Market Law, each referred to below.
For more information regarding our share capitalization, see “Item 7. Major Shareholders and Related Party Transactions—A. Major Shareholders,” elsewhere in this annual report. There were 2,828,723,963 shares of our common stock, no par value, issued and outstanding as of the date of this annual report.
Memorandum and articles of association
Set forth below is certain information concerning Cencosud S.A.’s capital stock and a brief summary of certain significant provisions of our Bylaws and Chilean law. You are encouraged to review our Bylaws, which are filed as Exhibit 1.1 of this annual report.
Organization and register
We are a publicly-held stock corporation (sociedad anónima abierta) organized under the laws of Chile and have an indefinite corporate duration. We were incorporated by a public deed dated November 10, 1978. This abstract is recorded on page 13808 No. 7412 of theRegistro de Comercio de Santiago (Commercial Registry of Santiago) for the year 1978. Our corporate purpose, as stated in our Bylaws, is broadly defined to include the purchase, sale, distribution and marketing of goods, as more fully set forth in our Bylaws.
Shareholder rights
Shareholder rights in Chilean companies are governed generally by a company’s bylaws (which effectively serve the purpose of both the articles, or certificate, of incorporation, and the bylaws of a United States company). Additionally, the Chilean Corporations Law governs the operation of Chilean stock corporations and provides for certain shareholder rights.
Shareholder rights can be amended through an agreement adopted in an extraordinary shareholders meeting, which shall subsequently agree upon the corresponding amendment to the bylaws. However, there are certain provisions of Chilean law that cannot be waived by the shareholders, such as the legal formalities prescribed by the Chilean Corporations Law for the organization and validity of a corporation or for the amendment of its bylaws; provisions dealing with the protection of minority shareholders, including the minimum number of board members, the existence of a committee of directors, the list of matters that shareholders may decide upon in an ordinary and/or extraordinary shareholders meeting of the company, the quorum required for the approval of certain supermajority matters; and other public policy provisions, such as the rules for the liquidation of a company, tender offer rules and, generally, all securities market regulations.
The Chilean securities markets are principally regulated by theSuperintendencia de Valores y Seguros (the Chilean Securities and Insurance Commission) (“SVS”) under the Securities Market Law and the Chilean Corporations Law. These two laws provide for disclosure requirements, restrictions on insider trading and price manipulation, and protection of minority investors. The Chilean Corporations Law clarifies rules and requirements for establishing publicly-held stock corporations while eliminating government supervision of privately-held companies. The Securities Market Law establishes requirements for public offerings, stock exchanges and brokers, and outlines disclosure requirements for companies that issue publicly offered securities.
Under Articles 12 and 54 and Title XV of the Securities Market Law, certain information regarding transactions in shares of publicly-held corporations must be reported to the SVS and the Chilean exchanges on which such shares are listed. Holders of shares of publicly-held corporations are required to report to the SVS and the Chilean exchanges:
| | • | | any acquisition or sale of shares that results in the holder’s acquiring or disposing of 10% or more of the corporation’s capital; and |
147
| | • | | any acquisition or sale of shares or options to buy or sell shares, in any amount, if made by a holder of 10% or more of the corporation’s capital or if made by a director, liquidator, main officer, general manager or manager of such corporation. |
| | • | | In addition, majority shareholders must include in their report whether their purpose is to acquire control of the company or if they are making a financial investment. A beneficial owner of ADSs representing 10.0% or more of our share capital will be subject to these reporting requirements under Chilean law. |
Persons or entities intending to acquire control of a publicly-held corporation, through means other than through a tender offer (oferta pública de adquisición de acciones), are also required to inform the public of such acquisition at least 10 business days before the date on which the transaction is to be completed, but in any case, as soon as negotiations regarding the change of control begin (i.e., when information and documents concerning the target are delivered to the potential acquirer) through a notice published in two Chilean newspapers, which must disclose, among other information, the person or entity purchasing or selling and the price and conditions of any negotiations. Prior to such publication, a written communication to such effect must be sent to the SVS and the Chilean exchanges.
In addition to the foregoing, Article 54A of the Chilean Securities Market Law requires that within two business days of the completion of the transactions pursuant to which a person has acquired control of a publicly traded company, a notice shall be published in the same newspapers in which the notice referred to above was published and notices shall be sent to the same persons mentioned in the preceding paragraphs.
Chilean law does not contain any provision that discriminates against shareholders or prospective shareholders who own a substantial number of shares. However, a special public offering procedure applies should the controlling shareholder of a company decide to increase its stock in the company, according to which the offer must be made to all shareholders on a pro rata basis in proportion to their respective stock.
Capitalization
Under Chilean law, a corporation increases its capital as soon as the shareholders authorize both the capital increase and the issuance of new stock, provided that the minutes of the corresponding shareholders meeting are put into a public deed, and an abstract of said deed is published in the Official Gazette and registered in the Commercial Registry corresponding to the company’s domicile. In addition, in the case of publicly-held stock corporations, the new shares must be registered in the Securities Registry of the SVS before they may be offered to the public. When a shareholder subscribes for shares, the shares are transferred to such shareholder’s name, and the shareholder is treated as a shareholder for all purposes, except receipt of dividends in the proportion corresponding to the unpaid price of such shares, unless otherwise stipulated in the bylaws of the corporation. The shareholder becomes eligible to receive dividends once such shareholder has paid for the shares. If a shareholder does not pay for shares for which such shareholder has subscribed on or prior to the date agreed upon for payment, the corporation is entitled to auction the shares on the stock exchange, and has a cause of action against the shareholder for the difference between the subscription price and the price received at auction. However, until such shares are sold at auction, the shareholder continues to exercise all the rights of a shareholder (except the right to receive dividends). Authorized shares which have not been paid for within the period ending three years from the date when the capital increase agreement was made at the shareholders’ meeting, are deemed cancelled under Chilean law and are no longer available for sale by the Chilean corporation. At that time, the capital of the corporation is automatically reduced to the amount effectively paid within such period.
The Bylaws authorize a single series of common stock, without par value.
Director requirements
Our Bylaws require the board to consist of nine directors. The entire board is elected every three years. There is no requirement that a director be a shareholder of our Company.
Our Bylaws do not contain any provision regarding a mandatory retirement age for directors, nor does Chilean law contain any provision in this respect.
According to Chilean Corporations Law, a publicly-held stock corporation (sociedad anónima abierta) can only execute a transaction with a related party whenever such transaction is for the benefit of the corporation, and conforms to price terms and conditions prevailing in the market at the time of its approval.
Directors, managers, administrators, main executives or liquidators who have an interest in a related party transaction must immediately inform the board of directors or its proxy of such interest and the transaction must first be approved in accordance with the procedures described below. Non-compliance with these requirements will result in joint and several liability for the damages the transaction causes to both the corporation and its shareholders.
148
If the transaction involves a relevant amount (more than 1% of the company’s equity, provided such transaction exceeds the equivalent of 2,000 UF, or in any case if it exceeds the equivalent to 20,000 UF) and the board of directors is not able to determine if it is an arm’s-length transaction, the Board may approve or reject the execution of the transaction, with the abstention of the interested director, or appoint two independent evaluators.
If the board of directors approves the transaction, the relevant resolution will be disclosed in the subsequent shareholders’ meeting. The resolution should expressly enumerate the directors that approved the operation.
Alternatively, in the case that evaluators are appointed, such evaluators will draft a report to inform the shareholders of the terms and conditions of the transaction, as well as its effect and potential impact on the corporation. The evaluators’ report shall be made available to the shareholders. If shareholders representing at least 5% of the company’s voting stock consider that the transaction is not in the company’s best interest, or if the evaluators’ report differ considerably, they may request that the Board call for an extraordinary shareholders meeting in order to approve or reject the execution of such transaction, in the former case by at least two-thirds of the company’s voting stock. The related party that intends to carry out the operation with the company must provide to the Board all relevant information pertaining to such operation.
Notwithstanding the applicable sanctions, the violation of these rules will not affect the validity of the transaction, but will entitle the corporation or the shareholders to request that the defender disgorge profits obtained from the transaction.
The following transactions with related parties can be carried out without compliance with the foregoing requirements, after approval by the board of directors:
| | • | | Transactions that do not involve a significant amount, as described above. All transactions carried out in a 12 month period through one or more acts that are similar or complementary and in which the parties, including related parties, or the purpose are the same will be considered a single transaction. |
| | • | | Transactions which are in the ordinary course of business, as determined by the corporation’s policies regarding such matters. In this case, the resolution that establishes such policies or their amendments will be made available to the shareholders at the corporation’s offices and on their web site, if applicable. |
| | • | | Transactions between corporations in which the company owns, either directly or indirectly, at least 95% of its counterparty. |
Borrowings by a director are treated under Chilean law as related party transactions and are subject to the rules set forth above.
Pursuant to the Chilean Corporations Law, if the bylaws of a company establish compensation for directors, such compensation must be agreed to in a shareholders meeting. Our Bylaws establish that the directors will be compensated in an amount determined by the annual shareholders meeting, notwithstanding the right of the Board to agree to compensate a director for the performance of any other duty different from his or her duty as a director.
Preemptive rights and increases of share capital
The Chilean Corporations Law grants certain preemptive rights to shareholders of all Chilean companies. The Chilean Corporations Law generally requires Chilean companies to offer to shareholders the right to purchase a sufficient number of shares or convertible securities to maintain their existing ownership percentage in the company whenever it issues new shares or convertible securities and prior to any sale in the market of its treasury shares of common stock.
Pursuant to this requirement, preemptive rights in connection with any future issue of shares will be offered by us to the depositary as the registered owner of the shares underlying the ADSs. However, the depositary will not be able to make such preemptive rights available to holders of ADSs unless a registration statement under the Securities Act is effective with respect to the underlying shares or an exemption from the registration requirements thereunder is available.
We intend to evaluate, at the time of any preemptive rights offering after the date hereof, the practicality under Chilean law in effect at the time of making such rights available to our ADS holders, as well as the costs and potential liabilities associated with registration of such rights and the related shares of common stock under the Securities Act, and the indirect benefits to us of thereby enabling the exercise by all or certain holders of ADSs of their preemptive rights and any other factors we consider appropriate at the time, and then to make a decision as to whether to file such registration statement. We cannot assure you that any registration statement would be filed. If we do not file a registration statement and no exemption from the registration requirements under the Securities Act is available, the Depositary will sell such holders’ preemptive rights and distribute the proceeds thereof if a premium can be recognized over the cost of such sale. In the event that the Depositary is not able, or determines that it is not feasible, to sell
149
such rights at a premium over the cost of any such sale, all or certain holders of ADSs may receive no value for such rights. Non-U.S. holders of ADSs may be able to exercise their preemptive rights regardless of whether a registration statement is filed. The inability of all or certain holders of ADSs to exercise preemptive rights in respect of shares of common stock underlying such ADSs could result in such holders not maintaining their percentage ownership of the common stock following such preemptive rights offering unless such holder made additional market purchases of ADSs or shares of common stock.
Under Chilean law, preemptive rights are exercisable or freely transferable by shareholders during a period that cannot be less than 30 days following the grant of such rights. During such period, and for an additional 30-day period thereafter, a Chilean corporation is not permitted to offer any unsubscribed shares for sale to third parties on terms which are more favorable than those offered to its shareholders. At the end of such additional 30-day period, a Chilean open stock corporation is authorized to sell unsubscribed shares to third parties on any terms, provided they are sold on a Chilean stock exchange. Unsubscribed shares that are not sold on a Chilean stock exchange can be sold to third parties only on terms no more favorable for the purchaser than those offered to shareholders.
Dividend and liquidation rights
In accordance with Chilean law, we must distribute mandatory cash dividends of 30% of our consolidated net income unless otherwise decided by a unanimous vote of the holders of the Shares. See “Item 8. Financial Information—A. Consolidated Statements and Other Financial Information—Dividends and Dividend Policy.”
At our option, the portion of any dividend which exceeds the mandatory limits established pursuant to Chilean law may be paid in cash, in our shares or in shares of corporations owned by us. Shareholders who do not expressly elect to receive a dividend other than in cash are legally presumed to have decided to receive the dividend in cash. Our ADS holders may, in the absence of an effective registration statement under the Securities Act or an available exemption from the registration requirement thereunder, effectively be required to receive a dividend in cash. See “—Preemptive rights and increases of share capital” above.
Those dividends not collected by the shareholders entitled thereto lapse five years after the payment date, with the funds going to the Chilean Treasury.
In the event of a liquidation of our company, the holders of fully paid shares of common stock would participate in the assets available after payment of all creditors in proportion to the number of shares held by them.
Shareholders’ meetings and voting rights
We hold our annual shareholders meeting during the first fourth months of each year. Extraordinary shareholders meetings may be called by the board of directors when deemed appropriate or when requested by shareholders representing at least 10% of the issued voting shares or by the SVS. Notice to convene the annual shareholders meeting or an extraordinary shareholders meeting is given by means of a notice in a newspaper published in Cencosud’s corporate domicile (currently Santiago) or in the Official Gazette in a prescribed manner. Notice must also be mailed to each shareholder and given to the SVS 15 days in advance of the meeting.
The quorum for a shareholders’ meeting is established by the presence, in person or by power of attorney, of shareholders representing at least the absolute majority of our issued voting shares. If a quorum is not present at the first meeting, the meeting can be reconvened and upon the meeting being reconvened, shareholders present at the reconvened meeting are deemed to constitute a quorum regardless of the percentage of the shares represented. However, if a shareholders’ meeting is called for the purpose of considering:
| | • | | a change of our organization, merger or division, |
| | • | | an amendment to the term of duration or early dissolution, |
| | • | | a change in our corporate domicile, |
| | • | | a decrease of our corporate capital, |
| | • | | approval of capital contributions in assets other than cash and their assessments, |
| | • | | modification of the authority reserved to shareholders meetings or limitations on the Board of Directors, |
| | • | | reduction in the number of members of our Board of Directors, |
| | • | | the sale, transfer or disposition of 50% or more of assets, either including or excluding its corresponding liability, or the formulation or modification of any business plan which contemplates the sale, transfer or disposition of our assets in such amount, the sale of 50% or more of the assets of an affiliate that represents at least 20% of the assets of the corporation, as well as any sale of its shares which would result in us ceasing to be in control of such subsidiary, |
150
| | • | | the form of distributing corporate benefits, |
| | • | | the granting of a guaranty by us of liabilities of any third-party other than a subsidiary, in an amount exceeding 50% of our total assets, |
| | • | | our purchase of our issued stock in accordance with articles 27A and 27B of Law No. 18,046, |
| | • | | the amendment of any formal defects in our Bylaws which may nullify our incorporation, or any amendment of the Bylaws referring to one or more of the matters indicated above, |
| | • | | the approval of our ceasing to be subject to the regulations applicable to publicly held corporations in the event we no longer meet the requirements under Chilean law to qualify as such a corporation, or the establishment of the right for our controller to acquire the shares of minority shareholders after a tender offer, in the terms set forth in paragraph 2 of article 71 bis of Law No. 18,046, |
| | • | | the approval or ratification of contracts or agreements with related parties, in accordance with articles 44 and 147 of Law No. 18,046, or |
| | • | | other matters as may be set forth in our Bylaws. |
The vote required at such meeting is a two-thirds majority of the issued common stock.
Additionally, the amendment of our Bylaws aimed at the creation, modification, extension or suppression of preferential rights, must be approved with the favorable vote of two-thirds of the shares of the affected series.
Chilean law does not require a publicly-held Chilean company to provide the level and type of information that United States securities laws require a reporting company to provide to its shareholders in connection with a solicitation of proxies. Under Chilean law, a notice of a shareholders’ meeting listing the matters to be addressed must be mailed to shareholders and the SVS not fewer than 15 days prior to the date of a meeting. In cases of an Annual Shareholders’ Meeting, an annual report of our activities, which includes our audited financial statements, must also be mailed to shareholders.
The Chilean Corporations Law provides that whenever shareholders representing 10% or more of the issued voting shares so request, a Chilean company’s annual report must include within the materials dispatched by the board of directors to shareholders, the comments and proposals of such shareholders in relation to the company’s affairs. Similarly, the Chilean Corporations Law provides that whenever the board of directors of a publicly-held company convenes a meeting of shareholders and solicits proxies for the meeting, information supporting its decisions or other similar materials, it is obligated to include the pertinent comments and proposals that may have been made by shareholders owning 10% or more of the company’s voting shares who request that such comments and proposals be so included.
Only shareholders registered in the Shareholders’ Registry as such at least five Chilean business days prior to the date of a shareholders meeting are entitled to attend and vote their shares. A shareholder may appoint by power of attorney another individual (who need not be a shareholder) as its attorney-in-fact to attend and vote on its behalf. Every shareholder entitled to attend and vote at a shareholders meeting shall have one vote for every share subscribed.
Right of dissenting shareholders to tender their shares
The Chilean Corporations Law provides that upon the adoption at an extraordinary shareholders meeting of any of the resolutions enumerated below, dissenting shareholders acquire a right of redemption to force the company to repurchase their shares, subject to the fulfillment of certain terms and conditions.
“Dissenting” shareholders are defined as those which vote against a resolution which results in the redemption right, or if absent at such a meeting, those who state in writing to the company their opposition to the respective resolution. Dissenting shareholders must perfect their redemption rights by tendering their stock to the company within 30 days of the resolution (except in the case of pension fund shareholders as discussed below).
The price paid to a dissenting shareholder of a publicly-held company for such shares is the weighted average of the closing sales prices for the shares as reported on the stock exchanges for the two-month period preceding the event giving rise to the redemption right.
151
The resolutions that result in a shareholder’s redemption right are the following:
| | • | | our transformation into a different type of legal entity; |
| | • | | our merger with or into another company; |
| | • | | the disposition of 50% or more of our assets, whether or not that sale includes our liabilities or the proposal or amendment of any business plan involving the transfer of more than 50% of our assets; and the sale of 50% or more of the assets of an affiliate which represents at least 20% of the assets of the corporation, as well as any sale of its shares which would result in us ceasing to be in control of such subsidiary; |
| | • | | the granting of security interests or personal guarantees to secure or guarantee third parties’ obligations exceeding 50% of our assets, except with regard to security interests or personal guarantees, which are granted to secure or guarantee obligations of our subsidiaries; |
| | • | | the creation of preferential rights for a class of shares or an amendment to those already existing, in which case the redemption right only accrues to the dissenting shareholder of the class or classes of shares adversely affected; |
| | • | | the amendment of our Bylaws to correct any formal defect in our incorporation, which might cause our Bylaws to become null and void, or any amendment of our Bylaws that grants a shareholder a redemption right; |
| | • | | the approval by our shareholders of our ceasing to be subject to the regulations applicable to publicly held corporations in the event we no longer meet the requirements under Chilean law to qualify as such a corporation; and |
| | • | | any other causes as may be established by Chilean law and our Bylaws (our Bylaws currently do not establish any instances). |
In addition, shareholders of a publicly held corporation have a redemption right if a person acquires two-thirds or more of the outstanding voting stock of the company and does not make a tender offer for the remaining shares within 30 days of that acquisition at a price not lower than the price that would be paid shareholders exercising their redemption rights.
However, the right of redemption described in the previous sentence does not apply in the event the company reduces its capital as a result of not having fully subscribed and paid an increase of capital within the statutory term.
Finally, shareholders of a publicly held corporation have the right of redemption within 30 days after the date when the controller acquires more than 95% of the shares of the company. These redemption rights must be exercised within 30 days.
C. MATERIAL CONTRACTS
See “Item 4. Information on the Company—B. Business Overview—Material Agreements.”
D. EXCHANGE CONTROLS
Foreign Exchange Controls
Chile
The Chilean Central Bank is the entity responsible for monetary policies and exchange controls in Chile. Chilean issuers are authorized to offer securities internationally provided they comply with, among other things, the provisions of Chapter XIV of the Compendium of Foreign Exchange Regulations of the Chilean Central Bank (the “Chilean Central Bank Compendium”).
Pursuant to the provisions of Chapter XIV of the Chilean Central Bank Compendium, it is not necessary to seek the Chilean Central Bank’s prior approval in order to acquire shares in a Chilean market. The Chilean Central Bank only requires that (i) the remittance of funds for the acquisition of the shares in Chile be made through the Formal Exchange Market and disclosed to the Chilean Central Bank as described below; and (ii) all remittances of funds from Chile to the foreign investor upon the sale of shares or from dividends or other distributions made in connection therewith be made through the Formal Exchange Market and disclosed to the Chilean Central Bank as described below.
The proceeds of the placement of the shares abroad may be brought into Chile or held abroad. If we remit the funds obtained from the placement of the shares in Chile, such remittance must be made through the Formal Exchange Market and we must deliver to the Department of Statistics Information of the Chilean Central Bank directly or through an entity participating in the Formal Exchange Market an annex providing information about the transaction, together with a letter instructing such entity to deliver us the foreign currency or the Chilean peso equivalent thereof. If we do not remit the funds obtained from the placement of the shares in Chile, we have to provide the same information to the Department of Statistics Information of the Chilean Central Bank directly or
152
through an entity of the Formal Exchange Market, within the first 10 days of the month following the date on which we received the funds. All payments from dividends or other distributions in connection with the shares made from Chile must be made through the Formal Exchange Market. Pursuant to Chapter XIV of the Chilean Central Bank Compendium, no prior authorization from the Chilean Central Bank is required for such payments in U.S. dollars. The participant of the Formal Exchange Market involved in the transfer must provide certain information to the Chilean Central Bank on the banking business day following the day of payment. In the event payments are made outside Chile using foreign currency held abroad, we must provide the relevant information to the Chilean Central Bank directly or through an entity of the Formal Exchange Market within the first 10 days of the month following the date on which the payment was made.
Under Chapter XIV of the Chilean Central Bank Compendium, payments and remittances of funds from Chile are governed by the rules in effect at the time the payment or remittance is made. Therefore, any change made to Chilean laws and regulations after the date hereof will affect foreign investors who have acquired the shares. We cannot assure you that further Chilean Central Bank regulations or legislative changes to the current foreign exchange control regime in Chile will not restrict or prevent us from acquiring U.S. dollars or that further restrictions applicable to us will not affect our ability to remit U.S. dollars for payment of dividends or other distributions in connection with the shares.
The above is a summary of the Chilean Central Bank’s regulations with respect to the issuance of securities, including the shares, as in force and effect as of the date of this annual report. We cannot assure you that restrictions will not be imposed in the future, nor can there be any assessment of the duration or impact of such restrictions if imposed. This summary does not purport to be complete and is qualified in its entirety by reference to the provisions of Chapter XIV of the Chilean Central Bank Compendium, a copy of which is available from us upon request at the following address Avenida Kennedy 9001, Piso 6, Las Condes, Santigo, Chile.
Argentina
Prior to December 1989, the Argentine foreign exchange market was subject to exchange controls. From December 1989 until April 1991, Argentina had a freely floating exchange rate for all foreign currency transactions, and the transfer of dividend payments in foreign currency abroad and the repatriation of capital were permitted without prior approval of the Central Bank of Argentina. From April 1, 1991, when the Convertibility Law became effective, until December 21, 2001, when the Central Bank of Argentina decided to close the foreign exchange market, the Argentine currency was freely convertible into U.S. dollars.
On December 3, 2001, the Argentine government imposed a number of monetary and currency exchange control measures through Decree 1570/01, which included restrictions on the free disposition of funds deposited with banks and tight restrictions on transferring funds abroad without the Central Bank of Argentina’s prior authorization subject to specific exceptions for transfers related to foreign trade. Beginning in January 2003, the Central Bank of Argentina has gradually eased these restrictions and expanded the list of transfers of funds abroad that do not require its prior authorization. However, in June 2003 the Argentine government instituted restrictions on capital flows into Argentina, which mainly consisted of a prohibition against the transfer abroad of any funds until 180 days after their entry into the country.
In June 2005, the Argentine government issued Decree 616/05, which established additional restrictions over all capital flows that could result in the decreased availability of international credit. Pursuant to the decree, all private sector indebtedness of physical persons or corporations in Argentina are required to be agreed upon and repaid not prior to 365 days from the date of entry of the funds into Argentina, regardless of the form of repayment. The decree outlines several types of transactions that are exempt from its requirements, including foreign trade financings, foreign trade balances of those entities authorized to carry out foreign exchange, and primary offerings of debt securities issued pursuant to a public offering and listed on a self-regulated market.
In addition, the decree, as supplemented by subsequent regulations, stipulates that all capital inflows of residents exceeding U.S.$2 million per month, as well as all capital inflows of non-residents settled in the local exchange market destined for local money holdings, acquisition of active or passive private sector financings and investments in securities issued by the public sector that are acquired in secondary markets (excluding foreign direct investment, which includes capital contributions to local companies of direct investments (namely, a company in which the foreign direct investor holds at least 10% of ordinary shares or voting rights, or its equivalent), and primary offerings of debt securities issued pursuant to a public offering and listed on a self-regulated market), must meet certain requirements, including those outlined below:
| | • | | such funds may be transferred only outside the local exchange market after a 365-day period from the date of entry of the funds into Argentina; |
| | • | | any Argentine Pesos resulting from the exchange of such funds are to be credited to an account within the Argentine banking system; and |
| | • | | except for certain type of capital inflows, a non-transferable, non-interest-bearing U.S. Dollar-denominated mandatory deposit must be maintained for a term of 365 calendar days, in an amount equal to 30% of any such inflow of funds to the local foreign exchange market (which mandatory deposit may not be used as collateral or guaranty for any transaction). |
153
In addition, on November 16, 2005, the Ministry of Economy and Production issued Resolution 637/05, pursuant to which Decree 616/05 was regulated, providing that any inflow of funds to the local exchange market in connection with an initial public offering of securities, bonds or certificates issued by a trustee under a trust, whether or not such trust is publicly offered and listed in a self-regulated market, shall comply with all requirements provided for section 4 of Decree 616/05 whenever such requirements are applicable to the inflow of funds to the local exchange market in connection with the acquisition of any of the assets under the trust.
The transfer abroad of dividend payments is currently authorized by applicable regulations to the extent such dividend payments are made in connection with audited financial statements approved by a shareholders’ meeting. Any breach of the provisions of Decree No. 616/05 or any other foreign exchange regulation is subject to criminal penalties of the laws governing the Argentine exchange market.
In addition, pursuant to Resolutions AFIP N° 3210/2011 and N° 3212/2011 and Communication “A” 5245, enacted in late 2011, prior to authorizing the sale of foreign currency to make portfolio investments abroad or similar investments, the local bank must obtain prior clearance from an online database run by the federal tax authority (AFIP). This database must confirm whether an individual or entity has sufficient declared assets or funds to make the purchase of foreign currency. In the event that declared assets or funds are not sufficient, the bank may not sell foreign currency to such individual or entity. However, the regulations fail to explain how this calculation is carried out. This clearance requirement may affect the ability of our Argentine subsidiaries to make or manage its foreign currency investments or to transfer funds abroad.
Repatriation of investments by non-Argentine residents
Repatriation of funds by non-Argentine residents is subject to the prior approval of the Central Bank; however, various exceptions exist to this general principle, including, among others:
| | • | | Repatriation of direct investments resulting from the sale of investments, the process of wind-up or liquidation of a company, capital reduction or the repayment of capital contributions. In these instances, the foreign investor must demonstrate that it has held the Argentine investment for at least 365 days. In addition, investments made after October 28, 2011 (capital contributions or acquisition of interests in Argentine companies) may be repatriated only if it can be demonstrated that the funds invested in the Argentine company were brought into Argentina at least 365 days prior to repatriation; a certificate from a financial institution or foreign exchange firm must be provided that states the amount of the funds and the date on which such funds were transferred into Argentina for the purpose of making the investment. However, in the event that the investor is organized or domiciled in a country which, pursuant to Argentine law, is considered to be of low or no taxation, repatriation must be approved by the Central Bank. |
| | • | | Repatriation of portfolio investments (and the related income), provided that the aggregate amount of such repatriation does not exceed U.S.$500,000 per month. Repatriation in this instance is permitted provided the investor can demonstrate that the funds used to make such investment were brought into Argentina at least 365 days prior to repatriation; a certificate from a financial institution or foreign exchange firm must be provided that states the amount of the funds and the date on which such funds were transferred into Argentina for the purpose of making the investment. However, in the event that the investor is organized or domiciled in a country which, pursuant to Argentine law, is considered to be of low or no taxation, repatriation must be approved by the Central Bank. |
These repatriation exceptions are available provided the financial institution through which a funds transfer is made is capable of determining (among other things) that “from the date of collection of the funds (…) to the date of the foreign exchange transaction, the funds received were not allocated to other investments in Argentina.”
Any transactions not covered by the preceding paragraphs (or any other exception) are subject to prior Central Bank approval.
154
Foreign investments by Argentine residents
As a general matter, individuals and legal entities (excluding private trusts and non-registered civil and commercial companies, associations and foundations) are authorized to buy or transfer foreign currency in an amount of up to U.S.$2 million per month (provided they do not have due and unpaid debts of any nature owing to foreign creditors). However, in practice, certain regulations have restricted the ability to purchase or transfer foreign currency for general savings or investment purposes (such practice is referred to as “accumulation” or “atesoramiento”):
| (a) | Pursuant to Communication “A” 5236 (as amended) of the Central Bank, in the event that the aggregate amount of foreign currency purchases (including transfers) during a calendar year exceeds U.S.$250,000: |
| | (i) | in the case of individuals, the total amount of foreign currency purchases may not exceed the sum of: (i) the investments in Argentine financial assets and the amount of Argentine currency declared in the individual’s most recent personal tax return filed with Argentine tax authorities, (ii) the funds resulting from the sale in Argentina of recordable assets and foreign currency declared in the individual’s most recent personal tax return filed with Argentine tax authorities, (iii) the individual’s earnings for the current year which are subject to income tax withholding, (iv) other sources of income collected by the individual during the year that are not subject to income tax and (v) amounts received by the individual through an inheritance; and |
| | (ii) | in the case of legal entities, the total amount of foreign currency purchases may not exceed: (i) the entity’s net worth (per the financial statements corresponding to the immediately preceding fiscal year), plus (ii) the entity’s earnings generated after the end of the immediately preceding fiscal year,plus (iii) the entity’s proceeds from the sale of foreign currency in the foreign exchange market,minus (iv) the entity’s investments in external assets (including foreign currency) as of the date of purchase,minus (v) deposits in Argentina of foreign currency,minus (vi) investments in Argentine companies,minus (vii) distributions by the entity of dividends approved after the end of the immediately preceding fiscal year. |
| (b) | Pursuant to Resolutions AFIP No. 3210/2011 and No. 3212/2011 and Communication “A” 5245, prior to authorizing the sale of foreign currency to a given client, the bank handling such sale must consult an online database maintained by the Argentine federal tax authority to confirm whether the client desiring to make such purchase has met the requirements outlined above. In the event that the requirements are not met by the client, the bank may not carry out the sale of foreign currency. However, the regulations fail to provide detail as to how the required calculations are to be made. |
In addition, purchases of foreign currency for purposes of accumulation are subject to the following conditions:
| (a) | The Argentine resident must not have due and unpaid debts owing to foreign creditors (whether financial or commercial in nature). This requirement will not apply if the purchase of foreign currency does not exceed U.S.$10,000 per calendar month. |
| (b) | If the purpose of the purchase and transfer of funds is to purchase Argentine securities, including ADRs, the purchase of such securities may only be carried out 20 business days following the transfer of funds. |
| (c) | In the case of foreign portfolio investments, the funds must be transferred from an Argentine bank account of the Argentine resident to a different bank account opened with: |
| | (i) | a foreign bank established in any country member of the OECD whose foreign indebtedness has an international rating of at least “BBB” or that consolidates its financial statements in Argentina with an Argentine bank; or |
| | (ii) | foreign banks of the country of permanent residence of individuals authorized to remain in Argentina as “temporary residents” under the provisions of section 23 of Argentine Immigration Law No. 25,871; or |
| | (iii) | a financial entity regularly engaged in investment banking activities, established in any country member of the OECD whose foreign indebtedness has an international rating of at least “BBB”. |
Repatriation of funds by Argentine residents
Repatriation of funds by Argentine residents up to U.S.$2 million per month is exempt from the deposit (encaje) requirement. If the funds repatriated by an Argentine resident exceed this monthly cap, the deposit requirement will apply in an amount equal to 30% of the excess funds.
Criminal foreign exchange regime
Pursuant to the provisions of Central Bank Communication “A” 3471, foreign exchange transactions may only be carried out through financial institutions authorized to do so by the Central Bank (e.g., financial institutions and foreign exchange bureaus). Central Bank Communication “A” 3471 further provides that any transactions that fail to comply with the applicable requirements will be subject to the penalties set forth in the Criminal Foreign Exchange Regime set by Law No. 19,359.
For a complete detail of all foreign exchange restrictions, investors should consult with their own legal and financial advisors. Additionally, the review of Executive Order No. 616/2005, MEP Resolution No. 365/2005, Law No. 19,359 and their amending and supplementing regulations is suggested.
155
Brazil
General rules
The basic law regulating foreign investment was enacted in 1962 (Law No. 4131) and was amended in 1964 (Law No. 4390). Foreign investment is not subject to government approvals or authorizations, and there are no requirements regarding minimum investment or local participation in capital (except in very limited cases such as in financial institutions, insurance companies and other entities subject to the regulating authority of the Central Bank of Brazil). Foreign participation, however, is limited or prohibited in limited areas of activities, including those detailed below.
The Central Bank of Brazil is the agency responsible for: (i) managing the day-today control over foreign capital flow in and out of Brazil (risk capital and loans under any form); (ii) setting forth the administrative rules and regulations for registering investments; (iii) monitoring foreign currency remittances; and (iv) allowing repatriation of funds. It has no jurisdiction over the quality of the investment and cannot restrict the remittances of funds resulting from the risk capital or loan, which are based on a registration with the Central Bank, through its Electronic System of Registration.
In the event of a serious balance of payment deficit, the Central Bank may limit profit remittances and prohibit remittances as capital repatriation for a limited period of time. This limitation, however, has never been applied even during Brazil’s most difficult balance of payments problems.
Foreign investments in currency must be officially channeled through financial institutions duly authorized to deal in foreign exchange (e.g. commercial banks). Foreign currency must be converted into Brazilian currency and vice-versa through the execution of an exchange contract with a commercial bank. Foreign investments may also be made through the contribution of assets and equipment intended for the local production of goods or services.
Foreign exchange market
Brazil previously operated with two official exchange rate markets, the commercial and floating rate markets, both of which were regulated and monitored by the Central Bank. Participation in a particular market was determined by the nature of the remittance of funds to be made.
In March, 2005 the Central Bank unified both markets and enacted more flexible exchange rules. As a consequence, remittances of funds in and out of Brazil now flow through one single exchange market regardless of the nature of the payments.
Foreign investment registration
Foreign investments in currency or in assets and equipment must be registered with the Central Bank of Brazil. Such registration grants the foreign investor the right to remit dividends and interest and to repatriate the investment. As of August 2000, foreign investments in capital must be registered with the Electronic System of Registration of the online data system of the Central Bank of Brazil (the “SISBACEN Data System”). Since February 2001, foreign loans are also subject to registration in the SISBACEN Data System.
The amount registered with the Central Bank of Brazil as foreign investment includes the sum of (i) the original investment (whether in cash or in kind); (ii) subsequent additional investments (including the capitalization of credits); and (iii) eventual profit reinvestments. This aggregate amount constitutes the basis for repatriation of capital and computation of any eventual capital gain tax, as explained below.
Profit remittance
Since January 1996, profits paid by a Brazilian company to a foreign investor are not subject to any withholding tax. The foreign currency to be remitted must be purchased in the exchange market directly from any commercial bank, upon presentation of the corporate act declaring the dividends, the pertinent financial statements, proof of the tax payment and the registration in the SISBACEN Data System. No further approval or consent of the Central Bank is necessary and there is no limitation on the amounts to be remitted if the original investment has been registered with the Central Bank as described above.
156
Repatriation of capital
Foreign capital invested in Brazil may be repatriated at any time and there is no minimum period of investment. Repatriation of the investment within the amount stated in the SISBACEN Data System may be made free of any tax or authorization. In principle, any excess over the registered amount will be treated as a capital gain, subject to a 15% withholding tax (such rate is increased to 25% in case of investors residing in tax havens) and prior (and discretionary) approval of the Central Bank.
In accordance with an common practice of the Central Bank of Brazil, whenever the total or partial repatriation of capital is sought upon the sale of an investment, the book value of the foreign investment (based on the financial statements of the company which received the investment) will be compared against the amount registered in foreign currency. If the book value is lower than the registered foreign investment, the remittance abroad of any amount exceeding the book value may be understood by the Central Bank as a capital gain, and, as such, subject to a 15% tax.
Other forms of funding Brazilian subsidiaries
The Brazilian foreign debt challenges, combined with other circumstances, forced the market to find various ways to fund Brazilian companies through the issuance of notes and bonds, as well as commercial paper placed outside Brazil under private and public placements. In recent years, the Central Bank has authorized a great volume of issues of bonds, fixed rate notes, floating rate notes, commercial papers and fixed or floating rate certificates of deposit, to be traded abroad. Nonetheless, foreign loans with maturity of less than ninety days are currently subject to a financial transactions tax. Interest paid to foreigners is subject to a 15% withholding tax (such rate is increased to 25% in case of creditors residing in tax heavens). Another source of funding has been the issue of ADRs—American Depositary Receipts and IDRs—International Depositary Receipts.
Peru
At the beginning of the 1990s, former President Alberto Fujimori liberalized price and wage controls in the private sector and eliminated all restrictions on capital flows. Since March 1991, there have been no exchange controls in Peru and all foreign exchange transactions are based on market rates. Prior to March 1991, the Peruvian foreign exchange market consisted of several alternative exchange rates. During the last two decades, the Peruvian currency has experienced a significant number of large devaluations and Peru has consequently adopted and operated under various exchange rate control practices and exchange rate determination policies, ranging from strict control over exchange rates to market-determination of rates. Current Peruvian regulations on foreign investment allow the foreign holders of equity shares and fixed income instruments to receive and repatriate 100% of the proceeds of the investment. Such investors are allowed to purchase foreign exchange at free market exchange rates through any member of the Peruvian banking system.
Colombia
Foreign Investment and Exchange Controls in Colombia
Although the exchange market flows freely, there are exchange regulations that establish those exchange operations that must be channeled through the exchange market, the procedures and penalties for infringement.
The rules applicable on exchange matters are issued jointly by Congress, the Government and the Central Bank. The main regulations on foreign investment and international exchange (“Exchange Regulations”) are set forth in Law 9 of 1991, Decree 2080 of 2000, External Resolution No. 8 of 2000 and Regulation DCIN-83. The law requires all foreign investment to be registered at the Central Bank.
The Central Bank is responsible for Exchange Regulations and managing, recording and authorizing changes in foreign investment. In turn, the Superintendency of Companies is responsible for overseeing compliance with the provisions on foreign investment set forth in the Exchange Regulations. Such foreign investment is divided into (1) direct foreign investment, and (2) portfolio foreign investment.
The foreign investment registered with the Central Bank grants the investor the following rights, known as “exchange rights”:
a. The possibility of repatriating the profits from the registered investment.
b. The possibility of reinvesting such profits in Colombia.
c. The possibility of repatriating sums resulting from the transfer of the investment within the country, the liquidation of the company or the portfolio and/or the reduction of the equity of the recipient company.
157
Foreign Indebtedness
The foreign currency received or paid as a consequence of a credit operation must be channeled through the exchange market. In addition, prior to or simultaneously with the disbursement, it will be required to report the foreign debt to the Central Bank through the exchange market intermediaries.
Up until October 28, 2011, Colombian residents could only obtain credits in foreign currency from foreign financial institutions, foreign market intermediaries or through the placement of securities in international capital markets. Since that date, Banco de la Republica allowed indebtedness with any foreign third party, including related parties. These modalities are considered liability credits since the debtor is a Colombian resident.
On the other hand, Colombian residents may grant loans in foreign currency to non residents and this modality is called active credits since the creditor is a Colombian resident.
E. TAXATION
General
The following discussion summarizes the material Chilean tax and U.S. federal income tax consequences to beneficial owners arising from the purchase, ownership and disposition of the common stock and ADSs. The summary does not purport to be a comprehensive description of all potential Chilean tax and U.S. federal income tax considerations that may be relevant to a decision to purchase, own or dispose of the common stock and ADSs and is not intended as tax advice to any particular investor. This summary does not describe any tax consequences arising under the laws of any state, locality or other taxing jurisdiction other than Chile and the United States. There is currently no income tax treaty in force between the United States and Chile.
Prospective purchasers of the common stock and ADSs should consult their own tax advisors as to the Chilean, United States or other tax consequences of the purchase, ownership and disposition of the common stock and ADSs in their particular circumstances, as well as the application of state, local, foreign or other tax laws.
Chilean tax considerations
The following section is the opinion of Morales y Besa Abogados Limitada as to the material Chilean income tax laws presently in force, including Ruling No. 324 of January 29, 1990 of the Chilean Internal Revenue Service and other applicable regulations and rulings. The discussion summarizes the material Chilean income tax consequences of an investment in the ADSs or shares of common stock received in exchange for ADSs by an individual who is not domiciled in or a resident of Chile or a legal entity that is not organized under the laws of Chile and does not have a permanent establishment located in Chile, which we refer to as a foreign holder. For purposes of Chilean law, an individual holder is a resident of Chile if he or she has remained in Chile for more than six months in one calendar year or for a total of more than six months in two consecutive tax years. An individual holder is domiciled in Chile if he or she resides in Chile with the purpose of staying in Chile (such purpose to be evidenced by circumstances such as the acceptance of employment within Chile or the relocation of his or her family to Chile). This discussion is not intended as tax advice to any particular investor, which can be rendered only in light of that investor’s particular tax situation.
Under Chilean law, provisions contained in statutes such as tax rates applicable to foreign holders, the computation of taxable income for Chilean purposes and the manner in which Chilean taxes are imposed and collected may be amended only by another statute. In addition, the Chilean tax authorities issue rulings and regulations of either general or specific application interpreting the provisions of Chilean tax law. Pursuant to Article 26 of the Chilean Tax Code, Chilean taxes may not be assessed retroactively against taxpayers who in good faith relied on such rulings, regulations and interpretations, but Chilean tax authorities may change such rulings, regulations and interpretations prospectively. On February 4, 2010, a comprehensive income tax treaty between the United States and Chile (the “Proposed U.S.-Chile Treaty”) was signed, however such treaty has not yet been ratified by each country and therefore is not yet effective. It is unclear at this time when such treaty will be ratified by both countries Based on the steps that have already been fulfilled in both countries, such treaty could be ratified within 2014. You should consult your tax adviser regarding the ongoing status of this treaty, and if ratified the impact such treaty would have on the consequences described in this annual report.
Cash dividends and other distributions
Cash dividends paid by us with respect to the ADSs or shares of common stock held by a Foreign Holder will be subject to a 35.0% Chilean withholding tax, which is withheld and paid over by us to the Chilean Treasury. We refer to this as the Chilean withholding tax. A credit against the Chilean withholding tax is available based on the level of corporate income tax, or first category tax, actually paid by us on the taxable income to which the dividend is imputed; however, this credit does not reduce the Chilean withholding tax on a one-for-one basis because it also increases the base on which the Chilean withholding tax is imposed. In addition,
158
distribution of book income in excess of retained taxable income is subject to the Chilean withholding tax, but such distribution is not eligible for the credit. Under Chilean income tax law, for purposes of determining the level of the first category tax that has been paid by us, dividends generally are assumed to have been paid out of our oldest retained taxable profits. From the year 2004 and until 2010, the first category tax rate was 17.0%., resulting in an effective dividend withholding tax rate of approximately 21.69%. From year 2011, As a way to obtain additional funds for the country’s reconstruction plan after the earthquake in February 2010, the first category tax rate was increased to 20.0%, for fiscal year 2011 and for fiscal year 18.5% during 2012, returning fiscal year 2013 to the permanent first category tax rate of 17.0% (Circular Letter No. 95, of 2001 and 63, of 2010). However, on September 24, 2012 Congress passed Law Nº 20,630, which increased the first category tax rate to 20% as from fiscal year 2013 in order to collect funds for financing the Educational Reform. The new Government has announced a tax reform which would likely result in a first category tax rate increase (although the bill has not been filed yet, a 25% rate proposal is expected). The foregoing tax consequences apply to cash dividends paid by us. Dividend distributions made in property (other than shares of common stock) will be subject to the same Chilean tax rules as cash dividends.
Capital gains
Gains realized on the sale, exchange or other disposition by a foreign holder of ADSs (or ADRs evidencing ADSs) will not be subject to Chilean taxation, provided that such disposition occurs outside Chile. The deposit and withdrawal of shares of common stock in exchange for ADRs will not be subject to any Chilean taxes.
Gains recognized on a sale or exchange of shares of common stock received in exchange for ADSs (as distinguished from sales or exchanges of ADSs representing such shares of common stock) by a foreign holder will be subject to both the first category tax and the Chilean withholding tax (the former being creditable against the latter) if (1) the foreign holder has held such shares of common stock for less than one year since exchanging ADSs for the shares of common stock, (2) the foreign holder acquired and disposed of the shares of common stock in the ordinary course of its business or as a regular trader of stock or (3) the sale is made to a company in which the foreign holder holds an interest as partner or shareholder (in the case of open stock corporations such interest must be 10.0% or more of the shares). A 15% withholding will be made on account of the seller’s final taxes. In all other cases, gain on the disposition of shares of common stock will be subject only to the first category tax levied as a sole tax. However, in these latter cases, if it is impossible to determine the taxable capital gain, a 5.0% withholding will be imposed on the total amount to be remitted abroad without any deductions as a provisional payment of the total tax due.
The tax basis of shares of common stock received in exchange for ADSs will be the acquisition value of such shares, adjusted according to the domestic inflation variation between the month preceding the acquisition and the month preceding the sale. The valuation procedure set forth in the Deposit Agreement, which values shares of common stock that are being exchanged at the highest price at which they trade on the Santiago Stock Exchange on the date of the exchange, generally will determine the acquisition value for this purpose. Consequently, the conversion of ADSs into shares of common stock and sale of such shares of common stock for the value established under the Deposit Agreement will not generate a capital gain subject to taxation in Chile, as long as the sale price is equal to the acquisition price fixed at the moment of the conversion. In the event that the sale price is greater than the acquisition price, said capital gain will be subject to the first category tax and the withholding taxes mentioned above.
The distribution and exercise of preemptive rights relating to the shares of common stock will not be subject to Chilean taxation. Amounts received in exchange for the shares or assignment of preemptive rights relating to the shares will be subject to both the first category tax and the Chilean withholding tax (the former being creditable against the latter to the extent described above).
If the Proposed U.S.-Chile Treaty becomes effective, it may further restrict the amount of Chilean tax, if any, imposed on gains derived from the sale or exchange of shares of common stock by U.S. residents eligible for the benefits of the treaty. If the Proposed U.S.-Chile Treaty becomes effective, U.S. investors should consult their tax advisors as to the applicability of the Treaty in their particular circumstances.
The Chilean Internal Revenue Service has not enacted any rule nor issued any ruling about the applicability of the following norms to the foreign holders of ADRs.
Pursuant to an amendment to the Chilean Income Tax Law published on November 7, 2001 (Law No. 19,768, amended by Law 20,448, dated August 13, 2010), the sale and disposition of shares of Chilean public corporations which are actively traded on stock exchanges is exempted from Chilean taxes on capital gains if the sale or disposition was made on a local stock exchange so long as the shares were purchased on a public stock exchange. However, Law N°20,448 limited this benefit to shares acquired and sold on a local stock exchange, with which it is unlikely that it will apply to the sale of share resulting from an exchange of ADSs. Investors who request delivery of ADSs in the form of shares of common stock should consult with their tax advisor to determine whether such shares will be eligible for the foregoing exemption.
159
Exempt capital gains—article 106 of the Chilean income tax law
According to Article 106 of the Chilean Income Tax law, the sale and disposition of shares of Chilean public corporations which are significantly traded on a Chilean stock exchange by foreign institutional investors, such as mutual funds, pension funds and others, is exempted of any Chilean tax on capital gains if the sale or disposition was made through a Chilean stock exchange or a tender offer.
A foreign institutional investor is an entity that is either:
| | • | | a fund that makes public offers of its shares in a country in which public debt has been rated investment grade by an international risk classification agency qualified by the local exchange regulator (“SVS”); |
| | • | | a fund that is registered with a regulatory entity of a country in which public debt has been rated investment grade by an international risk classification agency qualified by the SVS, provided that the investments in Chile, including securities issued abroad that represent Chilean securities, held by the fund represent less than 30% of its share value; |
| | • | | a fund whose investments in Chile, including securities issued abroad representing Chilean securities, represent less than 30% of its portfolio, provided that no more than 10% of the equity or right to the profits of the fund is directly or indirectly owned by Chilean residents; |
| | • | | a pension fund that is exclusively formed by individuals that receive their pension on account of capital accumulated in the fund or its main purpose is to finance the funds of individuals and it is regulated and supervised by the competent foreign authority; |
| | • | | a fund regulated by Chilean Law Nº 18,657 (referred to as Foreign Capital Investment Funds Law), in which case all holders of its shares must reside abroad or be qualified as local institutional investors; or |
| | • | | another kind of institutional foreign investor that complies with the characteristics defined by a regulation with the prior report of the SVS and the Chilean Internal Revenue Service. |
In order to be entitled to the exemption, foreign institutional investors, during the time in which they operate in Chile must:
| | • | | be organized abroad and not be domiciled in Chile; |
| | • | | prove their qualification as foreign institutional investors as mentioned above; |
| | • | | not participate, directly or indirectly, in the control of the issuers of the securities in which it invests and not hold, directly or indirectly, 10% or more of such companies’ capital or profits; |
| | • | | execute an agreement in writing with a Chilean bank or securities broker in which the intermediary is responsible for the execution of purchase and sale orders and for the verification, at the time of the respective remittance, that such remittances relate to capital gains that are exempt from income tax in Chile or, if they are subject to income tax, that the applicable withholdings have been made; and |
| | • | | register in a special registry with the Chilean Internal Revenue Service. |
Exempt capital gains—article 107 of the Chilean income tax law
According to article 107 of the Chilean Income Tax Law, gains derived from the sale or transfer of shares of publicly-traded companies organized in Chile that are actively traded in a stock exchange, as defined in the relevant regulation, are exempt of taxes in Chile, provided that the following requirements are met:
| | • | | The seller must have acquired the shares: (a) in a Chilean stock exchange authorized by the Chilean Superintendency of Securities and Insurance; (b) pursuant to a regulated tender offer carried out according to Title XXV of the Chilean Securities Market Law; (c) at the time of incorporation of the corporation or pursuant to a capital increase; (d) pursuant to the exchange of public traded securities convertible in shares (in this case the acquisition cost of the shares corresponds to the exchange price), or (e) in a redemption of securities from certain mutual funds; |
| | • | | The shares must be sold: (a) in a stock exchange authorized by the Chilean Superintendency of Securities and Insurance; (b) pursuant to a regulated tender offer, or (c) in a contribution of securities on certain mutual funds. |
The exemption under analysis also applies if the sale or transfer of shares is executed within 90 days following the day in which they were no longer considered as actively traded. In such case, the profit exempted from Chilean taxes will be up to the average price of shares within the last 90 days in which they were actively traded. Any profit above the average price will be subject to the general tax regime applicable to the transfer of shares.
160
For these purposes, shares are considered to be significantly traded on a Chilean stock exchange (presencia bursátil) when they (1) are registered in the securities registry kept by the SVS, (2) are registered in a Chilean Stock Exchange; and (3) fulfill at least one of the following requirements: (i) have an adjusted presence equal to or above 25%; or (ii) have a “Market Maker”, as such term is defined in the Norma de Carácter General No. 327, issued by the SVS on January 17, 2012. Accordingly, shares are considered to have a “Market Maker” if the issuer thereof has entered into an agreement with at least one stock broker, and such agreement complies with the requirements set forth in the aforementioned Norma de Carácter General No. 237. Currently, our shares are considered to be significantly traded on a Chilean stock exchange.
Other Chilean taxes
No Chilean inheritance, gift or succession taxes apply to the transfer or disposition of the ADSs by a foreign holder but such taxes generally will apply to the transfer at death or by a gift of shares of common stock by a foreign holder. No Chilean stamp, issue, registration or similar taxes or duties apply to foreign holders of ADSs or shares of common stock.
Withholding tax certificates
Upon request, we will provide to foreign holders appropriate documentation evidencing the payment of the Chilean withholding tax.
Material United States Federal Income Tax Considerations
The following is a discussion as to the material U.S. federal income tax consequences of the acquisition, ownership and disposition of our ADSs under currently applicable law. It does not address any aspect of U.S. federal gift or estate tax, the Medicare tax on net investment income, the alternative minimum tax or the state, local or foreign tax consequences of an investment in our ADSs. This discussion applies to you only if you hold and beneficially own our ADSs as capital assets for tax purposes (generally, property held for investment). This discussion does not apply to you if you are a member of a class of holders subject to special rules, such as:
| | • | | dealers in securities or currencies; |
| | • | | traders in securities that elect to use a mark-to-market method of accounting for securities holdings; |
| | • | | banks or other financial institutions; |
| | • | | tax-exempt organizations; |
| | • | | partnerships and other entities treated as partnerships for U.S. federal income tax purposes or persons holding ADSs through any such entities; |
| | • | | real estate investment trusts; |
| | • | | regulated investment companies; |
| | • | | persons that hold ADSs as part of a hedge, straddle, constructive sale, conversion transaction or other integrated investment; |
| | • | | U.S. holders (as defined below) whose functional currency for tax purposes is not the U.S. dollar; or |
| | • | | persons who actually or constructively own 10.0% or more of the total combined voting power of all classes of our shares (including ADSs) entitled to vote. |
This discussion is based on the U.S. Internal Revenue Code of 1986, as amended, (the “Code”), its legislative history, existing and proposed regulations promulgated thereunder, published rulings and court decisions, all as currently in effect. These laws are subject to change, possibly on a retroactive basis. In addition, this discussion relies in part on our assumptions regarding the projected value of our shares and the nature of our business. Finally, this discussion is based in part upon the representations of the depositary and the assumption that each obligation in the deposit agreement and any related agreement will be performed in accordance with its terms.
You should consult your own tax advisor concerning the particular U.S. federal income tax consequences to you of the purchase, ownership and disposition of our ADSs, as well as the consequences to you arising under the laws of any other taxing jurisdiction.
161
For purposes of the U.S. federal income tax discussion below, you are a “U.S. holder” if you beneficially own our ADSs and are:
| | • | | an individual who is a citizen or resident of the United States for U.S. federal income tax purposes; |
| | • | | a corporation that was created or organized in or under the laws of the United States, any state thereof or the District of Columbia; |
| | • | | an estate the income of which is subject to U.S. federal income tax regardless of its source; or |
| | • | | a trust, if (a) a court within the United States is able to exercise primary supervision over its administration and one or more U.S. persons have the authority to control all substantial decisions of the trust, or (b) the trust has a valid election in effect to be treated as a U.S. person. |
Except where specifically described below, this discussion assumes that we are not a not a “passive foreign investment company” (a “PFIC”) for U.S. federal income tax purposes. For U.S. federal income tax purposes, income earned through a foreign or domestic partnership or other flow-through entity is attributed to its owners. Accordingly, if a partnership or other flow-through entity holds ADSs, the tax treatment of the holder will generally depend on the status of the partner or other owner and the activities of the partnership or other flow-through entity.
U.S. Holders
ADSs. If you hold ADSs, for U.S. federal income tax purposes, you generally will be treated as the owner of the underlying shares that are represented by such ADSs. Accordingly, deposits or withdrawals of shares for ADSs will not be subject to U.S. federal income tax.
Distributions on our ADSs. Cash distributions (including amounts withheld to pay Chilean withholding taxes) made by us to or for the account of a U.S. Holder with respect to ADSs generally will be taxable to such U.S. Holder as ordinary dividend income when such distribution is paid, actually or constructively, out of our current or accumulated earnings and profits (as determined for U.S. federal income tax purposes). Distributions in excess of our current or accumulated earnings and profits will be treated first as a non-taxable return of capital reducing such U.S. Holder’s adjusted tax basis in the ADSs. Any distribution in excess of such U.S. Holder’s adjusted tax basis will be treated as capital gain and will be long-term capital gain if the U.S. Holder held the ADSs for more than one year. Because we do not expect to maintain calculations of our earnings and profits in accordance with U.S. federal income tax principles, U.S. Holders should expect that a distribution will generally be treated as a dividend for U.S. federal income tax purposes. As used below, the term “dividend” means a distribution that constitutes a dividend for U.S. federal income tax purposes.
A U.S. Holder will be entitled, subject to a number of complex limitations and conditions, including a minimum holding period requirement, to claim a U.S. foreign tax credit in respect of any Chilean withholding taxes imposed on dividends received on our ADSs. U.S. Holders who do not elect to claim a foreign tax credit with regard to any foreign income taxes paid or accrued during the taxable year may instead claim a deduction in respect of such withholding taxes. Dividends received with respect to the ADSs will be treated as foreign source income, which may be relevant in calculating such U.S. Holder’s U.S. foreign tax credit limitation. For purposes of the U.S. foreign tax credit limitation, foreign source income is separated into different “baskets,” and the credit for foreign taxes on income in any basket is limited to the U.S. federal income tax allocable to such income. Dividends paid with respect to ADSs should generally constitute “passive category income” for most U.S. Holders. Holders are urged to consult their tax advisors regarding the availability of the foreign tax credit in their particular circumstances.
The U.S. Treasury has expressed concerns that intermediaries in the chain of ownership between the holder of an ADS and the issuer of the security underlying the ADS may be taking actions that are inconsistent with the claiming of foreign tax credits for U.S. holders of ADSs. Such actions would also be inconsistent with the claiming of the reduced rate of tax, described below, applicable to dividends received by certain non-corporate holders. Accordingly, the analysis of the creditability of foreign taxes and the availability of the reduced tax rate for dividends received by certain non-corporate holders, each described below, could be affected by actions taken by parties to whom the ADSs are released and the IRS.
Dividends paid by us generally will not be eligible for the dividends received deduction available under the Code to certain U.S. corporate shareholders. Subject to the above-mentioned concerns by the U.S. Treasury and certain exceptions for short-term and hedged positions, the U.S. dollar amount of dividends received by certain U.S. Holders (including individuals) with respect to the ADSs will be subject to taxation at a rate of 20% if the dividends represent “qualified dividend income.” Dividends paid on the ADSs will be treated as qualified dividend income if (i) the ADSs are readily tradable on an established securities market in the United States and (ii) we were not in the year prior to the year in which the dividend was paid, and are not in the year in which the dividend is paid, a PFIC. Based upon the nature of our current and projected income, assets and activities, we do not expect the ADSs to be shares of a PFIC for U.S. federal income tax purposes.
162
Sales and other dispositions of ADSs. A U.S. Holder generally will recognize capital gain or loss upon the sale, exchange or other taxable disposition of ADSs measured by the difference between the amount realized and the U.S. Holder’s adjusted tax basis in ADSs. Any gain or loss will be long-term capital gain or loss if the ADSs have been held for more than one year. Long-term capital gains of certain U.S. Holders (including individuals) generally are eligible for reduced rates of U.S. federal income taxation. The deductibility of capital losses is subject to certain limitations under the Code.
If a Chilean income tax is withheld on the sale, exchange or other taxable disposition of our ADS, the amount realized by a U.S. Holder will include the gross amount of the proceeds of that sale, exchange or other taxable disposition before deduction of the Chilean income tax. Capital gain or loss, if any, realized by a U.S. Holder on the sale, exchange or other taxable disposition of ADS generally will be treated as U.S. source income or loss for U.S. foreign tax credit purposes. Consequently, in the case of a gain from the sale, exchange or other taxable disposition of our ADS that is subject to Chilean income tax, the U.S. Holder may not be able to benefit from the foreign tax credit for that Chilean income tax (i.e., because the gain from the disposition would be U.S. source), unless the U.S. Holder can apply the credit against U.S. federal income tax payable on other income from foreign sources. Alternatively, the U.S. Holder may take a deduction for the Chilean income tax, provided that the U.S. Holder elects to deduct all foreign income taxes paid or accrued for the taxable year.
Passive foreign investment company rules
Based on current estimates of our gross income and gross assets, the nature of our business and our current business plans (all of which are subject to change), we believe that we were not a PFIC for U.S. federal income tax purposes for our 2014 taxable year and we do not expect to become one in the foreseeable future. However, because the application of the regulations is not entirely clear and because PFIC status depends on the composition of a company’s income and assets and the market value of its assets from time to time, there can be no assurance that we will not be a PFIC for any taxable year. Our U.S. counsel has not rendered an opinion as to our PFIC classification. Rendering such an opinion would be impracticable because it involves an inherently factual test which will depend on our future circumstances. Also, we do not maintain our records in accordance with the U.S. federal income tax accounting principles required to permit a formal opinion to be rendered.
If we were a PFIC for any taxable year during which a U.S. Holder held ADSs, gain recognized by a U.S. Holder on a sale or other taxable disposition (including certain pledges) of the ADSs, and certain “excess distributions,” (as such term is defined under the Code) would be allocated ratably over the U.S. Holder’s holding period for the ADSs. The amounts allocated to the taxable year of the sale, other taxable disposition, or receipt of the excess distribution and to any year before we became a PFIC would be taxed as ordinary income. The amount allocated to each other taxable year would be subject to tax at the highest rate in effect for individuals or corporations, as appropriate, for that taxable year, and an interest charge would be imposed on the amount allocated to that taxable year. Certain elections may be available that would result in alternative treatments (such as mark-to-market treatment) of the ADSs. U.S. Holders are encouraged to consult their tax advisers to discuss the consequences to them if we were, or were to become a PFIC.
A U.S. Holder who owns preferred shares or ADSs during any taxable year that we are a PFIC in excess of certain de minimus amounts and fails to qualify for certain other exemptions would be required to file IRS Form 8621. In addition, under certain circumstances, the temporary regulations also require a “United States person” (as such term is defined under the Code) that indirectly owns common shares through another United States person to file Form 8621 for a taxable year during which such indirect shareholder is treated as receiving an excess distribution in connection with the ownership or disposition of the common shares, or reports income pursuant to a mark-to-market election. U.S. Holders should consult their own tax advisors regarding the application of the PFIC rules to our preferred shares or ADSs and the application of the recently enacted legislation to their particular situation.
U.S. Information reporting and backup withholding rules
In general, dividend payments with respect to the ADSs and the proceeds received on the sale or other disposition of those ADSs may be subject to information reporting to the IRS, and to backup withholding (currently imposed at a rate of 28.0%). Backup withholding will not apply, however, if you (1) are a corporation or come within certain other exempt categories and, when required, can demonstrate that fact or (2) provide a taxpayer identification number, certify as to no loss of exemption from backup withholding and otherwise comply with the applicable backup withholding rules. To establish your status as an exempt person, you will generally be required to provide certification on IRS Form W-9, W-8BEN or W-8ECI, as applicable. Backup withholding is not an additional tax. Any amounts withheld from payments to you under the backup withholding rules will be allowed as a refund or a credit against your U.S. federal income tax liability, provided that you furnish the required information to the IRS.
“Specified Foreign Financial Asset” Reporting
Owners of “specified foreign financial assets” with an aggregate value in excess of U.S.$50,000 (and in some circumstances, a higher threshold), may be required to file an information report with respect to such assets with their U.S. federal income tax returns.
163
“Specified foreign financial assets” generally include any financial accounts maintained by foreign financial institutions as well as any of the following, but only if they are not held in accounts maintained by financial institutions: (i) stocks and securities issued by non-U.S. persons, (ii) financial instruments and contracts held for investment that have non-U.S. issuers or counterparties and (iii) interests in foreign entities. Prospective purchasers should consult their own tax advisors regarding the application of the U.S. federal income tax laws to their particular situations as well as any additional tax consequences resulting from purchasing, holding or disposing of ADSs, including the applicability and effect of the tax laws of any state, local or foreign jurisdiction, including estate, gift, and inheritance laws.
F. DIVIDENDS AND PAYING AGENTS
Not applicable.
G. STATEMENT BY EXPERTS
Not applicable.
H. DOCUMENTS ON DISPLAY
We are required to file annual and special reports and other information with the SEC. You may read and coly any documents filed by the Company at the SEC’s public reference room at 100 F Street, N.E., Room 1580, Washington, D.C. 20549. Please call the SEC at 1-800-SEC-0330 for further information on the public reference room. The SEC also maintains a website at http://www.sec.gov which contains reports and other information regarding registrants that file electronically with the SEC.
I. SUBSIDIARY INFORMATION
Not applicable.
Item 11. Quantitative and Qualitative Disclosures About Market Risk
Market risk.
The Company is exposed to market risk, which involves variations in interest and exchange rates that may affect its financial position, operating results and cash flows. The Company’s hedge policy calls for a periodic review of its exposure to interest and exchange rate risk for its main assets and obligations.
Interest rate risk.
As of December 31, 2014, approximately 44% of the Company’s financial debt, primarily its short-term debt and bonds, was at fixed interest rates. The remaining 56% was at variable interest rates including derivates. Of the variable rate debt, approximately 99% is indexed to local interest rates (either as originally denominated or by re-denominating with derivatives).
The Company has identified as important its interest rate risk generated primarily from variable rate obligations, which are sensitized by measuring the impact on income of a reasonably possible variation in the observed interest rate. Following regulatory guidelines, the deviation in relevant interest rates is estimated using historical series with a daily frequency for each of the identified risk variables. The distribution of percentage changes occurring in three-month intervals is then analyzed and the extreme scenarios that fall outside a confidence interval of 95% are eliminated. The amount of the sensitized exposure corresponds to the total of the variable rate debt.
For variable rate debt, the financial risk refers to the potential upward deviation of cash flows related to interest payments on obligations from a specific target, attributable to the rise in interest rates that are important to the Company’s indebtedness structure, namely: LIBOR, TAB nominal and the Chamber rate (CAM), Chile.
164
As of and for December 31, 2014
| | | | | | | | | | | | | | | | |
Classification | | Currency | | Exposure | | | Market variable | | Change in
risk factor | | | Effect on income | |
| | | | | | | | | | % | | | (ThCh$) | |
Net liability | | USD | | | 400,000,000 | | | LIBOR 1M | | | (36.23 | ) | | | 101,133 | |
| | | | | | | | | | | 33.91 | | | | (94,648 | ) |
Net liability | | Ch$ | | | 79,508,100,000 | | | TAB NOM 90 | | | (42.86 | ) | | | 316,896 | |
| | | | | | | | | | | 43.19 | | | | (319,361 | ) |
Net liability | | Ch$ | | | 184,819,697,369 | | | TAB NOM 180 | | | (37.04 | ) | | | 638,566 | |
| | | | | | | | | | | 45.07 | | | | (777,073 | ) |
Net liability | | Ch$ | | | 607,851,430,000 | | | CAM | | | (43.25 | ) | | | 2,147,451 | |
| | | | | | | | | | | 42.18 | | | | (2,094,005 | ) |
Net liability | | BR$ | | | 698,216,971 | | | CDI | | | (14.82 | ) | | | 668,159 | |
| | | | | | | | | | | 13.18 | | | | (594,228 | ) |
Net liability | | COP$ | | | 296,642,344,553 | | | DTF TA | | | (17.18 | ) | | | 135,386 | |
| | | | | | | | | | | 12.02 | | | | (94,704 | ) |
Net liability | | COP$ | | | 66,762,674,279 | | | IBR | | | (27.01 | ) | | | 48,663 | |
| | | | | | | | | | | 19.89 | % | | | (35,829 | ) |
As of and for December 31, 2013
| | | | | | | | | | | | | | | | | | |
Classification | | Currency | | | Exposure | | | Market variable | | Change in
risk factor | | | Effect on income | |
| | | | | | | | | | | % | | | (ThCh$) | |
Net liability | | BR$ | | | | | 408,216,971 | | | CDI | | | (17.55 | ) | | | 355,709 | |
| | | | | | | | | | | | | 16.69 | | | | (338,364 | ) |
Net liability | | Ch$ | | | | | 79,508,100,000 | | | TAB NOM 90 | | | (41.98 | ) | | | 429,687 | |
| | | | | | | | | | | | | 42.11 | | | | (431,018 | ) |
Net liability | | Ch$ | | | | | 247.319.697.369 | | | TAB NOM 180 | | | (35.80 | ) | | | 1,241,252 | |
| | | | | | | | | | | | | 40.79 | | | | (1,414,333 | ) |
Net liability | | Ch$ | | | | | 608,001,430,000 | | | CAM | | | (51.19 | ) | | | 2,113,604 | |
| | | | | | | | | | | | | 47.06 | | | | (3,468,242 | ) |
The effect on income obtained from a theoretical exercise shows the incremental effect generated from the reasonably possible estimated change (i.e. it corresponds to the difference between the amount that was effectively recorded for the interest payment and the amount that would have been recorded in a scenario of lower or higher interest rates).
The Company’s risk management strategy is to hold its financial debt in variable rates in order to benefit from lower cost of funds and the remainder of its financial debt in fixed rates in order to reduce uncertainty stemming from variable interest payments, by denominating part of its variable interest rate liabilities into fixed rate liabilities using derivative financial instruments for these purposes, which allow the interest rate of the original obligation to be fixed.
Foreign exchange rate risk.
In the countries in which the Company operates, most expenses and income are in local currency. As a result, most of its debt (89%) is denominated in local currency. As of December 31, 2014, approximately 11% of our total outstanding debt was unhedged and subject to currency swings between our functional currency and the U.S. dollars. The remainder of our debt was either in local currencies or hedged with cross currency swaps or other foreign currency hedges. The Company’s policy is to hedge risks from variations in exchange rates on its net liability position in foreign currency using market instruments designed for that purpose.
The Company has identified as important the exchange rate risk generated from obligations in US dollars, Argentine pesos, Peruvian Nuevos Soles and Unidades de Fomento, which are sensitized by measuring the impact on income of a reasonably possible variation in observed exchange rates. Following regulatory guidelines, the deviation in relevant exchange rates is estimated using historical series with a daily frequency for each of the identified risk variables. The distribution of percentage changes occurring in three-month intervals is then analyzed and the extreme scenarios that fall outside a confidence interval of 95% are eliminated.
165
As of and for December 31, 2014
| | | | | | | | | | | | | | | | | | | | | | | | | | |
Classification | | Currency | | Exposure | | | Market
variable | | | Closing
value | | | Change in
risk factor | | | Exchange
rate
value | | | Effect on
income | |
| | | | | | | | | | | | | | % | | | | | | (ThCh$) | |
Net liability | | USD | | | 573,261,055 | | | | USD-CLP | | | | 606.75 | | | | (8,95 | )% | | | 552.46 | | | | 31,120,559 | |
| | | | | | | | | | | | | | | | | 9,74 | % | | | 665.82 | | | | (33,863,241 | ) |
Net liability | | ARG | | | 430,004,718 | | | | ARS-CLP | | | | 71.64 | | | | (14,55 | )% | | | 61.22 | | | | 4,480,841 | |
| | | | | | | | | | | | | | | | | 11,25 | % | | | 79.70 | | | | (3,466,153 | ) |
Net liability | | UF | | | 18,434,243 | | | | CLF-CLP | | | | 24,627.10 | | | | (0,496 | )% | | | 24,504.87 | | | | 2,253,307 | |
| | | | | | | | | | | | | | | | | 2,460 | % | | | 25,232.89 | | | | (11,167,289 | ) |
Net liability | | COP | | | 400,779,827,586 | | | | COP-CLP | | | | 0.26 | | | | (10,505 | )% | | | 0.23 | | | | 10,743,949 | |
| | | | | | | | | | | | | | | | | 9,786 | % | | | 0.28 | | | | (10,009,522 | ) |
Net liability | | PEN | | | 541,187,436 | | | | PEN-CLP | | | | 203.54 | | | | (8,387 | )% | | | 186.47 | | | | 9,238,629 | |
| | | | | | | | | | | | | | | | | 9,450 | % | | | 222.77 | | | | (10,409,018 | ) |
Net liability | | BRL | | | 1,025,118,587 | | | | BRL-CLP | | | | 228.19 | | | | (10,900 | )% | | | 203.32 | | | | 25,497,495 | |
| | | | | | | | | | | | | | | | | 11,433 | % | | | 254.28 | | | | (26,745,359 | ) |
As of and for December 31, 2013
| | | | | | | | | | | | | | | | | | | | | | | | | | | | |
Classification | | Currency | | | Exposure | | | Market
variable | | | Closing
value | | | Change in
risk factor | | | Exchange
rate
value | | | Effect on
income | |
| | | | | | | | | | | | | | | % | | | | | | (ThCh$) | |
Net liability | | | USD | | | | 564,405,018 | | | | USD-CLP | | | | 524.61 | | | | (9.17 | ) | | | 476.51 | | | | 27,150,492 | |
| | | | | | | | | | | | | | | | | | | 10.23 | | | | 578.26 | | | | (30,279,096 | ) |
Net liability | | | ARS | | | | 580,926,715 | | | | ARS-CLP | | | | 80.59 | | | | (13.62 | ) | | | 69.61 | | | | 6,377,540 | |
| | | | | | | | | | | | | | | | | | | 11.75 | | | | 90.06 | | | | (5,501,147 | ) |
Net liability | | | UF | | | | 30,758,874 | | | | CLF-CLP | | | | 23,306.56 | | | | (0.50 | ) | | | 23,190.87 | | | | 3,558,539 | |
| | | | | | | | | | | | | | | | | | | 2.55 | | | | 23,900.74 | | | | (18,276,283 | ) |
Net liability | | | COP | | | | 339,991,902,733 | | | | COP-CLP | | | | 0.27 | | | | (10.24 | ) | | | 0.24 | | | | 9,482,918 | |
| | | | | | | | | | | | | | | | | | | 10.23 | | | | 0.30 | | | | (9,472,797 | ) |
Net liability | | | PEN | | | | 281,143,707 | | | | PEN-CLP | | | | 187.88 | | | | (8.61 | ) | | | 171.71 | | | | 4,545,638 | |
| | | | | | | | | | | | | | | | | | | 9.83 | | | | 206.35 | | | | (5,191,347 | ) |
Net liability | | | BRL | | | | 432,869,191 | | | | BRL-CLP | | | | 222.45 | | | | (11.19 | ) | | | 197.55 | | | | 10,779,103 | |
| | | | | | | | | | | | | | | | | | | 11.74 | | | | 248.57 | | | | (11,304,624 | ) |
The effect on income obtained from a theoretical exercise shows the incremental effect generated from the reasonably possible estimated change (i.e. it corresponds to the difference between the amount that was effectively recorded for exchange differences and the amount that would have been recorded in a scenario of lower or higher exchange rates).
The Company’s strategy is to hold most of its financial debt in local currencies to reduce uncertainty stemming from an increase in the value of its liabilities due to foreign currency fluctuations, using derivative financial instruments for these purposes, which allow the value of the obligation to be expressed in its functional currency.
Additionally, the exposure to exchange rates for conversion of the functional currency of the subsidiaries in Argentina, Colombia, Peru and Brazil, relating to the difference between monetary assets and liabilities (i.e., those denominated in a local currency and consequently exposed to the translation from their functional currencies into the presentation currency for the Company’s consolidated financial statements) is hedge only when it’s predictable that adverse material differences could occur and the cost related to hedging is deemed reasonable by management. The Company currently does not have any net investment hedging contracts.
The Company assesses the fluctuation of the functional currencies compared to the presentation currency through a sensitivity analysis on equity and net assets in local currency using favorable and unfavorable scenarios, the amounts of exposure of all possible scenarios, including a general one, resulting from this analysis are as follows:
| | | | | | | | | | | | | | | | | | | | | | | | |
Currency | | Rate of
conversion | | | Scenarios | | | Flux on assets
M$ | | | Flux% | | | Flux on Equity
M$ | | | Flux
% | |
ARG PESO | | | 69.61 | | | | S1 | | | | (166,875,219 | ) | | | -1.66 | | | | (74,357,968 | ) | | | -1.75 | |
| | | 90.06 | | | | S2 | | | | 146,782,709 | | | | 1.46 | | | | 64,452,636 | | | | 1.51 | |
COP PESO | | | 0.24 | | | | S1 | | | | (193,798,308 | ) | | | -1.93 | | | | (144,412,544 | ) | | | -3.4 | |
| | | 0.30 | | | | S2 | | | | 193,798,308 | | | | 1.93 | | | | 144,412,544 | | | | 3.4 | |
PER SOL | | | 171.71 | | | | S1 | | | | (84,838,874 | ) | | | -0.84 | | | | (56,282,763 | ) | | | -1.32 | |
| | | 206.35 | | | | S2 | | | | 101,398,046 | | | | 1.01 | | | | 67,268,247 | | | | 1.58 | |
BRL REAL | | | 197.55 | | | | S1 | | | | (167,607,178 | ) | | | -1.67 | | | | (93,182,737 | ) | | | -2.19 | |
| | | 248.57 | | | | S2 | | | | 172,270,336 | | | | 1.71 | | | | 95,775,263 | | | | 2.25 | |
All currencies | | | | | | | S1 | | | | (613,119,579 | ) | | | -6.09 | | | | (368,236,012 | ) | | | -8.64 | |
| | | | | | | S2 | | | | 614,249,399 | | | | 6.10 | | | | 371,908,690 | | | | 8.73 | |
166
S1: Scenario 1 represents the most unfavorable exchange rate to be used in converting into the presentation currency, and how that impacts to the net assets and equity of the Company
S2: Scenario 2 represents the most advantageous exchange rate to be used in converting into the presentation currency, and how that impacts to the net investment and equity of the Company
Item 12. Description of Securities Other than Equity Securities
A. DEBT SECURITIES
Not applicable.
B. WARRANTS AND RIGHTS
Not applicable.
C. OTHER SECURITIES
Not applicable.
D. AMERICAN DEPOSITARY SHARES
The Bank of New York Mellon, a New York banking corporation, is the Depositary under our Deposit Agreement dated April 11, 2012.
Each ADS represents three shares (or a right to receive three shares) deposited with the principal Santiago office of Banco Santander Chile, as custodian for the Depositary. Each ADS may also represent any other securities, cash or other property which may be held by the Depositary from time to time. The depositary’s corporate trust office at which the ADSs are administered is located at 101 Barclay Street, New York, New York10286. The Bank of New York Mellon’s principal executive office is located at One Wall Street, New York, New York10286.
You may hold ADSs either (A) directly (i) by having an American Depositary Receipt, also referred to as an ADR, which is a certificate evidencing a specific number of ADSs, registered in your name, or (ii) by having ADSs registered in your name in the Direct Registration System, or (B) indirectly by holding a security entitlement in ADSs through your broker or other financial institution. If you hold ADSs directly, you are a registered ADS holder, also referred to as an ADS holder.
As an ADS holder, we will not treat you as one of our shareholders and you will not have shareholder rights. Chilean law governs shareholder rights. The Depositary is the holder of the shares underlying the ADSs. The deposit agreement among us, the Depositary and holders of ADSs, and all other persons indirectly holding ADSs sets out ADS holder rights as well as the rights and obligations of the depositary. New York law governs the deposit agreement and the ADSs.
Share dividends and other distributions
The Depositary is required, to the extent that in its judgment it can convert Chilean pesos on a reasonable basis into U.S. dollars and transfer the U.S. dollars to the United States, and subject to Chilean law, to convert all cash dividends and other cash distributions that it receives in respect of the deposited shares of Cencosud common stock into U.S. dollars and to distribute the amount thus received (net of the fees and any conversion expenses of the Depositary) to the holders of ADSs in proportion to the number of ADSs representing such shares held by each of them. See “Item 10.—D. Exchange Controls.” The amount distributed also will be reduced by any amounts required to be withheld by us, the Depositary or the Custodian on account of taxes or other governmental charges. If the Depositary determines that in its judgment any currency received by it cannot be so converted on a reasonable basis and transferred, the Depositary may distribute, or in its discretion hold, such foreign currency, without liability for interest thereon, for the respective account of the ADS holders entitled to receive the same.
167
If a distribution upon the deposited shares of Cencosud common stock by us consists of a dividend in, or a free distribution of, shares of Cencosud common stock, upon receipt by or on behalf of the Depositary of such additional shares of Cencosud common stock from us, the Depositary may or shall, if we so request, distribute to the holders of ADSs, in proportion to their holdings, additional ADSs representing the number of shares of Cencosud common stock so received as such dividend or distribution, in either case after deduction or payment of the fees and expenses of the Depositary. If such additional ADSs are not so issued, each ADS shall thereafter also represent the additional shares of Cencosud common stock distributed with respect to the shares of Cencosud common stock represented thereby. In lieu of delivering fractions of ADSs, in any such case, the Depositary will sell the amount of shares of Cencosud common stock represented by the aggregate of such fractions and distribute the net proceeds in dollars, all in the manner and subject to the conditions set forth in the Deposit Agreement.
If we offer or cause to be offered to the holders of shares of Cencosud common stock any rights to subscribe for additional shares of Cencosud common stock or any rights of any other nature, the Depositary, after consultation with us, shall have discretion as to the procedure to be followed in making such rights available to holders of ADSs or in disposing of such rights and distributing the net proceeds thereof as in the case of a distribution received in cash. If at the time of the offering of any such rights the Depositary determines that it is lawful and feasible to do so, the Depositary may, after consultation with us, distribute such rights available to holders by means of warrants or otherwise. To the extent the Depositary determines, in its discretion, that it is not lawful or feasible to make the rights available, it may sell such rights, warrants or other instruments, if a market is available therefor, at public or private sale, at such place or places and upon such terms as the Depositary may deem proper and allocate the net proceeds of such sales, net of the fees and expenses of the Depositary, for the accounts of the holders of ADSs otherwise entitled thereto upon an averaged or other practicable basis without regard to any distinctions among such holders of ADSs because of exchange restrictions or the date of delivery of any ADRs or otherwise. If, by the terms of the rights offering or by reason of applicable law, the Depositary may neither make such rights available to the holders nor dispose of such rights and distribute the net proceeds thereof, the Depositary shall allow the rights to lapse.
The Depositary will not offer such rights to the holders of ADSs unless both the rights and the securities to which the rights relate are either exempt from registration under the Securities Act or are registered under the Securities Act. If a holder of ADSs requests a distribution of warrants or other instruments, notwithstanding that there has been no such registration under the Securities Act, the Depositary will not effect the distribution unless it has received an opinion of our United States counsel satisfactory to the Depositary upon which the Depositary may rely that the distribution is exempt from registration under the provisions of the Securities Act. However, we will have no obligation to file a registration statement under the Securities Act to make available to holders of ADSs any right to subscribe for or to purchase any securities. If an exemption from registration is not available and a registration statement is not filed, holders of ADSs will not be permitted to purchase such securities or otherwise exercise such rights and the Depositary may sell such rights for the account of such holders of ADSs as described in the preceding paragraph. Such a disposal of rights may reduce the proportionate equity interest in us of the holders of ADSs.
The Depositary will send to holders of ADSs anything else we distribute on deposited securities by any means it thinks is legal, fair and practical. If it cannot make the distribution in that way, the Depositary has a choice. It may decide to sell what we distributed and distribute the net proceeds, in the same way as it does with cash. Or, it may decide to hold what we distributed, in which cash ADSs will also represent the newly distributed property. However, the Depositary is not required to distribute any securities (other than ADSs) to holders of ADSs unless it receives satisfactory evidence from us that it is legal to make that distribution.
Issuance of ADSs
The Depositary has agreed that, upon deposit with the Custodian of the requisite number of shares of Cencosud common stock and receipt of evidence satisfactory to it that the conditions to deposit described below have been met, and subject to the terms of the Deposit Agreement, the Depositary will deliver to, or upon the order of, the person or persons specified by the Depositary upon payment of the fees, governmental charges and taxes provided in the Deposit Agreement, the number of ADSs issuable in respect of such deposit.
Cancellation and withdrawal of ADSs
Upon surrender of ADSs at the Corporate Trust Office of the Depositary and payment of the fees of the Depositary and of the taxes and governmental charges, if any, provided for in the Deposit Agreement and subject to the terms thereof, ADS holders are entitled to delivery of the deposited shares of Cencosud common stock, any other property or documents of title at the time represented by the surrendered ADSs.
168
Subject to the terms and conditions of the Deposit Agreement and any limitations established by the Depositary, the Depositary may deliver ADSs prior to the receipt of shares of Cencosud common stock (a “Pre-Release”) and may receive ADSs in lieu of shares of Cencosud common stock. Each Pre-Release shall be:
| | • | | preceded or accompanied by a written representation and agreement from the person to whom ADSs are to be delivered that such person, or its customer, |
| | • | | owns the shares of Cencosud common stock or ADSs to be remitted, as the case may be, |
| | • | | assigns all beneficial right, title and interest in such shares of Cencosud common stock to the Depositary for the benefit of the owners of the ADSs, and |
| | • | | agrees in effect to hold such shares of Cencosud common stock for the account of the Depositary until delivery of the same upon the Depositary’s request, |
| | • | | at all times fully collateralized (such collateral marked to market daily) with cash or such other collateral as the Depositary deems appropriate, |
| | • | | terminable by the Depositary on not more than five business days’ notice, and |
| | • | | subject to such further indemnities and credit regulations as the Depositary reasonably deems appropriate. |
The Depositary will limit the number of ADSs involved in such Pre-Release transactions so that the number of ADSs represented thereby will not, at any one time, exceed 30 percent of the total number of ADSs then outstanding; however, the Depositary reserves the right to change or disregard such limit from time to time as it deems appropriate.
The Depositary shall not be required to accept for deposit any shares of Cencosud common stock unless it receives evidence satisfactory to the Depositary that any approval, if required, has been granted by any governmental body in Chile that is then performing the function of the regulation of currency exchange.
If the person proposing to deposit shares of Cencosud common stock is not domiciled or resident in Chile, the Custodian shall not accept those shares of Cencosud common stock unless it receives from or on behalf of that person sufficient evidence that the shares of Cencosud common stock were purchased in full compliance with the foreign exchange regulations applicable to investments in Chile (either Chapter XIV of the Compendium of Foreign Exchange Regulation of the Central Bank or Decree Law 600 of 1974, as amended, and related agreements with the Foreign Investment Committee) and, if applicable, an instrument whereby that person assigns and transfers to the Depositary any rights it may have under Chilean regulations relating to currency exchange. Pursuant to Chapter XIV of the Compendium of Foreign Exchange Regulations of the Central Bank, the Custodian and/or the Depositary must give notice to the Central Bank of Chile that the shares of Cencosud common stock have been deposited in exchange for ADSs.
If required by the Depositary, shares of Cencosud common stock presented for deposit at any time, whether or not our transfer books or the transfer books of the Foreign Registrar, if applicable, are closed, must also be accompanied by an agreement or assignment, of other instrument satisfactory to the Depositary, which will provide for the prompt transfer to the Custodian of any dividend, or right to subscribe for additional shares of Cencosud common stock or to receive other property which any person in whose name the shares of Cencosud common stock are or have been recorded may thereafter receive upon or in respect of such deposited shares of Cencosud common stock, or in lieu thereof, such agreement of indemnity or other agreement as shall be satisfactory to the Depositary.
At the request, risk and expense of any person proposing to deposit shares of Cencosud common stock, and for the account of such person, the Depositary may receive certificates for shares of Cencosud common stock to be deposited, together with the other instruments herein specified, for the purpose of forwarding such share certificates to the Custodian for deposit hereunder.
Upon each delivery to a Custodian of a certificate or certificates for shares of Cencosud common stock to be deposited hereunder, together with the other documents above specified, such Custodian must, as soon as transfer and recordation can be accomplished, present such certificate or certificates to us or the Foreign Registrar, if applicable, for transfer and recordation of the shares of Cencosud common stock being deposited in the name of the Depositary or its nominee or such Custodian or its nominee.
In the event that Shares are to be redeemed and, as a result, Shares registered in the name of the Custodian are called for redemption by the us, the Depositary will call for the redemption of ADSs (in aggregate number representing the number of Shares registered in the name of the Custodian called for redemption) and may adopt such method as it may deem equitable and practicable to select the ADSs called for redemption.
169
Voting rights
As soon as practicable after receipt of notice of any meeting or solicitation of consents or proxies of holder of shares of Cencosud common stock, as defined in the Deposit Agreement, if we so request, the Depositary has agreed to mail to holders of ADRs registered on the books of the Depositary a notice in English containing
| | • | | such information as is contained in such notice, |
| | • | | a statement that each holder of ADSs at the close of business on a specified record date will be entitled, subject to any applicable provisions of Chilean law and our Bylaws to instruct the Depositary as to the exercise of the voting rights, if any, pertaining to the amount of Cencosud common stock represented by such holders’ ADSs, and |
| | • | | a statement as to the manner in which such instructions may be given, including an express indication that instructions may be given to the Depositary to give a discretionary proxy to a person designated by us. |
Upon the written request of a holder of ADSs on such record date, received on or before the date established by the Depositary for such purpose, the Depositary has agreed to endeavor insofar as practicable to vote or cause to be voted the amount of shares of Cencosud common stock represented by the ADSs in accordance with any instruction set forth in such request. If no instructions are received by the Depositary from a holder of ADSs with respect to any of the shares of Cencosud common stock represented by such holder’s ADSs on or before the date established by the Depositary for such purpose, the Depositary will give a discretionary proxy to a person designated by us to vote the amount of shares of Cencosud common stock represented by those ADSs, unless we have notified the Depositary that (i) we do not wish such proxy given, (ii) we believe substantial shareholder opposition exists, or (iii) we believe the matter to be voted on would have a material and adverse effect on the rights of holders of our shares.
There are no legal or practical impediments to an ADS holder’s ability to vote that are not faced by holders of our shares of common stock except that there can be no assurance that we have request the Depositary to send the notice or that ADS holders will receive notice of meetings in time to instruct the Depositary before the applicable cutoff date.
Record dates
Whenever any cash dividend or other cash distribution shall become payable or any distribution other than cash shall be made, or whenever rights shall be issued with respect to shares of Cencosud common stock or whenever the Depositary shall receive notice of any meeting of holders of shares of Cencosud common stock or shareholders generally, the Depositary will fix a record date that will be the same as, or as near as practicable to the record date fixed by us with respect to the Cencosud common stock for the determination of the holders of ADSs who are entitled to receive such dividend, distribution or rights, or net proceeds of the sale thereof, or to give instructions for the exercise of voting rights at any such meeting, subject to the provisions of the Deposit Agreement. Subject to the Deposit Agreement, only such holders of ADSs at the close of business on such record date shall be entitled to receive or be affected by any such dividend, distribution, proceeds, exchange or other matter or to give such voting instructions.
In the event that the record date determined by the Depositary (the “ADS Record Date”) and that established by us (the “Common Stock Record Date”) are not the same, ADS holders on the Common Stock Record Date who dispose of their ADSs prior to the ADS Record Date will not receive dividends paid in respect of the shares of Cencosud common stock represented by such holder’s ADSs on the Common Stock Record Date.
Reports and other communications
The Depositary will maintain at its transfer office in the Borough of Manhattan, the City of New York, facilities for the execution and delivery, registration of transfers and surrender of ADSs, in accordance with the provisions of the Deposit Agreement, which at reasonable times will be open for our inspection and inspection by the holders of ADSs, provided that such inspection shall not be for the purpose of communication with holders of ADSs in the interest of a business or object other than our business or a matter related to the Deposit Agreement or the ADSs.
We will transmit to the Depositary copies (translated into English) of any communications generally distributed to holders of Cencosud common stock. The Depositary will make available for inspection by ADS holders at the Corporate Trust Office of the Depositary any reports and communications, including any material soliciting voting instructions, received from us that are both
| | • | | received by the Depositary or the Custodian or the nominee of either as a holder of shares of Cencosud common stock and |
| | • | | made generally available to the holders of shares of Cencosud common stock by us. |
The Depositary will also send to ADS holders copies of such reports when furnished by us as provided in the Deposit Agreement.
170
On or before the first date on which we give notice, by publication or otherwise, of any meeting of the holders of shares of Cencosud common stock or shareholders generally, or of any adjourned meeting of such holders, or of the taking of any action in respect of any cash or other distributions or offering of any rights, we shall transmit to the Depositary and the Custodian a written English-language version of the notice thereof in the form given or to be given to holders of shares of Cencosud common stock. The Depositary will, if we request, at our expense, arrange for the mailing of such notices to all ADR holders.
Payment of taxes
If any tax or governmental charge becomes payable with respect to any ADS or any shares of Cencosud common stock represented by any ADSs, including without limiting the generality of the foregoing any Chilean tax on a gain realized, or deemed to be realized, upon the withdrawal or sale of shares of Cencosud common stock, such tax or other governmental charge will be payable to the Depositary by the holder of the ADSs, who must pay the amount thereof to the Depositary upon demand. The Depositary may refuse to effect any transfer of such ADSs or any withdrawal of the shares of Cencosud common stock represented by such ADSs until such payment is made, and may withhold any dividends or other distributions, or may sell for the account of the holder of the ADS thereof any part or all of the shares of Cencosud common stock represented by such ADSs, and may apply such dividends or other distributions or the proceeds of any such sale in payment of such tax or other governmental charge and the holder of such ADSs shall remain liable for any deficiency. In the event the Depositary determines that there is a reasonable possibility that a tax would be imposed upon the withdrawal of shares in exchange for surrendered ADSs the Depositary may require, as a condition to such exchange, that the withdrawing investor provide satisfactory security to the Depositary in an amount sufficient to cover the estimated amount of such tax.
Amendment and termination
The form of the ADRs and the Deposit Agreement may at any time be amended by written agreement between us and the Depositary. Any amendment that imposes or increases any fees or charges (other than taxes and other governmental charges, registration fees, cable, telex, or facsimile transmission costs, delivery costs or other such expense) or that otherwise prejudices any substantial existing right of ADS holders, will not take effect as to outstanding ADSs until the expiration of 30 days after notice of such amendment has been given to the record holders of outstanding ADSs. Every holder of ADSs at the time such amendment so becomes effective will be deemed, by continuing to hold such ADSs, to consent and agree to such amendment and to be bound by the Deposit Agreement or the ADRs as amended thereby. In no event may any amendment impair the right of any ADS holder to surrender its ADSs and receive therefor the shares of Cencosud common stock represented thereby, except in order to comply with mandatory provisions of applicable law.
Whenever we direct, the Depositary has agreed to terminate the Deposit Agreement by mailing notice of such termination to the holders of ADSs at least 30 days prior to the date fixed in such notice for such termination. The Depositary may likewise terminate the Deposit Agreement at any time 60 days after the Depositary shall have delivered to us its written resignation provided that a successor depositary shall not have been appointed and accepted its appointment before the end of such 60-day period. If any ADSs remain outstanding after the date of termination, the Depositary thereafter will discontinue the registration of transfers of ADSs, will suspend the distribution of dividends to the holders thereof and will not give any further notices or perform any further acts under the Deposit Agreement, except that the Depositary will continue the collection of dividends and other distributions pertaining to the shares of Cencosud common stock, the sale of property and rights as provided in the Deposit Agreement and the delivery of shares of Cencosud common stock, together with any dividends or other distributions received with respect thereto and the net proceeds of the sale of any rights or other property, in exchange for surrendered ADSs. At any time after the expiration of four months from the date of termination, the Depositary may sell the shares of Cencosud common stock and hold the net proceeds, together with any other cash then held, unsegregated and without liability for interest, for the pro rata benefit of the holders of ADSs that have not theretofore been surrendered.
Limits on our obligations and the obligations of the depositary; limits on liability to ADS holders
Neither we nor the Depositary assume any obligation nor will we be subject to any liability under the Deposit Agreement to holders of ADSs, except that we agree to perform our obligations specifically set forth in the Deposit Agreement without negligence or bad faith. Neither we nor the Depositary will be under any obligation to appear in, prosecute or defend any action, suit or other proceeding in respect of any Deposited Securities or in respect of the ADRs on behalf of any holder of ADSs or other person, and the Custodian will not be under any obligation whatsoever with respect to such proceedings, the responsibility of the Custodian being solely to the Depositary. The Depositary will not be liable for any acts or omissions made by a successor depositary whether in connection with a previous act or omission of the Depositary or in connection with any matter arising wholly after the removal or resignation of the Depositary, provided that in connection with the issue out of which such potential liability arises the Depositary performed its obligations without negligence or bad faith while it acted as Depositary. The Depositary will not be responsible for any failure to carry out any instructions to vote any of the Deposited Securities, or for the manner in which any such vote is cast or the effect of any such vote, provided that any such action or non-action is without negligence and in good faith. None of the limitations described in this section will affect investor rights under U.S. federal securities laws.
171
Disclosure of interest in ADSs
Holders of ADSs are subject to certain provisions of the rules and regulations promulgated under the Exchange Act relating to the disclosure of interests in the shares of Cencosud common stock. Any holder of ADSs who is or becomes directly or indirectly interested in five percent (or such other percentage as may be prescribed by law or regulation) or more of the outstanding shares of Cencosud common stock must within ten days after becoming so interested and thereafter upon certain changes in such interests notify us as required by such rules and regulations. In addition, holders of ADSs as a matter of Chilean law are subject to the reporting requirements contained in Articles 12 and 54 and Title XV of Law 18,045 of Chile, which provision may apply when a holder beneficially owns ten percent or more of the Cencosud common stock or has the intention of taking control of Cencosud. See “Item 10. B. Memorandum and Articles of Association.”
Requirements for depositary actions
As a condition precedent to the delivery, registration of transfer or surrender of any ADSs or any split up or combination of ADR or withdrawal of any shares of Cencosud common stock, we, the Depositary or the Custodian may require from the holder or the presenter of the ADR or the depositor of the shares.
| | • | | payment of a sum sufficient to pay or reimburse the Depositary, the Custodian or us for any tax or other governmental charge and any stock transfer or registration fee or any charge of the Depositary upon delivery of the ADS or upon surrender of the ADS, as set forth in the Deposit Agreement, and |
| | • | | the production of proof satisfactory to the Depositary or Custodian of the identity or genuineness of any signature and proof of citizenship, residence, exchange-control approval, legal or beneficial ownership, compliance with all applicable laws and regulations, compliance with all other applicable provisions governing the shares of Cencosud common stock and the terms of the Deposit Agreement or other information as the Depositary may deem necessary or proper or as we may require by written request to the Depositary or the Custodian. |
The delivery, registration, registration of transfer of ADSs or split-up or combination of ADRs, or the deposit or withdrawal of shares of other property represented by ADSs, in particular instances or generally, may be suspended during any period when the transfer books of the Depositary are closed, or if any such action is deemed necessary or advisable by the Depositary or us at any time or from time to time.
The Depositary will act as ADS registrar or appoint a registrar or one or more co-registrars for registration of the ADSs in accordance with any requirements of the New York Stock Exchange or of any other stock exchange on which the ADSs may be listed or quoted.
The Depositary may appoint one or more co-transfer agents for the purpose of effecting transfers of ADSs or combinations and split-ups of ADRs at designated transfer offices on behalf of the Depositary. In carrying out its functions, a co-transfer agent may require evidence of authority and compliance with applicable laws and other requirements by holders of ADSs or persons entitled to ADSs and will be entitled to protection and indemnity to the same extent as the Depositary.
Books of depositary
The transfer of the ADSs is registrable on the books of the Depositary, provided, however, that the Depositary may close the transfer books at any time or from time to time when deemed expedient by it in connection with the performance of its duties.
Valuation of underlying shares for Chilean law purposes
For all purposes of valuation under Chilean law, the Deposit Agreement provides that the acquisition value of the shares of Cencosud common stock delivered to any holder upon surrender of ADSs shall be the highest reported sales price of the Cencosud common stock on the Santiago Stock Exchange for the day on which the transfer of the Cencosud common stock is recorded under the name of such holder on our books. In the event that no such sales price is reported by the Santiago Stock Exchange or another organized securities market during that day, the value shall be deemed to be the highest sale price on the day during which the last trade took place. However, if more than 30 days have lapsed since the last trade, such value shall be adjusted in accordance with the variation of the Chilean Consumer Price Index for the corresponding term.
172
Depositary Fees and Expenses
Pursuant to the Deposit Agreement, holders of our ADSs may have to pay to The Bank of New York Mellon, either directly or indirectly, fees or charges up to the amounts set forth in the table below:
| | | | |
| Persons depositing or withdrawing shares or ADS holders must pay: | | For: | | |
| $5.00 (or less) per 100 ADSs (or portion of 100 ADSs) | | • | | Issuance of ADSs, including issuances resulting from a distribution of shares or rights or other property |
| | |
| | • | | Cancellation of ADSs for the purpose of withdrawal, including if the Deposit Agreement terminates or if ADSs are redeemed |
| | |
| $.05 (or less) per ADS | | • | | Any cash distribution to ADS holders |
| | |
| A fee equivalent to the fee that would be payable if securities distributed to you had been shares and the shares had been deposited for issuance of ADSs | | • | | Distribution of securities distributed to holders of deposited securities which are distributed by the Depositary to ADS holders |
| | |
| $.05 (or less) per ADSs per calendar year | | • | | Depositary services |
| | |
| Registration or transfer fees | | • | | Transfer and registration of shares on our share register to or from the name of the Depositary or its agent when you deposit or withdraw shares |
| | |
| Expenses of the Depositary | | • | | Cable, telex and facsimile transmissions (when expressly provided in the deposit agreement) |
| | |
| | • | | converting foreign currency to U.S. dollars |
| | |
| Taxes and other governmental charges the depositary or the custodian have to pay on any ADS or share underlying an ADS, for example, stock transfer taxes, stamp duty or withholding taxes | | • | | As necessary |
| | |
| Persons depositing or withdrawing shares or ADS holders must pay: | | | | For: |
| Any charges incurred by the Depositary or its agents for servicing the deposited securities | | • | | As necessary |
The Depositary collects its fees for delivery and surrender of ADSs directly from investors depositing shares or surrendering ADSs for the purpose of withdrawal or from intermediaries acting for them. The Depositary collects fees for making distributions to investors by deducting those fees from the amounts distributed or by selling a portion of distributable property to pay the fees. The Depositary may collect its annual fee for depositary services by deduction from cash distributions or by directly billing investors or by charging the book-entry system accounts of participants acting for them. The Depositary may generally refuse to provide fee-attracting services until its fees for those services are paid.
From time to time, the Depositary may make payments to us to reimburse and / or share revenue from the fees collected from ADS holders, or waive fees and expenses for services provided, generally relating to costs and expenses arising out of establishment and maintenance of the ADS program. In performing its duties under the Deposit Agreement, the Depositary may use brokers, dealers or other service providers that are affiliates of the Depositary and that may earn or share fees or commissions.
Depositary Payments
Cencosud S.A. received from The Bank of New York Melon U.S.$ 981,841 during 2014 as depositary payments in connection with its American Depositary Shares program.
173
PART II
Item 13. Defaults, Dividend Arrearages and Delinquencies
Not applicable.
Item 14. Material Modifications to the Rights of Security Holders and Use of Proceeds
A. USE OF PROCEEDS
Not applicable.
Item 15. Controls and Procedures.
(a)Disclosure Controls and Procedures.
Our management, with the participation of our Chief Executive Officer and Chief Financial Officer, has conducted and evaluated the effectiveness of our disclosure controls and procedures as of December 31, 2014, pursuant to Rule 13a-15 promulgated under the Securities Exchange Act of 1934, as amended (the “Exchange Act”). Based on this evaluation, our Chief Executive Officer and Chief Financial Officer concluded that our disclosure controls and procedures were effective as of December 31, 2014.
Disclosure controls and procedures means controls and other procedures that are designed to ensure that information we are required to disclose in the reports that we file or submit under the Securities Exchange Act, is recorded, processed, summarized and reported within the time periods specified in the SEC’s rules and forms and, that such information required to be disclosed by us in the reports that we file or submit under the Exchange Act is accumulated and communicated to our management, including our Chief Executive Officer and Chief Financial Officer, or persons performing similar functions, as appropriate to allow timely decisions regarding required disclosure.
(b)Management’s annual report on internal control over financial reporting (ICFR)
Our management is responsible for establishing and maintaining adequate internal control over financial reporting as defined in Rules 13a-15(f) and 15d-15(f) under the Securities Exchange Act. The Company’s internal control over financial reporting is a process designed under the supervision of the Company’s Chief Executive Officer and Chief Financial Officer to provide reasonable assurance regarding the reliability of financial reporting and the preparation of financial statements for external purposes in accordance with generally accepted accounting principles and includes those policies and procedures that:
| | (i) | pertain to the maintenance of records that, in reasonable detail, accurately and fairly reflect the transactions and dispositions of the Company’s assets; |
| | (ii) | provide reasonable assurance that transactions are recorded as necessary to permit preparation of financial statements in accordance with generally accepted accounting principles, and that receipts and expenditures are being made only in accordance with authorization of the Company’s management and directors; and |
| | (iii) | provide reasonable assurance regarding prevention or timely detection of unauthorized acquisition, use or disposition of the Company’s assets that could have a material effect on the financial statements. |
Because of its inherent limitations, internal control over financial reporting may not prevent or detect misstatements. Also, projections of any evaluation of the effectiveness to future periods are subject to the risk that controls may become inadequate and that the degree of compliance with the policies or procedures may deteriorate.
Our management, with the participation of our Chief Executive Officer and Chief Financial Officer, has assessed the effectiveness of Cencosud’s internal control over financial reporting as of December 31, 2014 based on the criteria established inInternal Control—Integrated Framework (1992) issued by the Committee of Sponsoring Organizations of the Treadway Commission (“COSO”).
Based on this evaluation, our management concluded that our internal control over financial reporting was effective as of December 31, 2014 based on criteria inInternal Control – Integrated Framework (1992) issued by the COSO.
(c) Attestation Report of the registered public accounting firm
The effectiveness of our internal control over financial reporting as of December 31, 2014 has been audited by PricewaterhouseCoopers Consultores, Auditores y Compañía Limitada, an independent registered public accounting firm, as stated in their report which appears herein.
174
Remediation of Previously Disclosed Material Weakness in Internal Control Over Financial Reporting
During the year ended December 31, 2014, we implemented measures to improve controls and address a previously identified material weakness resulting from the aggregation of the potential impact of three issues in our IT environment: inadequate controls over segregation of duties and restricted access to the system, late removal of the former users access, and lack of monitoring controls over emergency user accounts. These measures included:
| | • | | Inadequate controls over segregation of duties and restricted access to the system: The Company deployed IT Tools in order to enhance controls over segregation of duties and access to critical transactions, and completed the implementation of software which assists management in automating and controlling the end-user provisioning process. |
| | • | | Late removal of the former users access: The Company implemented controls for the timely removal of access for terminated and inactive users. |
| | • | | Lack of monitoring controls over emergency users accounts: The Company enhanced controls related to the emergency account provisioning process and implemented monitoring controls related to these user accounts. |
After completing our testing of the design and operating effectiveness of these new procedures, we concluded that we have remediated the previously identified material weakness as of December 31, 2014.
(d)Changes in internal control over financial reporting.
Our management, with the participation of our Chief Executive Officer and Chief Financial Officer, conducted an evaluation of our internal control over financial reporting, and have identified the changes in the aforementioned remediation efforts were changes in internal control over financial reporting that occurred during the year ended December 31, 2014 that have materially affected, or are reasonably likely to materially affect, the Company’s internal control over financial reporting.
Item 16A. Audit Committee Financial Expert
The members of the audit committee are David Gallagher, Roberto Philipps and Cristián Eyzaguirre, each of whom is independent within the meaning of the SEC corporate governance rules. Our Board of Directors has determined that Roberto Philipps is “audit committee financial expert” as defined by the SEC.
Item 16B. Code of Ethics
We have adopted a code of ethics and business conduct that applies to our directors, executive officers and all employees. The text of our code of ethics is posted on our web site at:www.cencosud.com/inversionistas/ under the “informacion de interes” tab. The information on our website is not incorporated by reference into this document.
Item 16C. Principal Accountant Fees and Services
The following table sets forth the aggregate fees by categories specified below in connection with certain professional services rendered by PricewaterhouseCoopersConsultores, Auditores y Compañia Limitada (“PwC”), an independent registered public accounting firm and our principal external auditors, for the periods indicated. Except as set forth below, we did not pay any other fees to our auditors during the periods indicated below.
| | | | | | | | | | | | |
| | | For the year ended December 31, | |
| | | (in thousands of Ch$) | |
| | | 2014 | | | 2013 | | | 2012 | |
Audit Fees(1) | | | 6,700,051 | | | | 7,697,867 | | | | 5,859,442 | |
Audit- Related Fees(2) | | | 376,910 | | | | 86,450 | | | | 277,914 | |
Tax Fees(3) | | | 114,000 | | | | 312,431 | | | | 393,073 | |
Total | | | 7,190,961 | | | | 8,096,748 | | | | 6,530,429 | |
| (1) | “Audit fees” means the aggregate fees billed for professional services rendered by our principal auditors for the audit of our annual financial statements as well as in connection with audit services for SEC or other regulatory filings, including the initial public offering. |
175
| (2) | “Audit-related fees” represents aggregate fees billed for professional services rendered by our principal auditors for the assurance and related services. |
| (3) | “Tax Fees” in the above table are fees billed for tax compliance and tax consultations in Argentina, Brazil, Chile, Peru and Colombia. |
Our audit committee pre-approves all audit and non-audit services provided by our independent auditor pursuant to the Sarbanes-Oxley Act of 2002.
Item 16D. Exemptions from the Listing Standards for Audit Committees
Not applicable.
Item 16E. Purchases of Equity Securities by the Issuer and Affiliated Purchasers
Not applicable.
Item 16F. Change in Registrant’s Certifying Accountant
During the years ended December 31, 2014, 2013 and 2012 and through the date of this annual report, the principal independent accountant engaged to audit our financial statements, PwC, has not resigned, indicated that it has declined to stand for re-election after the completion of its current audit or been dismissed. For each of the years ended December 31, 2014, 2013 and 2012, PwC has not expressed reliance on another accountant or accounting firm in its report on our audited annual financial statements for such periods.
During the years ended December 31, 2014, 2013 and 2012 and through the date of this annual report, we have not engaged a new independent accountant as either the principal accountant to audit the our financial statements, or as an independent accountant to audit a significant subsidiary and on whom the principal accountant is expected to express reliance in its report.
Item 16G. Corporate Governance
General Summary of Significant Differences With Regard To Corporate Government Standards
As a foreign private issuer, we may follow our home country’s corporate governance practices in lieu of most of the NYSE’s corporate governance listing standards, or the NYSE Standards. Our corporate governance practices differ in certain significant respects from those that U.S. companies must adopt in order to maintain NYSE listing and, in accordance with Section 303A.11 of the NYSE Listed Company Manual, a brief, general summary of those differences is provided as follows.Composition of the Board of Directors; Independence. The NYSE listing standards provide that listed companies must have a majority of independent directors and that certain board committees must consist solely of independent directors. Under NYSE rule 303A.02, a director qualifies as independent only if the board affirmatively determines that such director has no material relationship with the company, either directly or indirectly. In addition, the NYSE listing standards enumerate a number of relationships that preclude independence.
Under the amendment to the Chilean Corporations Act, in effect as of January 1, 2010, an open-stock corporation must have at least one independent director (out of a minimum of seven directors) when its market capitalization reaches or exceeds 1.5 millionUnidades de Fomento (as of December 31, 2014 approximately Ch$ 4,374,558 million) and at least 12.5% of its outstanding shares with voting rights are in the possession of shareholders that individually control or possess less than 10% of such shares. In addition, the Chilean Corporation Act enumerates a number of relationships that preclude independence. The Chilean law also establishes a number of principles of general applicability designed to avoid conflicts of interests and to establish standards and procedures to conduct related party transactions. Specifically, directors elected by a group or class of shareholders have the same duties to the company and to the other shareholders as the rest of the directors, and all transactions with the company in which a director has an interest, must be in the interest of and for the benefit of the company, compare in price, terms and conditions to those prevailing in the market at the time of its approval and comply with the requirements and procedures set forth in Chapter XVI of the Chilean Corporation Act. See “Item 7. Major Shareholders and Related Party Transactions.”
Furthermore, such transactions must be reviewed by the directors committee (as defined below); they require prior approval by the board of directors, excluding interested directors, and must be disclosed at the next meeting of shareholders, unless such transactions fall within one the exemptions contemplated by the Chilean Corporations Act (i.e.,di minimis transaction amount, or if the counterparty is a wholly owned subsidiary or when the transaction falls within the ordinary course as so determined in the company’s policy on recurring business transactions as approved by the board of directors). See “Item 7. Major Shareholders and Related Party Transactions.” Pursuant to NYSE rule 303A.00, we may follow Chilean practices and are not required to have a majority of independent directors.
176
Committees. The NYSE listing standards require that listed companies have a Nominating/Corporate Governance Committee, a Compensation Committee and an Audit Committee. Each of these committees must consist solely of independent directors and must have a written charter that addresses certain matters specified by the listing standards.
Under Chilean law, the only board committee that is required is the directors committee (comité de directores), composed of three members, such committee having a direct responsibility to (a) review the company’s financial statements and the independent auditors’ report and issue an opinion on such financial statements and report prior to their submission for shareholders’ approval, (b) make recommendations to the board of directors with respect to the appointment of independent auditors and risk rating agencies that the board may propose to the shareholders at a shareholders’ meeting, (c) review related party transactions, and issue a report on such transactions, (d) review the managers, principal executive officers’ and employees’ compensation policies and plans, (e) prepare an annual report of the performance of its duties, including the principal recommendations to shareholders; (f) report to the board of directors the convenience of retaining non-audit services from its external auditors, if the nature of such services could impair their independence; and (g) perform other duties as defined by the company’s bylaws, by the general shareholders’ meeting or by the board. Requirements to be deemed an independent director are set forth in “Item 6. Directors, Senior Management and Employees—Board Practices.”
Shareholder Approval of Equity-Compensation Plans. Under NYSE listing standards, shareholders must be given the opportunity to vote on all equity-compensation plans and material revisions thereto, with limited exemptions. An “equity-compensation plan” is a plan or other arrangement that provides for the delivery of equity securities of the listed company to any employee, director or other service provider as compensation for services.
Under Chilean law, if previously approved by shareholders at an extraordinary shareholders’ meeting, up to ten percent of a capital increase in a publicly traded company may be set aside to fund equity-compensation plans for the company’s employees and/or for the employees of the company’s subsidiaries. Pursuant to NYSE rule 303A.00, as a foreign private issuer, we may follow Chilean practices and are not required to comply with the NYSE listing standards with respect to shareholder approval of equity-compensation plans.
Corporate Governance Guidelines. The NYSE listing standards provide that listed companies must adopt and disclose corporate governance guidelines with regard to (a) director qualifications standards; (b) director responsibilities; (c) director access to management and independent advisors; (d) director compensation; (e) director orientation and continuing education; (f) management succession; and (g) annual performance evaluation of the board. Chilean law does not require that such corporate governance guidelines be adopted. Director responsibilities and access to management and independent advisors are directly provided for by applicable law. Director compensation is determined by the annual meeting of shareholders pursuant to applicable law. As a foreign private issuer, we may follow Chilean practices and are not required to adopt and disclose corporate governance guidelines.
During 2012, the Superintendence of Securities and Insurance (Superintendencia de Valores y Seguros, or “SVS) adopted new regulations that require publicly traded corporations to produce information about the standards of their corporate governance currently in place and disclose such information not later than June 30, 2013 and thereafter on March 31 of each calendar year.
In compliance with such regulations, the Company intends to deliver and make public the relevant information about its corporate governance practices and policies as currently in effect, as well as the corporate governance practices and policies that it is either in the process of adopting or reviewing for future implementation.
Code of Business Conduct. The NYSE listing standards require that listed companies adopt and disclose a code of business conduct and ethics for directors, officers and employees, and promptly disclose any waivers of the code for directors or executive officers.
We have adopted a code of ethics, which includes business conduct guidelines that apply generally to all of our executive officers and employees. A copy of this code of business conduct, as amended, is available in our website atwww.cencosud.com/inversionistas/ under the “informacion de interes” tab. The information on our website is not incorporated by reference into this document.
Information of Interest to the Market. In 2008, the SVS promulgated new rules which require public companies to adopt a manual regarding disclosure of information of interest to the market, board members and executives shares transactions and black-out periods for such transactions. This manual applies to our directors, the directors of our subsidiaries, our executive officers, some of our employees which may be in possession of confidential, reserved or privileged information of interest, and to our advisors. The manual took effect on June 1, 2008. A copy of the manual regarding disclosure of information of interest to the market, as amended on March 18, 2010, is available in our website athttp://www.cencosud.com/inversionistas/. The information on our website is not incorporated by reference into this document.
177
Executive Sessions. To empower non-management directors to serve as a more effective check on management, NYSE listing standards provide that non-management directors of each company must meet at regularly scheduled executive sessions without management.
Under Chilean law, the office of director is not legally compatible with that of a company officer in publicly traded companies. The board of directors exercises its functions as a collective body and may partially delegate its powers to executive officers, attorneys, a director or a board commission of the company, and for specific purposes to other persons. As a foreign private issuer, we may follow Chilean practices and are not required to comply with the NYSE listing standard for executive sessions.
Certification Requirements. Under NYSE listing standards, Section 303A.12 (a) provides that each listed company CEO must certify to the NYSE each year that he or she is not aware of any violation by the company of NYSE corporate governance listing standards and Section 303A.12 (b) provides that each listed company CEO must promptly notify the NYSE in writing after any executive officer of the listed company becomes aware of any material non-compliance with any applicable provisions of Section 303A.
As a foreign private issuer, we must comply with Section 303A.12 (b) of the NYSE listing standards, but we are not required to comply with 303A.12 (a).
Item 16H. Mine Safety Disclosure
Not applicable.
PART III
Item 17. Financial Statements
We have responded to Item 18 in lieu of responding to this item.
Item 18. Financial Statements.
See pages F-1 through F-219 of this annual report.
Item 19. Exhibits
| | |
Exhibit
No. | | Description |
| |
| 1.1 | | Restated bylaws of Cencosud S.A., previously filed as exhibit 1.1 to the Company’s annual report on Form 20-F (File No. 001-35575) for the year ended December 31, 2012, filed with the Securities and Exchange Commission on May 7, 2013 (“2012 Form 20-F”) and incorporated by reference herein. |
| |
| 4.1 | | Stock Purchase Agreement among UBS A.G., London Branch, as buyer, Palermo Argentina Holdings I, S.L., Palermo Argentina Holdings II, S.L., International Finance Corporation, SCF Chile S.A., BSSF Chile S.A., and BSSFP Chile S.A, as sellers, dated March 30, 2011, previously filed as exhibit 10.1 to the Company’s registration statement on Form F-1 (File No. 333-181711) filed with the Securities and Exchange Commission on May 25, 2012 (“Form F-1”) and incorporated by reference herein. |
| |
| 4.2 | | Option Agreement between Cencosud S.A. and UBS A.G., London Branch, dated March 30, 2011, and related documents, previously filed as exhibit 4.2 to the Company’s 2012 Form 20-F and incorporated by reference herein. |
| |
| 4.3 | | Indenture, dated as of January 20, 2011, among Cencosud S.A., as issuer, Cencosud Retail S.A., as guarantor, and The Bank of New York Mellon, as trustee, paying agent, registrar and transfer agent, and The Bank of New York Mellon (Luxembourg) S.A., as Luxembourg paying agent and Luxembourg transfer agent, previously filed as exhibit 4.3 to the Company’s 2012 Form 20-F and incorporated by reference herein. |
| |
| 4.4 | | Indenture, dated as of December 6, 2012, among Cencosud S.A., as issuer, Cencosud Retail S.A., as guarantor, and The Bank of New York Mellon, as trustee, paying agent, registrar and transfer agent, and The Bank of New York Mellon (Luxembourg) S.A., as Luxembourg paying agent and Luxembourg transfer agent, previously filed as exhibit 4.4 to the Company’s 2012 Form 20-F and incorporated by reference herein. |
178
| | |
Exhibit
No. | | Description |
| |
| 4.5 | | Credit Agreement, dated as of October 17, 2012, among Cencosud S.A., as borrower, the lenders party thereto, and JPMorgan Chase Bank, National Association, as Administrative Agent, previously filed as exhibit 4.5 to the Company’s 2012 Form 20-F and incorporated by reference herein. |
| |
| 4.6 | | Share Purchase Agreement, dated as of October 18, 2012, between Carrefour Nederland B.V., Carrefour S.A. and Cencosud S.A., previously filed as exhibit 4.6 to the Company’s 2012 Form 20-F and incorporated by reference herein. |
| |
| 4.7 | | English language summary of the 2013 Plan—Stock Option Plan, previously filed as exhibit 10.3 to the Company’s registration statement on Form F-1 and incorporated by reference herein. |
| |
| 4.8 | | English language summary of the Incentive Plan—Stock Option Plan, previously filed as exhibit 10.4 to the Company’s registration statement on Form F-1 and incorporated by reference herein. |
| |
| 4.9 | | English language summary of the Retention Plan—Stock Option Plan, previously filed as exhibit 4.9 to the Company’s 2012 Form 20-F and incorporated by reference herein. |
| |
| 4.10 | | Indenture, dated as of February 12, 2015, among Cencosud S.A., as issuer, Cencosud Retail S.A., as guarantor, and The Bank of New York Mellon, as trustee, paying agent, registrar and transfer agent, and The Bank of New York Mellon (Luxembourg) S.A., as Luxembourg paying agent and Luxembourg transfer agent, relating to the Senior Notes due 2025. |
| |
| 4.11 | | Indenture, dated as of February 12, 2015, among Cencosud S.A., as issuer, Cencosud Retail S.A., as guarantor, and The Bank of New York Mellon, as trustee, paying agent, registrar and transfer agent, and The Bank of New York Mellon (Luxembourg) S.A., as Luxembourg paying agent and Luxembourg transfer agent, relating to the Senior Notes due 2045. |
| |
| 8.1 | | Subsidiaries of Cencosud S.A. |
| |
| 12.1 | | Certification of Chief Executive Officer pursuant to Section 302 of the Sarbanes-Oxley Act of 2002. |
| |
| 12.2 | | Certification of Chief Financial Officer pursuant to Section 302 of the Sarbanes-Oxley Act of 2002. |
| |
| 13.1 | | Certification of Chief Executive Officer and Chief Financial Officer pursuant to Section 906 of the Sarbanes-Oxley Act of 2002. |
179
SIGNATURES
The registrant hereby certifies that it meets all of the requirements for filing on Form 20-F and that it has duly caused and authorized the undersigned to sign this annual report on its behalf.
| | | | |
| Cencosud S.A. |
| |
| | /s/ Jaime Soler |
| | Name: | | Jaime Soler |
| | Title: | | Chief Executive Officer |
Date: April 30, 2015
Index to the financial statements
F-1
REPORT OF INDEPENDENT REGISTERED PUBLIC ACCOUNTING FIRM
To the Board of Directors and Shareholders
Cencosud S.A.
In our opinion, the accompanying consolidated statements of financial position and the related consolidated statements of profit and loss and, other comprehensive income, changes in net equity and of cash flows present fairly, in all material respects, the financial position of Cencosud S.A. and its subsidiaries at December 31, 2014 and 2013, and the results of their operations and their cash flows for each of the three years in the period ended December 31, 2014 in conformity with International Financial Reporting Standards as issued by the International Accounting Standards Board. Also in our opinion, the Company maintained, in all material respects, effective internal control over financial reporting as of December 31, 2014, based on criteria established in Internal Control - Integrated Framework (1992) issued by the Committee of Sponsoring Organizations of the Treadway Commission (COSO). The Company’s management is responsible for these financial statements, for maintaining effective internal control over financial reporting and for its assessment of the effectiveness of internal control over financial reporting, included in Management’s Annual Report on Internal Control over Financial Reporting appearing under Item 15 of this annual report. Our responsibility is to express opinions on these financial statements and on the Company’s internal control over financial reporting based on our integrated audits (which were integrated audits in 2014 and 2013). We conducted our audits in accordance with the standards of the Public Company Accounting Oversight Board (United States). Those standards require that we plan and perform the audits to obtain reasonable assurance about whether the financial statements are free of material misstatement and whether effective internal control over financial reporting was maintained in all material respects. Our audits of the financial statements included examining, on a test basis, evidence supporting the amounts and disclosures in the financial statements, assessing the accounting principles used and significant estimates made by management, and evaluating the overall financial statement presentation. Our audit of internal control over financial reporting included obtaining an understanding of internal control over financial reporting, assessing the risk that a material weakness exists, and testing and evaluating the design and operating effectiveness of internal control based on the assessed risk. Our audits also included performing such other procedures as we considered necessary in the circumstances. We believe that our audits provide a reasonable basis for our opinions.
F-2
Cencosud S.A.
A company’s internal control over financial reporting is a process designed to provide reasonable assurance regarding the reliability of financial reporting and the preparation of financial statements for external purposes in accordance with generally accepted accounting principles. A company’s internal control over financial reporting includes those policies and procedures that (i) pertain to the maintenance of records that, in reasonable detail, accurately and fairly reflect the transactions and dispositions of the assets of the company; (ii) provide reasonable assurance that transactions are recorded as necessary to permit preparation of financial statements in accordance with generally accepted accounting principles, and that receipts and expenditures of the company are being made only in accordance with authorizations of management and directors of the company; and (iii) provide reasonable assurance regarding prevention or timely detection of unauthorized acquisition, use, or disposition of the company’s assets that could have a material effect on the financial statements.
Because of its inherent limitations, internal control over financial reporting may not prevent or detect misstatements. Also, projections of any evaluation of effectiveness to future periods are subject to the risk that controls may become inadequate because of changes in conditions, or that the degree of compliance with the policies or procedures may deteriorate.
/s/ PricewaterhouseCoopers
Santiago, Chile
April 30, 2015
F-3
Cencosud S.A. and subsidiaries Consolidated Statements of Financial Position
| | | | | | | | | | |
| | | | | As of December 31, | |
Assets | | Note | | 2014 | | | 2013 | |
| | | | | ThCh$ | | | ThCh$ | |
| | | |
Current assets | | | | | | | | | | |
Cash and cash equivalents | | 5 | | | 218,871,793 | | | | 171,711,625 | |
Other financial assets, current | | 6 | | | 47,778,995 | | | | 49,583,940 | |
Other non-financial assets, current | | 22 | | | 10,646,492 | | | | 11,605,493 | |
Trade receivables and other receivables | | 8 | | | 781,576,754 | | | | 1,133,447,553 | |
Receivables due from related entities, current | | 9 | | | 1,371,016 | | | | 432,303 | |
Inventory | | 10 | | | 1,094,609,583 | | | | 1,044,906,627 | |
Current tax assets | | 16 | | | 54,196,417 | | | | 13,531,336 | |
| | | | | | | | | | |
| | | |
Total current assets other than non-current assets held for sale | | | | | 2,209,051,050 | | | | 2,425,218,877 | |
| | | | | | | | | | |
Assets held for sale | | 34 | | | 793,416,576 | | | | — | |
Total current assets | | | | | 3,002,467,626 | | | | 2,425,218,877 | |
| | | |
Non-current assets | | | | | | | | | | |
Other financial assets, non-current | | 6 | | | 302,479,598 | | | | 92,405,358 | |
Other non-financial assets, non-current | | 22 | | | 33,873,417 | | | | 38,263,337 | |
Trade receivable and other receivables, non-current | | 8 | | | 34,777,355 | | | | 155,839,812 | |
Equity method investment | | 11 | | | 52,247,914 | | | | 49,942,154 | |
Intangible assets other than goodwill | | 12 | | | 400,542,180 | | | | 571,621,507 | |
Goodwill | | 13 | | | 1,682,348,563 | | | | 1,696,040,684 | |
Property, plant and equipment | | 14 | | | 3,009,728,456 | | | | 3,101,883,868 | |
Investment property | | 15 | | | 1,663,592,396 | | | | 1,568,432,058 | |
Non-current tax assets, | | 16 | | | 43,047,543 | | | | 53,727,039 | |
Deferred income tax assets | | 16 | | | 491,398,181 | | | | 311,859,519 | |
| | | | | | | | | | |
| | | |
Total non-current assets | | | | | 7,714,035,603 | | | | 7,640,015,336 | |
| | | | | | | | | | |
| | | |
Total assets | | | | | 10,716,503,229 | | | | 10,065,234,213 | |
| | | | | | | | | | |
The accompanying notes are an integral part of these consolidated financial statements.
F-4
Cencosud S.A. and subsidiaries Consolidated Statements of Financial Position
| | | | | | | | | | |
| | | | | As of December 31, | |
Net equity and liabilities | | Note | | 2014 | | | 2013 | |
| | | | | ThCh$ | | | ThCh$ | |
| | | |
Current liabilities | | | | | | | | | | |
Other financial liabilities, current | | 17 | | | 714,159,288 | | | | 739,105,814 | |
Trade payables and other payables | | 18 | | | 1,983,086,109 | | | | 1,957,993,218 | |
Payables to related entities, current | | 9 | | | 3,302,006 | | | | 556,494 | |
Provisions and other liabilities | | 19 | | | 15,197,558 | | | | 46,406,283 | |
Current income tax liabilities | | 16 | | | 60,615,912 | | | | 63,131,459 | |
Current provision for employee benefits | | 21 | | | 102,513,612 | | | | 96,696,870 | |
Other non-financial liabilities, current | | 20 | | | 43,104,370 | | | | 47,808,861 | |
| | | | | | | | | | |
| | | |
Total current liabilities other than non-current assets held for sale | | | | | 2,921,978,855 | | | | 2,951,698,999 | |
| | | |
Liabilities held for sale | | 34 | | | 216,791,432 | | | | | |
| | | | | | | | | | |
Total current liabilities | | | | | 3,138,770,287 | | | | 2,951,698,999 | |
| | | |
Non-current liabilities | | | | | | | | | | |
Other financial liabilities, | | 17 | | | 2,402,716,245 | | | | 2,218,035,025 | |
Trade accounts payables | | 18 | | | 34,449,920 | | | | 8,954,817 | |
Provisions and other liabilities | | 19 | | | 104,765,779 | | | | 88,222,586 | |
Deferred income tax liabilities | | 16 | | | 674,881,877 | | | | 471,481,007 | |
Other non–financial liabilities, non–current | | 20 | | | 69,433,310 | | | | 65,474,690 | |
| | | | | | | | | | |
| | | |
Total non-current liabilities | | | | | 3,286,247,131 | | | | 2,852,168,125 | |
| | | | | | | | | | |
| | | |
Total liabilities | | | | | 6,425,017,418 | | | | 5,803,867,124 | |
| | | | | | | | | | |
| | | |
Equity | | | | | | | | | | |
Paid-in capital | | 23 | | | 2,321,380,936 | | | | 2,321,380,936 | |
Retained earnings | | 23 | | | 2,166,548,572 | | | | 2,049,483,333 | |
Share premium | | 23 | | | 526,633,344 | | | | 526,633,344 | |
Other reserves | | 23 | | | (722,245,257 | ) | | | (636,230,610 | ) |
| | | | | | | | | | |
| | | |
Equity attributable to controlling shareholders | | | | | 4,292,317,595 | | | | 4,261,267,003 | |
Non-controlling interest | | 23 | | | (831,784 | ) | | | 100,086 | |
| | | | | | | | | | |
| | | |
Total equity | | | | | 4,291,485,811 | | | | 4,261,367,089 | |
| | | | | | | | | | |
| | | |
Total equity and liabilities | | | | | 10,716,503,229 | | | | 10,065,234,213 | |
| | | | | | | | | | |
The accompanying notes are an integral part of these consolidated financial statements.
F-5
Cencosud S.A. and subsidiaries Consolidated Statements of Profit and Loss and Other Comprehensive Income
| | | | | | | | | | | | | | |
| | | | | For the year ended December 31, | |
Statements of profit and loss | | Note | | 2014 | | | 2013 | | | 2012 | |
| | | | | ThCh$ | | | ThCh$ | | | ThCh$ | |
Continuing Operations | | | | | | | | | | | | | | |
Revenues from ordinary activities | | 24 | | | 10,711,029,246 | | | | 10,134,158,210 | | | | 8,925,350,876 | |
Cost of Sales | | 25 | | | (7,814,773,235 | ) | | | (7,324,251,612 | ) | | | (6,464,234,047 | ) |
| | | | | | | | | | | | | | |
Gross Profit | | | | | 2,896,256,011 | | | | 2,809,906,598 | | | | 2,461,116,829 | |
| | | | |
Other income | | 25 | | | 114,437,716 | | | | 108,291,245 | | | | 107,010,792 | |
Distribution cost | | 25 | | | (26,653,898 | ) | | | (23,931,088 | ) | | | (20,233,594 | ) |
Administrative expenses | | 25 | | | (2,286,704,942 | ) | | | (2,181,508,368 | ) | | | (1,866,131,501 | ) |
Other expenses | | 25 | | | (182,076,769 | ) | | | (152,142,053 | ) | | | (162,024,745 | ) |
Other gain (losses), net | | 25 | | | 34,624,481 | | | | 26,365,872 | | | | (7,403,018 | ) |
| | | | | | | | | | | | | | |
Operating profit | | | | | 549,882,599 | | | | 586,982,206 | | | | 512,334,763 | |
| | | | |
Finance income | | 25 | | | 6,709,144 | | | | 5,999,175 | | | | 8,231,460 | |
Finance expenses | | 25 | | | (222,164,751 | ) | | | (223,855,751 | ) | | | (178,630,701 | ) |
Share of profit or loss of investments accounted for using the equity method | | 11 | | | 6,208,206 | | | | 10,289,439 | | | | 5,642,411 | |
Exchange differences | | 25 | | | (23,642,912 | ) | | | (25,053,921 | ) | | | (12,052,542 | ) |
(Losses) from indexation | | 25 | | | (39,575,950 | ) | | | (18,885,129 | ) | | | (23,537,752 | ) |
| | | | | | | | | | | | | | |
Profit before tax | | | | | 277,416,336 | | | | 335,476,019 | | | | 311,987,639 | |
| | | | |
Income tax expense | | 26 | | | (125,931,659 | ) | | | (94,068,463 | ) | | | (92,225,788 | ) |
| | | | | | | | | | | | | | |
| | | | |
Profit from continuing operations | | | | | 151,484,677 | | | | 241,407,556 | | | | 219,761,851 | |
| | | | | | | | | | | | | | |
| | | | |
Discontinued Operations | | | | | | | | | | | | | | |
Profit from discontinued operations | | 34 | | | 12,661,641 | | | | 8,357,240 | | | | 33,047,279 | |
| | | | | | | | | | | | | | |
| | | | |
(Loss)/profit attributable to | | | | | | | | | | | | | | |
| | | | |
Controlling shareholders | | | | | 164,894,672 | | | | 249,930,349 | | | | 249,958,615 | |
Non–controlling interest | | 23.6 | | | (748,354 | ) | | | (165,553 | ) | | | 2,850,515 | |
| | | | | | | | | | | | | | |
| | | | |
Profit | | | | | 164,146,318 | | | | 249,764,796 | | | | 252,809,130 | |
| | | | | | | | | | | | | | |
| | | | |
Earnings per share from continuing and discontinued operations attributable to controlling shareholders | | | | | | | | | | | | | | |
| | | | |
Basic earnings per share from continuing operations | | 27 | | | 53.8 | | | | 87.4 | | | | 93.2 | |
Basic earnings per share from discontinued operations | | | | | 4.5 | | | | 3.0 | | | | 14.2 | |
| | | | | 58.3 | | | | 90.4 | | | | 106.5 | |
| | | | | | | | | | | | | | |
| | | | |
Diluted earnings per share from continuing operations | | 27 | | | 53.8 | | | | 86.8 | | | | 92.3 | |
Diluted earnings per share from discontinued operations | | | | | 4.5 | | | | 3.0 | | | | 14.2 | |
2 | | | | | 58.3 | | | | 89.8 | | | | 106.5 | |
| | | | | | | | | | | | | | |
The accompanying notes are an integral part of these consolidated financial statements.
F-6
Cencosud S.A. and subsidiaries Consolidated Statements of Profit and Loss and Other Comprehensive Income
| | | | | | | | | | | | |
| | | For the year ended December 31, | |
| | | 2014 | | | 2013 | | | 2012 | |
| | | ThCh$ | | | ThCh$ | | | ThCh$ | |
| | | |
Profit | | | 164,146,318 | | | | 249,764,796 | | | | 252,809,130 | |
| | | |
Other comprehensive income | | | | | | | | | | | | |
Items that will never be reclassified to profit and loss | | | | | | | | | | | | |
Re-measurements of defined benefit liability (asset) | | | (431,191 | ) | | | 1,402,721 | | | | (792,855 | ) |
| | | | | | | | | | | | |
Total OCI that will never be reclassified to profit and loss | | | (431,191 | ) | | | 1,402,721 | | | | (792,855 | ) |
| | | | | | | | | | | | |
| | | |
Items that are or may be reclassified to profit and loss | | | | | | | | | | | | |
Foreign currency translation adjustments | | | (81,363,229 | ) | | | (153,344,258 | ) | | | (237,127,442 | ) |
Cash flow hedge | | | (7,791,437 | ) | | | (3,486,853 | ) | | | 16,862,328 | |
| | | | | | | | | | | | |
Total Items that are or may be reclassified to profit and loss | | | (89,154,666 | ) | | | (156,831,111 | ) | | | (220,265,114 | ) |
| | | | | | | | | | | | |
Other comprehensive income, before taxes. | | | (89,585,857 | ) | | | (155,428,390 | ) | | | (221,057,969 | ) |
| | | | | | | | | | | | |
| | | |
Income tax related to re-measurement of defined benefit liability (asset) | | | 146,605 | | | | (476,925 | ) | | | 269,571 | |
| | | | | | | | | | | | |
Total income tax that will never be reclassified to profit and loss | | | 146,605 | | | | (476,925 | ) | | | 269,571 | |
| | | | | | | | | | | | |
Income tax related to cash flow hedge and foreign currency translation adjustments | | | 467,671 | | | | 697,371 | | | | (3,372,466 | ) |
| | | | | | | | | | | | |
Total income tax that are or may be reclassified to profit and loss | | | 467,671 | | | | 697,371 | | | | (3,372,466 | ) |
| | | | | | | | | | | | |
Total other comprehensive income and expense | | | (88,971,581 | ) | | | (155,207,944 | ) | | | (224,160,864 | ) |
| | | | | | | | | | | | |
| | | |
Total comprehensive income | | | 75,174,737 | | | | 94,556,852 | | | | 28,648,266 | |
| | | | | | | | | | | | |
| | | |
Income attributable to | | | | | | | | | | | | |
Controlling shareholders | | | 76,055,757 | | | | 94,724,800 | | | | 34,001,833 | |
Non-controlling interest | | | (881,020 | ) | | | (167,948 | ) | | | (5,353,567 | ) |
| | | | | | | | | | | | |
| | | |
Total comprehensive income | | | 75,174,737 | | | | 94,556,852 | | | | 28,648,266 | |
| | | | | | | | | | | | |
The accompanying notes are an integral part of these consolidated financial statements.
F-7
Cencosud S.A. and subsidiaries
Consolidated Statement of Changes in Net Equity
For the year ended December 31, 2014
| | | | | | | | | | | | | | | | | | | | | | | | | | | | | | | | | | | | | | | | | | | | | | | | |
Statement of changes in
equity ThCh$ | | Paid-in
capital | | | Share
premium | | | Translation
reserves | | | Hedge
reserves | | | Actuarial
Gain
(loss)
reserves | | | Share
based
payments
reserves | | | Other
reserves | | | Total
reserves | | | Retained
earnings | | | Equity
attributable
to parent
company
shareholders | | | Non-
controlling
interest | | | Total equity | |
| | | | | | | | | | | | |
Opening balance as of January 1, 2014 | | | 2,321,380,936 | | | | 526,633,344 | | | | (615,316,151 | ) | | | 20,525,986 | | | | 402,512 | | | | 10,636,164 | | | | (52,479,121 | ) | | | (636,230,610 | ) | | | 2,049,483,333 | | | | 4,261,267,003 | | | | 100,086 | | | | 4,261,367,089 | |
| | | | | | | | | | | | | | | | | | | | | | | | | | | | | | | | | | | | | | | | | | | | | | | | |
| | | | | | | | | | | | |
Changes in equity | | | | | | | | | | | | | | | | | | | | | | | | | | | | | | | | | | | | | | | | | | | | | | | | |
| | | | | | | | | | | | |
Comprehensive income | | | | | | | | | | | | | | | | | | | | | | | | | | | | | | | | | | | | | | | | | | | | | | | | |
| | | | | | | | | | | | |
Net income | | | | | | | | | | | | | | | | | | | | | | | | | | | | | | | | | | | 164,894,672 | | | | 164,894,672 | | | | (748,354 | ) | | | 164,146,318 | |
| | | | | | | | | | | | |
Other comprehensive income | | | — | | | | — | | | | (81,230,563 | ) | | | (7,323,766 | ) | | | (284,586 | ) | | | | | | | | | | | (88,838,915 | ) | | | | | | | (88,838,915 | ) | | | (132,666 | ) | | | (88,971,581 | ) |
| | | | | | | | | | | | | | | | | | | | | | | | | | | | | | | | | | | | | | | | | | | | | | | | |
| | | | | | | | | | | | |
Total Comprehensive income | | | | | | | | | | | (81,230,563 | ) | | | (7,323,766 | ) | | | (284,586 | ) | | | | | | | | | | | (88,838,915 | ) | | | 164,894,672 | | | | 76,055,757 | | | | (881,020 | ) | | | 75,174,737 | |
| | | | | | | | | | | | | | | | | | | | | | | | | | | | | | | | | | | | | | | | | | | | | | | | |
| | | | | | | | | | | | |
Share issuance | | | | | | | | | | | | | | | | | | | | | | | | | | | | | | | | | | | | | | | | | | | | | | | | |
| | | | | | | | | | | | |
Dividends | | | | | | | | | | | | | | | | | | | | | | | | | | | | | | | | | | | (47,829,433 | ) | | | (47,829,433 | ) | | | | | | | (47,829,433 | ) |
| | | | | | | | | | | | |
Stock option (see 33) | | | | | | | | | | | | | | | | | | | | | | | 2,822,081 | | | | | | | | 2,822,081 | | | | | | | | 2,822,081 | | | | | | | | 2,822,081 | |
| | | | | | | | | | | | |
Decrease due to changes in ownership interest without a loss of control | | | | | | | | | | | | | | | | | | | | | | | | | | | 2,187 | | | | 2,187 | | | | | | | | 2,187 | | | | (50,850 | ) | | | (48,663 | ) |
| | | | | | | | | | | | | | | | | | | | | | | | | | | | | | | | | | | | | | | | | | | | | | | | |
| | | | | | | | | | | | |
Total transactions with owners | | | — | | | | — | | | | — | | | | — | | | | — | | | | 2,822,081 | | | | 2,187 | | | | 2,824,268 | | | | (47,829,433 | ) | | | (45,005,165 | ) | | | (50,850 | ) | | | (45,056,015 | ) |
| | | | | | | | | | | | | | | | | | | | | | | | | | | | | | | | | | | | | | | | | | | | | | | | |
| | | | | | | | | | | | |
Total Changes in equity | | | — | | | | — | | | | (81,230,563 | ) | | | (7,323,766 | ) | | | (284,586 | ) | | | 2,822,081 | | | | 2,187 | | | | (86,014,647 | ) | | | 117,065,239 | | | | 31,050,592 | | | | (931,870 | ) | | | 30,118,722 | |
| | | | | | | | | | | | | | | | | | | | | | | | | | | | | | | | | | | | | | | | | | | | | | | | |
| | | | | | | | | | | | |
Ending balance, as of December 31, 2014 | | | 2,321,380,936 | | | | 526,633,344 | | | | (696,546,714 | ) | | | 13,202,220 | | | | 117,926 | | | | 13,458,245 | | | | (52,476,934 | ) | | | (722,245,257 | ) | | | 2,166,548,572 | | | | 4,292,317,595 | | | | (831,784 | ) | | | 4,291,485,811 | |
F-8
Cencosud S.A. and subsidiaries
Consolidated Statement of Changes in Net Equity
For the year ended December 31, 2013
| | | | | | | | | | | | | | | | | | | | | | | | | | | | | | | | | | | | | | | | | | | | | | | | |
Statement of
changes in
equity ThCh$ | | Paid-in
capital | | | Issuance
premiums | | | Translation
reserves | | | Hedge
reserves | | | Actuarial
Gain
(loss)
reserves | | | Share
based
payments
reserves | | | Other
reserves | | | Total
reserves | | | Retained
earnings | | | Equity
attributable to
parent company
shareholders | | | Non-
controlling
interest | | | Total equity | |
| | | | | | | | | | | | |
Opening balance as of January 1, 2013 | | | 1,551,811,762 | | | | 477,341,095 | | | | (461,974,288 | ) | | | 23,315,468 | | | | (523,284 | ) | | | 6,892,685 | | | | (52,074,990 | ) | | | (484,364,409 | ) | | | 1,852,745,697 | | | | 3,397,534,145 | | | | 677,599 | | | | 3,398,211,744 | |
| | | | | | | | | | | | | | | | | | | | | | | | | | | | | | | | | | | | | | | | | | | | | | | | |
| | | | | | | | | | |
Changes in equity | | | | | | | | | | | | | | | | | | | | | | | | | | | | | | | | | | | | | | | | |
| | | | | | | | | | |
Comprehensive income | | | | | | | | | | | | | | | | | | | | | | | | | | | | | | | | | | | | | | | | |
| | | | | | | | | | | | |
Net income | | | | | | | | | | | | | | | | | | | | | | | | | | | | | | | | | | | 249,930,349 | | | | 249,930,349 | | | | (165,553 | ) | | | 249,764,796 | |
| | | | | | | | | | | | |
Other comprehensive income | | | — | | | | — | | | | (153,341,863 | ) | | | (2,789,482 | ) | | | 925,796 | | | | — | | | | — | | | | (155,205,549 | ) | | | | | | | (155,205,549 | ) | | | (2,395 | ) | | | (155,207,944 | ) |
| | | | | | | | | | | | | | | | | | | | | | | | | | | | | | | | | | | | | | | | | | | | | | | | |
| | | | | | | | | | | | |
Total Comprehensive income | | | | | | | | | | | (153,341,863 | ) | | | (2,789,482 | ) | | | 925,796 | | | | — | | | | — | | | | (155,205,549 | ) | | | 249,930,349 | | | | 94,724,800 | | | | (167,948 | ) | | | 94,556,852 | |
| | | | | | | | | | | | | | | | | | | | | | | | | | | | | | | | | | | | | | | | | | | | | | | | |
| | | | | | | | | | | | |
Share issuance | | | 769,569,174 | | | | 49,292,249 | | | | | | | | | | | | | | | | | | | | | | | | | | | | | | | | 818,861,423 | | | | | | | | 818,861,423 | |
| | | | | | | | | | | | |
Dividends | | | | | | | | | | | | | | | | | | | | | | | | | | | | | | | | | | | (53,192,713 | ) | | | (53,192,713 | ) | | | | | | | (53,192,713 | ) |
| | | | | | | | | | | | |
Stock option (see 33) | | | | | | | | | | | | | | | | | | | | | | | 3,743,479 | | | | | | | | 3,743,479 | | | | | | | | 3,743,479 | | | | | | | | 3,743,479 | |
| | | | | | | | | | | | |
Decrease due to changes in ownership interest without a loss of control (see 23.4) | | | | | | | | | | | | | | | | | | | | | | | — | | | | (404,131 | ) | | | (404,131 | ) | | | — | | | | (404,131 | ) | | | (409,565 | ) | | | (813,696 | ) |
| | | | | | | | | | | | | | | | | | | | | | | | | | | | | | | | | | | | | | | | | | | | | | | | |
| | | | | | | | | | | | |
Total transactions with owners | | | 769,569,174 | | | | 49,292,249 | | | | — | | | | — | | | | — | | | | 3,743,479 | | | | (404,131 | ) | | | 3,339,348 | | | | (53,192,713 | ) | | | 769,008,058 | | | | (409,565 | ) | | | 768,598,493 | |
| | | | | | | | | | | | | | | | | | | | | | | | | | | | | | | | | | | | | | | | | | | | | | | | |
| | | | | | | | | | | | |
Total Changes in equity | | | 769,569,174 | | | | 49,292,249 | | | | (153,341,863 | ) | | | (2,789,482 | ) | | | 925,796 | | | | 3,743,479 | | | | (404,131 | ) | | | (151,866,201 | ) | | | 196,737,636 | | | | 863,732,858 | | | | (577,513 | ) | | | 863,155,345 | |
| | | | | | | | | | | | | | | | | | | | | | | | | | | | | | | | | | | | | | | | | | | | | | | | |
| | | | | | | | | | | | |
Ending balance, as of December 31, 2013 | | | 2,321,380,936 | | | | 526,633,344 | | | | (615,316,151 | ) | | | 20,525,986 | | | | 402,512 | | | | 10,636,164 | | | | (52,479,121 | ) | | | (636,230,610 | ) | | | 2,049,483,333 | | | | 4,261,267,003 | | | | 100,086 | | | | 4,261,367,089 | |
| | | | | | | | | | | | | | | | | | | | | | | | | | | | | | | | | | | | | | | | | | | | | | | | |
F-9
Cencosud S.A. and subsidiaries
Consolidated Statement of Changes in Net Equity
For the year ended December 31, 2012
| | | | | | | | | | | | | | | | | | | | | | | | | | | | | | | | | | | | | | | | | | | | | | | | |
Statement of
changes in
equity ThCh$ | | Paid-in
capital | | | Issuance
premiums | | | Translation
reserves | | | Hedge
reserves | | | Actuarial
Gain (loss)
reserves | | | Share
based
payments
reserves | | | Other
reserves | | | Total
reserves | | | Retained
earnings | | | Equity
attributable to
controlling
shareholders | | | Non-
controlling
interest | | | Total equity | |
| | | | | | | | | | | | |
Opening balance as of January 1, 2012 | | | 927,804,431 | | | | 477,341,095 | | | | (233,050,928 | ) | | | 9,825,606 | | | | — | | | | 4,595,125 | | | | 15,907,719 | | | | (202,722,478 | ) | | | 1,660,432,903 | | | | 2,862,855,951 | | | | 87,750,295 | | | | 2,950,606,246 | |
| | | | | | | | | | | | | | | | | | | | | | | | | | | | | | | | | | | | | | | | | | | | | | | | |
| | | | | | | | | | | | |
Changes in equity | | | | | | | | | | | | | | | | | | | | | | | | | | | | | | | | | | | | | | | | | | | | | | | | |
| | | | | | | | | | | | |
Comprehensive income | | | | | | | | | | | | | | | | | | | | | | | | | | | | | | | | | | | | | | | | | | | | | | | | |
| | | | | | | | | | | | |
Net income | | | | | | | | | | | | | | | | | | | | | | | | | | | | | | | | | | | 249,958,615 | | | | 249,958,615 | | | | 2,850,515 | | | | 252,809,130 | |
| | | | | | | | | | | | |
Other comprehensive income | | | | | | | | | | | (228,923,360 | ) | | | 13,489,862 | | | | (523,284 | ) | | | — | | | | — | | | | (215,956,782 | ) | | | | | | | (215,956,782 | ) | | | (8,204,082 | ) | | | (224,160,864 | ) |
| | | | | | | | | | | | | | | | | | | | | | | | | | | | | | | | | | | | | | | | | | | | | | | | |
| | | | | | | | | | | | |
Total Comprehensive income | | | | | | | | | | | (228,923,360 | ) | | | 13,489,862 | | | | (523,284 | ) | | | — | | | | — | | | | (215,956,782 | ) | | | 249,958,615 | | | | 34,001,833 | | | | (5,353,567 | ) | | | 28,648,266 | |
| | | | | | | | | | | | | | | | | | | | | | | | | | | | | | | | | | | | | | | | | | | | | | | | |
| | | | | | | | | | | | |
Share issuance | | | 624,007,331 | | | | | | | | | | | | | | | | | | | | | | | | — | | | | | | | | | | | | 624,007,331 | | | | — | | | | 624,007,331 | |
| | | | | | | | | | | | |
Dividends | | | | | | | | | | | | | | | | | | | | | | | | | | | | | | | | | | | (57,645,821 | ) | | | (57,645,821 | ) | | | | | | | (57,645,821 | ) |
| | | | | | | | | | | | |
Option (call–put) (see 23.5) | | | | | | | | | | | | | | | | | | | | | | | | | | | 92,991,291 | | | | 92,991,291 | | | | | | | | 92,991,291 | | | | | | | | 92,991,291 | |
| | | | | | | | | | | | |
Stock option (see 33) | | | | | | | | | | | | | | | | | | | | | | | 2,297,560 | | | | | | | | 2,297,560 | | | | | | | | 2,297,560 | | | | | | | | 2,297,560 | |
Decrease due to changes in ownership interest without a loss of control (see 23.4) | | | | | | | | | | | | | | | | | | | | | | | | | | | (160,974,000 | ) | | | (160,974,000 | ) | | | — | | | | (160,974,000 | ) | | | (81,719,129 | ) | | | (242,693,129 | ) |
| | | | | | | | | | | | | | | | | | | | | | | | | | | | | | | | | | | | | | | | | | | | | | | | |
| | | | | | | | | | | | |
Total transactions with owners | | | 624,007,331 | | | | — | | | | — | | | | — | | | | — | | | | 2,297,560 | | | | (67,982,709 | ) | | | (65,685,149 | ) | | | (57,645,821 | ) | | | 500,676,361 | | | | (81,719,129 | ) | | | 418,957,232 | |
| | | | | | | | | | | | | | | | | | | | | | | | | | | | | | | | | | | | | | | | | | | | | | | | |
| | | | | | | | | | | | |
Total Changes in equity | | | 624,007,331 | | | | — | | | | (228,923,360 | ) | | | 13,489,862 | | | | (523,284 | ) | | | 2,297,560 | | | | (67,982,709 | ) | | | (281,641,931 | ) | | | 192,312,794 | | | | 534,678,194 | | | | (87,072,696 | ) | | | 447,605,498 | |
| | | | | | | | | | | | | | | | | | | | | | | | | | | | | | | | | | | | | | | | | | | | | | | | |
| | | | | | | | | | | | |
Ending balance, as of December 31, 2012 | | | 1,551,811,762 | | | | 477,341,095 | | | | (461,974,288 | ) | | | 23,315,468 | | | | (523,284 | ) | | | 6,892,685 | | | | (52,074,990 | ) | | | (484,364,409 | ) | | | 1,852,745,697 | | | | 3,397,534,145 | | | | 677,599 | | | | 3,398,211,744 | |
| | | | | | | | | | | | | | | | | | | | | | | | | | | | | | | | | | | | | | | | | | | | | | | | |
F-10
Cencosud S.A. and subsidiaries
Consolidated statements of cash flows
| | | | | | | | | | | | | | |
| | | | | For the years ended December 31, | |
| | | Note | | 2014 | | | 2013 | | | 2012 | |
| | | | | ThCh$ | | | ThCh$ | | | ThCh$ | |
Cash flows from (used in) operating activities | | | | | | | | | | | | | | |
| | | | |
Types of revenues from operating activities | | | | | | | | | | | | | | |
Revenue from sale of goods & provision of services | | | | | 12,494,148,894 | | | | 11,505,243,173 | | | | 10,302,436,270 | |
Proceeds from royalties, installments, commissions and other ordinary activities | | | | | 16,608,435 | | | | 6,377,662 | | | | — | |
Receipts from premiums and claims, annuities and other policy benefits underwritten | | | | | | | | | | | | | 63,957 | |
Other operating activity revenue | | | | | 12,356,355 | | | | 9,224,623 | | | | 11,128,303 | |
| | | | |
Types of payments | | | | | | | | | | | | | | |
Payments to suppliers for supply of goods & services | | | | | (10,210,372,358 | ) | | | (9,493,248,169 | ) | | | (8,203,825,488 | ) |
| | | | |
Payments to and on behalf of personnel | | | | | (1,367,742,879 | ) | | | (1,281,637,416 | ) | | | (1,091,769,706 | ) |
| | | | |
Other operating payments | | | | | (483,963,826 | ) | | | (385,954,518 | ) | | | (300,045,416 | ) |
| | | | |
Interest paid | | | | | (2,582,002 | ) | | | (1,399,519 | ) | | | (1,123,089 | ) |
Interest received | | | | | 1,678,603 | | | | 2,255,639 | | | | 1,893,069 | |
Taxes paid | | | | | (87,128,966 | ) | | | (66,078,734 | ) | | | (74,331,546 | ) |
Other cash inflows | | | | | 2,653,450 | | | | 7,282,776 | | | | 23,846,742 | |
| | | | | | | | | | | | | | |
Cash flows from operating activities (continuing operations) | | | | | 375,655,706 | | | | 302,065,517 | | | | 668,273,096 | |
Cash flows from operating activities (discontinued operations) | | | | | 14,583,058 | | | | 62,716,526 | | | | 50,441,523 | |
| | | | | | | | | | | | | | |
Net cash flow from operating activities | | | | | 390,238,764 | | | | 364,782,043 | | | | 718,714,619 | |
| | | | | | | | | | | | | | |
| | | | |
Cash flows from (used in) investment activities | | | | | | | | | | | | | | |
Acquisition of subsidiaries | | | | | — | | | | — | | | | (1,292,423,533 | ) |
Proceeds from sales of property, plant & equipment | | | | | 7,515,592 | | | | 1,082,763 | | | | 22,153,794 | |
Purchases of property, plant & equipment | | | | | (227,422,961 | ) | | | (317,709,777 | ) | | | (573,650,227 | ) |
Purchases of intangible assets | | | | | (22,594,236 | ) | | | (25,053,442 | ) | | | (18,595,944 | ) |
Dividends received | | | | | 6,892,639 | | | | 2,469,136 | | | | 2,001,798 | |
Interest received | | | | | 630,971 | | | | 2,473,841 | | | | 3,362,729 | |
Proceeds from sales of other financial assets—mutual funds | | | | | 825,385,250 | | | | 7,524,532,791 | | | | 5,620,928,451 | |
Purchases of other financial assets—mutual funds | | | | | (825,799,626 | ) | | | (7,497,162,191 | ) | | | (5,639,868,503 | ) |
| | | | | | | | | | | | | | |
Cash flows from investment activities (continuing operations) | | | | | (235,392,371 | ) | | | (309,366,879 | ) | | | (1,876,091,435 | ) |
Cash flows from investment activities (discontinued operations) | | | | | 1,996,104 | | | | (11,140,591 | ) | | | 2,523,768 | |
| | | | | | | | | | | | | | |
Net cash flow (used in) investment activities | | | | | (233,396,267 | ) | | | (320,507,470 | ) | | | (1,873,567,667 | ) |
| | | | | | | | | | | | | | |
| | | | |
Cash flows from (used in) financing activities | | | | | | | | | | | | | | |
Acquisition of non-controlling interests | | | | | — | | | | — | | | | (242,681,460 | ) |
Proceeds from paid in capital | | | | | — | | | | 818,871,267 | | | | 620,987,359 | |
Proceeds from borrowing at long–term | | | | | 725,079,729 | | | | — | | | | 2,062,402,859 | |
Proceeds from borrowing at short–term | | | | | 7,871,210,244 | | | | 4,641,469,793 | | | | 3,097,214,319 | |
| | | | | | | | | | | | | | |
Total loan proceeds from borrowing | | | | | 8,596,289,973 | | | | 5,460,341,060 | | | | 5,537,923,077 | |
| | | | |
Repayments of borrowing | | | | | (8,381,440,558 | ) | | | (5,318,203,095 | ) | | | (4,093,469,015 | ) |
Dividends paid | | | | | (58,269,234 | ) | | | (79,736,684 | ) | | | (20,034,383 | ) |
Interest paid | | | | | (188,378,177 | ) | | | (178,317,891 | ) | | | (160,012,962 | ) |
Other cash outflows | | | | | | | | | (898 | ) | | | (8,980,028 | ) |
| | | | | | | | | | | | | | |
Cash flows from financing activities (continuing operations) | | | | | (31,797,996 | ) | | | (115,917,508 | ) | | | 1,255,426,689 | |
Cash flows from financing activities (discontinued operations) | | | | | (80,580,490 | ) | | | 8,888,132 | | | | (9,349,273 | ) |
| | | | |
Net cash flow from financing activities | | | | | (112,378,486 | ) | | | (107,029,376 | ) | | | 1,246,077,416 | |
| | | | | | | | | | | | | | |
Net (decrease) increase in cash and cash equivalents before the effect of variations | | | | | 44,464,011 | | | | (62,754,803 | ) | | | 91,224,368 | |
| | | | |
Effects of variations in the exchange rate on cash and cash equivalents | | | | | 3,451,650 | | | | (3,254,377 | ) | | | 1,434,856 | |
| | | | | | | | | | | | | | |
Net (decrease) increase in cash and cash equivalents | | | | | 47,915,661 | | | | (66,009,180 | ) | | | 92,659,224 | |
Cash and cash equivalents at the beginning of the year | | 5 | | | 171,711,625 | �� | | | 237,720,805 | | | | 145,061,581 | |
| | | | | | | | | | | | | | |
Cash and cash equivalents at the end of the year | | 5 | | | 219,627,286 | | | | 171,711,625 | | | | 237,720,805 | |
| | | | |
Included in cash and cash equivalents per the statement of financial situation | | | | | 218,871,793 | | | | 171,711,625 | | | | 237,720,805 | |
Included in the assets of the disposal group | | | | | 755,493 | | | | — | | | | — | |
| | | | | | | | | | | | | | |
The accompanying notes are an integral part of these consolidated financial statements.
F-11
Cencosud S.A. and subsidiaries
Notes to the consolidated financial statements
Cencosud S.A. (hereinafter “Cencosud Group,” “the Company,” “the Holding,” “the Group”) taxpayer ID number 93.834.000-5 is a public corporation with an indefinite life, with its legal residence at Avda. Kennedy 9001, 4th floor, Las Condes, Santiago, Chile.
Cencosud S.A. is a public company registered with the Chilean Superintendence of Securities and Insurance (SVS), under No.743, which shares are quoted in Chile on the Stock Brokers-Stock Exchange (Valparaíso), the Chilean Electronic Stock Exchange and the Santiago Stock Exchange; it is also quoted on the United States of America Stock Exchange (“NYSE”) in New York in the form of American Depositary Receipts (ADRs).
Cencosud S.A. is a retail operator in Latin America, which has active operations in Chile, Argentina, Brazil, Colombia and Peru, where it has developed a successful multi-format and multi-brand strategy reaching sales of ThCh$ 10.711.029.246 to December 31, 2014.
During the year ended December 31, 2014, the Company employed an average of 149.955 employees, ending with a total number of 153.234 employees.
The Company’s operations include supermarkets, hypermarkets, home improvement stores, department stores, shopping centers, as well as real estate development and financial services, which makes it the most diversified retail company of Latin-American capital in South America with the biggest offering of square meters, it caters to the consumption needs of over 180 million customers.
Additionally, it operates other lines of business that complement the main retail operations, such as insurance brokerage, a travel agency, customer loyalty services and family entertainment centers. All of these services have gained recognition and prestige among customers, with brands that excel at quality and service.
The Company splits its equity among 2,828,723,963 shares of a single series whose main shareholders are the following:
| | | | | | | | |
Major shareholders as of December 31, 2014 | | Shares | | | Interest | |
| | | | | | % | |
Inversiones Quinchamalí Limitada | | | 573,754,802 | | | | 20.283 | % |
Inversiones Latadia Limitada | | | 550,823,211 | | | | 19.473 | % |
Inversiones Tano Limitada | | | 457,879,800 | | | | 16.187 | % |
Banco Santander—JP Morgan | | | 165,134,940 | | | | 5.838 | % |
Banco de Chile third-party accounts | | | 146,519,884 | | | | 5.180 | % |
Banco Itaú third-party accounts | | | 128,252,491 | | | | 4.534 | % |
Paulmann Kemna Horst | | | 70,336,573 | | | | 2.487 | % |
Fondo de Pensiones Provida C | | | 56,826,301 | | | | 2.009 | % |
Fondo de Pensiones Habitat C | | | 52,994,957 | | | | 1.874 | % |
Fondo de Pensiones Habitat B | | | 41,167,960 | | | | 1.455 | % |
Fondo de Pensiones Provida B | | | 36,054,975 | | | | 1.275 | % |
Fondo de Pensiones Capital C | | | 32,586,942 | | | | 1.152 | % |
Other Shareholders | | | 516,391,127 | | | | 18.255 | % |
| | | | | | | | |
| | |
Total | | | 2,828,723,963 | | | | 100.000 | % |
| | | | | | | | |
F-12
The Cencosud group is controlled by the Paulmann family, as detailed below:
| | | | |
Interest of Paulmann family as of December 31, 2014 | | Interest | |
| | | % | |
Inversiones Quinchamalí Limitada | | | 20.283 | % |
Inversiones Latadía Limitada | | | 19.473 | % |
Inversiones Tano Limitada | | | 16.187 | % |
Paulmann Kemna Horst | | | 2.487 | % |
Peter Paulmann Koepfer | | | 0.498 | % |
Manfred Paulmann Koepfer | | | 0.492 | % |
Heike Paulmann Koepfer | | | 0.492 | % |
Sucesión de Doña Helga Koepfer Schoebitz | | | 0.115 | % |
Inversiones Alpa Limitada | | | 0.007 | % |
| | | | |
| |
Total | | | 60.032 | % |
| | | | |
The consolidated financial statements of Cencosud group corresponding to the year ended December 31, 2014, were approved by the Board of Directors in a session held on March 27, 2015.
| 2 | Summary of the main accounting policies |
The consolidated financial statements of Cencosud S.A. have been prepared in accordance with International Financial Reporting Standards (IFRS), as issued by the International Accounting Standards Board (IASB).
As explained in note 16, on September 29, 2014 Law No. 20,780 was issued, which introduces modifications to the income tax system in Chile and other tax matters. On October 17, 2014 the Chilean Superintendence of Securities and Insurance (the “SVS”) issued Circular No. 856, which established that the effects of the change in the income tax rates on deferred tax assets and liabilities must be recognized directly within “Retained earnings” instead of the income statement as required by IAS 12.
In order to comply with IAS 12, these financial statements are different to those presented to the SVS as the aforementioned effect has been recognized within the income statement. A reconciliation of such differences in presented as follows:
| | | | | | | | | | | | |
| | | Consolidated
financial
statements for
SEC | | | Consolidated financial
statements for SVS | | | Difference | |
Total equity | | | 4,291,485,811 | | | | 4,291,485,811 | | | | — | |
Equity attributable to controlling shareholders | | | 4,292,317,595 | | | | 4,292,317,595 | | | | — | |
Retained earnings | | | | | | | | | | | — | |
Profit attributable to controlling shareholders | | | 164,894,672 | | | | 191,885,931 | | | | 26,991,259 | |
Retained earning before profit attributable to controlling shareholders | | | 2,001,653,900 | | | | 1,974,662,641 | | | | (26,991,259 | ) |
| | | | | | | | | | | | |
Total Retained earnings | | | 2,166,548,572 | | | | 2,166,548,572 | | | | — | |
| | | | | | | | | | | | |
| | | |
Non-controlling | | | | | | | | | | | | |
Retained earnings | | | | | | | | | | | — | |
Loss | | | (748,354 | ) | | | (861,853 | ) | | | 113,499 | |
Retained earning before loss | | | (83,430 | ) | | | 30,069 | | | | (113,499 | ) |
| | | | | | | | | | | | |
Total Retained earnings | | | (831,784 | ) | | | (831,784 | ) | | | — | |
| | | | | | | | | | | | |
F-13
The consolidated financial statements have been prepared under the historic-cost basis, as modified by the revaluation at fair value of certain financial instruments, derivative instruments and investment property.
The presentation of the financial statements in conformity with IFRS requires the use of certain accounting estimates, and also requires Management to exercise its judgment in the process of applying the Company’s accounting policies. Note 4 to these financial statements shows the areas in which a greater level of judgment has been applied, or where there is a higher level of complexity and therefore hypothesis and estimates are material to the financial statements.
The amounts in the attached financial statements are expressed in thousands of Chilean pesos, as the Chilean peso is the functional and presentation currency of the Company. All values have been rounded to the nearest thousand of pesos, except where mentioned.
In order to present comparative information, certain figures presented on the consolidated financial statements of the Group as of December 31, 2013, have been reclassified based on the presentation shown on the consolidated financial statement as of December 31, 2014. These reclassifications were made to correct the presentation between current tax assets and deferred income tax assets by ThCh $ 9,265,967 and between cost of sales and administrative expenses by ThCh $ 12,519,686. Management of the Company does not believe that these reclassifications made have a material impact on the financial statements.
Amended presentation of discontinued operations of the Financial services segment in Chile.
F-14
The Company, together with its subsidiaries Cencosud Retail S.A. and Easy S.A., have entered into a framework agreement (the “Framework Agreement”) on June 20, 2014 with The Bank of Nova Scotia (“BNS”) and its wholly owned subsidiary Scotiabank Chile, to further develop, on a joint basis, the retail finance business in Chile (hereinafter, the “Business”). The Framework Agreement provides that the Business shall be operated through (i) Cencosud Administradora de Tarjetas S.A. (“CAT”), a current subsidiary of Cencosud that is in the business of issuing credit cards and (ii) Cencosud Administradora de Procesos S.A., Cencosud Servicios Integrales S.A., and Cencosud Corredores de Seguros y Servicios Ltda. , or other companies to be established by Cencosud for purposes of the Framework Agreement (together with CAT, hereinafter, the “Subject Companies”). As part of the agreement, Scotiabank Chile will acquire fifty-one percent (51%) controlling interest of each of the Subject Companies, with Cencosud retaining the remaining forty-nine percent (49%) non-controlling interest.
Under IFRS Standard N° 5 (“IFRS 5”), “Non-current assets held for sale and discontinued operations”, the Subject Companies are considered as from June 20, 2014 “Assets held for sale” a result of Cencosud’s commitment to sell a controlling interest to an unrelated party under the Framework Agreement and that the occurrence of such transaction is deemed as highly probable by management.
IFRS 5 requires that (a) assets that meet the criteria to be classified as held for sale be measured at the lower of carrying amount and fair value less costs to sell, and depreciation on such assets to cease; and (b) assets that meet the criteria to be classified as held for sale be presented separately in the statement of financial position and the results of discontinued operations, net of tax, to be presented separately in the statement of comprehensive income. Net cash flows attributable to the operating, investing and financing activities of discontinued operations are required to be disclosed either in the notes to the financial statements or on the face of the statements of cash flows. IFRS 5 requires that a company “re-present” its statement of comprehensive income as if the operation had been discontinued for all prior periods presented.
As such, our consolidated statements for each of the three years in the period ended December 31, 2014 have been revised to present the results of operations of the Subject Companies (the financial services segment in Chile) as discontinued operations. Net cash flows from operating, investing and financing activities of discontinued operations have been separately presented in the consolidated statement of cash flows for each of the three years in the period ended December 31, 2014.
| 2.2 | New and amended standards adopted by the group |
(a) New standards, amendments and interpretations adopted by the group.
The following standards have been adopted by the group for the first time for the financial year beginning on 1 January 2014, however none of the new amendments and pronuncements had a significant impact on the group’s financial statements:
IFRIC 21, ‘Levies’, sets out the accounting for an obligation to pay a levy if that liability is within the scope of IAS 37 ‘Provisions’. The interpretation addresses what the obligating event is that gives rise to pay a levy and when a liability should be recognized. The Group is not currently subjected to significant levies so the impact on the Group is not material.
Amendment to IAS 32, ‘Financial instruments: Presentation’ on offsetting financial assets and financial liabilities. This amendment clarifies that the right of set-off must not be contingent on a future event. It must also be legally enforceable for all counterparties in the normal course of business, as well as in the event of default, insolvency or bankruptcy. The amendment also considers settlement mechanisms. The amendment did not have a significant effect on the group financial statements.
Amendments to IAS 36, ‘Impairment of assets’, on the recoverable amount disclosures for non-financial assets. This amendment removed certain disclosures of the recoverable amount of CGUs which had been included in IAS 36 by the issue of IFRS 13.
Amendment to IAS 39, ‘Financial instruments: Recognition and measurement’ on the novation of derivatives and the continuation of hedge accounting. This amendment considers legislative changes to ‘over-the-counter’
F-15
derivatives and the establishment of central counterparties. Under IAS 39 novation of derivatives to central counterparties would result in discontinuance of hedge accounting. The amendment provides relief from discontinuing hedge accounting when novation of a hedging instrument meets specified criteria. The amendment did not have a significant effect on the group financial statements.
(b) New standards, amendments and interpretations not yet adopted.
A number of new standards and amendments to standards and interpretations are effective for annual periods beginning after 1 January 2014, and have not been applied in preparing these consolidated financial statement. None of these is expected to have a significant effect on the consolidated financial statements of the Group, except the following set out below:
IFRS 9, ‘Financial instruments’, addresses the classification, measurement and recognition of financial assets and financial liabilities. The complete version of IFRS 9 was issued in July 2014. It replaces the guidance in IAS 39 that relates to the classification and measurement of financial instruments. IFRS 9 retains but simplifies the mixed measurement model and establishes three primary measurement categories for financial assets: amortized cost, fair value through OCI and fair value through P&L. The basis of classification depends on the entity’s business model and the contractual cash flow characteristics of the financial asset. Investments in equity instruments are required to be measured at fair value through profit or loss with the irrevocable option at inception to present changes in fair value in OCI not recycling. There is now a new expected credit losses model that replaces the incurred loss impairment model used in IAS 39. For financial liabilities there were no changes to classification and measurement except for the recognition of changes in own credit risk in other comprehensive income, for liabilities designated at fair value through profit or loss. IFRS 9 relaxes the requirements for hedge effectiveness by replacing the bright line hedge effectiveness tests. It requires an economic hedging instrument and for the ‘hedged ratio’ to be the same as the one management actually use for risk management purposes. Contemporaneous documentation is still required but is different to that currently prepared under IAS 39. The standard is effective for accounting periods beginning on or after 1 January 2018. Early adoption is permitted. The group is yet to assess IFRS 9’s full impact.
IFRS 15, ‘Revenue from contracts with customers’ deals with revenue recognition and establishes principles for reporting useful information to users of financial statements about the nature, amount, timing and uncertainty of revenue and cash flows arising from an entity’s contracts with customers. Revenue is recognized when a customer obtains control of a good or service and thus has the ability to direct the use and obtain the benefits from the good or service. The standard replaces IAS 18 ‘Revenue’ and IAS 11 ‘Construction contracts’ and related interpretations. The standard is effective for annual periods beginning on or after 1 January 2017 and earlier application is permitted. The group is assessing the impact of IFRS 15.
Amendment to IFRS 10 “consolidated financial statements” IFRS and IAS 28 “Investments in associates and joint ventures”. Published in September 2014. This amendment addresses an inconsistency between the requirements of the IFRS 10 and IAS 28 in the treatment of the sale or the contribution of goods between an investor and the associate or joint venture. The main consequence of the amendments is that recognizes a gain or loss completes when the transaction involves a business (is in a subsidiary or not) and a gain or loss partial when the transaction involves assets that do not constitute a business, even if these assets are in a subsidiary.
Amendment to IFRS 10 “consolidated financial statements” IFRS and IAS 28 “Investments in associates and joint ventures”. Published in December 2014. The amendment clarifies on the application of the exception from consolidation to investment entities and their subsidiaries. The amendment to IFRS 10 clarifies on the exception of consolidation that is available to entities in group structures that include investment entities. The amendment to IAS 28 allows, to an entity which is not an entity’s investment, but it has a stake in an associate or joint venture that is an entity of investment, a choice of accounting policy in the application of the equity method. The entity may choose to keep the measurement of fair value applied by the associate or joint venture that is an entity of investment, or instead, perform a consolidation at the level of the entity’s investment (associate or joint venture). Early application is permitted.
Amendment to IAS 1 “presentation of financial statements”. Published in December 2014 and is effective for fiscal years beginning on January 1, 2016. The amendment clarifies the guide for the application of IAS 1 on
F-16
materiality and aggregation, presentation of subtotals, structure of the financial statements and disclosure of accounting policies. The modifications are part of initiatives on disclosures of the IASB. Early adoption is permitted.
There are no other IFRSs or IFRIC interpretations that are not yet effective that would be expected to have a material impact on the Group.
Subsidiaries are entities controlled by the Group. The Group controls an entity when it’s exposed to, or has rights to, variable returns from its involvement with the entity and has the ability to affect those through its power over the entity.
Specifically, the Group controls an entity when all of the following circumstances are met:
| (a) | Power over the investee; |
| (b) | Exposure, or rights, to variable returns from involvement with the investee; and |
| (c) | The ability to use power over the investee to affect the amount of the investor’s returns. |
When the Group holds less than a majority of voting rights over an investee, it has the power over the investee when these voting rights are sufficient to give the Group the ability to direct unilaterally the relevant activities of the investee. The Group considers all facts and circumstances to evaluate if the voting rights over an investee are sufficient to give it power, including:
| (a) | the size of the investor holding of voting rights relative to the size and dispersion of holding of the other vote holders; (b) the potential voting rights held by the investor, other vote holders or other parties; (c) rights arising from other contractual agreements; and (d) any additional facts and circumstances that indicate the investor has, or does not have, the current ability to direct the relevant activities in the time that decision need to be made, including voting patterns at previous shareholders’ meetings. |
The Group will reassess whether it controls an investee if facts and circumstances indicate that there are changes in one or more of the three elements of control previously mentioned.
The financial statements of subsidiaries are included in the consolidated financial statements from the date in which control commences until the date in which control ceases.
| 2.3.2 | Associates or related entities |
Associates or related entities are those entities where the Group has a significant influence but not control, which is generally reflected in an interest between 20% and 50% of the voting rights. The investments in associates or related entities are accounted for using the equity method and are initially recognized at cost. The investment of the Group in associates or related entities includes the goodwill of the acquisition, net of any accumulated impairment loss.
The Group’s interest in the gains or losses which occurred after the acquisition of its associates or related entities is charged to income, and its participation in the equity changes subsequent to the acquisition that do not correspond to income are allocated to the corresponding equity reserves (and are presented accordingly in the statement of other integral income).
When the Group’s interest in the losses of an associate or related entity is equal to or higher than its interest—including any other uninsured accounts receivable—the Group does not recognize additional losses, unless it has incurred liabilities or payments on behalf of the associate or related entity.
Unrealized profits on transactions between the Group and its associates or related entities are eliminated to the extent of the Group’s interest in such entities. The unrealized losses are also eliminated unless the transaction provides evidence of impairment loss of the asset transferred. Whenever necessary to ensure consistency within the Group’s policy, the accounting policies of the associates are modified.
F-17
Dilution gains or losses in associates or related entities are recognized in the statement of income.
The group determines at each reporting date whether there is any objective evidence that the investment in the associate is impaired. If this is the case, the group calculates the amount of impairment as the difference between the recoverable amount of the associate and its carrying value and recognizes the impact in the statement of income.
Transactions with non-controlling interests that do not result in loss of control are accounted for as equity transactions—that is, as transactions with the owners in their capacity as owners. The difference between fair value of any consideration paid and the relevant share acquired of the carrying value of net assets of the associate is recorded in equity.
F-18
| 2.4.1 | Directly consolidated entities |
The detail of the subsidiaries included in consolidation is as follows:
| | | | | | | | | | | | | | | | | | | | | | | | |
| | | | | | | Interest percentage | |
| | | | | | | 12/31/2014 | | | 12/31/2013 | | | 12/31/2012 | |
Country | | Tax ID
Number | | Company name | | Direct | | | Indirect | | | Total | | | Total | | | Total | |
| | | | | | | % | | | % | | | % | | | % | | | % | |
Chile | | 81.201.000-K | | Cencosud Retail S.A. | | | 99.9605 | | | | 0.0004 | | | | 99.9609 | | | | 99.9609 | | | | 99.9609 | |
Chile | | 96.671.750-5 | | Easy S.A. | | | 99.5750 | | | | 0.0000 | | | | 99.5750 | | | | 99.5750 | | | | 99.5750 | |
Chile | | 99.500.840-8 | | Cencosud Administradora de Tarjetas S.A. | | | 99.9929 | | | | 0.0071 | | | | 100.0000 | | | | 100.0000 | | | | 100.0000 | |
Chile | | 76.568.660-1 | | Cencosud Administradora de Procesos S.A. | | | 99.9928 | | | | 0.0072 | | | | 100.0000 | | | | 100.0000 | | | | 100.0000 | |
Chile | | 96.978.180-8 | | Cencosud Internacional Ltda. | | | 74.8487 | | | | 25.1476 | | | | 99.9963 | | | | 99.9963 | | | | 99.9963 | |
Chile | | 94.226.000-8 | | Cencosud Shopping Centers S.A. | | | 99.9999 | | | | 0.0000 | | | | 99.9999 | | | | 99.9999 | | | | 99.9999 | |
Chile | | 78.410.310-2 | | Comercial Food And Fantasy Ltda. | | | 90.0000 | | | | 0.0000 | | | | 90.0000 | | �� | | 90.0000 | | | | 90.0000 | |
Chile | | 76.433.310-1 | | Costanera Center S.A. | | | 99.9999 | | | | 0.0000 | | | | 99.9999 | | | | 99.9999 | | | | 99.9999 | |
Chile | | 76.476.830-2 | | Circulo Mas S.A. | | | 99.0000 | | | | 1.0000 | | | | 100.0000 | | | | 100.0000 | | | | 100.0000 | |
Chile | | 99.565.970-0 | | Banco Paris S.A. | | | 98.8900 | | | | 1.1100 | | | | 100.0000 | | | | 100.0000 | | | | 100.0000 | |
Chile | | 83.123.700-7 | | Mercado Mayorista P y P Ltda. | | | 90.0000 | | | | 0.0000 | | | | 90.0000 | | | | 90.0000 | | | | 90.0000 | |
Chile | | 76.181.388-9 | | Cencosud Tiendas S.A.(*) | | | 0.0000 | | | | 0.0000 | | | | 000.0000 | | | | 100.0000 | | | | 100.0000 | |
China | | Foreign | | Cencosud (Shanghai) Trading CO, Ltda. | | | 100.0000 | | | | 0.0000 | | | | 100.0000 | | | | 100.0000 | | | | 100.0000 | |
Chile | | 76.236.195-7 | | Cencosud Argentina SPA | | | 100.0000 | | | | 0.0000 | | | | 100.0000 | | | | 100.0000 | | | | 100.0000 | |
Chile | | 76.388.146-6 | | Operadora de Procesos S.A. | | | 99.9000 | | | | 0.1000 | | | | 100.0000 | | | | 000.0000 | | | | 000.0000 | |
Chile | | 76.388.155-5 | | Servicios Integrales S.A. | | | 99.9000 | | | | 0.1000 | | | | 100.0000 | | | | 000.0000 | | | | 000.0000 | |
| (*) | As of December 31, 2012, Cencosud S.A. owned 85.58% of Cencosud Tiendas S.A. shares. However, the Company did not account for the non-controlling interest as a result of the option agreement which entitled Cencosud S.A to acquire the remaining interest of 14.42% in future periods. As a consequence, a financial liability was recognized for the payment of the 14.42% of the shares, in accordance to IAS 32 paragraph 23. |
On December 18, 2013, Cencosud Tiendas S.A. was merged with Cencosud S.A. after the exercise of the option for the acquisition of the remaining 14.42% of the shares of Cencosud Tienda S.A., as per the paragraph above.
As of December 31, 2014 Cencosud S.A. proceeded to apply IFRS 5 “Non-current assets classified as held for sale”. Thus reclassifying the operations financial retail for Chile separately in the financial statements. See note 34
F-19
| 2.4.2 | Indirect consolidation entities |
The financial statements of consolidated subsidiaries also include the following companies:
| | | | | | |
Country | | Tax ID number | | Company name | | |
| Chile | | 81.201.000-K | | Cencosud Retail S.A. | | |
| Chile | | 76.365.580-6 | | Jumbo Administradora Norte S.A. | | |
| | | |
| Chile | | 99.571.870-7 | | Jumbo Administradora Temuco S.A. | | |
| Chile | | 76.819.580-3 | | Santa Isabel Administradora Norte Ltda. | | |
| Chile | | 76.819.500-5 | | Santa Isabel Administradora Sur Ltda. | | |
| Chile | | 76.062.794-1 | | Santa Isabel Administradora S.A. | | |
| | | |
| Chile | | 78.448.780-6 | | Paris Administradora Sur Ltda. | | |
| | | |
| Chile | | 77.779.000-5 | | Paris Administradora Ltda. | | |
| Chile | | 77.301.910-K | | Logística y Distribución Paris Ltda. | | |
| Chile | | 77.251.760-2 | | Jumbo Supermercados administradora ltda.. | | |
| Chile | | 77.218.570-7 | | Cencosud Corredores de Seguros y Servicios Ltda. | | |
| Chile | | 77.312.480-9 | | Administradora de Servicios Cencosud Ltda. | | |
| Chile | | 99.586.230-1 | | Hotel Costanera S.A. | | |
| Chile | | 79.829.500-4 | | Eurofashion Ltda. | | |
| Chile | | 76.116.801-3 | | Administradora TMO S.A. | | |
| Chile | | 76.168.900-2 | | Meldar Capacitación Ltda. | | |
| Chile | | 77.566.430-4 | | Sociedad Comercializadora de Vestuarios FES Ltda. | | |
| Chile | | 99.512.750-4 | | MegaJohnsons Puente Alto S.A. | | |
| Chile | | 96.953.470-3 | | MegaJohnsons S.A. | | |
| Chile | | 96.973.670-5 | | MegaJohnsons Maipú S.A. | | |
| Chile | | 96.988.680-4 | | MegaJohnsons Puente S.A. | | |
| Chile | | 96.989.640-0 | | MegaJohnsons Viña del Mar S.A. | | |
| Chile | | 96.988.700-2 | | MegaJohnsons Administradora S.A. | | |
| Chile | | 96.988.690-1 | | MegaJohnsons Quilin S.A. | | |
| Chile | | 76.398.410-9 | | Johnsons Mega San Bernardo S.A. | | |
| Chile | | 76.190.379-9 | | Cencosud Retail Administradora Ltda. | | |
| Chile | | 96.671.750-5 | | Easy S.A. | | |
| Chile | | 76.365.590-3 | | Easy Administradora Norte S.A. | | |
| Chile | | 99.500.840-8 | | Cencosud Administradora de Tarjetas S.A. | | |
| Chile | | 76.023.825-2 | | Cencosud Servicios Integrales S.A. | | |
| Chile | | 94.226.000-8 | | Cencosud Shopping CentersS.A. | | |
| Chile | | 88.235.500-4 | | Sociedad Comercial de Tiendas S.A. | | |
| Chile | | 84.658.300-9 | | Inmobiliaria Bilbao Ltda. | | |
| Chile | | 78.409.990-8 | | ACC Alto las Condes Ltda. | | |
| Chile | | 76.433.310-1 | | Costanera CenterS.A. | | |
| Chile | | 96.732.790-5 | | Inmobiliaria Santa Isabel S.A. | | |
| Chile | | 76.203.299-6 | | Comercializadora Costanera Center S.P.A. | | |
| Chile | | 99.565.970-0 | | Banco Paris S.A. | | |
| Chile | | 76.099.893-1 | | Banparis Corredores de Seguros Ltda. | | |
| Chile | | 96.978.180-8 | | Cencosud Internacional Ltda. | | |
| Chile | | 76.258.307-0 | | Jumbo Argentina S.P.A. | | |
| Chile | | 76.258.309-7 | | Cencosud Internacional Argentina S.P.A | | |
F-20
| | | | | | |
Country | | Tax ID number | | Company name | | |
| Argentina | | Foreign | | Cencosud S.A. (Argentina) | | |
| Argentina | | Foreign | | Unicenter S.A. | | |
| Argentina | | Foreign | | Jumbo Retail Argentina S.A. | | |
| Argentina | | Foreign | | Agrojumbo | | |
| Argentina | | Foreign | | Blaisten S.A. | | |
| Argentina | | Foreign | | Cavas y Viñas El Acequion S.A. | | |
| Argentina | | Foreign | | Carnes Huinca S.A. | | |
| Argentina | | Foreign | | Agropecuaria Anjullon S.A. | | |
| | | |
| Argentina | | Foreign | | Corminas S.A | | |
| Argentina | | Foreign | | Invor S.A. | | |
| Argentina | | Foreign | | Pacuy S.A. | | |
| Argentina | | Foreign | | Supermercados Dave S.A. | | |
| Uruguay | | Foreign | | SUDCO Servicios Regionales S.A. | | |
| Colombia | | Foreign | | Cencosud Colombia S.A. | | |
| Brazil | | Foreign | | Cencosud Brasil S.A. | | |
| U.S.A. | | Foreign | | Gbarbosa Holding LLC | | |
| Brazil | | Foreign | | Gbarbosa Holding S.A | | |
| Brazil | | Foreign | | Cencosud Brasil Comercial Ltda. | | |
| Brazil | | Foreign | | Mercantil Rodrigues Comercial Ltda. | | |
| Brazil | | Foreign | | Perini Comercial de Alimentos Ltda. | | |
| Peru | | Foreign | | Cencosud Perú | | |
| Peru | | Foreign | | Teledistribución S.A. | | |
| Peru | | Foreign | | Almacenes Metro S.A. | | |
| Peru | | Foreign | | E. Wong S.A. | | |
| Peru | | Foreign | | Cencosud Retail Peru S.A. | | |
| Peru | | Foreign | | Tres Palmeras S.A. | | |
| Peru | | Foreign | | Las Hadas Inversionistas S.A. | | |
| Peru | | Foreign | | Cinco Robles SAC | | |
| Peru | | Foreign | | ISMB Supermercados S.A. | | |
| Peru | | Foreign | | Travel International Partners Perú S.A. | | |
| Peru | | Foreign | | Banco Cencosud S.A. | | |
| 2.5 | Foreign currency transaction |
| 2.5.1 | Functional and presentation currency |
Each entity included in these consolidated financial statements is measured using its functional currency, which is the currency of the main economic environment where the entity operates. The consolidated financial statements are presented in Chilean pesos.
In the case of international investments, the functional currency of each company has been defined as the local currency, as the business has a local focus and it is involved in the retail business.
The functional currency of each subsidiary was the Group operates is:
| | |
Country | | Functional currency |
| Chile | | Chilean peso |
| Argentina | | Argentine peso |
| Brazil | | Brazilian Real |
| Peru | | Peruvian Nuevo Sol |
| Colombia | | Colombian peso |
| China | | Yuan |
If the presentation currency differs from the functional currency of the entity, this entity must translate its results and financial position to the selected presentation currency, which in this case is the Chilean peso.
F-21
| 2.5.2 | Transactions and balances |
Transactions in foreign currency and adjustable units (“Unidad de Fomento” or “UF”) are recorded at the exchange rate of the corresponding currency or adjustable unit as of the date on which the transaction complies with the requirements for its initial acknowledgement. The UF is a Chilean inflation-indexed, peso-denominated monetary unit. The UF rate is set daily in advance based on changes in the previous month’s inflation rate. At the close of each statement of financial position the monetary assets and liabilities denominated in foreign currencies and adjustable units are translated into Chilean pesos at the exchange rate of the corresponding currency or adjustable unit. The exchange difference arising, both from the liquidation of foreign currency operations, as well as from the valuation of foreign currency monetary assets and liabilities, and the difference arising from the changes in adjustable units are recorded in the statement of income.
Transactions in foreign currency will be translated to the functional currency using the exchange rates in effect at the time of each transaction. Gains and losses in foreign currency that result from the liquidation of the transactions and from the translation at the current exchange rates at the closing of monetary assets and liabilities denominated in foreign currencies are recognized in the statement of income.
Exchange rates
The assets and liabilities held in foreign currency and those set in UF (indexation unit), are presented at the following exchange rates and closing values:
| | | | | | | | | | | | | | | | | | | | | | | | | | | | |
Date | | Ch$/US$ | | | $Ch/Uf | | | $Ch/$ Ar$ | | | $Ch/Colombian$ | | | $Ch/
Peruvian
nuevo sol | | | $Ch/
Brazilian
real | | | $CL/
Chinese
yuan | |
12-31-2014 | | | 606.75 | | | | 24,627.10 | | | | 70.97 | | | | 0.25 | | | | 202.93 | | | | 228.27 | | | | 97.59 | |
12-31-2013 | | | 524.61 | | | | 23,309.56 | | | | 80.49 | | | | 0.27 | | | | 187.49 | | | | 222.71 | | | | 86.49 | |
12-31-2012 | | | 479.96 | | | | 22,840.75 | | | | 97.70 | | | | 0.27 | | | | 188.15 | | | | 234.98 | | | | 77.02 | |
Group entities
The results and financial position of all the entities of Cencosud Group (none is in a hyperinflationary economy), that have a functional currency different than the presentation currency, are translated to the presentation currency as follows:
| a. | Assets, liabilities and equity of each statement of financial position are translated at the closing exchange rate of the closing date of the accounting period. |
| b. | Revenues and expenses of each statement of income are translated at average exchange rate (unless this average does not represent a reasonable approximation of the accumulative effect of the rates existing on the transaction dates, in which case income and expenses are translated at the exchange rate of the date of the transaction); and |
| c. | All the resulting exchange differences are recognized in other comprehensive income. |
On consolidation, the exchange rate differences arising from the translation of a net investment in foreign operations (or national entities with a functional currency that is different than the holding company), are recorded in net equity. When an investment is sold or disposed of (in part or entirely), exchange differences are recorded in the statement of income as part of the gain or loss on sale.
Adjustments to goodwill and to fair value of the assets and liabilities arising from the acquisition of a foreign entity (or entity with a functional currency different to that of the holding company) are treated as assets and liabilities of the foreign entity and translated at the closing exchange rate.
F-22
| 2.6 | Financial information of operating segments. |
Segment information is reported in a manner consistent with the internal reports delivered to those responsible for making the relevant operating decisions. Such executives are in charge of allocating resources and assessing the performance of the operating segments, which have been identified as:
Supermarkets, department stores, home improvement stores, shopping centers, financial services and other for which the strategic decisions are made.
This information is detailed in Note 28.
| 2.7 | Property, plant and equipment. |
Property, plant and equipment are measured at the acquisition cost, which includes the additional costs incurred until the asset is in operating condition, less the accumulated depreciation and the impairment losses.
Impairment losses are recorded as expenses in the Company’s consolidated statements of income by function.
Depreciation is recorded in the statement of income following the straight line method considering the useful life of the different components.
Leasehold improvements are amortized over the shorter of useful life or the duration of lease agreements.
The Group reviews the residual value, useful life and depreciation method of the property, plant and equipment as of each reporting period. Modifications in the initially set criteria are recognized, according to the situation, as a change in an estimate.
Periodic expenses related to maintenance, conservation and repairs are recorded in the consolidated statement of income by function as incurred.
Subsequent costs are included in the asset’s carrying amount or recognized as a separate asset, as appropriate, only when it is probable that future economic benefits associated with the item will flow to the Group and the cost of the item can be measured reliably. The carrying amount of the replaced part is derecognized. All other repairs and maintenance are charged to income during the financial period in which they are incurred.
Investments properties are assets maintained to generate income through lease which corresponds to land, buildings, work in progress and other constructions which are held to be leased or for a capital appreciation as a result of the increases occur in the future in their respective market prices. Investment properties are initially recognized at acquisition cost which mainly includes its purchase price and any directly attributable expenditure. The group has chosen as its accounting policy for subsequent valuations of these assets the fair value model, using the methodology of discounting the future cash flows to an appropriate discount rate. The Management estimated at each statement of financial position variations of this value, according to the discounted cash flow model. Gains and losses arising from changes in fair value of investment properties are included in the income statement as they occur and are not subject to annual depreciation. Gains from investment propertyrevaluation are not part of the taxable income and are excluded in determining the distributable net result for minimum accrual dividend.
The Group owns shopping centers in which it keeps its own stores and stores leased to third parties. In these cases, only the portion leased to third parties is considered investment property, recognizing the own stores as property, plant and equipment in the financial statements.
F-23
Intangible assets are those non-monetary assets without physical substance that are susceptible of being singled-out and identified, either because they are separable or because they arise from a legal or a contractual right. The only intangible assets recorded in the statement of financial position are those assets whose cost can be measured in a reliable way (or identified and recorded at fair value in a business combination) and those that the Group expects will generate future economic benefits.
In the case of intangible assets with an indefinite useful life, the Company considers that these maintain their value constantly over time, and therefore are not amortizable. However, these are tested for impairment annually, or more frequently, if events or changes in circumstances indicate a potential impairment.
The goodwill represents the excess of the acquisition cost over the fair value of the Group’s interest in the identifiable net assets of the subsidiary/associate as of the date of acquisition. Goodwill related to subsidiary acquisitions is included under intangible assets. Goodwill related to acquisitions of associates is included under investments in associates, and is tested for impairment along with the total balance of the associate.
Goodwill is not amortized; it is subsequently measured at cost less accumulated impairment losses and is tested for impairment annually. To perform this analysis, goodwill is allocated among the cash generating units that are expected to benefit from the business combination that generated the goodwill, and an estimation of the recoverable amount of the cash generating units through the method of the discounted cash flows estimated for each of the cash generating units. If the recoverable amount of any of the cash generating units is lower than the discounted cash flows, a loss should be recorded to income for the period. A loss from impairment of goodwill cannot be reversed in subsequent periods.
Goodwill impairment reviews are undertaken annually or more frequently if events or changes in circumstances indicate a potential impairment. The carrying value of goodwill is compared to the recoverable amount, which is the higher of value in use and the fair value less costs to sell. Any impairment is recognized immediately as an expense.
Gains and losses related to the sale of an entity include the book value of the goodwill related to the sold entity.
Commercial brands correspond to intangible assets of indefinite useful life that are shown at its acquisition cost, less any impairment loss. Trademarks acquired in a business combination are recognized at fair value at the acquisition date. These assets are subject to impairment tests annually or more frequently when events indicate that impairment may exist.
| 2.9.4 | Information technology and licenses. |
The licenses and database for information technology that have been acquired are capitalized at the cost incurred in the purchase plus the cost of implementation of the specific application. These expenses are amortized over the estimated useful life.
The corresponding development and maintenance expense of information technology are recorded as an expense of the period. Costs directly related with the production of unique and identifiable information technology that are controlled by the Group, and that may generate economic benefits that exceed the costs for over a year, are recognized as intangible assets. The direct costs include the expenses related to the personnel developing the application.
Development costs of technology recognized as assets are amortized over their estimated useful life.
F-24
General and specific borrowing costs directly attributable to the acquisition, construction or production of any qualified assets as described in Notes 2.7, which are assets that necessarily take a substantial period of time to get ready for their intended use or sale, are added to the cost of those assets, until the assets are ready for their intended use or sale.
Investment income earned on the temporary investment of specific borrowings pending their expenditure on qualifying assets is deducted from the borrowing costs eligible for capitalization.
All other borrowing costs are recognized in profit and loss in the period in which they are incurred.
| 2.11 | Impairment loss of non-financial assets. |
The assets that have an indefinite useful life are not subject to amortization and are tested annually for impairment. The assets subject to amortization are reviewed for impairment tests whenever events or changes in circumstances indicate that the carrying amount may not be recoverable.
To test if the assets have suffered an impairment of value, the Group compares the book value of the assets with their recoverable amount and recognizes an impairment loss for the excess of the book value over its recoverable amount.
The recoverable amount is the higher of an asset’s fair value less costs to sell and value in use. For purposes of assessing impairment, assets are grouped at the lowest levels for which there are separately identifiable cash flows (cash-generating units). Non-financial assets other than goodwill that suffered impairment are reviewed for possible reversal of the impairment at each reporting date.
Non-financial assets other than goodwill that have experienced an impairment loss are subject to subsequent impairment reviews as of each statements of financial position closing date in case a reversal of the loss may have occurred. If this situation occurs, the recoverable amount of the specific asset is recalculated and its amount increased if necessary. The increase is recognized in the Consolidated Statement of Comprehensive Income as a reversal of impairment losses. The increase in the asset resulting from the reversal of the impairment loss is limited to the amount that would have been recognized had there been no impairment.
The Group classifies its financial assets within the following categories: financial assets at fair value through profit or loss, and loans and receivables. The classification depends on the purpose for which the investments were acquired. The Group sets the classification of the investments at the time of the initial recognition. Purchases or sales of financial assets are accounted for as of the settlement date, which is the date when the asset is delivered or received by the Company.
| 2.12.1 | Financial assets at fair value through profit or loss. |
This category has two subcategories: (i) financial assets held for “trading” and (ii) those designated at the beginning as financial assets at fair value through profit or loss. The gains and losses that arise from the changes in their fair value are included in the net results of the period. A financial asset is classified at fair value through profit or loss if it is acquired mainly with the purpose of selling it in the short-term or if it is designated as such. The financial derivative instruments are classified as held for trading unless they are designated as hedging instruments.
The financial assets available to fair value with changes in results are accounted for subsequently to the recognition initial by its fair value
Assets within this category are classified as current if they are held for trading or if they are expected to be realized within twelve months of the date of the financial statements.
F-25
| 2.12.2 | Trade receivables and other receivables. |
Trade receivables are financial assets other than financial derivative instruments, with fixed payments or with established amounts that are not traded the financial market. They are included within current assets, with the exception of those maturing in over twelve months from the closing date of the financial statements, in which case they are classified as non-current assets.
Account receivables originated by the Company with a maturity in excess of 90 days are measured at their “amortized cost” by recognizing in income the accrued interests based on the effective interest rate (IRR). Amortized cost means the initial cost less the amortization of principal and the accumulated amortization based on the effective interest rate, considering the potential reductions due to impairment or payment default. Impairment for these assets happens when there is objective evidence that the Company will not be able to collect all the balances according to the original terms of the account receivable. The amount of the impairment allowance is the difference between the net accounting value and the present value of the discounted cash flows, discounted at the effective interest rate. The change in the impairment allowance is recorded against the Company’s income.
The effective interest rate is that which equals the future cash flows with the initial net asset value.
A value impairment allowance for trade accounts receivable is set when there is objective evidence that the Company will not be able to collect all the payments according to the original terms of the accounts receivable. Some indicators of potential impairment of accounts receivable are debtor’s financial difficulties, probability that the debtor will start a bankruptcy process or a financial restructuring, default or failure to pay, as well as the experience related to the behavior and characteristics of the collective portfolio.
The amount of the allowance is the difference between the book value of the asset and the present value of the estimated future cash flows, discounted at the effective interest rate. The book value of the asset is reduced through the allowance account and the amount of the loss is recorded in the statement of income.
| 2.12.3 | Financial assets held to maturity |
The Financial assets held-to-maturity are financial assets not derivatives with fixed or determinable payments and fixed maturity that the Group’s management has the positive intention and ability to hold to maturity. If the Group sells a significant amount of the financial assets held to maturity, the securities classified in this category will be reclassified to available for sale financial assets.
The Financial assets held-to-maturity are subsequently recorded at initial recognition at their amortized cost
| 2.12.4 | Available for sale financial assets |
The available for sale financial assets are non-derivative assets that are designated in this category or not classified in any of the other categories listed above. Subsequent to initial recognition, they are measured at fair value with changes recognised through the other comprehensive income and are included in non-current assets unless Management intends to dispose of the investment in the 12 months following the closing date.
| 2.12.5 | Financial assets and liabilities offset |
Financial assets and liabilities are offset and the net amount reported in the statements of financial position when there is a legally enforceable right to offset the recognized amounts and there is an intention to settle on a net basis to realize the asset and settle the liability simultaneously.
| 2.12.6 | Impairment loss on the value of financial assets |
Assets at amortized cost: the Group assesses at each reporting date if there is objective evidence that a financial asset or a group of financial assets may have suffered losses by impairment accounting. A financial asset or a group of financial assets is impaired, and incurred a loss for impairment, if there is evidence objective the deterioration as a result of one or more events that occurred after the initial recognition of the asset, and that event (or events) that causes of loss makes an impact on the estimated future cash flows of the financial asset or group of financial assets that can be estimated reliably.
F-26
Among the evidence of loss the impairment the may include indications that the debtors or a group of debtors is experiencing significant financial difficulties, non-payments or delays in the payment of interest or principal, the probability that will enter in a bankruptcy situation or in any other situation of financial reorganization, and when observable data indicate that there is a susceptible to valuation decrease in the estimated future cash flows such as changes in payment terms or economic conditions that correlate with defaults.
For the category of loans and accounts receivable, as shown in 2.12.2, the amount of the provision for loss of value is the difference between the net book value and the present value of future cash flows discounted at the original effective rate of the financial asset. The variation of the provision for loss of value is recognized in the results of the company. The carrying amount of the asset is reduced and the amount of the loss is recognised in the consolidated statement of income. If an investment held to maturity or a loan has a variable interest rate, the discount rate to assess any loss the impairment is determined in accordance with the contract current effective interest rate.
If in a later period, the amount of the impairment loss decreases and the decrease can be attributed objectively to an event occurred after the impairment has been recognised (such as an improvement in the creditworthiness of the debtor), the reversal of previously recognized impairment is recognised in the consolidated statement of income.
Assets classified as held for sale: the Group assesses at the end of each accounting period whether there is objective evidence that a financial asset or group of financial assets has deteriorated. For debt instruments, the group uses the criteria explained above for assets at amortized cost. In the case of investments in heritage instruments classified as held for sale, a significant or prolonged decline in the fair value of the instrument below its cost, is also considered evidence that the asset has deteriorated. If there is this type of evidence for the financial assets available for sale, the loss accumulated - valued as the difference between the acquisition cost and the current fair value, less any impairment of that financial asset previously recognized in results - is removed from the heritage and is recognized in results. Impairment losses recognised in the income statement consolidated by equity instruments are not reversed in the consolidated statement of income. If, in a subsequent period, the fair value of a debt instrument classified as available for sale increases and the increase can be attributed objectively to an event happened when impairment losses are recognized in the result, the impairment loss will revert in the consolidated statement of income.
| 2.13 | Derivative financial instruments and hedging activity. |
The derivative financial instruments are initially recorded at fair value on the date a derivative contract is entered and are subsequently re-measured at their fair value through the income account, except in the specific case of the accounting of hedging instruments. In order to classify a derivative as a hedging instrument for accounting purposes, the Company documents (i) as of the transaction date or at designation time, the relationship or correlation between the hedging instrument and the hedged item, as well as the risk management purposes and strategies, (ii) the assessment, both at designation date as well as on a continuing basis, whether the instrument used is effective to offset changes in fair value or in the cash flow of the hedged item. A hedge is considered effective when changes in the fair value or in the cash flow of the underlying directly attributable to the risk hedged are offset with the changes in fair value, or in the cash flow of the hedging instrument with effectiveness between 80% to 125%.
The method to recognize a gain or loss resulting from each valuation will depend on whether the derivative is designated as a hedge or not, and on the nature of the inherent risk of the hedged party. The Group designates certain derivatives as: i) fair value hedge of assets and liabilities recorded in the statements of financial position or and; ii) hedge of asset and liability cash flows recorded in the statements of financial position as highly probable transactions.
Hedges that meet the strict hedging accounting criteria are booked in accordance with IAS 39 “Financial instruments: Recognition and Measurement.”
F-27
The Group documents at the inception of the transaction the relationship between the hedging instrument and the hedged item, as well as its risk management objective and strategy for undertaking various hedging transactions. The Company also documents their evaluation, both at hedge inception and on an ongoing basis, of whether the derivatives that are used in hedging transactions are highly offsetting changes in fair values or cash flows of the hedged items.
Changes in the fair value of derivatives that are designated and qualify as fair value hedges are recorded in the statement of income, together with any changes in the fair value of the covered parties that can be attributable to the hedged risk.
The gain or loss related to the effective portion of interest rate swaps that hedge the loans at fixed interest rates is recognized in the statement of gains and losses as “financial expenses.”
The gain or loss related to the ineffective portion is also recorded in the statement of income. The changes in the fair value of the loans at a fixed rate that can be related to the interest rate risk are recorded in the statement of income under “financial expenses.”
If the hedge ceases to comply with the requirements to be recorded following the hedge accounting guidance, the adjustment in the book value of the hedged party for which the effective rate method is being used will be amortized in income over the remaining period until its maturity.
The effective portions of the changes in the fair value of derivatives that have been designated and qualify as cash flows hedges are recorded in net equity through other comprehensive income. The gain or loss related to the ineffective portion is recorded immediately in the statement of income as “other income (loss)”…
The accumulated amounts in net equity are included in the statement of income in the periods in which the hedged parties impact the income account.
When a hedging instrument expires or is sold, or when a hedge no longer meets the criteria for hedge accounting, any cumulative gain or loss existing in equity at that time remains in equity and is recognized when the forecasted transaction is ultimately recognized in the statement of income. When a forecast transaction is no longer expected to occur, the cumulative gain or loss that was reported in equity is immediately transferred to the statement of income within “other gains/(losses)—net”.
F-28
| 2.13.3 | Financial assets—options. |
In order to determine the fair value of call options (a financial asset), the company considers the net present value of the discounted cash flows of the underlying asset and an analysis of market comparable.
Options contracts incorporated into the agreements between Cencosud S.A. and UBS A.G. London Branch “UBS” (note 23.5) are recognized in the financial statements of Cencosud S.A. as follows:
| • | | The put option was initially accounted for as a liability with a charge to the equity account other reserves, at the present value of the estimated exercise price, in accordance with the provisions of IAS 32 “Financial Instruments: Presentation.” |
| • | | After the initial recognition, all variations in the value of the put option are recorded against profit and loss. |
| • | | After their initial recognition, the call option is accounted at fair value through profit or loss. The fair value is the present value of the difference between the amount to be paid to exercise the option and the fair value of the underlying shares. |
| • | | If the call option is exercised, the asset will be derecognized together with the cash provided as the exercise price, with a credit to non-controlling interest and other reserves within equity. The liability for the put option will be reversed with a credit to the equity account other reserves. |
| • | | If the put option is exercised, the corresponding liability will be derecognized with a balancing entry for the cash outflow given as the exercise price. The non-controlling interest will be derecognized against the asset for the call option (if any) and against the equity account other reserves. |
The Cencosud acquired 38.6062% of the stocks of Jumbo Retail Argentina S.A., held by UBS. Additionally, Cencosud and UBS agreed on ceasing the call and put option contracts. The impact from this transaction was presented in other reserves in the statement of changes in net equity.
Assets recorded under inventory are stated at the lower value between acquisition cost or production cost, and the net realizable value.
The net realizable value is the estimated sales price in the normal course of operations, less estimated costs necessary to complete the sale.
Commercial and other discounts as well as other similar entries are deducted in the determination of the acquisition price.
The valuation method of the inventory is the Weighted Average Cost.
The cost of inventory includes all the costs related to the acquisition and transformation of the inventory, as well as other costs that may have been incurred to achieve their current condition and location, among which the cost of consumed material, labor, and manufacturing expenses are included.
F-29
| 2.15 | Trade debtors and other receivables. |
Trade accounts receivable are recognized initially at their fair value (nominal value including an implicit interest) and subsequently recorded at their amortized cost according to the effective interest rate method, less the impairment allowance.
A value impairment allowance for trade accounts receivable is set when there is objective evidence that the Company will not be able to collect all the payments according to the original terms of the accounts receivable. Some indicators of potential impairment of accounts receivable are debtor’s financial difficulties, probability that the debtor will start a bankruptcy process or a financial restructuring, default or failure to pay, as well as the experience related to the behavior and characteristics of the collective portfolio.
The implicit interest is separated from the rest of the balance and is recorded as a financial income as the interests are accrued.
The amount of the allowance is the difference between the book value of the asset and the present value of the estimated future cash flows, discounted at the effective interest rate. The book value of the asset is reduced through the allowance account and the amount of the loss is recorded in the income statement.
| 2.16 | Cash and cash equivalents. |
Cash and cash equivalents include cash-in-hand, time deposits at financial entities, other liquid short-term investments with a high liquidity usually with an original maturity of up to three months and bank overdrafts. In the statement of financial position, if there are overdrafts, these are recorded under the line other financial liabilities within the line bank loans.
| 2.17 | Loans and other financial liabilities. |
Loans, debt arising from bond issuances and financial liabilities are initially recorded at their fair value, less the transaction costs that are directly related to the transaction. Afterwards, the financial liabilities held by the Group are measured at their amortized cost using the effective rate method.
The effective rate is that which matches future payments with the net initial value of the liability.
The financial liabilities are discharge when the obligation is cancelled, liquidated or expires. When an existing financial liability is replaced by another from the same lender on substantially different terms, or the terms of an existing liability are substantially modified, such an Exchange or modification is treated as low accountant of the original liability and the recognition of a new liability, and the difference in the respective carrying amounts is recognized in the income statement
| 2.18 | Trade payables and other payables. |
The trade creditors and other accounts payable are recorded at their nominal value, as their average payment terms are small and there is not a relevant difference with their fair value.
Accounts payable are classified as current liabilities if payment is due within one year or less (or in the normal operating cycle of the business if longer). If not, they are presented as non-current liabilities.
Trade payables are recognized initially at fair value and subsequently measured at amortized cost using the effective interest method.
Provisions are recorded in the statements of financial position when:
| a. | The Group has a present obligation (either legal or implicit) as a result of past events, |
| b. | It is probable that a resource outflow will occur that incorporate economic benefits to extinguish the obligation, and |
| c. | A reliable estimate of the amount of the obligation can be made. |
F-30
Provisions are measured at the present value of the cash outflows that are expected to be necessary to settle the liability, considering the best information available at the date of the annual financial statements, and are restated at the closing of each accounting period. The discount rate used to establish the present value reflects the current market assessments, at the date of the financial statements, of the time value of money, as well as the specific risk related to the specific liability.
F-31
The Company records vacation benefits expense following the accrual method. This benefit corresponds to all the personnel and is equivalent to a fixed amount according to the contracts of each employee. This benefit is recorded at its nominal value.
| 2.20.2 | Employee Benefit Plans |
The Group, in its Brazilian operations has a pension plan among other benefits with the employees. These commitments, both defined benefit and defined contribution, are instrumented through pension plans.
The Group’s net obligation in respect of defined benefit plan is calculated separately for each plan by estimating the amount of the future benefit that the employees have earned in the current and prior periods, discounting that amount and deducting the fair value of any plan assets.
The calculation of defined benefit obligation is performed annually by a qualified actuary using the projected unit credit method. When the calculation results in a potential asset for the Group, the recognized asset is limited to the present value of economic benefits available in the form of any refund from the plan or reductions in future contributions to the plan. To calculate the present value of economic benefits, consideration is given to any applicable minimum funding requirements.
Re-measurements of the net defined benefit liability, which comprise actuarial gains and losses, the return on plan assets (excluding interest) and the effect of the asset ceiling (if any, excluding interest), are recognized immediately in OCI. The Group determines the net interest expense (income) on the net defined benefit liability (asset) for the period by applying the discount rate used to measure the defined benefit obligation at the beginning of the annual period to the then-net defined benefit liability (asset), taking into account any changes in the net defined benefit liability (asset) during the period as a result of contributions and benefit payments. Net interest expense and other expenses related to the defined benefit plans are recognized in profit and loss.
When the benefits of a plan are changed or when a plan is curtailed, the resulting change in benefit that related to past service or the gain or loss on curtailment is recognized immediately in profit and loss. The Group recognizes gain and losses on the settlement of a defined benefit plan when the settlement occurs.
Defined Contribution plans
Obligations for contribution plans are expensed as the related service is provided. Prepaid contributions are recognized as an asset to the extent that a cash refund or a reduction in future payments is available.
Revenue recognition corresponds to the gross entry of economic benefits during the period from the Group operations. The revenue amount is shown net of any tax levy, price discounts and other items that impact the sales price.
Revenue is measured at the fair value of the consideration received or receivable, and represents amounts receivable for goods supplied, stated net of discounts, returns and value added taxes. The group recognizes revenue when the amount of revenue can be reliably measured; when it is probable that future economic benefits will flow to the entity; and when specific criteria have been met for each of the group’s activities, as described below. The group bases its estimate of return on historical results, taking into consideration the type of customer, the type of transaction and the specifics of each arrangement.
Ordinary revenue from sales of goods.
The sales of goods are recorded when the risks and benefits that rise from the ownership of the goods are substantially transferred, the amount of the income can be accurately calculated, and the collection of the sales is deemed probable.
F-32
Ordinary revenue from leases.
Revenue obtained from leases is recognized in a straight-line over the life of the corresponding contracts as per IAS 17.
Interest income.
The financial income derived from the Group’s commercial cards is recorded on an accrual basis according to the terms agreed upon with the customers. Interest is recognized using effective interest rate method.
When a loan and receivable is impaired, the group reduces the carrying amount to its recoverable amount, which is the estimated future cash flow discounted at the original effective interest rate of the instrument, and continues unwinding the discount as interest income. Interest income on impaired loans and receivables is recognized using the original effective interest rate.
Revenues from insurance brokerage, travel agencies and family entertainment centers.
The Company has income from personal and/or large-scale insurance brokerage exclusively to customers of the companies involved in the Group. The commission is recognized as earned over the term of the related coverage.
The Company generates revenues from domestic and international travel agency services. Commissions are recognized monthly and when the risks and benefits inherent in the transactions have been transferred to third parties.
The Company has revenues from of family entertainment services which are part of the malls of the Group. Revenue is recognized when services have been effectively provided.
Customer loyalty program.
The Group operates a loyalty program where customers accumulate points for purchases made, which entitle them to discounts on future purchases. The reward points are recognized as a separately identifiable component of the initial sale transaction by allocating the fair value of the consideration received between the award points and the other components of the sale such that the reward points are initially recognized as deferred income at their fair value.
Revenue from the reward points is recognized when the points are redeemed. Breakage is recognized as reward points are redeemed based upon expected redemption rates. Reward points expire 12 months after the initial sale.
Cencosud registers deferred income for various transactions from which cash is received and when the conditions to register the income described in Note 2.21 have not been met, such as cash received at the beginning of the issuance of the Group’s investment property rental contracts.
Deferred income is recorded in the statement of income on an accrual basis and when the commercial and contractual conditions are met.
Leases are classified as financial when they substantially transfer all the risks and benefits related to the ownership of the good. All other leases are considered as operating.
Goods acquired through a finance lease are recorded as non-current assets, and are initially measured at the present value of the minimum future payments or at its fair value if it is lower, reflecting the corresponding debt with the lessor as a liability. The payments made are detailed between the debt repayment and the corresponding financial burden, which is recorded as a financial expense for the year.
In the case of operating leases, the expense is recorded in a straight line according to the life of the lease contract for the fixed lease portion. The contingent leases are recorded as an expense of the period in which the payment appears probable, as well as the increments of fixed rent indexed by the fluctuation of the consumer price index.
F-33
| 2.24 | Current and deferred income taxes. |
The tax expense for the period is comprised of current and deferred tax. Tax is recognized in the statement of income, except to the extent that it relates to items recognized in other comprehensive income or directly in equity. In this case, the tax is also recognized in other comprehensive income or directly in equity, respectively.
The current tax is that which is estimated that will be paid or recovered during the period, using approved legal tax rates, or about to be approved at the date of the financial position statement, corresponding to the current period and including an adjustment corresponding to income taxes payable or recoverable from prior periods.
The deferred tax is calculated using the liability method, which identifies the temporary differences that arise from carrying balances used for the purpose of financial information and those used for tax purposes. The deferred tax liability corresponds to the amounts payable in the future from the temporary tax differences, and the deferred tax assets are those amounts recoverable as a result of temporary deductible differences, compensating negative taxable income balances or tax deductions pending application.
The assets and liabilities from deferred income taxes are measured at the rates applicable in the corresponding periods when the assets will be realized or the liabilities will be paid, based on approved current legal regulations at the date of the financial statements and after considering all tax consequences that derive from the way that the Group expects to recover the assets and liquidate the liabilities.
A deferred income tax asset is recorded only up to the point that it is probable that there will be future fiscal gains, against which unused fiscal credits can be applied. The deferred income tax assets accounted for, as well as those not accounted for, are subject to review at every closing date.
The deferred income tax rate is accrued from the temporary differences that arise from the investments in subsidiaries and affiliates, except when the Company has control over the time when the temporary differences will be reversed, and what it is probable that the temporary difference will not be reversed in the foreseeable future.
The deferred income tax assets and liabilities are recorded in the consolidated financial statements as non-current assets and liabilities, independently of their expected date of realization or liquidation.
The deferred income tax assets and liabilities are compensated when there is a legally executable right to compensate the current tax assets with the current tax liabilities and when the deferred income tax asset and liability are related to the income tax that is levied by the same tax authority to the same tax subject or to different tax subjects where there is the intention of liquidating the balances over a net basis.
| 2.25 | Payment of dividends. |
The payment of dividends to the Company’s shareholders is recorded as a liability in the annual accounts of the Group in the period in which the dividends are approved by the Company’s shareholders or when the corresponding liability is accrued according to legal regulations or the by-laws set at the Shareholders’ Meeting.
Law 18,046, requires the distribution of at least 30% of the net results for the year, unless the Shareholders provided byunanimity of the issued voting otherwise. In compliance with this requirement, the Company provisions 30 % of the net result thereof less dividends paid on a temporary basis during the year asminimum dividend.
The Company’s paid-in capital is represented by ordinary shares.
The incremental costs that can be directly allocated to the issuance of new shares are presented as a reduction to net equity, net of income taxes.
F-34
| 2.27 | Share-based payments. |
Compensation plans implemented through the use of stock options are recognized in the financial statements applying IFRS 2 “Share-based payments”, booking the expenses associated with the services provided by company executives at the time that these are incurred booking a credit in the account of other equity reserves.
The Company determines the fair value of the services received by referring to the fair value of the equity instruments at the date on which they are issued. The plan that issues the stock options based on continued employment assumes that the services will be received on a lineal basis up to the maturity date of the stock options. Likewise, in the case of stock options based on performance, it is assumed that the services will be received on a lineal basis up to the maturity date of the stock options.
The fair value of the employee services received in exchange for the grant of the options is recognized as an expense. The total amount to be expensed is determined by reference to the fair value of the options granted, including any performance condition and to have a current employment contract with the Company or any of its subsidiaries in Chile or abroad and the employment relationship has-not been interrupted from the date of signature of this contract until the date of execution of stock options.
At each year end, the Company reviews the estimations of the number of options that can be exercised.
Once the options are exercised, the Company will decide if new compensation payments in shares will be issued
| 2.28 | Non-current assets classified as held for sale. |
Anon-current asset (or a group of assets for disposal) will be classified as held for sale if their carrying amount will be recovered primarily through a transaction of sale, rather than by its continued use and a sale is considered highly probable.
The non-current asset (or assets for disposal groups) classified as held for sale, will be measured at the lower of their carrying amount or fair value less costs to sell.
Non-current assets will not be depreciated (or amortized) as long as they are classified as held for sale, or are part of an asset for a disposal group classified as held for sale. However, continue to recognizing both interest and other expenses attributable to the liabilities of a group of assets for disposal that have been classified as held for sale.
| 2.29 | Discontinued operations. |
A discontinued operation is a component of the entity that has been disposed of, or has been classified as kept for sale, and:
| | a) | Represents a separate major of business or a geographical area of operations, which is significant and can be separated from the rest of the Company; |
| | b) | Is part of a single co-ordinated plan to dispose of a separate major line of business or a geographical area of the operation that is significant and can be considered to be separated from the rest of the Company; o |
| | c) | Is a subsidiary acquired exclusively with a view to resale |
Cost of sales includes the cost of acquiring products sold and other costs incurred to bring inventory to the locations and conditions necessary for their sale. These costs primarily include acquisition costs net of discounts obtained, non-recoverable import expenses and taxes, insurance and costs for transporting products to distribution centers.
Cost of sales also includes losses related to the credit card receivable portfolio from the financial services segment.
| 2.31 | Other expenses by function. |
Other expenses by function includes, primarily, advertising expenses that the company incurs to promote its products and brands.
F-35
Distribution costs include all expenses necessary to deliver products to customers.
| 2.33 | Administrative expenses. |
Administrative expenses include payroll and personnel compensation, depreciation of property, plant and equipment for administrative purposes, amortization of non-current assets, and other overhead and administrative expenses.
| 2.34 | Change in accounting policies |
The Group has adopted the new accounting policies and pronouncements as set out in note 2.2, none of the new amendments and pronouncements had a significant impact on the group’s consolidated financial statements in 2013.
| 2.35 | Non-cash transactions |
Except for the acquisitions of assets through finance leases, the Group has not entered into any non-cash investing or financing transaction. See note 17.5.
F-36
| 3 | Risk management policies |
| 3.1 | Position-taking financial instruments. |
| 3.1.1 | Categories of financial instruments (classification and presentation). |
The Company’s position-taking instruments are classified based on their nature, characteristics and the purpose for which they have been acquired or issued.
As of December 31, 2014, and 2013 the Company classifies its financial instruments as follows: Table 1-1. Classification of financial instruments.
December 2014
| | | | | | | | | | | | | | | | | | |
| | | | | | | | | At amortized cost | | | At fair
value | |
Classification | | Group | | Type | | Note | | Book value | | | Fair value
(Informational) | | | Book value | |
| | | | | | | | | ThCh$ | | | ThCh$ | | | ThCh$ | |
At fair value through profit or loss | | Mutual funds | | Mutual fund shares | | 6 | | | | | | | | | | | 37,328,837 | |
| | Derivatives | | Forward | | | | | | | | | | | | | 3,844,213 | |
| | Other financial instruments | | Shares | | 6 | | | | | | | | | | | 42,780 | |
| | | | Financial investments long term | | 6 | | | | | | | | | | | 6,563,165 | |
| | | | Other financial investments | | 6 | | | | | | | | | | | 210,306 | |
Credit cards and Trade receivables, net | | Cash and equivalents | | Cash balances | | 5 | | | 44,859,904 | | | | 44,859,904 | | | | | |
| | | | Bank balances | | 5 | | | 129,874,187 | | | | 129,874,187 | | | | | |
| | | | Short-term deposits | | 5 | | | 44,137,702 | | | | 44,137,702 | | | | | |
| | | | receivables, net | | 8 | | | 816,354,109 | | | | 826,069,978 | | | | | |
| | Receivables from related entities | | Receivables from related entities, current | | 9 | | | 1,371,016 | | | | 1,371,016 | | | | | |
| | | | Receivables due from Bretas | | 6 | | | 16,938,176 | | | | 16,938,176 | | | | | |
Financial liabilities and payables | | Bank loans (1) | | Current | | 17 | | | 629,083,332 | | | | 609,653,255 | | | | | |
| | | | Non-Current | | 17 | | | 695,092,202 | | | | 710,054,526 | | | | | |
| | Bond debt (1) | | Current | | 17 | | | 50,539,046 | | | | 49,313,910 | | | | | |
| | | | Non-Current | | 17 | | | 1,656,384,016 | | | | 1,712,663,485 | | | | | |
| | Other loans (leases) | | Current | | 17 | | | 2,671,208 | | | | 2,671,208 | | | | | |
| | | | Non-Current | | 17 | | | 31,558,878 | | | | 31,558,878 | | | | | |
| | Debt purchase Subsidiaries (Bretas—Prezunic and Johnson’s) | | Current | | 17 | | | 25,542,999 | | | | 25,542,999 | | | | | |
| | | | Non-Current | | | | | 19,681,149 | | | | 19,681,149 | | | | | |
| | Other financial liabilities—other | | Current | | 17 | | | 5,939,949 | | | | 5,939,949 | | | | | |
| | Trade payables, | | Current | | 18 | | | 1,768,572,529 | | | | 1,768,572,529 | | | | | |
| | | | Non-Current | | 18 | | | 29,125,971 | | | | 29,125,971 | | | | | |
| | Withholding taxes | | Current | | 18 | | | 214,513,580 | | | | 214,513,580 | | | | | |
| | | | Non-Current | | 18 | | | 5,323,949 | | | | 5,323,950 | | | | | |
| | Payables to related entities, current | | Current | | 9 | | | 3,302,006 | | | | 3,302,006 | | | | | |
Hedges | | Hedging derivatives | | Cash flow hedging Liabilities | | 17 | | | | | | | | | | | 382,754 | |
| | | | Cash flow hedging assets | | 6 | | | | | | | | | | | 220,058,333 | |
| | | | Fair Value hedging assets | | | | | | | | | | | | | 65,272,783 | |
F-37
December 2013
| | | | | | | | | | | | | | | | | | |
| | | | | | | | | At amortized cost | | | At fair
value | |
Classification | | Group | | Type | | Note | | Book value | | | Fair value
(Informational) | | | Book value | |
| | | | | | | | | ThCh$ | | | ThCh$ | | | ThCh$ | |
At fair value through profit or loss | | Mutual funds Derivatives | | Mutual fund shares | | 6 | | | | | | | | | | | 40,759,800 | |
| | Other financial instruments | | Shares | | 6 | | | | | | | | | | | 38,198 | |
| | | | Financial investments long term | | 6 | | | | | | | | | | | 8,785,942 | |
| | | | Other financial investments | | 6 | | | | | | | | | | | 185,553 | |
Credit cards and Trade receivables, net | | Cash and equivalents | | Cash balances | | 5 | | | 47,627,336 | | | | 47,627,336 | | | | | |
| | | | Bank balances | | 5 | | | 105,893,186 | | | | 105,893,186 | | | | | |
| | | | Short-term deposits | | 5 | | | 18,191,103 | | | | 18,191,103 | | | | | |
| | Receivables Credit card and Trade (2) | | receivables, net | | 8 | | | 1,289,287,365 | | | | 1,368,550,076 | | | | | |
| | Receivables from related entities | | Receivables from related entities, current | | 9 | | | 432,303 | | | | 432,303 | | | | | |
| | | | Receivables due from Bretas | | 6 | | | 15,031,535 | | | | 15,031,535 | | | | | |
Financial liabilities and payables | | Bank loans (1) | | Current | | 17 | | | 441,070,635 | | | | 443,902,235 | | | | | |
| | | | Non-Current | | 17 | | | 420,811,688 | | | | 422,705,217 | | | | | |
| | Bond debt (1) | | Current | | 17 | | | 74,815,992 | | | | 76,569,908 | | | | | |
| | | | Non-Current | | 17 | | | 1,676,045,068 | | | | 1,766,658,876 | | | | | |
| | Other loans (leases) | | Current | | 17 | | | 4,808,673 | | | | 4,808,673 | | | | | |
| | | | Non-Current | | 17 | | | 27,779,079 | | | | 27,779,079 | | | | | |
| | Time deposits and Term savings accounts | | Current | | 17 | | | 151,918,114 | | | | 151,918,114 | | | | | |
| | | | Non-Current | | 17 | | | 48,923,826 | | | | 48,923,826 | | | | | |
| | Debt purchase Subsidiaries (Bretas—Prezunic and Johnson’s) | | Current | | 17 | | | 53,727,111 | | | | 53,727,111 | | | | | |
| | | | Non-Current | | | | | 34,919,748 | | | | 34,919,748 | | | | | |
| | Letters of credit | | Non-Current | | 17 | | | 9,511,591 | | | | 9,511,591 | | | | | |
| | Other financial liabilities—other | | Current | | 17 | | | 12,450,378 | | | | 12,450,378 | | | | | |
| | Trade payables, | | Current | | 18 | | | 1,737,920,899 | | | | 1,737,920,899 | | | | | |
| | | | Non-Current | | 18 | | | 4,956,289 | | | | 4,956,289 | | | | | |
| | Withholding taxes | | Current | | 18 | | | 220,072,319 | | | | 220,072,319 | | | | | |
| | | | Non-Current | | 18 | | | 3,998,528 | | | | 3,998,528 | | | | | |
| | Payables to related entities, current | | Current | | 9 | | | 556,494 | | | | 556,494 | | | | | |
Hedges | | Hedging derivatives | | Cash flow hedging Liabilities | | 17 | | | | | | | | | | | 358,936 | |
| | | | Cash flow hedging assets | | 6 | | | | | | | | | | | 80,099,525 | |
| | | | | | | | | | | | | | | | | (2,911,255 | ) |
| (1) | The fair value for disclosure purposes has been determined using discounted cash flow. Significant inputs include the discount rate used to reflect the credit risk associated with Cencosud S.A., these inputs are within level 2 of the fair value hierarchy. |
| (2) | The fair value of current receivables is not notably different to its carrying amount, as the impact of discounting is not significant. |
F-38
| 3.1.2. | General characterization. |
The Company maintains instruments classified at fair value through profit and loss for trading and risk management (derivate instruments not classified as cash flow or fair value hedges purposes). This category is comprised mainly of investments in mutual funds and derivatives.
The category “loans and Trade receivables net” includes bank balances, time deposits and receivables mainly from the credit card business, receivables from consumer credit loans of Banco Paris and notes receivable from customers when credit is extended using post-dated checks. As a result, this category of financial instruments combines the objectives of surplus optimization, liquidity management and financial planning to satisfy the Company’s working capital needs.
Financial liabilities maintained by the Company include obligations with banks and financial institutions, bond issuances and payables, and certificate of deposit issued by Banco Paris and other liabilities.
Lastly, the Company has classified as hedges those derivative instruments determined to be highly effective in offsetting exposure to changes in the hedged item attributable to the hedged risk.
| 3.1.3. | Accounting treatment of financial instruments (Note 2, accounting policies). |
| 3.1.4. | Valuation methodology (initially and subsequently). |
Financial instruments that have been accounted for at fair value in the statement of financial position as of December 31, 2014 have been measured using the methodologies as set forth in IAS 39. These methodologies applied for each class of financial instruments are classified using the following hierarchy:
Level I: The fair value of financial instruments traded in active markets is based on quoted market prices at the balance sheet date. A market is regarded as active if quoted prices are readily and regularly available from an exchange, dealer, broker, industry group, pricing service, or regulatory agency, and those prices represent actual and regularly occurring market transactions on an arm’s length basis. The quoted market price used for financial assets held by the group is the current bid price.
Level II: The fair value of financial instruments that are not traded in an active market (for example, over-the-counter derivatives) is determined by using valuation techniques. These valuation techniques maximize the use of observable market data where it is available and rely as little as possible on entity specific estimates. If all significant inputs required to fair value an instrument are observable, the instrument is included in level 2.
If one or more of the significant inputs is not based on observable market data, the instrument is included in Level 3.
Specific valuation techniques used to value financial instruments include:
| • | | Quoted market prices or dealer quotes for similar instruments; |
| • | | The fair value of interest rate swaps is calculated as the present value of the estimated future cash flows based on observable yield curves; |
| • | | Other techniques, such as discounted cash flow analysis, are used to determine fair value for the remaining financial instruments |
| • | | The fair value of forward foreign exchange contracts is determined using forward exchange rates at the balance sheet date, with the resulting value discounted back to present value; |
| • | | Other techniques, such as discounted cash flow analysis, are used to determine fair value for the remaining financial instruments. |
Level III: Inputs for assets or liabilities that are not based on observable market data.
F-39
The Group has established control framework with respect to the measurements of fair value. This includes a valuation team that has an overall responsibility for overseeing all significant fair value measurements, including level 3 fair values, and reports directly to the regional CFO.
The valuation team regularly reviews significant unobservable inputs and valuation adjustments. If third party information, such as broker quotes or pricing services, is used to measure fair values, then the valuation team assesses the evidence from third parties to support the conclusion that such valuations meet the requirements of IFRS, including the fair value hierarchy in which such valuation should be classified.
Taking into account the nature and characteristics of the instruments maintained in its portfolio, the Company classifies its valuation methodologies in the three aforementioned levels. Currently, the valuation process considers internally developed valuation techniques, for which parameters and observable market inputs are used, mainly using the present value methodology.
In 2014, the Group has no financial instruments that have been valuated using inputs assessed as level III, however, the procedures above are in line with the Group policies regarding the estimation and review of the inputs used in fair-valuing financial asset and recurrent and non-recurrent non-financial assets, see note 4.
F-40
The table below presents the percentage of financial instruments, valued under each method, compared to their total value.
Table 1-4. Successive valuation methodologies.
December 2014
| | | | | | | | | | | | | | | | | | | | | | | | | | |
| | | | | | | | | | Valuation method | | Amortized
cost | |
Classification | | Group | | Type | | Note | | | Value | | | Level I | | | Level II | | | Level III | |
| | | | | | | | | | ThCh$ | | | % | | | % | | | % | | % | |
At fair value through profit or loss | | Mutual funds | | Mutual fund shares | | | 6 | | | | 37,328,837 | | | | 100 | | | | | | | | | | | |
| | Derivatives | | Forward | | | 6 | | | | 3,844,213 | | | | — | | | | 100 | | | | | | | |
| | Shares | | Shares | | | 6 | | | | 42,780 | | | | 100 | | | | | | | | | | | |
| | Other financial Instrument | | Highly liquid financial instruments | | | 6 | | | | 6,563,165 | | | | 100 | | | | | | | | | | | |
| | | | Other financial investments | | | 6 | | | | 210,306 | | | | 100 | | | | | | | | | | | |
Credit cards and trade Receivables, net | | Cash and cash equivalents | | Cash balances | | | 5 | | | | 44,859,904 | | | | | | | | | | | | | | 100 | |
| | | | Bank balances | | | 5 | | | | 129,874,187 | | | | | | | | | | | | | | 100 | |
| | | | Short-term deposits | | | 5 | | | | 44,137,702 | | | | | | | | | | | | | | 100 | |
| | Receivables | | Credit card and trade receivables, net | | | 8 | | | | 16,938,176 | | | | | | | | | | | | | | 100 | |
| | | | Receivables due from Bretas | | | 6 | | | | 816,354,109 | | | | | | | | | | | | | | 100 | |
| | Receivables from related entities | | Receivables from related entities, current | | | 9 | | | | 1,371,016 | | | | | | | | | | | | | | 100 | |
Financial liabilities and payables | | Bank loans | | Current | | | 17 | | | | 629,083,332 | | | | | | | | | | | | | | 100 | |
| | | | Non-Current | | | 17 | | | | 695,092,202 | | | | | | | | | | | | | | 100 | |
| | Bonds payable | | Current | | | 17 | | | | 50,539,046 | | | | | | | | | | | | | | 100 | |
| | | | Non-Current | | | 17 | | | | 1,656,384,016 | | | | | | | | | | | | | | 100 | |
| | Other loans (lease) | | Current | | | 17 | | | | 2,671,208 | | | | | | | | | | | | | | 100 | |
| | | | Non-Current | | | | | | | 31,558,878 | | | | | | | | | | | | | | 100 | |
| | Debt purchase Bretas | | Current | | | 17 | | | | 25,542,999 | | | | | | | | | | | | | | 100 | |
| | | | Non-Current | | | 17 | | | | 19,681,149 | | | | | | | | | | | | | | | |
| | Other financial liabilities | | Current | | | 17 | | | | 5,939,949 | | | | | | | | | | | | | | 100 | |
| | Trade payables | | Current | | | 17 | | | | 1,768,572,529 | | | | | | | | | | | | | | 100 | |
| | | | Non-Current | | | 17 | | | | 29,125,971 | | | | | | | | | | | | | | 100 | |
| | Withholding taxes | | Current | | | 18 | | | | 214,513,580 | | | | | | | | | | | | | | 100 | |
| | | | Non-Current | | | 18 | | | | 5,323,949 | | | | | | | | | | | | | | 100 | |
| | Payables to related entities | | Current | | | 18 | | | | 3,302,006 | | | | | | | | | | | | | | 100 | |
| | Tax liabilities | | Current | | | 9 | | | | 60,615,912 | | | | | | | | | | | | | | 100 | |
Hedges | | Hedging derivatives | | Cash flow hedging liabilities | | | 17 | | | | 382,754 | | | | | | | | 100 | | | | | | | |
| | | | Cash flow hedging assets | | | 6 | | | | 220,058,333 | | | | | | | | 100 | | | | | | | |
| | | | Cash flow fair value | | | 6 | | | | 65,272,783 | | | | | | | | 100 | | | | | | | |
F-41
December 2013
| | | | | | | | | | | | | | | | | | | | | | | | |
| | | | | | | | | Valuation method | | Amortized
cost | |
Classification | | Group | | Type | | Note | | Value | | | Level I | | | Level II | | | Level III | |
| | | | | | | | | ThCh$ | | | % | | | % | | | % | | % | |
At fair value through profit or loss | | Mutual funds | | Mutual fund shares | | 6 | | | 40,759,800 | | | | 100 | | | | | | | | | | | |
| | Shares | | Shares | | 6 | | | 38,198 | | | | 100 | | | | | | | | | | | |
| | Other financial Instrument | | Highly liquid financial instruments | | 6 | | | 8,785,942 | | | | 100 | | | | | | | | | | | |
| | | | Other financial investments | | 6 | | | 185,553 | | | | 100 | | | | | | | | | | | |
Credit cards and trade Receivables, net | | Cash and cash equivalents | | Cash balances | | 5 | | | 47,627,336 | | | | | | | | | | | | | | 100 | |
| | | | Bank balances | | 5 | | | 105,893,186 | | | | | | | | | | | | | | 100 | |
| | | | Short-term deposits | | 5 | | | 18,191,103 | | | | | | | | | | | | | | 100 | |
| | Receivables | | Credit card and trade receivables, net | | 8 | | | 1,289,287,365 | | | | | | | | | | | | | | 100 | |
| | | | Receivables due from Bretas | | 6 | | | 15,031,535 | | | | | | | | | | | | | | 100 | |
| | Receivables from related entities | | Receivables from related entities, current | | 9 | | | 432,303 | | | | | | | | | | | | | | 100 | |
Financial liabilities and payables | | Bank loans | | Current | | 17 | | | 441,070,635 | | | | | | | | | | | | | | 100 | |
| | | | Non-Current | | 17 | | | 420,811,688 | | | | | | | | | | | | | | 100 | |
| | Bonds payable | | Current | | 17 | | | 74,815,992 | | | | | | | | | | | | | | 100 | |
| | | | Non-Current | | 17 | | | 1,676,045,068 | | | | | | | | | | | | | | 100 | |
| | Other loans (lease) | | Current | | 17 | | | 4,808,673 | | | | | | | | | | | | | | 100 | |
| | | | Non-Current | | | | | 27,779,079 | | | | | | | | | | | | | | 100 | |
| | Deposits and savings Accounts | | Current | | | | | 151,918,114 | | | | | | | | | | | | | | 100 | |
| | | | Non-Current | | 17 | | | 48,923,826 | | | | | | | | | | | | | | 100 | |
| | Debt purchase Bretas | | Current | | 17 | | | 53,727,111 | | | | | | | | | | | | | | 100 | |
| | | | Non-Current | | 17 | | | 34,919,748 | | | | | | | | | | | | | | | |
| | Letters of credit | | Current | | 17 | | | 9,511,591 | | | | | | | | | | | | | | 100 | |
| | Other financial liabilities | | Current | | 17 | | | 12,450,378 | | | | | | | | | | | | | | 100 | |
| | Trade payables | | Current | | 17 | | | 1,737,920,899 | | | | | | | | | | | | | | 100 | |
| | | | Non-Current | | 17 | | | 4,956,289 | | | | | | | | | | | | | | 100 | |
| | Withholding taxes | | Current | | 18 | | | 220,072,319 | | | | | | | | | | | | | | 100 | |
| | | | Non-Current | | 18 | | | 3,998,528 | | | | | | | | | | | | | | 100 | |
| | Payables to related entities | | Current | | 18 | | | 556,494 | | | | | | | | | | | | | | 100 | |
| | Tax liabilities | | Current | | 9 | | | 63,131,459 | | | | | | | | | | | | | | 100 | |
Hedges | | Hedging derivatives | | Cash flow hedging liabilities | | 17 | | | 358,936 | | | | | | | | 100 | | | | | | | |
| | | | Cash flow hedging assets | | 6 | | | 80,099,525 | | | | | | | | 100 | | | | | | | |
| | | | Fair value hedging assets | | | | | (2,911,255 | ) | | | | | | | 100 | | | | | | | |
Level I instruments are accounted from prices in an active market for directly observable and identical asset and liabilities.
Instruments classified as Level II correspond mainly to interest rate and cross currency swaps that have been valued by discounting the future cash flows stipulated in the contract for both the asset and liability component of each instrument. The structure of interest rates used to bring the future cash flows to present value is constructed based on the currency of each component and inferred from transactions involving risk-free instruments in the relevant market.
In order to estimate the fair value of debt instruments not accounted for at amortized cost, the Company has estimated the cash flows from variable interest obligations using relevant swap curves. The structure of interest rates used to bring the future cash flows to present value is constructed based on the currency of each obligation and corresponds to the risk-free curve in the relevant market plus a credit spread inferred from the initial contractual conditions of each obligation.
F-42
In addition, the fair value for informational purposes (Table 1-1) has been estimated for those instruments accounted for at amortized cost. For instruments maturing in less than one year, the Company has determined that the fair value does not differ significantly from the book value presented. The criteria adopted is applied to balances maintained in trade and other receivables, cash and cash equivalents, trade and other payables and the current portion of bank loans and bonds payable.
The Group recognizes transfers between levels of the fair value hierarchy at the end the reporting period during the change has occurred. As of December 31, 2014, there have been no transfers between level I and II, and transfers out of level III to another level of fair value.
3.1.5 Master netting or similar agreements
The Group does not have any hedged positions that qualify for netting mostly due to; (a) the hedge activities that the Group uses mostly relate to financial liabilities such as bank obligations and bonds, and (b) the position of the fair value of these derivatives contracts, hedging interest rate and exchange rates fluctuations, were favorable and thus presented as a assets as of December 31, 2014 and 2013.
| 3.1.6. | Particular effects on equity accounts. |
As of December 31, 2014, the Group presents in the statement of equity the effect relating to derivatives instruments for cash flow hedges deemed as effective, namely derivative contracts (cross currency swaps) with Banco Santander for UF 2,257,437 (equivalent to 280,000,000 soles) related to Incabond Hedge which maturity date is in 2018, hedges by US$ 535,000,000 related to the 144a bond issuance which maturity is on 2021, hedges by US$ 910,000,000 related to the 144a bond issuance which maturity is on 2023, hedges by US$ 100,000,000 related to the Scotiabank which maturity is on 2017, hedges by US$ 45,000,000 related to the Rabobank which maturity is on 2018, hedges by US$ 50,000,000 related to the Rabobank which maturity is on 2020, hedges by US$ 50,000,000 related to the Mizuho which maturity is on 2019, hedges by US$ 50,000,000 related to the Sumitomo which maturity is on 2019, and hedges by US$50,800,000 related to bank loans belongs to the subsidiary in Peru.
At December 31, 2014, the Company had 400,000,000 USD in forwards mainly associated with the coverage rate of the unpaid balance of the loan with HSBC short term. These operations allow inhibiting impact on results for the exchange difference arising from these obligations in USD
During the first quarter of 2013, the Company settled US$1,650,000,000 forward derivatives hedging exchange rate fluctuations relating to the JP Morgan Bridge Loan.
As of December 31, 2012 the company present US$1,650,000,000 short term forwards derivatives to hedge the exposure to the fluctuation of the foreign exchange rates related to the outstanding balance of the bridge loan with JP Morgan bank. As for this short term operation, the company had a “Roll-over” strategy of automatic renewal which continued until the stockholders meeting approved the issuance of new shares, which occurred during first semester of 2013. Those hedge transactions allowed to the company hedge the foreign exchange income statement impact due to debt denominated in foreign exchange.
As of the end of this reporting period, the Company has not reclassified any entries in the aforementioned financial instrument categories.
| 3.1.8. | Embedded derivatives. |
As of the end of this reporting period, the Company has not identified any embedded derivatives that should be valued independently from the host contract.
As of the end of this reporting period, the Company has not identified any non-compliance with the conditions related to outstanding liabilities.
F-43
The Company has entered into derivative contracts to hedge risks of fluctuations in exchange rates and interest rates. These instruments have been designated as hedges of eligible items and have been valued and accounted for as defined in the accounting criteria described in note 2.13.
Although the Company holds positions in financial instruments as part of its overall financial risk management strategy, only the following derivative instruments have been classified as accounting hedges:
Table 1-10. Hedges.
2014
| | | | | | | | | | | | | | | | | | | | | | |
| | | | | Hedge
subject
classification | | | | | | Book
value | | | Hedging instrument | | Fair
value | | | |
Hedge type | | Risk | | | Group | | Type | | | Group | | Type | | | Note |
| | | | | | | | | | | (ThCh$) | | | | | | | (ThCh$) | | | |
Cash flow | | Interest rate | | Financial
liability | | Bank obligations | | IFC Credit | | | — | | | Derivate | | Interest rate swap | | | (382,754 | ) | | 17 |
| | | | | | | | | | | | | | | | | | | | | | |
| | | | | | | | | | | | | | Sub—total
derivative | | | | | (382,754 | ) | | |
| | | | | | | | | | | | | | | | | | | | | | |
Cash flow | | Interest rate and exchange rate | | Financial Asset | | Bonds payable | | US bond | | | — | | | Derivate | | Cross currency swap | | | 105,854,109 | | | 6 |
Cash flow | | Interest rate and exchange rate | | Financial Asset | | Bonds payable | | Inacabond 1 | | | — | | | Derivate | | Cross currency swap | | | 1,267,147 | | | 6 |
Cash flow | | Interest rate and exchange rate | | Financial Asset | | Bank obligations | | Bank of
Tokio | | | — | | | Derivate | | Cross currency swap | | | 531,063 | | | 6 |
Cash flow | | Interest rate and exchange rate | | Financial Asset | | Bank obligations | | Banco
BBVA NY | | | — | | | Derivate | | Cross currency swap | | | 3,467,839 | | | 6 |
Cash flow | | Interest rate and exchange rate | | Financial Asset | | Bank obligations | | Rabobank
Crédito | | | — | | | Derivate | | Interest rate swap | | | 740,032 | | | 6 |
Cash flow | | Interest rate and exchange rate | | Financial Asset | | Bank obligations | | Rabobank
Crédito | | | — | | | Derivate | | Cross currency swap | | | 6,677,537 | | | 6 |
Cash flow | | Interest rate and exchange rate | | Financial Asset | | Bank obligations | | Scotiabank
Credit | | | — | | | Derivate | | Cross currency swap | | | 8,101,046 | | | 6 |
Cash flow | | Interest rate and exchange rate | | Financial Asset | | Bonds payable | | US
Bond - 2 | | | — | | | Derivate | | Cross currency swap | | | 154,407,519 | | | 6 |
Cash flow | | Interest rate and exchange rate | | Financial Asset | | Bonds payable | | Mizuho
Crédito | | | — | | | Derivate | | Cross currency swap | | | 2,090,495 | | | 6 |
Cash flow | | Interest rate and exchange rate | | Financial Asset | | Bonds payable | | Sumitomo
Crédito | | | — | | | Derivate | | Cross currency swap | | | 2,194,329 | | | 6 |
Cash flow | | Interest rate and exchange rate | | Financial Asset | | Bonds payable | | HSBC | | | — | | | Derivate | | Forward | | | 3,844,213 | | | 6 |
| | | | | | | | | | | | | | | | | | | | | | |
| | | | | | | | | | | | | | Sub—total
derivative | | | | | 289,175,329 | | | |
| | | | | | | | | | | | | | | | | | | | | | |
2013
| | | | | | | | | | | | | | | | | | | | | | |
| | | | | Hedge subject classification | | | | | | Book
value | | | Hedging instrument | | Fair
value | | | |
Hedge type | | Risk | | | Group | | Type | | | Group | | Type | | | Note |
| | | | | | | | | | | (ThCh$) | | | | | | | (ThCh$) | | | |
Cash flow | | Interest rate | | Financial liability | | Bank obligations | | BBVA NY | | | — | | | Derivate | | Cross currency swap | | | (111,456 | ) | | 17 |
Cash flow | | Interest rate | | Financial liability | | Bank obligations | | IFC Credit | | | — | | | Derivate | | Interest rate swap | | | (247,480 | ) | | 17 |
| | | | | | | | | | | | | | | | | | | | | | |
| | | | | | | | | | | | | | Sub—total
derivative | | | | | (358,936 | ) | | |
| | | | | | | | | | | | | | | | | | | | | | |
Cash flow | | Interest rate and exchange rate | | Financial Asset | | Bonds payable | | US bond | | | — | | | Derivate | | Cross currency swap | | | 47,842,494 | | | 6 |
F-44
| | | | | | | | | | | | | | | | | | | | | | |
| | | | | Hedge subject classification | | | | | | Book
value | | | Hedging instrument | | Fair
value | | | |
Hedge type | | Risk | | | Group | | Type | | | Group | | Type | | | Note |
| | | | | | | | | | | (ThCh$) | | | | | | | (ThCh$) | | | |
Cash flow | | Interest rate and exchange rate | | Financial Asset | | Bonds payable | | Inacabond 1 | | | — | | | Derivate | | Cross currency swap | | | 2,147,318 | | | 6 |
Cash flow | | Interest rate and exchange rate | | Financial Asset | | Bank obligations | | Bank of
Tokio | | | — | | | Derivate | | Cross currency swap | | | 2,048,904 | | | 6 |
Cash flow | | Interest rate and exchange rate | | Financial Asset | | Bank obligations | | Rabobank
Crédito | | | — | | | Derivate | | Interest rate swap | | | 614,017 | | | 6 |
Cash flow | | Interest rate and exchange rate | | Financial Asset | | Bank obligations | | Rabobank
Crédito | | | — | | | Derivate | | Cross currency swap | | | 484,974 | | | 6 |
Cash flow | | Interest rate and exchange rate | | Financial Asset | | Bank obligations | | Scotiabank
Credit | | | — | | | Derivate | | Cross currency swap | | | 657,802 | | | 6 |
Cash flow | | Interest rate and exchange rate | | Financial Asset | | Bonds payable | | US Bond - 2 | | | — | | | Derivate | | Cross currency swap | | | 23,392,761 | | | 6 |
| | | | | | | | | | | | | | | | | | | | | | |
| | | | | | | | | | | | | | Sub—total
derivative | | | | | 77,188,270 | | | |
The cash flow hedges have been evaluated as highly effective. A cash flow hedge is intended to hedge exposure to changes in the cash flows that (i) are attributed to a particular risk associated with an asset or liability recorded previously (as all or some of the future interest payments of debt at variable interest), or a highly probable forecasted transaction and that (ii) may affect profit for the year.
For the described hedge, the financial risk refers to the potential upward deviation of equivalent cash flows in the functional currency (Ch$) such as interest payments for bonds and debt. The hedge strategy adopted enables the Company to fix the cash outflow expressed in the functional currency for all coupon payments being hedged.
| 3.2. | Characteristics of financial risks. |
The Board of Directors understands that it is imperative for the Company to have an institutional framework that protects its financial stability and sustainability by effectively managing financial risks.
In general terms, the Company’s efforts are aimed at maintaining a policy that is sustainable with the development of its business, which by nature incorporates an important number of associated risks. As a result, the Company’s strategy is focused on maintaining strong financial solvency, placing emphasis on obtaining the cash flows necessary for its investments, ensuring proper management of working capital and taking necessary actions to minimize the financial risk from exposure of its loan commitments in different currencies and interest rates.
The Company identifies the following risks relevant to its operations:
The concept of credit risk refers to financial uncertainty, at different time horizons, related to complying with obligations entered into with counterparties, when contractual rights are exercised to receive cash or other financial assets from the Company.
The following table presents, as of December 31, 2014 and 2013, the amount in the financial asset category that best represents maximum exposure to credit risk without considering guarantees or credit enhancements.
F-45
Table 2-1-1. Exposure to credit risk by financial asset category.
As of December 31, 2014
| | | | | | | | | | |
Classification | | Group | | Type | | Note | | Book value | |
| | | | | | | | | (ThCh$) | |
At fair value through profit or loss | | Mutual funds | | Mutual funds shares | | 6 | | | 37,328,837 | |
| | Other | | Other financial investments | | 6 | | | 3,844,213 | |
| | | | Shares | | 6 | | | 42,780 | |
| | | | Other financial investment | | 6 | | | 6,563,165 | |
Credit cards and trade receivables net | | Cash and cash equivalents | | Cash balances | | 5 | | | 210,306 | |
| | | | Bank balances | | 5 | | | 44,859,904 | |
| | | | Short-term deposits | | 5 | | | 129,874,187 | |
| | Receivables | | Credit card and trade receivables, net | | 8 | | | 44,137,702 | |
| | | | Receivables due from Bretas | | 6 | | | 16,938,176 | |
| | | | Receivables from related, current y not current (1) | | 8 | | | 816,354,109 | |
| | | | Receivables from related entities, current | | 9 | | | 1,371,016 | |
As of December 31, 2013
| | | | | | | | | | |
Classification | | Group | | Type | | Note | | Book value | |
| | | | | | | | | (ThCh$) | |
At fair value through profit or loss | | Mutual funds | | Mutual funds shares | | 6 | | | 40,759,800 | |
| | Other | | Other financial investments | | 6 | | | 185,553 | |
| | | | Shares | | 6 | | | 38,198 | |
| | | | Other financial investment | | 6 | | | 8,785,942 | |
Credit cards and trade receivables net | | Cash and cash equivalents | | Cash balances | | 5 | | | 47,627,336 | |
| | | | Bank balances | | 5 | | | 105,893,186 | |
| | | | Short-term deposits | | 5 | | | 18,191,103 | |
| | Receivables | | Credit card and trade receivables, net | | 8 | | | 1,289,287,365 | |
| | | | Receivables due from Bretas | | 6 | | | 15,031,535 | |
| | | | Receivables from related entities, current | | 9 | | | 432,303 | |
Credit risk exposure is primarily concentrated in credit card and trade receivables, please note 8.
| 3.2.1.2. | Effect of guarantees on exposure. |
As of the end of this reporting period, the Company has not received any guarantees or other credit enhancements that impact its credit exposure detailed above. However, trade receivables are adequately covered from operating risks with life insurance policies that cover the risk of death.
As of the end of this reporting period, the Company identifies its concentrations for credit risk based on the relevant counterparty for each category of financial assets.
F-46
Table 2-1-2. Diversification of counterparties.
As of December 31, 2014
| | | | | | | | |
Classification | | Group | | Type | | Counterparty | | Exposure
by type of
instrument |
| | | | | | | | | % |
At fair value through profit and loss | | Mutual funds | | Mutual funds | | Domestic banks | | 37.54 |
| | | | | | Foreign banks | | 62.46 |
Trade receivables and credit card | | Cash and cash equivalents | | Cash balances | | Domestic banks | | 25.40 |
| | | | | | Foreign banks | | 74.60 |
| | | | Bank balances | | Domestic banks | | 52.97 |
| | | | | | Foreign banks | | 47.03 |
| | | | Short- term deposits | | Domestic banks | | 29.36 |
| | | | | | Foreign banks | | 70.64 |
| | Receivables | | Trade receivables, gross | | Non-financial institutions | | 100 |
| | | | Receivables from related entities, | | Non-financial institutions | | 100 |
Hedging Derivatives | | Derivatives | | Assets hedging derivatives | | Domestic banks | | 98,62 |
| | | | | | Foreign banks | | 1,38 |
As of December 31, 2013
| | | | | | | | |
Classification | | Group | | Type | | Counterparty | | Exposure
by type of
instrument |
| | | | | | | | | % |
At fair value through profit and loss | | Mutual funds | | Mutual funds | | Domestic banks | | 0 |
| | | | | | Foreign banks | | 100 |
Trade receivables and credit card | | Cash and cash equivalents | | Cash balances | | Domestic banks | | 13.88 |
| | | | | | Foreign banks | | 86.12 |
| | | | Bank balances | | Domestic banks | | 58.06 |
| | | | | | Foreign banks | | 41.94 |
| | | | Short- term deposits | | Domestic banks | | 40.48 |
| | | | | | Foreign banks | | 59.52 |
| | Receivables | | Trade receivables, gross | | Non-financial institutions | | 100 |
| | | | Receivables from related entities, | | Non-financial institutions | | 100 |
Hedging Derivatives | | Derivatives | | Assets hedging derivatives | | Domestic banks | | 97.35 |
| | | | | | Foreign banks | | 2.65 |
Non-financial institutions are mainly composed of clients’ credit cards and receivables from other companies. (see note 8)
As presented above, a considerable portion of the Company’s credit risk exposure stems from trade receivables, which, given the high degree of fragmentation of the customer portfolio (in terms of geographic location, age, socioeconomic level, among others), has been segmented using internal credit scales.
F-47
| 3.2.1.4. | Financial assets that are not in default or impaired. |
As part of its credit risk management activities, the Company constantly monitors the credit quality of counterparties for financial assets that are not in default or impaired. The following table details the credit quality by financial entity of the Company’s investments:
As of December 31, 2014
| | | | | | | | | | |
| | | | | | | | Credit quality |
Type | | Counterpart | | Amount of exposure | | | Solvency | | Outlook |
| | | | | (ThCh$) | | | | | |
Mutual funds | | Foreign banks | | | 23,317,170 | | | (*) | | Stable |
| | BCI bank | | | 860,000 | | | AA+ | | Stable |
| | Banchile | | | 13,151,667 | | | AA+ | | Stable |
Financial instruments | | Bonds - Central bank of Chile | | | 6,563,165 | | | AAA | | Stable |
Derivatives | | | | | 289,175,329 | | | | | Stable |
| (*) | All mutual funds included under “Foreign banks” have international risk ratings greater than or equal to A- as required by the Company’s investment policy. The assets that are due but not impaired are presented in Note 8. |
As of December 31, 2013
| | | | | | | | | | |
| | | | | | | | Credit quality |
Type | | Counterpart | | Amount of exposure | | | Solvency | | Outlook |
| | | | | (ThCh$) | | | | | |
Mutual funds | | Foreign banks | | | 40,759,799 | | | (*) | | Stable |
Financial instruments | | Bonds - Central bank of Chile | | | 8,785,942 | | | AAA | | Stable |
Derivatives | | | | | 77,188,270 | | | | | Stable |
| (*) | All mutual funds included under “Foreign banks” have international risk ratings greater than or equal to A- as required by the Company’s investment policy. The assets that are due but not impaired are presented in Note 8. |
| 3.2.1.5. | Credit Risk from operations other than credit card business. |
Credit risk from operations other than the credit card and banking businesses is limited primarily to balances maintained in notes payable from customers for sales with post-dated checks and external credit cards, which are generally recoverable in 30, 60 and 90 days, and investments in time deposits, bank balances and mutual funds. The Company monitors the latter using the credit risk rating granted by risk rating agencies. In addition, it targets its investments in mutual funds toward portfolios with highly solvent underlying assets, properly diversified assets and consistent management by the fund manager.
| 3.2.1.6. | Credit Risk from the credit card business - Also applies to non-current assets classified as held for sale (see note 34). |
Given the relative importance of this exposure from the credit card business as compared to total maximum credit risk exposure, Cencosud has targeted its credit risk management toward developing a management model for its own credit cards as well as the banking business that is consistent with the Company’s strategic guidelines and the profiles of its credit transactions. The model takes into consideration the large-scale and fragmented nature of the cardholder portfolio and is structured in terms of cardholder selection, portfolio management and recovery of cardholders in default.
F-48
| 3.2.1.6.1 | Business definition. |
The financial business is defined as one more element of Cencosud’s value offering, which complements the comprehensive product and service offerings the Company provides through each of its retail business units and is aimed at building long-term relationships with our customers. The largest percentage of the financial retail business corresponds to the Más Credit Card in Chile, which has been operating for more than 20 years. The card’s market penetration is less in other countries, such as Peru where it has been available for 2 years and 6 months with the name of Banco Cencosud Peru. In addition, the Company operates with Banco Bradesco in Brazil to develop the financial business in that country.
3.2.1.6.2. Risk Model
Foundations:
The Risk Management Model is tightly linked to the large-scale and fragmented nature of the retail cardholder portfolio with a very large volume of cardholders (more than 5,000,000 in the region) and average debt per cardholder of around US$ 500.
In this context, the challenge lies in managing the cardholder portfolio and its associated risk, building long-term relationships with cardholders and making the value proposition and the retail business sustainable over time. Risk management is structured to ensure:
| • | | Optimum cardholder selection. |
| • | | Optimum portfolio management, which involves activating, strengthening, retaining, reducing and containing the portfolio card holders. |
| • | | Optimum collections management for cardholders in default, maximizing recovery with high standards of quality and service without affecting the relationship with Cencosud’s customers. |
Cardholder management efforts are broadly targeted to include all customers, from our target market to prospective customers, including those with or without retail purchases, with or without credit card movements and with or without payments in default.
| a. | Key Risk Management Factors |
The large-scale and fragmented nature of the business determines portfolio management, in which the following key risk management factors stand out:
| • | | Automation and centralization of decision making. |
| • | | Management of information and earnings projections. |
| • | | Collections management. |
| • | | Large-scale and selective control model for credit and collections circuit. |
| • | | Provision models to cover portfolio risk in line with Basel II standards. |
Automation and centralization of decision making: credit and collections decisions are large-scale and automated and only minorities of decisions are analyzed by very specialized personnel. The Company features world class risk management and collections systems, including Capstone Decision Accelerator (CDA), TRIAD, Model Builder (from Fair Isaac Corporation - FICO) and Cyber Financial, among others.
Customer segmentation: processes are segmented, differentiated by strategy and action tactics per risk profile, activity level and likelihood of occurrence, among others.
Management of information and earnings projections: the Company manages comprehensive information and statistical models on all relevant business and customer variables, which allows it to make timely, prognostic decisions.
Collections management: the Company has one sole collections model for managing collections for retail cards, which uses an outsourcing collection model to efficiently recover debt through quality management of debtors.
F-49
Large-scale and selective control model for credit and collections circuit: the Company has large-scale controls over all phases of the credit and collections process, from its centralized processes to its point of- sale and collections processes.
Provision models to cover portfolio risk in line with Basel II standards: the Company has different provisions models that adhere to local regulations in each country as well as Basel II standards, in order to most adequately reflect cardholder portfolio risk. External variables which affect payment behavior are also included in statistical models for estimating provisions. The Company is making progress in each country on implementing anti-cyclical provisions based on industry best practices, starting with Chile and Peru and also during 2012 in Argentina. It also uses back testing to periodically monitor the sufficiency of the provisions it establishes.
Lastly, the Company has a corporate governance strategy that includes, among others, local Risk Committees for each country and a Corporate Risk Committee in which directors and senior executives participate. These committees have the following objectives, among others:
| • | | Monitor the business’s main risk indicators. |
| • | | Monitor the correct functioning of policies and credit and collections processes. |
| • | | Authorize entry into new markets and/or new products that impact risk. |
| • | | Authorize provisions model and monitor sufficiency. |
The concept of liquidity risk is used by the Company to refer to financial uncertainty, at different time horizons, related to its capacity to respond to cash needs to support its operations, under both normal and exceptional circumstances.
F-50
As of December 31, 2014 and 2013, the Company presents the following maturities for its financial instruments:
Table 2-2-1. Maturity analysis.
As of December 31, 2014
| | | | | | | | | | | | | | | | | | | | | | | | | | | | | | |
| | | | | Maturity | |
Classification | | Instrument | | 0—6 months | | | 6—12 months | | | 1—2 years | | | 2—3 years | | | 3—5 years | | | More than
5 years | | | Total
liabilities | |
| | | | | ThCh$ | | | ThCh$ | | | ThCh$ | | | ThCh$ | | | ThCh$ | | | ThCh$ | | | ThCh$ | |
| | Total liabilities | | | 2,430,673,854 | | | | 349,782,347 | | | | 370,460,528 | | | | 362,496,508 | | | | 518,854,758 | | | | 1,936,236,784 | | | | 5,968,504,779 | |
Other financial liabilities current and non-current | | Bank loans | | | 498,539,152 | | | | 149,435,250 | | | | 220,850,506 | | | | 226,974,267 | | | | 223,824,662 | | | | 70,416,371 | | | | 1,390,040,208 | |
| | Bond debt | | | 56,542,328 | | | | 55,014,112 | | | | 98,277,232 | | | | 124,427,473 | | | | 290,909,834 | | | | 1,843,402,526 | | | | 2,468,573,505 | |
| | Other loans | | | 565,487 | | | | 2,106,055 | | | | 4,185,774 | | | | 4,110,715 | | | | 4,120,262 | | | | 22,417,887 | | | | 37,506,180 | |
| | Other financial liabilities (Cross Currency Swaps—Interest Rate Swaps) | | | — | | | | 382,754 | | | | — | | | | — | | | | — | | | | — | | | | 382,754 | |
| | Time deposits | | | | | | | | | | | | | | | | | | | | | | | | | | | | |
| | Term savings accounts | | | | | | | | | | | | | | | | | | | | | | | | | | | | |
| | Letters of credit | | | | | | | | | | | | | | | | | | | | | | | | | | | | |
| | Deposits and other demand deposits | | | | | | | | | | | | | | | | | | | | | | | | | | | | |
| | Debt purchase Bretas—Prezunic—Johnson | | | — | | | | 25,542,999 | | | | 12,697,096 | | | | 6,984,053 | | | | — | | | | — | | | | 45,224,148 | |
| | Other financial liabilities—Other | | | 5,939,949 | | | | — | | | | — | | | | — | | | | — | | | | — | | | | 5,939,949 | |
Commercial loans | | Trade payables and other payables and non-current liabilities | | | 1,872,835,239 | | | | 110,250,870 | | | | 34,449,920 | | | | — | | | | — | | | | — | | | | 2,017,536,029 | |
| | Payables to related entities | | | 3,302,006 | | | | — | | | | — | | | | — | | | | — | | | | — | | | | 3,302,006 | |
F-51
As of December 31, 2013
| | | | | | | | | | | | | | | | | | | | | | | | | | | | | | |
| | | | | Maturity | |
Classification | | Instrument | | 0—6 months | | | 6—12 months | | | 1—2 years | | | 2—3 years | | | 3—5 years | | | More than
5 years | | | Total
liabilities | |
| | | | | ThCh$ | | | ThCh$ | | | ThCh$ | | | ThCh$ | | | ThCh$ | | | ThCh$ | | | ThCh$ | |
| | Total liabilities | | | 2,315,049,715 | | | | 466,310,043 | | | | 296,269,704 | | | | 355,297,339 | | | | 331,096,348 | | | | 2,079,392,357 | | | | 5,843,415,506 | |
Other financial liabilities current and non-current | | Bank loans | | | 155,452,528 | | | | 305,116,405 | | | | 128,565,783 | | | | 221,372,801 | | | | 95,999,770 | | | | 1,093,302 | | | | 907,600,589 | |
| | Bond debt | | | 81,530,434 | | | | 53,079,659 | | | | 100,598,032 | | | | 95,090,347 | | | | 226,213,963 | | | | 2,048,171,974 | | | | 2,604,684,409 | |
| | Other loans | | | 1,516,099 | | | | 3,894,247 | | | | 2,998,336 | | | | 2,902,844 | | | | 6,874,108 | | | | 18,987,723 | | | | 37,173,357 | |
| | Other financial liabilities (Cross Currency Swaps—Interest Rate Swaps) | | | 314,911 | | | | — | | | | 44,025 | | | | — | | | | — | | | | — | | | | 358,936 | |
| | Time deposits | | | 100,672,466 | | | | 50,492,621 | | | | 53,069,680 | | | | — | | | | — | | | | — | | | | 204,234,767 | |
| | Term savings accounts | | | 1,049,251 | | | | — | | �� | | — | | | | — | | | | — | | | | — | | | | 1,049,251 | |
| | Letters of credit | | | — | | | | — | | | | 2,039,031 | | | | 1,011,599 | | | | 2,008,507 | | | | 11,139,358 | | | | 16,198,495 | |
| | Deposits and other demand deposits | | | 3,513,936 | | | | — | | | | — | | | | — | | | | — | | | | — | | | | 3,513,936 | |
| | Debt purchase Bretas—Prezunic—Johnson | | | — | | | | 53,727,111 | | | | 32,938,814 | | | | 1,980,934 | | | | — | | | | — | | | | 88,646,859 | |
| | Other financial liabilities—Other | | | 12,450,378 | | | | — | | | | — | | | | — | | | | — | | | | — | | | | 12,450,378 | |
Commercial loans | | Trade payables and other payables and non-current liabilities | | | 1,957,993,218 | | | | — | | | | 8,954,817 | | | | — | | | | — | | | | — | | | | 1,966,948,035 | |
| | Payables to related entities | | | 556,494 | | | | — | | | | — | | | | — | | | | — | | | | — | | | | 556,494 | |
F-52
As part of its comprehensive risk management framework, the Company has liquidity management policies aimed at ensuring timely compliance with its obligations based on the scale and risk of its operations, both under normal conditions and exceptional situations, which are defined as circumstances in which cash flows can be substantially greater than expected as a result of unforeseen changes in general market conditions or the particular situation of a certain institution. In this context, liquidity risk management tools have been designed to both ensure positioning of the statements of financial position that allows minimizing the probability of an internal liquidity crisis (prevention policies) as well as defining contingency plans to address a liquidity crisis scenario.
For such purposes, the liquidity management policies define the Company’s management strategy, management’s roles and responsibilities, internal limits for cash flow mismatches, sources of risk, contingency plans and internal control mechanisms.
One of the indicators used to monitor liquidity risk is the liquidity position, which is measured and controlled each day based on the difference between cash flows payable for liabilities and expense accounts and cash flows receivable from assets and income accounts for a given maturity period.
In the event of a cash deficit on a consolidated level, Cencosud S.A. has various short and long-term financing alternatives, including lines of credit with banks, access to international debt markets, liquidation of investment instruments, etc. In contrast, in the event of a cash surplus on a consolidated level, this money is invested in different investment instruments.
As of December 31, 2014, the Company has available unused lines of credit for approximately ThCh$ 352,869,821 (ThCh$ 325,564,823 as of December 31, 2013).
As of December 31, 2014, the company held unused line of credits as a result of Confirming operations by ThCh$ 115.411.853 (ThCh$ 113,001,775 as of December 31, 2013) which held the original maturities agreed with the supplier. Such operations are presented in the line trade accounts payables.
Confirming operations that consider larger payment with the bank that the original payment deadline set by the Company and its suppliers in the trade agreement amounted, in the portion corresponding to the longest period of payment to ThCh$0 (ThCh$ 7,612 as of December 31, 2013) in Chile and ThCh$ 5,939,949 (ThCh$ 12.442.766 as of December 31, 2013) in Peru, to December 31, 2014. These operations are presented under “Other financial liabilities”
These operations are monitored on a regular basis so that these exposures do not adversely affect the consolidated financial ratios according to corporate policies with the final purpose of ensuring that the liquidity ratio and short term debt are within the parameters set up by management.
The Company is exposed to market risk, which involves variations in interest and exchange rates that may affect its financial position, operating results and cash flows. The Company’s hedge policy calls for a periodic review of its exposure to interest and exchange rate risk for its main assets and obligations.
| 3.2.1.8.1. | Interest rate risk. |
As of December 31, 2014, approximately 44% of the Company’s financial debt, primarily its short-term debt and bonds, was at fixed interest rates. The remaining 56% was at variable interest rates including derivatives. Of the variable rate debt, approximately 99% is indexed to local interest rates (either as originally denominated or by re-denominating with derivatives).
The Company has identified as important its interest rate risk generated primarily from variable rate obligations, which are sensitized by measuring the impact on income of a reasonably possible variation in the observed interest rate. Following regulatory guidelines, the deviation in relevant interest rates is estimated using historical series with a daily frequency for each of the identified risk variables. The distribution of percentage changes occurring in three-month intervals is then analyzed and the extreme scenarios that fall outside a confidence interval of 95% are eliminated. The amount of the sensitized exposure corresponds to the total of the variable rate debt.
F-53
For variable rate debt, the financial risk refers to the potential upward deviation of cash flows related to interest payments on obligations from a specific target, attributable to the rise in interest rates that are important to the Company’s indebtedness structure, namely: LIBOR, TAB nominal and the Chamber rate (CAM), Chile.
As of and for December 31, 2014
| | | | | | | | | | | | | | |
Classification | | Currency | | Exposure | | Market variable | | Change in
risk factor | | | Effect on
income | |
| | | | | | | | | % | | | (ThCh$) | |
Net liability | | USD | | 400,000,000 | | LIBOR 1M | | | (36.23 | ) | | | 101,133 | |
| | | | | | | | | 33.91 | | | | (94,648 | ) |
Net liability | | Ch$ | | 79,508,100,000 | | TAB NOM 90 | | | (42.86 | ) | | | 316,896 | |
| | | | | | | | | 43.19 | | | | (319,361 | ) |
Net liability | | Ch$ | | 184,819,697,369 | | TAB NOM 180 | | | (37.04 | ) | | | 638,566 | |
| | | | | | | | | 45.07 | | | | (777,073 | ) |
Net liability | | Ch$ | | 607,851,430,000 | | CAM | | | (43.25 | ) | | | 2,147,451 | |
| | | | | | | | | 42.18 | | | | (2,094,005 | ) |
Net liability | | BR$ | | 698,216,971 | | CDI | | | (14.82 | ) | | | 668,159 | |
| | | | | | | | | 13.18 | | | | (594,228 | ) |
Net liability | | COP$ | | 296,642,344,553 | | DTF TA | | | (17.18 | ) | | | 135,386 | |
| | | | | | | | | 12.02 | | | | (94,704 | ) |
Net liability | | COP$ | | 66,762,674,279 | | IBR | | | (27.01 | ) | | | 48,663 | |
| | | | | | | | | 19.89 | % | | | (35,829 | ) |
As of and for December 31, 2013
| | | | | | | | | | | | | | | | | | |
Classification | | Currency | | Exposure | | | Market variable | | | Change in
risk factor | | | Effect on
income | |
| | | | | | | | | | | % | | | (ThCh$) | |
Net liability | | BR$ | | | 408,216,971 | | | | CDI | | | | (17.55 | ) | | | 355,709 | |
| | | | | | | | | | | | | 16.69 | | | | (338,364 | ) |
Net liability | | Ch$ | | | 79,508,100,000 | | | | TAB NOM 90 | | | | (41.98 | ) | | | 429,687 | |
| | | | | | | | | | | | | 42.11 | | | | (431,018 | ) |
Net liability | | Ch$ | | | 247.319.697.369 | | | | TAB NOM 180 | | | | (35.80 | ) | | | 1,241,252 | |
| | | | | | | | | | | | | 40.79 | | | | (1,414,333 | ) |
Net liability | | Ch$ | | | 608,001,430,000 | | | | CAM | | | | (51.19 | ) | | | 2,113,604 | |
| | | | | | | | | | | | | 47,06 | | | | (3,468,242 | ) |
The effect on income obtained from a theoretical exercise shows the incremental effect generated from the reasonably possible estimated change (i.e. it corresponds to the difference between the amount that was effectively recorded for the interest payment and the amount that would have been recorded in a scenario of lower or higher interest rates).
The Company’s risk management strategy is to hold its financial debt in variable rates in order to benefit from lower cost of funds and the remainder of its financial debt in fixed rates in order to reduce uncertainty stemming from variable interest payments, by denominating part of its variable interest rate liabilities into fixed rate liabilities using derivative financial instruments for these purposes, which allow the interest rate of the original obligation to be fixed.
| 3.2.1.8.2. | Foreign exchange rate risk. |
In the countries in which the Company operates, most expenses and income are in local currency. As a result, most of its debt (89%) is denominated in local currency. As of December 31, 2014, approximately 79% of the debt in U.S. dollars was hedged with cross currency swaps or other foreign currency hedges. The Company’s policy is to hedge risks from variations in exchange rates on its net liability position in foreign currency using market instruments designed for that purpose.
The Company has identified as important the exchange rate risk generated from obligations in US dollars, Argentine pesos, Peruvian Nuevos Soles and Unidades de Fomento, which are sensitized by measuring the impact on income of a reasonably possible variation in observed exchange rates. Following regulatory guidelines, the deviation in relevant exchange rates is estimated using historical series with a daily frequency for each of the identified risk variables. The distribution of percentage changes occurring in three-month intervals is then analyzed and the extreme scenarios that fall outside a confidence interval of 95% are eliminated.
F-54
As of and for December 31, 2014
| | | | | | | | | | | | | | | | | | | | |
Classification | | Currency | | Exposure | | Market
variable | | Closing
value | | Change in
risk factor | | | Exchange
rate
value | | | Effect on
income | |
| | | | | | | | | | | % | | | | | | (ThCh$) | |
Net liability | | USD | | 573,261,055 | | USD-CLP | | 606,75 | | | -8,95 | % | | | 552,46 | | | | 31,120,559 | |
| | | | | | | | | | | 9,74 | % | | | 665,82 | | | | (33,863,241 | ) |
Net liability | | ARG | | 430,004,718 | | ARS-CLP | | 71,64 | | | -14,55 | % | | | 61,22 | | | | 4,480,841 | |
| | | | | | | | | | | 11,25 | % | | | 79,70 | | | | (3,466,153 | ) |
Net liability | | UF | | 18,434,243 | | CLF-CLP | | 24.627,10 | | | -0,496 | % | | | 24.504,87 | | | | 2,253,307 | |
| | | | | | | | | | | 2,460 | % | | | 25.232,89 | | | | (11,167,289 | ) |
Net liability | | COP | | 400,779,827,586 | | COP-CLP | | 0,26 | | | -10,505 | % | | | 0,23 | | | | 10,743,949 | |
| | | | | | | | | | | 9,786 | % | | | 0,28 | | | | (10,009,522 | ) |
Net liability | | PEN | | 541,187,436 | | PEN-CLP | | 203,54 | �� | | -8,387 | % | | | 186,47 | | | | 9,238,629 | |
| | | | | | | | | | | 9,450 | % | | | 222,77 | | | | (10,409,018 | ) |
Net liability | | BRL | | 1,025,118,587 | | BRL-CLP | | 228,19 | | | -10,900 | % | | | 203,32 | | | | 25,497,495 | |
| | | | | | | | | | | 11,433 | % | | | 254,28 | | | | (26,745,359 | ) |
As of and for December 31, 2013
| | | | | | | | | | | | | | | | | | | | | | | | |
Classification | | Currency | | Exposure | | | Market
variable | | Closing
value | | | Change in
risk factor | | | Exchange
rate
value | | | Effect on
income | |
| | | | | | | | | | | | | % | | | | | | (ThCh$) | |
Net liability | | USD | | | 564,405,018 | | | USD-CLP | | | 524.61 | | | | (9.17 | ) | | | 476.51 | | | | 27,150,492 | |
| | | | | | | | | | | | | | | 10.23 | | | | 578.26 | | | | (30,279,096 | ) |
Net liability | | ARS | | | 580,926,715 | | | ARS-CLP | | | 80.59 | | | | (13.62 | ) | | | 69.61 | | | | 6,377,540 | |
| | | | | | | | | | | | | | | 11.75 | | | | 90.06 | | | | (5,501,147 | ) |
Net liability | | UF | | | 30,758,874 | | | CLF-CLP | | | 23,306.56 | | | | (0.50 | ) | | | 23,190.87 | | | | 3,558,539 | |
| | | | | | | | | | | | | | | 2.55 | | | | 23,900.74 | | | | (18,276,283 | ) |
Net liability | | COP | | | 339,991,902,733 | | | COP-CLP | | | 0.27 | | | | (10.24 | ) | | | 0.24 | | | | 9,482,918 | |
| | | | | | | | | | | | | | | 10.23 | | | | 0.30 | | | | (9,472,797 | ) |
Net liability | | PEN | | | 281,143,707 | | | PEN-CLP | | | 187.88 | | | | (8.61 | ) | | | 171.71 | | | | 4,545,638 | |
| | | | | | | | | | | | | | | 9.83 | | | | 206.35 | | | | (5,191,347 | ) |
Net liability | | BRL | | | 432,869,191 | | | BRL-CLP | | | 222.45 | | | | (11.19 | ) | | | 197.55 | | | | 10,779,103 | |
| | | | | | | | | | | | | | | 11.74 | | | | 248.57 | | | | (11,304,624 | ) |
The effect on income obtained from a theoretical exercise shows the incremental effect generated from the reasonably possible estimated change (i.e. it corresponds to the difference between the amount that was effectively recorded for exchange differences and the amount that would have been recorded in a scenario of lower or higher exchange rates).
The Company’s strategy is to hold most of its financial debt in local currencies to reduce uncertainty stemming from an increase in the value of its liabilities due to foreign currency fluctuations, using derivative financial instruments for these purposes, which allow the value of the obligation to be expressed in its functional currency.
Additionally, the exposure to exchange rates for conversion of the functional currency of the subsidiaries in Argentina, Colombia, Peru and Brazil, relating to the difference between monetary assets and liabilities (e.i., those denominated in a local currency and consequently exposed to the translation from their functional currencies into the presentation currency for the Group consolidated financial statements) is hedge only when it’s predictable that adverse material differences could occur and the cost related to hedging is deemed reasonable by management. The Company currently does not have any net investment hedging contracts.
F-55
The Company assesses the fluctuation of the functional currencies compared to the presentation currency through a sensitivity analysis on equity and net assets in local currency using favorable and unfavorable scenarios, the amounts of exposure of all possible scenarios, including a general one, resulting from this analysis are as follows:
| | | | | | | | | | | | | | | | | | | | |
| Currency | | Rate of
conversion | | Scenarios | | Flux on assets ThCh$ | | | Flux% | | | Flux on Equity ThCh$ | | | Flux % | |
ARG PESO | | 61,22 | | S1 | | | (183,496,782 | ) | | | -1.71 | | | | (79,807,950 | ) | | | -1.86 | |
| | 79,70 | | S2 | | | 164,306,474 | | | | 1.53 | | | | 71,461,542 | | | | 1.67 | |
COP PESO | | 0,23 | | S1 | | | (146,562,723 | ) | | | -1.37 | | | | (99,593,445 | ) | | | -2.32 | |
| | 0,28 | | S2 | | | 204,675,438 | | | | 1.91 | | | | 139,082,650 | | | | 3.24 | |
PER SOL | | 186,47 | | S1 | | | (95,730,986 | ) | | | -0.89 | | | | (58,943,555 | ) | | | -1.37 | |
| | 222,77 | | S2 | | | 115,414,604 | | | | 1.08 | | | | 71,063,168 | | | | 1.66 | |
BRL REAL | | 203,32 | | S1 | | | (169,894,475 | ) | | | -1.59 | | | | (85,233,060 | ) | | | -1.99 | |
| | 254,28 | | S2 | | | 177,159,943 | | | | 1.65 | | | | 88,878,018 | | | | 2.07 | |
| | | | | | |
All currencies | | | | S1 | | | (595,684,966 | ) | | | -5.56 | | | | (323,578,010 | ) | | | -7.54 | |
| | | | S2 | | | 661,556,459 | | | | 6.17 | | | | 370,485,378 | | | | 8.63 | |
S1: Scenario 1 represents the most unfavorable exchange rate to be used in converting into the presentation currency, and how that impacts to the net assets and equity of the Group
S2: Scenario 2 represents the most advantageous exchange rate to be used in converting into the presentation currency, and how that impacts to the net investment and equity of the Group
| 4 | Estimates, judgment or criteria applied by management |
The estimates and criteria used are continuously assessed and are based on prior experience and other factors, including the expectation of occurrence of future events that are considered reasonable according to the circumstances.
The Cencosud Group makes estimates and assumptions with respect to the future. Actual results could differ from those estimates. The estimates and assumptions that have a significant risk of generating material adjustments to the asset and liability balances in the next year are presented below.
| 4.1 | Estimate of impairment of assets with indefinite useful lives |
The Cencosud Group assesses annually, or when there is a triggering event, whether goodwill has experienced any impairment, according to the accounting policy described in Note 2.11. The recoverable balances of the cash generating units have been determined from the base of their value in use. The methodology of discounting cash flows at a real pre-tax discount rate calculated for each country is applied.
| | | | | | | | | | | | | | | | | | | | |
| Segment | | 2014 | |
| | | Chile | | | Argentina | | | Perú | | | Colombia | | | Brasil | |
Supermarkets | | | 9,60 | % | | | 31,07 | % | | | 10,65 | % | | | 9,51 | % | | | 10,30 | % |
| | | | | |
Department Stores | | | 9,17 | % | | | — | | | | 8,89 | % | | | — | | | | — | |
| | | | | |
Home Improvement | | | 9,54 | % | | | 34,33 | % | | | — | | | | 9,23 | % | | | — | |
| | | | | | | | | | | | | | | | | | | | |
| Segment | | 2013 | |
| | | Chile | | | Argentina | | | Perú | | | Colombia | | | Brasil | |
Supermarkets | | | 9,16 | % | | | 27,57 | % | | | 10,69 | % | | | 9,33 | % | | | 10,54 | % |
| | | | | |
Department Stores | | | 8,83 | % | | | — | | | | 9,48 | % | | | — | | | | — | |
| | | | | |
Home Improvement | | | 9,19 | % | | | 28,78 | % | | | — | | | | 9,26 | % | | | — | |
F-56
The projection of flows is carried out by each country and by business segment. Using the functional currency of each country and the projection considered a horizon of 5 years perpetuity, unless they justify a different horizon. The projections are the historical information of the last year and the main macroeconomic variables that affect the markets. In addition projections considered a moderate organic growth and recurring investments needed to keep generating capacity of flow of each segment
The assets measured correspond mainly to trademarks and goodwill arising from past business combinations. The measurements are performed for each operating segment representing the cash generating unit determined to carry out the annual impairment test. The projected cash flows in each segment are allocated initially to identifiable tangible and intangible assets and the exceeding portion is allocated to goodwill. The valuation review of the trademarks incorporates among other factors the market analysis, financial projections and the determination of the role that brand has in the generation of sales.
F-57
| 4.2. | Impairment of accounts receivable |
The Company assesses the impairment of the accounts receivable when there is objective evidence that it will not be able to collect all the amounts according to the original terms of the account receivable (Note 2.12.2).
a) Fair value measurement for lands
The fair value for land was determined by external and independent property valuers, having an appropriate recognized professional qualification and recent experience in the location and category of the property being valued.
The methodology used in determining the fair value of lands was the market approach, which consists of determining the fair value based on recent transactions occurred in the market.
This measurement corresponds to level II of the fair value hierarchy.
b) Fair value measurements for investment properties other than land.
The Company’s finance department is responsible for determining fair value measurements included in the financial statements, including Level 3 fair values of investment properties. The Company’s finance department includes a valuations team that prepares a valuation for each investment property every quarter. The valuation team reports directly to the Chief Financial Officer (CFO) and the Audit Committee (AC). Discussions of valuation processes, key inputs and results are held between the CFO, AC and the valuation team at least once every quarter, in line with the Company’s quarterly reporting dates.
The fair value measurement for this type of investment has been categorized as a level III fair value based on the inputs used in the valuation technique. Investment properties are valued on a highest and best use basis. Changes in Level 3 fair values are analyzed at each reporting date during the quarterly valuation discussions between the CFO, AC and the valuation team. As part of this discussion, the team presents a report that explains the reasons for the fair value movements.
For all of the Company’s investment properties, the current use is considered to be the highest and best use.
The Company’s policy is to recognize transfers into and transfers out of fair value hierarchy levels as of the date of the event or change in circumstances that caused the transfer. There were no transfers in or out of Level 3 fair value measurements for investment properties during the period, nor transfers between Level 1 and Level 2 of the fair value hierarchy.
For investment property the methodology of the discounted future cash flows uses a country-specific WACC post- tax rate, measured in real terms and differentiated by country. The rates used at December 31, 2014 were 7.09% in Chile, 22.53% in Argentina, 7.8% in Peru and 7.7% in Colombia (at December 31, 2013: 7.82% in Chile, 20.08% in Argentina, 8.38% in Peru and 8.24% in Colombia ). To this effect, a calculation is performed to obtain the net revenues that correspond to the lease income minus the direct costs and operating expenses. Additionally, the projected cash flows used the historical information of the recent years and the projected macroeconomic variables that will affect each country.
As a result of the project of tax reform in Chile enacted in the second half of the year 2014, the Group conducted an assessment of changes in the legislation and included such in determining the fair value of the investment properties from June 30, 2014.
F-58
The cash flows are calculated in a scenario of moderated growth for those investment properties that have reached the expected maturity level and the main variables used are:
| 1. | Determination of the Discount Rate |
The discount rate is reviewed quarterly for each country and consists of the following factors:
| a) | BETA: Because the American market presents a greater number of comparable companies within this industry, using betas of companies in that country. |
| b) | Risk-free rate: It draws on the U.S. Treasury rate at 30 years (30yr T-Bond) |
| c) | Risk premium: Estimated on long-term returns of the stock market and the country risk of each transaction, estimated by the Credit Default Swap to 10 years (10yr CDS). In the case of Argentina’s country risk used is the average of the last three years. |
| d) | Leverage Ratio: Estimated as of BETA referring them on 66,4% equity and 33,6% debt. |
| e) | Tax rate: We use the tax rate in effect in each country |
| f) | Spread: To estimate the return on debt using the international bond spread Cencosud which is similar to the Industry spread. With all these factors we estimate the discount rate (WACC) nominal and real, the latter being used as the flow is estimated at UF (Undead de Foment) in Chile, or adjusted for inflation in Peru and Argentina |
The evolution of income depends on the property, but remains between 0.5% and 1.0% annual real growth, except those newly opened malls whose maturation does expect superior performance improved in the first years of operation. The revenue projection is reviewed quarterly so that it is aligned to the budget approved by the board in the short term and that their expectations of long-term trends are in line with the life cycle in which the asset is (Shopping).
| 3. | Growth in costs and expenses: |
As income, change in expenditure depends on the property but always reflects the standard structure resulting from the operation of such properties and operating agreements signed with tenants. These are also reviewed quarterly to be aligned with the budget and expected evolution for each Shopping.
For each shopping center, the Company reviews whether the investment plans is in line with the characteristics of each property and the life cycle in which they are placed.
Based on the points described above, the estimated available flow projection thirty-year term, after which it is estimated a perpetuity. The present value of these flows determines the fair value of the investment property.
F-59
| 5. | Valuation technique and Inter-relationship between key unobservable inputs. |
Valuation technique (Discounted cash flows): The valuation model considers the present value of the net cash flows to be generated from the property taking into account expected revenue growth, occupancy rates, other cost and expenses not paid by tenants. The expected net cash flows are discounted using risk-adjusted discount rates (see above on “determination of discount rate”). Among other factors, the discount rate estimation considers the quality of a building and its location, tenant credit and lease terms.
| | | | | | |
Class | | Country (*) | | Unobservable input | | Range |
| | | |
Malls | | Chile | | Discount rate (risk adjusted) | | 7.2% - 8.0% |
| | | | Expected revenue growth (real)(**) | | 0.5% - 1% |
| | | | Occupancy rate | | 90% - 100% |
| | | |
| | Argentina | | Discount rate (risk adjusted) | | 19.5% - 24% |
| | | | Expected revenue growth (real) | | 0.5% - 1% |
| | | | Occupancy rate | | 90% - 100% |
| | | |
Office | | Chile | | Discount rate (risk adjusted) | | 7.2% - 8.0% |
| | | | Expected revenue growth (real) | | 0.5% - 1% |
| | | | Occupancy rate (1st through 5th year) | | 50% - 90% |
| | | | Thereafter | | 80% - 98% |
| (*) | The group concentrates 89% of the total of the investment properties in Chile and Argentina. |
| (**) | For Costanera Shopping using 1.5% considering the level of maturation of this property. |
The estimated fair value of the investment properties would increase (decrease) if:
| • | | Risk-adjusted discount rate were lower (higher) |
| • | | Expected revenue growth were higher (lower) |
| • | | The occupancy rate were higher (lower) |
| 4.4 | Fair value of derivatives |
The fair value of financial instruments that are not traded in an active market as it is the case of the over-the-counter derivatives, is determined by using valuation techniques. The group uses its judgement to select a variety of methods and makes assumptions that are mainly based on market conditions existing at the end of each reporting period. The Group has used discounted cash flows analysis for various foreing exchange contracts and interest rate contracts that are not traded in active markets.
The net carrying amount of foreign exchange contracts and interest rate contracts would be an estimated ThCh$ 20,987,072 lower or ThCh$ 19,060,339 higher were the discount rate used in the discount cash flow analysis to differ by 10% from management’s estimates.
| 5 | Cash and cash equivalents |
The composition of this item as of December 31, 2014 and 2013 is the following:
| | | | | | | | |
| | | As of December 31, | |
Cash categories | | 2014 | | | 2013 | |
| | | ThCh$ | | | ThCh$ | |
Cash in hand | | | 44,859,904 | | | | 47,627,336 | |
Bank balances | | | 129,874,187 | | | | 105,893,186 | |
Short-term deposits | | | 44,137,702 | | | | 18,191,103 | |
| | | | | | | | |
Cash and cash equivalents | | | 218,871,793 | | | | 171,711,625 | |
| | | | | | | | |
F-60
Cash and equivalents include cash, bank account balances and short term investments. Currency is as follows:
| | | | | | | | |
| | | As of December 31, | |
Currency | | 2014 | | | 2013 | |
| | | ThCh$ | | | ThCh$ | |
Chilean Peso | | | 89,101,619 | | �� | | 75,215,858 | |
Argentine Peso | | | 28,382,909 | | | | 23,234,710 | |
US dollars | | | 454,489 | | | | 449,997 | |
Peruvian New Sol | | | 79,280,765 | | | | 38,247,113 | |
Brazilian Real | | | 9,720,446 | | | | 13,803,720 | |
Colombian Peso | | | 11,931,565 | | | | 20,760,227 | |
| | | | | | | | |
Total cash and cash equivalents | | | 218,871,793 | | | | 171,711,625 | |
| | | | | | | | |
| 6 | Other financial assets, current and non-current |
The composition of this item as of December 31, 2014 and 2013 includes the following:
| | | | | | | | |
| | | As of December 31, | |
Other financial assets, current | | 2014 | | | 2013 | |
| | | ThCh$ | | | ThCh$ | |
Shares | | | 42,780 | | | | 38,198 | |
Mutual Funds Shares(*) | | | 37,328,837 | | | | 40,759,800 | |
Hedging Derivatives | | | 3,844,213 | | | | — | |
Highly liquid financial instruments | | | 6,563,165 | | | | 8,785,942 | |
| | | | | | | | |
Total other financial assets, current | | | 47,778,995 | | | | 49,583,940 | |
| | | | | | | | |
| | | | | | | | |
| | | As of December 31, | |
Other financial assets, non-current | | 2014 | | | 2013 | |
| | | ThCh$ | | | ThCh$ | |
Hedging derivatives | | | 285,331,116 | | | | 77,188,270 | |
Financial investments Long term | | | 210,306 | | | | 185,553 | |
Account receivable due from Bretas (see 6.1 below) | | | 16,938,176 | | | | 15,031,535 | |
Total other financial assets, non-current | | | 302,479,598 | | | | 92,405,358 | |
| | | | | | | | |
| (*) | Mutual Funds shares are mainly fixed rate investments. |
| 6.1 | Offsetting non-derivatives financial assets and liabilities |
Financial assets and liabilities are offset and the net amount presented in the statement of financial position when, and only when, the Group has a legal right to offset the amounts and intends to either to settle them on a net basis or to realize the asset and settle the liability simultaneously.
F-61
The following financial assets and liabilities are subject to offsetting in accordance with paragraph 42 of IAS 32:
| a) | As of December 31, 2014 |
Financial assets
| | | | | | | | | | | | | | | | | | | | | | | | |
| | | | | | | | | | | | Related amounts not set off in
the balance sheet | | | | |
| | | Gross
amounts of
recognized
financial
assets | | | Gross amounts
of recognized
financial
liabilities set off
in the balance
sheet | | | Net amounts
of financial
assets
presented in
the balance
sheet | | | Financial
instrument | | | Cash collateral
received | | | Net amount | |
| | | ThCh$ | | | ThCh$ | | | ThCh$ | | | ThCh$ | | | ThCh$ | | | ThCh$ | |
| | | | | | |
Account receivable due from Bretas, | | | 16,938,176 | | | | — | | | | 16,938,176 | | | | — | | | | — | | | | 16,938,176 | |
Financial liabilities
| | | | | | | | | | | | | | | | | | | | | | | | |
| | | | | | | | | | | | Related amounts not set off in
the balance sheet | | | | |
| | | Gross amounts
of recognized
financial
liabilities | | | Gross
amounts of
recognized
financial
asset set off
in the
balance sheet | | | Net amounts
of financial
liability
presented in
the balance
sheet | | | Financial
instrument | | | Cash collateral
received | | | Net
amount | |
| | | ThCh$ | | | ThCh$ | | | ThCh$ | | | ThCh$ | | | ThCh$ | | | ThCh$ | |
| | | | | | |
Debt purchase Bretas, current | | | (12,697,096 | ) | | | — | | | | (12,697,096 | ) | | | (12,697,096 | ) | | | — | | | | — | |
| b) | As of December 31, 2013 |
Financial assets
| | | | | | | | | | | | | | | | | | | | | | | | |
| | | | | | | | | | | | Related amounts not set off in
the balance sheet | | | | |
| | | Gross
amounts of
recognized
financial
assets | | | Gross amounts
of recognized
financial
liabilities set off
in the balance
sheet | | | Net amounts
of financial
assets
presented in
the balance
sheet | | | Financial
instrument | | | Cash collateral
received | | | Net amount | |
| | | ThCh$ | | | ThCh$ | | | ThCh$ | | | ThCh$ | | | ThCh$ | | | ThCh$ | |
| | | | | | |
Account receivable due from Bretas, | | | 26,099,794 | | | | (11,068,259 | ) | | | 15,031,535 | | | | — | | | | — | | | | 15,031,535 | |
Financial liabilities
| | | | | | | | | | | | | | | | | | | | | | | | |
| | | | | | | | | | | | Related amounts not set off in
the balance sheet | | | | |
| | | Gross
amounts of
recognized
financial
liabilities | | | Gross
amounts of
recognized
financial asset
set off in the
balance sheet | | | Net amounts
of financial
liability
presented in
the balance
sheet | | | Financial
instrument | | | Cash collateral
received | | | Net amount | |
| | | ThCh$ | | | ThCh$ | | | ThCh$ | | | ThCh$ | | | ThCh$ | | | ThCh$ | |
| | | | | | |
Debt purchase Bretas, current | | | 57,342,194 | | | | (11,068,259 | ) | | | 46,273,935 | | | | (15,031,534 | ) | | | — | | | | 31,242,401 | |
The agreement between the Group and Bretas´ former shareholders established the net settlement of the abovementioned financial assets and liabilities.
F-62
The agreement mentioned above relates to the acquisition of Bretas in October 2010. As part of this acquisition, the Group assumed certain tax contingencies and accounted them for in accordance with IFRS 3, however, the former shareholders of Bretas agreed on assuming these tax contingencies when their settlement becomes effective, which entitled the Group to account for a receivable amount as a guarantee and presented it as an offset of the non-current financial liability that the Group accounted for as a result of the outstanding consideration from the acquisition. The amount due to the former shareholders of Bretas was reclassified as current in the statement of the financial position as of December 31, 2014 based on the change of the nature of this liability regarding its presentation and an amendment of the terms of the existing agreement.
The initial agreement included that such contingencies (receivable) offset the balance due to the former owner of Bretas for the outstanding consideration relating to the acquisition of Bretas. In 2013, the balance for the outstanding consideration changed its nature regarding the presentation as the Group had agreed the payment of this amount in 2014. As a result of this change in presentation of the financial liability and the expected realization of the contingencies in the long term, the parties agreed that (a) the contingencies which realization is expected in the short term offset the financial liability for the outstanding consideration, and (2) all the payments that the Group makes for the contingencies in the long-term are to be deducted from the future lease payments made to the former shareholders of Bretas. This change in the agreement resulted in the presentation of a separate long-term receivable account for the tax contingencies assessed as such. As of December 31, 2013, the amount of the related tax contingency is presented as a long-term provision in the consolidated statement of financial position of the Group.
F-63
| 7 | Derivative financial instruments |
| 7.1 | Financial assets and liabilities held at fair value through profit or loss |
The Company, following the financial risk management policy described in Note 3, enters into financial derivative contracts to hedge exchange rate and interest rate fluctuation risks.
This account as of December 31, 2014, there are no contracts relating to hedging activities.
Changes in the fair value of the assets and liabilities classified in this category (cross currency swaps and interest rate swaps) are recorded under “financial income” or “financial expenses”, except for the agreements that do not hedge direct liabilities, which are recorded as other gains (losses).
These financial instruments are recorded in the accounts other current and non-current financial assets and other current and non-current financial liabilities.
| 7.2 | Hedging assets and liabilities |
The Company has derivatives to hedge exposure to exchange rate and interest rate variation, particularly instruments classified as cross currency swaps (CCS), used to hedge debts denominated in Peruvian Nuevo Soles and U.S. dollars from bond placements and bank debt in those currencies. These instruments are classified as cash flow and fair value hedges. The fair value of these contracts as of December 31, 2014 represent an asset current of Th Ch$ 3,844,213 and asset – non current of ThCh$ 285,531,116 (ThCh$ 77,188,270 as asset non current of December 31, 2013) and a liability of ThCh$ 382,754 (ThCh$ 358,936 as of December 31, 2013).
These financial instruments are recorded in the accounts current and non-current financial assets and current and non-current financial liabilities. The liabilities are detailed in Note 17.4 and the asset in Note 6.
Changes in the fair value of the assets and liabilities classified in this category (cross currency swaps) are recorded under “financial income” or “financial expenses”.
These financial instruments are presented as “operating activities” in the statement of cash flows as part of the changes in working capital. This is based on the fact that Cencosud has entered into these assets and liabilities as derivative financial instruments to serve as economic and financial hedges for the risks associated with exchange rates and interest rates as described previously.
Instruments at fair value through profit or loss and hedge instruments are detailed in Note 3.
F-64
| 7.3 | Assets and liabilities derivatives designated as hedges |
The following table indicates the period in which the cash flows associated with cash hedges are expected to occur and the carrying amounts of the related hedging instruments.
| | | | | | | | | | | | |
| | | Carrying amount | | | Expected cash flows | |
| December 31, 2014 | | | | | One year or less | | | More than one year | |
| | | ThCh$ | | | ThCh$ | | | ThCh$ | |
| | | |
Cross Currency Swap | | | | | | | | | | | | |
Assets | | | 289,175,329 | | | | 35,071,613 | | | | 1,110,934,627 | |
Liabilities | | | — | | | | — | | | | — | |
Interest Rate Swap | | | | | | | | | | | | |
Liabilities | | | 382,754 | �� | | | — | | | | — | |
| | |
| | | Carrying amount | | | Expected cash flows | |
| December 31, 2013 | | | | | One year or less | | | More than one year | |
| | | ThCh$ | | | ThCh$ | | | ThCh$ | |
|
Cross Currency Swap | |
Assets | | | 77,188,270 | | | | 2,623,050 | | | | 905,111,113 | |
Liabilities | | | 111,456 | | | | 6,715,008 | | | | 8,288,838 | |
Interest Rate Swap | | | | | | | | | | | | |
Liabilities | | | 247,480 | | | | — | | | | — | |
| 8 | Trade receivables and other receivables |
Trade receivables and other receivables as of December 31, 2014 and 2013 are as follows:
| | | | | | | | |
| | | As of December 31, | |
Trade receivables and other receivables, net, current | | 2014 | | | 2013 | |
| | | ThCh$ | | | ThCh$ | |
Trade receivables net, current | | | 190,629,343 | | | | 189,382,770 | |
Credit card receivables net, current | | | 272,626,749 | | | | 573,299,096 | |
Other receivables, net, current | | | 317,357,759 | | | | 319,894,783 | |
Letters of credit loans | | | 962,903 | | | | 726,828 | |
Consumer installment credit—(Banco Paris) | | | | | | | 50,144,076 | |
| | | | | | | | |
Total | | | 781,576,754 | | | | 1,133,447,553 | |
| | | | | | | | |
| |
| | | As of December 31, | |
Trade receivables and other receivables, net, non-current | | 2014 | | | 2013 | |
| | | ThCh$ | | | ThCh$ | |
Trade receivables net, non-current | | | 960,006 | | | | 874,953 | |
Credit card receivables net, non-current | | | 2,800,679 | | | | 54,857,341 | |
Other receivables, net, non-current(1) | | | 20,614,649 | | | | 14,972,281 | |
Letters of credit loans | | | 10,402,021 | | | | 11,079,842 | |
Consumer installment credit—(Banco Paris) | | | | | | | 74,055,395 | |
| | | | | | | | |
| | |
Total | | | 34,777,355 | | | | 155,839,812 | |
| | | | | | | | |
F-65
| | | | | | | | |
| | | As of December 31, | |
Trade receivables and other receivables, gross, current | | 2014 | | | 2013 | |
| | | ThCh$ | | | ThCh$ | |
Trade receivables gross, current | | | 210,196,220 | | | | 207,511,530 | |
Credit card receivables gross, current | | | 287,514,053 | | | | 615,717,408 | |
Other receivables gross, current | | | 328,546,822 | | | | 336,000,114 | |
Letters of credit loans | | | 962,904 | | | | 951,689 | |
Consumer installment credit—(Banco Paris) | | | | | | | 64,867,699 | |
| | | | | | | | |
Total | | | 827,219,999 | | | | 1,225,048,440 | |
| | | | | | | | |
| |
| | | As of December 31, | |
Trade receivables and other receivables, gross, non-current | | 2014 | | | 2013 | |
| | | ThCh$ | | | ThCh$ | |
Trade receivables gross, non-current | | | 960,006 | | | | 874,953 | |
Credit card receivables gross, non-current | | | 2,800,679 | | | | 54,857,341 | |
Other receivables gross, non-current | | | 20,614,649 | | | | 14,972,280 | |
Letters of credit loans, non-current | | | 10,402,021 | | | | 11,079,844 | |
Consumer installment credit, non-current | | | — | | | | 74,055,395 | |
| | | | | | | | |
Total | | | 34,777,355 | | | | 155,839,813 | |
| | | | | | | | |
| |
| | | As of December 31, | |
Trade receivables and other receivables close to maturity | | 2014 | | | 2013 | |
| | | ThCh$ | | | ThCh$ | |
Less than three months | | | 606,401,384 | | | | 787,246,457 | |
Between three and six months | | | 73,829,507 | | | | 108,689,500 | |
Between six and twelve months | | | 46,238,087 | | | | 137,131,540 | |
In more than twelve months | | | 34,777,355 | | | | 155,839,812 | |
| | | | | | | | |
| | |
Total | | | 761,246,333 | | | | 1,188,907,309 | |
| | | | | | | | |
Please refer to table 1-1 in Note 3 to see the trade receivables’ and other receivables’ fair value.
The maturity of past due trade receivables as of December 31, 2014 and 2013 is as follows:
| | | | | | | | |
| | | As of December 31, | |
Trade receivables past due but not impaired | | 2014 | | | 2013 | |
| | | ThCh$ | | | ThCh$ | |
Past due in less than three months | | | 54,092,055 | | | | 144,856,572 | |
Past due between three and six months | | | 18,260,439 | | | | 27,167,160 | |
Past due between six and twelve months | | | 5,791,956 | | | | 5,919,720 | |
Past due in more than twelve months | | | 22,606,571 | | | | 14,037,491 | |
| | | | | | | | |
| | |
Total | | | 100,751,021 | | | | 191,980,943 | |
| | | | | | | | |
F-66
The movement of the bad debt allowance is as follows:
| | | | | | | | |
| | | As of December 31, | |
Change in bad debt allowance | | 2014 | | | 2013 | |
| | | ThCh$ | | | ThCh$ | |
Initial balance | | | 91,600,887 | | | | 93,609,839 | |
Increase in provision | | | 107,419,389 | | | | 87,813,321 | |
Utilized provision | | | (97,906,650- | ) | | | (89,822,273 | ) |
| | |
Reclassification to assets held for sale (note 34) | | | (55,470,381 | ) | | | — | |
| | | | | | | | |
| | |
Total | | | 45,643,245 | | | | 91,600,887 | |
| | | | | | | | |
The maximum exposure to credit risk at the date of the report is the book value in each category of the trade account. The Cencosud Group does not request collateral as a guarantee.
The information presented below is required by the Superintendence of Securities and Insurance through the rule number 23942 dated on September 14, 2011.
The financial business is defined as one more element of Cencosud’s value offering, which complements the comprehensive product and service offerings the Company provides through each of its business units and is aimed at building long-term relationships with our customers. The largest percentage of the financial retail business corresponds to the Más Credit Card in Chile, which has been operating for more than 20 years. The card’s market penetration is less in other countries, such as Peru where it has been available for less than 1 year. Its distribution with respect to the total portfolio is:
| | | | | | | | | | | | | | | | |
| | | As of December 31, | |
Receivables portfolio | | 2014 | | | | | | 2013 | | | | |
| | | ThCh$ | | | % | | | ThCh$ | | | % | |
Current credit card receivables, gross | | | 287,514,053 | | | | 99 | | | | 615,717,408 | | | | 91 | |
Non—current credit card receivables, gross | | | 2,800,679 | | | | 1 | | | | 54,857,341 | | | | 9 | |
| | | | | | | | | | | | | | | | |
| | | | |
Total credit card receivables | | | 290,314,732 | | | | 100 | | | | 670,574,749 | | | | | |
| | | | | | | | | | | | | | | | |
| | | | |
Chilean credit card | | | — | | | | | | | | 444,461,099 | | | | 66 | |
Credit card Más | | | — | | | | | | | | 443,887,523 | | | | | |
Credit card Johnson’s | | | — | | | | | | | | 573,576 | | | | | |
Argentine credit card | | | 220,392,098 | | | | 76 | | | | 169,088,073 | | | | 25 | |
Peruvian credit card | | | 69,922,634 | | | | 24 | | | | 57,025,577 | | | | 9 | |
| | | | | | | | | | | | | | | | |
| | | | |
Total credit card receivables | | | 290,314,732 | | | | 100 | | | | 670,574,749 | | | | 100 | |
| | | | | | | | | | | | | | | | |
F-67
| | | | | | | | |
Receivables portfolio Non-current assets reclassified to assets held for sale | | As of
December 312014 | | | | |
| | | ThCh$ | | | % | |
Current credit card receivables, gross | | | 426,660,055 | | | | | |
| | | | | | | | |
| | |
Total credit card receivables | | | 426,660,055 | | | | | |
| | | | | | | | |
| | |
Chilean credit card | | | 426,660,055 | | | | | |
Credit card Más | | | 426,562,388 | | | | 100 | |
Credit card Johnson’s | | | 97,667 | | | | 0,0 | |
| | | | | | | | |
| | |
Total credit card receivables | | | 426,660,055 | | | | 100 | |
Progress is being made to regionalize the financial business through an organizational structure where each risk area autonomously and independently manages risk, led by the Corporate Risk Management Division, which reports directly to Cencosud’s Corporate CEO. In turn, the risk management areas in each country report (administratively and functionally) to the Corporate Risk Manager.
F-68
CHILE
| 1. | Credit policies. Credit Card Más |
| a) | Credit policies are led by the Risk Management Division through a risk committee in Chile and parameters are set in the Company’s evaluation systems for the entire credit process. Among others, these policies include: |
| i. | the commercial ethics of debtors or those eligible for credit; |
| ii. | the cardholder risk profile, measured based on payment behavior and/or associated score models; |
| iii. | the debtor’s credit capacity, among others. |
As mentioned, the main objective of the financial business is to grant customers access to financing for products offered by the Company´s retail stores (to complement Cencosud’s value offering). Cash advances and financing at affiliated businesses are very limited as compared to total credit card sales. Financial products are targeted toward cardholders with better risk profiles and are complementary to the credit card itself. Minimum payment policies are segmented by risk profile and fluctuate between 10% and 20% of the value invoiced monthly.
| b) | The collections policy aims to secure 100% of debt payments while the cardholder is in the early stages of default so that the cardholder’s account may remain open to continue making purchases. However, some cardholders cannot make their payments. For these cardholders, new payment plans can be structured. These agreements must consider at least: |
| i. | The cardholder’s expressed will. |
| ii. | The intention to pay, manifested by an initial payment as a condition to restructure the debt. |
| iii. | Account blockage for all cardholders who restructure debt that is more than 30 days in default. Only after having demonstrated favorable payment behavior does the company evaluate potentially opening the account so the cardholder may continue making purchases and reducing the credit limit, as appropriate. |
Most renegotiation and refinancing are done for cardholders that are more than 30 days in default and require initial payments of an average of 15% of the total debt. The average term is around 23 months and a maximum of 2 restructurings per year is accepted.
| c) | Bad debt allowances are determined using a model that brings together banking industry best practices, in line with Basel criteria, in order to estimate the level of allowances necessary to cover the portfolio’s potential risk. This model segments cardholders in different clusters to better estimate losses, classifying renegotiated cardholders, among others, in a special category. The validation and sufficiency of the allowance model is monitored on a monthly basis by the Risk Committee using defined back testing and sufficiency analyses. Beginning in December 31, the Board of Directors of Cencosud Group, through its Corporate Risk Committee, decided to begin establishing anti-cyclical provisions for a total of ThCh$3,902, which is increasingly being adopted as a best practice by the international and local banking industry. These provisions, which are established in economically favorable periods with low unemployment rates and high growth rates, allow the company to prepare for recessionary economic cycles and their impact on the cardholder portfolio. |
| d) | The write-off policy establishes that 100% of all accounts with more than 6 invoices past due be written off and that such amounts be fully recognized as a loss in the statement of income. All cardholders that subsequently pay all or part of their written-off debt are recognized as recovered write-offs in the statement of income. |
F-69
| | | | | | | | | | | | |
| | | | | | Range | |
| | | Average term | | | Minimum | | | Maximum | |
Purchases | | | 3 | | | | 1 | | | | 36 | |
Affiliated businesses | | | 3 | | | | 1 | | | | 36 | |
Cash advances | | | 14 | | | | 3 | | | | 48 | |
Renegotiated | | | 23 | | | | 4 | | | | 24 | |
Refinancing | | | 7 | | | | 4 | | | | 12 | |
| 2. | Definition of portfolio types. |
Considers 2 types of policies in restructuring debt in default:
| a. | Renegotiation Policy: establishes the conditions for restructuring 100% of the cardholder’s debt in default. |
| b. | Refinancing Policy: establishes the conditions for restructuring 100% of the cardholder’s invoiced debt. |
| 3. | Portfolio stratification |
As of December 31, 2014
| | | | | | | | | | | | | | | | | | | | |
Credit card Más Delinquency segments | | Non-
refinanced
customers
(number) | | | Non-
refinanced
portfolio | | | Refinanced
customers
(number) | | | Refinanced
portfolio | | | Total
Gross
portfolio | |
| | | N° | | | ThCh$ | | | N° | | | ThCh$ | | | ThCh$ | |
Payments up to date | | | 1,125,311 | | | | 331,498,568 | | | | 29,193 | | | | 15,168,091 | | | | 346,666,659 | |
01-30 days | | | 91,502 | | | | 37,668,543 | | | | 10,476 | | | | 5,703,919 | | | | 43,372,462 | |
31-60 days | | | 29,172 | | | | 8,946,609 | | | | 6,202 | | | | 3,288,972 | | | | 12,235,581 | |
61-90 days | | | 17,361 | | | | 5,190,493 | | | | 4,731 | | | | 2,555,810 | | | | 7,746,303 | |
91-120 days | | | 12,867 | | | | 4,064,153 | | | | 3,526 | | | | 1,939,699 | | | | 6,003,852 | |
121-150 days | | | 10,307 | | | | 3,548,797 | | | | 2,880 | | | | 1,593,028 | | | | 5,141,825 | |
150-180 days | | | 10,503 | | | | 3,866,737 | | | | 2,705 | | | | 1,528,969 | | | | 5,395,706 | |
>180 days | | | — | | | | — | | | | — | | | | — | | | | — | |
| | | | | | | | | | | | | | | | | | | | |
Total | | | 1,297,023 | | | | 394,783,900 | | | | 59,713 | | | | 31,778,488 | | | | 426,562,388 | |
| | | | | | | | | | | | | | | | | | | | |
As of December 31, 2014
| | | | | | |
ThCh$ |
Total allowance on non-refinanced portfolio | | | 15,097,967 | | | As of December 31, 2014 |
Total allowance on refinanced portfolio | | | 7,516,375 | | | As of December 31, 2014 |
Total write-offs for the period | | | 44,591,383 | | | Write-offs between January 1 and December 31, 2014 |
Total recovered for the period | | | 16,416,423 | | | Write-offs recovered between January 1 and December 31, 2014 |
|
N° |
Number of cards issued (not additional cards) | | | 2,662,034 | | | Stock as of December 31, 2014 |
Number of cards with outstanding balances | | | 1,356,736 | | | Stock as of December 31, 2014 |
| | |
Average number of refinances | | | 7,718 | | | Average number of accounts refinanced monthly between January 1 and December 31, 2014 |
| | |
Total refinanced receivables (ThCh$) | | | 31,778,488 | | | Stock of refinanced portfolio as of December 2014 |
| | |
% refinanced / non-refinanced portfolio | | | 4.60 | % | | Number of refinanced customers/non-refinanced customers |
F-70
As of December 31, 2013
| | | | | | | | | | | | | | | | | | | | |
Credit card Más Delinquency segments | | Non-
refinanced
customers
(number) | | | Non-
refinanced
portfolio | | | Refinanced
customers
(number) | | | Refinanced
portfolio | | | Total
Gross
portfolio | |
| | | N° | | | ThCh$ | | | N° | | | ThCh$ | | | ThCh$ | |
Payments up to date | | | 1,232,001 | | | | 346,218,316 | | | | 34,947 | | | | 15,740,292 | | | | 361,958,608 | |
01-30 days | | | 91,698 | | | | 37,659,571 | | | | 14,681 | | | | 6,620,467 | | | | 44,280,038 | |
31-60 days | | | 28,309 | | | | 9,012,903 | | | | 8,351 | | | | 3,967,265 | | | | 12,980,168 | |
61-90 days | | | 16,190 | | | | 4,800,557 | | | | 5,744 | | | | 2,761,775 | | | | 7,562,332 | |
91-120 days | | | 12,425 | | | | 3,837,416 | | | | 4,721 | | | | 2,321,809 | | | | 6,159,225 | |
121-150 days | | | 10,248 | | | | 3,464,801 | | | | 3,878 | | | | 1,938,661 | | | | 5,403,462 | |
150-180 days | | | 10,686 | | | | 3,647,565 | | | | 3,600 | | | | 1,896,125 | | | | 5,543,690 | |
>180 days | | | — | | | | — | | | | — | | | | — | | | | — | |
| | | | | | | | | | | | | | | | | | | | |
| | | | | |
Total | | | 1,401,557 | | | | 408,641,129 | | | | 75,922 | | | | 35,246,394 | | | | 443,887,523 | |
As of December 31, 2013
| | | | | | |
ThCh$ |
Total allowance on non-refinanced portfolio | | | 20,519,859 | | | As of December 2013 |
Total allowance on refinanced portfolio | | | 8,473,679 | | | As of December 2013 |
Total write-offs for the period | | | 57,018,013 | | | Write-offs between Jan and Dec 2013 |
| | |
Total recovered for the period | | | 18,201,984 | | | Write-offs recovered between Jan and Dec 2013 |
|
N° |
Number of cards issued (not additional cards) | | | 2,930,288 | | | Stock as of December 2013 |
Number of cards with outstanding balances | | | 1,477,479 | | | Stock as of December 2013 |
Average number of refinances | | | 7,820 | | | Average number of accounts refinanced monthly between Jan and Dec 2013 |
Total refinanced receivables (ThCh$) | | | 35,246,394 | | | Stock of refinanced portfolio as of December 2013 |
% refinanced / non-refinanced portfolio | | | 5.42 | % | | Number of refinanced customers/non-refinanced customers |
F-71
| 4. | Portfolio allowance factors |
As of December 31, 2014
| | | | | | | | |
Credit card Más Delinquency segments | | Non-refinanced
portfolio
as % of average
losses | | | Refinanced
portfolio
as % of
average losses | |
Payments up to date | | | 0.8 | | | | 18.3 | |
01-30 | | | 5.0 | | | | 20.4 | |
31-60 | | | 20.0 | | | | 16.8 | |
61-90 | | | 36.8 | | | | 29.7 | |
91-120 | | | 51.5 | | | | 38.6 | |
121-150 | | | 63.6 | | | | 48.8 | |
151-180 | | | 64.2 | | | | 48.8 | |
>180 days | | | — | | | | — | |
| | | | | | | | |
Total | | | 3.8 | | | | 23.7 | |
| | | | | | | | |
As of December 31, 2013
| | | | | | | | |
Credit card Más Delinquency segments | | Non-refinanced
portfolio
as % of average
losses | | | Refinanced
portfolio
as % of
average losses | |
Payments up to date | | | 1.9 | | | | 16.9 | |
01-30 | | | 7.1 | | | | 20.8 | |
31-60 | | | 24.7 | | | | 17.0 | |
61-90 | | | 43.1 | | | | 31.7 | |
91-120 | | | 57.4 | | | | 40.2 | |
121-150 | | | 68.8 | | | | 50.9 | |
151-180 | | | 69.4 | | | | 50.9 | |
>180 days | | | — | | | | — | |
| | | | | | | | |
Total | | | 5.0 | | | | 24.0 | |
| | | | | | | | |
.0
| 5. | Risk ratios. (% provision/portfolio) |
As of December 31, 2014
| | | | | | |
Credit card Más risk ratios (allowance / portfolio) | | % | | | |
| | |
Non-refinanced portfolio | | | 3.8 | | | Stock of allowances on non-refinanced portfolio /Stock of non-refinanced portfolio |
| | |
Refinanced portfolio | | | 23.7 | | | Stock of allowances on refinanced portfolio /Stock of refinanced portfolio |
| | |
Total portfolio | | | 5.3 | | | Stock of total allowances/ Stock of total portfolio |
Write off ratio | | | 6.0 | | | |
F-72
As of December 31, 2013
| | | | | | |
Credit card Más risk ratios (allowance / portfolio) | | % | | | |
Non-refinanced portfolio | | | 5.0 | | | Stock of allowances on non-refinanced portfolio /Stock of non-refinanced portfolio |
Refinanced portfolio | | | 24 | | | Stock of allowances on refinanced portfolio /Stock of refinanced portfolio |
Total portfolio | | | 6.5 | | | Stock of total allowances/ Stock of total portfolio |
Write off ratio | | | 9.4 | | | |
Credit CardJohnson´s—TMO
As of March 2012, the Company’s system began to migrate the portfolio management of Johnson’s Multiopción Card (hereinafter TMO) to Cencosud Cards. This process involved that the client had to change its product by Cencosud card, which was conducted during 2012. For purposes of portfolio impacts, promotes the transfer of clients without problems of arrears and without renegotiation conditions.
| 1. | Purchase of TMO´s portfolio. |
In December 2012, the portfolio of TMO was included in the portfolio of Cencosud Administradora de Tarjeta. As of December 31, 2014, the carrying value of the portfolio amounts to M$ 97,667 (85% of this amount represents customers who renegotiated) and shows a bad debt provision of M$ 66,800.
F-73
ARGENTINA
| a) | Customers are selected using policies with parameters based on the credit assessment system. The approval decision and the credit limit are based on a combination of statistical models, payment history in the financial system and an estimate of the applicant’s income level. The minimum payment is between 10% and 30% depending on the risk of the customer for shopping segment up to 5 and 100% for purchases greater than 5 quota: associated trades represent December a22% of total sales. Not offered financial products of advance cash. |
| b) | Collections policy: during the first 90 days of delay, the company aims to ensure that the cardholder pays its debt in default and recovers access to credit. Refinancing requires an initial payment of at least 50% of the unpaid minimum payment and are limited to a maximum of once every six months. For cardholders more than 90 days in default, the card is blocked indefinitely and a new payment plan is established based on their willingness and capacity to pay. |
| c) | Allowances: allowances are calculated each month by applying statistical methodology that combines portfolio behavior over the last 12 months. The portfolio is also segmented into clusters based on the likelihood of non-payment calculated when the account is opened and also the cardholder’s seniority. The company verifies that the calculated allowances charge the expected losses in the current period and also that they exceed the requirements of the local regulator (BCRA). Conservative allowances are added based on new factors that may not be taken into consideration by the statistical methodology. |
F-74
| d) | Write-off policy: The local regulator requires allowances for 100% of delinquent debt once it is 360 days past due. However, Cencosud applies their owncriteria of establishing allowances for 100% of accounts that are 180 days past due. Currently, because of a limitation with the card processing system in Argentina, accounts are not written-off in accounting at 360 days. However, the 100% allowance is maintained. |
Average Terms for Credit Cards and Refinancing (months)
| | | | |
Range of terms | | Portfolio | |
| | | % | |
Payment upon invoicing | | | 17.50 | |
Installments 0-3 M | | | 31.72 | |
Installments 3-6 M | | | 22.02 | |
Installments 6-12 M | | | 10.79 | |
Installments +12 M | | | 17.97 | |
Average term for portfolio | | | 6.69 | |
| | | | |
Range of terms for refinanced collections | | Portfolio | |
| | | % | |
Installments 0-3 M | | | 8.2 | |
Installments 3-6 M | | | 31.1 | |
Installments 6-12 M | | | 48.2 | |
Installments +12 M | | | 12.5 | |
Average term for refinanced collections in months | | | 11.4 | |
| 2. | Definition of portfolio types. |
Cencosud Argentina segments its portfolio into three main groups based on risk of non-payment. This segmentation is determined when customers are approved for credit and is used primarily to properly allocate credit limits. Each month, the company monitors the mixture of characteristics of new cards issued versus the portfolio, and any important deviations are used to modify customer selection methods.
| 3. | Portfolio stratification |
As of December 31, 2014
| | | | | | | | | | | | | | | | | | | | |
Delinquency segments | | Non-refinanced
customers
(number) | | | Non-
refinanced
portfolio | | | Refinanced
customers
(number) | | | Refinanced
portfolio | | | Total
Gross
portfolio | |
| | | N° | | | ThCh$ | | | N° | | | ThCh$ | | | ThCh$ | |
Payments up to date | | | 787,949 | | | | 188,443,617 | | | | 5,254 | | | | 2,815,381 | | | | 191,258,998 | |
01-30 days | | | 94,951 | | | | 20,002,040 | | | | 1,993 | | | | 685,699 | | | | 20,687,739 | |
31-60 days | | | 16,694 | | | | 3,217,508 | | | | 938 | | | | 390,654 | | | | 3,608,162 | |
61-90 days | | | 8,710 | | | | 1,969,955 | | | | 571 | | | | 276,826 | | | | 2,246,781 | |
91-120 days | | | 3,850 | | | | 978,019 | | | | 277 | | | | 153,264 | | | | 1,131,283 | |
121-150 days | | | 2,588 | | | | 790,351 | | | | 79 | | | | 34,186 | | | | 824,537 | |
150-180 days | | | 2,188 | | | | 633,775 | | | | 2 | | | | 823 | | | | 634,598 | |
>180 days | | | | | | | | | | | | | | | | | | | | |
| | | | | |
Total | | | 916,930 | | | | 216,035,265 | | | | 9,114 | | | | 4,356,833 | | | | 220,392,098 | |
F-75
| | | | | | |
M$ |
Total allowance on non-refinanced portfolio | | | 6,328,417 | | | Stock as of December 2014 |
Total allowance on refinanced portfolio | | | 1,661,563 | | | Stock as of December 2014 |
| | |
Total write-offs for the period | | | 371,365 | | | Write-offs between Jan and Dec 2014 |
| | |
Total recovered for the period | | | 464,531 | | | Write-offs recovered between Jan and Dec 2014 |
| | | | | | |
N° |
| | |
Number of cards issued (not additional cards) | | | 1,232,252 | | | Stock as of December 2014 |
Number of cards with outstanding balances | | | 926,044 | | | Stock as of December 2014 |
| | |
Average number of refinancing | | | 1,401 | | | Average number of accounts refinanced monthly between Jan and Dec 2014 |
Total refinanced receivables | | | 4,356,833 | | | Stock of refinanced portfolio as of December 2014 |
| | |
% refinanced / non-refinanced portfolio | | | 0.99 | | | Number of refinanced customers/non-refinanced customers |
As of December 31, 2013
| | | | | | | | | | | | | | | | | | | | |
Delinquency segments | | Non-refinanced
customers
(number) | | | Non-
refinanced
portfolio | | | Refinanced
customers
(number) | | | Refinanced
portfolio | | | Total
Gross
portfolio | |
| | | N° | | | ThCh$ | | | N° | | | ThCh$ | | | ThCh$ | |
Payments up to date | | | 673,223 | | | | 144,439,434 | | | | 2,792 | | | | 689,093 | | | | 145,128,527 | |
01-30 days | | | 86,911 | | | | 17,721,705 | | | | 928 | | | | 242,134 | | | | 17,963,839 | |
31-60 days | | | 22,973 | | | | 3,190,021 | | | | 516 | | | | 151,723 | | | | 3,341,744 | |
61-90 days | | | 7,787 | | | | 1,057,097 | | | | 239 | | | | 72,109 | | | | 1,129,206 | |
91-120 days | | | 3,117 | | | | 607,332 | | | | 128 | | | | 44,948 | | | | 652,280 | |
121-150 days | | | 2,570 | | | | 570,801 | | | | 54 | | | | 15,385 | | | | 586,186 | |
150-180 days | | | 1,180 | | | | 284,304 | | | | 4 | | | | 1,174 | | | | 285,478 | |
>180 days | | | 17 | | | | 813 | | | | — | | | | — | | | | 813 | |
| | | | | |
Total | | | 797,778 | | | | 167,871,507 | | | | 4,661 | | | | 1,216,566 | | | | 169,088,073 | |
F-76
As of December 31, 2013
| | | | | | |
M$ |
Total allowance on non-refinanced portfolio | | | 4,027,068 | | | Stock as of December 2013 |
Total allowance on refinanced portfolio | | | 555,750 | | | Stock as of December 2013 |
| | |
Total write-offs for the period | | | 7,225,842 | | | Write-offs between Jan and Dec 2012 |
| | |
Total recovered for the period | | | 2,494,930 | | | Write-offs recovered between Jan and Dec 2013 |
|
N° |
| | |
Number of cards issued (not additional cards) | | | 1,171,323 | | | Stock as of December 2013 |
Number of cards with outstanding balances | | | 802,439 | | | Stock as of December 2013 |
| | |
Average number of refinancing | | | 943 | | | Average number of accounts refinanced monthly between Jan and Dec 2013 |
| | |
Total refinanced receivables | | | 1,216,566 | | | Stock of refinanced portfolio as of December 2013 |
| | |
% refinanced / non-refinanced portfolio | | | 0.58 | | | Number of refinanced customers/non-refinanced customers |
F-77
| 4. | Portfolio allowance factors. |
As of December 31, 2014
| | | | | | | | |
Delinquency segments | | Non-refinanced
portfolio
as % of
average losses | | | Refinanced
portfolio as %
of average
losses | |
Payments up to date | | | 1.8 | | | | 33.6 | |
01-30 | | | 2.2 | | | | 33.6 | |
31-60 | | | 9.5 | | | | 72.0 | |
61-90 | | | 27.8 | | | | 100.0 | |
91-120 | | | 45.1 | | | | 100.0 | |
121-150 | | | 68.6 | | | | 100.0 | |
151-180 | | | 90.6 | | | | 100.0 | |
>180 days | | | — | | | | — | |
| | | | | | | | |
Total | | | 2.9 | | | | 46.4 | |
| | | | | | | | |
As of December 31, 2013
| | | | | | | | |
Delinquency segments | | Non-refinanced
portfolio
as % of
average losses | | | Refinanced
portfolio as %
of average
losses | |
Payments up to date | | | 1.5 | | | | 33.6 | |
01-30 | | | 2.1 | | | | 33.6 | |
31-60 | | | 10.7 | | | | 72.0 | |
61-90 | | | 27.9 | | | | 100.0 | |
91-120 | | | 44.6 | | | | 100.0 | |
121-150 | | | 60.3 | | | | 100.0 | |
151-180 | | | 85.6 | | | | 100.0 | |
>180 days | | | 100.0 | | | | — | |
| | | | | | | | |
Total | | | 2.4 | | | | 45.7 | |
| | | | | | | | |
F-78
| 5. | Risk ratios (% provision/portfolio). |
As of December 31, 2014
| | | | | | |
Risk ratios (allowance / portfolio) | | % | | | |
Non-refinanced portfolio | | | 2.9 | | | Stock of allowances on non-refinanced portfolio/Stock of non-refinanced portfolio |
Refinanced portfolio | | | 46.4 | | | Stock of allowances on refinanced portfolio/Stock of refinanced portfolio |
Total portfolio | | | 3.6 | | | Stock of total allowances/Stock of total portfolio |
Write off ratio | | | 3.6 | | | |
As of December 31, 2013
| | | | | | |
Risk ratios (allowance / portfolio) | | % | | | |
Non-refinanced portfolio | | | 2.4 | | | Stock of allowances on non-refinanced portfolio/Stock of non-refinanced portfolio |
Refinanced portfolio | | | 45.7 | | | Stock of allowances on refinanced portfolio/Stock of refinanced portfolio |
Total portfolio | | | 2.7 | | | Stock of total allowances/Stock of total portfolio |
Write off ratio | | | 3.3 | | | |
PERU
Financial retail operations in Peru began July 21, 2010 with a pilot program in one store and later in October 2010 was rolled out in all formats of Metro Supermarkets. Prospective credit card holders are selected based on the cardholders’ purchasing behavior in the Bonus customer loyalty program, combined with an analysis of behavior profiles by credit rating agencies available in the country.
Since operations began, they were structured as defined by the Group, following the requirements defined by Peruvian banking regulations (despite not being enforceable at that time). From June, 2012 Cencosud Bank has been authorized by the Superintendency of Banks and Insurance (SBS) to establish itself as a bank.
Adhering to banking regulations involves diverse elements; including observing mandatory definitions for refinancing, as well as classifying debtors based on days in default which, in turn, translates into establishing allowances over the principal of the loans.
In addition, the standards require pro-cyclical provisions to be established that are linked to the economic cycle and that in practice translate into 1.5% additional allowances over current non-delinquent balances.
| 2. | Definition of portfolio types. |
The portfolio is divided into two groups:
| • | | Non-refinanced portfolio. |
| • | | Refinanced portfolio, which includes cardholders that are at least one day delinquent. They must make a minimum payment and the debtor classification (and therefore the allowance) must be maintained or increased based on the regulations mentioned above. |
F-79
| 3. | Portfolio stratification |
As of December 31, 2014
| | | | | | | | | | | | | | | | | | | | |
Delinquency segments | | Non-refinanced
customers
(number) | | | Non-
refinanced
portfolio | | | Refinanced
customers
(number) | | | Refinanced
portfolio | | | Total
gross
portfolio | |
| | | N° | | | ThCh$ | | | N° | | | ThCh$ | | | ThCh$ | |
Payments up to date | | | 221,583 | | | | 59,983,701 | | | | 2,904 | | | | 1,087,167 | | | | 61,070,868 | |
01-30 days | | | 8,171 | | | | 2,837,752 | | | | 698 | | | | 280,541 | | | | 3,118,293 | |
31-60 days | | | 4,818 | | | | 1,909,791 | | | | 620 | | | | 248,621 | | | | 2,158,412 | |
61-90 days | | | 3,112 | | | | 1,273,760 | | | | 329 | | | | 132,164 | | | | 1,405,924 | |
91-120 days | | | 3,677 | | | | 1,605,737 | | | | 262 | | | | 117,557 | | | | 1,723,294 | |
121-150 days | | | 726 | | | | 326,899 | | | | 46 | | | | 18,323 | | | | 345,222 | |
150-180 days | | | 108 | | | | 65,072 | | | | 5 | | | | 8,119 | | | | 73,191 | |
>180 days | | | 1,015 | | | | 25,146 | | | | 31 | | | | 2,284 | | | | 27,430 | |
| | | | | |
Total | | | 243,210 | | | | 68,027,858 | | | | 4,895 | | | | 1,894,776 | | | | 69,922,634 | |
| | | | | | | | | | | | | | | | | | | | |
As of December 31, 2014
| | | | | | |
ThCh$ |
Total allowance on non-refinanced portfolio | | | 3,770,364 | | | Stock as of December 2014 |
Total allowance on refinanced portfolio | | | 975,623 | | | Stock as of December 2014 |
Total write-offs for the period | | | 4,157,960 | | | Write-offs between Jan and Dec 2014 |
Total recovered for the period | | | 753,560 | | | Write-offs recovered between Jan and Dec 2014 |
| | | | | | |
N° |
Number of cards issued (not additional cards) | | | 532,168 | | | Stock as of December 2014 |
Number of cards with outstanding balances | | | 248,105 | | | Stock as of December 2014 |
Average number of refinances | | | 578 | | | Average number of accounts refinanced monthly between Jan and Dec 2014 |
Total refinanced receivables | | | 1,894,776 | | | Stock of refinanced portfolio as of December 2014 |
% refinanced / non-refinanced portfolio | | | 2.01 | | | Number of refinanced customers/non- refinanced customers |
As of December 31, 2013
| | | | | | | | | | | | | | | | | | | | |
Delinquency segments | | Non-refinanced
customers
(number) | | | Non-
refinanced
portfolio | | | Refinanced
customers
(number) | | | Refinanced
portfolio | | | Total
gross
portfolio | |
| | | N° | | | ThCh$ | | | N° | | | ThCh$ | | | ThCh$ | |
Payments up to date | | | 226,953 | | | | 50,424,409 | | | | 327 | | | | 72,013 | | | | 50,496,422 | |
01-30 days | | | 10,344 | | | | 2,606,274 | | | | 64 | | | | 17,102 | | | | 2,623,376 | |
31-60 days | | | 5,281 | | | | 1,268,826 | | | | 15 | | | | 4,116 | | | | 1,272,942 | |
61-90 days | | | 3,479 | | | | 764,649 | | | | 15 | | | | 3,210 | | | | 767,859 | |
91-120 days | | | 3,931 | | | | 888,699 | | | | 29 | | | | 11,355 | | | | 900,054 | |
121-150 days | | | 872 | | | | 222,351 | | | | 20 | | | | 5,091 | | | | 227,442 | |
150-180 days | | | 226 | | | | 31,789 | | | | 31 | | | | 13,708 | | | | 45,497 | |
>180 days | | | 2,526 | | | | 614,610 | | | | 162 | | | | 77,375 | | | | 691,985 | |
| | | | | | | | | | | | | | | | | | | | |
| | | | | |
Total | | | 253,612 | | | | 56,821,607 | | | | 663 | | | | 203,970 | | | | 57,025,577 | |
| | | | | | | | | | | | | | | | | | | | |
F-80
As of December 31, 2013
| | | | | | |
ThCh$ |
Total allowance on non-refinanced portfolio | | | 3,107,209 | | | Stock as of December 2013 |
Total allowance on refinanced portfolio | | | 155,844 | | | Stock as of December 2013 |
Total write-offs for the period | | | 9,056,228 | | | Write-offs between Jan and Dec 2013 |
Total recovered for the period | | | 717,359 | | | Write-offs recovered between Jan and Dec 2013 |
| | | | | | |
N° |
Number of cards issued (not additional cards) | | | 541,570 | | | Stock as of December 2013 |
Number of cards with outstanding balances | | | 254,275 | | | Stock as of December 2013 |
Average number of refinances | | | — | | | Average number of accounts refinanced monthly between Jan and Dec 2013 |
Total refinanced receivables | | | 203,970 | | | Stock of refinanced portfolio as of December 2013 |
% refinanced / non-refinanced portfolio | | | 0.26 | | | Number of refinanced customers/non-refinanced customers |
F-81
| 4. | Portfolio allowance factors. |
As of December 31, 2014
| | | | | | | | |
Delinquency segments | | Non-refinanced
portfolio
as % of
average losses | | | Refinanced
portfolio
as % of
average losses | |
Payments up to date | | | 1.5 | | | | 38.6 | |
01-30 | | | 6.8 | | | | 44.1 | |
31-60 | | | 26.3 | | | | 65.3 | |
61-90 | | | 60.0 | | | | 80.8 | |
91-120 | | | 60.0 | | | | 94.2 | |
121-150 | | | 100.0 | | | | 100.0 | |
151-180 | | | 100.0 | | | | 100.0 | |
>180 days | | | 100.4 | | | | 1140.1 | |
Total | | | 5.5 | | | | 51.5 | |
| | | | | | | | |
As of December 31, 2013
| | | | | | | | |
Delinquency segments | | Non-refinanced
portfolio
as % of
average losses | | | Refinanced
portfolio
as % of
average losses | |
Payments up to date | | | 1.5 | | | | 43.3 | |
01-30 | | | 6.4 | | | | 60.8 | |
31-60 | | | 26.5 | | | | 91.6 | |
61-90 | | | 60.0 | | | | 94.1 | |
91-120 | | | 59.9 | | | | 99.4 | |
121-150 | | | 99.8 | | | | 100.0 | |
151-180 | | | 99.9 | | | | 100.0 | |
>180 days | | | 100.0 | | | | 100.0 | |
| | | | | | | | |
| | |
Total | | | 5.5 | | | | 76.4 | |
| | | | | | | | |
F-82
| 5. | Risk ratios (% provision/portfolio) |
As of December 31, 2014
| | | | | | |
Risk ratios (allowance / portfolio) | | % | | | |
Non-refinanced portfolio | | | 5.5 | | | Stock of allowances on non-refinanced portfolio /Stock of non-refinanced portfolio |
Refinanced portfolio | | | 51.5 | | | Stock of allowances on refinanced portfolio / Stock of refinanced portfolio |
Total portfolio | | | 6.8 | | | Stock of total allowances / Stock of total portfolio |
Note:
Allowances and allowance ratios do not include millions ThCh$ 784 in anti-cyclical provisions that are included based on international and domestic banking industry best practices and in line with the Basel standards in order to be prepared for future changes in macroeconomic conditions.
As of December 31, 2013
| | | | | | |
Risk ratios (allowance / portfolio) | | % | | | |
Non-refinanced portfolio | | | 5.5 | | | Stock of allowances on non-refinanced portfolio /Stock of non-refinanced portfolio |
Refinanced portfolio | | | 76.4 | | | Stock of allowances on refinanced portfolio / Stock of refinanced portfolio |
Total portfolio | | | 5.7 | | | Stock of total allowances / Stock of total portfolio |
Write-off ratio | | | 19.9 | | | |
Note:
Allowances and allowance ratios do not include millions ThCh$ 388 in anti-cyclical provisions that are included based on international and domestic banking industry best practices and in line with the Basel standards in order to be prepared for future changes in macroeconomic conditions.
| 9 | Transactions with related parties |
Transactions with related companies are based on immediate payment or collection or with a term of up to 30 days, and are not subject to special conditions. These operations comply with what is established in articles 44 and 49 of Law N° 18,046 that regulates the Corporations.
It is noteworthy that the related party transactions are in accordance with IAS 24 (Revised) “Related Parties”. The Company has a policy to disclose all transactions performed with related parties during the period.
F-83
| 9.1 | Trade receivables from related entities |
The composition of the item as of December 31, 2014 and December 31, 2013 is as follows:
| | | | | | | | | | | | | | | | | | | | | | | | | | |
| | | | | Receivables from related entities | | Balance as of | |
Tax ID Number | | Company | | Transaction description | | Transaction term | | Nature of relationship | | Currency | | Current | | | Non-current | |
| | | | | | | 12/31/2014 | | | 12/31/2013 | | | 12/31/2014 | | | 12/31/2013 | |
| | | | | | | | | | | | | ThCh$ | | | ThCh$ | | | ThCh$ | | | ThCh$ | |
96.863.570-0 | | Inmobiliaria Mall Viña del Mar S.A. | | Dividends receivable | | Current | | Associate | | Chilean Pesos | | | 1,371,016 | | | | 432,303 | | | | — | | | | — | |
| | | | | | | | | | | | | | | | | | | | | | | | | | |
Total | | | | | | | | | | | | | 1,371,016 | | | | 432,303 | | | | — | | | | — | |
| | | | | | | | | | | | | | | | | | | | | | | | | | |
| 9.2 | Trade payables to related entities |
The composition of the item as of December 31, 2014 and December 31, 2013 is as follows:
| | | | | | | | | | | | | | | | | | | | | | | | | | |
| | | | | Payables to related entities | | Balance as of | |
Tax ID number | | Company | | Transaction description | | Transaction term | | Nature of relationship | | Currency | | Current | | | Non-current | |
| | | | | | | 12/31/2014 | | | 12/31/2013 | | | 12/31/2014 | | | 12/31/2013 | |
| | | | | | | | | | | | | ThCh$ | | | ThCh$ | | | ThCh$ | | | ThCh$ | |
| | Loyalti del Perú S.A.C. | | Fund transfer | | Current | | Associate | | Peruvian New Sol | | | 3,302,006 | | | | 556,494 | | | | — | | | | — | |
| | | | | | | | | | | | | | | | | | | | | | | | | | |
| | | | | | | | | |
| | | | | | | | | | | | | 3,302,006 | | | | 556,494 | | | | — | | | | — | |
| | | | | | | | | | | | | | | | | | | | | | | | | | |
F-84
| 9.3 | Transactions with related parties and impact on income |
The operations and its impact on income are presented for the years ended December 31, 2014 and December 31, 2013, as follows:
| | | | | | | | | | | | | | | | | | | | | | | | | | |
| Transactions | |
Tax ID Number | | Company | | Nature of
relationship | | Transaction
description | | Currency | | Country | | 12/31/2014 | | | Impact to
income
(charge
/credit) | | | 12/31/2013 | | | Impact to
income
(charge
/credit) | |
| | | | | | | | | | | | | ThCh$ | | | ThCh$ | | | ThCh$ | | | ThCh$ | |
| 3.294.888-k | | Horst Paulmann Kemna | | Chairman | | Dividends paid | | Chilean pesos | | Chile | | | 1,448,867 | | | | — | | | | 2,011,560 | | | | — | |
| 4.580.001-6 | | Helga Koepfer Schoebitz | | Shareholder | | Dividends paid | | Chilean pesos | | Chile | | | 63,867 | | | | — | | | | 88,771 | | | | — | |
| 76.425.400-7 | | Inversiones Tano Ltda. | | Shareholder | | Dividends paid | | Chilean pesos | | Chile | | | 9,431,893 | | | | — | | | | 13,094,931 | | | | — | |
| 86.193.900-6 | | Inversiones Quinchamali Ltda. | | Shareholder | | Dividends paid | | Chilean pesos | | Chile | | | 11,919,602 | | | | — | | | | 16,637,640 | | | | — | |
| 96.802.510-4 | | Inversiones Latadia Ltda. | | Shareholder | | Dividends paid | | Chilean pesos | | Chile | | | 11,346,441 | | | | — | | | | 15,753,026 | | | | — | |
| 7.012.865-9 | | Manfred Paulmann Koepfer | | Shareholder | | Dividends paid | | Chilean pesos | | Chile | | | 257,880 | | | | — | | | | 358,033 | | | | — | |
| 8.953.509-3 | | Peter Paulmann Koepfer | | Director | | Dividends paid | | Chilean pesos | | Chile | | | 256,387 | | | | — | | | | 355,959 | | | | — | |
| 8953510-7 | | Heike Paulmann Koepfer | | Director | | Dividends paid | | Chilean pesos | | Chile | | | 253,168 | | | | — | | | | 351,490 | | | | — | |
| 0-E | | Plaza Lima Norte | | Company director relationship | | Leases paid | | Peruvian New Sol | | Peru | | | 940,167 | | | | (940,167 | ) | | | 614,638 | | | | (614,638 | ) |
| 0-E | | Plaza Lima Norte | | Company director relationship | | Utilities paid | | Peruvian New Sol | | Peru | | | 386,679 | | | | (386,679 | ) | | | 286,775 | | | | (286,775 | ) |
| 96.863.570-0 | | Inmobiliaria Mall Viña Del Mar S.A. | | Associate | | Leases paid | | Chilean pesos | | Chile | | | 2,844,602 | | | | (2,844,602 | ) | | | 2,990,827 | | | | (2,990,827 | ) |
| 96.863.570-0 | | Inmobiliaria Mall Viña Del Mar S.A. | | Associate | | Utilities Paid | | Chilean pesos | | Chile | | | 2,068,690 | | | | (2,068,690 | ) | | | 2,327,237 | | | | (2,327,237 | ) |
| 96.863.570-0 | | Inmobiliaria Mall Viña Del Mar S.A. | | Associate | | Dividends collected | | Chilean pesos | | Chile | | | 5,153,267 | | | | — | | | | 2,461,185 | | | | | |
| 96.863.570-0 | | Inmobiliaria Mall Viña Del Mar S.A. | | Associate | | Sale of goods | | Chilean pesos | | Chile | | | 39,915 | | | | 39,915 | | | | 8,901 | | | | 8,901 | |
| 77.209.070-6 | | Viña Cousiño Macul S.A. | | Common director | | Merchandise buying | | Chilean pesos | | Chile | | | 804,477 | | | | (804,477 | ) | | | 707,765 | | | | (707,765 | ) |
| 92.434.000-0 | | Besalco S.A. | | Common director | | Services provided | | Chilean pesos | | Chile | | | | | | | | | | | 307 | | | | (307 | ) |
| 92.147.000-2 | | Wenco S.A. | | Common director | | Merchandise buying | | Chilean pesos | | Chile | | | 1,916,998 | | | | (1,916,998 | ) | | | 2,506,186 | | | | (2,506,186 | ) |
| 92.147.000-2 | | Wenco S.A. | | Common director | | Sale of goods | | Chilean pesos | | Chile | | | 64,398 | | | | (64,398 | ) | | | 2,999 | | | | 2,999 | |
| 76.076.630-5 | | Maxi Kioskos Chile S.A. | | Company’s Director | | Leases collected | | Chilean pesos | | Chile | | | 402,676 | | | | 402,676 | | | | 478,364 | | | | 478,364 | |
| 76.076.630-5 | | Maxi Kioskos Chile S.A. | | Company’s Director | | Utilities collected | | Chilean pesos | | Chile | | | 183,740 | | | | 183,740 | | | | 231,157 | | | | 231,157 | |
F-85
| | | | | | | | | | | | | | | | | | | | | | | | | | |
| Transactions | |
Tax ID Number | | Company | | Name of
relationship | | Transaction
description | | Currency | | Country | | 12/31/2014 | | | Impact to
Income
(charge
/credit) | | | 12/31/2013 | | | Impact to
income
(charge
/credit) | |
| | | | | | | | | | | | | ThCh$ | | | ThCh$ | | | ThCh$ | | | ThCh$ | |
| 76.076.630-5 | | Maxi Kioskos Chile S.A. | | Company’s Director | | Utilities collected | | Chilean pesos | | Chile | | | | | | | | | | | 828 | | | | 828 | |
| 78.410.320-K | | Imp y Comercial Regen Ltda. | | Company’s Director | | Merchandise buying | | Chilean pesos | | Chile | | | 538,564 | | | | (538,564 | ) | | | 385,807 | | | | (385,807 | ) |
| 78.410.320-K | | Imp Y Comercial Regen Ltda. | | Company’s Director | | Leases collected | | Chilean pesos | | Chile | | | 188,315 | | | | 188,315 | | | | 231,442 | | | | 231,442 | |
| 78.410.320-K | | Imp Y Comercial Regen Ltda. | | Company’s Director | | Sale of goods | | Chilean pesos | | Chile | | | 19,795 | | | | 19,795 | | | | | | | | | |
| 78.410.320-K | | Imp Y Comercial Regen Ltda. | | Company’s Director | | Common expenses collected | | Chilean pesos | | Chile | | | 66,079 | | | | 66,079 | | | | 87,275 | | | | 87,275 | |
| 88.983.600-8 | | Teleductos S.A. | | Common director | | Leas collected | | Chilean pesos | | Chile | | | 119,447 | | | | (119,447 | ) | | | | | | | | |
| 88.983.600-8 | | Teleductos S.A. | | Common director | | Services provided | | Chilean pesos | | Chile | | | 703,940 | | | | (703,940 | ) | | | 939,346 | | | | (939,346 | ) |
| 88.983.600-8 | | Teleductos S.A. | | Common director | | Leases paid | | Chilean pesos | | Chile | | | 7,858 | | | | (7,858 | ) | | | | | | | | |
| 92.491.000-3 | | Labsa Inversiones Ltda. | | Company, director relationship | | Leases paid | | Chilean pesos | | Chile | | | 669,474 | | | | (669,474 | ) | | | 676,841 | | | | (676,841 | ) |
| 93.737.000-8 | | Manquehue Net S.A. | | Common director | | Services provided | | Chilean pesos | | Chile | | | 7,329 | | | | (7,329 | ) | | | 8,499 | | | | (8,499 | ) |
| 77.978.800-8 | | Neuralis Ltda. | | Company, director relationship | | Services provided | | Chilean pesos | | Chile | | | 13,026 | | | | (13,026 | ) | | | 5,769 | | | | (5,769 | ) |
| 96.566.940-K | | Agencias Universales S.A. | | Common director | | Services provided | | Chilean pesos | | Chile | | | 598,503 | | | | (598,503 | ) | | | 616,338 | | | | (616,338 | ) |
| 96.566.940-K | | Agencias Universales S.A. | | Common director | | Sale of goods | | Chilean pesos | | Chile | | | 18,001 | | | | 18,001 | | | | 22,206 | | | | 22,206 | |
| 92.580.000-7 | | Empresa Nacional de Telecomunicaciones S.A. | | Common director | | Services provided | | Chilean pesos | | Chile | | | 1,013,524 | | | | (1,013,524 | ) | | | 738,464 | | | | (738,464 | ) |
| 90.193.000-7 | | Empresa El Mercurio.S.A.P. | | Common director | | Sale of goods | | Chilean pesos | | Chile | | | 25,531 | | | | 25,531 | | | | 5,365 | | | | (5,365 | ) |
| 90.193.000-7 | | Empresa El Mercurio.S.A.P. | | Common director | | Leases paid | | Chilean pesos | | Chile | | | 203,185 | | | | 203,185 | | | | | | | | | |
| 90.193.000-7 | | Empresa El Mercurio.S.A.P. | | Common director | | Common expenses collected | | Chilean pesos | | Chile | | | 14,777 | | | | 14,777 | | | | | | | | | |
| 90.193.000-7 | | Empresa El Mercurio.S.A.P. | | Common director | | Services provided | | Chilean pesos | | Chile | | | 2,820,967 | | | | (2,820,967 | ) | | | 2,064,849 | | | | (2,064,849 | ) |
| 96.628.870-1 | | Entel Telefonia Local S.A. | | Common director | | Services provided | | Chilean pesos | | Chile | | | 49,413 | | | | (49,413 | ) | | | 18,019 | | | | (18,019 | ) |
| 96.806.980-2 | | Entel PCS Telecomunicaciones S.A. | | Common director | | Services provided | | Chilean pesos | | Chile | | | 304,780 | | | | (304,780 | ) | | | 134,992 | | | | (134,992 | ) |
| 96.806.980-2 | | Entel PCS Telecomunicaciones S.A. | | Common director | | Services provided | | Chilean pesos | | Chile | | | 8,180,454 | | | | (8,180,454 | ) | | | 12,753,566 | | | | (12,753,566 | ) |
| 96.566.940-K | | Cia Nacional de Telefonos, Telefonica del Sur S.A. | | Common director | | Services provided | | Chilean pesos | | Chile | | | 1,881 | | | | 1,881 | | | | — | | | | — | |
| 96.566.940-K | | Cia Nacional de Telefonos, Telefonica del Sur S.A. | | Common director | | Leas collected | | Chilean pesos | | Chile | | | — | | | | — | | | | 6,119 | | | | (6,119 | ) |
| 4773765-6 | | Cristian Eyzaguirre Johnston | | Common director | | Services provided | | Chilean pesos | | Chile | | | 103,676 | | | | (103,676 | ) | | | | | | | | |
| 96.628.870-1 | | Industria Productos Alimenticios S.A. | | Common director | | Merchandise buying | | Chilean pesos | | Chile | | | 1,062,352 | | | | (1,062,352 | ) | | | 1,245,503 | | | | (1,245,503 | ) |
| 79.675.370-5 | | Assets- Chile S.A. | | Common director | | Sale of goods | | Chilean pesos | | Chile | | | 4,958 | | | | 4,958 | | | | 906 | | | | (906 | ) |
| 70.649.100-7 | | Centros de Estudios Pùblicos | | Company, director relationship | | Services provided | | Chilean pesos | | Chile | | | 15,414 | | | | (15,414 | ) | | | 28,595 | | | | (28,595 | ) |
F-86
| | | | | | | | | | | | | | | | | | | | | | | | | | |
| Transactions | |
Tax ID Number | | Company | | Name of
relationship | | Transaction
description | | Currency | | Country | | 12/31/2014 | | | Impact to
Income
(charge
/credit) | | | 12/31/2013 | | | Impact to
income
(charge
/credit) | |
| | | | | | | | | | | | | ThCh$ | | | ThCh$ | | | ThCh$ | | | ThCh$ | |
| O-3 | | JetAviation Flight Services Inc. | | Company, director relationship | | Services provided | | Chilean pesos | | Chile | | | 675,534 | | | | (675,534 | ) | | | 1,144,040 | | | | (1,144,040 | ) |
| 92434000 | | Besalco S.A | | Common director | | Services provided | | Chilean pesos | | Chile | | | 1,753 | | | | (1,753 | ) | | | 307 | | | | (307 | ) |
| 88.417.000-1 | | Sky Airline S.A. | | Company, director relationship | | Leases collected | | Chilean pesos | | Chile | | | 11,654 | | | | 11,654 | | | | 15,141 | | | | 15,141 | |
| 88.417.000-1 | | Sky Airline S.A. | | Company, director relationship | | Other expenses collected | | Chilean pesos | | Chile | | | 3,922 | | | | 3,922 | | | | 5,632 | | | | 5,632 | |
| 88.417.000-1 | | Sky Airline S.A. | | Company, director relationship | | Compra pasajes aéreos | | Chilean pesos | | Chile | | | 46 | | | | (46 | ) | | | | | | | | |
| 79689080-0 | | Inversiones e Inmobiliaria Inmo Ltda. | | Company, director relationship | | Services provided | | Chilean pesos | | Chile | | | 300,000 | | | | 300,000 | | | | — | | | | — | |
F-87
Addition information required by SVS (Superintendencia de Valores y Seguros) as per communication N° 3592 dated January 31, 2014.
| a) | Transactions between the holding company Cencosud S.A and its direct and indirect subsidiaries. |
| | | | | | | | | | | | | | | | | | | | | | | | | | |
Tax ID
Number | | Company | | Nature of
relationship | | Transaction
description | | Currency | | Country | | 12/31/2013 | | | Impact to
income
(charge
/credit) | | | 12/31/2013 | | | Impact to
income
(charge
/credit) | |
| | | | | | | | | | | | | ThCh$ | | | ThCh$ | | | ThCh$ | | | ThCh$ | |
| 93.834.000-5 | | Cencosud Chile S.A. | | Common control | | Admin and operational fees | | Chilean peso | | Chile | | | 77,292,455 | | | | (77,292,455 | ) | | | 74,020,423 | | | | (74,020,423 | ) |
| 94.226.000-8 | | Cencosud Shopping Centers S.A. | | Common control | | Leases | | Chilean peso | | Chile | | | 63,018,336 | | | | (63,018,336 | ) | | | 61,551,936 | | | | (61,551,936 | ) |
| 94.226.000-8 | | Cencosud Shopping Centers S.A. | | Common control | | Utilities | | Chilean peso | | Chile | | | 17,232,385 | | | | (17,232,385 | ) | | | 17,799,619 | | | | (17,799,619 | ) |
| 84.671.700-5 | | Cencosud Retail S.A. | | Common control | | Leases | | Chilean peso | | Chile | | | 187,220 | | | | (187,220 | ) | | | 32,302 | | | | (32,302 | ) |
| 84.671.700-5 | | Cencosud Retail S.A. | | Common control | | Sales of inventory | | Chilean peso | | Chile | | | 14,794,721 | | | | (14,794,721 | ) | | | 14,163,609 | | | | (14,163,609 | ) |
| 78.410.990-8 | | Adm. del Centro Comercial Alto las Condes Ltda. | | Common control | | Utilities | | Chilean peso | | Chile | | | 23,826,124 | | | | (23,826,124 | ) | | | 25,658,822 | | | | (25,658,822 | ) |
| 96.671.750-5 | | Easy S.A. | | Common control | | Sale of inventory | | Chilean peso | | Chile | | | 970,790 | | | | (970,790 | ) | | | 1,845,056 | | | | (1,845,056 | ) |
| 78.410.310-2 | | Food & Fantasy Ltda. | | Common control | | Services rendered | | Chilean peso | | Chile | | | 30 | | | | (30 | ) | | | 3,893 | | | | (3,893 | ) |
| 99.500.840-8 | | Cencosud Administradora de Tarjetas S.A. | | Common control | | Admin and operational fees | | Chilean peso | | Chile | | | 506,013 | | | | (506,013 | ) | | | 533,173 | | | | (533,173 | ) |
| 96.732.790-5 | | Inmobiliaria Santa Isabel S.A. | | Common control | | Leases | | Chilean peso | | Chile | | | 475,751 | | | | (475,751 | ) | | | 455,555 | | | | (455,555 | ) |
| 99.566.580-8 | | Jumbo Administradora S.A. | | Common control | | Admin and operational fees | | Chilean peso | | Chile | | | 43,945,582 | | | | (43,945,582 | ) | | | 67,247,586 | | | | (67,247,586 | ) |
| 99.571.870-7 | | Jumbo Administradora Temuco S.A. | | Common control | | Admin and operational fees | | Chilean peso | | Chile | | | 13,470,106 | | | | (13,470,106 | ) | | | 21,795,347 | | | | (21,795,347 | ) |
| 88.235.500-4 | | Sociedad Comercial de Tiendas S.A. | | Common control | | Leases | | Chilean peso | | Chile | | | 4,520,709 | | | | (4,520,709 | ) | | | 4,728,446 | | | | (4,728,446 | ) |
| 76.365.580-6 | | Jumbo Administradora Norte S.A. | | Common control | | Admin and operational fees | | Chilean peso | | Chile | | | 20,024,368 | | | | (20,024,368 | ) | | | 26,976,444 | | | | (26,976,444 | ) |
| 76.365.590-3 | | Easy Administradora Norte S.A. | | Common control | | Admin and operational fees | | Chilean peso | | Chile | | | 6,691,396 | | | | (6,691,396 | ) | | | 10,276,427 | | | | (10,276,427 | ) |
| 76.433.310-1 | | Costanera Center S.A. | | Common control | | Easement | | Chilean peso | | Chile | | | 26,202,640 | | | | (26,202,640 | ) | | | 18,659,833 | | | | (18,659,833 | ) |
| 77.312.480-9 | | Administradora de Servicios Paris Ltda. | | Common control | | Commissions | | Chilean peso | | Chile | | | 9,826 | | | | (9,826 | ) | | | 7,013 | | | | (7,013 | ) |
| 76.476.830-2 | | Circulo Mas S.A. | | Common control | | Services rendered | | Chilean peso | | Chile | | | 29,187,114 | | | | (29,187,114 | ) | | | 23,252,183 | | | | (23,252,183 | ) |
| 76.568.660-1 | | Cencosud Administradora de Procesos S.A. | | Common control | | Admin and operational fees | | Chilean peso | | Chile | | | 2,356,186 | | | | (2,356,186 | ) | | | 1,882,904 | | | | (1,882,904 | ) |
| 76.023.825-2 | | Cencosud Servicios Integrales S.A. | | Common control | | Commissions | | Chilean peso | | Chile | | | 4,458,884 | | | | (4,458,884 | ) | | | 7,187,656 | | | | (7,187,656 | ) |
| 77.302.910-k | | Logística y Distribución Paris Ltda. | | Common control | | Admin and operational fees | | Chilean peso | | Chile | | | 5,000,345 | | | | (5,000,345 | ) | | | 5,000,345 | | | | (5,000,345 | ) |
| 78.448.780-6 | | Paris Administradora Sur Ltda. | | Common control | | Admin and operational fees | | Chilean peso | | Chile | | | 13,297,824 | | | | (13,297,824 | ) | | | 20,885,489 | | | | (20,885,489 | ) |
| 77.251.760-2 | | Jumbo Supermercados Administradora Ltda. | | Common control | | Admin and operational fees | | Chilean peso | | Chile | | | 65,019,331 | | | | (65,019,331 | ) | | | 4,462,799 | | | | (4,462,799 | ) |
| 77.779.000-5 | | Paris Administradora Ltda. | | Common control | | Admin and operational fees | | Chilean peso | | Chile | | | 63,740,691 | | | | (63,740,691 | ) | | | 56,355,833 | | | | (56,355,833 | ) |
| 76.819.580-3 | | Santa Isabel Administradora Norte Ltda. | | Common control | | Admin and operational fees | | Chilean peso | | Chile | | | 16,069,134 | | | | (16,069,134 | ) | | | 22,084,068 | | | | (22,084,068 | ) |
| 76.819.500-5 | | Santa Isabel Administradora Sur Ltda. | | Common control | | Admin and operational fees | | Chilean peso | | Chile | | | 13,775,048 | | | | (13,775,048 | ) | | | 19,589,136 | | | | (19,589,136 | ) |
F-88
| | | | | | | | | | | | | | | | | | | | | | | | | | |
Tax ID
Number | | Company | | Nature of
relationship | | Transaction
description | | Currency | | Country | | 12/31/2013 | | | Impact to
income
(charge
/credit) | | | 12/31/2013 | | | Impact to
income
(charge
/credit) | |
| | | | | | | | | | | | | ThCh$ | | | ThCh$ | | | ThCh$ | | | ThCh$ | |
| 79.829.500-4 | | Eurofashion Ltda. | | Common control | | Sale of inventory | | Chilean peso | | Chile | | | 15,672,569 | | | | (15,672,569 | ) | | | 16,120,799 | | | | (16,120,799 | ) |
| 76.062.794-1 | | Santa Isabel Administradora S.A. | | Common control | | Admin and operational fees | | Chilean peso | | China | | | 76,789,213 | | | | (76,789,213 | ) | | | 61,089,375 | | | | (61,089,375 | ) |
| O-E | | Cencosud (Shanghai) Trading Co., Ltd | | Common control | | Admin and operational fees | | Chilean peso | | Chile | | | 2,016,567 | | | | (2,016,567 | ) | | | 1,637,824 | | | | (1,637,824 | ) |
| 96.988.700-2 | | MegaJohnson’s Administradora S.A. | | Common control | | Admin and operational fees | | US dollar | | Chile | | | 10,536,486 | | | | (10,536,486 | ) | | | 5,648,963 | | | | (5,648,963 | ) |
| 76.190.379-9 | | Cencosud Retail Administradora Ltda. | | Common control | | Admin and operational fees | | Chilean peso | | Chile | | | 7,468,314 | | | | (7,468,314 | ) | | | 10,278,884 | | | | (10,278,884 | ) |
| 76.203.299-6 | | Comercializadora Costanera Center S.P.A. | | Common control | | Leases | | Chilean peso | | Chile | | | 5,934,388 | | | | (5,934,388 | ) | | | 6,365,437 | | | | (6,365,437 | ) |
| 76.203.299-6 | | Comercializadora Costanera Center S.P.A. | | Common control | | Utilities | | Chilean peso | | Chile | | | 3,118,535 | | | | (3,118,535 | ) | | | 2,578,189 | | | | (2,578,189 | ) |
| O-E | | Cencosud Argentina S.A. | | Common control | | Leases | | Argentine peso | | Argentina | | | 12,131,063 | | | | (12,131,063 | ) | | | 7,407,554 | | | | (7,407,554 | ) |
| O-E | | Cencosud Argentina S.A. | | Common control | | Utilities | | Argentine peso | | Argentina | | | 7,859,099 | | | | (7,859,099 | ) | | | 8,260,750 | | | | (8,260,750 | ) |
| O-E | | Cencosud Argentina S.A. | | Common control | | Sale of inventory | | Argentine peso | | Argentina | | | 1,513,651 | | | | (1,513,651 | ) | | | 4,892,716 | | | | (4,892,716 | ) |
| O-E | | Cencosud Argentina S.A. | | Common control | | Commissions | | Argentine peso | | Argentina | | | 14,519,700 | | | | (14,519,700 | ) | | | 13,874,286 | | | | (13,874,286 | ) |
| O-E | | Jumbo Retail Argentina S.A. | | Common control | | Leases | | Argentine peso | | Argentina | | | 209,253 | | | | (209,253 | ) | | | 528,900 | | | | (528,900 | ) |
| O-E | | Jumbo Retail Argentina S.A. | | Common control | | Sale of inventory | | Argentine peso | | Argentina | | | 9,189,946 | | | | (9,189,946 | ) | | | 9,336,677 | | | | (9,336,677 | ) |
| O-E | | Invor S.A. | | Common control | | Leases | | Argentine peso | | Argentina | | | 403,995 | | | | (403,995 | ) | | | 413,845 | | | | (413,845 | ) |
F-89
| b) | Financing activities between related parties and their conditions |
As of December 31, 2014
| | | | | | | | | | | | | | | | | | | | | | | | | | | | | | |
Grantor | | Tax ID | | Country | | Receiving entity | | Country | | Instrument | | Currency | | Rate | | | Loans granted
in local
currency | | | Settlements
made in local
currency | | | Grant date | | Maturity
date | |
| | | | | | | | | ThCh$ | | ThCh$ | | | | | | | | | | ThCh$ | | | ThCh$ | | ThCh$ | |
Cencosud S.A. | | 93.834.000-5 | | Chile | | Cencosud Retail S.A. | | Chile | | Fund transfer | | Chilean peso | | | — | | | | 1,929,125,918 | | | | 1,743,820,640 | | | Throughout 2014 | | | — | |
Cencosud S.A. | | 93.834.000-5 | | Chile | | Cencosud Shopping Centers S.A. | | Chile | | Fund transfer | | Chilean peso | | | — | | | | 60,092,367 | | | | 163,357,065 | | | Throughout 2014 | | | — | |
Cencosud S.A. | | 93.834.000-5 | | Chile | | Administradora Centro Comercial Alto Las Condes Ltda. | | Chile | | Fund transfer | | Chilean peso | | | — | | | | 51,327,427 | | | | 51,698,061 | | | Throughout 2014 | | | — | |
Cencosud S.A. | | 93.834.000-5 | | Chile | | Easy S.A. | | Chile | | Fund transfer | | Chilean peso | | | — | | | | 388,951,685 | | | | 369,675,430 | | | Throughout 2014 | | | — | |
Cencosud S.A. | | 93.834.000-5 | | Chile | | Comercial Food And Fantasy Ltda. | | Chile | | Fund transfer | | Chilean peso | | | — | | | | 2,108,623 | | | | 2,517,818 | | | Throughout 2014 | | | — | |
Cencosud S.A. | | 93.834.000-5 | | Chile | | Cencosud Internacional Ltda. | | Chile | | Prepaid capital contributions | | Chilean peso | | | — | | | | 331,950 | | | | 6,819,980 | | | Throughout 2014 | | | — | |
Cencosud S.A. | | 93.834.000-5 | | Chile | | Cencosud Internacional Ltda. | | Chile | | Prepaid capital contributions | | Chilean peso | | | — | | | | 20,014,602 | | | | — | | | Throughout 2014 | | | — | |
Cencosud S.A. | | 93.834.000-5 | | Chile | | Cencosud Administradora de Tarjetas S.A. | | Chile | | Fund transfer | | Chilean peso | | | — | | | | 899,565,998 | | | | 721,525,370 | | | Throughout 2014 | | | — | |
Cencosud S.A. | | 93.834.000-5 | | Chile | | Jumbo Administradora S.A. | | Chile | | Fund transfer | | Chilean peso | | | — | | | | 49,292,680 | | | | 56,012,535 | | | Throughout 2014 | | | — | |
Cencosud S.A. | | 93.834.000-5 | | Chile | | Jumbo Administradora Temuco S.A. | | Chile | | Fund transfer | | Chilean peso | | | — | | | | 17,720,641 | | | | 19,934,968 | | | Throughout 2014 | | | — | |
Cencosud S.A. | | 93.834.000-5 | | Chile | | Cencosud Corredora de Seguros Ltda. | | Chile | | Fund transfer | | Chilean peso | | | — | | | | 5,000 | | | | — | | | Throughout 2014 | | | — | |
Cencosud S.A. | | 93.834.000-5 | | Chile | | Sociedad Comercial de Tiendas S.A. | | Chile | | Fund transfer | | Chilean peso | | | — | | | | 5,149,197 | | | | 10,586,718 | | | Throughout 2014 | | | — | |
Cencosud S.A. | | 93.834.000-5 | | Chile | | Jumbo Administradora Norte Ltda. | | Chile | | Fund transfer | | Chilean peso | | | — | | | | 21,107,219 | | | | 26,639,139 | | | Throughout 2014 | | | — | |
Cencosud S.A. | | 93.834.000-5 | | Chile | | Easy Administradora Norte S.A. | | Chile | | Fund transfer | | Chilean peso | | | — | | | | 6,394,897 | | | | 8,446,053 | | | Throughout 2014 | | | — | |
Cencosud S.A. | | 93.834.000-5 | | Chile | | Costanera Centers S.A. | | Chile | | Fund transfer | | Chilean peso | | | — | | | | 35,737,812 | | | | 37,487,732 | | | Throughout 2014 | | | — | |
Cencosud S.A. | | 93.834.000-5 | | Chile | | Circulo Mas S.A. | | Chile | | Fund transfer | | Chilean peso | | | — | | | | 14,748,662 | | | | 13,505,310 | | | Throughout 2014 | | | — | |
Cencosud S.A. | | 93.834.000-5 | | Chile | | Cencosud Administradora de Procesos S.A. | | Chile | | Fund transfer | | Chilean peso | | | — | | | | 42,927,818 | | | | 27,048,407 | | | Throughout 2014 | | | — | |
Cencosud S.A. | | 93.834.000-5 | | Chile | | Cencosud Servicios Integrales S.A. | | Chile | | Fund transfer | | Chilean peso | | | — | | | | 78,802,594 | | | | 51,256,909 | | | Throughout 2014 | | | — | |
Cencosud S.A. | | 93.834.000-5 | | Chile | | Logistica y Distribución Paris Ltda. | | Chile | | Fund transfer | | Chilean peso | | | — | | | | 6,118,691 | | | | 5,575,325 | | | Throughout 2014 | | | — | |
Cencosud S.A. | | 93.834.000-5 | | Chile | | Paris Administradora Sur Ltda. | | Chile | | Fund transfer | | Chilean peso | | | — | | | | 23,227,011 | | | | 17,520,186 | | | Throughout 2014 | | | — | |
Cencosud S.A. | | 93.834.000-5 | | Chile | | Administradora y Comercial Puente Alto Ltda. | | Chile | | Fund transfer | | Chilean peso | | | — | | | | 49,437,476 | | | | 49,449,320 | | | Throughout 2014 | | | — | |
Cencosud S.A. | | 93.834.000-5 | | Chile | | Paris Administradora Ltda. | | Chile | | Fund transfer | | Chilean peso | | | — | | | | 89,256,845 | | | | 75,662,400 | | | Throughout 2014 | | | — | |
Cencosud S.A. | | 93.834.000-5 | | Chile | | Santa Isabel Administradora Norte S.A. | | Chile | | Fund transfer | | Chilean peso | | | — | | | | 19,738,757 | | | | 23,973,062 | | | Throughout 2014 | | | — | |
Cencosud S.A. | | 93.834.000-5 | | Chile | | Santa Isabel Administradora Sur S.A. | | Chile | | Fund transfer | | Chilean peso | | | — | | | | 13,392,970 | | | | 16,887,329 | | | Throughout 2014 | | | — | |
Cencosud S.A. | | 93.834.000-5 | | Chile | | Eurofashion Ltda. | | Chile | | Fund transfer | | Chilean peso | | | — | | | | 57,668,729 | | | | 44,461,984 | | | Throughout 2014 | | | — | |
Cencosud S.A. | | 93.834.000-5 | | Chile | | Santa Isabel Administradora S.A. | | Chile | | Fund transfer | | Chilean peso | | | — | | | | 90,589,806 | | | | 78,806,585 | | | Throughout 2014 | | | — | |
Cencosud S.A. | | 93.834.000-5 | | Chile | | Administradora TMO S.A. | | Chile | | Fund transfer | | Chilean peso | | | — | | | | 1,204,953 | | | | 586,498 | | | Throughout 2014 | | | — | |
Cencosud S.A. | | 93.834.000-5 | | Chile | | Sociedad Comercializadora de Vestuario FES Ltda. | | Chile | | Fund transfer | | Chilean peso | | | — | | | | 23,521 | | | | 14,754 | | | Throughout 2014 | | | — | |
Cencosud S.A. | | 93.834.000-5 | | Chile | | MegaJohnson’s Puente Alto S.A. | | Chile | | Fund transfer | | Chilean peso | | | — | | | | 2,000 | | | | — | | | Throughout 2014 | | | — | |
Cencosud S.A. | | 93.834.000-5 | | Chile | | MegaJohnson’s S.A. | | Chile | | Fund transfer | | Chilean peso | | | — | | | | 1,441,420 | | | | 323,255 | | | Throughout 2014 | | | — | |
Cencosud S.A. | | 93.834.000-5 | | Chile | | MegaJohnson’s Maipú S.A. | | Chile | | Fund transfer | | Chilean peso | | | — | | | | 629 | | | | 150,887 | | | Throughout 2014 | | | — | |
Cencosud S.A. | | 93.834.000-5 | | Chile | | MegaJohnson’s Puente S.A. | | Chile | | Fund transfer | | Chilean peso | | | — | | | | 2,850 | | | | — | | | Throughout 2014 | | | — | |
Cencosud S.A. | | 93.834.000-5 | | Chile | | Paris Administradora Centro Ltda. | | Chile | | Fund transfer | | Chilean peso | | | — | | | | | | | | | | | Throughout 2014 | | | — | |
Cencosud S.A. | | 93.834.000-5 | | Chile | | MegaJohnson’s Viña del Mar S.A. | | Chile | | Fund transfer | | Chilean peso | | | — | | | | 399,591 | | | | — | | | Throughout 2014 | | | — | |
Cencosud S.A. | | 93.834.000-5 | | Chile | | Paris Administradora Norte Ltda. | | Chile | | Fund transfer | | Chilean peso | | | — | | | | | | | | | | | Throughout 2014 | | | — | |
Cencosud S.A. | | 93.834.000-5 | | Chile | | MegaJohnson’s Administradora S.A. | | Chile | | Fund transfer | | Chilean peso | | | — | | | | 14,087,470 | | | | 17,195,686 | | | Throughout 2014 | | | — | |
Cencosud S.A. | | 93.834.000-5 | | Chile | | MegaJohnson’s Quilin S.A. | | Chile | | Fund transfer | | Chilean peso | | | — | | | | 7,750 | | | | — | | | Throughout 2014 | | | — | |
Cencosud S.A. | | 93.834.000-5 | | Chile | | Johnson’s Mega San Bernardo S.A. | | Chile | | Fund transfer | | Chilean peso | | | — | | | | 2,050 | | | | — | | | Throughout 2014 | | | — | |
Cencosud S.A. | | 93.834.000-5 | | Chile | | Cencosud Retail Administradora S.A. | | Chile | | Fund transfer | | Chilean peso | | | — | | | | 32,170,084 | | | | 58,542,991 | | | Throughout 2014 | | | — | |
Cencosud S.A. | | 93.834.000-5 | | Chile | | Comercializadora Contanera Center SPA | | Chile | | Fund transfer | | Chilean peso | | | — | | | | 45,406,534 | | | | 41,685,605 | | | Throughout 2014 | | | — | |
Cencosud S.A. | | 93.834.000-5 | | Chile | | Cencosud Internacional Argentina Spa | | Chile | | Fund transfer | | Chilean peso | | | | | | | 66,845 | | | | — | | | — | | | — | |
F-90
| | | | | | | | | | | | | | | | | | | | | | | | | | | | | | |
Grantor | | Tax ID | | Country | | Receiving entity | | Country | | Instrument | | Currency | | Rate | | | Loans granted
in local
currency | | | Settlements
made in local
currency | | | Grant date | | Maturity
date | |
| | | | | | | | | ThCh$ | | ThCh$ | | | | | | | | | | ThCh$ | | | ThCh$ | | ThCh$ | |
Cencosud S.A. | | 93.834.000-5 | | Chile | | Cencosud Corredora de Seguros Ltda. | | Chile | | Fund transfer | | Chilean peso | | | | | | | 22,329 | | | | — | | | | | | | |
Cencosud Brasil Comercial | | 93.834.000-5 | | Chile | | PERINI | | Chile | | Fund transfer | | Reales | | | 125% CDI | | | | 2,990 | | | | — | | | | | | | |
Cencosud Brasil Comercial | | O-E | | Argentina | | Mercantil Rodriguez | | Chile | | Loan | | Reales | | | 125% CDI | | | | — | | | | 8,780 | | | | | | | |
Cencosud Perú S.A. | | O-E | | Brasil | | E.Wong S.A. | | Chile | | Loan | | Sol Peruano | | | fixed 18,50% | | | | — | | | | 6,645 | | | | | | | |
Cencosud Perú S.A. | | O-E | | Brasil | | Cencosud Retail Perú S.A. | | Chile | | Loan | | Sol Peruano | | | fixed 18,50% | | | | — | | | | 12,737 | | | 05/09/2014 | | | 04/03/2015 | |
Cencosud Perú S.A. | | 93.834.000-5 | | Chile | | Tres Palmeras SA | | Chile | | Loan | | Sol Peruano | | | fixed 18,50% | | | | | | | | 3,098 | | | 18/11/2014 | | | 17/05/2015 | |
Cencosud Perú S.A. | | O-E | | Perú | | Cencosud Retail Perú S.A. | | Chile | | Loan | | US Dollar | | | fixed 3,0% | | | | — | | | | 1,275 | | | 22/09/2014 | | | 22/09/2015 | |
Cencosud S.A. | | O-E | | Perú | | Cencosud Perú S.A. | | Chile | | Loan | | US Dollar | | | fixed 7,66% | | | | — | | | | 30,000 | | | 01/02/2011 | | | 14/08/2017 | |
Unicenter SA | | O-E | | Perú | | Agrojumbo SA | | Chile | | Loan | | Argentine peso | | | fixed 18,50% | | | | 1,795 | | | | — | | | 07/09/2014 | | | 06/03/2015 | |
Unicenter SA | | O-E | | Perú | | Agrojumbo SA | | Chile | | Loan | | Argentine peso | | | fixed 18,50% | | | | 4,583 | | | | — | | | 14/09/2014 | | | 13/03/2015 | |
Jumbo | | O-E | | Argentina | | Cavas y Viñas El Acequión | | Chile | | Loan | | Argentine peso | | | fixed 18,50% | | | | 122 | | | | — | | | 05/09/2014 | | | 04/03/2015 | |
Jumbo | | O-E | | Perú | | Cavas y Viñas El Acequión | | Chile | | Loan | | Argentine peso | | | fixed 18,50% | | | | 124 | | | | — | | | 18/11/2014 | | | 17/05/2015 | |
Jumbo | | O-E | | Perú | | Cavas y Viñas El Acequión | | Chile | | Loan | | Argentine peso | | | fixed 18,50% | | | | 436 | | | | — | | | 31/08/2014 | | | 27/02/2015 | |
Agropecuaria Anjullón | | O-E | | Perú | | Cavas y Viñas El Acequión | | Chile | | Loan | | Argentine peso | | | fixed 18,50% | | | | 104 | | | | — | | | 16/09/2014 | | | 15/03/2015 | |
Agropecuaria Anjullón | | O-E | | Perú | | Cavas y Viñas El Acequión | | Chile | | Loan | | Argentine peso | | | fixed 18,50% | | | | 104 | | | | — | | | 25/09/2014 | | | 24/03/2015 | |
F-91
| 9.4 | Board of Directors and key management of the Company |
The Board of Directors as of December 31, 2014 is comprised of the following people:
| | | | |
Board of directors | | Role | | Profession |
| Horst Paulmann Kemna | | Chairman | | Businessman |
| Heike Paulmann Koepfer | | Director | | Commercial Engineer |
| Peter Paulmann Koepfer | | Director | | Commercial Engineer |
| Roberto Oscar Philipps | | Director | | National Public Accountant |
| Cristian Eyzaguirre Johnston | | Director | | Economist |
| Richard Bûchi Buc | | Director | | Civil Engineer |
| Erasmo Wong Lu | | Director | | Civil Engineer |
| David Gallagher Patrickson | | Director | | Economist |
| Julio Moura Neto | | Director | | Engineer |
Key management of the Company as of December 31, 2014 is composed of the following people:
| | | | |
Senior management | | Position | | Profession |
| Daniel Rodríguez | | Chief Executive Officer | | Forest Engineer |
| Carlos Mechetti | | General Counsel | | Attorney at law |
| Bronislao Jandzio | | Audit Managing Director | | Business Administrator |
| Pablo Castillo | | Supermarket Managing Director | | Commercial Engineer |
| Carlos Wulf | | Home Improvement Stores Managing Director | | Naval Engineer |
| Renato Fernández | | Corporate Affairs Manager | | Journalist |
| Jaime Soler | | Department Stores Managing Director | | Commercial Engineer |
| Marcelo Reyes | | Corporate Risk Managing Director | | Commercial Engineer |
| Patricio Rivas | | Financial Retail Managing Director | | Commercial Engineer |
| Pietro Illuminati | | Procurement Director | | Industrial Engineer |
| Rodrigo Hetz | | Human Resources Director | | Industrial Engineer |
| Andres Artigas | | Chief Information Officer | | Industrial Engineer |
| Juan Manuel Parada | | Chief Financial Officer | | Business Administrator |
| Stepan Krause | | Projects Managing Director | | Commercial Engineer |
| Rodrigo Larrain | | Shopping Centers Managing Director | | Industrial Engineer |
| 9.5 | Board of Directors compensation |
In accordance with Article 33 of Law N° 18,046 in regards to Corporations, the Ordinary Shareholders’ Meeting held on April 25, 2014, set the following amounts for the 2014 period:
| • | | Fees paid for attending Board sessions: payment of UF 330 (equivalents to ThCh$ 8,127) each month for those holding the position of Director of the Board and twice this amount for the President of the Board, if and only if they attend a minimum of 10 ordinary sessions each year. |
| • | | Fees paid for attending the Directors’ Committee: payment to each Director of UF 110( equivalents to ThCh$ 2,709) for each session they attend. |
F-92
The details of the amount paid to Directors for the years ended December 31, 2014, 2013 and 2012, are as follows:
| | | | | | | | | | | | | | |
| | | | | For the year ended December 31, | |
Name | | Role | | 2014 | | | 2013 | | | 2012 | |
| | | | | ThCh$ | | | ThCh$ | | | ThCh$ | |
Horst Paulmann Kemna | | Chairman | | | 184,487 | | | | 147,291 | | | | 104,146 | |
Heike Paulmann Koepfer | | Director | | | 92,243 | | | | 73,646 | | | | 57,292 | |
Peter Paulmann Koepfer | | Director | | | 92,243 | | | | 73,646 | | | | 52,072 | |
Cristián Eyzaguirre Johnston | | Director | | | 92,243 | | | | 79,771 | | | | 69,453 | |
Roberto Oscar Philipps | | Director | | | 122,991 | | | | 98,225 | | | | 69,453 | |
Sven von Appen Behmann | | Director | | | — | | | | 18,283 | | | | 52,072 | |
Erasmo Wong Lu Vega | | Director | | | 92,243 | | | | 73,646 | | | | 52,072 | |
David Gallagher Patrickson | | Director | | | 122,991 | | | | 98,225 | | | | 69,453 | |
Julio Moura | | Director | | | 92,243 | | | | 73,646 | | | | 52,072 | |
Richard Bûchi Buc | | Director | | | 122,991 | | | | 73,816 | | | | — | |
| | | | | | | | | | | | | | |
Total | | | | | 1,014,675 | | | | 810,195 | | | | 578,085 | |
| | | | | | | | | | | | | | |
(*)
On November 13, 2014 the Company communicated a material event reporting that on that date, Mr. Daniel Rodriguez Cofré, has submitted to Cencosud´s Board of Directors his resignation as Chief Executive Officer, effective on December 31, 2014.
The Board appointed Mr. Jaime Soler Bottinelli as new Corporative Chief Executive Officer since January 1, 2015.
| 9.6 | Compensation paid to senior management |
| | | | | | | | | | | | |
| | | For the year ended December 31, | |
Key management compensation | | 2014 | | | 2013 | | | 2012 | |
| | | ThCh$ | | | ThCh$ | | | ThCh$ | |
Salary and other short term employee benefits | | | 5,195,504 | | | | 6,255,270 | | | | 5,715,000 | |
Shares—based payments | | | 612,501 | | | | 983,730 | | | | 445,717 | |
| | | | | | | | | | | | |
| | | |
Total | | | 5,808,005 | | | | 7,239,000 | | | | 6,160,717 | |
| | | | | | | | | | | | |
The Cencosud Group has established an incentive plan, which rewards management for the achievement of individual objectives in the achievement of the company’s results. These incentives are structured as a minimum and a maximum of gross compensation and are paid once a year.
The composition of this item as of December 31, 2014 and 2013 is as follows:
| | | | | | | | |
| | | As of December 31, | |
Inventory category | | 2014 | | | 2013 | |
| | | ThCh$ | | | ThCh$ | |
Raw materials | | | 6,804,775 | | | | 5,948,240 | |
Goods | | | 1,239,757,189 | | | | 1,152,071,765 | |
Finished Goods | | | 235,448 | | | | 793,111 | |
Provisions | | | (152,187,829 | ) | | | (113,906,489 | ) |
| | | | | | | | |
| | |
Total | | | 1,094,609,583 | | | | 1,044,906,627 | |
| | | | | | | | |
F-93
The composition of inventories by business line as of December 31, 2014 and 2013 is as follows:
| | | | | | | | | | | | | | | | |
| | | As of December 31, 2014 | |
Inventory category | | Department
stores | | | Supermarkets | | | Home
improvement | | | Total | |
| | | ThCh$ | | | ThCh$ | | | ThCh$ | | | ThCh$ | |
Raw material | | | 2,116,044 | | | | 4,688,732 | | | | — | | | | 6,804,776 | |
Goods | | | 153,451,257 | | | | 695,663,533 | | | | 238,454,570 | | | | 1,087,569,360 | |
Finished Goods | | | — | | | | 235,447 | | | | — | | | | 235,447 | |
| | | | | | | | | | | | | | | | |
| | | | |
Total | | | 155,567,301 | | | | 700,587,712 | | | | 238,454,570 | | | | 1,094,609,583 | |
| | | | | | | | | | | | | | | | |
| | | | | | | | | | | | | | | | |
| | | As of December 31, 2013 | |
Inventory category | | Department
stores | | | Supermarkets | | | Home
improvement | | | Total | |
| | | ThCh$ | | | ThCh$ | | | ThCh$ | | | ThCh$ | |
Raw material | | | 1,856,890 | | | | 4,091,350 | | | | — | | | | 5,948,240 | |
Goods | | | 178,369,821 | | | | 651,423,279 | | | | 208,372,176 | | | | 1,038,165,276 | |
Finished Goods | | | — | | | | 793,111 | | | | — | | | | 793,111 | |
| | | | | | | | | | | | | | | | |
| | | | |
Total | | | 180,226,711 | | | | 656,307,740 | | | | 208,372,176 | | | | 1,044,906,627 | |
| | | | | | | | | | | | | | | | |
The Company periodically assesses its inventories at their net realizable value, by separating the inventory for each line of business and verifying the age, inventory turnover, sales prices and seasonality. Any adjustments are carried against income of the period.
The goods included in inventory are valued between the purchase price or production cost, net of allowance for obsolescence and net realizable value.
The carrying amount of inventories carried at December 31, 2014 and December 31, 2013 to its net realizable value less selling costs, provides for:
Current Inventories:
| | | | | | | | |
Inventories at net realizable value | | Inventories at net realizable
as of December 31, | |
| | 2014 | | | 2013 | |
| | | ThCh$ | | | ThCh$ | |
Inventory | | | 59,318,630 | | | | 46,104,966 | |
| | | | | | | | |
Total | | | 59,318,630 | | | | 46,104,966 | |
| | | | | | | | |
| | | | | | | | |
| | | Balance as of December 31, | |
Net realizable value movements | | 2014 | | | 2013 | |
| | | ThCh$ | | | ThCh$ | |
Beginning Balance | | | 46,104,966 | | | | 43,659,617 | |
Increase of Inventory to NRV (Net Realizable Value) | | | 20,798,098 | | | | 8,619,110 | |
Decrease of Inventory to NRV (Net Realizable Value) | | | (7,584,434 | ) | | | (6,173,761 | ) |
Acquisitions through Business combinations | | | . | | | | . | |
| | | | | | | | |
Total | | | 59,318,630 | | | | 46,104,966 | |
| | | | | | | | |
F-94
Other information relevant to inventory:
| | | | | | | | | | | | |
| | | For the periods between | |
Additional information inventory | | 01/01/2014
12/31/2014 | | | 01/01/2013
12/31/2013 | | | 01/01/2012
12/31/2012 | |
| | | ThCh$ | | | ThCh$ | | | ThCh$ | |
Cost of inventories recognized as expenses during the year | | | 7,377,823,134 | | | | 6,922,055,443 | | | | 6,318,469,948 | |
Provision movements:
| | | | | | | | |
| | | Balance as of December 31, | |
Provisions | | 2014 | | | 2013 | |
| | | ThCh$ | | | ThCh$ | |
Beginning Balance | | | 113,906,489 | | | | 112,639,609 | |
Amount of sales of inventory | | | 47,902,756 | | | | 12,822,726 | |
Amount of reversals of inventory reductions | | | (9,621,416 | ) | | | (11,555,846 | ) |
| | | | | | | | |
| | |
Total | | | 152,187,829 | | | | 113,906,489 | |
| | | | | | | | |
The circumstances or events that led to the reversal of any write-down of inventories at December 31, 2014 and 2013, relate mainly to liquidations and auctions to recover more value from the estimated net realizable value for inventories.
The Company has not given inventories as collaterals at the end of the year.
F-95
| 11 | Investments in associates recorded following the equity method |
| 11.1. | Breakdown of investments in associates |
The composition of the item as of December 31, 2014 and 2013, as well as other related information is as follows:
| | | | | | | | | | | | | | | | | | | | | | | | | | | | | | | | |
Investments in associates | | Country
Of origin | | Functional
currency | | Ownership
percentage | | | Voting power
percentage | | | Balance
as of
December 31,
2013 | | | Participation
in profit or
loss of equity
method | | | Translation
difference | | | Other increase
(decrease)(*) | | | Balance
as of
December 31,
2014 | |
| | | | | | | % | | | % | | | ThCh$ | | | ThCh$ | | | ThCh$ | | | ThCh$ | | | ThCh$ | |
Loyalti del Perú S.A.C. | | Peru | | Peruvian Nuevo Sol | | | 42.50 | | | | 42.50 | | | | 860,815 | | | | 170,050 | | | | 66,543 | | | | (344,981 | ) | | | 752,427 | |
Carnes Huinca S.A. | | Argentina | | Argentine Pesos | | | 50.00 | | | | 50.00 | | | | 192,079 | | | | (133,810 | ) | | | (58,269 | ) | | | — | | | | — | |
Inmobiliaria Mall Viña del Mar S.A. | | Chile | | Chilean Pesos | | | 33.33 | | | | 33.33 | | | | 48,889,260 | | | | 6,171,966 | | | | — | | | | (3,565,739 | ) | | | 51,495,487 | |
| | | | | | | | | | | | | | | | | | | | | | | | | | | | | | | | |
| | | | | | | | | |
Total | | | | | | | | | | | | | | | 49,942,154 | | | | 6,208,206 | | | | 8,274 | | | | (3,910,720 | ) | | | 52,247,914 | |
The composition of the item as of December 31, 2013 and 2012, as well as other related information is as follows:
| | | | | | | | | | | | | | | | | | | | | | | | | | | | | | | | |
Investments in associates | | Country
Of origin | | Functional
currency | | Ownership
percentage | | | Voting power
percentage | | | Balance
as of
December 31,
2012 | | | Participation
in profit or
loss of equity
method | | | Translation
difference | | | Other increase
(decrease) | | | Balance
as of
December 31,
2013 | |
| | | | | | | % | | | % | | | ThCh$ | | | ThCh$ | | | ThCh$ | | | ThCh$ | | | ThCh$ | |
Loyalti del Perú S.A.C. | | Peru | | Peruvian Nuevo Sol | | | 42.50 | | | | 42.50 | | | | 717,843 | | | | 142,475 | | | | 497 | | | | — | | | | 860,815 | |
Carnes Huinca S.A. | | Argentina | | Argentine Pesos | | | 50.00 | | | | 50.00 | | | | 207,360 | | | | 23,037 | | | | (38,318 | ) | | | — | | | | 192,079 | |
Inmobiliaria Mall Viña del Mar S.A. | | Chile | | Chilean Pesos | | | 3.33 | | | | 33.33 | | | | 41,335,198 | | | | 10,123,927 | | | | — | | | | (2,569,865 | ) | | | 48,889,260 | |
| | | | | | | | | | | | | | | | | | | | | | | | | | | | | | | | |
| | | | | | | | | |
Total | | | | | | | | | | | | | | | 42,260,401 | | | | 10,289,439 | | | | (37,821 | ) | | | (2,569,865 | ) | | | 49,942,154 | |
| | | | | | | | | | | | | | | | | | | | | | | | | | | | | | | | |
| (*) | Decreases represent dividends received from associates. |
F-96
The composition of the item as of December 31, 2012 and 2011, as well as other related information is as follows:
| | | | | | | | | | | | | | | | | | | | | | | | | | | | | | | | |
Investments in associates | | Country
of origin | | Functional
currency | | Ownership
percentage | | | Voting power
percentage | | | Balance
as of
December 31,
2011 | | | Participation
in profit or
loss of
equity
method | | | Translation
difference | | | Other increase
(decrease) | | | Balance
as of
December 31,
2012 | |
| | | | | | | % | | | % | | | ThCh$ | | | ThCh$ | | | ThCh$ | | | ThCh$ | | | ThCh$ | |
Loyalti del Perú S.A.C. | | Peru | | Peruvian Nuevo Sol | | | 42.50 | | | | 42.50 | | | | 935,477 | | | | 97,534 | | | | (315,168 | ) | | | — | | | | 717,843 | |
Carnes Huinca S.A. | | Argentina | | Argentine Pesos | | | 50.00 | | | | 50.00 | | | | (14,578 | ) | | | 801 | | | | 27,234 | | | | 248,371 | | | | 207,360 | |
Inmobiliaria Mall Viña del Mar S.A. | | Chile | | Chilean Pesos | | | 33.33 | | | | 33.33 | | | | 37,897,834 | | | | 5,544,077 | | | | — | | | | (2,106,713 | ) | | | 41,335,198 | |
| | | | | | | | | | | | | | | | | | | | | | | | | | | | | | | | |
Total | | | | | | | | | | | | | | | 38,818,733 | | | | 5,642,412 | | | | (342,402 | ) | | | (1,858,342 | ) | | | 42,260,401 | |
| | | | | | | | | | | | | | | | | | | | | | | | | | | | | | | | |
F-97
Set out above are the associates of the group as at 31 December 2014, which, in the opinion of the directors, are material to the group. The associates as listed above have share capital consisting solely of ordinary shares, which are held directly by the group; the country of incorporation or registration is also their principal place of business.
There are no contingent liabilities relating to the group’s interest in the associates
The associates listed above are private companies and there is no quoted market price available for their shares.
| 11.2 | Relevant summarized information with regards to associates |
The information below reflects the amounts presented in the financial statements of the associates adjusted for differences in accounting policies between the group and the associates.
The information regarding investments in associates as of December 31, 2014 is as follows:
| | | | | | | | | | | | | | | | | | | | | | | | | | | | | | | | |
| | | At December 31, 2014 | |
Investments in associates | | Interest | | | Current
assets | | | Non-current
assets | | | Current
liabilities | | | Non-current
liabilities | | | Ordinary
income | | | Ordinary
expense | | | Net gain
(loss) | |
| | | % | | | ThCh$ | | | ThCh$ | | | ThCh$ | | | ThCh$ | | | ThCh$ | | | ThCh$ | | | ThCh$ | |
Loyalti del Perú S.A.C. | | | 42.5 | | | | 5,156,260 | | | | 220,255 | | | | 982,387 | | | | 2,623,712 | | | | 7,581,053 | | | | 7,180,935 | | | | 400,118 | |
Carnes Huinca S.A. | | | 50.00 | | | | 129,358 | | | | 160,144 | | | | 1,719,006 | | | | — | | | | 467,017 | | | | 734,637 | | | | (267,620 | ) |
Inmobiliaria Mall Viña del Mar S.A. | | | 33.33 | | | | 33,586,345 | | | | 244,982,888 | | | | 13,689,029 | | | | 110,370,471 | | | | 24,660,719 | | | | (2,424,743 | ) | | | 18,517,750 | |
| | | | | | | | |
Total | | | | | | | 38,871,963 | | | | 245,363,287 | | | | 16,390,422 | | | | 112,994,183 | | | | 32,708,789 | | | | 5,490,829 | | | | 18,650,248 | |
The information regarding investments in associates as of December 31, 2013 is as follows:
| | | | | | | | | | | | | | | | | | | | | | | | | | | | | | | | |
| | | At December 31, 2013 | |
Investments in associates | | Interest | | | Current
assets | | | Non-current
assets | | | Current
liabilities | | | Non-current
liabilities | | | Ordinary
income | | | Ordinary
expense | | | Net gain
(loss) | |
| | | % | | | ThCh$ | | | ThCh$ | | | ThCh$ | | | ThCh$ | | | ThCh$ | | | ThCh$ | | | ThCh$ | |
Loyalti del Perú S.A.C. | | | 42.5 | | | | 4,003,056 | | | | 258,207 | | | | 834,033 | | | | 1,401,782 | | | | 8,516,202 | | | | 8,180,967 | | | | 335,235 | |
Carnes Huinca S.A. | | | 50.00 | | | | 335,846 | | | | 190,382 | | | | 142,070 | | | | — | | | | 2,016,399 | | | | 1,970,325 | | | | 46,074 | |
Inmobiliaria Mall Viña del Mar S.A. | | | 33.33 | | | | 13,095,417 | | | | 216,495,332 | | | | 13,619,985 | | | | 69,288,315 | | | | 22,338,980 | | | | (8,035,837 | ) | | | 30,374,817 | |
| | | | | | | | | | | | | | | | | | | | | | | | | | | | | | | | |
| | | | | | | | |
Total | | | | | | | 17,434,319 | | | | 216,943,921 | | | | 14,596,088 | | | | 70,690,097 | | | | 32,871,581 | | | | 2,115,455 | | | | 30,756,126 | |
| | | | | | | | | | | | | | | | | | | | | | | | | | | | | | | | |
F-98
The information regarding investments in associates as of December 31, 2012 is as follows:
| | | | | | | | | | | | | | | | | | | | | | | | | | | | | | | | |
| | | At December 31, 2012 | |
Investments in associates | | Interest | | | Current
assets | | | Non-current
assets | | | Current
liabilities | | | Non-current
liabilities | | | Ordinary
income | | | Ordinary
expense | | | Net gain
(loss) | |
| | | % | | | ThCh$ | | | ThCh$ | | | ThCh$ | | | ThCh$ | | | ThCh$ | | | ThCh$ | | | ThCh$ | |
Loyalti del Perú S.A.C. | | | 42.5 | | | | 4,183,697 | | | | 204,230 | | | | 829,610 | | | | 1,869,275 | | | | 6,203,947 | | | | 5,974,455 | | | | 229,492 | |
Carnes Huinca S.A. | | | 50.00 | | | | 254,780 | | | | 263,165 | | | | 103,225 | | | | | | | | 1,882,828 | | | | 1,881,226 | | | | 1,602 | |
Inmobiliaria Mall Viña del Mar S.A. | | | 33.33 | | | | 5,681,797 | | | | 190,702,140 | | | | 11,181,517 | | | | 61,184,425 | | | | 21,313,956 | | | | 4,680,062 | | | | 16,633,894 | |
| | | | | | | | | | | | | | | | | | | | | | | | | | | | | | | | |
| | | | | | | | |
Total | | | | | | | 10,120,274 | | | | 191,169,535 | | | | 12,114,352 | | | | 63,053,700 | | | | 29,400,731 | | | | 12,535,743 | | | | 16,864,988 | |
| | | | | | | | | | | | | | | | | | | | | | | | | | | | | | | | |
| 12 | Intangible assets other than goodwill |
Intangible assets are mainly composed of software and brands acquired in business combinations. The detail as of December 31, 2014 and 2013 is as follows:
| | | | | | | | |
| | | As of December 31, | |
Intangibles assets other than goodwill net | | 2014 | | | 2013 | |
| | | ThCh$ | | | ThCh$ | |
Finite life intangible assets, net | | | 125,471,527 | | | | 101,181,642 | |
Indefinite life intangible assets, net | | | 275,070,653 | | | | 470,439,865 | |
| | | | | | | | |
| | |
Intangible assets, net | | | 400,542,180 | | | | 571,621,507 | |
| | | | | | | | |
| | |
Patents, Trade Marks and Other Rights, Net | | | 275,070,653 | | | | 470,439,865 | |
Software (IT) | | | 88,441,290 | | | | 61,048,198 | |
Other Identifiable Intangible Assets, net | | | 37,030,237 | | | | 40,133,444 | |
| | | | | | | | |
| | |
Identifiable Intangible Assets, Net | | | 400,542,180 | | | | 571,621,507 | |
| | | | | | | | |
| |
| | | As of December 31, | |
Intangibles assets other than goodwill gross | | 2014 | | | 2013 | |
| | | ThCh$ | | | ThCh$ | |
Finite life intangible assets, Gross | | | 216,527,275 | | | | 175,222,015 | |
Indefinite life intangible assets, Gross | | | 275,070,653 | | | | 470,439,865 | |
| | | | | | | | |
| | |
Intangible Assets, Gross | | | 491,597,928 | | | | 645,661,880 | |
| | | | | | | | |
| | |
Patents, Trade Marks and Other Rights, Gross | | | 275,070,653 | | | | 470,439,865 | |
Software (IT) | | | 160,757,436 | | | | 118,664,961 | |
Other Identifiable Intangible Assets, Gross | | | 55,769,839 | | | | 56,557,054 | |
| | | | | | | | |
| | |
Identifiable Intangible Assets, Gross | | | 491,597,928 | | | | 645,661,880 | |
| | | | | | | | |
F-99
| | | | | | | | |
| | | As of December 31, | |
Accumulated amortization and value impairment | | 2014 | | | 2013 | |
| | | ThCh$ | | | ThCh$ | |
Finite life intangible assets | | | (91,055,748 | ) | | | (74,040,373 | ) |
Indefinite life intangible assets | | | — | | | | — | |
| | | | | | | | |
| | |
Intangible Assets, Gross | | | (91,055,748 | ) | | | (74,040,373 | ) |
| | | | | | | | |
| | |
Software (IT) | | | (72,316,146 | ) | | | (57,616,763 | ) |
Other Identifiable Intangible Assets | | | (18,739,602 | ) | | | (16,423,610 | ) |
| | | | | | | | |
| | |
Accumulated amortization and value impairment | | | (91,055,748 | ) | | | (74,040,373 | ) |
| | | | | | | | |
Other identifiable intangible assets mainly correspond to customer’s data base.
The Group performs an annual recoverability analysis, according to the criteria described in note 2.11 “under Impairment loss of non financial assets IAS 36 “impairment of assets.”.
The detail of the useful lives applied to intangible assets as of December 31, 2014 and 2013 is as follows:
| | | | |
Estimated useful lives or amortization rates used | | Minimum
life | | Maximum
life |
Patents, Trade Marks and Other Rights | | Indefinite | | Indefinite |
Software (IT) | | 1 | | 7 |
Other identifiable Intangible Assets | | 1 | | 5 |
The movement of intangible assets as of and for the year ended December 31, 2014 is the following:
| | | | | | | | | | | | | | | | |
Intangible movements | | Patents,
trademarks
and other
rights | | | Applications
(IT) | | | Other
identifiable
intangible
assets | | | Intangible
assets, net | |
| | | ThCh$ | | | ThCh$ | | | ThCh$ | | | ThCh$ | |
Initial balance as of January 1, 2014 | | | 470,439,865 | | | | 61,048,198 | | | | 40,133,444 | | | | 571,621,507 | |
Additions | | | — | | | | 19,709,085 | | | | — | | | | 19,709,085 | |
Removal | | | — | | | | (348,314 | ) | | | — | | | | (348,314 | ) |
Amortization | | | — | | | | (14,699,383 | ) | | | (2,315,992 | ) | | | (17,015,375 | ) |
Increase (decrease) in foreign exchange | | | 10,239,485 | | | | (2,813,769 | ) | | | 134,265 | | | | 7,559,981 | |
Decrease for classification as held for sale | | | (205,608,697 | ) | | | (3,526,108 | ) | | | 99,484 | | | | (209,035,321 | ) |
Other Increase (decrease) | | | — | | | | 29,071,581 | | | | (1,020,964 | ) | | | 28,050,617 | |
| | | | | | | | | | | | | | | | |
Balance at December 31, 2014 | | | 275,070,653 | | | | 88,441,290 | | | | 37,030,237 | | | | 400,542,180 | |
| | | | | | | | | | | | | | | | |
F-100
The movement of intangible assets as of and for the year ended December 31, 2013 is the following:
| | | | | | | | | | | | | | | | |
Intangible movements | | Patents,
trademarks
and other
rights | | | Applications
(IT) | | | Other
identifiable
intangible
assets | | | Intangible
assets, net | |
| | | ThCh$ | | | ThCh$ | | | ThCh$ | | | ThCh$ | |
Initial balance as of January 1, 2013 | | | 472,618,978 | | | | 38,122,191 | | | | 44,542,777 | | | | 555,283,946 | |
Additions | | | — | | | | 35,929,237 | | | | 666,005 | | | | 36,595,242 | |
Acquisitions through business combination | | | — | | | | — | | | | — | | | | — | |
Amortization | | | — | | | | (11,553,378 | ) | | | (3,833,906 | ) | | | (15,387,284 | ) |
Increase (decrease) in foreign exchange | | | (2,179,113 | ) | | | (1,449,852 | ) | | | (1,241,432 | ) | | | (4,870,397 | ) |
| | | | | | | | | | | | | | | | |
Balance at December 31, 2013 | | | 470,439,865 | | | | 61,048,198 | | | | 40,133,444 | | | | 571,621,507 | |
| | | | | | | | | | | | | | | | |
The details of the amounts of identifiable intangible assets that are individually significant as of December 31, 2014 and 2013 is as follows:
| | | | | | | | | | | | | | |
Individually significant identifiable Intangible assets | | Book
Value
2014 | | | Book
Value
2013 | | | Remaining
amortization
period | | Country of
origin | | Segment |
| | | ThCh$ | | | ThCh$ | | | | | | | |
Paris Brand | | | 120,754,313 | | | | 326,363,010 | | | Indefinite | | Chile | | Department stores |
Johnson’s Brand | | | 15,501,628 | | | | 15,501,628 | | | Indefinite | | Chile | | Department stores |
Pierre Cardin License | | | 171,584 | | | | 171,584 | | | Defined | | Chile | | Department stores |
Wong Brand | | | 33,189,716 | | | | 30,224,513 | | | Indefinite | | Peru | | Supermarkets |
Metro Brand | | | 72,413,925 | | | | 65,944,390 | | | Indefinite | | Peru | | Supermarkets |
Bretas Brand | | | 19,137,928 | | | | 18,671,783 | | | Indefinite | | Brazil | | Supermarkets |
Perini Brand | | | 856,926 | | | | 836,053 | | | Indefinite | | Brazil | | Supermarkets |
Prezunic Brand | | | 13,044,633 | | | | 12,726,904 | | | Indefinite | | Brazil | | Supermarkets |
| | | | | | | | | | | | | | |
Total | | | 275,070,653 | | | | 470,439,865 | | | | | | | |
| | | | | | | | | | | | | | |
The factors for considering the brands with indefinite useful lives over time are the following:
| • | | Verifiable history and expected use of the asset by the Company: This is the most important factor to consider in the definition of the useful life of the brand. The brands mentioned have a history of more than 80 years of successful existence in the market. The use that has been and is being given to these brands shows an intention to keep them and consolidate them further in the long term. |
| • | | Legal, regulatory or contractual limits to the useful life of the intangible asset: There are no legal, regulatory or contractual limits linked to the brands. The brands are duly protected and the pertinent registrations remain current. |
| • | | Effects of obsolescence, demand, competition and other economic factors: The brands have a rating linked to strong national brands according to their history. This implies a low risk of obsolescence. |
| • | | Maintenance of the necessary investment levels to produce the projected future cash flows: historic and projected cash flows for the brands are duly sustained with investments in marketing, publicity, technology, renovations and improvements to the retail infrastructure. They are efficient as a result of synergies and scale of operations, but are compatible and realistic for the industry. An increase in the other general administration expenses and necessary sales is also contemplated to sustain the projected increase in sales. |
| • | | Relationship of the useful life of an asset or group of assets with the useful life of an intangible asset: The brands do not depend on the useful life of any asset or group of assets as they existed independently for a substantial time prior to the acquisitions, and they are not related to sectors subject to technological obsolescence or other causes. |
F-101
The charge to income for amortization of intangibles for the years ended December 31, 2014, 2013 and 2012, are detailed below:
| | | | | | | | | | | | |
Item line in statement of income which includes amortization of identifiable
Intangible assets | | As of December 31, | |
| | 2014 | | | 2013 | | | 2012 | |
| | | ThCh$ | | | ThCh$ | | | ThCh$ | |
Administrative expenses (see note 25.3) | | | 17,015,375 | | | | 14,101,251 | | | | 8,723,032 | |
| | | | | | | | | | | | |
Total | | | 17,015,375 | | | | 14,101,251 | | | | 8,723,032 | |
| | | | | | | | | | | | |
As of December 31, 2014 and 2013, there are no relevant intangible assets encumbered. There are also no restrictions on ownership of them.
As of December 31, 2014 and 2013, there are no commitments to acquire intangible assets.
No significant intangible assets that have been fully depreciated are in use as of December 31, 2014.
13.1 Impairment test on Cash Generating Units including Goodwill.
Goodwill is allocated to each group of cash generating units, as appropriate, in each country and operating segment. The following table details goodwill by operating segment and country as of December 31, 2014 and 2013:
| | | | | | | | | | | | |
| | | As of December 31, | | | | |
Goodwill per operating segment and country | | 2013 | | | Exchange rate fluctuation | | | 2014 | |
| | | ThCh$ | | | ThCh$ | | | ThCh$ | |
Real Estate & Shopping—Argentina | | | 170,515 | | | | (20,168 | ) | | | 150,347 | |
Real Estate & Shopping—Colombia | | | 38,515,875 | | | | (2,853,028 | ) | | | 35,662,847 | |
Supermarkets—Chile | | | 106,991,957 | | | | — | | | | 106,991,957 | |
Supermarkets—Brazil | | | 555,708,811 | | | | 13,876,125 | | | | 569,584,936 | |
Supermarkets—Peru | | | 248,204,885 | | | | 20,439,935 | | | | 268,644,820 | |
Supermarkets— Colombia | | | 539,222,248 | | | | (39,942,388 | ) | | | 499,279,860 | |
Home Improvement—Argentina | | | 3,646,347 | | | | (437,551 | ) | | | 3,208,796 | |
Home Improvement—Chile | | | 1,227,458 | | | | — | | | | 1,227,458 | |
Department stores—Chile | | | 138,159,463 | | | | — | | | | 138,159,463 | |
Financial services – Colombia | | | 64,193,125 | | | | (4,755,046 | ) | | | 59,438,079 | |
| | | | | | | | | | | | |
Total | | | 1,696,040,684 | | | | (13,692,121 | ) | | | 1,682,348,563 | |
| | | | | | | | | | | | |
The basis of the amount recoverable from each group of cash generating units is the value in use, which determined by the net present value of the cash flows that the group of cash generating units will produce, discounted based on a rate of average cost of market capital in line with the business of each country.
F-102
13.2 Key assumptions
Discount rate
| | | | | | | | |
| | | Discount rate | |
Cash generating units | | 2014 | | | 2013 | |
Supermarkets – Chile | | | 9.60 | | | | 9.16 | |
| | |
Supermarkets – Brazil | | | 10.30 | | | | 10.54 | |
| | |
Supermarkets – Peru | | | 10.65 | | | | 10.69 | |
| | |
Supermarkets – Colombia | | | 9.51 | | | | 9.33 | |
| | |
Department stores– Chile | | | 9.17 | | | | 8.83 | |
| | |
Home Improvement—Argentina | | | 34,33 | | | | 28.78 | |
| | |
Home Improvement—Chile | | | 9.54 | | | | 9.19 | |
| | |
Real Estate - Colombia | | | 11,17 | | | | 9,33 | |
| | |
Financial Services - Colombia | | | 11,83 | | | | 9,33 | |
The discount rate was a pre-tax measure estimated based on the historical industry average weighted-average cost of capital, with a debt leveraging of 23% taking into account the main competitors in the market in each country where the Company operates.
F-103
Other key assumptions
The financial projections to determine the net present value of future cash flows are modeled considering the principal variables that determine the historic flows of each group of CGU and the budgets approved by the Board. Conservative growth rates are used for this purpose, which fluctuate from 1,2% to 1,7% annual average for the first five year of the projections and the terminal growth rates are between 0% and 1%, except for the group of UGEs Supermarkets Colombia which have 10 years projections with an annual average growth of 3,4%. The most sensitive variables used in these projections are the discount rates, operating costs, store occupation factors, terminal growth rates, and the market prices of the goods and services traded.
A differentiated discount rate is used to determine the value in use of each operating segment/country where the Company operates. For the impairment test performed in 2014, management carried out a reasonableness analysis on the key assumptions such as EBITDA margin, discount rate and terminal growth rate. This analysis consisted of a sensibility analysis on these three assumptions. Management assessed a change of 5%, 5% and 10% on the EBITDA margin, discount rate and terminal growth rate respectively. Based on the results of the sensibility analysis performed, if the proposed changes occurred on the assessed key assumptions, there would not be an impairment loss in 2014.
If EBITDA margin used in the value in use calculation for the group of UGEs Supermarkets - Colombia, or if the estimated cost of capital used in determining the discount rate for the group of UGEs aforementioned, had been 5% higher, than management’s estimates, both changes taken in isolation, the recoverable amount determined by value in use calculation, still remains in an amount similar to the goodwill carrying amount, with a small surplus.
If EBITDA margin used in the value in use calculation for the group of UGEs Supermarkets -Brazil, or if the estimated cost of capital used in determining the discount rate for the group of UGEs aforementioned, had been 5% higher, than the management’s estimates, both changes taken in isolation, the recoverable amount determined by value in use calculation, remains in an amount higher than similar to the goodwill carrying amount, with a small surplus.
The recoverable amount exceeded the CGU’s carrying amounts of each group of CGU based on a sensibility analysis performed, management did not identify a reasonably possible change in the two assumptions tested that could cause the carrying value exceeds the recoverable amount.
Acquisition of Colombia Holdings Alpha BV, Colombia Holdings Thalie BV, Colombia Holdings Calliope BV, Colombia Holdings Uranie BV, and Colombia Holdings Coledim BV, each organized under the laws of the Kingdom of the “Netherlands”, as well as the acquisition of 100% of the capital stock of Grandes Superficies de Colombia S.A. and Atacadao de Colombia S.A.S (Carrefour)
On November 30, 2012, Cencosud S.A. filed an official notice of an essential event, or “Hecho Esencial”, with the Chilean Superintendency of Securities and Insurance, “Superintendencia de Valores y Seguros” (“SVS”), pursuant to article 9 and second paragraph of article 10 of Act number 18.045 of the Republic of Chile, and Section II of the General Rule No. 30 of the SVS, announcing that:
Pursuant to the stock purchase agreement executed between the Company and Carrefour Nederlans B.V., a company organized under the laws of the Kingdom of the Netherlands and an affiliate of Carrefour S.A., a company organized under the laws of France, the Company completed the acquisition of 100% of the capital stock of Colombia Holdings Alpha BV, Colombia Holdings Thalie BV, Colombia Holdings Calliope BV, Colombia Holdings Uranie BV, and Colombia Holdings Coledim BV, each organized under the laws of the Kingdom of the Netherlands, as well as the acquisition of 100% of the capital stock of Grandes Superficies de Colombia S.A. and Atacadao de Colombia S.A.S., each organized under the laws of Colombia (collectively, the “Acquired Companies”). The Acquired Companies operate supermarkets under the Carrefour brand name in Colombia.
The total purchase price operation was EUR 1,905,005,000 (ThCh$1,171,090,394). All the expenses related to this transaction have been recorded in the income statements of the Company. The expenses amounted to ThCH$3,359,720 (professional fees).
Net sales and profit of the chain in the last twelve months of 2012 totaled about US$ 2.1 billion and US$$27,498 million respectively. In one month to December 31, 2012, the acquired Company contributed revenue and profit of US$244 and US$9,7 million respectively.
F-104
The Company operates 72 hypermarkets, 16 convenience stores, four local cash & carry format, as well as gas stations. It also acquired the premises are located in nine of the ten largest cities in Colombia, becoming the second supermarket operator. In relation to the attributable synergies to this acquisition, Cencosud is a strong retail operator in the South America Pacific shore and the entry into the Colombian market creates synergy opportunities not only for its Colombian operations but also for its Chilean and Peruvian operations by increasing the scale of its purchases from Asia and by providing a better cost of goods to Colombia and to its operations in Chile and Peru. Furthermore, given that Cencosud is a multi-format retail operator, it believes is well suited to create value out of the real estate portfolio acquired by developing new formats into the existing properties. Cencosud can further develop the sites by opening home improvement stores next to existing supermarkets, or start department store or shopping center operations in the future, further developing its business footprint in Colombia and generating operational efficiencies in that market. Finally, the Group’s core business is supermarket operations, which is also the case for the Company’s Colombian Operations. Supermarkets are worth more than the value of their assets. Procedures, logistics, trained people, points of sales, etc., are all part of the added value of a supermarket operation. The goodwill recognized is basically attributable to the aforementioned facts and synergies expected to be achieved from integrating the acquired business into the Group’s existing structure.
The Company concluded the process of determining the fair value measurement of assets and liabilities of the Sociedad Grandes Superficies de Colombia S.A. y Atacadao de Colombia S.A.S in 2013. All adjustments determined as part of the process have been accounted for as adjusting entries to the amounts recognized as of December 31, 2012.
The balance of the company at the date of purchase provided the following:
| | | | | | | | | | | | |
Assets | | Measurement
Period
Adjustments | | | Final allocation of
consideration
transferred
restated | | | Preliminary
allocation as
of December 01,
2012 | |
| | | | | | ThCh$ | | | ThCh$ | |
Current Assets | | | | | | | | |
Cash and cash equivalents | | | — | | | | 7,137,486 | | | | 7,137,486 | |
Other financial assets, current | | | 463,921 | | | | 3,124,415 | | | | 2,660,494 | |
Trade debtors and other accounts receivables | | | (2,963,220 | ) | | | 34,085,549 | | | | 37,048,769 | |
Intercompany receivables, current | | | | | | | 74,099 | | | | 74,099 | |
Inventories | | | (15,919,318 | ) | | | 94,035,892 | | | | 109,955,210 | |
Current tax assets | | | — | | | | 8,016,441 | | | | 8,016,441 | |
| | | | | | | | | | | | |
| | | |
Total current assets | | | (18,418,617 | ) | | | 146,473,882 | | | | 164,892,499 | |
| | | | | | | | | | | | |
| | | |
Non-current assets | | | | | | | | | | | | |
Trade debtors and other accounts receivable,non-current | | | — | | | | 7,280 | | | | 7,280 | |
Intangible assets other than goodwill | | | 10,373,018 | | | | 17,669,695 | | | | 7,296,677 | |
Goodwill | | | (26,618,046 | ) | | | — | | | | 26,618,046 | |
Property, plant and equipment | | | 224,997,165 | | | | 715,416,527 | | | | 490,419,362 | |
Investment property | | | — | | | | 23,495,425 | | | | 23,495,425 | |
Deferred income tax assets | | | 17,911,453 | | | | 50,165,320 | | | | 32,253,867 | |
| | | | | | | | | | | | |
| | | |
Total non-current assets | | | 226,663,590 | | | | 806,754,247 | | | | 580,090,657 | |
| | | | | | | | | | | | |
| | | |
Total assets | | | 208,244,973 | | | | 953,228,129 | | | | 744,983,156 | |
F-105
| | | | | | | | | | | | |
Net Equity and liabilities | | Measurement
Period
Adjustments | | | Final allocation of
consideration
transferred | | | Preliminary
allocation as
of December 01,
2012 | |
| | | | | | ThCh$ | | | ThCh$ | |
Current liabilities | | | | | | | | | | | | |
Other financial liabilities, current | | | — | | | | 80,314,269 | | | | 80,314,269 | |
Trade creditors and other Accounts payables | | | 1,509,214 | | | | 182,131,348 | | | | 180,622,134 | |
Intercompany Accounts payable, current | | | — | | | | 5,220,634 | | | | 5,220,634 | |
Other short-term provisions | | | 10,162,303 | | | | 12,965,888 | | | | 2,803,585 | |
Employee benefit provisions, current | | | — | | | | 2,788,075 | | | | 2,788,075 | |
Other non-financial liabilities, current | | | — | | | | 867,040 | | | | 867,040 | |
| | | | | | | | | | | | |
| | | |
Total current liabilities | | | 11,671,517 | | | | 284,287,254 | | | | 272,615,737 | |
| | | | | | | | | | | | |
| | | |
Non-current Liabilities | | | | | | | | | | | | |
Other financial liabilities, non-current | | | 2,805,517 | | | | 11,855,081 | | | | 9,049,564 | |
Non-current liabilities | | | — | | | | 14,538,258 | | | | 14,538,258 | |
Other Non-current provisions | | | 9,374,893 | | | | 9,374,893 | | | | — | |
Deferred income tax liabilities | | | 71,980,675 | | | | 79,525,006 | | | | 7,544,331 | |
Other long term provisions | | | — | | | | 713,260 | | | | 713,260 | |
| | | | | | | | | | | | |
| | | |
Total non-current liabilities | | | 84,161,085 | | | | 116,006,498 | | | | 31,845,413 | |
| | | | | | | | | | | | |
| | | |
Total liabilities | | | 95,832,602 | | | | 400,293,752 | | | | 304,461,150 | |
| | | | | | | | |
Net Equity and liabilities | | Final allocation of
consideration
transferred
restated | | | Preliminary
allocation of
consideration
transferred | |
| | | | | | ThCh$ | |
| | |
Paid in Capital | | | | | | | 323,596,000 | |
Retained Earnings | | | | | | | 78,632,494 | |
Other Reserves | | | | | | | 38,293,512 | |
| | |
Equity attributable to equity instrument holders: | | | | | | | | |
Not controlling interest | | | | | | | 440,522,006 | |
| | | | | | | | |
| | |
Equity and liabilities | | | | | | | 744,983,156 | |
| | | | | | | | |
| | |
Net Assets | | | 552,934,377 | | | | | |
Consideration Paid | | | 1,171,090,394 | | | | | |
Goodwill | | | 618,156,017 | | | | | |
Accumulated exchange difference | | | 23,775,231 | | | | | |
Goodwill as of December 31, 2013 | | | 641,931,248 | | | | | |
F-106
As for the allocation of Goodwill, this was determined by taking into account the expected benefits from the related synergies arising from business model of the Company in Colombia, the allocation is as follows:
| a) | Supermarket – carries 84% of total goodwill |
| b) | Financial services – carries 10% of total goodwill |
| c) | Shopping centers – carries 6% of total goodwill |
The goodwill recognized is expected to be deductible for tax purposes.
Fair value measurements
The valuation techniques used in determining the fair value of the significant assets and assumed liabilities were as follows:
Property Plan and Equipment: The Company used the “Replacement Cost new method” to determine the fair value of PPE. This method consists of identifying the replacement cost of new property with similar capacity, adjusted for depreciable factors such as functional or technological obsolescence, remaining useful life, and physical condition. For lands and buildings, the Company used the “Sales Comparison method.” This method identifies prices of recent transactions between market participants (purchasers/sellers) for comparable properties.
Intangible assets: The Company identified and assessed for recognition the following intangibles assets:
| • | | Customer relationship: The Company used the multi-period excess earnings method to estimate the fair value based on a residual cash flow notion. |
| • | | Customer lists (databases): The Company used a market approach to determine the fair value of this asset |
The hierarchy for the fair value of the assets measured from the business combination, specifically intangible assets, has been assessed as level III.
The trade receivables comprise of gross contractual amounts of ThCh$ M$ 34,399,870, of which ThCh$3,878,630 was expected to be uncollectible as of the date of acquisition.
| 14 | Property, plant and equipment |
| 14.1 | The composition of this item as of December 31, 2014 and 2013 is as follows: |
| | | | | | | | |
| | | As of December 31, | |
| | | 2014 | | | 2013 | |
| | | ThCh$ | | | ThCh$ | |
Construction in progress | | | 108,039,312 | | | | 196,653,736 | |
Land | | | 771,941,959 | | | | 755,456,534 | |
Buildings | | | 1,138,386,080 | | | | 1,159,045,283 | |
Plant and equipment | | | 271,557,147 | | | | 270,153,069 | |
Information technology equipment | | | 41,570,628 | | | | 35,962,383 | |
Fixed installations and accessories | | | 383,530,340 | | | | 389,903,950 | |
Motor vehicles | | | 3,256,956 | | | | 1,192,222 | |
Leasehold improvements | | | 260,036,834 | | | | 230,830,919 | |
Other property plant and equipment | | | 31,409,200 | | | | 62,685,772 | |
| | | | | | | | |
| | |
Totals | | | 3,009,728,456 | | | | 3,101,883,868 | |
| | | | | | | | |
F-107
| | | | | | | | |
| | | As of December 31, | |
Property, plant and equipment categories, gross | | 2014 | | | 2013 | |
| | | ThCh$ | | | ThCh$ | |
Construction in progress | | | 108,039,312 | | | | 196,653,736 | |
Land | | | 771,941,959 | | | | 755,456,534 | |
Buildings | | | 1,307,766,446 | | | | 1,350,194,798 | |
Plant and equipment | | | 574,031,890 | | | | 564,330,049 | |
Information technology equipment | | | 140,855,701 | | | | 134,041,857 | |
Fixed installations and accessories | | | 730,008,069 | | | | 679,969,395 | |
Motor vehicles | | | 7,848,595 | | | | 5,493,456 | |
Leasehold improvements | | | 316,018,731 | | | | 276,531,887 | |
Other property plant and equipment | | | 36,689,118 | | | | 73,410,377 | |
| | | | | | | | |
| | |
Totals | | | 3,993,199,821 | | | | 4,036,082,089 | |
| | | | | | | | |
| | | | | | | | |
Accumulated depreciation and impairment of property, plant and equipment | | As of December 31, | |
| | 2014 | | | 2013 | |
| | | ThCh$ | | | ThCh$ | |
Buildings | | | (169,380,366 | ) | | | (191,149,515 | ) |
Plant and equipment | | | (302,474,743 | ) | | | (294,176,980 | ) |
Information technology equipment | | | (99,285,073 | ) | | | (98,079,474 | ) |
Fixed installations and accessories | | | (346,477,729 | ) | | | (290,065,445 | ) |
Motor vehicles | | | (4,591,639 | ) | | | (4,301,234 | ) |
Leasehold improvements | | | (55,981,897 | ) | | | (45,700,968 | ) |
Other property plant and equipment | | | (5,279,918 | ) | | | (10,724,605 | ) |
| | | | | | | | |
| | |
Totals | | | (983,471,365 | ) | | | (934,198,221 | ) |
| | | | | | | | |
F-108
| 14.2 | The following table shows the technical useful lives for the assets. |
| | | | | | | | | | |
Method used for the depreciation of property, plant and equipment (life) | | Rate explanation | | Minimum
life | | | Maximum
life | |
Buildings | | Useful Life (years) | | | 25 | | | | 60 | |
Plant and equipment | | Useful Life (years) | | | 7 | | | | 20 | |
Information technology equipment | | Useful Life (years) | | | 3 | | | | 7 | |
Fixed installations and accessories | | Useful Life (years) | | | 7 | | | | 15 | |
Motor vehicles | | Useful Life (years) | | | 1 | | | | 5 | |
Leasehold improvements (*) | | Useful Life (years) | | | 5 | | | | 35 | |
Other property plant and equipment | | Useful Life (years) | | | 3 | | | | 15 | |
| (*) | Leasehold improvement will be depreciated using the shorter useful life between of the length of the lease contract and the useful life per the table above. |
The Company and its subsidiaries reviewed the estimated useful lives of property, plant and equipment at the end of each fiscal year. As such, the Company has determined that there are no significant changes in the estimated useful lives in the reporting periods.
F-109
| 14.3 | Reconciliation of changes in property, plant and equipment |
The following chart shows a detailed roll-forward of changes in property, plant and equipment; by class between January 1, 2014 and December 31, 2014:
| | | | | | | | | | | | | | | | | | | | | | | | | | | | | | | | | | | | | | | | |
Movement year 2014 | | Construction In
progress | | | Land | | | Building,
net | | | Plant and
equipment
net | | | Information
technology
equipment,
net | | | Fixed
installations
and
accessories,
net | | | Motor
vehicles,
net | | | Lease
improvements,
net | | | Other
property,
plant and
equipment,
net | | | Property,
plant and
equipment,
net | |
| | | ThCh$ | | | ThCh$ | | | ThCh$ | | | ThCh$ | | | ThCh$ | | | ThCh$ | | | ThCh$ | | | ThCh$ | | | ThCh$ | | | ThCh$ | |
Opening balance January 1, 2014 | | | 196,653,736 | | | | 755,456,534 | | | | 1,159,045,283 | | | | 270,153,069 | | | | 35,962,383 | | | | 389,903,950 | | | | 1,192,222 | | | | 230,830,919 | | | | 62,685,772 | | | | 3,101,883,868 | |
Charge | | | | | | | | | | | | | | | | | | | | | | | | | | | | | | | | | | | | | | | | |
Additions | | | 74,613,966 | | | | 28,789,994 | | | | 12,142,562 | | | | 22,688,461 | | | | 7,431,611 | | | | 10,221,794 | | | | 37,127 | | | | 21,411,800 | | | | 6,356,217 | | | | 183,693,532 | |
| | | | | | | | | | |
Disposals | | | — | | | | — | | | | — | | | | — | | | | — | | | | — | | | | (12,998 | ) | | | — | | | | — | | | | (12,998 | ) |
Transfer to (from) non—current assets and disposal groups held for sale | | | (153,192 | ) | | | — | | | | — | | | | (1,063,820 | ) | | | (737,816 | ) | | | (697,955 | ) | | | — | | | | — | | | | — | | | | (2,652,783 | ) |
Transfers to (from) investment properties | | | 6,208,164 | | | | 9,024,753 | | | | (255,582 | ) | | | 145,240 | | | | — | | | | 424,342 | | | | — | | | | — | | | | (11,834 | ) | | | 15,535,083 | |
Other Increase/(decrease) | | | (31,645,866 | ) | | | | | | | — | | | | | | | | 3,595,249 | | | | | | | | | | | | | | | | | | | | (28,050,617 | ) |
| | | | | | | | | | |
Removal | | | (41,390 | ) | | | — | | | | (3,735,684 | ) | | | (1,936,378 | ) | | | (854,924 | ) | | | (29,646 | ) | | | — | | | | — | | | | (10,692,659 | ) | | | (17,290,681 | ) |
Depreciation expenses | | | | | | | | | | | (33,585,988 | ) | | | (53,175,448 | ) | | | (12,446,988 | ) | | | (63,836,549 | ) | | | (289,575 | ) | | | (18,888,233 | ) | | | (804,885 | ) | | | (183,027,666 | ) |
Increase (decrease) in foreign exchange | | | 21,117,212 | | | | (21,329,321 | ) | | | (31,192,967 | ) | | | (15,939,444 | ) | | | (3,048,321 | ) | | | (9,767,635 | ) | | | (41,059 | ) | | | 292,006 | | | | (439,753 | ) | | | (60,349,282 | ) |
| | | | | | | | | | |
Transfer from construction in progress | | | (158,713,318 | ) | | | — | | | | 35,968,456 | | | | 50,685,470 | | | | 11,669,432 | | | | 57,312,033 | | | | 2,371,239 | | | | 26,390,344 | | | | (25,683,656 | ) | | | — | |
| | | | | | | | | | | | | | | | | | | | | | | | | | | | | | | | | | | | | | | | |
Total changes | | | (88,614,424 | ) | | | 16,485,426 | | | | (20,659,203 | ) | | | 1,404,081 | | | | 5,608,243 | | | | (6,373,616 | ) | | | 2,064,734 | | | | 29,205,917 | | | | (31,276,570 | ) | | | (92,155,412 | ) |
| | | | | | | | | | | | | | | | | | | | | | | | | | | | | | | | | | | | | | | | |
Final balance as of December 31, 2014 | | | 108,039,312 | | | | 771,941,960 | | | | 1,138,386,080 | | | | 271,557,150 | | | | 41,570,626 | | | | 383,530,334 | | | | 3,256,956 | | | | 260,036,836 | | | | 31,409,202 | | | | 3,009,728,456 | |
| | | | | | | | | | | | | | | | | | | | | | | | | | | | | | | | | | | | | | | | |
F-110
The following chart shows a detailed roll-forward of changes in property, plant and equipment; by class between January 1, 2013 and December 31, 2013:
| | | | | | | | | | | | | | | | | | | | | | | | | | | | | | | | | | | | | | | | |
Movement year 2013 | | Construction In
progress | | | Land | | | Building,
net | | | Plant and
equipment
net | | | Information
technology
equipment,
net | | | Fixed
installations
and
accessories,
net | | | Motor
vehicles,
net | | | Lease
improvements,
net | | | Other
property,
plant and
equipment,
net | | | Property,
plant and
equipment,
net | |
| | | ThCh$ | | | ThCh$ | | | ThCh$ | | | ThCh$ | | | ThCh$ | | | ThCh$ | | | ThCh$ | | | ThCh$ | | | ThCh$ | | | ThCh$ | |
Opening balance January 1, 2013 | | | 277,245,095 | | | | 786,367,971 | | | | 1,121,151,675 | | | | 275,363,368 | | | | 32,063,673 | | | | 393,271,556 | | | | 1,854,965 | | | | 195,341,364 | | | | 51,868,443 | | | | 3,134,528,110 | |
Charge | | | | | | | | | | | | | | | | | | | | | | | | | | | | | | | | | | | | | | | | |
Additions | | | 87,527,955 | | | | 15,341,731 | | | | 29,421,393 | | | | 23,910,995 | | | | 8,908,011 | | | | 30,801,595 | | | | 26,999 | | | | 41,061,452 | | | | 7,585,256 | | | | 244,585,387 | |
| | | | | | | | | | |
Disposals | | | — | | | | — | | | | — | | | | — | | | | — | | | | (1,827 | ) | | | (201,455 | ) | | | — | | | | — | | | | (203,282 | ) |
Transfer to (from) non—current assets and disposal groups held for sale | | | — | | | | — | | | | — | | | | — | | | | — | | | | — | | | | — | | | | — | | | | — | | | | — | |
Transfers to (from) investment properties | | | (11,695,675 | ) | | | 37,592 | | | | (575,206 | ) | | | — | | | | — | | | | 655,702 | | | | — | | | | — | | | | (18,593 | ) | | | (11,596,180 | ) |
Disposals through business divestiture | | | — | | | | — | | | | — | | | | — | | | | — | | | | — | | | | — | | | | — | | | | — | | | | — | |
Removal | | | (6,532 | ) | | | (33,944 | ) | | | (614,499 | ) | | | (864,775 | ) | | | (108,519 | ) | | | (642,688 | ) | | | (242 | ) | | | (346,263 | ) | | | (720 | ) | | | (2,618,182 | ) |
Depreciation expenses | | | | | | | | | | | (29,006,983 | ) | | | (50,637,568 | ) | | | (11,832,075 | ) | | | (61,364,962 | ) | | | (686,065 | ) | | | (14,201,074 | ) | | | (5,921,663 | ) | | | (173,650,390 | ) |
Increase (decrease) in foreign exchange | | | (7,764,143 | ) | | | (26,713,784 | ) | | | (21,491,905 | ) | | | (11,910,988 | ) | | | 566,083 | | | | (13,360,842 | ) | | | (43,916 | ) | | | (11,246,577 | ) | | | 2,804,477 | | | | (89,161,595 | ) |
Transfer from construction in progress | | | (148,652,964 | ) | | | (19,543,032 | ) | | | 60,160,808 | | | | 34,292,037 | | | | 6,365,210 | | | | 40,545,416 | | | | 241,936 | | | | 20,222,017 | | | | 6,368,572 | | | | — | |
| | | | | | | | | | | | | | | | | | | | | | | | | | | | | | | | | | | | | | | | |
Total changes | | | (80,591,359 | ) | | | (30,911,437 | ) | | | 37,893,608 | | | | (5,210,299 | ) | | | 3,898,710 | | | | (3,367,606 | ) | | | (662,743 | ) | | | 35,489,555 | | | | 10,817,329 | | | | (32,644,242 | ) |
| | | | | | | | | | | | | | | | | | | | | | | | | | | | | | | | | | | | | | | | |
Final balance as of December 31, 2013 | | | 196,653,736 | | | | 755,456,534 | | | | 1,159,045,283 | | | | 270,153,069 | | | | 35,962,383 | | | | 389,903,950 | | | | 1,192,222 | | | | 230,830,919 | | | | 62,685,772 | | | | 3,101,883,868 | |
| | | | | | | | | | | | | | | | | | | | | | | | | | | | | | | | | | | | | | | | |
F-111
| | | | | | | | | | | | | | | | | | | | | | | | | | | | | | | | | | | | | | | | |
Movement year 2012 | | Construction In
progress | | | Land | | | Building,
net | | | Plant and
equipment,
net | | | Information
Technology
equipment,
net | | | Fixed
Installations
And
accessories,
net | | | Engine
vehicles,
net | | | Lease
improvements,
net | | | Other
property,
plant and
equipment,
net | | | Property,
plant and
equipment,
net | |
| | | ThCh$ | | | ThCh$ | | | ThCh$ | | | ThCh$ | | | ThCh$ | | | ThCh$ | | | ThCh$ | | | ThCh$ | | | ThCh$ | | | ThCh$ | |
Opening balance January 1, 2012 | | | 350,254,325 | | | | 593,589,931 | | | | 608,920,291 | | | | 214,613,734 | | | | 22,501,400 | | | | 264,943,521 | | | | 1,101,256 | | | | 134,218,413 | | | | 38,385,930 | | | | 2,228,528,801 | |
Charge | | | | | | | | | | | | | | | | | | | | | | | | | | | | | | | | | | | | | | | | |
Additions | | | 199,439,068 | | | | 29,558,199 | | | | 16,356,250 | | | | 51,499,623 | | | | 9,289,164 | | | | 53,502,893 | | | | 292,850 | | | | 44,026,508 | | | | 15,425,831 | | | | 419,390,386 | |
Acquisitions through business combination (See note 13) | | | 26,475,367 | | | | 205,337,111 | | | | 425,100,918 | | | | 22,636,848 | | | | 1,682,377 | | | | 35,560,264 | | | | 1,055,677 | | | | 33,077,924 | | | | 20,779,314 | | | | 771,705,800 | |
Disposals | | | — | | | | (13,413,500 | ) | | | — | | | | — | | | | — | | | | — | | | | (125,471 | ) | | | — | | | | — | | | | (13,538,971 | ) |
Transfer to (from) non—current assets and disposal groups held for sale | | | — | | | | — | | | | — | | | | — | | | | — | | | | — | | | | — | | | | — | | | | — | | | | — | |
| | | | | | | | | | |
Transfers to (from) investment properties | | | 9,102,922 | | | | (9,116,117 | ) | | | 4,195,542 | | | | (119,851 | ) | | | (74,635 | ) | | | (107,278 | ) | | | — | | | | — | | | | (6,375,415 | ) | | | (2,494,832 | ) |
Disposals through business divestiture | | | — | | | | — | | | | — | | | | — | | | | — | | | | — | | | | — | | | | — | | | | — | | | | — | |
| | | | | | | | | | |
Removal | | | (2,026,193 | ) | | | (2,347,124 | ) | | | (4,430,792 | ) | | | (4,829,501 | ) | | | (355,432 | ) | | | (739,975 | ) | | | | | | | (150,265 | ) | | | (522,448 | ) | | | (15,401,730 | ) |
| | | | | | | | | | |
Depreciation expenses | | | | | | | | | | | (22,060,242 | ) | | | (37,751,367 | ) | | | (7,339,250 | ) | | | (53,029,585 | ) | | | (352,937 | ) | | | (9,750,470 | ) | | | (1,186,169 | ) | | | (131,470,020 | ) |
| | | | | | | | | | |
Increase (decrease) in foreign exchange | | | (4,810,026 | ) | | | (32,237,454 | ) | | | (27,380,220 | ) | | | (16,245,504 | ) | | | (2,191,010 | ) | | | (14,729,318 | ) | | | (116,439 | ) | | | (18,835,643 | ) | | | (5,645,710 | ) | | | (122,191,324 | ) |
| | | | | | | | | | |
Transfer from construction in progress | | | (301,190,368 | ) | | | 14,996,925 | | | | 120,449,928 | | | | 45,559,386 | | | | 8,551,059 | | | | 107,871,034 | | | | 29 | | | | 12,754,897 | | | | (8,992,890 | ) | | | — | |
| | | | | | | | | | | | | | | | | | | | | | | | | | | | | | | | | | | | | | | | |
| | | | | | | | | | |
Total changes | | | (73,009,230 | ) | | | 192,778,040 | | | | 512,231,384 | | | | 60,749,634 | | | | 9,562,273 | | | | 128,328,035 | | | | 753,709 | | | | 61,122,951 | | | | 13,482,513 | | | | 905,999,309 | |
| | | | | | | | | | | | | | | | | | | | | | | | | | | | | | | | | | | | | | | | |
| | | | | | | | | | |
Final balance as of December 31, 2012 | | | 277,245,095 | | | | 786,367,971 | | | | 1,121,151,675 | | | | 275,363,368 | | | | 32,063,673 | | | | 393,271,556 | | | | 1,854,965 | | | | 195,341,364 | | | | 51,868,443 | | | | 3,134,528,110 | |
| | | | | | | | | | | | | | | | | | | | | | | | | | | | | | | | | | | | | | | | |
F-112
14.4The Company has traditionally maintained the policy to carry out all the necessary work in response to the opportunities and changes experienced in domestic and regional markets where the Company operates, to capture the best opportunities and results for each of its business units.
The cost includes disbursements directly attributable to the acquisition or construction of an asset, as well as interests from related financing in the case of qualifying assets.
| 14.5 | Costs arising from interest expense: |
The company incorporates costs for general and specific interest directly attributable to the acquisition, construction or production of an asset which necessarily takes time to get ready for intended use.
| | | | | | | | | | | | |
| | | As of December 31, | |
Detail | | 2014 | | | 2013 | | | 2012 | |
| | | ThCh$ | | | ThCh$ | | | ThCh$ | |
Costs of capitalized interest in Property, Plant and Equipment | | | 58,692 | | | | 295,405 | | | | 14,158,806 | |
Capitalization rate of capitalized interests in Property, Plant and Equipment | | | 5.7 | % | | | 4.5 | % | | | 4.5 | % |
| 14.6 | Assets subject to finance lease |
The financial lease operations are shown in note 30.
As of December 31, 2014 and 2013, properties, plant and equipment have been granted as security for the total amount of ThCh$ 4,154,567 and ThCh$ 3,186,327, respectively, whose details are shown in Note 31.1 Guarantees Granted. Nevertheless, there are no restrictions on ownership of assets.
| 14.8 | Commitments to acquire assets |
As of December 31, 2014, there are commitments to acquire property, plant and equipment of ThCh$ 76,028,453. (As of December 31, 2013 there are commitments to acquire property, plant or equipment of ThCh$ 67,592,660.)
| 14.9 | Assets out of service |
As of December 31, 2014 and 2013, there are no essential elements or assets that are temporarily out of service. The property, plant and equipment mainly relate to stores and operating fixed assets to enable the performance of the retail business every day of the year, except when there are restrictions for public holidays established in each country.
| 14.10 | Assets fully depreciated |
In view of the nature of the retail business, the Company has no significant assets that are fully depreciated and that are in use as of December 31, 2014 and 2013. These assets relate mainly to minor equipment such as scales, furniture, computers, cameras, lighting and others. The retail business assets are depreciated based on the term of the lease agreement.
F-113
Assets subject to amortization are tested for impairment whenever events or changes in business circumstances indicate that the carrying amount of the assets may not be recovered. It recognizes an impairment loss when the carrying amount is greater than its recoverable amount. The recoverable amount of an asset is the higher of an asset’s fair value less costs to sell and its value in use. For the purposes of assessing impairment, assets are grouped at the lowest level for which identifiable cash flows exist separately. The Company has not recognized losses or reversals of impairment affecting profit and loss as of December 31, 2014 and December 31, 2013.
| 14.12 | Property Plant and Equipment components: |
The main items that compose each asset class are:
Plant and equipment: presented in this asset class are primarily properties used in the operation of retail business such as mixers, sausages portioning machines, system ready meals, frozen island, cold containers, and refrigerated display cases, forming bread ovens, blender, among others.
Equipment for information technology: correspond to items such as computers, printers, notebook, labeling, scanner, clock control, price inquiries and servers, among others.
Fixtures and fittings: presented in this asset class are expenditures to enable operations of stores, such, ceilings, floors, wall finishes, lighting the sky, smoke detectors, sprinklers, air ducts and heating, communications networks, escalators, elevators, hoists, electrical substation and central air conditioning among others.
Leasehold improvements: presented in this asset class are disbursements associated with enabling or leased store improvements such as remodeling of facades, finishes, floors, ceilings and walls among others. Other property, plant and equipment: mainly corresponds to fixed assets in transit and assets acquired under finance lease.
The investment properties are assets held to generate rental income and include lands, buildings, malls in Chile, Argentina, Peru and Colombia and other real estate projects in progress that are held either to obtain rental income or for capital appreciation. The factors considered in the valuation methodology of the investment properties are described in note 4.5 “Estimates, judgment or criteria applied by management”.
| 15.1 | The roll-forward of investment properties at December 31, 2014 and 2013 is the following: |
| | | | | | | | |
| | | As of December 31, | |
Roll-forward of investment properties, net, fair value method | | 2014 | | | 2013 | |
| | | ThCh$ | | | ThCh$ | |
Investment properties, net, initial value | | | 1,568,432,058 | | | | 1,471,343,789 | |
Revaluation, adjustment to fair value gains (losses) (*) | | | 100,772,615 | | | | 95,110,013 | |
Additions, Investment Properties, Fair Value Method | | | 25,060,310 | | | | 37,900,602 | |
| | |
Transfer to (from) owner-occupied property, investment property, cost model | | | (15,535,083 | ) | | | 11,596,180 | |
Retirement, investment properties, Fair Value Method | | | — | | | | (4,749 | ) |
Increase (decrease) in foreign exchange rate, Investment Properties, Fair Value Method | | | (15,137,504 | ) | | | (47,513,777 | ) |
| | | | | | | | |
| | |
Changes in Investment Properties, Fair Value Method, Total | | | 95,160,338 | | | | 97,088,269 | |
| | | | | | | | |
| | |
Investment Properties, Fair Value Method, Final Balance | | | 1,663,592,396 | | | | 1,568,432,058 | |
The value of land measure through a market approach amounts to ThCh$ 312,213,496 and ThCh$ 268,286,953 as of December 31, 2014 and 2013, respectively
| (*) | Revaluation, adjustment to fair value gains (losses) has been included in the line item “other income by function” of the statement of comprehensive income and note 25.5 |
F-114
| 15.2 | Income and expense from investment properties |
| | | | | | | | | | | | |
| | | As of December 31, | |
Income and expense from investment properties | | 2014 | | | 2013 | | | 2012 | |
| | | ThCh$ | | | ThCh$ | | | ThCh$ | |
Revenue from Investment Property Leases | | | 214,849,681 | | | | 205,331,757 | | | | 166,280,480 | |
Direct Expense of Operation of Investment Properties which generate lease revenue | | | 62,505,656 | | | | 62,117,428 | | | | 54,075,826 | |
Direct Expense of Operation of Investment Properties which do not generate lease revenue | | | — | | | | — | | | | — | |
| 15.3 | As of December 31, 2014, investment properties are not encumbered. |
| 15.4 | As of December 31, 2014, there are commitments to acquire investment properties by ThCh$ 18,415,052. (ThCh$ 35,247,915 as of December 31,2013). |
| 15.5 | There are no restrictions on ownership of assets. |
| 15.6 | Investment Properties |
At December 31, 2014 and 2013, these assets are valued using the fair value model. The methodology used in the valuation of these assets and significant assumptions used are described in note 4.5. The Costanera Center project corresponds to assets that have been classified as investment property. The Shopping Mall is in operation since June, 2012 and the offices and hotel at the end of the year are under construction.
| 16 | Deferred income taxes and current tax |
The source of the deferred income taxes recorded as of December 31, 2014 and 2013 is the following:
| 16.1 | Deferred income tax assets |
| | | | | | | | |
Deferred income tax assets | | As of December 31, | |
| | 2014 | | | 2013 | |
| | | ThCh$ | | | ThCh$ | |
Fixed assets | | | 5,171,186 | | | | 24,577,902 | |
Accumulations or accruals | | | 5,877,466 | | | | 2,898,063 | |
Inventory | | | 31,323,149 | | | | 19,071,557 | |
Bad-debt reserve | | | 21,325,530 | | | | 26,738,963 | |
Accruals and provisions | | | 64,519,198 | | | | 58,954,431 | |
Vacation / annual leave | | | 5,159,766 | | | | 4,683,348 | |
Tax carry forward losses | | | 350,964,754 | | | | 174,936,932 | |
| | | | | | | | |
| | |
Total | | | 484,341,049 | | | | 311,861,196 | |
| | | | | | | | |
The recovery of the deferred tax asset balances requires that the business achieves a sufficient level of taxable income in the future. The Company estimates that the estimated projected future income will cover the recovery of the assets.
F-115
| 16.2 | Deferred income tax liabilities |
| | | | | | | | |
Deferred income tax liabilities | | As of December 31, | |
| | 2014 | | | 2013 | |
| | | ThCh$ | | | ThCh$ | |
Fixed assets | | | 365,513,998 | | | | 335,327,877 | |
Intangibles | | | 272,912,702 | | | | 110,695,030 | |
Accumulations or accruals | | | 13,874,061 | | | | 7,987,656 | |
Foreign currency translation | | | 15,523,984 | | | | 17,472,121 | |
| | | | | | | | |
| | |
Total | | | 667,824,745 | | | | 471,482,684 | |
| | | | | | | | |
The analysis of deferred tax assets and deferred tax liabilities is as follows:
| | | | | | | | |
| | | As of December 31, | |
Deferred income tax assets | | 2014 | | | 2013 | |
| | | ThCh$ | | | ThCh$ | |
Deferred tax assets to be recovered after more than 12 months | | | 479,181,283 | | | | 294,229,397 | |
Deferred tax assets to be recovered within 12 months | | | 5,159,766 | | | | 17,631,799 | |
| | | | | | | | |
| | |
Deferred tax assets | | | 484,341,049 | | | | 311,861,196 | |
| | | | | | | | |
| | | | | | | | |
| | | As of December 31, | |
Deferred income tax liabilities | | 2014 | | | 2013 | |
| | | ThCh$ | | | ThCh$ | |
Deferred tax liabilities to be recovered after more than 12 months | | | (659,005,332 | ) | | | (463,844,751 | ) |
Deferred tax liabilities to be recovered within 12 months | | | (8,819,413 | ) | | | (7,637,933 | ) |
| | | | | | | | |
| | |
Deferred tax liabilities | | | (667,824,745 | ) | | | (471,482,684 | ) |
| | | | | | | | |
| | |
Deferred tax liability (net) | | | (183,483,696 | ) | | | (159,621,488 | ) |
| | | | | | | | |
The gross movement on the deferred income tax account is as follows:
| | | | | | | | |
| | | As of December 31, | |
| | | 2014 | | | 2013 | |
| | | ThCh$ | | | ThCh$ | |
As of 1 January | | | (159,621,487 | ) | | | (178,277,276 | ) |
Debit to the statement of income(*) | | | (17,548,140 | ) | | | (25,367,188 | ) |
Business combinations and exchange differences | | | 5,098,624 | | | | 43,802,529 | |
Tax debited (credited) directly to equity | | | 614,276 | | | | 220,447 | |
Discontinued operations | | | (12,026,969 | ) | | | — | |
| | | | | | | | |
| | |
At 31 December | | | (183,483,696 | ) | | | (159,621,488 | ) |
| | | | | | | | |
| (*) | The(decrease) increase in Assets and liabilities for deferred income tax includes effects of the Recently enacted tax law en Peru, Chile and Colombia |
F-116
| 16.3 | The deferred income tax roll-forward is as follows: |
| | | | | | | | |
| | | As of December 31, | |
Movements in deferred income tax asset | | 2014 | | | 2013 | |
| | | ThCh$ | | | ThCh$ | |
Deferred income tax assets Initial balance | | | 311,861,196 | | | | 268,680,396 | |
Increase (decrease) in deferred income tax assets | | | 162,085,124 | | | | 46,775,285 | |
Increase (decrease) for change in income tax rate | | | 15,362,754 | | | | — | |
Increase (decrease) in foreign exchange rate | | | (4,968,025 | ) | | | (3,594,485 | ) |
| | | | | | | | |
| | |
Deferred income tax assets, final balance | | | 484,341,049 | | | | 311,861,196 | |
| | | | | | | | |
| |
| | | As of December 31, | |
Movements in deferred income tax liability | | 2014 | | | 2013 | |
| | | ThCh$ | | | ThCh$ | |
Deferred income tax liabilities, Initial balance | | | (471,482,684 | ) | | | (446,957,672 | ) |
Increase (decrease) in deferred income tax liabilities | | | (171,925,670 | ) | | | (72,839,845 | ) |
Increase (decrease) in income tax rate | | | (34,483,041 | ) | | | — | |
Increase (decrease) in foreign exchange rate | | | 10,066,650 | | | | 48,314,833 | |
| | | | | | | | |
| | |
Deferred income tax liabilities, final balance | | | (667,824,745 | ) | | | (471,482,684 | ) |
| | | | | | | | |
The changes in deferred income tax assets and liabilities during the year, without taking into consideration the offsetting of balances within the same tax jurisdiction, are as follows:
| | | | | | | | | | | | | | | | | | | | |
Deferred tax liabilities | | Fixed assets | | | Intangibles | | | Capitalized
expenses | | | Other | | | Total | |
| | | ThCh$ | | | ThCh$ | | | ThCh$ | | | ThCh$ | | | ThCh$ | |
As of 1 January 2013 | | | (333,469,052 | ) | | | (89,151,556 | ) | | | (14,266,291 | ) | | | (10,070,773 | ) | | | (446,957,672 | ) |
Charged (credit to the Statement of income | | | (1,858,825 | ) | | | (21,543,474 | ) | | | 6,278,635 | | | | (7,401,348 | ) | | | (24,525,012 | ) |
Charged directly to equity | | | | | | | | | | | | | | | | | | | | |
| | | | | | | | | | | | | | | | | | | | |
At December 31, 2012 | | | (335,327,877 | ) | | | (110,695,030 | ) | | | (7,987,656 | ) | | | (17,472,121 | ) | | | (471,482,684 | ) |
| | | | | |
Charged (credit) to the statement of income | | | (30,186,121 | ) | | | (162,217,672 | ) | | | (5,886,405 | ) | | | 1,948,137 | | | | (196,342,061 | ) |
At December 31, 2014 | | | (365,513,998 | ) | | | (272,912,702 | ) | | | (13,874,061 | ) | | | (15,523,984 | ) | | | (667,824,745 | ) |
| | | | | | | | | | | | | | | | | | | | |
| | | | | |
Deferred tax assets | | Tax losses
carry forward | | | Bad debt
provision | | | Provisions | | | Other | | | Total | |
| | | ThCh$ | | | ThCh$ | | | ThCh$ | | | ThCh$ | | | ThCh$ | |
As of 1 January 2013 | | | 120,720,440 | | | | 25,227,789 | | | | 60,657,224 | | | | 62,074,943 | | | | 268,680,396 | |
Charged (credit) to the Statement of Income | | | 54,216,492 | | | | 1,511,174 | | | | (1,702,793 | ) | | | (10,146,702 | ) | | | 43,878,171 | |
Charged directly to equity | | | — | | | | — | | | | — | | | | (697,371 | ) | | | (697,371 | ) |
| | | | | | | | | | | | | | | | | | | | |
| | | | | |
At December 31, 2013 | | | 174,936,932 | | | | 26,738,963 | | | | 58,954,431 | | | | 51,230,870 | | | | 311,861,196 | |
| | | | | | | | | | | | | | | | | | | | |
| | | | | |
Charged (credit) to the Statement of Income | | | 176,027,822 | | | | (5,413,433 | ) | | | 5,564,767 | | | | (4,313,579 | ) | | | 171,865,577 | |
Charged directly to equity | | | — | | | | — | | | | — | | | | 614,276 | | | | 614,276 | |
| | | | | | | | | | | | | | | | | | | | |
| | | | | |
At December 31, 2014 | | | 350,964,754 | | | | 21,325,530 | | | | 64,519,198 | | | | 47,531,567 | | | | 484,341,049 | |
| | | | | | | | | | | | | | | | | | | | |
F-117
| 16.4 | Compensation of deferred income tax assets and liabilities |
The deferred tax assets and liabilities are offset when there is a legal right to compensate the current tax assets against the current tax liabilities and when the deferred income tax assets and liabilities are related to the income tax levied on the same tax authority and the same entity.
The compensated amounts are detailed below:
| | | | | | | | | | | | |
Concept | | Gross assets/
liabilities | | | Compensated
values | | | Compensated
values | |
Deferred income tax assets | | | 311,861,196 | | | | (1,677 | ) | | | 311,859,519 | |
Deferred income tax liabilities | | | (471,482,684 | ) | | | 1,677 | | | | (471,481,007 | ) |
| | | (159,621,488 | ) | | | — | | | | (159,621,488 | ) |
Final balance at December 31, 2013 | | | 484,341,049 | | | | 7,057,132 | | | | 491,398,181 | |
| | | (667,824,745 | ) | | | (7,057,132 | ) | | | (674,881,877 | ) |
Deferred income tax assets | | | (183,483,696 | ) | | | — | | | | (183,483,696 | ) |
| | | | | | | | | | | | |
| 16.5 | Current income tax assets and current income tax liabilities |
The composition of this item as of December 31, 2014 and 2013 is the following:
| | | | | | | | |
Current tax assets | | 12/31/2014 | | | 12/31/2013 | |
| | | ThCh$ | | | ThCh$ | |
Current tax assets, total | | | 54,196,417 | | | | 13,531,336 | |
| | | | | | | | |
| | |
Current tax assets | | | 54,196,417 | | | | 13,531,336 | |
| | | | | | | | |
| | |
Current income tax liabilities | | 12/31/2013 | | | 12/31/2012 | |
| | | ThCh$ | | | ThCh$ | |
Current income tax liabilities, total | | | 60,615,912 | | | | 63,131,459 | |
| | | | | | | | |
| | |
Current income tax liabilities | | | 60,615,912 | | | | 63,131,459 | |
| | | | | | | | |
| | |
Non-current tax assets | | 12/31/2013 | | | 12/31/2012 | |
| | | ThCh$ | | | ThCh$ | |
Minimum presume tax asset | | | 856,902 | | | | 10,763,386 | |
Tax receivable long term | | | 42,190,641 | | | | 42,963,653 | |
| | | | | | | | |
| | |
Non-current tax assets | | | 43,047,543 | | | | 53,727,039 | |
| | | | | | | | |
F-118
| 17 | Other financial liabilities, current and non-current |
The composition of this item as of December 31, 2014 and 2013 is the following:
| 17.1 | Types of interest bearing (accruing) loans |
| | | | | | | | | | | | | | | | |
| | | Balance as of 12/31/2014 | | | Balance as of 12/31/2013 | |
Loans | | Current | | | Non-current | | | Current | | | Non-current | |
| | | ThCh$ | | | ThCh$ | | | ThCh$ | | | ThCh$ | |
Bank loans (1) | | | 629,083,332 | | | | 695,092,202 | | | | 441,070,635 | | | | 420,811,688 | |
Bond debt (2) | | | 50,539,046 | | | | 1,656,384,016 | | | | 74,815,992 | | | | 1,676,045,068 | |
Other loans—leases | | | 2,671,208 | | | | 31,558,878 | | | | 4,808,673 | | | | 27,779,079 | |
Other financial liabilities (CCS) | | | — | | | | — | | | | — | | | | — | |
Other financial liabilities (hedge activities) | | | — | | | | — | | | | — | | | | — | |
Time deposits (3) | | | — | | | | — | | | | 147,454,456 | | | | 48,923,826 | |
Term savings accounts | | | — | | | | — | | | | 1,049,251 | | | | — | |
Letters of credit | | | — | | | | — | | | | — | | | | 9,511,591 | |
Deposits and other demand deposits | | | — | | | | — | | | | 3,414,407 | | | | — | |
Debt purchase Bretas (4) | | | — | | | | 12,697,096 | | | | 46,273,935 | | | | — | |
Debt purchase Prezunic | | | 21,539,582 | | | | 4,891,649 | | | | 2,400,861 | | | | 32,938,814 | |
| | | | |
Debt purchase Johnson (see 13) | | | 4,003,417 | | | | — | | | | 5,052,315 | | | | — | |
Debt M. Rodriguez | | | — | | | | 2,092,404 | | | | — | | | | 1,980,934 | |
Other Financial liabilities—other | | | 5,939,949 | | | | — | | | | 12,450,378 | | | | — | |
| | | | | | | | | | | | | | | | |
| | | | |
Totals Loans | | | 713,776,534 | | | | 2,402,716,245 | | | | 738,790,903 | | | | 2,217,991,000 | |
| | | | | | | | | | | | | | | | |
| | |
Financial liabilities at fair value through profit or loss | | Balance as of 12/31/2014 | | | Balance as of 12/31/2013 | |
| | Current | | | Non-current | | | Current | | | Non-current | |
| | | ThCh$ | | | ThCh$ | | | ThCh$ | | | ThCh$ | |
| | | | |
Other financial liabilities (Non Hedging derivatives) | | | — | | | | — | | | | — | | | | — | |
| | | | |
Other financial liabilities (Hedging derivatives) | | | 382,754 | | | | — | | | | 314,911 | | | | 44,025 | |
| | | | | | | | | | | | | | | | |
| | | | |
Total Other Financial Liabilities | | | 382,754 | | | | — | | | | 314,911 | | | | 44,025 | |
Total | | | 714,159,288 | | | | 2,402,716,245 | | | | 739,105,814 | | | | 2,218,035,025 | |
| | | | | | | | | | | | | | | | |
| (1) | Bank loans correspond to loans taken out with banks and financial institutions. (See Note 17.2) |
| (2) | Bond debt corresponds to bonds placed in public securities markets or issued to the public in general. |
| (3) | Time deposits are the main funding source of the subsidiary, Banco Paris in Chile. Deposits taken by Chilean clients of Banco Paris are mainly money market deposits, which are 390 persons, 19 institutions, and 3 companies. The average maturity of these deposits is 196 days (2013: 233 days) and an average interest rate of 0,46% (2013: 0,54%) as of December 31, 2014 |
Time deposits, term savings accounts, letters of credit and demand deposits were reclassified at December 31, 2014 as Liabilities included in groups of assets for disposal classified as held for sale. See note 34.
Description of transaction and accounting recognition
On March 13, 2012, the Company entered into a short-term facility for approximately U.S.$200 million (ThCh$ 96,942) with an affiliate of Banco Bilbao Vizcaya Argentaria, S.A., as lender, to finance our investing activities,
F-119
including capital expenditures, and to refinance certain short-term liabilities, including repayment of overdraft lines (“BBVAShort-Term Loan”). The BBVA Short-Term Loan bears interest at an annual rate of the Tasa Cámara, an indexed interest rate established by ABIF, plus 1.86%, and has a maturity date of March 13, 2013. On July 27, 2012 the Company paid U.S.$200 million (ThCh$ 99,852) of this short term facility.
On April 27, 2012, the Company entered into a U.S.$750 million (ThCh$ 362,558) committed credit facility with J.P. Morgan Chase National Association, an affiliate of J.P. Morgan Securities LLC (“J.P. Morgan”), Morgan Stanley Bank, N.A., an affiliate of Morgan Stanley & Co. LLC (“Morgan Stanley”), The Bank of Tokyo—Mitsubishi UFJ, Ltd. and Mizuho Corporate Bank Ltd., as lenders, (the “J.P. Morgan Credit Facility”) in order to finance the Company’s short-term funding requirements, including capital expenditures, interest expense and tax obligations. As of May 7, 2012, amounts drawn under the J.P. Morgan Credit Facility totaled U.S.$250 million (ThCh$ 120,860). The J.P. Morgan Credit Facility bears an interest rate of LIBOR, as adjusted for statutory reserve requirements for euro currency liabilities, plus a margin of 1.25% for the first six months, 1.50% for the following three months, and 1.75% thereafter. The J.P. Morgan Credit Facility matures on March 13, 2013. On August 2, 2012 the company repaid US$250 million (ThCh$ 121,150).
On December 27, 2012 de Company repaid US$ 150 million (ThCh$ 71,994,000) corresponding to the loan agreement signed between Cencosud S.A. and BBVA Bancomer S.A., as Managing Agent, on February 11, 2008.
On October 17, 2012 Cencosud S.A. and JPMorgan Chase Bank, National Association as administrative agent, JPMorgan securities LLC, acting as global coordinator and J.P. Morgan Securities LLC as Book runner and Lead Arranger entered into a Credit Agreement, under the New York Law, USA by US$2,500 million (ThCh$1,199,900,000). On December 06, 2012 the Company repaid US$1,000 million. (See 17.2)
On December 6, 2012 the Company signed a bond issuance pursuant to Rule 144A under the Securities Act by US$1,200 million (ThCh$575,952,000) (see 17.3.1).
On March 26, 2014, the company took long-term credit for U.S. $50 million (ThCh$ 27,788) with Rabobank Curacao N.V. to finance our investing activities, including capital expenditures, and to refinance certain short-term liabilities, including repayment of overdraft lines of short-term loan.
On March 27, 2014, the company took long-term credit for U.S. $50 million (ThCh$ 27,572) with Mizuho Bank Ltd. to finance our investing activities, including capital expenditures, and to refinance certain short-term liabilities, including repayment of overdraft lines of short-term loan.
On March 31, 2014, the company took long-term credit for ThCh $50,000,000 with Bank Santander Chile S.A. to refinance certain short-term liabilities, including capital expenditures. On march 31, 2014 the Company pre-paid ThCh$ 50.000.000 for credit Banco Itaú Chile.
On April 01, 2014, the company took long-term credit for U.S. $50 million (ThCh$ 27,559) with Sumitomo Mitsui Banking Corporation, to finance our investing activities, including capital expenditures, and to refinance certain short-term liabilities, including repayment of overdraft lines of short-term loan.
On November 13, 2014, the company took short-term credit for U.S. $400 million (ThCh$ 238,080) with HSBC Bank USA N.A. (U.S. $200 million) and The Bank Of Nova Scotia (U.S. $200 million). On November 18, 2014 the Company pre-paid US$400 million for Series of Bonds A – C and D.
F-120
| 17.2 | Bank loans—breakdown of currency and maturity dates |
| | | | | | | | | | | | | | | | | | | | | | | | | | | | | | | | | | | | | | | | | | | | |
| At December 31, 2014 | | | | | | | | | | | | Current | | | Non-current | |
Segment | | ID | | Creditor name | | Currency | | Amortization type | | Effective
interest
rate | | | Nominal
rate | | | Expiration | | | Total
Current at
12/31/2013 | | | Expiration | | | Total non-
current at
12/31/2014 | |
| | | | | | | | Up to 90
days | | | 90 days to
1 year | | | | 1 to 3 year | | | 3 to 5 years | | | 5 or more
years | | |
| | | | | | | | | | | % | | | % | | | ThCh$ | | | ThCh$ | | | ThCh$ | | | ThCh$ | | | ThCh$ | | | ThCh$ | | | ThCh$ | |
Chile | | 97.004.000-5 | | BANCO DE CHILE S.A. | | USD | | Monthly | | | 0,74 | % | | | 0,74 | % | | | 6,345,594 | | | | — | | | | 6,345,594 | | | | — | | | | — | | | | — | | | | — | |
| | 97.004.000-5 | | BANCO DE CHILE S.A. | | Ch$ | | At maturity | | | 4,44 | % | | | 4,19 | % | | | — | | | | 48,928,183 | | | | 48,928,183 | | | | — | | | | — | | | | — | | | | — | |
| | 97.015.000-5 | | BANCO SANTANDER CHILE S.A. | | USD | | Monthly | | | 0,76 | % | | | 0,76 | % | | | 9,956,500 | | | | — | | | | 9,956,500 | | | | — | | | | — | | | | — | | | | — | |
| | 97.015.000-5 | | BANCO SANTANDER CHILE S.A. | | Ch$ | | Monthly | | | 0,37 | % | | | 0,37 | % | | | — | | | | — | | | | — | | | | — | | | | — | | | | — | | | | — | |
| | 97.015.000-5 | | BANCO SANTANDER CHILE S.A. | | USD | | Monthly | | | 0,71 | % | | | 0,71 | % | | | 80,328 | | | | — | | | | 80,328 | | | | — | | | | — | | | | — | | | | — | |
| | 97.015.000-5 | | BANCO SANTANDER CHILE S.A. | | Ch$ | | At maturity | | | 5,39 | % | | | 4,91 | % | | | 479,854 | | | | — | | | | 479,854 | | | | 32,753,765 | | | | — | | | | — | | | | 32,753,765 | |
| | 97.015.000-5 | | BANCO SANTANDER CHILE S.A. | | Ch$ | | At maturity | | | 6,59 | % | | | 6,28 | % | | | 802,444 | | | | — | | | | 802,444 | | | | — | | | | 49,790,285 | | | | — | | | | 49,790,285 | |
| | 97.006.000-6 | | BANCO DE CREDITO E INVERSIONES S.A. | | Ch$ | | ANNUAL | | | 4,44 | % | | | 4,44 | % | | | 121,792 | | | | 12,470,629 | | | | 12,592,421 | | | | — | | | | — | | | | — | | | | — | |
| | 97.018.000-1 | | BANCO SCOTIABANK | | Ch$ | | Monthly | | | 0,27 | % | | | 0,27 | % | | | 60,016,440 | | | | — | | | | 60,016,440 | | | | — | | | | — | | | | — | | | | — | |
| | 97.080.000-K | | BANCO BICE S.A | | Ch$ | | At maturity | | | 4,55 | % | | | 4,29 | % | | | 244,530 | | | | — | | | | 244,530 | | | | 18,940,445 | | | | — | | | | — | | | | 18,940,445 | |
| | 97.032.000-8 | | BANCO BILBAO VIZCAYA ARGENTARIA CHILE S.A. | | Ch$ | | Semiannual | | | 4,28 | % | | | 3,97 | % | | | 4,403,175 | | | | 3,500,000 | | | | 7,903,175 | | | | 62,678,017 | | | | — | | | | — | | | | 62,678,017 | |
| | 97.032.000-8 | | BANCO BILBAO VIZCAYA ARGENTARIA CHILE S.A. | | Ch$ | | Semiannual | | | 4,22 | % | | | 4,19 | % | | | 686,432 | | | | — | | | | 686,432 | | | | 1,740,985 | | | | 12,186,894 | | | | 20,665,082 | | | | 34,592,961 | |
| | 97.032.000-8 | | BANCO BILBAO VIZCAYA ARGENTARIA CHILE S.A. | | Ch$ | | ANNUAL | | | 0,72 | % | | | 0,72 | % | | | 2,623,112 | | | | — | | | | 2,623,112 | | | | — | | | | — | | | | — | | | | — | |
| | 97.032.000-8 | | BANCO BILBAO VIZCAYA ARGENTARIA CHILE S.A. | | Ch$ | | Monthly | | | 0,36 | % | | | 0,36 | % | | | 4,024,656 | | | | — | | | | 4,024,656 | | | | — | | | | — | | | | — | | | | — | |
F-121
| | | | | | | | | | | | | | | | | | | | | | | | | | | | | | | | | | | | | | | | | | | | |
| At December 31, 2014 | | | | | | | | | | | | Current | | | Non-current | |
Segment | | ID | | Creditor name | | Currency | | Amortization type | | Effective
interest
rate | | | Nominal
rate | | | Expiration | | | Total
Current at
12/31/2013 | | | Expiration | | | Total non-
current at
12/31/2014 | |
| | | | | | | | Up to 90
days | | | 90 days to
1 year | | | | 1 to 3 year | | | 3 to 5 years | | | 5 or more
years | | |
| | | | | | | | | | | % | | | % | | | ThCh$ | | | ThCh$ | | | ThCh$ | | | ThCh$ | | | ThCh$ | | | ThCh$ | | | ThCh$ | |
| | 97.030.000-6 | | BANCO DEL ESTADO DE CHILE S.A. | | Ch$ | | At maturity | | | 4,31 | % | | | 4,31 | % | | | 19,041 | | | | — | | | | 19,041 | | | | 39,155,857 | | | | 39,754,050 | | | | — | | | | 78,909,907 | |
| | O-E | | BANCO SCOTIABANK | | USD | | Semiannual | | | 2,11 | % | | | 1,82 | % | | | — | | | | 20,041,910 | | | | 20,041,910 | | | | 40,351,158 | | | | — | | | | — | | | | 40,351,158 | |
| | O-E | | BANCO RABOBANK CURACAO N.V. | | USD | | Annual | | | 4,16 | % | | | 3,86 | % | | | — | | | | 3,285,735 | | | | 3,285,735 | | | | 12,135,000 | | | | 12,074,130 | | | | — | | | | 24,209,130 | |
| | O-E | | BANCO RABOBANK CURACAO N.V. | | USD | | At maturity | | | 2,12 | % | | | 1,93 | % | | | 156,169 | | | | — | | | | 156,169 | | | | — | | | | 20,225,000 | | | | 9,901,043 | | | | 30,126,043 | |
| | O-E | | BANCO MIZUHO | | USD | | Semiannual | | | 2,10 | % | | | 1,73 | % | | | 135,634 | | | | — | | | | 135,634 | | | | 15,168,750 | | | | 14,874,819 | | | | — | | | | 30,043,569 | |
| | O-E | | BANCO SUMITOMO | | USD | | Semiannual | | | 2,06 | % | | | 1,72 | % | | | 132,717 | | | | — | | | | 132,717 | | | | 12,135,000 | | | | 17,911,506 | | | | — | | | | 30,046,506 | |
| | O-E | | BANCO HSBC | | USD | | At maturity | | | 0,36 | % | | | 0,36 | % | | | 242,188,773 | | | | — | | | | 242,188,773 | | | | — | | | | — | | | | — | | | | — | |
| | | | | | | | | | | | | |
Argentina | | O-E | | BANCO GALICIA | | ARS | | Monthly | | | 31,75 | % | | | 31,75 | % | | | 1,794,597 | | | | — | | | | 1,794,597 | | | | — | | | | — | | | | — | | | | — | |
| | O-E | | BAPRO | | ARS | | MONTHLY | | | 28,00 | % | | | 28,00 | % | | | 883,494 | | | | — | | | | 883,494 | | | | — | | | | — | | | | — | | | | — | |
| | O-E | | BANCO GALICIA | | ARS | | TRIMESTRAL | | | 15,01 | % | | | 15,01 | % | | | 262,283 | | | | 702,603 | | | | 964,886 | | | | — | | | | — | | | | — | | | | — | |
| | O-E | | BANCO FRANCES | | ARS | | MONTHLY | | | 35,00 | % | | | 35,00 | % | | | 113,552 | | | | — | | | | 113,552 | | | | — | | | | — | | | | — | | | | — | |
| | O-E | | BANCO GALICIA | | ARS | | MONTHLY | | | 28,00 | % | | | 28,00 | % | | | 10,083 | | | | — | | | | 10,083 | | | | — | | | | — | | | | — | | | | — | |
| | O-E | | BANCO IFC | | USD | | MONTHLY | | | 1,88 | % | | | 1,88 | % | | | 2,390,249 | | | | 2,302,207 | | | | 4,692,456 | | | | 4,633,786 | | | | — | | | | — | | | | 4,633,786 | |
| | O-E | | BANCO GALICIA | | ARS | | MONTHLY | | | 15,01 | % | | | 15,01 | % | | | 157,711 | | | | 496,559 | | | | 654,270 | | | | 47 | | | | — | | | | — | | | | 47 | |
| | O-E | | BANCO ITAU | | ARS | | MONTHLY | | | 29,50 | % | | | 29,50 | % | | | 14,088,930 | | | | — | | | | 14,088,930 | | | | — | | | | — | | | | — | | | | — | |
| | O-E | | BANCO CIUDAD | | ARS | | TRIMESTRAL | | | 28,00 | % | | | 28,00 | % | | | 3,619,470 | | | | — | | | | 3,619,470 | | | | — | | | | — | | | | — | | | | — | |
| | | | | | | | | | | | | |
Colombia | | O-E | | HELM BANK | | COP | | SEMIANNUAL | | | 6,69 | % | | | 6,69 | % | | | — | | | | 2,271,349 | | | | 2,271,349 | | | | — | | | | — | | | | — | | | | — | |
| | O-E | | BANCO COLPATRIA | | COP | | At maturity | | | 7,37 | % | | | 7,13 | % | | | 552,825 | | | | — | | | | 552,825 | | | | — | | | | — | | | | — | | | | — | |
| | O-E | | BANCO DE BOGOTÁ | | COP | | At maturity | | | 5,00 | % | | | 4,89 | % | | | 42,642 | | | | 953,492 | | | | 996,134 | | | | — | | | | — | | | | — | | | | — | |
| | O-E | | BANCO DE BOGOTÁ | | COP | | At maturity | | | 6,48 | % | | | 6,38 | % | | | 41,550 | | | | — | | | | 41,550 | | | | 1,750,000 | | | | — | | | | — | | | | 1,750,000 | |
| | O-E | | BANCO DE BOGOTÁ | | COP | | At maturity | | | 6,87 | % | | | 6,76 | % | | | 308,688 | | | | — | | | | 308,688 | | | | — | | | | 12,750,000 | | | | — | | | | 12,750,000 | |
| | O-E | | BANCO DE BOGOTÁ | | COP | | At maturity | | | 6,87 | % | | | 6,76 | % | | | 469,946 | | | | — | | | | 469,946 | | | | — | | | | 19,410,586 | | | | — | | | | 19,410,586 | |
| | O-E | | BANCO DE BOGOTÁ | | COP | | At maturity | | | 6,85 | % | | | 6,74 | % | | | 78,581 | | | | — | | | | 78,581 | | | | — | | | | 3,500,000 | | | | — | | | | 3,500,000 | |
| | O-E | | BANCO BBVA | | COP | | At maturity | | | 8,31 | % | | | 8,15 | % | | | 475,809 | | | | — | | | | 475,809 | | | | — | | | | 16,690,669 | | | | — | | | | 16,690,669 | |
F-122
| | | | | | | | | | | | | | | | | | | | | | | | | | | | | | | | | | | | | | | | | | | | |
| At December 31, 2014 | | | | | | | | | | | | Current | | | Non-current | |
Segment | | ID | | Creditor name | | Currency | | Amortization type | | Effective
interest
rate | | | Nominal
rate | | | Expiration | | | Total
Current at
12/31/2013 | | | Expiration | | | Total non-
current at
12/31/2014 | |
| | | | | | | | Up to 90
days | | | 90 days to
1 year | | | | 1 to 3 year | | | 3 to 5 years | | | 5 or more
years | | |
| | | | | | | | | | | % | | | % | | | ThCh$ | | | ThCh$ | | | ThCh$ | | | ThCh$ | | | ThCh$ | | | ThCh$ | | | ThCh$ | |
| | O-E | | BANCO POPULAR | | COP | | At maturity | | | 6,52 | % | | | 6,42 | % | | | 235,421 | | | | — | | | | 235,421 | | | | 11,000,000 | | | | — | | | | — | | | | 11,000,000 | |
| | O-E | | BANCO DE BOGOTÁ | | COP | | At maturity | | | 6,85 | % | | | 6,74 | % | | | 578,130 | | | | — | | | | 578,130 | | | | — | | | | 25,750,000 | | | | — | | | | 25,750,000 | |
| | O-E | | BANCO DADIVENDA | | COP | | At maturity | | | 6,15 | % | | | 5,98 | % | | | 1,044,954 | | | | — | | | | 1,044,954 | | | | — | | | | — | | | | — | | | | — | |
| | O-E | | BANCO CORPBANCA | | COP | | At maturity | | | 6,29 | % | | | 6,12 | % | | | 4,374,370 | | | | — | | | | 4,374,370 | | | | — | | | | — | | | | — | | | | — | |
| | | | | | | | | | | | | |
Brazil | | O-E | | BRADESCO | | Real | | AT MATURITY | | | 12,15 | % | | | 12,15 | % | | | 10,733 | | | | 32,200 | | | | 42,933 | | | | 7,418,775 | | | | — | | | | — | | | | 7,418,775 | |
| | O-E | | BRADESCO | | Real | | AT MATURITY | | | 12,76 | % | | | 12,76 | % | | | 45,697,811 | | | | — | | | | 45,697,811 | | | | — | | | | — | | | | — | | | | — | |
| | O-E | | BRADESCO | | Real | | AT MATURITY | | | 13,28 | % | | | 13,28 | % | | | 412,036 | | | | 1,236,109 | | | | 1,648,145 | | | | 37,984,128 | | | | — | | | | — | | | | 37,984,128 | |
| | O-E | | HSBC | | Real | | AT MATURITY | | | 13,24 | % | | | 13,24 | % | | | 2,747,171 | | | | 8,241,514 | | | | 10,988,685 | | | | 51,510,497 | | | | — | | | | — | | | | 51,510,497 | |
| | O-E | | SANTANDER | | Real | | AT MATURITY | | | 12,32 | % | | | 12,32 | % | | | 38,883,671 | | | | — | | | | 38,883,671 | | | | — | | | | — | | | | — | | | | — | |
| | O-E | | SAFRA | | Real | | AT MATURITY | | | 12,34 | % | | | 12,34 | % | | | 27,510,299 | | | | — | | | | 27,510,299 | | | | — | | | | — | | | | — | | | | — | |
| | O-E | | BANCO DO BRASIL | | Real | | AT MATURITY | | | 13,07 | % | | | 13,07 | % | | | 2,703,136 | | | | 8,109,413 | | | | 10,812,549 | | | | — | | | | — | | | | — | | | | — | |
| | O-E | | BANCO DO NORDESTE | | Real | | MONTHLY | | | 8,50 | % | | | 8,50 | % | | | 86,045 | | | | 258,047 | | | | 344,092 | | | | 813,859 | | | | 271,287 | | | | — | | | | 1,085,146 | |
Peru | | O-E | | BANCO DE CREDITO | | Soles | | TRIMESTRAL | | | 7,34 | % | | | 7,34 | % | | | 321,985 | | | | 973,674 | | | | 1,295,659 | | | | 3,265,561 | | | | — | | | | — | | | | 3,265,561 | |
| | O-E | | BANK OF TOKIO | | USD | | TRIMESTRAL | | | 2,83 | % | | | 2,83 | % | | | 5,465 | | | | 8,451,777 | | | | 8,457,242 | | | | 12,714,604 | | | | — | | | | — | | | | 12,714,604 | |
| | O-E | | BANCO DE CREDITO | | Soles | | TRIMESTRAL | | | 7,71 | % | | | 7,71 | % | | | 189,281 | | | | — | | | | 189,281 | | | | 10,604,773 | | | | 3,548,775 | | | | — | | | | 14,153,548 | |
| | O-E | | BANCO CONTINENTAL | | USD | | SEMIANNUAL | | | 5,15 | % | | | 5,15 | % | | | 352,994 | | | | 4,870,164 | | | | 5,223,158 | | | | 15,793,469 | | | | — | | | | — | | | | 15,793,469 | |
| | O-E | | BANCO BILBAO VIZCAYA | | USD | | TRIMESTRAL | | | 2,24 | % | | | 2,24 | % | | | 2,416,496 | | | | 7,169,495 | | | | 9,585,991 | | | | — | | | | — | | | | — | | | | — | |
| | O-E | | BANCO SCOTIABANK | | Soles | | SEMIANNUAL | | | 7,50 | % | | | 7,50 | % | | | 5,346 | | | | 2,828,231 | | | | 2,833,577 | | | | 5,671,012 | | | | — | | | | — | | | | 5,671,012 | |
| | O-E | | BANCO CONTINENTAL | | Soles | | AT MATURITY | | | 6,67 | % | | | 6,67 | % | | | 289,967 | | | | — | | | | 289,967 | | | | 17,568,588 | | | | — | | | | — | | | | 17,568,588 | |
| | O-E | | CMAC TRUJILLO | | Soles | | AT MATURITY | | | 5,35 | % | | | 5,35 | % | | | 624,682 | | | | — | | | | 624,682 | | | | — | | | | — | | | | — | | | | — | |
| | O-E | | CMAC TRUJILLO | | Soles | | AT MATURITY | | | 5,26 | % | | | 5,26 | % | | | 416,219 | | | | — | | | | 416,219 | | | | — | | | | — | | | | — | | | | — | |
| | O-E | | CMAC TRUJILLO | | Soles | | AT MATURITY | | | 5,30 | % | | | 5,30 | % | | | 208,119 | | | | — | | | | 208,119 | | | | — | | | | — | | | | — | | | | — | |
| | O-E | | BANCO RIPLEY | | Soles | | AT MATURITY | | | 3,90 | % | | | 3,90 | % | | | 2,638,651 | | | | — | | | | 2,638,651 | | | | — | | | | — | | | | — | | | | — | |
| | O-E | | BCP | | Soles | | AT MATURITY | | | 6,34 | % | | | 6,34 | % | | | 1,253,228 | | | | — | | | | 1,253,228 | | | | — | | | | — | | | | — | | | | — | |
| | O-E | | BCP | | Soles | | AT MATURITY | | | 6,34 | % | | | 6,34 | % | | | 1,246,230 | | | | — | | | | 1,246,230 | | | | — | | | | — | | | | — | | | | — | |
| | | | | | | | | | | | | | | | | | | | | | | | | | | | | | | | | | | | | | | | | | | | |
| | | | | | | | | | | | | |
| | | | TOTAL | | | | | | | | | | | | | | | 491,960,041 | | | | 137,123,291 | | | | 629,083,332 | | | | 415,788,076 | | | | 248,738,001 | | | | 30,566,125 | | | | 695,092,202 | |
| | | | | | | | | | | | | | | | | | | | | | | | | | | | | | | | | | | | | | | | | | | | |
F-123
| | | | | | | | | | | | | | | | | | | | | | | | | | | | | | | | | | | | | | | | | | | | |
| At December 31, 2013 | | | | | | | | | | | | Current | | | Non-current | |
Segment | | ID | | Creditor name | | Currency | | Amortization type | | Effective
interest
rate | | | Nominal
rate | | | Expiration | | | Total
Current at
12/31/2013 | | | Expiration | | | Total non-
current at
12/31/2013 | |
| | | | | | | | Up to 90
days | | | 90 days to
1 year | | | | 1 to 3 year | | | 3 to 5 years | | | 5 or more
years | | |
| | | | | | | | | | | % | | | % | | | ThCh$ | | | ThCh$ | | | ThCh$ | | | ThCh$ | | | ThCh$ | | | ThCh$ | | | ThCh$ | |
Chile | | 97.004.000-5 | | BANCO DE CHILE S.A. | | USD | | Monthly | | | 1.25 | % | | | 1.25 | % | | | 5,208,647 | | | | — | | | | 5,208,647 | | | | — | | | | — | | | | — | | | | — | |
| | 97.004.000-5 | | BANCO DE CHILE S.A. | | Ch$ | | At maturity | | | 7.40 | % | | | 7.03 | % | | | 637,290 | | | | — | | | | 637,290 | | | | 48,311,138 | | | | — | | | | — | | | | 48,311,138 | |
| | 97.015.000-5 | | BANCO SANTANDER CHILE S.A. | | USD | | Monthly | | | 1.80 | % | | | 1.80 | % | | | 7,093 | | | | — | | | | 7,093 | | | | — | | | | — | | | | — | | | | — | |
| | 97.015.000-5 | | BANCO SANTANDER CHILE S.A. | | USD | | Monthly | | | 0.75 | % | | | 0.75 | % | | | 3,594,199 | | | | — | | | | 3,594,199 | | | | — | | | | — | | | | — | | | | — | |
| | 97.015.000-5 | | BANCO SANTANDER CHILE S.A. | | Ch$ | | Monthly | | | 0.40 | % | | | 0.40 | % | | | 31,341,511 | | | | — | | | | 31,341,511 | | | | — | | | | — | | | | — | | | | — | |
| | 97.015.000-5 | | BANCO SANTANDER CHILE S.A. | | USD | | Monthly | | | 0.71 | % | | | 0.49 | % | | | 297,431 | | | | — | | | | 297,431 | | | | — | | | | — | | | | — | | | | — | |
| | 97.015.000-5 | | BANCO SANTANDER CHILE S.A. | | Ch$ | | At maturity | | | 7.29 | % | | | 6.85 | % | | | 637,199 | | | | — | | | | 637,199 | | | | 32,684,335 | | | | — | | | | — | | | | 32,684,335 | |
| | 97.006.000-6 | | BANCO DE CREDITO E INVERSIONES S.A. | | Ch$ | | Annual | | | 6.47 | % | | | 6.09 | % | | | 329,875 | | | | 12,500,000 | | | | 12,829,875 | | | | 12,445,145 | | | | — | | | | — | | | | 12,445,145 | |
| | 76.645.030-K | | BANCO ITAU CHILE S.A. | | Ch$ | | At maturity | | | 0.00 | % | | | 6.31 | % | | | — | | | | 25,360,125 | | | | 25,360,125 | | | | — | | | | — | | | | — | | | | — | |
| | 76.645.030-K | | BANCO ITAU CHILE S.A. | | Ch$ | | At maturity | | | 6.52 | % | | | 6.03 | % | | | 314,608 | | | | 25,000,000 | | | | 25,314,608 | | | | — | | | | — | | | | — | | | | — | |
| | 97.080.000-K | | BANCO BICE S.A | | Ch$ | | At maturity | | | 7.00 | % | | | 6.63 | % | | | 326,610 | | | | — | | | | 326,610 | | | | 18,915,908 | | | | — | | | | — | | | | 18,915,908 | |
| | 97.032.000-8 | | BANCO BILBAO VIZCAYA ARGENTARIA CHILE S.A. | | Ch$ | | Semiannual | | | 6.87 | % | | | 6.45 | % | | | 1,285,667 | | | | — | | | | 1,285,667 | | | | 34,775,521 | | | | 34,775,521 | | | | — | | | | 69,551,042 | |
| | 97.032.000-8 | | BANCO BILBAO VIZCAYA ARGENTARIA CHILE S.A. | | Ch$ | | At maturity | | | 0.00 | % | | | 6.05 | % | | | 883,598 | | | | 8,704,924 | | | | 9,588,522 | | | | 25,970,631 | | | | — | | | | — | | | | 25,970,631 | |
F-124
| | | | | | | | | | | | | | | | | | | | | | | | | | | | | | | | | | | | | | | | | | | | |
| At December 31, 2013 | | | | | | | | | | | | Current | | | Non-current | |
Segment | | ID | | Creditor name | | Currency | | Amortization type | | Effective
interest
rate | | | Nominal
rate | | | Expiration | | | Total
Current at
12/31/2013 | | | Expiration | | | Total non-
current at
12/31/2013 | |
| | | | | | | | Up to 90
days | | | 90 days to
1 year | | | | 1 to 3 year | | | 3 to 5 years | | | 5 or more
years | | |
| | | | | | | | | | | % | | | % | | | ThCh$ | | | ThCh$ | | | ThCh$ | | | ThCh$ | | | ThCh$ | | | ThCh$ | | | ThCh$ | |
| | 97.032.000-8 | | BANCO BILBAO VIZCAYA ARGENTARIA CHILE S.A. | | Ch$ | | Annual | | | 0.65 | % | | | 0.65 | % | | | 1,314,274 | | | | — | | | | 1,314,274 | | | | — | | | | — | | | | — | | | | — | |
| | 97.032.000-8 | | BANCO BILBAO VIZCAYA ARGENTARIA CHILE S.A. | | Ch$ | | Monthly | | | 0.40 | % | | | 0.40 | % | | | 5,171,090 | | | | — | | | | 5,171,090 | | | | — | | | | — | | | | — | | | | — | |
| | 97.030.000-6 | | BANCO DEL ESTADO DE CHILE S.A. | | Ch$ | | Annual | | | 5.99 | % | | | 5.49 | % | | | 26,193 | | | | 39,754,050 | | | | 39,780,243 | | | | 39,513,970 | | | | — | | | | — | | | | 39,513,970 | |
| | 97.030.000-6 | | BANCO DEL ESTADO DE CHILE S.A. | | Ch$ | | Monthly | | | 0.40 | % | | | 0.40 | % | | | 23,490,221 | | | | — | | | | 23,490,221 | | | | — | | | | — | | | | — | | | | — | |
| | 97.053.000-2 | | BANCO SECURITY S.A. | | Ch$ | | Monthly | | | 1.02 | % | | | 0.81 | % | | | 1,851,487 | | | | — | | | | 1,851,487 | | | | — | | | | — | | | | — | | | | — | |
| | 97.053.000-2 | | BANCO SECURITY S.A. | | USD | | Monthly | | | 1.21 | % | | | 1.21 | % | | | 12,443 | | | | — | | | | 12,443 | | | | — | | | | — | | | | — | | | | — | |
| | O-E | | BANCO SCOTIABANK | | USD | | Semiannual | | | 2.35 | % | | | 2.06 | % | | | 192,382 | | | | — | | | | 192,382 | | | | 34,759,364 | | | | 17,377,074 | | | | — | | | | 52,136,438 | |
| | O-E | | BANCO RABOBANK CURACAO N.V. | | USD | | Annual | | | 4.16 | % | | | 3.86 | % | | | — | | | | 2,855,924 | | | | 2,855,924 | | | | 8,049,815 | | | | 15,912,033 | | | | — | | | | 23,961,848 | |
| | | | | | | | | | | | | |
Argentina | | O-E | | BANCO FRANCES | | ARS | | Monthly | | | 30.00 | % | | | 30.00 | % | | | 4,330,362 | | | | — | | | | 4,330,362 | | | | — | | | | — | | | | — | | | | — | |
| | O-E | | BANCO GALICIA | | ARS | | Quarterly | | | 15.01 | % | | | 15.01 | % | | | — | | | | 537,420 | | | | 537,420 | | | | 543,308 | | | | — | | | | — | | | | 543,308 | |
| | O-E | | STANDARD BANK | | ARS | | Quarterly | | | 15.01 | % | | | 15.01 | % | | | — | | | | 537,420 | | | | 537,420 | | | | 543,308 | | | | — | | | | — | | | | 543,308 | |
| | O-E | | BANCO MACRO | | ARS | | Monthly | | | 26.25 | % | | | 26.25 | % | | | 4,024,500 | | | | — | | | | 4,024,500 | | | | — | | | | — | | | | — | | | | — | |
| | O-E | | BANCO FRANCES | | ARS | | Monthly | | | 21.50 | % | | | 21.50 | % | | | 5,231,850 | | | | — | | | | 5,231,850 | | | | — | | | | — | | | | — | | | | — | |
| | O-E | | BANCO GALICIA | | ARS | | Monthly | | | 33.00 | % | | | 33.00 | % | | | 1,781,860 | | | | — | | | | 1,781,860 | | | | — | | | | — | | | | — | | | | — | |
| | O-E | | BANCO GALICIA | | ARS | | Monthly | | | 12.50 | % | | | 12.50 | % | | | 229,988 | | | | — | | | | 229,988 | | | | — | | | | — | | | | — | | | | — | |
| | O-E | | BANCO IFC | | USD | | Monthly | | | 1.95 | % | | | 1.95 | % | | | — | | | | 4,091,006 | | | | 4,091,006 | | | | 8,009,547 | | | | — | | | | — | | | | 8,009,547 | |
| | O-E | | BANCO FRANCES | | ARS | | Monthly | | | 33.00 | % | | | 33.00 | % | | | 458,793 | | | | — | | | | 458,793 | | | | — | | | | — | | | | — | | | | — | |
| | O-E | | BANCO GALICIA | | ARS | | Monthly | | | 30.00 | % | | | 30.00 | % | | | 1,297,713 | | | | — | | | | 1,297,713 | | | | — | | | | — | | | | — | | | | — | |
| | O-E | | BANCO FRANCES | | ARS | | Monthly | | | 30.00 | % | | | 30.00 | % | | | 13,742,811 | | | | — | | | | 13,742,811 | | | | 715,467 | | | | — | | | | — | | | | 715,467 | |
| | O-E | | BANCO GALICIA | | ARS | | Quarterly | | | 15.01 | % | | | 15.01 | % | | | — | | | | 768,584 | | | | 768,584 | | | | — | | | | — | | | | — | | | | — | |
| | O-E | | BANCO FRANCES | | ARS | | Monthly | | | 26.00 | % | | | 26.00 | % | | | 8,049,000 | | | | — | | | | 8,049,000 | | | | — | | | | — | | | | — | | | | — | |
| | O-E | | BANCO MACRO | | ARS | | Monthly | | | 18.50 | % | | | 18.50 | % | | | 4,024,500 | | | | — | | | | 4,024,500 | | | | — | | | | — | | | | — | | | | — | |
| | | | | | | | | | | | | |
Colombia | | O-E | | BANCO DAVIVIENDA | | COP | | Monthly | | | 5.98 | % | | | 5.98 | % | | | 949,691 | | | | — | | | | 949,691 | | | | — | | | | — | | | | — | | | | — | |
| | O-E | | BANCO DAVIVIENDA | | COP | | Monthly | | | 5.88 | % | | | 5.88 | % | | | 948,221 | | | | — | | | | 948,221 | | | | — | | | | — | | | | — | | | | — | |
| | O-E | | BANCO AVVILLAS | | COP | | Monthly | | | 5.89 | % | | | 5.89 | % | | | — | | | | 958,934 | | | | 958,934 | | | | — | | | | — | | | | — | | | | — | |
| | O-E | | BANCO AVVILLAS | | COP | | Monthly | | | 5.56 | % | | | 5.56 | % | | | — | | | | 273,343 | | | | 273,343 | | | | — | | | | — | | | | — | | | | — | |
F-125
| | | | | | | | | | | | | | | | | | | | | | | | | | | | | | | | | | | | | | | | | | | | |
| At December 31, 2013 | | | | | | | | | | | | Current | | | Non-current | |
Segment | | ID | | Creditor name | | Currency | | Amortization type | | Effective
interest
rate | | | Nominal
rate | | | Expiration | | | Total
Current at
12/31/2013 | | | Expiration | | | Total non-
current at
12/31/2013 | |
| | | | | | | | Up to 90
days | | | 90 days to
1 year | | | | 1 to 3 year | | | 3 to 5 years | | | 5 or more
years | | |
| | | | | | | | | | | % | | | % | | | ThCh$ | | | ThCh$ | | | ThCh$ | | | ThCh$ | | | ThCh$ | | | ThCh$ | | | ThCh$ | |
| | O-E | | BANCO AVVILLAS | | COP | | Monthly | | | 5.56 | % | | | 5.56 | % | | | — | | | | 819,969 | | | | 819,969 | | | | — | | | | — | | | | — | | | | — | |
| | O-E | | BANCO AVVILLAS | | COP | | Monthly | | | 5.61 | % | | | 5.61 | % | | | — | | | | 948,981 | | | | 948,981 | | | | — | | | | — | | | | — | | | | — | |
| | O-E | | BANCO DAVIVIENDA | | COP | | Monthly | | | 6,69 | % | | | 6,69 | % | | | — | | | | 949,415 | | | | 949,415 | | | | — | | | | — | | | | — | | | | — | |
| | O-E | | BANCO CITIBANK | | COP | | Monthly | | | 6,64 | % | | | 6,64 | % | | | — | | | | 948,968 | | | | 948,968 | | | | — | | | | — | | | | — | | | | — | |
| | O-E | | BANCO CITIBANK | | COP | | Monthly | | | 6,64 | % | | | 6,64 | % | | | — | | | | 947,728 | | | | 947,728 | | | | — | | | | — | | | | — | | | | — | |
| | O-E | | BANCO HELM BANK | | COP | | Monthly | | | 6,69 | % | | | 6,69 | % | | | — | | | | 947,749 | | | | 947,749 | | | | — | | | | — | | | | — | | | | — | |
| | O-E | | BANCO HELM BANK | | COP | | Semiannual | | | 6,69 | % | | | 6,69 | % | | | 1,461,558 | | | | — | | | | 1,461,558 | | | | — | | | | — | | | | — | | | | — | |
| | O-E | | BANCO COLPATRIA | | COP | | At maturity | | | 6,40 | % | | | 6,22 | % | | | 888,249 | | | | — | | | | 888,249 | | | | — | | | | — | | | | — | | | | — | |
| | O-E | | BANCO DE BOGOTÁ | | COP | | At maturity | | | 5,58 | % | | | 5,44 | % | | | — | | | | 15,828,105 | | | | 15,828,105 | | | | — | | | | — | | | | — | | | | — | |
| | O-E | | BANCO DE BOGOTÁ | | COP | | At maturity | | | 5,58 | % | | | 5,44 | % | | | — | | | | 3,771,445 | | | | 3,771,445 | | | | — | | | | — | | | | — | | | | — | |
| | O-E | | BANCO DE BOGOTÁ | | COP | | At maturity | | | 5.58 | % | | | 5.44 | % | | | — | | | | 1,960,646 | | | | 1,960,646 | | | | — | | | | — | | | | — | | | | — | |
| | O-E | | BANCO DE BOGOTÁ | | COP | | At maturity | | | 6.01 | | | | 5.85 | | | | — | | | | 635,788 | | | | 635,788 | | | | — | | | | — | | | | — | | | | — | |
| | O-E | | BANCO CORPBANCA | | COP | | At maturity | | | 5.54 | | | | 5.40 | | | | — | | | | 28,587,503 | | | | 28,587,503 | | | | — | | | | — | | | | — | | | | — | |
| | | | | | | | | | | | | |
| | O-E | | BANCO BBVA | | COP | | At maturity | | | 5.69 | | | | 5.55 | | | | — | | | | 18,560,403 | | | | 18,560,403 | | | | — | | | | — | | | | — | | | | — | |
| | | | | | | | | | | | | |
| | O-E | | BANCO POPULAR | | COP | | At maturity | | | 5.15 | | | | 5.03 | | | | — | | | | 5,272,805 | | | | 5,272,805 | | | | — | | | | — | | | | — | | | | — | |
| | O-E | | BANCO DE BOGOTÁ | | COP | | At maturity | | | 5.15 | | | | 5.03 | | | | — | | | | 6,920,228 | | | | 6,920,228 | | | | — | | | | — | | | | — | | | | — | |
| | | | | | | | | | | | | |
Brazil | | O-E | | BANCO BNDES | | Real | | Monthly | | | 7.15 | | | | 7.15 | | | | 314,168 | | | | 942,761 | | | | 1,256,929 | | | | — | | | | — | | | | — | | | | — | |
| | | | | | | | | | | | | |
| | O-E | | BANCO BNDES | | Real | | Monthly | | | 7.94 | | | | 7.94 | | | | 344,399 | | | | 1,033,198 | | | | 1,377,597 | | | | — | | | | — | | | | — | | | | — | |
| | | | | | | | | | | | | |
| | O-E | | BANCO BNDES | | Real | | Monthly | | | 7.41 | | | | 7.41 | | | | 96,290 | | | | 288,870 | | | | 385,160 | �� | | | — | | | | — | | | | — | | | | — | |
| | | | | | | | | | | | | |
| | O-E | | BANCO BRADESCO | | Real | | At maturity | | | 12.88 | | | | 12.88 | | | | 8,628 | | | | 25,884 | | | | 34,512 | | | | 7,238,075 | | | | — | | | | — | | | | 7,238,075 | |
| | | | | | | | | | | | | |
| | O-E | | BANCO HSBC | | Real | | At maturity | | | 11.30 | | | | 11.30 | | | | 13,909,523 | | | | 41,728,570 | | | | 55,638,093 | | | | — | | | | — | | | | — | | | | — | |
| | | | | | | | | | | | | |
| | O-E | | BANCO TOKYO - MITSUBHISHI | | Real | | At maturity | | | 11.45 | | | | 11.45 | | | | 4,812,436 | | | | 14,437,307 | | | | 19,249,743 | | | | — | | | | — | | | | — | | | | — | |
| | O-E | | BANCO DO BRASIL | | Real | | At maturity | | | 11.04 | | | | 11.04 | | | | — | | | | — | | | | — | | | | 9,394,201 | | | | — | | | | — | | | | 9,394,201 | |
| | O-E | | BANCO DO NORDESTE | | Real | | Monthly | | | 8.50 | | | | 8.50 | | | | 82,169 | | | | 246,506 | | | | 328,675 | | | | 1,041,737 | | | | 347,246 | | | | — | | | | 1,388,983 | |
Peru | | O-E | | BANCO DE CREDITO | | Soles | | Quarterly | | | 7.34 | | | | 7.34 | | | | 8,231 | | | | 832,540 | | | | 840,771 | | | | 2,468,025 | | | | 1,737,667 | | | | — | | | | 4,205,692 | |
| | O-E | | BANK OF TOKIO | | USD | | Quarterly | | | 2.85 | | | | 2.85 | | | | 3,251 | | | | — | | | | 3,251 | | | | 14,579,758 | | | | 3,666,917 | | | | — | | | | 18,246,675 | |
| | O-E | | BANCO DE CREDITO | | Soles | | Quarterly | | | 7.71 | | | | 7.71 | | | | 221,248 | | | | — | | | | 221,248 | | | | 3,234,862 | | | | 8,733,936 | | | | 1,093,302 | | | | 13,062,100 | |
| | O-E | | BANCO CONTINENTAL | | USD | | Semiannual | | | 5.15 | | | | 5.15 | | | | 1,938,199 | | | | 1,582,976 | | | | 3,521,175 | | | | 9,464,597 | | | | 8,394,101 | | | | — | | | | 17,858,698 | |
| | O-E | | BANCO BILBAO VIZCAYA | | USD | | Quarterly | | | 2.26 | | | | 2.26 | | | | 1,713,884 | | | | 5,011,198 | | | | 6,725,082 | | | | 8,270,117 | | | | — | | | | — | | | | 8,270,117 | |
| | O-E | | BANCO SCOTIABANK | | Soles | | Semiannual | | | 7.50 | | | | 7.50 | | | | 8,224 | | | | — | | | | 8,224 | | | | 5,223,387 | | | | 2,621,675 | | | | — | | | | 7,845,062 | |
F-126
| | | | | | | | | | | | | | | | | | | | | | | | | | | | | | | | | | | | | | | | | | | | |
| At December 31, 2013 | | | | | | | | | | | | Current | | | Non-current | |
Segment | | ID | | Creditor name | | Currency | | Amortization type | | Effective
interest
rate | | | Nominal
rate | | | Expiration | | | Total
Current at
12/31/2013 | | | Expiration | | | Total non-
current at
12/31/2013 | |
| | | | | | | | Up to 90
days | | | 90 days to
1 year | | | | 1 to 3 year | | | 3 to 5 years | | | 5 or more
years | | |
| | | | | | | | | | | % | | | % | | | ThCh$ | | | ThCh$ | | | ThCh$ | | | ThCh$ | | | ThCh$ | | | ThCh$ | | | ThCh$ | |
| | O-E | | BANCO SCOTIABANK | | Soles | | At maturity | | | 4.90 | | | | 4.90 | | | | 96,637 | | | | 6,877,883 | | | | 6,974,520 | | | | — | | | | — | | | | — | | | | — | |
| | O-E | | BANCO CONTINENTAL | | Soles | | At maturity | | | 4.85 | | | | 4.85 | | | | 160,826 | | | | 11,562,452 | | | | 11,723,278 | | | | — | | | | — | | | | — | | | | — | |
| | | | | | | | | | | | | | | | | | | | | | | | | | | | | | | | | | | | | | | | | | | | |
| | | | TOTAL | | | | | | | | | | | | | | | 148,059,027 | | | | 293,011,608 | | | | 441,070,635 | | | | 326,152,216 | | | | 93,566,170 | | | | 1,093,302 | | | | 420,811,688 | |
| | | | | | | | | | | | | | | | | | | | | | | | | | | | | | | | | | | | | | | | | | | | |
F-127
Long Terms Bonds—Short term portion
| | | | | | | | | | | | | | | | | | | | | | | | | | | | | | | | | | |
Inscription number or ID | | Note | | Series | | Current
nominal
amount
placed | | | Restatement
unit
of the
bond | | Interest
rate | | | Effective
interest
rate | | | Maturity | | Periodicity | | Accounting value | | | Placement
in Chile
or abroad |
| | | | | | | | | Principal
installment | | Amortization
type | | 12/31/2014 | | | 12/31/2013 | | |
| | | | | | | | | | | | % | | | % | | | | | | | | | ThCh$ | | | ThCh$ | | | |
268 | | | | BJUMB - B1 | | | 339,916 | | | UF | | | 6,5 | % | | | 6,90 | % | | 01/09/2026 | | Semiannual | | Semiannual | | | 390,674 | | | | 510,723 | | | NACIONAL |
268 | | | | BJUMB - B2 | | | 1,699,580 | | | UF | | | 6,5 | % | | | 6,90 | % | | 01/09/2026 | | Semiannual | | Semiannual | | | 3,058,775 | | | | 2,585,830 | | | NACIONAL |
443 | | | | BCENC - A | | | — | | | UF | | | 4,3 | % | | | 4,75 | % | | 15/03/2027 | | Semiannual | | Semiannual | | | — | | | | 1,229,562 | | | NACIONAL |
530 | | | | BCENC - E | | | 2,000,000 | | | UF | | | 3,5 | % | | | 4,14 | % | | 07/05/2018 | | Semiannual | | At Maturity | | | 292,254 | | | | 275,137 | | | NACIONAL |
530 | | | | BCENC - F | | | 4,500,000 | | | UF | | | 4,0 | % | | | 4,31 | % | | 07/05/2028 | | Semiannual | | At Maturity | | | 677,615 | | | | 640,258 | | | NACIONAL |
551 | | | | BCENC - J | | | 3,000,000 | | | UF | | | 5,7 | % | | | 5,70 | % | | 15/10/2029 | | Semiannual | | Semiannual | | | 876,024 | | | | 829,160 | | | NACIONAL |
551 | | | | BCENC - K | | | — | | | Ch$ | | | 7,0 | % | | | 7,15 | % | | 01/03/2014 | | Semiannual | | At Maturity | | | — | | | | 30,685,910 | | | NACIONAL |
551 | | | | BCENC - L | | | 250,000 | | | UF | | | 4,1 | % | | | 3,86 | % | | 28/05/2015 | | Semiannual | | Semiannual | | | 6,186,097 | | | | 11,715,387 | | | NACIONAL |
551 | | | | BCENC - N | | | 4,500,000 | | | UF | | | 4,7 | % | | | 4,95 | % | | 28/05/2030 | | Semiannual | | Semiannual S | | | 478,782 | | | | 452,575 | | | NACIONAL |
551 | | | | BCENC - O | | | 54,000,000 | | | Ch$ | | | 7,0 | % | | | 7,68 | % | | 01/06/2031 | | Semiannual | | At Maturity | | | 313,908 | | | | 313,303 | | | NACIONAL |
N/A | | | | ÚNICA - A | | | 280,000,000 | | | S | | | 7,2 | % | | | 7,49 | % | | 05/05/2018 | | Semiannual | | At Maturity | | | 637,828 | | | | 588,574 | | | EXTRANJERO |
N/A | | | | ÚNICA - A | | | 130,000,000 | | | S | | | 7,6 | % | | | 7,76 | % | | 12/08/2017 | | Semiannual | | At Maturity | | | 776,099 | | | | 717,113 | | | EXTRANJERO |
N/A | | | | ÚNICA - A | | | 750,000,000 | | | USD | | | 5,5 | % | | | 5,80 | % | | 20/01/2021 | | Semiannual | | At Maturity | | | 11,598,896 | | | | 9,948,508 | | | EXTRANJERO |
N/A | | | | ÚNICA - A | | | 1,200,000,000 | | | USD | | | 4,9 | % | | | 5,17 | % | | 20/01/2023 | | Semiannual | | At Maturity | | | 16,575,885 | | | | 14,323,952 | | | EXTRANJERO |
N/A | | | | MÁS CUOTAS SERIE 1 | | | 140,896,923 | | | Arg$ | | | 25.23 | % | | | 25.23 | % | | 01/07/2015 | | Monthly | | Monthly | | | 6,875,763 | | | | — | | | EXTRANJERO |
N/A | | | | MÁS CUOTAS SERIE 1 | | | 12,198,868 | | | Arg$ | | | 29.50 | % | | | 29.50 | % | | 01/10/2015 | | Monthly | | Monthly | | | 865,754 | | | | — | | | EXTRANJERO |
N/A | | | | MÁS CUOTAS SERIE 1 | | | 6,099,434 | | | Arg$ | | | 28.00 | % | | | 28.00 | % | | 01/02/2016 | | Monthly | | Monthly | | | 432,877 | | | | — | | | EXTRANJERO |
N/A | | | | MÁS CUOTAS SERIE 1 | | | 7,070,798 | | | Arg$ | | | 28,0 | % | | | 28,00 | % | | 01/10/2016 | | Monthly | | Monthly | | | 501,815 | | | | — | | | EXTRANJERO |
| | | | | | | | | | | | | | | | | | | | | | | | | | | | | | | | | | |
| | | | | | | | | | | |
| | | | Total short—term portion | | | | | | | | | | | | | | | | | | | | 50,539,046 | | | | 74,815,992 | | | |
| | | | | | | | | | | | | | | | | | | | | | | | | | | | | | | | | | |
F-128
| | | | | | | | | | | | | | | | | | | | | | | | | | | | | | | | |
Inscription number or ID | | Series | | Current
nominal
amount
placed | | | Restatement
unit of the
bond | | Interest
rate | | | Effective
interest
rate | | | Maturity | | Periodicity | | Accounting value | | | Placement
in Chile
or abroad |
| | | | | | | | Principal
installment | | Amortization
type | | 12/31/2014 | | | 12/31/2013 | | |
| | | | | | | | | | % | | | % | | | | | | | | | ThCh$ | | | ThCh$ | | | |
268 | | BJUMB - B1 | | | 339,916 | | | UF | | | 6,5 | % | | | 6,90 | % | | 01/09/2026 | | Semiannual | | Semiannual | | | 7,980,472 | | | | 7,923,293 | | | NACIONAL |
268 | | BJUMB - B2 | | | 1,699,580 | | | UF | | | 6,5 | % | | | 6,90 | % | | 01/09/2026 | | Semiannual | | Semiannual | | | 38,823,243 | | | | 38,488,858 | | | NACIONAL |
443 | | BCENC - A | | | — | | | UF | | | 4,3 | % | | | 4,75 | % | | 15/03/2027 | | Semiannual | | Semiannual | | | — | | | | 90,232,986 | | | NACIONAL |
443 | | BCENC - C | | | — | | | UF | | | 4,1 | % | | | 4,61 | % | | 01/07/2027 | | Semiannual | | Semiannual | | | — | | | | 100,563,384 | | | NACIONAL |
443 | | BCENC - D | | | — | | | UF | | | 4,0 | % | | | 4,38 | % | | 01/07/2028 | | Semiannual | | Semiannual | | | — | | | | 33,794,100 | | | NACIONAL |
530 | | BCENC - E | | | 2,000,000 | | | UF | | | 3,5 | % | | | 4,14 | % | | 07/05/2018 | | Semiannual | | At Maturity | | | 48,264,287 | | | | 45,437,538 | | | NACIONAL |
530 | | BCENC - F | | | 4,500,000 | | | UF | | | 4,0 | % | | | 4,31 | % | | 07/05/2028 | | Semiannual | | At Maturity | | | 107,321,315 | | | | 101,404,739 | | | NACIONAL |
551 | | BCENC - J | | | 3,000,000 | | | UF | | | 5,7 | % | | | 5,70 | % | | 15/10/2029 | | Semiannual | | Semiannual | | | 73,849,017 | | | | 69,898,124 | | | NACIONAL |
551 | | BCENC - L | | | 250,000 | | | UF | | | 4,1 | % | | | 3,86 | % | | 28/05/2015 | | Semiannual | | Semiannual | | | — | | | | 5,868,694 | | | NACIONAL |
551 | | BCENC - N | | | 4,500,000 | | | UF | | | 4,7 | % | | | 4,95 | % | | 28/05/2030 | | Semiannual | | Semiannual | | | 108,213,757 | | | | 102,290,315 | | | NACIONAL |
551 | | BCENC - O | | | 54,000,000 | | | Ch$ | | | 7,0 | % | | | 7,68 | % | | 01/06/2031 | | Semiannual | | At Maturity | | | 50,644,541 | | | | 50,546,943 | | | NACIONAL |
N/A | | ÚNICA - A | | | 280,000,000 | | | S | | | 7,2 | % | | | 7,49 | % | | 05/05/2018 | | Semiannual | | At Maturity | | | 56,512,826 | | | | 52,148,859 | | | EXTRANJERO |
N/A | | ÚNICA - A | | | 130,000,000 | | | S | | | 7,6 | % | | | 7,76 | % | | 12/08/2017 | | Semiannual | | At Maturity | | | 26,371,646 | | | | 24,367,325 | | | EXTRANJERO |
N/A | | ÚNICA - A | | | 750,000,000 | | | USD | | | 5,5 | % | | | 5,80 | % | | 20/01/2021 | | Semiannual | | At Maturity | | | 455,654,686 | | | | 390,512,983 | | | EXTRANJERO |
N/A | | ÚNICA - A | | | 1,200,000,000 | | | USD | | | 4,9 | % | | | 5,17 | % | | 20/01/2023 | | Semiannual | | At Maturity | | | 682,748,226 | | | | 562,566,927 | | | EXTRANJERO |
| | | | | | | | | | | | | | | | | | | | | | | | | | | | | | | | |
| | Total Long—Term portion | | | | | | | | | | | | | | | | | | | | 1,656,384,016 | | | | 1,676,045,068 | | | |
| | | | | | | | | | | | | | | | | | | | | | | | | | | | | | | | |
F-129
| 17.4 | Other Financial Liabilities—Derivatives—Options |
The detail as of December 31, 2014 and December 31, 2013 is as follows:
| | | | | | | | | | | | | | | | | | | | | | | | | | | | | | | | | | | | | | | | | | |
| | | | | | | | | | | | | | | | | | | | | | Periodicity | | Total
Current and Non-Current |
ID | | Institution Name | | Asset Position
(In Thousands) | | | currency | | Assets
Interest
rate | | | Liability
Position (In
Thousands) | | | Currency | | | Liability
Interest
Rate | | | Due date | | | Interest payment | | Principal
Installment | | December 31,
2014 (ThCh$) | | | December 31,
2013 (ThCh$) | | | Placement in Chile or abroad |
O-E | | Banco BBVA | | | 1,014 | | | USD | | | 1.95 | % | | | 1,676 | | | | USD | | | | 3.49 | % | | | 15/08/2016 | | | Semiannual | | — | | | 219,295 | | | | 147,176 | | | Foreign |
O-E | | Banco Santander | | | 1,014 | | | USD | | | 1.95 | % | | | 1,646 | | | | USD | | | | 3.41 | % | | | 15/08/2016 | | | Semiannual | | — | | | 163,459 | | | | 100,304 | | | Foreign |
O-E | | Banco BBVA | | | 29,362 | | | USD | | | 2.24 | % | | | 86,389 | | | | Soles | | | | 6.30 | % | | | 16/11/2015 | | | Quarterly | | Quarterly | | | — | | | | 111,456 | | | Foreign |
| | | | | | | | | | | | | |
| | | | | | | | | | | | | | | | | | | | | | | | | | | | | | | | TOTAL | | | 382,754 | | | | 358,936 | | | |
| | | | | | | | | | | | | | | | | | | | | | | | | | | | | | | | | | | | | | | | | | |
F-130
The detail of the leasing agreement as of December 31, 2014 and 2013 is as follows;
| | | | | | | | | | | | | | | | | | | | | | | | | | | | | | | | | | | | |
| | | | | | | | | | | Current Expiration | | | Non-Current Expiration | |
| | | ID | | Creditor
Name | | Currency | | Amortization
type | | Up to 90 days
ThCh$ | | | Between 90
days and one
year
ThCh$ | | | TOTAL
Current
as of
December 31,
2014
ThCh$ | | | 1 to 3 years
ThCh$ | | | 3 to 5 years
ThCh$ | | | 5 or more
years
ThCh$ | | | Total non-
Current as of
December 31,
2014
ThCh$ | |
Cencosud Shopping Centers S.A. | | 94226000-8 | | CIA. DE SEG.DE VIDA CONS. NAC. DE SEG. S.A. | | Ch$ | | Mensual | | | 53,132 | | | | 171,148 | | | | 224,280 | | | | 933,415 | | | | 933,413 | | | | 2,564,627 | | | | 4,431,455 | |
Cencosud Shopping Centers S.A. | | 94226000-8 | | CIA. DE SEG.DE VIDA CONS. NAC. DE SEG. S.A. | | Ch$ | | Mensual | | | 29,785 | | | | 89,037 | | | | 118,822 | | | | 523,249 | | | | 523,249 | | | | 1,438,941 | | | | 2,485,439 | |
Cencosud Shopping Centers S.A. | | 94226000-8 | | CIA. DE SEG.DE VIDA CONS. NAC. DE SEG. S.A. | | Ch$ | | Mensual | | | 5,838 | | | | 17,452 | | | | 23,290 | | | | 102,562 | | | | 102,562 | | | | 282,046 | | | | 487,170 | |
Cencosud Shopping Centers S.A. | | 94226000-8 | | CIA. DE SEG.DE VIDA CONS. NAC. DE SEG. S.A. | | Ch$ | | Mensual | | | 12,933 | | | | 38,662 | | | | 51,595 | | | | 227,206 | | | | 227,206 | | | | 624,820 | | | | 1,079,232 | |
Cencosud Shopping Centers S.A. | | 94226000-8 | | CIA. DE SEG.DE VIDA CONS. NAC. DE SEG. S.A. | | Ch$ | | Mensual | | | 15,241 | | | | 45,560 | | | | 60,801 | | | | 267,747 | | | | 267,747 | | | | 736,307 | | | | 1,271,801 | |
Cencosud Retail S.A. | | 81201000-K | | INMOBILIARIA EDIFICIO PANORÁMICO LIMITADA | | PESOS | | MENSUAL | | | 25,173 | | | | 316,841 | | | | 342,014 | | | | 302,081 | | | | 201,388 | | | | 173,849 | | | | 677,318 | |
Cencosud Retail S.A. | | 81201000-K | | CENTRO ESPAÑOL DE TEMUCO | | UF | | MENSUAL | | | 13,133 | | | | 38,041 | | | | 51,174 | | | | 149,432 | | | | 99,621 | | | | 149,507 | | | | 398,560 | |
Cencosud Retail S.A. | | 81201000-K | | SOCIEDAD DE RENTA HISPANO CHILENA SA | | UF | | MENSUAL | | | 12,295 | | | | 36,886 | | | | 49,181 | | | | 147,542 | | | | 98,362 | | | | 73,463 | | | | 319,367 | |
Cencosud Retail S.A. | | 81201000-K | | BANCO CHILE - LEASING | | UF | | SEMESTRAL | | | 40,515 | | | | 779,277 | | | | 819,792 | | | | 3,575,878 | | | | — | | | | — | | | | 3,575,878 | |
Cencosud Retail S.A. | | 81201000-K | | BANCO BICE - LEASING | | UF | | SEMESTRAL | | | 14,485 | | | | 43,456 | | | | 57,941 | | | | 173,825 | | | | — | | | | — | | | | 173,825 | |
Cencosud Retail S.A. | | 81201000-K | | INVERSIONES OLYMPUS LTDA. | | UF | | Mensual | | | — | | | | 2,819 | | | | 2,819 | | | | 5,637 | | | | 5,637 | | | | 335,465 | | | | 346,739 | |
Cencosud Retail S.A. | | 81201000-K | | INMOBILIARIA RECOLETA LTDA. | | UF | | Mensual | | | — | | | | 2,766 | | | | 2,766 | | | | 5,532 | | | | 5,532 | | | | 541,449 | | | | 552,513 | |
Cencosud Retail S.A. | | 81201000-K | | INVERSIONES PUNTA BLANCA LTDA. | | UF | | Mensual | | | — | | | | 553 | | | | 553 | | | | 1,106 | | | | 1,106 | | | | 375,413 | | | | 377,625 | |
Cencosud Retail S.A. | | 81201000-K | | EMPRESAS PROULX CHILE II S.A. | | UF | | Mensual | | | — | | | | 1,858 | | | | 1,858 | | | | 3,716 | | | | 3,716 | | | | 585,405 | | | | 592,837 | |
Cencosud Retail S.A. | | 81201000-K | | INERSA S.A. | | UF | | Mensual | | | — | | | | 3,332 | | | | 3,332 | | | | 6,665 | | | | 6,665 | | | | 469,658 | | | | 482,988 | |
Cencosud Retail S.A. | | 81201000-K | | RVC RENTAS S.A. | | UF | | Mensual | | | — | | | | 1,961 | | | | 1,961 | | | | 3,922 | | | | 3,922 | | | | 353,958 | | | | 361,802 | |
Cencosud Retail S.A. | | 81201000-K | | SEGUROS DE VIDA CRUZ DEL SUR S.A. | | UF | | Mensual | | | — | | | | 2,698 | | | | 2,698 | | | | 5,395 | | | | 5,395 | | | | 380,188 | | | | 390,978 | |
Cencosud Retail S.A. | | 81201000-K | | INMOBILIARIA MALL VIÑA DEL MAR S.A. | | UF | | Mensual | | | — | | | | 2,354 | | | | 2,354 | | | | 4,709 | | | | 4,709 | | | | 331,813 | | | | 341,231 | |
Cencosud Retail S.A. | | 81201000-K | | EMPRESAS PROULX CHILE II S.A. | | UF | | Mensual | | | — | | | | 1,808 | | | | 1,808 | | | | 3,616 | | | | 3,616 | | | | 526,772 | | | | 534,004 | |
Cencosud Retail S.A. | | 81201000-K | | INMOBILIARIA TIERRA SANTA | | UF | | Mensual | | | — | | | | 1,960 | | | | 1,960 | | | | 3,921 | | | | 3,921 | | | | 253,998 | | | | 261,840 | |
Cencosud Retail S.A. | | 81201000-K | | SEGUROS DE VIDA CRUZ DEL SUR S.A. | | UF | | Mensual | | | — | | | | 3,768 | | | | 3,768 | | | | 7,536 | | | | 7,536 | | | | 679,018 | | | | 694,090 | |
Cencosud Retail S.A. | | 81201000-K | | INVERSIONES URBANAS LTDA. | | UF | | Mensual | | | — | | | | 6,280 | | | | 6,280 | | | | 12,560 | | | | 12,560 | | | | 1,131,566 | | | | 1,156,686 | |
Cencosud Retail S.A. | | 81201000-K | | INMOBILIARIA GR CHAMISERO I S.A. | | UF | | Mensual | | | — | | | | 6,155 | | | | 6,155 | | | | 12,310 | | | | 12,310 | | | | 1,109,064 | | | | 1,133,684 | |
Grandes Superficies de Colombia S.A. | | 830025638 | | BANCO DE BOGOTÁ | | COL | | MENSUAL | | | 74,391 | | | | 83,370 | | | | 157,761 | | | | — | | | | — | | | | — | | | | — | |
Grandes Superficies de Colombia S.A. | | 830025638 | | CENTRO COMERCIAL BULEVAR NIZA | | COL | | MENSUAL | | | 19,606 | | | | 60,586 | | | | 80,192 | | | | 175,227 | | | | 197,219 | | | | 1,409,972 | | | | 1,782,418 | |
Grandes Superficies de Colombia S.A. | | 830025638 | | FCP INVERLINK | | COL | | MENSUAL | | | 34,701 | | | | 107,234 | | | | 141,935 | | | | 310,143 | | | | 349,068 | | | | 1,868,223 | | | | 2,527,434 | |
F-131
| | | | | | | | | | | | | | | | | | | | | | | | | | | | | | | | | | | | |
| | | | | | | | | | | Current Expiration | | | Non-Current Expiration | |
| | | ID | | Creditor
Name | | Currency | | Amortization
type | | Up to 90 days
ThCh$ | | | Between 90
days and one
year
ThCh$ | | | TOTAL
Current
as of
December 31,
2014
ThCh$ | | | 1 to 3 years
ThCh$ | | | 3 to 5 years
ThCh$ | | | 5 or more
years
ThCh$ | | | Total non-
Current as of
December 31,
2014
ThCh$ | |
Grandes Superficies de Colombia S.A. | | 830025638 | | COMERCIALIZADORA DE COLECCIONES S.A. | | COL | | MENSUAL | | | 11,918 | | | | 36,830 | | | | 48,748 | | | | 106,521 | | | | 119,890 | | | | 4,866,113 | | | | 5,092,524 | |
Grandes Superficies de Colombia S.A. | | 830025638 | | SOISAN S.A. | | COL | | MENSUAL | | | 229 | | | | 727 | | | | 956 | | | | 2,262 | | | | 2,825 | | | | 24,353 | | | | 29,440 | |
Cencosud Retail Perú | | 20109072177 | | BIF LEASING | | Soles | | MENSUAL | | | 76,409 | | | | — | | | | 76,409 | | | | — | | | | — | | | | — | | | | — | |
Cencosud Retail Perú | | 20109072177 | | BIF LEASING | | Soles | | MENSUAL | | | 88,101 | | | | 88,532 | | | | 176,633 | | | | — | | | | — | | | | — | | | | — | |
Cencosud Retail Perú | | 20109072177 | | BIF LEASING | | Soles | | MENSUAL | | | 37,602 | | | | 113,770 | | | | 151,372 | | | | — | | | | — | | | | — | | | | — | |
| | | | | | | | | | | | | | | | | | | | | | | | | | | | | | | | | | | | |
| | | | | | | | Total | | | 565,487 | | | | 2,105,721 | | | | 2,671,208 | | | | 7,073,715 | | | | 3,199,175 | | | | 21,285,988 | | | | 31,558,878 | |
| | | | | | | | | | | | | | | | | | | | | | | | | | | | | | | | | | | | |
| | | | | | | | | | | | | | | | | | | | | | | | | | | | | | | | | | | | |
| | | | | | | | | | | Current Expiration | | | Non-Current Expiration | |
| | | ID | | Creditor
Name | | Currency | | Amortization
type | | Up to 90 days
ThCh$ | | | Between 90
days and one
year
ThCh$ | | | TOTAL
Current
as of
December 31,
2013
ThCh$ | | | 1 to 3 years
ThCh$ | | | 3 to 5 years
ThCh$ | | | 5 or more
years
ThCh$ | | | Total non-
Current as of
December 31,
2013
ThCh$ | |
Cencosud Shopping Centers S.A. | | 94226000-8 | | CIA. DE SEG.DE VIDA CONS. NAC. DE SEG. S.A. | | Ch$ | | Monthly | | | 51,480 | | | | 154,440 | | | | 205,920 | | | | 880,407 | | | | 2,201,018 | | | | 1,430,668 | | | | 4,512,093 | |
Cencosud Shopping Centers S.A. | | 94226000-8 | | CIA. DE SEG.DE VIDA CONS. NAC. DE SEG. S.A. | | Ch$ | | Monthly | | | 28,859 | | | | 86,575 | | | | 115,434 | | | | 493,535 | | | | 1,233,837 | | | | 801,998 | | | | 2,529,370 | |
Cencosud Shopping Centers S.A. | | 94226000-8 | | CIA. DE SEG.DE VIDA CONS. NAC. DE SEG. S.A. | | Ch$ | | Monthly | | | 5,657 | | | | 16,970 | | | | 22,627 | | | | 96,737 | | | | 241,843 | | | | 157,199 | | | | 495,779 | |
Cencosud Shopping Centers S.A. | | 94226000-8 | | CIA. DE SEG.DE VIDA CONS. NAC. DE SEG. S.A. | | Ch$ | | Monthly | | | 12,531 | | | | 37,593 | | | | 50,124 | | | | 214,304 | | | | 535,759 | | | | 348,245 | | | | 1,098,308 | |
Cencosud Shopping Centers S.A. | | 94226000-8 | | CIA. DE SEG.DE VIDA CONS. NAC. DE SEG. S.A. | | Ch$ | | Monthly | | | 14,767 | | | | 44,300 | | | | 59,067 | | | | 252,542 | | | | 631,355 | | | | 410,382 | | | | 1,294,279 | |
Cencosud Retail S.A. | | 81201000-K | | INMOBILIARIA EDIFICIO PANORÁMICO LIMITADA | | Ch$ | | Monthly | | | 22,250 | | | | 66,752 | | | | 89,002 | | | | 121,300 | | | | 121,300 | | | | 550,906 | | | | 793,506 | |
Cencosud Retail S.A. | | 81201000-K | | CENTRO ESPAÑOL DE TEMUCO | | UF | | Monthly | | | 11,801 | | | | 35,402 | | | | 47,203 | | | | 62,199 | | | | 62,199 | | | | 217,698 | | | | 342,096 | |
Cencosud Retail S.A. | | 81201000-K | | SOCIEDAD DE RENTA HISPANO CHILENA SA | | UF | | Monthly | | | 12,500 | | | | 37,500 | | | | 50,000 | | | | 68,642 | | | | 68,642 | | | | 134,424 | | | | 271,708 | |
Cencosud Retail S.A. | | 81201000-K | | BANCO CHILE – LEASING | | UF | | Semiannual | | | 208,034 | | | | 624,109 | | | | 832,143 | | | | 1,103,798 | | | | — | | | | — | | | | 1,103,798 | |
Cencosud Retail S.A. | | 81201000-K | | BANCO BICE – LEASING | | UF | | Semiannual | | | 17,200 | | | | 51,600 | | | | 68,800 | | | | 92,445 | | | | 92,445 | | | | — | | | | 184,890 | |
Cencosud Retail S.A. | | 81201000-K | | INVERSIONES OLYMPUS LTDA. | | UF | | Monthly | | | — | | | | — | | | | — | | | | — | | | | — | | | | 340,320 | | | | 340,320 | |
Cencosud Retail S.A. | | 81201000-K | | INMOBILIARIA RECOLETA LTDA. | | UF | | Monthly | | | — | | | | — | | | | — | | | | — | | | | — | | | | 532,623 | | | | 532,623 | |
Cencosud Retail S.A. | | 81201000-K | | INVERSIONES PUNTA BLANCA LTDA. | | UF | | Monthly | | | — | | | | — | | | | — | | | | — | | | | — | | | | 358,734 | | | | 358,734 | |
Cencosud Retail S.A. | | 81201000-K | | EMPRESAS PROULX CHILE II S.A. | | UF | | Monthly | | | — | | | | — | | | | — | | | | — | | | | — | | | | 565,956 | | | | 565,956 | |
Cencosud Retail S.A. | | 81201000-K | | INERSA S.A. | | UF | | Monthly | | | — | | | | — | | | | — | | | | — | | | | — | | | | 466,191 | | | | 466,191 | |
Cencosud Retail S.A. | | 81201000-K | | RVC RENTAS S.A. | | UF | | Monthly | | | — | | | | — | | | | — | | | | — | | | | — | | | | 350,809 | | | | 350,809 | |
Cencosud Retail S.A. | | 81201000-K | | SEGUROS DE VIDA CRUZ DEL SUR S.A. | | UF | | Monthly | | | — | | | | — | | | | — | | | | — | | | | — | | | | 377,382 | | | | 377,382 | |
Cencosud Retail S.A. | | 81201000-K | | INMOBILIARIA MALL VIÑA DEL MAR S.A. | | UF | | Monthly | | | — | | | | — | | | | — | | | | — | | | | — | | | | 329,364 | | | | 329,364 | |
Cencosud Retail S.A. | | 81201000-K | | EMPRESAS PROULX CHILE II S.A. | | UF | | Monthly | | | — | | | | — | | | | — | | | | — | | | | — | | | | 511,645 | | | | 511,645 | |
Cencosud Retail S.A. | | 81201000-K | | INMOBILIARIA TIERRA SANTA | | UF | | Monthly | | | — | | | | — | | | | — | | | | — | | | | — | | | | 254,773 | | | | 254,773 | |
Grandes Superficies de Colombia S.A. | | 830025638 | | BANCO DE BOGOTÁ | | COL | | Monthly | | | 83,581 | | | | 250,743 | | | | 334,324 | | | | 150,550 | | | | — | | | | — | | | | 150,550 | |
Grandes Superficies de Colombia S.A. | | 830025638 | | IBM | | COL | | Monthly | | | 72,478 | | | | 92,481 | | | | 164,959 | | | | — | | | | — | | | | — | | | | — | |
Grandes Superficies de Colombia S.A. | | 830025638 | | CENTRO COMERCIAL BULEVAR NIZA | | COL | | Monthly | | | 15,835 | | | | 48,935 | | | | 64,770 | | | | 174,772 | | | | 196,708 | | | | 1,680,814 | | | | 2,052,294 | |
Grandes Superficies de Colombia S.A. | | 830025638 | | FCP INVERLINK | | COL | | Monthly | | | 28,028 | | | | 86,612 | | | | 114,640 | | | | 309,338 | | | | 348,163 | | | | 2,311,121 | | | | 2,968,622 | |
F-132
| | | | | | | | | | | | | | | | | | | | | | | | | | | | | | | | | | | | |
| | | | | | | | | | | Current Expiration | | | Non-Current Expiration | |
| | | ID | | Creditor
Name | | Currency | | Amortization
type | | Up to 90 days
ThCh$ | | | Between 90
days and one
year
ThCh$ | | | TOTAL
Current
as of
December 31,
2013
ThCh$ | | | 1 to 3 years
ThCh$ | | | 3 to 5 years
ThCh$ | | | 5 or more
years
ThCh$ | | | Total non-
Current as of
December 31,
2013
ThCh$ | |
Grandes Superficies de Colombia S.A. | | 830025638 | | COMERCIALIZADORA DE COLECCIONES S.A. | | COL | | Monthly | | | 9,626 | | | | 29,747 | | | | 39,373 | | | | 106,244 | | | | 119,579 | | | | 5,263,878 | | | | 5,489,701 | |
Grandes Superficies de Colombia S.A. | | 830025638 | | SOISAN S.A. | | COL | | Monthly | | | 223 | | | | 669 | | | | 892 | | | | 1,480 | | | | 4,486 | | | | 26,469 | | | | 32,435 | |
E. Wong | | 20100106915 | | CONTINENTAL LEASING | | Soles | | Semiannual | | | 210,296 | | | | — | | | | 210,296 | | | | — | | | | — | | | | — | | | | — | |
E. Wong | | 20100106915 | | CONTINENTAL LEASING | | Soles | | Semiannual | | | 224,220 | | | | — | | | | 224,220 | | | | — | | | | — | | | | — | | | | — | |
Hipermercados Metro | | 20109072177 | | CONTINENTAL LEASING | | Soles | | Semiannual | | | 597 | | | | 175,803 | | | | 176,400 | | | | — | | | | — | | | | — | | | | — | |
Hipermercados Metro | | 20109072177 | | CONTINENTAL LEASING | | Soles | | Semiannual | | | 561 | | | | 165,205 | | | | 165,766 | | | | — | | | | — | | | | — | | | | — | |
Hipermercados Metro | | 20109072177 | | CONTINENTAL LEASING | | Soles | | Semiannual | | | 11 | | | | 97,340 | | | | 97,351 | | | | — | | | | — | | | | — | | | | — | |
Hipermercados Metro | | 20109072177 | | CONTINENTAL LEASING | | Soles | | Semiannual | | | 68,818 | | | | 67,776 | | | | 136,594 | | | | — | | | | — | | | | — | | | | — | |
Hipermercados Metro | | 20109072177 | | CONTINENTAL LEASING | | Soles | | Semiannual | | | 1,897 | | | | 227,517 | | | | 229,414 | | | | — | | | | — | | | | — | | | | — | |
Hipermercados Metro | | 20109072177 | | BIF LEASING | | Soles | | Monthly | | | 47,701 | | | | 112,701 | | | | 160,402 | | | | — | | | | — | | | | — | | | | — | |
Hipermercados Metro | | 20109072177 | | BIF LEASING | | Soles | | Monthly | | | 80,148 | | | | 242,618 | | | | 322,766 | | | | — | | | | — | | | | — | | | | — | |
Hipermercados Metro | | 20109072177 | | BIF LEASING | | Soles | | Monthly | | | 67,953 | | | | 204,853 | | | | 272,806 | | | | 70,266 | | | | — | | | | — | | | | 70,266 | |
Hipermercados Metro | | 20109072177 | | BIF LEASING | | Soles | | Monthly | | | 78,374 | | | | 235,075 | | | | 313,449 | | | | 162,427 | | | | — | | | | — | | | | 162,427 | |
Hipermercados Metro | | 20109072177 | | BIF LEASING | | Soles | | Monthly | | | 140,673 | | | | 99,258 | | | | 239,931 | | | | 139,160 | | | | — | | | | — | | | | 139,160 | |
| | | | | | | | | | | | | | | | | | | | | | | | | | | | | | | | | | | | |
| | | | | | | | Total | | | 1,516,099 | | | | 3,292,574 | | | | 4,808,673 | | | | 4,500,146 | | | | 5,857,334 | | | | 17,421,599 | | | | 27,779,079 | |
| | | | | | | | | | | | | | | | | | | | | | | | | | | | | | | | | | | | |
F-133
| 1. | As established in the agreement to issue bonds of Cencosud S.A. dated July 5, 2001 and by virtue of which two series (Series A and Series B) were issued, of which only Series B (tranche B1 and B2) remains in effect, the Company, hereinafter the Issuer, has the following indebtedness limits or management restrictions, among others: |
| a) | Comply with the laws, regulations and other legal provisions applicable to it; |
| b) | Establish and maintain adequate accounting systems based on generally accepted accounting principles in Chile, as well as hire and maintain an independent external auditing firm of recognized local or international prestige to examine and analyze the Financial Statements and issue an opinion on the statements as of December 31 of each year. Likewise, in accordance with current standards and as long as they are in effect, the Issuer shall hire and maintain, continuously and without interruption, two risk rating agencies registered with the SVS for the life of the bond issuance. These risk rating agencies may be replaced to the extent that the Issuer complies with the obligation of maintaining two of them, continuously and without interruption, for the life of the bond issuance. Nevertheless, it is expressly agreed that: (i) in the event that by SVS provision the currently valid accounting standards were modified, replacing IFRS, and that change were to affect one or more of the restrictions contained in the Ninth clause and/or the definitions in the First clause related to the aforementioned Ninth clause of the Agreement, or (ii) if the valuation criteria established for the accounting entries in the current Financial Statements were modified by the competent entity authorized to issue accounting standards, the Issuer shall, within fifteen Working Days of the new provisions having been reflected for the first time in its Financial Statements, present these changes to the Bondholders’ Representative. The Issuer, within twenty Working Days of the new provisions having been reflected for the first time in its Financial Statements, shall request that its external auditors proceed to adapt the obligations indicated in the Ninth clause and/or the definitions contained in the First clause that are related to the aforementioned Ninth clause of the Agreement based on the new accounting situation within twenty Working Days after the date of request. The Issuer and the Bondholders’ Representative shall modify the Agreement in order to adjust it as determined by the auditors within ten Working Days of the auditors having issued their report, and the Issuer shall file with the SVS the request for this modification of the Agreement, together with the respective documentation. The aforementioned procedure shall be considered prior to the date on which the Financial Statements must be filed with the SVS by the Issuer, for the reporting period following that in which the new provisions have been reflected for the first time in its Financial Statements. For this, prior consent from the bondholders’ association shall not be necessary. Notwithstanding, the Bondholders’ Representative shall inform the Bondholders of the modifications to the Agreement by publishing a notice in the newspaperLa Nacion (print or digital version) and in the event this publication is suspended or no longer exists, in the Official Gazette, which shall take place within twenty Working Days following the date the respective deed modifying the Agreement is granted. In the cases mentioned above, and until the Agreement has been modified in accordance with the aforementioned procedure, the Issuer shall not be considered to have breached the Agreement when as a result exclusively of these modifications, the Issuer fails to comply with one or more restrictions contained in the Ninth clause of the Agreement and/or the definitions contained in the First clause that are related to the aforementioned Ninth clause. Once the Agreement has been modified as stated above, the Issuer shall comply with the agreed-upon modifications to reflect its new accounting situation. Record is left that the procedure contained in this provision is intended to protect the changes produced exclusively by provisions on accounting matters and in no case those produced by variations in market conditions that affect the Issuer. All expenses resulting from the above shall be borne by the Issuer. Likewise, the Issuer shall hire and maintain, continuously and without interruption, two risk rating agencies registered with the SVS for the life of the bonds; |
| c) | Send a copy of its quarterly and annual Financial Statements to the Bondholders’ Representative within the same period of time in which it must be filed with the SVS; |
F-134
| d) | Notify the Bondholders’ Representative of notices for ordinary and extraordinary shareholders’ meetings no later than the day of publication of the last notice for shareholders; |
| e) | Notify the Bondholders’ Representative of all material events that are not considered reserved or any infraction of the Issuer’s obligations under the agreement as soon as the event or infraction occurs or comes to its knowledge, within the same period of time in which it must notify the SVS. The document that fulfills this obligation must be signed by the Issuer’s Chief Executive Officer or by his replacement and must be sent with a return receipt or by certified mail; |
| f) | Maintain, during the life of this Agreement, its assets free of Restricted Encumbrances that are equivalent, at least, to one point two times the unpaid balance of the principal owed on the Bonds. This obligation shall be verified and measured as of the reporting dates of the Financial Statements. The Issuer shall send information to verify the ratio referred to in this clause to the Bondholders’ Representative upon request. In the event that the Issuer fails to comply with this obligation, it may equally and within a maximum of sixty days from the date of violation, establish guarantees in favor of the Bondholders that are proportionally equal to those granted to third parties other than the Bondholders. For these purposes, assets and debt will be valued at book value. The following shall not be considered for these purposes: encumbrances established for any authority for taxes that are still not owed by the Issuer and are being duly challenged by it; those established in the ordinary course of business of the Issuer that are being duly challenged by it; preferences established by law such as, for example, those mentioned in article two thousand four hundred seventy-two of the Civil Code and articles one hundred five and one hundred six of the Securities Market Law; and all encumbrances to which the Issuer has not consented and that are being duly challenged by it; |
| g) | Not sell or transfer essential assets that represent more than 30% of its total assets and that place in danger the continuity of its business, unless that sale, cession or transfer is to a subsidiary and to the extent that it jointly and severally undertakes to pay the Bonds; |
| h) | Maintain an indebtedness ratio no greater than one point three; |
| i) | Maintain minimum equity of eleven million, five hundred thousand UF at all times during the life of the bonds; |
| j) | Not make investments in debt instruments issued by related persons or engage in transactions with related persons under conditions that are less favorable than market conditions for the Issuer; |
| k) | Contract and maintain insurance that reasonably protects its operating assets; |
| l) | Send information on any reduction in its interest in Subsidiaries that results in losing control and stems from a sale, exchange or merger of its interest in them to the Bondholders’ Representative within 30 working days of the event having occurred; |
| m) | Record in its accounting books the provisions that arise from adverse contingencies that, in management’s opinion, should be reflected in the Financial Statements of the Issuer in accordance with IFRS or the standards that replace them and those established by the SVS, as appropriate. |
| 2. | As established in the agreement to issue bonds of Cencosud S.A., dated March 13, 2008, and by virtue of which two series (Series E and Series F) were issued, the Company, hereinafter the Issuer, has the following obligations and management restrictions, among others: |
| a) | Comply with applicable laws, regulations and other legal provisions, particularly those related to the timely and correct payment of taxes, duties and charges; |
| b) | Establish and maintain adequate accounting systems based on IFRS or those standards that replace IFRS; an independent external auditing firm of recognized prestige to issue an opinion on the financial statements as of December 31 of each year; two risk rating agencies registered with the SVS for the life of the Bonds; |
| c) | Send to the Bondholders’ Representative (i) a copy of all information that the Issuer must send the SVS, as long as it is not considered reserved information, including a copy of its quarterly and annual Financial |
F-135
| | Statements, within the period of time in which it should file such information with the SVS; (ii) information on compliance with the obligations undertaken by virtue of the Agreement within the period of time in which it should file its Financial Statements with the SVS; (iii) copies of the risk rating reports on the issuance no later than five Working Days after receipt of these reports from its private risk rating agencies; (iv) all information regarding any violation of its obligations undertaken by virtue of the Issuance Agreement and any other relevant information requested by the SVS, as soon as the event occurs or comes to its knowledge. |
| d) | Notify the Bondholders’ Representative of notices for ordinary and extraordinary shareholders’ meetings no later than the day of publication of the last notice for shareholders; |
| e) | Send the Bondholders’ Representative information on any reduction of its interest in the capital of its Relevant Subsidiaries that are greater than 10% of the capital, as well as any reduction that means losing control of the company once the transaction has taken place; |
| f) | Not engage in, with related persons, transactions under conditions that are less favorable for the Issuer than prevailing market conditions; |
| g) | Maintain the following financial ratios based on the Quarterly Financial Statements: (i) An indebtedness level based on the Financial Statements of a ratio of other current financial liabilities and other non-current financial liabilities, less cash and cash equivalents, less other current financial assets, over total equity attributable to the owners of the parent company, no greater than one point two. Liabilities shall include the obligations that the Issuer undertakes as endorser, simple and/or joint guarantor and those in which it responds directly or indirectly for obligations of third parties; and ii) Maintain Total Assets free of all pledges, mortgages or other encumbrances for an amount at least equal to one point two times the Issuer’s Liabilities in conformity with the Financial Statements; |
| h) | Except by express statement of the Bondholders’ Representative, authorized at an extraordinary meeting of the Bondholders, with votes that represent at least fifty-one percent of the Bonds in circulation, that releases the Issuer from the obligation indicated below, it shall maintain ownership of the brands (i) “Jumbo” and (ii) “París” directly or through its subsidiaries; |
| i) | Record in its accounting books the provisions that arise from adverse contingencies that, in the Issuer’s opinion, should be reflected in the Issuer’s financial statements; |
| j) | Maintain insurance that reasonably protects its operating assets and ensure that its subsidiaries meet this condition; |
| k) | Not grant endorsements or guarantees or establish itself as joint and several co-signer in favor of third parties, except subsidiaries of the Issuer. |
| l) | Maintain direct or indirect ownership of at least fifty-one percent of Cencosud Supermercados S.A. and forty-nine percent of Cencosud Administradora de Tarjetas S.A., as well as the Companies that eventually control the business areas currently developed by these Companies; |
| m) | Maintain income from retail sales, mall management, real estate investment and credit assessments, granting and management equivalent to at least sixty-seven percent of the Issuer’s ordinary revenue, based on the Quarterly Financial Statements; and |
| n) | Inform the Bondholders’ Representative of the effective use of the funds stemming from the Bond placement corresponding to the Line. |
| 3. | As established in the Master Issuance Agreement for the Private Offering Program for Corporate Bonds of Cencosud S.A., dated April 24, 2008, hereinafter “the Program”, entered into in Lima, Peru, and by virtue of which two issuances of the same series (Series A) were carried out, the Company, hereinafter the Issuer, has the following obligations and management restrictions, among others: |
| a) | Preserve its corporate existence and duly maintain and develop its corporate objective; |
F-136
| b) | Be in full compliance with all tax obligations, whether formalities or payment obligations, except those that have been challenged using procedures set forth by the laws of the applicable jurisdiction; |
| c) | Maintain on at least a pari passu basis with Bonds issued with respect to payment obligations of other debts or obligations without specific guarantees; |
| d) | Not make substantial changes in the line of business or its corporate objective that produce a material adverse effect on the Issuer’s financial condition, understanding as such any change that reduces the Program’s risk rating by two (2) or more risk categories below the rating in effect at that time; |
| e) | A change in control that reduces the Program’s risk rating by two (2) or more risk categories below the rating in effect at that time may not occur; |
| f) | Not transfer fully or partially, its obligations under the Program Documents; |
| g) | Maintain indebtedness, based on the consolidated Financial Statements, or the individual financial statements if the Issuer does not consolidate, of a ratio of consolidated financial liabilities, or individual if the Issuer does not consolidate, less Cash, less Time Deposits, less Marketable Securities, less repo agreements and forward contracts classified as other current assets in the Issuer’s consolidated Financial Statements, or the individual financial statements if the Issuer does not consolidate, to Total Equity that does not exceed 1.20. Consolidated financial liabilities, or individual if the Issuer does not consolidate, shall include the obligations that the Issuer undertakes as endorser, simple and/or joint guarantor and those in which it responds directly or indirectly for obligations of third parties. Nevertheless, the liabilities of Banco París shall not be considered for the purpose of calculating this indebtedness; and |
F-137
| h) | The Issuer shall issue each quarter: (i) a report that is a sworn statement indicating that no violation of the obligations established in this clause has occurred; (ii) a report containing the calculation of the ratios referred to in the preceding letter. |
| 4. | As established in the agreement to issue bonds of Cencosud S.A., dated September 5, 2008 and modified on October 2, 2008, and by virtue of which the Series J, L, N and O were issued, the Company, hereinafter the Issuer, has the following obligations or management restrictions: |
| a) | Comply with applicable laws, regulations and other legal provisions, particularly those related to the timely and correct payment of taxes, duties and charges; |
| b) | Establish and maintain adequate accounting systems based on IFRS or those standards that replace IFRS; an independent external auditing firm of recognized prestige to issue an opinion on the financial statements as of December 31 of each year; two risk rating agencies registered with the SVS for the life of the Bonds; |
| c) | Send to the Bondholders’ Representative (i) a copy of all information that the Issuer must send the SVS, as long as it is not considered reserved information, including a copy of its quarterly and annual Financial Statements, within the period of time in which it should file such information with the SVS; (ii) information regarding compliance with the obligations undertaken by virtue of the Agreement within the period of time in which it should file its Financial Statements with the SVS; (iii) copies of the risk rating reports on the issuance no later than five Working Days after receipt of these reports from its private risk rating agencies; (iv) all information regarding any violation of its obligations undertaken by virtue of the Agreement and any other relevant information requested by the SVS, as soon as the event occurs or comes to its knowledge; |
| d) | Notify the Bondholders’ Representative of notices for ordinary and extraordinary shareholders’ meetings no later than the day of publication of the last notice for shareholders; |
| e) | Send the Bondholders’ Representative information on any reduction of its interest in the capital of its Relevant Subsidiaries that are greater than 10% of the capital, as well as any reduction that means losing control of the company once the transaction has taken place; |
| f) | Not engage in, with related persons, transactions under conditions that are less favorable for the Issuer than prevailing market conditions; |
| g) | Maintain the following financial ratios based on the Quarterly Financial Statements: (i) An indebtedness level based on the Financial Statements of a ratio of other current financial liabilities and other non-current financial liabilities, less cash and cash equivalents, less other current financial assets, over total equity attributable to the owners of the parent company, no greater than one point two. Liabilities shall include the obligations that the Issuer undertakes as endorser, simple and/or joint guarantor and those in which it responds directly or indirectly for obligations of third parties; and ii) Maintain Total Assets free of all pledges, mortgages or other encumbrances for an amount at least equal to one point two times the Issuer’s Liabilities in conformity with the Financial Statements; |
| h) | Except by express statement of the Bondholders’ Representative, authorized at an extraordinary meeting of the Bondholders, with votes that represent at least fifty-one percent of the Bonds in circulation, that releases the Issuer from the obligation indicated below, it shall maintain ownership of the brands (i) “Jumbo” and (ii) “París” directly or through its subsidiaries; |
| i) | Record in its accounting books the provisions that arise from adverse contingencies that, in the Issuer’s opinion, should be reflected in the Issuer’s financial statements; |
| j) | Maintain insurance that reasonably protects its operating assets and ensure that its subsidiaries meet this condition; |
| k) | Not grant endorsements or guarantees or establish itself as joint and several co-signer in favor of third parties, except subsidiaries of the Issuer. |
F-138
| l) | Maintain direct or indirect ownership of at least fifty-one percent of Cencosud Supermercados S.A. and forty-nine percent of Cencosud Administradora de Tarjetas S.A., as well as the Companies that eventually control the business areas currently developed by these Companies; |
| m) | Maintain income from retail sales, mall management, real estate investment and credit assessments, granting and management equivalent to at least sixty-seven percent of the Issuer’s ordinary revenue, based on the Quarterly Financial Statements; and |
| n) | Inform the Bondholders’ Representative of the effective use of the funds stemming from the Bond placement corresponding to the Line. |
| 5. | As a result of the loan granted by the International Finance Corporation to the subsidiary Cencosud S.A. (Argentina), an agreement was signed between these entities on September 24, 2008. The Minutes of the Board of Directors of the subsidiary Cencosud S.A. (Argentina) dated September 5, 2008, makes mention of having entered into a Share Retention Agreement, which was signed by the subsidiary Cencosud S.A. (Argentina) and its controller, Cencosud S.A. (Chile), in favor of the “International Finance Corporation” by virtue of which Cencosud S.A. (Chile) undertakes to: |
| a) | Maintain its shareholdings in the subsidiaries Cencosud S.A., Cencosud Shopping Centers S.A. (Chile) and Cencosud Retail S.A. (Chile); |
| b) | Maintain its shareholding in Blaisten S.A. and Unicenter S.A. |
| 6. | As established in the debt consolidation agreement signed June 30, 2010 between Cencosud Retail S.A. as Debtor and Banco del Estado de Chile as Creditor, Cencosud S.A., shall comply with the following obligations and financial and management restrictions: |
| a) | Maintain income from retail sales, mall management, real estate investment and credit assessments, granting and management equivalent to at least sixty-seven percent of the Consolidated Operating Income, based on the Consolidated Quarterly Financial Statements; |
| b) | Not merge with any company, except those cases in which the merger meets all of the following requirements: (i) that the Company resulting from the merger is a Corporation established and governed by the laws of the Republic of Chile, and (ii) that the Company resulting from the merger maintains Cencosud’s current line of business; |
| c) | Maintain at all times a ratio of Net Financial Debt to Own Funds of no more than one point two; |
| d) | Maintain minimum equity equivalent to 28,000,000 UF. |
| e) | Maintain assets free of all pledges, mortgages and other encumbrances for an amount at least equivalent to one point two times its unguaranteed consolidated liabilities. The obligations established in this letter and in letters (a),( c) and (d) above shall be measured every quarter based on the Financial Statements of Cencosud S.A. |
| f) | Do not establish personal guarantees in favor of other creditors to secure obligations of third parties that do not belong to Cencosud S.A. and its subsidiaries without prior authorization from the Bank; |
| g) | Send to the Bank, signed by duly authorized persons, its annual report and annual Financial Statements, duly audited, and the quarterly Financial Statements, in the same format in which they were filed with the SVS, within 5 days following the date on which the information must be filed with the SVS. This obligation shall only be demandable in the event, for any reason, that the information is not available on the SVS’s website; and |
| h) | Each quarter, submit to the Bank a certificate of compliance of the affirmative and negative obligations established in the agreement, including a detail of the calculation of the financial covenants entered into by the Finance Manager. |
F-139
| 7. | As established in the line of credit agreement signed October 12, 2010 between Cencosud S.A. as Debtor and Banco de Chile as Creditor, Cencosud S.A., shall comply with the following obligations and financial and management restrictions: |
| a) | Submit to the Bank a copy of the Debtor’s individual and consolidated Financial Statements for each quarter as soon as possible and in any event within thirty days of filing them with the SVS, to the extent that this information is not available on the SVS’s website or another publicly accessible website. If the Debtor were not obligated to file this information with the SVS, it must still submit it to the Bank as soon as it is available. These Financial Statements shall be prepared in accordance with IFRS; |
| b) | Submit to the Bank a copy of the Debtor’s individual and consolidated Financial Statements for each year end as soon as possible and in any event within thirty days of filing them with the SVS, to the extent that this information is not available on the SVS’s website or another publicly accessible website. If the Debtor were not obligated to file this information with the SVS, it must still submit it to the Bank as soon as it is available. These Financial Statements shall be certified by an independent auditor of recognized international prestige that is registered with the SVS; |
| c) | Along with the Financial Statements referred to in the preceding letters, submit to the Bank a certificate issued by the Debtor’s Chief Executive Officer and/or Chief Financial Officer, or their replacement, that certifies that, to the best of their knowledge and understanding, no Grounds for Non-Compliance has occurred or detailing the nature and extent of such events if they have occurred; |
| d) | Notify the Bank as soon as possible but no later than five banking days after the date on which any executive of the Debtor has knowledge of: (i) the occurrence of any Grounds for Non-Compliance; (ii) any action, lawsuit or judicial or administrative proceedings regarding this instrument; (iii) any circumstance or event that affects or could result in an Adverse Important Effect on the businesses, activities, operations or financial situation of the Debtor and that results in the inability to pay of the Debtor; (iv) any relevant event referring to the Debtor’s operations that, in conformity with articles nine and ten of Law eighteen thousand forty-five on Securities Markets and the instructions provided by the SVS in General Character Ruling number thirty, may be interpreted as a material event, to the extent that that information is not available on the SVS’s website or another publicly accessible site; |
| e) | Submit to the Bank, when requested in writing or for justified reasons, additional information on the financial, tax, accounting, economic and/or legal situation of the Debtor, in which case it shall be provided within thirty banking days of the date on which the request is made in writing. Notwithstanding, and at the Bank’s request, the Debtor shall inform the Bank of the modifications made to the Company within thirty banking days of the event, submitting all pertinent information, and shall also inform the Bank of all new powers of attorney or the revocation of current powers of attorney, providing a copy of the corresponding public deeds; |
| f) | Submit to the Bank, at its request, information necessary to correctly apply the provisions on individual credit limits; |
| g) | Maintain and ensure that each Subsidiary maintains its books, records and accounting notes in which it makes complete, timely and reliable notes in conformity with current standards and IFRS; |
| h) | Maintain all relevant rights, licenses, permits, brands, franchises, concessions or patents fully valid, with the understanding. However, the Debtor or any of its Subsidiaries may surrender these rights, licenses, permits, brands, franchises, concessions or patents to the extent that they do not involve an Important Adverse Effect. In particular, it shall maintain ownership of the following brands directly: (i) “Jumbo” and (ii) “París”; |
| i) | Comply with and ensure that each Subsidiary complies with each and every one of its obligations by virtue of any act, contract or convention, whose failure to comply produces or could produce, individually or collectively, an Important Adverse Effect; |
| j) | Comply with and ensure that each Relevant Subsidiary complies with current laws and standards applicable to the development of its business and ownership of its assets; |
F-140
| k) | Pay and ensure that each Subsidiary pays, fully and opportunely, all important obligations, which are understood for the purposes of this instrument as those obligations that are important for the Debtor’s business, operations, financial or other conditions, projections, including but not limited to all taxes, charges or property taxes it must pay, as well as all obligations that, for taxes, charges, property taxes, labor matters or obligations with its suppliers or others, may result in an Encumbrance, except when compliance of these obligations is challenged by the Debtor or a Relevant Subsidiary, through proper legal proceedings initiated in good faith and adequate accounting provisions have been established in accordance with IFRS; |
| l) | Maintain and ensure that each Relevant Subsidiary maintains all assets necessary to keep its businesses and operations in proper working order and maintenance, except for wear resulting from legitimate use. The Debtor shall also maintain and ensure that each Relevant Subsidiary maintains proper insurance coverage for these assets in conformity with industry practice; |
| m) | Ensure that all operations with related persons, as defined in law number eighteen thousand forty-five, either directly or through related persons, are carried out under prevailing market conditions; |
| n) | Ensure that at any time the obligation listed in the first clause shall have the same payment preference (pari passu) as its other debts with third party creditors. These restrictions shall not be applied to any case considered Permitted Encumbrances by the agreement; |
| o) | Maintain direct or indirect ownership of at least fifty-one percent of Cencosud Retail S.A. and Cencosud Shopping Centers S.A., as well as its successor companies and transferees and the Companies that eventually control the business areas currently developed by these Companies. |
| p) | Maintain a ratio of net financial liabilities to equity of less than one point two. For these purposes, net financial liabilities shall be defined as all consolidated current financial debt of Cencosud S.A. less the sum of the items Cash, Time Deposits, Marketable Securities and repo agreements and forward contracts accounted for in Other Assets. Net Financial Debt shall also include the obligations that the company undertakes as endorser or simple or joint guarantor and all obligations where it responds directly or indirectly for obligations of unrelated third parties. In no case shall net Financial Debt include the liabilities owed by Banco París; |
| q) | Maintain minimum equity of twenty-eight million UF. |
| r) | Maintain assets free of pledges or Encumbrances or at least one hundred twenty percent of the value of current, unguaranteed liabilities; |
| s) | Not dispose of or transfer, and ensure that the Relevant Subsidiaries do not dispose of or transfer, either directly or indirectly, their Essential Assets, as defined hereinafter. For the purposes of this agreement, “Essential Assets” shall be defined as the brands “Jumbo” and “París” and the shares that represent at least fifty-one percent of the capital of the companies Cencosud Retail S.A. and Cencosud Shopping Centers S.A. and; |
| t) | Not enter into or execute, and not allow Relevant Subsidiaries to enter into or execute any act or agreement to liquidate or dissolve its operations or businesses, nor to agree on, enter into or execute any act to split or merge, when it causes or may cause the Debtor, directly or indirectly, to lose control or ownership of its current businesses, as well as the assets necessary for execution and that it produces or may produce an Important Adverse Effect, except when such acts are for an amount less than or equal to two percent of the consolidated assets of Cencosud S.A. |
| 8. | As established in the line of credit agreement signed October 12, 2010 between Cencosud Retail S.A. as Debtor and Banco de Crédito e Inversiones as Creditor, Cencosud S.A., shall comply with the following obligations and financial and management restrictions: |
| a) | Submit to the Bank a copy of its individual and consolidated Financial Statements for each quarter as soon as possible and in any event within thirty days of filing them with the SVS, to the extent that this information is not available on the SVS’s website or another publicly accessible website. If it were not obligated to file this information with the SVS, it must still submit it to the Bank as soon as it is available. These Financial Statements shall be prepared in accordance with IFRS; |
F-141
| b) | Submit to the Bank a copy of its individual and consolidated Financial Statements for each year end as soon as possible and in any event within thirty days of filing them with the SVS, to the extent that this information is not available on the SVS’s website or another publicly accessible website. If it were not obligated to file this information with the SVS, it must still submit it to the Bank as soon as it is available. These Financial Statements shall be certified by an independent auditor of recognized international prestige that is registered with the SVS; |
| c) | Along with the Financial Statements referred to in the preceding letters, submit to the Bank a certificate issued by the Chief Executive Officer and/or Chief Financial Officer, or their replacement, that certifies that, to the best of their knowledge and understanding, no grounds for non-compliance or violation, as defined hereinafter, have occurred or detailing the nature and extent of such events if they have occurred; |
| d) | Notify the Bank as soon as possible but no later than five banking days after the date on which any executive has knowledge of: (i) the occurrence of any Grounds for Non-Compliance, as defined hereinafter, or any Non-Compliance; (ii) any action, lawsuit or judicial or administrative proceedings regarding this instrument; (iii) any circumstance or event that affects or could result in an Adverse Important Effect on the businesses, activities, operations or financial situation of the Debtor and/or Cencosud and that results in the inability to pay of the Debtor and/or Cencosud; (iv) any relevant event referring to Cencosud’s and/or the Guarantor’s operations that, in conformity with articles nine and ten of Law eighteen thousand forty-five on Securities Markets and the instructions provided by the SVS in General Character Ruling number thirty, may be interpreted as a material event, to the extent that that information is not available on the SVS’s website or another publicly accessible site; |
| e) | Submit to the Bank, when requested in writing or for justified reasons, additional information on its financial, tax, accounting, economic and/or legal situation, in which case it shall be provided within thirty banking days of the date on which the request is made in writing. Notwithstanding, and at the Bank’s request, it shall inform the Bank of the modifications made to the Company within thirty banking days of the event, submitting all pertinent information, and shall also inform the Bank of all new powers of attorney or the revocation of current powers of attorney, providing a copy of the corresponding public deeds; |
| f) | Submit to the Bank, at its request, information necessary to correctly apply the provisions on individual credit limits; |
| g) | Maintain and ensure that each Subsidiary maintains its books, records and accounting notes in which it makes complete, timely and reliable notes in conformity with current standards and IFRS; |
| h) | Maintain all relevant rights, licenses, permits, brands, franchises, concessions or patents fully valid, with the understanding, however, that these rights, licenses, permits, brands, franchises, concessions or patents may be surrendered to the extent that they do not involve an Important Adverse Effect. In particular, it shall maintain ownership of the following brands directly or through its subsidiaries: (i) “Jumbo” and (ii) “París”; |
| i) | Comply with and ensure that each Subsidiary complies with each and every one of its obligations by virtue of any act, contract or convention, whose failure to comply produces or could produce, individually or collectively, an Important Adverse Effect; |
| j) | Comply with and ensure that each Relevant Subsidiary complies with current law and standards applicable to the development of its business and ownership of its assets; |
| k) | Pay and ensure that each Subsidiary pays, fully and opportunely, all important obligations, which are understood for the purposes of this instrument as those obligations that are important for the business, operations, financial or other conditions, projections, including but not limited to all taxes, charges or property taxes it must pay, as well as all obligations that, for taxes, charges, property taxes, labor matters or obligations with its suppliers or others, may result in an Encumbrance, except when compliance of these obligations is challenged through proper legal proceedings initiated in good faith and adequate accounting provisions have been established in accordance with IFRS; |
F-142
| l) | Maintain and ensure that each Relevant Subsidiary maintains all assets necessary to keep its businesses and operations in proper working order and maintenance, except for wear resulting from legitimate use. It shall also maintain and ensure that each Relevant Subsidiary maintains proper insurance coverage for these assets in conformity with industry practice; |
| m) | Ensure that all operations with related persons, as defined in law number eighteen thousand forty-five, either directly or through related persons, are carried out under prevailing market conditions; |
| n) | Ensure that at any time its obligations under this agreement shall have the same payment preference (pari passu) as its other debts with third party creditors. These restrictions shall not be applied to any case where the agreement considers them Permitted Encumbrances; |
| o) | Maintain direct or indirect ownership of at least fifty-one percent of Cencosud Retail S.A. y Cencosud Shopping Centers S.A., as well as its successor companies and transferees and the Companies that eventually control the business areas currently developed by these Companies; |
| p) | Maintain a ratio of net financial liabilities to equity of less than one point two. For these purposes, net financial liabilities shall be defined as all consolidated current financial debt of Cencosud S.A. less the sum of the items Cash, Time Deposits, Marketable Securities and repo agreements and forward contracts accounted for in Other Assets. Net Financial Debt shall also include the obligations that the company undertakes as endorser or simple or joint guarantor and all obligations where it responds directly or indirectly for obligations of unrelated third parties. In no case shall net Financial Debt include the liabilities owed by Banco París; |
| q) | Maintain a ratio of total liabilities to equity of less than one point five; |
| r) | Maintain minimum equity of twenty-eight million UF. |
| s) | Not dispose of or transfer, and ensure that the Relevant Subsidiaries do not dispose of or transfer, either directly or indirectly, their Essential Assets, as defined hereinafter. For the purposes of this agreement, “Essential Assets” shall be defined as the brands “Jumbo” and “París” and the shares that represent at least fifty-one percent of the capital of the companies Cencosud Retail S.A. and Cencosud Shopping Centers S.A. and; |
| t) | Not enter into or execute, and not allow Relevant Subsidiaries to enter into or execute any act or agreement to liquidate or dissolve its operations or businesses, nor to agree on, enter into or execute any act to split or merge, when it involves or may involve, directly or indirectly, losing control or ownership of its current businesses, as well as the assets necessary for execution and that it produces or may produce an Important Adverse Effect, except when such acts are for an amount less than or equal to two percent of the consolidated assets of Cencosud S.A. |
| 9. | As established in the Indenture dated January 20, 2011, entered into under the laws of the state of New York, United States, and by virtue of which Rule 144/A bonds were placed in the U.S. market, the Company, hereinafter the Issuer, has the following obligations and management restrictions, among others: |
| a) | Prohibition from granting encumbrances; |
| b) | Prohibition from entering into leaseback agreements; |
| c) | Prohibition from merging or selling all or a substantial part of its assets; |
| d) | Reporting obligations established in Rule 144/A and; |
| e) | Obligation to submit annual and quarterly financial statements to the trustee and bondholders. |
F-143
| 10. | As established in the loan agreement signed September 7, 2011 between Cencosud S.A. as Debtor and Banco Bilbao Vizcaya Argentaria Chile as Creditor, Cencosud S.A., shall comply with the following obligations and financial and management restrictions: |
| a) | Submit to the Bank a copy of the Debtor’s consolidated Financial Statements for each quarter as soon as possible and in any event within 30 days of filing them with the SVS, to the extent that this information is not available on the SVS’s website or another publicly accessible website. These Financial Statements shall be prepared in accordance with IFRS or applicable standards in Chile; |
| b) | Submit to the Bank a copy of the Debtor’s individual and consolidated Financial Statements for each year end as soon as possible and in any event within 30 days of filing them with the SVS, to the extent that this information is not available on the SVS’s website or another publicly accessible website. These Financial Statements shall be certified by an independent auditor of recognized international prestige that is registered with the SVS; |
| c) | Along with the Financial Statements referred to in the preceding letters, submit to the Bank a certificate issued by the Debtor’s Chief Executive Officer and/or Chief Financial Officer, or their replacement, that certifies that, to the best of their knowledge and understanding, no Grounds for Non-Compliance has occurred or detailing the nature and extent of such events if they have occurred; |
| d) | Notify the Bank as soon as possible but no later than 5 banking days after the date on which any one of the indicated executives of the Debtor has knowledge of: (i) the occurrence of any Grounds for Non-Compliance or any Non-Compliance; (ii) any action, lawsuit or judicial or administrative proceedings regarding the agreement; (iii) any circumstance or event that affects or could result in an Adverse Important Effect on the businesses, activities, operations or financial situation of the Debtor and that results in the inability to pay of the Debtor; (iv) any relevant event referring to the Debtor’s operations that, in conformity with articles nine and ten of Law eighteen thousand forty-five on Securities Markets and the instructions provided by the SVS in General Character Ruling number thirty, may be interpreted as a material event, to the extent that that information is not available on the SVS’s website or another publicly accessible site and provided that that information is not considered “reserved” in conformity with the law; (v) submit to the Bank, when requested in writing and for justified reasons, additional information on the financial, tax, accounting, economic and/or legal situation of the Debtor, in which case it shall be provided within 30 banking days of the date on which the request is made in writing; (vi) submit to the Bank, at its request, information necessary to correctly apply the provisions on individual credit limits; |
| e) | Maintain and ensure that each Subsidiary maintains its books, records and accounting notes in which it makes complete, timely and reliable notes in conformity with current standards and/or IFRS; |
| f) | Maintain all relevant rights, licenses, permits, brands, franchises, concessions or patents fully valid, with the understanding, however, that the Debtor or any of its Subsidiaries may surrender these rights, licenses, permits, brands, franchises, concessions or patents to the extent that they do not involve an Important Adverse Effect. In particular, the Debtor shall maintain ownership of the following brands directly or through its subsidiaries: (i) “Jumbo” and (ii) “París”; |
| g) | Comply with and ensure that each Subsidiary complies with each and every one of its obligations by virtue of any act, contract or convention, whose failure to comply produces or could produce, individually or collectively, an Important Adverse Effect; |
| h) | Comply with and ensure that each Relevant Subsidiary complies with current laws and standards applicable to the development of its business and ownership of its assets; |
| i) | Pay and ensure that each Subsidiary pays, fully and opportunely, all important obligations, which are understood for the purposes of this instrument as those obligations that are important for the Debtor’s business, operations, financial or other conditions, including but not limited to all taxes, charges or property taxes it must pay, as well as all obligations that, for taxes, charges, property taxes, labor matters or obligations with its suppliers or others, may result in an Encumbrance, except when compliance of these obligations is challenged by the Debtor or a Relevant Subsidiary, through proper legal proceedings initiated in good faith and adequate accounting provisions have been established in accordance with IFRS or the current standards in Chile; |
| j) | Maintain and ensure that each Relevant Subsidiary maintains all assets necessary to keep its businesses and operations in proper working order and maintenance, except for wear resulting from legitimate use. The Debtor shall also maintain and ensure that each Relevant Subsidiary maintains proper insurance coverage for these assets in conformity with industry practice; |
F-144
| k) | Ensure that all operations with related persons, as defined in law number 18,045, either directly or through related persons, are carried out under prevailing market conditions; |
| l) | Ensure that at any time the Debtor’s obligations under this agreement shall have the same payment preference (pari passu) as its other debts with third party creditors, a restriction which is not applicable in cases the agreement defines as Permitted Encumbrances. |
| m) | Possess, directly or indirectly, shares that represent at least 51% of the capital of the following companies: Cencosud Retail S.A. and Cencosud Shopping Centers S.A., and their respective successor companies and transferees, as well as the companies that may eventually control the business areas currently developed by these companies. |
| n) | Maintain a ratio of net financial liabilities to equity of less than one point two. |
| o) | Maintain assets free of pledges or Encumbrances or at least one hundred twenty percent of the value of liabilities; |
| p) | Not dispose of or transfer, and ensure that the Relevant Subsidiaries do not dispose of or transfer, either directly or indirectly, their Essential Assets, as defined in the agreement. |
| q) | Not enter into or execute, and not allow Relevant Subsidiaries to enter into or execute any act or agreement to liquidate or dissolve its operations or businesses, nor to agree on, enter into or execute any act to split or merge, when it causes or may cause the Debtor, directly or indirectly, to lose control or ownership of its current businesses, as well as the assets necessary for execution and that it produces or may produce an Important Adverse Effect, except when such acts are for an amount less than or equal to two percent of the consolidated assets of Cencosud S.A. |
| 11. | As established in the loan agreement signed September 14, 2011 between Cencosud S.A. as Debtor and Banco Bice, Chile as Creditor, Cencosud S.A., shall comply with the following obligations and financial and management restrictions: |
| a) | Submit to the Bank a copy of the Debtor’s consolidated Financial Statements for each quarter as soon as possible and in any event within 30 days of filing them with the SVS, to the extent that this information is not available on the SVS’s website or another publicly accessible website. These Financial Statements shall be prepared in accordance with IFRS or applicable standards in Chile; |
| b) | Submit to the Bank a copy of the Debtor’s individual and consolidated Financial Statements for each year end as soon as possible and in any event within 30 days of filing them with the SVS, to the extent that this information is not available on the SVS’s website or another publicly accessible website. These Financial Statements shall be certified by an independent auditor of recognized international prestige that is registered with the SVS; |
| c) | Along with the Financial Statements referred to in the preceding letters, submit to the Bank a certificate issued by the Debtor’s Chief Executive Officer and/or Chief Financial Officer, or their replacement, that certifies that, to the best of their knowledge and understanding, no Grounds for Non-Compliance has occurred or detailing the nature and extent of such events if they have occurred; |
F-145
| d) | Notify the Bank as soon as possible but no later than 5 banking days after the date on which any one of the indicated executives of the Debtor has knowledge of: (i) the occurrence of any Grounds for Non-Compliance or any Non-Compliance; (ii) any action, lawsuit or judicial or administrative proceedings regarding the agreement; (iii) any circumstance or event that affects or could result in an Adverse Important Effect on the businesses, activities, operations or financial situation of the Debtor and that results in the inability to pay of the Debtor; (iv) any relevant event referring to the Debtor’s operations that, in conformity with articles nine and ten of Law eighteen thousand forty-five on Securities Markets and the instructions provided by the SVS in General Character Ruling number thirty, may be interpreted as a material event, to the extent that that information is not available on the SVS’s website or another publicly accessible site and provided that that information is not considered “reserved” in conformity with the law; (v) submit to the Bank, when requested in writing and for justified reasons, additional information on the financial, tax, accounting, economic and/or legal situation of the Debtor, in which case it shall be provided within 30 banking days of the date on which the request is made in writing; (vi) submit to the Bank, at its request, information necessary to correctly apply the provisions on individual credit limits; |
| e) | Maintain and ensure that each Subsidiary maintains its books, records and accounting notes in which it makes complete, timely and reliable notes in conformity with current standards and/or IFRS; |
| f) | Maintain all relevant rights, licenses, permits, brands, franchises, concessions or patents fully valid, with the understanding, however, that the Debtor or any of its Subsidiaries may surrender these rights, licenses, permits, brands, franchises, concessions or patents to the extent that they do not involve an Important Adverse Effect. In particular, the Debtor shall maintain ownership of the following brands directly or through its subsidiaries: (i) “Jumbo” and (ii) “París”; |
| g) | Comply with and ensure that each Subsidiary complies with each and every one of its obligations by virtue of any act, contract or convention, whose failure to comply produces or could produce, individually or collectively, an Important Adverse Effect; |
| h) | Comply with and ensure that each Relevant Subsidiary complies with current laws and standards applicable to the development of its business and ownership of its assets; |
| i) | Pay and ensure that each Subsidiary pays, fully and opportunely, all important obligations, which are understood for the purposes of this instrument as those obligations that are important for the Debtor’s business, operations, financial or other conditions, including but not limited to all taxes, charges or property taxes it must pay, as well as all obligations that, for taxes, charges, property taxes, labor matters or obligations with its suppliers or others, may result in an Encumbrance, except when compliance of these obligations is challenged by the Debtor or a Relevant Subsidiary, through proper legal proceedings initiated in good faith and adequate accounting provisions have been established in accordance with IFRS or the current standards in Chile; |
| j) | Maintain and ensure that each Relevant Subsidiary maintains all assets necessary to keep its businesses and operations in proper working order and maintenance, except for wear resulting from legitimate use. The Debtor shall also maintain and ensure that each Relevant Subsidiary maintains proper insurance coverage for these assets in conformity with industry practice; |
| k) | Ensure that all operations with related persons, as defined in law number 18,045, either directly or through related persons, are carried out under prevailing market conditions; |
| l) | Ensure that at any time the Debtor’s obligations under this agreement shall have the same payment preference (pari passu) as its other debts with third party creditors, a restriction which is not applicable in cases the agreement defines as Permitted Encumbrances. |
| m) | Possess, directly or indirectly, shares that represent at least 51% of the capital of the following companies: Cencosud Retail S.A. and Cencosud Shopping Centers S.A., and their respective successor companies and transferees, as well as the companies that may eventually control the business areas currently developed by these companies. |
F-146
| n) | Maintain a ratio of net financial liabilities to equity of less than one point two. |
| o) | Maintain assets free of pledges or Encumbrances or at least one hundred twenty percent of the value of its liabilities; |
| p) | Not dispose of or transfer, and ensure that the Relevant Subsidiaries do not dispose of or transfer, either directly or indirectly, their Essential Assets, as defined in the agreement. |
| q) | Not enter into or execute, and not allow Relevant Subsidiaries to enter into or execute any act or agreement to liquidate or dissolve its operations or businesses, nor to agree on, enter into or execute any act to split or merge, when it causes or may cause the Debtor, directly or indirectly, to lose control or ownership of its current businesses, as well as the assets necessary for execution and that it produces or may produce an Important Adverse Effect, except when such acts are for an amount less than or equal to two percent of the consolidated assets of Cencosud S.A. |
| 12. | As established in the line of credit agreement signed September 20, 2011 between Cencosud S.A. as Debtor and Banco Santander-Chile as Creditor, Cencosud S.A., shall comply with the following obligations and financial and management restrictions: |
| a) | Submit to the Bank its quarterly and annual individual Financial Statements, together with the quarterly consolidated Financial Statements of Cencosud to the extent that these documents have not been published on a publicly accessible website. These Financial Statements shall be submitted to the Bank within sixty days of the corresponding quarter end. The year-end Financial Statements shall be submitted to the Bank within one hundred twenty days of the respective year end. The year-end individual Financial Statements of Cencosud shall be audited and submitted with their notes and the opinion of the Independent Auditors; |
| b) | Supply opportunely, accurately and sufficiently, and to the extent available all financial and accounting information and all other information that the Bank reasonably requests and that is necessary for evaluating and controlling faithful and exact compliance with the Agreement; |
| c) | Comply fully and opportunely with the payment of all relevant obligations considered first-class loans, especially labor, social security, tax and other obligations with such preference. For these purposes, relevant obligations “Relevant Obligations” are those whose cumulative amount exceeds one million United States dollars or their equivalent in domestic currency. A delay of less than thirty days in the payment of the aforementioned obligations shall not be considered non-compliance for the purposes of this clause; |
| d) | Maintain an “Indebtedness Level” based on the Financial Statements of Cencosud of a ratio of Other Current Financial Liabilities and Other Non-Current Financial Liabilities, less Cash and Cash Equivalents, less Other Current Financial Assets, over Cencosud’s Total Equity no greater than one point two. Liabilities shall include the obligations that Cencosud undertakes as endorser, simple and/or joint guarantor and those in which it responds directly or indirectly for obligations of third parties, all in conformity with accounting principles generally accepted in Chile GAAP or IFRS, as appropriate; and |
| e) | Maintain a ratio of Assets Free of Pledges and/or Encumbrances and Liabilities equal to or greater than one point two. For these purposes, “Assets” is defined as all real estate or chattel property and assets, tangible or intangible and securities; and “Liabilities” is defined as all obligations of the debtor, financial or not, contingent or not, less the Equity of Cencosud; |
| f) | Submit to the Bank a copy of its audited annual report within thirty days of its approval at the General Shareholders’ Meeting as set forth in its by-laws—or in the absence of by-laws, by the law—to the extent that these documents have not been published on a publicly accessible website. |
F-147
| 13. | As established in the line of credit agreement signed October 04, 2011 between Cencosud S.A. as Debtor and Rabobank Curacao N.V as Creditor, Cencosud S.A., shall comply with the following obligations and financial and management restrictions: |
| a) | Maintain with the rest of the lenders at least the same conditions, guarantees or preferences under this agreement, according to the Chilean law, except for the preferences in favor of the fiscal authority, employees, labor obligations and any other obligation imposed by applicable laws. |
| b) | Not encumber or give guarantee over Assets of Cencosud, except for the mentioned in this agreement. |
| c) | Send the Audited Financial Statements under IFRS and its corresponding notes, as soon as they are available, even if they are not in the S.V.S web site. |
| d) | Send, amongst with the Financial Information, a letter signed off by the attorneys properly authorized by the debtor, a letter informing comply or not any of the obligations included in this contract. |
| e) | The debtor will inform any relevant or essential event that could be adversely affect within ten bank business days after the event occurs, except for legal exceptions. |
| f) | As soon as take knowledge, and within thirty business bank days, the company should inform the following: i) any potential force major that could affect this contract; ii) any fails to comply to the terms of this agreement, litigation or relevant claims against the debtor or any event that could adversely affect the obligations included in this contract, iii) inform to the bank any deviation in the budget under this contract iv) Any event that could adversely affect and could reasonably occurs, mentioned before. |
| g) | Give to the bank any copy of the documents or notice relevant that could result in any material adversely effect to the bank. |
| h) | Inform any modifications to the by-laws within fifteen business bank days. |
| i) | Inform to the bank, within ten bank business days, any claim, action or demand initiated against the company by any court or other public or private entity that could cause any material adverse effect. |
| j) | Keep updated the contingencies plans to keep the business on going and make the best effort to accomplish with the main obligations related to licenses, permits, software. |
| k) | Inform to the bank, within ten bank business days the acquisition over or equal to fifty millions of US dollars, of any ownership in companies that give to the debtor the control over that company. |
| l) | To pay on time taxes, labor or other obligations. |
| m) | To keep accurate accounting records according to the generally accounting principles accepted in Chile |
| n) | Keep the main asset to the business in good shape, giving proper maintenance, keeping insurance over the asset. Specially the debtor will keep the property of the following bands a) Jumbo and b) Paris |
| o) | Keep its actual business operations and activities. |
| p) | To keep the actual number of shares in its main subsidiaries |
| q) | Comply with the laws, regulations and other legal provisions applicable to its subsidiaries. |
| r) | Maintain the following financial ratios: (i) Leverage Ratio of no more than 1.2; (ii) Consolidated Equity greater than UF 28,000,000; (iii) assets pledges or encumbrances over consolidated liabilities under 1.2 |
F-148
| s) | Not sell or transfer any essential consolidated asset. Essential asset under this contract are the brands a) Jumbo and Paris, b) the shares that represent at least fifty percent of the companies “Cencosud Retail S.A.” and Cencosud Shopping Centers S.A. |
| t) | Not enter into or execute, and not allow Relevant Subsidiaries to enter into or execute any act or agreement to liquidate or dissolve its operations or businesses, nor to agree on, enter into or execute any act to split or merge, when it involves or may involve, directly or indirectly, losing control or ownership of its current businesses, as well as the assets necessary for execution and that it produces or may produce an Important Adverse Effect. |
| 14. | As established in the credit agreement signed October 19, 2011 between Cencosud S.A. as Debtor and Scotiabank & Trust (Cayman) LDT as Creditor, Cencosud S.A., shall comply with the following obligations and financial and management restrictions: |
| a) | Send the Audited Financial Statements under IFRS and its corresponding notes , as soon as they are available, even if they are not in the S.V.S web site. |
| b) | Send copy of the general information reported by the debtor to the S.V.S to accomplish with any rule. |
| c) | Send the taxes or stamp tax payments to which this contract is affected and inform any action on this taxes. |
| d) | Send, amongst with the Financial Information, a letter signed off by the attorneys properly authorized by the debtor, a letter informing comply or not any of the obligations included in this contract. Additionally to that the company should send a certificate signed off by the external auditors. |
| e) | Give to the bank any change in relevant events that could result in any material adversely effect to the bank. |
| f) | Ensure that at any time its obligations under this agreement shall have the same payment preference (pari passu) as its other debts with third party creditors. |
| g) | Not sell, transfer or give guarantees over any essential consolidated asset of the company or any subsidiary. |
| h) | The debtor and the guarantors cannot incur in other indebtedness, except for those consider as part of the normal business and that cannot adversely affect the Company. |
| i) | Keep the main asset to the business in good shape, giving proper maintenance, keeping insurance over the asset. |
| j) | Prohibition to the debtor or guarantor, merging or selling its assets, except for the exceptions consider in this agreement. |
| k) | To keep accurate accounting records according to the generally accounting principles accepted in Chile. |
| l) | To keep actual main business operations. |
| m) | Maintain the following financial ratios: (i) Leverage Ratio of no more than 1.2; (ii) Consolidated Equity greater than UF 28,000,000; (iii) Maintain a financial expense ratio of at least 3.0 to 1.0 and assets pledges or encumbrances over consolidated liabilities under 1.2. |
| n) | Not engage in, with related persons, transactions under conditions that are more that those transactions which could have agree with third parties. |
F-149
| 15. | According to the stated in the “Indenture”, dated December 6, 2012 under the bond issuance pursuant to Rule 144ª under the Securities Act, the Company as “issuer” shall comply with the following: |
| a) | The Company shall not, nor shall it permit any Subsidiary to, issue, assume or suffer to exist any Indebtedness, if such Indebtedness is secured by a Lien upon any property or assets of the Company or any Subsidiary, unless, concurrently therewith, the Securities shall be secured equally and ratably with (or prior to) such Indebtedness; provided, except for the mentioned in the agreement. |
| b) | The Company shall not, nor shall it permit any Subsidiary to, enter into any Sale and Leaseback Transaction with respect to any of their property or assets, unless (a) the Company or such Subsidiary would be entitled pursuant to Section 5.02 of the agreement to issue or assume Indebtedness (in an amount equal to the Attributable Value with respect to such Sale and Leaseback Transaction) secured by a Lien on such property or assets without equally and ratably securing the Securities, (b) the Company or such Subsidiary shall apply or cause to be applied, in the case of a sale or transfer for cash, the net proceeds thereof and, in the case of a sale or transfer otherwise than for cash, an amount equal to the fair market value (as determined in good faith by the Board of Directors) of the property or assets so leased, (i) to the retirement, within 360 days after the effective date of such Sale and Leaseback Transaction, of (A) Indebtedness of the Company ranking at least pari passu with the Securities or (B) Indebtedness of any Subsidiary, in each case owing to a Person other than the Company or any Affiliate of the Company, or (ii) to the acquisition, purchase, construction, development, extension or improvement of any property or assets of the Company or any Subsidiary used or to be used by or for the benefit of the Company or any Subsidiary in the ordinary course of business or (c) the Company or such Subsidiary equally and ratably secures the Securities. Except for transactions providing for a lease for a term, including any renewal, of not more than three years or to arrangements between the Company and a Subsidiary or between Subsidiaries. |
| c) | Submit or make accessible electronically with notice to the trustee as soon as they are available, but in any event within 120 calendar days after the end of each fiscal year of the Company (currently ending December 31), copies of its audited financial statements on a consolidated basis) in respect of such fiscal year (including a profit and loss account, statements of financial position and cash flow statement), in English, prepared in accordance with IFRS and audited by a member firm of an internationally recognized firm of independent accountants. As soon as they are available, but in any event within 90 calendar days after the end of each of the first three fiscal quarters of each fiscal year of the Company, copies of its unaudited financial statements (on a consolidated basis) in respect of the relevant period (including a profit and loss account, statements of financial position and cash flow statement), in English, prepared on a basis consistent with the audited financial statements of the Company and in accordance with IFRS, together with a certificate signed by the person then authorized to sign financial statements on behalf of the Company to the effect that such financial statements are true in all material respects and present fairly the financial position of the Company as at the end of, and the results of its operations for, the relevant quarterly period in the event the Company is subject to the reporting requirements of Section 13 or 15(d) of the Exchange Act, timely file with the Commission such annual and other reports as may be required by the rules and regulations of the Commission in effect at the relevant time and in the form required thereunder. |
| d) | The Company shall take all action necessary to provide information to permit resale of the Securities pursuant to Rule 144A under the Securities Act, including furnishing to any Holder of a Security or beneficial interest in a Global Security, or to any prospective purchaser designated by such Holder, upon written request of such Holder, financial and other information required to be delivered under Rule 144A(d)(4) (as amended from time to time and including any successor provision) unless, at the time of such request, the Company is subject to the reporting requirements of Section 13 or Section 15(d) of the Exchange Act or is exempt from such requirements pursuant to Rule 12g3-2(b) under the Exchange Act (as amended from time to time and including any successor provision). |
F-150
| e) | Protect its existence as a corporation, and, in the case of the Company, the corporate, partnership, limited liability company or other existence of each Subsidiary, in accordance with the respective organizational documents (as the same may be amended from time to time) of the Company, the Guarantor or any such Subsidiary; |
| f) | Neither the Company nor the Guarantor shall consolidate with or merge into any other Person or convey or transfer its properties and assets substantially as an entirety to any Person except for the mentioned in the agreement. |
| 16. | As established in the novation contract, recognition of debt and restructuring signed march 21, 2014 between Cencosud Administradora de Tarjetas S.A.; Cencosud S.A. as Debtor and Banco Bilbao Vizcaya Argentaria Chile as Creditor, Cencosud S.A., shall comply with the following obligations and financial and management restrictions: |
| a) | Submit to the Bank a copy of its individual and consolidated Financial Statements for each quarter as soon as possible and in any event within thirty days of filing them with the SVS, to the extent that this information is not available on the SVS’s website or another publicly accessible website. If it were not obligated to file this information with the SVS, it must still submit it to the Bank as soon as it is available. These Financial Statements shall be prepared in accordance with IFRS; |
| b) | Submit to the Bank a copy of its individual and consolidated Financial Statements for each year end as soon as possible and in any event within thirty days of filing them with the SVS, to the extent that this information is not available on the SVS’s website or another publicly accessible website. If it were not obligated to file this information with the SVS, it must still submit it to the Bank as soon as it is available. These Financial Statements shall be certified by an independent auditor of recognized international prestige that is registered with the SVS; |
| c) | Along with the Financial Statements referred to in the preceding letters, submit to the Bank a certificate issued by the Chief Executive Officer and/or Chief Financial Officer, or their replacement, that certifies that, to the best of their knowledge and understanding, no Grounds for Non-compliance or Non-Compliance, as defined in the agreement, have occurred or detailing the nature and extent of such events if they have occurred; |
| d) | Notify the Bank as soon as possible but no later than five banking days after the date on which any executive has knowledge of: (i) the occurrence of any Grounds for Non-Compliance, as defined in the agreement, or any Non-Compliance; (ii) any action, lawsuit or judicial or administrative proceedings regarding this instrument; (iii) any circumstance or event that affects or could result in an Important Adverse Effect on the businesses, activities, operations or financial situation of Cencosud and that results in the inability to pay of the Debtor and/or Cencosud; (iv) any relevant event referring to Cencosud’s operations that, in conformity with articles nine and ten of Law eighteen thousand forty-five on Securities Markets and the instructions provided by the SVS in General Character Ruling number thirty, may be interpreted as a material event, to the extent that that information is not available on the SVS’s website or another publicly accessible site and provided that that information is not considered “reserved” in conformity with the law; |
| e) | Submit to the Bank, when requested in writing or for justified reasons, additional information on the financial, tax, accounting, economic and/or legal situation of Cencosud, in which case it shall be provided within thirty banking days of the date on which the request is made in writing. Notwithstanding, and at the Bank’s request, Cencosud shall inform the Bank of the modifications made to the Company within thirty banking days of the event, submitting all pertinent information, and shall also inform the Bank of all new powers of attorney or the revocation of current powers of attorney, providing a copy of the corresponding public deeds; |
| f) | Submit to the Bank, at its request, information necessary to correctly apply the provisions on individual credit limits; |
| g) | Maintain and ensure that each Subsidiary maintains its books, records and accounting notes in which it makes complete, timely and reliable notes in conformity with current standards and IFRS; |
F-151
| h) | Maintain all relevant rights, licenses, permits, brands, franchises, concessions or patents fully valid, with the understanding, however, that these rights, licenses, permits, brands, franchises, concessions or patents may be surrendered to the extent that they do not involve an Important Adverse Effect. In particular, it shall maintain ownership of the following brands directly or through its subsidiaries: (i) “Jumbo” and (ii) “París”; |
| i) | Comply with and ensure that each Subsidiary complies with each and every one of its obligations by virtue of any act, contract or convention, whose failure to comply produces or could produce, individually or collectively, an Important Adverse Effect; |
| j) | Comply with and ensure that each Relevant Subsidiary complies with current laws and standards applicable to the development of its business and ownership of its assets; |
| k) | Pay and ensure that each Subsidiary pays, fully and opportunely, all important obligations, which are understood for the purposes of this instrument as those obligations that are important for the business, operations, financial or other conditions, projections, including but not limited to all taxes, charges or property taxes it must pay, as well as all obligations that, for taxes, charges, property taxes, labor matters or obligations with its suppliers or others, may result in an Encumbrance, except when compliance of these obligations is challenged through proper legal proceedings initiated in good faith and adequate accounting provisions have been established in accordance with IFRS; |
| l) | Maintain and ensure that each Relevant Subsidiary maintains all assets necessary to keep its businesses and operations in proper working order and maintenance, except for wear resulting from legitimate use. It shall also maintain and ensure that each Relevant Subsidiary maintains proper insurance coverage for these assets in conformity with industry practice; |
| m) | Ensure that all operations with related persons, as defined in law number eighteen thousand forty-five, either directly or through related persons, are carried out under prevailing market conditions; |
| n) | Ensure that at any time its obligations under this agreement shall have the same payment preference (pari passu) as its other debts with third party creditors. These restrictions shall not be applied to any case where the agreement considers them Permitted Encumbrances; |
| o) | Possess, directly or indirectly, shares that represent at least fifty-one percent of the capital of the following Companies: Cencosud Retail S.A. and Cencosud Shopping Centers S.A., and their respective successor companies and transferees, as well as the Companies that eventually control the business areas currently developed by these Companies; |
| p) | Maintain a ratio of net financial liabilities to equity of less than one point two; |
| q) | Maintain assets free of pledges or Encumbrances or at least one hundred twenty percent of the value of liabilities; |
| r) | Not dispose of or transfer, and ensure that the Relevant Subsidiaries do not dispose of or transfer, either directly or indirectly, their Essential Assets, as defined hereinafter. For the purposes of this agreement, “Essential Assets” shall be defined as the brands “Jumbo” and “París” and the shares that represent at least fifty-one percent of the capital of the companies Cencosud Retail S.A. and Cencosud Shopping Centers S.A. and; |
| s) | Not enter into or execute, and not allow Relevant Subsidiaries to enter into or execute any act or agreement to liquidate or dissolve its operations or businesses, nor to agree on, enter into or execute any act to split or merge, when it involves or may involve, directly or indirectly, that the Debtor and/or the Guarantor lose control or ownership of its current businesses, as well as the assets necessary for execution and that it produces or may produce an Important Adverse Effect, except when such acts are for an amount less than or equal to two percent of the consolidated assets of Cencosud S.A. |
F-152
| 17. | As established in the credit agreement signed March 25, 2014 between Cencosud S.A. as Debtor and Mizuho Bank Ltd as Creditor, Cencosud S.A., shall comply with the following obligations and financial and management restrictions: |
| a) | Annual Financial Statements. To the extent that they are not freely available at a public access web page of the SVS, the SEC web page or the Borrower’s corporate web page, it will provide to the Lender, within five (5) Business Days after the date on which they are required to be furnished to the SVS or, if no longer required by the SVS, within 90 days after the end of each fiscal year of the Borrower, the Consolidated balance sheet of the Borrower and its Consolidated Subsidiaries as at the end of such fiscal year and the related Consolidated statements of income and retained earnings and statement of changes in financial position of the Borrower and its Consolidated Subsidiaries for such fiscal year, setting forth in each case in comparative form the figures for the previous fiscal year, and the Consolidated statement of cash flows for such fiscal year, all reported on in conformity with Applicable Accounting Principles and with the unqualified opinion thereon of independent public accountants of recognized international standing. |
| b) | Quarterly Financial Statements. To the extent that they are not freely available at a public access web page of the SVS, the SEC web page or the Borrower’s corporate web page, it will provide to the Lender within five (5) Business Days after the date on which they are required to be furnished to the SVS or, if no longer required by the SVS, within 60 days after the end of the first three quarters of each fiscal year of the Borrower, the unaudited Consolidated balance sheet of the Borrower and its Consolidated Subsidiaries as at the end of each such fiscal quarter and the related unaudited Consolidated statements of income and retained earnings of the Borrower and its Consolidated Subsidiaries for such quarter and for the portion of the fiscal year ended at the end of such quarter, setting forth in the case of such statements of income and retained earnings in comparative form the figures for the corresponding quarter and the corresponding portion of the previous fiscal year, and the unaudited Consolidated statement of cash flows for such fiscal quarter, all certified as to fairness of presentation and conformity with Applicable Accounting Principles by a senior financial officer of the Borrower. |
| c) | Information to the Superintendencia de Valores y Seguros of the Republic of Chile. To the extent that they are not freely available at a public access web page of the SVS, the United Stated Securities and Exchange Commission (“SEC”) or the Borrower’s corporate web page, promptly after the making of any filing with the SVS of any circular, document or other material written information required to be filed with the SVS and distributed generally to the Borrower’s shareholders, it will provide a copy thereof to the Lender with the exception of any private, confidential or restricted access communications with the SVS or the SEC as the Borrower may reasonably determine. |
| d) | Stamp Tax. Promptly after the Borrower has paid any Stamp Tax required to be paid by it hereunder, the Borrower will deliver to the Lender one copy of any document or other information required to be filed in connection with such payment. |
| e) | Litigation. It will promptly deliver to the Lender details of any litigation, arbitration or administrative proceeding which, had it been current, pending or threatened at the date of this Agreement, would have rendered the representation and warranty in Section 3.10 incorrect. |
| f) | Events of Default. It will promptly notify the Lender of the occurrence of any Event of Default or Default, together with a description of any action taken or proposed to be taken to remedy it. Together with each financial statement delivered by it under Sections 5.1(a) and (b), and promptly after any request made by the Lender from time to time, it will deliver to the Lender a certificate signed on its behalf by the Gerente de Finanzas or such other Person as may be acceptable to the Lender for that purpose (i) for each fiscal quarter of the Borrower, setting forth reasonably detailed calculations demonstrating compliance with Section 5.9 and (ii) confirming that, so far as it is aware and (if applicable) except as previously notified to the Lender or waived in accordance with Section 7.1, no Event of Default or Default has occurred and is continuing or (as the case may be) setting out details of any which has occurred and is continuing and has not been so notified and of which it is aware and of any action taken or proposed to be taken to remedy it. |
| g) | Notices. It will promptly give notice to the Lender of (i) any changes known to the Borrower in taxes, duties or other fees of Chile or any political subdivision or taxing authority thereof or any change known to the Borrower in any laws of Chile, that would reasonably be expected to adversely affect the ability of the Borrower to make any payment due under this Agreement or the Note and (ii) any development or event which has had or would reasonably be expected to have a Material Adverse Effect. |
| h) | Other Information. It will promptly deliver to the Lender such other information relating to the financial condition or business of the Borrower or any of its Material Subsidiaries (including, without limitation, such information regarding the use of proceeds of the Loan) as the Lender may from time to time reasonably request. |
F-153
| i) | Notices to Central Bank. On the Drawdown Date, it will give notice to the Central Bank of the terms and conditions of the Loan as contemplated by this Agreement. |
| j) | Ranking. The Borrower will take all actions necessary to ensure that its payment obligations hereunder and under the Note rank and will at all times rank at least pari passu with all other present and future unsecured and unsubordinated Indebtedness of the Borrower. |
| k) | Limitation on Liens and Asset Dispositions. (a) The Borrower will not, and will not permit any of its Material Subsidiaries to, sell, assign or otherwise transfer to any Person (other than to the Borrower) any of the Essential Assets, except that the Borrower or any Material Subsidiary may sell, assign or otherwise transfer Essential Assets (x) in the ordinary course its business provided that such sale, assignment or transfer of assets is for at least the fair market value of such assets and (y) outside of the ordinary course of its business for fair value in an aggregate amount not to exceed an amount equal to 10% of the Borrower’s or such Material Subsidiary’s total assets, as the case may be, in any fiscal year and provided that the proceeds of any such sale, assignment or transfer shall be reinvested in the business of the Borrower, or in the case of a sale, assignment or other transfer of Essential Assets by any other Subsidiary, in the business of the Borrower or any other Subsidiary, in each case, within 90 days of receipt thereof. The parties agree that a Material Subsidiary Change in Control shall not qualify as a sale, assignment or transfer of Essential Assets for purposes of this Agreement. |
(b) The Borrower will not, and will not permit any of its Material Subsidiaries to create, incur or suffer to exist in favor of any Person any Lien (other than Permitted Liens and the Liens existing on the date hereof) on any Assets of the Borrower; provided that at all times the ratio of the total Assets of the Borrower and its Consolidated Subsidiaries (determined on a Consolidated basis) that are not subject to any Lien (including Permitted Liens) to the Borrower’s Total Liabilities must be at least 1.20.
| l) | Maintenance of Existence and Payment of Obligations. The Borrower will (a) subject to Section 5.8, preserve, renew and keep in full force and effect its corporate existence, (b) take all reasonable action to maintain all rights, privileges and franchises necessary or desirable in the normal conduct of its business, except to the extent that failure to do so would not reasonably be expected to have a Material Adverse Effect and (c) pay, discharge or otherwise satisfy at or before maturity or before they become delinquent, as the case may be, all its taxes and other obligations of whatever nature, except to the extent that failure to do so would not reasonably be expected to have a Material Adverse Effect or where the amount or validity thereof is currently being contested in good faith by appropriate proceedings and reserves to the extent required by Applicable Accounting Principles have been provided on the books of the Borrower. |
| m) | Compliance With Laws; Authorizations. The Borrower will comply with any applicable Requirements of Law to which it is subject and obtain and comply with the terms of and maintain in full force and effect all authorizations, approvals, licenses and consents required by the laws and regulations of Chile to the extent necessary to enable the Borrower lawfully to enter into and perform its obligations under the Loan Documents or to ensure the legality, validity, enforceability or admissibility in evidence in Chile of the Loan Documents except to the extent that failure to do so would not reasonably be expected to have a Material Adverse Effect. |
| n) | Maintenance of Property; Insurance. The Borrower will, and will cause each of its Material Subsidiaries to, keep all Assets used or useful in its business in good working order and condition, ordinary wear and tear excepted, except to the extent that failure to do so could not reasonably be expected to have a Material Adverse Effect, and maintain with financially sound insurance companies insurance on all its tangible Assets in at least such amounts and against at least such risks as are customary for its type of business. |
| o) | Books and Records. The Borrower will, and will cause each of its Subsidiaries to, keep proper books of records and account in which full, true and correct entries in conformity with Applicable Accounting Principles and all applicable Requirements of Law to which it is subject shall be made of all dealings and transactions in relation to its business and activities. |
| p) | Limitation on Fundamental Changes. The Borrower will not (a) enter into any transaction of merger, consolidation or amalgamation, unless (i) such transaction of merger, consolidation or amalgamation does not result in an Event of Default and (ii) in the case of any such transaction of merger, consolidation or |
F-154
| | amalgamation, the Borrower is the surviving corporation or (b) spin off any of its businesses, Subsidiaries or groups of Assets to any Person other than a Subsidiary except for any spin-offs which do not have a Material Adverse Effect. |
| q) | Net Financial Debt to Consolidated Net Worth plus Minority Interests Ratio. The Borrower will not permit the Net Financial Debt to Consolidated Net Worth plus Minority Interests Ratio at any time to exceed 1.2 to 1.0. |
| r) | Transactions with Affiliates. The Borrower will not, nor will it permit any of its Subsidiaries to: (a) transfer, sell, lease, assign or otherwise dispose of any Assets to an Affiliate, (b) make any loan or extension of credit to an Affiliate, (c) merge into or consolidate with an Affiliate except as permitted by Section 5.9, or purchase or acquire Assets from an Affiliate or (d) enter into any other transaction, with or for the benefit of an Affiliate unless, in each case, such transaction that is entered into with an Affiliate is on an arm’s-length basis on terms no more favorable to such Affiliate than would be available to an unrelated Person. |
| s) | Purpose of the Loans. The Borrower will not use any of the proceeds of the Loan, directly or indirectly, for the purpose, whether immediate, incidental or ultimate, of buying or carrying any “margin stock” within the meaning of Regulation U of the Board of Governors of the Federal Reserve System, as in effect from time to time. The Lender shall not have any responsibility as to the use by the Borrower of any of such proceeds. |
| t) | Central Bank Notice. Within 5 Business Days of the Drawdown Date, the Lender shall have received evidence satisfactory to it that the corresponding notice required by Chapter XIV of the Foreign Exchange Regulations issued by the Central Bank has been made. |
| 18. | As established in the credit agreement signed March 26, 2014 between Cencosud S.A. as Debtor and Rabobank as Creditor, Cencosud S.A., shall comply with the following obligations and financial and management restrictions: |
| a) | Submit to the Bank, so soon be possible and in any case in ninety days following the closing date of Financial Statements for each quarter and annuals, to the extent that this information is not available on the SVS’s website or another publicly accessible website, copy of his Financial statements, individual and consolidated, for the period understood in every quarter and understood in the annual exercise, case the latter inside hundred twenty days of the closing and certified by an auditor independent from recognized prestige. These Financial statements will have to be prepared in conformity with IFRS |
| b) | Submit to the Bank a certificate issued by the Chief Executive Officer and/or Chief Financial Officer, or their replacement, that certifies that, to the best of their knowledge and understanding, no grounds for non-compliance or violation, as defined hereinafter, have occurred or detailing the nature and extent of such events if they have occurred; |
| c) | Notify the Bank as soon as possible but no later than five banking days after the date on which any executive has knowledge of: (i) the occurrence of any Grounds for Non-Compliance, as defined hereinafter, or any Non-Compliance; (ii) any action, lawsuit or judicial or administrative proceedings regarding this instrument; (iii) any circumstance or event that affects or could result in an Adverse Important Effect on the businesses, activities, operations or financial situation of the Debtor and/or Cencosud and that results in the inability to pay of the Debtor and/or Cencosud; (iv) any relevant event referring to Cencosud’s and/or the Guarantor’s operations that, in conformity with articles nine and ten of Law eighteen thousand forty-five on Securities Markets and the instructions provided by the SVS in General Character Ruling number thirty, may be interpreted as a material event, to the extent that that information is not available on the SVS’s website or another publicly accessible site; |
| d) | Submit to the Bank, when requested in writing or for justified reasons, additional information on its financial, tax, accounting, economic and/or legal situation, in which case it shall be provided within thirty banking days of the date on which the request is made in writing. Notwithstanding, and at the Bank’s request, it shall inform the Bank of the modifications made to the Company within thirty banking days of the event, submitting all pertinent information, and shall also inform the Bank of all new powers of attorney or the revocation of current powers of attorney, providing a copy of the corresponding public deeds; |
F-155
| e) | Submit to the Bank, at its request, information necessary to correctly apply the provisions on individual credit limits; |
| f) | Maintain and ensure that each Subsidiary maintains its books, records and accounting notes in which it makes complete, timely and reliable notes in conformity with current standards and IFRS; |
| g) | Maintain all relevant rights, licenses, permits, brands, franchises, concessions or patents fully valid, with the understanding, however, that these rights, licenses, permits, brands, franchises, concessions or patents may be surrendered to the extent that they do not involve an Important Adverse Effect. In particular, it shall maintain ownership of the following brands directly or through its subsidiaries: (i) “Jumbo” and (ii) “París”; |
| h) | Comply with and ensure that each Subsidiary complies with each and every one of its obligations by virtue of any act, contract or convention, whose failure to comply produces or could produce, individually or collectively, an Important Adverse Effect; |
| i) | Comply with and ensure that each Relevant Subsidiary complies with current laws and standards applicable to the development of its business and ownership of its assets; |
| j) | Pay and ensure that each Subsidiary pays, fully and opportunely, all important obligations, which are understood for the purposes of this instrument as those obligations that are important for the business, operations, financial or other conditions, projections, including but not limited to all taxes, charges or property taxes it must pay, as well as all obligations that, for taxes, charges, property taxes, labor matters or obligations with its suppliers or others, may result in an Encumbrance, except when compliance of these obligations is challenged through proper legal proceedings initiated in good faith and adequate accounting provisions have been established in accordance with IFRS; |
| k) | Maintain and ensure that each Relevant Subsidiary maintains all assets necessary to keep its businesses and operations in proper working order and maintenance, except for wear resulting from legitimate use. It shall also maintain and ensure that each Relevant Subsidiary maintains proper insurance coverage for these assets in conformity with industry practice; |
| l) | Ensure that all operations with related persons, as defined in law number eighteen thousand forty-five, either directly or through related persons, are carried out under prevailing market conditions; |
| m) | Ensure that at any time its obligations under this agreement shall have the same payment preference (pari passu) as its other debts with third party creditors. These restrictions shall not be applied to any case where the agreement considers them Permitted Encumbrances; |
| n) | Maintain direct or indirect ownership of at least fifty-one percent of Cencosud Retail S.A. and Cencosud Shopping Centers S.A., as well as its successor companies and transferees and the Companies that eventually control the business areas currently developed by these Companies; |
| o) | Maintain in the consolidated Financial Statements income from the business areas of sales to the detail, administration of omercial centers, real-estate investment and evaluation, grant and credit administration, to an equivalent level, at least, of 67 % of the income of exploitation consolidated. |
| p) | Maintain a ratio of net financial liabilities to equity of less than one point two. |
| q) | Maintain assets free of pledges or Encumbrances or at least one hundred twenty percent of the value of current; |
| r) | Maintain minimum equity of twenty-eight million UF. |
| s) | Not dispose of or transfer, and ensure that the Relevant Subsidiaries do not dispose of or transfer, either directly or indirectly, their Essential Assets, as defined hereinafter. For the purposes of this agreement, “Essential Assets” shall be defined as the brands “Jumbo” and “París” and the shares that represent at least fifty-one percent of the capital of the companies Cencosud Retail S.A. and Cencosud Shopping Centers S.A. and; |
F-156
| t) | Not enter into or execute, and not allow Relevant Subsidiaries to enter into or execute any act or agreement to liquidate or dissolve its operations or businesses, nor to agree on, enter into or execute any act to split or merge, when it involves or may involve, directly or indirectly, losing control or ownership of its current businesses, as well as the assets necessary for execution and that it produces or may produce an Important Adverse Effect, except when such acts are for an amount less than or equal to two percent of the consolidated assets of Cencosud S.A. |
| u) | Do not constitute liens on assets other than those defined as permitted liens. |
| 19. | As established in the credit agreement signed March 28, 2014 between Cencosud S.A. as Debtor and Banco Santander-Chile as Creditor, Cencosud S.A., shall comply with the following obligations and financial and management restrictions: |
| a) | Submit to the Bank, so soon be possible and in any case in ninety days following the closing date of Financial Statements for each quarter and annuals, to the extent that this information is not available on the SVS’s website or another publicly accessible website, copy of his Financial statements, individual and consolidated, for the period understood in every quarter and understood in the annual exercise, case the latter inside hundred twenty days of the closing and certified by an auditor independent from recognized prestige. These Financial statements will have to be prepared in conformity with IFRS |
| b) | Submit to the Bank a certificate issued by the Chief Executive Officer and/or Chief Financial Officer, or their replacement, that certifies that, to the best of their knowledge and understanding, no grounds for non-compliance or violation, as defined hereinafter, have occurred or detailing the nature and extent of such events if they have occurred; |
| c) | Notify the Bank as soon as possible but no later than five banking days after the date on which any executive has knowledge of: (i) the occurrence of any Grounds for Non-Compliance, as defined hereinafter, or any Non-Compliance; (ii) any action, lawsuit or judicial or administrative proceedings regarding this instrument; (iii) any circumstance or event that affects or could result in an Adverse Important Effect on the businesses, activities, operations or financial situation of the Debtor and/or Cencosud and that results in the inability to pay of the Debtor and/or Cencosud; (iv) any relevant event referring to Cencosud’s and/or the Guarantor’s operations that, in conformity with articles nine and ten of Law eighteen thousand forty-five on Securities Markets and the instructions provided by the SVS in General Character Ruling number thirty, may be interpreted as a material event, to the extent that that information is not available on the SVS’s website or another publicly accessible site; |
| d) | Submit to the Bank, when requested in writing or for justified reasons, additional information on its financial, tax, accounting, economic and/or legal situation, in which case it shall be provided within thirty banking days of the date on which the request is made in writing. Notwithstanding, and at the Bank’s request, it shall inform the Bank of the modifications made to the Company within thirty banking days of the event, submitting all pertinent information, and shall also inform the Bank of all new powers of attorney or the revocation of current powers of attorney, providing a copy of the corresponding public deeds; |
| e) | Submit to the Bank, at its request, information necessary to correctly apply the provisions on individual credit limits; |
| f) | Maintain and ensure that each Subsidiary maintains its books, records and accounting notes in which it makes complete, timely and reliable notes in conformity with current standards and IFRS; |
| g) | Maintain all relevant rights, licenses, permits, brands, franchises, concessions or patents fully valid, with the understanding, however, that these rights, licenses, permits, brands, franchises, concessions or patents may be surrendered to the extent that they do not involve an Important Adverse Effect. In particular, it shall maintain ownership of the following brands directly or through its subsidiaries: (i) “Jumbo” and (ii) “París”; |
| h) | Comply with and ensure that each Subsidiary complies with each and every one of its obligations by virtue of any act, contract or convention, whose failure to comply produces or could produce, individually or collectively, an Important Adverse Effect; |
| i) | Comply with and ensure that each Relevant Subsidiary complies with current laws and standards applicable to the development of its business and ownership of its assets; |
F-157
| j) | Pay and ensure that each Subsidiary pays, fully and opportunely, all important obligations, which are understood for the purposes of this instrument as those obligations that are important for the business, operations, financial or other conditions, projections, including but not limited to all taxes, charges or property taxes it must pay, as well as all obligations that, for taxes, charges, property taxes, labor matters or obligations with its suppliers or others, may result in an Encumbrance, except when compliance of these obligations is challenged through proper legal proceedings initiated in good faith and adequate accounting provisions have been established in accordance with IFRS; |
| k) | Maintain and ensure that each Relevant Subsidiary maintains all assets necessary to keep its businesses and operations in proper working order and maintenance, except for wear resulting from legitimate use. It shall also maintain and ensure that each Relevant Subsidiary maintains proper insurance coverage for these assets in conformity with industry practice; |
| l) | Ensure that all operations with related persons, as defined in law number eighteen thousand forty-five, either directly or through related persons, are carried out under prevailing market conditions; |
| m) | Ensure that at any time its obligations under this agreement shall have the same payment preference (pari passu) as its other debts with third party creditors. These restrictions shall not be applied to any case where the agreement considers them Permitted Encumbrances; |
| n) | Maintain direct or indirect ownership of at least fifty-one percent of Cencosud Retail S.A. and Cencosud Shopping Centers S.A., as well as its successor companies and transferees and the Companies that eventually control the business areas currently developed by these Companies; |
| o) | Maintain a ratio of net financial liabilities to equity of less than one point two. |
| p) | Maintain assets free of pledges or Encumbrances or at least one hundred twenty percent of the value of current; |
| q) | To quote with the Bank the contracting of derivative products and financial services. |
| r) | Not dispose of or transfer, and ensure that the Relevant Subsidiaries do not dispose of or transfer, either directly or indirectly, their Essential Assets, as defined hereinafter. For the purposes of this agreement, “Essential Assets” shall be defined as the brands “Jumbo” and “París” and the shares that represent at least fifty-one percent of the capital of the companies Cencosud Retail S.A. and Cencosud Shopping Centers S.A. and; |
| s) | Not enter into or execute, and not allow Relevant Subsidiaries to enter into or execute any act or agreement to liquidate or dissolve its operations or businesses, nor to agree on, enter into or execute any act to split or merge, when it involves or may involve, directly or indirectly, losing control or ownership of its current businesses, as well as the assets necessary for execution and that it produces or may produce an Important Adverse Effect, except when such acts are for an amount less than or equal to two percent of the consolidated assets of Cencosud S.A. |
| 20. | As established in the credit agreement signed March 28, 2014 between Cencosud S.A. as Debtor and Sumitomo Mitsui Banking Corporation as Creditor, Cencosud S.A., shall comply with the following obligations and financial and management restrictions: |
| a) | Annual Financial Statements. To the extent that they are not freely available at a public access web page of the SVS, the SEC web page or the Borrower’s corporate web page, it will provide to the Lender, within five (5) Business Days after the date on which they are required to be furnished to the SVS or, if no longer required by the SVS, within 90 days after the end of each fiscal year of the Borrower, the Consolidated balance sheet of the Borrower and its Consolidated Subsidiaries as at the end of such fiscal year and the related Consolidated statements of income and retained earnings and statement of changes in financial position of the Borrower and its Consolidated Subsidiaries for such fiscal year, setting forth in each case in comparative form the figures for the previous fiscal year, and the Consolidated statement of cash flows for such fiscal year, all reported on in conformity with Applicable Accounting Principles and with the unqualified opinion thereon of independent public accountants of recognized international standing. |
F-158
| b) | Quarterly Financial Statements. To the extent that they are not freely available at a public access web page of the SVS, the SEC web page or the Borrower’s corporate web page, it will provide to the Lender within five (5) Business Days after the date on which they are required to be furnished to the SVS or, if no longer required by the SVS, within 75 days after the end of the first three quarters of each fiscal year of the Borrower, the unaudited Consolidated balance sheet of the Borrower and its Consolidated Subsidiaries as at the end of each such fiscal quarter and the related unaudited Consolidated statements of income and retained earnings of the Borrower and its Consolidated Subsidiaries for such quarter and for the portion of the fiscal year ended at the end of such quarter, setting forth in the case of such statements of income and retained earnings in comparative form the figures for the corresponding quarter and the corresponding portion of the previous fiscal year, and the unaudited Consolidated statement of cash flows for such fiscal quarter, all certified as to fairness of presentation and conformity with Applicable Accounting Principles by a senior financial officer of the Borrower. |
| c) | Information to the Superintendencia de Valores y Seguros of the Republic of Chile. To the extent that they are not freely available at a public access web page of the SVS, the United Stated Securities and Exchange Commission (“SEC”) or the Borrower’s corporate web page, promptly after the making of any filing with the SVS of any circular, document or other material written information required to be filed with the SVS and distributed generally to the Borrower’s shareholders, it will provide notice of such filing and a copy thereof to the Lender with the exception of any private, confidential or restricted access communications with the SVS or the SEC as the Borrower may reasonably determine. |
| d) | Stamp Tax. Promptly after the Borrower has paid any Stamp Tax required to be paid by it hereunder, the Borrower will deliver to the Lender one copy of any document or other information required to be filed in connection with such payment. |
| e) | Litigation. It will promptly deliver to the Lender details of any litigation, arbitration or administrative proceeding which, had it been current, pending or threatened at the date of this Agreement, would have rendered the representation and warranty in Section 3.10 incorrect. |
| f) | Events of Default. It will promptly notify the Lender of the occurrence of any Event of Default or Default, together with a description of any action taken or proposed to be taken to remedy it. Together with each financial statement delivered by it under Sections 5.1(a) and (b), it will deliver to the Lender a certificate signed on its behalf by the Gerente de Finanzas or such other Person as may be acceptable to the Lender for that purpose (i) for each fiscal quarter of the Borrower, setting forth reasonably detailed calculations demonstrating compliance with Section 5.9 and (ii) confirming that so far as it is aware and (if applicable) except as previously notified to the Lender or waived in accordance with Section 7.1, no Event of Default or Default has occurred and is continuing or (as the case may be) setting out details of any which has occurred and is continuing and has not been so notified and of which it is aware and of any action taken or proposed to be taken to remedy it. |
| g) | Notices. It will promptly give notice to the Lender of (i) any changes known to the Borrower in Taxes of Chile or any political subdivision or taxing authority thereof or any change known to the Borrower in any laws of Chile, that would reasonably be expected to adversely affect the ability of the Borrower to make any payment due under this Agreement or the Note, (ii) any Material Subsidiary Change in Control, (iii) any sale of Assets outside of the ordinary course of business and (iv) any development or event which has had or would reasonably be expected to have a Material Adverse Effect, provided that in the case of clauses (ii) and (iii), notice need not be provided to the extent the information relates to confidential (hecho reservado) communications with the SVS or the SEC as the Borrower may reasonably determine. |
| h) | Other Information. It will promptly deliver to the Lender such other information relating to the financial condition or business of the Borrower or any of its Material Subsidiaries as the Lender may from time to time reasonably request. |
| i) | Notices to Central Bank. On the Drawdown Date, it will give notice to the Central Bank of the terms and conditions of the Loan as contemplated by this Agreement. |
F-159
| j) | Ranking. The Borrower will take all actions necessary to ensure that its payment obligations hereunder and under the Note rank and will at all times rank at least pari passu with all other present and future unsecured and unsubordinated Indebtedness of the Borrower. |
| k) | Limitation on Liens and Asset Dispositions. (a) The Borrower will not, and will not permit any of its Material Subsidiaries to, sell, assign or otherwise transfer to any Person (other than to the Borrower) any of its material Assets, except that the Borrower or any Material Subsidiary may sell, assign or otherwise transfer material Assets (x) in the ordinary course its business provided that such sale, assignment or transfer of assets is for at least the fair market value of such assets and (y) outside of the ordinary course of its business for fair value in an aggregate amount not to exceed an amount equal to 10% of the Borrower’s or such Material Subsidiary’s total assets, as the case may be, in any fiscal year, and provided that, the proceeds of any such sale, assignment or transfer shall be reinvested in the business of the Borrower, or in the case of a sale, assignment or other transfer of Essential Assets by any other Subsidiary, in the business of the Borrower or any other Subsidiary, in each case, within 90 days of receipt thereof. If such proceeds are not reinvested within such 90 day period, the Borrower shall prepay the outstanding principal amount of the Loan in whole or ratably in part, together with accrued interest to the date of such prepayment on the principal amount prepaid, in an amount equal to the net cash proceeds received by the Borrower or any of its Material Subsidiaries in connection with any such sale, lease or transfer. |
(b) The Borrower will not, and will not permit any of its Material Subsidiaries to create, incur or suffer to exist in favor of any Person any Lien (other than Permitted Liens and the Liens existing on the date hereof) on any Assets of the Borrower if such Lien (if foreclosed upon) would have a Material Adverse Effect; provided that at all times the ratio of the total Assets of the Borrower and its Consolidated Subsidiaries (determined on a Consolidated basis) that are not subject to any Lien (including Permitted Liens) to the Borrower’s Total Liabilities must be at least 1.20:1.00.
| l) | Maintenance of Existence and Payment of Obligations. The Borrower will, and will cause each of its Material Subsidiaries to, (a) subject to Section 5.8, preserve, renew and keep in full force and effect its corporate existence, (b) take all reasonable action to maintain all rights, privileges and franchises necessary or desirable in the normal conduct of its business, except to the extent that failure to do so would not reasonably be expected to have a Material Adverse Effect and (c) pay, discharge or otherwise satisfy at or before maturity or before they become delinquent, as the case may be, all its Taxes and other obligations of whatever nature, except to the extent that failure to do so would not reasonably be expected to have a Material Adverse Effect or where the amount or validity thereof is currently being contested in good faith by appropriate proceedings and reserves to the extent required by Applicable Accounting Principles have been provided on the books of the Borrower. |
| m) | Compliance With Laws; Authorizations. The Borrower will (a) comply with any applicable Requirements of Law to which it is subject, except to the extent that failure to do so would not reasonably be expected to have a Material Adverse Effect and (b) obtain and comply with the terms of and maintain in full force and effect all authorizations, approvals, licenses and consents, including those relating to Jumbo and París, required by the laws and regulations of Chile to the extent necessary to enable the Borrower lawfully to enter into and perform its obligations under the Loan Documents or to ensure the legality, validity, enforceability or admissibility in evidence in Chile of the Loan Documents. |
| n) | Maintenance of Property; Insurance. The Borrower will, and will cause each of its Material Subsidiaries to, keep all Assets used or useful in its business in good working order and condition, ordinary wear and tear excepted, except to the extent that failure to do so could not reasonably be expected to have a Material Adverse Effect, and maintain with financially sound insurance companies insurance on all its tangible Assets in at least such amounts and against at least such risks as are customary for its type of business. |
| o) | Books and Records. The Borrower will, and will cause each of its Subsidiaries to, keep proper books of records and account in which full, true and correct entries in conformity with Applicable Accounting Principles and all applicable Requirements of Law to which it is subject shall be made of all dealings and transactions in relation to its business and activities. |
| p) | Limitation on Fundamental Changes. The Borrower will not (a) enter into any transaction of merger, consolidation or amalgamation, unless (i) such transaction of merger, consolidation or amalgamation does not result in a Default or an Event of Default and (ii) in the case of any such transaction of merger, consolidation or amalgamation, the Borrower is the surviving corporation or (b) spin off any of its |
F-160
| | businesses, Subsidiaries or groups of Assets to any Person other than a Subsidiary except for any spin-offs which do not have a Material Adverse Effect, provided, the Borrower will not enter any such transaction if, after giving effect to such transaction, less than 67% of the Borrower’s consolidated net income would be attributable to income from businesses other than its retail, investment, lending and management businesses. |
| q) | Net Financial Debt to Consolidated Net Worth plus Minority Interests Ratio. The Borrower will not permit the Net Financial Debt to Consolidated Net Worth plus Minority Interests Ratio at any time to exceed 1.2 to 1.0. |
| r) | Stamp Tax. The Borrower will, on the Drawdown Date, pay any Stamp Tax required to be paid by it hereunder. |
| s) | Transactions with Affiliates. The Borrower will not, nor will it permit any of its Subsidiaries to: (a) transfer, sell, lease, assign or otherwise dispose of any Assets to an Affiliate, (b) make any loan or extension of credit to an Affiliate, (c) merge into or consolidate with an Affiliate except as permitted by Section 5.9, or purchase or acquire Assets from an Affiliate or (d) enter into any other transaction, with or for the benefit of an Affiliate unless, in each case, such transaction that is entered into with an Affiliate is on an arm’s-length basis on terms no more favorable to such Affiliate than would be available to an unrelated Person. |
| t) | Purpose of the Loans. The Borrower will not use any of the proceeds of the Loan, directly or indirectly, for the purpose, whether immediate, incidental or ultimate, of buying or carrying any “margin stock” within the meaning of Regulation U of the Board of Governors of the Federal Reserve System, as in effect from time to time. The Lender shall not have any responsibility as to the use by the Borrower of any of such proceeds. |
| u) | Anti-Terrorism. The Borrower shall not, and shall not permit any of its Subsidiaries or any of their respective directors or officers to become subject to any Sanctions. The Borrower shall, and shall cause each of its Subsidiaries and their respective directors and officers to remain in compliance, in all material respects, with (i) all applicable Sanctions Laws, (ii) to the extent applicable, all Anti-Corruption Laws and (iii) the PATRIOT Act, to the extent applicable, and any other terrorism and money laundering laws, rules, regulations and orders applicable to the Borrower and its Subsidiaries. The Borrower shall not, and shall cause each of its Subsidiaries not to, use any part of the proceeds of the Loan, directly or indirectly, (A) for the purpose of financing any activities or business of or with any Person or in any country or territory that at such time is the subject of any Sanctions or (B) for any payments to any governmental official or employee, political party, official of a political party, candidate for political office, or anyone else acting in an official capacity, in order to obtain, retain or direct business or obtain any improper advantage, in violation of any Anti-Corruption Law. |
| v) | Central Bank Notice. Within 5 Business Days of the Drawdown Date, the Lender shall have received evidence satisfactory to it that the corresponding notice required by Chapter XIV of the Foreign Exchange Regulations issued by the Central Bank has been made. |
| 21. | As established in the credit agreement signed November 13, 2014 between Cencosud S.A. as Debtor and HSBC Bank USA, N.A. as Creditor, Cencosud S.A., shall comply with the following obligations and financial and management restrictions: |
| a) | Annual Financial Statements. To the extent that they are not freely available at a public access web page of the SVS, the SEC web page or the Borrower’s corporate web page, it will provide to the Administrative Agent and the Lenders, within five (5) Business Days after the date on which they are required to be furnished to the SVS or, if no longer required by the SVS, within 90 days after the end of each fiscal year of the Borrower, the Consolidated balance sheet of the Borrower and its Consolidated Subsidiaries as at the end of such fiscal year and the related audited Consolidated statements of income and retained earnings and statement of changes in financial position of the Borrower and its Consolidated Subsidiaries for such fiscal year, setting forth in each case in comparative form the figures for the previous fiscal year, and the audited Consolidated statement of cash flows for such fiscal year, all reported on in conformity with Applicable Accounting Principles and with the unqualified opinion thereon of independent public accountants of recognized international standing. Such financial statements shall be provided with a schedule in form satisfactory to the Administrative Agent of the computations used by the Borrower in determining compliance with the covenant contained in Section 5.9. |
F-161
| b) | Quarterly Financial Statements. To the extent that they are not freely available at a public access web page of the SVS, the SEC web page or the Borrower’s corporate web page, it will provide to the Administrative Agent and the Lenders within five (5) Business Days after the date on which they are required to be furnished to the SVS or, if no longer required by the SVS, within 75 days after the end of the first three quarters of each fiscal year of the Borrower, the unaudited Consolidated balance sheet of the Borrower and its Consolidated Subsidiaries as at the end of each such fiscal quarter and the related unaudited Consolidated statements of income and retained earnings of the Borrower and its Consolidated Subsidiaries for such quarter and for the portion of the fiscal year ended at the end of such quarter, setting forth in the case of such statements of income and retained earnings in comparative form the figures for the corresponding quarter and the corresponding portion of the previous fiscal year, and the unaudited Consolidated statement of cash flows for such fiscal quarter, all certified as to fairness of presentation and conformity with Applicable Accounting Principles by a senior financial officer of the Borrower, together with a schedule in form satisfactory to the Administrative Agent of the computations used by the Borrower in determining compliance with the covenant contained in Section 5.9. |
| c) | Information to the Superintendencia de Valores y Seguros of the Republic of Chile. To the extent that they are not freely available at a public access web page of the SVS, the United Stated Securities and Exchange Commission (“SEC”) or the Borrower’s corporate web page, promptly after the making of any filing with the SVS of any circular, document or other material written information required to be filed with the SVS and distributed generally to the Borrower’s shareholders, it will provide a copy thereof to the Administrative Agent and the Lenders with the exception of any private, confidential or restricted access communications with the SVS or the SEC as the Borrower may reasonably determine. |
| d) | Central Bank Registration. Promptly after the Borrower has registered the terms and conditions of the Loans with the Central Bank, the Borrower will deliver to the Administrative Agent and the Lenders one copy of any document or other information in connection with such registration. |
| e) | Litigation. It will promptly deliver to the Administrative Agent and the Lenders details of any litigation, arbitration or administrative proceeding which, had it been current, pending or threatened at the date of this Agreement, would have rendered the representation and warranty in Section 3.10 incorrect. |
| f) | Events of Default. It will promptly notify the Administrative Agent and the Lenders of the occurrence of any Event of Default or Default, together with a description of any action taken or proposed to be taken to remedy it. Together with each financial statement delivered by it under Sections 5.1(a) and (b), and promptly after any request made by any Lender through the Administrative Agent from time to time, it will deliver to such Lender and the Administrative Agent a certificate signed on its behalf by the Gerente de Finanzas or such other Person as may be acceptable to such Lender for that purpose (i) for each fiscal quarter of the Borrower, setting forth reasonably detailed calculations demonstrating compliance with Section 5.9 and (ii) confirming that, so far as it is aware and (if applicable) except as previously notified to such Lender and the Administrative Agent or waived in accordance with Section 8.1, no Event of Default or Default has occurred and is continuing or (as the case may be) setting out details of any which has occurred and is continuing and has not been so notified and of which it is aware and of any action taken or proposed to be taken to remedy it. |
| g) | Notices. It will promptly give notice to the Administrative Agent and the Lenders of (i) any changes known to the Borrower in taxes, duties or other fees of Chile or any political subdivision or taxing authority thereof or any change known to the Borrower in any laws of Chile, that would reasonably be expected to adversely affect the ability of the Borrower to make any payment due under this Agreement or the Note, (ii) the occurrence of any Material Subsidiary Change in Control and (iii) any development or event which has had or would reasonably be expected to have a Material Adverse Effect. |
| h) | Other Information. It will promptly deliver to any Lender such other information relating to the financial condition or business of the Borrower or any of its Material Subsidiaries (including, without limitation, such information regarding the use of proceeds of the Loan) as such Lender may from time to time reasonably request. |
| i) | Ranking. The Borrower will take all reasonable actions necessary to ensure that its payment obligations hereunder and under the Note rank and will at all times rank at least pari passu with all other present and future unsecured and unsubordinated Indebtedness of the Borrower. |
F-162
| j) | Limitation on Liens and Asset Dispositions. (a) The Borrower will not, and will not permit any of its Material Subsidiaries to, sell, assign or otherwise transfer to any Person (other than to the Borrower) any of the Essential Assets, except that the Borrower or any Material Subsidiary may sell, assign or otherwise transfer Essential Assets (x) in the ordinary course of its business provided that such sale, assignment or transfer of assets is for at least the fair market value of such assets and (y) outside of the ordinary course of its business for fair value in an aggregate amount not to exceed an amount equal to 10% of the Borrower’s or such Material Subsidiary’s total assets, as the case may be, in any fiscal year and provided that the proceeds of any such sale, assignment or transfer shall be reinvested in the business of the Borrower, or in the case of a sale, assignment or other transfer of Essential Assets by any other Subsidiary, in the business of the Borrower or any other Subsidiary, in each case, within 90 days of receipt thereof. If such proceeds are not reinvested within such 90 day period, the Borrower shall prepay the outstanding principal amount of the Loans in whole or ratably in part, together with accrued interest to the date of such prepayment on the principal amount prepaid, in an amount equal to the net cash proceeds received by the Borrower or any of its Material Subsidiaries in connection with any such sale, lease or transfer. The parties agree that a Material Subsidiary Change in Control shall not qualify as a sale, assignment or transfer of Essential Assets for purposes of this Agreement. |
(b) The Borrower will not, and will not permit any of its Material Subsidiaries to create, incur or suffer to exist in favor of any Person any Lien (other than Permitted Liens and the Liens existing on the date hereof) on any Assets of the Borrower as a result of which the ratio of the total Assets of the Borrower and its Consolidated Subsidiaries (determined on a Consolidated basis) that are not subject to any Lien (including Permitted Liens and Liens existing on the date hereof) to the Borrower’s Total Liabilities is less than 1.20.
| k) | Maintenance of Existence and Payment of Obligations. The Borrower will, and will cause each of its Material Subsidiaries to, (a) subject to Section 5.8, preserve, renew and keep in full force and effect its corporate existence, (b) take all reasonable action to maintain all rights, privileges and franchises necessary or desirable in the normal conduct of its business, except to the extent that failure to do so would not reasonably be expected to have a Material Adverse Effect and (c) pay, discharge or otherwise satisfy at or before maturity or before they become delinquent, as the case may be, all its taxes and other obligations of whatever nature, except to the extent that failure to do so would not reasonably be expected to have a Material Adverse Effect or where the amount or validity thereof is currently being contested in good faith by appropriate proceedings and reserves to the extent required by Applicable Accounting Principles have been provided on the books of the Borrower. |
| l) | Compliance With Laws; Authorizations. The Borrower will (a) comply with any applicable Requirements of Law to which it is subject, except to the extent that failure to do so would not reasonably be expected to have a Material Adverse Effect, and (b) obtain and comply with the terms of and maintain in full force and effect all authorizations, approvals, licenses and consents required by the laws and regulations of Chile to the extent necessary to enable the Borrower lawfully to enter into and perform its obligations under the Loan Documents or to ensure the legality, validity, enforceability or admissibility in evidence in Chile of the Loan Documents. |
| m) | Maintenance of Property; Insurance. The Borrower will, and will cause each of its Material Subsidiaries to, keep all Assets used or useful in its business in good working order and condition, ordinary wear and tear excepted, except to the extent that failure to do so could not reasonably be expected to have a Material Adverse Effect, and maintain with financially sound insurance companies insurance on all its tangible Assets in at least such amounts and against at least such risks as are customary for its type of business. |
| n) | Books and Records. The Borrower will, and will cause each of its Subsidiaries to, keep proper books of records and account in which full, true and correct entries in conformity with Applicable Accounting Principles and all applicable Requirements of Law to which it is subject shall be made of all dealings and transactions in relation to its business and activities. |
| o) | Limitation on Fundamental Changes. The Borrower will not (a) enter into any transaction of merger, consolidation or amalgamation, unless (i) such transaction of merger, consolidation or amalgamation does not result in a Default or an Event of Default and (ii) in the case of any such transaction of merger, consolidation or amalgamation, the Borrower is the surviving corporation or (b) spin off any of its businesses, Subsidiaries or groups of Assets to any Person other than a Subsidiary except for any spin-offs which do not have a Material Adverse Effect. |
F-163
| p) | Net Financial Debt to Consolidated Net Worth plus Minority Interests Ratio. The Borrower will not permit the Net Financial Debt to Consolidated Net Worth plus Minority Interests Ratio at any time to exceed 1.2 to 1.0. |
| q) | Transactions with Affiliates. The Borrower will not, nor will it permit any of its Subsidiaries to: (a) transfer, sell, lease, assign or otherwise dispose of any Assets to an Affiliate, (b) make any loan or extension of credit to an Affiliate, or (c) merge into or consolidate with an Affiliate except as permitted by Section 5.8, or purchase or acquire Assets from an Affiliate or (d) enter into any other transaction, with or for the benefit of an Affiliate; unless, in each case, such transaction that is entered into with an Affiliate is on an arm’s-length basis on terms no more favorable to such Affiliate than would be available to an unrelated Person. |
| r) | Purpose of the Loans. The Borrower will not use any of the proceeds of the Loan, directly or indirectly, for the purpose, whether immediate, incidental or ultimate, of buying or carrying any “margin stock” within the meaning of Regulation U of the Board of Governors of the Federal Reserve System, as in effect from time to time. No Lender shall not have any responsibility as to the use by the Borrower of any of such proceeds. |
| s) | Change in Nature of Business. The Borrower will not engage in any material line of business substantially different from those lines of business conducted by the Borrower on the date hereof or any business reasonably related, complementary, synergistic or ancillary thereto or reasonable extensions thereof. |
| t) | Anti-Terrorism. The Borrower shall not, and shall not permit any of its Subsidiaries or any of their respective directors or officers to become subject to any Sanctions. The Borrower shall, and shall cause each of its Subsidiaries and their respective directors and officers to remain in compliance, with (i) all applicable Sanctions Laws and Regulations, (ii) in all material respects and to the extent applicable, all Anti-Corruption Laws and (iii) the PATRIOT Act, to the extent applicable, and any other terrorism and money laundering laws, rules, regulations and orders applicable to the Borrower and its Subsidiaries. The Borrower shall not, and shall cause each of its Subsidiaries not to, use any part of the proceeds of the Loan, directly or indirectly, (A) for the purpose of financing any activities or business of or with any Person or in any country or territory that at such time is the subject of any Sanctions, (B) for any payments to any governmental official or employee, political party, official of a political party, candidate for political office, or anyone else acting in an official capacity, in order to obtain, retain or direct business or obtain any improper advantage, in violation of any Anti-Corruption Law or (C) in any other manner that would result in a violation of Sanctions by any Person party to this Agreement. |
Central Bank Notice. The Borrower will give notice to the Central Bank of the terms and conditions of the Loans as contemplated by this Agreement.
As of December 31, 2014 and 2013, the Company was in compliance with the aforementioned financial debt covenants.
| 18 | Trade accounts payable and other payables |
The composition of the area detail of this item as of December 31, 2014 and 2013 is as follows:
| | | | | | | | | | | | | | | | |
| | | | | | As of December 31, | |
| | | Current | | | Non-current | |
Account | | 2014 | | | 2013 | | | 2014 | | | 2013 | |
| | | ThCh$ | | | ThCh$ | | | ThCh$ | | | ThCh$ | |
Trade payable | | | 1,768,572,529 | | | | 1,737,920,899 | | | | 29,125,971 | | | | 4,956,289 | |
Withholdings | | | 214,513,580 | | | | 220,072,319 | | | | 5,323,949 | | | | 3,998,528 | |
| | | | | | | | | | | | | | | | |
| | | | |
Total | | | 1,983,086,109 | | | | 1,957,993,218 | | | | 34,449,920 | | | | 8,954,817 | |
| | | | | | | | | | | | | | | | |
The main suppliers of Cencosud S.A. are as follows: Agrosuper Com.de Alimentos Ltda., Nestlé, Unilever Chile S.A., Unilever Argentina S.A., Samsung Electronics Chile, Mastellone Hnos. S.A., Comercial Santa Elena S.A., Empresas Carozzi S.A., Sancor Cooperativas Unidas Ltda., CMPC Tissue S.A., Organización Terpel S.A., Cervec y Malteria Quilmes SAI, Watts S.A.,Molinos Rio de la Plata S.A., BRF Brasil Foods S.A., Danone Argentina S.A., Compañía de Bebidas Das Americas Ambev, LG Electronics Colombia Ltda., Cooperativa Agrícola y Lechera de la Unión Ltda, LG Electronics Chile.
F-164
| 19 | Provisions and other liabilities |
| 19.1.1 | The composition of this item as of December 31, 2014 and 2013 is as follows: |
| | | | | | | | | | | | | | | | |
| | | | | | As of December 31, | |
| | | Current | | | Non-current | |
Accruals and provision | | 2014 | | | 2013 | | | 2014 | | | 2013 | |
| | | ThCh$ | | | ThCh$ | | | ThCh$ | | | ThCh$ | |
Legal claims provision(1) | | | 10,911,238 | | | | 41,702,611 | | | | 88,428,946 | | | | 67,478,191 | |
Onerous contracts provision(2) | | | 4,286,320 | | | | 4,703,672 | | | | 16,336,833 | | | | 20,744,395 | |
| | | | | | | | | | | | | | | | |
| | | | |
Total | | | 15,197,558 | | | | 46,406,283 | | | | 104,765,779 | | | | 88,222,586 | |
| | | | | | | | | | | | | | | | |
F-165
The following table shows the civil, labor and tax proceedings faced by the Company and its subsidiaries (by country). The proceedings comprising each category are those presenting a probable occurrence likelihood and the amount of loss can be quantified or estimated.
| | | | | | | | | | | | | | | | | | | | | | | | |
| | | Provision Legal Claims | | | Exposure | |
| | | Civil | | | Labor | | | Tax | | | Total | | | Current | | | Non-current | |
| | | ThCh$ | | | ThCh$ | | | ThCh$ | | | ThCh$ | | | ThCh$ | | | ThCh$ | |
Total as of December 31,2014 | | | 34,417,405 | | | | 26,372,660 | | | | 38,550,119 | | | | 99,340,184 | | | | 10,911,238 | | | | 88,428,946 | |
Total as of December 31,2013 | | | 32,828,662 | | | | 22,863,865 | | | | 53,488,275 | | | | 109,180,802 | | | | 41,702,612 | | | | 67,478,190 | |
| | | | | | | | | | | | | | | | | | | | | | | | |
| | | | | | | | |
Provision By Country | | December 31, 2014
ThCh$ | | | December 31,
2013
ThCh$ | |
Chile | | | 8,245,262 | | | | 8,803,142 | |
Argentina | | | 30,596,529 | | | | 30,310,516 | |
Brazil | | | 52,510,627 | | | | 61,400,392 | |
Peru | | | 227,747 | | | | 1,218,767 | |
Colombia | | | 7,760,019 | | | | 7,447,985 | |
| | | | | | | | |
Total Provision | | | 99,340,184 | | | | 109,180,802 | |
| | | | | | | | |
The nature of these obligations is as follows:
Civil provision: This primarily corresponds to civil and commercial trials that mainly deal with claims from customers, defects in products, accidents of customers in the stores and law suits related with customer service.
Labor provision: This primarily corresponds to staff severance indemnities and salary disputes from former employees.
Tax provision: This primarily corresponds to tax claims in the countries in which the Company operates.
(2) Provisions for onerous contracts
The provisions recorded under this concept correspond mainly to the excess over the fair value payable related to onerous lease contracts recorded in business combinations of the period.
| 19.2 | Movement of provisions: |
| | | | | | | | | | | | |
Provision type | | Legal claims | | | Onerous
contracts | | | Total | |
| | | ThCh$ | | | ThCh$ | | | ThCh$ | |
Initial Balance January 1, 2014 | | | 109,180,802 | | | | 25,448,067 | | | | 134,628,869 | |
| | | | | | | | | | | | |
Movements in Provisions: | | | | | | | | | | | | |
Additional provisions | | | 15,688,454 | | | | — | | | | 15,688,454 | |
Increase (decrease) in existing provisions | | | (9,569,206 | ) | | | (4,410,328 | ) | | | (13,979,534 | ) |
Provision used during the year | | | (11,984,434 | ) | | | — | | | | (11,984,434 | ) |
Reversal of used provision | | | (1,836,299 | ) | | | (414,586 | ) | | | (2,250,885 | ) |
Increase (decrease) in foreign exchange rate | | | (2,139,133 | ) | | | — | | | | (2,139,133 | ) |
| | | | | | | | | | | | |
Changes in provisions, total | | | (9,840,618 | ) | | | (4,824,914 | ) | | | (14,665,532 | ) |
| | | | | | | | | | | | |
| | | |
Total provision, closing balance as of December 31, 2014 | | | 99,340,184 | | | | 20,623,153 | | | | 119,963,337 | |
F-166
| | | | | | | | | | | | |
Provision type | | Legal claims | | | Onerous
contracts | | | Total | |
| | | ThCh$ | | | ThCh$ | | | ThCh$ | |
Initial Balance January 1, 2013 | | | 134,475,084 | | | | 38,132,983 | | | | 172,608,067 | |
Movements in Provisions: | | | | | | | | | | | | |
Additional provisions | | | 21,877,548 | | | | — | | | | 21,877,548 | |
Increase (decrease) in existing provisions | | | (24,671,256 | ) | | | (12,684,916 | ) | | | (37,356,172 | ) |
Acquisitions through business combinations (See note 13) | | | — | | | | — | | | | — | |
Provision used during the year | | | (11,624,382 | ) | | | — | | | | (11,624,382 | ) |
Reversal of used provision | | | (1,615,445 | ) | | | — | | | | (1,615,445 | ) |
Increase (decrease) in foreign exchange rate | | | (9,260,747 | ) | | | — | | | | (9,260,747 | ) |
| | | | | | | | | | | | |
Changes in provisions, total | | | (25,294,282 | ) | | | (12,684,916 | ) | | | (37,979,198 | ) |
| | | | | | | | | | | | |
| | | |
Total provision, closing balance as of December 31, 2013 | | | 109,180,802 | | | | 25,448,067 | | | | 134,628,869 | |
| | | | | | | | | | | | |
F-167
| 20 | Other non-financial liabilities |
The composition of this item as of December 31, 2014 and 2013 is as follows:
| | | | | | | | |
| | | As of December 31, | |
| | | 2014 | | | 2013 | |
| | | ThCh$ | | | ThCh$ | |
Customer loyalty program | | | 14,842,693 | | | | 10,697,957 | |
Guarantees deposits | | | 12,965,389 | | | | 9,895,969 | |
Minimum accrual dividend | | | 13,603,115 | | | | 24,042,737 | |
Other | | | 1,693,173 | | | | 3,172,198 | |
| | | | | | | | |
| | |
Total Other non-financial Liabilities, current | | | 43,104,370 | | | | 47,808,861 | |
| | | | | | | | |
| | |
Guarantees deposits | | | 13,817,670 | | | | 12,996,253 | |
Prepaid Commissions | | | 45,472,067 | | | | 46,853,181 | |
Other | | | 10,143,573 | | | | 5,625,256 | |
| | | | | | | | |
| | |
Total Other non-financial Liabilities, non-current | | | 69,433,310 | | | | 65,474,690 | |
| | | | | | | | |
| 21 | Current provisions for employee benefits |
21.1 Vacations and bonuses
The composition of this item as of December 31, 2014 and 2013 is as follows:
| | | | | | | | |
| | | As of December 31, | |
| | | 2014 | | | 2013 | |
| | | ThCh$ | | | ThCh$ | |
Employees’ vacation | | | 60,919,314 | | | | 56,440,586 | |
Income sharing and bonuses | | | 41,594,298 | | | | 40,256,284 | |
| | | | | | | | |
| | |
Total current provisions for employee benefits | | | 102,513,612 | | | | 96,696,870 | |
| | | | | | | | |
The amount of accumulated liabilities for vacations is calculated in accordance with current Chilean legislation on an accrual basis. The bonuses relate to the amount that is paid the following year with respect to compliance with annual targets, which can be estimated reliably.
F-168
21.2 Other employee benefits
| a) | Description and conditions |
The Group contributes to a post-employment and retirement benefit plans in Brazil, which are accounted for as defined benefit plan. These plans entitle the employees to receive certain benefits and pension payments after the respective vesting periods are fulfilled. The benefits on which the Group contributes are as follows:
| | |
| Benefits | | Conditions |
| |
| Pension due to an early retirement | | Retirement at age 55 and 5 years of service. |
| Pension due to disability | | 1 year of service |
| Death benefits | | 1 year of service |
| Other benefits | | Retirement at age 55 and 5 years of service. |
| Death pension | | 1 year of enrollment in the benefit plan |
The defined benefit plan expose the Group to actual risks, such as longevity risk, currency risk, interest rate risk and market (investment) risk.
The Group has two types of benefit plans in Brazil; a) benefit plan in which employees contribute, and b) benefits in which employees don’t make any contributions:
For plans in which the employees contribute: the contribution is conditioned to the formal adherence to the plan, the employees contribute with a 6% limit of their monthly salary, receiving in exchange an equal contribution from the employer (Cencosud Brazil). Furthermore, the employee receives a return from the plan asset.
Plan assets:
| | | | | | | | | | | | | | | | | | | | | | | | | | | | | | | | |
| | | December 31, 2014 | | | December 31, 2013 | |
| Suppliers | | Level 1 | | | Level 2 | | | Level 3 | | | Total | | | Level 1 | | | Level 2 | | | Level 3 | | | Total | |
| | | | | | | | |
Investment funds – fixed income | | | 2,049,308 | | | | — | | | | — | | | | 2,049,308 | | | | 1,999,393 | | | | — | | | | — | | | | 1,999,393 | |
Investments funds – Equity | | | 615,246 | | | | — | | | | — | | | | 615,246 | | | | 600,260 | | | | — | | | | — | | | | 600,260 | |
F-169
| c) | Movement in net defined benefit (asset) liability |
| | | | | | | | | | | | | | | | | | | | | | | | |
| | | Defined benefit obligation | | | Fair value of plan assets | | | Net defined benefit liability (asset) | |
| Movements | | ChTh$ | | | ChTh$ | | | ChTh$ | | | ChTh$ | | | ChTh$ | | | ChTh$ | |
| | | 2014 | | | 2013 | | | 2014 | | | 2013 | | | 2014 | | | 2013 | |
Balance at January 1 | | | 1,864,073 | | | | 3,035,810 | | | | (1,930,605 | ) | | | (2,692,991 | ) | | | (66,532 | ) | | | 342,819 | |
| | | | | | |
Service cost | | | 492,764 | | | | 1,251,097 | | | | — | | | | — | | | | 492,764 | | | | 1,251,097 | |
Past service credit | | | | | | | | | | | — | | | | — | | | | — | | | | — | |
Interest cost (Income) | | | 198,513 | | | | 263,487 | | | | (373,926 | ) | | | (245,458 | ) | | | (175,413 | ) | | | 18,029 | |
Included in profit of loss | | | 691,277 | | | | 1,514,584 | | | | (373,926 | ) | | | (245,458 | ) | | | 317,351 | | | | 1,269,126 | |
Re-measurement loss (gain): | | | | | | | | | | | | | | | | | | | | | | | | |
Actuarial loss (gain) | | | | | | | | | | | | | | | | | | | | | | | | |
Demographic assumptions | | | (225,165 | ) | | | (44,223 | ) | | | — | | | | — | | | | (225,165 | ) | | | (44,223 | ) |
Financial assumptions | | | (519,392 | ) | | | (779,221 | ) | | | — | | | | — | | | | (519,392 | ) | | | (779,221 | ) |
Experience adjustment | | | (2,882 | ) | | | (1,844,366 | ) | | | — | | | | — | | | | (2,882 | ) | | | (1,844,366 | ) |
Return on plan assets | | | — | | | | — | | | | 1,178,361 | | | | 1,767,333 | | | | 1,178,361 | | | | 1,767,333 | |
Exchange rates | | | (79,982 | ) | | | (25,319 | ) | | | 80,251 | | | | — | | | | 269 | | | | (25,319 | ) |
Included in OCI | | | (827,421 | ) | | | (2,693,129 | ) | | | 1,258,612 | | | | 1,767,333 | | | | 431,191 | | | | (925,796 | ) |
Contributions paid by employer | | | — | | | | 6,808 | | | | (778,053 | ) | | | (759,489 | ) | | | (778,053 | ) | | | (752,681 | ) |
Benefits paid | | | — | | | | — | | | | — | | | | — | | | | — | | | | — | |
Other | | | — | | | | 6,808 | | | | (778,053 | ) | | | (759,489 | ) | | | (778,053 | ) | | | (752,681 | ) |
Balance at December 31 | | | 1,727,929 | | | | 1,864,073 | | | | (1,823,972 | ) | | | (1,930,605 | ) | | | (96,043 | ) | | | (66,532 | ) |
The following were the principal actuarial assumptions at the reporting date (expressed as weighted averages)
| | | | | | | | |
| Assumptions | | 31/12/2014 | | | 31/12/2013 | |
Discount rate | | | 11.69 | % | | | 12.10 | % |
Inflation | | | 5,2 | % | | | 5,2 | % |
Salarial growth rate | | | 6,4 | % | | | 7,3 | % |
Reasonably possible changes at the reporting date to one of the relevant actuarial assumptions, holding other assumptions constant, would have affected the defined benefit obligation by the amounts shown below:
| | | | | | | | |
| December 31, 2014 | | Defined benefit obligation | | | | |
| | | Increase ThCh$ | | | Decrease ThCh$ | |
Discount rate (0.5% movement) | | | (113,867 | ) | | | 125,968 | |
F-170
| 22 | Other current and non-current non-financial assets |
The composition of the item as of December 31, 2014 and 2013 is as follows:
| | | | | | | | |
| | | As of December 31, | |
Other non-financial assets, current | | 2014 | | | 2013 | |
| | | ThCh$ | | | ThCh$ | |
Lease guarantees | | | 3,937,821 | | | | 4,142,481 | |
Pre-paid rent | | | 2,686,849 | | | | 2,537,929 | |
Pre-paid insurance | | | 3,929,688 | | | | 4,888,501 | |
Other | | | 92,134 | | | | 36,582 | |
| | | | | | | | |
| | |
Total | | | 10,646,492 | | | | 11,605,493 | |
| | | | | | | | |
| |
| | | As of December 31, | |
Other non-financial assets, non-current | | 2014 | | | 2013 | |
| | | ThCh$ | | | ThCh$ | |
Lease guarantees | | | 8,072,150 | | | | 7,504,543 | |
Pre-paid rent | | | 25,037,866 | | | | 29,882,006 | |
Other | | | 763,401 | | | | 876,788 | |
| | | | | | | | |
| | |
Total | | | 33,873,417 | | | | 38,263,337 | |
| | | | | | | | |
The fair value for the non-financial assets equals their carrying value as of December 31, 2014 and 2013. As of December 31, 2014 and 2013, no significant differences exists between the carrying value of non-financial assets and their fair value.
The objectives of the Cencosud Group regarding capital management are to safeguard its capacity to continue as a going concern, ensuring appropriate returns for its shareholders and benefits for other stakeholders, and maintaining an optimum capital structure while reducing capital costs.
Capital management
The Group’s objective regarding capital management is to safeguard the capacity to continue ensuring appropriate returns for the shareholders and benefits for other stakeholders, and maintaining an optimum capital structure while reducing capital costs.
F-171
In line with the industry, the Cencosud Group monitors its capital using the leverage ratio. This ratio is calculated by dividing net financial debt by total capital, which must be minor to 1.2 times. Net financial debt corresponds to total indebtedness (including current and non-current debt) less cash and cash equivalents and other financial assets. Total capital corresponds to total equity as shown in the consolidated statement of financial position.
| | | | | | | | |
| | | As of December 31, | |
Other non-financial assets, non-current | | 2014 | | | 2013 | |
| | | ThCh$ | | | ThCh$ | |
Total borrowings (note 17 and note 34) | | | 3,300,462,387 | | | | 2,957,140,839 | |
Less: Cash and cash equivalents (Note 5 and note 34) | | | (219,627,286 | ) | | | (171,711,625 | ) |
Less: Other financial assets (note 6 and note 34 | | | (353,686,187 | ) | | | (141,989,298 | ) |
Cash and cash equivalents- Banco Paris (Note 28.11) | | | 16,005,243 | | | | 15,352,349 | |
Other financial assets – Banco París ( Nota28.11) | | | 9,990,759 | | | | 8,785,942 | |
Less: Other financial liabilites – Banco Paris (Note 28.11) | | | (173,596,140 | ) | | | (201,667,118 | ) |
| | | | | | | | |
| | |
Net debt | | | 2,579,548,776 | | | | 2,465,911,089 | |
| | | | | | | | |
Total equity | | | 4,291,485,811 | | | | 4,261,367,089 | |
Leverage ratio | | | 0.60 | | | | 0.58 | |
In accordance with the above, the Cencosud Group has combined different financing sources, such as: capital increases, operating cash flows, bank loans and bonds.
As part of the finance strategy, the Group will continue seeking to extend the payments terms and shift focus to the operations through the refinancing of liabilities in the forthcoming periods with the ultimately purpose of deleveraging the Group.
As of December 31, 2014, the authorized, subscribed and paid-in capital amounts to ThCh$ 2,321,380,936 (ThCh$ 2,321,380,936 as of December 31, 2013).
| 23.2 | Subscribed and paid shares |
As of June 22, 2012, the Company proceeded to increase the authorized Capital through the issuance of 270,000,000 of shares, without a par value and in a unique series, as agreed at the shareholders meeting held on April 29th, 2011 which complemented and modified preliminary agreements made at extraordinary shareholders meetings on March 1st and May 15th of 2012. 27,000,000 shares out of the capital increase were set aside to offer them in a stock option plan for the Company’s upper management.
The referential share price reported to the SVS (Superintendencia de Valores y Seguros) was ThCh$ 3,555.56. The final issue share price was ThCh$2,600 per share.
In connection with share issuance, 59,493,000 shares were issued in the United States of America in the form of American Depositary Shares (ADSs) and 183,507,000 shares were issued in the local market in Chile.
At the extraordinary shareholders meeting held on November 20, 2012, the shareholders agreed to increase capital by ThCh$835,000,000 through the issuance of 332,987,717 of shares in one series and without a par value. 10% out of the total issuance was set aside to offer them in a stock option plan for employees, the remaining of the shares was offered to the Company’s shareholders
F-172
The following tables show the movement of the authorized and the issued and fully paid shares described above between January 1, 2013 and December 31, 2014
| | | | |
| Movement of authorized shares | | No of shares | |
Authorized shares as of January 1, 2013 | | | 2,574,015,016 | |
Capital increase as of February 28, 2013 | | | 5,661,074 | |
Capital increase as of March 13, 2013 | | | 290,741,796 | |
Capital increase as of March 25, 2013 | | | 3,286,076 | |
Increase pursuant to stock option plan | | | 33,298,771 | |
Decrease due to unsubscribed Capital in 2013 | | | (17,979,999 | ) |
Authorized shares as of December 31, 2013 | | | 2,889,022,734 | |
Authorized shares as of December 31, 2014 | | | 2,889,022,734 | |
| | | | | | | | |
| Movement in issued and fully paid shares | | No of shares | | | Total Ch$ | |
Paid shares as of January 1, 2013 | | | 2,507,103,215 | | | | 1,551,811,762 | |
Capital increase as of February 28, 2013 | | | 5,661,074 | | | | 14,195,709 | |
Capital increase as of March 13, 2013 | | | 290,741,796 | | | | 729,064,129 | |
Capital increase as of March 25, 2013 | | | 3,286,076 | | | | 8,240,164 | |
Exercise of stock option | | | 21,931,802 | | | | 18,069,172 | |
Paid shares as of December 31, 2013 | | | 2,828,723,963 | | | | 2,321,380,936 | |
Paid shares as of December 31, 2014 | | | 2,828,723,963 | | | | 2,321,380,936 | |
As of December 31, 2014, 60,298,771 issued shares were pending of subscription and payment, of which 27,000,000 and 33,298,771 will expire on April 29th and November 20th of 2017 respectively.
The dividend distribution policy adopted by Cencosud S.A. establishes the payment of dividends of 30% of the distributable net profits.
In relation to SVS Ruling No. 1945, on October 29, 2010, the Company’s Board of Directors agreed that the net distributable profits for the year 2010 and following years will be the figure reflected in the financial statements as “profit for the year attributable controlling shareholders”, excluding the unrealized result for fair value appraisal of investment properties, net of deferred taxes.
The shareholders’ meeting held on April 26, 2013 approved to pay a minimum dividend amounting to ThCh$ 58,269,234 (Ch$20.59906). This dividend was paid in May 15, 2013. On September 15, 2013, the Board of Directors agreed on distributing a interim dividend of Ch$8 per share in relation to the profits of 2013. This dividend was paid on December 10, 2013
The shareholders’ meeting held on April 25, 2014 approved to pay a minimum dividend amounting to ThCh$ 58,269,234 (Ch$20.59906). This dividend was paid in May 14, 2014. The informa Directory that the previous offer, considers a payment of a provisional dividend of Ch$ 8 per share, this dividend was paid on December 10, 2013.
On -November 3th, 2014, the Board of Directors agreed on distributing an interim dividend of Ch$8 per share in relation to the profits of 2014. This dividend was paid on December 3th, 2014.
F-173
The company recorded a minimum dividend by ThCh$ 13,597,056 at December 31, 2014 (ThCh$ 24,042,737 at December 31, 2013) (see note 20). The total charge to equity as of December 31, 2014 was ThCh$ 47,823,374 (ThCh$ 53,192,713 as of December 31, 2013).
The initial Balance is mainly due to the inflation adjustment reversal recorded under IFRS first adoption (transition date to IFRS on January 1st, 2009).
The movements of other Reserves and Changes in ownership interest were as follows:
Movements of reserves between January 1, 2014 and December 31, 2014 are as follows:
| | | | | | | | | | | | | | | | | | | | | | | | |
| Reserve movement | | Translation | | | Hedging reserves | | | Actuarial gain (loss) reserves | | | Shared based payments reserves | | | Other reserves | | | Total reserves | |
| | | | | | |
Initial balance current period January 1, 2014 | | | (615,316,151 | ) | | | 20,525,986 | | | | 402,512 | | | | 10,636,164 | | | | (52,479,121 | ) | | | (636,230,610 | ) |
Change in equity | | | | | | | | | | | | | | | | | | | | | | | | |
Other comprehensive income | | | (81,230,563 | ) | | | (7,323,766 | ) | | | (284,586 | ) | | | — | | | | — | | | | (88,838,915 | ) |
Transfer to (from) retained earnings | | | — | | | | — | | | | — | | | | 2,822,081 | | | | — | | | | 2,822,081 | |
Increase (decrease) from changes in ownership interest in subsidiaries that do not result in loss of control | | | — | | | | — | | | | — | | | | — | | | | 2,187 | | | | 2,187 | |
| | | | | | |
Total changes in equity | | | (81,230,563 | ) | | | (7,323,766 | ) | | | (284,586 | ) | | | 2,822,081 | | | | 2,187 | | | | (86,014,647 | ) |
| | | | | | |
Closing balance of current year, December 31, 2014 | | | (696,546,714 | ) | | | 13,202,220 | | | | 117,926 | | | | 13,458,245 | | | | (52,476,934 | ) | | | (722,245,257 | ) |
In 2013, the Group acquired the remaining interest of Cencosud Argentina S.A., for a consideration higher than the book value of the investment accounted for under the equity method. As a result, the Group presented this adjustment as a movement of other reserve in the statement of equity amounting to ThCh$404,131.
Movements of reserves between January 1, 2013 and December 31, 2013 are as follows:
| | | | | | | | | | | | | | | | | | | | | | | | |
| Reserve movement | | Currency
translation | | | Hedging reserves | | | Actuarial gain (loss) reserves | | | Shared based payments reserves | | | Other reserves | | | Total reserves | |
| | | | | | |
Initial balance current period January 1, 2013 | | | (461,974,288 | ) | | | 23,315,468 | | | | (523,284 | ) | | | 6,892,685 | | | | (52,074,990 | ) | | | (484,364,409 | ) |
Change in equity | | | | | | | | | | | | | | | | | | | | | | | | |
Other Comprehensive income | | | (153,341,863 | ) | | | (2,789,482 | ) | | | 925,796 | | | | — | | | | — | | | | (155,205,549 | ) |
Increase (decrease) due to transfers and other changes in equity | | | — | | | | — | | | | — | | | | 3,743,479 | | | | — | | | | 3,743,479 | |
Transfer to (from) retained earnings, | | | | | | | | | | | | | | | | | | | | | | | | |
Increase (decrease) from changes in ownership interest in subsidiaries that do not result in loss of control | | | — | | | | — | | | | — | | | | — | | | | (404,131 | ) | | | (404,131 | ) |
Total changes in equity | | | (153,341,863 | ) | | | (2,789,482 | ) | | | 925,796 | | | | 3,743,479 | | | | (404,131 | ) | | | (151,866,201 | ) |
Closing balance of current year, December 31, 2013 | | | (615,316,151 | ) | | | 20,525,986 | | | | 402,512 | | | | 10,636,164 | | | | (52,479,121 | ) | | | (636,230,610 | ) |
Movements of reserves between January 1, 2012 and December 31, 2012 are as follows:
| | | | | | | | | | | | | | | | | | | | | | | | |
| Reserve movement | | Currency
translation | | | Hedging reserves | | | Actuarial gain (loss) reserves | | | Shared based payments reserves | | | Other reserves | | | Total reserves | |
| | | | | | |
Initial balance current period January 1, 2012 | | | (233,050,928 | ) | | | 9,825,606 | | | | — | | | | 4,595,125 | | | | 15,907,719 | | | | (202,722,478 | ) |
Change in equity | | | | | | | | | | | | | | | | | | | | | | | | |
Other Comprehensive income | | | (228,923,360 | ) | | | 13,489,862 | | | | (523,284 | ) | | | — | | | | — | | | | (215,956,782 | ) |
Increase (decrease) due to transfers and other changes in equity | | | | | | | | | | | | | | | | | | | 92,991,291 | | | | 92,991,291 | |
Transfer to (from) retained earnings, | | | — | | | | — | | | | — | | | | 2,297,560 | | | | — | | | | 2,297,560 | |
Increase (decrease) from changes in ownership interest in subsidiaries that do not result in loss of control | | | — | | | | — | | | | — | | | | — | | | | (160,974,000 | ) | | | (160,974,000 | ) |
Total changes in equity | | | (228,923,360 | ) | | | 13,489,862 | | | | (523,284 | ) | | | 2,297,560 | | | | (67,982,709 | ) | | | (281,641,931 | ) |
Closing balance of current year, December 31, 2012 | | | (461,974,288 | ) | | | 23,315,468 | | | | (523,284 | ) | | | 6,892,685 | | | | (52,074,990 | ) | | | (484,364,409 | ) |
F-174
| a) | Currency translation reserve: This item includes the exchange rate differences resulted from the conversion of the financial statement of all subsidiaries from their functional currency into the presentation currency of the Group. |
| b) | Hedging reserves: This reserve includes the effect of the changes in the fair value of certain financial instruments used as cash flow hedges and deemed as effective. These reserves are transferred to income of the period at the end of the life of the instruments’ contracts when the hedged cash flow is realized. |
| c) | Other reserves: The initial balance shows the effect of the elimination of price-level restatement of book-basis capital under IFRS for the transition year. In 2014, no significant changes were observed. |
| d) | Actuarial gain (loss) reserve: This reserve is composed of the actuarial gains (losses) and the effect from the return on the pension plan asset that have been recognized over the past two year in relation to the Company’s pension plan Brazil. |
| e) | Other reserves: This reserve has not shown any transactions during 2014 year. |
On June 29, 2012, in connection with the purchase by the Company of the remaining 38.6062% interest in Jumbo Retail Argentina S.A. from UBS A.G. London Branch, the Company and UBS A.G. London Branch agreed to terminate the purchase option (call) and put option (put) and associated rights and obligations between the parties. As a result of the termination of these contracts and the exercise of the call option, the Company paid ThCh$ 242,681,460 for the 38.6062% interest in Jumbo Retail Argentina. The accounting effects of this decision are recognized in equity under “other reserves”, as follows:
| | | | |
| | | ThCh$ | |
Purchase price | | | 242,681,460 | |
Non-controlling interests acquired | | | (81,707,460 | ) |
| | | | |
Total due to non-controlling interest acquired | | | 160,974,000 | |
| | | | |
| |
Call option asset | | | (147,470,592 | ) |
Put option liability | | | 240,461,884 | |
| | | | |
Total due to options | | | 92,991,292 | |
F-175
| 23.5 | Non-controlling interest |
Details of the non-controlling shares as of December 31, 2013 and 2012 are as follows:
| | | | | | | | | | | | | | | | |
| | | Non-controlling Interest Dec 31, | | | Non-controlling Interest Dec 31, | | | As of December 31, | |
| Company | | 2014 % | | | 2013 % | | | 2014 ThCh$ | | | 2013 ThCh$ | |
Cencosud Shoppings Centers S.A. | | | 0.00004 | | | | 0.00040 | | | | 370 | | | | 355 | |
Cencosud Internacional Ltda. | | | 0.00000 | | | | 0.00433 | | | | — | | | | 52,288 | |
Costanera Center S.A. | | | 0.00000 | | | | 0.00004 | | | | 22 | | | | 5 | |
Mercado Mayorista P y P Ltda. | | | 10.00000 | | | | 10.00000 | | | | 93,871 | | | | 93,871 | |
Easy S.A. | | | 0.42500 | | | | 0.35200 | | | | 356,997 | | | | 421,966 | |
Comercial Food and Fantasy Ltda. | | | 10.00000 | | | | 10.00000 | | | | (30,391 | ) | | | (60,110 | ) |
Administradora del Centro Comercial Alto Las Condes Ltda. | | | 55.00000 | | | | 55.00000 | | | | (1,567,557 | ) | | | (686,033 | ) |
Cencosud Retail S.A. | | | 0.00039 | | | | 0.00039 | | | | 196,395 | | | | 228,840 | |
Jumbo Retail Argentina S.A. | | | 0.07600 | | | | 0.07600 | | | | 118,509 | | | | 48,904 | |
| | | | |
Total | | | | | | | | | | | (831,784 | ) | | | 100,086 | |
| | | | | | | | | | | | | | | | |
| | | | | | | | | | | | | | | | | | | | | | | | |
| | | Non-controlling Interest | | | Non-controlling
interest | | | Non-controlling
interest | | | Results | |
| Company | | 2014 % | | | 2013 % | | | 2012 % | | | 2014 ThCh$ | | | 2013 ThCh$ | | | 2012 ThCh$ | |
Cencosud Shoppings Centers S.A. | | | 0.00040 | | | | 0.00040 | | | | 0.00040 | | | | 24 | | | | 51 | | | | 35 | |
Cencosud Internacional Ltda. | | | 0.00000 | | | | 0.00433 | | | | 0.00433 | | | | 1,027 | | | | 2,346 | | | | 3,372 | |
Costanera Center S.A. | | | 0.00004 | | | | 0.00004 | | | | 0.00004 | | | | 8 | | | | (1 | ) | | | (2 | ) |
Mercado Mayorista P y P Ltda. | | | 10.00000 | | | | 10.00000 | | | | 10.00000 | | | | — | | | | 282 | | | | | |
Easy S.A. | | | 0.42500 | | | | 0.42500 | | | | 0.42500 | | | | 95,558 | | | | 71,558 | | | | 43,190 | |
Comercial Food and Fantasy Ltda. | | | 10.00000 | | | | 10.00000 | | | | 10.00000 | | | | 29,023 | | | | 17,801 | | | | 43,694 | |
Alto Las Condes Ltda. | | | 55.00000 | | | | 55.00000 | | | | 55.00000 | | | | (881,525 | ) | | | (290,808 | ) | | | (340,401 | ) |
Cencosud Retail S.A. | | | 0.03906 | | | | 0.00039 | | | | 0.00039 | | | | 26,331 | | | | 33,845 | | | | 39,914 | |
Jumbo Retail Argentina S.A. | | | 0.07600 | | | | 0.07700 | | | | 0.07700 | | | | (18,800 | ) | | | (627 | ) | | | 3,002,758 | |
Cencosud Argentina S.A (*). | | | 0.00000 | | | | 0.00000 | | | | 0.08302 | | | | — | | | | — | | | | 57,955 | |
| | | | | | | | | | | | | | | | | | | | | | | | |
Total | | | | | | | | | | | | | | | (748,354 | ) | | | (165,553 | ) | | | 2,850,515 | |
| | | | | | | | | | | | | | | | | | | | | | | | |
On June 29 2012, Cencosud S.A., acquired 38.6062% of Jumbo Retail S.A. shares from UBS, which resulted in a non-controlling interest of 0.077%.(*) During 2013, the Group acquired the non controlling interest of this subsidiary.
F-176
The breakdown of ordinary income is as follows:
| | | | | | | | | | | | |
| | | For the year ended December 31, | |
Income by nature | | 2014 | | | 2013 | | | 2012 | |
| | | ThCh$ | | | ThCh$ | | | ThCh$ | |
Sale of goods | | | 10,376,295,411 | | | | 9,829,313,975 | | | | 8,682,771,449 | |
Services rendered (**) | | | 307,290,878 | | | | 301,842,147 | | | | 268,154,751 | |
Commission(*) | | | 31,099,176 | | | | 32,325,103 | | | | 26,647,499 | |
Interests income | | | 198,169,776 | | | | 177,558,602 | | | | 171,503,408 | |
Income from discontinued operation | | | (201,825,995 | ) | | | (206,881,617 | ) | | | (223,726,231 | ) |
| | | | | | | | | | | | |
| | | |
Total | | | 10,711,029,246 | | | | 10,134,158,210 | | | | 8,925,350,876 | |
| | | | | | | | | | | | |
| (*) | Includes revenues from insurance brokerage, travel agencies, family entertainment centers and customer loyalty program. |
| (**) | Includes lease revenues from Shopping Centers |
100% of the sales made in each country where the Group operates are received in local currency.
| 25 | Breakdown of significant results |
The items by function from the Statements of Income are described as follows in 25.1, 25.2 and 25.3.
| | | | | | | | | | | | |
Expenses by nature of integral income by function | | For the year ended December 31, | |
| | 2014 | | | 2013 | | | 2012 | |
| | | ThCh$ | | | ThCh$ | | | ThCh$ | |
Cost of sales | | | 7,814,773,235 | | | | 7,324,251,612 | | | | 6,464,234,047 | |
Distribution cost | | | 26,653,898 | | | | 23,931,088 | | | | 20,233,594 | |
Administrative expenses | | | 2,286,704,942 | | | | 2,181,508,368 | | | | 1,866,131,501 | |
Other expenses (*) | | | 182,076,769 | | | | 152,142,053 | | | | 162,024,745 | |
| | | | | | | | | | | | |
| | | |
Total | | | 10,310,208,844 | | | | 9,681,833,121 | | | | 8,512,623,887 | |
| | | | | | | | | | | | |
| (*) | Mainly includes marketing expenses. |
F-177
The following is a breakdown of the main operating and management costs and expenses of the Cencosud Group for the following periods:
| | | | | | | | | | | | | | | | | | | | | | | | | | | | | | | | | | | | |
| | | For the year ended December 31 | |
Expenses by
nature | | 2014 | | | 2014 | | | 2014 | | | 2013 | | | 2013 | | | 2013 | | | 2012 | | | 2012 | | | 2012 | |
| | | | | | Discontinued
operation | | | Continued
Operation | | | | | | Discontinued
operation | | | Continued
Operation | | | | | | Discontinued
operation | | | Continued
Operation | |
| | | ThCh$ | | | ThCh$ | | | ThCh$ | | | ThCh$ | | | ThCh$ | | | ThCh$ | | | ThCh$ | | | ThCh$ | | | ThCh$ | |
Cost of goods sold | | | 7,377,823,134 | | | | | | | | 7,377,823,134 | | | | 7,160,676,127 | | | | (339 | ) | | | 7,160,675,788 | | | | 6,318,469,948 | | | | (7,397 | ) | | | 6,318,462,551 | |
Other cost of sales | | | 492,749,104 | | | | (55,799,003 | ) | | | 436,950,101 | | | | 223,392,156 | | | | (59,816,332 | ) | | | 163,575,824 | | | | 229,361,825 | | | | (83,590,329 | ) | | | 145,771,496 | |
Personnel expenses | | | 1,443,743,124 | | | | (37,077,303 | ) | | | 1,406,665,821 | | | | 1,340,881,800 | | | | (36,865,744 | ) | | | 1,304,016,056 | | | | 1,157,677,464 | | | | (36,533,768 | ) | | | 1,121,143,696 | |
Depreciation and amortization | | | 202,342,813 | | | | (2,299,772 | ) | | | 200,043,041 | | | | 189,037,674 | | | | (2,461,658 | ) | | | 186,576,016 | | | | 141,450,398 | | | | (2,509,579 | ) | | | 138,940,819 | |
Distribution cost | | | 26,653,898 | | | | | | | | 26,653,898 | | | | 23,931,088 | | | | — | | | | 23,931,088 | | | | 20,233,594 | | | | — | | | | 20,233,594 | |
Other expenses | | | 195,747,099 | | | | (13,670,330 | ) | | | 182,076,769 | | | | 182,307,997 | | | | (30,165,944 | ) | | | 152,142,053 | | | | 176,173,759 | | | | (14,149,014 | ) | | | 162,024,745 | |
Utilities and other store related expenses | | | | | | | | | | | | | | | 114,344,589 | | | | (222,353 | ) | | | 114,122,236 | | | | 100,303,114 | | | | (318,917 | ) | | | 99,984,197 | |
Cleaning | | | 75,470,885 | | | | (70,415 | ) | | | 75,400,470 | | | | 68,896,478 | | | | (82,157 | ) | | | 68,814,321 | | | | 53,155,225 | | | | (78,592 | ) | | | 53,076,633 | |
Safety and security | | | 61,560,198 | | | | (69,828 | ) | | | 61,490,370 | | | | 62,504,253 | | | | (69,719 | ) | | | 62,434,534 | | | | 53,810,657 | | | | (65,736 | ) | | | 53,744,921 | |
| | | | | | | | | |
Maintenance | | | 86,746,311 | | | | (934,684 | ) | | | 85,811,627 | | | | 79,075,709 | | | | (1,504,859 | ) | | | 77,570,850 | | | | 66,987,807 | | | | (797,014 | ) | | | 66,190,793 | |
| | | | | | | | | |
Professional fees | | | 78,956,876 | | | | (2,811,581 | ) | | | 76,145,295 | | | | 81,475,579 | | | | (3,865,736 | ) | | | 77,609,843 | | | | 77,198,032 | | | | (2,398,781 | ) | | | 74,799,251 | |
Bags for Customers | | | 25,258,963 | | | | | | | | 25,258,963 | | | | 31,457,921 | | | | | | | | 31,457,921 | | | | 30,774,898 | | | | — | | | | 30,774,898 | |
Credit card commission | | | 89,437,729 | | | | | | | | 89,437,729 | | | | 81,305,782 | | | | — | | | | 81,305,782 | | | | 77,472,181 | | | | (1,042,041 | ) | | | 76,430,140 | |
lease | | | 188,325,891 | | | | (2,011,677 | ) | | | 186,314,214 | | | | 168,801,648 | | | | (1,361,988 | ) | | | 167,439,660 | | | | 153,089,337 | | | | (2,343,848 | ) | | | 150,745,489 | |
Other | | | 90,322,026 | | | | (10,184,614 | ) | | | 80,137,412 | | | | 23,900,745 | | | | (13,739,596 | ) | | | 10,161,149 | | | | 13,494,998 | | | | (13,194,334 | ) | | | 300,664 | |
| | | | | | | | | | | | | | | | | | | | | | | | | | | | | | | | | | | | |
| | | | | | | | | |
Total | | | 10,435,138,051 | | | | (124,929,207 | ) | | | 10,310,208,844 | | | | 9,831,989,546 | | | | (150,156,425 | ) | | | 9,681,833,121 | | | | 8,669,653,237 | | | | (157,029,350 | ) | | | 8,512,623,887 | |
| | | | | | | | | | | | | | | | | | | | | | | | | | | | | | | | | | | | |
F-178
The following is a breakdown of personnel expenses for the following periods:
| | | | | | | | | | | | | | | | | | | | | | | | | | | | | | | | | | | | |
| | | For the year ended December 31 | |
Personal
Expenses | | 2014 | | | 2014 | | | 2014 | | | 2013 | | | 2013 | | | 2013 | | | 2012 | | | 2012 | | | 2012 | |
| | | | | | Discontinued
operation | | | Continued
Operation | | | | | | Discontinued
operation | | | Continued
Operation | | | | | | Discontinued
operation | | | Continued
Operation | |
| | | ThCh$ | | | ThCh$ | | | ThCh$ | | | ThCh$ | | | ThCh$ | | | ThCh$ | | | ThCh$ | | | ThCh$ | | | ThCh$ | |
Salaries | | | 1,152,243,822 | | | | (31,847,526 | ) | | | 1,120,396,296 | | | | 1,047,414,483 | | | | (25,415,529 | ) | | | 1,021,998,954 | | | | 916,346,146 | | | | (27,065,394 | ) | | | 889,280,752 | |
Short-term employee benefits | | | 260,677,494 | | | | (4,028,624 | ) | | | 256,648,870 | | | | 254,831,463 | | | | (9,629,166 | ) | | | 245,202,297 | | | | 218,779,750 | | | | (8,194,898 | ) | | | 210,584,852 | |
Termination benefits | | | 30,821,808 | | | | (1,201,153 | ) | | | 29,620,655 | | | | 38,635,854 | | | | (1,821,049 | ) | | | 36,814,805 | | | | 22,551,568 | | | | (1,273,476 | ) | | | 21,278,092 | |
| | | | | | | | | | | | | | | | | | | | | | | | | | | | | | | | | | | | |
a | | | 1,443,743,124 | | | | (37,077,303 | ) | | | 1,406,665,821 | | | | 1,340,881,800 | | | | (36,865,744 | ) | | | 1,304,016,056 | | | | 1,157,677,464 | | | | (36,533,768 | ) | | | 1,121,143,696 | |
| | | | | | | | | | | | | | | | | | | | | | | | | | | | | | | | | | | | |
| 25.3 | Depreciation and amortization |
The following is a breakdown of depreciation and amortization for the following periods:
| | | | | | | | | | | | | | | | | | | | | | | | | | | | | | | | | | | | |
| | | For the year ended December 31 | |
| Depreciation and amortization | | 2014 | | | 2014 | | | 2014 | | | 2013 | | | 2013 | | | 2013 | | | 2012 | | | 2012 | | | 2012 | |
| | | | | | Discontinued
operation | | | Continued
Operation | | | | | | Discontinued
operation | | | Continued
Operation | | | | | | Discontinued
operation | | | Continued
Operation | |
| | | ThCh$ | | | ThCh$ | | | ThCh$ | | | ThCh$ | | | ThCh$ | | | ThCh$ | | | ThCh$ | | | ThCh$ | | | ThCh$ | |
Depreciation | | | 183,863,858 | | | | (836,192 | ) | | | 183,027,666 | | | | 173,650,390 | | | | (1,175,626 | ) | | | 172,474,764 | | | | 131,470,020 | | | | (1,252,233 | ) | | | 130,217,787 | |
Amortization | | | 18,478,955 | | | | (1,463,580 | ) | | | 17,015,375 | | | | 15,387,284 | | | | (1,286,032 | ) | | | 14,101,252 | | | | 9,980,378 | | | | (1,257,346 | ) | | | 8,723,032 | |
| | | | | | | | | | | | | | | | | | | | | | | | | | | | | | | | | | | | |
Total | | | 202,342,813 | | | | (2,299,772 | ) | | | 200,043,041 | | | | 189,037,674 | | | | (2,461,658 | ) | | | 186,576,016 | | | | 141,450,398 | | | | (2,509,579 | ) | | | 138,940,819 | |
| | | | | | | | | | | | | | | | | | | | | | | | | | | | | | | | | | | | |
F-179
| | | | | | | | | | | | | | | | | | | | | | | | | | | | | | | | | | | | |
| | | For the year ended December 31 | |
| Other gains (losses) | | 2014 | | | 2014 | | | 2014 | | | 2013 | | | 2013 | | | 2013 | | | 2012 | | | 2012 | | | 2012 | |
| | | | | | Discontinued
operation | | | Continued
Operation | | | | | | Discontinued
operation | | | Continued
Operation | | | | | | Discontinued
operation | | | Continued
Operation | |
| | | ThCh$ | | | ThCh$ | | | ThCh$ | | | ThCh$ | | | ThCh$ | | | ThCh$ | | | ThCh$ | | | ThCh$ | | | ThCh$ | |
Sales of Property, plant and equipment | | | (2,731,176 | ) | | | — | | | | (2,731,176 | ) | | | — | | | | — | | | | — | | | | 7,184,649 | | | | — | | | | 7,184,649 | |
UBS Call Option | | | — | | | | — | | | | — | | | | — | | | | — | | | | — | | | | (16,258,777 | ) | | | — | | | | (16,258,777 | ) |
Insurance claims (*) | | | 1,411,112 | | | | — | | | | 1,411,112 | | | | 2,203,829 | | | | — | | | | 2,203,829 | | | | — | | | | — | | | | — | |
Fair value derivatives | | | 41,139,461 | | | | (35,340 | ) | | | 41,104,121, | | | | 29,531,125 | | | | (16,000 | ) | | | 29,515,125 | | | | 4,308,000 | | | | (33,663 | ) | | | 4,274,337 | |
Commission under operational agreement | | | — | | | | — | | | | — | | | | — | | | | — | | | | — | | | | — | | | | — | | | | — | |
Other Net Gains and Losses | | | (5,194,916 | ) | | | — | | | | (5,194,916 | ) | | | (5,353,082 | ) | | | — | | | | (5,353,082 | ) | | | (2,603,227 | ) | | | — | | | | (2,603,227 | ) |
| | | | | | | | | | | | | | | | | | | | | | | | | | | | | | | | | | | | |
Total | | | 34,624,481 | | | | (35,340 | ) | | | 34,589,141 | | | | 26,381,872 | | | | (16,000 | ) | | | 26,365,872 | | | | (7,369,355 | ) | | | (33,663 | ) | | | (7,403,018 | ) |
| (*) | These insurance recoveries relate to the earthquake affecting the operations in Talcahuano, Chile in 2010, and damages of certain stores in Santiago, Chile due to a fire in 2012. |
| 25.5 | Other operating income |
| | | | | | | | | | | | | | | | | | | | | | | | | | | | | | | | | | | | |
| | | For the year ended December 31 | |
| Other operating income | | 2014 | | | 2014 | | | 2014 | | | 2013 | | | 2013 | | | 2013 | | | 2012 | | | 2012 | | | 2012 | |
| | | | | | Discontinued
operation | | | Continued
Operation | | | | | | Discontinued
operation | | | Continued
Operation | | | | | | Discontinued
operation | | | Continued
Operation | |
| | | ThCh$ | | | ThCh$ | | | ThCh$ | | | ThCh$ | | | ThCh$ | | | ThCh$ | | | ThCh$ | | | ThCh$ | | | ThCh$ | |
Sell Carton & Wraps | | | 3,761,265 | | | | — | | | | 3,761,265 | | | | 3,178,983 | | | | — | | | | 3,178,983 | | | | 2,983,358 | | | | — | | | | 2,983,358 | |
Recovery of fees | | | 2,446,055 | | | | | | | | 2,446,055 | | | | 1,271,807 | | | | — | | | | 1,271,807 | | | | 956,947 | | | | — | | | | 956,947 | |
Increase on revaluation of investment properties | | | 100,772,615 | | | | | | | | 100,772,615 | | | | 95,110,013 | | | | — | | | | 95,110,013 | | | | 98,633,366 | | | | — | | | | 98,633,366 | |
Other Income | | | 7,457,781 | | | | (190,554 | ) | | | 7,267,227 | | | | 9,153,179 | | | | (422,737 | ) | | | 8,730,442 | | | | 4,536,399 | | | | (99,278 | ) | | | 4,437,121 | |
| | | | | | | | | | | | | | | | | | | | | | | | | | | | | | | | | | | | |
| | | | | | | | | |
Total | | | 114,437,716 | | | | (190,554 | ) | | | 114,247,162 | | | | 108,713,982 | | | | (422,737 | ) | | | 108,291,245 | | | | 107,110,070 | | | | (99,278 | ) | | | 107,010,792 | |
F-180
The following is the financial income detailed for the periods ended:
| | | | | | | | | | | | | | | | | | | | | | | | | | | | | | | | | | | | |
| | | For the year ended December 31 | |
Other gains
(losses) | | 2014 | | | 2014 | | | 2014 | | | 2013 | | | 2013 | | | 2013 | | | 2012 | | | 2012 | | | 2012 | |
| | | | | | Discontinued
operation | | | Continued
Operation | | | | | | Discontinued
operation | | | Continued
Operation | | | | | | Discontinued
operation | | | Continued
Operation | |
| | | ThCh$ | | | ThCh$ | | | ThCh$ | | | ThCh$ | | | ThCh$ | | | ThCh$ | | | ThCh$ | | | ThCh$ | | | ThCh$ | |
Financial income from cash flow hedging | | | | | | | | | | | | | | | 25,010 | | | | — | | | | 25,010 | | | | 267,370 | | | | — | | | | 267,370 | |
Other finance income | | | 6,709,144 | | | | (314,723 | ) | | | 6,394,421 | | | | 5,829,603 | | | | 144,562 | | | | 5,974,165 | | | | 7,843,098 | | | | 120,992 | | | | 7,964,090 | |
| | | | | | | | | | | | | | | | | | | | | | | | | | | | | | | | | | | | |
Financial income | | | 6,709,144 | | | | (314,723 | ) | | | 6,394,421 | | | | 5,854,613 | | | | 144,562 | | | | 5,999,175 | | | | 8,110,468 | | | | 120,992 | | | | 8,231,460 | |
| | | | | | | | | | | | | | | | | | | | | | | | | | | | | | | | | | | | |
Bank loan expenses | | | (115,108,874 | ) | | | 15,413,160 | | | | (99,695,714 | ) | | | (137,975,837 | ) | | | 13,100,402 | | | | (124,875,435 | ) | | | (120,611,344 | ) | | | 11,245,751 | | | | (109,365,593 | ) |
Bond debt expenses | | | (100,627,140 | ) | | | 11,162,618 | | | | (89,464,522 | ) | | | (90,072,133 | ) | | | 21,728,421 | | | | (68,343,712 | ) | | | (61,010,164 | ) | | | 21,145,658 | | | | (39,864,506 | ) |
Interest on bank loans | | | — | | | | 12,431,878 | | | | 12,431,878 | | | | (13,389,526 | ) | | | | | | | (13,389,526 | ) | | | (11,487,735 | ) | | | | | | | (11,487,735 | ) |
Valuation of financial derivatives expenses | | | (6,428,737 | ) | | | — | | | | (6,428,737 | ) | | | (17,247,078 | ) | | | | | | | (17,247,078 | ) | | | (17,912,867 | ) | | | | | | | (17,912,867 | ) |
| | | | | | | | | | | | | | | | | | | | | | | | | | | | | | | | | | | | |
Financial Expenses | | | (222,164,751 | ) | | | 39,007,656 | | | | (183,157,095 | ) | | | (258,684,574 | ) | | | 34,828,823 | | | | (223,855,751 | ) | | | (211,022,110 | ) | | | 32,391,409 | | | | (178,630,701 | ) |
| | | | | | | | | | | | | | | | | | | | | | | | | | | | | | | | | | | | |
Results from UF indexed bonds in Chile | | | (36,559,232 | ) | | | 4,969,932 | | | | (31,589,300 | ) | | | (13,879,380 | ) | | | 2,074,458 | | | | (11,804,922 | ) | | | (16,126,911 | ) | | | 2,377,697 | | | | (13,749,214 | ) |
Results from UF indexed Brazil | | | (6,829,994 | ) | | | — | | | | (6,829,994 | ) | | | (6,957,024 | ) | | | | | | | (6,957,024 | ) | | | (9,391,256 | ) | | | | | | | (9,391,256 | ) |
Results from UF indexed Other | | | 3,813,276 | | | | — | | | | 3,813,276 | | | | (123,183 | ) | | | | | | | (123,183 | ) | | | (397,282 | ) | | | | | | | (397,282 | ) |
| | | | | | | | | | | | | | | | | | | | | | | | | | | | | | | | | | | | |
(Losses) gains from indexation | | | (39,575,950 | ) | | | 4,969,932 | | | | (34,606,018 | ) | | | (20,959,587 | ) | | | 2,074,458 | | | | (18,885,129 | ) | | | (25,915,449 | ) | | | 2,377,697 | | | | (23,537,752 | ) |
| | | | | | | | | | | | | | | | | | | | | | | | | | | | | | | | | | | | |
Financial debt IFC-ABN Argentina | | | (3,250,121 | ) | | | — | | | | (3,250,121 | ) | | | (4,821,735 | ) | | | — | | | | (4,821,735 | ) | | | (5,468,763 | ) | | | | | | | (5,468,763 | ) |
Bond debt USA and Peru | | | (18,974,289 | ) | | | 19,198,679 | | | | 224,390 | | | | (26,103,769 | ) | | | 9,274,498 | | | | (16,829,271 | ) | | | (2,276,453 | ) | | | (8,928,180 | ) | | | (11,204,633 | ) |
Financial debt Peru | | | (1,568,572 | ) | | | — | | | | (1,568,572 | ) | | | (3,830,530 | ) | | | 395,038 | | | | (3,435,492 | ) | | | 1,121,237 | | | | (444,564 | ) | | | 676,673 | |
Financial assets and Financial debt—Colombia | | | 150,070 | | | | — | | | | 150,070 | | | | 32,577 | | | | — | | | | 32,577 | | | | 3,944,181 | | | | — | | | | 3,944,181 | |
| | | | | | | | | | | | | | | | | | | | | | | | | | | | | | | | | | | | |
Exchange difference | | | (23,642,912 | ) | | | 19,198,679 | | | | (4,444,233 | ) | | | (34,723,457 | ) | | | 9,669,536 | | | | (25,053,921 | ) | | | (2,679,798 | ) | | | (9,372,744 | ) | | | (12,052,542 | ) |
Financial results total | | | (278,674,469 | ) | | | 62,861,544 | | | | (215,812,925 | ) | | | (308,513,005 | ) | | | 46,717,379 | | | | (261,795,626 | ) | | | (231,506,889 | ) | | | 25,517,354 | | | | (205,989,535 | ) |
| | | | | | | | | | | | | | | | | | | | | | | | | | | | | | | | | | | | |
F-181
The corporate income tax expense on continuing operations amounts to ThCh$ 124,678,928 ThCh$ 94,068,463 and ThCh$ 92,225,788, for the periods according to the following detail:
| | | | | | | | | | | | |
Expenses (income) due to income tax, current and deferred portions
(presentation) | | For the year ended December 31, | |
| | 2014 | | | 2013 | | | 2012 | |
| | | ThCh$ | | | ThCh$ | | | ThCh$ | |
Current tax expense | | | 107,130,790 | | | | 68,701,274 | | | | 82,748,194 | |
| | | | | | | | | | | | |
| | | |
Total current tax expenses, Net | | | 107,130,790 | | | | 68,701,274 | | | | 82,748,194 | |
| | | | | | | | | | | | |
| | | |
Deferred tax income (expense) due to taxes arising from the creation and reversal of temporary differences | | | (1,572,147 | ) | | | 18,714,831 | | | | 21,118,918 | |
Deferred expenses (income) due to taxes arising from the changes in tax rates or new rates | | | 20,373,016 | | | | 6,652,358 | | | | (11,641,324 | ) |
| | | | | | | | | | | | |
| | | |
Total deferred tax expenses, net | | | 18,800,869 | | | | 25,367,189 | | | | 9,477,594 | |
| | | | | | | | | | | | |
| | | |
Tax expense on continuing operations | | | 125,931,659 | | | | 94,068,463 | | | | 92,225,788 | |
| | | | | | | | | | | | |
| |
Expenses (income) due to income tax, by source (national, foreign) (presentation) | | For the year ended December 31, | |
| | 2014 | | | 2013 | | | 2012 | |
| | | ThCh$ | | | ThCh$ | | | ThCh$ | |
Current income tax expense, Net, Foreign | | | 83,895,424 | | | | 52,504,750 | | | | 70,950,015 | |
Current income tax expense, Net, Local | | | 23,235,366 | | | | 44,920,056 | | | | 11,798,179 | |
| | | | | | | | | | | | |
| | | |
Current income tax expense, Net, Total | | | 107,130,790 | | | | 97,424,806 | | | | 82,748,194 | |
| | | | | | | | | | | | |
| | | |
Deferred income tax expense, Net, Foreign | | | (681,264 | ) | | | (9,836,201 | ) | | | (15,214,306 | ) |
Deferred income tax expense, Net, Local | | | 19,482,133 | | | | 6,479,858 | | | | 24,691,900 | |
| | | | | | | | | | | | |
| | | |
Deferred income tax expense, Net, Total | | | 18,800,869 | | | | (3,356,343 | ) | | | 9,477,594 | |
| | | | | | | | | | | | |
| | | |
Tax Expense on continuing operations | | | 125,931,659 | | | | 94,068,463 | | | | 92,225,788 | |
| | | | | | | | | | | | |
The tax expense on continuing operations excludes the tax expense from the discontinued operation of ChTh$- 1,599,496 for the year ended December 31, 2014 (Dec 2013: 2,089,310 and Dec 2012: 8,262,494), see note 34.
F-182
The following chart shows the reconciliation between the corporate income tax calculations resulting from the application of the legal and effective rates for the periods:
| | | | | | | | | | | | |
Reconciliation of income tax expense using the statutory rate to income tax
expense using the effective rate | | For the periods | |
| | 2014 | | | 2013 | | | 2012 | |
| | | ThCh$ | | | ThCh$ | | | ThCh$ | |
Income tax expense using the legal rate | | | 61,398,123 | | | | 63,115,282 | | | | 59,435,560 | |
| | | | | | | | | | | | |
| | | |
Tax effect of rates in other territories | | | 15,170,940 | | | | 19,661,979 | | | | 24,183,407 | |
Non-taxable expenses | | | 7,432,995 | | | | 6,180,072 | | | | 15,447,183 | |
Non-taxable income | | | — | | | | — | | | | 8,103,282 | |
Price level restatement under tax law | | | (25,080,449 | ) | | | (8,945,672 | ) | | | (3,853,610 | ) |
Colombia –Presumptive Income rate adjustment 9% (rate 34% and credit 25%) | | | 3,853,344 | | | | 6,652,358 | | | | (11,641,323 | |
| | | |
Tax Effect of changes in tax rates | | | 20,373,017 | | | | | | | | | |
| | | |
Effect of share of profit of equity-accounted investee | | | (1,859,945 | ) | | | (2,024,785 | ) | | | (1,108,276 | ) |
Amortization of deductible expenses for tax- Goodwill Colombia | | | 39,609,320 | | | | | | | | | |
| | | |
Changes in estimates related to prior years | | | 5,034,314 | | | | 9,429,229 | | | | 1,659,565 | |
| | | | | | | | | | | | |
| | | |
Adjustments to tax expenses using the legal rate, total | | | 64,533,536 | | | | 30,953,181 | | | | 32,790,228 | |
| | | | | | | | | | | | |
| | | |
Income tax expense using the effective rate | | | 125,931,659 | | | | 94,068,463 | | | | 92,225,788 | |
The Company has deferred assets for tax losses arising from the different countries where it has investments. These arise mainly in the retail and real estate areas, both in Chile and abroad. For the tax losses carry-forward, there are no limits regarding their usage in all jurisdictions where the Group operates, the realization of tax losses is estimated based on the Group future projections.
These losses are in countries where they have no time limit and their reversal is estimated as projected future revenues as increasing.
| b) | Reversal of asset and liability timing differences: |
The reversal of asset and liability timing differences is directly related to the nature of the asset and liability accounts generating these differences. There is no set term for the reversal of timing differences, due to the reversal of some and the origin of others.
The current income tax rate in Chile that affects the Company is 21% for the fiscal year 2014 (Dec 2013: 20%).
On September 29, 2014, Law No. 20,780 was enacted and published in the Official Gazette, introducing various amendments to the current income tax law and taxation rules for other taxes.
F-183
The new tax reform comprises a dual income tax system, Attributed Profir Income (API) and Partially Integrated System (PIS), the main differences between these systems are as follows:
| | |
Attributed Profit Income (API) | | Partially Integrated System (PIS) |
| |
| Shareholders would be taxed on an accrued basis | | Shareholders would be taxed on a cash basis (dividend distribution) |
| |
| Income tax rate of 25% | | Income tax rate of 27% |
| |
| Final tax with a 100% of tax credit | | Final tax credit with 65% of tax credit |
| |
| ETR (effective tax rate) of 35% | | ERT of 44.5% (exception) |
| |
| Excess of distribution over the taxable income will be taxable by the owner (exception) | | Excess of distribution over the taxable income will be taxable by the last owner w/o tax credit |
Under the recently enacted tax law, the income tax rate will increase to 21%, 22.5%, 24%, 25.5% and 27%, for the years 2014, 2015, 2016, 2017, 2018 and following fiscal years, respectively, based on the adoption of the partially integrated system.
Alternatively, for the years 2014, 2015, 2016 and 2017 and following fiscal years, an increase of 21%, 22.5%, 24%, and 25%, respectively, will apply in the event that other companies adopt the attributed taxable income system.
The Income Tax System adopted by Cencosud was the partially integrated system unless otherwise is indicated by the Shareholders by the end of 2016 (July – December).
Based on the adoption of the Partially Integrated System and the application of the progressive increase of its rates, Cencosud had an increase in its deferred tax liability balance which resulted in a loss in its Income Statement for ChTh$ 25,445,577 first effect to September 30 and . a loss in the last quarter 2014 of ChTh 1,618,860.
The rates that affect its foreign subsidiaries are: 35% in Argentina, 33% in Colombia, 30% in Peru and 34% in Brazil. For Colombia, this current rate was modified from 33% to 34% and enacted in 2013.
With date December 15, 2014, Peru enacted in law Nº 30.296 which envisages gradual reduction in taxes from the current 30% to 28% in 2015-2016, 27% in 2017-2018, and 26% from 2019 onwards. The effects caused by this new law are recognized in the year 2014 and resulted in a profit in its Income Statement for ThCh$ 6,110,161.
Additionally, with date December 23, 2014 in Colombia was enacted law N° 1.739. The effects caused by this new law are recognized in the year 2014 and resulted in a profit in its Income Statement for ThCh$ 581,261.
| d) | Deferred taxes not recognized. |
The Company has no unrecognized deferred taxes as of the date of these financial statements.
F-184
The basic earnings per share is calculated dividing the profits attributable to the Company shareholders among the weighted average of the common shares circulating during the year, excluding any common shares acquired by the Company and held as treasury shares.
| | | | | | | | | | | | |
| | | For the year ended December 31, | |
Basic Earnings per Share | | 2014 | | | 2013 | | | 2012 | |
Profit from continuing operations attributable to controlling shareholders | | | 152,233,031 | | | | 241,573,109 | | | | 216,911,336 | |
Profit from discontinued operations attributable to controlling shareholders | | | 12,661,641 | | | | 8,357,240 | | | | 33,047,279 | |
| | | | | | | | | | | | |
Available income for common shareholders, basic | | | 164,894,672 | | | | 249,930,349 | | | | 249,958,615 | |
| | | | | | | | | | | | |
Weighted average of share number, basic | | | 2,828,723,963 | | | | 2,762,910,986 | | | | 2,327,518,639 | |
Earnings per share from continued operations, basic | | | 53,8 | | | | 87.4 | | | | 93.2 | |
Earnings per share from discontinued operations, basic | | | 4.5 | | | | 3.0 | | | | 14.2 | |
The diluted earnings per share are calculated dividing the profits attributable to the Company’s shareholders by the weighted-average of common shares that would be issued if all common shares were converted with diluting effects.
| | | | | | | | | | | | |
| | | For the year ended December 31, | |
Basic Earnings per Share, diluted | | 2014 | | | 2013 | | | 2012 | |
Profit from continuing operations attributable to controlling shareholders | | | 152,233,031 | | | | 241,573,109 | | | | 216,911,336 | |
Profit from discontinued operations attributable to controlling shareholders | | | 12,661,641 | | | | 8,357,240 | | | | 33,047,279 | |
Available income for common shareholders, diluted | | | 164,894,672 | | | | 249,930,349 | | | | 249,958,615 | |
| | | | | | | | | | | | |
| | | |
Weighted average of share number, diluted | | | 2,828,723,963 | | | | 2,783,287,215 | | | | 2,350,018,639 | |
Earnings per share from continued operations, diluted | | | 53,8 | | | | 86.8 | | | | 92.3 | |
Earnings per share from discontinued operations, diluted | | | 4.5 | | | | 3.0 | | | | 14.1 | |
The diluted earnings per share is calculated by dividing the profit attributable to shareholders of the Company by the weighted average of common shares that would be issued on the conversion of all dilutive potential ordinary shares are dilutive.
| | | | | | | | | | | | |
| | | For the year ended December 31, | |
Reconciliation of basic and diluted shares | | 2014 | | | 2013 | | | 2012 | |
| | | ThCh$ | | | ThCh$ | | | ThCh$ | |
Weighted average number of shares, basic | | | 2,828,723,963 | | | | 2,762,910,986 | | | | 2,327,518,639 | |
Increase in shares from share-based compensation plans | | | — | | | | 20,376,229 | | | | 22,500,000 | |
| | | | | | | | | | | | |
| | | |
Weighted average number of shares, diluted | | | 2,828,723,963 | | | | 2,783,287,215 | | | | 2,350,018,639 | |
| | | | | | | | | | | | |
F-185
The Company reports the information by segment according to what is set forth in IFRS 8 “Operating Segments.” An operating segment is defined as a component of an entity over which separated financial information is available and is regularly reviewed.
In the information by segments, all transactions between the different operating segments have been eliminated.
Amended presentation for discontinued operations:
As discussed in Note 2.1, these consolidated financial statements have been re-presented to retroactively present the Subject Companies as discontinued operations. As such, the following segment information has also been re-presented to exclude the Subject Companies from the Financial services segment and to present them as discontinued operations remaining forty-nine percent (49%) owned by Cencosud as indicated in the Framework Agreement further explained in noted 2.1.
| 28.1 | Segmentation criteria |
For management purposes, the Company is organized in five operative divisions: Supermarkets, Shopping Centers, Home Improvement stores, Department stores and Financial Services. These segments are the basic on which the Company makes decisions with respect to its operations and resource allocation.
The operative segments are disclosed in a similar way with the presentation of the internal reports used by Management in the control and decision making process, considering the segments from a point of view according to the type of business and geographical area.
The operating segments that are reported derive their revenues mainly from the sale of products and rendering of services to final consumers of retail. There are no customers whose purchases represent more than 10% of the consolidated revenue, nor a specific business segment.
The rest of the minor activities, mainly including the travel agency and family-entertainment centers businesses, plus certain consolidation adjustments and corporate expenses administered centrally, are included in the segment “Support services, financing, adjustments and other”.
F-186
| 28.2 | Regional information by segment |
The segment information which is delivered to the chief operating decision maker (“Board of Directors”) of the reportable segments for the years ended December 31, 2014, 2013 and 2012 in thousands of Chilean pesos, is the following:
| | | | | | | | | | | | | | | | | | | | | | | | | | | | | | | | |
Regional information, by segment | |
| Consolidated statement of income | | Supermarkets | | | Shopping
Centers | | | Home
improvement | | | Department
stores | | | Financial
services | | | Support services, financing, adjustments and other | | | Consolidated | | | Discontinued | |
| For the year ended December 31, 2014 | | ThCh$ | | | ThCh$ | | | ThCh$ | | | ThCh$ | | | ThCh$ | | | ThCh$ | | | ThCh$ | | | ThCh$ | |
Revenues from ordinary activities | | | 8,159,236,907 | | | | 214,849,681 | | | | 1,225,616,059 | | | | 991,442,445 | | | | 117,678,894 | | | | 2,205,260 | | | | 10,711,029,246 | | | | 201,825,995 | |
Cost of sales | | | (6,204,110,370 | ) | | | (28,028,570 | ) | | | (800,341,557 | ) | | | (741,279,355 | ) | | | (39,046,459 | ) | | | (1,966,924 | ) | | | (7,814,773,235 | ) | | | (55,799,003 | ) |
| | | | | | | | | | | | | | | | | | | | | | | | | | | | | | | | |
Gross Margin | | | 1,955,126,537 | | | | 186,821,111 | | | | 425,274,502 | | | | 250,163,090 | | | | 78,632,435 | | | | 238,336 | | | | 2,896,256,011 | | | | 146,026,992 | |
| | | | | | | | | | | | | | | | | | | | | | | | | | | | | | | | |
| | | | | | | | |
Other revenues by function | | | 9,212,081 | | | | 100,845,534 | | | | 725,300 | | | | 1,730,198 | | | | (6 | ) | | | 1,924,609 | | | | 114,437,716 | | | | 190,554 | |
Sales, general and administrative expenses | | | (1,674,771,984 | ) | | | (34,477,086 | ) | | | (327,214,081 | ) | | | (258,903,578 | ) | | | (42,531,877 | ) | | | (157,537,003 | ) | | | (2,495,435,609 | ) | | | (69,130,204 | ) |
Financial expenses and income, net | | | — | | | | — | | | | — | | | | — | | | | — | | | | (215,455,607 | ) | | | (215,455,607 | ) | | | (38,692,934 | ) |
Participation in profit or loss of equity method associates | | | 36,241 | | | | 6,171,965 | | | | | | | | | | | | — | | | | | | | | 6,208,206 | | | | — | |
Exchange differences | | | — | | | | — | | | | — | | | | — | | | | | | | | (23,642,912 | ) | | | (23,642,912 | ) | | | (19,198,679 | ) |
| | | | | | | | |
(Losses) from Indexation | | | — | | | | — | | | | — | | | | — | | | | — | | | | (39,575,950 | ) | | | (39,575,950 | ) | | | (4,969,932 | ) |
| | | | | | | | |
Other gains (Losses), net | | | — | | | | — | | | | — | | | | 2,434,854 | | | | — | | | | 32,189,627 | | | | 34,624,481 | | | | 35,340 | |
| | | | | | | | |
Income tax charge | | | — | | | | — | | | | — | | | | — | | | | — | | | | (125,931,659 | ) | | | (125,931,659 | ) | | | (1,599,496 | ) |
| | | | | | | | |
Profit (loss) | | | 289,602,875 | | | | 259,361,524 | | | | 98,785,721 | | | | (4,575,436 | ) | | | 36,100,552 | | | | (527,790,559 | ) | | | 151,484,677 | | | | 12,661,641 | |
| | | | | | | | | | | | | | | | | | | | | | | | | | | | | | | | |
| | | | | | | | |
Profit (loss) from continuing operations | | | 289,602,875 | | | | 259,361,524 | | | | 98,785,721 | | | | (4,575,436 | ) | | | 36,100,552 | | | | (527,790,559 | ) | | | 151,484,677 | | | | — | |
| | | | | | | | | | | | | | | | | | | | | | | | | | | | | | | | |
Profit (loss) from discontinued operations attributable to owners of the Company | | | — | | | | — | | | | — | | | | — | | | | — | | | | — | | | | | | | | 12,661,641 | |
| | | | | | | | | | | | | | | | | | | | | | | | | | | | | | | | |
Profit (loss) of attributable to non-controlling interest | | | | | | | — | | | | — | | | | — | | | | — | | | | 748,354 | | | | 748,354 | | | | — | |
| | | | | | | | | | | | | | | | | | | | | | | | | | | | | | | | |
Profit for the year attributable to shareholders, Total | | | 289,602,875 | | | | 259,361,524 | | | | 98,785,721 | | | | (4,575,436 | ) | | | 36,100,552 | | | | (527,042,205 | ) | | | 152,233,031 | | | | 12,661,641 | |
| | | | | | | | |
Depreciation and amortization | | | 134,505,152 | | | | 5,487,636 | | | | 20,362,503 | | | | 26,429,194 | | | | 1,942,336 | | | | 11,316,220 | | | | 200,043,041 | | | | 2,299,772 | |
F-187
| | | | | | | | | | | | | | | | | | | | | | | | | | | | | | | | |
| Consolidated statement of income | | Supermarkets | | | Shopping
Centers | | | Home
improvement | | | Department
stores | | | Financial
services | | | Support services, financing, adjustments and other | | | Consolidated | | | Discontinued | |
| For the year ended December 31, 2013 | | ThCh$ | | | ThCh$ | | | ThCh$ | | | ThCh$ | | | ThCh$ | | | ThCh$ | | | ThCh$ | | | ThCh$ | |
Revenues from ordinary activities | | | 7,682,993,707 | | | | 205,331,757 | | | | 1,176,889,876 | | | | 970,359,682 | | | | 81,651,184 | | | | 16,932,004 | | | | 10,134,158,210 | | | | 206,881,617 | |
Cost of sales | | | (5,782,590,090 | ) | | | (23,340,760 | ) | | | (787,402,395 | ) | | | (701,529,624 | ) | | | (25,937,848 | ) | | | (3,450,895 | ) | | | (7,324,251,612 | ) | | | (59,816,671 | ) |
| | | | | | | | | | | | | | | | | | | | | | | | | | | | | | | | |
Gross Margin | | | 1,900,403,617 | | | | 181,990,997 | | | | 389,487,481 | | | | 268,830,058 | | | | 55,713,336 | | | | 13,481,109 | | | | 2,809,906,598 | | | | 147,064,946 | |
| | | | | | | | | | | | | | | | | | | | | | | | | | | | | | | | |
| | | | | | | | |
Other revenues by function | | | 13,066,677 | | | | 94,247,902 | | | | 238,535 | | | | 225,651 | | | | — | | | | 512,480 | | | | 108,291,245 | | | | 422,737 | |
| | | | | | | | |
Sales, general and administrative expenses | | | (1,608,981,816 | ) | | | (38,776,668 | ) | | | (309,684,052 | ) | | | (245,331,298 | ) | | | (15,666,959 | ) | | | (139,140,716 | ) | | | (2,357,581,509 | ) | | | (90,339,754 | ) |
Financial expenses and income, net | | | — | | | | — | | | | — | | | | — | | | | — | | | | (217,856,576 | ) | | | (217,856,576 | ) | | | (34,973,385 | ) |
Participation in profit or loss of equity method associates | | | 165,512 | | | | 10,123,927 | | | | — | | | | — | | | | — | | | | — | | | | 10,289,439 | | | | | |
Exchange differences | | | — | | | | — | | | | — | | | | — | | | | — | | | | (25,053,921 | ) | | | (25,053,921 | ) | | | (9,669,536 | ) |
| | | | | | | | |
(Losses) from Indexation | | | — | | | | — | | | | — | | | | — | | | | — | | | | (18,885,129 | ) | | | (18,885,129 | ) | | | (2,074,458 | ) |
| | | | | | | | |
Other gains (Losses), net | | | — | | | | — | | | | — | | | | 1,029,785 | | | | — | | | | 25,336,087 | | | | 26,365,872 | | | | 16,000 | |
| | | | | | | | |
Income tax charge | | | — | | | | — | | | | — | | | | — | | | | — | | | | (94,068,463 | ) | | | (94,068,463 | ) | | | (2,089,310 | ) |
| | | | | | | | |
Profit (loss) | | | 304,653,990 | | | | 247,586,158 | | | | 80,041,964 | | | | 24,754,196 | | | | 40,046,377 | | | | (455,675,129 | ) | | | 241,407,556 | | | | 8,357,240 | |
Profit (loss) from continuing operations | | | 304,653,990 | | | | 247,586,158 | | | | 80,041,964 | | | | 24,754,196 | | | | 40,046,377 | | | | (455,675,129 | ) | | | 241,407,556 | | | | | |
| | | | | | | | | | | | | | | | | | | | | | | | | | | | | | | | |
Profit (loss) from discontinued operations attributable to owners of the Company | | | | | | | | | | | — | | | | — | | | | — | | | | — | | | | | | | | 8,357,240 | |
| | | | | | | | | | | | | | | | | | | | | | | | | | | | | | | | |
Profit (loss) of attributable to non-controlling interest | | | — | | | | — | | | | — | | | | — | | | | — | | | | 165,553 | | | | 165,553 | | | | — | |
Profit for the year attributable to shareholders, Total | | | 304,653,990 | | | | 247,586,158 | | | | 80,041,964 | | | | 24,754,196 | | | | 40,046,377 | | | | (455,509,576 | ) | | | 241,573,109 | | | | 8,357,240 | |
| | | | | | | | |
Depreciation and amortization | | | 130,205,423 | | | | 3,949,574 | | | | 19,481,127 | | | | 24,609,973 | | | | 1,776,078 | | | | 6,553,841 | | | | 186,576,016 | | | | 2,461,658 | |
F-188
| | | | | | | | | | | | | | | | | | | | | | | | | | | | | | | | |
Consolidated statement of income | | Supermarkets | | | Shopping Centers | | | Home improvement | | | Department stores | | | Financial services | | | Support services, financing, adjustments and other | | | Consolidated total | | | Discontinued operation financial services | |
For the year ended December 31, 2012 | | ThCh$ | | | ThCh$ | | | ThCh$ | | | ThCh$ | | | ThCh$ | | | ThCh$ | | | ThCh$ | | | ThCh$ | |
Revenues from ordinary activities | | | 6,733,610,368 | | | | 172,103,636 | | | | 1,063,086,246 | | | | 886,074,835 | | | | 58,453,967 | | | | 12,021,824 | | | | 8,925,350,876 | | | | 223,726,231 | |
| | | | | | | | |
Cost of sales | | | (5,057,477,386 | ) | | | (27,212,848 | ) | | | (711,500,077 | ) | | | (644,667,874 | ) | | | (21,081,862 | ) | | | (2,294,000 | ) | | | (6,464,234,047 | ) | | | (83,597,726 | ) |
| | | | | | | | | | | | | | | | | | | | | | | | | | | | | | | | |
Gross Margin | | | 1,676,132,982 | | | | 144,890,788 | | | | 351,586,169 | | | | 241,406,961 | | | | 37,372,105 | | | | 9,727,824 | | | | 2,461,116,829 | | | | 140,128,505 | |
| | | | | | | | | | | | | | | | | | | | | | | | | | | | | | | | |
| | | | | | | | |
Other revenues by function | | | 7,095,688 | | | | 98,906,148 | | | | 102,797 | | | | 315,626 | | | | 0 | | | | 590,533 | | | | 107,010,792 | | | | 99,278 | |
Sales, general and administrative expenses | | | (1,368,788,836 | ) | | | (26,739,071 | ) | | | (278,043,349 | ) | | | (221,491,769 | ) | | | (46,803,305 | ) | | | (106,523,510 | ) | | | (2,048,389,840 | ) | | | (73,431,624 | ) |
Financial expenses and income, net | | | — | | | | — | | | | — | | | | — | | | | — | | | | (170,399,241 | ) | | | (170,399,241 | ) | | | (32,512,401 | ) |
Participation in profit or loss of equity method associates | | | 98,335 | | | | 5,643,512 | | | | — | | | | — | | | | 0 | | | | (99,436 | ) | | | 5,642,411 | | | | (2,695 | ) |
Exchange differences | | | — | | | | — | | | | — | | | | — | | | | — | | | | (12,052,542 | ) | | | (12,052,542 | ) | | | 9,372,744 | |
(Losses) from Indexation | | | — | | | | — | | | | — | | | | — | | | | — | | | | (23,537,752 | ) | | | (23,537,752 | ) | | | (2,377,697 | ) |
| | | | | | | | |
Other earnings (Losses), net | | | — | | | | — | | | | — | | | | — | | | | — | | | | (7,403,018 | ) | | | (7,403,018 | ) | | | 33,663 | |
| | | | | | | | |
Income tax charge | | | — | | | | — | | | | — | | | | — | | | | — | | | | (92,225,788 | ) | | | (92,225,788 | ) | | | (8,262,494 | ) |
| | | | | | | | | | | | | | | | | | | | | | | | | | | | | | | | |
| | | | | | | | |
Profit (loss) | | | 314,538,169 | | | | 222,701,377 | | | | 73,645,617 | | | | 20,230,818 | | | | (9,431,200 | ) | | | (401,922,930 | ) | | | 219,761,851 | | | | 33,047,279 | |
Profit (loss) from continuing operations | | | 314,538,169 | | | | 222,701,377 | | | | 73,645,617 | | | | 20,230,818 | | | | (9,431,200 | ) | | | (401,922,930 | ) | | | 219,761,851 | | | | | |
Profit (loss) from discontinued operations attributable to owners of the Company | | | | | | | | | | | | | | | | | | | | | | | | | | | — | | | | 33,047,279 | |
Profit (loss) of attributable to non-controlling interest | | | | | | | | | | | | | | | | | | | | | | | (2,850,515 | ) | | | (2,850,515 | ) | | | | |
Profit for the year attributable to shareholders, Total | | | 314,538,169 | | | | 222,701,377 | | | | 73,645,617 | | | | 20,230,818 | | | | (9,431,200 | ) | | | (404,773,445 | ) | | | 216,911,336 | | | | 33,047,279 | |
| | | | | | | | | | | | | | | | | | | | | | | | | | | | | | | | |
| | | | | | | | |
Depreciation and amortization | | | 89,454,327 | | | | 2,605,979 | | | | 17,740,121 | | | | 22,895,958 | | | | 954,777 | | | | 5,289,657 | | | | 138,940,819 | | | | 2,509,579 | |
F-189
The Company controls the results of each of the operating segments, at the level of revenues, costs and management expenses. The support services, exchange rates, readjustments, taxes and non-recurring income and expense, or financial income, are not allocated, as they are centrally managed.
The financing policy of the Group has been historically getting financed and managing these resources through the Company Holding Cencosud S.A., the funds are subsequently transferred to other countries as required to finance the local investments. This policy aims to reduce the financial cost of the Group.
F-190
| 28.3 | Gross margin by country and segment, in thousands of Chilean pesos: |
Gross margin by country and segment
| | | | | | | | | | | | | | | | | | | | | | | | | | | | | | | | |
For the year ended
December 31, 2014 | | Supermarkets | | | Shopping
Centers | | | Home
improvement | | | Department
stores | | | Financial
services | | | Support services,
financing,
adjustments
and other | | | Continuing operations
total | | | Discontinued operation financial services | |
| | | ThCh$ | | | ThCh$ | | | ThCh$ | | | ThCh$ | | | ThCh$ | | | ThCh$ | | | ThCh$ | | | ThCh$ | |
| | | | | | | | |
Chile | | | | | | | | | | | | | | | | | | | | | | | | | | | | | | | | |
Ordinary income, total | | | 2,354,805,121 | | | | 120,733,606 | | | | 465,520,212 | | | | 952,203,421 | | | | 329,538 | | | | (1,030,905 | ) | | | 3,892,560,993 | | | | 201,825,995 | |
Cost of sales | | | (1,766,081,982 | ) | | | (7,302,377 | ) | | | (329,587,879 | ) | | | (707,454,394 | ) | | | (260,542 | ) | | | (515,869 | ) | | | (2,811,203,043 | ) | | | (55,799,003 | ) |
| | | | | | | | | | | | | | | | | | | | | | | | | | | | | | | | |
Gross margin | | | 588,723,139 | | | | 113,431,229 | | | | 135,932,333 | | | | 244,749,027 | | | | 68,996 | | | | (1,546,774 | ) | | | 1,081,357,950 | | | | 146,026,992 | |
| | | | | | | | | | | | | | | | | | | | | | | | | | | | | | | | |
| | | | | | | | |
Argentina | | | | | | | | | | | | | | | | | | | | | | | | | | | | | | | | |
Ordinary income, total | | | 1,813,585,714 | | | | 66,588,613 | | | | 692,925,000 | | | | — | | | | 62,597,051 | | | | 8,122,804 | | | | 2,643,819,182 | | | | — | |
Cost of sales | | | (1,257,008,623 | ) | | | (18,675,802 | ) | | | (420,660,060 | ) | | | — | | | | (16,245,766 | ) | | | (2,001,225 | ) | | | (1,714,591,476 | ) | | | — | |
| | | | | | | | | | | | | | | | | | | | | | | | | | | | | | | | |
Gross margin | | | 556,577,091 | | | | 47,912,811 | | | | 272,264,940 | | | | — | | | | 46,351,285 | | | | 6,121,579 | | | | 929,227,706 | | | | | |
| | | | | | | | | | | | | | | | | | | | | | | | | | | | | | | | |
| | | | | | | | |
Brazil | | | | | | | | | | | | | | | | | | | | | | | | | | | | | | | | |
Ordinary income, total | | | 2,154,312,700 | | | | — | | | | — | | | | — | | | | 3,842,801 | | | | — | | | | 2,158,155,501 | | | | — | |
Cost of sales | | | (1,720,817,095 | ) | | | — | | | | — | | | | — | | | | — | | | | — | | | | (1,720,817,095 | ) | | | — | |
| | | | | | | | | | | | | | | | | | | | | | | | | | | | | | | | |
Gross margin | | | 433,495,605 | | | | — | | | | — | | | | — | | | | 3,842,801 | | | | — | | | | 437,338,406 | | | | | |
| | | | | | | | | | | | | | | | | | | | | | | | | | | | | | | | |
| | | | | | | | |
Peru | | | | | | | | | | | | | | | | | | | | | | | | | | | | | | | | |
Ordinary income, total | | | 836,676,581 | | | | 17,438,146 | | | | — | | | | 39,239,024 | | | | 42,814,446 | | | | 835,932 | | | | 937,004,129 | | | | | |
Cost of sales | | | (653,144,482 | ) | | | (1,678,214 | ) | | | — | | | | (33,824,961 | ) | | | (22,540,153 | ) | | | 693,161 | | | | (710,494,649 | ) | | | | |
| | | | | | | | | | | | | | | | | | | | | | | | | | | | | | | | |
Gross margin | | | 183,532,099 | | | | 15,759,932 | | | | — | | | | 5,414,063 | | | | 20,274,293 | | | | 1,529,093 | | | | 226,509,480 | | | | | |
| | | | | | | | | | | | | | | | | | | | | | | | | | | | | | | | |
| | | | | | | | |
Colombia | | | | | | | | | | | | | | | | | | | | | | | | | | | | | | | | |
Ordinary income, total | | | 999,856,791 | | | | 10,089,316 | | | | 67,170,848 | | | | — | | | | 8,095,057 | | | | (5,722,571 | ) | | | 1,079,489,441 | | | | | |
Cost of sales | | | (807,058,188 | ) | | | (372,177 | ) | | | (50,093,618 | ) | | | — | | | | — | | | | (142,989 | ) | | | (857,666,972 | ) | | | | |
| | | | | | | | | | | | | | | | | | | | | | | | | | | | | | | | |
Gross margin | | | 192,798,603 | | | | 9,717,139 | | | | 17,077,230 | | | | — | | | | 8,095,057 | | | | (5,865,560 | ) | | | 221,822,469 | | | | | |
| | | | | | | | | | | | | | | | | | | | | | | | | | | | | | | | |
| | | | | | | | |
Total | | | | | | | | | | | | | | | | | | | | | | | | | | | | | | | | |
Ordinary income, total | | | 8,159,236,907 | | | | 214,849,681 | | | | 1,225,616,060 | | | | 991,442,445 | | | | 117,678,893 | | | | 2,205,260 | | | | 10,711,029,246 | | | | 201,825,995 | |
Cost of sales | | | (6,204,110,370 | | | | (28,028,570 | ) | | | (800,341,557 | ) | | | (741,279,355 | ) | | | (39,046,461 | ) | | | (1,966,922 | ) | | | (7,814,773,235 | ) | | | (55,799,003 | ) |
| | | | | | | | | | | | | | | | | | | | | | | | | | | | | | | | |
Gross margin | | | 1,955,126,537 | | | | 186,821,111 | | | | 425,274,503 | | | | 250,163,090 | | | | 78,632,432 | | | | 238,338 | | | | 2,896,256,011 | | | | 146,026,992 | |
| | | | | | | | | | | | | | | | | | | | | | | | | | | | | | | | |
F-191
| | | | | | | | | | | | | | | | | | | | | | | | | | | | | | | | |
For the year ended
December 31, 2013 | | Supermarkets | | | Shopping
Centers | | | Home
improvement | | | Department
stores | | | Financial
services | | | Support services,
financing,
adjustments
and other | | | Continuing operations
total | | | Discontinued operation financial services | |
| | | ThCh$ | | | ThCh$ | | | ThCh$ | | | ThCh$ | | | ThCh$ | | | ThCh$ | | | ThCh$ | | | ThCh$ | |
| | | | | | | | |
Chile | | | | | | | | | | | | | | | | | | | | | | | | | | | | | | | | |
Ordinary income, total | | | 2,227,303,379 | | | | 112,838,221 | | | | 448,703,025 | | | | 955,776,720 | | | | 0 | | | | (1,199,580 | ) | | | 3,743,421,765 | | | | 206,881,617 | |
Cost of sales | | | (1,667,850,383 | ) | | | (6,819,735 | ) | | | (319,188,084 | ) | | | (689,359,574 | ) | | | 0 | | | | (568,775 | ) | | | (2,683,786,551 | ) | | | (59,816,671 | ) |
| | | | | | | | | | | | | | | | | | | | | | | | | | | | | | | | |
| | | | | | | | |
Gross margin | | | 559,452,996 | | | | 106,018,486 | | | | 129,514,941 | | | | 266,417,146 | | | | 0 | | | | (1,768,355 | ) | | | 1,059,635,214 | | | | 147,064,946 | |
| | | | | | | | |
Argentina | | | | | | | | | | | | | | | | | | | | | | | | | | | | | | | | |
Ordinary income, total | | | 1,786,933,136 | | | | 69,296,509 | | | | 682,009,977 | | | | — | | | | 44,739,642 | | | | 18,871,615 | | | | 2,601,850,879 | | | | — | |
Cost of sales | | | (1,245,360,758 | ) | | | (13,833,170 | ) | | | (434,482,148 | ) | | | — | | | | (11,406,064 | ) | | | (2,742,129 | ) | | | (1,707,824,269 | ) | | | — | |
| | | | | | | | | | | | | | | | | | | | | | | | | | | | | | | | |
| | | | | | | | |
Gross margin | | | 541,572,378 | | | | 55,463,339 | | | | 247,527,829 | | | | — | | | | 33,333,578 | | | | 16,129,486 | | | | 894,026,610 | | | | — | |
| | | | | | | | | | | | | | | | | | | | | | | | | | | | | | | | |
| | | | | | | | |
Brazil | | | | | | | | | | | | | | | | | | | | | | | | | | | | | | | | |
Ordinary income, total | | | 2,003,897,962 | | | | — | | | | — | | | | — | | | | 3,983,225 | | | | — | | | | 2,007,881,187 | | | | — | |
Cost of sales | | | (1,550,663,330 | ) | | | — | | | | — | | | | — | | | | — | | | | — | | | | (1,550,663,330 | ) | | | — | |
| | | | | | | | | | | | | | | | | | | | | | | | | | | | | | | | |
| | | | | | | | |
Gross margin | | | 453,234,632 | | | | | | | | | | | | | | | | 3,983,225 | | | | — | | | | 457,217,857 | | | | | |
| | | | | | | | | | | | | | | | | | | | | | | | | | | | | | | | |
| | | | | | | | |
Peru | | | | | | | | | | | | | | | | | | | | | | | | | | | | | | | | |
Ordinary income, total | | | 745,469,519 | | | | 14,555,001 | | | | — | | | | 14,582,962 | | | | 25,347,365 | | | | 189,260 | | | | 800,144,107 | | | | | |
Cost of sales | | | (577,962,622 | ) | | | (2,337,166 | ) | | | — | | | | (12,170,050 | ) | | | (14,531,784 | ) | | | (139,991 | ) | | | (607,141,613 | ) | | | | |
| | | | | | | | | | | | | | | | | | | | | | | | | | | | | | | | |
| | | | | | | | |
Gross margin | | | 167,506,897 | | | | 12,217,835 | | | | — | | | | 2,412,912 | | | | 10,815,581 | | | | 49,269 | | | | 193,002,494 | | | | | |
| | | | | | | | |
Colombia | | | | | | | | | | | | | | | | | | | | | | | | | | | | | | | | |
Ordinary income, total | | | 919,389,711 | | | | 8,642,026 | | | | 46,176,874 | | | | — | | | | 7,580,951 | | | | (929,290 | ) | | | 980,860,272 | | | | | |
Cost of sales | | | (740,752,997 | ) | | | (350,689 | ) | | | (33,732,163 | ) | | | — | | | | — | | | | — | | | | (774,835,849 | ) | | | | |
| | | | | | | | | | | | | | | | | | | | | | | | | | | | | | | | |
| | | | | | | | |
Gross margin | | | 178,636,714 | | | | 8,291,337 | | | | 12,444,711 | | | | | | | | 7,580,951 | | | | (929,290 | ) | | | 206,024,423 | | | | | |
| | | | | | | | |
Total | | | | | | | | | | | | | | | | | | | | | | | | | | | | | | | | |
Ordinary income, total | | | 7,682,993,709 | | | | 205,331,757 | | | | 1,176,889,876 | | | | 970,359,682 | | | | 81,651,184 | | | | 16,932,003 | | | | 10,134,158,210 | | | | 206,881,617 | |
Cost of sales | | | (5,782,590,090 | ) | | | (23,340,760 | ) | | | (787,402,395 | ) | | | (701,529,624 | ) | | | (25,937,848 | ) | | | (3,450,895 | ) | | | (7,324,251,612 | ) | | | (59,816,671 | ) |
| | | | | | | | | | | | | | | | | | | | | | | | | | | | | | | | |
| | | | | | | | |
Gross margin | | | 1,900,403,619 | | | | 181,990,997 | | | | 389,487,481 | | | | 268,830,058 | | | | 55,713,336 | | | | 13,481,108 | | | | 2,809,906,598 | | | | 147,064,946 | |
F-192
Gross margin by country and segment
| | | | | | | | | | | | | | | | | | | | | | | | | | | | | | | | |
For the year ended December 31,
2012 | | Supermarkets | | | Shopping
Centers | | | Home
improvement | | | Department
stores | | | Financial
services | | | Support
services,
financing,
adjustments
and other | | | Continuing operations
total | | | Discontinued operation financial services | |
| | | ThCh$ | | | ThCh$ | | | ThCh$ | | | ThCh$ | | | ThCh$ | | | ThCh$ | | | ThCh$ | | | ThCh$ | |
| | | | | | | | |
Chile | | | | | | | | | | | | | | | | | | | | | | | | | | | | | | | | |
Ordinary income, total | | | 2,057,975,971 | | | | 93,090,583 | | | | 400,374,671 | | | | 886,074,835 | | | | 0 | | | | 1,125,243 | | | | 3,438,641,303 | | | | 223,726,231 | |
Cost of sales | | | (1,560,271,586 | ) | | | (8,201,277 | ) | | | (285,324,555 | ) | | | (644,667,874 | ) | | | 0 | | | | (535,983 | ) | | | (2,499,001,275 | ) | | | (83,597,726 | ) |
| | | | | | | | | | | | | | | | | | | | | | | | | | | | | | | | |
| | | | | | | | |
Gross margin | | | 497,704,385 | | | | 84,889,306 | | | | 115,050,116 | | | | 241,406,961 | | | | 0 | | | | 589,260 | | | | 939,640,028 | | | | 140,128,505 | |
| | | | | | | | | | | | | | | | | | | | | | | | | | | | | | | | |
| | | | | | | | |
Argentina | | | | | | | | | | | | | | | | | | | | | | | | | | | | | | | | |
Ordinary income, total | | | 1,751,868,719 | | | | 65,468,487 | | | | 619,984,596 | | | | — | | | | 41,237,795 | | | | 10,588,737 | | | | 2,489,148,334 | | | | — | |
Cost of sales | | | (1,235,669,100 | ) | | | (14,498,868 | ) | | | (394,867,272 | ) | | | — | | | | (10,786,532 | ) | | | (1,697,425 | ) | | | (1,657,519,197 | ) | | | — | |
| | | | | | | | | | | | | | | | | | | | | | | | | | | | | | | | |
| | | | | | | | |
Gross margin | | | 516,199,619 | | | | 50,969,619 | | | | 225,117,324 | | | | — | | | | 30,451,263 | | | | 8,891,312 | | | | 831,629,137 | | | | — | |
| | | | | | | | | | | | | | | | | | | | | | | | | | | | | | | | |
| | | | | | | | |
Brazil | | | | | | | | | | | | | | | | | | | | | | | | | | | | | | | | |
Ordinary income, total | | | 2,095,104,021 | | | | — | | | | — | | | | — | | | | 3,675,547 | | | | — | | | | 2,098,779,568 | | | | — | |
Cost of sales | | | (1,639,791,932 | ) | | | — | | | | — | | | | — | | | | — | | | | — | | | | (1,639,791,932 | ) | | | — | |
| | | | | | | | | | | | | | | | | | | | | | | | | | | | | | | | |
| | | | | | | | |
Gross margin | | | 455,312,089 | | | | — | | | | — | | | | — | | | | 3,675,547 | | | | — | | | | 458,987,636 | | | | — | |
| | | | | | | | | | | | | | | | | | | | | | | | | | | | | | | | |
| | | | | | | | |
Peru | | | | | | | | | | | | | | | | | | | | | | | | | | | | | | | | |
Ordinary income, total | | | 713,307,958 | | | | 12,725,632 | | | | — | | | | — | | | | 13,115,177 | | | | 307,844 | | | | 739,456,611 | | | | | |
Cost of sales | | | (535,329,816 | ) | | | (4,482,928 | ) | | | — | | | | — | | | | (10,295,330 | ) | | | (60,592 | ) | | | (550,168,666 | ) | | | | |
| | | | | | | | | | | | | | | | | | | | | | | | | | | | | | | | |
| | | | | | | | |
Gross margin | | | 177,978,142 | | | | 8,242,704 | | | | — | | | | — | | | | 2,819,847 | | | | 247,252 | | | | 189,287,945 | | | | — | |
| | | | | | | | | | | | | | | | | | | | | | | | | | | | | | | | |
| | | | | | | | |
Colombia | | | | | | | | | | | | | | | | | | | | | | | | | | | | | | | | |
Ordinary income, total | | | 115,353,699 | | | | 818,934 | | | | 42,726,979 | | | | — | | | | 425,448 | | | | — | | | | 159,325,060 | | | | — | |
Cost of sales | | | (86,414,952 | ) | | | (29,775 | ) | | | (31,308,250 | ) | | | — | | | | — | | | | — | | | | (117,752,977 | ) | | | — | |
| | | | | | | | | | | | | | | | | | | | | | | | | | | | | | | | |
| | | | | | | | |
Gross margin | | | 28,938,747 | | | | 789,159 | | | | 11,418,729 | | | | — | | | | 425,448 | | | | — | | | | 41,572,083 | | | | — | |
| | | | | | | | | | | | | | | | | | | | | | | | | | | | | | | | |
| | | | | | | | |
Total | | | | | | | | | | | | | | | | | | | | | | | | | | | | | | | | |
Ordinary income, total | | | 6,733,610,368 | | | | 172,103,636 | | | | 1,063,086,246 | | | | 886,074,835 | | | | 58,453,967 | | | | 12,021,824 | | | | 8,925,350,876 | | | | 223,726,231 | |
Cost of sales | | | (5,057,477,386 | ) | | | (27,212,848 | ) | | | (711,500,077 | ) | | | (644,667,874 | ) | | | (21,081,862 | ) | | | (2,294,000 | ) | | | (6,464,234,047 | ) | | | (83,597,726 | ) |
| | | | | | | | | | | | | | | | | | | | | | | | | | | | | | | | |
| | | | | | | | |
Gross margin | | | 1,676,132,982 | | | | 144,890,788 | | | | 351,586,169 | | | | 241,406,961 | | | | 37,372,105 | | | | 9,727,824 | | | | 2,461,116,829 | | | | 140,128,505 | |
F-193
| 28.4 | Regional information by segment: Total assets |
| | | | | | | | | | | | | | | | | | | | | | | | | | | | |
| | | Supermarkets | | | Shopping
Centers | | | Home
improvement | | | Department
stores | | | Financial
services | | | Support services,
financing,
adjustments
and other | | | Consolidated
total | |
At December 31, 2014 | | ThCh$ | | | ThCh$ | | | ThCh$ | | | ThCh$ | | | ThCh$ | | | ThCh$ | | | ThCh$ | |
Current Assets | | | | | | | | | | | | | | | | | | | | | | | | | | | | |
Cash and cash equivalent | | | 152,859,721 | | | | 6,462,947 | | | | 11,252,555 | | | | 26,745,107 | | | | 16,820,985 | | | | 4,730,478 | | | | 218,871,793 | |
Other financial assets, current | | | — | | | | — | | | | — | | | | — | | | | — | | | | 47,778,995 | | | | 47,778,995 | |
Other non-financial assets, current | | | 4,081,250 | | | | 1,174,486 | | | | 2,264,731 | | | | 828,702 | | | | 183,117 | | | | 2,114,206 | | | | 10,646,492 | |
Trade receivables and other receivables, current | | | 322,351,096 | | | | 33,472,707 | | | | 60,528,075 | | | | 43,259,975 | | | | 311,292,653 | | | | 10,672,248 | | | | 781,576,754 | |
Trade receivables due from related parties, current | | | — | | | | 1,371,016 | | | | — | | | | — | | | | — | | | | — | | | | 1,371,016 | |
Inventory, current | | | 700,587,712 | | | | — | | | | 238,454,570 | | | | 155,567,301 | | | | — | | | | — | | | | 1,094,609,583 | |
Income tax receivable, current | | | 1,500,907 | | | | 1,458,328 | | | | 755,879 | | | | 6,884,749 | | | | 2,357,468 | | | | 41,239,086 | | | | 54,196,417 | |
Assets held for the sales | | | | | | | | | | | | | | | | | | | 793,416,576 | | | | | | | | 793,416,576 | |
Total current assets | | | 1,181,380,686 | | | | 43,939,484 | | | | 313,255,810 | | | | 233,285,834 | | | | 1,124,070,799 | | | | 106,535,013 | | | | 3,002,467,626 | |
| | | | | | | |
Non-Current Assets | | | | | | | | | | | | | | | | | | | | | | | | | | | | |
Other financial assets, non-current | | | — | | | | — | | | | — | | | | — | | | | — | | | | 302,479,598 | | | | 302,479,598 | |
Other non-financial assets, non-current | | | — | | | | — | | | | — | | | | — | | | | — | | | | 33,873,417 | | | | 33,873,417 | |
Trade receivables and other receivables, non-current | | | 20,154,938 | | | | — | | | | — | | | | — | | | | 13,202,701 | | | | 1,419,716 | | | | 34,777,355 | |
Equity method investments | | | 752,427 | | | | 51,495,487 | | | | — | | | | — | | | | — | | | | — | | | | 52,247,914 | |
Intangible assets other than goodwill | | | 202,601,955 | | | | 119,575 | | | | 6,246,077 | | | | 168,670,499 | | | | 3,607,455 | | | | 19,296,619 | | | | 400,542,180 | |
Goodwill | | | 1,444,501,573 | | | | 35,813,194 | | | | 4,436,254 | | | | 138,159,463 | | | | 59,438,079 | | | | — | | | | 1,682,348,563 | |
Property, plant and equipment | | | 2,048,467,430 | | | | 356,180,482 | | | | 309,921,733 | | | | 261,250,882 | | | | 3,600,107 | | | | 30,307,822 | | | | 3,009,728,456 | |
Investment property | | | — | | | | 1,663,592,396 | | | | — | | | | — | | | | — | | | | — | | | | 1,663,592,396 | |
Income tax assets, non-current | | | — | | | | — | | | | — | | | | — | | | | — | | | | 43,047,543 | | | | 43,047,543 | |
Deferred income tax assets | | | — | | | | — | | | | — | | | | | | | | — | | | | 491,398,181 | | | | 491,398,181 | |
| | | | | | | | | | | | | | | | | | | | | | | | | | | | |
| | | | | | | |
Total non-current assets | | | 3,716,478,323 | | | | 2,107,201,134 | | | | 320,604,064 | | | | 568,080,844 | | | | 79,848,342 | | | | 921,822,896 | | | | 7,714,035,603 | |
| | | | | | | | | | | | | | | | | | | | | | | | | | | | |
| | | | | | | |
Total Assets | | | 4,897,859,009 | | | | 2,151,140,618 | | | | 633,859,874 | | | | 801,366,678 | | | | 1,203,919,141 | | | | 1,028,357,909 | | | | 10,716,503,229 | |
F-194
| | | | | | | | | | | | | | | | | | | | | | | | | | | | |
| | | Supermarkets | | | Shopping
Centers | | | Home
improvement | | | Department
stores | | | Financial
services | | | Support services,
financing,
adjustments
and other | | | Consolidated
total | |
At December 31, 2013 | | ThCh$ | | | ThCh$ | | | ThCh$ | | | ThCh$ | | | ThCh$ | | | ThCh$ | | | ThCh$ | |
Current Assets | | | | | | | | | | | | | | | | | | | | | | | | | | | | |
Cash and cash equivalent | | | 127,987,761 | | | | 4,134,789 | | | | 8,371,625 | | | | 13,356,724 | | | | 16,426,776 | | | | 1,433,950 | | | | 171,711,625 | |
Other financial assets, current | | | — | | | | — | | | | — | | | | — | | | | — | | | | 49,583,940 | | | | 49,583,940 | |
Other non-financial assets, current | | | 7,138,420 | | | | 665,031 | | | | 2,067,224 | | | | 400,880 | | | | 400,137 | | | | 933,801 | | | | 11,605,493 | |
Trade receivables and other receivables, current | | | 331,091,832 | | | | 26,414,689 | | | | 65,976,199 | | | | 35,509,197 | | | | 660,782,211 | | | | 9,673,425 | | | | 1,133,447,553 | |
Trade receivables due from related parties, current | | | — | | | | 432,303 | | | | — | | | | — | | | | — | | | | — | | | | 432,303 | |
Inventory, current | | | 656,307,740 | | | | — | | | | 208,372,176 | | | | 180,226,711 | | | | — | | | | — | | | | 1,044,906,627 | |
Income tax receivable, current | | | 746,015 | | | | 2,738,250 | | | | 1,436,634 | | | | 2,344,763 | | | | 822,592 | | | | 5,443,082 | | | | 13,531,336 | |
| | | | | | | | | | | | | | | | | | | | | | | | | | | | |
Total current assets | | | 1,123,271,768 | | | | 34,385,062 | | | | 286,223,858 | | | | 235,838,275 | | | | 678,431,716 | | | | 67,068,198 | | | | 2,425,218,877 | |
| | | | | | | |
Non-Current Assets | | | | | | | | | | | | | | | | | | | | | | | | | | | | |
Other financial assets, non-current | | | — | | | | — | | | | — | | | | — | | | | — | | | | 92,405,358 | | | | 92,405,358 | |
Other non-financial assets, non-current | | | — | | | | — | | | | — | | | | — | | | | — | | | | 38,263,337 | | | | 38,263,337 | |
Trade receivables and other receivables, non-current | | | 13,923,011 | | | | — | | | | — | | | | — | | | | 139,992,578 | | | | 1,924,223 | | | | 155,839,812 | |
Equity method investments | | | 1,052,894 | | | | 48,889,260 | | | | — | | | | — | | | | — | | | | — | | | | 49,942,154 | |
Intangible assets other than goodwill | | | 196,641,232 | | | | 1,897 | | | | 1,190,519 | | | | 144,038,458 | | | | 210,865,748 | | | | 18,883,653 | | | | 571,621,507 | |
Goodwill | | | 1.450,127,901 | | | | 38,686,390 | | | | 4,873,805 | | | | 138,159,463 | | | | 64,193,125 | | | | | | | | 1,696,040,684 | |
Property, plant and equipment | | | 2,342,823,658 | | | | 160,353,883 | | | | 332,811,904 | | | | 252,986,187 | | | | 6,145,009 | | | | 6,763,227 | | | | 3,101,883,868 | |
Investment property | | | — | | | | 1,568,432,058 | | | | — | | | | — | | | | — | | | | — | | | | 1,568,432,058 | |
Income tax assets, non-current | | | — | | | | — | | | | — | | | | — | | | | — | | | | 53,727,039 | | | | 53,727,039 | |
Deferred income tax assets | | | — | | | | — | | | | — | | | | — | | | | — | | | | 311,859,519 | | | | 311,859,519 | |
| | | | | | | | | | | | | | | | | | | | | | | | | | | | |
| | | | | | | |
Total non-current assets | | | 4,004,568,696 | | | | 1,816,363,488 | | | | 338,876,228 | | | | 535,184,108 | | | | 421,196,460 | | | | 523,826,356 | | | | 7,640,015,336 | |
| | | | | | | | | | | | | | | | | | | | | | | | | | | | |
Total Assets | | | 5,127,840,464 | | | | 1,850,748,550 | | | | 625,100,086 | | | | 771,022,383 | | | | 1,099,628,176 | | | | 590,894,554 | | | | 10,065,234,213 | |
F-195
| 28.5 | Current Asset and liabilities by segment |
| | | | | | | | | | | | | | | | | | | | | | | | | | | | |
Regional information by segment Current assets
and liabilities at December 31, 2014 | | Supermarkets
ThCh$ | | | Shopping
Center
ThCh$ | | | Home
Improvement
ThCh$ | | | Department
Stores ThCh$ | | | Financial
Services
(Insurance +
cards + bank)
ThCh$ | | | Support
Services,
Financing, and
Other Settings
ThCh$ | | | Total
Consolidated
ThCh$ | |
Trade accounts payable and other payables | | | 1,338,355,251 | | | | 48,485,417 | | | | 249,240,761 | | | | 223,566,217 | | | | 85,351,453 | | | | 38,087,010 | | | | 1,983,086,109 | |
| | | | | | | |
Regional information by segment Current assets
and liabilities at December 31, 2013 | | Supermarkets
ThCh$ | | | Shopping
Center
ThCh$ | | | Home
Improvement
ThCh$ | | | Department
Stores ThCh$ | | | Financial
Services
(Insurance +
cards + bank)
ThCh$ | | | Support
Services,
Financing, and
Other Settings
ThCh$ | | | Total
Consolidated
ThCh$ | |
Trade accounts payable and other payables | | | 1,358,568,357 | | | | 45,068,829 | | | | 247,192,916 | | | | 215,322,018 | | | | 70,380,105 | | | | 21,460,993 | | | | 1,957,993,218 | |
| 28.6 | Information by country, assets and liabilities |
In thousands of Chilean pesos:
Assets and liabilities by country
| | | | | | | | | | | | | | | | | | | | | | | | |
| | | Chile | | | Argentina | | | Brazil | | | Peru | | | Colombia | | | Consolidated
total | |
At December 31, 2014 | | ThCh$ | | | ThCh$ | | | ThCh$ | | | ThCh$ | | | ThCh$ | | | ThCh$ | |
Total assets | | | 4,950,428,641 | | | | 1,335,607,168 | | | | 1,554,510,379 | | | | 1,180,226,630 | | | | 1,695,730,411 | | | | 10,716,503,229 | |
Total liabilities | | | 3,891,354,582 | | | | 756,061,392 | | | | 774,639,936 | | | | 459,527,050 | | | | 543,434,458 | | | | 6,425,017,418 | |
Net investment | | | 1,059,074,059 | | | | 579,545,776 | | | | 779,870,443 | | | | 720,699,580 | | | | 1,152,295,953 | | | | 4,291,485,811 | |
Percentage of equity | | | 24.7 | | | | 13.5 | | | | 18.2 | | | | 16.8 | | | | 26.9 | | | | 100.00 | |
| | | | | | |
At December 31, 2013 | | | | | | | | | | | | | | | | | | |
Total assets | | | 4,594,880,919 | | | | 1,234,539,186 | | | | 1,483,616,643 | | | | 1,008,012,702 | | | | 1,744,184,763 | | | | 10,065,234,213 | |
| | | | | | |
Total liabilities | | | 3,609,794,420 | | | | 696,788,617 | | | | 658,786,450 | | | | 394,025,753 | | | | 444,471,884 | | | | 5,803,867,124 | |
Net investment | | | 985,086,499 | | | | 537,750,569 | | | | 824,830,193 | | | | 613,986,949 | | | | 1,299,712,879 | | | | 4,261,367,089 | |
Percentage of equity | | | 23.1 | | | | 12.6 | | | | 19.4 | | | | 14.4 | | | | 30.5 | | | | 100.00 | |
F-196
| 28.7 | Regional information, including intersegments is as follows: |
| | | | | | | | | | | | |
| | | For the year ended December 31, 2014 | |
Regional information, by segment | | Total segment
revenue | | | Intersegment
revenue | | | Revenue from
external customer | |
| | | ThCh$ | | | ThCh$ | | | ThCh$ | |
Supermarkets | | | 8,159,236,907 | | | | — | | | | 8,159,236,907 | |
Shopping | | | 354,270,879 | | | | 139,421,198 | | | | 214,849,681 | |
Home Improvement | | | 1,232,202,692 | | | | 6,586,633 | | | | 1,225,616,059 | |
Department stores | | | 991,442,445 | | | | — | | | | 991,442,445 | |
Financial Services | | | 319,504,889 | | | | — | | | | 319,504,889 | |
Financial Services (discontinued operations) | | | (201,825,995 | ) | | | — | | | | (201,825,995 | ) |
Others | | | 2,205,260 | | | | — | | | | 2,205,260 | |
| | | | | | | | | | | | |
| | | |
TOTAL | | | 10,857,037,077 | | | | 146,007,831 | | | | 10,711,029,246 | |
| | | | | | | | | | | | |
| |
| | | For the year ended December 31, 2013 | |
Regional information, by segment | | Total segment
revenue | | | Intersegment
revenue | | | Revenue from
external customer | |
| | | ThCh$ | | | ThCh$ | | | ThCh$ | |
Supermarkets | | | 7,682,064,417 | | | | — | | | | 7,682,064,417 | |
Shopping | | | 321,500,128 | | | | 116,168,371 | | | | 205,331,757 | |
Home Improvement | | | 1,187,795,422 | | | | 10,905,546 | | | | 1,176,889,876 | |
Department stores | | | 970,359,682 | | | | — | | | | 970,359,682 | |
Financial Services | | | 288,532,801 | | | | — | | | | 288,532,801 | |
Financial Services (discontinued operations) | | | (206,881,617 | ) | | | | | | | (206,881,617 | ) |
Others | | | 17,861,294 | | | | — | | | | 17,861,294 | |
| | | | | | | | | | | | |
| | | |
TOTAL | | | 10,261,232,127 | | | | 127,073,917 | | | | 10,134,158,210 | |
| | | | | | | | | | | | |
| |
| | | For the year ended December 31, 2012 | |
Regional information, by segment | | Total segment
revenue | | | Intersegment
revenue | | | Revenue from
external customer | |
| | | ThCh$ | | | ThCh$ | | | ThCh$ | |
Supermarkets | | | 6,733,610,368 | | | | — | | | | 6,733,610,368 | |
Shopping | | | 274,386,329 | | | | 102,282,693 | | | | 172,103,636 | |
Home Improvement | | | 1,071,180,346 | | | | 8,094,100 | | | | 1,063,086,246 | |
Department stores | | | 886,074,835 | | | | — | | | | 886,074,835 | |
Financial Services | | | 282,180,198 | | | | — | | | | 282,180,198 | |
Financial Services (discontinued operations) | | | (223,726,231 | ) | | | | | | | (223,726,231 | ) |
Others | | | 12,021,824 | | | | — | | | | 12,021,824 | |
| | | | | | | | | | | | |
TOTAL | | | 9,035,727,669 | | | | 110,376,793 | | | | 8,925,350,876 | |
| | | | | | | | | | | | |
F-197
| 28.8 | Non-current assets by country |
| | | | | | | | | | | | | | | | | | | | | | | | |
At December 31, 2014 | | Chile | | | Argentina | | | Brazil | | | Peru | | | Colombia | | | Consolidated
total | |
| | | ThCh$ | | | ThCh$ | | | ThCh$ | | | ThCh$ | | | ThCh$ | | | ThCh$ | |
Other non-financial assets | | | 25,929,866 | | | | 6,211,511 | | | | — | | | | 1,725,040 | | | | 7,000 | | | | 33,873,417 | |
Trade receivables and other receivables | | | 11,092,704 | | | | 3,760,685 | | | | 19,923,966 | | | | — | | | | — | | | | 34,777,355 | |
Equity Method investments | | | 51,495,487 | | | | — | | | | — | | | | 752,427 | | | | — | | | | 52,247,914 | |
Intangible assets other than goodwill | | | 191,711,948 | | | | 14,880,200 | | | | 75,035,961 | | | | 107,805,013 | | | | 11,109,058 | | | | 400,542,180 | |
Goodwill | | | 246,378,878 | | | | 3,359,143 | | | | 569,584,936 | | | | 268,644,820 | | | | 594,380,786 | | | | 1,682,348,563 | |
Property Plant and Equipment | | | 1,190,341,063 | | | | 336,413,924 | | | | 404,896,191 | | | | 369,333,777 | | | | 708,743,501 | | | | 3,009,728,456 | |
Investment Property | | | 1,268,128,765 | | | | 205,318,919 | | | | — | | | | 160,257,212 | | | | 29,887,500 | | | | 1,663,592,396 | |
Income tax assets, non-current | | | 42,190,641 | | | | 856,902 | | | | — | | | | — | | | | — | | | | 43,047,543 | |
| | | | | | | | | | | | | | | | | | | | | | | | |
Non-current assets—Total | | | 3,027,269,352 | | | | 570,801,284 | | | | 1,069,441,054 | | | | 908,518,289 | | | | 1,344,127,845 | | | | 6,920,157,824 | |
| | | | | | | | | | | | | | | | | | | | | | | | |
| | | | | | |
| | | Chile | | | Argentina | | | Brazil | | | Peru | | | Colombia | | | Consolidated
total | |
At December 31, 2013 | | ThCh$ | | | ThCh$ | | | ThCh$ | | | ThCh$ | | | ThCh$ | | | ThCh$ | |
Other non-financial assets | | | 30,922,885 | | | | 5,928,669 | | | | — | | | | 1,404,223 | | | | 7,560 | | | | 38,263,337 | |
Trade receivables and other receivables | | | 128,147,510 | | | | 13,997,371 | | | | 13,694,931 | | | | — | | | | — | | | | 155,839,812 | |
Equity Method investments | | | 48,889,260 | | | | 192,079 | | | | — | | | | 860,815 | | | | — | | | | 49,942,154 | |
Intangible assets other than goodwill | | | 372,172,379 | | | | 10,830,938 | | | | 74,926,954 | | | | 100,080,155 | | | | 13,611,081 | | | | 571,621,507 | |
Goodwill | | | 246,271,648 | | | | 3,816,863 | | | | 555,816,040 | | | | 248,204,885 | | | | 641,931,248 | | | | 1,696,040,684 | |
Property Plant and Equipment | | | 1,216,059,698 | | | | 377,125,449 | | | | 389,333,433 | | | | 330,734,647 | | | | 788,630,641 | | | | 3,101,883,868 | |
Investment Property | | | 1,204,788,484 | | | | 198,805,718 | | | | — | | | | 134,354,573 | | | | 30,483,283 | | | | 1,568,432,058 | |
Income tax assets, non-current | | | 42,963,654 | | | | 756,141 | | | | — | | | | — | | | | 10,007,244 | | | | 53,727,039 | |
| | | | | | | | | | | | | | | | | | | | | | | | |
| | | | | | |
Non-current assets—Total | | | 3,290,215,518 | | | | 611,453,228 | | | | 1,033,771,358 | | | | 815,639,298 | | | | 1,484,671,057 | | | | 7,235,750,459 | |
| | | | | | | | | | | | | | | | | | | | | | | | |
The amounts for non-current assets by country shown in this note exclude other non-current financial assets, deferred tax assets as per IFRS 8.
F-198
| 28.9 | Consolidated Cash Flow by segment: |
| | | | | | | | | | | | | | | | | | | | | | | | | | | | | | | | |
Regional information by segment
Consolidated Segment Flows at
December 31, 2014 | | Supermarkets | | | Shopping
Center | | | Home
Improvement | | | Department
Stores | | | Financial
Services
(Insurance +
cards +
bank) | | | Support
Services,
Financing,
and Other
Settings | | | Total
Consolidated | | | Discontinued Operation
financial
services ThCh$ | |
| | ThCh$ | | | ThCh$ | | | ThCh$ | | | ThCh$ | | | ThCh$ | | | ThCh$ | | | ThCh$ | | |
Net cash flows from (used in) operating activities | | | 352,955,364 | | | | 124,889,629 | | | | (7,609,958 | ) | | | 31,120,679 | | | | 47,141,959 | | | | (158,258,909 | ) | | | 390,238,764 | | | | 14,583,058 | |
Net cash flows from (used in) investing activities | | | (154,641,311 | ) | | | (33,155,410 | ) | | | (22,292,309 | ) | | | (15,108,427 | ) | | | 1,743,516 | | | | (9,942,326 | ) | | | (233,396,267 | ) | | | 1,996,104 | |
Net cash flows from (used in) financing activities | | | (177,846,105 | ) | | | (89,306,076 | ) | | | 33,326,282 | | | | (2,623,869 | ) | | | (47,718,370 | ) | | | 171,789,652 | | | | (112,378,486 | ) | | | (80,580,490 | ) |
| | | | | | | | |
Regional information by segment
Consolidated Segment Flows at
December 31, 2013 | | Supermarkets | | | Shopping
Center | | | Home
Improvement | | | Department
Stores | | | Financial
Services
(Insurance +
cards +
bank) | | | Support
Services,
Financing,
and Other
Settings | | | Total
Consolidated | | | Discontinued operation
financial
services ThCh$ | |
| | ThCh$ | | | ThCh$ | | | ThCh$ | | | ThCh$ | | | ThCh$ | | | ThCh$ | | | ThCh$ | | |
Net cash flows from (used in) operating activities | | | 297,980,105 | | | | 116,800,693 | | | | (11,153,014 | ) | | | 23,490,373 | | | | 61,466,198 | | | | (123,802,312 | ) | | | 364,782,043 | | | | 62,716,526 | |
Net cash flows from (used in) investing activities | | | (250,966,957 | ) | | | (56,305,223 | ) | | | (27,988,274 | ) | | | (14,195,064 | ) | | | (11,226,681 | ) | | | 40,174,729 | | | | (320,507,470 | ) | | | (11,140,591 | ) |
Net cash flows from (used in) financing activities | | | (78,033,044 | ) | | | (63,007,924 | ) | | | 34,736,268 | | | | (24,550,736 | ) | | | (59,941,493 | ) | | | 83,767,553 | | | | (107,029,376 | ) | | | 8,888,132 | |
F-199
| | | | | | | | | | | | | | | | | | | | | | | | | | | | | | | | |
Regional information by segment
Consolidated Segment Flows at
December 31, 2012 | | Supermarkets | | | Shopping
Center | | | Home
Improvement | | | Department
Stores | | | Financial
Services
(Insurance +
cards +
bank) | | | Support
Services,
Financing,
and Other
Settings | | | Total
Consolidated | | | Discontinued operation financial services ThCh$ | |
| | ThCh$ | | | ThCh$ | | | ThCh$ | | | ThCh$ | | | ThCh$ | | | ThCh$ | | | ThCh$ | | |
Net cash flows from (used in) operating activities | | | 511,615,028 | | | | 138,682,474 | | | | 59,899,058 | | | | 37,800,248 | | | | 60,778,455 | | | | (90,060,644 | ) | | | 718,714,619 | | | | 50,441,523 | |
Net cash flows from (used in) investing activities | | | (1,597,987,512 | ) | | | (169,430,593 | ) | | | (30,630,553 | ) | | | (35,053,881 | ) | | | 2,525,737 | | | | (42,990,865 | ) | | | (1,873,567,667 | ) | | | 2,523,768 | |
Net cash flows from (used in) financing activities | | | 1,144,256,989 | | | | 35,772,502 | | | | (21,716,322 | ) | | | 11,406,894 | | | | (56,969,377 | ) | | | 133,326,730 | | | | 1,246,077,416 | | | | (9,349,273 | ) |
F-200
| 28.10 | Additions to non-current assets: |
| | | | | | | | | | | | | | | | | | | | | | | | | | | | | | |
As of December 31, 2014 | | | | | Supermarkets | | | Shopping
Center | | | Home
Improvement | | | Department
Stores | | | Financial
Services
(Insurance +
cards +
bank) | | | Support
Services,
Financing,
and Other
Settings | | Total
Consolidated | |
| | | ThCh$ | | | ThCh$ | | | ThCh$ | | | ThCh$ | | | ThCh$ | | | ThCh$ | | | ThCh$ | |
Property plant and equipment | | | 112,859,466 | | | | 18,802,562 | | | | 12,941,331 | | | | 22,010,115 | | | | 660,035 | | | | 16,420,023 | | | | | | 183,693,532 | |
| | | | | | | | |
Intangible asset, other that goodwill | | | 13,062,984 | | | | 36,232 | | | | 664,554 | | | | 371,636 | | | | 1,370,169 | | | | 4,203,510 | | | | | | 19,709,085 | |
| | | | | | | | |
Goodwill | | | — | | | | — | | | | — | | | | — | | | | — | | | | — | | | | | | — | |
| | | | | | | | |
Investment properties | | | — | | | | 25,060,310 | | | | — | | | | — | | | | — | | | | — | | | | | | 25.060,310 | |
| | | | | | | | |
Total additions | | | 125,922,450 | | | | 43,899,104 | | | | 13,605,885 | | | | 22,381,751 | | | | 2,030,204 | | | | 20,623,533 | | | | | | 228,462,927 | |
| | | | | | | | | | | | | | | | | | | | | | | | | | | | |
As of December 31, 2013 | | Supermarkets | | | Shopping
Center | | | Home
Improvement | | | Department
Stores | | | Financial
Services
(Insurance +
cards +
bank) | | | Support
Services,
Financing,
and Other
Settings | | | Total
Consolidated | |
| | | ThCh$ | | | ThCh$ | | | ThCh$ | | | ThCh$ | | | ThCh$ | | | ThCh$ | | | ThCh$ | |
Property plant and equipment | | | 185,955,442 | | | | 13,119,685 | | | | 15,953,772 | | | | 21,905,020 | | | | 726,912 | | | | 6,924,556 | | | | 244,585,387 | |
| | | | | | | |
Property plant and equipment, acquired through a business combination | | | | | | | | | | | | | | | | | | | | | | | | | | | | |
| | | | | | | |
Intangible asset, other that goodwill | | | 16,598,139 | | | | 17,128 | | | | 968,004 | | | | 1,923,291 | | | | 3,057,342 | | | | 14,031,338 | | | | 36,595,242 | |
| | | | | | | |
Intangible asset, other that goodwill, acquired through a business combination | | | | | | | | | | | | | | | | | | | | | | | | | | | | |
| | | | | | | |
Goodwill | | | | | | | | | | | | | | | | | | | | | | | | | | | | |
| | | | | | | |
Investment properties | | | — | | | | 37,900,602 | | | | — | | | | — | | | | — | | | | — | | | | 37,900,602 | |
| | | | | | | |
Total additions | | | 202,553,581 | | | | 51,037,415 | | | | 16,921,776 | | | | 23,828,311 | | | | 3,784,254 | | | | 20,955,894 | | | | 319,081,231 | |
F-201
| 28.11 | Bank statements Paris: |
Below is classified financial information of Banco Paris, used in the consolidation of Cencosud SA at December 31, 2014 and December 31, 2013.
| | | | | | | | |
| | | As of December 31, | |
Assets | | 2014 | | | 2013 | |
| | | ThCh$ | | | ThCh$ | |
| | |
Current assets | | | | | | | | |
Cash and cash equivalents | | | 16,005,243 | | | | 15,352,349 | |
Other financial assets, current | | | 9,990,759 | | | | 8,785,942 | |
Trade receivables and other receivables | | | 106,543,456 | | | | 129,922,520 | |
Current tax assets | | | 1,664,830 | | | | 460,086 | |
| | | | | | | | |
| | |
Total current assets | | | 134,204,288 | | | | 154,520,897 | |
| | | | | | | | |
| | |
Non-current assets | | | | | | | | |
Trade receivable and other receivables, non-current | | | 100,530,025 | | | | 102,904,388 | |
Receivables from related entities | | | 396,861 | | | | 38,010 | |
Equity method investment | | | 11,658 | | | | 11,707 | |
Intangible assets other than goodwill | | | 3,205,105 | | | | 3,175,651 | |
Property, plant and equipment | | | 695,289 | | | | 1,284,878 | |
Deferred income tax assets | | | 5,777,461 | | | | 2,451,102 | |
| | | | | | | | |
| | |
Total non-current assets | | | 110,616,399 | | | | 109,865,736 | |
| | | | | | | | |
| | |
Total assets | | | 244,820,687 | | | | 264,386,633 | |
| | | | | | | | |
F-202
Below is classified financial information of Banco Paris, used in the consolidation of Cencosud SA at December 31, 2014 and December 31, 2013.
| | | | | | | | |
| | | As of December 31, | |
Net equity and liabilities | | 2013 | | | 2013 | |
| | | ThCh$ | | | ThCh$ | |
| | |
Current liabilities | | | | | | | | |
Other financial liabilities, current | | | 134,403,164 | | | | 152,017,643 | |
Trade payables and other payables | | | 8,659,514 | | | | 9,367,366 | |
Current income tax liabilities | | | 2,040,819 | | | | 543,641 | |
Current provision for employee benefits | | | 402,241 | | | | 539,068 | |
Total current liabilities | | | 145,505,738 | | | | 162,467,718 | |
| | | | | | | | |
| | |
Non-current liabilities | | | | | | | | |
Other financial liabilities, | | | 49,183,735 | | | | 58,435,417 | |
Trade accounts payables | | | 3,759,019 | | | | 1,334,706 | |
Deferred income tax liabilities | | | 1,408,928 | | | | 1,292,601 | |
| | | | | | | | |
| | |
Total non-current liabilities | | | 54,351,682 | | | | 61,062,724 | |
| | | | | | | | |
| | |
Total liabilities | | | 199,857,420 | | | | 223,530,442 | |
| | | | | | | | |
| | |
Net equity | | | | | | | | |
Paid-in capital | | | 39,579,421 | | | | 39,579,421 | |
Retained earnings (accumulated losses) | | | 3,543,402 | | | | 5,398,170 | |
Other reserves | | | 1,840,444 | | | | (4,121,400 | ) |
| | | | | | | | |
| | |
Net equity attributable to controlling shareholders | | | 44,963,267 | | | | 40,856,191 | |
Non-controlling interest | | | — | | | | — | |
| | | | | | | | |
| | |
Total net equity | | | 44,963,267 | | | | 40,856,191 | |
| | | | | | | | |
| | |
Total net equity and liabilities | | | 244,820,687 | | | | 264,386,633 | |
| | | | | | | | |
Below is classified financial information of Banco Paris, used in the consolidation of Cencosud SA at December 31, 2014 and December 31, 2013.
| | | | | | | | |
| | | For the year ended
December 31, | |
Statement of integral income | | 2014
ThCh$ | | | 2013
ThCh$ | |
Revenues from ordinary activities | | | 52,029,906 | | | | 48,375,633 | |
Cost of Sales | | | (9,416,113 | ) | | | (458,483 | ) |
| | | | | | | | |
Gross Margin | | | 42,613,793 | | | | 47,917,150 | |
Administrative expenses | | | (26,635,118 | ) | | | (28,108,339 | ) |
Financial income | | | 314,723 | | | | 144,562 | |
Financial expenses | | | (12,431,878 | ) | | | (13,389,526 | ) |
| | | (1,686 | ) | | | (5,301 | ) |
Exchange differences | | | 10,260 | | | | (594 | ) |
| | | | | | | | |
Profit before tax | | | 3,870,094 | | | | 6,557,952 | |
Income tax charge | | | (326,692 | ) | | | (1,159,782 | ) |
| | | | | | | | |
Profit from ongoing operations | | | 3,543,402 | | | | 5,398,170 | |
| | | | | | | | |
Net income | | | 3,543,402 | | | | 5,398,170 | |
| | | | | | | | |
F-203
| 29 | Restrictions, contingencies, legal proceedings and other matters |
| • | | The subsidiaries of Cencosud S.A. in Chile are involved in lawsuits and litigation that are pending as of year-end. The amounts of these claims are covered by a civil liability insurance policy. |
| • | | A civil lawsuit was filed against the indirectly controlled affiliate GBarbosa Comercial (Brazil) by the Public Employees Union in supermarkets in the State of Sergipe, which is awaiting the first instance ruling. The union is seeking compensation for overtime hours for all employees of the subsidiary for the period after May 2007. The petition was filed and supported by the ruling, albeit still not judicial, that was issued through another public civil claim, which annulled a bank of hours from May 2007 to April 2009. |
Based on the opinion of a legal advisor, we cannot estimate the value of the case given the complexity of the calculations related to the process, as well as the absence of sufficient evidence in the file in order to quantify.
The controlled indirect of Cencosud Colombia S.A., are involved in lawsuits and litigation that are pending as of year-end. The amounts of these claims are covered by a civil liability insurance policy. The contingencies and legal proceedings disclosed above are deemed to be of a possible outcome.
The Company leases installations, land, equipment and other assets under operating lease agreements.
The agreements have diverse durations and expiration periods, renewal rights and indexation clauses, which are mainly related to the inflation rate in the countries where the contracts are held.
The Minimum Future Payments of leases, as a Lessee as of December 31, 2014 and 2013 are detailed below:
| | | | | | | | |
| | | As of December 31, | |
| | | 2014 | | | 2013 | |
| | | ThCh$ | | | ThCh$ | |
Up to one year | | | 154,892,848 | | | | 132,974,984 | |
Between two and up to five years | | | 574,808,033 | | | | 492,226,414 | |
Over five years | | | 1,439,759,315 | | | | 1,328,213,321 | |
| | | | | | | | |
| | |
Total | | | 2,169,460,196 | | | | 1,953,414,719 | |
| | | | | | | | |
Lease payments and subleases recognized in the statement of income:
| | | | | | | | |
| �� | | As of December 31, | |
| | | 2014 | | | 2013 | |
| | | ThCh$ | | | ThCh$ | |
Minimum payments from operational leases | | | 176,168,561 | | | | 155,286,694 | |
Contingent leases from operational leases | | | 31,252,963 | | | | 13,514,956 | |
| | | | | | | | |
| | |
Total | | | 207,421,524 | | | | 168,801,650 | |
| | | | | | | | |
F-204
The Minimum Future payments of leases, as a Lessor as of December 31, 2014 and 2013 are detailed below:
| | | | | | | | |
| | | As of December 31, | |
| | | 2014 | | | 2013 | |
| | | ThCh$ | | | ThCh$ | |
Up to one year | | | 151,493,592 | | | | 132,839,245 | |
Between two and five years | | | 320,728,865 | | | | 326,247,569 | |
Over five years | | | 103,388,470 | | | | 95,137,675 | |
| | | | | | | | |
| | |
Total | | | 575,610,927 | | | | 554,224,489 | |
| | | | | | | | |
The contingent income recognized in the statement of income amounts to ThCh$ 28.208.503 (ThCh$ 27.642.623 as of December 31, 2013).
The Company has no individually significant operating leases, nor are there restrictions on the distribution of dividends or on incurring other leasing contracts or debt. All the contracts are at market values.
In Other property, plant and equipment are assets acquired under finance leases.
| | | | | | | | |
| | | Balance as of, | |
Property, plant and equipment, net | | 31/12/2014
ThCh$ | | | 31/12/2013
ThCh$ | |
Land | | | 8,044,818 | | | | 8,026,326 | |
Buildings | | | 13,349,228 | | | | 18,188,677 | |
Information technology equipment | | | 1,564,895 | | | | 10,716,244 | |
fixed installations and accessories | | | | | | | — | |
Equipment | | | 48,973 | | | | 151,656 | |
Vehicles | | | 102,481 | | | | 394,144 | |
| | | | | | | | |
| | |
Total | | | 23,110,395 | | | | 37,477,047 | |
| | | | | | | | |
The values of the future payments under these leases are as follows:
| | | | | | | | | | | | |
| | | 31/12/2014 | |
Reconciliation of minimum lease payments | | Present Value
ThCh$ | | | Interest
ThCh$ | | | Gross
ThCh$ | |
Less than one year | | | 2,671,208 | | | | 515,992 | | | | 3,187,200 | |
Between one and five years | | | 10,191,876 | | | | (914,790 | ) | | | 9,277,086 | |
More than five years | | | 18,366,339 | | | | 3,369,100 | | | | 21,735,439 | |
| | | | | | | | | | | | |
| | | |
Total | | | 31,229,423 | | | | 2,970,302 | | | | 34,199,725 | |
| | | | | | | | | | | | |
F-205
| | | | | | | | | | | | |
| | | 31/12/2013 | |
Reconciliation of minimum lease payments | | Present Value
ThCh$ | | | Interest
ThCh$ | | | Gross
ThCh$ | |
Less than one year | | | 4,808,673 | | | | 601,673 | | | | 5,410,346 | |
Between one and five years | | | 10,357,480 | | | | 2,417,808 | | | | 12,775,288 | |
More than five years | | | 17,421,599 | | | | 1,566,124 | | | | 18,987,723 | |
| | | | | | | | | | | | |
| | | |
Total | | | 32,587,752 | | | | 4,585,605 | | | | 37,173,357 | |
| | | | | | | | | | | | |
| 31 | Guarantees with third parties |
The detail of the guarantees obtained is the following:
| 31.1 | Guarantees received by project. |
The amounts detailed below are related to off statements of financial position arrangement.
| | | | | | | | |
| | | As of December 31, | |
Grantor of the guarantee | | 2014 | | | 2013 | |
| | | ThCh$ | | | ThCh$ | |
Constructora INALCO S.A. | | | | | | | 378,304 | |
Inoxcentro Comercial SA | | | 10,173 | | | | | |
Polex Chile SA | | | 4,489 | | | | | |
Salfa Construcción S.A. | | | | | | | 422,382 | |
Ascensores OTIS Chile Ltda. | | | | | | | — | |
Constructora Cruzat S.A. | | | | | | | — | |
Traancura Ing. Constr. Ltda. | | | | | | | — | |
Constructora Cuevas y Purcell S.A. | | | | | | | 335,449 | |
Inmobiliaria y Constructora Class Ltda. | | | | | | | 48,868 | |
Empresa Constructora D L P Ltda. | | | | | | | 58,024 | |
Other Guarantees obtained for work completion | | | | | | | 7,337 | |
| | | | | | | | |
| | |
Total guarantees obtained for work completion | | | 14,662 | | | | 1,250,364 | |
Guarantees received for store leases | | | 8,252,727 | | | | 8,403,703 | |
| | | | | | | | |
| | |
Total guarantees obtained | | | 8,267,389 | | | | 9,654,067 | |
| | | | | | | | |
| | | | | | | | | | | | | | | | |
| | | Debtor | | | | Committed Assets | |
Guarantee creditor | | Name | | Relation | | Guarantee
type | | Type | | Book value
2014 | | | Book value
2013 | |
| | | | | | | | | | | ThCh$ | | | ThCh$ | |
Other | | Cencosud S.A Argentina | | Subsidiary | | Mortgage | | Property, plant and
equipment | | | 4,154,567 | | | | 3,186,327 | |
| | | | | | | | | | | | | | | | |
| | | | | | |
Total property, plant and equipment | | | | | | | | | | | 4,154,567 | | | | 3,186,327 | |
| | | | | | | | | | | | | | | | |
F-206
31.3 Debt Balance from Direct Guarantees
| | | | | | | | | | | | | | | | | | | | |
| | | Debtor | | | | | | | | | | |
Guarantee creditor | | Name | | | Relation | | | Guarantee
type | | | Book
value
2014 | | | Book value
2013 | |
| | | | | | | | | | | | ThCh$ | | | ThCh$ | |
Other | | | Cencosud S.A Argentina | | | | Subsidiary | | | | Mortgage | | | | 4,154,567 | | | | 3,186,327 | |
| | | | | | | | | | | | | | | | | | | | |
| | | | | |
Total property, plant and equipment | | | | | | | | | | | | | | | 4,154,567 | | | | 3,186,327 | |
| | | | | | | | | | | | | | | | | | | | |
The distribution of personnel of the Company is the following:
| | | | | | | | | | | | | | | | | | | | |
| | | As of December 31, 2014 | | | | |
Company | | Managers
and main
executives | | | Professionals
and
technicians | | | Workers
and
other | | | Total | | | Average | |
Cencosud S.A. | | | 12 | | | | 924 | | | | 216 | | | | 1,152 | | | | 1,186 | |
Subsidiaries in Chile—Argentina Brazil—Peru—Colombia | | | 337 | | | | 18,090 | | | | 133,655 | | | | 152,082 | | | | 148,769 | |
| | | | | | | | | | | | | | | | | | | | |
| | | | | |
Total | | | 349 | | | | 19,014 | | | | 133,871 | | | | 153,234 | | | | 149,955 | |
| | | | | | | | | | | | | | | | | | | | |
| | |
| | | As of December 31, 2013 | | | | |
Company | | Managers
and main
executives | | | Professionals
and
technicians | | | Workers
and
other | | | Total | | | Average | |
Cencosud S.A. | | | 15 | | | | 767 | | | | 396 | | | | 1,178 | | | | 1,170 | |
Subsidiaries in Chile—Argentina—Brazil—Peru—Colombia | | | 1,454 | | | | 12,794 | | | | 138,212 | | | | 152,460 | | | | 153,254 | |
| | | | | | | | | | | | | | | | | | | | |
| | | | | |
Total | | | 1,469 | | | | 13,561 | | | | 138,608 | | | | 153,638 | | | | 154,424 | |
| | | | | | | | | | | | | | | | | | | | |
F-207
As of December 31, 2014, the Company has a share-based compensation plan for executives of Cencosud S.A. and Affiliates. The details of the arrangements are described below:
| | | | |
Agreement | | Stock options granted to key executives | | |
| | |
Nature of the arrangement | | 2014 retention plan for executives | | 2015 retention plan for executives |
Date of grant | | September 2013 | | September 2014 |
Number of instruments granted | | 22,171,504 shares | | 10,057,500 shares |
Exercise price | | Ch$ 2,600 | | Ch$ 1,646 |
Share price at granted date | | Ch$ 2,071 | | Ch$ 1,785 |
Vesting | | 0.9; 1.9; 2.9; 3.9 years | | 1.2; 2.2; 3.1; 3.4 years |
Condition | | a) As of the grant date, the executive must have a current employment contract with the Company or any of its subsidiaries in Chile or abroad without any interruption in its employment relationship. b) From the date of signing of the stock option contract and until the exercise date, the Executive has not committed any serious breaches of its employment duties, at the Company’s sole discretion. | | a) As of the grant date, the executive must have a current employment contract with the Company or any of its subsidiaries in Chile or abroad without any interruption in its employment relationship. b) From the date of signing of the stock option contract and until the exercise date, the Executive has not committed any serious breaches of its employment duties, at the Company’s sole discretion. |
| | |
Settlement | | Shares | | Shares or other representative instrument of money payable to the view |
Data used in the options pricing model: | | | | |
Weighted average price of shares used | | Ch$ 2,071 | | Ch$ 1,785 |
Exercise price | | Ch$ 2,600 | | Ch$ 1,646 |
Expected volatility | | 23.4% | | 27.0% |
Expected term at grant day (in years) | | 0.9; 1.9; 2.9; 3.9 years | | 1.2; 2.2; 3.1; 3.4 years |
Risk free interest rate | | 5.0% | | 3,3% |
Expected dividends (dividends yield) | | 1% | | 0,9% |
Anticipated % of executives leaving the plan (at grant date) | | 10% | | 10% |
Fair value of the option at the grant date | | Ch$ 157.49 | | Ch$ 404,37 |
F-208
As of December 31, 2013, the Company has the following compensation plans for executives, which during the month of April 2013 on the rights-based compensation plan for executives options were exercised Cencosud SA and subsidiaries that held the company. Details of the plans are described below:
| | | | |
Agreement | | Stock options granted to key executives | | Stock options granted to key executives |
| | |
Nature of the arrangement | | Years of service plan | | Performance incentive |
Date of grant | | 1/1/2010 | | 1/1/2010 |
Number of instruments granted | | 8,392,143 shares | | 16,607,857 shares |
Exercise price | | Ch$ 1,750 | | Ch$ 1,750 |
Share price at granted date | | Ch$ 1,766.8 | | Ch$ 1,766.8 |
Vesting | | 3.3 | | 3.3 |
Condition | | a) As of the grant date, the executive must have a current employment contract with the Company or any of its subsidiaries in Chile or abroad without any interruption in its employment relationship. b) From the date of signing of the stock option contract and until the exercise date, the Executive has not committed any serious breaches of its employment duties, at the Company’s sole discretion. | | The investing condition requires that EBITDA for the year ended December 31, 2012 (meaning the Consolidated net income of Cencosud S.A. plus financial interest, depreciation, amortization and income taxes and excluding the variation of adjustment unit and change by revaluation of investment properties) increase 100% or more based on the EBITDA for the year ended December 31, 2009 (amounting to ThCh$ 403,210,000. EBITDA is calculated based only on the businesses that the Company has or operates as of signing date of the stock options contract and excludes any acquisition (such as purchase, merger, or other similar transaction) made by the Company. The Board has approved a change to the performance incentive plan, as is described below. |
| | |
Settlement | | Shares | | Shares |
Data used in the options pricing model: | | | | |
| | |
Weighted average price of shares used | | Ch$ 1,766.8 | | Ch$ 1,766.8 |
Exercise price | | Ch$ 1,750 | | Ch$ 1,750 |
Expected volatility | | 16.0% | | 16.0% |
Expected term at grant day (in years) | | 3.3 | | 3.3 |
Risk free interest rate | | 4.7% | | 4.7% |
Expected dividends (dividends yield) | | 0% | | 0% |
Anticipated % of executives leaving the plan (at grant date) | | 10% | | 10% |
Fair value of the option at the grant date | | Ch$ 331.87 | | Ch$ 331.87 |
F-209
| | | | | | | | |
| | | Numbers of shares | |
Stock options granted to key executives | | 2014 | | | 2013 | |
1) Outstanding as of the beginning of the period | | | 22,010,664 | | | | 18,443,792 | |
2) Granted during the period | | | 10,152,500 | | | | 26,374,148 | |
3) Forfeited during the period | | | (1,762,368 | ) | | | (875,474 | ) |
4) Exercised during the period | | | — | | | | (21,931,802 | ) |
5) Expired at the end of the period | | | (5,209,098 | ) | | | — | |
6) Outstanding at the end of the period | | | 25,191,698 | | | | 22,010,664 | |
7) Vested and expected to vest at the end of the period | | | 25,191,698 | | | | 22,010,664 | |
8) Eligible for exercise at the end of the period | | | 675 | | | | 370 | |
| | | | | | | | | | | | |
Stock options—Impact in P&L | | 2014 | | | 2013 | | | 2012 | |
| | | ThCh$ | | | ThCh$ | | | ThCh$ | |
Impact in the income statement | | | 2,822,081 | | | | 3,743,479 | | | | 2,297,559 | |
The Board has approved a change to the performance incentive plan, changing the condition of exercise in accordance with the EBITDA increase percentage actually achieved. It was also agreed to postpone the deadline for exercising the stock option plans until April 22, 2013.
Additionally, the Board delegated to its Chairman the possibility of providing additional options to the aforementioned performance incentive plan to certain key executives under the condition that they not exceed the limit of number of shares approved by the Shareholders dated April 25, 2008 for this purposes.
At the end of each reporting period, the Company revises its estimates of the number of options that can be exercised. The estimated number of options to be exercised is 25,191,698 and 22,010,664 shares at December 31, 2014 and December 31, 2013, respectively.
In relation to the 2015 Retention Plan, the outstanding options as of December 31, 2014 had a weighted-average contractual life of 1.73 years. In relation to the 2014 Retention Plan, the outstanding options as of December 31, 2014 had a weighted-average contractual life of 0,92 years.
The Company utilizes a valuation model that is based in a constant volatility assumption to value its employee share options. The fair value of each option grant has been estimated, as of the grant date, using the Black Scholes option pricing model.
| 34 | Discontinued operations |
The Company, together with its subsidiaries Cencosud Retail S.A. and Easy S.A., have entered into a framework agreement on June 20, 2014 (the “Framework Agreement”) with The Bank of Nova Scotia (“BNS”) and its wholly owned subsidiary Scotiabank Chile, to further develop, on a joint basis, the retail finance business in Chile (hereinafter, the “Business”). The Framework Agreement provides that the Business shall be operated through (i) CencosudAdministradora de Tarjetas S.A. (“CAT”), a current subsidiary of Cencosud that is in the business of issuing credit cards and (ii) CencosudAdministradora de Procesos S.A., CencosudServiciosIntegrales S.A., and CencosudCorredores de Seguros y Servicios Ltda., or other companies to be established by Cencosud for purposes of the Framework Agreement (together with CAT, hereinafter, the “Subject Companies”). As part of the agreement, Scotiabank Chile, upon regulatory approvals, will acquire fifty-one percent (51%) controlling interest of each of the Subject Companies, with Cencosud retaining the remaining forty-nine percent (49%) non-controlling interest.
Under IFRS Standard N° 5 (“IFRS 5”), “Disposal of subsidiaries, business and non-current assets”, the Subject Companies are considered as “Assets held for sale” as a result of Cencosud’s commitment to sell a controlling interest to an unrelated party under the Framework Agreement.
F-210
IFRS 5 requires that (a) assets that meet the criteria to be classified as held for sale be measured at the lower of carrying amount and fair value less costs to sell, and depreciation on such assets to cease; and (b) assets that meet the criteria to be classified as held for sale be presented separately in the statement of financial position and the results of discontinued operations, net of tax, and be presented separately in the statement of comprehensive income. Net cash flows attributable to the operating, investing and financing activities of discontinued operations are required to be disclosed either in the notes to the financial statements or on the face of the statements of cash flows. IFRS 5 requires that a company “re-present” its financial disclosure of discontinued operations for all prior periods presented in the financial statements so that the disclosures relate to all operations that have been discontinued by the end of the reporting period for the latest period presented.
As such, the Company has presented the Subject Companies as discontinued operations in this consolidated financial statements as of December 31, 2014 and has re-presented the consolidated statements of income and comprehensive income of December 31, 2013 and 2012 and of cash flows of December 31, 2013 and 2012 to retroactively present the Subject Companies as discontinued operations.
As this transaction received regulatory approval for the full implementation of the joint venture framework agreement on April 10, 2015, The term for the consummation of the transaction has been estimated by the Company to be during the first semester of 2015.
Assets and liabilities of disposal group held for sale
As of December 31 2014, the disposal group was stated at its carrying amount
| | | | |
Assets | | 12/31/2014 | |
| | | ThCh$ | |
Currents assets | | | | |
Cash and cash equivalents | | | 755,493 | |
Other financial assets, current | | | 3,427,594 | |
Other non-financial assets, current | | | 88,360 | |
Trade receivables and other receivables | | | 445,652,518 | |
Current tax assets | | | 356,247 | |
| | | | |
Total current assets | | | 450,280,212 | |
| | | | |
Non-current assets | | | | |
Other financial assets, non-current | | | — | |
Trade receivable and other receivables, non-current | | | 120,815,446 | |
Intangible assets other than goodwill | | | 207,571,741 | |
Property, plant and equipment | | | 1,816,591 | |
Non-current tax assets, | | | 484,662 | |
Deferred income tax assets | | | 12,447,924 | |
| | | | |
Total non-current assets | | | 343,136,364 | |
| | | | |
Total assets | | | 793,416,576 | |
| | | | |
F-211
| | | | |
Liabilities | | 12/31/2014 | |
| | | ThCh$ | |
Current liabilities | | | | |
Other financial liabilities, current | | | 134,403,119 | |
Trade payables and other payables | | | 28,054,214 | |
Provisions and other liabilities | | | 2,139,131 | |
Current income tax liabilities | | | 357,563 | |
Current provision for employee benefits | | | 2,232,715 | |
| | | | |
Total current liabilities | | | 167,186,742 | |
| | | | |
Non-current liabilities | | | | |
Other financial liabilities, | | | 49,183,735 | |
Deferred income tax liabilities | | | 420,955 | |
| | | | |
Total non-current liabilities | | | 49,604,690 | |
| | | | |
Total liabilities | | | 216,791,432 | |
| | | | |
F-212
| | b) | Results of discontinued operation |
The following tables present the results for the discontinued operations
| | | | | | | | | | | | |
In thousands of Chilean pesos | | 31/12/2014 | | | 31/12/2013 | | | 31/12/2012 | |
For the quarter ended Dec 31, 2012 | | ThCh$ | | | ThCh$ | | | ThCh$ | |
Revenues from ordinary activities | | | 201,825,995 | | | | 206,881,617 | | | | 223,726,231 | |
Cost of sales | | | (55,799,003 | ) | | | (59,816,671 | ) | | | (83,597,726 | ) |
| | | | | | | | | | | | |
| | | |
Gross Profit | | | 146,026,992 | | | | 147,064,946 | | | | 140,128,505 | |
| | | | | | | | | | | | |
| | | |
Other revenues by function | | | 190,554 | | | | 422,737 | | | | 99,278 | |
Sales, general and administrative expenses | | | (55,459,874 | ) | | | (60,173,810 | ) | | | (59,282,610 | ) |
Other expenses by function | | | (13,670,330 | ) | | | (30,165,944 | ) | | | (14,149,014 | ) |
Other gain (losses), net | | | 35,340 | | | | 16,000 | | | | 33,663 | |
| | | | | | | | | | | | |
Results from operating activities | | | 77,122,682 | | | | 57,163,929 | | | | 66,829,822 | |
| | | | | | | | | | | | |
Finance income | | | 259,620 | | | | (144,562 | ) | | | (120,992 | ) |
Finance expenses | | | (38,952,554 | ) | | | (34,828,823 | ) | | | (32,391,409 | ) |
Participation in profit or loss of equity method associates | | | — | | | | — | | | | (2,695 | ) |
Exchange differences | | | (19,198,679 | ) | | | (9,669,536 | ) | | | 9,372,744 | |
(Losses) from indexation | | | (4,969,932 | ) | | | (2,074,458 | ) | | | (2,377,697 | ) |
| | | | | | | | | | | | |
| | | |
Results from operating activities before income tax | | | 14,261,137 | | | | 10,446,550 | | | | 41,309,773 | |
Income Tax | | | (1,599,496 | ) | | | (2,089,310 | ) | | | (8,262,494 | ) |
| | | |
Profit from discontinued operations net of tax | | | 12,661,641 | | | | 8,357,240 | | | | 33,047,279 | |
| | | |
Depreciation and amortization | | | 2,299,772 | | | | 2,461,658 | | | | 2,509,579 | |
| | | |
Earnings per share from discontinued operations, basic | | | 4.5 | | | | 3.0 | | | | 14.2 | |
Earnings per share from discontinued operations, diluted | | | 4.5 | | | | 3.0 | | | | 14.2 | |
F-213
| b) | Cash flows from (used in) discontinued operations |
| | | | | | | | | | | | |
In thousands of Chilean pesos | | 31/12/2014 | | | 31/12/2013 | | | 31/12/2012 | |
| | | ThCh$ | | | ThCh$ | | | ThCh$ | |
Net cash from (used in) operating activities | | | 14,583,058 | | | | 62,716,526 | | | | 50.441.523 | |
Net cash from (used in) investing activities | | | 1,996,104 | | | | (11,140,591 | ) | | | 2,523,768 | |
Net cash from (used in) financing activities | | | (80,580,490 | ) | | | 8,888,132 | | | | (9,349,273 | ) |
As of December 31, 2014 and 2013, the Company has not made disbursements related to the protection of the environment, and there are no future commitments with regards to this matter.
At December 31, 2014 and December 31, 2013 the Superintendence of Securities and Insurance and other administrative authorities have not applied sanctions to the Company or its Directors
On February 12, 2015 the Company has issued and placed on international markes two series of bonds for US $1.000.000.000 (one billion dollars of the United States of America), the conformity with the regulation 144A of the Securities Act of the years 1933 of the United States of America and his correspondent Regulation S.
| a) | Bonds for total amount USD’s 650.000.000 (six hundred fifty million dollars of the United States of America) with maturity to 10 years, with a rate of interest of placement of 5,197% and rate of coupon of 5,150% (the “Bonds 2025”); and |
| b) | Bonds for total amount USD’s 350.000.000 (three hundred fifty million dollars of the United States of America) with maturity to 30 years, with a rate of interest of placement of 6,632% and rate of coupon of 6,625% (the “Bonds 2045”) |
This successful refinancing is in line with the Group’s financial strategy which is to seek to extend payment terms for our debts in order to shift focus to the operations and ultimately the leverage the Group.
On April 10, 2015, the Superintendency of Banks and Financial Institutions of Chile announced its approval of the joint venture between the Company and ScotiaBank.
Between the date of issuance of these consolidated financial statements and the filing date of this report, management is not aware of any other subsequent events that could significantly affect the consolidated financial statements.
F-214