| OMB APPROVAL |
OMB Number: 3235-0570 Expires: January 31, 2017 Estimated average burden hours per response: 20.6 |
UNITED STATES
SECURITIES AND EXCHANGE COMMISSION
Washington, D.C. 20549
SECURITIES AND EXCHANGE COMMISSION
Washington, D.C. 20549
FORM N-CSR
CERTIFIED SHAREHOLDER REPORT OF REGISTERED
MANAGEMENT INVESTMENT COMPANIES
Investment Company Act file number 811-22680
Ultimus Managers Trust
(Exact name of registrant as specified in charter)
| 225 Pictoria Drive, Suite 450 Cincinnati, Ohio | 45246 |
| (Address of principal executive offices) | (Zip code) |
Frank L. Newbauer, Esq.
Ultimus Fund Solutions, LLC 225 Pictoria Drive, Suite 450 Cincinnati, Ohio 45246
(Name and address of agent for service)
Registrant's telephone number, including area code: (513) 587-3400
Date of fiscal year end: May 31, 2014
Date of reporting period: May 31, 2014
Form N-CSR is to be used by management investment companies to file reports with the Commission not later than 10 days after the transmission to stockholders of any report that is required to be transmitted to stockholders under Rule 30e-1 under the Investment Company Act of 1940 (17 CFR 270.30e-1). The Commission may use the information provided on Form N-CSR in its regulatory, disclosure review, inspection, and policymaking roles.
A registrant is required to disclose the information specified by Form N-CSR, and the Commission will make this information public. A registrant is not required to respond to the collection of information contained in Form N-CSR unless the Form displays a currently valid Office of Management and Budget ("OMB") control number. Please direct comments concerning the accuracy of the information collection burden estimate and any suggestions for reducing the burden to Secretary, Securities and Exchange Commission, 450 Fifth Street, NW, Washington, DC 20549-0609. The OMB has reviewed this collection of information under the clearance requirements of 44 U.S.C. § 3507.
| Item 1. | Reports to Stockholders. |

APEXcm SMALL/MID CAP GROWTH FUND
(APSGX)
Annual Report
May 31, 2014
APEXcm SMALL/MID CAP GROWTH FUND LETTER TO SHAREHOLDERS | May 31, 2014 |
Dear Fellow APEXcm Fund Shareholder,
We thank you for your ongoing support! We are pleased to report that APEXcm Small/Mid Cap Growth Fund (the “Fund”) continues to grow, and has performed well relative to its investment objective. During the year ended May 31, 2014, your Fund’s performance was +20.26% (net of expenses), outperforming the Fund’s benchmark, the Russell 2500TM Growth Index, which rose 18.51%.
APEX PHILOSOPHY
We believe that the best way to provide value-added returns is to identify companies that exhibit certain favorable fundamental advantages and benefit from secular growth trends, which allows us to structure the portfolio in high-conviction areas of longer-term sustainable growth. Embedded in our portfolio construction is the recognition of companies at different stages of their growth cycle, which we designate as “stable” and “emerging” growth stocks. We believe that having the spectrum of growth companies that are truly innovative and growing rapidly, combined with established growth businesses, can provide relative stability while allowing the opportunity to drive outperformance versus our benchmark and peers over time. Also, we believe the SMID (small/mid cap) style provides the opportunity to invest in higher growth companies and capture a longer period of growth as these companies mature.
INVESTMENT ENVIRONMENT
During this one-year period, the slow and steady slog of corporations and households continuing to deleverage, along with central banks around the world embarking on massive rounds of accommodation, has provided a choppy, challenging, but ultimately rewarding market environment. During the year, in spite of the U.S. Federal Reserve embarking on a tapering of its historic $85 billion per month bond buying liquidity infusion program, investors remained optimistic as the wealth effect created by increasing financial assets and the housing recovery fueled optimism and consumption. As tepid growth continues and we slowly grind towards a self-sustaining economy, prospects in the U.S. are relatively bright as household and corporate balance sheets, along with employment, have improved significantly. As we moved into 2014, an unusually bad winter, coupled with renewed geopolitical risks and higher volatility in high growth sectors, once again provided reason to pause, rewind and then move forward.
DISCUSSION OF KEY POSITIONING AND HOLDINGS VERSUS THE BENCHMARK
| • | Solid stock selection in the Consumer Discretionary, Energy, Financials, Health Care, Industrials and Materials sectors added approximately 7% in value, with only a slight negative offset in Information Technology of approximately -1%. |
1
| • | Overall attribution from sector effect was negative (approximately 1.5%), due mostly to our more cyclical portfolio positioning with the overweight in Consumer Discretionary and Information Technology providing a negative impact, as well as the underweight positioning in Health Care, Industrials and Consumer Staples. |
| • | Key secular growth areas of payments and processing, genomics and specialty pharmaceuticals, the drive towards energy independence, and pent-up demand in housing, autos and aerospace provided compelling investment opportunities. |
| • | Additionally, the timing of significant cash inflows into the Fund as the market continued its relentless advance negatively impacted performance. |
Information Technology: We remain overweight in Information Technology, with a preference to businesses that are in areas where cap-ex is showing improvement and possess high quality balance sheet and cash flow characteristics. The overweight slightly hurt performance and stock selection was also slightly negative. One of the leaders for the year was NXPI (+90.63%), a leader in High-Performance Mixed Signal chips that are well positioned in the high growth areas of automotives, mobile payments (with their Near Field Communication chips), and the payments and processing theme (with smart card processing chips). Payments and processing company Alliance Data Systems continued to perform well (+63.86%) as their unique approach to helping businesses capture marketing data and assimilate into growing their loyalty programs persisted in adding value along with FleetCor Technologies, a provider of fuel cards and fleet and lodging payment programs (+45.17%). Due to their success (and thus encountering market cap restrictions), both NXPI and Alliance Data were sold towards the end of the reporting period. E-commerce continues to perform well with IAC/InterActiveCorp increasing +38.32%, but the theme was negatively impacted by MercadoLibre (-25.37%), as this Latin American on-line marketplace was challenged by declining currencies in Argentina and Brazil. Also, Neustar (-42.52%) and International Game Technology (-28.12%) performed poorly.
Consumer Discretionary: We remain overweight in Consumer Discretionary, as there are several elements of the economy with significant pent-up demand. In spite of some recent slower weather-related housing data, we believe there is more improvement to come, especially in the corresponding multiplier of durables which was reflected in the stellar performance of unique housing goods company Williams-Sonoma (+26.65%). Also, the auto recovery was amplified in the performance of Autoliv (+38.12%). During the period, Signet Jewelers (+63.54%) deployed some of its industry-leading cash flow to acquire Zale’s, providing a boost to the stock. These areas of resurgence led to Consumer Discretionary stock selection adding approximately 1.75% to performance for the year.
Health Care: We maintained our underweight position in Health Care during the period, as several successful holdings were eliminated or trimmed. During the period, we sold Illumina and Incyte and eliminated Onyx, which was acquired by Amgen, with each of these holdings adding a significant amount to the sector outperformance of approximately 1.60%. The selection of Jazz Pharmaceuticals,
2
with its narcolepsy drug-Xyrem, and Salix Pharmaceuticals, with its strong franchise in treating intestinal disorders, provided additional value. During the reporting period, however, several stocks such as Momenta Pharmaceuticals and Isis Pharmaceuticals were down in excess of 20%. Small Cap biotech is an area which we have been strategically adding to as opportunity is provided but have noted areas where heightened expectations and valuations have prompted a more prudent approach.
Financials: We remain slightly overweight in Financials. In our view, the steep yield curve, better credit standards, declining delinquencies, and higher capital ratios support this attractively valued sector. Stock selection was slightly positive for the year (+.71%), as strong performance in Evercore Partners (+41.39%) was offset by a decline in Wisdom Tree Investments (-35%), as capital flows slowed into their highly successful international offerings.
Energy: We moved to a slight overweight in Energy, as the long-term theme of energy independence was heightened during the year with the emergence of more geopolitical risks. Stock selection added approximately 1.17% for the period, with companies executing well in the hydraulic fracturing areas of Eagle Ford & Marcellus (Carrizo Oil and Gas +65%) and Bakken (Whiting Petroleum +55.96%) along with flexible drill specialist Helmerich & Payne (+82.92%).
Industrials: Although still slightly underweight in Industrials, we continue to selectively add to the Fund’s allocation as many companies exhibiting pent-up demand (especially in aerospace and construction) show good long-term secular growth prospects. United Rentals was our largest positive contributor (+77.78%) for the year, as the company continues to capitalize on the corporate desire to rent capital assets in the high demand areas of construction and energy. Towers Watson, a beneficiary of the roll out of the Affordable Care Act, was up +40.82% during this time period. Both of these companies were key providers to this sector’s approximately 1.85% excess performance.
OUTLOOK
In spite of a dismal weather-related start to 2014, the U.S. economy seems to be improving. This trend continues to be reflected in improving leading economic indicators, expanding global Purchasing Managers’ Indices (PMIs), accelerating commercial and industrial loan growth, improving corporate earnings, and constrained budget deficits, with more political visibility and continued accommodative monetary policy. The volatility in the market reflects its self-correcting mechanism as it works off some excesses following the parabolic rise in the areas of social media, cloud computing and early-stage biotech. We believe these rotational corrections will continue versus a broad market sell-off. We believe these mini-corrections will provide opportunity in some of these high interest areas which exhibit secular growth attributes. Also, in this slow growth, low interest rate environment, we would expect an increase in mergers and acquisitions, providing continued support to smaller, faster-growth companies. While valuations are no longer cheap, we do consider the opportunities reasonable relative to growth as the economy shifts into self-sustaining trends.
3
However, following a rise this year amid placid trading, you don’t have to look too far to see reasons for a potential market cooling. Already in 2014 investors have had to digest slowing growth in China, unrest in Ukraine, the gradual policy shift regarding the incredible monetary stimulus provided by the Federal Reserve and now unsettling events in the Middle East along with a mid-term U.S. election on the horizon. We continue to monitor the impact of these uncertainties, but at this point believe there are more opportunities brewing in the secular growth areas and would look to take advantage of any persistent apprehension.
Thank you for your continued confidence in the APEXcm Small/Mid Cap Growth Fund.
Sincerely,
Nitin N. Kumbhani
President and Chief Investment Officer
Past performance is not predictive of future performance. Investment results and principal value will fluctuate so that shares, when redeemed, may be worth more or less than their original cost. Current performance may be higher or lower than the performance data quoted. Performance data current to the most recent month end are available by calling 1-888-575-4800.
An investor should consider the investment objectives, risks, charges and expenses of the Fund carefully before investing. The Fund’s prospectus contains this and other important information. To obtain a copy of the Fund’s prospectus please visit our website at www.apexcmfund.com or call 1-888-575-4800 and a copy will be sent to you free of charge. Please read the prospectus carefully before you invest. The APEXcm Small/Mid Cap Growth Fund is distributed by Ultimus Fund Distributors, LLC.
The Letter to Shareholders seeks to describe some of the Adviser’s current opinions and views of the financial markets. Although the Adviser believes it has a reasonable basis for any opinions or views expressed, actual results may differ, sometimes significantly so, from those expected or expressed. The securities held by the Fund that are discussed in the Letter to Shareholders were held during the period covered by this Report. They do not comprise the entire investment portfolio of the Fund, may be sold at any time and may no longer be held by the Fund. The opinions of the Adviser with respect to those securities may change at any time.
4
APEXcm SMALL/MID CAP GROWTH FUND
PERFORMANCE INFORMATION
May 31, 2014 (Unaudited)
PERFORMANCE INFORMATION
May 31, 2014 (Unaudited)
Comparison of the Change in Value of a $10,000
Investment in APEXcm Small/Mid Cap Growth Fund
versus the Russell 2500TM Growth Index
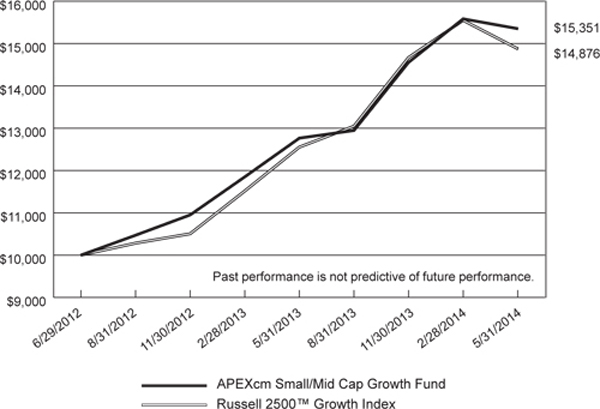
Average Annual Total Returns For Periods Ended May 31, 2014 | ||
| 1 Year | Since Inception(b) | |
APEXcm Small/Mid Cap Growth Fund(a) | 20.26% | 25.00% |
Russell 2500TM Growth Index | 18.51% | 22.97% |
| (a) | The Fund’s total return does not reflect the deduction of taxes a shareholder would pay on Fund distributions or the redemption of Fund shares. |
| (b) | The Fund commenced operations on June 29, 2012. |
5
APEXcm SMALL/MID CAP GROWTH FUND
PORTFOLIO INFORMATION
May 31, 2014 (Unaudited)
PORTFOLIO INFORMATION
May 31, 2014 (Unaudited)
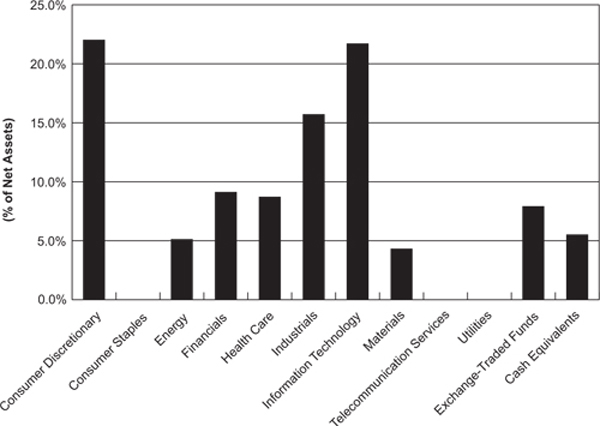
Sector Diversification
Top Ten Equity Holdings
| Security Description | % of Net Assets | |
| iShares Russell Mid-Cap Growth ETF | 4.0% | |
| iShares Russell 2000 Growth ETF | 3.9% | |
| United Rentals, Inc. | 3.2% | |
| Signet Jewelers Ltd. | 3.1% | |
| Expedia, Inc. | 2.5% | |
| IAC/InterActiveCorp | 2.3% | |
| Autoliv, Inc. | 2.2% | |
| Robert Half International, Inc. | 2.2% | |
| FleetCor Technologies, Inc. | 2.2% | |
| Wabtec Corp. | 2.1% |
6
APEXcm SMALL/MID CAP GROWTH FUND SCHEDULE OF INVESTMENTS May 31, 2014 | ||||||||
| COMMON STOCKS — 86.6% | Shares | Value | ||||||
| Consumer Discretionary — 22.0% | ||||||||
| Auto Components — 5.9% | ||||||||
| Autoliv, Inc. | 18,181 | $ | 1,927,186 | |||||
| Dana Holding Corp. | 43,748 | 968,581 | ||||||
| Gentex Corp. | 27,671 | 800,245 | ||||||
| Visteon Corp. * | 16,826 | 1,533,522 | ||||||
| 5,229,534 | ||||||||
| Hotels, Restaurants & Leisure — 1.4% | ||||||||
| Wyndham Worldwide Corp. | 17,234 | 1,274,110 | ||||||
| Internet & Catalog Retail — 2.5% | ||||||||
| Expedia, Inc. | 29,639 | 2,172,539 | ||||||
| Leisure Products — 1.9% | ||||||||
| Polaris Industries, Inc. | 12,810 | 1,651,465 | ||||||
| Multi-line Retail — 1.0% | ||||||||
| Dillard's, Inc. - Class A | 8,068 | 909,667 | ||||||
| Specialty Retail — 9.3% | ||||||||
| AutoNation, Inc. * | 21,524 | 1,230,527 | ||||||
| Foot Locker, Inc. | 24,357 | 1,173,520 | ||||||
| PetSmart, Inc. | 21,431 | 1,231,640 | ||||||
| Sally Beauty Holdings, Inc. * | 15,121 | 387,400 | ||||||
| Signet Jewelers Ltd. | 25,888 | 2,746,458 | ||||||
| Williams-Sonoma, Inc. | 22,262 | 1,489,773 | ||||||
| 8,259,318 | ||||||||
| Energy — 5.1% | ||||||||
| Energy Equipment & Services — 1.8% | ||||||||
| Helmerich & Payne, Inc. | 13,994 | 1,538,640 | ||||||
| Oil, Gas & Consumable Fuels — 3.3% | ||||||||
| Carrizo Oil & Gas, Inc. * | 25,673 | 1,475,171 | ||||||
| Whiting Petroleum Corp. * | 20,337 | 1,461,214 | ||||||
| 2,936,385 | ||||||||
| Financials — 9.1% | ||||||||
| Banks — 2.8% | ||||||||
| Cullen/Frost Bankers, Inc. | 14,186 | 1,061,964 | ||||||
| First Republic Bank/CA | 27,440 | 1,395,598 | ||||||
| 2,457,562 | ||||||||
7
APEXcm SMALL/MID CAP GROWTH FUND SCHEDULE OF INVESTMENTS (Continued) | ||||||||
| COMMON STOCKS — 86.6% (Continued) | Shares | Value | ||||||
| Financials — 9.1% (Continued) | ||||||||
| Capital Markets — 2.5% | ||||||||
| Affiliated Managers Group, Inc. * | 6,774 | $ | 1,277,576 | |||||
| Evercore Partners, Inc. - Class A | 16,665 | 917,242 | ||||||
| 2,194,818 | ||||||||
| Diversified Financial Services — 0.5% | ||||||||
| Interactive Brokers Group, Inc. - Class A | 17,120 | 394,102 | ||||||
| Insurance — 1.4% | ||||||||
| XL Group plc | 39,230 | 1,273,406 | ||||||
| Real Estate Management & Development — 1.9% | ||||||||
| CBRE Group, Inc. - Class A * | 57,552 | 1,717,352 | ||||||
| Health Care — 8.7% | ||||||||
| Biotechnology — 2.1% | ||||||||
| Keryx Biopharmaceuticals, Inc. * | 28,396 | 374,827 | ||||||
| Medivation, Inc. * | 9,598 | 699,022 | ||||||
| Momenta Pharmaceuticals, Inc. * | 23,455 | 290,607 | ||||||
| United Therapeutics Corp. * | 5,204 | 498,231 | ||||||
| 1,862,687 | ||||||||
| Health Care Providers & Services — 2.1% | ||||||||
| Universal Health Services, Inc. - Class B | 20,476 | 1,834,035 | ||||||
| Life Sciences Tools & Services — 1.9% | ||||||||
| PAREXEL International Corp. * | 15,717 | 792,923 | ||||||
| WuXi PharmaTech (Cayman), Inc. - ADR * | 28,444 | 949,176 | ||||||
| 1,742,099 | ||||||||
| Pharmaceuticals — 2.6% | ||||||||
| Akorn, Inc. * | 33,475 | 936,296 | ||||||
| Jazz Pharmaceuticals plc * | 2,780 | 394,371 | ||||||
| Salix Pharmaceuticals Ltd. * | 8,421 | 960,668 | ||||||
| 2,291,335 | ||||||||
| Industrials — 15.7% | ||||||||
| Aerospace & Defense — 1.5% | ||||||||
| B/E Aerospace, Inc. * | 13,947 | 1,349,372 | ||||||
| Electrical Equipment — 1.0% | ||||||||
| EnerSys, Inc. | 12,139 | 838,077 | ||||||
8
APEXcm SMALL/MID CAP GROWTH FUND SCHEDULE OF INVESTMENTS (Continued) | ||||||||
| COMMON STOCKS — 86.6% (Continued) | Shares | Value | ||||||
| Industrials — 15.7% (Continued) | ||||||||
| Machinery — 4.8% | ||||||||
| Nordson Corp. | 15,495 | $ | 1,263,462 | |||||
| Valmont Industries, Inc. | 7,417 | 1,149,264 | ||||||
| Wabtec Corp. | 23,309 | 1,835,351 | ||||||
| 4,248,077 | ||||||||
| Professional Services — 3.8% | ||||||||
| Robert Half International, Inc. | 42,017 | 1,915,555 | ||||||
| Towers Watson & Co. - Class A | 13,203 | 1,485,470 | ||||||
| 3,401,025 | ||||||||
| Road & Rail — 1.4% | ||||||||
| Old Dominion Freight Line, Inc. * | 19,476 | 1,245,685 | ||||||
| Trading Companies & Distributors — 3.2% | ||||||||
| United Rentals, Inc. * | 27,829 | 2,812,120 | ||||||
| Information Technology — 21.7% | ||||||||
| Communications Equipment — 3.4% | ||||||||
| Ciena Corp. * | 46,621 | 904,447 | ||||||
| F5 Networks, Inc. * | 10,098 | 1,096,138 | ||||||
| Finisar Corp. * | 40,436 | 960,355 | ||||||
| 2,960,940 | ||||||||
Electronic Equipment, Instruments & Components — 2.2% | ||||||||
| Dolby Laboratories, Inc. - Class A * | 22,328 | 927,505 | ||||||
| FEI Co. | 12,372 | 1,032,443 | ||||||
| 1,959,948 | ||||||||
| Internet Software & Services — 2.3% | ||||||||
| IAC/InterActiveCorp | 30,056 | 1,990,008 | ||||||
| IT Services — 9.0% | ||||||||
| FleetCor Technologies, Inc. * | 15,103 | 1,909,170 | ||||||
| Gartner, Inc. * | 22,471 | 1,597,463 | ||||||
| Global Payments, Inc. | 18,843 | 1,291,876 | ||||||
| Heartland Payment Systems, Inc. | 24,859 | 1,030,406 | ||||||
| InterXion Holding N.V. * | 20,903 | 549,540 | ||||||
| Total System Services, Inc. | 53,513 | 1,619,303 | ||||||
| 7,997,758 | ||||||||
| Semiconductors & Semiconductor Equipment — 0.9% | ||||||||
| Entegris, Inc. * | 69,821 | 800,847 | ||||||
9
APEXcm SMALL/MID CAP GROWTH FUND SCHEDULE OF INVESTMENTS (Continued) | ||||||||
| COMMON STOCKS — 86.6% (Continued) | Shares | Value | ||||||
| Information Technology — 21.7% (Continued) | ||||||||
| Software — 3.9% | ||||||||
| Informatica Corp. * | 20,292 | $ | 742,484 | |||||
| Manhattan Associates, Inc. * | 14,812 | 480,798 | ||||||
| NetScout Systems, Inc. * | 11,900 | 462,553 | ||||||
| Rovi Corp. * | 30,805 | 744,557 | ||||||
| TIBCO Software, Inc. * | 48,365 | 1,040,331 | ||||||
| 3,470,723 | ||||||||
| Materials — 4.3% | ||||||||
| Chemicals — 1.0% | ||||||||
| Albemarle Corp. | 12,958 | 896,564 | ||||||
| Containers & Packaging — 1.3% | ||||||||
| Silgan Holdings, Inc. | 22,880 | 1,117,230 | ||||||
| Metals & Mining — 0.6% | ||||||||
| Constellium N.V. - Class A * | 17,114 | 498,702 | ||||||
| Paper & Forest Products — 1.4% | ||||||||
| KapStone Paper and Packaging Corp. * | 42,971 | 1,248,308 | ||||||
Total Common Stocks (Cost $66,981,905) | $ | 76,574,438 | ||||||
| EXCHANGE-TRADED FUNDS — 7.9% | Shares | Value | ||||||
| iShares Russell 2000 Growth ETF | 26,842 | $ | 3,498,855 | |||||
| iShares Russell Mid-Cap Growth ETF | 40,634 | 3,528,656 | ||||||
Total Exchange-Traded Funds (Cost $6,852,482) | $ | 7,027,511 | ||||||
10
APEXcm SMALL/MID CAP GROWTH FUND SCHEDULE OF INVESTMENTS (Continued) | ||||||||
| MONEY MARKET FUNDS — 6.1% | Shares | Value | ||||||
Fidelity Institutional Money Market Portfolio - Class I, 0.05% (a) (Cost $5,397,904) | 5,397,904 | $ | 5,397,904 | |||||
Total Investments at Value — 100.6% (Cost $79,232,291) | $ | 88,999,853 | ||||||
| Liabilities in Excess of Other Assets — (0.6%) | (523,153 | ) | ||||||
| Net Assets — 100.0% | $ | 88,476,700 | ||||||
| ADR - American Depositary Receipt. | |
| * | Non-income producing security. |
| (a) | The rate shown is the 7-day effective yield as of May 31, 2014. |
| See accompanying notes to financial statements. | |
11
APEXcm SMALL/MID CAP GROWTH FUND STATEMENT OF ASSETS AND LIABILITIES May 31, 2014 | ||||
ASSETS | ||||
| Investments in securities: | ||||
| At acquisition cost | $ | 79,232,291 | ||
| At value (Note 2) | $ | 88,999,853 | ||
| Dividends receivable | 73,235 | |||
| Receivable for capital shares sold | 321,030 | |||
| Other assets | 14,735 | |||
| Total assets | 89,408,853 | |||
| LIABILITIES | ||||
| Payable for investment securities purchased | 828,255 | |||
| Payable for capital shares redeemed | 20,541 | |||
| Payable to Adviser (Note 4) | 52,822 | |||
| Payable to administrator (Note 4) | 12,600 | |||
| Other accrued expenses | 17,935 | |||
| Total liabilities | 932,153 | |||
| NET ASSETS | $ | 88,476,700 | ||
| NET ASSETS CONSIST OF: | ||||
| Paid-in capital | $ | 79,271,851 | ||
| Accumulated net investment loss | (105,388 | ) | ||
| Accumulated net realized losses from security transactions | (457,325 | ) | ||
| Net unrealized appreciation on investments | 9,767,562 | |||
| NET ASSETS | $ | 88,476,700 | ||
| Shares of beneficial interest outstanding (unlimited number of shares authorized, no par value) | 5,822,222 | |||
| Net asset value, offering price and redemption price per share (Note 2) | $ | 15.20 | ||
See accompanying notes to financial statements.
12
APEXcm SMALL/MID CAP GROWTH FUND STATEMENT OF OPERATIONS For the Year Ended May 31, 2014 | ||||
INVESTMENT INCOME | ||||
| Dividend income | $ | 330,950 | ||
| EXPENSES | ||||
| Investment advisory fees (Note 4) | 498,727 | |||
| Administration fees (Note 4) | 51,863 | |||
| Custody and bank service fees | 40,600 | |||
| Professional fees | 33,058 | |||
| Registration and filing fees | 32,287 | |||
| Fund accounting fees (Note 4) | 31,746 | |||
| Transfer agent fees (Note 4) | 18,000 | |||
| Compliance fees (Note 4) | 12,000 | |||
| Trustees' fees and expenses (Note 4) | 8,867 | |||
| Postage and supplies | 5,351 | |||
| Insurance expense | 4,030 | |||
| Other expenses | 10,428 | |||
| Total expenses | 746,957 | |||
| Less fee reductions by the Adviser (Note 4) | (223,293 | ) | ||
| Net expenses | 523,664 | |||
| NET INVESTMENT LOSS | (192,714 | ) | ||
| REALIZED AND UNREALIZED GAINS (LOSSES) ON INVESTMENTS | ||||
| Net realized losses from security transactions | (197,613 | ) | ||
| Net change in unrealized appreciation/depreciation on investments | 8,704,592 | |||
| NET REALIZED AND UNREALIZED GAINS ON INVESTMENTS | 8,506,979 | |||
| NET INCREASE IN NET ASSETS RESULTING FROM OPERATIONS | $ | 8,314,265 | ||
See accompanying notes to financial statements.
13
APEXcm SMALL/MID CAP GROWTH FUND STATEMENTS OF CHANGES IN NET ASSETS | ||||||||
Year Ended May 31, 2014 | Period Ended May 31, 2013(a) | |||||||
| FROM OPERATIONS | ||||||||
| Net investment income (loss) | $ | (192,714 | ) | $ | 9,832 | |||
| Net realized losses from security transactions | (197,613 | ) | (33,444 | ) | ||||
| Net change in unrealized appreciation/depreciation on investments | 8,704,592 | 1,062,970 | ||||||
| Net increase in net assets resulting from operations | 8,314,265 | 1,039,358 | ||||||
| DISTRIBUTIONS TO SHAREHOLDERS | ||||||||
| From net investment income | — | (19,469 | ) | |||||
| From net realized gains on investments | (226,268 | ) | — | |||||
| Decrease in net assets from distributions to shareholders | (226,268 | ) | (19,469 | ) | ||||
| CAPITAL SHARE TRANSACTIONS | ||||||||
| Proceeds from shares sold | 74,662,709 | 12,444,893 | ||||||
| Net asset value of shares issued in reinvestment of distributions to shareholders | 162,061 | 19,469 | ||||||
| Payments for shares redeemed | (7,589,046 | ) | (431,272 | ) | ||||
| Net increase in net assets from capital share transactions | 67,235,724 | 12,033,090 | ||||||
| TOTAL INCREASE IN NET ASSETS | 75,323,721 | 13,052,979 | ||||||
| NET ASSETS | ||||||||
| Beginning of period | 13,152,979 | 100,000 | ||||||
| End of period | $ | 88,476,700 | $ | 13,152,979 | ||||
| ACCUMULATED NET INVESTMENT LOSS | $ | (105,388 | ) | $ | (9,637 | ) | ||
| CAPITAL SHARE ACTIVITY | ||||||||
| Shares sold | 5,289,946 | 1,060,310 | ||||||
| Shares reinvested | 10,768 | 1,764 | ||||||
| Shares redeemed | (515,199 | ) | (35,367 | ) | ||||
| Net increase in shares outstanding | 4,785,515 | 1,026,707 | ||||||
| Shares outstanding at beginning of period | 1,036,707 | 10,000 | ||||||
| Shares outstanding at end of period | 5,822,222 | 1,036,707 | ||||||
| (a) | Represents the period from the commencement of operations (June 29, 2012) through May 31, 2013. |
See accompanying notes to financial statements.
14
APEXcm SMALL/MID CAP GROWTH FUND FINANCIAL HIGHLIGHTS | ||||||||
Per Share Data for a Share Outstanding Throughout Each Period | ||||||||
Year Ended May 31, 2014 | Period Ended May 31, 2013(a) | |||||||
| Net asset value at beginning of period | $ | 12.69 | $ | 10.00 | ||||
| Income (loss) from investment operations: | ||||||||
| Net investment income (loss) | (0.03 | ) | 0.04 | (b) | ||||
| Net realized and unrealized gains on investments | 2.60 | 2.72 | ||||||
| Total from investment operations | 2.57 | 2.76 | ||||||
| Less distributions: | ||||||||
| From net investment income | — | (0.07 | ) | |||||
| From net realized gains on investments | (0.06 | ) | — | |||||
| Total distributions | (0.06 | ) | (0.07 | ) | ||||
| Net asset value at end of period | $ | 15.20 | $ | 12.69 | ||||
Total return (c) | 20.26 | % | 27.65 | %(d) | ||||
| Net assets at end of period (000's) | $ | 88,477 | $ | 13,153 | ||||
| Ratios/supplementary data: | ||||||||
| Ratio of total expenses to average net assets | 1.49 | % | 4.87 | %(e) | ||||
Ratio of net expenses to average net assets (f) | 1.05 | % | 1.05 | %(e) | ||||
Ratio of net investment income (loss) to average net assets (f) | (0.38 | %) | 0.26 | %(e) | ||||
| Portfolio turnover rate | 47 | % | 18 | %(d) | ||||
| (a) | Represents the period from the commencement of operations (June 29, 2012) through May 31, 2013. |
| (b) | Calculated using weighted average shares outstanding during the period. |
| (c) | Total return is a measure of the change in value of an investment in the Fund over the periods covered. The returns shown do not reflect the deduction of taxes a shareholder would pay on Fund distributions, if any, or the redemption of Fund shares. The total returns would be lower if the Adviser had not reduced advisory fees and/or reimbursed expenses. |
| (d) | Not annualized. |
| (e) | Annualized. |
| (f) | Ratio was determined after advisory fee reductions and/or expense reimbursements (Note 4). |
See accompanying notes to financial statements.
15
APEXcm SMALL/MID CAP GROWTH FUND
NOTES TO FINANCIAL STATEMENTS
May 31, 2014
NOTES TO FINANCIAL STATEMENTS
May 31, 2014
1. Organization
APEXcm Small/Mid Cap Growth Fund (the “Fund”) is a diversified series of Ultimus Managers Trust (the “Trust”), an open-end investment company established as an Ohio business trust under a Declaration of Trust dated February 28, 2012. Other series of the Trust are not incorporated in this report. The Fund commenced operations on June 29, 2012.
The investment objective of the Fund is long-term capital growth.
2. Significant Accounting Policies
The following is a summary of the Fund’s significant accounting policies. The policies are in conformity with accounting principles generally accepted in the United States of America (“GAAP”).
Securities valuation – The Fund’s portfolio securities are valued at market value as of the close of regular trading on the New York Stock Exchange (the “NYSE”) (normally 4:00 p.m. Eastern time) on each business day the NYSE is open. Securities listed on the NYSE or other exchanges are valued on the basis of their last sales prices on the exchanges on which they are primarily traded. If there are no sales on that day, the securities are valued at the closing bid price on the NYSE or other primary exchange for that day. NASDAQ listed securities are valued at the NASDAQ Official Closing Price. If there are no sales on that day, the securities are valued at the last bid price as reported by NASDAQ. Securities traded in the over-the-counter market are valued at the last sale price, if available, otherwise at the most recently quoted bid price. In the event that market quotations are not readily available or are considered unreliable due to market or other events, securities and other assets are valued at fair value as determined in good faith in accordance with procedures adopted by the Board of Trustees of the Trust and will be classified as Level 2 or 3 within the fair value hierarchy (see below), depending on the inputs used. Factors determining portfolio investments subject to fair value determination include, but are not limited to, the following: the spread between bid and asked prices is substantial; infrequency of sales; thinness of market; the size of reported trades; a temporary lapse in the provision of prices by any reliable pricing source; and actions of the securities or futures markets, such as the suspension or limitation of trading.
GAAP establishes a single authoritative definition of fair value, sets out a framework for measuring fair value and requires additional disclosures about fair value measurements.
16
APEXcm SMALL/MID CAP GROWTH FUND
NOTES TO FINANCIAL STATEMENTS (Continued)
NOTES TO FINANCIAL STATEMENTS (Continued)
Various inputs are used in determining the value of the Fund’s investments. These inputs are summarized in the three broad levels listed below:
| • | Level 1 – quoted prices in active markets for identical securities |
| • | Level 2 – other significant observable inputs |
| • | Level 3 – significant unobservable inputs |
The inputs or methodology used for valuing securities are not necessarily an indication of the risks associated with investing in those securities. The inputs used to measure fair value may fall into different levels of the fair value hierarchy. In such cases, for disclosure purposes, the level in the fair value hierarchy within which the fair value measurement falls in its entirety is determined based on the lowest level input that is significant to the fair value measurement.
The following is a summary of the inputs used to value the Fund’s investments as of May 31, 2014:
| Level 1 | Level 2 | Level 3 | Total | |||||||||||||
| Common Stocks | $ | 76,574,438 | $ | — | $ | — | $ | 76,574,438 | ||||||||
| Exchange-Traded Funds | 7,027,511 | — | — | 7,027,511 | ||||||||||||
| Money Market Funds | 5,397,904 | — | — | 5,397,904 | ||||||||||||
| Total | $ | 88,999,853 | $ | — | $ | — | $ | 88,999,853 | ||||||||
Refer to the Fund’s Schedule of Investments for a listing of the common stocks by industry type. As of May 31, 2014, the Fund did not have any transfers in and out of any Level. In addition, the Fund did not have derivative instruments or any assets or liabilities that were measured at fair value on a recurring basis using significant unobservable inputs (Level 3) as of May 31, 2014. It is the Fund’s policy to recognize transfers into and out of any Level at the end of the reporting period.
Share valuation – The net asset value per share of the Fund is calculated daily by dividing the total value of the Fund’s assets, less liabilities, by the number of shares outstanding. The offering price and redemption price per share of the Fund is equal to the net asset value per share.
Investment income – Dividend income is recorded on the ex-dividend date. Interest income is accrued as earned.
Security transactions – Security transactions are accounted for on the trade date. Gains and losses on securities sold are determined on a specific identification basis.
17
APEXcm SMALL/MID CAP GROWTH FUND
NOTES TO FINANCIAL STATEMENTS (Continued)
NOTES TO FINANCIAL STATEMENTS (Continued)
Common expenses – Common expenses of the Trust are allocated among the Fund and the other series of the Trust based on the relative net assets of each series or the nature of the services performed and the relative applicability to each series.
Distributions to shareholders – Distributions to shareholders arising from net investment income and net realized capital gains, if any, are distributed at least once each year. The amount of distributions from net investment income and net realized gains are determined in accordance with federal income tax regulations, which may differ from GAAP. Dividends and distributions to shareholders are recorded on the ex-dividend date. The tax character of distributions paid during the periods ended May 31, 2014 and May 31, 2013 was as follows:
| Periods Ended | Ordinary Income | Long-Term Capital Gains | Total Distributions | |||||||||
| May 31, 2014 | $ | 212,871 | $ | 13,397 | $ | 226,268 | ||||||
| May 31, 2013 | $ | 19,469 | $ | — | $ | 19,469 | ||||||
Estimates – The preparation of financial statements in conformity with GAAP requires management to make estimates and assumptions that affect the reported amounts of assets and liabilities and disclosure of contingent assets and liabilities as of the date of the financial statements and the reported amounts of income and expenses during the reporting period. Actual results could differ from those estimates.
Federal income tax – The Fund has qualified and intends to continue to qualify as a regulated investment company under the Internal Revenue Code of 1986 (the “Code”). Qualification generally will relieve the Fund of liability for federal income taxes to the extent 100% of its net investment income and net realized gains are distributed in accordance with the Code. Accordingly, no provision for income tax has been made.
In order to avoid imposition of the excise tax applicable to regulated investment companies, it is also the Fund’s intention to declare as dividends in each calendar year at least 98% of its net investment income (earned during the calendar year) and 98.2% of its net realized capital gains (earned during the twelve months ended October 31) plus undistributed amounts from prior years.
18
APEXcm SMALL/MID CAP GROWTH FUND
NOTES TO FINANCIAL STATEMENTS (Continued)
NOTES TO FINANCIAL STATEMENTS (Continued)
The following information is computed on a tax basis for each item as of May 31, 2014:
| Tax cost of portfolio investments | $ | 79,259,641 | ||
| Gross unrealized appreciation | $ | 11,000,673 | ||
| Gross unrealized depreciation | (1,260,461 | ) | ||
| Net unrealized appreciation | 9,740,212 | |||
| Qualified late year losses | (535,363 | ) | ||
| Total accumulated earnings | $ | 9,204,849 |
The difference between the federal income tax cost of portfolio investments and the financial statement cost is due to certain timing differences in the recognition of capital gains or losses under income tax regulations and GAAP. These “book/tax” differences are temporary in nature and are primarily due to the tax deferral of losses on wash sales.
Qualified late year losses incurred after October 31, 2013 and within the taxable year are deemed to arise on the first day of the Fund’s next taxable year. For the year ended May 31, 2014, the Fund intends to defer $105,388 of late year ordinary losses and $429,975 of post-October capital losses to June 1, 2014 for federal income tax purposes.
For the year ended May 31, 2014, the Fund reclassified $96,963 of accumulated net investment loss against paid-in capital on its Statement of Assets and Liabilities. Such reclassification, the result of permanent differences between financial statement and income tax reporting requirements, had no effect on the Fund’s total net assets or net asset value per share.
The Fund recognizes the tax benefits or expenses of uncertain tax positions only when the position is “more likely than not” to be sustained assuming examination by tax authorities. Management has reviewed the Fund’s tax positions for all open tax periods (periods ended May 31, 2013 and May 31, 2014) and has concluded that no provision for unrecognized tax benefits or expenses is required in these financial statements.
3. Investment Transactions
During the year ended May 31, 2014, cost of purchases and proceeds from sales of investment securities, other than short-term investments, were $84,948,639 and $22,501,850, respectively.
19
APEXcm SMALL/MID CAP GROWTH FUND
NOTES TO FINANCIAL STATEMENTS (Continued)
NOTES TO FINANCIAL STATEMENTS (Continued)
4. Transactions with Related Parties
INVESTMENT ADVISORY AGREEMENT
The Fund’s investments are managed by Apex Capital Management, Inc. (the “Adviser”) pursuant to the terms of an Investment Advisory Agreement. Under the Investment Advisory Agreement, the Fund pays the Adviser an advisory fee, computed and accrued daily and paid monthly, at the annual rate of 1.00% of its average daily net assets.
The Adviser has contractually agreed, until October 1, 2017, to reduce its advisory fees and to reimburse the Fund’s operating expenses (excluding brokerage costs, taxes, interest, acquired fund fees and expenses, extraordinary expenses, and other expenses not incurred in the ordinary course of the Fund’s business) to the extent necessary so that the Fund’s annual ordinary operating expenses do not exceed an amount equal to 1.05% of its average daily net assets. Accordingly, the Adviser reduced its advisory fees in the amount of $223,293 during the year ended May 31, 2014.
Advisory fee reductions and expense reimbursements by the Adviser are subject to repayment by the Fund for a period of three years after such fees and expenses were incurred, provided that the repayments do not cause the Fund’s ordinary operating expenses, at the time the repayment occurs, to exceed the expense limitation of 1.05% per annum. As of May 31, 2014, the Adviser may in the future recover advisory fee reductions and expense reimbursements totaling $368,169. The Adviser may recover a portion of this amount no later than the dates as stated below:
| May 31, 2016 | May 31, 2017 | |
| $144,876 | $223,293 |
Certain officers of the Fund are also officers of the Adviser.
OTHER SERVICE PROVIDERS
Ultimus Fund Solutions, LLC (“Ultimus”) provides fund administration, fund accounting, compliance and transfer agency services to the Fund. Pursuant to servicing agreements with Ultimus, the Fund pays Ultimus fees in accordance with the agreements for its services. In addition, the Fund pays out-of-pocket expenses including but not limited to postage, supplies and costs of pricing the Fund’s portfolio securities.
DISTRIBUTION AGREEMENT
Under the terms of a Distribution Agreement with the Trust, Ultimus Fund Distributors, LLC (the “Distributor”) serves as principal underwriter to the Fund. The Distributor is a wholly-owned subsidiary of Ultimus. The Distributor is compensated by the Adviser (not the Fund) for acting as principal underwriter.
20
APEXcm SMALL/MID CAP GROWTH FUND
NOTES TO FINANCIAL STATEMENTS (Continued)
NOTES TO FINANCIAL STATEMENTS (Continued)
Certain officers of the Trust are also officers of Ultimus and/or the Distributor.
TRUSTEE COMPENSATION
Each Trustee who is not an interested person of the Trust receives from the Fund a fee of $500 for each Board meeting attended plus reimbursement of travel and other expenses incurred in attending the meetings. Trustees affiliated with the Adviser or Ultimus are not compensated by the Trust for their services.
5. Contingencies and Commitments
The Fund indemnifies the Trust’s officers and Trustees for certain liabilities that might arise from their performance of their duties to the Fund. Additionally, in the normal course of business the Fund enters into contracts that contain a variety of representations and warranties and which provide general indemnifications. The Fund’s maximum exposure under these arrangements is unknown, as this would involve future claims that may be made against the Fund that have not yet occurred. However, based on experience, the Fund expects the risk of loss to be remote.
6. Subsequent Events
The Fund is required to recognize in the financial statements the effects of all subsequent events that provide additional evidence about conditions that existed as of the date of the Statement of Assets and Liabilities. For non-recognized subsequent events that must be disclosed to keep the financial statements from being misleading, the Fund is required to disclose the nature of the event as well as an estimate of its financial effect, or a statement that such an estimate cannot be made. Management has evaluated subsequent events through the issuance of these financial statements and has noted no such events.
21
APEXcm SMALL/MID CAP GROWTH FUND
REPORT OF INDEPENDENT REGISTERED
PUBLIC ACCOUNTING FIRM
REPORT OF INDEPENDENT REGISTERED
PUBLIC ACCOUNTING FIRM
To the Board of Trustees of Ultimus Managers Trust
and the Shareholders of APEXcm Small/Mid Cap Growth Fund
and the Shareholders of APEXcm Small/Mid Cap Growth Fund
We have audited the accompanying statement of assets and liabilities of the APEXcm Small/Mid Cap Growth Fund (the “Fund”), a series of shares of beneficial interest in the Ultimus Managers Trust, including the schedule of investments, as of May 31, 2014, and the related statement of operations for the year then ended, and the statements of changes in net assets and the financial highlights for the year then ended and for the period June 29, 2012 (commencement of operations) through May 31, 2013. These financial statements and financial highlights are the responsibility of the Fund’s management. Our responsibility is to express an opinion on these financial statements and financial highlights based on our audits.
We conducted our audits in accordance with the standards of the Public Company Accounting Oversight Board (United States). Those standards require that we plan and perform the audits to obtain reasonable assurance about whether the financial statements and financial highlights are free of material misstatement. An audit includes examining, on a test basis, evidence supporting the amounts and disclosures in the financial statements. Our procedures included confirmation of securities owned as of May 31, 2014 by correspondence with the custodian and broker. An audit also includes assessing the accounting principles used and significant estimates made by management, as well as evaluating the overall financial statement presentation. We believe that our audits provide a reasonable basis for our opinion.
In our opinion, the financial statements and financial highlights referred to above present fairly, in all material respects, the financial position of the APEXcm Small/Mid Cap Growth Fund as of May 31, 2014, and the results of its operations for the year then ended, and the changes in its net assets and its financial highlights for the year then ended and for the period June 29, 2012 through May 31, 2013, in conformity with accounting principles generally accepted in the United States of America.
 BBD, LLP |
Philadelphia, Pennsylvania
July 24, 2014
July 24, 2014
22
APEXcm SMALL/MID CAP GROWTH FUND
ABOUT YOUR FUND’S EXPENSES (Unaudited)
ABOUT YOUR FUND’S EXPENSES (Unaudited)
We believe it is important for you to understand the impact of costs on your investment. As a shareholder of the Fund, you incur ongoing costs, including management fees and other operating expenses. The following examples are intended to help you understand your ongoing costs (in dollars) of investing in the Fund and to compare these costs with the ongoing costs of investing in other mutual funds.
A mutual fund’s ongoing costs are expressed as a percentage of its average net assets. This figure is known as the expense ratio. The expenses in the table below are based on an investment of $1,000 made at the beginning of the most recent period (December 1, 2013) and held until the end of the period (May 31, 2014).
The table below illustrates the Fund’s ongoing costs in two ways:
Actual fund return – This section helps you to estimate the actual expenses that you paid over the period. The “Ending Account Value” shown is derived from the Fund’s actual return, and the third column shows the dollar amount of operating expenses that would have been paid by an investor who started with $1,000 in the Fund. You may use the information here, together with the amount you invested, to estimate the expenses that you paid over the period.
To do so, simply divide your account value by $1,000 (for example, an $8,600 account value divided by $1,000 = 8.6), then multiply the result by the number given for the Fund under the heading “Expenses Paid During Period.”
Hypothetical 5% return – This section is intended to help you compare the Fund’s ongoing costs with those of other mutual funds. It assumes that the Fund had an annual return of 5% before expenses during the period shown, but that the expense ratio is unchanged. In this case, because the return used is not the Fund’s actual return, the results do not apply to your investment. The example is useful in making comparisons because the SEC requires all mutual funds to calculate expenses based on a 5% return. You can assess the Fund’s ongoing costs by comparing this hypothetical example with the hypothetical examples that appear in shareholder reports of other funds.
Note that expenses shown in the table are meant to highlight and help you compare ongoing costs only. The Fund does not charge transaction fees, such as purchase or redemption fees, nor does it carry a “sales load.”
The calculations assume no shares were bought or sold during the period. Your actual costs may have been higher or lower, depending on the amount of your investment and the timing of any purchases or redemptions.
23
APEXcm SMALL/MID CAP GROWTH FUND
ABOUT YOUR FUND’S EXPENSES (Unaudited) (Continued)
ABOUT YOUR FUND’S EXPENSES (Unaudited) (Continued)
More information about the Fund’s expenses can be found in this report. For additional information on operating expenses and other shareholder costs, please refer to the Fund’s prospectus.
Beginning Account Value December 1, 2013 | Ending Account Value May 31, 2014 | Expenses Paid During Period* | |
| Based on Actual Fund Return | $1,000.00 | $1,054.70 | $5.38 |
| Based on Hypothetical 5% Return (before expenses) | $1,000.00 | $1,019.70 | $5.29 |
| * | Expenses are equal to the Fund’s annualized expense ratio of 1.05% for the period, multiplied by the average account value over the period, multiplied by 182/365 (to reflect the one-half year period). |
OTHER INFORMATION (Unaudited)
A description of the policies and procedures that the Fund uses to vote proxies relating to portfolio securities is available without charge upon request by calling toll-free 1-888-575-4800, or on the SEC’s website at http://www.sec.gov. Information regarding how the Fund voted proxies relating to portfolio securities during the most recent 12-month period ended June 30 is available without charge upon request by calling toll-free 1-888-575-4800, or on the SEC’s website at http://www.sec.gov.
The Trust files a complete listing of portfolio holdings for the Fund with the SEC as of the end of the first and third quarters of each fiscal year on Form N-Q. These filings are available upon request by calling 1-888-575-4800. Furthermore, you may obtain a copy of the filings on the SEC’s website at http://www.sec.gov. The Trust’s Forms N-Q may also be reviewed and copied at the SEC’s Public Reference Room in Washington, DC, and information on the operation of the Public Reference Room may be obtained by calling 1-800-SEC-0330.
24
APEXcm SMALL/MID CAP GROWTH FUND
FEDERAL TAX INFORMATION (Unaudited)
FEDERAL TAX INFORMATION (Unaudited)
In accordance with federal tax requirements, the following provides shareholders with information concerning distributions from ordinary income and net realized gains made by the Fund during the fiscal year ended May 31, 2014. Certain dividends paid by the fund may be subject to a maximum tax rate of 23.8%, as provided by the Jobs and Growth Tax Relief Reconciliation Act of 2003. The Fund intends to designate up to a maximum amount of $131,431 as taxed at a maximum rate of 23.8%. Additionally, the Fund intends to designate up to a maximum amount of $13,397 as a long-term gain distribution.
As required by federal regulations, complete information was computed and reported in conjunction with your 2013 Form 1099-DIV.
25
APEXcm SMALL/MID CAP GROWTH FUND
BOARD OF TRUSTEES AND EXECUTIVE OFFICERS
(Unaudited)
BOARD OF TRUSTEES AND EXECUTIVE OFFICERS
(Unaudited)
The Board of Trustees has overall responsibility for management of the Trust’s affairs. The Trustees serve during the lifetime of the Trust and until its termination, or until death, resignation, retirement, or removal. The Trustees, in turn, elect the officers of the Fund to actively supervise its day-to-day operations. The officers have been elected for an annual term. Unless otherwise noted, each Trustee’s and officer’s address is 225 Pictoria Drive, Suite 450, Cincinnati, Ohio 45246. The following are the Trustees and executive officers of the Fund:
Name and Year of Birth | Length of Time Served | Position(s) Held with Trust | Principal Occupation(s) During Past 5 Years | Number of Funds in Trust Overseen by Trustee | Directorships of Public Companies Held by Trustee During Past 5 Years |
| Interested Trustees: | |||||
Robert G. Dorsey* Year of Birth: 1957 | Since February 2012 June 2012 to October 2013 | Trustee President | Managing Director of Ultimus Fund Solutions, LLC and Ultimus Fund Distributors, LLC (1999 to present) | 7 | n/a |
| Independent Trustees: | |||||
John C. Davis Year of Birth: 1952 | Since July 2014 Since June 2012 | Chairman Trustee | Consultant (government services) since May 2011; Retired Partner of PricewaterhouseCoopers LLP (1974-2010) | 7 | n/a |
John J. Discepoli Year of Birth: 1963 | Since June 2012 | Trustee | Owner of Discepoli Financial Planning, LLC (personal financial planning company) since November 2004 | 7 | n/a |
David M. Deptula Year of Birth: 1958 | Since June 2012 | Trustee | Vice President of Tax at The Standard Register Company since November 2011; Tax Partner at Deloitte Tax LLP from 1984 to 2011 | 7 | n/a |
| * | Mr. Dorsey is considered an “interested person” of the Trust within the meaning of Section 2(a)(19) of the 1940 Act because of his relationship with the Trust’s administrator, transfer agent and distributor. |
26
APEXcm SMALL/MID CAP GROWTH FUND
BOARD OF TRUSTEES AND EXECUTIVE OFFICERS
(Unaudited) (Continued)
BOARD OF TRUSTEES AND EXECUTIVE OFFICERS
(Unaudited) (Continued)
Name and Year of Birth | Length of Time Served | Position(s) Held with Trust | Principal Occupation(s) During Past 5 Years |
| Executive Officers: | |||
David R. Carson Year of Birth: 1958 | Since October 2013 April 2013 to October 2013 | President Vice President | Vice President and Director of Client Strategies of Ultimus Fund Solutions, LLC (2013 to present); Chief Compliance Officer, The Huntington Funds (2005 to 2013), The Flex-Funds (2006 to 2011), Meeder Financial (2007 to 2011), Huntington Strategy Shares (2012 to 2013), and Huntington Asset Advisors (2013); Vice President, Huntington National Bank (2001 to 2013). |
Nitin N. Kumbhani 8163 Old Yankee Road, Suite E Dayton, Ohio 45458 Year of Birth: 1948 | Since June 2012 | Principal Executive Officer of APEXcm Small/Mid Cap Growth Fund | President and Chief Investment Officer of Apex Capital Management, Inc. (1987 to present) |
Michael Kalbfleisch 8163 Old Yankee Road, Suite E Dayton, Ohio 45458 Year of Birth: 1959 | Since June 2012 | Vice President of APEXcm Small/Mid Cap Growth Fund | Vice President and Chief Compliance Officer of Apex Capital Management, Inc. (2001 to present) |
Mark J. Seger Year of Birth: 1962 | Since February 2014 | Treasurer | Managing Director of Ultimus Fund Solutions, LLC and Ultimus Fund Distributors, LLC (1999 to present) |
Frank L. Newbauer Year of Birth: 1954 | Since February 2012 | Secretary | Assistant Vice President of Ultimus Fund Solutions, LLC and Ultimus Fund Distributors, LLC (2010 to present); Assistant Vice President of JPMorgan Chase Bank, N.A. (1999 to 2010) |
Stephen L. Preston Year of Birth: 1966 | Since June 2012 | Chief Compliance Officer | Assistant Vice President and Chief Compliance Officer of Ultimus Fund Distributors, LLC and Assistant Vice President of Ultimus Fund Solutions, LLC since 2011; Senior Consultant at Mainstay Capital Markets Consultants (2010 to 2011); Chief Compliance Officer at INTL Trading, Inc. (2008 to 2010). |
Additional information about members of the Board and executive officers is available in the Fund’s Statement of Additional Information (“SAI”). To obtain a free copy of the SAI, please call 1-888-575-4800.
27
APEXcm SMALL/MID CAP GROWTH FUND
DISCLOSURE REGARDING APPROVAL OF INVESTMENT ADVISORY AGREEMENT (Unaudited)
DISCLOSURE REGARDING APPROVAL OF INVESTMENT ADVISORY AGREEMENT (Unaudited)
The Board of Trustees (the “Board”), including the Independent Trustees voting separately, has reviewed and approved the Fund’s Investment Advisory Agreement with Apex Capital Management, Inc. (“Apex”) for an additional annual term. Approval took place at an in-person meeting held on April 21, 2014, at which all of the Trustees were present.
In the course of their deliberations, the Board was advised by legal counsel. The Board received and reviewed a substantial amount of information provided by the Apex in response to requests of the Board and counsel.
In considering the Investment Advisory Agreement and reaching their conclusions with respect thereto, the Board reviewed and analyzed various factors that they determined were relevant, including the factors described below.
The nature, extent, and quality of the services provided by Apex. In this regard, the Board reviewed the services being provided by Apex to the Fund including, without limitation, Apex’s investment advisory services since the Fund’s inception, its compliance procedures and practices, and its efforts to promote the Fund and assist in its distribution. The Board noted that the Fund’s Principal Executive Officer is an employee of Apex and serves the Trust without additional compensation from the Fund. After reviewing the foregoing information and further information concerning Apex’s business, the Board concluded that the quality, extent, and nature of the services provided by Apex were satisfactory and adequate for the Fund.
The investment performance of the Fund and Apex. In this regard, the Board compared the performance of the Fund and the performance of its benchmark index, Morningstar category and a comparable peer group index selected by Apex (the “SMID Peer Group”). The Board also considered the consistency of Apex’s management of the Fund with the Fund’s investment objectives and policies. Following discussion of the investment performance of the Fund and the Fund’s performance relative to its Morningstar category and its SMID Peer Group, Apex’s experience in managing the Fund and separate accounts, and other factors, the Board concluded that the investment performance of the Fund has been satisfactory.
The costs of the services provided and profits realized by Apex from its relationship with the Fund. In this regard, the Board considered Apex’s staffing, personnel, and methods of operating; the education and experience of Apex’s personnel; Apex’s compliance policies and procedures; the financial condition of Apex and the level of commitment to the Fund and Apex by the principals of Apex; the asset level of the Fund; the overall expenses of the Fund; and the differences in fees and services provided to Apex’s other clients that may be similar to the Fund. The Board discussed the Fund’s Expense Limitation Agreement with Apex, and considered
28
APEXcm SMALL/MID CAP GROWTH FUND
DISCLOSURE REGARDING APPROVAL OF INVESTMENT ADVISORY AGREEMENT (Unaudited) (Continued)
DISCLOSURE REGARDING APPROVAL OF INVESTMENT ADVISORY AGREEMENT (Unaudited) (Continued)
Apex’s fee reductions and expense reimbursements with respect to the Fund. The Board further took into account Apex’s willingness to continue the Expense Limitation Agreement for the Fund until at least October 1, 2017.
The Board also considered potential benefits to Apex in managing the Fund, including promotion of Apex’s name and the potential for Apex to receive research, statistical, or other services from the Fund’s trades that may benefit Apex’s other clients. The Board compared the Fund’s advisory fee and overall expense ratio to its Morningstar category and its SMID Peer Group. The Board noted that the Fund’s advisory fee of 1.00% per annum was higher than the average advisory fee of 0.78% for its Morningstar category. The Board further noted that the overall expense ratio of 1.05% per annum (after applying the Expense Limitation Agreement) for the Fund was lower than the 1.36% average expense ratio for its Morningstar category. Following these comparisons and upon further consideration and discussion of the foregoing, the Board concluded that the advisory fee paid to Apex by the Fund is fair and reasonable.
The extent to which economies of scale would be realized as the Fund grows and whether advisory fee levels reflect these economies of scale for the benefit of the Fund’s investors. In this regard, the Board considered the Fund’s fee arrangements with Apex, including both the advisory fee and the Expense Limitation Agreement. The Board determined that, while the advisory fee remained the same at all asset levels, the shareholders of the Fund have experienced benefits from the Expense Limitation Agreement. Following further discussion of the Fund’s asset levels, expectations for growth, and level of fees, the Board determined that the Fund’s fee arrangements with Apex continue to provide benefits through the Expense Limitation Agreement and that, at the Fund’s projected asset levels for the next year, the Fund’s arrangements with Apex are fair and reasonable.
Apex’s practices regarding brokerage and portfolio transactions. In this regard, the Board considered Apex’s policies and procedures, and performance in implementing those policies and procedures, to seek best execution for the Fund. The Board also considered the historical portfolio turnover rate for the Fund; the process by which evaluations are made of the overall reasonableness of commissions paid; the method and basis for selecting and evaluating the broker-dealers used; any anticipated allocation of portfolio business to persons affiliated with Apex; and the extent to which the Fund allocated trades to broker-dealers who provide research, statistical or other services (“soft dollars”). After further review and discussion, the Board determined that Apex’s practices regarding brokerage and portfolio transactions were satisfactory.
29
APEXcm SMALL/MID CAP GROWTH FUND
DISCLOSURE REGARDING APPROVAL OF INVESTMENT ADVISORY AGREEMENT (Unaudited) (Continued)
DISCLOSURE REGARDING APPROVAL OF INVESTMENT ADVISORY AGREEMENT (Unaudited) (Continued)
Possible conflicts of interest. In evaluating the possibility for conflicts of interest, the Board considered such matters as the experience and abilities of the advisory personnel assigned to the Fund, the basis of decisions to buy or sell securities for the Fund and/or Apex’s other accounts, Apex’s use of block trading and its process for allocating trades among its different clients, and the substance and administration of Apex’s code of ethics. Following further consideration and discussion, the Board found Apex’s standards and practices relating to the identification and mitigation of potential conflicts of interests to be satisfactory.
Conclusion
After full consideration of the above factors as well as other factors, the Board unanimously concluded that approval of the Investment Advisory Agreement was in the best interests of the Fund and its shareholders.
30
This page intentionally left blank.
This page intentionally left blank.
This page intentionally left blank.

BARROW ALL-CAP CORE FUND
INSTITUTIONAL CLASS (BALIX)
INVESTOR CLASS (BALAX)
BARROW ALL-CAP LONG/SHORT FUND
INSTITUTIONAL CLASS (BFSLX)
INVESTOR CLASS (BFLSX)
Annual Report
May 31, 2014
BARROW ALL-CAP CORE FUND LETTER TO SHAREHOLDERS | July 24, 2014 |
Dear Shareholders,
We are pleased to report on the status and performance of the Barrow All-Cap Core Fund (the “Fund”) for the fiscal period ended 5/31/14. We believe the Fund owns a well-positioned portfolio of equity interests in excellent businesses at attractive valuations. This portfolio is highly diversified by market cap segments (large, mid, small), industry sectors, and issuers. The underlying businesses feature high returns on capital, wide operating margins, and low debt loads. Based on our estimates of intrinsic value, our portfolio’s valuation is cheap on an absolute basis and approximately 30% less expensive than the U.S. stock market as represented by the S&P 500 Index.
On 8/30/13, the Fund was reorganized as a mutual fund from a private limited partnership, which commenced operations on 12/31/08. Please refer to the Performance Information on pages 4 and 5 for a summary of Fund performance versus the S&P 500 over various periods of time since the Fund's inception.
The Fund’s long-term performance has been excellent relative to the S&P 500 TR Index. While the Fund has exceeded the total return of the S&P 500 in each of the past five calendar years by 277-431 basis points, since the beginning of the Fund’s current fiscal period on 8/30/13, the Fund has lagged the S&P 500 by 391 basis points. This is attributable to the Fund’s mid cap and small cap positions, which have underperformed the S&P 500 as have the S&P 400 Midcap and Russell 2000 indices. We are confident the Fund’s mid cap and small cap holdings will make meaningful contributions to the Fund’s performance over time, and the Fund continues to hold substantial allocations in each.
The Fund continued to implement its “go-anywhere” U.S. equities strategy, which uses a proprietary private equity approach applied across the market spectrum to uncover quality companies trading at temporary discounts to their intrinsic values. To increase our chances for success, we harness these opportunities by investing in a variety of positions diversified across market cap and industry sectors.
Over the past nine months, we uncovered 59 new opportunities, composed of 21 small caps, 21 mid caps, and 17 large caps and representing six different industry sectors. We believe all of these new additions to the Fund’s portfolio are excellent companies with strong balance sheets. They are generally using their ample free cash flow to: a) re-invest in growth opportunities at high rates of return; b) pay dividends; c) repurchase stock at attractive valuations; and/or d) retire outstanding debt.
1
In keeping with our practice since the beginning of 2009, over the past year the Fund’s investments were sourced by taking account of the opportunity set of all companies in our broad investment universe each time we committed capital to a new position. We think this approach allows us to uncover excellent investment opportunities that arise from temporary market inefficiencies and to gather up the most compelling investments across a wide array of industries and market caps while avoiding the destructive behavioral biases inherent in concentrated-stock and sector-specialized investing.
For the nine-month fiscal period ended 5/31/14, the three positions that contributed the most to the Fund’s return were Endo International plc, Smith & Wesson Holding Corporation, and Lorillard, Inc., which generated total returns of +71.79%, +45.16% and +52.02%, respectively, and increased the Fund’s return by 65 bps, 46 bps and 45 bps, respectively. The three worst-contributing positions were Express, Inc., Terra Nitrogen Company, L.P., and Coach, Inc. which generated total returns of -39.92%, -32.16%, and -21.41%, respectively, and reduced the Fund’s return by 44 bps, 36 bps and 26 bps, respectively.
Seven of the Fund’s holdings were announced as take-over targets over the past nine months, which was approximately 2.1x the market average.1 The control premia we have captured by virtue of holding stocks which end up being merger targets has made repeated and meaningful contributions to the Fund’s total returns, and we expect the Fund to continue to benefit from this effect going forward. We remove companies from the Fund’s portfolio soon after they are announced as take-over targets and re-invest that capital.
Over the nine-month fiscal period ending 5/31/14, the Fund’s portfolio generated a gross total return of +16.63% (excluding fees and expenses), including +21.05% for large caps, +13.96% for mid caps and +14.07% for small caps. This compares to +19.64% for the S&P 500 TR Index, +17.66% for the S&P 400 Midcap TR Index, and +13.32% for the Russell 2000 TR Index. The sectors held by the Fund with the best performance were Health Care and Energy, which generated total returns of +25.83% and +25.53%, respectively. The two sectors held by the Fund that did least well were Consumer Discretionary and Materials, which returned +0.12% and +8.21%, respectively.
Given the quality and value in the Fund’s portfolio, we remain confident in the Fund’s long-term prospects to outperform the S&P 500 Index and the overall U.S. stock market. We believe the Fund owns a diversified portfolio of quality companies with excellent business characteristics, including high return on capital, wide operating margins, low debt levels, large dividend yields and meaningful insider ownership. Furthermore, we own this portfolio of outstanding companies with a margin of safety at pricing well below intrinsic value, which we estimate holistically on an unleveraged basis with our private equity perspective, and the pricing of the overall U.S. stock market. We expect this combination of quality and value to serve us well into the future as it has in the past.
2
You can find more information about the Fund’s portfolio on the Barrow Funds website (www.barrowfunds.com), including our unique quarterly “consolidated look-through” report in which we compare the portfolio of the Fund with the S&P 500 Index as if they were holding companies like Berkshire Hathaway.
Sincerely,
| Nicholas Chermayeff | Robert F. Greenhill, Jr. | David R. Bechtel |
| Co-Portfolio Manager, | Co-Portfolio Manager, | Principal, |
| Investment Committee | Investment Committee | Investment Committee |
| 1 | Barrow calculates the frequency of merger and acquisition (“M&A”) activity in its portfolio on a quarterly basis by dividing the cumulative number of portfolio holdings that have been announced as merger or acquisition targets by the cumulative number of unique holdings it has held in its portfolio. Barrow calculates the frequency of M&A activity in the market on a quarterly basis by dividing the cumulative number of publicly-traded U.S. common stocks that have been announced as acquisition targets per Bloomberg by the total universe of publicly-traded U.S. common stocks as identified by Bloomberg (approximately 10,000). |
Past performance is not predictive of future performance. Investment results and principal value will fluctuate so that shares, when redeemed, may be worth more or less than their original cost. Current performance may be higher or lower than the performance data quoted. Performance data current to the most recent month end are available by calling 1-877-767-6633.
An investor should consider the investment objectives, risks, charges and expenses of the Fund carefully before investing. The Fund’s prospectus contains this and other important information. To obtain a copy of the Fund’s prospectus please visit our website at www.barrowfunds.com or call 1-877-767-6633 and a copy will be sent to you free of charge. Please read the prospectus carefully before you invest. The Fund is distributed by Ultimus Fund Distributors, LLC.
The Letter to Shareholders seeks to describe some of the Adviser’s current opinions and views of the financial markets. Although the Adviser believes it has a reasonable basis for any opinions or views expressed, actual results may differ, sometimes significantly so, from those expected or expressed. The securities held by the Fund that are discussed in the Letter to Shareholders were held during the period covered by this Report. They do not comprise the entire investment portfolio of the Fund, may be sold at any time and may no longer be held by the Fund. The opinions of the Fund’s Adviser with respect to those securities may change at any time.
3
BARROW ALL-CAP CORE FUND
PERFORMANCE INFORMATION
May 31, 2014 (Unaudited)
PERFORMANCE INFORMATION
May 31, 2014 (Unaudited)
Comparison of the Change in Value of a $10,000 Investment in
Barrow All-Cap Core Fund(b) versus the S&P 500® Index
Barrow All-Cap Core Fund(b) versus the S&P 500® Index
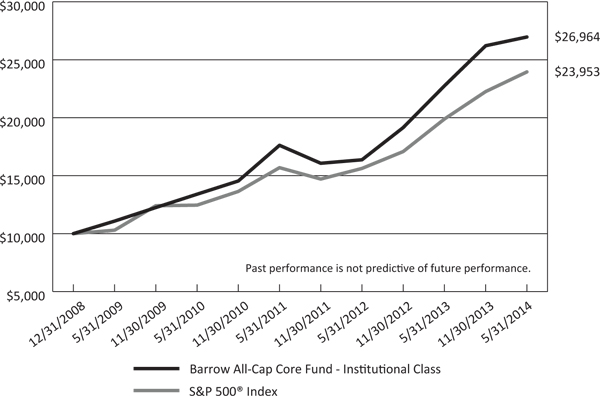
Total Return(a) For the fiscal period | Average Annual Total Returns(a) (b) For the periods ended May 31, 2014 | |||
| 8/30/13 - 5/31/14 | 1 Year | 5 Year | Since Inception (12/31/08 - 5/31/14) | |
| Barrow All-Cap Core Fund - Institutional Class | 15.73% | 18.52% | 19.47% | 20.11% |
| Barrow All-Cap Core Fund - Investor Class | 15.51% | n/a | n/a | n/a |
S&P 500® Index | 19.64% | 20.45% | 18.40% | 17.51% |
4
BARROW ALL-CAP CORE FUND
PERFORMANCE INFORMATION
May 31, 2014 (Unaudited) (Continued)
PERFORMANCE INFORMATION
May 31, 2014 (Unaudited) (Continued)
Comparison of Total Rates of Return with the S&P 500® Index | |||
Barrow All-Cap Core Fund - Institutional Class(b) | S&P 500® Index | Difference | |
| Annual Total Rates of Return for the Calendar Years: | |||
| 2009 | 30.10% | 26.46% | 3.64% |
| 2010 | 18.75% | 15.06% | 3.69% |
| 2011 | 5.50% | 2.12% | 3.38% |
| 2012 | 18.77% | 16.00% | 2.77% |
| 2013 | 36.69% | 32.38% | 4.31% |
| Total Return Since Inception (not annualized) | 169.64% | 139.53% | 30.11% |
| (a) | The Fund’s total return does not reflect the deduction of taxes a shareholder would pay on Fund distributions, if any, or the redemption of Fund shares. |
| (b) | The Barrow All-Cap Core Fund - Institutional Class (the "Fund") performance includes the performance of the Barrow Street Fund LP (the "Predecessor Private Fund"), the Fund's predecessor, for the periods before the Fund's registration statement became effective. The Predecessor Private Fund was reorganized into the Institutional Class shares of the Fund at the close of business on August 30, 2013, the date the Fund commenced operations. The Fund has been managed in the same style and by the same portfolio managers since the Predecessor Private Fund’s inception on December 31, 2008. The Fund’s investment goals, policies, guidelines and restrictions are, in all material respects, equivalent to those of the Predecessor Private Fund. The performance of the Predecessor Private Fund is net of management fees of 1.50% of assets but does not include the effect of a 20% performance fee which was in place until October 7, 2012. The prior performance of the Predecessor Private Fund was not subject to certain investment restrictions, diversification requirements and other restrictions of the Investment Company Act of 1940, as amended, or Subchapter M of the Internal Revenue Code of 1986, as amended. If such restrictions had been applicable, they might have adversely affected the Predecessor Private Fund’s performance. |
5
BARROW ALL-CAP LONG/SHORT FUND LETTER TO SHAREHOLDERS | July 24, 2014 |
Dear Shareholders,
We are pleased to report on the status and performance of the Barrow All-Cap Long/Short Fund (the “Fund”) for the fiscal period ended 5/31/14. We believe the Fund owns a well-positioned long portfolio of equity positions in excellent businesses at attractive valuations that feature high returns on capital, wide operating margins, and low debt loads. The Fund also sells short the common stock of companies with poor business characteristics that are trading at what we consider to be high prices. Our long and short portfolios are highly diversified by market cap segments (large, mid, small), industry sectors, and issuers.
We believe the Fund is well positioned to do well in any future market conditions, especially a bear market. In our view, the long and short portfolios are cheap and expensive, respectively, on an absolute basis and in relation to the U.S. stock market as represented by the S&P 500 Index. The Fund’s short portfolio is designed to provide a meaningful hedge against the market’s potential downside volatility.
Barrow Street launched the Fund on August 30, 2013. For the nine months ended 5/31/14, the Fund posted a total return of 4.10%, which compares to 19.64% for the S&P 500 Index and 9.16% for the HFRI Equity Hedge Index. The Fund substantially lagged the performance of the S&P 500 due to the successful implementation of its mission to hedge a significant amount of market exposure.
The Fund maintains a gross exposure of approximately 220% of its net capital with long exposure of 130%, short exposure of 90%, and net exposure of 40%. Over the nine months since the Fund’s inception, the Fund’s long portfolio generated an unleveraged gross total return of +16.63% (excluding fees and expenses), which trailed the S&P 500 by 301 basis points largely because the Fund’s mid cap and small cap positions significantly underperformed the S&P 500 along with mid and small cap indices.
The gross total return of the stocks in the Fund’s short portfolio was +15.73% (excluding fees and expenses) including substitute dividend payments, which impacted the Fund’s performance by -14.18% given the Fund’s average short exposure of -90.1%. Increasing prices of shorted securities reduce a hedged fund’s value. While the Fund’s short portfolio negatively impacted the Fund’s performance over this period, the total return of the stocks in the Fund’s short portfolio was 390 basis points less than the S&P 500 Index, which rose 19.64% including substitute dividend payments. The Fund’s all cap, large cap, mid cap and small cap short positions increased by 15.73%, 17.59%, 13.85% and 15.87%, respectively, including substitute dividend payments.
The Fund continued to implement its “go-anywhere” U.S. equities strategy, which uses a proprietary private equity approach applied across the market spectrum to uncover opportunities to: 1) purchase quality companies trading at temporary discounts to their intrinsic values; and 2) sell short the stock of lower quality companies trading at prices
6
well above their intrinsic values. To increase our chances for success, we harness these opportunities by investing in a variety of positions diversified across market cap and industry sectors.
Over the fiscal period, we uncovered 59 new long opportunities in six industry sectors, including 21 small caps, 21 mid caps, and 17 large caps. We believe all of these new additions to the Fund’s portfolio are excellent companies with strong balance sheets. They are generally using their ample free cash flow to: a) re-invest in growth opportunities at high rates of return; b) pay dividends; c) repurchase stock at attractive valuations; and/or d) retire outstanding debt. In tandem, we initiated 219 new short positions, including 106 small caps, 51 mid caps and 62 large caps. We believe these companies are overpriced and exhibit weak quality characteristics.
In keeping with our practice, the Fund’s investments were sourced by taking account of the opportunity set of all companies in our broad investment universe each time we committed capital to a new position. We think this approach allows us to uncover excellent investment opportunities that arise from temporary market inefficiencies and to gather up the most compelling investments across a wide array of industries and market caps while avoiding the destructive behavioral biases inherent in concentrated-stock and sector-specialized investing.
The three best-contributing long positions for the period ended 5/31/14 were: Endo International plc, Smith & Wesson Holding Corporation, and Lorillard, Inc., which generated total returns of +71.79%, +45.16% and +52.02%, respectively, and increased the Fund’s return by 83 bps, 62 bps and 60 bps, respectively. The three worst-contributing long positions were Express, Inc., Terra Nitrogen Company, L.P., and Coach, Inc., which generated total returns of -39.92%, -32.16%, and -21.41%, respectively, and reduced the Fund’s return by 60 bps, 47 bps and 36 bps, respectively.
The three best-contributing short positions for the period ended 5/31/14 were: Natural Grocers by Vitamin C, Inc., Medidata Solutions, Inc., and Annie’s, Inc., which generated total returns of-46.07%, -13.53% and -28.76%, respectively, and increased the Fund’s return by 17 bps, 10 bps and 10 bps, respectively. The three worst-contributing short positions were Forest Laboratories, Inc., Pacira Pharmaceuticals, Inc., and Cadence Pharmaceuticals, Inc. which generated total returns of +122.85%, +114.27% and, +156.51% respectively, and reduced the Fund’s return by 31 bps, 22 bps and 20 bps, respectively.
Seven of the Fund’s long positions were announced as take-over targets since 8/30/13, which was approximately 2.1x the market average.1 On the short side, 21 of the Fund’s positions were announced as a take-over targets since 8/30/13, which was approximately 1.5x the market average.1
Since 8/30/13, the long portfolio generated an unleveraged gross total return of +16.63% (excluding fees and expenses), including +21.05% for large caps, +13.96% for mid caps and +14.07% for small caps. This compares to +19.64% for the S&P 500 TR Index, +17.66% for the S&P 400 Midcap TR Index, and +13.32% for the Russell 2000 TR Index. The sectors held by the Fund with the best performance were Health Care
7
and Energy, which generated total returns of +25.83% and +25.53%, respectively. The two sectors held by the Fund that did least well were Consumer Discretionary and Materials, which returned +0.12% and +8.21%, respectively.
Over the same period, the Fund’s short portfolio generated an unleveraged gross total return of -15.73% (excluding fees and expenses), including -17.59% for large caps, -13.85% for mid caps and -15.87% for small caps. Our sectors with the best performance were Consumer Discretionary and Consumer Staples, which returned -12.82% and -13.59%, respectively. Our sectors that did least well were Materials and Energy, which generated total returns of -19.54% and -19.10%, respectively.
Given the quality and value we see in the Fund’s long portfolio and find lacking in the Fund’s short portfolio, we remain confident in the Fund’s long-term ability to produce attractive equity-like returns with less volatility than the overall market, especially during market downturns.
You can find more information about the Fund’s portfolio on the Barrow Funds website (www.barrowfunds.com), including our unique quarterly “consolidated look-through” report in which we compare the long portfolio of the Fund with the S&P 500 Index as if they were holding companies like Berkshire Hathaway.
Sincerely,
| Nicholas Chermayeff | Robert F. Greenhill, Jr. | David R. Bechtel |
| Co-Portfolio Manager, | Co-Portfolio Manager, | Principal, |
| Investment Committee | Investment Committee | Investment Committee |
| 1 | Barrow calculates the frequency of merger and acquisition (“M&A”) activity in its portfolio on a quarterly basis by dividing the cumulative number of portfolio holdings that have been announced as merger or acquisition targets by the cumulative number of unique holdings it has held in its portfolio. Barrow calculates the frequency of M&A activity in the market on a quarterly basis by dividing the cumulative number of publicly-traded U.S. common stocks that have been announced as acquisition targets per Bloomberg by the total universe of publicly-traded U.S. common stocks as identified by Bloomberg (approximately 10,000). |
Past performance is not predictive of future performance. Investment results and principal value will fluctuate so that shares, when redeemed, may be worth more or less than their original cost. Current performance may be higher or lower than the performance data quoted. Performance data current to the most recent month end are available by calling 1-877-767-6633.
An investor should consider the investment objectives, risks, charges and expenses of the Fund carefully before investing. The Fund’s prospectus contains this and other important information. To obtain a copy of the Fund’s prospectus please visit our website at www.barrowfunds.com or call 1-877-767-6633 and a copy will be sent to you free of charge. Please read the prospectus carefully before you invest. The Fund is distributed by Ultimus Fund Distributors, LLC.
8
The Letter to Shareholders seeks to describe some of the Adviser’s current opinions and views of the financial markets. Although the Adviser believes it has a reasonable basis for any opinions or views expressed, actual results may differ, sometimes significantly so, from those expected or expressed. The securities held by the Fund that are discussed in the Letter to Shareholders were held during the period covered by this Report. They do not comprise the entire investment portfolio of the Fund, may be sold at any time and may no longer be held by the Fund. The opinions of the Fund’s Adviser with respect to those securities may change at any time.
9
BARROW ALL-CAP LONG/SHORT FUND
PERFORMANCE INFORMATION
May 31, 2014 (Unaudited)
PERFORMANCE INFORMATION
May 31, 2014 (Unaudited)
Comparison of the Change in Value of a $10,000 Investment in
Barrow All-Cap Long/Short Fund versus the S&P 500® Index
Barrow All-Cap Long/Short Fund versus the S&P 500® Index
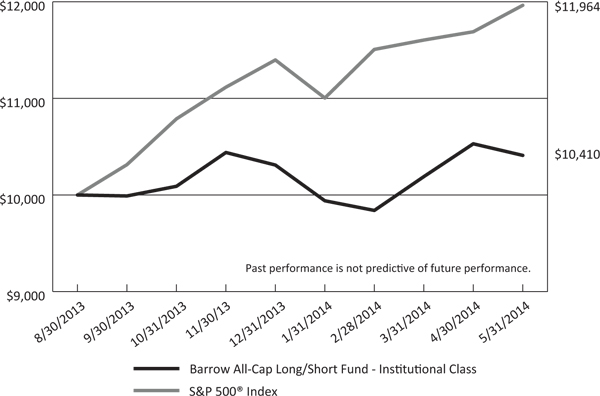
Total Returns(a) For the period ended May 31, 2014 | |
Since Inception(b) | |
| Barrow All-Cap Long/Short Fund - Institutional Class | 4.10% |
| Barrow All-Cap Long/Short Fund - Investor Class | 3.90% |
S&P 500® Index | 19.64% |
| (a) | The Fund's total return does not reflect the deduction of taxes a shareholder would pay on Fund distributions, if any, or the redemption of Fund shares. |
| (b) | The Fund commenced operations on August 30, 2013. |
10
BARROW ALL-CAP CORE FUND
PORTFOLIO INFORMATION
May 31, 2014 (Unaudited)
PORTFOLIO INFORMATION
May 31, 2014 (Unaudited)
Sector Diversification
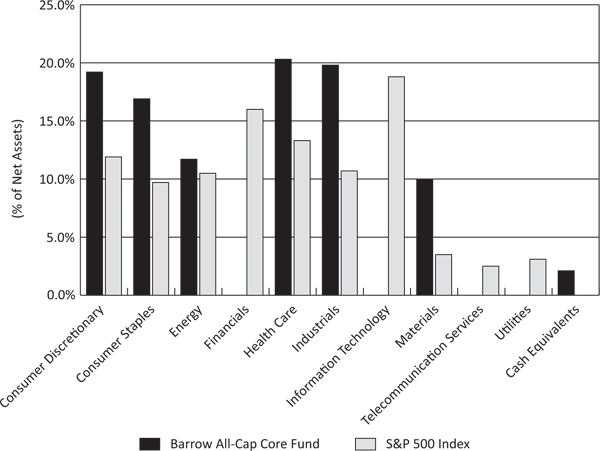
Top 10 Equity Holdings
| Security Description | % of Net Assets | |
| Smith & Wesson Holding Corporation | 1.4% | |
| Deluxe Corporation | 1.3% | |
| Lorillard, Inc. | 1.3% | |
| Vector Group Ltd. | 1.3% | |
| Cardinal Health, Inc. | 1.2% | |
| Reynolds American, Inc. | 1.2% | |
| AmSurg Corporation | 1.2% | |
| Myriad Genetics, Inc. | 1.2% | |
| Northrop Grumman Corporation | 1.2% | |
| PDL BioPharma, Inc. | 1.2% |
11
BARROW ALL-CAP LONG/SHORT FUND
PORTFOLIO INFORMATION
May 31, 2014 (Unaudited)
PORTFOLIO INFORMATION
May 31, 2014 (Unaudited)
Net Sector Exposure Diversification*
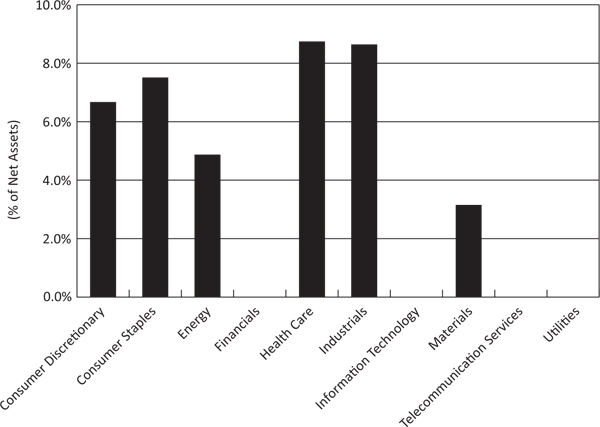
| * | The net percentages are computed by taking the net dollar exposure, including short positions, and dividing by the net assets of the Fund. Consequently, the percentages will not total to 100%. |
| Top 10 Long Common Stocks | Top 10 Short Common Stocks | |||
| Security Description | % of Net Assets | Security Description | % of Net Assets | |
| Smith & Wesson Holding Corporation | 1.9% | WhiteWave Foods Company, (The) - Class A | 0.5% | |
| Deluxe Corporation | 1.8% | Cal-Maine Foods, Inc. | 0.5% | |
| Lorillard, Inc. | 1.8% | TreeHouse Foods, Inc. | 0.5% | |
| Vector Group Ltd. | 1.7% | United Natural Foods, Inc. | 0.5% | |
| Cardinal Health, Inc. | 1.6% | LifePoint Hospitals, Inc. | 0.4% | |
| Northrop Grumman Corporation | 1.6% | Snyder's-Lance, Inc. | 0.4% | |
| Reynolds American, Inc. | 1.6% | Actavis plc | 0.4% | |
| AmSurg Corporation | 1.6% | Tootsie Roll Industries, Inc. | 0.4% | |
| Myriad Genetics, Inc. | 1.6% | Fresh Del Monte Produce, Inc. | 0.4% | |
| PDL BioPharma, Inc. | 1.6% | Boston Beer Company, Inc. - Class A | 0.4% | |
12
BARROW ALL-CAP CORE FUND SCHEDULE OF INVESTMENTS May 31, 2014 | ||||||||
| COMMON STOCKS — 97.9% | Shares | Value | ||||||
| Consumer Discretionary — 19.2% | ||||||||
| Automobiles — 0.2% | ||||||||
| Thor Industries, Inc. | 737 | $ | 44,220 | |||||
| Diversified Consumer Services — 1.2% | ||||||||
H&R Block, Inc. (a) | 4,922 | 146,577 | ||||||
Outerwall, Inc. (a) (b) | 1,321 | 93,434 | ||||||
Weight Watchers International, Inc. (a) | 798 | 16,623 | ||||||
| 256,634 | ||||||||
| Hotels, Restaurants & Leisure — 0.9% | ||||||||
International Game Technology (a) | 10,864 | 136,343 | ||||||
Interval Leisure Group, Inc. (a) | 3,006 | 61,593 | ||||||
| 197,936 | ||||||||
| Household Durables — 0.1% | ||||||||
Tupperware Brands Corporation (a) | 217 | 18,167 | ||||||
| Leisure Products — 2.8% | ||||||||
LeapFrog Enterprises, Inc. (a) (b) | 9,824 | 68,080 | ||||||
Smith & Wesson Holding Corporation (a) (b) | 19,472 | 309,215 | ||||||
Sturm, Ruger & Company, Inc. (a) | 3,741 | 226,780 | ||||||
| 604,075 | ||||||||
| Media — 4.4% | ||||||||
Crown Media Holdings, Inc. - Class A (a) (b) | 6,602 | 23,569 | ||||||
DIRECTV (a) (b) | 2,695 | 222,176 | ||||||
Gannett Company, Inc. (a) | 1,783 | 49,550 | ||||||
| Harte-Hanks, Inc. | 4,646 | 33,033 | ||||||
Interpublic Group of Companies, Inc. (a) | 9,477 | 181,200 | ||||||
John Wiley & Sons, Inc. - Class A (a) | 886 | 48,535 | ||||||
| Meredith Corporation | 47 | 2,113 | ||||||
National CineMedia, Inc. (a) | 13,535 | 212,093 | ||||||
| Omnicom Group, Inc. | 270 | 19,211 | ||||||
Starz - Series A (b) | 3,363 | 102,908 | ||||||
| Time Warner, Inc. | 260 | 18,156 | ||||||
| Viacom, Inc. - Class B | 651 | 55,550 | ||||||
| 968,094 | ||||||||
| Specialty Retail — 6.9% | ||||||||
American Eagle Outfitters, Inc. (a) | 8,076 | 86,655 | ||||||
Bed Bath & Beyond, Inc. (a) (b) | 1,774 | 107,948 | ||||||
| Best Buy Company, Inc. | 1,004 | 27,771 | ||||||
Buckle, Inc. (The) (a) | 4,712 | 211,333 | ||||||
13
BARROW ALL-CAP CORE FUND SCHEDULE OF INVESTMENTS (Continued) | ||||||||
| COMMON STOCKS — 97.9% (Continued) | Shares | Value | ||||||
| Consumer Discretionary — 19.2% (Continued) | ||||||||
| Specialty Retail — 6.9% (Continued) | ||||||||
Cato Corporation (The) - Class A (a) | 1,870 | $ | 53,931 | |||||
Chico's FAS, Inc. (a) | 126 | 1,910 | ||||||
Express, Inc. (a) (b) | 12,296 | 155,053 | ||||||
Foot Locker, Inc. (a) | 3,379 | 162,800 | ||||||
Francesca's Holdings Corporation (a) (b) | 10,047 | 154,121 | ||||||
GameStop Corporation - Class A (a) | 4,243 | 160,597 | ||||||
Gap, Inc. (The) (a) | 4,445 | 183,267 | ||||||
| GNC Holdings, Inc. - Class A | 490 | 18,091 | ||||||
Select Comfort Corporation (a) (b) | 9,392 | 174,128 | ||||||
| 1,497,605 | ||||||||
| Textiles, Apparel & Luxury Goods — 2.7% | ||||||||
Coach, Inc. (a) | 4,425 | 180,142 | ||||||
Iconix Brand Group, Inc. (a) (b) | 3,913 | 164,111 | ||||||
Steven Madden Ltd. (a) (b) | 6,673 | 212,602 | ||||||
Vera Bradley, Inc. (b) | 764 | 20,590 | ||||||
| 577,445 | ||||||||
| Consumer Staples — 16.9% | ||||||||
| Beverages — 1.1% | ||||||||
Dr Pepper Snapple Group, Inc. (a) | 3,501 | 202,008 | ||||||
National Beverage Corporation (a) (b) | 1,770 | 32,780 | ||||||
| 234,788 | ||||||||
| Food Products — 5.3% | ||||||||
B&G Foods, Inc. (a) | 2,119 | 72,597 | ||||||
Darling Ingredients, Inc. (a) (b) | 6,170 | 123,338 | ||||||
Dean Foods Company (a) | 4,023 | 69,920 | ||||||
Hillshire Brands Company (The) (a) | 1,056 | 56,263 | ||||||
| Ingredion, Inc. | 823 | 62,671 | ||||||
| J & J Snack Foods Corporation | 197 | 18,453 | ||||||
| Kellogg Company | 594 | 40,974 | ||||||
| Kraft Foods Group, Inc. | 1,733 | 103,044 | ||||||
Lancaster Colony Corporation (a) | 2,575 | 229,922 | ||||||
Pilgrim's Pride Corporation (a) (b) | 7,729 | 196,626 | ||||||
| Pinnacle Foods, Inc. | 732 | 22,919 | ||||||
| Sanderson Farms, Inc. | 943 | 87,237 | ||||||
Seaboard Corporation (b) | 22 | 59,287 | ||||||
| 1,143,251 | ||||||||
| Household Products — 1.2% | ||||||||
Energizer Holdings, Inc. (a) | 1,090 | 126,440 | ||||||
| Spectrum Brands Holdings, Inc. | 1,597 | 124,359 | ||||||
14
BARROW ALL-CAP CORE FUND SCHEDULE OF INVESTMENTS (Continued) | ||||||||
| COMMON STOCKS — 97.9% (Continued) | Shares | Value | ||||||
| Consumer Staples — 16.9% (Continued) | ||||||||
| Household Products — 1.2% (Continued) | ||||||||
| WD-40 Company | 254 | $ | 18,331 | |||||
| 269,130 | ||||||||
| Personal Products — 3.4% | ||||||||
| Herbalife Ltd. | 600 | 38,898 | ||||||
Inter Parfums, Inc. (a) | 6,726 | 200,906 | ||||||
Nu Skin Enterprises, Inc. - Class A (a) | 1,628 | 120,211 | ||||||
Revlon, Inc. - Class A (a) (b) | 5,255 | 165,638 | ||||||
USANA Health Sciences, Inc. (a) (b) | 2,942 | 211,559 | ||||||
| 737,212 | ||||||||
| Tobacco — 5.9% | ||||||||
Altria Group, Inc. (a) | 6,008 | 249,692 | ||||||
Lorillard, Inc. (a) | 4,532 | 281,754 | ||||||
Philip Morris International, Inc. (a) | 2,351 | 208,158 | ||||||
Reynolds American, Inc. (a) | 4,336 | 258,556 | ||||||
Vector Group Ltd. (a) | 13,323 | 278,584 | ||||||
| 1,276,744 | ||||||||
| Energy — 11.7% | ||||||||
| Energy Equipment & Services — 1.7% | ||||||||
C&J Energy Services, Inc. (a) (b) | 5,194 | 158,988 | ||||||
Geospace Technologies Corporation (b) | 1,527 | 77,450 | ||||||
National Oilwell Varco, Inc. (a) | 1,682 | 137,705 | ||||||
| 374,143 | ||||||||
| Oil, Gas & Consumable Fuels — 10.0% | ||||||||
| Alliance Resource Partners, L.P. | 199 | 18,099 | ||||||
Alon USA Energy, Inc. (a) | 5,321 | 79,549 | ||||||
Alon USA Partners, L.P. (a) | 11,307 | 220,147 | ||||||
| BP Prudhoe Bay Royalty Trust | 339 | 30,764 | ||||||
Chevron Corporation (a) | 168 | 20,629 | ||||||
CVR Energy, Inc. (a) | 1,954 | 91,955 | ||||||
CVR Refining, L.P. (a) | 7,247 | 194,002 | ||||||
Delek US Holdings, Inc. (a) | 3,930 | 122,105 | ||||||
| Green Plains, Inc. | 700 | 20,454 | ||||||
HollyFrontier Corporation (a) | 4,847 | 238,715 | ||||||
Marathon Oil Corporation (a) | 5,761 | 211,198 | ||||||
Marathon Petroleum Corporation (a) | 2,586 | 231,163 | ||||||
Northern Tier Energy, L.P. (a) | 8,817 | 245,906 | ||||||
Phillips 66 (a) | 1,484 | 125,828 | ||||||
Renewable Energy Group, Inc. (a) (b) | 4,105 | 40,598 | ||||||
Tesoro Corporation (a) | 618 | 34,732 | ||||||
VAALCO, Inc. (b) | 2,075 | 13,488 | ||||||
15
BARROW ALL-CAP CORE FUND SCHEDULE OF INVESTMENTS (Continued) | ||||||||
| COMMON STOCKS — 97.9% (Continued) | Shares | Value | ||||||
Energy — 11.7% (Continued) | ||||||||
| Oil, Gas & Consumable Fuels — 10.0% (Continued) | ||||||||
| Valero Energy Corporation | 330 | $ | 18,497 | |||||
Western Refining, Inc. (a) | 5,373 | 220,400 | ||||||
| 2,178,229 | ||||||||
| Health Care — 20.3% | ||||||||
| Biotechnology — 3.5% | ||||||||
Myriad Genetics, Inc. (a) (b) | 7,700 | 255,332 | ||||||
PDL BioPharma, Inc. (a) | 26,808 | 251,191 | ||||||
Spectrum Pharmaceuticals, Inc. (a) (b) | 6,608 | 51,476 | ||||||
United Therapeutics Corporation (a) (b) | 2,112 | 202,203 | ||||||
| 760,202 | ||||||||
| Health Care Equipment & Supplies — 2.8% | ||||||||
Abbott Laboratories (a) | 467 | 18,685 | ||||||
Align Technology, Inc. (b) | 251 | 13,707 | ||||||
C.R. Bard, Inc. (a) | 158 | 23,370 | ||||||
CareFusion Corporation (b) | 498 | 21,379 | ||||||
Globus Medical, Inc. - Class A (a) (b) | 10,214 | 246,974 | ||||||
ICU Medical, Inc. (b) | 208 | 12,495 | ||||||
Medtronic, Inc. (a) | 3,561 | 217,328 | ||||||
| Meridian Bioscience, Inc. | 636 | 12,981 | ||||||
Sirona Dental Systems, Inc. (b) | 169 | 12,712 | ||||||
Thoratec Corporation (b) | 884 | 29,278 | ||||||
| 608,909 | ||||||||
| Health Care Providers & Services — 11.3% | ||||||||
AmerisourceBergen Corporation (a) | 1,510 | 110,502 | ||||||
AMN Healthcare Services, Inc. (a) (b) | 8,510 | 95,312 | ||||||
AmSurg Corporation (a) (b) | 5,647 | 255,696 | ||||||
Bio-Reference Laboratories, Inc. (a) (b) | 7,380 | 197,489 | ||||||
Cardinal Health, Inc. (a) | 3,712 | 262,178 | ||||||
Chemed Corporation (a) | 2,600 | 229,008 | ||||||
HealthSouth Corporation (a) | 5,784 | 203,134 | ||||||
Laboratory Corporation of America Holdings (a) (b) | 2,247 | 230,497 | ||||||
MEDNAX, Inc. (a) (b) | 3,060 | 176,348 | ||||||
| Owens & Minor, Inc. | 367 | 12,728 | ||||||
Patterson Companies, Inc. (a) | 3,382 | 132,439 | ||||||
PharMerica Corporation (b) | 2,494 | 67,687 | ||||||
Quest Diagnostics, Inc. (a) | 3,810 | 228,181 | ||||||
| Select Medical Holdings Corporation | 6,211 | 94,097 | ||||||
VCA, Inc. (a) (b) | 4,593 | 154,554 | ||||||
| 2,449,850 | ||||||||
16
BARROW ALL-CAP CORE FUND SCHEDULE OF INVESTMENTS (Continued) | ||||||||
| COMMON STOCKS — 97.9% (Continued) | Shares | Value | ||||||
| Health Care — 20.3% (Continued) | ||||||||
| Health Care Technology — 0.1% | ||||||||
| Computer Programs & Systems, Inc. | 538 | $ | 34,206 | |||||
Quality Systems, Inc. (a) | 125 | 1,946 | ||||||
| 36,152 | ||||||||
| Pharmaceuticals — 2.6% | ||||||||
| AbbVie, Inc. | 335 | 18,201 | ||||||
Auxilium Pharmaceuticals, Inc. (a) (b) | 2,104 | 47,087 | ||||||
| Eli Lilly & Company | 1,182 | 70,754 | ||||||
Endo International plc (a) (b) | 2,193 | 154,804 | ||||||
Pfizer, Inc. (a) | 2,439 | 72,268 | ||||||
Prestige Brands Holdings, Inc. (a) (b) | 5,838 | 199,660 | ||||||
| 562,774 | ||||||||
| Industrials — 19.8% | ||||||||
| Aerospace & Defense — 4.9% | ||||||||
Alliant Techsystems, Inc. (a) | 414 | 52,284 | ||||||
Cubic Corporation (a) | 1,824 | 88,738 | ||||||
Engility Holdings, Inc. (a) (b) | 3,938 | 152,204 | ||||||
Exelis, Inc. (a) | 13,841 | 236,404 | ||||||
National Presto Industries, Inc. (a) | 706 | 49,695 | ||||||
Northrop Grumman Corporation (a) | 2,097 | 254,890 | ||||||
Raytheon Company (a) | 2,440 | 238,071 | ||||||
| 1,072,286 | ||||||||
| Commercial Services & Supplies — 3.3% | ||||||||
| ADT Corporation (The) | 1,760 | 56,672 | ||||||
| Avery Dennison Corporation | 742 | 37,619 | ||||||
Deluxe Corporation (a) | 5,036 | 282,469 | ||||||
Performant Financial Corporation (a) (b) | 12,187 | 115,655 | ||||||
Pitney Bowes, Inc. (a) | 8,420 | 232,645 | ||||||
| 725,060 | ||||||||
| Construction & Engineering — 0.8% | ||||||||
| Fluor Corporation | 718 | 53,907 | ||||||
KBR, Inc. (a) | 4,726 | 114,795 | ||||||
| 168,702 | ||||||||
| Electrical Equipment — 0.8% | ||||||||
| Babcock & Wilcox Company (The) | 1,962 | 63,412 | ||||||
| Brady Corporation - Class A | 680 | 18,448 | ||||||
Emerson Electric Company (a) | 1,486 | 99,161 | ||||||
| 181,021 | ||||||||
17
BARROW ALL-CAP CORE FUND SCHEDULE OF INVESTMENTS (Continued) | ||||||||
| COMMON STOCKS — 97.9% (Continued) | Shares | Value | ||||||
| Industrials — 19.8% (Continued) | ||||||||
| Machinery — 5.1% | ||||||||
| American Railcar Industries, Inc. | 986 | $ | 64,386 | |||||
Crane Company (a) | 865 | 64,105 | ||||||
Deere & Company (a) | 1,744 | 159,001 | ||||||
| Dover Corporation | 230 | 20,051 | ||||||
Joy Global, Inc. (a) | 3,082 | 176,136 | ||||||
Lindsay Corporation (a) | 2,514 | 211,905 | ||||||
Oshkosh Corporation (a) | 2,300 | 124,315 | ||||||
PACCAR, Inc. (a) | 959 | 60,762 | ||||||
Valmont Industries, Inc. (a) | 1,406 | 217,860 | ||||||
| 1,098,521 | ||||||||
| Professional Services — 4.6% | ||||||||
Dun & Bradstreet Corporation (The) (a) | 2,189 | 226,014 | ||||||
Exponent, Inc. (a) | 300 | 21,219 | ||||||
FTI Consulting, Inc. (a) (b) | 1,994 | 64,346 | ||||||
Huron Consulting Group, Inc. (a) (b) | 1,360 | 92,317 | ||||||
| Insperity, Inc. | 1,824 | 58,404 | ||||||
Korn/Ferry International (a) (b) | 949 | 28,821 | ||||||
Navigant Consulting, Inc. (a) (b) | 11,175 | 188,075 | ||||||
Resources Connection, Inc. (a) | 4,264 | 52,874 | ||||||
Robert Half International, Inc. (a) | 1,018 | 46,411 | ||||||
RPX Corporation (a) (b) | 13,228 | 214,955 | ||||||
| 993,436 | ||||||||
| Road & Rail — 0.2% | ||||||||
Landstar System, Inc. (a) | 634 | 41,166 | ||||||
| Trading Companies & Distributors — 0.1% | ||||||||
United Rentals, Inc. (b) | 197 | 19,907 | ||||||
| Materials — 10.0% | ||||||||
| Chemicals — 7.4% | ||||||||
| American Vanguard Corporation | 866 | 13,180 | ||||||
CF Industries Holdings, Inc. (a) | 1,021 | 248,419 | ||||||
| Eastman Chemical Company | 847 | 74,756 | ||||||
Ferro Corporation (b) | 1,492 | 19,098 | ||||||
FutureFuel Corporation (a) | 9,860 | 169,395 | ||||||
Innospec, Inc. (a) | 1,210 | 51,026 | ||||||
Koppers Holdings, Inc. (a) | 1,362 | 49,495 | ||||||
| LyondellBasell Industries N.V. - Class A | 496 | 49,387 | ||||||
NewMarket Corporation (a) | 602 | 235,689 | ||||||
Olin Corporation (a) | 7,832 | 213,422 | ||||||
18
BARROW ALL-CAP CORE FUND SCHEDULE OF INVESTMENTS (Continued) | ||||||||
| COMMON STOCKS — 97.9% (Continued) | Shares | Value | ||||||
| Materials — 10.0% (Continued) | ||||||||
| Chemicals — 7.4% (Continued) | ||||||||
PetroLogistics, L.P. (a) | 10,465 | $ | 150,801 | |||||
Rentech Nitrogen Partners, L.P. (a) | 1,650 | 26,862 | ||||||
| Scotts Miracle-Gro Company (The) - Class A | 619 | 37,109 | ||||||
Terra Nitrogen Company, L.P. (a) | 1,309 | 181,820 | ||||||
| Westlake Chemical Corporation | 1,266 | 102,356 | ||||||
| 1,622,815 | ||||||||
| Containers & Packaging — 1.7% | ||||||||
Crown Holdings, Inc. (b) | 1,217 | 59,450 | ||||||
Gold Resource Corporation (a) | 3,715 | 16,272 | ||||||
Kaiser Aluminum Corporation (a) | 1,628 | 111,469 | ||||||
Reliance Steel & Aluminum Company (a) | 267 | 19,211 | ||||||
Southern Copper Corporation (a) | 5,414 | 160,904 | ||||||
| 367,306 | ||||||||
| Paper & Forest Products — 0.9% | ||||||||
Louisiana-Pacific Corporation (a) (b) | 6,669 | 94,700 | ||||||
Schweitzer-Mauduit International, Inc. (a) | 2,293 | 95,572 | ||||||
| 190,272 | ||||||||
Total Common Stocks (Cost $18,447,801) | $ | 21,276,052 | ||||||
| MONEY MARKET FUNDS — 2.0% | Shares | Value | ||||||
Fidelity Institutional Money Market Government Portfolio - Class I, 0.01% (c) (Cost $439,876) | 439,876 | $ | 439,876 | |||||
Total Investments at Value — 99.9% (Cost $18,887,677) | $ | 21,715,928 | ||||||
| Other Assets in Excess of Liabilities — 0.1% | 23,238 | |||||||
| Net Assets — 100.0% | $ | 21,739,166 | ||||||
| (a) | All or a portion of the shares have been pledged as collateral for the bank line of credit (Note 5). |
| (b) | Non-income producing security. |
| (c) | The rate shown is the 7-day effective yield as of May 31, 2014. |
| See accompanying notes to financial statements. | |
19
BARROW ALL-CAP LONG/SHORT FUND SCHEDULE OF INVESTMENTS May 31, 2014 | ||||||||
| COMMON STOCKS — 131.0% | Shares | Value | ||||||
| Consumer Discretionary — 25.9% | ||||||||
| Automobiles — 0.3% | ||||||||
Thor Industries, Inc. (a) | 202 | $ | 12,120 | |||||
| Diversified Consumer Services — 1.6% | ||||||||
H&R Block, Inc. (a) | 1,319 | 39,280 | ||||||
Outerwall, Inc. (a) (b) | 356 | 25,180 | ||||||
Weight Watchers International, Inc. (a) | 219 | 4,561 | ||||||
| 69,021 | ||||||||
| Hotels, Restaurants & Leisure — 1.2% | ||||||||
International Game Technology (a) | 2,958 | 37,123 | ||||||
Interval Leisure Group, Inc. (a) | 816 | 16,720 | ||||||
| 53,843 | ||||||||
| Household Durables — 0.1% | ||||||||
Tupperware Brands Corporation (a) | 57 | 4,772 | ||||||
| Leisure Products — 3.8% | ||||||||
LeapFrog Enterprises, Inc. (a) (b) | 2,692 | 18,655 | ||||||
Smith & Wesson Holding Corporation (a) (b) | 5,312 | 84,355 | ||||||
Sturm, Ruger & Company, Inc. (a) | 1,018 | 61,711 | ||||||
| 164,721 | ||||||||
| Media — 6.0% | ||||||||
Crown Media Holdings, Inc. - Class A (a) (b) | 1,796 | 6,412 | ||||||
DIRECTV (a) (b) | 741 | 61,088 | ||||||
Gannett Company, Inc. (a) | 489 | 13,589 | ||||||
| Harte-Hanks, Inc. | 1,272 | 9,044 | ||||||
Interpublic Group of Companies, Inc. (a) | 2,578 | 49,291 | ||||||
John Wiley & Sons, Inc. - Class A (a) | 238 | 13,038 | ||||||
Meredith Corporation (a) | 9 | 405 | ||||||
National CineMedia, Inc. (a) | 3,686 | 57,759 | ||||||
| Omnicom Group, Inc. | 73 | 5,194 | ||||||
Starz - Series A (a) (b) | 915 | 27,999 | ||||||
| Time Warner, Inc. | 70 | 4,888 | ||||||
| Viacom, Inc. - Class B | 175 | 14,933 | ||||||
| 263,640 | ||||||||
| Specialty Retail — 9.3% | ||||||||
American Eagle Outfitters, Inc. (a) | 2,212 | 23,735 | ||||||
Bed Bath & Beyond, Inc. (a) (b) | 485 | 29,512 | ||||||
| Best Buy Company, Inc. | 271 | 7,496 | ||||||
Buckle, Inc. (The) (a) | 1,289 | 57,812 | ||||||
20
BARROW ALL-CAP LONG/SHORT FUND SCHEDULE OF INVESTMENTS (Continued) | ||||||||
| COMMON STOCKS — 131.0% (Continued) | Shares | Value | ||||||
| Consumer Discretionary — 25.9% (Continued) | ||||||||
| Specialty Retail — 9.3% (Continued) | ||||||||
Cato Corporation (The) - Class A (a) | 510 | $ | 14,708 | |||||
Chico's FAS, Inc. (a) | 34 | 516 | ||||||
Express, Inc. (a) (b) | 3,346 | 42,193 | ||||||
Foot Locker, Inc. (a) | 923 | 44,470 | ||||||
Francesca's Holdings Corporation (a) (b) | 2,742 | 42,062 | ||||||
GameStop Corporation - Class A (a) | 1,156 | 43,755 | ||||||
Gap, Inc. (The) (a) | 1,217 | 50,177 | ||||||
| GNC Holdings, Inc. - Class A | 133 | 4,910 | ||||||
Select Comfort Corporation (a) (b) | 2,559 | 47,444 | ||||||
| 408,790 | ||||||||
| Textiles, Apparel & Luxury Goods — 3.6% | ||||||||
Coach, Inc. (a) | 1,207 | 49,137 | ||||||
Iconix Brand Group, Inc. (a) (b) | 1,068 | 44,792 | ||||||
Steven Madden Ltd. (a) (b) | 1,820 | 57,985 | ||||||
Vera Bradley, Inc. (a) (b) | 207 | 5,579 | ||||||
| 157,493 | ||||||||
| Consumer Staples — 22.0% | ||||||||
| Beverages — 1.4% | ||||||||
Brown-Forman Corporation - Class B (a) | 2 | 185 | ||||||
Dr Pepper Snapple Group, Inc. (a) | 955 | 55,104 | ||||||
National Beverage Corporation (a) (b) | 479 | 8,871 | ||||||
| 64,160 | ||||||||
| Food Products — 6.4% | ||||||||
B&G Foods, Inc. (a) | 578 | 19,802 | ||||||
Darling International, Inc. (a) (b) | 1,503 | 30,045 | ||||||
Dean Foods Company (a) | 889 | 15,451 | ||||||
Hillshire Brands Company (The) (a) | 288 | 15,345 | ||||||
Ingredion, Inc. (a) | 215 | 16,372 | ||||||
| J & J Snack Foods Corporation | 53 | 4,964 | ||||||
| Kellogg Company | 28 | 1,931 | ||||||
Kraft Foods Group, Inc. (a) | 473 | 28,125 | ||||||
Lancaster Colony Corporation (a) | 702 | 62,682 | ||||||
Pilgrim's Pride Corporation (a) (b) | 2,001 | 50,905 | ||||||
| Pinnacle Foods, Inc. | 202 | 6,325 | ||||||
| Sanderson Farms, Inc. | 221 | 20,445 | ||||||
Seaboard Corporation (a) (b) | 3 | 8,085 | ||||||
| 280,477 | ||||||||
| Household Products — 1.7% | ||||||||
Energizer Holdings, Inc. (a) | 296 | 34,336 | ||||||
Spectrum Brands Holdings, Inc. (a) | 436 | 33,951 | ||||||
21
BARROW ALL-CAP LONG/SHORT FUND SCHEDULE OF INVESTMENTS (Continued) | ||||||||
| COMMON STOCKS — 131.0% (Continued) | Shares | Value | ||||||
| Consumer Staples — 22.0% (Continued) | ||||||||
| Household Products — 1.7% (Continued) | ||||||||
| WD-40 Company | 69 | $ | 4,980 | |||||
| 73,267 | ||||||||
| Personal Products — 4.6% | ||||||||
| Herbalife Ltd. | 162 | 10,502 | ||||||
Inter Parfums, Inc. (a) | 1,836 | 54,841 | ||||||
Nu Skin Enterprises, Inc. - Class A (a) | 439 | 32,416 | ||||||
Revlon, Inc. - Class A (a) (b) | 1,438 | 45,326 | ||||||
USANA Health Sciences, Inc. (a) (b) | 801 | 57,600 | ||||||
| 200,685 | ||||||||
| Tobacco — 7.9% | ||||||||
Altria Group, Inc. (a) | 1,637 | 68,034 | ||||||
Lorillard, Inc. (a) | 1,235 | 76,780 | ||||||
Philip Morris International, Inc. (a) | 639 | 56,577 | ||||||
Reynolds American, Inc. (a) | 1,180 | 70,363 | ||||||
Vector Group Ltd. (a) | 3,634 | 75,987 | ||||||
| 347,741 | ||||||||
| Energy — 15.9% | ||||||||
| Energy Equipment & Services — 2.3% | ||||||||
C&J Energy Services, Inc. (a) (b) | 1,418 | 43,405 | ||||||
Geospace Technologies Corporation (a) (b) | 416 | 21,100 | ||||||
National Oilwell Varco, Inc. (a) | 459 | 37,578 | ||||||
| 102,083 | ||||||||
| Oil, Gas & Consumable Fuels — 13.6% | ||||||||
| Alliance Resource Partners, L.P. | 54 | 4,911 | ||||||
Alon USA Energy, Inc.(a) | 1,428 | 21,349 | ||||||
Alon USA Partners, L.P. (a) | 3,091 | 60,182 | ||||||
| BP Prudhoe Bay Royalty Trust | 92 | 8,349 | ||||||
Chevron Corporation (a) | 48 | 5,894 | ||||||
CVR Energy, Inc. (a) | 529 | 24,895 | ||||||
CVR Refining, L.P. (a) | 1,981 | 53,031 | ||||||
Delek US Holdings, Inc. (a) | 1,071 | 33,276 | ||||||
| Green Plains, Inc. | 190 | 5,552 | ||||||
HollyFrontier Corporation (a) | 1,319 | 64,961 | ||||||
Marathon Oil Corporation (a) | 1,574 | 57,703 | ||||||
Marathon Petroleum Corporation (a) | 703 | 62,841 | ||||||
Northern Tier Energy, L.P. (a) | 2,408 | 67,159 | ||||||
Phillips 66 (a) | 403 | 34,170 | ||||||
Renewable Energy Group, Inc. (a) (b) | 1,121 | 11,087 | ||||||
Tesoro Corporation (a) | 170 | 9,554 | ||||||
VAALCO Energy, Inc. (b) | 562 | 3,653 | ||||||
22
BARROW ALL-CAP LONG/SHORT FUND SCHEDULE OF INVESTMENTS (Continued) | ||||||||
| COMMON STOCKS — 131.0% (Continued) | Shares | Value | ||||||
| Energy — 15.9% (Continued) | ||||||||
| Oil, Gas & Consumable Fuels — 13.6% (Continued) | ||||||||
| Valero Energy Corporation | 89 | $ | 4,988 | |||||
Western Refining, Inc. (a) | 1,472 | 60,381 | ||||||
| 593,936 | ||||||||
| Financials — 0.0% | ||||||||
| Insurance — 0.0% | ||||||||
Gerova Financial Group Ltd. (a) (b) (c) | 2 | — | ||||||
| Health Care — 27.3% | ||||||||
| Biotechnology — 4.7% | ||||||||
Myriad Genetics, Inc. (a) (b) | 2,104 | 69,769 | ||||||
PDL BioPharma, Inc. (a) | 7,309 | 68,485 | ||||||
Spectrum Pharmaceuticals, Inc. (a) (b) | 1,694 | 13,196 | ||||||
United Therapeutics Corporation (a) (b) | 580 | 55,529 | ||||||
| 206,979 | ||||||||
| Health Care Equipment & Supplies — 3.7% | ||||||||
Align Technology, Inc. (b) | 70 | 3,823 | ||||||
C.R. Bard, Inc. (a) | 43 | 6,360 | ||||||
CareFusion Corporation (a) (b) | 136 | 5,839 | ||||||
Globus Medical, Inc. - Class A (a) (b) | 2,788 | 67,414 | ||||||
ICU Medical, Inc. (b) | 57 | 3,424 | ||||||
Medtronic, Inc. (a) | 971 | 59,260 | ||||||
| Meridian Bioscience, Inc. | 173 | 3,531 | ||||||
Sirona Dental Systems, Inc. (b) | 43 | 3,234 | ||||||
Thoratec Corporation (b) | 242 | 8,015 | ||||||
| 160,900 | ||||||||
| Health Care Providers & Services — 15.2% | ||||||||
AmerisourceBergen Corporation (a) | 370 | 27,076 | ||||||
AMN Healthcare Services, Inc. (a) (b) | 2,314 | 25,917 | ||||||
AmSurg Corporation (a) (b) | 1,542 | 69,822 | ||||||
Bio-Reference Laboratories, Inc. (a) (b) | 2,014 | 53,895 | ||||||
Cardinal Health, Inc. (a) | 1,010 | 71,336 | ||||||
Chemed Corporation (a) | 710 | 62,537 | ||||||
HealthSouth Corporation (a) | 1,580 | 55,490 | ||||||
Laboratory Corporation of America Holdings (a) (b) | 615 | 63,087 | ||||||
MEDNAX, Inc. (a) (b) | 838 | 48,294 | ||||||
| Owens & Minor, Inc. | 95 | 3,295 | ||||||
Patterson Companies, Inc. (a) | 926 | 36,262 | ||||||
PharMerica Corporation (a) (b) | 685 | 18,591 | ||||||
Quest Diagnostics, Inc. (a) | 1,042 | 62,405 | ||||||
Select Medical Holdings Corporation (a) | 1,687 | 25,558 | ||||||
23
BARROW ALL-CAP LONG/SHORT FUND SCHEDULE OF INVESTMENTS (Continued) | ||||||||
| COMMON STOCKS — 131.0% (Continued) | Shares | Value | ||||||
| Health Care — 27.3% (Continued) | ||||||||
| Health Care Providers & Services — 15.2% (Continued) | ||||||||
VCA Antech, Inc. (a) (b) | 1,253 | $ | 42,163 | |||||
| 665,728 | ||||||||
| Health Care Technology — 0.2% | ||||||||
Computer Programs & Systems, Inc. (a) | 145 | 9,219 | ||||||
Quality Systems, Inc. (a) | 34 | 530 | ||||||
| 9,749 | ||||||||
| Pharmaceuticals — 3.5% | ||||||||
| AbbVie, Inc. | 89 | 4,835 | ||||||
Auxilium Pharmaceuticals, Inc. (a) (b) | 504 | 11,280 | ||||||
Eli Lilly & Company (a) | 324 | 19,395 | ||||||
Endo International plc (a) (b) | 599 | 42,283 | ||||||
Pfizer, Inc. (a) | 662 | 19,615 | ||||||
Prestige Brands Holdings, Inc. (a) (b) | 1,596 | 54,583 | ||||||
| 151,991 | ||||||||
| Industrials — 26.7% | ||||||||
| Aerospace & Defense — 6.7% | ||||||||
Alliant Techsystems, Inc. (a) | 112 | 14,145 | ||||||
Cubic Corporation (a) | 487 | 23,693 | ||||||
Engility Holdings, Inc. (a) (b) | 1,077 | 41,626 | ||||||
Exelis, Inc. (a) | 3,775 | 64,477 | ||||||
National Presto Industries, Inc. (a) | 192 | 13,515 | ||||||
Northrop Grumman Corporation (a) | 580 | 70,499 | ||||||
Raytheon Company (a) | 671 | 65,469 | ||||||
| 293,424 | ||||||||
| Commercial Services & Supplies — 4.5% | ||||||||
| ADT Corporation (The) | 477 | 15,359 | ||||||
| Avery Dennison Corporation | 201 | 10,191 | ||||||
Deluxe Corporation (a) | 1,373 | 77,012 | ||||||
Performant Financial Corporation (a) (b) | 3,333 | 31,630 | ||||||
Pitney Bowes, Inc. (a) | 2,299 | 63,521 | ||||||
| 197,713 | ||||||||
| Construction & Engineering — 1.0% | ||||||||
| Fluor Corporation | 194 | 14,566 | ||||||
KBR, Inc. (a) | 1,284 | 31,188 | ||||||
| 45,754 | ||||||||
| Electrical Equipment — 1.1% | ||||||||
| Babcock & Wilcox Company (The) | 473 | 15,287 | ||||||
Brady Corporation - Class A (a) | 189 | 5,128 | ||||||
Emerson Electric Company (a) | 410 | 27,359 | ||||||
| 47,774 | ||||||||
24
BARROW ALL-CAP LONG/SHORT FUND SCHEDULE OF INVESTMENTS (Continued) | ||||||||
| COMMON STOCKS — 131.0% (Continued) | Shares | Value | ||||||
| Industrials — 26.7% (Continued) | ||||||||
| Machinery — 6.8% | ||||||||
American Railcar Industries, Inc. (a) | 268 | $ | 17,500 | |||||
Crane Company (a) | 237 | 17,564 | ||||||
Deere & Company (a) | 479 | 43,670 | ||||||
| Dover Corporation | 63 | 5,492 | ||||||
Joy Global, Inc. (a) | 843 | 48,178 | ||||||
Lindsay Corporation (a) | 685 | 57,739 | ||||||
Oshkosh Corporation (a) | 628 | 33,943 | ||||||
PACCAR, Inc. (a) | 260 | 16,474 | ||||||
Valmont Industries, Inc. (a) | 381 | 59,036 | ||||||
| 299,596 | ||||||||
| Professional Services — 6.2% | ||||||||
Dun & Bradstreet Corporation (The) (a) | 603 | 62,260 | ||||||
Exponent, Inc. (a) | 83 | 5,871 | ||||||
FTI Consulting, Inc. (a) (b) | 540 | 17,426 | ||||||
Huron Consulting Group, Inc. (a) (b) | 371 | 25,183 | ||||||
Insperity, Inc. (a) | 494 | 15,818 | ||||||
Korn/Ferry International (a) (b) | 259 | 7,866 | ||||||
Navigant Consulting, Inc. (a) (b) | 3,045 | 51,247 | ||||||
Resources Connection, Inc. (a) | 1,168 | 14,483 | ||||||
Robert Half International, Inc. (a) | 275 | 12,537 | ||||||
RPX Corporation (a) (b) | 3,611 | 58,679 | ||||||
| 271,370 | ||||||||
| Road & Rail — 0.3% | ||||||||
Landstar System, Inc. (a) | 171 | 11,103 | ||||||
| Trading Companies & Distributors — 0.1% | ||||||||
United Rentals, Inc. (b) | 53 | 5,356 | ||||||
| Materials — 13.2% | ||||||||
| Chemicals — 9.8% | ||||||||
| American Vanguard Corporation | 233 | 3,546 | ||||||
CF Industries Holdings, Inc. (a) | 273 | 66,424 | ||||||
| Eastman Chemical Company | 219 | 19,329 | ||||||
Ferro Corporation (b) | 109 | 1,395 | ||||||
FutureFuel Corporation (a) | 2,691 | 46,231 | ||||||
Innospec, Inc. (a) | 334 | 14,085 | ||||||
Koppers Holdings, Inc. (a) | 368 | 13,373 | ||||||
LyondellBasell Industries N.V. - Class A (a) | 133 | 13,243 | ||||||
NewMarket Corporation (a) | 159 | 62,250 | ||||||
Olin Corporation (a) | 2,137 | 58,233 | ||||||
25
BARROW ALL-CAP LONG/SHORT FUND SCHEDULE OF INVESTMENTS (Continued) | ||||||||
| COMMON STOCKS — 131.0% (Continued) | Shares | Value | ||||||
| Materials — 13.2% (Continued) | ||||||||
| Chemicals — 9.8% (Continued) | ||||||||
PetroLogistics, L.P. (a) | 2,843 | $ | 40,968 | |||||
Rentech Nitrogen Partners, L.P. (a) | 454 | 7,391 | ||||||
| Scotts Miracle-Gro Company (The) - Class A | 146 | 8,753 | ||||||
Terra Nitrogen Company, L.P. (a) | 353 | 49,032 | ||||||
Westlake Chemical Corporation (a) | 346 | 27,974 | ||||||
| 432,227 | ||||||||
| Containers & Packaging — 0.4% | ||||||||
Crown Holdings, Inc. (b) | 329 | 16,071 | ||||||
| Metals & Mining — 1.8% | ||||||||
Gold Resource Corporation (a) | 1,013 | 4,437 | ||||||
Kaiser Aluminum Corporation (a) | 446 | 30,538 | ||||||
Reliance Steel & Aluminum Company (a) | 7 | 504 | ||||||
Southern Copper Corporation (a) | 1,484 | 44,104 | ||||||
| 79,583 | ||||||||
| Paper & Forest Products — 1.2% | ||||||||
Louisiana-Pacific Corporation (a) (b) | 1,774 | 25,191 | ||||||
Schweitzer-Mauduit International, Inc. (a) | 623 | 25,966 | ||||||
| 51,157 | ||||||||
Total Common Stocks (Cost $5,403,900) | $ | 5,743,224 | ||||||
26
BARROW ALL-CAP LONG/SHORT FUND SCHEDULE OF INVESTMENTS (Continued) | ||||||||
| MONEY MARKET FUNDS — 0.5% | Shares | Value | ||||||
Fidelity Institutional Money Market Government Portfolio - Class I, 0.01% (d) (Cost $22,705) | 22,705 | $ | 22,705 | |||||
Total Investments at Value — 131.5% (Cost $5,426,605) | $ | 5,765,929 | ||||||
| Liabilities in Excess of Other Assets — (31.5%) | (1,379,659 | )(e) | ||||||
| Net Assets — 100.0% | $ | 4,386,270 | ||||||
| (a) | All or a portion of the shares have been committed as collateral for open short positions and any outstanding borrowings for investment purposes (Note 2). |
| (b) | Non-income producing security. |
| (c) | Security value has been determined in good faith pursuant to procedures adopted by the Board of Trustees. The total value of such securities is $0 at May 31, 2014, representing 0.0% of net assets (Note 2). |
| (d) | The rate shown is the 7-day effective yield as of May 31, 2014. |
| (e) | Includes cash held as margin deposits for open short positions. |
| See accompanying notes to financial statements. | |
27
BARROW ALL-CAP LONG/SHORT FUND SCHEDULE OF SECURITIES SOLD SHORT May 31, 2014 | ||||||||
| COMMON STOCKS — 91.4% | Shares | Value | ||||||
| Consumer Discretionary — 19.2% | ||||||||
| Auto Components — 1.2% | ||||||||
| Allison Transmission Holdings, Inc. | 206 | $ | 6,380 | |||||
| BorgWarner, Inc. | 96 | 6,038 | ||||||
| Dorman Products, Inc. | 12 | 638 | ||||||
| Drew Industries, Inc. | 12 | 582 | ||||||
| Federal Mogul Holdings Corporation | 154 | 2,555 | ||||||
| Gentherm, Inc. | 270 | 11,105 | ||||||
| Goodyear Tire & Rubber Company (The) | 130 | 3,428 | ||||||
| Johnson Controls, Inc. | 54 | 2,611 | ||||||
| Modine Manufacturing Company | 479 | 7,314 | ||||||
| Superior Industries International, Inc. | 169 | 3,363 | ||||||
| Visteon Corporation | 77 | 7,018 | ||||||
| 51,032 | ||||||||
| Automobiles — 0.4% | ||||||||
| General Motors Company | 129 | 4,461 | ||||||
| Harley-Davidson, Inc. | 81 | 5,770 | ||||||
| Tesla Motors, Inc. | 31 | 6,441 | ||||||
| Winnebago Industries, Inc. | 104 | 2,575 | ||||||
| 19,247 | ||||||||
| Distributors — 0.4% | ||||||||
| Core-Mark Holding Company, Inc. | 90 | 7,441 | ||||||
| LKQ Corporation | 178 | 4,938 | ||||||
| Pool Corporation | 80 | 4,618 | ||||||
| 16,997 | ||||||||
| Diversified Consumer Services — 0.7% | ||||||||
| Graham Holdings Company - Class B | 4 | 2,708 | ||||||
| Hillenbrand, Inc. | 221 | 6,694 | ||||||
| LifeLock, Inc. | 377 | 4,230 | ||||||
| Matthews International Corporation - Class A | 102 | 4,182 | ||||||
| Regis Corporation | 447 | 6,151 | ||||||
| Service Corporation International | 111 | 2,222 | ||||||
| Sotheby's | 112 | 4,422 | ||||||
| 30,609 | ||||||||
| Hotels, Restaurants & Leisure — 5.5% | ||||||||
| Aramark | 15 | 396 | ||||||
| Bally Technologies, Inc. | 15 | 885 | ||||||
| Biglari Holdings, Inc. | 18 | 7,592 | ||||||
| BJ's Restaurants, Inc. | 214 | 6,760 | ||||||
| Bloomin' Brands, Inc. | 287 | 5,981 | ||||||
28
BARROW ALL-CAP LONG/SHORT FUND SCHEDULE OF SECURITIES SOLD SHORT (Continued) | ||||||||
| COMMON STOCKS — 91.4% (Continued) | Shares | Value | ||||||
| Consumer Discretionary — 19.2% (Continued) | ||||||||
| Hotels, Restaurants & Leisure — 5.5% (Continued) | ||||||||
| Bob Evans Farms, Inc. | 134 | $ | 5,986 | |||||
| Brinker International, Inc. | 45 | 2,234 | ||||||
| Buffalo Wild Wings, Inc. | 55 | 7,948 | ||||||
| Burger King Worldwide, Inc. | 235 | 6,037 | ||||||
| Carnival Corporation | 143 | 5,724 | ||||||
| Cedar Fair, L.P. | 134 | 6,972 | ||||||
| Cheesecake Factory, Inc. (The) | 137 | 6,284 | ||||||
| Chipotle Mexican Grill, Inc. | 10 | 5,471 | ||||||
| Churchill Downs, Inc. | 71 | 6,118 | ||||||
| Chuy's Holdings, Inc. | 174 | 5,685 | ||||||
| Cracker Barrel Old Country Store, Inc. | 54 | 5,430 | ||||||
| Darden Restaurants, Inc. | 108 | 5,413 | ||||||
| Del Frisco's Restaurant Group, Inc. | 141 | 3,808 | ||||||
| Diamond Resorts International, Inc. | 58 | 1,116 | ||||||
| Dunkin' Brands Group, Inc. | 82 | 3,670 | ||||||
| Fiesta Restaurant Group, Inc. | 157 | 6,322 | ||||||
| Hyatt Hotels Corporation - Class A | 107 | 6,544 | ||||||
| Ignite Restaurant Group, Inc. | 54 | 829 | ||||||
| International Speedway Corporation - Class A | 193 | 6,000 | ||||||
| Jack in the Box, Inc. | 133 | 7,678 | ||||||
| Krispy Kreme Doughnuts, Inc. | 301 | 5,671 | ||||||
| Las Vegas Sands Corporation | 81 | 6,198 | ||||||
| Life Time Fitness, Inc. | 127 | 6,756 | ||||||
| Marcus Corporation (The) | 28 | 470 | ||||||
| Marriott International, Inc. - Class A | 86 | 5,299 | ||||||
| Marriott Vacations Worldwide Corporation | 64 | 3,626 | ||||||
| MGM Resorts International | 128 | 3,296 | �� | |||||
| Norwegian Cruise Line Holdings Ltd. | 133 | 4,489 | ||||||
| Panera Bread Company - Class A | 4 | 615 | ||||||
| Papa John's International, Inc. | 56 | 2,429 | ||||||
| Penn National Gaming, Inc. | 48 | 560 | ||||||
| Red Robin Gourmet Burgers, Inc. | 99 | 7,136 | ||||||
| Royal Caribbean Cruises Ltd. | 87 | 4,810 | ||||||
| Ruby Tuesday, Inc. | 315 | 2,479 | ||||||
| Scientific Games Corporation - Class A | 65 | 582 | ||||||
| SeaWorld Entertainment, Inc. | 112 | 3,418 | ||||||
| Six Flags Entertainment Corporation | 174 | 7,040 | ||||||
| Sonic Corporation | 245 | 5,096 | ||||||
| Speedway Motorsports, Inc. | 172 | 3,173 | ||||||
| Starbucks Corporation | 70 | 5,127 | ||||||
29
BARROW ALL-CAP LONG/SHORT FUND SCHEDULE OF SECURITIES SOLD SHORT (Continued) | ||||||||
| COMMON STOCKS — 91.4% (Continued) | Shares | Value | ||||||
| Consumer Discretionary — 19.2% (Continued) | ||||||||
| Hotels, Restaurants & Leisure — 5.5% (Continued) | ||||||||
| Starwood Hotels & Resorts Worldwide, Inc. | 73 | $ | 5,829 | |||||
| Texas Roadhouse, Inc. | 124 | 3,135 | ||||||
| Vail Resorts, Inc. | 105 | 7,318 | ||||||
| Wendy's Company (The) | 897 | 7,355 | ||||||
| Wyndham Worldwide Corporation | 7 | 518 | ||||||
| Wynn Resorts Ltd. | 30 | 6,449 | ||||||
| Yum! Brands, Inc. | 60 | 4,639 | ||||||
| 240,396 | ||||||||
| Household Durables — 2.6% | ||||||||
| Cavco Industries, Inc. | 71 | 5,451 | ||||||
| D.R. Horton, Inc. | 229 | 5,423 | ||||||
| Ethan Allen Interiors, Inc. | 186 | 4,360 | ||||||
| Harman International Industries, Inc. | 81 | 8,507 | ||||||
| iRobot Corporation | 145 | 5,123 | ||||||
| Jarden Corporation | 101 | 5,715 | ||||||
| La-Z-Boy, Inc. | 96 | 2,344 | ||||||
| Leggett & Platt, Inc. | 136 | 4,613 | ||||||
| Lennar Corporation - Class A | 130 | 5,317 | ||||||
| Libbey, Inc. | 46 | 1,240 | ||||||
| M/I Homes, Inc. | 258 | 5,885 | ||||||
| MDC Holdings, Inc. | 222 | 6,351 | ||||||
| Meritage Homes Corporation | 122 | 4,893 | ||||||
| Mohawk Industries, Inc. | 42 | 5,698 | ||||||
| Newell Rubbermaid, Inc. | 18 | 527 | ||||||
| PulteGroup, Inc. | 236 | 4,616 | ||||||
| Ryland Group, Inc. (The) | 157 | 5,919 | ||||||
| Standard Pacific Corporation | 887 | 7,123 | ||||||
| Stanley Black & Decker, Inc. | 36 | 3,146 | ||||||
| Taylor Morrison Home Corporation - Class A | 156 | 3,323 | ||||||
| Tempur Sealy International, Inc. | 139 | 7,639 | ||||||
| Toll Brothers, Inc. | 148 | 5,361 | ||||||
| TRI Pointe Homes, Inc. | 30 | 457 | ||||||
| Universal Electronics, Inc. | 130 | 5,912 | ||||||
| WCI Communities, Inc. | 51 | 945 | ||||||
| 115,888 | ||||||||
| Internet & Catalog Retail — 1.0% | ||||||||
| Amazon.com, Inc. | 16 | 5,001 | ||||||
| Coupons.com, Inc. | 27 | 697 | ||||||
| Groupon, Inc. | 625 | 3,675 | ||||||
| HomeAway, Inc. | 186 | 5,729 | ||||||
30
BARROW ALL-CAP LONG/SHORT FUND SCHEDULE OF SECURITIES SOLD SHORT (Continued) | ||||||||
| COMMON STOCKS — 91.4% (Continued) | Shares | Value | ||||||
| Consumer Discretionary — 19.2% (Continued) | ||||||||
| Internet & Catalog Retail — 1.0% (Continued) | ||||||||
| Liberty Interactive Corporation - Series A | 161 | $ | 4,690 | |||||
| NetFlix, Inc. | 12 | 5,014 | ||||||
| NutriSystem, Inc. | 138 | 2,277 | ||||||
| Orbitz Worldwide, Inc. | 344 | 2,556 | ||||||
| RetailMeNot, Inc. | 24 | 612 | ||||||
| Shutterfly, Inc. | 136 | 5,595 | ||||||
| TripAdvisor, Inc. | 60 | 5,830 | ||||||
| 41,676 | ||||||||
| Leisure Products — 0.3% | ||||||||
| Callaway Golf Company | 878 | 7,041 | ||||||
| Hasbro, Inc. | 40 | 2,148 | ||||||
| Mattel, Inc. | 30 | 1,165 | ||||||
| Polaris Industries, Inc. | 3 | 387 | ||||||
| 10,741 | ||||||||
| Media — 1.8% | ||||||||
| Carmike Cinemas, Inc. | 15 | 516 | ||||||
| CBS Corporation - Class B | 7 | 417 | ||||||
| CBS Outdoor Americas, Inc. | 32 | 1,039 | ||||||
| Charter Communications, Inc. - Class A | 22 | 3,149 | ||||||
| Discovery Communications, Inc. | 8 | 616 | ||||||
| DISH Network Corporation - Class A | 78 | 4,576 | ||||||
| DreamWorks Animation SKG, Inc. - Class A | 202 | 5,672 | ||||||
| E.W. Scripps Company - Class A | 247 | 4,821 | ||||||
| Lamar Advertising Company - Class A | 147 | 7,253 | ||||||
| Liberty Media Corporation - Class A | 9 | 1,144 | ||||||
| Lions Gate Entertainment Corporation | 34 | 888 | ||||||
| Live Nation, Inc. | 386 | 9,156 | ||||||
| Madison Square Garden Company (The) - Class A | 112 | 6,143 | ||||||
| New York Times Company (The) - Class A | 119 | 1,768 | ||||||
| News Corporation - Class A | 33 | 563 | ||||||
| Nexstar Broadcasting Group, Inc. - Class A | 141 | 6,551 | ||||||
| Regal Entertainment Group - Class A | 148 | 2,888 | ||||||
| Rentrak Corporation | 56 | 2,894 | ||||||
| Scholastic Corporation | 171 | 5,452 | ||||||
| SFX Entertainment, Inc. | 95 | 695 | ||||||
| Sirius XM Holdings, Inc. | 1,462 | 4,795 | ||||||
| Tribune Company | 5 | 396 | ||||||
| Twenty-First Century Fox, Inc. | 12 | 425 | ||||||
| Walt Disney Company (The) | 34 | 2,856 | ||||||
31
BARROW ALL-CAP LONG/SHORT FUND SCHEDULE OF SECURITIES SOLD SHORT (Continued) | ||||||||
| COMMON STOCKS — 91.4% (Continued) | Shares | Value | ||||||
| Consumer Discretionary — 19.2% (Continued) | ||||||||
| Media — 1.8% (Continued) | ||||||||
| World Wrestling Entertainment, Inc. - Class A | 481 | $ | 5,426 | |||||
| 80,099 | ||||||||
| Multiline Retail — 0.5% | ||||||||
| Big Lots, Inc. | 25 | 1,061 | ||||||
| Burlington Stores, Inc. | 46 | 1,307 | ||||||
| Family Dollar Stores, Inc. | 28 | 1,641 | ||||||
| Fred's, Inc. - Class A | 373 | 5,696 | ||||||
| Kohl's Corporation | 32 | 1,742 | ||||||
| Target Corporation | 75 | 4,257 | ||||||
| Tuesday Morning Corporation | 487 | 7,870 | ||||||
| 23,574 | ||||||||
| Specialty Retail — 3.0% | ||||||||
| Abercrombie & Fitch Company - Class A | 96 | 3,649 | ||||||
| Aéropostale, Inc. | 636 | 2,487 | ||||||
| Asbury Automotive Group, Inc. | 18 | 1,163 | ||||||
| AutoNation, Inc. | 108 | 6,174 | ||||||
| Barnes & Noble, Inc. | 432 | 7,836 | ||||||
| bebe stores, inc. | 670 | 2,747 | ||||||
| Big 5 Sporting Goods Corporation | 22 | 255 | ||||||
| Cabela's, Inc. | 100 | 6,123 | ||||||
| CarMax, Inc. | 107 | 4,741 | ||||||
| Children's Place Retail Stores, Inc. (The) | 7 | 339 | ||||||
| Conn's, Inc. | 80 | 3,731 | ||||||
| CST Brands, Inc. | 15 | 496 | ||||||
| Dick's Sporting Goods, Inc. | 18 | 800 | ||||||
| Five Below, Inc. | 158 | 5,720 | ||||||
| Group 1 Automotive, Inc. | 15 | 1,207 | ||||||
| Haverty Furniture Companies, Inc. | 106 | 2,653 | ||||||
| Home Depot, Inc. (The) | 28 | 2,246 | ||||||
| Lithia Motors, Inc. - Class A | 98 | 7,686 | ||||||
| Lowe's Companies, Inc. | 110 | 5,179 | ||||||
| Lumber Liquidators Holdings, Inc. | 57 | 4,428 | ||||||
| Men's Wearhouse, Inc. (The) | 47 | 2,340 | ||||||
| Monro Muffler Brake, Inc. | 124 | 6,697 | ||||||
| Office Depot, Inc. | 1,472 | 7,537 | ||||||
| O'Reilly Automotive, Inc. | 19 | 2,811 | ||||||
| Penske Automotive Group, Inc. | 138 | 6,420 | ||||||
| Pep Boys - Manny Moe & Jack (The) | 569 | 5,798 | ||||||
| Restoration Hardware Holdings, Inc. | 73 | 4,853 | ||||||
| Stage Stores, Inc. | 305 | 5,603 | ||||||
32
BARROW ALL-CAP LONG/SHORT FUND SCHEDULE OF SECURITIES SOLD SHORT (Continued) | ||||||||
| COMMON STOCKS — 91.4% (Continued) | Shares | Value | ||||||
| Consumer Discretionary — 19.2% (Continued) | ||||||||
| Specialty Retail — 3.0% (Continued) | ||||||||
| Stein Mart, Inc. | 112 | $ | 1,514 | |||||
| Systemax, Inc. | 31 | 496 | ||||||
| Tiffany & Company | 58 | 5,766 | ||||||
| Tile Shop Holdings, Inc. (The) | 143 | 2,134 | ||||||
| Tractor Supply Company | 82 | 5,332 | ||||||
| Ulta Salon Cosmetics & Fragrance, Inc. | 53 | 4,500 | ||||||
| Urban Outfitters, Inc. | 11 | 369 | ||||||
| Williams-Sonoma, Inc. | 13 | 870 | ||||||
| 132,700 | ||||||||
| Textiles, Apparel & Luxury Goods — 1.8% | ||||||||
| Columbia Sportswear Company | 96 | 8,023 | ||||||
| CROCS, Inc. | 33 | 493 | ||||||
| Deckers Outdoor Corporation | 38 | 2,937 | ||||||
| Hanesbrands, Inc. | 74 | 6,277 | ||||||
| Kate Spade & Company | 250 | 9,103 | ||||||
| Movado Group, Inc. | 75 | 2,872 | ||||||
| NIKE, Inc. - Class B | 65 | 4,999 | ||||||
| Oxford Industries, Inc. | 35 | 2,238 | ||||||
| PVH Corporation | 40 | 5,265 | ||||||
| Quiksilver, Inc. | 944 | 5,607 | ||||||
| Skechers U.S.A., Inc. - Class A | 204 | 9,078 | ||||||
| Under Armour, Inc. - Class A | 120 | 6,095 | ||||||
| Unifi, Inc. | 122 | 2,840 | ||||||
| VF Corporation | 65 | 4,096 | ||||||
| Vince Holding Corporation | 133 | 3,696 | ||||||
| Wolverine World Wide, Inc. | 183 | 4,734 | ||||||
| 78,353 | ||||||||
| Consumer Staples — 14.5% | ||||||||
| Beverages — 2.2% | ||||||||
| Boston Beer Company, Inc. - Class A | 84 | 18,010 | ||||||
| Brown-Forman Corporation - Class B | 150 | 13,900 | ||||||
| Coca-Cola Bottling Company Consolidated | 207 | 15,579 | ||||||
| Coca-Cola Company (The) | 70 | 2,864 | ||||||
| Coca-Cola Enterprises, Inc. | 300 | 13,692 | ||||||
| Constellation Brands, Inc. - Class A | 190 | 15,985 | ||||||
| Molson Coors Brewing Company - Class B | 234 | 15,381 | ||||||
| Monster Beverage Corporation | 13 | 902 | ||||||
| Pepsico, Inc. | 11 | 972 | ||||||
| 97,285 | ||||||||
33
BARROW ALL-CAP LONG/SHORT FUND SCHEDULE OF SECURITIES SOLD SHORT (Continued) | ||||||||
| COMMON STOCKS — 91.4% (Continued) | Shares | Value | ||||||
| Consumer Staples — 14.5% (Continued) | ||||||||
| Food & Staples Retailing — 3.8% | ||||||||
| Anderson's, Inc. (The) | 349 | $ | 17,778 | |||||
| Casey's General Stores, Inc. | 153 | 10,898 | ||||||
| Chefs' Warehouse, Inc. (The) | 539 | 9,961 | ||||||
| Costco Wholesale Corporation | 107 | 12,414 | ||||||
| Fairway Group Holdings Corporation | 37 | 228 | ||||||
| Fresh Market, Inc. (The) | 157 | 4,812 | ||||||
| Kroger Company (The) | 159 | 7,591 | ||||||
| Natural Grocers by Vitamin Cottage, Inc. | 516 | 10,727 | ||||||
| PriceSmart, Inc. | 175 | 16,039 | ||||||
| Rite Aid Corporation | 510 | 4,263 | ||||||
| SpartanNash Company | 463 | 11,242 | ||||||
| Sprouts Farmers Market, Inc. | 72 | 1,951 | ||||||
| Sysco Corporation | 362 | 13,586 | ||||||
| United Natural Foods, Inc. | 307 | 20,695 | ||||||
| Walgreen Company | 219 | 15,748 | ||||||
| Wal-Mart Stores, Inc. | 10 | 768 | ||||||
| Weis Markets, Inc. | 19 | 900 | ||||||
| Whole Foods Market, Inc. | 233 | 8,910 | ||||||
| 168,511 | ||||||||
| Food Products — 6.9% | ||||||||
| Annie's, Inc. | 302 | 9,881 | ||||||
| Archer-Daniels-Midland Company | 268 | 12,044 | ||||||
| Boulder Brands, Inc. | 654 | 8,875 | ||||||
| Bunge Ltd. | 162 | 12,589 | ||||||
| Calavo Growers, Inc. | 336 | 10,507 | ||||||
| Cal-Maine Foods, Inc. | 326 | 22,742 | ||||||
| Campbell Soup Company | 206 | 9,455 | ||||||
| Chiquita Brands International, Inc. | 115 | 1,180 | ||||||
| ConAgra Foods, Inc. | 393 | 12,694 | ||||||
| Diamond Foods, Inc. | 196 | 6,262 | ||||||
| Flowers Foods, Inc. | 612 | 12,760 | ||||||
| Fresh Del Monte Produce, Inc. | 632 | 18,309 | ||||||
| Hain Celestial Group, Inc. (The) | 155 | 14,062 | ||||||
| Hershey Company (The) | 95 | 9,247 | ||||||
| Hormel Foods Corporation | 145 | 7,135 | ||||||
| Keurig Green Mountain, Inc. | 99 | 11,165 | ||||||
| McCormick & Company, Inc. | 171 | 12,365 | ||||||
| Mead Johnson Nutrition Company | 36 | 3,221 | ||||||
| Mondelēz International, Inc. - Class A | 280 | 10,534 | ||||||
| Post Holdings, Inc. | 300 | 14,991 | ||||||
34
BARROW ALL-CAP LONG/SHORT FUND SCHEDULE OF SECURITIES SOLD SHORT (Continued) | ||||||||
| COMMON STOCKS — 91.4% (Continued) | Shares | Value | ||||||
| Consumer Staples — 14.5% (Continued) | ||||||||
| Food Products — 6.9% (Continued) | ||||||||
| Snyder's-Lance, Inc. | 692 | $ | 18,809 | |||||
| Tootsie Roll Industries, Inc. | 636 | 18,508 | ||||||
| TreeHouse Foods, Inc. | 289 | 21,660 | ||||||
| Tyson Foods, Inc. - Class A | 30 | 1,274 | ||||||
| WhiteWave Foods Company (The) - Class A | 736 | 23,177 | ||||||
| 303,446 | ||||||||
| Household Products — 0.5% | ||||||||
| Colgate-Palmolive Company | 86 | 5,882 | ||||||
| Kimberly Clark Corporation | 110 | 12,359 | ||||||
| Procter & Gamble Company (The) | 25 | 2,020 | ||||||
| 20,261 | ||||||||
| Personal Products — 0.9% | ||||||||
| Avon Products, Inc. | 532 | 7,602 | ||||||
| Coty, Inc. - Class A | 227 | 3,786 | ||||||
| Elizabeth Arden, Inc. | 504 | 13,674 | ||||||
| Estée Lauder Companies, Inc. (The) - Class A | 179 | 13,715 | ||||||
| Synutra International, Inc. | 169 | 948 | ||||||
| 39,725 | ||||||||
| Tobacco — 0.2% | ||||||||
| Universal Corporation | 150 | 8,032 | ||||||
| Energy — 11.0% | ||||||||
| Energy Equipment & Services — 1.5% | ||||||||
| Baker Hughes, Inc. | 9 | 635 | ||||||
| Basic Energy Services, Inc. | 60 | 1,632 | ||||||
| Bristow Group, Inc. | 27 | 2,051 | ||||||
| Era Group, Inc. | 147 | 4,295 | ||||||
| Exterran Holdings, Inc. | 66 | 2,755 | ||||||
| Exterran Partners, L.P. | 82 | 2,294 | ||||||
| FMC Technologies, Inc. | 19 | 1,103 | ||||||
| Gulfmark Offshore, Inc. - Class A | 81 | 3,759 | ||||||
| Helix Energy Solutions Group, Inc. | 200 | 4,676 | ||||||
| Hercules Offshore, Inc. | 157 | 713 | ||||||
| Hornbeck Offshore Services, Inc. | 19 | 860 | ||||||
| ION Geophysical Corporation | 1,000 | 4,170 | ||||||
| Key Energy Services, Inc. | 552 | 4,444 | ||||||
| McDermott International, Inc. | 546 | 3,964 | ||||||
| Parker Drilling Company | 516 | 3,338 | ||||||
| Patterson-UTI Energy, Inc. | 22 | 728 | ||||||
| Pioneer Energy Services Corporation | 115 | 1,828 | ||||||
35
BARROW ALL-CAP LONG/SHORT FUND SCHEDULE OF SECURITIES SOLD SHORT (Continued) | ||||||||
| COMMON STOCKS — 91.4% (Continued) | Shares | Value | ||||||
| Energy — 11.0% (Continued) | ||||||||
| Energy Equipment & Services — 1.5% (Continued) | ||||||||
| Rowan Companies plc - Class A | 141 | $ | 4,365 | |||||
| SEACOR Holdings, Inc. | 63 | 5,045 | ||||||
| TETRA Technologies, Inc. | 549 | 6,330 | ||||||
| Tidewater, Inc. | 66 | 3,440 | ||||||
| USA Compression Partners, L.P. | 39 | 975 | ||||||
| Willbros Group, Inc. | 235 | 2,858 | ||||||
| 66,258 | ||||||||
| Oil, Gas & Consumable Fuels — 9.5% | ||||||||
| Access Midstream Partners, L.P. | 112 | 7,055 | ||||||
| Anadarko Petroleum Corporation | 13 | 1,337 | ||||||
| Antero Resources Corporation | 20 | 1,230 | ||||||
| Approach Resources, Inc. | 222 | 4,333 | ||||||
| Athlon Energy, Inc. | 18 | 782 | ||||||
| Atlas Energy, L.P. | 147 | 5,893 | ||||||
| Atlas Resource Partners, L.P. | 278 | 5,507 | ||||||
| Bill Barrett Corporation | 128 | 3,200 | ||||||
| Boardwalk Pipeline Partners, L.P. | 77 | 1,347 | ||||||
| Bonanza Creek Energy, Inc. | 51 | 2,735 | ||||||
| Buckeye Partners, L.P. | 79 | 6,198 | ||||||
| Cabot Oil & Gas Corporation | 153 | 5,545 | ||||||
| Calumet Specialty Products Partners, L.P. | 91 | 2,891 | ||||||
| Carrizo Oil & Gas, Inc. | 31 | 1,781 | ||||||
| Cheniere Energy Partners, L.P. | 15 | 513 | ||||||
| Cheniere Energy, Inc. | 155 | 10,557 | ||||||
| Chesapeake Energy Corporation | 178 | 5,112 | ||||||
| Cloud Peak Energy, Inc. | 22 | 406 | ||||||
| Cobalt International Energy, Inc. | 285 | 5,270 | ||||||
| Comstock Resources, Inc. | 66 | 1,795 | ||||||
| Concho Resources, Inc. | 49 | 6,458 | ||||||
| CONSOL Energy, Inc. | 162 | 7,156 | ||||||
| Contango Oil & Gas Company | 86 | 3,697 | ||||||
| Crestwood Equity Partners, L.P. | 381 | 5,353 | ||||||
| Crestwood Midstream Partners, L.P. | 51 | 1,112 | ||||||
| DCP Midstream Partners, L.P. | 101 | 5,425 | ||||||
| Devon Energy Corporation | 41 | 3,030 | ||||||
| Diamondback Energy, Inc. | 89 | 6,718 | ||||||
| Eagle Rock Energy Partners, L.P. | 151 | 673 | ||||||
| Emerald Oil, Inc. | 562 | 3,653 | ||||||
| Enbridge Energy Partners, L.P. | 157 | 4,867 | ||||||
| Energen Corporation | 35 | 2,988 | ||||||
36
BARROW ALL-CAP LONG/SHORT FUND SCHEDULE OF SECURITIES SOLD SHORT (Continued) | ||||||||
| COMMON STOCKS — 91.4% (Continued) | Shares | Value | ||||||
| Energy — 11.0% (Continued) | ||||||||
| Oil, Gas & Consumable Fuels — 9.5% (Continued) | ||||||||
| Energy Transfer Equity, L.P. | 153 | $ | 7,797 | |||||
| Energy Transfer Partners, L.P. | 105 | 5,914 | ||||||
| EnLink Midstream Partners, L.P. | 243 | 7,404 | ||||||
| Enlink Midstream, LLC | 241 | 9,946 | ||||||
| Enterprise Products Partners, L.P. | 88 | 6,584 | ||||||
| EOG Resources, Inc. | 16 | 1,693 | ||||||
| EQT Corporation | 63 | 6,733 | ||||||
| EQT Midstream Partners, L.P. | 66 | 5,421 | ||||||
| EV Energy Partners, L.P. | 128 | 4,727 | ||||||
| Genesis Energy, L.P. | 108 | 6,156 | ||||||
| Gulfport Energy Corporation | 82 | 5,045 | ||||||
| Holly Energy Partners, L.P. | 14 | 495 | ||||||
| Jones Energy, Inc. - Class A | 65 | 1,139 | ||||||
| Kinder Morgan Energy Partners, L.P. | 51 | 3,879 | ||||||
| Kinder Morgan, Inc. | 157 | 5,242 | ||||||
| Kodiak Oil & Gas Corporation | 231 | 2,941 | ||||||
| Laredo Petroleum, Inc. | 175 | 4,842 | ||||||
| Legacy Reserves, L.P. | 70 | 2,058 | ||||||
| LinnCo, LLC | 58 | 1,614 | ||||||
| Magellan Midstream Partners, L.P. | 87 | 7,124 | ||||||
| Magnum Hunter Resources Corporation | 1,079 | 8,265 | ||||||
| MarkWest Energy Partners, L.P. | 90 | 5,575 | ||||||
| Matador Resources | 284 | 7,066 | ||||||
| Memorial Production Partners, L.P. | 197 | 4,407 | ||||||
| MPLX, L.P. | 38 | 2,172 | ||||||
| Newfield Exploration Company | 42 | 1,532 | ||||||
| NGL Energy Partners, L.P. | 124 | 4,960 | ||||||
| Noble Energy, Inc. | 80 | 5,766 | ||||||
| NuStar Energy, L.P. | 123 | 7,136 | ||||||
| ONEOK Partners, L.P. | 63 | 3,471 | ||||||
| ONEOK, Inc. | 28 | 1,806 | ||||||
| Par Petroleum Corporation | 88 | 1,751 | ||||||
| PDC Energy, Inc. | 120 | 7,703 | ||||||
| Pioneer Natural Resources Company | 29 | 6,095 | ||||||
| QEP Resources, Inc. | 191 | 6,101 | ||||||
| QR Energy, L.P. | 90 | 1,613 | ||||||
| Range Resources Corporation | 71 | 6,599 | ||||||
| Regency Energy Partners, L.P. | 174 | 4,837 | ||||||
| Rentech, Inc. | 661 | 1,540 | ||||||
| Resolute Energy Corporation | 278 | 2,313 | ||||||
37
BARROW ALL-CAP LONG/SHORT FUND SCHEDULE OF SECURITIES SOLD SHORT (Continued) | ||||||||
| COMMON STOCKS — 91.4% (Continued) | Shares | Value | ||||||
| Energy — 11.0% (Continued) | ||||||||
| Oil, Gas & Consumable Fuels — 9.5% (Continued) | ||||||||
| Rex Energy Corporation | 262 | $ | 5,209 | |||||
| Rose Rock Midstream, L.P. | 45 | 1,954 | ||||||
| Sanchez Energy Corporation | 192 | 6,611 | ||||||
| SemGroup Corporation - Class A | 108 | 7,338 | ||||||
| SM Energy Company | 40 | 3,032 | ||||||
| Spectra Energy Corporation | 148 | 6,006 | ||||||
| Summit Midstream Partners, L.P. | 41 | 1,845 | ||||||
| Sunoco Logistics Partners, L.P. | 42 | 3,864 | ||||||
| Synergy Resources Corporation | 460 | 5,400 | ||||||
| Targa Resources Corporation | 73 | 8,392 | ||||||
| Targa Resources Partners, L.P. | 103 | 7,000 | ||||||
| Tesoro Logistics, L.P. | 84 | 5,855 | ||||||
| TransMontaigne Partners, L.P. | 19 | 943 | ||||||
| Triangle Petroleum Corporation | 564 | 5,668 | ||||||
| Ultra Petroleum Corporation | 166 | 4,485 | ||||||
| W&T Offshore, Inc. | 21 | 308 | ||||||
| Western Gas Equity Partners | 61 | 3,170 | ||||||
| Western Gas Partners, L.P. | 91 | 6,551 | ||||||
| Whiting Petroleum Corporation | 12 | 862 | ||||||
| Williams Companies, Inc. | 149 | 6,997 | ||||||
| Williams Partners, L.P. | 112 | 5,948 | ||||||
| WPX Energy, Inc. | 343 | 7,265 | ||||||
| 416,782 | ||||||||
| Health Care — 18.5% | ||||||||
| Biotechnology — 2.1% | ||||||||
| ACADIA Pharmaceuticals, Inc. | 175 | 3,614 | ||||||
| Achillion Pharmaceuticals, Inc. | 192 | 520 | ||||||
| Aegerion Pharmaceuticals, Inc. | 67 | 2,201 | ||||||
| Agios Pharmaceuticals, Inc. | 11 | 387 | ||||||
| Alexion Pharmaceuticals, Inc. | 2 | 333 | ||||||
| Alnylam Pharmaceuticals, Inc. | 65 | 3,854 | ||||||
| Anacor Pharmaceuticals, Inc. | 106 | 1,431 | ||||||
| Ariad Pharmaceuticals, Inc. | 43 | 278 | ||||||
| Array BioPharma, Inc. | 295 | 1,239 | ||||||
| BioCryst Pharmaceuticals, Inc. | 84 | 837 | ||||||
| BioMarin Pharmaceutical, Inc. | 6 | 348 | ||||||
| Celldex Therapeutics, Inc. | 168 | 2,454 | ||||||
| Cepheid | 41 | 1,847 | ||||||
| Clovis Oncology, Inc. | 74 | 3,789 | ||||||
| CTI BioPharma Corporation | 40 | 118 | ||||||
38
BARROW ALL-CAP LONG/SHORT FUND SCHEDULE OF SECURITIES SOLD SHORT (Continued) | ||||||||
| COMMON STOCKS — 91.4% (Continued) | Shares | Value | ||||||
| Health Care — 18.5% (Continued) | ||||||||
| Biotechnology — 2.1% (Continued) | ||||||||
| Cubist Pharmaceuticals, Inc. | 5 | $ | 333 | |||||
| Dynavax Technologies Corporation | 368 | 530 | ||||||
| Exact Sciences Corporation | 170 | 2,292 | ||||||
| Geron Corporation | 246 | 512 | ||||||
| Halozyme Therapeutics, Inc. | 105 | 829 | ||||||
| Hyperion Therapeutics, Inc. | 15 | 439 | ||||||
| ImmunoGen, Inc. | 47 | 556 | ||||||
| Immunomedics, Inc. | 107 | 356 | ||||||
| Incyte Corporation | 7 | 347 | ||||||
| Infinity Pharmaceuticals, Inc. | 108 | 1,091 | ||||||
| Insmed, Inc. | 165 | 2,168 | ||||||
| Intercept Pharmaceuticals, Inc. | 14 | 3,313 | ||||||
| InterMune, Inc. | 232 | 9,192 | ||||||
| Ironwood Pharmaceuticals, Inc. | 237 | 3,394 | ||||||
| Isis Pharmaceuticals, Inc. | 116 | 3,389 | ||||||
| KYTHERA Biopharmaceuticals, Inc. | 86 | 2,878 | ||||||
| Lexicon Pharmaceuticals, Inc. | 1,413 | 1,865 | ||||||
| Medivation, Inc. | 63 | 4,588 | ||||||
| Momenta Pharmaceuticals, Inc. | 216 | 2,676 | ||||||
| Neurocrine Biosciences, Inc. | 53 | 736 | ||||||
| Novavax, Inc. | 184 | 867 | ||||||
| NPS Pharmaceuticals, Inc. | 81 | 2,521 | ||||||
| Orexigen Therapeutics, Inc. | 553 | 3,572 | ||||||
| Portola Pharmaceuticals, Inc. | 18 | 399 | ||||||
| PTC Therapeutics, Inc. | 24 | 569 | ||||||
| Puma Biotechnology, Inc. | 60 | 4,586 | ||||||
| Raptor Pharmaceutical Corporation | 146 | 1,194 | ||||||
| Regeneron Pharmaceuticals, Inc. | 1 | 307 | ||||||
| Sangamo BioSciences, Inc. | 33 | 434 | ||||||
| Seattle Genetics, Inc. | 76 | 2,536 | ||||||
| Stemline Therapeutics, Inc. | 4 | 61 | ||||||
| Synageva BioPharma Corporation | 42 | 3,408 | ||||||
| Synergy Pharmaceuticals, Inc. | 123 | 534 | ||||||
| TESARO, Inc. | 74 | 1,971 | ||||||
| Theravance, Inc. | 127 | 3,639 | ||||||
| Vanda Pharmaceuticals, Inc. | 11 | 113 | ||||||
| Vertex Pharmaceuticals, Inc. | 5 | 361 | ||||||
| XOMA Corporation | 173 | 716 | ||||||
| 92,522 | ||||||||
39
BARROW ALL-CAP LONG/SHORT FUND SCHEDULE OF SECURITIES SOLD SHORT (Continued) | ||||||||
| COMMON STOCKS — 91.4% (Continued) | Shares | Value | ||||||
| Health Care — 18.5% (Continued) | ||||||||
| Health Care Equipment & Supplies — 7.1% | ||||||||
| Abaxis, Inc. | 10 | $ | 413 | |||||
| Abiomed, Inc. | 141 | 3,215 | ||||||
| Accuray, Inc. | 882 | 7,779 | ||||||
| Align Technology, Inc. | 68 | 3,714 | ||||||
| Analogic Corporation | 68 | 4,646 | ||||||
| AngioDynamics, Inc. | 163 | 2,336 | ||||||
| Antares Pharma, Inc. | 1,637 | 4,829 | ||||||
| AtriCure, Inc. | 81 | 1,338 | ||||||
| Baxter International, Inc. | 174 | 12,947 | ||||||
| Becton, Dickinson and Company | 75 | 8,828 | ||||||
| Boston Scientific Corporation | 1,121 | 14,382 | ||||||
| Cardiovascular Systems, Inc. | 323 | 9,060 | ||||||
| Cerus Corporation | 233 | 976 | ||||||
| CONMED Corporation | 12 | 539 | ||||||
| Cooper Companies, Inc. (The) | 109 | 14,063 | ||||||
| Cynosure, Inc. | 291 | 6,338 | ||||||
| DENTSPLY International, Inc. | 263 | 12,437 | ||||||
| DexCom, Inc. | 451 | 15,226 | ||||||
| Edwards Lifesciences Corporation | 65 | 5,278 | ||||||
| Endologix, Inc. | 517 | 6,752 | ||||||
| GenMark Diagnostics, Inc. | 212 | 2,334 | ||||||
| Greatbatch, Inc. | 96 | 4,484 | ||||||
| Haemonetics Corporation | 373 | 12,704 | ||||||
| HeartWare International, Inc. | 94 | 8,476 | ||||||
| Hill-Rom Holdings, Inc. | 37 | 1,469 | ||||||
| Hologic, Inc. | 628 | 15,348 | ||||||
| IDEXX Laboratories, Inc. | 101 | 12,977 | ||||||
| Insulet Corporation | 360 | 13,187 | ||||||
| Integra LifeSciences Holdings Corporation | 153 | 6,877 | ||||||
| Invacare Corporation | 431 | 7,112 | ||||||
| Merit Medical Systems, Inc. | 445 | 6,243 | ||||||
| Neogen Corporation | 23 | 869 | ||||||
| NuVasive, Inc. | 235 | 7,835 | ||||||
| NxStage Medical, Inc. | 577 | 7,922 | ||||||
| OraSure Technologies, Inc. | 67 | 424 | ||||||
| Quidel Corporation | 93 | 2,111 | ||||||
| Spectranetics Corporation (The) | 341 | 7,311 | ||||||
| STAAR Surgical Company | 386 | 5,956 | ||||||
| Stryker Corporation | 149 | 12,589 | ||||||
| Teleflex, Inc. | 44 | 4,692 | ||||||
40
BARROW ALL-CAP LONG/SHORT FUND SCHEDULE OF SECURITIES SOLD SHORT (Continued) | ||||||||
| COMMON STOCKS — 91.4% (Continued) | Shares | Value | ||||||
| Health Care — 18.5% (Continued) | ||||||||
| Health Care Equipment & Supplies — 7.1% (Continued) | ||||||||
| Volcano Corporation | 349 | $ | 6,059 | |||||
| West Pharmaceutical Services, Inc. | 381 | 16,036 | ||||||
| Wright Medical Group, Inc. | 272 | 8,269 | ||||||
| ZELTIQ Aesthetics, Inc. | 259 | 4,527 | ||||||
| 310,907 | ||||||||
| Health Care Providers & Services — 3.5% | ||||||||
| Acadia Healthcare Company, Inc. | 340 | 14,498 | ||||||
| Accretive Health, Inc. | 157 | 1,176 | ||||||
| Air Methods Corporation | 213 | 10,267 | ||||||
| Amedisys, Inc. | 295 | 4,292 | ||||||
| BioScrip, Inc. | 522 | 4,098 | ||||||
| Brookdale Senior Living, Inc. | 410 | 13,637 | ||||||
| Capital Senior Living Corporation | 313 | 7,431 | ||||||
| ExamWorks Group, Inc. | 263 | 7,790 | ||||||
| Express Scripts Holding Company | 133 | 9,505 | ||||||
| Healthways, Inc. | 400 | 6,892 | ||||||
| Henry Schein, Inc. | 91 | 10,888 | ||||||
| HMS Holdings Corporation | 258 | 4,850 | ||||||
| LifePoint Hospitals, Inc. | 320 | 19,597 | ||||||
| McKesson Corporation | 27 | 5,120 | ||||||
| MWI Veterinary Supply, Inc. | 51 | 7,115 | ||||||
| Team Health Holdings, Inc. | 263 | 13,352 | ||||||
| Universal Health Services, Inc. - Class B | 126 | 11,286 | ||||||
| 151,794 | ||||||||
| Health Care Technology — 1.4% | ||||||||
| Allscripts Healthcare Solutions, Inc. | 991 | 14,607 | ||||||
| athenahealth, Inc. | 133 | 16,879 | ||||||
| Cerner Corporation | 246 | 13,296 | ||||||
| Medidata Solutions, Inc. | 341 | 13,187 | ||||||
| Veeva Systems, Inc. - Class A | 130 | 2,725 | ||||||
| Vocera Communications, Inc. | 28 | 362 | ||||||
| 61,056 | ||||||||
Life Sciences Tools & Services — 0.0% (a) | ||||||||
| Agilent Technologies, Inc. | 6 | 342 | ||||||
| Furiex Pharmaceuticals, Inc. | 6 | 620 | ||||||
| Illumina, Inc. | 2 | 316 | ||||||
| Thermo Fisher Scientific, Inc. | 3 | 351 | ||||||
| 1,629 | ||||||||
41
BARROW ALL-CAP LONG/SHORT FUND SCHEDULE OF SECURITIES SOLD SHORT (Continued) | ||||||||
| COMMON STOCKS — 91.4% (Continued) | Shares | Value | ||||||
| Health Care — 18.5% (Continued) | ||||||||
| Pharmaceuticals — 4.4% | ||||||||
| Abbott Laboratories | 217 | $ | 8,682 | |||||
| AcelRx Pharmaceuticals, Inc. | 190 | 1,748 | ||||||
| Actavis plc | 88 | 18,615 | ||||||
| AVANIR Pharmaceuticals, Inc. - Class A | 1,994 | 10,528 | ||||||
| Bristol-Myers Squibb Company | 271 | 13,479 | ||||||
| ContraVir Pharmaceuticals, Inc. | 1 | 1 | ||||||
| DepoMed, Inc. | 266 | 3,173 | ||||||
| Endocyte, Inc. | 328 | 2,076 | ||||||
| Hospira, Inc. | 327 | 16,079 | ||||||
| Impax Laboratories, Inc. | 221 | 6,135 | ||||||
| Jazz Pharmaceuticals plc | 7 | 993 | ||||||
| Lannett Company, Inc. | 111 | 4,638 | ||||||
| Mallinckrodt plc | 18 | 1,400 | ||||||
| Medicines Company (The) | 356 | 9,932 | ||||||
| Merck & Company, Inc. | 259 | 14,986 | ||||||
| Mylan, Inc. | 318 | 15,849 | ||||||
| Nektar Therapeutics | 778 | 9,126 | ||||||
| Pacira Pharmaceuticals, Inc. | 214 | 16,609 | ||||||
| Perrigo Company plc | 61 | 8,430 | ||||||
| Repros Therapeutics, Inc. | 115 | 1,869 | ||||||
| Sagent Pharmaceuticals, Inc. | 216 | 4,841 | ||||||
| Salix Pharmaceuticals Ltd. | 65 | 7,415 | ||||||
| TherapeuticsMD, Inc. | 776 | 3,151 | ||||||
| Zoetis, Inc. | 440 | 13,508 | ||||||
| Zogenix, Inc. | 515 | 1,184 | ||||||
| 194,447 | ||||||||
| Industrials — 18.1% | ||||||||
| Aerospace & Defense — 3.1% | ||||||||
| AAR Corporation | 135 | 3,280 | ||||||
| AeroVironment, Inc. | 166 | 5,332 | ||||||
| American Science & Engineering, Inc. | 22 | 1,476 | ||||||
| Astronics Corporation | 81 | 4,444 | ||||||
| Astronics Corporation - Class B | 3 | 164 | ||||||
| B/E Aerospace, Inc. | 82 | 7,933 | ||||||
| Boeing Company (The) | 49 | 6,627 | ||||||
| Curtiss-Wright Corporation | 126 | 8,395 | ||||||
| DigitalGlobe, Inc. | 219 | 6,649 | ||||||
| Esterline Technologies Corporation | 56 | 6,241 | ||||||
| GenCorp, Inc. | 279 | 5,192 | ||||||
| General Dynamics Corporation | 47 | 5,552 | ||||||
42
BARROW ALL-CAP LONG/SHORT FUND SCHEDULE OF SECURITIES SOLD SHORT (Continued) | ||||||||
| COMMON STOCKS — 91.4% (Continued) | Shares | Value | ||||||
| Industrials — 18.1% (Continued) | ||||||||
| Aerospace & Defense — 3.1% (Continued) | ||||||||
| HEICO Corporation | 76 | $ | 3,959 | |||||
| Hexcel Corporation | 175 | 7,184 | ||||||
| Honeywell International, Inc. | 47 | 4,378 | ||||||
| Huntington Ingalls Industries, Inc. | 83 | 8,286 | ||||||
| KEYW Holding Corporation (The) | 279 | 2,957 | ||||||
| MOOG, Inc. - Class A | 113 | 8,143 | ||||||
| Precision Castparts Corporation | 21 | 5,313 | ||||||
| Rockwell Collins, Inc. | 29 | 2,292 | ||||||
| Spirit Aerosystems Holdings, Inc. - Class A | 280 | 9,086 | ||||||
| Taser International, Inc. | 159 | 2,110 | ||||||
| Teledyne Technologies, Inc. | 76 | 7,203 | ||||||
| Textron, Inc. | 196 | 7,687 | ||||||
| United Technologies Corporation | 42 | 4,881 | ||||||
| 134,764 | ||||||||
| Air Freight & Logistics — 0.5% | ||||||||
| Air Transport Services Group, Inc. | 290 | 2,633 | ||||||
| FedEx Corporation | 50 | 7,208 | ||||||
| United Parcel Service, Inc. - Class B | 49 | 5,090 | ||||||
| UTi Worldwide, Inc. | 353 | 3,442 | ||||||
| XPO Logistics, Inc. | 46 | 1,156 | ||||||
| 19,529 | ||||||||
| Building Products — 2.2% | ||||||||
| A.O. Smith Corporation | 69 | 3,407 | ||||||
| AAON, Inc. | 91 | 2,839 | ||||||
| American Woodmark Corporation | 50 | 1,378 | ||||||
| Apogee Enterprises, Inc. | 156 | 4,696 | ||||||
| Armstrong World Industries, Inc. | 122 | 6,475 | ||||||
| Builders FirstSource, Inc. | 680 | 4,882 | ||||||
| Fortune Brands Home & Security, Inc. | 144 | 5,757 | ||||||
| Gibraltar Industries, Inc. | 170 | 2,696 | ||||||
| Griffon Corporation | 218 | 2,548 | ||||||
| Lennox International, Inc. | 65 | 5,520 | ||||||
| Masco Corporation | 288 | 6,134 | ||||||
| Masonite International Corporation | 53 | 2,791 | ||||||
| NCI Building Systems, Inc. | 320 | 5,360 | ||||||
| Nortek, Inc. | 18 | 1,512 | ||||||
| Owens Corning, Inc. | 183 | 7,505 | ||||||
| PGT, Inc. | 206 | 1,774 | ||||||
| Ply Gem Holdings, Inc. | 260 | 3,058 | ||||||
| Quanex Building Products Corporation | 271 | 4,824 | ||||||
43
BARROW ALL-CAP LONG/SHORT FUND SCHEDULE OF SECURITIES SOLD SHORT (Continued) | ||||||||
| COMMON STOCKS — 91.4% (Continued) | Shares | Value | ||||||
| Industrials — 18.1% (Continued) | ||||||||
| Building Products — 2.2% (Continued) | ||||||||
| Simpson Manufacturing Company, Inc. | 137 | $ | 4,557 | |||||
| Trex Company, Inc. | 158 | 4,884 | ||||||
| Universal Forest Products, Inc. | 95 | 4,612 | ||||||
| USG Corporation | 269 | 8,065 | ||||||
| 95,274 | ||||||||
| Commercial Services & Supplies — 2.3% | ||||||||
| ABM Industries, Inc. | 93 | 2,536 | ||||||
| Brink's Company (The) | 84 | 2,243 | ||||||
| CECO Environmental Corporation | 20 | 286 | ||||||
| Clean Harbors, Inc. | 130 | 7,944 | ||||||
| Copart, Inc. | 46 | 1,636 | ||||||
| Covanta Holding Corporation | 324 | 6,185 | ||||||
| EnerNOC, Inc. | 184 | 3,531 | ||||||
| G&K Services, Inc. - Class A | 26 | 1,347 | ||||||
| Healthcare Services Group, Inc. | 119 | 3,541 | ||||||
| Herman Miller, Inc. | 42 | 1,313 | ||||||
| HNI Corporation | 20 | 749 | ||||||
| InnerWorkings, Inc. | 108 | 813 | ||||||
| Interface, Inc. | 227 | 4,141 | ||||||
| Iron Mountain, Inc. | 221 | 6,882 | ||||||
| KAR Auction Services, Inc. | 234 | 7,146 | ||||||
| Kimball International, Inc. - Class B | 160 | 2,581 | ||||||
| Knoll, Inc. | 40 | 702 | ||||||
| McGrath RentCorp | 127 | 4,354 | ||||||
| Mobile Mini, Inc. | 13 | 566 | ||||||
| MSA Safety, Inc. | 27 | 1,476 | ||||||
| Republic Services, Inc. | 179 | 6,337 | ||||||
| Rollins, Inc. | 22 | 675 | ||||||
| Schawk, Inc. | 34 | 690 | ||||||
| SP Plus Corporation | 149 | 3,534 | ||||||
| Steelcase, Inc. - Class A | 40 | 656 | ||||||
| Stericycle, Inc. | 49 | 5,604 | ||||||
| Team, Inc. | 77 | 3,228 | ||||||
| Tetra Tech, Inc. | 154 | 4,098 | ||||||
| Viad Corporation | 77 | 1,766 | ||||||
| Waste Connections, Inc. | 137 | 6,243 | ||||||
| Waste Management, Inc. | 142 | 6,345 | ||||||
| 99,148 | ||||||||
44
BARROW ALL-CAP LONG/SHORT FUND SCHEDULE OF SECURITIES SOLD SHORT (Continued) | ||||||||
| COMMON STOCKS — 91.4% (Continued) | Shares | Value | ||||||
| Industrials — 18.1% (Continued) | ||||||||
| Construction & Engineering — 0.6% | ||||||||
| AECOM Technology Corporation | 20 | $ | 643 | |||||
| Aegion Corporation | 195 | 4,674 | ||||||
| Ameresco, Inc. - Class A | 84 | 550 | ||||||
| Comfort Systems USA, Inc. | 154 | 2,541 | ||||||
| Dycom Industries, Inc. | 157 | 4,671 | ||||||
| Granite Construction, Inc. | 151 | 5,364 | ||||||
| Great Lakes Dredge & Dock Company | 483 | 3,680 | ||||||
| Jacobs Engineering Group, Inc. | 28 | 1,542 | ||||||
| MasTec, Inc. | 45 | 1,620 | ||||||
| Quanta Services, Inc. | 36 | 1,222 | ||||||
| 26,507 | ||||||||
| Electrical Equipment — 0.7% | ||||||||
| Acuity Brands, Inc. | 14 | 1,757 | ||||||
| Eaton Corporation plc | 12 | 884 | ||||||
| Encore Wire Corporation | 84 | 4,082 | ||||||
| Franklin Electric Company, Inc. | 125 | 4,787 | ||||||
| General Cable Corporation | 101 | 2,576 | ||||||
| GrafTech International Ltd. | 364 | 3,804 | ||||||
| Power Solutions International, Inc. | 53 | 4,133 | ||||||
| PowerSecure International, Inc. | 32 | 259 | ||||||
| Regal-Beloit Corporation | 43 | 3,282 | ||||||
| Roper Industries, Inc. | 20 | 2,834 | ||||||
| SolarCity Corporation | 63 | 3,308 | ||||||
| Vicor Corporation | 82 | 607 | ||||||
| 32,313 | ||||||||
| Industrial Conglomerates — 0.1% | ||||||||
| General Electric Company | 177 | 4,742 | ||||||
| Machinery — 4.3% | ||||||||
| Albany International Corporation - Class A | 84 | 3,129 | ||||||
| Altra Industrial Motion Corporation | 30 | 1,026 | ||||||
| Astec Industries, Inc. | 119 | 4,749 | ||||||
| Barnes Group, Inc. | 145 | 5,420 | ||||||
| Blount International, Inc. | 28 | 341 | ||||||
| Briggs & Stratton Corporation | 208 | 4,281 | ||||||
| Caterpillar, Inc. | 36 | 3,680 | ||||||
| Chart Industries, Inc. | 72 | 5,176 | ||||||
| CIRCOR International, Inc. | 54 | 4,118 | ||||||
| Colfax Corporation | 103 | 7,497 | ||||||
45
BARROW ALL-CAP LONG/SHORT FUND SCHEDULE OF SECURITIES SOLD SHORT (Continued) | ||||||||
| COMMON STOCKS — 91.4% (Continued) | Shares | Value | ||||||
| Industrials — 18.1% (Continued) | ||||||||
| Machinery — 4.3% (Continued) | ||||||||
| Cummins, Inc. | 45 | $ | 6,882 | |||||
| Donaldson Company, Inc. | 157 | 6,395 | ||||||
| EnPro Industries, Inc. | 61 | 4,477 | ||||||
| ESCO Technologies, Inc. | 127 | 4,270 | ||||||
| Federal Signal Corporation | 107 | 1,468 | ||||||
| Flowserve Corporation | 93 | 6,858 | ||||||
| Gorman-Rupp Company (The) | 101 | 3,203 | ||||||
| Harsco Corporation | 289 | 7,797 | ||||||
| ITT Corporation | 92 | 4,018 | ||||||
| John Bean Technologies Corporation | 23 | 658 | ||||||
| Kennametal, Inc. | 125 | 5,630 | ||||||
| L.B. Foster Company - Class A | 6 | 306 | ||||||
| Lincoln Electric Holdings, Inc. | 14 | 920 | ||||||
| Manitowoc Company, Inc. (The) | 32 | 866 | ||||||
| Meritor, Inc. | 116 | 1,602 | ||||||
| Middleby Corporation (The) | 34 | 8,120 | ||||||
| Mueller Industries, Inc. | 41 | 1,182 | ||||||
| Mueller Water Products, Inc. - Class A | 530 | 4,468 | ||||||
| NACCO Industries, Inc. - Class A | 43 | 2,333 | ||||||
| Pall Corporation | 78 | 6,610 | ||||||
| Parker Hannifin Corporation | 3 | 376 | ||||||
| Proto Labs, Inc. | 61 | 4,025 | ||||||
| RBC Bearings, Inc. | 57 | 3,418 | ||||||
| Rexnord Corporation | 100 | 2,557 | ||||||
| SPX Corporation | 79 | 8,266 | ||||||
| Tennant Company | 40 | 2,556 | ||||||
| Terex Corporation | 201 | 7,730 | ||||||
| Timken Company | 76 | 4,881 | ||||||
| Titan International, Inc. | 148 | 2,340 | ||||||
| Toro Company (The) | 15 | 969 | ||||||
| Trimas Corporation | 67 | 2,352 | ||||||
| Trinity Industries, Inc. | 92 | 7,961 | ||||||
| WABCO Holdings, Inc. | 47 | 5,018 | ||||||
| Watts Water Technologies, Inc. - Class A | 102 | 5,687 | ||||||
| Westinghouse Air Brake Technologies Corporation | 13 | 1,024 | ||||||
| Woodward, Inc. | 166 | 7,420 | ||||||
| Xylem, Inc. | 91 | 3,394 | ||||||
| 187,454 | ||||||||
46
BARROW ALL-CAP LONG/SHORT FUND SCHEDULE OF SECURITIES SOLD SHORT (Continued) | ||||||||
| COMMON STOCKS — 91.4% (Continued) | Shares | Value | ||||||
| Industrials — 18.1% (Continued) | ||||||||
| Marine — 0.2% | ||||||||
| Kirby Corporation | 72 | $ | 7,960 | |||||
| Matson, Inc. | 70 | 1,720 | ||||||
| 9,680 | ||||||||
| Professional Services — 1.3% | ||||||||
| Acacia Research Corporation | 277 | 4,471 | ||||||
| Advisory Board Company (The) | 125 | 6,049 | ||||||
| Barrett Business Services, Inc. | 28 | 1,320 | ||||||
| Corporate Executive Board Company (The) | 104 | 7,090 | ||||||
| Equifax, Inc. | 9 | 637 | ||||||
| IHS, Inc. - Class A | 48 | 6,044 | ||||||
| Kelly Services, Inc. - Class A | 206 | 3,659 | ||||||
| Kforce, Inc. | 106 | 2,335 | ||||||
| Manpower, Inc. | 81 | 6,640 | ||||||
| Mistras Group, Inc. | 195 | 4,438 | ||||||
| Nielsen Holdings N.V. | 82 | 3,957 | ||||||
| Paylocity Holding Corporation | 50 | 974 | ||||||
| Pendrell Corporation | 1,824 | 2,937 | ||||||
| Towers Watson & Company - Class A | 4 | 450 | ||||||
| TrueBlue, Inc. | 121 | 3,292 | ||||||
| Verisk Analytics, Inc. - Class A | 9 | 533 | ||||||
| WageWorks, Inc. | 103 | 4,169 | ||||||
| �� | 58,995 | |||||||
| Road & Rail — 2.0% | ||||||||
| ArcBest Corporation | 173 | 7,399 | ||||||
| Celadon Group, Inc. | 143 | 3,340 | ||||||
| Con-Way, Inc. | 171 | 7,902 | ||||||
| CSX Corporation | 230 | 6,762 | ||||||
| Genesee & Wyoming, Inc. - Class A | 73 | 7,107 | ||||||
| Heartland Express, Inc. | 96 | 2,076 | ||||||
| J.B. Hunt Transport Services, Inc. | 83 | 6,446 | ||||||
| Kansas City Southern | 51 | 5,483 | ||||||
| Knight Transportation, Inc. | 79 | 1,925 | ||||||
| Marten Transport, Ltd. | 241 | 5,806 | ||||||
| Norfolk Southern Corporation | 71 | 7,153 | ||||||
| Old Dominion Freight Line, Inc. | 126 | 8,059 | ||||||
| Ryder System, Inc. | 6 | 521 | ||||||
| Saia, Inc. | 64 | 2,789 | ||||||
| Swift Transportation Company | 203 | 5,026 | ||||||
| Union Pacific Corporation | 39 | 7,772 | ||||||
47
BARROW ALL-CAP LONG/SHORT FUND SCHEDULE OF SECURITIES SOLD SHORT (Continued) | ||||||||
| COMMON STOCKS — 91.4% (Continued) | Shares | Value | ||||||
| Industrials — 18.1% (Continued) | ||||||||
| Road & Rail — 2.0% (Continued) | ||||||||
| Universal Truckload Services, Inc. | 30 | $ | 729 | |||||
| Werner Enterprises, Inc. | 101 | 2,666 | ||||||
| 88,961 | ||||||||
| Trading Companies & Distributors — 0.6% | ||||||||
| Beacon Roofing Supply, Inc. | 64 | 2,208 | ||||||
| DXP Enterprises, Inc. | 3 | 209 | ||||||
| Fastenal Company | 123 | 5,996 | ||||||
| H&E Equipment Services, Inc. | 154 | 5,336 | ||||||
| Kaman Corporation | 45 | 1,914 | ||||||
| MRC Global, Inc. | 19 | 547 | ||||||
| MSC Industrial Direct Company, Inc. - Class A | 10 | 920 | ||||||
| Rush Enterprises, Inc. - Class A | 49 | 1,626 | ||||||
| Stock Building Supply Holdings, Inc. | 55 | 1,052 | ||||||
| W.W. Grainger, Inc. | 8 | 2,067 | ||||||
| Watsco, Inc. | 48 | 4,830 | ||||||
| 26,705 | ||||||||
| Transportation Infrastructure — 0.2% | ||||||||
| Macquarie Infrastructure Company, LLC | 132 | 8,116 | ||||||
| Wesco Aircraft Holdings, Inc. | 111 | 2,413 | ||||||
| 10,529 | ||||||||
| Materials — 10.1% | ||||||||
| Chemicals — 3.7% | ||||||||
| A. Schulman, Inc. | 53 | 1,866 | ||||||
| Advanced Emissions Solutions, Inc. | 126 | 2,950 | ||||||
| Air Products and Chemicals, Inc. | 53 | 6,358 | ||||||
| Airgas, Inc. | 55 | 5,848 | ||||||
| Albemarle Corporation | 35 | 2,422 | ||||||
| Ashland, Inc. | 29 | 2,987 | ||||||
| Axiall Corporation | 21 | 970 | ||||||
| Balchem Corporation | 19 | 1,048 | ||||||
| Cabot Corporation | 222 | 12,554 | ||||||
| Calgon Carbon Corporation | 147 | 3,153 | ||||||
| Celanese Corporation - Series A | 116 | 7,273 | ||||||
| Chemtura Corporation | 312 | 7,794 | ||||||
| Cytec Industries, Inc. | 13 | 1,291 | ||||||
| Dow Chemical Company (The) | 154 | 8,026 | ||||||
| E.I. du Pont de Nemours and Company | 82 | 5,683 | ||||||
| Ecolab, Inc. | 56 | 6,115 | ||||||
| Flotek Industries, Inc. | 48 | 1,362 | ||||||
| FMC Corporation | 44 | 3,369 | ||||||
48
BARROW ALL-CAP LONG/SHORT FUND SCHEDULE OF SECURITIES SOLD SHORT (Continued) | ||||||||
| COMMON STOCKS — 91.4% (Continued) | Shares | Value | ||||||
| Materials — 10.1% (Continued) | ||||||||
| Chemicals — 3.7% (Continued) | ||||||||
| Huntsman Corporation | 184 | $ | 4,911 | |||||
| Intrepid Potash, Inc. | 142 | 2,302 | ||||||
| Kraton Performance Polymers, Inc. | 302 | 7,511 | ||||||
| Kronos Worldwide, Inc. | 261 | 3,938 | ||||||
| LSB Industries, Inc. | 146 | 5,571 | ||||||
| OM Group, Inc. | 211 | 6,499 | ||||||
| PolyOne Corporation | 338 | 13,564 | ||||||
| Praxair, Inc. | 50 | 6,612 | ||||||
| Rockwood Holdings, Inc. | 107 | 8,172 | ||||||
| Sensient Technologies Corporation | 132 | 7,234 | ||||||
| Taminco Corporation | 172 | 3,665 | ||||||
| Tronox Ltd. | 417 | 11,080 | ||||||
| Valhi, Inc. | 299 | 1,716 | ||||||
| 163,844 | ||||||||
| Construction Materials — 0.8% | ||||||||
| Eagle Materials, Inc. | 145 | 12,611 | ||||||
| Headwaters, Inc. | 435 | 5,624 | ||||||
| Martin Marietta Materials, Inc. | 83 | 10,192 | ||||||
| Vulcan Materials Company | 114 | 6,951 | ||||||
| 35,378 | ||||||||
| Containers & Packaging — 0.3% | ||||||||
| Bemis Company, Inc. | 18 | 745 | ||||||
| Graphic Packaging Holding Company | 252 | 2,769 | ||||||
| Myers Industries, Inc. | 79 | 1,679 | ||||||
| Packaging Corporation of America | 30 | 2,075 | ||||||
| Rock-Tenn Company - Class A | 34 | 3,435 | ||||||
| Sealed Air Corporation | 48 | 1,581 | ||||||
| 12,284 | ||||||||
| Metals & Mining — 4.1% | ||||||||
| Alcoa, Inc. | 661 | 8,996 | ||||||
| Allegheny Technologies, Inc. | 340 | 13,964 | ||||||
| Allied Nevada Gold Corporation | 52 | 144 | ||||||
| Carpenter Technology Corporation | 162 | 10,123 | ||||||
| Century Aluminum Company | 688 | 9,391 | ||||||
| Coeur Mining, Inc. | 596 | 4,077 | ||||||
| Commercial Metals Company | 451 | 8,005 | ||||||
| Compass Minerals International, Inc. | 127 | 11,810 | ||||||
| Freeport-McMoRan Copper & Gold, Inc. | 146 | 4,971 | ||||||
| Globe Specialty Metals, Inc. | 410 | 8,196 | ||||||
| Haynes International, Inc. | 55 | 2,921 | ||||||
49
BARROW ALL-CAP LONG/SHORT FUND SCHEDULE OF SECURITIES SOLD SHORT (Continued) | ||||||||
| COMMON STOCKS — 91.4% (Continued) | Shares | Value | ||||||
| Materials — 10.1% (Continued) | ||||||||
| Metals & Mining — 4.1% (Continued) | ||||||||
| Hecla Mining Company | 2,132 | $ | 5,906 | |||||
| Horsehead Holding Corporation | 445 | 7,378 | ||||||
| Materion Corporation | 214 | 7,295 | ||||||
| Newmont Mining Corporation | 215 | 4,921 | ||||||
| Nucor Corporation | 130 | 6,582 | ||||||
| Reliance Steel & Aluminum Company | 8 | 576 | ||||||
| Royal Gold, Inc. | 198 | 12,419 | ||||||
| RTI International Metals, Inc. | 125 | 3,352 | ||||||
| Schnitzer Steel Industries, Inc. - Class A | 249 | 6,205 | ||||||
| Steel Dynamics, Inc. | 612 | 10,569 | ||||||
| Stillwater Mining Company | 618 | 10,389 | ||||||
| SunCoke Energy, Inc. | 178 | 3,574 | ||||||
| United States Steel Corporation | 58 | 1,336 | ||||||
| US Silica Holdings, Inc. | 81 | 4,096 | ||||||
| Worthington Industries, Inc. | 281 | 11,324 | ||||||
| 178,520 | ||||||||
| Paper & Forest Products — 1.2% | ||||||||
| Clearwater Paper Corporation | 122 | 7,573 | ||||||
| Deltic Timber Corporation | 106 | 6,494 | ||||||
| International Paper Company | 136 | 6,478 | ||||||
| KapStone Paper and Packaging Corporation | 422 | 12,259 | ||||||
| MeadWestvaco Corporation | 175 | 7,101 | ||||||
| P.H. Glatfelter Company | 236 | 6,212 | ||||||
| Wausau Paper Corporation | 493 | 5,245 | ||||||
| 51,362 | ||||||||
Total Common Stocks (Proceeds $3,769,097) | $ | 4,009,956 | ||||||
WARRANTS — 0.0% (a) | Shares | Value | ||||||
Magnum Hunter Resources Corporation (b) (Proceeds $0) | 97 | $ | — | |||||
Total Securities Sold Short — 91.4% (Proceeds $3,769,097) | $ | 4,009,956 | ||||||
| (a) | Percentage rounds to less than 0.1% |
| (b) | Security value has been determined in good faith pursuant to procedures adopted by the Board of Trustees. The total value of such securities is $0 at May 31, 2014, representing 0.0% of net assets (Note 2). |
| See accompanying notes to financial statements. | |
50
BARROW FUNDS STATEMENTS OF ASSETS AND LIABILITIES May 31, 2014 | ||||||||
Barrow All-Cap Core Fund | Barrow All-Cap Long/Short Fund | |||||||
| ASSETS | ||||||||
| Investments in securities: | ||||||||
| At acquisition cost | $ | 18,887,677 | $ | 5,426,605 | ||||
| At value (Note 2) | $ | 21,715,928 | $ | 5,765,929 | ||||
| Deposits with brokers for securities sold short (Note 2) | — | 2,619,424 | ||||||
| Cash | — | 153 | ||||||
| Dividends and interest receivable | 32,867 | 8,901 | ||||||
| Receivable for capital shares sold | — | 100 | ||||||
| Receivable from Adviser (Note 4) | — | 9,187 | ||||||
| Other assets | 11,975 | 12,121 | ||||||
| TOTAL ASSETS | 21,760,770 | 8,415,815 | ||||||
| LIABILITIES | ||||||||
| Securities sold short, at value (Note 2) (proceeds $3,769,097) | — | 4,009,956 | ||||||
| Line of credit payable (Note 5) | 7 | — | ||||||
| Dividends payable on securities sold short (Note 2) | — | 2,792 | ||||||
| Payable to Adviser (Note 4) | 6,433 | — | ||||||
| Payable to administrator (Note 4) | 7,680 | 7,540 | ||||||
| Accrued brokerage expense on securities sold short (Note 2) | — | 206 | ||||||
| Other accrued expenses and liabilities | 7,484 | 9,051 | ||||||
| TOTAL LIABILITIES | 21,604 | 4,029,545 | ||||||
| NET ASSETS | $ | 21,739,166 | $ | 4,386,270 | ||||
| Net assets consist of: | ||||||||
| Paid-in capital | $ | 17,141,594 | $ | 4,233,835 | ||||
| Undistributed net investment income | 98,862 | 11,721 | ||||||
| Accumulated undistributed net realized gains from security transactions | 1,670,459 | 42,249 | ||||||
| Net unrealized appreciation (depreciation) on: | ||||||||
| Investments | 2,828,251 | 339,324 | ||||||
| Short positions | — | (240,859 | ) | |||||
| Net assets | $ | 21,739,166 | $ | 4,386,270 | ||||
| NET ASSET VALUE PER SHARE: | ||||||||
| INSTITUTIONAL CLASS | ||||||||
| Net assets applicable to Institutional Class | $ | 21,380,457 | $ | 4,212,079 | ||||
Institutional Class shares of beneficial interest outstanding (unlimited number of shares authorized, no par value) | 809,713 | 404,765 | ||||||
| Net asset value, offering price and redemption price per share (Note 2) | $ | 26.40 | $ | 10.41 | ||||
| INVESTOR CLASS | ||||||||
| Net assets applicable to Investor Class | $ | 358,709 | $ | 174,191 | ||||
Investor Class shares of beneficial interest outstanding (unlimited number of shares authorized, no par value) | 13,602 | 16,758 | ||||||
| Net asset value, offering price and redemption price per share (Note 2) | $ | 26.37 | $ | 10.39 | ||||
| See accompanying notes to financial statements. |
51
BARROW FUNDS STATEMENTS OF OPERATIONS For the Period Ended May 31, 2014(a) | ||||||||
Barrow All-Cap Core Fund | Barrow All-Cap Long/Short Fund | |||||||
| INVESTMENT INCOME | ||||||||
| Dividends | $ | 316,505 | $ | 78,824 | ||||
| Interest | — | 7,772 | ||||||
| TOTAL INVESTMENT INCOME | 316,505 | 86,596 | ||||||
| EXPENSES | ||||||||
| Investment advisory fees (Note 4) | 145,203 | 41,540 | ||||||
| Accounting services fees (Note 4) | 23,963 | 22,779 | ||||||
| Custodian fees | 14,138 | 28,953 | ||||||
| Registration and filing fees, Common | 6,494 | 4,794 | ||||||
| Registration fees, Institutional Class | 8,675 | 8,699 | ||||||
| Registration fees, Investor Class | 4,934 | 4,984 | ||||||
| Administration fees (Note 4) | 18,000 | 18,000 | ||||||
| Transfer agent fees, Institutional Class (Note 4) | 9,000 | 9,000 | ||||||
| Transfer agent fees, Investor Class (Note 4) | 9,000 | 9,000 | ||||||
| Professional fees | 14,505 | 14,505 | ||||||
| Dividend expense on securities sold short (Note 2) | — | 27,646 | ||||||
| Prime brokerage expense on securities sold short (Note 2) | — | 21,409 | ||||||
| Compliance service fees (Note 4) | 9,000 | 9,000 | ||||||
| Pricing fees | 2,449 | 12,462 | ||||||
| Trustees’ fees and expenses (Note 4) | 6,889 | 6,889 | ||||||
| Postage and supplies | 3,998 | 4,026 | ||||||
| Printing of shareholder reports | 3,075 | 2,927 | ||||||
| Insurance expense | 1,482 | 1,482 | ||||||
| Distribution fees, Investor Class (Note 4) | 246 | 271 | ||||||
| Borrowing costs (Note 5) | 121 | — | ||||||
| Other expenses | 6,036 | 6,027 | ||||||
| TOTAL EXPENSES | 287,208 | 254,393 | ||||||
| Fee reductions and expense reimbursements by the Adviser (Note 4): | ||||||||
| Common | (86,552 | ) | (125,244 | ) | ||||
| Institutional Class | (17,675 | ) | (17,699 | ) | ||||
| Investor Class | (13,934 | ) | (13,984 | ) | ||||
| NET EXPENSES | 169,047 | 97,466 | ||||||
| NET INVESTMENT INCOME (LOSS) | 147,458 | (10,870 | ) | |||||
| (a) | Represents the period from the commencement of operations (close of business August 30, 2013) through May 31, 2014 (Note 1). |
| See accompanying notes to financial statements. | |
52
BARROW FUNDS STATEMENTS OF OPERATIONS For the Period Ended May 31, 2014(a) (Continued) | ||||||||
Barrow All-Cap Core Fund | Barrow All-Cap Long/Short Fund | |||||||
| REALIZED AND UNREALIZED GAINS (LOSSES) ON INVESTMENTS AND SECURITIES SOLD SHORT | ||||||||
| Net realized gains (losses) from: | ||||||||
| Investments | $ | 2,033,616 | $ | 253,094 | ||||
| Securities sold short | — | (188,254 | ) | |||||
| Net change in unrealized appreciation (depreciation) on: | ||||||||
| Investments | 550,715 | 339,324 | ||||||
| Securities sold short | — | (240,859 | ) | |||||
| NET REALIZED AND UNREALIZED GAINS ON INVESTMENTS | 2,584,331 | 163,305 | ||||||
| NET INCREASE IN NET ASSETS RESULTING FROM OPERATIONS | $ | 2,731,789 | $ | 152,435 | ||||
| (a) | Represents the period from the commencement of operations (close of business August 30, 2013) through May 31, 2014 (Note 1). |
| See accompanying notes to financial statements. | |
53
BARROW FUNDS STATEMENTS OF CHANGES IN NET ASSETS For the Period Ended May 31, 2014(a) | ||||||||
Barrow All-Cap Core Fund | Barrow All-Cap Long/Short Fund | |||||||
| FROM OPERATIONS | ||||||||
| Net investment income (loss) | $ | 147,458 | $ | (10,870 | ) | |||
| Net realized gains (losses) from: | ||||||||
| Investments | 2,033,616 | 253,094 | ||||||
| Securities sold short | — | (188,254 | ) | |||||
| Net change in unrealized appreciation (depreciation) on: | ||||||||
| Investments | 550,715 | 339,324 | ||||||
| Securities sold short | — | (240,859 | ) | |||||
| Net increase in net assets resulting from operations | 2,731,789 | 152,435 | ||||||
| DISTRIBUTIONS TO SHAREHOLDERS (Note 2) | ||||||||
| Net investment income, Institutional Class | (48,373 | ) | — | |||||
| Net investment income, Investor Class | (223 | ) | — | |||||
| Net realized gains, Institutional Class | (360,767 | ) | — | |||||
| Net realized gains, Investor Class | (2,390 | ) | — | |||||
| Decrease in net assets from distributions to shareholders | (411,753 | ) | — | |||||
| CAPITAL SHARE TRANSACTIONS | ||||||||
| Institutional Class | ||||||||
| Proceeds from shares sold | 2,180,472 | 5,510,279 | ||||||
| Net asset value of shares issued in reinvestment of distributions | 409,139 | — | ||||||
| Proceeds from tax-free reorganization (Note 1) | 16,732,894 | — | ||||||
| Payments for shares redeemed | (243,555 | ) | (1,444,928 | ) | ||||
| Net increase in Institutional Class net assets from capital share transactions | 19,078,950 | 4,065,351 | ||||||
| Investor Class | ||||||||
| Proceeds from shares sold | 337,567 | 201,389 | ||||||
| Net asset value of shares issued in reinvestment of distributions | 2,613 | — | ||||||
| Payments for shares redeemed | — | (32,905 | ) | |||||
| Net increase in Investor Class net assets from capital share transactions | 340,180 | 168,484 | ||||||
| TOTAL INCREASE IN NET ASSETS | 21,739,166 | 4,386,270 | ||||||
| NET ASSETS | ||||||||
| Beginning of period | — | — | ||||||
| End of period | $ | 21,739,166 | $ | 4,386,270 | ||||
| UNDISTRIBUTED NET INVESTMENT INCOME | $ | 98,862 | $ | 11,721 | ||||
| (a) | Represents the period from the commencement of operations (close of business August 30, 2013) through May 31, 2014 (Note 1). |
| See accompanying notes to financial statements. | |
54
BARROW FUNDS STATEMENTS OF CHANGES IN NET ASSETS For the Period Ended May 31, 2014(a) (Continued) | ||||||||
Barrow All-Cap Core Fund | Barrow All-Cap Long/Short Fund | |||||||
| CAPITAL SHARE ACTIVITY | ||||||||
| Institutional Class | ||||||||
| Shares sold | 85,541 | 546,033 | ||||||
| Shares reinvested | 15,791 | — | ||||||
| Shares issued from tax-free reorganization (Note 1) | 718,150 | — | ||||||
| Shares redeemed | (9,769 | ) | (141,268 | ) | ||||
| Net increase in shares outstanding | 809,713 | 404,765 | ||||||
| Shares outstanding, beginning of period | — | — | ||||||
| Shares outstanding, end of period | 809,713 | 404,765 | ||||||
| Investor Class | ||||||||
| Shares sold | 13,501 | 19,972 | ||||||
| Shares reinvested | 101 | — | ||||||
| Shares redeemed | — | (3,214 | ) | |||||
| Net increase in shares outstanding | 13,602 | 16,758 | ||||||
| Shares outstanding, beginning of period | — | — | ||||||
| Shares outstanding, end of period | 13,602 | 16,758 | ||||||
| (a) | Represents the period from the commencement of operations (close of business August 30, 2013) through May 31, 2014 (Note 1). |
| See accompanying notes to financial statements. | |
55
BARROW ALL-CAP CORE FUND INSTITUTIONAL CLASS FINANCIAL HIGHLIGHTS | ||||
Per share data for a share outstanding throughout the period: | ||||
Period Ended May 31, 2014(a) | ||||
| Net asset value at beginning of period | $ | 23.30 | ||
| Income from investment operations: | ||||
| Net investment income | 0.18 | |||
| Net realized and unrealized gains on investments | 3.47 | |||
| Total from investment operations | 3.65 | |||
| Less distributions: | ||||
| From net investment income | (0.06 | ) | ||
| From net realized gains from investments | (0.49 | ) | ||
| Total distributions | (0.55 | ) | ||
| Net asset value at end of period | $ | 26.40 | ||
Total return (b) | 15.73 | %(c) | ||
| Ratios and supplemental data: | ||||
| Net assets at end of period (000’s) | $ | 21,380 | ||
| Ratio of total expenses to average net assets | 1.86 | %(d) | ||
Ratio of net expenses to average net assets (e) | 1.15 | %(d) | ||
Ratio of net expenses to average net assets excluding borrowing costs (e) | 1.15 | %(d) | ||
Ratio of net investment income to average net assets (e) | 1.01 | %(d) | ||
| Portfolio turnover rate | 45 | %(c) | ||
| (a) | Represents the period from the commencement of operations (close of business August 30, 2013) through May 31, 2014 (Note 1). |
| (b) | Total return is a measure of the change in value of an investment in the Fund over the period covered, which assumes any dividends or capital gains distributions are reinvested in shares of the Fund. The return shown does not reflect the deduction of taxes a shareholder would pay on Fund distributions or the redemption of Fund shares. Total return would be lower if the Adviser had not reduced advisory fees and reimbursed expenses. |
| (c) | Not annualized. |
| (d) | Annualized. |
| (e) | Ratio was determined after fee reductions and expense reimbursements by the Adviser (Note 4). |
| See accompanying notes to financial statements. | |
56
BARROW ALL-CAP CORE FUND INVESTOR CLASS FINANCIAL HIGHLIGHTS | ||||
Per share data for a share outstanding throughout the period: | ||||
Period Ended May 31, 2014(a) | ||||
| Net asset value at beginning of period | $ | 23.30 | ||
| Income from investment operations: | ||||
| Net investment income | 0.09 | |||
| Net realized and unrealized gains on investments | 3.51 | |||
| Total from investment operations | 3.60 | |||
| Less distributions: | ||||
| From net investment income | (0.04 | ) | ||
| From net realized gains from investments | (0.49 | ) | ||
| Total distributions | (0.53 | ) | ||
| Net asset value at end of period | $ | 26.37 | ||
Total return (b) | 15.51 | %(c) | ||
| Ratios and supplemental data: | ||||
| Net assets at end of period (000’s) | $ | 359 | ||
| Ratio of total expenses to average net assets | 16.03 | %(d) | ||
Ratio of net expenses to average net assets (e) | 1.40 | %(d) | ||
Ratio of net expenses to average net assets excluding borrowing costs (e) | 1.40 | %(d) | ||
Ratio of net investment income to average net assets (e) | 0.76 | %(d) | ||
| Portfolio turnover rate | 45 | %(c) | ||
| (a) | Represents the period from the commencement of operations (close of business August 30, 2013) through May 31, 2014 (Note 1). |
| (b) | Total return is a measure of the change in value of an investment in the Fund over the period covered, which assumes any dividends or capital gains distributions are reinvested in shares of the Fund. The return shown does not reflect the deduction of taxes a shareholder would pay on Fund distributions or the redemption of Fund shares. Total return would be lower if the Adviser had not reduced advisory fees and reimbursed expenses. |
| (c) | Not annualized. |
| (d) | Annualized. |
| (e) | Ratio was determined after fee reductions and expense reimbursements by the Adviser (Note 4). |
| See accompanying notes to financial statements. | |
57
BARROW ALL-CAP LONG/SHORT FUND INSTITUTIONAL CLASS FINANCIAL HIGHLIGHTS | ||||
Per share data for a share outstanding throughout the period: | ||||
Period Ended May 31, 2014(a) | ||||
| Net asset value at beginning of period | $ | 10.00 | ||
| Income (loss) from investment operations: | ||||
| Net investment loss | (0.03 | ) | ||
| Net realized and unrealized gains on investments | 0.44 | |||
| Total from investment operations | 0.41 | |||
| Net asset value at end of period | $ | 10.41 | ||
Total return (b) | 4.10 | %(c) | ||
| Ratios and supplemental data: | ||||
| Net assets at end of period (000’s) | $ | 4,212 | ||
Ratio of total expenses to average net assets (d) | 8.69 | %(e) | ||
Ratio of net expenses to average net assets (d) (f) | 3.51 | %(e) | ||
Ratio of net expenses to average net assets excluding dividend expense (d) (f) | 2.51 | %(e) | ||
Ratio of net expenses to average net assets excluding dividend expense and prime brokerage expense on securities sold short (f) | 1.74 | %(e) | ||
Ratio of net investment loss to average net assets (f) | (0.37 | )%(e) | ||
| Portfolio turnover rate | 76 | %(c) | ||
| (a) | Represents the period from the commencement of operations (close of business August 30, 2013) through May 31, 2014 (Note 1). |
| (b) | Total return is a measure of the change in value of an investment in the Fund over the period covered, which assumes any dividends or capital gains distributions are reinvested in shares of the Fund. The return shown does not reflect the deduction of taxes a shareholder would pay on Fund distributions, if any, or the redemption of Fund shares. Total return would be lower if the Adviser had not reduced advisory fees and reimbursed expenses. |
| (c) | Not annualized. |
| (d) | The Fund earns interest income on the margin account balance that is associated with securities sold short. The ratio of interest income to average net assets for the period ended May 31, 2014 is 0.28%(e). |
| (e) | Annualized. |
| (f) | Ratio was determined after fee reductions and expense reimbursements by the Adviser (Note 4). |
| See accompanying notes to financial statements. | |
58
BARROW ALL-CAP LONG/SHORT FUND INVESTOR CLASS FINANCIAL HIGHLIGHTS | ||||
Per share data for a share outstanding throughout the period: | ||||
Period Ended May 31, 2014(a) | ||||
| Net asset value at beginning of period | $ | 10.00 | ||
| Income (loss) from investment operations: | ||||
| Net investment loss | (0.04 | ) | ||
| Net realized and unrealized gains on investments | 0.43 | |||
| Total from investment operations | 0.39 | |||
| Net asset value at end of period | $ | 10.39 | ||
Total return (b) | 3.90 | %(c) | ||
| Ratios and supplemental data: | ||||
| Net assets at end of period (000’s) | $ | 174 | ||
Ratio of total expenses to average net assets (d) | 21.15 | %(e) | ||
Ratio of net expenses to average net assets (d) (f) | 3.76 | %(e) | ||
Ratio of net expenses to average net assets excluding dividend expense (d) (f) | 2.76 | %(e) | ||
Ratio of net expenses to average net assets excluding dividend expense and prime brokerage expense on securities sold short (f) | 1.99 | %(e) | ||
Ratio of net investment loss to average net assets (f) | (0.62 | )%(e) | ||
| Portfolio turnover rate | 76 | %(c) | ||
| (a) | Represents the period from the commencement of operations (close of business August 30, 2013) through May 31, 2014 (Note 1). |
| (b) | Total return is a measure of the change in value of an investment in the Fund over the period covered, which assumes any dividends or capital gains distributions are reinvested in shares of the Fund. The return shown does not reflect the deduction of taxes a shareholder would pay on Fund distributions, if any, or the redemption of Fund shares. Total return would be lower if the Adviser had not reduced advisory fees and reimbursed expenses. |
| (c) | Not annualized. |
| (d) | The Fund earns interest income on the margin account balance that is associated with securities sold short. The ratio of interest income to average net assets for the period ended May 31, 2014 is 0.28%(e). |
| (e) | Annualized. |
| (f) | Ratio was determined after fee reductions and expense reimbursements by the Adviser (Note 4). |
| See accompanying notes to financial statements. | |
59
BARROW FUNDS
NOTES TO FINANCIAL STATEMENTS
May 31, 2014
NOTES TO FINANCIAL STATEMENTS
May 31, 2014
1. Organization
Barrow All-Cap Core Fund and Barrow All-Cap Long/Short Fund (individually, a “Fund” and collectively, the “Funds”) are each a diversified series of Ultimus Managers Trust (the “Trust”), an open-end investment company established as an Ohio business trust under a Declaration of Trust dated February 28, 2012. Other series of the Trust are not incorporated in this report. The Funds commenced operations at the close of business on August 30, 2013.
The investment objective of Barrow All-Cap Core Fund is to generate long-term capital appreciation. The investment objective of Barrow All-Cap Long/Short Fund is to generate above-average returns through capital appreciation, while also attempting to reduce volatility and preserve capital during market downturns.
Barrow All-Cap Core Fund acquired the assets and liabilities of Barrow Street Fund LP, a Delaware limited partnership (the “Predecessor Private Fund”), in a tax-free reorganization completed at the close of business on August 30, 2013, the date the Barrow All-Cap Core Fund commenced operations. The Predecessor Private Fund had an investment objective and investment policies that were, in all material respects, equivalent to those of Barrow All-Cap Core Fund. However, the Predecessor Private Fund was not registered as an investment company under the Investment Company Act of 1940, as amended (the “1940 Act”), and was not subject to certain investment limitations, diversification requirements, liquidity requirements and other restrictions imposed by the 1940 Act and the Internal Revenue Code of 1986, as amended (the “Code”). If such requirements and restrictions had been applicable, they might have adversely affected the Predecessor Private Fund’s performance. In addition, the Predecessor Private Fund charged an annual management fee of 1.50% of assets and, until October 7, 2012, a 20% performance fee after it reached certain performance benchmarks. Barrow All-Cap Core Fund pays a management fee equal to 0.99% of average daily net assets and does not charge a performance fee.
Upon completion of the reorganization, the net assets of Barrow All-Cap Core Fund were $16,732,894. The number of shares of Barrow All-Cap Core Fund issued in connection with the reorganization was 718,150, and the amount of net unrealized gains on the portfolio securities transferred to Barrow All-Cap Core Fund was $2,277,536.
Each Fund offers two classes of shares: Institutional Class shares (sold without any sales loads or distribution fees) and Investor Class shares (sold without any sales loads, but subject to a distribution fee of up to 0.25% of the average daily net assets attributable to Investor Class shares). Each class of shares represents an ownership interest in the same investment portfolio.
60
BARROW FUNDS
NOTES TO FINANCIAL STATEMENTS (Continued)
NOTES TO FINANCIAL STATEMENTS (Continued)
2. Significant Accounting Policies
The following is a summary of the Funds’ significant accounting policies. The policies are in conformity with accounting principles generally accepted in the United States of America (“GAAP”).
Securities valuation – Each Fund’s portfolio securities are valued at market value as of the close of regular trading on the New York Stock Exchange (the “NYSE”) (normally 4:00 p.m. Eastern time) on each business day the NYSE is open. Securities listed on the NYSE or other exchanges are valued on the basis of their last sales prices on the exchanges on which they are primarily traded. If there are no sales on that day, the securities are valued at the closing bid price on the NYSE or other primary exchange for that day. NASDAQ listed securities are valued at the NASDAQ Official Closing Price. If there are no sales on that day, the securities are valued at the last bid price as reported by NASDAQ. Securities traded in the over-the-counter market are valued at the last sale price, if available, otherwise at the mean of the closing bid and ask prices. In the event that market quotations are not readily available or are considered unreliable due to market or other events, securities and other assets are valued at fair value as determined in good faith in accordance with procedures adopted by the Board of Trustees of the Trust and will be classified as Level 2 or 3 within the fair value hierarchy (see below), depending on the inputs used. Factors determining portfolio investments subject to fair value determination include, but are not limited to, the following: the spread between bid and asked prices is substantial; infrequency of sales; thinness of market; the size of reported trades; a temporary lapse in the provision of prices by any reliable pricing source; and actions of the securities or futures markets, such as the suspension or limitation of trading.
GAAP establishes a single authoritative definition of fair value, sets out a framework for measuring fair value and requires additional disclosures about fair value measurements.
Various inputs are used in determining the value of each Fund’s investments. These inputs are summarized in the three broad levels listed below:
| • | Level 1 – quoted prices in active markets for identical securities |
| • | Level 2 – other significant observable inputs |
| • | Level 3 – significant unobservable inputs |
61
BARROW FUNDS
NOTES TO FINANCIAL STATEMENTS (Continued)
NOTES TO FINANCIAL STATEMENTS (Continued)
The inputs or methodology used for valuing securities are not necessarily an indication of the risks associated with investing in those securities. The inputs used to measure fair value may fall into different levels of the fair value hierarchy. In such cases, for disclosure purposes, the level in the fair value hierarchy within which the fair value measurement falls in its entirety is determined based on the lowest level input that is significant to the fair value measurement.
The following is a summary of the inputs used to value the Funds’ investments as of May 31, 2014:
| Barrow All-Cap Core Fund | Level 1 | Level 2 | Level 3 | Total | ||||||||||||
Investments in Securities: | ||||||||||||||||
| Common Stocks | $ | 21,276,052 | $ | — | $ | — | $ | 21,276,052 | ||||||||
| Money Market Funds | 439,876 | — | — | 439,876 | ||||||||||||
| Total | $ | 21,715,928 | $ | — | $ | — | $ | 21,715,928 | ||||||||
| Barrow All-Cap Long/Short Fund | Level 1 | Level 2 | Level 3 | Total | ||||||||||||
Investments in Securities: | ||||||||||||||||
| Common Stocks | $ | 5,743,224 | $ | — | (a) | $ | — | $ | 5,743,224 | |||||||
| Money Market Funds | 22,705 | — | — | 22,705 | ||||||||||||
| Total | $ | 5,765,929 | $ | — | $ | — | $ | 5,765,929 | ||||||||
Other Financial Instruments: | ||||||||||||||||
| Common Stocks – Sold Short | $ | (4,009,956 | ) | $ | — | $ | — | $ | (4,009,956 | ) | ||||||
| Warrants – Sold Short | — | — | (a) | — | — | |||||||||||
| Total | $ | (4,009,956 | ) | $ | — | $ | — | $ | (4,009,956 | ) | ||||||
| (a) | Barrow All-Cap Core Long/Short Fund holds Level 2 securities which are valued at $0. |
Refer to each Fund’s Schedule of Investments and Schedule of Securities Sold Short, as applicable, for a listing of securities by industry type. As of May 31, 2014, the Funds did not have any transfers in and out of any Level. There were no Level 3 securities and or derivative instruments held by the Funds as of May 31, 2014. It is the Funds’ policy to recognize transfers into and out of any Level at the end of the reporting period.
Share valuation – The net asset value per share of each class of each Fund is calculated daily by dividing the total value of the assets attributable to that class, less liabilities attributable to that class, by the number of shares of that class outstanding. The offering price and redemption price per share of each class of each Fund is equal to the net asset value per share of such class.
62
BARROW FUNDS
NOTES TO FINANCIAL STATEMENTS (Continued)
NOTES TO FINANCIAL STATEMENTS (Continued)
Investment income – Dividend income is recorded on the ex-dividend date. Interest income is accrued as earned.
Security transactions – Security transactions are accounted for on the trade date. Gains and losses on securities sold are determined on a specific identification basis.
Allocation between classes – Investment income earned, realized capital gains and losses, and unrealized appreciation and depreciation are allocated daily to each class of shares based upon its proportionate share of total net assets of each Fund. Class specific expenses are charged directly to the class incurring the expense. Common expenses which are not attributable to a specific class are allocated daily to each class of shares based upon its proportionate share of total net assets of each Fund.
Common expenses – Common expenses of the Trust are allocated among the Funds and the other series of the Trust based on the relative net assets of each series or the nature of the services performed and the relative applicability to each series.
Distributions to shareholders – Distributions to shareholders arising from net investment income and net realized capital gains, if any, are distributed at least once each year. The amount of distributions from net investment income and net realized gains are determined in accordance with federal income tax regulations, which may differ from GAAP. Dividends and distributions to shareholders are recorded on the ex-dividend date. The tax character of distributions paid by Barrow All-Cap Core Fund during the period ended May 31, 2014 was as follows:
Ordinary Income | Long-Term Capital Gains | Total | ||||||||||
| Institutional Class | $ | 193,861 | $ | 215,279 | $ | 409,140 | ||||||
| Investor Class | $ | 1,187 | $ | 1,426 | $ | 2,613 | ||||||
There were no distributions paid by Barrow All-Cap Long/Short Fund during the period ended May 31, 2014.
Short Positions – Barrow All-Cap Long/Short Fund may sell securities short. For financial statement purposes, an amount equal to the settlement amount is included in the Statements of Assets and Liabilities as an asset and an equivalent liability is then subsequently marked-to-market daily to reflect the current value of the short position. Subsequent fluctuations in the market prices of securities sold, but not yet purchased, may require purchasing the securities at prices which may differ from the market value reflected on the Statements of Assets and Liabilities. The Fund is liable for any dividends payable on securities while those securities are in a short position and will also bear other costs, such as charges for the prime brokerage accounts, in connection with the short positions. These costs are reported as brokerage expenses on securities sold short in the Statements of Operations. As collateral for its short positions, the Fund is required under the 1940 Act to maintain assets consisting of cash, cash equivalents
63
BARROW FUNDS
NOTES TO FINANCIAL STATEMENTS (Continued)
NOTES TO FINANCIAL STATEMENTS (Continued)
or other liquid securities equal to the market value of the securities sold short. The deposits with brokers for securities sold short are reported on the Statements of Assets and Liabilities. The amount of collateral is required to be adjusted daily to reflect changes in the value of the securities sold short. To the extent Barrow All-Cap Long/Short Fund invests the proceeds received from selling securities short, the Fund is engaging in a form of leverage. The use of leverage by the Fund may make any change in the Fund’s net asset value greater than it would be without the use of leverage. Short sales are speculative transactions and involve special risks, including greater reliance on the ability of Barrow Street Advisors, LLC (the "Adviser") to accurately anticipate the future value of a security.
Estimates – The preparation of financial statements in conformity with GAAP requires management to make estimates and assumptions that affect the reported amounts of assets and liabilities and disclosure of contingent assets and liabilities as of the date of the financial statements and the reported amounts of income and expenses during the reporting period. Actual results could differ from those estimates.
Federal income tax – Each Fund intends to qualify as a regulated investment company under the Code. Qualification generally will relieve each Fund of liability for federal income taxes to the extent 100% of its net investment income and net realized gains are distributed in accordance with the Code. Accordingly, no provision for income tax has been made.
In order to avoid imposition of the excise tax applicable to regulated investment companies, it is also each Fund’s intention to declare as dividends in each calendar year at least 98% of its net investment income (earned during the calendar year) and 98.2% of its net realized capital gains (earned during the twelve months ended October 31) plus undistributed amounts from prior years.
The following information is computed on a tax basis for each item as of May 31, 2014:
| Barrow All-Cap Core Fund | Barrow All-Cap Long/Short Fund | |||||||
| Cost of portfolio investments | $ | 18,872,639 | $ | 5,444,542 | ||||
| Gross unrealized appreciation | $ | 3,583,895 | $ | 584,639 | ||||
| Gross unrealized depreciation | (740,606 | ) | (263,252 | ) | ||||
| Net unrealized appreciation | 2,843,289 | 321,387 | ||||||
| Net unrealized depreciation on securities sold short | — | (341,581 | ) | |||||
| Undistributed ordinary income | 161,229 | 172,629 | ||||||
| Undistributed long-term gains | 1,593,054 | — | ||||||
| Accumulated earnings | $ | 4,597,572 | $ | 152,435 | ||||
64
BARROW FUNDS
NOTES TO FINANCIAL STATEMENTS (Continued)
NOTES TO FINANCIAL STATEMENTS (Continued)
As of May 31, 2014, the tax cost of securities sold short is $3,668,375 for Barrow All-Cap Long/Short Fund.
The difference between the federal income tax cost of portfolio investments and securities sold short and the tax components of accumulated earnings and the financial statement cost and components of net assets is due to certain timing differences in the recognition of capital gains or losses under income tax regulations and GAAP. These “book/tax” differences are temporary in nature and are primarily due to the tax deferral of losses on wash sales and the tax treatment of income and capital gains on publicly-traded partnerships held by the Funds.
For the period ended May 31, 2014, Barrow All-Cap Long/Short Fund reclassified $22,591 of net investment loss against undistributed net realized gains from security transactions on the Statements of Assets and Liabilities. Such reclassification, the result of permanent differences between financial statement and income tax reporting requirements, had no effect on the Fund’s net assets or net asset value per share.
The Funds recognize tax benefits or expenses of uncertain tax positions only when the position is “more likely than not” to be sustained assuming examination by tax authorities. Management has reviewed tax positions for the current tax year and has concluded that no provision for unrecognized tax benefits or expenses is required in these financial statements.
3. Investment Transactions
During the period ended May 31, 2014, cost of purchases and proceeds from sales of investment securities, other than short-term investments and short positions, amounted to $10,803,490 and $8,803,443, respectively, for Barrow All-Cap Core Fund and $5,370,016 and $3,573,727, respectively, for Barrow All-Cap Long/Short Fund.
4. Transactions with Related Parties
INVESTMENT ADVISORY AGREEMENT
Each Fund’s investments are managed by the Adviser pursuant to the terms of an Investment Advisory Agreement. Barrow All-Cap Core Fund pays the Adviser an investment advisory fee, computed and accrued daily and paid monthly, at the annual rate of 0.99% of its average daily net assets. Barrow All-Cap Long/Short Fund pays the Adviser an investment advisory fee, computed and accrued daily and paid monthly, at the annual rate of 1.50% of its average daily net assets.
65
BARROW FUNDS
NOTES TO FINANCIAL STATEMENTS (Continued)
NOTES TO FINANCIAL STATEMENTS (Continued)
The Adviser has contractually agreed, until October 1, 2016, to reduce its investment advisory fees and to reimburse each Fund’s expenses to the extent necessary to limit annual ordinary operating expenses (excluding brokerage costs, taxes, interest, borrowing costs such as interest and dividend expense on securities sold short, acquired fund fees and expenses, extraordinary expenses such as litigation and merger or reorganization costs and other expenses not incurred in the ordinary course of such Fund’s business, and amounts, if any, payable under a Rule 12b-1 Plan) to 1.15% and 1.40% of average daily net assets of Institutional Class and Investor Class shares, respectively, for Barrow All-Cap Core Fund and to 1.74% and 1.99% of average daily net assets of Institutional Class and Investor Class shares, respectively, for Barrow All-Cap Long/Short Fund. During the period ended May 31, 2014, the Adviser reduced its investment advisory fees and reimbursed other expenses as follows:
| Investment Advisory Fee Reductions | Expenses Reimbursed | Total | ||||||||||
| Barrow All-Cap Core Fund: | ||||||||||||
| Common | $ | 86,552 | $ | — | $ | 86,552 | ||||||
| Institutional Class | — | 17,675 | 17,675 | |||||||||
| Investor Class | — | 13,934 | 13,934 | |||||||||
| $ | 86,552 | $ | 31,609 | $ | 118,161 | |||||||
| Barrow All-Cap Long/Short Fund: | ||||||||||||
| Common | $ | 41,540 | $ | 83,704 | $ | 125,244 | ||||||
| Institutional Class | — | 17,699 | 17,699 | |||||||||
| Investor Class | — | 13,984 | 13,984 | |||||||||
| $ | 41,540 | $ | 115,387 | $ | 156,927 | |||||||
Advisory fee reductions and expense reimbursements by the Adviser are subject to repayment by each Fund for a period of three years after such fees and expenses were incurred, provided that the repayments do not cause each Fund’s ordinary operating expenses, at the time the repayment occurs, to exceed the expense limitations stated above. As of May 31, 2014, the Adviser may in the future recover advisory fee reductions and expense reimbursements totaling $118,161 and $156,927 from Barrow All-Cap Core Fund and Barrow All-Cap Long/Short Fund, respectively. The Adviser may recover these amounts no later than May 31, 2017.
Certain officers of the Funds are also officers of the Adviser.
OTHER SERVICE PROVIDERS
Ultimus Fund Solutions, LLC (“Ultimus”) provides fund administration, fund accounting, compliance and transfer agency services to the Funds. Pursuant to servicing agreements with Ultimus, each Fund pays Ultimus fees in accordance with the agreements for its services. In addition, each Fund pays out-of-pocket expenses including, but not limited to, postage, supplies and costs of pricing portfolio securities.
66
BARROW FUNDS
NOTES TO FINANCIAL STATEMENTS (Continued)
NOTES TO FINANCIAL STATEMENTS (Continued)
DISTRIBUTION AGREEMENT
Under the terms of a Distribution Agreement with the Trust, Ultimus Fund Distributors, LLC (the “Distributor”) serves as principal underwriter to each Fund. The Distributor is a wholly-owned subsidiary of Ultimus.
Certain Trustees and officers of the Trust are also officers of Ultimus and the Distributor.
DISTRIBUTION PLAN
Each Fund has adopted a distribution plan pursuant to Rule 12b-1 under the 1940 Act (the “Plan”), pursuant to which each Fund may pay intermediaries and other persons for rendering distribution services and for bearing any related expenses with respect to the Investor Class of each Fund, which fees will not exceed the annual rate of 0.25% of the Fund’s average daily net assets allocable to Investor Class shares. During the period ended May 31, 2014, the Investor Class of Barrow All-Cap Core Fund and Barrow All-Cap Long/Short Fund incurred $246 and $271, respectively, of distribution fees under the Plan.
TRUSTEE COMPENSATION
Each Trustee who is not an interested person of the Trust receives from each Fund a fee of $500 for each Board meeting attended plus reimbursement of travel and other expenses incurred in attending the meetings. Trustees affiliated with the Adviser or Ultimus are not compensated by the Trust for their services.
PRINCIPAL HOLDERS OF FUND SHARES
As of May 31, 2014, Robert F. Greenhill, Jr., a principal of the Adviser, owned 19% and 27% of the outstanding shares of the Institutional Class and Investor Class shares, respectively, of Barrow All-Cap Core Fund and 55% and 53% of the outstanding shares of the Institutional Class and Investor Class shares, respectively, of Barrow All-Cap Long/Short Fund.
5. Borrowing Costs
Barrow All-Cap Core Fund has a secured a bank line of credit with BNP Paribas that provides a maximum borrowing of up to one-third of Barrow Street All-Cap Core Fund’s net assets. The line of credit may be used to maintain necessary liquidity to make payments for redemptions of Fund shares or for temporary emergency purposes. Borrowings under this arrangement bear interest at a rate per annum equal to the one-month LIBOR at the time of borrowing plus 0.85%. During the period ended May 31, 2014, Barrow All-Cap Core Fund incurred $121 of borrowing costs. Barrow All-Cap Long/Short Fund incurred no borrowing costs during the period ended May 31, 2014. As of May 31, 2014, Barrow All-Cap Core Fund had outstanding borrowings of $7. The average outstanding borrowings and average interest rate on such borrowings by Barrow All-Cap Core Fund during the period ended May 31, 2014 were $15,333 and 1.05%, respectively.
67
BARROW FUNDS
NOTES TO FINANCIAL STATEMENTS (Continued)
NOTES TO FINANCIAL STATEMENTS (Continued)
6. Contingencies and Commitments
The Funds indemnify the Trust’s officers and Trustees for certain liabilities that might arise from their performance of their duties to the Funds. Additionally, in the normal course of business the Funds enter into contracts that contain a variety of representations and warranties and which provide general indemnifications. The Funds’ maximum exposure under these arrangements is unknown, as this would involve future claims that may be made against the Funds that have not yet occurred. However, based on experience, the Funds expect the risk of loss to be remote.
7. Sector Risk
If a Fund has significant investments in the securities of issuers in industries within a particular sector, any development affecting that sector will have a greater impact on the value of the net assets of the Fund than would be the case if the Fund did not have significant investments in that sector. In addition, this may increase the risk of loss on an investment in the Fund and increase the volatility of the Fund’s net asset value per share. From time to time, a particular set of circumstances may affect this sector or other companies within the sector. For instance, economic or market factors, regulation or deregulation, or other developments may negatively impact all companies in a particular sector and therefore the value of a Fund’s portfolio will be adversely affected. As of May 31, 2014, Barrow All-Cap Long/Short Fund had the following investments within the following sectors, expressed as a percentage of net assets:
Long Positions | Short Positions | |
| Consumer Discretionary | 25.9% | (19.2%) |
| Health Care | 27.3% | (18.5%) |
| Industrials | 26.7% | (18.1%) |
8. Subsequent Events
The Funds are required to recognize in the financial statements the effects of all subsequent events that provide additional evidence about conditions that existed as of the date of the Statements of Assets and Liabilities. For non-recognized subsequent events that must be disclosed to keep the financial statements from being misleading, the Funds are required to disclose the nature of the event as well as an estimate of its financial effect, or a statement that such an estimate cannot be made. Management has evaluated subsequent events through the issuance of these financial statements and has noted no such events.
68
BARROW FUNDS
REPORT OF INDEPENDENT REGISTERED
PUBLIC ACCOUNTING FIRM
REPORT OF INDEPENDENT REGISTERED
PUBLIC ACCOUNTING FIRM
To the Board of Trustees of Ultimus Managers Trust and the
Shareholders of Barrow All-Cap Core Fund and Barrow All-Cap Long/Short Fund
Shareholders of Barrow All-Cap Core Fund and Barrow All-Cap Long/Short Fund
We have audited the accompanying statements of assets and liabilities of the Barrow All-Cap Core Fund and Barrow All-Cap Long/Short Fund (the "Funds"), each a series of shares of beneficial interest in the Ultimus Managers Trust, including the schedules of investments, as of May 31, 2014, and the related statements of operations and changes in net assets and the financial highlights for the period August 30, 2013 (commencement of operations) through May 31, 2014. These financial statements and financial highlights are the responsibility of the Funds' management. Our responsibility is to express an opinion on these financial statements and financial highlights based on our audits.
We conducted our audits in accordance with the standards of the Public Company Accounting Oversight Board (United States). Those standards require that we plan and perform the audits to obtain reasonable assurance about whether the financial statements and financial highlights are free of material misstatement. An audit includes examining, on a test basis, evidence supporting the amounts and disclosures in the financial statements. Our procedures included confirmation of securities owned as of May 31, 2014 by correspondence with the custodian and brokers. An audit also includes assessing the accounting principles used and significant estimates made by management, as well as evaluating the overall financial statement presentation. We believe that our audits provide a reasonable basis for our opinion.
In our opinion, the financial statements and financial highlights referred to above present fairly, in all material respects, the financial position of the Barrow All-Cap Core Fund and Barrow All-Cap Long/Short Fund as of May 31, 2014, and the results of their operations, the changes in their net assets and their financial highlights for the period August 30, 2013 through May 31, 2014, in conformity with accounting principles generally accepted in the United States of America.
| |
| BBD, LLP |
Philadelphia, Pennsylvania
July 25, 2014
July 25, 2014
69
BARROW FUNDS
ABOUT YOUR FUNDS’ EXPENSES (Unaudited)
ABOUT YOUR FUNDS’ EXPENSES (Unaudited)
We believe it is important for you to understand the impact of costs on your investment. As a shareholder of the Funds, you incur ongoing costs, including management fees, class specific fees (such as distribution (12b-1) fees) and other operating expenses. The following examples are intended to help you understand your ongoing costs (in dollars) of investing in the Funds and to compare these costs with the ongoing costs of investing in other mutual funds.
A mutual fund’s ongoing costs are expressed as a percentage of its average net assets. This figure is known as the expense ratio. The expenses in the table below are based on an investment of $1,000 made at the beginning of the most recent period (December 1, 2013) and held until the end of the period (May 31, 2014).
The table below illustrates each Fund’s ongoing costs in two ways:
Actual fund return – This section helps you to estimate the actual expenses that you paid over the period. The “Ending Account Value” shown is derived from each Fund’s actual return, and the third column shows the dollar amount of operating expenses that would have been paid by an investor who started with $1,000 in the Funds. You may use the information here, together with the amount you invested, to estimate the expenses that you paid over the period.
To do so, simply divide your account value by $1,000 (for example, an $8,600 account value divided by $1,000 = 8.6), then multiply the result by the number given for the Funds under the heading “Expenses Paid During Period.”
Hypothetical 5% return – This section is intended to help you compare the Funds’ ongoing costs with those of other mutual funds. It assumes that each Fund had an annual return of 5% before expenses during the period shown, but that the expense ratio is unchanged. In this case, because the return used is not the Funds’ actual return, the results do not apply to your investment. The example is useful in making comparisons because the Securities and Exchange Commission (the “SEC”) requires all mutual funds to calculate expenses based on a 5% return. You can assess each Fund’s ongoing costs by comparing this hypothetical example with the hypothetical examples that appear in shareholder reports of other funds.
Note that expenses shown in the table are meant to highlight and help you compare ongoing costs only. The Funds do not charge transaction fees, such as purchase or redemption fees, nor do they carry a “sales load.”
The calculations assume no shares were bought or sold during the period. Your actual costs may have been higher or lower, depending on the amount of your investment and the timing of any purchases or redemptions.
70
BARROW FUNDS
ABOUT YOUR FUNDS’ EXPENSES (Unaudited) (Continued)
ABOUT YOUR FUNDS’ EXPENSES (Unaudited) (Continued)
More information about the Funds’ expenses can be found in this report. For additional information on operating expenses and other shareholder costs, please refer to the Funds’ prospectus.
| Barrow All-Cap Core Fund - Institutional Class | |||
Beginning Account Value December 1, 2013 | Ending Account Value May 31, 2014 | Expenses Paid During Period* | |
| Based on Actual Fund Return | $1,000.00 | $1,028.80 | $5.82 |
| Based on Hypothetical 5% Return (before expenses) | $1,000.00 | $1,019.20 | $5.79 |
| * | Expenses are equal to the Fund’s annualized expense ratio of 1.15% for the period, multiplied by the average account value over the period, multiplied by 182/365 (to reflect the one-half year period). |
| Barrow All-Cap Core Fund - Investor Class | |||
Beginning Account Value December 1, 2013 | Ending Account Value May 31, 2014 | Expenses Paid During Period* | |
| Based on Actual Fund Return | $1,000.00 | $1,027.60 | $7.08 |
| Based on Hypothetical 5% Return (before expenses) | $1,000.00 | $1,017.95 | $7.04 |
| * | Expenses are equal to the Fund’s annualized expense ratio of 1.40% for the period, multiplied by the average account value over the period, multiplied by 182/365 (to reflect the one-half year period). |
| Barrow All-Cap Long/Short Fund - Institutional Class | |||
Beginning Account Value December 1, 2013 | Ending Account Value May 31, 2014 | Expenses Paid During Period* | |
| Based on Actual Fund Return | $1,000.00 | $997.10 | $19.27 |
| Based on Hypothetical 5% Return (before expenses) | $1,000.00 | $1,005.63 | $19.35 |
| * | Expenses are equal to the Fund’s annualized expense ratio of 3.87% for the period, multiplied by the average account value over the period, multiplied by 182/365 (to reflect the one-half year period). |
71
BARROW FUNDS
ABOUT YOUR FUNDS’ EXPENSES (Unaudited) (Continued)
ABOUT YOUR FUNDS’ EXPENSES (Unaudited) (Continued)
| Barrow All-Cap Long/Short Fund - Investor Class | |||
Beginning Account Value December 1, 2013 | Ending Account Value May 31, 2014 | Expenses Paid During Period* | |
| Based on Actual Fund Return | $1,000.00 | $996.20 | $20.50 |
| Based on Hypothetical 5% Return (before expenses) | $1,000.00 | $1,004.39 | $20.59 |
| * | Expenses are equal to the Fund’s annualized expense ratio of 4.12% for the period, multiplied by the average account value over the period, multiplied by 182/365 (to reflect the one-half year period). |
OTHER INFORMATION (Unaudited)
A description of the policies and procedures that the Funds use to vote proxies relating to portfolio securities is available without charge upon request by calling toll-free 1-877-767-6633, or on the SEC’s website at http://www.sec.gov. Information regarding how the Funds voted proxies relating to portfolio securities during the most recent period ended June 30 will be available without charge upon request no later than August 31, 2014 by calling toll-free 1-877-767-6633, or on the SEC’s website at http://www.sec.gov.
The Trust files a complete listing of portfolio holdings for each of the Funds with the SEC as of the end of the first and third quarters of each fiscal year on Form N-Q. These filings are available upon request by calling 1-877-767-6633. Furthermore, you may obtain a copy of the filings on the SEC’s website at http://www.sec.gov. The Trust’s Forms N-Q may also be reviewed and copied at the SEC’s Public Reference Room in Washington, DC, and information on the operation of the Public Reference Room may be obtained by calling 1-800-SEC-0330.
72
BARROW FUNDS
FEDERAL TAX INFORMATION (Unaudited)
FEDERAL TAX INFORMATION (Unaudited)
In accordance with federal tax requirements, the following provides shareholders with information concerning distributions from ordinary income and net realized gains made by Barrow All-Cap Core Fund during the fiscal year ended May 31, 2014. Certain dividends paid by Barrow All-Cap Core Fund may be subject to a maximum tax rate of 23.8%, as provided by the Jobs and Growth Tax Relief Reconciliation Act of 2003. The Fund intends to designate up to a maximum amount of $119,526 as taxed at a maximum rate of 23.8%. Additionally, the Fund intends to designate up to a maximum amount of $216,705 as a long-term gain distribution.
As required by federal regulations, complete information was computed and reported in conjunction with your 2013 Form 1099-DIV.
73
BARROW FUNDS
BOARD OF TRUSTEES AND EXECUTIVE OFFICERS
(Unaudited)
BOARD OF TRUSTEES AND EXECUTIVE OFFICERS
(Unaudited)
The Board of Trustees has overall responsibility for management of the Trust’s affairs. The Trustees serve during the lifetime of the Trust and until its termination, or until death, resignation, retirement, or removal. The Trustees, in turn, elect the officers of the Fund to actively supervise its day-to-day operations. The officers have been elected for an annual term. Unless otherwise noted, each Trustee’s and officer’s address is 225 Pictoria Drive, Suite 450, Cincinnati, OH 45246. The following are the Trustees and executive officers of the Fund:
Name and Year of Birth | Length of Time Served | Position(s) Held with Trust | Principal Occupation(s) During Past 5 Years | Number of Funds in Trust Overseen by Trustee | Directorships of Public Companies Held by Trustee During Past 5 Years |
| Interested Trustees: | |||||
Robert G. Dorsey* Year of Birth: 1957 | Since February 2012 July 2012 to October 2013 | Trustee President | Managing Director of Ultimus Fund Solutions, LLC and Ultimus Fund Distributors, LLC (1999 to present) | 7 | None |
| Independent Trustees: | |||||
John C. Davis Year of Birth: 1952 | Since July 2014 Since June 2012 | Chairman Trustee | Consultant (government services) since May 2011; Retired Partner of PricewaterhouseCoopers LLP (1974-2010) | 7 | None |
John J. Discepoli Year of Birth: 1963 | Since June 2012 | Trustee | Owner of Discepoli Financial Planning, LLC (personal financial planning company) since November 2004 | 7 | None |
David M. Deptula Year of Birth: 1958 | Since June 2012 | Trustee | Vice President of Tax at The Standard Register Company since November 2011; Tax Partner at Deloitte Tax LLP from 1984 to 2011 | 7 | None |
| * | Mr. Dorsey is considered an “interested person” of the Trust within the meaning of Section 2(a)(19) of the 1940 Act because of his relationship with the Trust’s administrator, transfer agent and distributor. |
74
BARROW FUNDS
BOARD OF TRUSTEES AND EXECUTIVE OFFICERS
(Unaudited) (Continued)
BOARD OF TRUSTEES AND EXECUTIVE OFFICERS
(Unaudited) (Continued)
Name and Year of Birth | Length of Time Served | Position(s) Held with Trust | Principal Occupation(s) During Past 5 Years |
| Executive Officers: | |||
David R. Carson Year of Birth: 1958 | Since October 2013 April 2013 to October 2013 | President Vice President | Vice President and Director of Client Strategies of Ultimus Fund Solutions, LLC (2013 to present); Chief Compliance Officer, The Huntington Funds (2005 to 2013), The Flex-Funds (2006 to 2011), Meeder Financial (2007 to 2011), Huntington Strategy Shares (2012 to 2013), and Huntington Asset Advisors (2013); Vice President, Huntington National Bank (2001 to 2013) |
Nicholas Chermayeff 300 First Stamford Place 3rd Floor East Stamford, CT 06902 Year of Birth: 1969 | Since April 2013 | Principal Executive Officer of Barrow All-Cap Core Fund and Barrow All-Cap Long/Short Fund | Co-Chief Executive Officer and Principal of Barrow Street Capital LLC (since 1997) |
Mark J. Seger Year of Birth: 1962 | Since February 2014 | Treasurer | Managing Director of Ultimus Fund Solutions, LLC and Ultimus Fund Distributors, LLC (1999 to present) |
Frank L. Newbauer Year of Birth: 1954 | Since February 2012 | Secretary | Assistant Vice President of Ultimus Fund Solutions, LLC and Ultimus Fund Distributors, LLC (2010 to present); Assistant Vice President of JPMorgan Chase Bank, N.A. (1999 to 2010) |
Stephen L. Preston Year of Birth: 1966 | Since June 2012 | Chief Compliance Officer | Assistant Vice President and Chief Compliance Officer of Ultimus Fund Distributors, LLC and Assistant Vice President of Ultimus Fund Solutions, LLC since 2011; Senior Consultant at Mainstay Capital Markets Consultants (2010 to 2011); Chief Compliance Officer at INTL Trading, Inc. (2008 to 2010) |
Additional information about members of the Board and executive officers is available in the Funds’ Statement of Additional Information (“SAI”). To obtain a free copy of the SAI, please call 1-877-767-6633.
75
This page intentionally left blank.
This page intentionally left blank.

CINCINNATI ASSET MANAGEMENT FUNDS:
BROAD MARKET STRATEGIC INCOME FUND
Annual Report
May 31, 2014
CINCINNATI ASSET MANAGEMENT FUNDS: BROAD MARKET STRATEGIC INCOME FUND LETTER TO SHAREHOLDERS | July 3, 2014 |
Dear Fellow Shareholders,
The Annual report for the Cincinnati Asset Management Funds: Broad Market Strategic Income Fund presents data and performance for the fiscal year ended May 31, 2014. All of us at Cincinnati Asset Management want to thank you for your investment with us. We appreciate your confidence in our investment management.
The Fund is currently invested primarily in investment grade corporate bonds (approximately 60%) and high yield corporate bonds (approximately 40%) that we consider undervalued. The weighted average credit rating is investment grade. We believe that our proprietary analysis enhances our ability to identify opportunities and enables us to sell securities when more attractive opportunities present themselves. These investment decisions are made with the important discipline of maintaining portfolio diversification and with the dual objectives of achieving a high level of income while preserving capital.
Our disciplined investing strategy resulted in the Fund holding 79 positions in the bonds of more than 60 different corporations at May 31. At that time, cash balances amounted to approximately 2% of the Fund’s assets, and the Fund continues to be fully invested, as is its objective. The weighted average maturity of the Fund’s investments was 7.3 years at May 31, which is 3 years shorter than the average maturity of the Fund’s benchmark (Barclays U.S. Corporate BAA Index); longer maturity bonds outperformed shorter maturity bonds during the fiscal year, and, consequently, the Fund underperformed its benchmark (4.68% versus 5.49%). The Fund infrequently purchases securities with a maturity beyond 10 years, so we expect that the Fund’s performance relative to the benchmark will most often be impacted by the performance (better or worse) than that of the longer maturity bonds in the benchmark index.
During the past several months, interest rates have been volatile while declining; the yield on the 10-year Treasury Bond was 2.74% at November 30, rose to 3.03% at December 31 and settled back to 2.48% at May 31. (As of the date of this Letter, that rate is over 2.60%) Bond prices decline as rates increase, and the price of your Fund shares will reflect those changes in interest rates. Bonds that the Fund owns were yielding, on average, around 2.0% more than Treasury yields at May 31. Your managers believe that the Fund’s current positionings should provide excellent value relative to other investment-grade rated fixed income alternatives.
During the first calendar quarter of 2014, annualized GDP growth was -2.9%. Many economists believe that the second quarter will rebound, considering that some of the first quarter’s decline was attributable to the extraordinarily severe winter weather. However, many economists believe that the US economy will continue to face headwinds that will result in GDP growing at a rate approaching 2% for all of 2014. The Federal Reserve (the “FED”) continues to reinforce its policy of maintaining short-term interest rates close to 0%. On the other hand, the FED announced in December that it would begin to taper its open market purchases of Treasury, Agency and Mortgage securities from the $85 billion per month level; that tapering has continued, and currently stands at $35 billion per month. Interestingly, when
1
the FED first indicated its intent to “taper” back in May of last year, interest rates increased from the 2.11% to close to the 3.0% level; when the FED announced its actual plan to taper, Treasury rates increased by only 0.25%, and rates subsequently declined to the 2.50% level as tapering continues. During this period, rates on corporate debt have been less volatile. Although all rates will be impacted by “headline” news and the so-called “risk-off/risk-on” trades that cause short-term volatility, we intend to focus on the relative value of corporate and high yield bonds and will maintain our focus on the intermediate term maturity of the portfolio. It is the underlying credit quality of the companies we purchase that influences our investment decisions, not short-term interest rate fluctuations. The current FED tapering suggests that they believe the economy is strengthening, and credit quality improves when that is the case. In fact, corporate cash flow has remained strong throughout the period.
We believe that the companies in the Fund’s portfolio are positioned to withstand economic adversity and to participate in any economic expansion. For example, the Fund’s positions in the energy sector acknowledge the fact that fossil fuels will continue to play an important role in a growing economy; the yields at which we purchased and continue to hold these securities have rewarded us for the challenges that this sector may face. Similarly, the Fund’s positions in the financials sector represent investments in those companies that we believe have the financial strength and diversity of business to meet the regulatory constraints with which they are dealing and to benefit from the possibility of a more rapid economic recovery. The Fund’s positions in the equipment trust certificates of several airlines have benefitted from the airlines’ strong performance while we enjoy the benefit of being collateralized by the underlying aircraft.
While the economy continues to face uncertainty in the face of unemployment, government deficits, tax reform, and a host of other issues, we are reminded that there are still opportunities that can reward investors, and we endeavor to identify these opportunities every day.
Thank you again for your confidence in the Fund. Our fellow investors are very important to us and if you have any questions regarding market conditions or the Fund, please don’t hesitate to call us (513.554.8500).
Sincerely,
Cincinnati Asset Management Funds: Broad Market Strategic Income Fund
Managed by Cincinnati Asset Management, Inc.
Managed by Cincinnati Asset Management, Inc.
2
Past performance is not predictive of future performance. Investment results and principal value will fluctuate so that shares, when redeemed, may be worth more or less than their original cost. Current performance may be higher or lower than the performance data quoted. Performance data current to the most recent month end are available by calling 1-866-738-1128.
An investor should consider the investment objectives, risks, charges and expenses of the Fund carefully before investing. The Fund’s prospectus contains this and other important information. To obtain a copy of the Fund’s prospectus please call 1-866-738-1128 and a copy will be sent to you free of charge. Please read the prospectus carefully before you invest. Cincinnati Asset Management Funds: Broad Market Strategic Income Fund is distributed by Ultimus Fund Distributors, LLC.
The Letter to Shareholders seeks to describe some of the adviser’s current opinions and views of the financial markets. Although the adviser believes it has a reasonable basis for any opinions or views expressed, actual results may differ, sometimes significantly so, from those expected or expressed.
3
CINCINNATI ASSET MANAGEMENT FUNDS:
BROAD MARKET STRATEGIC INCOME FUND
PERFORMANCE INFORMATION
May 31, 2014 (Unaudited)
BROAD MARKET STRATEGIC INCOME FUND
PERFORMANCE INFORMATION
May 31, 2014 (Unaudited)
Comparison of the Change in Value of a $10,000 Investment
in Cincinnati Asset Management Funds: Broad Market Strategic
Income Fund versus the Barclays U.S. Corporate BAA Index
in Cincinnati Asset Management Funds: Broad Market Strategic
Income Fund versus the Barclays U.S. Corporate BAA Index
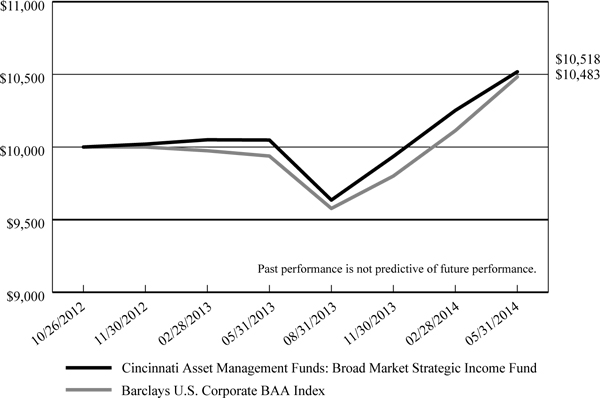
Average Annual Total Returns For the periods ended May 31, 2014 | ||
| 1 Year | Since Inception(b) | |
Cincinnati Asset Management Funds: Broad Market Strategic Income Fund (a) | 4.68% | 3.22% |
| Barclays U.S. Corporate BAA Index | 5.49% | 3.00% |
| (a) | The Fund’s total return does not reflect the deduction of taxes a shareholder would pay on Fund distributions or the redemption of Fund shares. |
| (b) | The Fund commenced operations on October 26, 2012. |
4
CINCINNATI ASSET MANAGEMENT FUNDS:
BROAD MARKET STRATEGIC INCOME FUND
PORTFOLIO INFORMATION
May 31, 2014 (Unaudited)
BROAD MARKET STRATEGIC INCOME FUND
PORTFOLIO INFORMATION
May 31, 2014 (Unaudited)
Sector Diversification
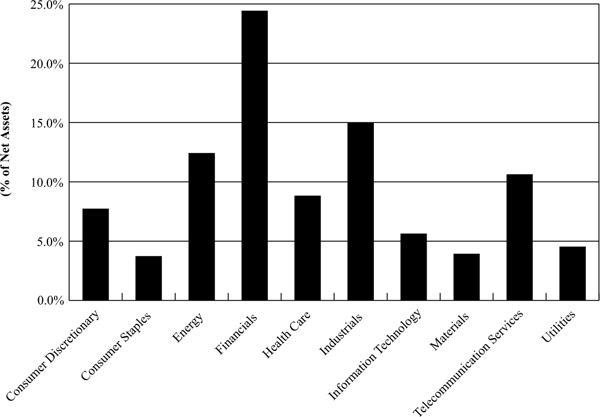
Top 10 Investments
| Security Description | % of Net Assets | |
| Toll Brothers Finance Corp., 5.875%, due 02/15/22 | 3.0% | |
| Wells Fargo & Co., 4.125%, due 08/15/23 | 2.8% | |
| US Airways Class A Pass-Through Certificates, Series 2012-2, 4.625%, due 12/03/26 | 2.8% | |
| Bristol-Myers Squibb Co., 3.250%, due 11/01/23 | 2.8% | |
| U.S. Bancorp, 2.950%, due 07/15/22 | 2.7% | |
| Qwest Corp., 6.750%, due 12/01/21 | 2.7% | |
| JPMorgan Chase & Co., 4.500%, due 01/24/22 | 2.6% | |
| PerkinElmer, Inc., 5.000%, due 11/15/21 | 2.5% | |
| Hewlett-Packard Co., 4.375%, due 09/15/21 | 2.5% | |
| International Lease Finance Corp., 5.875%, due 08/15/22 | 2.5% |
| Credit Rating Allocation | ||
| S&P Credit Rating | % of Portfolio | |
| AA | 6.2% | |
| A | 39.0% | |
| BBB | 12.2% | |
| BB | 29.6% | |
| B | 12.4% | |
| CCC | 0.6% | |
5
CINCINNATI ASSET MANAGEMENT FUNDS: BROAD MARKET STRATEGIC INCOME FUND SCHEDULE OF INVESTMENTS May 31, 2014 | |||||||||||||
| CORPORATE BONDS — 96.6% | Coupon | Maturity | Par Value | Value | |||||||||
| Consumer Discretionary — 7.7% | |||||||||||||
| Avis Budget Car Rental, LLC | 5.500 | % | 04/01/23 | $ | 50,000 | $ | 51,250 | ||||||
| CCO Holdings, LLC | 5.250 | % | 09/30/22 | 43,000 | 43,914 | ||||||||
| Lamar Media Corp. | 5.875 | % | 02/01/22 | 43,000 | 46,332 | ||||||||
| MGM Resorts International | 6.625 | % | 12/15/21 | 45,000 | 50,119 | ||||||||
| Penske Auto Group, Inc. | 5.750 | % | 10/01/22 | 52,000 | 54,665 | ||||||||
| Regal Entertainment Group | 5.750 | % | 03/15/22 | 6,000 | 6,225 | ||||||||
| Regal Entertainment Group | 5.750 | % | 02/01/25 | 45,000 | 45,225 | ||||||||
| Royal Caribbean Cruises Ltd. | 5.250 | % | 11/15/22 | 52,000 | 54,210 | ||||||||
| Walt Disney Co. (The) | 2.350 | % | 12/01/22 | 150,000 | 143,586 | ||||||||
| 495,526 | |||||||||||||
| Consumer Staples — 3.7% | |||||||||||||
| Anheuser-Busch InBev SA/NV | 2.625 | % | 01/17/23 | 100,000 | 96,634 | ||||||||
| B&G Foods, Inc. | 4.625 | % | 06/01/21 | 54,000 | 53,865 | ||||||||
| Wal-Mart Stores, Inc. | 2.550 | % | 04/11/23 | 90,000 | 87,402 | ||||||||
| 237,901 | |||||||||||||
| Energy — 11.5% | |||||||||||||
| Apache Corp. | 3.250 | % | 04/15/22 | 109,000 | 112,704 | ||||||||
| Arch Coal, Inc. | 7.250 | % | 10/01/20 | 46,000 | 33,695 | ||||||||
| Chesapeake Energy Corp. | 6.125 | % | 02/15/21 | 42,000 | 47,408 | ||||||||
| Chevron Corp. | 2.355 | % | 12/05/22 | 150,000 | 144,294 | ||||||||
| ConocoPhillips Co. | 2.400 | % | 12/15/22 | 150,000 | 144,563 | ||||||||
| Denbury Resources, Inc. | 4.625 | % | 07/15/23 | 56,000 | 54,180 | ||||||||
| Offshore Group Investment Ltd. | 7.500 | % | 11/01/19 | 20,000 | 21,100 | ||||||||
| Offshore Group Investment Ltd. | 7.125 | % | 04/01/23 | 27,000 | 27,405 | ||||||||
| Peabody Energy Corp. | 7.875 | % | 11/01/26 | 50,000 | 52,750 | ||||||||
| Range Resources Corp. | 5.000 | % | 08/15/22 | 46,000 | 48,530 | ||||||||
| Sabine Pass Liquefaction, LLC | 5.625 | % | 04/15/23 | 51,000 | 52,530 | ||||||||
| 739,159 | |||||||||||||
| Financials — 23.7% | |||||||||||||
| Bank of America Corp. | 3.300 | % | 01/11/23 | 150,000 | 147,980 | ||||||||
| Ford Motor Credit Co., LLC | 4.250 | % | 09/20/22 | 150,000 | 159,563 | ||||||||
| General Electric Capital Corp. | 3.150 | % | 09/07/22 | 150,000 | 152,046 | ||||||||
| International Lease Finance Corp. | 8.625 | % | 01/15/22 | 35,000 | 43,444 | ||||||||
| International Lease Finance Corp. | 5.875 | % | 08/15/22 | 150,000 | 160,500 | ||||||||
| JPMorgan Chase & Co. | 4.500 | % | 01/24/22 | 150,000 | 164,262 | ||||||||
| PNC Financial Services Group, Inc. | 2.854 | % | 11/09/22 | 150,000 | 147,148 | ||||||||
| Toll Brothers Finance Corp. | 5.875 | % | 02/15/22 | 175,000 | 189,875 | ||||||||
| U.S. Bancorp | 2.950 | % | 07/15/22 | 175,000 | 172,727 | ||||||||
| Wells Fargo & Co. | 4.125 | % | 08/15/23 | 175,000 | 181,545 | ||||||||
| 1,519,090 | |||||||||||||
6
CINCINNATI ASSET MANAGEMENT FUNDS: BROAD MARKET STRATEGIC INCOME FUND SCHEDULE OF INVESTMENTS (Continued) | |||||||||||||
| CORPORATE BONDS — 96.6% (Continued) | Coupon | Maturity | Par Value | Value | |||||||||
| Health Care — 8.8% | |||||||||||||
| Bristol-Myers Squibb Co. | 3.250 | % | 11/01/23 | $ | 175,000 | $ | 176,879 | ||||||
| Community Health Systems, Inc. | 7.125 | % | 07/15/20 | 50,000 | 54,312 | ||||||||
| Davita HealthCare Partners, Inc. | 5.750 | % | 08/15/22 | 50,000 | 53,750 | ||||||||
| HCA Holdings, Inc. | 6.250 | % | 02/15/21 | 40,000 | 42,900 | ||||||||
| HCA Holdings, Inc. | 5.875 | % | 05/01/23 | 17,000 | 17,638 | ||||||||
| HealthSouth Corp. | 5.750 | % | 11/01/24 | 54,000 | 57,240 | ||||||||
| PerkinElmer, Inc. | 5.000 | % | 11/15/21 | 150,000 | 162,402 | ||||||||
| 565,121 | |||||||||||||
| Industrials — 15.9% | |||||||||||||
| B/E Aerospace, Inc. | 5.250 | % | 04/01/22 | 46,000 | 49,105 | ||||||||
| General Dynamics Corp. | 2.250 | % | 11/15/22 | 150,000 | 142,499 | ||||||||
| Iron Mountain, Inc. | 5.750 | % | 08/15/24 | 54,000 | 54,270 | ||||||||
| R.R. Donnelley & Sons Co. | 7.625 | % | 06/15/20 | 4,000 | 4,590 | ||||||||
| R.R. Donnelley & Sons Co. | 7.875 | % | 03/15/21 | 41,000 | 47,253 | ||||||||
| Raytheon Co. | 2.500 | % | 12/15/22 | 150,000 | 144,587 | ||||||||
| Service Corp. International | 7.500 | % | 04/01/27 | 50,000 | 54,500 | ||||||||
| Stanley Black & Decker, Inc. | 2.900 | % | 11/01/22 | 150,000 | 147,658 | ||||||||
| Teekay Corp. | 8.500 | % | 01/15/20 | 47,000 | 54,579 | ||||||||
| United Airlines Class B Pass-Through Certificates, Series 2013-1 | 5.375 | % | 02/15/23 | 43,000 | 44,505 | ||||||||
| United Rentals North America, Inc. | 6.125 | % | 06/15/23 | 45,000 | 48,600 | ||||||||
| US Airways Class A Pass-Through Certificates, Series 2012-2 | 4.625 | % | 12/03/26 | 173,383 | 181,185 | ||||||||
| US Airways Class B Pass-Through Certificates, Series 2012-1 | 8.000 | % | 04/01/21 | 37,065 | 42,254 | ||||||||
| 1,015,585 | |||||||||||||
| Information Technology — 5.6% | |||||||||||||
| Equinix, Inc. | 5.375 | % | 04/01/23 | 52,000 | 53,300 | ||||||||
| Hewlett-Packard Co. | 4.375 | % | 09/15/21 | 150,000 | 161,540 | ||||||||
| Intel Corp. | 2.700 | % | 12/15/22 | 150,000 | 146,610 | ||||||||
| 361,450 | |||||||||||||
| Materials — 3.9% | |||||||||||||
| Ball Corp. | 4.000 | % | 11/15/23 | 6,000 | 5,700 | ||||||||
| Graphic Packaging International, Inc. | 4.750 | % | 04/15/21 | 55,000 | 55,481 | ||||||||
| Praxair, Inc. | 2.200 | % | 08/15/22 | 150,000 | 142,362 | ||||||||
| Vulcan Materials Co. | 7.500 | % | 06/15/21 | 36,000 | 42,750 | ||||||||
| 246,293 | |||||||||||||
7
CINCINNATI ASSET MANAGEMENT FUNDS: BROAD MARKET STRATEGIC INCOME FUND SCHEDULE OF INVESTMENTS (Continued) | |||||||||||||
| CORPORATE BONDS — 96.6% (Continued) | Coupon | Maturity | Par Value | Value | |||||||||
| Telecommunication Services — 11.3% | |||||||||||||
| AT&T, Inc. | 2.625 | % | 12/01/22 | $ | 140,000 | $ | 134,944 | ||||||
| CenturyLink, Inc. | 5.800 | % | 03/15/22 | 5,000 | 5,225 | ||||||||
| Comcast Corp. | 3.600 | % | 03/01/24 | 65,000 | 67,174 | ||||||||
| Embarq Corp. | 7.995 | % | 06/01/36 | 40,000 | 43,823 | ||||||||
| Frontier Communications Corp. | 9.000 | % | 08/15/31 | 50,000 | 53,375 | ||||||||
| Intelsat Jackson Holdings S.A. | 7.500 | % | 04/01/21 | 40,000 | 43,950 | ||||||||
| Mediacom, LLC/Mediacom Capital Corp. | 7.250 | % | 02/15/22 | 43,000 | 46,870 | ||||||||
| Qwest Corp. | 6.750 | % | 12/01/21 | 150,000 | 172,473 | ||||||||
| Sprint Communications Co., L.P. | 6.000 | % | 11/15/22 | 50,000 | 51,875 | ||||||||
| Verizon Communications, Inc. | 5.150 | % | 09/15/23 | 50,000 | 56,393 | ||||||||
| Zayo Group, LLC | 8.125 | % | 01/01/20 | 40,000 | 43,850 | ||||||||
| 719,952 | |||||||||||||
| Utilities — 4.5% | |||||||||||||
| AES Corp. (The) | 7.375 | % | 07/01/21 | 45,000 | 51,975 | ||||||||
| AES Corp. (The) | 5.500 | % | 03/15/24 | 2,000 | 2,060 | ||||||||
| Amerigas Finance, LLC | 7.000 | % | 05/20/22 | 43,000 | 47,730 | ||||||||
| Ferrellgas, L.P. | 6.500 | % | 05/01/21 | 50,000 | 52,500 | ||||||||
| GenOn Americas Generation, LLC | 8.500 | % | 10/01/21 | 28,000 | 29,050 | ||||||||
| NRG Energy, Inc. | 7.875 | % | 05/15/21 | 37,000 | 41,347 | ||||||||
| NRG Energy, Inc. | 6.625 | % | 03/15/23 | 8,000 | 8,580 | ||||||||
| Suburban Propane Partners, L.P. | 5.500 | % | 06/01/24 | 55,000 | 55,825 | ||||||||
| 289,067 | |||||||||||||
Total Investments at Value — 96.6% (Cost $6,166,153) | $ | 6,189,144 | |||||||||||
| Other Assets in Excess of Liabilities — 3.4% | 218,268 | ||||||||||||
| Net Assets — 100.0% | $ | 6,407,412 | |||||||||||
See accompanying notes to financial statements.
8
CINCINNATI ASSET MANAGEMENT FUNDS: BROAD MARKET STRATEGIC INCOME FUND STATEMENT OF ASSETS AND LIABILITIES May 31, 2014 | ||||
ASSETS | ||||
| Investments in securities: | ||||
| At acquisition cost | $ | 6,166,153 | ||
| At value (Note 2) | $ | 6,189,144 | ||
| Cash | 168,049 | |||
| Interest receivable | 75,660 | |||
| Receivable from Adviser (Note 4) | 15,011 | |||
| Other assets | 13,325 | |||
| Total assets | 6,461,189 | |||
| LIABILITIES | ||||
| Payable to administrator (Note 4) | 6,550 | |||
| Payable for investment securities purchased | 40,032 | |||
| Other accrued expenses | 7,195 | |||
| Total liabilities | 53,777 | |||
| NET ASSETS | $ | 6,407,412 | ||
| NET ASSETS CONSIST OF: | ||||
| Paid-in capital | $ | 6,356,856 | ||
| Undistributed net investment income | 31,733 | |||
| Accumulated net realized losses from security transactions | (4,168 | ) | ||
| Net unrealized appreciation on investments | 22,991 | |||
| NET ASSETS | $ | 6,407,412 | ||
| Shares of beneficial interest outstanding (unlimited number of shares authorized, no par value) | 637,403 | |||
| Net asset value, offering price and redemption price per share (Note 2) | $ | 10.05 | ||
See accompanying notes to financial statements.
9
CINCINNATI ASSET MANAGEMENT FUNDS: BROAD MARKET STRATEGIC INCOME FUND STATEMENT OF OPERATIONS For the Year Ended May 31, 2014 | ||||
INVESTMENT INCOME | ||||
| Interest | $ | 212,992 | ||
| EXPENSES | ||||
| Investment advisory fees (Note 4) | 39,354 | |||
| Professional fees | 33,158 | |||
| Registration and filing fees | 28,917 | |||
| Fund accounting fees (Note 4) | 26,267 | |||
| Administration fees (Note 4) | 25,750 | |||
| Pricing fees | 16,279 | |||
| Distribution fees (Note 4) | 13,126 | |||
| Compliance fees (Note 4) | 12,000 | |||
| Transfer agent fees (Note 4) | 12,000 | |||
| Trustees' fees and expenses (Note 4) | 9,041 | |||
| Custody and bank service fees | 8,086 | |||
| Insurance expense | 4,048 | |||
| Postage and supplies | 3,736 | |||
| Other expenses | 6,263 | |||
| Total expenses | 238,025 | |||
| Less fee reductions and expense reimbursements by the Adviser (Note 4) | (203,919 | ) | ||
| Net expenses | 34,106 | |||
| NET INVESTMENT INCOME | 178,886 | |||
| REALIZED AND UNREALIZED GAINS (LOSSES) ON INVESTMENTS | ||||
| Net realized losses from security transactions | (3,453 | ) | ||
| Net change in unrealized appreciation/depreciation on investments | 80,934 | |||
| NET REALIZED AND UNREALIZED GAINS ON INVESTMENTS | 77,481 | |||
| NET INCREASE IN NET ASSETS RESULTING FROM OPERATIONS | $ | 256,367 | ||
See accompanying notes to financial statements.
10
CINCINNATI ASSET MANAGEMENT FUNDS: BROAD MARKET STRATEGIC INCOME FUND STATEMENTS OF CHANGES IN NET ASSETS | ||||||||
Year Ended May 31, 2014 | Period Ended May 31, 2013(a) | |||||||
| FROM OPERATIONS | ||||||||
| Net investment income | $ | 178,886 | $ | 84,972 | ||||
| Net realized losses from security transactions | (3,453 | ) | (715 | ) | ||||
| Net change in unrealized appreciation/depreciation on investments | 80,934 | (57,943 | ) | |||||
| Net increase in net assets resulting from operations | 256,367 | 26,314 | ||||||
| DISTRIBUTIONS TO SHAREHOLDERS | ||||||||
| From net investment income | (175,744 | ) | (56,381 | ) | ||||
| FROM CAPITAL SHARE TRANSACTIONS | ||||||||
| Proceeds from shares sold | 1,179,992 | 5,243,516 | ||||||
| Net asset value of shares issued in reinvestment of distributions to shareholders | 175,744 | 56,381 | ||||||
| Payments for shares redeemed | (248,777 | ) | (50,000 | ) | ||||
| Net increase in net assets from capital share transactions | 1,106,959 | 5,249,897 | ||||||
| TOTAL INCREASE IN NET ASSETS | 1,187,582 | 5,219,830 | ||||||
| NET ASSETS | ||||||||
| Beginning of period | 5,219,830 | — | ||||||
| End of period | $ | 6,407,412 | $ | 5,219,830 | ||||
| UNDISTRIBUTED NET INVESTMENT INCOME | $ | 31,733 | $ | 28,591 | ||||
| CAPITAL SHARE ACTIVITY | ||||||||
| Shares sold | 119,978 | 524,271 | ||||||
| Shares reinvested | 18,333 | 5,633 | ||||||
| Shares redeemed | (25,837 | ) | (4,975 | ) | ||||
| Net increase in shares outstanding | 112,474 | 524,929 | ||||||
| Shares outstanding at beginning of period | 524,929 | — | ||||||
| Shares outstanding at end of period | 637,403 | 524,929 | ||||||
| (a) | Represents the period from the commencement of operations (October 26, 2012) through May 31, 2013. |
See accompanying notes to financial statements.
11
CINCINNATI ASSET MANAGEMENT FUNDS: BROAD MARKET STRATEGIC INCOME FUND FINANCIAL HIGHLIGHTS | ||||||||
Per Share Data for a Share Outstanding Throughout Each Period | ||||||||
Year Ended May 31, 2014 | Period Ended May 31, 2013(a) | |||||||
| Net asset value at beginning of period | $ | 9.94 | $ | 10.00 | ||||
| Income (loss) from investment operations: | ||||||||
| Net investment income | 0.33 | 0.16 | ||||||
| Net realized and unrealized gains (losses) on investments | 0.11 | (0.11 | ) | |||||
| Total from investment operations | 0.44 | 0.05 | ||||||
| Less distributions: | ||||||||
| From net investment income | (0.33 | ) | (0.11 | ) | ||||
| Net asset value at end of period | $ | 10.05 | $ | 9.94 | ||||
Total return (b) | 4.68 | % | 0.48 | %(c) | ||||
| Net assets at end of period | $ | 6,407,412 | $ | 5,219,830 | ||||
| Ratios/supplementary data: | ||||||||
| Ratio of total expenses to average net assets | 4.53 | % | 3.69 | %(d) | ||||
Ratio of net expenses to average net assets (e) | 0.65 | % | 0.65 | %(d) | ||||
Ratio of net investment income to average net assets (e) | 3.41 | % | 2.81 | %(d) | ||||
| Portfolio turnover rate | 11 | % | 13 | %(c) | ||||
| (a) | Represents the period from the commencement of operations (October 26, 2012) through May 31, 2013. |
| (b) | Total return is a measure of the change in value of an investment in the Fund over the periods covered. The returns shown do not reflect the deduction of taxes a shareholder would pay on Fund distributions, if any, or the redemption of Fund shares. The total returns would be lower if the Adviser had not reduced advisory fees and reimbursed expenses. |
| (c) | Not annualized. |
| (d) | Annualized |
| (e) | Ratios were determined after advisory fee reductions and expense reimbursements (Note 4). |
See accompanying notes to financial statements.
12
CINCINNATI ASSET MANAGEMENT FUNDS:
BROAD MARKET STRATEGIC INCOME FUND
NOTES TO FINANCIAL STATEMENTS
May 31, 2014
BROAD MARKET STRATEGIC INCOME FUND
NOTES TO FINANCIAL STATEMENTS
May 31, 2014
1. Organization
Cincinnati Asset Management Funds: Broad Market Strategic Income Fund (the “Fund”) is a diversified series of Ultimus Managers Trust (the “Trust”), an open-end investment company established as an Ohio business trust under a Declaration of Trust dated February 28, 2012. Other series of the Trust are not incorporated in this report. The Fund commenced operations on October 26, 2012.
The investment objective of the Fund is to achieve a high level of income consistent with a secondary goal of preservation of capital.
2. Significant Accounting Policies
The following is a summary of the Fund’s significant accounting policies. The policies are in conformity with accounting principles generally accepted in the United States of America (“GAAP”).
Securities valuation – The Fund’s fixed income securities are generally valued using prices provided by an independent pricing service approved by the Trust’s Board of Trustees (the “Board”). The independent pricing service uses information with respect to transactions in bonds, quotations from bond dealers, market transactions in comparable securities and various relationships between securities in determining these prices. The methods used by the independent pricing service and the quality of valuations so established are reviewed by Cincinnati Asset Management, Inc. (the “Adviser”), under the general supervision of the Board. Securities for which market quotations are not readily available are valued at fair value as determined in good faith under procedures adopted by the Board.
GAAP establishes a single authoritative definition of fair value, sets out a framework for measuring fair value and requires additional disclosures about fair value measurements.
Various inputs are used in determining the value of the Fund’s investments. These inputs are summarized in the three broad levels listed below:
| • | Level 1 – quoted prices in active markets for identical securities |
| • | Level 2 – other significant observable inputs |
| • | Level 3 – significant unobservable inputs |
13
CINCINNATI ASSET MANAGEMENT FUNDS:
BROAD MARKET STRATEGIC INCOME FUND
NOTES TO FINANCIAL STATEMENTS (Continued)
BROAD MARKET STRATEGIC INCOME FUND
NOTES TO FINANCIAL STATEMENTS (Continued)
Corporate bonds are classified as Level 2 since values are based on prices provided by an independent pricing service that utilizes various “other significant observable inputs” including bid and ask quotations, prices of similar securities and interest rates, among other factors. The inputs or methodology used for valuing securities are not necessarily an indication of the risks associated with investing in those securities. The inputs used to measure fair value may fall into different levels of the fair value hierarchy. In such cases, for disclosure purposes, the level in the fair value hierarchy within which the fair value measurement falls in its entirety is determined based on the lowest level input that is significant to the fair value measurement.
The following is a summary of the inputs used to value the Fund’s investments as of May 31, 2014:
| Level 1 | Level 2 | Level 3 | Total | |||||||||||||
| Corporate Bonds | $ | — | $ | 6,189,144 | $ | — | $ | 6,189,144 | ||||||||
Refer to the Fund’s Schedule of Investments for a listing of the securities by sector type. As of May 31, 2014, the Fund did not have any transfers in and out of any Level. In addition, the Fund did not have derivative instruments or any assets or liabilities that were measured at fair value on a recurring basis using significant unobservable inputs (Level 3) as of May 31, 2014. It is the Fund’s policy to recognize transfers into and out of any Level at the end of the reporting period.
Share valuation – The net asset value per share of the Fund is calculated daily by dividing the total value of the Fund’s assets, less liabilities, by the number of shares outstanding. The offering price and redemption price per share of the Fund is equal to the net asset value per share.
Investment income – Interest income is accrued as earned. Discounts and premiums on fixed income securities purchased are accreted or amortized using the effective interest method. Dividend income is recorded on the ex-dividend date.
Security transactions – Security transactions are accounted for on the trade date. Gains and losses on securities sold are determined on a specific identification basis.
Common expenses – Common expenses of the Trust are allocated among the Fund and other series of the Trust based on the relative net assets of each series or the nature of the services performed and the relative applicability to each series.
14
CINCINNATI ASSET MANAGEMENT FUNDS:
BROAD MARKET STRATEGIC INCOME FUND
NOTES TO FINANCIAL STATEMENTS (Continued)
BROAD MARKET STRATEGIC INCOME FUND
NOTES TO FINANCIAL STATEMENTS (Continued)
Distributions to shareholders – Dividends from net investment income are declared and paid quarterly to shareholders. Net realized capital gains, if any, are distributed at least once each year. The amount of distributions from net investment income and net realized gains are determined in accordance with federal income tax regulations, which may differ from GAAP. Dividends and distributions to shareholders are recorded on the ex-dividend date. The tax character of distributions paid during the periods ended May 31, 2014 and May 31, 2013 was ordinary income. On June 30, 2014, the Fund paid an ordinary income dividend of $0.0774 per share to shareholders of record on June 27, 2014.
Estimates – The preparation of financial statements in conformity with GAAP requires management to make estimates and assumptions that affect the reported amounts of assets and liabilities and disclosure of contingent assets and liabilities as of the date of the financial statements and the reported amounts of income and expenses during the reporting period. Actual results could differ from those estimates.
Federal income tax – The Fund has qualified and intends to continue to qualify as a regulated investment company under the Internal Revenue Code of 1986 (the “Code”). Qualification generally will relieve the Fund of liability for federal income taxes to the extent 100% of its net investment income and net realized gains are distributed in accordance with the Code. Accordingly, no provision for income tax has been made.
In order to avoid imposition of the excise tax applicable to regulated investment companies, it is also the Fund’s intention to declare as dividends in each calendar year at least 98% of its net investment income (earned during the calendar year) and 98.2% of its net realized capital gains (earned during the twelve months ended October 31) plus undistributed amounts from prior years.
The following information is computed on a tax basis for each item as of May 31, 2014:
| Tax cost of portfolio investments | $ | 6,166,153 | ||
| Gross unrealized appreciation | $ | 105,487 | ||
| Gross unrealized depreciation | (82,496 | ) | ||
| Net unrealized appreciation on investments | 22,991 | |||
| Undistributed ordinary income | 31,733 | |||
| Capital loss carryforwards | (4,168 | ) | ||
| Accumulated earnings | $ | 50,556 |
As of May 31, 2014, the Fund had short-term and long-term capital loss carryforwards of $1,524 and $2,644, respectively. These capital loss carryforwards, which do not expire, may be utilized in future years to offset net realized capital gains, if any, prior to distributing such gains to shareholders.
15
CINCINNATI ASSET MANAGEMENT FUNDS:
BROAD MARKET STRATEGIC INCOME FUND
NOTES TO FINANCIAL STATEMENTS (Continued)
BROAD MARKET STRATEGIC INCOME FUND
NOTES TO FINANCIAL STATEMENTS (Continued)
The Fund recognizes the tax benefits or expenses of uncertain tax positions only when the position is “more likely than not” to be sustained assuming examination by tax authorities. Management has reviewed the Fund’s tax positions for all open tax periods (periods ended May 31, 2013 and May 31, 2014) and has concluded that no provision for unrecognized tax benefits or expenses is required in these financial statements.
3. Investment Transactions
During the year ended May 31, 2014, cost of purchases and proceeds from sales of investment securities, other than short-term investments, were $1,718,044 and $556,530, respectively.
4. Transactions with Related Parties
INVESTMENT ADVISORY AGREEMENT
The Fund’s investments are managed by the Adviser pursuant to the terms of an Investment Advisory Agreement. Under the Investment Advisory Agreement, the Fund pays the Adviser an advisory fee, computed and accrued daily and paid monthly, at the annual rate of 0.75% of its average daily net assets.
The Adviser has contractually agreed, until October 1, 2017, to reduce its advisory fees and to reimburse the Fund’s operating expenses to the extent necessary so that the Fund’s annual ordinary operating expenses (excluding brokerage costs, taxes, interest, costs to organize the Fund, acquired fund fees and expenses, extraordinary expenses and other expenses not incurred in the ordinary course of the Fund’s business) do not exceed an amount equal to 0.65% of its average daily net assets. During the year ended May 31, 2014, the Adviser did not collect any of its advisory fees and, in addition, reimbursed other operating expenses totaling $164,565.
Certain officers of the Fund are also officers of the Adviser.
DISTRIBUTION PLAN
The Fund has adopted a distribution plan pursuant to Rule 12b-1 under the Investment Company Act of 1940 (the “Rule 12b-1 Plan”), pursuant to which the Fund may incur certain costs for distribution and/or shareholder servicing expenses not to exceed 0.25% per annum of the Fund’s average daily net assets. During the year ended May 31, 2014, the Fund incurred $13,126 in distribution and service fees under the Rule 12b-1 Plan.
OTHER SERVICE PROVIDERS
Ultimus Fund Solutions, LLC (“Ultimus”) provides fund administration, fund accounting, compliance and transfer agency services to the Fund. Pursuant to servicing agreements with Ultimus, the Fund pays Ultimus fees in accordance with the agreements for its services. In addition, the Fund pays out-of-pocket expenses including, but not limited to postage, supplies and costs of pricing the Fund’s portfolio securities.
16
CINCINNATI ASSET MANAGEMENT FUNDS:
BROAD MARKET STRATEGIC INCOME FUND
NOTES TO FINANCIAL STATEMENTS (Continued)
BROAD MARKET STRATEGIC INCOME FUND
NOTES TO FINANCIAL STATEMENTS (Continued)
DISTRIBUTION AGREEMENT
Under the terms of a Distribution Agreement with the Trust, Ultimus Fund Distributors, LLC (the “Distributor”) serves as principal underwriter to the Fund. The Distributor is a wholly-owned subsidiary of Ultimus.
Certain Trustees and officers of the Trust are also officers of Ultimus and the Distributor.
TRUSTEE COMPENSATION
Each Trustee who is not an interested person of the Trust receives from the Fund a fee of $500 for each Board meeting attended plus reimbursement of travel and other expenses incurred in attending the meetings. Trustees affiliated with the Adviser or Ultimus are not compensated by the Trust for their services.
PRINCIPAL HOLDER OF FUND SHARES
As of May 31, 2014, Mary S. Sloneker owned 50% of the outstanding shares of the Fund.
5. Contingencies and Commitments
The Fund indemnifies the Trust’s officers and Trustees for certain liabilities that might arise from their performance of their duties to the Fund. Additionally, in the normal course of business the Fund enters into contracts that contain a variety of representations and warranties and which provide general indemnifications. The Fund’s maximum exposure under these arrangements is unknown, as this would involve future claims that may be made against the Fund that have not yet occurred. However, based on experience, the Fund expects the risk of loss to be remote.
6. Subsequent Events
The Fund is required to recognize in the financial statements the effects of all subsequent events that provide additional evidence about conditions that existed as of the date of the Statement of Assets and Liabilities. For non-recognized subsequent events that must be disclosed to keep the financial statements from being misleading, the Fund is required to disclose the nature of the event as well as an estimate of its financial effect, or a statement that such an estimate cannot be made. Management has evaluated subsequent events through the issuance of these financial statements and has noted no such events.
17
CINCINNATI ASSET MANAGEMENT FUNDS:
BROAD MARKET STRATEGIC INCOME FUND
REPORT OF INDEPENDENT REGISTERED
PUBLIC ACCOUNTING FIRM
BROAD MARKET STRATEGIC INCOME FUND
REPORT OF INDEPENDENT REGISTERED
PUBLIC ACCOUNTING FIRM
To the Board of Trustees of Ultimus Managers Trust
and the Shareholders of Cincinnati Asset Management Funds:
Broad Market Strategic Income Fund
and the Shareholders of Cincinnati Asset Management Funds:
Broad Market Strategic Income Fund
We have audited the accompanying statement of assets and liabilities of the Cincinnati Asset Management Funds: Broad Market Strategic Income Fund (the “Fund”), a series of shares of beneficial interest in the Ultimus Managers Trust, including the schedule of investments, as of May 31, 2014, and the related statement of operations for the year then ended, and the statements of changes in net assets and the financial highlights for the year then ended and for the period October 26, 2012 (commencement of operations) through May 31, 2013. These financial statements and financial highlights are the responsibility of the Fund’s management. Our responsibility is to express an opinion on these financial statements and financial highlights based on our audits.
We conducted our audits in accordance with the standards of the Public Company Accounting Oversight Board (United States). Those standards require that we plan and perform the audits to obtain reasonable assurance about whether the financial statements and financial highlights are free of material misstatement. An audit includes examining, on a test basis, evidence supporting the amounts and disclosures in the financial statements. Our procedures included confirmation of securities owned as of May 31, 2014 by correspondence with the custodian and brokers. An audit also includes assessing the accounting principles used and significant estimates made by management, as well as evaluating the overall financial statement presentation. We believe that our audits provide a reasonable basis for our opinion.
In our opinion, the financial statements and financial highlights referred to above present fairly, in all material respects, the financial position of the Cincinnati Asset Management Funds: Broad Market Strategic Income Fund as of May 31, 2014, and the results of its operations for the year then ended, and the changes in its net assets and its financial highlights for the year then ended and for the period October 26, 2012 through May 31, 2013, in conformity with accounting principles generally accepted in the United States of America.
| |
| BBD, LLP |
Philadelphia, Pennsylvania
July 24, 2014
July 24, 2014
18
CINCINNATI ASSET MANAGEMENT FUNDS:
BROAD MARKET STRATEGIC INCOME FUND
ABOUT YOUR FUND’S EXPENSES (Unaudited)
BROAD MARKET STRATEGIC INCOME FUND
ABOUT YOUR FUND’S EXPENSES (Unaudited)
We believe it is important for you to understand the impact of costs on your investment. As a shareholder of the Fund, you incur ongoing costs, including management fees, distribution (12b-1) fees and other operating expenses. The following examples are intended to help you understand your ongoing costs (in dollars) of investing in the Fund and to compare these costs with the ongoing costs of investing in other mutual funds.
A mutual fund’s ongoing costs are expressed as a percentage of its average net assets. This figure is known as the expense ratio. The expenses in the table below are based on an investment of $1,000 made at the beginning of the most recent period (December 1, 2013) and held until the end of the period (May 31, 2014).
The table below illustrates the Fund’s ongoing costs in two ways:
Actual fund return – This section helps you to estimate the actual expenses that you paid over the period. The “Ending Account Value” shown is derived from the Fund’s actual return, and the third column shows the dollar amount of operating expenses that would have been paid by an investor who started with $1,000 in the Fund. You may use the information here, together with the amount you invested, to estimate the expenses that you paid over the period.
To do so, simply divide your account value by $1,000 (for example, an $8,600 account value divided by $1,000 = 8.6), then multiply the result by the number given for the Fund under the heading “Expenses Paid During Period.”
Hypothetical 5% return – This section is intended to help you compare the Fund’s ongoing costs with those of other mutual funds. It assumes that the Fund had an annual return of 5% before expenses during the period shown, but that the expense ratio is unchanged. In this case, because the return used is not the Fund’s actual return, the results do not apply to your investment. The example is useful in making comparisons because the SEC requires all mutual funds to calculate expenses based on a 5% return. You can assess the Fund’s ongoing costs by comparing this hypothetical example with the hypothetical examples that appear in shareholder reports of other funds.
Note that expenses shown in the table are meant to highlight and help you compare ongoing costs only. The Fund does not charge transaction fees, such as purchase or redemption fees, nor does it carry a “sales load.” The calculations assume no shares were bought or sold during the period. Your actual costs may have been higher or lower, depending on the amount of your investment and the timing of any purchases or redemptions.
19
CINCINNATI ASSET MANAGEMENT FUNDS:
BROAD MARKET STRATEGIC INCOME FUND
ABOUT YOUR FUND’S EXPENSES (Unaudited) (Continued)
BROAD MARKET STRATEGIC INCOME FUND
ABOUT YOUR FUND’S EXPENSES (Unaudited) (Continued)
More information about the Fund’s expenses can be found in this report. For additional information on operating expenses and other shareholder costs, please refer to the Fund’s prospectus.
Beginning Account Value December 1, 2013 | Ending Account Value May 31, 2014 | Expenses Paid During Period* | |
| Based on Actual Fund Return | $1,000.00 | $1,058.60 | $3.34 |
| Based on Hypothetical 5% Return (before expenses) | $1,000.00 | $1,021.69 | $3.28 |
| * | Expenses are equal to the Fund’s annualized expense ratio of 0.65% for the period, multiplied by the average account value over the period, multiplied by 182/365 (to reflect the one-half year period). |
OTHER INFORMATION (Unaudited)
A description of the policies and procedures that the Fund uses to vote proxies relating to portfolio securities is available without charge upon request by calling toll-free 1-866-738-1128, or on the SEC’s website at http://www.sec.gov. Information regarding how the Fund voted proxies relating to portfolio securities during the most recent 12-month period ended June 30 is available without charge upon request by calling toll-free 1-866-738-1128, or on the SEC’s website at http://www.sec.gov.
The Trust files a complete listing of portfolio holdings for the Fund with the SEC as of the end of the first and third quarters of each fiscal year on Form N-Q. These filings are available upon request by calling 1-866-738-1128. Furthermore, you may obtain a copy of the filings on the SEC’s website at http://www.sec.gov. The Trust’s Forms N-Q may also be reviewed and copied at the SEC’s Public Reference Room in Washington, DC, and information on the operation of the Public Reference Room may be obtained by calling 1-800-SEC-0330.
20
CINCINNATI ASSET MANAGEMENT FUNDS:
BROAD MARKET STRATEGIC INCOME FUND
BOARD OF TRUSTEES AND EXECUTIVE OFFICERS
(Unaudited)
BROAD MARKET STRATEGIC INCOME FUND
BOARD OF TRUSTEES AND EXECUTIVE OFFICERS
(Unaudited)
The Board of Trustees has overall responsibility for management of the Trust’s affairs. The Trustees serve during the lifetime of the Trust and until its termination, or until death, resignation, retirement, or removal. The Trustees, in turn, elect the officers of the Fund to actively supervise its day-to-day operations. The officers have been elected for an annual term. Unless otherwise noted, each Trustee’s and officer’s address is 225 Pictoria Drive, Suite 450, Cincinnati, OH 45246. The following are the Trustees and executive officers of the Fund:
Name and Year of Birth | Length of Time Served | Position(s) Held with Trust | Principal Occupation(s) During Past 5 Years | Number of Funds in Trust Overseen by Trustee | Directorships of Public Companies Held by Trustee During Past 5 Years |
| Interested Trustees: | |||||
Robert G. Dorsey* Year of Birth: 1957 | Since February 2012 June 2012 to October 2013 | Trustee President | Managing Director of Ultimus Fund Solutions, LLC and Ultimus Fund Distributors, LLC (1999 to present) | 7 | None |
| Independent Trustees: | |||||
John C. Davis Year of Birth: 1952 | Since July 2014 Since June 2012 | Chairman Trustee | Consultant ( government services) since May 2011; Retired Partner of PricewaterhouseCoopers LLP (1974-2010) | 7 | None |
John J. Discepoli Year of Birth: 1963 | Since June 2012 | Trustee | Owner of Discepoli Financial Planning, LLC (personal financial planning company) since November 2004 | 7 | None |
David M. Deptula Year of Birth: 1958 | Since June 2012 | Trustee | Vice President of Tax at The Standard Register Company since November 2011; Tax Partner at Deloitte Tax LLP from 1984 to 2011 | 7 | None |
| * | Mr. Dorsey is considered an “interested person” of the Trust within the meaning of Section 2(a)(19) of the 1940 Act because of his relationship with the Trust’s administrator, transfer agent and distributor. |
21
CINCINNATI ASSET MANAGEMENT FUNDS:
BROAD MARKET STRATEGIC INCOME FUND
BOARD OF TRUSTEES AND EXECUTIVE OFFICERS
(Unaudited) (Continued)
BROAD MARKET STRATEGIC INCOME FUND
BOARD OF TRUSTEES AND EXECUTIVE OFFICERS
(Unaudited) (Continued)
Name and Year of Birth | Length of Time Served | Position(s) Held with Trust | Principal Occupation(s) During Past 5 Years |
| Executive Officers: | |||
David R. Carson Year of Birth: 1958 | Since October 2013 April 2013 to October 2013 | President Vice President | Vice President and Director of Client Strategies of Ultimus Fund Solutions, LLC (2013 to present); Chief Compliance Officer, The Huntington Funds (2005 to 2013), The Flex-Funds (2006 to 2011), Meeder Financial (2007 to 2011), Huntington Strategy Shares (2012 to 2013), and Huntington Asset Advisors (2013); Vice President, Huntington National Bank (2001 to 2013). |
William S. Sloneker 8845 Governor’s Hill Drive, Cincinnati, Ohio 45249 Year of Birth: 1953 | Since June 2012 | Principal Executive Officer of Cincinnati Asset Management Funds: Broad Market Strategic Income Fund | Chairman, Chief Executive Office and Portfolio Manager of Cincinnati Asset Management, Inc. (1989 to present) |
Mark J. Seger Year of Birth: 1962 | Since February 2014 | Treasurer | Managing Director of Ultimus Fund Solutions, LLC and Ultimus Fund Distributors, LLC (1999 to present) |
| Frank L. Newbauer Year of Birth: 1954 | Since February 2012 | Secretary | Assistant Vice President of Ultimus Fund Solutions, LLC and Ultimus Fund Distributors, LLC (2010 to present); Assistant Vice President of JPMorgan Chase Bank, N.A. (1999 to 2010) |
Stephen L. Preston Year of Birth: 1966 | Since June 2012 | Chief Compliance Officer | Assistant Vice President and Chief Compliance Officer of Ultimus Fund Distributors, LLC and Assistant Vice President of Ultimus Fund Solutions, LLC since 2011; Senior Consultant at Mainstay Capital Markets Consultants (2010 to 2011); Chief Compliance Officer at INTL Trading, Inc. (2008 to 2010). |
Additional information about members of the Board and executive officers is available in the Fund’s Statement of Additional Information (“SAI”). To obtain a free copy of the SAI, please call 1-866-738-1128.
22
CINCINNATI ASSET MANAGEMENT FUNDS:
BROAD MARKET STRATEGIC INCOME FUND
DISCLOSURE REGARDING APPROVAL OF INVESTMENT ADVISORY AGREEMENT (Unaudited)
BROAD MARKET STRATEGIC INCOME FUND
DISCLOSURE REGARDING APPROVAL OF INVESTMENT ADVISORY AGREEMENT (Unaudited)
The Board of Trustees (the “Board”), including the Independent Trustees voting separately, has reviewed and approved the Fund’s Investment Advisory Agreement with Cincinnati Asset Management, Inc. (“CAM”) for an additional annual term. Approval took place at an in-person meeting held on April 21, 2014, at which all of the Trustees were present.
In the course of their deliberations, the Board was advised by legal counsel. The Board received and reviewed a substantial amount of information provided by CAM in response to requests of the Board and counsel.
In considering the Investment Advisory Agreement and reaching their conclusions with respect thereto, the Board reviewed and analyzed various factors that they determined were relevant, including the factors described below.
The nature, extent, and quality of the services provided by CAM. In this regard, the Board reviewed the services being provided by CAM to the Fund including, without limitation, its investment advisory services since the Fund’s inception, its compliance procedures and practices, and its efforts to promote the Fund and assist in its distribution. The Board also noted that the Fund’s Principal Executive Officer is an employee of CAM and serves the Trust without additional compensation from the Fund. After reviewing the foregoing information and further information concerning CAM’s business, the Board concluded that the quality, extent, and nature of the services provided by CAM were satisfactory and adequate for the Fund.
The investment performance of the Fund and CAM. In this regard, the Board compared the performance of the Fund with the performance of its benchmark index, its Morningstar category and a comparable peer group identified by CAM (the “Bond Peer Group”). The Board also considered the consistency of CAM’s management of the Fund with the Fund’s investment objective and policies. Following discussion of the investment performance of the Fund and the Fund’s performance relative to its Morningstar category and its Bond Peer Group, CAM’s experience in managing the Fund and separate accounts, CAM’s historical investment performance and other factors, the Board concluded that the investment performance of the Fund has been satisfactory.
The costs of the services to be provided and profits realized by CAM from its relationship with the Fund. In this regard, the Board considered CAM’s staffing, personnel, and methods of operating; the education and experience of CAM’s personnel; CAM’s compliance program, policies, and procedures; the financial condition of CAM and the level of commitment to the Fund and CAM by the principals of CAM; the asset level of the Fund; the overall expenses of the Fund, including the advisory fee; and the differences in fees and services to CAM’s other clients that may be similar to the Fund. The Board discussed the Fund’s Expense Limitation Agreement with CAM, and considered CAM’s current and past fee reductions and expense reimbursements with respect to the Fund under the Expense Limitation Agreement. The Board further took into account CAM’s willingness to continue the Expense Limitation Agreement for the Fund until at least October 1, 2017.
23
CINCINNATI ASSET MANAGEMENT FUNDS:
BROAD MARKET STRATEGIC INCOME FUND
DISCLOSURE REGARDING APPROVAL OF INVESTMENT ADVISORY AGREEMENT (Unaudited) (Continued)
BROAD MARKET STRATEGIC INCOME FUND
DISCLOSURE REGARDING APPROVAL OF INVESTMENT ADVISORY AGREEMENT (Unaudited) (Continued)
The Board also considered potential benefits for CAM in managing the Fund, including promotion of CAM’s name and the potential for CAM to receive research, statistical, or other services from the Fund’s trades that may benefit CAM’s other clients. The Board compared the Fund’s advisory fee and overall expense ratio to the average advisory fees and average expense ratios for its Morningstar category and Bond Peer Group. The Board noted that the Fund’s advisory fee of 0.75% per annum was higher than the average advisory fee of 0.57% per annum for its Morningstar category of Multisector Bond funds. The Board also considered CAM’s commitment to cap the Fund’s expenses at 0.65% per annum. The Board further noted that the overall expense ratio of 0.65% per annum (after applying the expense limitation) for the Fund was lower than the 1.18% average expense ratio for its Morningstar category of Multisector Bond funds. Following these comparisons and upon further consideration and discussion of the foregoing, the Board concluded that the advisory fee paid to CAM by the Fund is fair and reasonable.
The extent to which economies of scale would be realized as the Fund grows and whether advisory fee levels reflect these economies of scale for the benefit of the Fund’s investors. In this regard, the Board considered that the Fund’s fee arrangements with CAM involve both the advisory fee and the Expense Limitation Agreement. The Board determined that, while the advisory fee remained the same as asset levels increased, the shareholders of the Fund have experienced benefits from the Expense Limitation Agreement. Following further discussion of the Fund’s asset levels, expectations for growth, and level of fees, the Board determined that the Fund’s fee arrangements with CAM continue to provide benefits and that, at the Fund’s projected asset levels for the next year, the Fund’s arrangements with CAM were fair and reasonable.
Brokerage and portfolio transactions. In this regard, the Board considered CAM’s policies and procedures, and performance in implementing those policies and procedures, to seek best execution for its clients, including the Fund. The Board also considered the historical portfolio turnover rate for the Fund; the process by which evaluations are made of the overall reasonableness of commissions paid; the method and basis for selecting and evaluating the broker-dealers used; and any anticipated allocation of portfolio business to persons affiliated with CAM. After further review and discussion, the Board determined that CAM’s practices regarding brokerage and portfolio transactions are satisfactory.
Possible conflicts of interest. In evaluating the possibility for conflicts of interest, the Board considered such matters as the experience and abilities of the advisory personnel assigned to the Fund, CAM’s process for allocating trades among its different clients; and the substance and administration of CAM’s code of ethics. Following further consideration and discussion, the Board found that CAM’s standards and practices relating to the identification and mitigation of potential conflicts of interests were satisfactory.
Conclusion
After full consideration of the above factors as well as other factors, the Board unanimously concluded that approval of the Investment Advisory Agreement was in the best interests of the Fund and its shareholders.
24
This page intentionally left blank.
WAVELENGTH INTEREST RATE NEUTRAL FUND LETTER TO SHAREHOLDERS | July 11, 2014 |
Dear Fellow Shareholders:
Over the past eight months financial markets experienced a diverse and dynamic set of conditions that resulted in uncertainty among many investors. While this is not uncommon, we appreciate that you have entrusted us with your investment and are pleased to report balanced, positive returns over the period in our first annual shareholder letter.
What follows is designed to provide context around these returns in a way that builds a deeper understanding of the investment process that supports them. We believe that informed investors make better investment decisions, and through this we hope to build on the partnership your investment creates.
PERFORMANCE SUMMARY
From inception on September 30, 2013 through May 31, 2014, the Wavelength Interest Rate Neutral Fund (the “Fund”) delivered a return of +4.62% versus a benchmark return of +0.03% for the S&P / BGCantor 0-3 Month US Treasury Bill Index (which seeks to represent the return from not taking risk in financial markets). The Fund’s outperformance was generated amidst changing expectations for growth, inflation and related policy decisions, and these balanced results are in line with long-term investment objectives.
WAVELENGTH PHILOSOPHY
We believe that macroeconomic conditions drive asset prices and central banks use interest rates to manage macroeconomic conditions. Based on this fundamental logic, we seek to build a portfolio that is hedged to changes in interest rates by balancing investment exposure between instruments we expect to outperform in rising and falling macroeconomic conditions.
INVESTMENT ENVIRONMENT
Central to our investment philosophy, we believe that changing expectations for conditions drive investment decisions, which in turn drive market prices. This logic played out over the period, particularly in relation to expected Federal Reserve policy.
The third quarter of 2013 ended on a high note, culminating with a series of positive economic surprises in the US. Many market participants believed in a firm recovery that would lead to a reduction in Federal Reserve asset purchases. Based on this expectation, the prices of government bonds the Federal Reserve had been purchasing declined, while assets that benefit from better than expected growth generally increased in value.
In the fourth quarter of 2013 the magnitude of positive surprises decreased, however, and this similarly changed many market participants’ outlook for Federal Reserve policy. With a more modest reduction in purchases there would be more buyers of government bonds, and the stimulative impact these purchases had on the economy would also be maintained. As a result of these changes to expectations, both US government and corporate assets rallied over the period.
1
This cycle of changing expectations continued into 2014, and market responses maintained the logic outlined above. When growth data came in below expectations in January, corporate securities – particularly equities – underperformed while government bonds became more attractive on a relative basis. Further clarity around the Federal Reserve’s planned asset purchases, however, helped raise future growth expectations for market participants, leading to a recovery in corporate securities and extended rally in government bonds through the end of May.
PERFORMANCE DISCUSSION
The Fund responded to market conditions as expected throughout the period, generating a balanced positive return amidst the changing investment landscape. The consistent rotation of performance drivers brought on by the varied expectations described above created opportunities to harvest return from a wide range of sources while avoiding outsized risks to any individual economic outcome.
As such, the Fund generated positive performance from each asset class in the portfolio over the period, with gains offsetting losses in different scenarios by design. While government bond exposure detracted from performance in the fourth quarter of 2013, positive contributions from corporate securities, such as high yield credit and convertible bonds, were effective at limiting downside risk. Maintaining the balance when growth was lower than expected in the first quarter of 2014, gains from government bonds outweighed these losses to produce robust portfolio gains. Outside of these sectors, the Fund’s commodity exposure rebounded after a modest negative contribution to generate positive returns for the period, and USD-denominated emerging market debt also performed positively overall despite the up-and-down nature of geopolitical risks.
OUTLOOK
While investor uncertainty continues to rise around major economic events and releases, the general level of clarity in economic policy and its potential outcomes has improved. Efforts by the Federal Reserve to provide a clear framework for how policy decisions are made should ultimately limit the amount by which markets over- and under-react to forward guidance. With this increasingly direct approach, we expect well-founded economic datapoints to maintain their fundamental relationships with asset prices and believe targeting a balanced exposure across potential macroeconomic outcomes will continue to deliver value through investment returns.
Thank you for your trust and support through investment.
Sincerely,

Andrew Dassori
Founding Partner & Chief Investment Officer
Wavelength Capital Management
Wavelength Capital Management
2
Past performance is not predictive of future performance. Investment results and principal value will fluctuate so that shares, when redeemed, may be worth more or less than their original cost. Current performance may be higher or lower than the performance data quoted. Performance data current to the most recent month end are available by calling 1-866-896-9292.
An investor should consider the investment objectives, risks, charges and expenses of the Fund carefully before investing. The Fund’s prospectus contains this and other important information. To obtain a copy of the Fund’s prospectus please call 1-866-896-9292 and a copy will be sent to you free of charge. Please read the prospectus carefully before you invest. The Wavelength Interest Rate Neutral Fund is distributed by Ultimus Fund Distributors, LLC.
The Letter to Shareholders seeks to describe some of the Adviser’s current opinions and views of the financial markets. Although the Adviser believes it has a reasonable basis for any opinions or views expressed, actual results may differ, sometimes significantly so, from those expected or expressed.
3
WAVELENGTH INTEREST RATE NEUTRAL FUND
PERFORMANCE INFORMATION
May 31, 2014 (Unaudited)
PERFORMANCE INFORMATION
May 31, 2014 (Unaudited)
Comparison of the Change in Value of a $10,000 Investment in
Wavelength Interest Rate Neutral Fund versus the
S&P/BGCantor 0-3 Month U.S. Treasury Bill Index
Wavelength Interest Rate Neutral Fund versus the
S&P/BGCantor 0-3 Month U.S. Treasury Bill Index
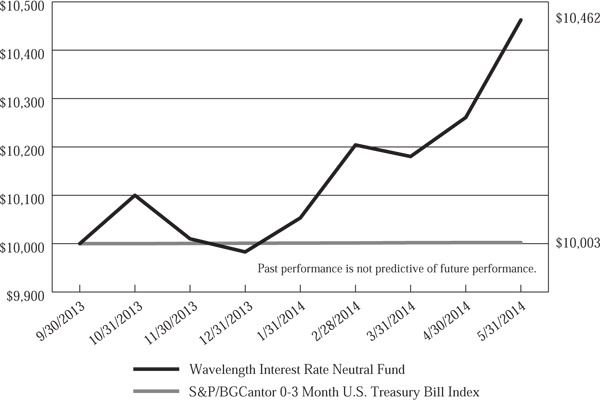
Total Return For the period ended May 31, 2014 | |
Since Inception(b) | |
Wavelength Interest Rate Neutral Fund(a) | 4.62% |
| S&P/BGCantor 0-3 Month U.S. Treasury Bill Index | 0.03% |
| (a) | The Fund’s total return does not reflect the deduction of taxes a shareholder would pay on Fund distributions or the redemption of Fund shares. |
| (b) | The Fund commenced operations on September 30, 2013. |
4
WAVELENGTH INTEREST RATE NEUTRAL FUND
PORTFOLIO INFORMATION
May 31, 2014 (Unaudited)
PORTFOLIO INFORMATION
May 31, 2014 (Unaudited)
Portfolio Allocation (% of Investments(a))
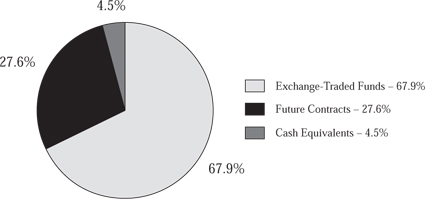
Top 10 Investments (Excluding Cash Equivalents)
| Investment Description | % of Investments(a) | |
| 5-Year U.S. Treasury Note Future | 13.4% | |
iShares® Barclays TIPS Bond ETF | 12.5% | |
| PowerShares Senior Loan Portfolio | 11.9% | |
SPDR® Barclays Convertible Securities ETF | 7.9% | |
iShares® iBoxx $ High Yield Corporate Bond ETF | 7.4% | |
iShares® J.P. Morgan USD Emerging Markets Bond ETF | 6.7% | |
| 10-Year U.S. Treasury Note Future | 6.0% | |
| PowerShares Emerging Markets Sovereign Debt Portfolio | 5.5% | |
SPDR® Barclays Short Term High Yield Bond ETF | 5.1% | |
SPDR® Barclays High Yield Bond ETF | 3.4% |
| (a) | Adjusted to include the notional value of futures contracts. |
5
WAVELENGTH INTEREST RATE NEUTRAL FUND SCHEDULE OF INVESTMENTS May 31, 2014 | ||||||||
| EXCHANGE-TRADED FUNDS — 90.2% | Shares | Value | ||||||
| Commodities — 3.2% | ||||||||
iShares® S&P GSCI™ Commodity-Indexed Trust (a) | 3,875 | $ | 128,379 | |||||
SPDR® Gold Shares (a) (b) | 200 | 24,086 | ||||||
| 152,465 | ||||||||
| Emerging Markets — 16.7% | ||||||||
iShares® J.P. Morgan USD Emerging Markets Bond ETF | 3,616 | 418,118 | ||||||
| Market Vectors Emerging Markets High Yield Bond ETF | 975 | 25,691 | ||||||
| PowerShares Emerging Markets Sovereign Debt Portfolio | 11,675 | 341,844 | ||||||
| 785,653 | ||||||||
| Large-Cap Index — 0.7% | ||||||||
SPDR® S&P 500® ETF | 175 | 33,710 | ||||||
| Real Estate Investment Trusts (REIT) — 1.0% | ||||||||
SPDR® Dow Jones REIT ETF | 25 | 2,073 | ||||||
| Vanguard REIT ETF | 600 | 44,814 | ||||||
| 46,887 | ||||||||
| U.S. Fixed Income — 68.6% | ||||||||
| Highland/iBoxx Senior Loan ETF | 2,357 | 46,834 | ||||||
iShares® TIPS Bond ETF | 6,750 | 780,232 | ||||||
iShares® 3-7 Year Treasury Bond ETF | 479 | 58,491 | ||||||
iShares® 7-10 Year Treasury Bond ETF | 165 | 17,157 | ||||||
iShares® 20+ Year Treasury Bond ETF | 425 | 48,492 | ||||||
iShares® iBoxx $ High Yield Corporate Bond ETF | 4,875 | 463,369 | ||||||
| PIMCO 0-5 Year High Yield Corporate Bond Index ETF | 450 | 47,988 | ||||||
| PowerShares Senior Loan Portfolio | 30,038 | 745,843 | ||||||
SPDR® Barclays Convertible Securities ETF | 10,014 | 495,292 | ||||||
SPDR® Barclays High Yield Bond ETF | 5,100 | 211,803 | ||||||
SPDR® Barclays Short Term High Yield Bond ETF | 10,279 | 318,341 | ||||||
| 3,233,842 | ||||||||
Total Exchange-Traded Funds — 90.2% (Cost $4,145,146) | $ | 4,252,557 | ||||||
6
WAVELENGTH INTEREST RATE NEUTRAL FUND SCHEDULE OF INVESTMENTS (Continued) | ||||||||
| MONEY MARKET FUNDS — 5.9% | Shares | Value | ||||||
Fidelity Institutional Money Market Government Portfolio - Class I, 0.01% (c) (Cost $279,920) | 279,920 | $ | 279,920 | |||||
Total Investments at Value — 96.1% (Cost $4,425,066) | $ | 4,532,477 | ||||||
| Other Assets in Excess of Liabilities — 3.9% | 184,484 | |||||||
| Net Assets — 100.0% | $ | 4,716,961 | ||||||
| (a) | Non-income producing security. |
| (b) | For federal income tax purposes, structured as a grantor trust. |
| (c) | The rate shown is the 7-day effective yield as of May 31, 2014. |
| See accompanying notes to financial statements. | |
7
WAVELENGTH INTEREST RATE NEUTRAL FUND SCHEDULE OF FUTURES CONTRACTS May 31, 2014 | |||||||||||||
| FUTURES CONTRACTS | Expiration Date | Contracts | Aggregate Market Value of Contracts | Unrealized Appreciation | |||||||||
| Index Futures | |||||||||||||
| Dow Jones U.S. Real Estate Index Future | 6/20/2014 | 1 | $ | 27,880 | $ | 128 | |||||||
| E-Mini S&P 500 Future | 6/20/2014 | 2 | 192,050 | 6,996 | |||||||||
S&P® GSCI® Future | 6/16/2014 | 1 | 162,500 | 322 | |||||||||
| Total Index Futures | 382,430 | 7,446 | |||||||||||
| Treasury Futures | |||||||||||||
| 5-Year U.S. Treasury Note Future | 9/30/2014 | 7 | 837,813 | 849 | |||||||||
| 10-Year U.S. Treasury Note Future | 9/19/2014 | 3 | 376,031 | 1,152 | |||||||||
| U.S. Treasury Long Bond Future | 9/19/2014 | 1 | 137,250 | 686 | |||||||||
| Total Treasury Futures | 1,351,094 | 2,687 | |||||||||||
| Total Futures Contracts | $ | 1,733,524 | $ | 10,133 | |||||||||
See accompanying notes to financial statements.
8
WAVELENGTH INTEREST RATE NEUTRAL FUND STATEMENT OF ASSETS AND LIABILITIES May 31, 2014 | ||||
ASSETS | ||||
| Investments in securities: | ||||
| At acquisition cost | $ | 4,425,066 | ||
| At value (Note 2) | $ | 4,532,477 | ||
| Cash | 1,266 | |||
| Margin deposits for futures contracts (Note 2) | 176,046 | |||
| Dividends receivable | 176 | |||
| Receivable for capital shares sold | 3,000 | |||
| Receivable for investment securities sold | 108,024 | |||
| Receivable from Adviser (Note 4) | 8,066 | |||
| Other assets | 3,642 | |||
| Total assets | 4,832,697 | |||
| LIABILITIES | ||||
| Payable for investment securities purchased | 102,213 | |||
| Payable to administrator (Note 4) | 6,040 | |||
| Variation margin payable (Notes 2 and 5) | 2,851 | |||
| Other accrued expenses | 4,632 | |||
| Total liabilities | 115,736 | |||
| NET ASSETS | $ | 4,716,961 | ||
| NET ASSETS CONSIST OF: | ||||
| Paid-in capital | $ | 4,554,419 | ||
| Undistributed net investment income | 13,372 | |||
| Accumulated net realized gains from investments and futures contracts | 31,626 | |||
| Net unrealized appreciation on: | ||||
| Investments | 107,411 | |||
| Futures contracts (Note 5) | 10,133 | |||
| NET ASSETS | $ | 4,716,961 | ||
| Shares of beneficial interest outstanding (unlimited number of shares authorized, no par value) | 454,638 | |||
| Net asset value, offering price and redemption price per share (Note 2) | $ | 10.38 | ||
See accompanying notes to financial statements.
9
WAVELENGTH INTEREST RATE NEUTRAL FUND STATEMENT OF OPERATIONS For the Period Ended May 31, 2014(a) | ||||
INVESTMENT INCOME | ||||
| Dividends | $ | 67,658 | ||
| EXPENSES | ||||
| Investment advisory fees (Note 4) | 25,278 | |||
| Fund accounting fees (Note 4) | 16,269 | |||
| Administration fees (Note 4) | 16,000 | |||
| Legal fees | 14,271 | |||
| Compliance fees (Note 4) | 8,000 | |||
| Transfer agent fees (Note 4) | 8,000 | |||
| Custody and bank service fees | 7,398 | |||
| Registration and filing fees | 7,103 | |||
| Trustees' fees and expenses (Note 4) | 6,736 | |||
| Postage and supplies | 3,492 | |||
| Insurance expense | 2,667 | |||
| Other expenses | 2,792 | |||
| Total expenses | 118,006 | |||
| Less fee reductions and expense reimbursements by the Adviser (Note 4) | (91,664 | ) | ||
| Net expenses | 26,342 | |||
| NET INVESTMENT INCOME | 41,316 | |||
| REALIZED AND UNREALIZED GAINS ON INVESTMENTS AND FUTURES CONTRACTS | ||||
| Net realized gains from: | ||||
| Investments | 22,444 | |||
| Futures contracts (Note 5) | 13,061 | |||
| Capital gain distributions from regulated investment companies | 39 | |||
| Net change in unrealized appreciation/depreciation on: | ||||
| Investments | 107,411 | |||
| Futures contracts (Note 5) | 10,133 | |||
| NET REALIZED AND UNREALIZED GAINS ON INVESTMENTS | 153,088 | |||
| NET INCREASE IN NET ASSETS RESULTING FROM OPERATIONS | $ | 194,404 | ||
| (a) | Represents the period from the commencement of operations (September 30, 2013) through May 31, 2014. |
See accompanying notes to financial statements.
10
WAVELENGTH INTEREST RATE NEUTRAL FUND STATEMENT OF CHANGES IN NET ASSETS | ||||
Period Ended May 31, 2014(a) | ||||
| FROM OPERATIONS | ||||
| Net investment income | $ | 41,316 | ||
| Net realized gains from: | ||||
| Investments | 22,444 | |||
| Futures contracts (Note 5) | 13,061 | |||
| Capital gain distributions from regulated investment companies | 39 | |||
| Net change in unrealized appreciation/depreciation on: | ||||
| Investments | 107,411 | |||
| Futures contracts (Note 5) | 10,133 | |||
| Net increase in net assets from operations | 194,404 | |||
| DISTRIBUTIONS TO SHAREHOLDERS | ||||
| From net investment income | (27,944 | ) | ||
| From net realized gains | (3,918 | ) | ||
| Decrease in net assets from distributions to shareholders | (31,862 | ) | ||
| CAPITAL SHARE TRANSACTIONS | ||||
| Proceeds from shares sold | 4,572,557 | |||
| Net asset value of shares issued in reinvestment of distributions to shareholders | 31,862 | |||
| Payments for shares redeemed | (50,000 | ) | ||
| Net increase in net assets from capital share transactions | 4,554,419 | |||
| TOTAL INCREASE IN NET ASSETS | 4,716,961 | |||
| NET ASSETS | ||||
| Beginning of period | — | |||
| End of period | $ | 4,716,961 | ||
| ACCUMULATED NET INVESTMENT INCOME | $ | 13,372 | ||
| CAPITAL SHARE ACTIVITY | ||||
| Shares sold | 456,307 | |||
| Shares issued in reinvestment of distributions to shareholders | 3,190 | |||
| Shares redeemed | (4,859 | ) | ||
| Net increase in shares outstanding | 454,638 | |||
| Shares outstanding at beginning of period | — | |||
| Shares outstanding at end of period | 454,638 | |||
| (a) | Represents the period from the commencement of operations (September 30, 2013) through May 31, 2014. |
See accompanying notes to financial statements.
11
WAVELENGTH INTEREST RATE NEUTRAL FUND FINANCIAL HIGHLIGHTS | ||||
Per Share Data for a Share Outstanding Throughout the Period | ||||
Period Ended May 31, 2014(a) | ||||
| Net asset value at beginning of period | $ | 10.00 | ||
| Income from investment operations: | ||||
| Net investment income | 0.10 | |||
| Net realized and unrealized gains on investments and futures contracts | 0.36 | |||
| Total from investment operations | 0.46 | |||
| Less distributions: | ||||
| Distributions from net investment income | (0.07 | ) | ||
| Distributions from net realized gains | (0.01 | ) | ||
| Total distributions | (0.08 | ) | ||
| Net asset value at end of period | $ | 10.38 | ||
Total return (b) | 4.62 | %(c) | ||
| Net assets at end of period (000's) | $ | 4,717 | ||
| Ratios/supplementary data: | ||||
Ratio of total expenses to average net assets (f) | 4.42 | %(d) | ||
Ratio of net expenses to average net assets (e) (f) | 0.99 | %(d) | ||
Ratio of net investment income to average net assets (e) (f) (g) | 1.55 | %(d) | ||
| Portfolio turnover rate | 114 | %(c) | ||
| (a) | Represents the period from the commencement of operations (September 30, 2013) through May 31, 2014. |
| (b) | Total return is a measure of the change in value of an investment in the Fund over the period covered. The return shown does not reflect the deduction of taxes a shareholder would pay on Fund distributions, if any, or the redemption of Fund shares. The total return would be lower if the Adviser had not reduced advisory fees and reimbursed expenses. |
| (c) | Not annualized. |
| (d) | Annualized |
| (e) | Ratio was determined after advisory fee reductions and expense reimbursements (Note 4). |
| (f) | The ratios of expenses and net investment income to average net assets do not reflect the Fund’s proportionate share of expenses of the underlying investment companies in which the Fund invests. |
| (g) | Recognition of net investment income by the Fund is affected by the timing of the declarations of dividends by the underlying investment companies in which the Fund invests. |
See accompanying notes to financial statements.
12
WAVELENGTH INTEREST RATE NEUTRAL FUND
NOTES TO FINANCIAL STATEMENTS
May 31, 2014
NOTES TO FINANCIAL STATEMENTS
May 31, 2014
1. Organization
Wavelength Interest Rate Neutral Fund (the “Fund”) is a non-diversified series of Ultimus Managers Trust (the “Trust”), an open-end investment company established as an Ohio business trust under a Declaration of Trust dated February 28, 2012. Other series of the Trust are not incorporated in this report. The Fund commenced operations on September 30, 2013.
The investment objective of the Fund is total return.
2. Significant Accounting Policies
The following is a summary of the Fund’s significant accounting policies. The policies are in conformity with accounting principles generally accepted in the United States of America (“GAAP”).
Securities and futures valuation – The Fund’s portfolio securities are valued at market value as of the close of regular trading on the New York Stock Exchange (the “NYSE”) (normally 4:00 p.m. Eastern time) on each business day the NYSE is open. Securities listed on the NYSE or other exchanges are valued on the basis of their last sales prices on the exchanges on which they are primarily traded. If there are no sales on that day, the securities are valued at the closing bid price on the NYSE or other primary exchange for that day. NASDAQ listed securities are valued at the NASDAQ Official Closing Price. If there are no sales on that day, the securities are valued at the last bid price as reported by NASDAQ. Securities traded in the over-the-counter market are valued at the last sale price, if available, otherwise at the most recently quoted bid price. In the event that market quotations are not readily available or are considered unreliable due to market or other events, securities and other assets are valued at fair value as determined in good faith in accordance with procedures adopted by the Board of Trustees of the Trust and will be classified as Level 2 or 3 within the fair value hierarchy (see below), depending on the inputs used. Factors determining portfolio investments subject to fair value determination include, but are not limited to, the following: the spread between bid and asked prices is substantial; infrequency of sales; thinness of market; the size of reported trades; a temporary lapse in the provision of prices by any reliable pricing source; and actions of the securities or futures markets, such as the suspension or limitation of trading. Futures contracts that trade on exchanges that close before 4:00 p.m. Eastern time are valued at their last sale price as of the close of regular trading on the primary exchange on which the contract is traded. Prices for these futures contracts are monitored daily by the Adviser until 4:00 p.m. Eastern time to determine if fair valuation is required.
GAAP establishes a single authoritative definition of fair value, sets out a framework for measuring fair value and requires additional disclosures about fair value measurements.
13
WAVELENGTH INTEREST RATE NEUTRAL FUND
NOTES TO FINANCIAL STATEMENTS (Continued)
NOTES TO FINANCIAL STATEMENTS (Continued)
Various inputs are used in determining the value of the Fund’s investments. These inputs are summarized in the three broad levels listed below:
| • | Level 1 – quoted prices in active markets for identical securities |
| • | Level 2 – other significant observable inputs |
| • | Level 3 – significant unobservable inputs |
The inputs or methodology used for valuing securities are not necessarily an indication of the risks associated with investing in those securities. The inputs used to measure fair value may fall into different levels of the fair value hierarchy. In such cases, for disclosure purposes, the level in the fair value hierarchy within which the fair value measurement falls in its entirety is determined based on the lowest level input that is significant to the fair value measurement.
The following is a summary of the inputs used to value the Fund’s investments as of May 31, 2014:
| Level 1 | Level 2 | Level 3 | Total | |||||||||||||
Investments in Securities | ||||||||||||||||
| Exchange-Traded Funds | $ | 4,252,557 | $ | — | $ | — | $ | 4,252,557 | ||||||||
| Money Market Funds | 279,920 | — | — | 279,920 | ||||||||||||
| Total | $ | 4,532,477 | $ | — | $ | — | $ | 4,532,477 | ||||||||
Other Financial Instruments | ||||||||||||||||
| Futures Contracts | $ | 10,133 | $ | — | $ | — | $ | 10,133 | ||||||||
As of May 31, 2014, the Fund did not have any transfers in and out of any Level. In addition, the Fund did not have any assets or liabilities that were measured at fair value on a recurring basis using significant unobservable inputs (Level 3) as of May 31, 2014. It is the Fund’s policy to recognize transfers into and out of any Level at the end of the reporting period.
Share valuation – The net asset value per share of the Fund is calculated daily by dividing the total value of the Fund’s assets, less liabilities, by the number of shares outstanding. The offering price and redemption price per share of the Fund is equal to the net asset value per share.
Investment income – Dividend income is recorded on the ex-dividend date. Interest income is accrued as earned.
Security transactions – Security transactions are accounted for on the trade date. Gains and losses on securities sold are determined on a specific identification basis.
14
WAVELENGTH INTEREST RATE NEUTRAL FUND
NOTES TO FINANCIAL STATEMENTS (Continued)
NOTES TO FINANCIAL STATEMENTS (Continued)
Common expenses – Common expenses of the Trust are allocated among the Fund and the other series of the Trust based on the relative net assets of each series or the nature of the services performed and the relative applicability to each series.
Distributions to shareholders – Distributions to shareholders arising from net investment income, if any, are expected to be distributed on a quarterly basis and net realized capital gains, if any, are distributed at least annually. The amount of distributions from net investment income and net realized gains are determined in accordance with federal income tax regulations, which may differ from GAAP. Dividends and distributions to shareholders are recorded on the ex-dividend date. During the period ended May 31, 2014, the tax character of distributions paid was ordinary income. On June 30, 2014, the Fund paid an ordinary income dividend of $0.0425 per share to shareholders of record on June 27, 2014.
Futures contracts – The Fund may use futures contracts to gain exposure to or to hedge against changes in the value of equities, real estate, interest rates or commodities. A futures contract represents a commitment for the future purchase or sale of an asset at a specified price on a specified date. When the Fund purchases or sells a futures contract, no price is paid to or received by the Fund. Instead, the Fund is required to deposit in a segregated asset account an amount of cash or qualifying securities currently ranging from 2% to 10% of the contract amount. This is called the “initial margin deposit.” Subsequent payments, known as “variation margin,” are made or received by the Fund each day, depending on the daily fluctuations in the fair value of the underlying asset. The Fund recognizes an unrealized gain or loss equal to the daily variation margin. If market conditions move unexpectedly, the Fund may not achieve the anticipated benefits of the futures contracts and may realize a loss. The margin deposits for futures contracts and the variation margin payable are reported on the Statement of Assets and Liabilities.
Estimates – The preparation of financial statements in conformity with GAAP requires management to make estimates and assumptions that affect the reported amounts of assets and liabilities and disclosure of contingent assets and liabilities as of the date of the financial statements and the reported amounts of income and expenses during the reporting period. Actual results could differ from those estimates.
Federal income tax – The Fund intends to qualify as a regulated investment company under the Internal Revenue Code of 1986 (the “Code”). Qualification generally will relieve the Fund of liability for federal income taxes to the extent 100% of its net investment income and net realized gains are distributed in accordance with the Code. Accordingly, no provision for income tax has been made.
In order to avoid imposition of the excise tax applicable to regulated investment companies, it is also the Fund’s intention to declare as dividends in each calendar year at least 98% of its net investment income (earned during the calendar year) and 98.2% of its net realized capital gains (earned during the twelve months ended October 31) plus undistributed amounts from prior years.
15
WAVELENGTH INTEREST RATE NEUTRAL FUND
NOTES TO FINANCIAL STATEMENTS (Continued)
NOTES TO FINANCIAL STATEMENTS (Continued)
The following information is computed on a tax basis for each item as of May 31, 2014:
| Tax cost of portfolio investments | $ | 4,431,857 | ||
| Gross unrealized appreciation | $ | 103,724 | ||
| Gross unrealized depreciation | (3,104 | ) | ||
| Net unrealized appreciation | 100,620 | |||
| Undistributed ordinary income | 47,966 | |||
| Undistributed long-term gains | 13,956 | |||
| Total accumulated earnings | $ | 162,542 |
The difference between the federal income tax cost of portfolio investments and the tax components of accumulated earnings and the financial statement cost and components of net assets is due to certain timing differences in the recognition of capital gains or losses under income tax regulations and GAAP. These “book/tax” differences are temporary in nature and are primarily due to the tax deferral of losses on wash sales and the tax treatment of realized and unrealized gains and losses on futures contracts.
The Fund recognizes the tax benefits or expenses of uncertain tax positions only when the position is “more likely than not” to be sustained assuming examination by tax authorities. Management has reviewed the Fund’s tax positions for the current tax period (ended May 31, 2014) and has concluded that no provision for unrecognized tax benefits or expenses is required in these financial statements.
3. Investment Transactions
During the period ended May 31, 2014, cost of purchases and proceeds from sales of investment securities, other than short-term investments, were $8,341,928 and $4,219,226, respectively.
4. Transactions with Related Parties
INVESTMENT ADVISORY AGREEMENT
The Fund’s investments are managed by Wavelength Capital Management, LLC (the “Adviser”) pursuant to the terms of an Investment Advisory Agreement. Under the Investment Advisory Agreement, the Fund pays the Adviser an advisory fee, computed and accrued daily and paid monthly, at the annual rate of 0.95% of its average daily net assets.
The Adviser has contractually agreed, until October 1, 2016, to reduce its advisory fees and to reimburse the Fund’s operating expenses (excluding brokerage costs, taxes, interest, acquired fund fees and expenses, extraordinary expenses and other expenses not incurred in the ordinary course of the Fund’s business) to the extent necessary so that the Fund’s annual ordinary operating expenses do not exceed an amount equal to 0.99% of its average daily net assets. During the period ended May 31, 2014, the Adviser did not collect any of its advisory fees and, in addition, reimbursed the Fund for other operating expenses totaling $66,386.
16
WAVELENGTH INTEREST RATE NEUTRAL FUND
NOTES TO FINANCIAL STATEMENTS (Continued)
NOTES TO FINANCIAL STATEMENTS (Continued)
Advisory fee reductions and expense reimbursements by the Adviser are subject to repayment by the Fund for a period of three years after such fees and expenses were incurred, provided that the repayments do not cause the Fund’s ordinary operating expenses, at the time the repayment occurs, to exceed the expense limitation of 0.99% per annum. As of May 31, 2014, the Adviser may in the future recover advisory fee reductions and expense reimbursements totaling $91,664. The Adviser may recover this amount no later than May 31, 2017.
Certain officers of the Fund are also officers of the Adviser.
OTHER SERVICE PROVIDERS
Ultimus Fund Solutions, LLC (“Ultimus”) provides fund administration, fund accounting, compliance and transfer agency services to the Fund. Pursuant to servicing agreements with Ultimus, the Fund pays Ultimus fees in accordance with the agreements for its services. In addition, the Fund pays out-of-pocket expenses including, but not limited to, postage, supplies and costs of pricing the Fund’s portfolio securities.
DISTRIBUTION AGREEMENT
Under the terms of a Distribution Agreement with the Trust, Ultimus Fund Distributors, LLC (the “Distributor”) serves as the principal underwriter to the Fund. The Distributor is a wholly-owned subsidiary of Ultimus. The Distributor is compensated by the Adviser (not the Fund) for acting as principal underwriter.
Certain Trustees and officers of the Trust are also officers of Ultimus and the Distributor.
TRUSTEE COMPENSATION
Each Trustee who is not an interested person of the Trust receives from the Fund a fee of $500 for each Board meeting attended plus reimbursement of travel and other expenses incurred in attending the meetings. Trustees affiliated with the Adviser or Ultimus are not compensated by the Trust for their services.
PRINCIPAL HOLDER OF FUND SHARES
As of May 31, 2014, Mark Landis, a control person of the Adviser, owned 73% of the outstanding shares of the Fund.
5. Derivatives Transactions
The Fund’s position in derivative instruments as of May 31, 2014 are recorded in the following location in the Statement of Assets and Liabilities:
| Derivative Investment Type | Location |
| Futures contracts | Variation Margin Payable |
17
WAVELENGTH INTEREST RATE NEUTRAL FUND
NOTES TO FINANCIAL STATEMENTS (Continued)
NOTES TO FINANCIAL STATEMENTS (Continued)
The following table sets forth the values of futures contracts of the Fund as of May 31, 2014:
| Variation Margin | ||||||||||||
| Receivable | (Payable) | Total | ||||||||||
| Asset Derivatives | ||||||||||||
| Futures Contracts | ||||||||||||
| Index | $ | 430 | $ | (2,156 | ) | $ | (1,726 | ) | ||||
| Treasury | — | (1,125 | ) | (1,125 | ) | |||||||
| Total Asset Derivatives | $ | 430 | $ | (3,281 | ) | $ | (2,851 | ) | ||||
Transactions in derivative instruments for the Fund during the period ended May 31, 2014 are recorded in the following location in the Statement of Operations:
| Derivative Investment Type | Location |
| Futures contracts | Net realized gains from futures contracts |
| Net change in unrealized appreciation/depreciation on futures contracts |
The following is a summary of net realized gains and net change in unrealized appreciation/depreciation on derivative instruments for the Fund recognized in the Statement of Operations during the period ended May 31, 2014:
| Type of Derivative | Net Realized Gains | Net Change in Unrealized Appreciation/ Depreciation | ||||||
| Futures Contracts | ||||||||
| Index | $ | — | $ | 7,446 | ||||
| Treasury | 13,061 | 2,687 | ||||||
| Total Futures Contracts | $ | 13,061 | $ | 10,133 | ||||
The average monthly notional amount of futures contracts purchased during the period ended May 31, 2014, was $529,525, and the gross notional amount of futures contracts outstanding at May 31, 2014 was $1,733,524.
18
WAVELENGTH INTEREST RATE NEUTRAL FUND
NOTES TO FINANCIAL STATEMENTS (Continued)
NOTES TO FINANCIAL STATEMENTS (Continued)
In the ordinary course of business, the Fund may enter into transactions subject to enforceable netting agreements or other similar arrangements (“netting agreements”). Generally, the right to offset in netting agreements allows the Fund to offset any exposure to a specific counterparty with any collateral received or delivered to that counterparty based on the terms of the agreements. Generally, the Fund manages its cash collateral securities and securities collateral on a counterparty basis. As of May 31, 2014, the offsetting of financial assets and derivatives assets is as follows:
| Description | Gross Amounts of Recognized Assets | Gross Amounts Offset in Statement of Assets and Liabilities | Net Amounts of Assets Presented in Statement of Assets and Liabilities | Collateral Pledged | Net Amount | |||||||||||||||
| Futures Contracts | $ | 430 | $ | (3,281 | ) | $ | (2,851 | ) | $ | 176,046 | $ | 173,195 | ||||||||
| Total subject to a master netting or similar arrangement | $ | 430 | $ | (3,281 | ) | $ | (2,851 | ) | $ | 176,046 | $ | 173,195 | ||||||||
6. Certain Investments and Risks
The securities in which the Fund invests, as well as the risks associated with these securities, are described in the Fund’s prospectus. Among these risks are those associated with investments in exchange-traded funds (“ETF”). Investments in ETFs are subject to the risk that the market price of an ETF’s shares may differ from its net asset value. This difference in price may be due to the fact that the supply and demand in the market for ETF shares at any point in time is not always identical to the supply and demand in the market for the underlying basket of securities. Accordingly, there may be times when an ETF trades at a premium (creating the risk that the Fund pays more than NAV for an ETF when making a purchase) or discount (creating the risks that the Fund’s NAV is reduced for undervalued ETFs it holds and that the Fund receives less than NAV when selling an ETF). Investments in ETFs are also subject to the risk that the ETF may not be able to replicate exactly the performance of the indices it tracks because the total return generated by the securities will be reduced by transaction costs incurred in adjusting the actual balance of the securities. In addition, an ETF in which the Fund invests may incur expenses not incurred by their applicable indices. Certain securities comprising the indices tracked by the ETF may, from time to time, temporarily be unavailable, which may further impede the ETF’s ability to track their applicable indices or match their performance. To the extent that the Fund invests in ETFs, there will be some duplication of expenses because the Fund would bear its pro-rata portion of such ETF’s advisory fees and operational expenses.
19
WAVELENGTH INTEREST RATE NEUTRAL FUND
NOTES TO FINANCIAL STATEMENTS (Continued)
NOTES TO FINANCIAL STATEMENTS (Continued)
7. Contingencies and Commitments
The Fund indemnifies the Trust’s officers and Trustees for certain liabilities that might arise from their performance of their duties to the Fund. Additionally, in the normal course of business the Fund enters into contracts that contain a variety of representations and warranties and which provide general indemnifications. The Fund’s maximum exposure under these arrangements is unknown, as this would involve future claims that may be made against the Fund that have not yet occurred. However, based on experience, the Fund expects the risk of loss to be remote.
8. Subsequent Events
The Fund is required to recognize in the financial statements the effects of all subsequent events that provide additional evidence about conditions that existed as of the date of the Statement of Assets and Liabilities. For non-recognized subsequent events that must be disclosed to keep the financial statements from being misleading, the Fund is required to disclose the nature of the event as well as an estimate of its financial effect, or a statement that such an estimate cannot be made. Management has evaluated subsequent events through the issuance of these financial statements and has noted no such events.
20
WAVELENGTH INTEREST RATE NEUTRAL FUND
REPORT OF INDEPENDENT REGISTERED
PUBLIC ACCOUNTING FIRM
REPORT OF INDEPENDENT REGISTERED
PUBLIC ACCOUNTING FIRM
To the Board of Trustees of Ultimus Managers Trust
and the Shareholders of Wavelength Interest Rate Neutral Fund
and the Shareholders of Wavelength Interest Rate Neutral Fund
We have audited the accompanying statement of assets and liabilities of the Wavelength Interest Rate Neutral Fund (the “Fund”), a series of shares of beneficial interest in the Ultimus Managers Trust, including the schedule of investments, as of May 31, 2014, and the related statements of operations and changes in net assets and the financial highlights for the period September 30, 2013 (commencement of operations) through May 31, 2014. These financial statements and financial highlights are the responsibility of the Fund’s management. Our responsibility is to express an opinion on these financial statements and financial highlights based on our audit.
We conducted our audit in accordance with the standards of the Public Company Accounting Oversight Board (United States). Those standards require that we plan and perform the audit to obtain reasonable assurance about whether the financial statements and financial highlights are free of material misstatement. An audit includes examining, on a test basis, evidence supporting the amounts and disclosures in the financial statements. Our procedures included confirmation of securities owned as of May 31, 2014 by correspondence with the custodian and brokers. An audit also includes assessing the accounting principles used and significant estimates made by management, as well as evaluating the overall financial statement presentation. We believe that our audit provides a reasonable basis for our opinion.
In our opinion, the financial statements and financial highlights referred to above present fairly, in all material respects, the financial position of the Wavelength Interest Rate Neutral Fund as of May 31, 2014, and the results of its operations, the changes in its net assets and its financial highlights for the period September 30, 2013 through May 31, 2014, in conformity with accounting principles generally accepted in the United States of America.
| |
| BBD, LLP |
Philadelphia, Pennsylvania
July 24, 2014
July 24, 2014
21
WAVELENGTH INTEREST RATE NEUTRAL FUND
ABOUT YOUR FUND’S EXPENSES (Unaudited)
ABOUT YOUR FUND’S EXPENSES (Unaudited)
We believe it is important for you to understand the impact of costs on your investment. As a shareholder of the Fund, you incur ongoing costs, including management fees and other operating expenses. The following examples are intended to help you understand your ongoing costs (in dollars) of investing in the Fund and to compare these costs with the ongoing costs of investing in other mutual funds.
A mutual fund’s ongoing costs are expressed as a percentage of its average net assets. This figure is known as the expense ratio. The expenses in the table below are based on an investment of $1,000 made at the beginning of the most recent period (December 1, 2013) and held until the end of the period (May 31, 2014).
The table below illustrates the Fund’s ongoing costs in two ways:
Actual fund return – This section helps you to estimate the actual expenses that you paid over the period. The “Ending Account Value” shown is derived from the Fund’s actual return, and the third column shows the dollar amount of operating expenses that would have been paid by an investor who started with $1,000 in the Fund. You may use the information here, together with the amount you invested, to estimate the expenses that you paid over the period.
To do so, simply divide your account value by $1,000 (for example, an $8,600 account value divided by $1,000 = 8.6), then multiply the result by the number given for the Fund under the heading “Expenses Paid During Period.”
Hypothetical 5% return – This section is intended to help you compare the Fund’s ongoing costs with those of other mutual funds. It assumes that the Fund had an annual return of 5% before expenses during the period shown, but that the expense ratio is unchanged. In this case, because the return used is not the Fund’s actual return, the results do not apply to your investment. The example is useful in making comparisons because the SEC requires all mutual funds to calculate expenses based on a 5% return. You can assess the Fund’s ongoing costs by comparing this hypothetical example with the hypothetical examples that appear in shareholder reports of other funds.
Note that expenses shown in the table are meant to highlight and help you compare ongoing costs only. The Fund does not charge transaction fees, such as purchase or redemption fees, nor does it carry a “sales load.”
The calculations assume no shares were bought or sold during the period. Your actual costs may have been higher or lower, depending on the amount of your investment and the timing of any purchases or redemptions.
22
WAVELENGTH INTEREST RATE NEUTRAL FUND
ABOUT YOUR FUND’S EXPENSES (Unaudited) (Continued)
ABOUT YOUR FUND’S EXPENSES (Unaudited) (Continued)
More information about the Fund’s expenses can be found in this report. For additional information on operating expenses and other shareholder costs, please refer to the Fund’s prospectus.
Beginning Account Value December 1, 2013 | Ending Account Value May 31, 2014 | Expenses Paid During Period* | |
| Based on Actual Fund Return | $1,000.00 | $1,045.20 | $5.05 |
| Based on Hypothetical 5% Return (before expenses) | $1,000.00 | $1,020.00 | $4.99 |
| * | Expenses are equal to the Fund’s annualized expense ratio of 0.99% for the period, multiplied by the average account value over the period, multiplied by 182/365 (to reflect the one-half year period). |
OTHER INFORMATION (Unaudited)
A description of the policies and procedures that the Fund uses to vote proxies relating to portfolio securities is available without charge upon request by calling toll-free 1-866-896-9292, or on the SEC’s website at http://www.sec.gov. Information regarding how the Fund voted proxies relating to portfolio securities during the most recent period ended June 30 is available without charge upon request by calling toll-free 1-866-896-9292, or on the SEC’s website at http://www.sec.gov.
The Trust files a complete listing of portfolio holdings for the Fund with the SEC as of the end of the first and third quarters of each fiscal year on Form N-Q. These filings are available upon request by calling 1-866-896-9292. Furthermore, you may obtain a copy of the filings on the SEC’s website at http://www.sec.gov. The Trust’s Forms N-Q may also be reviewed and copied at the SEC’s Public Reference Room in Washington, DC, and information on the operation of the Public Reference Room may be obtained by calling 1-800-SEC-0330.
23
WAVELENGTH INTEREST RATE NEUTRAL FUND
BOARD OF TRUSTEES AND EXECUTIVE OFFICERS (Unaudited)
BOARD OF TRUSTEES AND EXECUTIVE OFFICERS (Unaudited)
The Board of Trustees has overall responsibility for management of the Trust’s affairs. The Trustees serve during the lifetime of the Trust and until its termination, or until death, resignation, retirement, or removal. The Trustees, in turn, elect the officers of the Fund to actively supervise its day-to-day operations. The officers have been elected for an annual term. Unless otherwise noted, each Trustee’s and officer’s address is 225 Pictoria Drive, Suite 450, Cincinnati, OH 45246. The following are the Trustees and executive officers of the Fund:
Name and Year of Birth | Length of Time Served | Position(s) Held with Trust | Principal Occupation(s) During Past 5 Years | Number of Funds in Trust Overseen by Trustee | Directorships of Public Companies Held by Trustee During Past 5 Years |
| Interested Trustees: | |||||
Robert G. Dorsey* Year of Birth: 1957 | Since February 2012 June 2012 to October 2013 | Trustee President | Managing Director of Ultimus Fund Solutions, LLC and Ultimus Fund Distributors, LLC (1999 to present) | 7 | None |
| Independent Trustees: | |||||
John C. Davis Year of Birth: 1952 | Since July 2014 Since June 2012 | Chairman Trustee | Consultant ( government services) since May 2011; Retired Partner of PricewaterhouseCoopers LLP (1974-2010) | 7 | None |
John J. Discepoli Year of Birth: 1963 | Since June 2012 | Trustee | Owner of Discepoli Financial Planning, LLC (personal financial planning company) since November 2004 | 7 | None |
David M. Deptula Year of Birth: 1958 | Since June 2012 | Trustee | Vice President of Tax at The Standard Register Company since November 2011; Tax Partner at Deloitte Tax LLP from 1984 to 2011 | 7 | None |
| * | Mr. Dorsey is considered an “interested person” of the Trust within the meaning of Section 2(a)(19) of the 1940 Act because of his relationship with the Trust’s administrator, transfer agent and distributor. |
24
WAVELENGTH INTEREST RATE NEUTRAL FUND
BOARD OF TRUSTEES AND EXECUTIVE OFFICERS (Unaudited) (Continued)
BOARD OF TRUSTEES AND EXECUTIVE OFFICERS (Unaudited) (Continued)
Name and Year of Birth | Length of Time Served | Position(s) Held with Trust | Principal Occupation(s) During Past 5 Years |
| Executive Officers: | |||
David R. Carson Year of Birth: 1958 | Since October 2013 April 2013 to October 2013 | President Vice President | Vice President and Director of Client Strategies of Ultimus Fund Solutions, LLC (2013 to present); Chief Compliance Officer, The Huntington Funds (2005 to 2013), The Flex-Funds (2006 to 2011), Meeder Financial (2007 to 2011), Huntington Strategy Shares (2012 to 2013), and Huntington Asset Advisors (2013); Vice President, Huntington National Bank (2001 to 2013). |
Andrew Dassori 215 Park Avenue South, Suite 1902 New York, NY 10003 Year of Birth: 1984 | Since July 2013 | Principal Executive Officer of Wavelength Interest Rate Neutral Fund | Managing Member and Chief Compliance Officer of Wavelength Capital Management, LLC (2013 to present); Formerly, Portfolio Manager, Credit Suisse Asset Management LLC (2007 to 2013) |
Mark J. Seger Year of Birth: 1962 | Since February 2014 | Treasurer | Managing Director of Ultimus Fund Solutions, LLC and Ultimus Fund Distributors, LLC (1999 to present) |
Frank L. Newbauer Year of Birth: 1954 | Since February 2012 | Secretary | Assistant Vice President of Ultimus Fund Solutions, LLC and Ultimus Fund Distributors, LLC (2010 to present); Assistant Vice President of JPMorgan Chase Bank, N.A. (1999 to 2010) |
Stephen L. Preston Year of Birth: 1966 | Since June 2012 | Chief Compliance Officer | Assistant Vice President and Chief Compliance Officer of Ultimus Fund Distributors, LLC and Assistant Vice President of Ultimus Fund Solutions, LLC since 2011; Senior Consultant at Mainstay Capital Markets Consultants (2010 to 2011); Chief Compliance Officer at INTL Trading, Inc. (2008 to 2010. |
Additional information about members of the Board and executive officers is available in the Fund’s Statement of Additional Information (“SAI”). To obtain a free copy of the SAI, please call 1-866-896-9292.
25
| Item 2. | Code of Ethics. |
As of the end of the period covered by this report, the registrant has adopted a code of ethics that applies to the registrant’s principal executive officer, principal financial officer, principal accounting officer or controller, or persons performing similar functions, regardless of whether these individuals are employed by the registrant or a third party. Pursuant to Item 12(a)(1), a copy of registrant’s code of ethics is filed as an exhibit to this Form N-CSR. During the period covered by this report, the code of ethics has not been amended, and the registrant has not granted any waivers, including implicit waivers, from the provisions of the code of ethics.
| Item 3. | Audit Committee Financial Expert. |
The registrant’s board of trustees has determined that the registrant has at least one audit committee financial expert serving on its audit committee. The names of the audit committee financial experts are John C. Davis and David M. Deptula. Messrs. Davis and Deptula are “independent” for purposes of this Item.
| Item 4. | Principal Accountant Fees and Services. |
| (a) | Audit Fees. The aggregate fees billed for professional services rendered by the principal accountant for the audit of the registrant’s annual financial statements or for services that are normally provided by the accountant in connection with statutory and regulatory filings or engagements were $50,000 and $39,000 with respect to the registrant’s fiscal years ended May 31, 2014 and 2013, respectively. |
| (b) | Audit-Related Fees. No fees were billed in the last fiscal year for assurance and related services by the principal accountant that are reasonably related to the performance of the audit of the registrant’s financial statements and are not reported under paragraph (a) of this Item. |
| (c) | Tax Fees. The aggregate fees billed for professional services rendered by the principal accountant for tax compliance, tax advice, and tax planning were $10,000 with respect to the registrant’s fiscal year ended May 31, 2014. The services comprising these fees are the preparation of the registrant’s federal income and excise tax returns. |
| (d) | All Other Fees. No fees were billed in the last fiscal year for products and services provided by the principal accountant, other than the services reported in paragraphs (a) through (c) of this Item. |
| (e)(1) | The audit committee has not adopted pre-approval policies and procedures described in paragraph (c)(7) of Rule 2-01 of Regulation S-X. |
| (e)(2) | None of the services described in paragraph (b) through (d) of this Item were approved by the audit committee pursuant to paragraph (c)(7)(i)(C) of Rule 2-01 of Regulation S-X. |
| (f) | Less than 50% of hours expended on the principal accountant’s engagement to audit the registrant’s financial statements for the most recent fiscal year were attributed to work performed by persons other than the principal accountant’s full-time, permanent employees. |
| (g) | During the fiscal years ended May 31, 2014 and 2013, aggregate non-audit fees of $10,000 and $6,000, respectively, were billed by the registrant’s principal accountant for services rendered to the registrant. No non-audit fees were billed in the last fiscal year by the registrant’s principal accountant for services rendered to the registrant’s investment adviser (not including any sub-adviser whose role is primarily portfolio management and is subcontracted with or overseen by another investment adviser), and any entity controlling, controlled by, or under common control with the adviser that provides ongoing services to the registrant. |
| (h) | The principal accountant has not provided any non-audit services to the registrant’s investment adviser (not including any sub-adviser whose role is primarily portfolio management and is subcontracted with or overseen by another investment adviser), and any entity controlling, controlled by, or under common control with the investment adviser that provides ongoing services to the registrant. |
| Item 5. | Audit Committee of Listed Registrants. |
Not applicable
| Item 6. | Schedule of Investments. |
| (a) | Not applicable [schedule filed with Item 1] |
| (b) | Not applicable |
| Item 7. | Disclosure of Proxy Voting Policies and Procedures for Closed-End Management Investment Companies. |
Not applicable
| Item 8. | Portfolio Managers of Closed-End Management Investment Companies. |
Not applicable
| Item 9. | Purchases of Equity Securities by Closed-End Management Investment Company and Affiliated Purchasers. |
Not applicable
| Item 10. | Submission of Matters to a Vote of Security Holders. |
The registrant’s Committee of Independent Trustees shall review shareholder recommendations to fill vacancies on the registrant’s board of trustees if such recommendations are submitted in writing, addressed to the Committee at the registrant’s offices and meet any minimum qualifications adopted by the Committee. The Committee may adopt, by resolution, a policy regarding its procedures for considering candidates for the board of trustees, including any recommended by shareholders.
| Item 11. | Controls and Procedures. |
(a) Based on their evaluation of the registrant’s disclosure controls and procedures (as defined in Rule 30a-3(c) under the Investment Company Act of 1940) as of a date within 90 days of the filing date of this report, the registrant’s principal executive officer and principal financial officer have concluded that such disclosure controls and procedures are reasonably designed and are operating effectively to ensure that material information relating to the registrant, including its consolidated subsidiaries, is made known to them by others within those entities, particularly during the period in which this report is being prepared, and that the information required in filings on Form N-CSR is recorded, processed, summarized, and reported on a timely basis.
(b) There were no changes in the registrant’s internal control over financial reporting (as defined in Rule 30a-3(d) under the Investment Company Act of 1940) that occurred during the second fiscal quarter of the period covered by this report that have materially affected, or are reasonably likely to materially affect, the registrant’s internal control over financial reporting.
| Item 12. | Exhibits. |
File the exhibits listed below as part of this Form. Letter or number the exhibits in the sequence indicated.
(a)(1) Any code of ethics, or amendment thereto, that is the subject of the disclosure required by Item 2, to the extent that the registrant intends to satisfy the Item 2 requirements through filing of an exhibit: Attached hereto
(a)(2) A separate certification for each principal executive officer and principal financial officer of the registrant as required by Rule 30a-2(a) under the Act (17 CFR 270.30a-2(a)): Attached hereto
(a)(3) Any written solicitation to purchase securities under Rule 23c-1 under the Act (17 CFR 270.23c-1) sent or given during the period covered by the report by or on behalf of the registrant to 10 or more persons: Not applicable
(b) Certifications required by Rule 30a-2(b) under the Act (17 CFR 270.30a-2(b)): Attached hereto
| Exhibit 99.CODE ETH | Code of Ethics |
| Exhibit 99.CERT | Certifications required by Rule 30a-2(a) under the Act |
| Exhibit 99.906CERT | Certifications required by Rule 30a-2(b) under the Act |
SIGNATURES
Pursuant to the requirements of the Securities Exchange Act of 1934 and the Investment Company Act of 1940, the registrant has duly caused this report to be signed on its behalf by the undersigned, thereunto duly authorized.
| (Registrant) | Ultimus Managers Trust | |
| By (Signature and Title)* | /s/ Frank L. Newbauer | |
| Frank L. Newbauer, Secretary | ||
| Date | August 1, 2014 | |
| Pursuant to the requirements of the Securities Exchange Act of 1934 and the Investment Company Act of 1940, this report has been signed below by the following persons on behalf of the registrant and in the capacities and on the dates indicated. | ||
| By (Signature and Title)* | /s/ Nitin N. Kumbhani | |
Nitin N. Kumbhani, Principal Executive Officer (APEXcm Small/Mid Cap Growth Fund) | ||
| Date | August 1, 2014 | |
| By (Signature and Title)* | /s/ William S. Sloneker | |
William S. Sloneker, Principal Executive Officer (Cincinnati Asset Management Funds: Broad Market Strategic Income Fund) | ||
| Date | August 1, 2014 | |
| By (Signature and Title)* | /s/ Nicholas Chermayeff | |
Nicholas Chermayeff, Principal Executive Officer (Barrow All-Cap Core Fund and Barrow All-Cap Long/Short Fund) | ||
| Date | August 1, 2014 | |
| By (Signature and Title)* | /s/ Andrew G. Dassori | |
Andrew G. Dassori, Principal Executive Officer (Wavelength Interest Rate Neutral Fund) | ||
| Date | August 1, 2014 | |
| By (Signature and Title)* | /s/ Mark J. Seger | |
| Mark J. Seger, Treasurer | ||
| Date | August 1, 2014 |
| * | Print the name and title of each signing officer under his or her signature. |