| OMB APPROVAL |
OMB Number: 3235-0570
Expires: July 31, 2022
Estimated average burden hours per response: 20.6 |
UNITED STATES
SECURITIES AND EXCHANGE COMMISSION
Washington, D.C. 20549
FORM N-CSR
CERTIFIED SHAREHOLDER REPORT OF REGISTERED
MANAGEMENT INVESTMENT COMPANIES
| Investment Company Act file number | 811-22680 |
| Ultimus Managers Trust |
| (Exact name of registrant as specified in charter) |
| 225 Pictoria Drive, Suite 450 Cincinnati, Ohio | 45246 |
| (Address of principal executive offices) | (Zip code) |
Matthew J. Beck, esq.
| Ultimus Fund Solutions, LLC 225 Pictoria Drive, Suite 450 Cincinnati, Ohio 45246_ |
| (Name and address of agent for service) |
| Registrant's telephone number, including area code: | (513) 587-3400 |
| Date of fiscal year end: | February 28 | |
| Date of reporting period: | February 28, 2021 |
Form N-CSR is to be used by management investment companies to file reports with the Commission not later than 10 days after the transmission to stockholders of any report that is required to be transmitted to stockholders under Rule 30e-1 under the Investment Company Act of 1940 (17 CFR 270.30e-1). The Commission may use the information provided on Form N-CSR in its regulatory, disclosure review, inspection, and policymaking roles.
A registrant is required to disclose the information specified by Form N-CSR, and the Commission will make this information public. A registrant is not required to respond to the collection of information contained in Form N-CSR unless the Form displays a currently valid Office of Management and Budget ("OMB") control number. Please direct comments concerning the accuracy of the information collection burden estimate and any suggestions for reducing the burden to the Secretary, Securities and Exchange Commission, 450 Fifth Street, NW, Washington, DC 20549-0609. The OMB has reviewed this collection of information under the clearance requirements of 44 U.S.C. § 3507.
| Item 1. | Reports to Stockholders. |
| (a) |

BLUEPRINT GROWTH FUND
Investor Class (BLUPX)
Institutional Class (BLUIX)
Annual Report
February 28, 2021
| BLUEPRINT GROWTH FUND | |
| LETTER TO SHAREHOLDERS | March 15, 2021 |
Dear Shareholders,
Our last letter in the third quarter of 2020 had us all gripped by ever-climbing COVID-19 case rates and the prospect of a contested election lingering deep into the new year. Fortunately, extraordinary vaccine efforts combined with a society successfully adapting to the pandemic led to virus rates falling significantly as we enter warmer weather and hopefully even lower case and hospitalization rates. Likewise, the election resulted in a relatively smooth transition, creating certainty which the markets love.
Since last August, the Blueprint Growth Fund has been positioned to take advantage of advancing global equities and falling fixed income prices. Aside from a pre-election spike in volatility which caused the Fund to slightly increase its defensive measures, the Fund has since been decidedly ‘pro-equities’ in its portfolio allocation. As of the time of this letter, this is still the case as we enter March with no interruption in site.
As of February 28, the Institutional Class is up 20.8% since inception (March 31, 2020) versus the Morningstar Global Allocation Total Return Index (the Fund’s benchmark) return of 31.7%. As explained in our last letter, the gap between the Fund and chosen benchmark is explained by the Fund initially launching in a full defensive posture in reaction to the pandemic-induced decline in equities in the first quarter of 2020. As markets rebounded the Fund adapted to take advantage of advancing trends that have remained in place to now. Also like our last letter, the top and bottom performers are largely the same with the top Fund performers coming from equity markets, namely the iShares Core S&P Total Market ETF, the iShares Core MSCI Emerging Market ETF and iShares Core MSCI Total International ETF. Lagging performers have come from alternative and fixed income asset classes.
Looking ahead, the key market drivers will continue to be the outcome of vaccine deployment across the globe and whether any virus variants undermine that process. Inflation has also emerged as a real threat as unprecedented stimulus boosts consumer spending already poised to rebound sharply after a year of lockdown induced suppression. The current state of trends is favorable for equities and less so for fixed income. The Blueprint Growth Fund has been positioned to benefit from these trends for quite some time and will continue to be until asset prices indicate otherwise. We feel this adaptive approach, while not designed to respond to every gyration in the market, will ultimately provide superior long-term performance in a path that is more palatable for shareholders.
Thank you for your continued confidence and support of the Blueprint Growth Fund.
Best,
 |  |
| Jon Robinson | Brandon Langley |
Blueprint Fund Management, LLC
www.blueprintmutualfunds.com
1
Past performance is not predictive of future performance. Investment results and principal value will fluctuate so that shares, when redeemed, may be worth more or less than their original cost. Current performance may be higher or lower than the performance data quoted. Performance data current to the most recent month-end are available by calling 1-866-983-4525.
An investor should consider the investment objectives, risks, charges, and expenses of the Fund carefully before investing. The Fund’s prospectus contains this and other important information. To obtain a copy of the Fund’s prospectus please visit the Fund’s website at www.blueprintmutualfunds.com or call 1-866-983-4525 and a copy will be sent to you free of charge. Please read the prospectus carefully before you invest. The Fund is distributed by Ultimus Fund Distributors, LLC.
The Letter to Shareholders seeks to describe some of the Adviser’s current opinions and views of the financial markets. Although the Adviser believes it has a reasonable basis for any opinions or views expressed, actual results may differ, sometimes significantly so, from those expected or expressed. The securities held by the Fund that are discussed in the Letter to Shareholders were held during the period covered by this Report. They do not comprise the entire investment portfolio of the Fund, may be sold at any time, and may no longer be held by the Fund. For a complete list of securities held by the Fund as of February 28, 2021, please see the Schedule of Investments section of the annual report. The opinions of the Fund’s adviser with respect to those securities may change at any time.
2
| BLUEPRINT GROWTH FUND |
| PERFORMANCE INFORMATION |
| February 28, 2021 (Unaudited) |
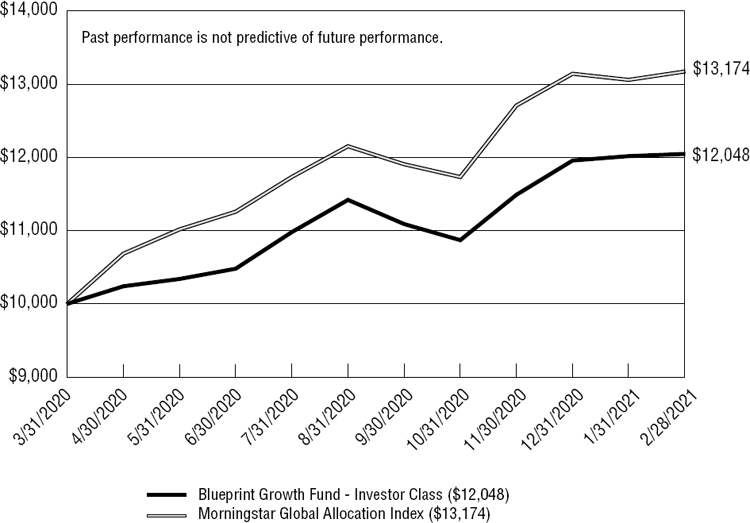
Comparison of the Change in Value of a $10,000 Investment in
Blueprint Growth Fund - Investor Class (a) versus the Morningstar
Global Allocation Index
| Total Returns (b) | ||
| (for the period ended February 28, 2021) | ||
| Since | ||
| Inception | ||
| (3/31/2020) | ||
| Blueprint Growth Fund - Investor Class | 20.48% | |
| Blueprint Growth Fund - Institutional Class | 20.80% | |
| Morningstar Global Allocation Index (c) | 31.74% | |
| (a) | The line graph above represents performance of the Investor Class only, which will vary from the performance of the Institutional Class based on the difference in fees paid by shareholders in the different classes. |
| (b) | The Fund’s total returns do not reflect the deduction of taxes a shareholder would pay on Fund distributions or the redemption of Fund shares. |
| (c) | The Morningstar Global Allocation Index measures the performance of a multi-asset class portfolio of global equities, global bonds and cash. This portfolio is held in a static allocation that is appropriate for investors who seek average exposure to global equity market risk and returns. |
3
| BLUEPRINT GROWTH FUND |
| PORTFOLIO INFORMATION |
| February 28, 2021 (Unaudited) |
Sector Diversification (% of Net Assets)

| Top 10 Equity Holdings | |
| % of | |
| Net Assets | |
| iShares Core MSCI Emerging Markets ETF | 15.2% |
| Vanguard FTSE Developed Markets ETF | 14.6% |
| iShares Core S&P Total U.S. Stock Market ETF | 7.7% |
| Vanguard Small-Cap ETF | 4.3% |
| Microsoft Corporation | 3.9% |
| ProShares VIX Short-Term Futures ETF | 3.8% |
| Apple, Inc. | 3.8% |
| iShares TIPS Bond ETF | 3.1% |
| iShares Gold Trust | 2.6% |
| Amazon.com, Inc. | 1.6% |
4
| BLUEPRINT GROWTH FUND |
| SCHEDULE OF INVESTMENTS |
| February 28, 2021 |
| COMMON STOCKS — 44.8% | Shares | Value | ||||||
| Communications — 5.2% | ||||||||
| Cable & Satellite — 0.6% | ||||||||
| Charter Communications, Inc. - Class A (a) | 97 | $ | 59,502 | |||||
| Comcast Corporation - Class A | 5,430 | 286,269 | ||||||
| 345,771 | ||||||||
| Entertainment Content — 0.7% | ||||||||
| Walt Disney Company (The) (a) | 2,070 | 391,313 | ||||||
| Internet Media & Services — 3.9% | ||||||||
| Alphabet, Inc. - Class A (a) | 320 | 647,011 | ||||||
| Alphabet, Inc. - Class C (a) | 307 | 625,316 | ||||||
| Booking Holdings, Inc. (a) | 47 | 109,440 | ||||||
| Facebook, Inc. - Class A (a) | 1,540 | 396,735 | ||||||
| Netflix, Inc. (a) | 516 | 278,047 | ||||||
| 2,056,549 | ||||||||
| Consumer Discretionary — 4.5% | ||||||||
| Apparel & Textile Products — 0.4% | ||||||||
| NIKE, Inc. - Class B | 1,650 | 222,387 | ||||||
| Automotive — 1.4% | ||||||||
| Ford Motor Company (a) | 3,722 | 43,547 | ||||||
| General Motors Company | 1,287 | 66,062 | ||||||
| Tesla, Inc. (a) | 921 | 622,136 | ||||||
| 731,745 | ||||||||
| E-Commerce Discretionary — 1.6% | ||||||||
| Amazon.com, Inc. (a) | 274 | 847,463 | ||||||
| Leisure Facilities & Services — 0.5% | ||||||||
| McDonald’s Corporation | 466 | 96,061 | ||||||
| Starbucks Corporation | 1,437 | 155,239 | ||||||
| 251,300 | ||||||||
| Retail - Discretionary — 0.6% | ||||||||
| Home Depot, Inc. (The) | 714 | 184,455 | ||||||
| Lowe’s Companies, Inc. | 945 | 150,963 | ||||||
| 335,418 | ||||||||
| Consumer Staples — 1.6% | ||||||||
| Beverages — 0.2% | ||||||||
| Coca-Cola Company (The) | 2,625 | 128,599 | ||||||
5
| BLUEPRINT GROWTH FUND |
| SCHEDULE OF INVESTMENTS (Continued) |
| COMMON STOCKS — 44.8% (Continued) | Shares | Value | ||||||
| Consumer Staples — 1.6% (Continued) | ||||||||
| Food — 0.1% | ||||||||
| Kraft Heinz Company (The) | 187 | $ | 6,803 | |||||
| Mondelez International, Inc. - Class A | 1,007 | 53,532 | ||||||
| 60,335 | ||||||||
| Household Products — 0.1% | ||||||||
| Colgate-Palmolive Company | 570 | 42,864 | ||||||
| Retail - Consumer Staples — 0.7% | ||||||||
| Costco Wholesale Corporation | 308 | 101,948 | ||||||
| Target Corporation | 585 | 107,312 | ||||||
| Walgreen Boots Alliance, Inc. | 789 | 37,817 | ||||||
| Walmart, Inc. | 955 | 124,074 | ||||||
| 371,151 | ||||||||
| Tobacco & Cannabis — 0.5% | ||||||||
| Altria Group, Inc. | 2,223 | 96,923 | ||||||
| Philip Morris International, Inc. | 1,913 | 160,730 | ||||||
| 257,653 | ||||||||
| Energy — 1.0% | ||||||||
| Oil & Gas Producers — 0.9% | ||||||||
| Chevron Corporation | 2,074 | 207,400 | ||||||
| ConocoPhillips | 1,041 | 54,142 | ||||||
| Exxon Mobil Corporation | 4,015 | 218,296 | ||||||
| Kinder Morgan, Inc. | 1,101 | 16,185 | ||||||
| 496,023 | ||||||||
| Oil & Gas Services & Equipment — 0.1% | ||||||||
| Schlumberger Ltd. | 1,386 | 38,683 | ||||||
| Financials — 4.4% | ||||||||
| Asset Management — 0.2% | ||||||||
| BlackRock, Inc. | 179 | 124,315 | ||||||
| Banking — 2.2% | ||||||||
| Bank of America Corporation | 8,044 | 279,207 | ||||||
| Citigroup, Inc. | 2,369 | 156,070 | ||||||
| JPMorgan Chase & Company | 3,195 | 470,208 | ||||||
| U.S. Bancorp | 1,617 | 80,850 | ||||||
| Wells Fargo & Company | 4,324 | 156,399 | ||||||
| 1,142,734 | ||||||||
6
| BLUEPRINT GROWTH FUND |
| SCHEDULE OF INVESTMENTS (Continued) |
| COMMON STOCKS — 44.8% (Continued) | Shares | Value | ||||||
| Financials — 4.4% (Continued) | ||||||||
| Institutional Financial Services — 0.6% | ||||||||
| Bank of New York Mellon Corporation (The) | 1,024 | $ | 43,172 | |||||
| Goldman Sachs Group, Inc. (The) | 337 | 107,665 | ||||||
| Hong Kong Exchanges and Clearing Ltd. - ADR | 977 | 60,193 | ||||||
| Morgan Stanley | 1,550 | 119,148 | ||||||
| 330,178 | ||||||||
| Insurance — 1.1% | ||||||||
| Allstate Corporation (The) | 401 | 42,746 | ||||||
| American International Group, Inc. | 982 | 43,159 | ||||||
| Berkshire Hathaway, Inc. - Class B (a) | 1,845 | 443,741 | ||||||
| MetLife, Inc. | 751 | 43,258 | ||||||
| 572,904 | ||||||||
| Specialty Finance — 0.3% | ||||||||
| American Express Company | 721 | 97,523 | ||||||
| Capital One Financial Corporation | 459 | 55,167 | ||||||
| 152,690 | ||||||||
| Health Care — 4.6% | ||||||||
| Biotech & Pharma — 2.7% | ||||||||
| AbbVie, Inc. | 2,143 | 230,887 | ||||||
| Amgen, Inc. | 362 | 81,421 | ||||||
| Biogen, Inc. (a) | 79 | 21,558 | ||||||
| Bristol-Myers Squibb Company | 1,406 | 86,230 | ||||||
| Daiichi Sankyo Company Ltd. - ADR | 1,139 | 32,564 | ||||||
| Eli Lilly & Company | 798 | 163,502 | ||||||
| Johnson & Johnson | 3,133 | 496,455 | ||||||
| Novartis AG - ADR | 1,131 | 97,164 | ||||||
| Novo Nordisk A/S - ADR | 1,593 | 113,501 | ||||||
| Roche Holding AG - ADR | 2,383 | 97,941 | ||||||
| Viatris, Inc. (a) | 208 | 3,089 | ||||||
| 1,424,312 | ||||||||
| Health Care Facilities & Services — 0.6% | ||||||||
| CVS Health Corporation | 1,582 | 107,782 | ||||||
| UnitedHealth Group, Inc. | 598 | 198,667 | ||||||
| 306,449 | ||||||||
| Medical Equipment & Devices — 1.3% | ||||||||
| Abbott Laboratories | 1,979 | 237,045 | ||||||
| Danaher Corporation | 784 | 172,221 | ||||||
| Medtronic plc | 1,612 | 188,556 | ||||||
| Thermo Fisher Scientific, Inc. | 252 | 113,420 | ||||||
| 711,242 | ||||||||
7
| BLUEPRINT GROWTH FUND |
| SCHEDULE OF INVESTMENTS (Continued) |
| COMMON STOCKS — 44.8% (Continued) | Shares | Value | ||||||
| Industrials — 2.5% | ||||||||
| Aerospace & Defense — 0.6% | ||||||||
| Boeing Company (The) (a) | 686 | $ | 145,439 | |||||
| General Dynamics Corporation | 262 | 42,829 | ||||||
| Raytheon Technologies Corporation | 1,859 | 133,829 | ||||||
| 322,097 | ||||||||
| Diversified Industrials — 0.9% | ||||||||
| 3M Company | 703 | 123,067 | ||||||
| Emerson Electric Company | 331 | 28,433 | ||||||
| General Electric Company | 9,056 | 113,562 | ||||||
| Honeywell International, Inc. | 902 | 182,520 | ||||||
| 447,582 | ||||||||
| Electrical Equipment — 0.1% | ||||||||
| ABB Ltd. - ADR | 2,065 | 59,431 | ||||||
| Machinery — 0.2% | ||||||||
| Caterpillar, Inc. | 545 | 117,655 | ||||||
| Transportation & Logistics — 0.7% | ||||||||
| Canadian National Railway Company | 544 | 59,470 | ||||||
| FedEx Corporation | 320 | 81,440 | ||||||
| Union Pacific Corporation | 808 | 166,416 | ||||||
| United Parcel Service, Inc. - Class B | 480 | 75,758 | ||||||
| 383,084 | ||||||||
| Materials — 0.5% | ||||||||
| Chemicals — 0.2% | ||||||||
| Dow, Inc. | 907 | 53,794 | ||||||
| DuPont de Nemours, Inc. | 937 | 65,890 | ||||||
| 119,684 | ||||||||
| Metals & Mining — 0.3% | ||||||||
| BHP Group Ltd. - ADR | 993 | 75,379 | ||||||
| Rio Tinto plc - ADR | 865 | 75,601 | ||||||
| 150,980 | ||||||||
| Real Estate — 6.6% | ||||||||
| REITs — 6.6% | ||||||||
| Alexandria Real Estate Equities, Inc. | 671 | 107,152 | ||||||
| American Campus Communities, Inc. | 1,454 | 59,556 | ||||||
| AvalonBay Communities, Inc. | 1,219 | 214,239 | ||||||
| Boston Properties, Inc. | 649 | 64,335 | ||||||
| Cousins Properties, Inc. | 1,453 | 48,734 | ||||||
| Douglas Emmett, Inc. | 653 | 21,386 | ||||||
8
| BLUEPRINT GROWTH FUND |
| SCHEDULE OF INVESTMENTS (Continued) |
| COMMON STOCKS — 44.8% (Continued) | Shares | Value | ||||||
| Real Estate — 6.6% (Continued) | ||||||||
| REITs — 6.6% (Continued) | ||||||||
| Duke Realty Corporation | 3,549 | $ | 139,298 | |||||
| Equity LifeStyle Properties, Inc. | 782 | 48,210 | ||||||
| Equity Residential | 2,961 | 193,679 | ||||||
| Essex Property Trust, Inc. | 589 | 150,071 | ||||||
| Extra Space Storage, Inc. | 1,139 | 143,172 | ||||||
| Federal Realty Investment Trust | 589 | 59,589 | ||||||
| Healthpeak Properties, Inc. | 5,318 | 154,701 | ||||||
| Host Hotels & Resorts, Inc. | 5,921 | 98,229 | ||||||
| Invitation Homes, Inc. | 5,519 | 160,824 | ||||||
| Kilroy Realty Corporation | 425 | 26,971 | ||||||
| Prologis, Inc. | 3,813 | 377,754 | ||||||
| Public Storage | 1,416 | 331,259 | ||||||
| Realty Income Corporation | 1,685 | 101,538 | ||||||
| Regency Centers Corporation | 1,298 | 71,105 | ||||||
| Simon Property Group, Inc. | 2,246 | 253,618 | ||||||
| Sun Communities, Inc. | 1,020 | 154,989 | ||||||
| UDR, Inc. | 2,594 | 106,795 | ||||||
| Ventas, Inc. | 3,322 | 175,734 | ||||||
| Vornado Realty Trust | 645 | 27,696 | ||||||
| Welltower, Inc. | 3,749 | 254,557 | ||||||
| 3,545,191 | ||||||||
| Technology — 13.5% | ||||||||
| Semiconductors — 1.9% | ||||||||
| ASML Holding N.V. | 493 | 279,575 | ||||||
| NVIDIA Corporation | 738 | 404,852 | ||||||
| QUALCOMM, Inc. | 757 | 103,096 | ||||||
| Texas Instruments, Inc. | 1,077 | 185,535 | ||||||
| Tokyo Electron Ltd. - ADR | 630 | 66,150 | ||||||
| 1,039,208 | ||||||||
| Software — 4.7% | ||||||||
| Adobe, Inc. (a) | 330 | 151,691 | ||||||
| Microsoft Corporation | 9,022 | 2,096,532 | ||||||
| Oracle Corporation | 2,378 | 153,405 | ||||||
| salesforce.com, inc. (a) | 442 | 95,693 | ||||||
| 2,497,321 | ||||||||
9
| BLUEPRINT GROWTH FUND |
| SCHEDULE OF INVESTMENTS (Continued) |
| COMMON STOCKS — 44.8% (Continued) | Shares | Value | ||||||
| Technology — 13.5% (Continued) | ||||||||
| Technology Hardware — 4.3% | ||||||||
| Apple, Inc. | 16,519 | $ | 2,003,094 | |||||
| Cisco Systems, Inc. | 5,124 | 229,914 | ||||||
| Nintendo Company Ltd. - ADR | 923 | 71,182 | ||||||
| 2,304,190 | ||||||||
| Technology Services — 2.6% | ||||||||
| Accenture plc - Class A | 817 | 204,985 | ||||||
| Mastercard, Inc. - Class A | 1,050 | 371,543 | ||||||
| PayPal Holdings, Inc. (a) | 1,345 | 349,498 | ||||||
| Visa, Inc. - Class A | 2,062 | 437,948 | ||||||
| 1,363,974 | ||||||||
| Utilities — 0.4% | ||||||||
| Electric Utilities — 0.4% | ||||||||
| Duke Energy Corporation | 494 | 42,282 | ||||||
| Exelon Corporation | 692 | 26,711 | ||||||
| NextEra Energy, Inc. | 1,227 | 90,160 | ||||||
| Southern Company (The) | 654 | 37,095 | ||||||
| 196,248 | ||||||||
| Total Common Stocks (Cost $22,773,725) | $ | 23,888,723 | ||||||
10
| BLUEPRINT GROWTH FUND |
| SCHEDULE OF INVESTMENTS (Continued) |
| EXCHANGE-TRADED FUNDS — 54.0% | Shares | Value | ||||||
| iShares Core MSCI Emerging Markets ETF | 125,596 | $ | 8,129,829 | |||||
| iShares Core MSCI Total International Stock ETF | 10,593 | 730,070 | ||||||
| iShares Core S&P Total U.S. Stock Market ETF | 46,047 | 4,084,829 | ||||||
| iShares Core U.S. REIT ETF | 14,001 | 706,210 | ||||||
| iShares Gold Trust (a) | 85,382 | 1,403,680 | ||||||
| iShares TIPS Bond ETF | 13,066 | 1,644,095 | ||||||
| ProShares VIX Short-Term Futures ETF (a) | 156,718 | 2,045,170 | ||||||
| Vanguard FTSE Developed Markets ETF | 161,808 | 7,768,402 | ||||||
| Vanguard Small-Cap ETF | 10,889 | 2,295,837 | ||||||
| Total Exchange-Traded Funds (Cost $25,978,105) | $ | 28,808,122 | ||||||
| Investments at Value — 98.8% (Cost $48,751,830) | $ | 52,696,845 | ||||||
| Other Assets in Excess of Liabilities — 1.2% | 648,653 | |||||||
| Net Assets — 100.0% | $ | 53,345,498 | ||||||
| (a) | Non-income producing security. |
ADR - American Depositary Receipt.
See accompanying notes to financial statements.
11
| BLUEPRINT GROWTH FUND |
| STATEMENT OF ASSETS AND LIABILITIES |
| February 28, 2021 |
| ASSETS | ||||
| Investments: | ||||
| At cost | $ | 48,751,830 | ||
| At value (Note 2) | $ | 52,696,845 | ||
| Dividends receivable | 28,233 | |||
| Receivable for capital shares sold | 417,276 | |||
| Receivable for investment securities sold | 6,317,847 | |||
| Deferred offering costs (Note 2) | 9,900 | |||
| Other assets | 17,707 | |||
| Total assets | 59,487,808 | |||
| LIABILITIES | ||||
| Due to custodian | 325,758 | |||
| Payable for capital shares redeemed | 626,790 | |||
| Payable for investment securities purchased | 5,137,396 | |||
| Payable to the Adviser (Note 4) | 29,455 | |||
| Payable to administrator (Note 4) | 10,582 | |||
| Accrued distribution fees (Note 4) | 8 | |||
| Other accrued expenses and liabilities | 12,321 | |||
| Total liabilities | 6,142,310 | |||
| NET ASSETS | $ | 53,345,498 | ||
| NET ASSETS CONSIST OF: | ||||
| Paid-in capital | $ | 49,858,877 | ||
| Accumulated earnings | 3,486,621 | |||
| NET ASSETS | $ | 53,345,498 | ||
| NET ASSET VALUE PER SHARE: | ||||
| INVESTOR CLASS | ||||
| Net assets applicable to Investor Class | $ | 72,305 | ||
| Investor Class shares of beneficial interest outstanding (unlimited number of shares authorized, no par value) | 6,014 | |||
| Net asset value, offering price and redemption price per share (Note 2) | $ | 12.02 | ||
| INSTITUTIONAL CLASS | ||||
| Net assets applicable to Institutional Class | $ | 53,273,193 | ||
| Institutional Class shares of beneficial interest outstanding (unlimited number of shares authorized, no par value) | 4,422,922 | |||
| Net asset value, offering price and redemption price per share (Note 2) | $ | 12.04 | ||
See accompanying notes to financial statements.
12
| BLUEPRINT GROWTH FUND |
| STATEMENT OF OPERATIONS |
| Period Ended February 28, 2021 (a) |
| INVESTMENT INCOME | ||||
| Dividend income (net of foreign withholding taxes of $387) | $ | 323,602 | ||
| Interest | 459 | |||
| Total investment income | 324,061 | |||
| EXPENSES | ||||
| Investment advisory fees (Note 4) | 199,292 | |||
| Registration and filing fees | 34,110 | |||
| Fund accounting fees (Note 4) | 29,617 | |||
| Administration fees (Note 4) | 27,548 | |||
| Transfer agent fees - Investor Class (Note 4) | 11,000 | |||
| Transfer agent fees - Institutional Class (Note 4) | 12,500 | |||
| Legal fees | 22,886 | |||
| Offering costs (Note 2) | 19,800 | |||
| Trustees’ fees and expenses (Note 4) | 19,358 | |||
| Compliance service fees (Note 4) | 11,000 | |||
| Networking fees | 6,900 | |||
| Postage and supplies | 5,937 | |||
| Custodian and bank service fees | 5,698 | |||
| Insurance expense | 2,112 | |||
| Printing of shareholder reports | 1,097 | |||
| Distribution fees - Investor Class (Note 4) | 47 | |||
| Other expenses | 15,524 | |||
| Total expenses | 424,426 | |||
| Fee reductions by the Adviser (Note 4) | (141,841 | ) | ||
| Net expenses | 282,585 | |||
| NET INVESTMENT INCOME | 41,476 | |||
| REALIZED AND UNREALIZED GAINS (LOSSES) ON INVESTMENTS | ||||
| Net realized losses from investment transactions | (408,741 | ) | ||
| Net change in unrealized appreciation (depreciation) on investments | 3,945,015 | |||
| NET REALIZED AND UNREALIZED GAINS ON INVESTMENTS | 3,536,274 | |||
| NET INCREASE IN NET ASSETS RESULTING FROM OPERATIONS | $ | 3,577,750 | ||
| (a) | Represents the period from the commencement of operations (March 31, 2020) through February 28, 2021. |
See accompanying notes to financial statements.
13
| BLUEPRINT GROWTH FUND |
| STATEMENT OF CHANGES IN NET ASSETS |
| Period Ended | ||||
| February 28, | ||||
| 2021 (a) | ||||
| FROM OPERATIONS | ||||
| Net investment income | $ | 41,476 | ||
| Net realized losses from investment transactions | (408,741 | ) | ||
| Net change in unrealized appreciation (depreciation) on investments | 3,945,015 | |||
| Net increase in net assets resulting from operations | 3,577,750 | |||
| FROM DISTRIBUTIONS TO SHAREHOLDERS (Note 2) | ||||
| Investor Class | (63 | ) | ||
| Institutional Class | (111,204 | ) | ||
| Decrease in net assets from distributions to shareholders | (111,267 | ) | ||
| CAPITAL SHARE TRANSACTIONS | ||||
| Investor Class | ||||
| Proceeds from shares sold | 70,056 | |||
| Net asset value of shares issued in reinvestment of distributions to shareholders | 63 | |||
| Payments for shares redeemed | (64 | ) | ||
| Net increase in Investor Class net assets from capital share transactions | 70,055 | |||
| Institutional Class | ||||
| Proceeds from shares sold | 54,668,532 | |||
| Net asset value of shares issued in reinvestment of distributions to shareholders | 110,988 | |||
| Payments for shares redeemed | (4,970,560 | ) | ||
| Net increase in Institutional Class net assets from capital share transactions | 49,808,960 | |||
| TOTAL INCREASE IN NET ASSETS | 53,345,498 | |||
| NET ASSETS | ||||
| Beginning of period | — | |||
| End of period | $ | 53,345,498 | ||
14
| BLUEPRINT GROWTH FUND |
| STATEMENT OF CHANGES IN NET ASSETS (Continued) |
| Period Ended | ||||
| February 28, | ||||
| 2021 (a) | ||||
| CAPITAL SHARES ACTIVITY | ||||
| Investor Class | ||||
| Shares sold | 6,015 | |||
| Shares issued in reinvestment of distributions to shareholders | 5 | |||
| Shares redeemed | (6 | ) | ||
| Net increase in shares outstanding | 6,014 | |||
| Shares outstanding at beginning of period | — | |||
| Shares outstanding at end of period | 6,014 | |||
| Institutional Class | ||||
| Shares sold | 4,833,392 | |||
| Shares issued in reinvestment of distributions to shareholders | 9,319 | |||
| Shares redeemed | (419,789 | ) | ||
| Net increase in shares outstanding | 4,422,922 | |||
| Shares outstanding at beginning of period | — | |||
| Shares outstanding at end of period | 4,422,922 | |||
| (a) | Represents the period from the commencement of operations (March 31, 2020) through February 28, 2021. |
See accompanying notes to financial statements.
15
| BLUEPRINT GROWTH FUND |
| INVESTOR CLASS |
| FINANCIAL HIGHLIGHTS |
Per Share Data for a Share Outstanding Throughout the Period
| Period Ended | ||||
| February 28, | ||||
| 2021 (a) | ||||
| Net asset value at beginning of period | $ | 10.00 | ||
| Income (loss) from investment operations: | ||||
| Net investment loss (b) | (0.02 | ) | ||
| Net realized and unrealized gains on investments | 2.07 | |||
| Total from investment operations | 2.05 | |||
| Less distributions from: | ||||
| Net investment income | (0.03 | ) | ||
| Net asset value at end of period | $ | 12.02 | ||
| Total return (c) | 20.48 | % (d) | ||
| Net assets at end of period | $ | 72,305 | ||
| Ratios/supplementary data: | ||||
| Ratio of total expenses to average net assets (e) | 104.34 | % (f) | ||
| Ratio of net expenses to average net assets (e)(g) | 1.60 | % (f)(h) | ||
| Ratio of net investment loss to average net assets (g) | (0.16 | %) (f) | ||
| Portfolio turnover rate | 95 | % (d) | ||
| (a) | Represents the period from the commencement of operations (March 31, 2020) through February 28, 2021. |
| (b) | Per share net investment loss has been determined on the basis of average number of shares outstanding during the period. Recognition of net investment loss by the Fund is affected by the timing of the declaration of the dividends by the underlying companies in which the Fund invests. |
| (c) | Total return is a measure of the change in value of an investment in the Fund over the period covered. The return shown does not reflect the deduction of taxes a shareholder would pay on Fund distributions, if any, or the redemption of Fund shares. The total return would have been lower had the Adviser not reduced advisory fees and reimbursed expenses (Note 4). |
| (d) | Not annualized. |
| (e) | Ratio does not include expenses of the investment companies in which the Fund invests. |
| (f) | Annualized. |
| (g) | Ratio was determined after advisory fees reductions and expense reimbursements (Note 4). |
| (h) | Includes costs to organize the Fund of 0.10% which are excluded from the Expense Limitation Agreement (Note 4). |
See accompanying notes to financial statements.
16
| BLUEPRINT GROWTH FUND |
| INSTITUTIONAL CLASS |
| FINANCIAL HIGHLIGHTS |
Per Share Data for a Share Outstanding Throughout the Period
| Period Ended | ||||
| February 28, | ||||
| 2021 (a) | ||||
| Net asset value at beginning of period | $ | 10.00 | ||
| Income from investment operations: | ||||
| Net investment income (b) | 0.02 | |||
| Net realized and unrealized gains on investments | 2.06 | |||
| Total from investment operations | 2.08 | |||
| Less distributions from: | ||||
| Net investment income | (0.04 | ) | ||
| Net asset value at end of period | $ | 12.04 | ||
| Total return (c) | 20.80 | % (d) | ||
| Net assets at end of period (000’s) | $ | 53,273 | ||
| Ratios/supplementary data: | ||||
| Ratio of total expenses to average net assets (e) | 1.93 | % (f) | ||
| Ratio of net expenses to average net assets (e)(g) | 1.35 | % (f)(h) | ||
| Ratio of net investment income to average net assets (g) | 0.20 | % (f) | ||
| Portfolio turnover rate | 95 | % (d) | ||
| (a) | Represents the period from the commencement of operations (March 31, 2020) through February 28, 2021. |
| (b) | Per share net investment income has been determined on the basis of average number of shares outstanding during the period. Recognition of net investment income by the Fund is affected by the timing of the declaration of the dividends by the underlying companies in which the Fund invests. |
| (c) | Total return is a measure of the change in value of an investment in the Fund over the period covered. The return shown does not reflect the deduction of taxes a shareholder would pay on Fund distributions, if any, or the redemption of Fund shares. The total return would have been lower had the Adviser not reduced advisory fees and reimbursed expenses (Note 4). |
| (d) | Not annualized. |
| (e) | Ratio does not include expenses of the investment companies in which the Fund invests. |
| (f) | Annualized. |
| (g) | Ratio was determined after advisory fees reductions and expense reimbursements (Note 4). |
| (h) | Includes costs to organize the Fund of 0.10% which are excluded from the Expense Limitation Agreement (Note 4). |
See accompanying notes to financial statements.
17
| BLUEPRINT GROWTH FUND |
| NOTES TO FINANCIAL STATEMENTS |
| February 28, 2021 |
| 1. | Organization |
Blueprint Growth Fund (the “Fund”) is a diversified series of Ultimus Managers Trust (the “Trust”). The Trust is an open-end management investment company established as an Ohio business trust under a Declaration of Trust dated February 28,2012. Other series of the Trust are not incorporated in this report. The Fund commenced operations on March 31, 2020.
The investment objective of the Fund is to seek capital appreciation while managing risk.
The Fund currently offers two classes of shares: Investor Class shares (sold without any sales loads, but subject to a distribution and/or shareholder servicing fee of up to 0.25% of the average daily net assets attributable to Investor Class shares, and requiring a $5,000 initial investment) and Institutional Class shares (sold without any sales loads and distribution and/or shareholder servicing fees and requiring a $15,000 initial investment). Each share class represents an ownership interest in the same investment portfolio.
| 2. | Significant Accounting Policies |
The following is a summary of the Fund’s significant accounting policies used in the preparation of its financial statements. These policies are in conformity with accounting principles generally accepted in the United States of America (“GAAP”). The Fund follows accounting and reporting guidance under Financial Accounting Standards Board Accounting Standards Codification Topic 946, “Financial Services – Investment Companies.”
Securities valuation – The Fund values its portfolio securities at fair value as of the close of regular trading on the New York Stock Exchange (the “NYSE”) (normally 4:00 p.m. Eastern time) on each business day the NYSE is open for business. The Fund values its listed securities, including common stocks and exchange-traded funds (“ETFs”), on the basis of the security’s last sale price on the security’s primary exchange, if available, otherwise at the exchange’s most recently quoted mean price. NASDAQ-listed securities are valued at the NASDAQ Official Closing Price. When using a quoted price and when the market for the security is considered active, the security will be classified as Level 1 within the fair value hierarchy (see below). In the event that market quotations are not readily available or are considered unreliable due to market or other events, the Fund values its securities and other assets at fair value in accordance with procedures established by and under the general supervision of the Board of Trustees (the “Board”). Under these procedures, the securities will be classified as Level 2 or 3 within the fair value hierarchy, depending on the inputs used. Unavailable or unreliable market quotes may be due to the following factors: a substantial bid-ask spread; infrequent sales resulting in stale prices; insufficient trading volume; small trade sizes; a temporary lapse in any reliable pricing
18
| BLUEPRINT GROWTH FUND |
| NOTES TO FINANCIAL STATEMENTS (Continued) |
source; and actions of the securities or futures markets, such as the suspension or limitation of trading. As a result, the prices of securities used to calculate the Fund’s net asset value (“NAV”) may differ from quoted or published prices for the same securities.
GAAP establishes a single authoritative definition of fair value, sets out a framework for measuring fair value, and requires additional disclosures about fair value measurements.
Various inputs are used in determining the value of the Fund’s investments. These inputs are summarized in the three broad levels listed below:
| ● | Level 1 – quoted prices in active markets for identical securities |
| ● | Level 2 – other significant observable inputs |
| ● | Level 3 – significant unobservable inputs |
The inputs or methods used for valuing securities are not necessarily an indication of the risks associated with investing in those securities. The inputs used to measure fair value may fall into different levels of the fair value hierarchy. In such cases, for disclosure purposes, the level in the fair value hierarchy within which the fair value measurement falls in its entirety is determined based on the lowest level input that is significant to the fair value measurement.
The following is a summary of the Fund’s investments and the inputs used to value the investments as of February 28, 2021:
| Level 1 | Level 2 | Level 3 | Total | |||||||||||||
| Common Stocks | $ | 23,888,723 | $ | — | $ | — | $ | 23,888,723 | ||||||||
| Exchange-Traded Funds | 28,808,122 | — | — | 28,808,122 | ||||||||||||
| Total | $ | 52,696,845 | $ | — | $ | — | $ | 52,696,845 | ||||||||
Refer to the Fund’s Schedule of Investments for a listing of the common stocks by sector and industry type. The Fund did not hold any derivative instruments or any assets or liabilities that were measured at fair value on a recurring basis using significant unobservable inputs (Level 3) as of or during the period ended February 28, 2021.
Cash – The Fund’s cash, if any, is held in a bank account with balances which, at times, may exceed United States federally insured limits set by the Federal Deposit Insurance Corporation. The Fund maintains these balances with a high quality financial institution and may incur charges on cash overdrafts.
Share valuation – The NAV per share of each class of the Fund is calculated daily by dividing the total value of the assets attributable to that class, less liabilities attributable to that class, by the number of shares outstanding of that class. The offering price and redemption price per share of each class of the Fund is equal to the NAV per share of such class.
19
| BLUEPRINT GROWTH FUND |
| NOTES TO FINANCIAL STATEMENTS (Continued) |
Investment income – Dividend income is recorded on the ex-dividend date. Non-cash dividends included in dividend income, if any, are recorded at the fair market value of the security received. Interest income is accrued as earned. Withholding taxes on foreign dividends, if any, have been recorded in accordance with the Fund’s understanding of the applicable country’s rules and tax rates.
Investment transactions – Investment transactions are accounted for on the trade date. Realized gains and losses on investments sold are determined on a specific identification basis.
Offering costs – The Adviser advanced some of the Fund’s initial offering costs and was subsequently reimbursed by the Fund. Costs of $29,700 incurred in connection with the offering and initial registration have been deferred and are being amortized on a straight-line basis over the first twelve months after commencement of operations. As of February 28, 2021, there was $9,900 in unamortized offering costs remaining in the Fund.
Common expenses – Common expenses of the Trust are allocated among the Fund and the other series of the Trust based on the relative net assets of each series, the number of series in the Trust, or the nature of the services performed and the relative applicability to each series.
Distributions to shareholders – The Fund distributes to shareholders any net investment income dividends and net realized capital gains on an annual basis. The amount of such dividends and distributions are determined in accordance with federal income tax regulations, which may differ from GAAP. Dividends and distributions to shareholders are recorded on the ex-dividend date. The tax character of distributions paid to shareholders by the Fund during the period ended February 28, 2021 was ordinary income.
Estimates – The preparation of financial statements in conformity with GAAP requires management to make estimates and assumptions that affect the reported amounts of assets and liabilities and disclosure of contingent assets and liabilities as of the date of the financial statements and the reported amounts of increase (decrease) in net assets from operations during the reporting period. Actual results could differ from those estimates.
Federal income tax – The Fund intends to qualify as a regulated investment company under the Internal Revenue Code of 1986, as amended (the “Code”). Qualification generally will relieve the Fund of liability for federal income taxes to the extent 100% of its net investment income and net realized capital gains are distributed in accordance with the Code.
In order to avoid imposition of the excise tax applicable to regulated investment companies, it is also the Fund’s intention to declare as dividends in each calendar year equal to at least 98% of its net investment income (earned during the calendar year) and 98.2% of its net realized capital gains (earned during the twelve months ended October 31) plus undistributed amounts from prior years.
20
| BLUEPRINT GROWTH FUND |
| NOTES TO FINANCIAL STATEMENTS (Continued) |
The following information is computed on a tax basis for each item as of February 28, 2021:
| Cost of portfolio investments | $ | 48,944,093 | ||
| Gross unrealized appreciation | $ | 4,908,381 | ||
| Gross unrealized depreciation | (1,155,629 | ) | ||
| Net unrealized appreciation | 3,752,752 | |||
| Accumulated capital and other losses | (266,131 | ) | ||
| Total accumulated earnings | $ | 3,486,621 | ||
The difference between the federal income tax cost of portfolio investments and the financial statement cost of portfolio investments is due to certain timing differences in the recognition of capital gains or losses under income tax regulations and GAAP. These “book/tax” differences are temporary in nature and are primarily due to the tax deferral of losses on wash sales.
Qualified late year ordinary losses incurred after December 31, 2020 and within the taxable year are deemed to arise on the first day of the Fund’s next taxable year. For the period ended February 28, 2021, the Fund deferred $48,519 of late year ordinary losses to March 1, 2021 for federal income tax purposes.
As of February 28, 2021, the Fund had short-term capital loss carryforwards of $217,612 for federal income tax purposes. These capital loss carryforwards, which do not expire, may be utilized in future years to offset net realized capital gains, if any.
For the period ended February 28, 2021, the Fund reclassified $20,138 of accumulated earnings against paid-in capital on the Statement of Assets and Liabilities. Such reclassification, the result of permanent differences between the financial statement and income tax reporting requirements, had no effect on the Fund’s net assets or NAV per share.
The Fund recognizes the tax benefits or expenses of uncertain tax positions only when the position is “more likely than not” of being sustained assuming examination by tax authorities. Management has reviewed the Fund’s tax positions for the current tax year and has concluded that no provision for unrecognized tax benefits or expenses is required in these financial statements. The Fund identifies its major tax jurisdiction as U.S. Federal. The Fund recognizes interest and penalties, if any, related to unrecognized tax benefits as income tax on the Statement of Operations. During the period ended February 28, 2021, the Fund did not incur any interest of penalties.
| 3. | Investment Transactions |
During the period ended February 28, 2021, cost of purchases and proceeds from sales of investment securities, other than short-term investments, amounted to $72,409,324 and $23,244,103, respectively.
21
| BLUEPRINT GROWTH FUND |
| NOTES TO FINANCIAL STATEMENTS (Continued) |
| 4. | Transactions with Related Parties |
ADVISORY AND SUB-ADVISORY AGREEMENTS
Pursuant to the terms of the Advisory Agreement, Blueprint Fund Management, LLC (the “Adviser”) serves as the investment adviser to the Fund. The Adviser provides the Fund with the selection of a sub-investment advisor and the compliance and managerial oversight of that sub-adviser and its services to the Fund. The Fund pays the Adviser an investment advisory fee, computed and accrued daily and paid monthly, at the annual rate of 0.95% of average daily net assets.
Blueprint Investment Partners, LLC (the “Sub-Adviser”) serves as the Funds sub-adviser. Pursuant to the Sub-Advisory Agreement, the Sub-Adviser provides the Fund with a continuous program of investing the Fund’s assets and determining the composition of the Fund’s portfolio. For its services, the Adviser pays the Sub-Adviser an investment sub-advisory fee computed at the annual rate of 0.20% of the Fund’s average daily net assets. The Fund does not directly pay the sub-advisory fee.
Pursuant to an Expense Limitation Agreement (“ELA”) between the Fund and the Adviser, the Adviser has agreed contractually, until June 30, 2023, to reduce its advisory fees and reimburse other expenses to the extent necessary to limit total annual fund operating expenses (excluding brokerage costs, taxes, interest, borrowing costs such as interest and dividend expenses on securities sold short, acquired fund fees and expenses, costs to organize the Fund, extraordinary expenses such as litigation and merger or reorganization costs and other expenses not incurred in the ordinary course of the Fund’s business) to 1.50% and 1.25% of average daily net assets for Investor Class and Institutional Class shares, respectively. Accordingly, during the period ended February 28, 2021, the Adviser reduced its investment advisory fees in the amount of $100,204, and, in addition, reimbursed other operating expenses of $41,637.
Advisory fee reductions and expense reimbursements by the Adviser are subject to repayment by the Fund for a period of three years after such fees and expenses were incurred, provided that the repayments do not cause total annual fund operating expenses (exclusive of such reductions and reimbursements) to exceed (i) the expense limitation then in effect, if any, and (ii) the expense limitation in effect at the time the expenses to be repaid were incurred. Prior to June 30, 2023, the agreement may not be modified or terminated without the approval of the Board. After June 30, 2023, the ELA may continue from year-to-year provided such continuance is approved by the Board. The ELA may be terminated by the Adviser, or the Board, without approval by the other party, at the end of the then current term upon not less than 90 days’ notice to the other parties as set forth in the ELA. As February 28, 2021, the Adviser may seek repayment of expense reimbursements no later than the date below:
| February 29, 2024 | $ | 141,841 | |
| Total | $ | 141,841 | |
22
| BLUEPRINT GROWTH FUND |
| NOTES TO FINANCIAL STATEMENTS (Continued) |
OTHER SERVICE PROVIDERS
Ultimus Fund Solutions, LLC (“Ultimus”) provides administration, fund accounting, compliance and transfer agency services to the Fund. The Fund pays Ultimus fees in accordance with the agreements for such services. In addition, the Fund pays out-of-pocket expenses including, but not limited to, postage, supplies and certain costs related to the pricing of the Fund’s portfolio securities.
Under the terms of a Distribution Agreement with the Trust, Ultimus Fund Distributors, LLC (the “Distributor”) serves as principal underwriter to the Fund. The Distributor is a wholly-owned subsidiary of Ultimus. The Distributor is compensated partially by the Adviser and partially by the Investor Class shares of the Fund for acting as principal underwriter.
A Trustee and certain officers of the Trust are also officers of Ultimus and/or the Distributor.
DISTRIBUTION PLAN
The Fund has adopted a plan of distribution (the “Plan”), pursuant to Rule 12b-1 under the 1940 Act, which permits Investor Class shares of the Fund to make payments to securities dealers and other financial organizations (including payments directly to the Adviser and the Distributor) for expenses related to the distribution and servicing of the Fund’s Investor Class shares. The annual limitation for payment of expenses pursuant to the Plan is 0.25% of the Fund’s average daily net assets allocable to Investor Class shares. The Fund has not adopted a plan of distribution with respect to Institutional Class shares. During the period ended February 28, 2021, Investor Class shares of the Fund incurred $47 of distribution fees under the Plan.
TRUSTEE COMPENSATION
Each Trustee who is not an “interested person” of the Trust (“Independent Trustee”) receives a $1,300 annual retainer from the Fund, paid quarterly, except for the Board Chairperson who receives a $1,500 annual retainer from the Fund, paid quarterly. Each Independent Trustee also receives from the Fund a fee of $500 for each Board meeting attended plus reimbursement for travel and other meeting-related expenses.
PRINCIPAL HOLDERS OF FUND SHARES
As of February 28, 2021, the following shareholders owned of record 25% or more of the outstanding shares of the Fund:
| NAME OF RECORD OWNER | % OWNERSHIP | |
| National Financial Services, LLC | 64% | |
| TD Ameritrade, Inc. | 31% | |
A beneficial owner of 25% or more of the Fund’s outstanding shares may be considered a controlling person. That shareholder’s vote could have a more significant effect on matters presented at a shareholders’ meeting.
23
| BLUEPRINT GROWTH FUND |
| NOTES TO FINANCIAL STATEMENTS (Continued) |
| 5. | Contingencies and Commitments |
The Fund indemnifies the Trust’s officers and Trustees for certain liabilities that might arise from their performance of their duties to the Fund. Additionally, in the normal course of business the Fund enters into contracts that contain a variety of representations and warranties and which provide general indemnifications. The Fund’s maximum exposure under these arrangements is unknown, as this would involve future claims that may be made against the Fund that have not yet occurred. However, based on experience, the Fund expects the risk of loss to be remote.
| 6. | Investment in Other Investment Companies |
The Fund may invest a significant portion of its assets in shares of one or more investment companies, including ETFs, open-end mutual funds and money market mutual funds. The Fund will incur additional indirect expenses (acquired fund fees and expenses) to the extent it invests in shares of other investment companies. As of February 28, 2021, the Fund had 54.0% of the value of its net assets invested in ETFs.
| 7. | Subsequent Events |
The Fund is required to recognize in the financial statements the effects of all subsequent events that provide additional evidence about conditions that existed as of the date of the Statement of Assets and Liabilities. For non-recognized subsequent events that must be disclosed to keep the financial statements from being misleading, the Fund is required to disclose the nature of the event as well as an estimate of its financial effect, or a statement that such an estimate cannot be made. Management has evaluated subsequent events through the issuance of these financial statements and has noted no such events.
24
| BLUEPRINT GROWTH FUND |
| REPORT OF INDEPENDENT REGISTERED |
| PUBLIC ACCOUNTING FIRM |
To the Shareholders of Blueprint Growth Fund and
Board of Trustees of Ultimus Managers Trust
Opinion on the Financial Statements
We have audited the accompanying statement of assets and liabilities, including the schedule of investments, of Blueprint Growth Fund (the “Fund”), a series of Ultimus Managers Trust, as of February 28, 2021, the related statements of operations and changes in net assets, the related notes, and the financial highlights for the period March 31, 2020 (commencement of operations) through February 28, 2021 (collectively referred to as the “financial statements”). In our opinion, the financial statements present fairly, in all material respects, the financial position of the Fund as of February 28, 2021, the results of its operations, changes in net assets, and the financial highlights for the period March 31, 2020 (commencement of operations) through February 28, 2021, in conformity with accounting principles generally accepted in the United States of America.
Basis for Opinion
These financial statements are the responsibility of the Fund’s management. Our responsibility is to express an opinion on the Fund’s financial statements based on our audit. We are a public accounting firm registered with the Public Company Accounting Oversight Board (United States) (“PCAOB”) and are required to be independent with respect to the Fund in accordance with the U.S. federal securities laws and the applicable rules and regulations of the Securities and Exchange Commission and the PCAOB.
We conducted our audit in accordance with the standards of the PCAOB. Those standards require that we plan and perform the audit to obtain reasonable assurance about whether the financial statements are free of material misstatement whether due to error or fraud.
Our audit included performing procedures to assess the risks of material misstatement of the financial statements, whether due to error or fraud, and performing procedures that respond to those risks. Such procedures included examining, on a test basis, evidence regarding the amounts and disclosures in the financial statements. Our procedures included confirmation of securities owned as of February 28, 2021, by correspondence with the custodian and broker; when replies were not received from the broker, we performed other auditing procedures. Our audit also included evaluating the accounting principles used and significant estimates made by management, as well as evaluating the overall presentation of the financial statements. We believe that our audit provides a reasonable basis for our opinion.
We have served as the Fund’s auditor since 2020.
COHEN & COMPANY, LTD.
Cleveland, Ohio
April 28, 2021
25
| BLUEPRINT GROWTH FUND |
| ABOUT YOUR FUND’S EXPENSES (Unaudited) |
We believe it is important for you to understand the impact of costs on your investment. As a shareholder of the Fund, you incur ongoing costs, including management fees, class-specific expenses (such as distribution fees) and other operating expenses. The following examples are intended to help you understand your ongoing costs (in dollars) of investing in the Fund and to compare these costs with the ongoing costs of investing in other mutual funds.
A mutual fund’s ongoing costs are expressed as a percentage of its average net assets. This figure is known as the expense ratio. The expenses in the table below are based on an investment of $1,000 made at the beginning of the most recent period (September 1, 2020) and held until the end of the period (February 28, 2021).
The table below illustrates the Fund’s ongoing costs in two ways:
Actual fund return – This section helps you to estimate the actual expenses that you paid over the period. The “Ending Account Value” shown is derived from the Fund’s actual return, and the fourth column shows the dollar amount of operating expenses that would have been paid by an investor who started with $1,000 in the Fund. You may use the information here, together with the amount you invested, to estimate the expenses that you paid over the period.
To do so, simply divide your account value by $1,000 (for example, an $8,600 account value divided by $1,000 = 8.6), then multiply the result by the number given for the Fund under the heading “Expenses Paid During Period.”
Hypothetical 5% return – This section is intended to help you compare the Fund’s ongoing costs with those of other mutual funds. It assumes that the Fund had an annual return of 5% before expenses during the period shown, but that the expense ratio is unchanged. In this case, because the return used is not the Fund’s actual return, the results do not apply to your investment. The example is useful in making comparisons because the U.S. Securities and Exchange Commission (the “SEC”) requires all mutual funds to calculate expenses based on a 5% return. You can assess the Fund’s ongoing costs by comparing this hypothetical example with the hypothetical examples that appear in shareholder reports of other funds.
Note that expenses shown in the table are meant to highlight and help you compare ongoing costs only. The Fund does not charge transaction fees, such as purchase or redemption fees, nor does it carry a “sales load.”
The calculations assume no shares were bought or sold during the period. Your actual costs may have been higher or lower, depending on the amount of your investment and the timing of any purchases or redemptions.
More information about the Fund’s expenses can be found in this report. For additional information on operating expenses and other shareholder costs, please refer to the Fund’s prospectus.
26
| BLUEPRINT GROWTH FUND |
| ABOUT YOUR FUND’S EXPENSES (Unaudited) (Continued) |
More information about the Fund’s expenses can be found in this report. For additional information on operating expenses and other shareholder costs, please refer to the Fund’s prospectus.
| Beginning | Ending | |||||||
| Account Value | Account Value | Expenses | ||||||
| September 1, | February 28, | Net Expense | Paid During | |||||
| 2020 | 2021 | Ratio (a) | Period (b) | |||||
| Investor Class | ||||||||
| Based on Actual Fund Return | $1,000.00 | $1,055.00 | 1.64% | $8.36 | ||||
| Based on Hypothetical 5% Return (before expenses) | $1,000.00 | $1,016.66 | 1.64% | $8.20 | ||||
| Institutional Class | ||||||||
| Based on Actual Fund Return | $1,000.00 | $1,056.80 | 1.36% | $6.94 | ||||
| Based on Hypothetical 5% Return (before expenses) | $1,000.00 | $1,018.05 | 1.36% | $6.80 |
| (a) | Annualized, based on the Fund’s expenses during the period since the commencement of operations. |
| (b) | Expenses are equal to the Fund’s annualized net expense ratio multiplied by the average account value over the period, multiplied by 181/365 (to reflect the one-half year period). |
27
| BLUEPRINT GROWTH FUND |
| OTHER INFORMATION (Unaudited) |
A description of the policies and procedures that the Fund uses to vote proxies relating to portfolio securities is available without charge upon request by calling toll-free 1-866-983-4525, or on the SEC’s website at www.sec.gov. Information regarding how the Fund voted proxies relating to portfolio securities during the most recent 12-month period ended June 30 is available without charge upon request by calling toll-free 1-866-983-4525, or on the SEC’s website at www.sec.gov.
The Trust files a complete listing of portfolio holdings for the Fund with the SEC as of the end of the first and third quarters of each fiscal year as an exhibit to Form N-PORT. These filings are available upon request by calling 1-800-665-9778. Furthermore, you may obtain a copy of the filings on the SEC’s website at www.sec.gov.
| FEDERAL TAX INFORMATION (Unaudited) |
Dividends Received Deduction
For corporate shareholders, 94.98% of ordinary income dividends paid during the period ended February 28, 2021 qualify for the corporate dividends received deduction.
Qualified Dividend Income
The Fund has designated the maximum amount allowable of their net taxable income as qualified dividend income as provided in the Jobs and Growth Tax Relief Reconciliation Act of 2003. This amount was reflected on Form 1099-DIV for the calendar year 2020.
28
| BLUEPRINT GROWTH FUND |
| BOARD OF TRUSTEES AND EXECUTIVE OFFICERS (Unaudited) |
The Board has overall responsibility for management of the Trust’s affairs. The Trustees serve during the lifetime of the Trust and until its termination, or until death, resignation, retirement, or removal. The Trustees, in turn, elect the officers of the Funds to actively supervise their day-to-day operations. The officers have been elected for an annual term. Each Trustee’s and officer’s address is 225 Pictoria Drive, Suite 450, Cincinnati, Ohio 45246. The following are the Trustees and executive officers of the Funds:
| Name and Year of Birth | Length of Time Served | Position(s) Held with Trust | Principal Occupation(s) During Past 5 Years | Number of Funds in Trust Overseen by Trustee | Directorships of Public Companies Held by Trustee During Past 5 Years |
| Interested Trustees: | |||||
| David R. Carson* Year of Birth: 1958 | Since 2013 | Trustee (January 2021 to present) Principal Executive Officer (April 2017 to January 2021) President (October 2013 to present) Vice President (April 2013 to October 2013) | SVP, Client Strategies of Ultimus Fund Solutions, LLC (2013 to present); President, Unified Series Trust (2016 to present) and Trustee (2020 to present); President, Centaur Mutual Funds Trust (2018 to present); Chief Compliance Officer, FSI Low Beta Absolute Return Fund (2013 to 2016) | 15 | Interested Trustee of Unified Series Trust (25 funds) |
29
| BLUEPRINT GROWTH FUND |
| BOARD OF TRUSTEES AND EXECUTIVE OFFICERS (Unaudited) (Continued) |
| Name and Year of Birth | Length of Time Served | Position(s) Held with Trust | Principal Occupation(s) During Past 5 Years | Number of Funds in Trust Overseen by Trustee | Directorships of Public Companies Held by Trustee During Past 5 Years |
| Independent Trustees: | |||||
| Janine L. Cohen Year of Birth: 1952 | Since January 2016 | Chairperson (October 2019 to present) Trustee (January 2016 to present) | Retired (2013) financial services executive | 15 | None |
David M. Deptula Year of Birth: 1958 | Since June 2012 | Trustee | Vice President of Legal and Special Projects at Dayton Freight Lines, Inc. since 2016; Vice President of Tax Treasury at The Standard Register Inc. (formerly The Standard Register Company) from 2011 to 2016 | 15 | None |
Robert E. Morrison Year of Birth: 1957 | Since June 2019 | Trustee | Senior Vice President and National Practice Lead for Investment, Huntington National Bank/Huntington Private Bank (2014 to present) | 15 | None |
Clifford N. Schireson Year of Birth: 1953 | Since June 2019 | Trustee | Founder of Schireson Consulting, LLC (2017 to present); Director of Institutional Services for Brandes Investment Partners, LP (2004-2017) | 15 | Trustee of the San Diego City Employees’ Retirement System (2009 to present) |
Jacqueline A. Williams Year of Birth: 1954 | Since June 2019 | Trustee | Managing Member of Custom Strategy Consulting, LLC (2017 to present); Managing Director of Global Investment Research (2005 to 2017), Cambridge Associates, LLC | 15 | None |
| * | Mr. Carson is considered an “interested person” of the Trust within the meaning of Section 2(a)(19) of the Investment Company Act of 1940, as amended, because of his relationship with the Trust’s administrator, transfer agent and distributor. |
30
| BLUEPRINT GROWTH FUND |
| BOARD OF TRUSTEES AND EXECUTIVE OFFICERS (Unaudited) (Continued) |
| Name and Year of Birth | Length of Time Served | Position(s) Held with Trust | Principal Occupation(s) During Past 5 Years |
| Executive Officers: | |||
| Todd E. Heim Year of Birth: 1967 | Since 2014 | Principal Executive Officer and President (January 2021 to present) Vice President (2014 to 2021) | VP, Relationship Management of Ultimus Fund Solutions, LLC (2018 to present); Client Implementation Manager and AVP of Ultimus Fund Solutions, LLC (2014 to 2018); Naval Flight Officer in the United States Navy (May 1989 to June 2017) |
| Jennifer L. Leamer Year of Birth: 1976 | Since 2014 | Treasurer (October 2014 to present) Assistant Treasurer (April 2014 to October 2014) | SVP, Fund Accounting of Ultimus Fund Solutions, LLC (2014 to present) |
| Daniel D. Bauer Year of Birth: 1977 | Since 2016 | Assistant Treasurer (April 2016 to present) | AVP, Fund Accounting (September 2015 to present) of Ultimus Fund Solutions, LLC |
| Matthew J. Beck Year of Birth: 1988 | Since 2018 | Secretary (July 2018 to present) | VP, Senior Legal Councel of Ultimus Fund Solutions, LLC (2018 to present); Chief Compliance Officer of OBP Capital, LLC (2015 to 2018); Vice President and General Counsel of The Nottingham Company (2014 to 2018) |
| Natalie S. Anderson Year of Birth: 1975 | Since 2016 | Assistant Secretary (April 2016 to present) | Manager, Legal Administration (July 2016 to present) and Paralegal (January 2015 to June 2016) of Ultimus Fund Solutions, LLC |
| Gweneth K. Gosselink Year of Birth: 1955 | Since 2016 | Chief Compliance Officer (January 2021 to present) | AVP, Compliance Officer of Ultimus Fund Solutions, LLC (December 2019 to present); CCO Consultant at GKG Consulting, LLC (December 2019 to present); Chief Operating Officer and CCO at Miles Capital, Inc. (June 2013 to December 2019) |
| Martin R. Dean Year of Birth: 1963 | Since 2019 | Assistant Chief Compliance Officer (January 2021 to present) Interim Chief Compliance Officer (October 2019 to present) Assistant Chief Compliance Officer (January 2016 to 2017) | SVP of Fund Compliance of Ultimus Fund Solutions, LLC (2016 to present) |
Additional information about members of the Board and executive officers is available in the Funds’ Statement of Additional Information (“SAI”). To obtain a free copy of the SAI, please call 1-866-561-3087.
31
| BLUEPRINT GROWTH FUND |
| LIQUIDITY RISK MANAGEMENT PROGRAM (Unaudited) |
The Fund has adopted and implemented a written liquidity risk management program (the “Program”) as required by Rule 22e-4 (the “Liquidity Rule”) under the Investment Company Act of 1940, as amended. The Program is reasonably designed to assess and manage the Fund’s liquidity risk, taking into consideration, among other factors, the Fund’s investment strategy and the liquidity of its portfolio investments during normal and reasonably foreseeable stressed conditions; its short- and long-term cash flow projections; and its cash holdings and access to other funding sources. The Fund’s Board of Trustees (the “Board”) approved the appointment of the Liquidity Administrator Committee, which is comprised of the Fund’s Adviser and certain Trust officers, to be responsible for the Program’s administration and oversight and for reporting to the Board on at least an annual basis regarding the Program’s operation and effectiveness. The annual written report assessing the Program (the “Report”) was presented to the Board at the October 19-20, 2020 Board meeting and covered the period from June 1, 2019 to May 31, 2020 (the “Review Period”).
During the Review Period, the Fund did not experience unusual stress or disruption to its operations related to purchase and redemption activity. Also, during the Review Period, the Fund held adequate levels of cash and highly liquid investments to meet shareholder redemption activities in accordance with applicable requirements. The Report concluded that the Program is reasonably designed to prevent violation of the Liquidity Rule and the Program has been effectively implemented.
32
Blueprint-AR-21
 |
| HVIA EQUITY FUND |
| INSTITUTIONAL CLASS (HVEIX) |
| Managed by |
| Hudson Valley Investment Advisors, Inc. |
| ANNUAL REPORT |
| February 28, 2021 |
| HVIA EQUITY FUND LETTER TO SHAREHOLDERS | February 28, 2021 |
HVIA Equity Fund for One Year Period Ended February 28th, 2021
The HVIA Equity Fund (“HVEIX” or the “Fund”) launched on October 31, 2016. The Fund’s focus is on using a GARP investment framework to determine suitable investments. This acronym is “Growth at a Reasonable Price” which focuses on investing in equities that are at a discount to their expected growth rate. In our experience of using this investment philosophy, we have come to realize that the process does not fit neatly into months, quarters or years but it expects to outperform over the longer term.
Investment Environment
For the February 28, 2021 fiscal year end, HVEIX recorded a yearly total return of +39.10% compared to +31.29% for the S&P 500 Index. During the year, the economy continued to advance due to the fiscal support provided by the U.S. Government and the monetary support from the Federal Reserve. The support included a historically large amount of stimulus placed into the economy. The rebound seen in economic growth was multifaceted and is expected to continue as interest rates are at levels to support growth. Monetary stimulus is in place and there is a strong economy based on housing and auto demand. A main factor influencing the economy was the COVID-19 pandemic which appeared at fiscal year-end to be at an inflection point leading to the opening of the economy. One of the main factors that got us back to the point of reopening was the ingenuity of new drugs that are capable of neutralizing the virus. The year saw companies in several sectors report strong rebounds in both revenues and earnings as investors discounted an earnings rebound as the COVID-19 impact was expected to fade. The introduction of immunization drugs had investors rotating into areas that are more cyclical. With pent up demand for various services, the trajectory of growth should continue to move higher in 2021. The current environment along with the “normalization” of markets appears to have the economy getting additional support. We feel comfortable as Congress is helping select areas of the economy to further limit contraction. The change in parties for President has lowered the day-to-day risks seen in the past but may be changing the longer term risks due to the large amounts of debt taken on by government.
A main factor influencing the markets was the Presidential election, COVID-19 and the country’s unrest from various protests. We believe that the U.S. is seeing a rebound to “normalization” similar to that of China, which would put the U.S. about 6 to 8 weeks behind the Chinese in terms of getting back to economic normality. We expect the U.S. to be more flexible, as the help from management ingenuity has allowed many U.S. businesses to handle the current environment.
The most recent stimulus used to stabilize the economy and assist individuals should act as a barrier for individuals and help shelter them against further economic contraction. It appears the economy should continue to see improvement over the medium to longer term. With the housing and automobile markets experiencing strong rebounds, inventories for these two industries are at all-time lows. At HVIA, we tend to look at a number of economic statistics that can provide early insight for the future economic direction. One such statistic is the U.S. trucking survey; this is showing an increase in overall demand which should continue over the coming quarters. This survey provides strong correlation to the overall U.S. economy.
1
Future growth should also continue, as the U.S. economy has seen an improvement in unemployment as well as a strong rebound in capital spending. This should continue thru 2021, which will help broaden out the economic environment.
HVIA continues to believe that the economy will continue to accelerate due to a variety of factors. Some factors are low interest rates, a significant stimulus package; the transition of political overhang; as well as a decrease in the COVID-19 impact as drug distribution increases. We should therefore see an uptick in demand from current product limitations and the further opening of the economy.
Over the long term, earnings are the main determinate of stock market value. We believe on a short-term basis, the “noise” of short-term factors such as interest rates and potential inflation will bring a rise in volatility. We also believe that economic growth will continue to pick up but will start to slow off from the significant growth seen from the rebound in 2020. We are comfortable with seeing a return to “normalcy” over the coming quarters but we will see some short-term issues. However, we will be moving into a longer-term growth as most sectors in the economy do not appear overextended and there is not a buildup of financial excess.
Interest rate spreads, which provide a gauge for risk, have seen continued contraction, and point to a strong economic future. We further expect to hear about inflation but believe that for the most part that this is transitory. Again, HVIA continues to believe that we will see an upward bias for equities as policy risk recedes.
The equity markets had been the beneficiary of both a rebound in revenues and earnings. We expect a reacceleration over the coming year to both top and bottom lines to support equity prices. We also anticipate that margins will increase and that cyclical areas of the economy should help to support overall S&P 500 earnings. Valuations are high on a historical level but relative basis they are fair.
Current Market Expectations
As the fiscal year progressed, investors saw a rotation from larger cap technology to cyclical, less expensive areas such as commodity and cyclical areas of the market. Interest rates remained low forcing investors into longer duration stocks and bonds. Company earnings have rebounded from significantly lower levels with revenues being 1% below estimates from earlier in the year. GDP appears to have continued to show strength with the potential for two back to back quarters of record GDP growth as we move into 2021. Risks we have focused on are the potential increase in interest rates, rise in inflation increase and the continued duration length of the services sector remaining in a stagnate state due to COVID-19.
Over the short term, risk appears to have plateaued. COVID-19 cases have dropped and the most susceptible group (those that are 65 years old plus) will be covered by vaccines sooner than what was anticipated. This will bring down deaths and allow for the opening of the economy in a bigger way. At the end of the fiscal year we already were witnessing the benefits of the economy opening to a greater extent. Employment and sales both rebounded and are expected to continue helping to support earnings.
Finally, we have seen the changing in government policy with the new administration. This will focus on higher taxes and investment. We’ll wait to see the impact, but at this point the strength of the economy over the shorter term will outweigh the longer term impacts that
2
are being communicated at the writing of this letter. No matter what happens we expect valuation levels to be limited and the growth in earnings will be a main driver in moving equity markets.
Investment Philosophy and Performance
We invest with an eye for the longer term, which means over 18 months. We focus on companies that are showing improving asset utilization, margin expansion and efficient capital allocation. The net effect is a portfolio of companies that tend to trend towards an improving Return on Equity (which is a measure of how well a company uses investments to generate earnings) but are trading at a discount to their expected growth or that of the industry group.
For the year ended February 28, 2021 HVEIX was up +39.10% compared to +31.29% for the S&P 500’s return over the same period. The following three positions had the largest total return for the quarter:
Nvidia Corp. (NVDA) 130.34%
Chipotle Mexican Grill Inc. (CMG) 116.48%
Exxon Mobil Corp. (XOM) 98.87%
Our top performer during the year was Nvidia Corp. “NVDA”, which saw strong demand, and increase in market share with its end markets seeing accelerated growth. The company’s largest percentage market share include video gaming and electronic vehicles. NVDA is also expanding into other areas such as healthcare due to its chips computational processing power. The second best performer was Chipotle Mexican Grill Inc. “CMG” that took advantage of the stay at home period by adding to its technology which allows for store pickup. It also added new products during a period when it was able to see stronger throughput. The company also has limited debt and is positioned for future buildout. The last top position over this period was in part to the rebound in the underlying price of oil and the oversold nature of the energy space. As the energy industry has been focused on cash returns the level of supply that ultimately ends the energy cycle may extend the energy cycle over the coming quarters. We cut our overall energy position over the year but maintained XOM as part of the portfolio.
The following positions had the greatest negative total return for the quarter:
Enbridge Inc. (ENB) -21.55%
Williams Companies Inc. (WMS) -41.23%
Conoco Phillips (COP) -41.89%
Conoco Phillips was the Fund’s worst performer, closely followed by Williams Companies, Inc., during the quarter. The HVIA Fund reduced its energy exposure during the earlier part of the year which saw oil prices go almost negative during the period. The company, Conoco Phillips COP, is a strong player in the field but as a risk reduction factor we cut our position and redeployed into names that were “on sale” in technology and discretionary which we took advantage of during the first part of the year. Our third worst performer was Enbridge, Inc. which is a gas pipeline company which is also dependent on energy prices for its performance. Again, we reduced our exposure to energy earlier in the year. These are all well run companies but on a macro basis there will be a shakeout of energy concerns over the coming years.
3
Fund Operations
Over the past 12 months, ending February 28, 2021 the Fund had an increase in assets to $30.4 million with gross inflows of approximately $3.6 million over the period.
We do not employ soft dollar arrangements for the Fund portfolio and our expectation is for continued low turnover, evidenced by the Fund’s turnover rate of approximately 5% over the period covered by this report. We are not anticipating any changes in our operations or personnel at this time.
Sincerely,
 |  |
| Gustave J. Scacco | Ronald P. Mayfield |
| Portfolio Manager | Co-Portfolio Manager |
Past performance is not predictive of future performance. Investment results and principal value will fluctuate so that shares, when redeemed, may be worth more or less than their original cost. Current performance may be higher or lower than the performance data quoted. Performance data current to the most recent month-end is available by calling 1-888-209-8710.
An investor should consider the investment objectives, risks, charges, and expenses of the Fund carefully before investing. The Fund’s prospectus contains this and other important information. To obtain a copy of the Fund’s prospectus please call 1-888-209-8710 and a copy will be sent to you free of charge or visit the Fund’s website at www.hviafunds.com. Please read the prospectus carefully before you invest. The Fund is distributed by Ultimus Fund Distributors, LLC.
The Letter to Shareholders seeks to describe some of the Adviser’s current opinions and views of the financial markets. Although the Adviser believes it has a reasonable basis for any opinions or views expressed, actual results may differ, sometimes significantly so, from those expected or expressed. The securities held by the Fund that are discussed in the Letter to Shareholders were held during the period covered by this Report. They do not comprise the entire investment portfolio of the Fund, may be sold at any time, and may no longer be held by the Fund. For a complete list of securities held by the Fund as of February 28, 2021, please see the Schedule of Investments section of the annual report. The opinions of the Fund’s adviser with respect to those securities may change at any time.
Statements in the Letter to Shareholders that reflect projections or expectations for future financial or economic performance of the Fund and the market in general and statements of the Fund’s plans and objectives for future operations are forward-looking statements. No assurance can be given that actual results or events will not differ materially from those projected, estimated, assumed, or anticipated in any such forward-looking statements. Important factors that could result in such differences, in addition to factors noted with such forward-looking statements include, without limitation, general economic conditions, such as inflation, recession, and interest rates.
4
| HVIA EQUITY FUND |
| PERFORMANCE INFORMATION |
| February 28, 2021 (Unaudited) |
Comparison of the Change in Value of a $25,000 Investment in
HVIA Equity Fund - Institutional Class versus the S&P 500® Index
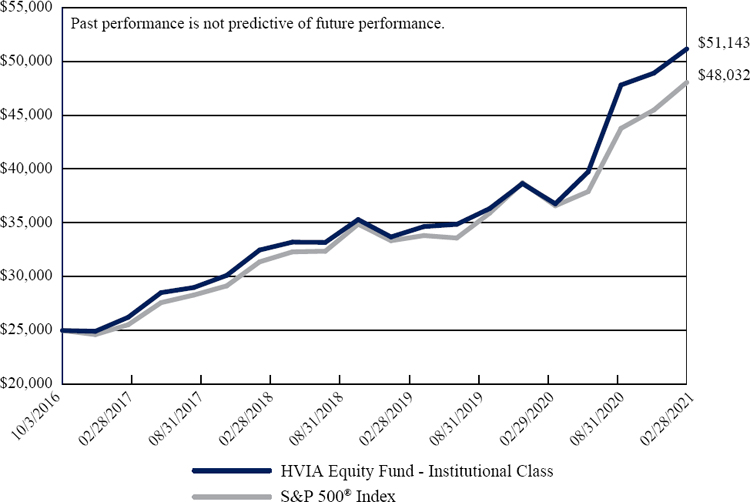
| Average Annual Total Returns | |||||||
| (for the periods ended February 28, 2021) | |||||||
| Since | |||||||
| 1 Year | 3 Years | Inception(b) | |||||
| HVIA Equity Fund - Institutional Class(a) | 39.10% | 15.48% | 17.64% | ||||
| S&P 500® Index(c) | 31.29% | 14.14% | 15.98% | ||||
| (a) | The Fund’s total returns do not reflect the deduction of taxes a shareholder would pay on Fund distributions or the redemption of Fund shares. |
| (b) | The Fund commenced operations on October 3, 2016. |
| (c) | The S&P 500® Index is a market capitalization weighted index of 500 large companies that is widely used as a barometer of U.S. stock market performance. The index is unmanaged and shown for illustration purposes only. An investor cannot invest in an index and its returns are not indicative of the performance of any specific investment. |
5
| HVIA EQUITY FUND |
| PORTFOLIO INFORMATION |
| February 28, 2021 (Unaudited) |
Sector Diversification (% of Net Assets)
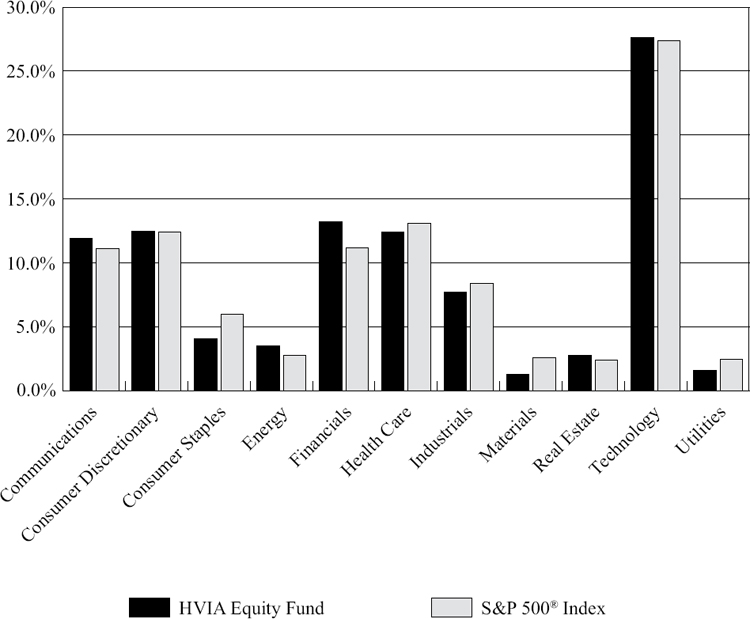
| Top 10 Equity Holdings | |
| % of | |
| Security Description | Net Assets |
| NVIDIA Corporation | 4.8% |
| Microsoft Corporation | 4.7% |
| Apple, Inc. | 4.6% |
| Amazon.com, Inc. | 4.6% |
| Bank of America Corporation | 3.6% |
| JPMorgan Chase & Company | 3.6% |
| Alphabet, Inc. - Class C | 3.6% |
| salesforce.com, inc. | 3.6% |
| Adobe, Inc. | 3.4% |
| FedEx Corporation | 3.2% |
6
| HVIA EQUITY FUND |
| SCHEDULE OF INVESTMENTS |
| February 28, 2021 |
| COMMON STOCKS — 98.6% | Shares | Value | ||||||
| Communications — 11.9% | ||||||||
| Cable & Satellite — 1.7% | ||||||||
| Comcast Corporation - Class A | 10,000 | $ | 527,200 | |||||
| Entertainment Content — 2.8% | ||||||||
| Walt Disney Company (The) (a) | 4,500 | 850,680 | ||||||
| Internet Media & Services — 6.0% | ||||||||
| Alphabet, Inc. - Class C (a) | 535 | 1,089,720 | ||||||
| Facebook, Inc. - Class A (a) | 2,800 | 721,336 | ||||||
| 1,811,056 | ||||||||
| Telecommunications — 1.4% | ||||||||
| Verizon Communications, Inc. | 7,700 | 425,810 | ||||||
| Consumer Discretionary — 12.5% | ||||||||
| Apparel & Textile Products — 1.0% | ||||||||
| NIKE, Inc. - Class B | 2,300 | 309,994 | ||||||
| E-Commerce Discretionary — 4.6% | ||||||||
| Amazon.com, Inc. (a) | 450 | 1,391,818 | ||||||
| Home Construction — 0.3% | ||||||||
| Lennar Corporation - Class A | 1,000 | 82,970 | ||||||
| Leisure Facilities & Services — 4.2% | ||||||||
| Chipotle Mexican Grill, Inc. (a) | 550 | 793,100 | ||||||
| Royal Caribbean Cruises Ltd. | 1,835 | 171,150 | ||||||
| Starbucks Corporation | 2,950 | 318,689 | ||||||
| 1,282,939 | ||||||||
| Retail - Discretionary — 2.4% | ||||||||
| AutoZone, Inc. (a) | 265 | 307,379 | ||||||
| CarMax, Inc. (a) | 1,500 | 179,265 | ||||||
| Home Depot, Inc. (The) | 950 | 245,423 | ||||||
| 732,067 | ||||||||
| Consumer Staples — 4.1% | ||||||||
| Beverages — 0.8% | ||||||||
| PepsiCo, Inc. | 1,900 | 245,461 | ||||||
| Food — 0.8% | ||||||||
| Mondelēz International, Inc. - Class A | 4,400 | 233,904 | ||||||
7
| HVIA EQUITY FUND |
| SCHEDULE OF INVESTMENTS (Continued) |
| COMMON STOCKS — 98.6% (Continued) | Shares | Value | ||||||
| Consumer Staples — 4.1% (Continued) | ||||||||
| Household Products — 1.2% | ||||||||
| Estée Lauder Companies, Inc. (The) - Class A | 1,300 | $ | 371,618 | |||||
| Retail - Consumer Staples — 1.3% | ||||||||
| Dollar General Corporation | 2,050 | 387,430 | ||||||
| Energy — 3.5% | ||||||||
| Oil & Gas Producers — 3.5% | ||||||||
| Cabot Oil & Gas Corporation | 15,500 | 286,905 | ||||||
| Enbridge, Inc. | 3,306 | 111,776 | ||||||
| Exxon Mobil Corporation | 12,050 | 655,158 | ||||||
| 1,053,839 | ||||||||
| Financials — 13.2% | ||||||||
| Banking — 7.2% | ||||||||
| Bank of America Corporation | 31,865 | 1,106,034 | ||||||
| JPMorgan Chase & Company | 7,450 | 1,096,417 | ||||||
| 2,202,451 | ||||||||
| Institutional Financial Services — 2.8% | ||||||||
| Morgan Stanley | 11,300 | 868,631 | ||||||
| Insurance — 2.1% | ||||||||
| Marsh & McLennan Companies, Inc. | 5,500 | 633,710 | ||||||
| Specialty Finance — 1.1% | ||||||||
| American Express Company | 2,400 | 324,624 | ||||||
| Health Care — 12.4% | ||||||||
| Biotech & Pharma — 1.9% | ||||||||
| Eli Lilly & Company | 2,300 | 471,247 | ||||||
| Pfizer, Inc. | 3,000 | 100,470 | ||||||
| 571,717 | ||||||||
| Health Care Facilities & Services — 1.6% | ||||||||
| UnitedHealth Group, Inc. | 1,500 | 498,330 | ||||||
| Medical Equipment & Devices — 8.9% | ||||||||
| Danaher Corporation | 3,650 | 801,796 | ||||||
| Illumina, Inc. (a) | 1,750 | 768,968 | ||||||
| Medtronic plc | 3,200 | 374,304 | ||||||
| PerkinElmer, Inc. | 3,350 | 422,401 | ||||||
| Thermo Fisher Scientific, Inc. | 750 | 337,560 | ||||||
| 2,705,029 | ||||||||
8
| HVIA EQUITY FUND |
| SCHEDULE OF INVESTMENTS (Continued) |
| COMMON STOCKS — 98.6% (Continued) | Shares | Value | ||||||
| Industrials — 7.7% | ||||||||
| Machinery — 1.5% | ||||||||
| Lincoln Electric Holdings, Inc. | 2,350 | $ | 277,558 | |||||
| Oshkosh Corporation | 1,650 | 174,900 | ||||||
| 452,458 | ||||||||
| Transportation & Logistics — 6.2% | ||||||||
| CSX Corporation | 6,000 | 549,300 | ||||||
| FedEx Corporation | 3,850 | 979,825 | ||||||
| Southwest Airlines Company | 6,150 | 357,500 | ||||||
| 1,886,625 | ||||||||
| Materials — 1.3% | ||||||||
| Chemicals — 1.3% | ||||||||
| Sherwin-Williams Company (The) | 595 | 404,802 | ||||||
| Real Estate — 2.8% | ||||||||
| REITs — 2.8% | ||||||||
| American Tower Corporation | 1,200 | 259,356 | ||||||
| Prologis, Inc. | 6,000 | 594,420 | ||||||
| 853,776 | ||||||||
| Technology — 27.6% | ||||||||
| Semiconductors — 6.9% | ||||||||
| NVIDIA Corporation | 2,650 | 1,453,737 | ||||||
| Xilinx, Inc. | 5,000 | 651,500 | ||||||
| 2,105,237 | ||||||||
| Software — 11.7% | ||||||||
| Adobe, Inc. (a) | 2,250 | 1,034,257 | ||||||
| Microsoft Corporation | 6,150 | 1,429,137 | ||||||
| salesforce.com, inc. (a) | 5,000 | 1,082,500 | ||||||
| 3,545,894 | ||||||||
| Technology Hardware — 6.8% | ||||||||
| Apple, Inc. | 11,600 | 1,406,616 | ||||||
| Ciena Corporation (a) | 12,550 | 654,734 | ||||||
| 2,061,350 | ||||||||
| Technology Services — 2.2% | ||||||||
| Visa, Inc. - Class A | 3,200 | 679,648 | ||||||
9
| HVIA EQUITY FUND |
| SCHEDULE OF INVESTMENTS (Continued) |
| COMMON STOCKS — 98.6% (Continued) | Shares | Value | ||||||
| Utilities — 1.6% | ||||||||
| Electric Utilities — 1.6% | ||||||||
| AES Corporation (The) | 11,400 | $ | 302,784 | |||||
| Duke Energy Corporation | 2,180 | 186,586 | ||||||
| 489,370 | ||||||||
| Total Common Stocks — 98.6% (Cost $17,779,537) | $ | 29,990,438 | ||||||
| Other Assets in Excess of Liabilities — 1.4% | 419,223 | |||||||
| Net Assets — 100.0% | $ | 30,409,661 | ||||||
| (a) | Non-income producing security. |
See accompanying notes to financial statements.
10
| HVIA EQUITY FUND |
| STATEMENT OF ASSETS AND LIABILITIES |
| February 28, 2021 |
| ASSETS | ||||
| Investments in securities: | ||||
| At cost | $ | 17,779,537 | ||
| At value (Note 2) | $ | 29,990,438 | ||
| Cash (Note 2) | 373,839 | |||
| Receivable for capital shares sold | 40,408 | |||
| Dividends and interest receivable | 27,372 | |||
| Other assets | 6,975 | |||
| TOTAL ASSETS | 30,439,032 | |||
| LIABILITIES | ||||
| Payable to Adviser (Note 4) | 7,897 | |||
| Payable to administrator (Note 4) | 10,515 | |||
| Other accrued expenses | 10,959 | |||
| TOTAL LIABILITIES | 29,371 | |||
| NET ASSETS | $ | 30,409,661 | ||
| NET ASSETS CONSIST OF: | ||||
| Paid-in capital | $ | 17,814,942 | ||
| Distributable earnings | 12,594,719 | |||
| NET ASSETS | $ | 30,409,661 | ||
| PRICING OF INSTITUTIONAL SHARES (NOTE 1) | ||||
| Net assets applicable to Institutional Shares | $ | 30,409,661 | ||
| Shares of Institutional Shares outstanding (unlimited number of shares authorized, no par value) | 1,569,378 | |||
| Net asset value, offering price and redemption price per share (Note 2) | $ | 19.38 | ||
See accompanying notes to financial statements.
11
| HVIA EQUITY FUND |
| STATEMENT OF OPERATIONS |
| For the Year Ended February 28, 2021 |
| INVESTMENT INCOME | ||||
| Dividends | $ | 285,735 | ||
| Foreign withholding taxes on dividends | (1,221 | ) | ||
| Interest | 639 | |||
| TOTAL INVESTMENT INCOME | 285,153 | |||
| EXPENSES | ||||
| Investment advisory fees (Note 4) | 188,498 | |||
| Fund accounting fees (Note 4) | 32,552 | |||
| Administration fees (Note 4) | 30,025 | |||
| Registration and filing fees | 23,992 | |||
| Legal fees | 26,391 | |||
| Transfer agent fees (Note 4) | 18,000 | |||
| Audit and tax services fees | 17,500 | |||
| Trustees’ fees and expense (Note 4) | 16,750 | |||
| Compliance fees (Note 4) | 12,000 | |||
| Custody and bank service fees | 7,744 | |||
| Printing of shareholder reports | 5,377 | |||
| Postage and supplies | 3,867 | |||
| Insurance expense | 3,673 | |||
| Other expenses | 20,466 | |||
| TOTAL EXPENSES | 406,835 | |||
| Less fee reductions and expense reimbursements by the Adviser (Note 4) | (154,656 | ) | ||
| NET EXPENSES | 252,179 | |||
| NET INVESTMENT INCOME | 32,974 | |||
| REALIZED AND UNREALIZED GAINS (LOSSES) ON INVESTMENTS AND FOREIGN CURRENCIES | ||||
| Net realized gains (losses) from: | ||||
| Investments | 351,628 | |||
| Foreign currency transactions | (709 | ) | ||
| Net change in unrealized appreciation (depreciation) on: | ||||
| Investments | 8,023,634 | |||
| Foreign currency translations | 44 | |||
| NET REALIZED AND UNREALIZED GAINS ON INVESTMENTS AND FOREIGN CURRENCIES | 8,374,597 | |||
| NET INCREASE IN NET ASSETS RESULTING FROM OPERATIONS | $ | 8,407,571 | ||
See accompanying notes to financial statements.
12
| HVIA EQUITY FUND |
| STATEMENTS OF CHANGES IN NET ASSETS |
| Year | Year | |||||||
| Ended | Ended | |||||||
| February 28, | February 29, | |||||||
| 2021 | 2020 | |||||||
| FROM OPERATIONS | ||||||||
| Net investment income | $ | 32,974 | $ | 84,814 | ||||
| Net realized gains (losses) from: | ||||||||
| Investments | 351,628 | 201,104 | ||||||
| Foreign currency transactions | (709 | ) | (1,413 | ) | ||||
| Net change in unrealized appreciation (depreciation) on: | ||||||||
| Investments | 8,023,634 | 821,166 | ||||||
| Foreign currency translation | 44 | (75 | ) | |||||
| Net increase in net assets resulting from operations | 8,407,571 | 1,105,596 | ||||||
| DISTRIBUTIONS TO SHAREHOLDERS (Note 2) | ||||||||
| Institutional Shares | (143,520 | ) | (142,135 | ) | ||||
| CAPITAL SHARE TRANSACTIONS | ||||||||
| Institutional Shares | ||||||||
| Proceeds from shares sold | 3,621,574 | 2,920,292 | ||||||
| Net asset value of shares issued in reinvestment of distributions to shareholders | 1,022 | 423 | ||||||
| Payments for shares redeemed | (1,705,703 | ) | (1,584,113 | ) | ||||
| Net increase in Institutional Shares net assets from capital share transactions | 1,916,893 | 1,336,602 | ||||||
| TOTAL INCREASE IN NET ASSETS | 10,180,944 | 2,300,063 | ||||||
| NET ASSETS | ||||||||
| Beginning of year | 20,228,717 | 17,928,654 | ||||||
| End of year | $ | 30,409,661 | $ | 20,228,717 | ||||
| CAPITAL SHARE ACTIVITY | ||||||||
| Institutional Shares | ||||||||
| Shares sold | 229,701 | 203,674 | ||||||
| Shares reinvested | 54 | 28 | ||||||
| Shares redeemed | (105,450 | ) | (108,623 | ) | ||||
| Net increase in shares outstanding | 124,305 | 95,079 | ||||||
| Shares outstanding at beginning of year | 1,445,073 | 1,349,994 | ||||||
| Shares outstanding at end of year | 1,569,378 | 1,445,073 | ||||||
See accompanying notes to financial statements.
13
| HVIA EQUITY FUND |
| INSTITUTIONAL SHARES |
| FINANCIAL HIGHLIGHTS |
Per Share Data for a Share Outstanding Throughout Each Period
| Year | Year | Year | Year | Period | ||||||||||||||||
| Ended | Ended | Ended | Ended | Ended | ||||||||||||||||
| February 28, | February 29, | February 28, | February 28, | February 28, | ||||||||||||||||
| 2021 | 2020 | 2019 | 2018 | 2017 (a) | ||||||||||||||||
| Net asset value at beginning of period | $ | 14.00 | $ | 13.28 | $ | 13.17 | $ | 11.39 | $ | 10.00 | ||||||||||
| Income from investment operations: | ||||||||||||||||||||
| Net investment income | 0.02 | 0.06 | 0.09 | 0.06 | 0.02 | |||||||||||||||
| Net realized and unrealized gains on investments and foreign currencies | 5.45 | 0.76 | 0.43 | 1.81 | 1.39 | |||||||||||||||
| Total from investment operations | 5.47 | 0.82 | 0.52 | 1.87 | 1.41 | |||||||||||||||
| Less distributions from: | ||||||||||||||||||||
| Net investment income | (0.00 | ) (b) | (0.07 | ) | (0.08 | ) | (0.06 | ) | (0.02 | ) | ||||||||||
| Net realized gains | (0.09 | ) | (0.03 | ) | (0.33 | ) | (0.03 | ) | — | |||||||||||
| Total distributions | (0.09 | ) | (0.10 | ) | (0.41 | ) | (0.09 | ) | (0.02 | ) | ||||||||||
| Net asset value at end of period | $ | 19.38 | $ | 14.00 | $ | 13.28 | $ | 13.17 | $ | 11.39 | ||||||||||
| Total return (c) | 39.10 | % | 6.11 | % | 4.34 | % | 16.45 | % | 14.06 | % (d) | ||||||||||
| Net assets at end of period (000’s) | $ | 30,410 | $ | 20,229 | $ | 17,929 | $ | 15,059 | $ | 11,381 | ||||||||||
| Ratios/supplementary data: | ||||||||||||||||||||
| Ratio of total expenses to average net assets | 1.59 | % | 1.76 | % | 1.86 | % | 2.11 | % | 2.36 | % (e) | ||||||||||
| Ratio of net expenses to average net assets (f) | 0.99 | % | 0.99 | % | 0.99 | % | 0.99 | % | 0.99 | % (e) | ||||||||||
| Ratio of net investment income to average net assets (f) | 0.13 | % | 0.42 | % | 0.70 | % | 0.53 | % | 0.56 | % (e) | ||||||||||
| Portfolio turnover rate | 11 | % | 16 | % | 29 | % | 4 | % | 2 | % (d) | ||||||||||
| (a) | Represents the period from the commencement of operations (October 3, 2016) through February 28, 2017. |
| (b) | Amounts rounds to less than $0.01 per share. |
| (c) | Total return is a measure of the change in value of an investment in the Fund over the periods covered. The returns shown do not reflect the deduction of taxes a shareholders would pay on Fund distributions, if any, or the redemption of Fund shares. The total returns would be lower if the Adviser had not reduced advisory fees and reimbursed expenses. |
| (d) | Not annualized. |
| (e) | Annualized. |
| (f) | Ratio was determined after advisory fee reductions and expense reimbursements (Note 4). |
See accompanying notes to financial statements.
14
| HVIA EQUITY FUND |
| NOTES TO FINANCIAL STATEMENTS |
| February 28, 2021 |
| 1. | Organization |
HVIA Equity Fund (the “Fund”) is a diversified series of Ultimus Managers Trust (the “Trust”), an open-end investment company established as an Ohio business trust under a Declaration of Trust dated February 28, 2012. Other series of the Trust are not incorporated in this report.
The investment objective of the Fund is to seek growth at a reasonable price.
The Fund currently offers one class of shares: Institutional Class shares (sold without any sales loads or distribution fees and subject to a $25,000 initial investment requirement). As of February 28, 2021, the Investor Class shares (to be sold without any sales load, but subject to a distribution fee of up to 0.25% of the class’ average daily net assets and subject to a $2,500 initial investment requirement) are not currently offered. When both classes are offered, each share class will represent an ownership interest in the same investment portfolio.
| 2. | Significant Accounting Policies |
The following is a summary of the Fund’s significant accounting policies. The policies are in conformity with accounting principles generally accepted in the United States of America (“GAAP”). The Fund follows accounting and reporting guidance under Financial Accounting Standards Board Accounting Standards Codification Topic 946, “Financial Services – Investment Companies.”
Securities valuation – The Fund values its portfolio securities at fair value as of the close of regular trading on the New York Stock Exchange (the “NYSE”) (normally 4:00 p.m. Eastern time) on each business day the NYSE is open for business. The Fund values its common stocks on the basis of the security’s last sale price on the security’s primary exchange, if available, otherwise at the exchange’s most recently quoted mean price. NASDAQ-listed securities are valued at the NASDAQ Official Closing Price. The Fund values securities traded in the over-the-counter market at the last sale price, if available, otherwise at the most recently quoted mean price. When using a quoted price and when the market is considered active, the security will be classified as Level 1 within the fair value hierarchy (see below). In the event that market quotations are not readily available or are considered unreliable due to market or other events, the Fund values its securities and other assets at fair value pursuant to procedures established by and under the direction of the Board of Trustees (the “Board”) of the Trust. Under these procedures, the securities will be classified as Level 2 or 3 within the fair value hierarchy, depending on the inputs used. Unavailable or unreliable market quotes may be due to the following factors: a substantial bid-ask spread; infrequent sales resulting in stale prices; insufficient trading volume; small trade sizes; a temporary lapse in any reliable pricing source; and actions of the securities or futures markets, such as the suspension or limitation of trading. As a result, the prices of securities used to calculate the Fund’s net asset value (“NAV”) may differ from quoted or published prices for the same securities.
15
| HVIA EQUITY FUND |
| NOTES TO FINANCIAL STATEMENTS (Continued) |
GAAP establishes a single authoritative definition of fair value, sets out a framework for measuring fair value, and requires additional disclosures about fair value measurements.
Various inputs are used in determining the value of the Fund’s investments. These inputs are summarized in the three broad levels listed below:
| ● | Level 1 – quoted prices in active markets for identical securities |
| ● | Level 2 – other significant observable inputs |
| ● | Level 3 – significant unobservable inputs |
The inputs or methods used for valuing securities are not necessarily an indication of the risks associated with investing in those securities. The inputs used to measure fair value may fall into different levels of the fair value hierarchy. In such cases, for disclosure purposes, the level in the fair value hierarchy within which the fair value measurement falls in its entirety is determined based on the lowest level input that is significant to the fair value measurement.
The following is a summary of the Fund’s investments and the inputs used to value the investments as of February 28, 2021:
| Level 1 | Level 2 | Level 3 | Total | |||||||||||||
| Common Stocks | $ | 29,990,438 | $ | — | $ | — | $ | 29,990,438 | ||||||||
Refer to the Fund’s Schedule of Investments for a listing of common stocks by sector and industry type. The Fund did not have any derivative instruments or any assets or liabilities that were measured at fair value on a recurring basis using significant unobservable inputs (Level 3) as of or during the year ended February 28, 2021.
Foreign currency translation – Securities and other assets and liabilities denominated in or expected to settle in foreign currencies, if any, are translated into U.S. dollars based on exchange rates on the following basis:
| A. | The fair values of investment securities and other assets and liabilities are translated as of the close of the NYSE each day. |
| B. | Purchases and sales of investment securities and income and expenses are translated at the rate of exchange prevailing as of 4:00 p.m. Eastern Time on the respective date of such transactions. |
| C. | The Fund does not isolate that portion of the results of operations caused by changes in foreign exchange rates on investments from those caused by changes in market prices of securities held. Such fluctuations are included with the net realized and unrealized gains or losses on investments. |
Reported net realized foreign exchange gains or losses arise from 1) purchases and sales of foreign currencies, 2) currency gains or losses realized between the trade and settlement dates on securities transactions, and 3) the difference between the amounts of dividends and
16
| HVIA EQUITY FUND |
| NOTES TO FINANCIAL STATEMENTS (Continued) |
foreign withholding taxes recorded on the Fund’s books and the U.S. dollar equivalent of the amounts actually received or paid. Reported net unrealized foreign exchange gains and losses arise from changes in the value of assets and liabilities that result from changes in exchange rates.
Cash – The Fund’s cash is held in a bank account with balances which, at times, may exceed United States federally insured limits set by the Federal Deposit Insurance Corporation. The Fund maintains these balances with a high quality financial institution and may incur charges on cash overdrafts. As of February 28, 2021, the cash balance reflected on the Statement of Assets and Liabilities represents the amount held in a deposit sweep account.
Share valuation – The NAV per share of each class of the Fund is calculated daily by dividing the total value of its assets attributable to that class, less liabilities attributable to that class, by the number of shares outstanding of that class. The offering price and redemption price per share of each class of the Fund is equal to the NAV per share of such class.
Investment income – Dividend income is recorded on the ex-dividend date. Non-cash dividends included in dividend income, if any, are recorded at the fair market value of the security received. Interest income is accrued as earned. Withholding taxes on foreign dividends have been recorded in accordance with the Fund’s understanding of the applicable country’s tax rules and rates.
Investment transactions – Investment transactions are accounted for on the trade date. Realized gains and losses on investments sold are determined on a specific identification basis.
Common expenses – Common expenses of the Trust are allocated among the Fund and the other series of the Trust based on the relative net assets of each series, the number of series in the Trust, or the nature of the services performed and the relative applicability to each series.
Distributions to shareholders – The Fund will distribute to shareholders any net investment income dividends and net realized capital gains distributions at least once each year. The amount of such dividends and distributions are determined in accordance with federal income tax regulations, which may differ from GAAP. Dividends and distributions to shareholders are recorded on the ex-dividend date. The tax character of the Fund’s distributions during the years ended February 28, 2021 and February 29, 2020 was as follows:
| Ordinary | Long-Term | Total | ||||||||||
| Years Ended | Income | Capital Gains | Distributions | |||||||||
| February 28, 2021 | $ | 4,185 | $ | 139,335 | $ | 143,520 | ||||||
| February 29, 2020 | $ | 102,533 | $ | 39,602 | $ | 142,135 | ||||||
17
| HVIA EQUITY FUND |
| NOTES TO FINANCIAL STATEMENTS (Continued) |
Estimates – The preparation of financial statements in conformity with GAAP requires management to make estimates and assumptions which affect the reported amounts of assets and liabilities and disclosure of contingent assets and liabilities as of the date of the financial statements and the reported amounts of increase (decrease) in net assets from operations during the reporting period. Actual results could differ from those estimates.
Federal income tax – The Fund has qualified and intends to continue to qualify as a regulated investment company under the Internal Revenue Code of 1986, as amended (the “Code”). Qualification generally will relieve the Fund of liability for federal income taxes to the extent 100% of its net investment income and net realized capital gains are distributed in accordance with the Code.
In order to avoid imposition of the excise tax applicable to regulated investment companies, it is also the Fund’s intention to declare as dividends in each calendar year at least 98% of its net investment income (earned during the calendar year) and 98.2% of its net realized capital gains (earned during the 12 months ended October 31) plus undistributed amounts from prior years.
The following information is computed on a tax basis for each item as of February 28, 2021:
| Tax cost of portfolio investments | $ | 17,779,537 | ||
| Gross unrealized appreciation | $ | 12,375,486 | ||
| Gross unrealized depreciation | (164,585 | ) | ||
| Net unrealized appreciation | 12,210,901 | |||
| Undistributed ordinary income | 94,428 | |||
| Undistributed long-term capital gains | 289,386 | |||
| Distributable earnings | $ | 12,594,719 | ||
The Fund recognizes the tax benefits or expenses of uncertain tax positions only when the position is “more likely than not” of being sustained assuming examination by tax authorities. Management has reviewed the Fund’s tax positions for all open tax periods (generally, three years) and has concluded that no provision for unrecognized tax benefits or expenses is required in these financial statements. The Fund identifies its major tax jurisdiction as U.S. Federal. The Fund recognizes interest and penalties, if any, related to unrecognized tax benefits as income tax on the Statement of Operations. During the year ended February 28, 2021, the Fund did not incur any interest of penalties.
| 3. | Investment Transactions |
During the year ended ended February 28, 2021, cost of purchases and proceeds from sales of investment securities, other than short-term investments, amounted to $4,572,254 and $2,719,753, respectively.
18
| HVIA EQUITY FUND |
| NOTES TO FINANCIAL STATEMENTS (Continued) |
| 4. | Transactions with Related Parties |
INVESTMENT ADVISORY AGREEMENT
The Fund’s investments are managed by Hudson Valley Investment Advisors, Inc. (the “Adviser”) pursuant to the terms of an Investment Advisory Agreement. Under the Investment Advisory Agreement, the Fund pays the Adviser an investment advisory fee, computed and accrued daily and paid monthly, at the annual rate of 0.74% of its average daily net assets.
Pursuant to an Expense Limitation Agreement (“ELA”), the Adviser has contractually agreed, until July 1, 2021, to reduce investment advisory fees and reimburse other expenses to the extent necessary to limit total annual operating expenses (exclusive of brokerage costs, taxes, interest, borrowing costs such as interest and dividend expense on securities sold short, costs to organize the Fund, acquired fund fees and expenses, extraordinary expenses such as litigation and merger or reorganization costs and other expenses not incurred in the ordinary course of the Fund’s business) to an amount not exceeding 0.99% of average daily net assets of the Institutional Class shares and 1.24% of the average daily net assets of the Investor class shares. Accordingly, the Adviser reduced its investment advisory fees in the amount of $154,656 during the year ended February 28, 2021.
Under the terms of the ELA, investment advisory fee reductions and expense reimbursements by the Adviser are subject to repayment by the Fund for a period of three years after such fees and expenses were incurred, provided the repayments do not cause total annual operating expenses to exceed: (i) the expense limitation then in effect, if any, and (ii) the expense limitation in effect at the time the expenses to be repaid were incurred. As of February 28, 2021, the Adviser may seek repayment of investment advisory fee reductions and expense reimbursements in the amount of $455,516 no later than the dates listed below:
| February 28, 2022 | $ | 146,308 | ||
| February 28, 2023 | 154,552 | |||
| February 29, 2024 | 154,656 | |||
| Total | $ | 455,516 | ||
OTHER SERVICE PROVIDERS
Ultimus Fund Solutions, LLC (“Ultimus”) provides administration, fund accounting, compliance and transfer agency services to the Fund. The Fund pays Ultimus fees in accordance with the agreements for such services. In addition, the Fund pays out-of-pocket expenses including, but not limited to, postage, supplies, and certain costs related to the pricing of the Fund’s portfolio securities.
19
| HVIA EQUITY FUND |
| NOTES TO FINANCIAL STATEMENTS (Continued) |
Under the terms of a Distribution Agreement with the Trust, Ultimus Fund Distributors, LLC (the “Distributor”) serves as the principal underwriter to the Fund. The Distributor is a wholly-owned subsidiary of Ultimus. The Distributor is compensated by the Adviser (not the Fund) for acting as principal underwriter.
Certain officers and a Trustee of the Trust are also officers of Ultimus.
TRUSTEE COMPENSATION
Each Trustee who is not an “interested person” of the Trust (“Independent Trustee”) receives a $1,300 annual retainer from the Fund, paid quarterly, except for the Board Chairperson who receives a $1,500 annual retainer from the Fund, paid quarterly. Each Independent Trustee also receives from the Fund a fee of $500 for each Board meeting attended plus reimbursement for travel and other meeting-related expenses.
PRINCIPAL HOLDER OF FUND SHARES
As of February 28, 2021, the following shareholder owned of record more than 25% of the outstanding shares of the Fund:
| NAME OF RECORD OWNER | % Ownership | |
| Pershing, LLC (for the benefit of its customers) | 99.7% | |
A beneficial owner of 25% or more of the Fund’s outstanding shares may be considered a controlling person. That shareholder’s vote could have a more significant effect on matters presented at a shareholders’ meeting.
| 5. | Sector Risk |
If a Fund has significant investments in the securities of issuers in industries within a particular business sector, any development affecting that sector will have a greater impact on the value of the net assets of the Fund than would be the case if the Fund did not have significant investments in that sector. In addition, this may increase the risk of loss of an investment in the Fund and increase the volatility of the Fund’s NAV per share. From time to time, circumstances may affect a particular sector and the companies within such sector. For instance, economic or market factors, regulation or deregulation, or other developments may negatively impact all companies in a particular sector and therefore the value of a Fund’s portfolio would be adversely affected. As of February 28, 2021, the Fund had 27.6% of the value of its net assets invested in common stocks within the Technology sector.
20
| HVIA EQUITY FUND |
| NOTES TO FINANCIAL STATEMENTS (Continued) |
| 6. | Contingencies and Commitments |
The Fund indemnifies the Trust’s officers and Trustees for certain liabilities that might arise from the performance of their duties to the Fund. Additionally, in the normal course of business the Fund enters into contracts that contain a variety of representations and warranties and which provide general indemnifications. The Fund’s maximum exposure under these arrangements is unknown, as this would involve future claims that may be made against the Fund that have not yet occurred. However, based on experience, the Fund expects the risk of loss to be remote.
| 7. | Subsequent Events |
The Fund is required to recognize in the financial statements the effects of all subsequent events that provide additional evidence about conditions that existed as of the date of the Statement of Assets and Liabilities. For non-recognized subsequent events that must be disclosed to keep the financial statements from being misleading, the Fund is required to disclose the nature of the event as well as an estimate of its financial effect, or a statement that such an estimate cannot be made. Management has evaluated subsequent events through the issuance of these financial statements and has noted no such events.
21
| HVIA EQUITY FUND |
| REPORT OF INDEPENDENT REGISTERED |
| PUBLIC ACCOUNTING FIRM |
To the Shareholders of HVIA Equity Fund and
Board of Trustees of Ultimus Managers Trust
Opinion on the Financial Statements
We have audited the accompanying statement of assets and liabilities, including the schedule of investments, of HVIA Equity Fund (the “Fund”), a series of Ultimus Managers Trust, as of February 28, 2021, the related statement of operations for the year then ended, the statements of changes in net assets for each of the two years in the period then ended, the related notes, and the financial highlights for each of the five periods in the period then ended (collectively referred to as the “financial statements”). In our opinion, the financial statements present fairly, in all material respects, the financial position of the Fund as of February 28, 2021, the results of its operations for the year then ended, the changes in net assets for each of the two years in the period then ended, and the financial highlights for each of the five periods in the period then ended, in conformity with accounting principles generally accepted in the United States of America.
Basis for Opinion
These financial statements are the responsibility of the Fund’s management. Our responsibility is to express an opinion on the Fund’s financial statements based on our audits. We are a public accounting firm registered with the Public Company Accounting Oversight Board (United States) (“PCAOB”) and are required to be independent with respect to the Fund in accordance with the U.S. federal securities laws and the applicable rules and regulations of the Securities and Exchange Commission and the PCAOB.
We conducted our audits in accordance with the standards of the PCAOB. Those standards require that we plan and perform the audit to obtain reasonable assurance about whether the financial statements are free of material misstatement whether due to error or fraud.
Our audits included performing procedures to assess the risks of material misstatement of the financial statements, whether due to error or fraud, and performing procedures that respond to those risks. Such procedures included examining, on a test basis, evidence regarding the amounts and disclosures in the financial statements. Our procedures included confirmation of securities owned as of February 28, 2021, by correspondence with the custodian. Our audits also included evaluating the accounting principles used and significant estimates made by management, as well as evaluating the overall presentation of the financial statements. We believe that our audits provide a reasonable basis for our opinion.
We have served as the Fund’s auditor since 2016.
COHEN & COMPANY, LTD.
Cleveland, Ohio
April 28, 2021
22
| HVIA EQUITY FUND |
| ABOUT YOUR FUND’S EXPENSES (Unaudited) |
We believe it is important for you to understand the impact of costs on your investment. As a shareholder of the Fund, you incur ongoing costs, including management fees and other operating expenses. The following examples are intended to help you understand your ongoing costs (in dollars) of investing in the Fund and to compare these costs with the ongoing costs of investing in other mutual funds.
A mutual fund’s ongoing costs are expressed as a percentage of its average net assets. This figure is known as the expense ratio. The expenses in the table below are based on an investment of $1,000 made at the beginning of the most recent period (September 1, 2020) and held until the end of the period (February 28, 2021).
The table below illustrates the Fund’s ongoing costs in two ways:
Actual fund return – This section helps you to estimate the actual expenses that you paid over the period. The “Ending Account Value” shown is derived from the Fund’s actual return, and the fourth column shows the dollar amount of operating expenses that would have been paid by an investor who started with $1,000 in the Fund. You may use the information here, together with the amount you invested, to estimate the expenses that you paid over the period.
To do so, simply divide your account value by $1,000 (for example, an $8,600 account value divided by $1,000 = 8.6), then multiply the result by the number given for the Fund under the heading “Expenses Paid During Period.”
Hypothetical 5% return – This section is intended to help you compare the Fund’s ongoing costs with those of other mutual funds. It assumes that the Fund had an annual return of 5% before expenses during the period shown, but that the expense ratio is unchanged. In this case, because the return used is not the Fund’s actual return, the results do not apply to your investment. The example is useful in making comparisons because the U.S. Securities and Exchange Commission (the “SEC”) requires all mutual funds to calculate expenses based on a 5% return. You can assess the Fund’s ongoing costs by comparing this hypothetical example with the hypothetical examples that appear in shareholder reports of other funds.
Note that expenses shown in the table are meant to highlight and help you compare ongoing costs only. The Fund does not charge transaction fees, such as purchase or redemption fees, nor does it carry a “sales load.” The calculations assume no shares were bought or sold during the period. Your actual costs may have been higher or lower, depending on the amount of your investment and the timing of any purchases or redemptions.
More information about the Fund’s expenses can be found in this report. For additional information on operating expenses and other shareholder costs, please refer to the Fund’s prospectus.
23
| HVIA EQUITY FUND |
| ABOUT YOUR FUND’S EXPENSES (Unaudited) (Continued) |
| Beginning | Ending | |||||||
| Account Value | Account Value | Expenses | ||||||
| September 1, | February 28, | Net Expense | Paid During | |||||
| Institutional Class | 2020 | 2021 | Ratio (a) | Period (b) | ||||
| Based on Actual Fund Return | $1,000.00 | $1,070.00 | 0.99% | $5.07 | ||||
| Based on Hypothetical 5% Return (before expenses) | $1,000.00 | $1,019.90 | 0.99% | $4.94 |
| (a) | Annualized, based on the Fund’s most recent one-half year expenses. |
| (b) | Expenses are equal to the Fund’s annualized net expense ratio multiplied by the average account value over the period, multiplied 181/365 (to reflect the one-half year period). |
| LIQUIDITY RISK MANAGEMENT PROGRAM (Unaudited) |
The Fund has adopted and implemented a written liquidity risk management program (the “Program”) as required by Rule 22e-4 (the “Liquidity Rule”) under the Investment Company Act of 1940, as amended. The Program is reasonably designed to assess and manage the Fund’s liquidity risk, taking into consideration, among other factors, the Fund’s investment strategy and the liquidity of its portfolio investments during normal and reasonably foreseeable stressed conditions; its short- and long-term cash flow projections; and its cash holdings and access to other funding sources. The Fund’s Board of Trustees (the “Board”) approved the appointment of the Liquidity Administrator Committee, comprising of the Fund’s Adviser and certain Trust officers, to be responsible for the Program’s administration and oversight and for reporting to the Board on at least an annual basis regarding the Program’s operation and effectiveness. The annual written report assessing the Program (the “Report”) was presented to the Board at the October 19-20, 2020 Board meeting and covered the period from June 1, 2019 to May 31, 2020 (the “Review Period”).
During the Review Period, the Fund did not experience unusual stress or disruption to its operations related to purchase and redemption activity. Also, during the Review Period, the Fund held adequate levels of cash and highly liquid investments to meet shareholder redemption activities in accordance with applicable requirements. The Report concluded that the Program is reasonably designed to prevent violation of the Liquidity Rule and the Program has been effectively implemented.
24
| HVIA EQUITY FUND |
| OTHER INFORMATION (Unaudited) |
A description of the policies and procedures that the Fund uses to vote proxies relating to portfolio securities is available without charge upon request by calling toll- free 1-888-209-8710, or on the SEC’s website at www.sec.gov. Information regarding how the Fund voted proxies relating to portfolio securities during the most recent 12-month period ended June 30 is available without charge upon request by calling toll-free 1-888-209-8710, or on the SEC’s website at www.sec.gov.
The Trust files a complete listing of portfolio holdings for the Fund with the SEC as of the end of the first and third quarters of each fiscal year as an exhibit to its reports on Form N-PORT. These filings are available upon request by calling 1-888-209-8710. Furthermore, you may obtain a copy of the filings on the SEC’s website at www.sec.gov.
| FEDERAL TAX INFORMATION (Unaudited) |
For the fiscal year ended February 28, 2021, the Fund designated $139,335 as long-term capital gain distributions.
Qualified Dividend Income – The Fund designates 100%, or up to the maximum amount of such dividends allowable pursuant to the Internal Revenue code, as qualified dividend income eligible for the reduced tax rate of 15%.
Dividends Received Deduction – Corporate shareholders are generally entitled to take the dividends received deduction on the portion of a Fund’s dividend distribution that qualifies under tax law. For the Fund’s fiscal year 2021 ordinary income dividends, 100% qualifies for the corporate dividends received deduction.
25
| HVIA EQUITY FUND |
| BOARD OF TRUSTEES AND EXECUTIVE OFFICERS (Unaudited) |
The Board has overall responsibility for management of the Trust’s affairs. The Trustees serve during the lifetime of the Trust and until its termination, or until death, resignation, retirement, or removal. The Trustees, in turn, elect the officers of the Fund to actively supervise their day-to-day operations. The officers have been elected for an annual term. Each Trustee’s and officer’s address is 225 Pictoria Drive, Suite 450, Cincinnati, Ohio 45246. The following are the Trustees and executive officers of the Fund:
| Name and Year of Birth | Length of Time Served | Position(s) Held with Trust | Principal Occupation(s) During Past 5 Years | Number of Funds in Trust Overseen by Trustee | Directorships of Public Companies Held by Trustee During Past 5 Years |
| Interested Trustees: | |||||
| David R. Carson* Year of Birth: 1958 | Since February 2013 | Trustee (January 2021 to present) Principal Executive Officer (April 2017 to January 2021) President (October 2013 to present) Vice President (April 2013 to October 2013) | SVP, Client Strategies of Ultimus Fund Solutions, LLC (2013 to present); President, Unified Series Trust (2016 to present) and Trustee (2020 to present); President, Centaur Mutual Funds Trust (2018 to present); Chief Compliance Officer, FSI Low Beta Absolute Return Fund (2013 to 2016) | 15 | Interested Trustee of Unified Series Trust (25 Funds) |
26
| HVIA EQUITY FUND |
| BOARD OF TRUSTEES AND EXECUTIVE OFFICERS (Unaudited) (Continued) |
| Name and Year of Birth | Length of Time Served | Position(s) Held with Trust | Principal Occupation(s) During Past 5 Years | Number of Funds in Trust Overseen by Trustee | Directorships of Public Companies Held by Trustee During Past 5 Years |
| Independent Trustees: | |||||
| Janine L. Cohen Year of Birth: 1952 | Since January 2016 | Chairperson (October 2019 to present) Trustee (January 2016 to present) | Retired (2013) financial services executive | 15 | None |
David M. Deptula Year of Birth: 1958 | Since June 2012 | Trustee | Vice President of Legal and Special Projects at Dayton Freight Lines, Inc. since 2016; Vice President of Tax Treasury at The Standard Register Inc. (formerly The Standard Register Company) from 2011 to 2016 | 15 | None |
Robert E. Morrison Year of Birth: 1957 | Since June 2019 | Trustee | Senior Vice President and National Practice Lead for Investment, Huntington National Bank/Huntington Private Bank (2014 to present) | 15 | None |
Clifford N. Schireson Year of Birth: 1953 | Since June 2019 | Trustee | Founder of Schireson Consulting, LLC (2017 to present); Director of Institutional Services for Brandes Investment Partners, LP (2004-2017) | 15 | Trustee of the San Diego City Employees’ Retirement System (2009 to present) |
Jacqueline A. Williams Year of Birth: 1954 | Since June 2019 | Trustee | Managing Member of Custom Strategy Consulting, LLC (2017 to present); Managing Director of Global Investment Research (2005 to 2017), Cambridge Associates, LLC | 15 | None |
| * | Mr. Carson is considered an “interested person” of the Trust within the meaning of Section 2(a)(19) of the Investment Company Act of 1940, as amended, because of his relationship with the Trust’s administrator, transfer agent and distributor. |
27
| HVIA EQUITY FUND |
| BOARD OF TRUSTEES AND EXECUTIVE OFFICERS (Unaudited) (Continued) |
| Name and Year of Birth | Length of Time Served | Position(s) Held with Trust | Principal Occupation(s) During Past 5 Years |
| Executive Officers: | |||
| Todd E. Heim Year of Birth: 1967 | Since 2014 | Principal Executive Officer and President (January 2021 to present) Vice President (2014 to present) | VP, Relationship Management of Ultimus Fund Solutions, LLC (2018 to present); Client Implementation Manager and AVP of Ultimus Fund Solutions, LLC (2014 to 2018); Naval Flight Officer in the United States Navy (May 1989 to June 2017) |
| Jennifer L. Leamer Year of Birth: 1976 | Since 2014 | Treasurer (October 2014 to present) Assistant Treasurer (April 2014 to October 2014) | SVP, Fund Accounting of Ultimus Fund Solutions, LLC (2014 to present) |
| Daniel D. Bauer Year of Birth: 1977 | Since 2016 | Assistant Treasurer (April 2016 to present) | AVP, Fund Accounting (September 2015 to present) of Ultimus Fund Solutions, LLC |
| Matthew J. Beck Year of Birth: 1988 | Since 2018 | Secretary (July 2018 to present) | VP, Senior Legal Counsel of Ultimus Fund Solutions, LLC (2018 to present); Chief Compliance Officer of OBP Capital, LLC (2015 to 2018); Vice President and General Counsel of The Nottingham Company (2014 to 2018) |
| Natalie S. Anderson Year of Birth: 1975 | Since 2016 | Assistant Secretary (April 2016 to present) | Manager, Legal Administration (July 2016 to present) and Paralegal (January 2015 to June 2016) of Ultimus Fund Solutions, LLC |
| Gweneth K. Gosselink Year of Birth: 1955 | Since 2020 | Chief Compliance Officer (January 2020 to present) | AVP, Compliance Officer of Ultimus Fund Solutions, LLC (December 2019 to present); CCO Consultant at GKG Consulting, LLC (December 2019 to present); Chief Operating Officer & CCO at Miles Capital, Inc. (June 2013 to December 2019) |
| Martin R. Dean Year of Birth: 1963 | Since 2016 | Assistant Chief Compliance Officer (January 2020 to present) Interim Chief Compliance Officer (October 2019 to January 2020) Assistant Chief Compliance Officer (January 2016 to 2017) | SVP, Head of Fund Compliance of Ultimus Fund Solutions, LLC (2016 to present) |
Additional information about members of the Board and executive officers is available in the Fund’s Statement of Additional Information (“SAI”). To obtain a free copy of the SAI, please call 1-888-209-8710.
28
HVIA-SAR-21
| (b) | Not applicable. |
Item 2. Code of Ethics.
As of the end of the period covered by this report, the registrant has adopted a code of ethics that applies to the registrant’s principal executive officer, principal financial officer, principal accounting officer or controller, or persons performing similar functions, regardless of whether these individuals are employed by the registrant or a third party. Pursuant to Item 13(a)(1), a copy of registrant’s code of ethics is filed as an exhibit to this Form N-CSR. During the period covered by this report, the code of ethics has not been amended, and the registrant has not granted any waivers, including implicit waivers, from the provisions of the code of ethics.
Item 3. Audit Committee Financial Expert.
The registrant’s board of trustees has determined that the registrant has at least one audit committee financial expert serving on its audit committee. The name of the audit committee financial expert is Janine L. Cohen. Ms. Cohen is “independent” for purposes of this Item.
Item 4. Principal Accountant Fees and Services.
| (a) | Audit Fees. The aggregate fees billed for professional services rendered by the principal accountant for the audit of the registrant’s annual financial statements or for services that are normally provided by the accountant in connection with statutory and regulatory filings or engagements were $27,000 and $43,500 with respect to the registrant’s fiscal years ended February 28, 2021 and February 29, 2020, respectively. |
| (b) | Audit-Related Fees. No fees were billed in the last two fiscal years for assurance and related services by the principal accountant that are reasonably related to the performance of the audit of the registrant’s financial statements and are not reported under paragraph (a) of this Item. |
| (c) | Tax Fees. The aggregate fees billed for professional services rendered by the principal accountant for tax compliance, tax advice, and tax planning were $6,000 and $9,000 with respect to the registrant’s fiscal years ended February 28, 2021 and February 29, 2020, respectively. The services comprising these fees are the preparation of the registrant’s federal income and excise tax returns. |
| (d) | All Other Fees. No fees were billed in the last fiscal year for products and services provided by the principal accountant, other than the services reported in paragraphs (a) through (c) of this Item. |
| (e)(1) | The audit committee has not adopted pre-approval policies and procedures described in paragraph (c)(7) of Rule 2-01 of Regulation S-X. |
| (e)(2) | None of the services described in paragraph (b) through (d) of this Item were approved by the audit committee pursuant to paragraph (c)(7)(i)(C) of Rule 2-01 of Regulation S-X. |
| (f) | Less than 50% of hours expended on the principal accountant’s engagement to audit the registrant’s financial statements for the most recent fiscal year were attributed to work performed by persons other than the principal accountant’s full-time, permanent employees. |
| (g) | During the fiscal years ended February 28, 2021 and February 29, 2020, aggregate non-audit fees of $6,000 and $9,000, respectively, were billed by the registrant’s principal accountant for services rendered to the registrant. No non-audit fees were billed in the last two fiscal years by the registrant’s principal accountant for services rendered to the registrant’s investment adviser (not including any sub-adviser whose role is primarily portfolio management and is subcontracted with or overseen by another investment adviser), and any entity controlling, controlled by, or under common control with the adviser that provides ongoing services to the registrant. |
| (h) | The principal accountant has not provided any non-audit services to the registrant’s investment adviser (not including any sub-adviser whose role is primarily portfolio management and is subcontracted with or overseen by another investment adviser), and any entity controlling, |
controlled by, or under common control with the investment adviser that provides ongoing services to the registrant.
Item 5. Audit Committee of Listed Registrants.
Not applicable
Item 6. Schedule of Investments.
| (a) | Not applicable [schedule filed with Item 1] |
| (b) | Not applicable |
Item 7. Disclosure of Proxy Voting Policies and Procedures for Closed-End Management Investment Companies.
Not applicable
| Item 8. | Portfolio Managers of Closed-End Management Investment Companies. |
Not applicable
Item 9. Purchases of Equity Securities by Closed-End Management Investment Company and Affiliated Purchasers.
Not applicable
Item 10. Submission of Matters to a Vote of Security Holders.
The registrant’s Committee of Independent Trustees shall review shareholder recommendations to fill vacancies on the registrant’s board of trustees if such recommendations are submitted in writing, addressed to the Committee at the registrant’s offices and meet any minimum qualifications adopted by the Committee. The Committee may adopt, by resolution, a policy regarding its procedures for considering candidates for the board of trustees, including any recommended by shareholders.
Item 11. Controls and Procedures.
(a) Based on their evaluation of the registrant’s disclosure controls and procedures (as defined in Rule 30a-3(c) under the Investment Company Act of 1940) as of a date within 90 days of the filing date of this report, the registrant’s principal executive officer and principal financial officer have concluded that such disclosure controls and procedures are reasonably designed and are operating effectively to ensure that material information relating to the registrant, including its consolidated subsidiaries, is made known to them by others within those entities, particularly during the period in which this report is being prepared, and that the information required in filings on Form N-CSR is recorded, processed, summarized, and reported on a timely basis.
(b) There were no changes in the registrant’s internal control over financial reporting (as defined in Rule 30a-3(d) under the Investment Company Act of 1940) that occurred during the second fiscal quarter of the period covered by this report that have materially affected, or are reasonably likely to materially affect, the registrant’s internal control over financial reporting.
Item 12. Disclosure of Securities Lending Activities for Closed-End Management Investment Companies.
Not applicable
| Item 13. | Exhibits. |
File the exhibits listed below as part of this Form. Letter or number the exhibits in the sequence indicated.
(a)(1) Any code of ethics, or amendment thereto, that is the subject of the disclosure required by Item 2, to the extent that the registrant intends to satisfy the Item 2 requirements through filing of an exhibit: Attached hereto
(a)(2) A separate certification for each principal executive officer and principal financial officer of the registrant as required by Rule 30a-2(a) under the Act (17 CFR 270.30a-2(a)): Attached hereto
(a)(3) Any written solicitation to purchase securities under Rule 23c-1 under the Act (17 CFR 270.23c-1) sent or given during the period covered by the report by or on behalf of the registrant to 10 or more persons: Not applicable
(a)(4) Change in the registrant’s independent public accountants: Not applicable
(b) Certifications required by Rule 30a-2(b) under the Act (17 CFR 270.30a-2(b)): Attached hereto
Exhibit 99.CODE ETH Code of Ethics
Exhibit 99.CERT Certifications required by Rule 30a-2(a) under the Act
Exhibit 99.906CERT Certifications required by Rule 30a-2(b) under the Act
SIGNATURES
Pursuant to the requirements of the Securities Exchange Act of 1934 and the Investment Company Act of 1940, the registrant has duly caused this report to be signed on its behalf by the undersigned, thereunto duly authorized.
| (Registrant) | Ultimus Managers Trust | ||
| By (Signature and Title)* | /s/ Matthew J. Beck | ||
| Matthew J. Beck, Secretary | |||
| Date | May 5, 2021 | ||
| Pursuant to the requirements of the Securities Exchange Act of 1934 and the Investment Company Act of 1940, this report has been signed below by the following persons on behalf of the registrant and in the capacities and on the dates indicated. | |||
| By (Signature and Title)* | /s/ Todd E. Heim | ||
| Todd E. Hein, Principal Executive Officer | |||
| Date | May 5, 2021 | ||
| By (Signature and Title)* | /s/ Jennifer L. Leamer | ||
| Jennifer L. Leamer, Treasurer and Principal Financial Officer | |||
| Date | May 5, 2021 | ||
* Print the name and title of each signing officer under his or her signature.