ALEXANDER & BALDWIN, INC. ’S REAL ESTATE SUPPLEMENTAS OF AND FOR THE YEARS ENDED DECEMBER 31, 2012 AND 2011(Unaudited)
About This SupplementThis periodic Supplement is designed to provide current and potential shareholders of Alexander & Baldwin, Inc. with additional information regarding the Company’s Real Estate operating segments. This information is supplemental to and does not replace the information provided to shareholders in the Company’s periodic filings with the Securities and Exchange Commission.The information contained in this Supplement is unaudited and should be read in conjunction with the Company’s quarterly and annual reports and other filings with the Securities and Exchange Commission. The Company intends to provide periodic updates to the information contained herein, but is not required, and undertakes no obligation, to revise or update forward-looking statements or any factors that may affect actual results, whether as a result of new information, future events, or circumstances occurring after the dates on the cover of this Supplement.Feedback and suggestions regarding the contents of this Supplement are welcomed, and should be directed to Suzy P. Hollinger, Director, Investor Relations, via telephone at (808) 525-8422 or via email to shollinger@abinc.com.
Alexander & Baldwin, Inc. Real Estate SupplementINDEX TO REAL ESTATE SUPPLEMENT(Unaudited)AS OF YEARS ENDED DECEMBER 31, 2012 AND 2011Forward-Looking Statements 3Basis of Presentation 3Periodic Updates 4About the Company 5Selected Financial Data 7Landholdings 9Landholdings 10Landholdings by Geographic Location (Table 1) 10Landholdings Under Joint Venture Development (Table 2) 10Landholdings by Type and Location (Table 3) 11A&B Ag Zoned Land Sales Data – Maui and Kauai– 2007 to 2012 11(Table 4)Real Estate Sales 13Segment Strategy and Operations 14Real Estate Development Overview (Table 5) 15Reconciliation of Acreage Under Development (Table 5) to 17Landholdings (Table 3) (Table 6)Development Project Information Sheets 19Future Development Project Summaries 27Entitlement Activity 30Real Estate Investments 32Real Estate Leasing 33Segment Strategy and Operations 34Acquisition and Disposition Strategy 361
Asset Descriptions and Statistics 37Property Detail – Hawaii Improved Properties (Table 7) 37Property Detail – Mainland Improved Properties (Table 8) 38Comparable% Occupancy Data by Geographic Region and Asset 39Class (Table 9)Weighted Average Gross Leasable Area by Geographic Region 39and Asset Class (Table 10)Occupancy Analysis Trend - Last Five Quarters (Table 11) 39Real Estate Leasing Cash Net Operating Income (NOI) (Table 12) 40Real Estate Leasing Same Store Cash NOI (Table 13) 40Statement on Management’s Use of Non-GAAP Financial Measures 41Reconciliation of Real Estate Leasing Operating Profit to Cash 41NOI and Same Store Cash NOI (Non-GAAP) (Table 14)Portfolio Acquisitions and Dispositions 422012 and 2011 Improved Property Portfolio 42Acquisitions/Dispositions (Table 15)Lease Renewal Analysis 43Lease Expirations (Table 16) 43Portfolio Concentrations 44Tenant Concentrations as of 12/31/12 (Table 17) 44Hawaii Commercial Property Information Sheets 45Mainland Commercial Property Information Sheets 572
Forward-Looking StatementsThis Supplement contains certain forward-looking statements, such as forecasts and projections of the Company’s future performance or statements of management’s plans and objectives. These statements are “forward-looking” statements as that term is defined in the Private Securities Litigation Reform Act of 1995. Except for historical information contained in this Supplement, such communications contain forward-looking statements. These include, for example, all references to current or future years. New risk factors emerge from time to time and it is not possible for the Company to predict all such risk factors, nor can it assess the impact of all such risk factors on the Company’s business or the extent to which any factor, or combination of factors, may cause actual results to differ materially from those contained in any forward-looking statements. Accordingly, forward-looking statements cannot be relied upon as a guarantee of future results and involve a number of risks and uncertainties that could cause actual results to differ materially from those projected in the statements, including, but not limited to the factors that are described in Part I, Item 1A under the caption of “Risk Factors” of the Company’s Form 10-K, as well as factors that are described in the Company’s other filings, including subsequent filings, with the Securities and Exchange Commission (“SEC”). The Company is not required, and undertakes no obligation, to revise or update forward-looking statements or any factors that may affect actual results, whether as a result of new information, future events, or circumstances occurring after the date of this report.Basis of PresentationThe information contained in this Supplement does not purport to disclose all items required by accounting principles generally accepted in the United States of America (GAAP). The information contained in this Supplement is unaudited and should be read in conjunction with the Company’s most recent Form 10-K and other filings with the SEC.3
Periodic UpdatesThe Company provides quarterly updates, but undertakes no obligation to continue to provide updates, of the information contained in the tables listed below:Table 7: Property Detail – Hawaii Improved PropertiesTable 8: Property Detail – Mainland Improved PropertiesTable 9: Comparable% Occupancy Data by Geographic Region andAsset ClassTable 10: Weighted Average Gross Leasable Area by Geographic Region andAsset ClassTable 11: Occupancy Analysis Trend – Last Five QuartersTable 12: Real Estate Leasing Cash NOITable 13: Real Estate Leasing Same Store Cash NOITable 14: Reconciliation of Real Estate Leasing Operating Profit to Cash NOI andSame Store Cash NOI (Non-GAAP)Table 15: Improved Property Portfolio Acquisitions/DispositionsFor detailed information on past quarters, refer to the quarterly supplements for 2012, which are available on the Company’s website at www.alexanderbaldwin.com.The Company currently intends to update all other information contained herein on an annual basis.4
About the CompanyAlexander & Baldwin, Inc. (“A&B” or “Company”) is a Hawaii-based real estate and land company. Founded in 1870 as a sugar plantation, the Company has evolved from its agricultural roots into complementary businesses serving the real estate and agricultural needs of Hawaii. A&B’s operations reach beyond Hawaii to include a U.S. Mainland commercial property portfolio.A&B has significant landholdings in Hawaii; at December 31, 2012, the Company owned over 87,000 acres in the state, primarily on the islands of Maui and Kauai. A&B is responsible for the stewardship of this land and the long-term enhancement of its value. The vast majority of this land was acquired over 100 years ago to support the cultivation of sugar cane.For a significant portion of the Company’s core Hawaii landholdings, agriculture and related uses represent the highest and best use for the foreseeable future, providing significant benefits to the community and shareholders alike. In total, roughly 86,500 acres of the Company’s land, including land leased to others, are currently designated for agriculture and conservation uses (the latter consisting mainly of the collection and transport of water for irrigation purposes and hydroelectric power production). A&B cultivates sugar on nearly 36,000 acres (including land leased from third parties) in Maui’s Central Valley. On Kauai, A&B leases roughly 4,600 acres to third parties engaged in a variety of agricultural activities, including cultivation of coffee and seed corn, and raising of livestock. The Company also utilizes its land assets to produce renewable energy, including biomass combustion, hydroelectric, and solar photovoltaic generation facilities.A&B’s integrated approach to land management ensures that lands suitable for development are employed at their highest and best use by undertaking planning, entitlement and development activities, where appropriate, to enhance the value of the Company’s lands, while addressing market demand and community needs. By identifying and pursuing developments and transactions that enhance the value of raw landholdings, and reinvesting proceeds from these efforts into new developments and a portfolio of income-producing properties, A&B creates value for shareholders and diversifies its income stream. The Company’s development activities, once limited to its legacy landholdings on Maui and Kauai, have expanded to encompass lands newly acquired for development and the participation in a number of development joint ventures throughout Hawaii. This expansion of the Company’s development activities has allowed it to leverage its expertise, market knowledge and capital resources, while also mitigating risk.5
REAL ESTATEReal estate development and leasing activities are conducted by A&B Properties, Inc. (“A&B Properties”), a wholly owned subsidiary of A&B, and various other subsidiaries and affiliates of A&B. The Company’s real estate business consists of two segments that operate in Hawaii and on the Mainland: sales and leasing. The real estate sales segment creates value through an active and comprehensive program of land stewardship, planning, entitlement, investment, development and sale of land and commercial and residential properties principally in Hawaii. The real estate leasing segment generates significant, stable, recurring cash flows through the ownership, operation and management of a portfolio of high-quality retail, office and industrial properties in Hawaii and on the Mainland. Cash generated by this portfolio serves as an important source of funding for A&B's real estate development activities.AGRIBUSINESSAgribusiness operations are conducted by Hawaiian Commercial & Sugar Company (“HC&S”), a division of A&B, and certain other wholly owned subsidiaries of A&B. Agribusiness produces and sells bulk raw sugar, specialty food-grade sugars and molasses, and is also a renewable energy provider on the islands of Maui and Kauai through hydroelectric and solar facilities and the cogeneration of electricity from bagasse at its sugar mill. This segment, which operates exclusively in Hawaii, also includes support services for other agricultural operations and includes general trucking services, mobile equipment maintenance and repair services.More information about the Company can be found at www.alexanderbaldwin.com.Corporate Headquarters WebsitesAlexander & Baldwin, Inc. Alexander & Baldwin, Inc.822 Bishop Street www.alexanderbaldwin.comHonolulu, HI 96813 A&B Properties, Inc.Investor Relationswww.abprop.comSuzy P. HollingerDirector, Investor Relations Hawaiian Commercial & Sugar Company(808) 525-8422 www.hcsugar.comshollinger@abinc.com Transfer Agent & RegistrarComputershare Shareowner ServicesP.O. Box 43006, Providence, RI 02940-3006(800) 454-0477http://www.computershare.com/us/Pages/sos.aspx?rocc=1Stock Exchange ListingNYSE: ALEX6
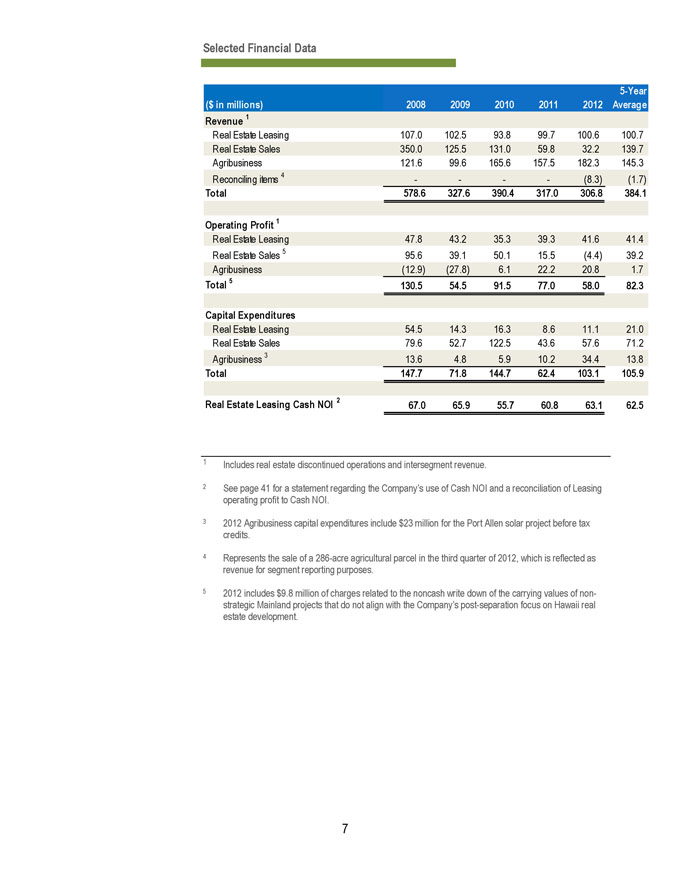
Selected Financial Data5-Year($in millions) 2008 2009 2010 2011 2012 AverageRevenue 1Real Estate Leasing 107.0 102.5 93.8 99.7 100.6 100.7Real Estate Sales 350.0 125.5 131.0 59.8 32.2 139.7Agribusiness 121.6 99.6 165.6 157.5 182.3 145.3Reconciling items 4 - - - - (8.3) (1.7)Total 578.6 327.6 390.4 317.0 306.8 384.1Operating Profit 1Real Estate Leasing 47.8 43.2 35.3 39.3 41.6 41.4Real Estate Sales 5 95.6 39.1 50.1 15.5 (4.4) 39.2Agribusiness (12.9) (27.8) 6.1 22.2 20.8 1.7Total 5 130.5 54.5 91.5 77.0 58.0 82.3Capital ExpendituresReal Estate Leasing 54.5 14.3 16.3 8.6 11.1 21.0Real Estate Sales 79.6 52.7 122.5 43.6 57.6 71.2Agribusiness 3 13.6 4.8 5.9 10.2 34.4 13.8Total 147.7 71.8 144.7 62.4 103.1 105.9Real Estate Leasing Cash NOI 2 67.0 65.9 55.7 60.8 63.1 62.51 Includes real estate discontinued operations and intersegment revenue.2 3 4 5See page 41 for a statement regarding the Company’s use of Cash NOI and a reconciliation of Leasing operating profit to Cash NOI.2012 Agribusiness capital expenditures include $23 million for the Port Allen solar project before tax credits.Represents the sale of a 286-acre agricultural parcel in the third quarter of 2012, which is reflected as revenue for segment reporting purposes.2012 includes $9.8 million of charges related to the noncash write down of the carrying values of non-strategic Mainland projects that do not align with the Company’s post-separation focus on Hawaii real estate development.7

THIS PAGE WAS INTENTIONALLY LEFT BLANK.8
Alexander & Baldwin, Inc. Real Estate SupplementLANDHOLDINGS9
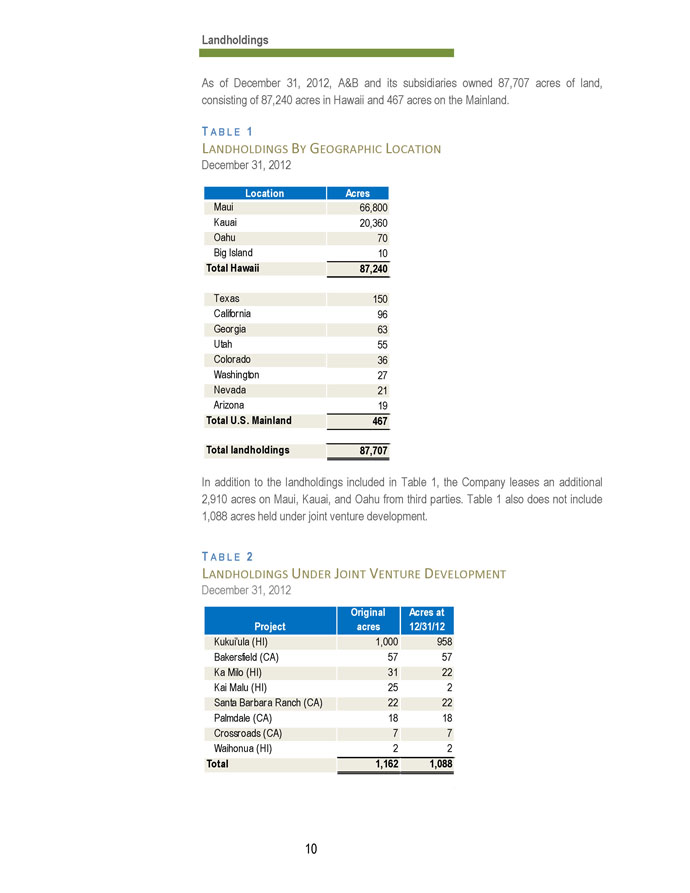
LandholdingsAs of December 31, 2012, A&B and its subsidiaries owned 87,707 acres of land, consisting of 87,240 acres in Hawaii and 467 acres on the Mainland.TABLE 1LANDHOLDINGS BY GEOGRAPHIC LOCATIONDecember 31, 2012Location AcresMaui 66,800Kauai 20,360Oahu 70Big Island 10Total Hawaii 87,240Texas 150California 96Georgia 63Utah 55Colorado 36Washington 27Nevada 21Arizona 19Total U.S. Mainland 467Total landholdings87,707In addition to the landholdings included in Table 1, the Company leases an additional 2,910 acres on Maui, Kauai, and Oahu from third parties. Table 1 also does not include 1,088 acres held under joint venture development.TABLE 2LANDHOLDINGS UNDER JOINT VENTURE DEVELOPMENTDecember 31, 2012Original Acres atProject acres 12/31/12Kukui’ula (HI) 1,000 958Bakersfield (CA) 57 57Ka Milo (HI) 31 22Kai Malu (HI) 25 2Santa Barbara Ranch (CA) 22 22Palmdale (CA) 18 18Crossroads (CA) 7 7Waihonua (HI) 2 2Total 1,162 1,08810
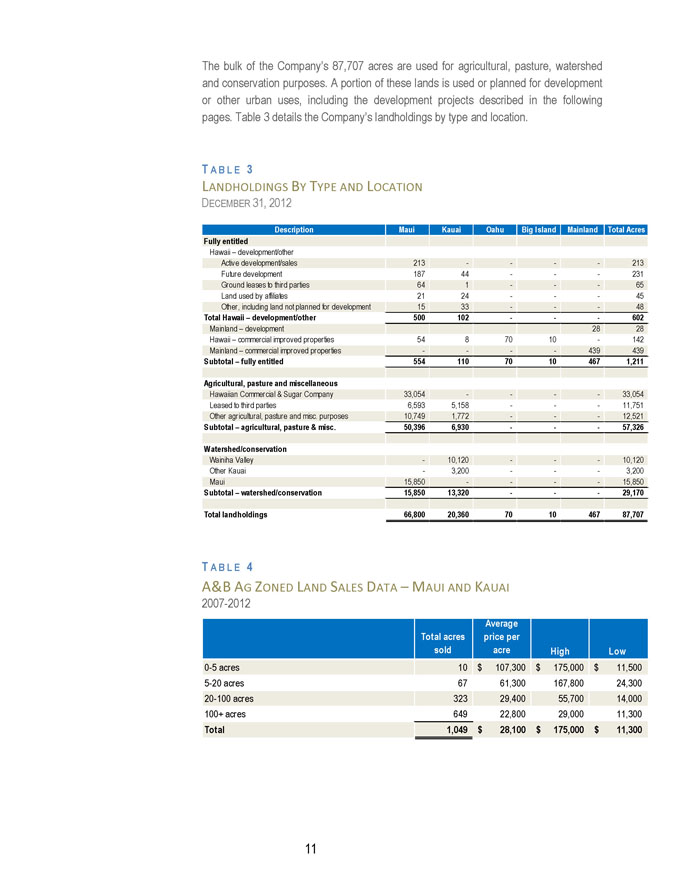
The bulk of the Company’s 87,707 acres are used for agricultural, pasture, watershed and conservation purposes. A portion of these lands is used or planned for development or other urban uses, including the development projects described in the following pages. Table 3 details the Company’s landholdings by type and location.TABLE 3LANDHOLDINGS BY TYPE AND LOCATIONDECEMBER 31, 2012Description Maui Kauai Oahu Big Island Mainland Total AcresFully entitledHawaii – development/otherActive development/sales 213 - - - - 213Future development 187 44 - - - 231Ground leases to third parties 64 1 - - - 65Land used by affiliates 21 24 - - - 45Other, including land not planned for development 15 33 - - - 48Total Hawaii – development/other 500 102 - - - 602Mainland – development 28 28Hawaii – commercial improved properties 54 8 70 10 - 142Mainland – commercial improved properties - - - - 439 439Subtotal – fully entitled 554 110 70 10 467 1,211Agricultural, pasture and miscellaneousHawaiian Commercial & Sugar Company 33,054 - - - - 33,054Leased to third parties 6,593 5,158 - - - 11,751Other agricultural, pasture and misc. purposes 10,749 1,772 - - - 12,521Subtotal – agricultural, pasture & misc. 50,396 6,930 - - - 57,326Watershed/conservationWainiha Valley - 10,120 - - - 10,120Other Kauai - 3,200 - - - 3,200Maui 15,850 - - - - 15,850Subtotal – watershed/conservation 15,850 13,320 - - - 29,170Total landholdings 66,800 20,360 70 10 467 87,707TABLE 4A&B AG ZONED LAND SALES DATA – MAUI AND KAUAI2007-2012AverageTotal acres price persold acre High Low0-5 acres 10 $107,300 $175,000 $11,5005-20 acres 67 61,300 167,800 24,30020-100 acres 323 29,400 55,700 14,000100+ acres 649 22,800 29,000 11,300Total 1,049 $28,100 $175,000 $11,30011
THIS PAGE WAS INTENTIONALLY LEFT BLANK.12
Alexander & Baldwin, Inc. Real Estate SupplementREAL ESTATE SALES13
Real Estate Sales Segment Strategy and OperationsThe real estate sales segment generates its operating profit through the development and sale of pipeline projects, raw lands and commercial properties from the real estate leasing segment portfolio, and the equity in earnings of joint ventures.The real estate sales segment primarily seeks to create shareholder value through an active, comprehensive, Hawaii-centric program of land stewardship, planning, entitlement, investment, development and sale of real estate. The segment’s primary strategic objectives include:FOCUS ON ENTITLEMENT AND DEVELOPMENT OF LEGACY HAWAII LANDSA&B focuses on the development of a portion of its core landholdings in Hawaii, pursuing appropriate entitlement and development projects that respond to market demand while meeting community needs. The large amount of land that the Company owns on Maui and Kauai provides opportunities for A&B to serve a wide range of markets.INVEST IN HIGH-RETURNING REAL ESTATE OPPORTUNITIES IN HAWAIIIn addition to the development of its legacy lands, since 1998, A&B has invested in attractive development opportunities across Hawaii, leveraging market knowledge, development expertise, entitlement experience and financial strength to both create shareholder value and diversify its development portfolio and pipeline.EXPAND PIPELINE PROJECTS FOR MARKET RECOVERYA&B’s pipeline of development projects encompasses a broad range of real estate product types, including residential and commercial properties. A&B works to continuously expand this pipeline to meet the demands of a recovering real estate market.UTILIZE STRATEGIC JOINT VENTURES WITH A WIDE VARIETY OF PARTNERSA&B pursues joint ventures and other strategic relationships, where appropriate, with a wide variety of locally, nationally and globally prominent land owners, real estate planning, development, and financing companies, home builders, and construction firms. In doing so, it supplements its in-house capabilities, accesses third-party capital, gains access to new opportunities in the Hawaii market, diversifies its pipeline, and optimizes risk-adjusted returns.14
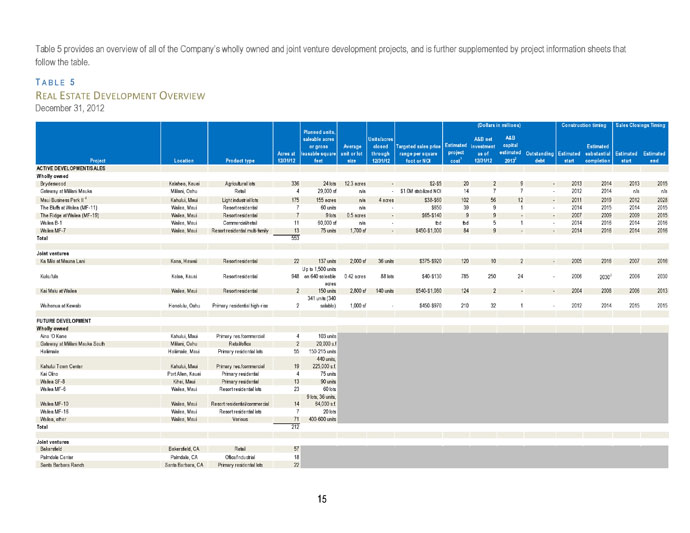
Table 5 provides an overview of all of the Company’s wholly owned and joint venture development projects, and is further supplemented by project information sheets thatfollow the table.TABLE 5REAL ESTATE DEVELOPMENT OVERVIEWDecember 31, 2012Planned units, (Dollars in millions) Construction timing Sales Closings TimingA&B net A&Bsaleable acres Units/acresAverage Estimated capital Estimatedor gross closed Targeted sales price investmentAcres at leasable square unit or lot through range per square project as of estimated Outstanding Estimated substantial Estimated EstimatedProject Location Product type 12/31/12 feet size 12/31/12 foot or NOI cost1 12/31/12 20132 debt start completion start endACTIVE DEVELOPMENT/SALESWholly owned Agricultural lotsBrydeswood Kalaheo, Kauai 336 24 lots 12.3 acres - $2-$5 20 2 9 - 2013 2014 2013 2015Gateway at Mililani Mauka Mililani, Oahu Retail 4 29,000 sf n/a - $1.0M stabilized NOI 14 7 7 - 2012 2014 n/a n/aMaui Business Park II 4 Kahului, Maui Light industrial lots 175 155 acres n/a 4 acres $38-$60 102 56 12 - 2011 2019 2012 2028The Bluffs at Wailea (MF-11) Wailea, Maui Resort residential 7 60 units n/a - $650 39 9 1 - 2014 2015 2014 2015The Ridge at Wailea (MF-19) Wailea, Maui Resort residential 7 9 lots 0.5 acres - $65-$140 9 9 - - 2007 2009 2009 2015Wailea B-1 Wailea, Maui Commercial/retail 11 60,000 sf n/a - tbd tbd 5 1 - 2014 2016 2014 2016Wailea MF-7 Wailea, Maui Resort residential multi-family 13 75 units 1,700 sf - $450-$1,000 84 9 - - 2014 2016 2014 2016Total 553Joint venturesKa Milo at Mauna Lani Kona, Hawaii Resort residential 22 137 units 2,000 sf 36 units $375-$920 120 10 2 - 2005 2016 2007 2016Kukui'ula Koloa, Kauai Resort residential 948 Up to 1,500 units 20303on 640 saleable 0.42 acres 88 lots $40-$130 785 250 24 - 2006 2006 2030Kai Malu at Wailea Wailea, Maui Resort residential 2 acres150 units 2,800 sf 140 units $540-$1,080 124 2 - - 2004 2008 2006 2013341 units (340Waihonua at Kewalo Honolulu, Oahu Primary residential high-rise 2 salable) 1,000 sf - $450-$970 210 32 1 - 2012 2014 2015 2015FUTURE DEVELOPMENTWholly ownedAina 'O Kane Kahului, Maui Primary res./commercial 4 103 unitsGateway at Mililani Mauka South Mililani, Oahu Retail/office 2 20,000 s.fHaliimaile Haliimaile, Maui Primary residential lots 55 150-215 unitsKahului Town Center Kahului, Maui Primary res./commercial 19 440 units,225,000 s.f.Kai Olino Port Allen, Kauai Primary residential 4 75 unitsWailea SF-8 Kihei, Maui Primary residential 13 90 unitsWailea MF-6 Wailea, Maui Resort residential lots 23 60 lotsWailea MF-10 Wailea, Maui Resort residential/commercial 14 9 lots, 36 units,64,000 s.f.Wailea MF-16 Wailea, Maui Resort residential lots 7 20 lotsWailea, other Wailea, Maui Various 71 400-600 unitsTotal 212Joint venturesBakersfield Bakersfield, CA Retail 57Palmdale Center Palmdale, CA Office/Industrial 18Santa Barbara Ranch Santa Barbara, CA Primary residential lots 2215
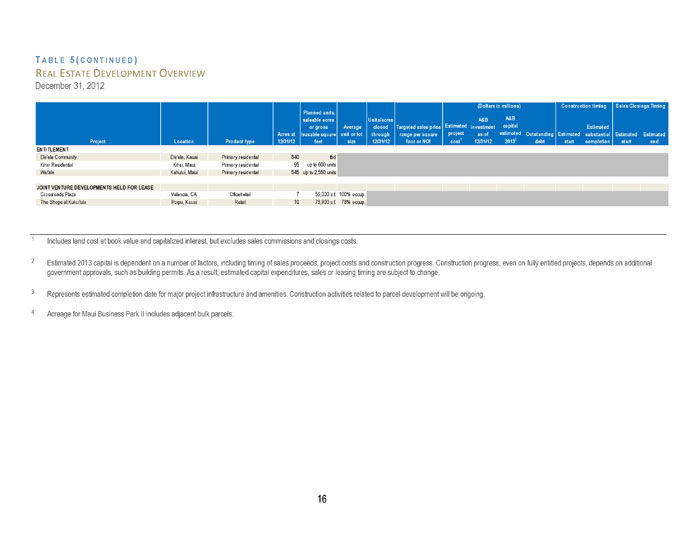
TABLE 5 (CONTINUED)REAL ESTATE DEVELOPMENT OVERVIEWDecember 31, 2012Planned units, (Dollars in millions) Construction timing Sales Closings TimingA&B A&Bsaleable acres Units/acresAverage Estimated capitalor gross closed Targeted sales price investment EstimatedAcres at leasable square unit or lot through range per square project as of estimated Outstanding Estimated substantial Estimated EstimatedProject Location Product type 12/31/12 feet size 12/31/12 foot or NOI cost1 12/31/12 20132 debt start completion start endENTITLEMENTEle'ele Community Ele'ele, Kauai Primary residential 840 tbdKihei Residential Kihei, Maui Primary residential 95 up to 600 unitsWai'ale Kahului, Maui Primary residential 545 up to 2,550 unitsJOINT VENTURE DEVELOPMENTS HELD FOR LEASE Valencia, CA Office/retail 7 56,000 s.f. 100% occup.Crossroads PlazaThe Shops at Kukui'ula Poipu, Kauai Retail 10 78,900 s.f. 78% occup.1 Includes land cost at book value and capitalized interest, but excludes sales commissions and closings costs.2 Estimated 2013 capital is dependent on a number of factors, including timing of sales proceeds, project costs and construction progress. Construction progress, even on fully entitled projects, depends on additional government approvals, such as building permits. As a result, estimated capital expenditures, sales or leasing timing are subject to change.3 Represents estimated completion date for major project infrastructure and amenities. Construction activities related to parcel development will be ongoing.4 Acreage for Maui Business Park II includes adjacent bulk parcels.16
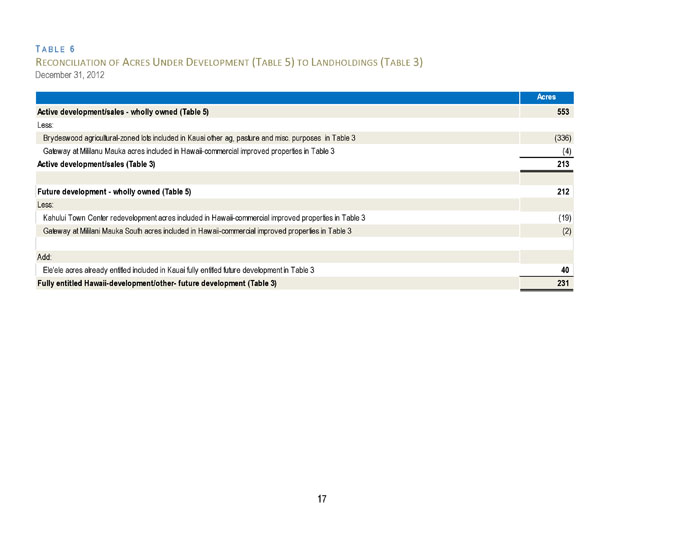
TABLE 6RECONCILIATION OF ACRES UNDER DEVELOPMENT (TABLE 5) TO LANDHOLDINGS (TABLE 3)December 31, 2012AcresActive development/sales - wholly owned (Table 5) 553Less:Brydeswood agricultural-zoned lots included in Kauai other ag, pasture and misc. purposes in Table 3 (336)Gateway at Mililanu Mauka acres included in Hawaii-commercial improved properties in Table 3 (4)Active development/sales (Table 3) 213Future development - wholly owned (Table 5) 212Less:Kahului Town Center redevelopment acres included in Hawaii-commercial improved properties in Table 3 (19)Gateway at Mililani Mauka South acres included in Hawaii-commercial improved properties in Table 3 (2)Add:Ele'ele acres already entitled included in Kauai fully entitled future development in Table 3 40Fully entitled Hawaii-development/other- future development (Table 3) 23117
THIS PAGE WAS INTENTIONALLY LEFT BLANK.18
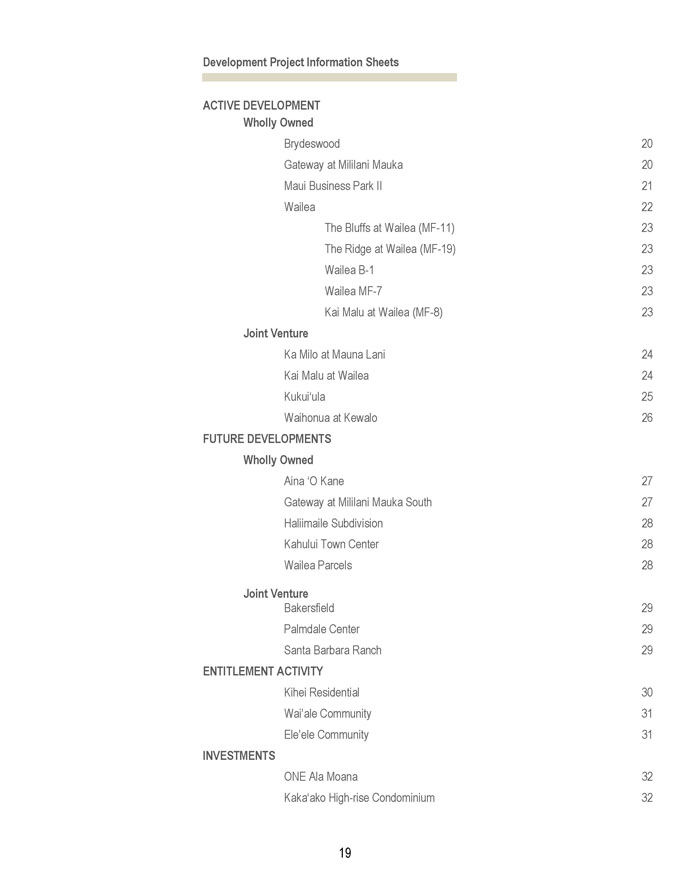
Development Project Information SheetsACTIVE DEVELOPMENTWholly OwnedBrydeswood 20Gateway at Mililani Mauka 20Maui Business Park II 21Wailea 22The Bluffs at Wailea (MF-11) 23The Ridge at Wailea (MF-19) 23Wailea B-1 23Wailea MF-7 23Kai Malu at Wailea (MF-8) 23Joint VentureKa Milo at Mauna Lani 24Kai Malu at Wailea 24Kukui‘ula 25Waihonua at Kewalo 26FUTURE DEVELOPMENTSWholly OwnedAina ‘O Kane 27Gateway at Mililani Mauka South 27Haliimaile Subdivision 28Kahului Town Center 28Wailea Parcels 28Joint VentureBakersfield 29Palmdale Center 29Santa Barbara Ranch 29ENTITLEMENT ACTIVITYKihei Residential 30Wai’ale Community 31Ele’ele Community 31INVESTMENTSONE Ala Moana 32Kaka‘ako High-rise Condominium 3219
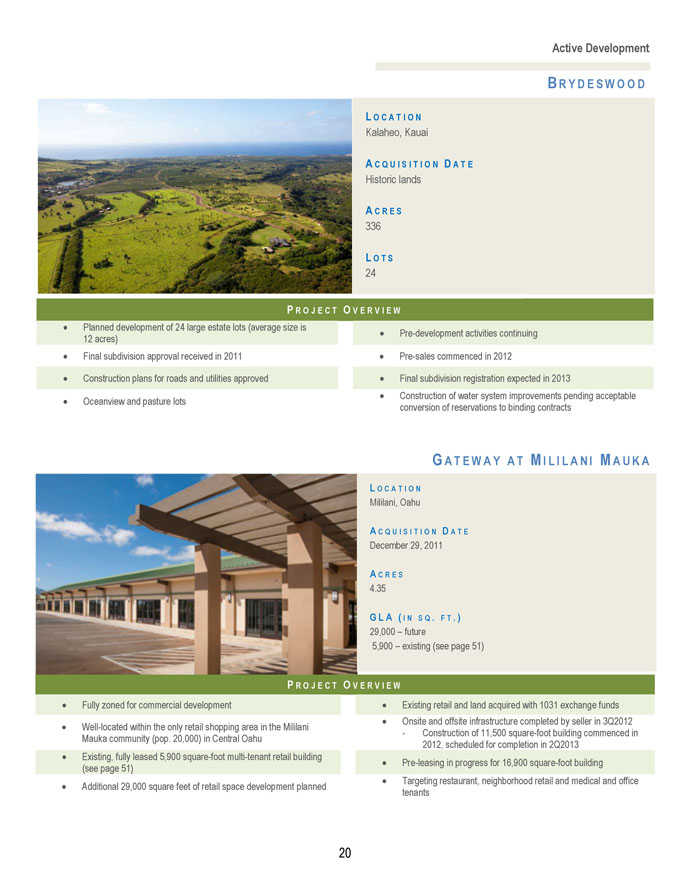
Active DevelopmentBRYDESWOODLOCATIONKalaheo, KauaiACQUISITIONDATEHistoric landsACRES336LOTS24PROJECT OVERVIEW• Planned development of 24 large estate lots (average size is • Pre-development activities continuing12 acres)• Final subdivision approval received in 2011• Construction plans for roads and utilities approved• Oceanview and pasture lots• Pre-sales commenced in 2012• Final subdivision registration expected in 2013• Construction of water system improvements pending acceptable conversion of reservations to binding contractsGATEWAY AT MILILANI MAUKALOCATIONMililani, OahuACQUISITION DATEDecember 29, 2011ACRES4.35GLA (IN SQ. FT.)29,000 – future5,900 – existing (see page 51)PROJECT OVERVIEW• Fully zoned for commercial development• Well-located within the only retail shopping area in the Mililani Mauka community (pop. 20,000) in Central Oahu• Existing, fully leased 5,900 square-foot multi-tenant retail building (see page 51)• Additional 29,000 square feet of retail space development planned• Existing retail and land acquired with 1031 exchange funds• Onsite and offsite infrastructure completed by seller in 3Q2012- Construction of 11,500 square-foot building commenced in 2012, scheduled for completion in 2Q2013• Pre-leasing in progress for 16,900 square-foot building• Targeting restaurant, neighborhood retail and medical and office tenants20
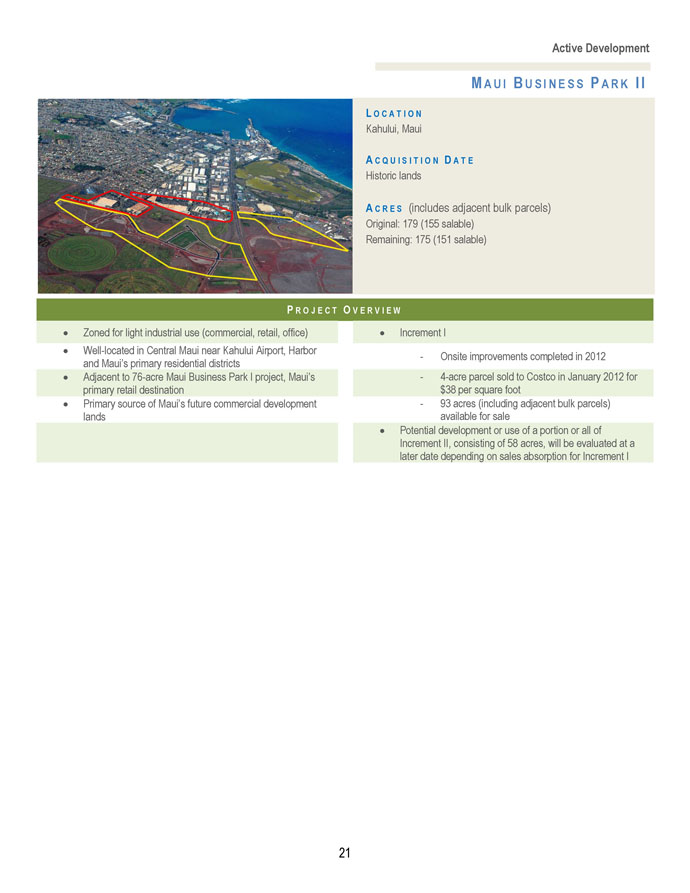
Active DevelopmentMAUI BUSINESS PARKIILOCATIONKahului, MauiACQUISITION DATEHistoric landsACRES (includes adjacent bulk parcels)Original: 179 (155 salable)Remaining: 175 (151 salable)PROJECT OVERVIEW• Zoned for light industrial use (commercial, retail, office)• Well-located in Central Maui near Kahului Airport, Harbor and Maui’s primary residential districts• Adjacent to 76-acre Maui Business Park I project, Maui’s primary retail destination• Primary source of Maui’s future commercial development lands• Increment I- Onsite improvements completed in 2012- 4-acre parcel sold to Costco in January 2012 for $38 per square foot- 93 acres (including adjacent bulk parcels) available for sale• Potential development or use of a portion or all of Increment II, consisting of 58 acres, will be evaluated at a later date depending on sales absorption for Increment I21
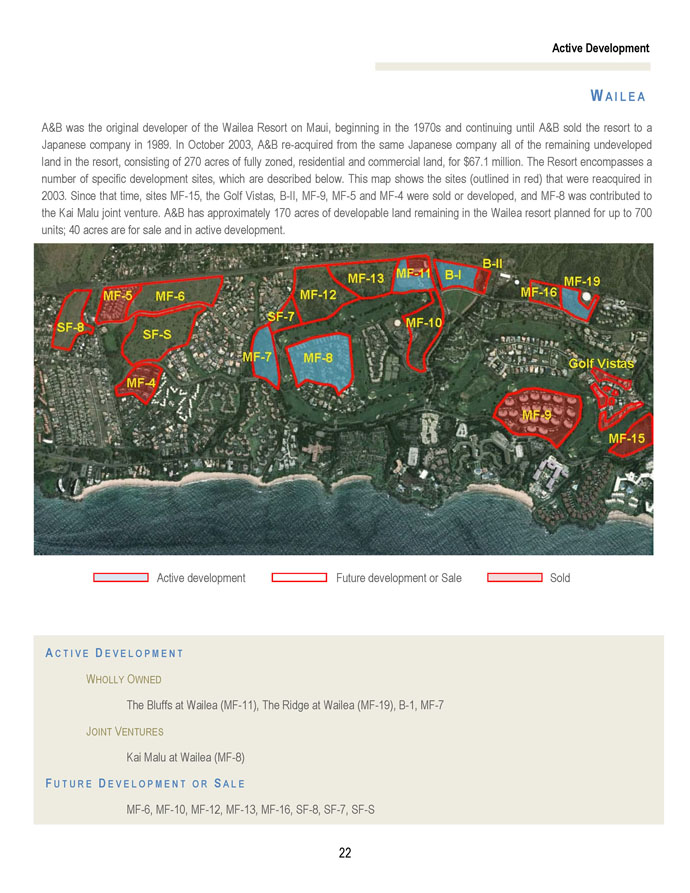
Active DevelopmentWAILEAA&B was the original developer of the Wailea Resort on Maui, beginning in the 1970s and continuing until A&B sold the resort to a Japanese company in 1989. In October 2003, A&B re-acquired from the same Japanese company all of the remaining undeveloped land in the resort, consisting of 270 acres of fully zoned, residential and commercial land, for $67.1 million. The Resort encompasses a number of specific development sites, which are described below. This map shows the sites (outlined in red) that were reacquired in 2003. Since that time, sites MF-15, the Golf Vistas, B-II, MF-9, MF-5 and MF-4 were sold or developed, and MF-8 was contributed to the Kai Malu joint venture. A&B has approximately 170 acres of developable land remaining in the Wailea resort planned for up to 700 units; 40 acres are for sale and in active development.Active development Future development or Sale SoldACTIVE DEVELOPMENTWHOLLY OWNEDThe Bluffs at Wailea (MF-11), The Ridge at Wailea (MF-19), B-1, MF-7JOINT VENTURESKai Malu at Wailea (MF-8)FUTURE DEVELOPMENTOR SALEMF-6, MF-10, MF-12, MF-13, MF-16, SF-8, SF-7, SF-S22
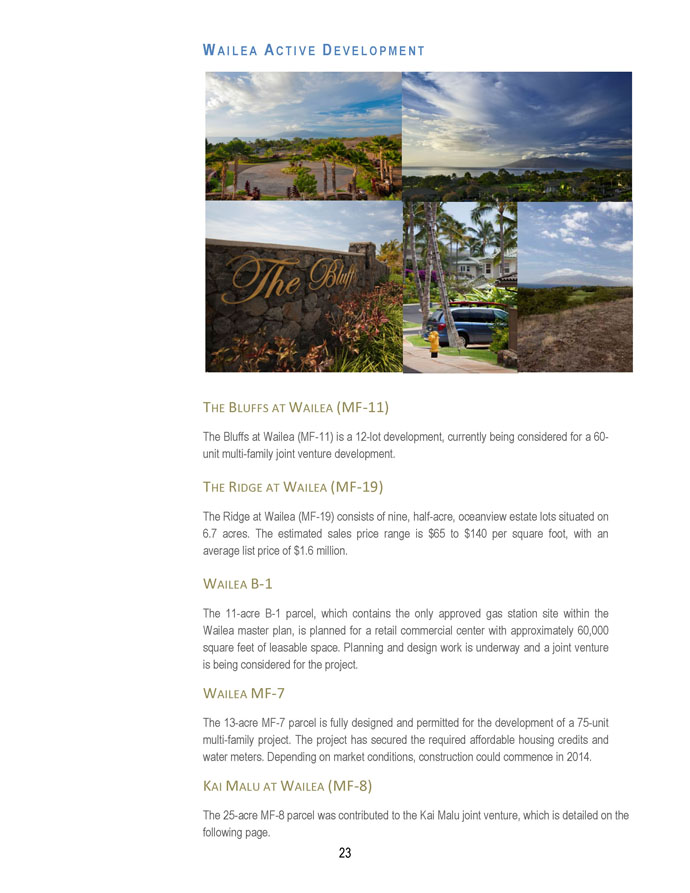
WAILEA ACTIVE DEVELOPMENTTHE BLUFFS AT WAILEA (MF-11)The Bluffs at Wailea (MF-11) is a 12-lot development, currently being considered for a 60-unit multi-family joint venture development.THE RIDGE AT WAILEA (MF-19)The Ridge at Wailea (MF-19) consists of nine, half-acre, oceanview estate lots situated on 6.7 acres. The estimated sales price range is $65 to $140 per square foot, with an average list price of $1.6 million.WAILEA B-1The 11-acre B-1 parcel, which contains the only approved gas station site within the Wailea master plan, is planned for a retail commercial center with approximately 60,000 square feet of leasable space. Planning and design work is underway and a joint venture is being considered for the project.WAILEA MF-7The 13-acre MF-7 parcel is fully designed and permitted for the development of a 75-unit multi-family project. The project has secured the required affordable housing credits and water meters. Depending on market conditions, construction could commence in 2014.KAI MALU AT WAILEA (MF-8)The 25-acre MF-8 parcel was contributed to the Kai Malu joint venture, which is detailed on the following page.23
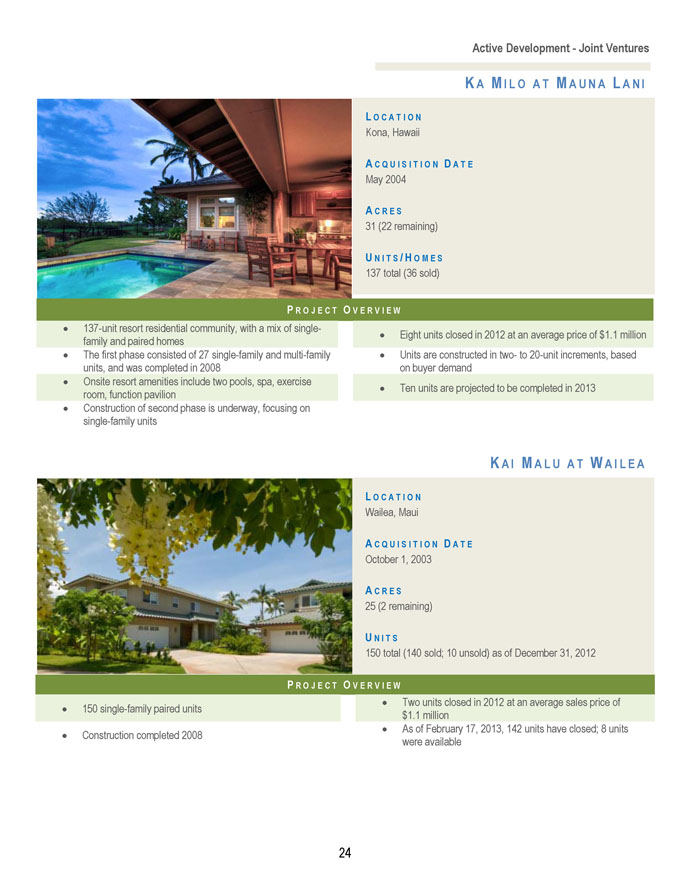
Active Development - Joint VenturesKA MILO AT MAUNA LANILOCATIONKona, HawaiiACQUISITION DATEMay 2004ACRES31 (22 remaining)UNITS / HOMES137 total (36 sold)PROJECT OVERVIEW• 137-unit resort residential community, with a mix of single-family and paired homes• The first phase consisted of 27 single-family and multi-family units, and was completed in 2008• Onsite resort amenities include two pools, spa, exercise room, function pavilion• Construction of second phase is underway, focusing on single-family unitsPROJECT• 150 single-family paired units• Construction completed 2008• Eight units closed in 2012 at an average price of $1.1 million• Units are constructed in two- to 20-unit increments, based on buyer demand• Ten units are projected to be completed in 2013KAI MALU AT WAILEALOCATIONWailea, MauiACQUISITION DATEOctober 1, 2003ACRES25 (2 remaining)UNITS150 total (140 sold; 10 unsold) as of December 31, 2012OVERVIEW• Two units closed in 2012 at an average sales price of $1.1 million• As of February 17, 2013, 142 units have closed; 8 units were available24
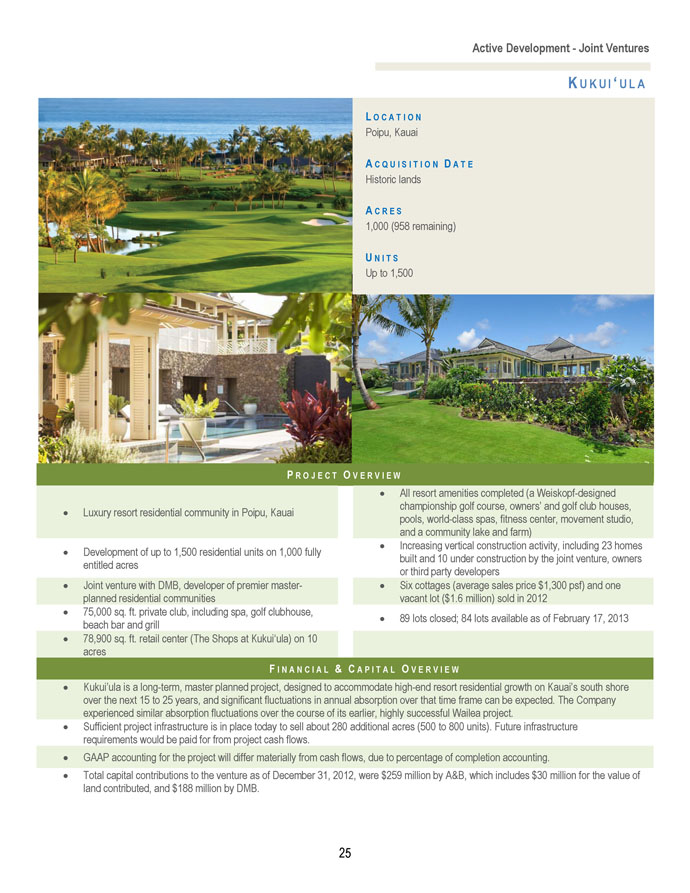
Active Development - Joint VenturesKUKUI‘ULALOCATIONPoipu, KauaiACQUISITION DATEHistoric landsACRES1,000 (958 remaining)UNITSUp to 1,500PROJECT OVERVIEW• Luxury resort residential community in Poipu, Kauai• Development of up to 1,500 residential units on 1,000 fully entitled acres• Joint venture with DMB, developer of premier master-planned residential communities• 75,000 sq. ft. private club, including spa, golf clubhouse, beach bar and grill• 78,900 sq. ft. retail center (The Shops at Kukui‘ula) on 10 acresFINANCIAL• All resort amenities completed (a Weiskopf-designed championship golf course, owners’ and golf club houses, pools, world-class spas, fitness center, movement studio, and a community lake and farm)• Increasing vertical construction activity, including 23 homes built and 10 under construction by the joint venture, owners or third party developers• Six cottages (average sales price $1,300 psf) and one vacant lot ($1.6 million) sold in 2012• 89 lots closed; 84 lots available as of February 17, 2013& CAPITAL OVERVIEW• Kukui’ula is a long-term, master planned project, designed to accommodate high-end resort residential growth on Kauai’s south shore over the next 15 to 25 years, and significant fluctuations in annual absorption over that time frame can be expected. The Company experienced similar absorption fluctuations over the course of its earlier, highly successful Wailea project.• Sufficient project infrastructure is in place today to sell about 280 additional acres (500 to 800 units). Future infrastructure requirements would be paid for from project cash flows.• GAAP accounting for the project will differ materially from cash flows, due to percentage of completion accounting.• Total capital contributions to the venture as of December 31, 2012, were $259 million by A&B, which includes $30 million for the value of land contributed, and $188 million by DMB.25
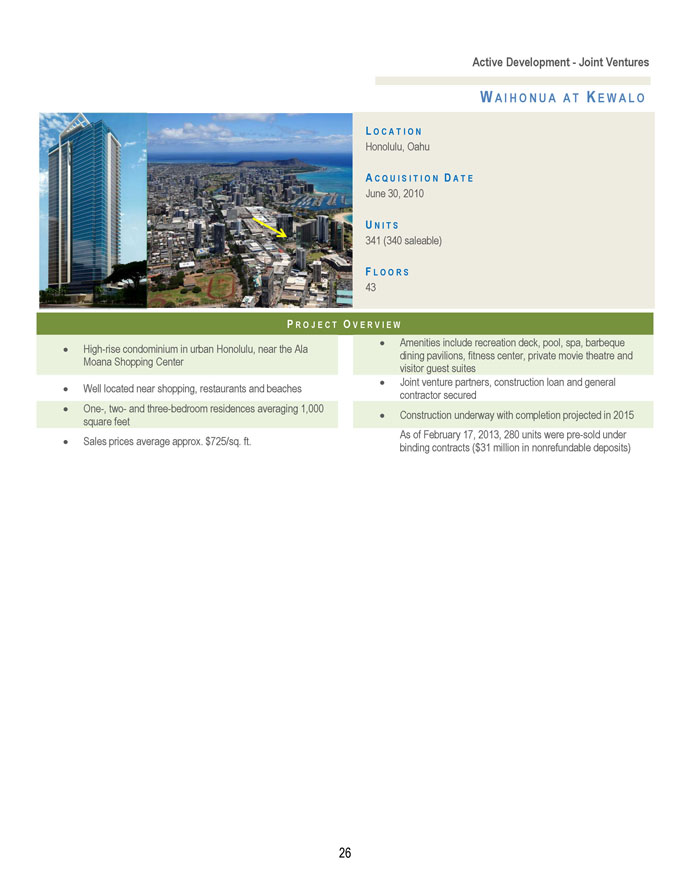
Active Development - Joint VenturesWAIHONUAATKEWALOLOCATIONHonolulu, OahuACQUISITION DATEJune 30, 2010UNITS341 (340 saleable)FLOORS43PROJECT OVERVIEW• High-rise condominium in urban Honolulu, near the Ala Moana Shopping Center• Well located near shopping, restaurants and beaches• One-, two- and three-bedroom residences averaging 1,000 square feet• Sales prices average approx. $725/sq. ft.• Amenities include recreation deck, pool, spa, barbeque dining pavilions, fitness center, private movie theatre and visitor guest suites• Joint venture partners, construction loan and general contractor secured• Construction underway with completion projected in 2015As of February 17, 2013, 280 units were pre-sold under binding contracts ($31 million in nonrefundable deposits)26
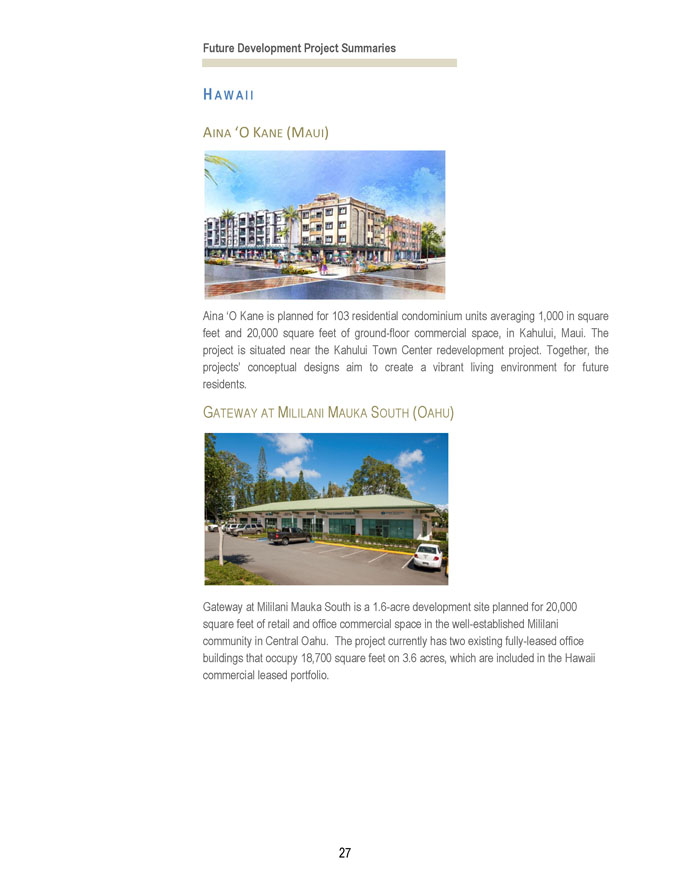
Future Development Project SummariesHAWAIIAINA ‘O KANE (MAUI)Aina ‘O Kane is planned for 103 residential condominium units averaging 1,000 in square feet and 20,000 square feet of ground-floor commercial space, in Kahului, Maui. The project is situated near the Kahului Town Center redevelopment project. Together, the projects’ conceptual designs aim to create a vibrant living environment for future residents.GATEWAY AT MILILANI MAUKA SOUTH (OAHU)Gateway at Mililani Mauka South is a 1.6-acre development site planned for 20,000 square feet of retail and office commercial space in the well-established Mililani community in Central Oahu. The project currently has two existing fully-leased office buildings that occupy 18,700 square feet on 3.6 acres, which are included in the Hawaii commercial leased portfolio.27
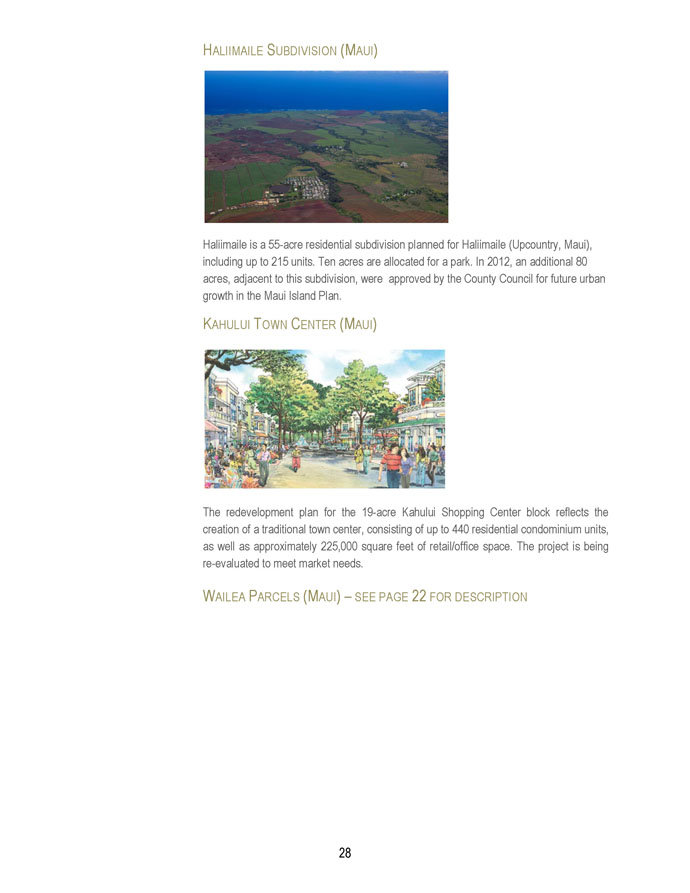
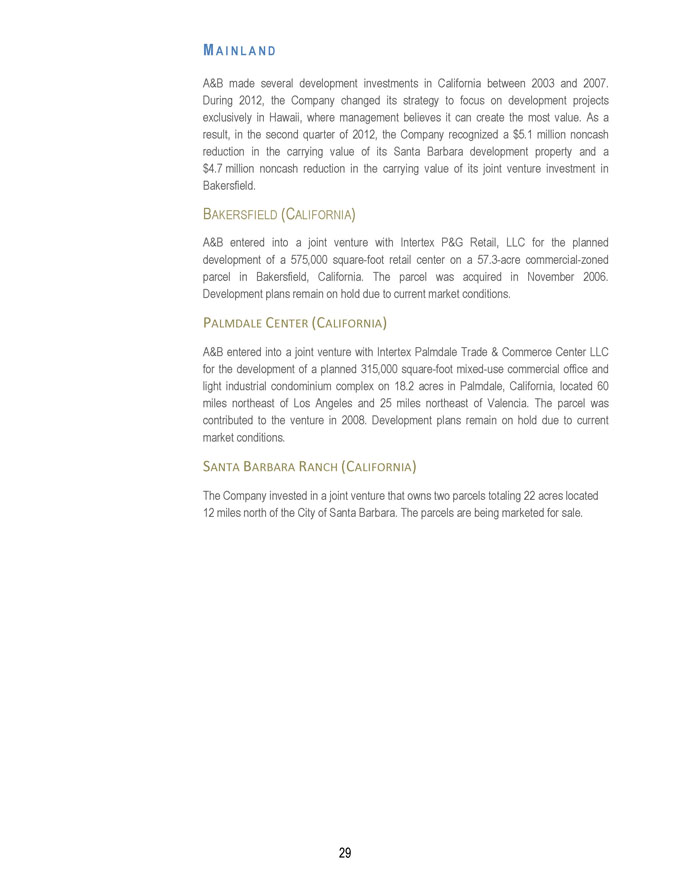
HALIIMAILE SUBDIVISION (MAUI)Haliimaile is a 55-acre residential subdivision planned for Haliimaile (Upcountry, Maui), including up to 215 units. Ten acres are allocated for a park. In 2012, an additional 80 acres, adjacent to this subdivision, were approved by the County Council for future urban growth in the Maui Island Plan.KAHULUI TOWN CENTER (MAUI)The redevelopment plan for the 19-acre Kahului Shopping Center block reflects the creation of a traditional town center, consisting of up to 440 residential condominium units, as well as approximately 225,000 square feet of retail/office space. The project is being re-evaluated to meet market needs.WAILEA PARCELS (MAUI) – SEE PAGE 22 FOR DESCRIPTION28
MAIN LANDA&B made several development investments in California between 2003 and 2007. During 2012, the Company changed its strategy to focus on development projects exclusively in Hawaii, where management believes it can create the most value. As a result, in the second quarter of 2012, the Company recognized a $5.1 million noncash reduction in the carrying value of its Santa Barbara development property and a $4.7 million noncash reduction in the carrying value of its joint venture investment in Bakersfield.BAKERSFIELD (CALIFORNIA)A&B entered into a joint venture with Intertex P&G Retail, LLC for the planned development of a 575,000 square-foot retail center on a 57.3-acre commercial-zoned parcel in Bakersfield, California. The parcel was acquired in November 2006. Development plans remain on hold due to current market conditions.PALMDALE CENTER (CALIFORNIA)A&B entered into a joint venture with Intertex Palmdale Trade & Commerce Center LLC for the development of a planned 315,000 square-foot mixed-use commercial office and light industrial condominium complex on 18.2 acres in Palmdale, California, located 60 miles northeast of Los Angeles and 25 miles northeast of Valencia. The parcel was contributed to the venture in 2008. Development plans remain on hold due to current market conditions.SANTA BARBARA RANCH (CALIFORNIA)The Company invested in a joint venture that owns two parcels totaling 22 acres located 12 miles north of the City of Santa Barbara. The parcels are being marketed for sale.29
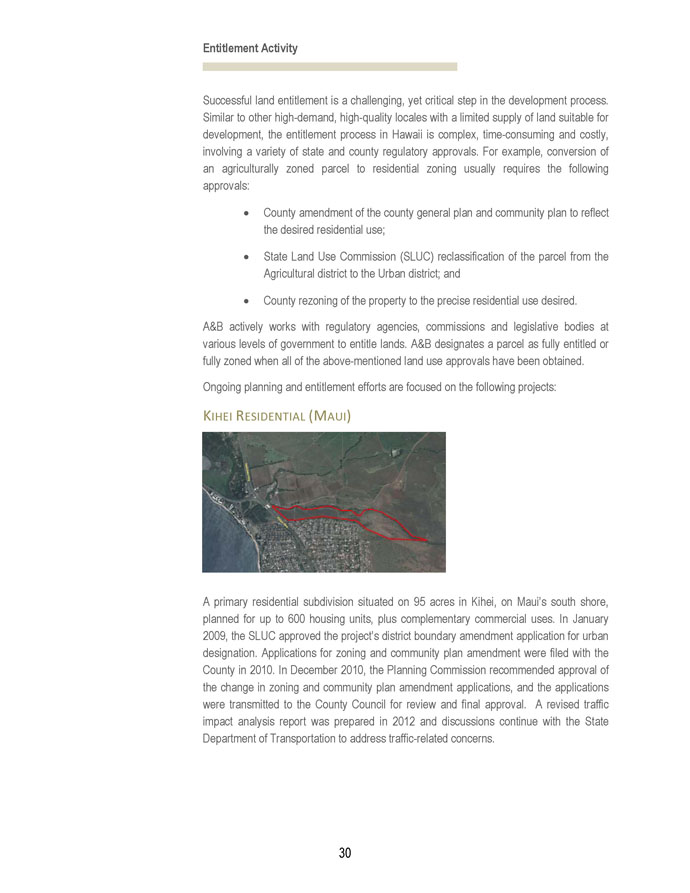
Entitlement ActivitySuccessful land entitlement is a challenging, yet critical step in the development process. Similar to other high-demand, high-quality locales with a limited supply of land suitable for development, the entitlement process in Hawaii is complex, time-consuming and costly, involving a variety of state and county regulatory approvals. For example, conversion of an agriculturally zoned parcel to residential zoning usually requires the following approvals:• County amendment of the county general plan and community plan to reflect the desired residential use;• State Land Use Commission (SLUC) reclassification of the parcel from the Agricultural district to the Urban district; and• County rezoning of the property to the precise residential use desired.A&B actively works with regulatory agencies, commissions and legislative bodies at various levels of government to entitle lands. A&B designates a parcel as fully entitled or fully zoned when all of the above-mentioned land use approvals have been obtained.Ongoing planning and entitlement efforts are focused on the following projects:KIHEI RESIDENTIAL (MAUI)A primary residential subdivision situated on 95 acres in Kihei, on Maui’s south shore, planned for up to 600 housing units, plus complementary commercial uses. In January 2009, the SLUC approved the project’s district boundary amendment application for urban designation. Applications for zoning and community plan amendment were filed with the County in 2010. In December 2010, the Planning Commission recommended approval of the change in zoning and community plan amendment applications, and the applications were transmitted to the County Council for review and final approval. A revised traffic impact analysis report was prepared in 2012 and discussions continue with the State Department of Transportation to address traffic-related concerns.30
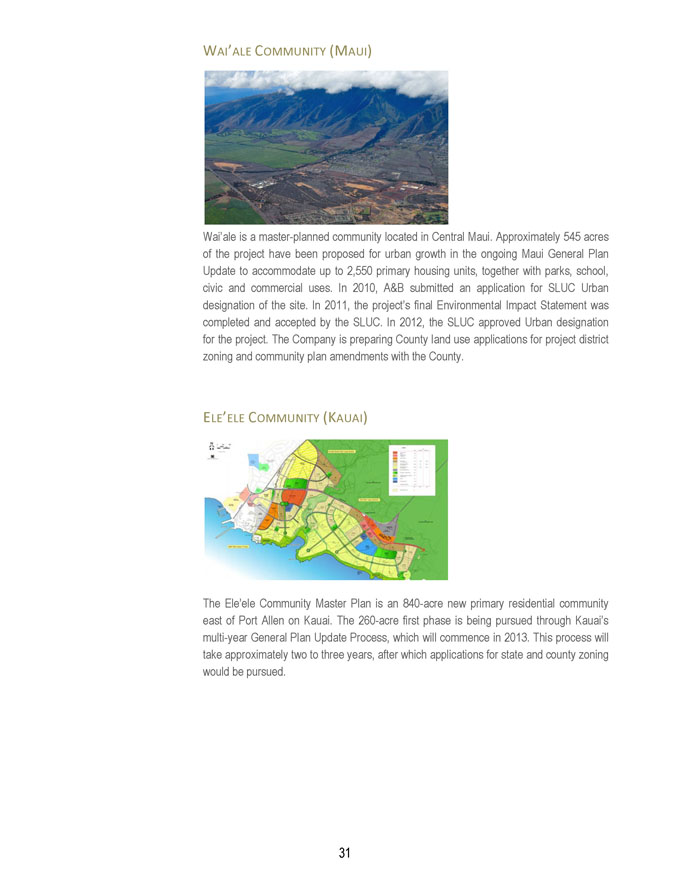
WAI’ALE COMMUNITY (MAUI)Wai’ale is a master-planned community located in Central Maui. Approximately 545 acres of the project have been proposed for urban growth in the ongoing Maui General Plan Update to accommodate up to 2,550 primary housing units, together with parks, school, civic and commercial uses. In 2010, A&B submitted an application for SLUC Urban designation of the site. In 2011, the project’s final Environmental Impact Statement was completed and accepted by the SLUC. In 2012, the SLUC approved Urban designation for the project. The Company is preparing County land use applications for project district zoning and community plan amendments with the County.ELE’ELE COMMUNITY (KAUAI)The Ele’ele Community Master Plan is an 840-acre new primary residential community east of Port Allen on Kauai. The 260-acre first phase is being pursued through Kauai’s multi-year General Plan Update Process, which will commence in 2013. This process will take approximately two to three years, after which applications for state and county zoning would be pursued.31
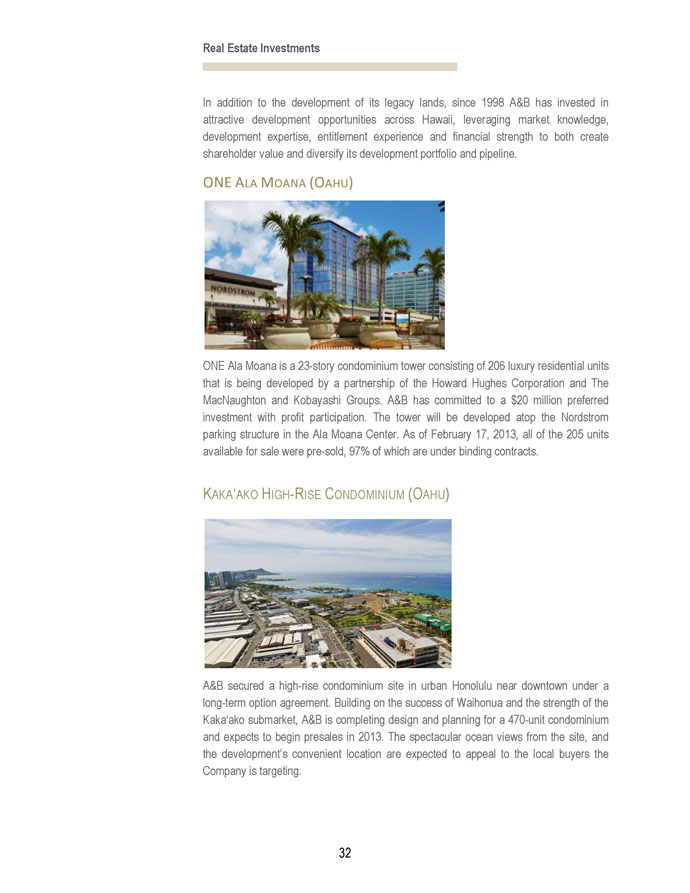
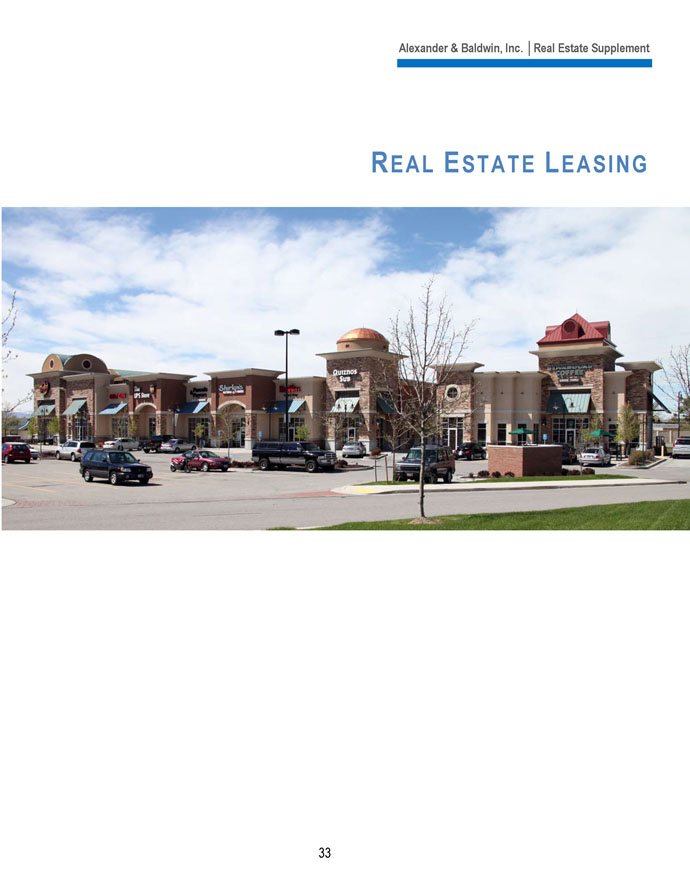
Real Estate InvestmentsIn addition to the development of its legacy lands, since 1998 A&B has invested in attractive development opportunities across Hawaii, leveraging market knowledge, development expertise, entitlement experience and financial strength to both create shareholder value and diversify its development portfolio and pipeline.ONE ALA MOANA (OAHU)ONE Ala Moana is a 23-story condominium tower consisting of 206 luxury residential units that is being developed by a partnership of the Howard Hughes Corporation and The MacNaughton and Kobayashi Groups. A&B has committed to a $20 million preferred investment with profit participation. The tower will be developed atop the Nordstrom parking structure in the Ala Moana Center. As of February 17, 2013, all of the 205 units available for sale were pre-sold, 97% of which are under binding contracts.KAKA‘AKO HIGH-RISE CONDOMINIUM (OAHU)A&B secured a high-rise condominium site in urban Honolulu near downtown under a long-term option agreement. Building on the success of Waihonua and the strength of the Kaka‘ako submarket, A&B is completing design and planning for a 470-unit condominium and expects to begin presales in 2013. The spectacular ocean views from the site, and the development’s convenient location are expected to appeal to the local buyers the Company is targeting.32
Alexander & Baldwin, Inc. Real Estate SupplementREAL ESTATE LEASING33
Real Estate Leasing Segment Strategy and OperationsThe real estate leasing segment owns, operates and manages commercial properties. It focuses on acquiring high-quality retail, office and industrial properties in good locations, effectively managing those properties to increase margins through higher occupancies and cost management, and positioning these assets for potential sale when full market value has been achieved.1 Real estate leasing income also includes revenue from a variety of land leases, licenses and other agreements related to real estate in Hawaii. From a strategic perspective, the relatively stable, recurring cash flows generated by the real estate leasing business act to counterbalance the cyclicality inherent in real estate sales results, as well as support development activities.A&B strives to increase the value of its commercial property portfolio through active management. Periodically, when A&B believes it has maximized the value of a select asset, it may market the asset for sale, or sell in response to an unsolicited offer. Upon sale, A&B will seek to redeploy the proceeds on a 1031 tax-deferred basis into a new asset with a higher return potential. Income taxes that are deferred utilizing the 1031 exchange process represent an interest-free source of capital that is used by the Company to generate incremental cash flow. Given the low historical cost basis of the Company’s lands, the strategy is particularly appealing to A&B. Over the years, the Company has deferred over $200 million of income taxes on the sale of raw land and improved properties. The tax benefits of the 1031 program also allow the Company to compete effectively for acquisitions, and earn attractive returns.As of December 31, 2012, A&B’s portfolio, which includes 45 income-producing properties comprising 7.9 million square feet of gross leasable area (6.5 million on the Mainland and 1.4 million in Hawaii), is well balanced among retail, office and industrial sectors and is geographically dispersed in eight Mainland states and Hawaii. While a disproportionate amount of total portfolio square footage is located on the Mainland, Net Operating Income (NOI) is more balanced, with Hawaii properties generating over 40% of the $63.1 million2 in total portfolio NOI.1 Any financial impact from such a sale would be reported in Real Estate Sales segment results.2 See page 41 for a statement on the Company’s use of NOI and a reconciliation of Leasing operating profit to Real Estate Leasing Cash NOI34
PORTFOLIO SEGMENT DESCRIPTIONHAWAII IMPROVED PROPERTIESA&B’s Hawaii improved property portfolio consists of 22 retail, office and industrial properties, comprising approximately 1.4 million square feet of leasable space. The majority of the commercial properties are located on Maui and Oahu, with smaller holdings in the area of Port Allen, Kauai, and the Big Island of Hawaii.HAWAII UNIMPROVED PROPERTIESThe Company leases and licenses a relatively small portion of its legacy lands on Maui and Kauai to third parties. These leases and licenses cover a wide variety of urban and agricultural lands, ranging from ground leases covering the fee interest in land underlying commercial properties, to farming and pasture leases, to licenses of remnant parcels and easement areas, to sand and aggregate quarry leases whose lease or royalty payments are based on extraction rates. Accordingly, both period-to-period results and rental revenue per land unit may be highly variable.MAINLAND IMPROVED PROPERTIESOn the Mainland, A&B owns a portfolio of 23 retail, office and industrial properties acquired primarily by way of 1031 tax-deferred exchanges. The Company’s Mainland portfolio comprises approximately 6.5 million square feet of leasable space.Summarized information for the Company’s portfolio as of and for the year ended December 31, 2012 follows.Hawaii Mainland TotalGLA (in millions) at 12/31/12Industrial 0.5 4.5 5.0Office 0.2 1.3 1.5Retail 0.7 0.7 1.4Total 1.4 6.5 7.92012 Average OccupancyIndustrial 93% 97% 96%Office 88% 85% 86%Retail 92% 86% 89%Total 92% 93% 93%2012 Cash NOI (in millions)1 $26.82 $36.3 $63.11 See page 41 for a statement on the Company’s use of NOI and a reconciliation of Leasing operating profit to Real Estate Leasing Cash NOI2 Includes $3.5 million of NOI from unimproved Hawaii properties35
Acquisition and Disposition StrategyThe Company believes that Hawaii is poised for growth, and further believes that given A&B’s combination of local market knowledge, relationship, and financial strength, it has a sustainable competitive advantage in investing in Hawaii commercial properties. As a result, it will seek to increasingly focus the portfolio’s geographic concentration to Hawaii over the long run. Given the relatively small number of suitable investment properties available in Hawaii at any given time, and the significant transactional restrictions that accompany the 1031 process, it is likely that the pace of commercial portfolio property sales in the future will be dictated largely by the availability of suitable Hawaii replacement investment opportunities.36
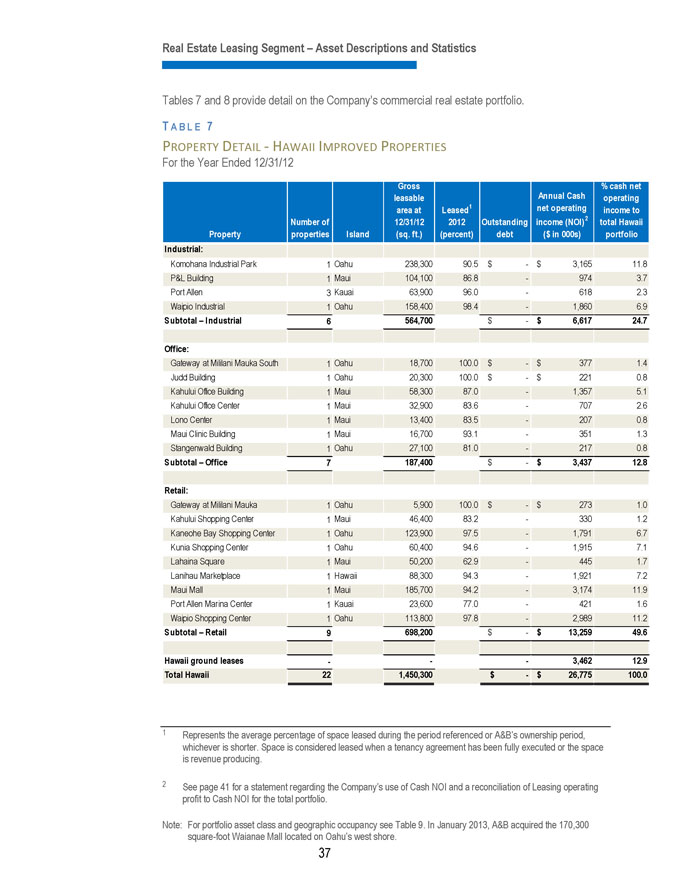
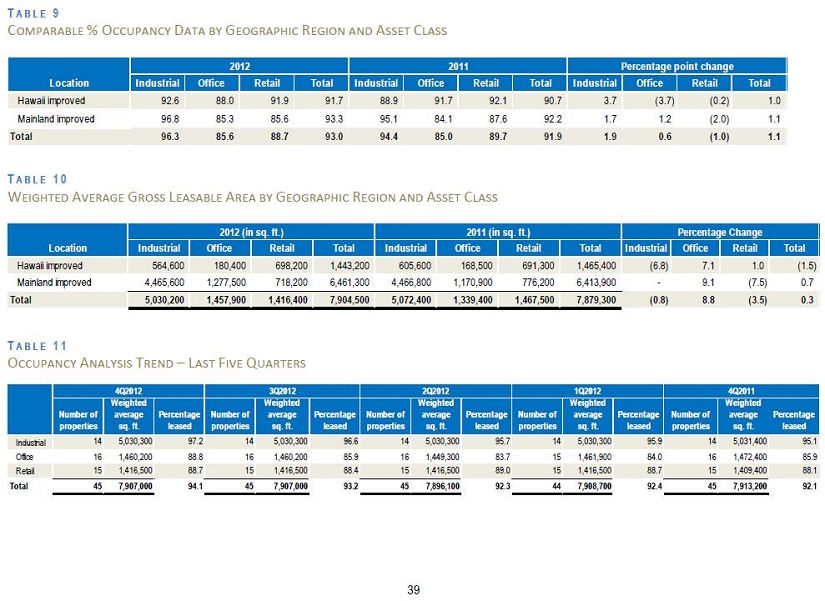
Real Estate Leasing Segment – Asset Descriptions and StatisticsTables 7 and 8 provide detail on the Company’s commercial real estate portfolio.TABLE 7PROPERTY DETAIL- HAWAII IMPROVED PROPERTIESFor the Year Ended 12/31/12Gross Annual Cash% cash netleasable operating1 net operatingarea at Leased income toincome (NOI)2Number of 12/31/12 2012 Outstanding total HawaiiProperty properties Island (sq. ft.) (percent) debt ($in 000s) portfolioIndustrial:Komohana Industrial Park 1 Oahu 238,300 90.5 $- $3,165 11.8P&L Building 1 Maui 104,100 86.8 - 974 3.7Port Allen 3 Kauai 63,900 96.0 - 618 2.3Waipio Industrial 1 Oahu 158,400 98.4 - 1,860 6.9Subtotal – Industrial 6 564,700 $- $6,617 24.7Office:Gateway at Mililani Mauka South 1 Oahu 18,700 100.0 $- $377 1.4Judd Building 1 Oahu 20,300 100.0 $- $221 0.8Kahului Office Building 1 Maui 58,300 87.0 - 1,357 5.1Kahului Office Center 1 Maui 32,900 83.6 - 707 2.6Lono Center 1 Maui 13,400 83.5 - 207 0.8Maui Clinic Building 1 Maui 16,700 93.1 - 351 1.3Stangenwald Building 1 Oahu 27,100 81.0 - 217 0.8Subtotal – Office 7 187,400 $- $3,437 12.8Retail:Gateway at Mililani Mauka 1 Oahu 5,900 100.0 $- $273 1.0Kahului Shopping Center 1 Maui 46,400 83.2 - 330 1.2Kaneohe Bay Shopping Center 1 Oahu 123,900 97.5 - 1,791 6.7Kunia Shopping Center 1 Oahu 60,400 94.6 - 1,915 7.1Lahaina Square 1 Maui 50,200 62.9 - 445 1.7Lanihau Marketplace 1 Hawaii 88,300 94.3 - 1,921 7.2Maui Mall 1 Maui 185,700 94.2 - 3,174 11.9Port Allen Marina Center 1 Kauai 23,600 77.0 - 421 1.6Waipio Shopping Center 1 Oahu 113,800 97.8 - 2,989 11.2Subtotal – Retail 9 698,200 $- $13,259 49.6Hawaii ground leases- - - 3,462 12.9Total Hawaii 22 1,450,300 $- $26,775 100.01 Represents the average percentage of space leased during the period referenced or A&B’s ownership period, whichever is shorter. Space is considered leased when a tenancy agreement has been fully executed or the space is revenue producing.2 See page 41 for a statement regarding the Company’s use of Cash NOI and a reconciliation of Leasing operating profit to Cash NOI for the total portfolio.Note: For portfolio asset class and geographic occupancy see Table 9. In January 2013, A&B acquired the 170,300 square-foot Waianae Mall located on Oahu’s west shore.37
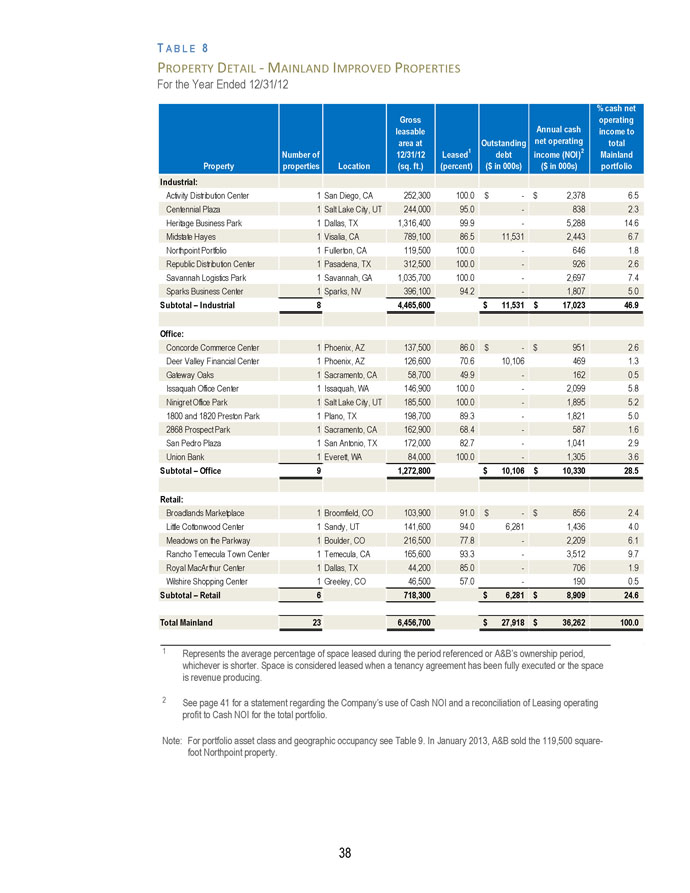
TABLE 8PROPERTY DETAIL- MAINLAND IMPROVED PROPERTIESFor the Year Ended 12/31/12% cash netGross Annual cash operatingleasable income toOutstanding net operatingarea at totalLeased1 income (NOI)2Number of 12/31/12 debt MainlandProperty properties Location (sq. ft.) (percent) ($in 000s) ($in 000s) portfolioIndustrial:Activity Distribution Center 1 San Diego, CA 252,300 100.0 $- $2,378 6.5Centennial Plaza 1 Salt Lake City, UT 244,000 95.0 - 838 2.3Heritage Business Park 1 Dallas, TX 1,316,400 99.9 - 5,288 14.6Midstate Hayes 1 Visalia, CA 789,100 86.5 11,531 2,443 6.7Northpoint Portfolio 1 Fullerton, CA 119,500 100.0 - 646 1.8Republic Distribution Center 1 Pasadena, TX 312,500 100.0 - 926 2.6Savannah Logistics Park 1 Savannah, GA 1,035,700 100.0 - 2,697 7.4Sparks Business Center 1 Sparks, NV 396,100 94.2 - 1,807 5.0Subtotal – Industrial 8 4,465,600 $11,531 $17,023 46.9Office:Concorde Commerce Center 1 Phoenix, AZ 137,500 86.0 $- $951 2.6Deer Valley Financial Center 1 Phoenix, AZ 126,600 70.6 10,106 469 1.3Gateway Oaks 1 Sacramento, CA 58,700 49.9 - 162 0.5Issaquah Office Center 1 Issaquah, WA 146,900 100.0 - 2,099 5.8Ninigret Office Park 1 Salt Lake City, UT 185,500 100.0 - 1,895 5.21800 and 1820 Preston Park 1 Plano, TX 198,700 89.3 - 1,821 5.02868 Prospect Park 1 Sacramento, CA 162,900 68.4 - 587 1.6San Pedro Plaza 1 San Antonio, TX 172,000 82.7 - 1,041 2.9Union Bank 1 Everett, WA 84,000 100.0 - 1,305 3.6Subtotal – Office 9 1,272,800 $10,106 $10,330 28.5Retail:Broadlands Marketplace 1 Broomfield, CO 103,900 91.0 $- $856 2.4Little Cottonwood Center 1 Sandy, UT 141,600 94.0 6,281 1,436 4.0Meadows on the Parkway 1 Boulder, CO 216,500 77.8 - 2,209 6.1Rancho Temecula Town Center 1 Temecula, CA 165,600 93.3 - 3,512 9.7Royal MacArthur Center 1 Dallas, TX 44,200 85.0 - 706 1.9Wilshire Shopping Center 1 Greeley, CO 46,500 57.0 - 190 0.5Subtotal – Retail 6 718,300 $6,281 $8,909 24.6Total Mainland 23 6,456,700 $27,918 $36,262 100.01 Represents the average percentage of space leased during the period referenced or A&B’s ownership period, whichever is shorter. Space is considered leased when a tenancy agreement has been fully executed or the space is revenue producing.2 See page 41 for a statement regarding the Company’s use of Cash NOI and a reconciliation of Leasing operating profit to Cash NOI for the total portfolio.Note: For portfolio asset class and geographic occupancy see Table 9. In January 2013, A&B sold the 119,500 square-foot Northpoint property.38
TA
Statement on Management’s Use of Non-GAAP Financial Measures
Cash net operating income (NOI) is a non-GAAP measure derived from real estate revenues
(determined in accordance with GAAP, less straight-line rental adjustments) minus property
operating expenses (determined in accordance with GAAP). Cash NOI does not have any
standardized meaning prescribed by GAAP, and therefore, may differ from definitions of cash NOI
used by other companies. Cash NOI should not be considered as an alternative to net income
(determined in accordance with GAAP) as an indicator of the Company’s financial performance, or
as an alternative to cash flow from operating activities as a measure of the Company’s liquidity.
Cash NOI is commonly used as a measure of operating performance because it is an indicator of
the return on property investment, and provides a method of comparing property performance over
time. Cash NOI excludes general and administrative expenses, straight-line rental adjustments,
bad debt expense, interest income, interest expense, depreciation and amortization, and gains on
sales of interests in real estate. The Company believes that the real estate leasing segment’s
operating profit after discontinued operations is the most directly comparable GAAP measurement
to cash NOI. A required reconciliation of real estate leasing operating profit to real estate leasing
segment same store cash NOI is as follows:
T ABLE 1 4
RECONCILIATION OF REAL ESTATE LEASING OPERATING PROFIT TO CASH NOI
AND SAME STORE CASH NOI (NON-GAAP)
(in millions)
1 Cash NOI related to properties that were operated throughout the duration of both periods under comparison.
(Dollars in millions) 2012 2011 2010 2009 2008
Real Estate Leasing segment operating profit before
discontinued operations 41.6 39.3 35.3 43.2 47.8
Less amounts reported in discontinued operations (0.7) (2.2) (3.3) (8.0) (4.2)
Real Estate Leasing segment operating profit after
subtracting discontinued operations 40.9 37.1 32.0 35.2 43.6
Adjustments:
Depreciation and amortization 22.2 21.7 21.1 21.2 19.2
FASB 13 straight-line lease adjustments (3.6) (3.8) (4.1) (2.0) (2.4)
General and administrative expense 2.9 3.6 3.4 3.5 2.4
Discontinued operations 0.7 2.2 3.3 8.0 4.2
Real Estate Leasing total cash NOI 63.1 60.8 55.7 65.9 67.0
Acquisitions/ disposition adjustments/ other (4.1) (3.2)
Real Estate Leasing segment same store cash NOI1 59.0 57.6
41
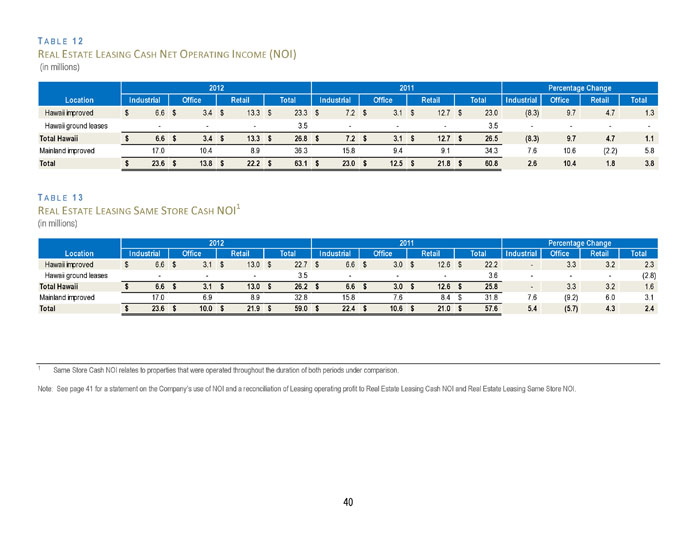
TABLE 1 2REAL ESTATE LEASING CASH NET OPERATING INCOME (NOI)(in millions)2012 2011 Percentage ChangeLocation Industrial Office Retail Total Industrial Office Retail Total Industrial Office Retail TotalHawaii improved $6.6 $3.4 $13.3 $23.3 $7.2 $3.1 $12.7 $23.0 (8.3) 9.7 4.7 1.3Hawaii ground leases - - - 3.5 - - - 3.5 - - - -Total Hawaii $6.6 $3.4 $13.3 $26.8 $7.2 $3.1 $12.7 $26.5 (8.3) 9.7 4.7 1.1Mainland improved 17.0 10.4 8.9 36.3 15.8 9.4 9.1 34.3 7.6 10.6 (2.2) 5.8Total $23.6 $13.8 $22.2 $63.1 $23.0 $12.5 $21.8 $60.8 2.6 10.4 1.8 3.8TABLE 1 3REAL ESTATE LEASING SAME STORE CASH NOI1(in millions)2012 2011 Percentage ChangeLocation Industrial Office Retail Total Industrial Office Retail Total Industrial Office Retail TotalHawaii improved $6.6 $3.1 $13.0 $22.7 $6.6 $3.0 $12.6 $22.2 - 3.3 3.2 2.3Hawaii ground leases - - - 3.5 - - - 3.6 - - - (2.8)Total Hawaii $6.6 $3.1 $13.0 $26.2 $6.6 $3.0 $12.6 $25.8 - 3.3 3.2 1.6Mainland improved 17.0 6.9 8.9 32.8 15.8 7.6 8.4 $31.8 7.6 (9.2) 6.0 3.1Total $23.6 $10.0 $21.9 $59.0 $22.4 $10.6 $21.0 $57.6 5.4 (5.7) 4.3 2.41 Same Store Cash NOI relates to properties that were operated throughout the duration of both periods under comparison.Note: See page 41 for a statement on the Company’s use of NOI and a reconciliation of Leasing operating profit to Real Estate Leasing Cash NOI and Real Estate Leasing Same Store NOI.40
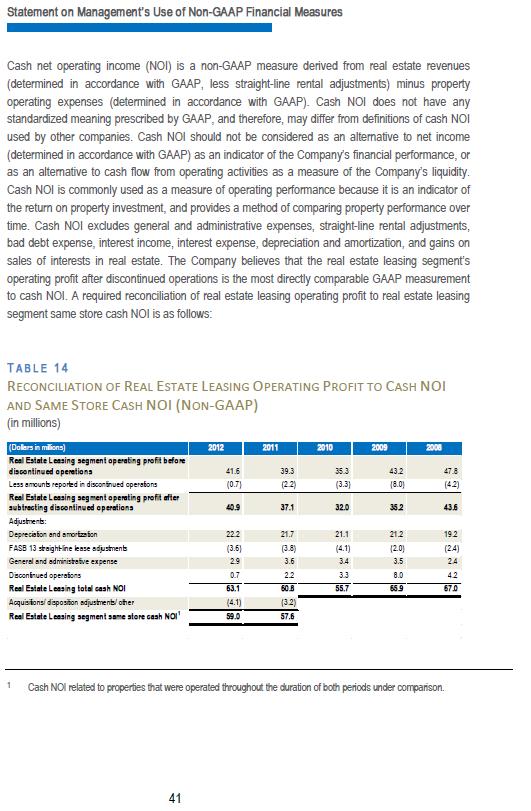
Statement on Management's Use of Non-GAAP Financial Measures Cash net operating income (NOI) is a non-GAAP measure derived from real estate revenues (determined in accordance with GAAP, less straight-line rental adjustments) minus property operating expenses (determined in accordance with GAAP). Cash NOI does not have any standardized meaning prescribed by GAAP, and therefore, may differ from definitions of cash NOI used by other companies. Cash NOI should not be considered as an alternative to net income (determined in accordance with GAAP) as an indicator of the Company's financial performance, or as an alternative to cash flow from operating activities as a measure of the Company's liquidity. Cash NOI is commonly used as a measure of operating performance because it is an indicator of the return on property investment, and provides a method of comparing property performance over time. Cash NOI excludes general and administrative expenses, straight-line rental adjustments, bad debt expense, interest income, interest expense, depreciation and amortization, and gains on sales of interests in real estate. The Company believes that the real estate leasing segment's operating profit after discontinued operations is the most directly comparable GAAP measurement to cash NOI. A required reconciliation of real estate leasing operating profit to real estate leasing segment same store cash NOI is as follows: TABLE 14 RECONCILIATION OF REAL ESTATE LEASING OPERATING PROFIT TO CASH NOI AND SAME STORE CASH NOI (NON-GAAP) (in millions) 1 Cash NOI related to properties that were operated throughout the duration of both periods under comparison. 41
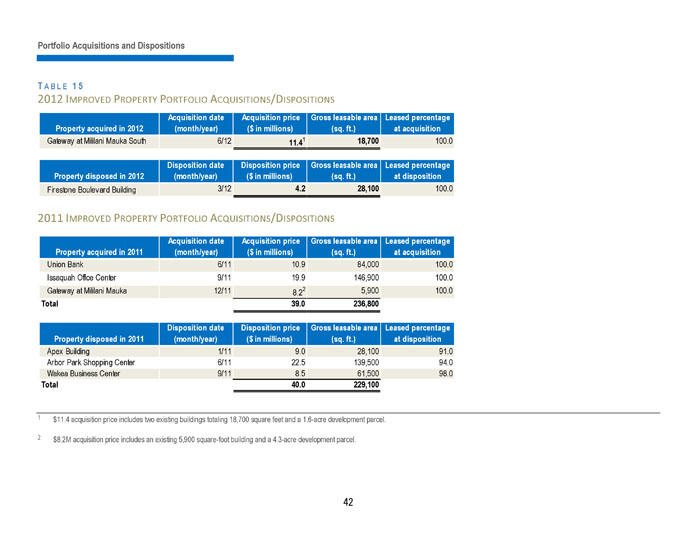
Portfolio Acquisitions and DispositionsTABLE 1 52012 IMPROVED PROPERTY PORTFOLIO ACQUISITIONS/DISPOSITIONSAcquisition date Acquisition price Gross leasable area Leased percentageProperty acquired in 2012 (month/year) ($in millions) (sq. ft.) at acquisitionGateway at Mililani Mauka South 6/12 1 18,700 100.011.4Disposition date Disposition price Gross leasable area Leased percentageProperty disposed in 2012 (month/year) ($in millions) (sq. ft.) at dispositionFirestone Boulevard Building 3/12 4.2 28,100 100.02011 IMPROVED PROPERTY PORTFOLIO A CQUISITIONS/DISPOSITIONSAcquisition date Acquisition price Gross leasable area Leased percentageProperty acquired in 2011 (month/year) ($in millions) (sq. ft.) at acquisitionUnion Bank 6/11 10.9 84,000 100.0Issaquah Office Center 9/11 19.9 146,900 100.0Gateway at Mililani Mauka 12/11 2 5,900 100.08.2Total39.0 236,800Disposition date Disposition price Gross leasable area Leased percentageProperty disposed in 2011 (month/year) ($in millions) (sq. ft.) at dispositionApex Building 1/11 9.0 28,100 91.0Arbor Park Shopping Center 6/11 22.5 139,500 94.0Wakea Business Center 9/11 8.5 61,500 98.0Total 40.0 229,1001 $11.4 acquisition price includes two existing buildings totaling 18,700 square feet and a 1.6-acre development parcel.2 $8.2M acquisition price includes an existing 5,900 square-foot building and a 4.3-acre development parcel.42
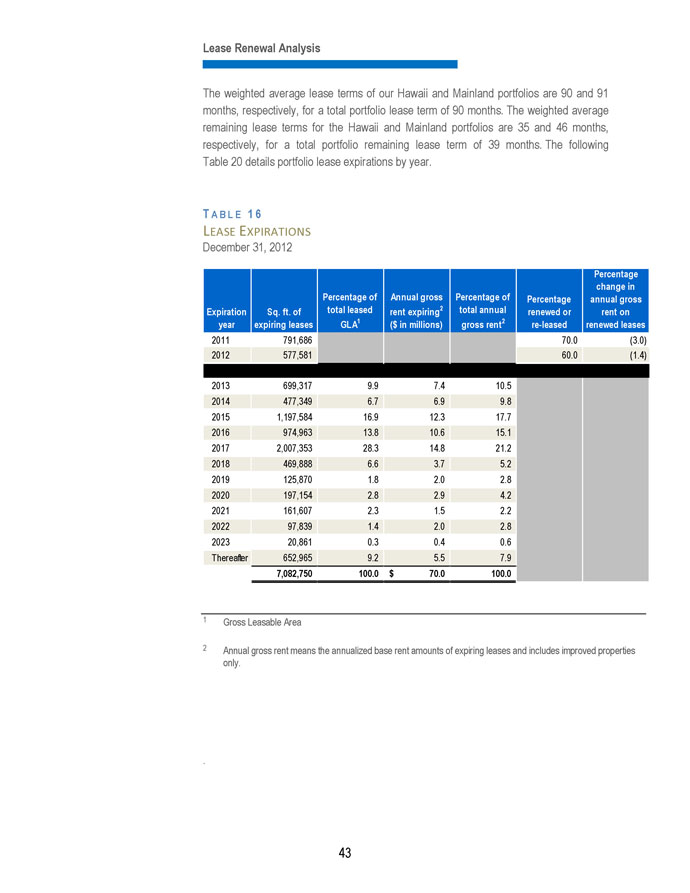
Lease Renewal AnalysisThe weighted average lease terms of our Hawaii and Mainland portfolios are 90 and 91 months, respectively, for a total portfolio lease term of 90 months. The weighted average remaining lease terms for the Hawaii and Mainland portfolios are 35 and 46 months, respectively, for a total portfolio remaining lease term of 39 months. The following Table 20 details portfolio lease expirations by year.TABLE 1 6LEASE EXPIRATIONSDecember 31, 2012PercentagePercentage of Annual gross Percentage of Percentage change inannual grossExpiration Sq. ft. of total leased 2 total annualrenewed orrent expiring rent onGLA1 gross rent2year expiring leases ($in millions) re-leased renewed leases2011 791,686 70.0 (3.0)2012 577,581 60.0 (1.4)2013 699,317 9.9 7.4 10.52014 477,349 6.7 6.9 9.82015 1,197,584 16.9 12.3 17.72016 974,963 13.8 10.6 15.12017 2,007,353 28.3 14.8 21.22018 469,888 6.6 3.7 5.22019 125,870 1.8 2.0 2.82020 197,154 2.8 2.9 4.22021 161,607 2.3 1.5 2.22022 97,839 1.4 2.0 2.82023 20,861 0.3 0.4 0.6Thereafter 652,965 9.2 5.5 7.97,082,750 100.0 $70.0 100.01 Gross Leasable Area2 Annual gross rent means the annualized base rent amounts of expiring leases and includes improved properties only.43
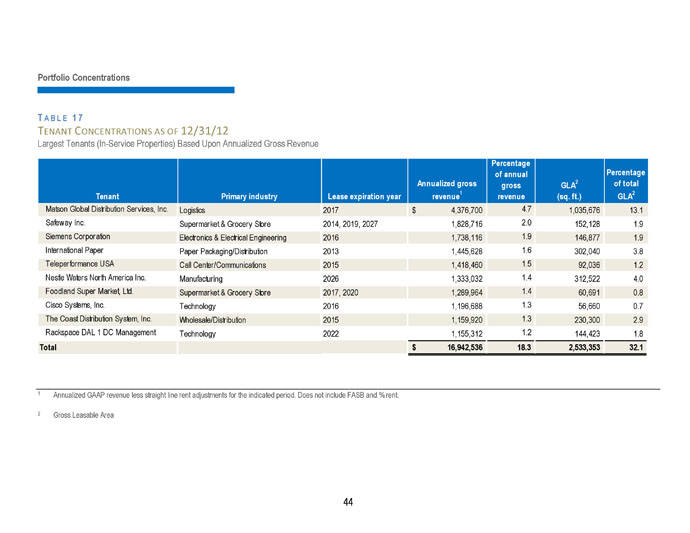
Portfolio ConcentrationsTABLE 1 7TENANT CONCENTRATIONS AS OF 12/31/12Largest Tenants (In-Service Properties) Based Upon Annualized Gross RevenuePercentage Percentageof annualAnnualized gross 2 of totalgross GLArevenue1 GLA2Tenant Primary industry Lease expiration year revenue (sq. ft.)Matson Global Distribution Services, Inc. Logistics 2017 $4,376,700 4.7 1,035,676 13.1Safeway Inc. Supermarket & Grocery Store 2014, 2019, 2027 1,828,716 2.0 152,128 1.9Siemens Corporation Electronics & Electrical Engineering 2016 1,738,116 1.9 146,877 1.9International Paper Paper Packaging/Distribution 2013 1,445,628 1.6 302,040 3.8Teleperformance USA Call Center/Communications 2015 1,418,460 1.5 92,036 1.2Nestle Waters North America Inc. Manufacturing 2026 1,333,032 1.4 312,522 4.0Foodland Super Market, Ltd. Supermarket & Grocery Store 2017, 2020 1,289,964 1.4 60,691 0.8Cisco Systems, Inc. Technology 2016 1,196,688 1.3 56,660 0.7The Coast Distribution System, Inc. Wholesale/Distribution 2015 1,159,920 1.3 230,300 2.9Rackspace DAL 1 DC Management Technology 2022 1,155,312 1.2 144,423 1.8Total $16,942,536 18.3 2,533,353 32.11 Annualized GAAP revenue less straight line rent adjustments for the indicated period. Does not include FASB and% rent.2 Gross Leasable Area44
Hawaii Commercial Property Information SheetsIndustrialKomohana Industrial Park 46P&L Building 46Port Allen 47Waipio Industrial 47OfficeGateway at Mililani Mauka South 48Judd Building 48Kahului Office Building 49Kahului Office Center 49Lono Center 50Maui Clinic Building 50Stangenwald Building 51RetailGateway at Mililani Mauka 51Kahului Shopping Center 52Kaneohe Bay Shopping Center 52Kunia Shopping Center 53Lahaina Square 53Lanihau Marketplace 54Maui Mall 54Port Allen Marina Center 55Waipio Shopping Center 5545
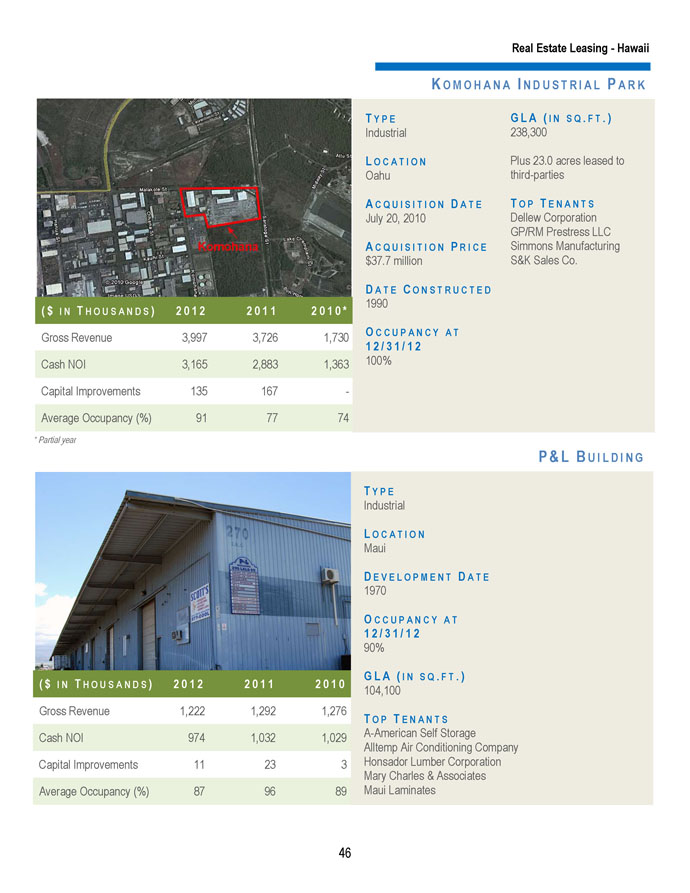
($INTHOUSANDS) 2 0 1 2 2 0 1 1 2 0 1 0 *Gross Revenue 3,997 3,726 1,730Cash NOI 3,165 2,883 1,363Capital Improvements 135 167 -Average Occupancy (%) 91 77 74* Partial yearKOMOHANATYPEIndustrialLOCATIONOahuACQUISITION DATEJuly 20, 2010ACQUISITION PRICE $37.7millionDATE CONSTRUCTED1990OCCUPANCYAT1 2 / 3 1 / 1 2100%Real Estate Leasing - HawaiiINDUSTRIALPARKGLA (IN SQ. FT.)238,300Plus 23.0 acres leased to third-partiesTOP TENANTSDellew CorporationGP/RM Prestress LLCSimmons ManufacturingS&K Sales Co.($INTHOUSANDS) 2 0 1 2 2 0 1 1 2 0 1 0Gross Revenue 1,222 1,292 1,276Cash NOI 974 1,032 1,029Capital Improvements 11 23 3Average Occupancy (%) 87 96 89P & L BUILDINGTYPEIndustrialLOCATIONMauiDEVELOPMENT DATE1970OCCUPANCYAT1 2 / 3 1 / 1 290%GLA (IN SQ . FT.)104,100TOP TENANTSA-American Self StorageAlltemp Air Conditioning CompanyHonsador Lumber CorporationMary Charles & AssociatesMaui Laminates46
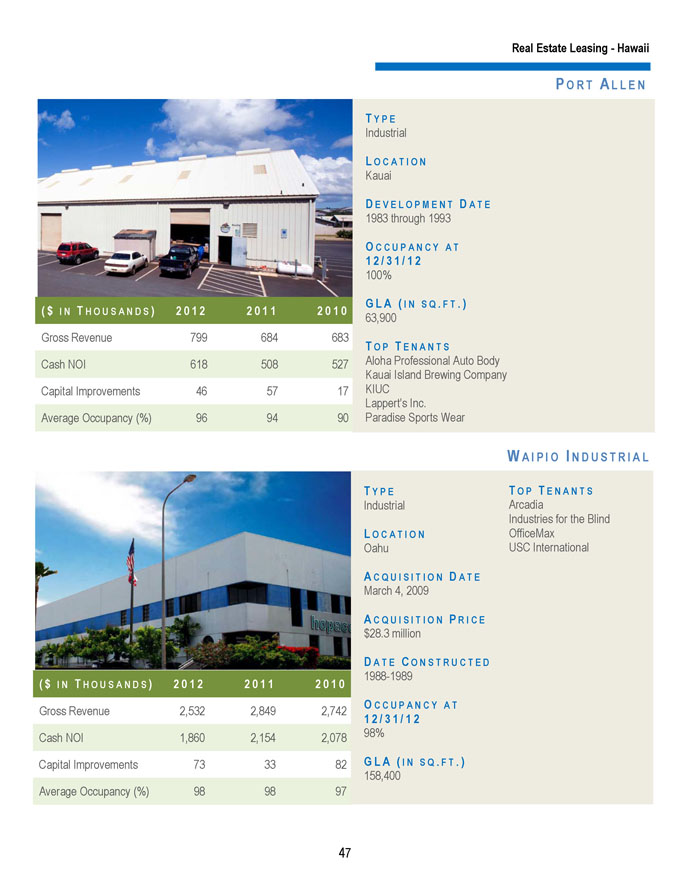
Real Estate Leasing - HawaiiPORTALLENTYPEIndustrialLOCATIONKauaiDEVELOPMENT DATE1983 through 1993OCCUPANCYAT1 2 / 3 1 / 1 2100%GLA (IN SQ . FT.)($INTHOUSANDS) 2 0 1 2 2 0 1 1 2 0 1 0 2 0 1 0 2 0 0 963,900Gross Revenue 799 684 683 683 688TOP TENANTSAloha Professional Auto BodyCash NOI 618 508 527 527 518Kauai Island Brewing CompanyCapital Improvements 46 57 17 KIUC 17 22Lappert’s Inc.Average Occupancy (%) 96 94 90 Paradise Sports90 Wear 98WAIPIO INDUSTRIALTYPE TOP TENANTSIndustrial ArcadiaIndustries for the BlindLOCATION OfficeMaxOahu USC InternationalACQUISITION DATEMarch 4, 2009ACQUISITION PRICE$28.3 millionDATE CONSTRUCTED($INTHOUSANDS) 2 0 1 2 2 0 1 1 2 0 1 0 1988-1989Gross Revenue 2,532 2,849 2,742 OCCUPANCYAT1 2 / 3 1 / 1 2Cash NOI 1,860 2,154 2,078 98%Capital Improvements 73 33 82 GLA (IN SQ . FT.)158,400Average Occupancy (%) 98 98 9747
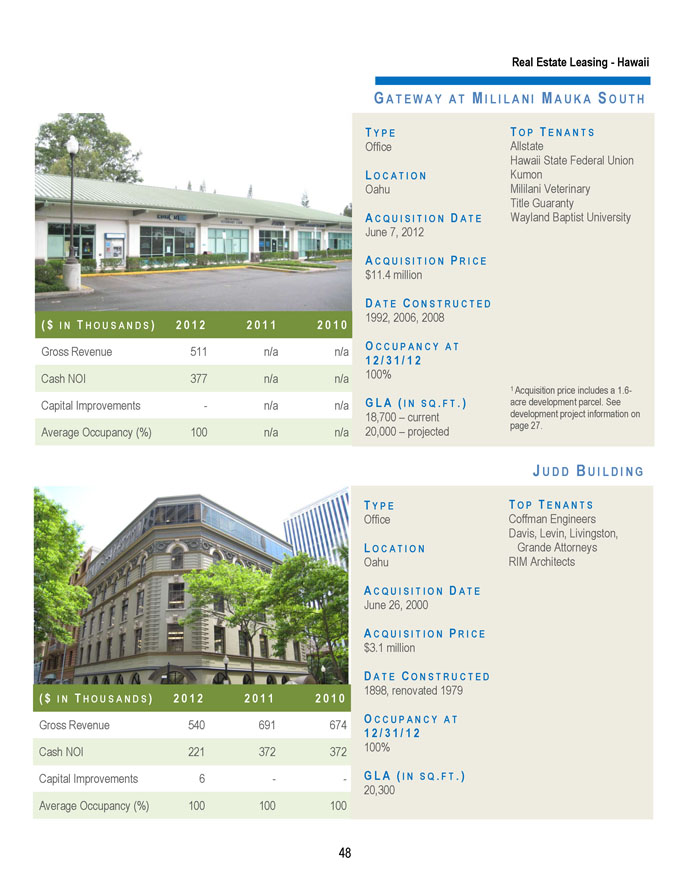
Real Estate Leasing - HawaiiGATEWAY AT MILILANI MAUKA SOUTH($INTHOUSANDS) 2 0 1 2 2 0 1 1 2 0 1 0Gross Revenue 511 n/a n/aCash NOI 377 n/a n/aCapital Improvements - n/a n/aAverage Occupancy (%) 100 n/a n/aTYPEOfficeLOCATIONOahuACQUISITION DATEJune 7, 2012ACQUISITION PRICE $11.4 millionDATE CONSTRUCTED1992, 2006, 20082 0 1 0 2 0 0 9OCCUPANCYAT674 6691 2 / 3 1 / 1 2100% 372 379G L A ( I N - S Q . F T .) -18,700 – current20,000 –100projected 100TOP TENANTSAllstateHawaii State Federal UnionKumonMililani VeterinaryTitle GuarantyWayland Baptist University1 Acquisition price includes a 1.6-acre development parcel. See development project information on page 27.JUDD BUILDINGTYPEOfficeLOCATIONOahuACQUISITION DATEJune 26, 2000ACQUISITION PRICE$3.1 millionDATE CONSTRUCTED($INTHOUSANDS) 2 0 1 2 2 0 1 1 2 0 1 0 1898, renovated 1979Gross Revenue 540 691 674 OCCUPANCYAT1 2 / 3 1 / 1 2Cash NOI 221 372 372 100%Capital Improvements 6 - - GLA (IN SQ . FT.)20,300Average Occupancy (%) 100 100 100TOP TENANTSCoffman EngineersDavis, Levin, Livingston,Grande AttorneysRIM Architects48
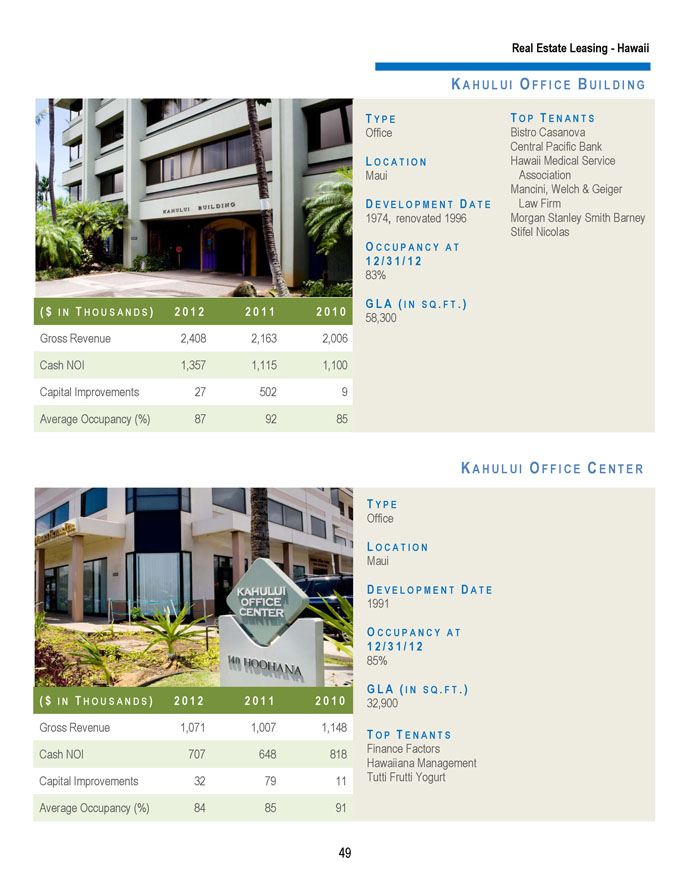
Real Estate Leasing - HawaiiKAHULUI OFFICE BUILDINGTYPEOfficeLOCATIONMauiDEVELOPMENT DATE1974, renovated 1996OCCUPANCYAT1 2 / 3 1 / 1 283%($INTHOUSANDS) 2 0 1 2 2 0 1 1 2 0 1 0 GLA (IN SQ . FT.)58,300Gross Revenue 2,408 2,163 2,006Cash NOI 1,357 1,115 1,100Capital Improvements 27 502 9Average Occupancy (%) 87 92 85TOP TENANTSBistro CasanovaCentral Pacific BankHawaii Medical ServiceAssociationMancini, Welch & GeigerLaw FirmMorgan Stanley Smith BarneyStifel Nicolas($INTHOUSANDS) 2 0 1 2 2 0 1 1 2 0 1 0Gross Revenue 1,071 1,007 1,148Cash NOI 707 648 818Capital Improvements 32 79 11Average Occupancy (%) 84 85 91KAHULUI OFFICE CENTERTYPEOfficeLOCATIONMauiDEVELOPMENT DATE1991OCCUPANCYAT1 2 / 3 1 / 1 285%GLA (IN SQ . FT.)32,900TOP TENANTSFinance FactorsHawaiiana ManagementTutti Frutti Yogurt49
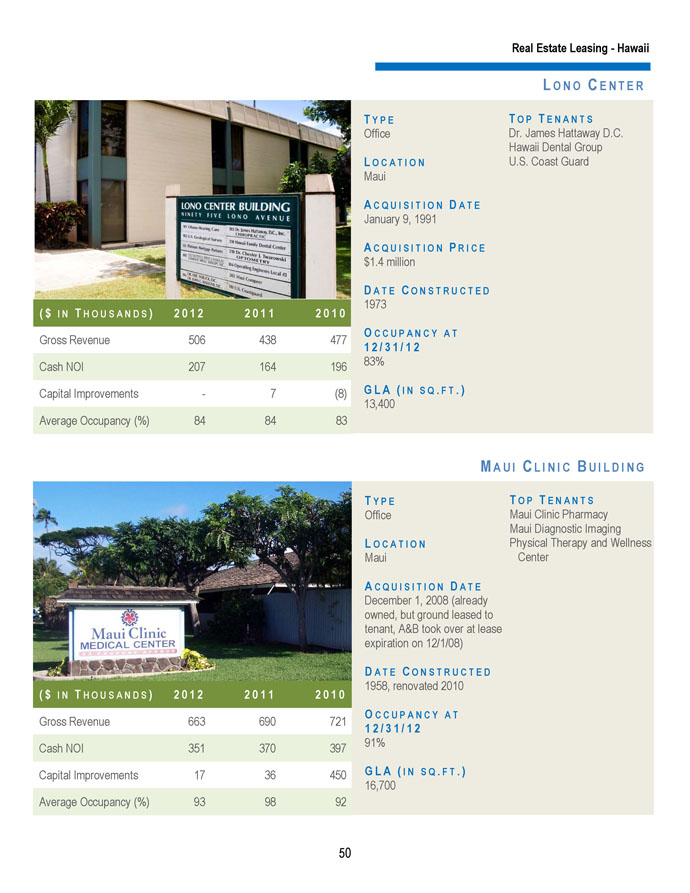
TYPEOfficeLOCATIONMauiACQUISITION DATEJanuary 9, 1991ACQUISITION PRICE$1.4 millionDATE CONSTRUCTED($INTHOUSANDS) 2 0 1 2 2 0 1 1 2 0 1 0 1973Real Estate Leasing - HawaiiLONO CENTERTOP TENANTSDr. James Hattaway D.C.Hawaii Dental GroupU.S. Coast GuardGross Revenue 506 438 477 OCCUPANCYAT1 2 / 3 1 / 1 2Cash NOI 207 164 196 83%Capital Improvements - 7 (8) GLA (IN SQ . FT.)13,400Average Occupancy (%) 84 84 83MAUI CLINIC BUILDINGTYPE TOP TENANTSOffice Maui Clinic PharmacyMaui Diagnostic ImagingLOCATION Physical Therapy and WellnessMaui CenterACQUISITION DATEDecember 1, 2008 (alreadyowned, but ground leased totenant, A&B took over at leaseexpiration on 12/1/08)DATE CONSTRUCTED($INTHOUSANDS) 2 0 1 2 2 0 1 1 2 0 1 0 1958, renovated 2010Gross Revenue 663 690 721 OCCUPANCYAT1 2 / 3 1 / 1 2Cash NOI 351 370 397 91%Capital Improvements 17 36 450 GLA (IN SQ . FT.)16,700Average Occupancy (%) 93 98 9250
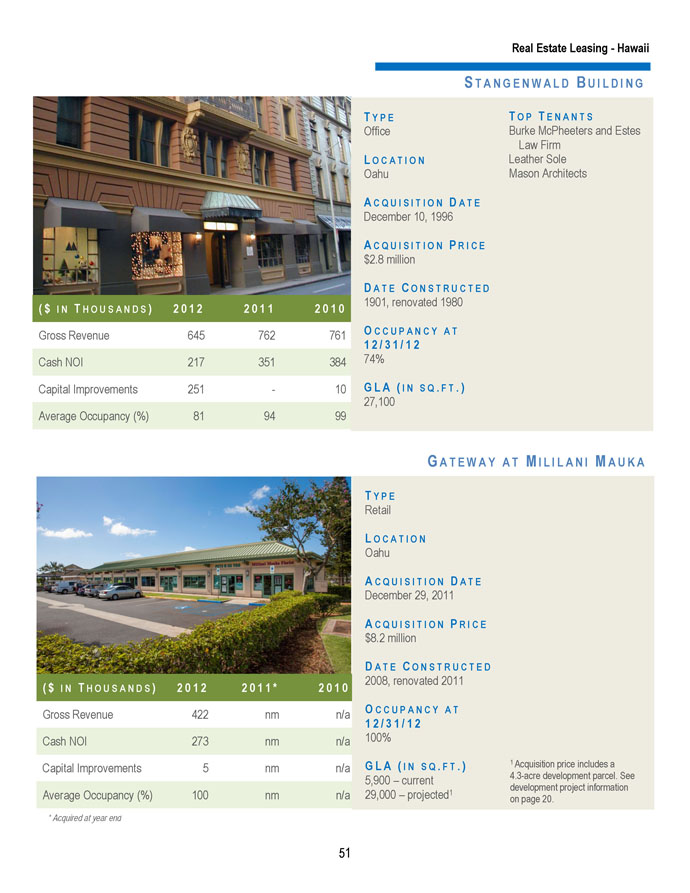
Real Estate Leasing - HawaiiSTANGENWALD BUILDINGTYPE TOP TENANTSOffice Burke McPheeters and EstesLaw FirmLOCATION Leather SoleOahu Mason ArchitectsACQUISITION DATEDecember 10, 1996ACQUISITION PRICE$2.8 millionDATE CONSTRUCTED($INTHOUSANDS) 2 0 1 2 2 0 1 1 2 0 1 0 1901, renovated 1980Gross Revenue 645 762 761 OCCUPANCYAT1 2 / 3 1 / 1 2Cash NOI 217 351 384 74%Capital Improvements 251 - 10 GLA (IN SQ . FT.)27,100Average Occupancy (%) 81 94 99GATEWAYATMILILANIMAUKA($INTHOUSANDS) 2 0 1 2 2 0 1 1 * 2 0 1 0Gross Revenue 422 nm n/aCash NOI 273 nm n/aCapital Improvements 5 nm n/aAverage Occupancy (%) 100 nm n/a* Acquired at year endTYPERetailLOCATIONOahuACQUISITION DATEDecember 29, 2011ACQUISITION PRICE $8.2 millionDATE CONSTRUCTED2008, renovated 2011OCCUPANCYAT1 2 / 3 1 / 1 2100%GLA (IN SQ . FT.)5,900 – current29,000 – projected11 Acquisition price includes a4.3-acre development parcel. See development project information on page 20.51
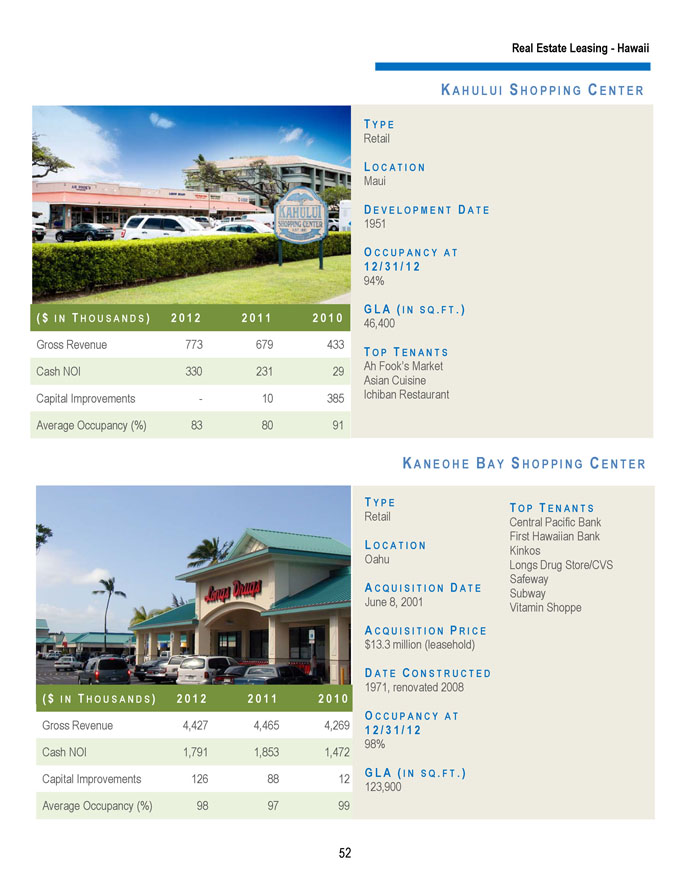
Real Estate Leasing - HawaiiKAHULUI SHOPPING CENTERTYPERetailLOCATIONMauiDEVELOPMENT DATE1951OCCUPANCYAT1 2 / 3 1 / 1 294%($INTHOUSANDS) 2 0 1 2 2 0 1 1 2 0 1 0 GLA (IN SQ . FT.)46,400Gross Revenue 773 679 433 TOP TENANTSCash NOI 330 231 29 Ah Fook’s MarketAsian CuisineCapital Improvements - 10 385 Ichiban RestaurantAverage Occupancy (%) 83 80 91KANEOHE BAYTYPERetailLOCATIONOahuACQUISITION DATEJune 8, 2001ACQUISITION PRICE$13.3 million (leasehold)DATE CONSTRUCTED1971, renovated 2008($INTHOUSANDS) 2 0 1 2 2 0 1 1 2 0 1 0 2 0 1 0 2 0 0 9OCCUPANCYATGross Revenue 4,427 4,465 4,269 4,269 3,8791 2 / 3 1 / 1 2Cash NOI 1,791 1,853 1,472 98% 1,472 1,942GLA (IN SQ . FT.)Capital Improvements 126 88 12 123,900 12 44Average Occupancy (%) 98 97 99 99 100SHOPPING CENTERTOP TENANTSCentral Pacific BankFirst Hawaiian BankKinkosLongs Drug Store/CVSSafewaySubwayVitamin Shoppe52
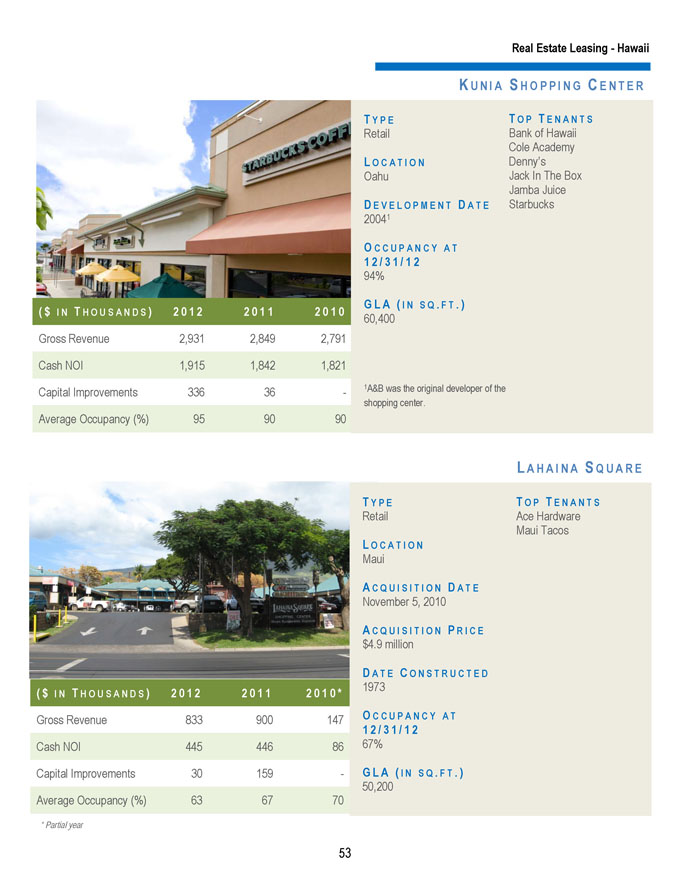
($INTHOUSANDS) 2 0 1 2 2 0 1 1 2 0 1 0Gross Revenue 2,931 2,849 2,791Cash NOI 1,915 1,842 1,821Capital Improvements 336 36 -Average Occupancy (%) 95 90 90Real Estate Leasing - HawaiiKUNIA SHOPPING CENTERTYPE TOP TENANTSRetail Bank of HawaiiCole AcademyLOCATION Denny’sOahu Jack In The BoxJamba JuiceDEVELOPMENT DATE Starbucks20041OCCUPANCYAT1 2 / 3 1 / 1 294%GLA (IN SQ . FT.)60,4001A&B was the original developer of the shopping center.LAHAINA SQUARETYPE TOP TENANTSRetail Ace HardwareLOCATION Maui TacosMauiACQUISITION DATENovember 5, 2010ACQUISITION PRICE$4.9 millionDATE CONSTRUCTED($INTHOUSANDS) 2 0 1 2 2 0 1 1 2 0 1 0 * 1973Gross Revenue 833 900 147 OCCUPANCYAT1 2 / 3 1 / 1 2Cash NOI 445 446 86 67%Capital Improvements 30 159 - GLA (IN SQ . FT.)50,200Average Occupancy (%) 63 67 70* Partial year53
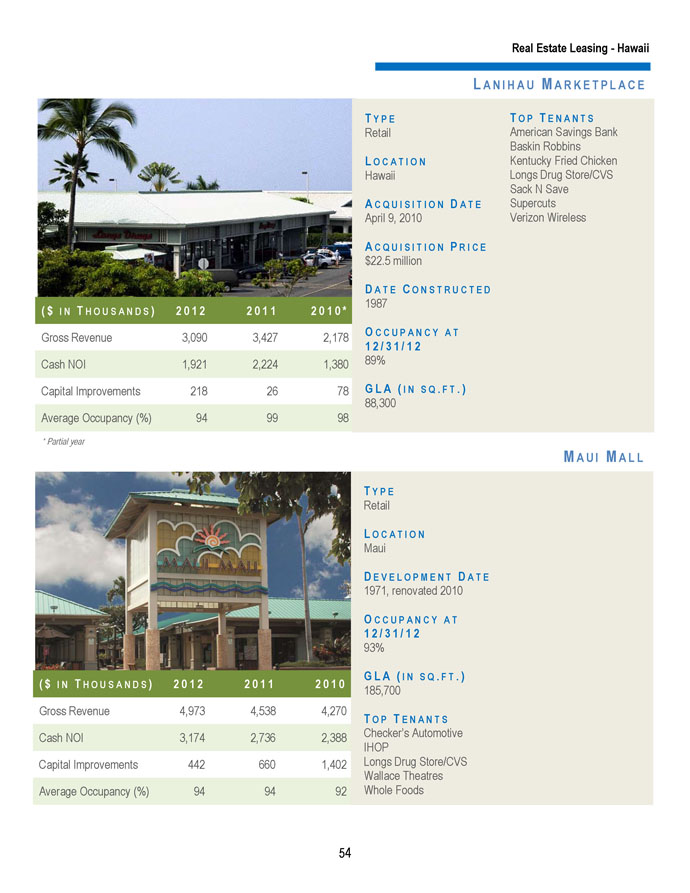
($INTHOUSANDS) 2 0 1 2 2 0 1 1 2 0 1 0 *Gross Revenue 3,090 3,427 2,178Cash NOI 1,921 2,224 1,380Capital Improvements 218 26 78Average Occupancy (%) 94 99 98* Partial year($INTHOUSANDS) 2 0 1 2 2 0 1 1 2 0 1 0Gross Revenue 4,973 4,538 4,270Cash NOI 3,174 2,736 2,388Capital Improvements 442 660 1,402Average Occupancy (%) 94 94 92Real Estate Leasing - HawaiiLANIHAU MARKETPLACETYPE TOP TENANTSRetail American Savings BankBaskin RobbinsLOCATION Kentucky Fried ChickenHawaii Longs Drug Store/CVSSack N SaveACQUISITION DATE SupercutsApril 9, 2010 Verizon WirelessACQUISITION PRICE$22.5 millionDATE CONSTRUCTED19872 0 1 0 * 2 0 1 0 * 2 0 1 0 * 2 0 0 9OCCUPANCYAT2,178 147 147 n/a1 2 / 3 1 / 1 289% 1,380 86 86 n/aGLA (IN SQ . FT.)78 - - n/a88,30098 70 70 n/aMAUIMALLTYPERetailLOCATIONMauiDEVELOPMENT DATE1971, renovated 2010OCCUPANCYAT1 2 / 3 1 / 1 293%GLA (IN SQ . FT.)185,700TOP TENANTSChecker’s AutomotiveIHOPLongs Drug Store/CVSWallace TheatresWhole Foods54
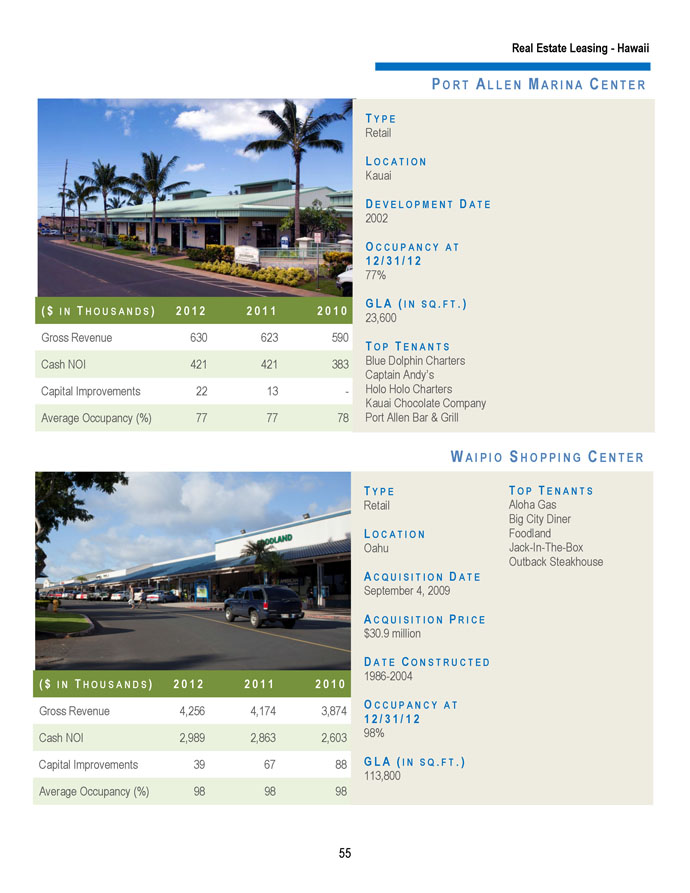
Real Estate Leasing - HawaiiPORTALLENMARINA CENTERTYPERetailLOCATIONKauaiDEVELOPMENT DATE2002OCCUPANCYAT1 2 / 3 1 / 1 277%GLA (IN SQ . FT.)($INTHOUSANDS) 2 0 1 2 2 0 1 1 2 0 1 0 2 0 1 1 2 0 1 023,600Gross Revenue 630 623 590 4,538 4,270TOP TENANTSBlue Dolphin ChartersCash NOI 421 421 383 2,736 2,388Captain Andy’sHolo Holo ChartersCapital Improvements 22 13 - 660 1,402Kauai Chocolate CompanyAverage Occupancy (%) 77 77 78 Port Allen94Bar & Grill 92WAIPIO2 0 1 0 2 0 0 94,270 3,7942,388 2,0751,402 52492 91SHOPPING CENTER($INTHOUSANDS) 2 0 1 2 2 0 1 1 2 0 1 0Gross Revenue 4,256 4,174 3,874Cash NOI 2,989 2,863 2,603TYPERetailLOCATIONOahuACQUISITION DATESeptember 4, 2009ACQUISITION PRICE $30.9 millionDATE CONSTRUCTED1986-2004OCCUPANCYAT1 2 / 3 1 / 1 298%TOP TENANTSAloha GasBig City DinerFoodlandJack-In-The-BoxOutback SteakhouseCapital Improvements 39 67 88 GLA (IN SQ . FT.)113,800Average Occupancy (%) 98 98 9855

THIS PAGE WAS INTENTIONALLY LEFT BLANK.56
Mainland Commercial Property Information SheetsIndustrialActivity Distribution Center 58Centennial Plaza 58Heritage Business Park 59Midstate 99 Distribution Center 59Northpoint Industrial 60Republic Distribution Center 60Savannah Logistics Park 61Sparks Business Center 61OfficeConcorde Commerce Center 62Deer Valley Financial Center 62Gateway Oaks 63Issaquah Office Center 63Ninigret Office Park 641800 and 1820 Preston Park 642868 Prospect Park 65San Pedro Plaza 65Union Bank 66RetailBroadlands Marketplace 66Little Cottonwood Center 67Meadows on the Parkway 67Rancho Temecula Town Center 68Royal MacArthur Center 68Wilshire Shopping Center 6957
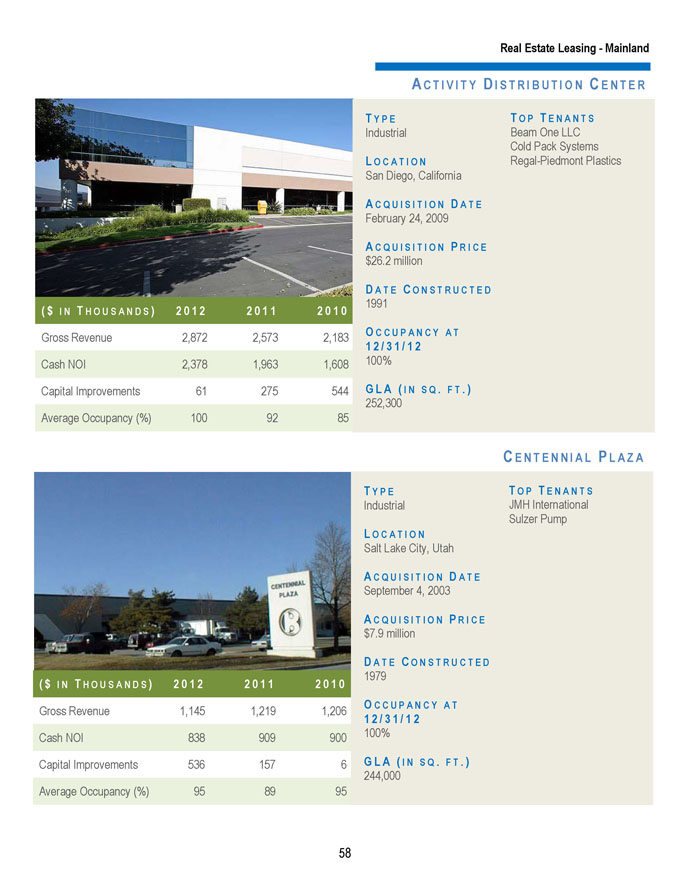
($INTHOUSANDS) 2 0 1 2 2 0 1 1 2 0 1 0Gross Revenue 2,872 2,573 2,183Cash NOI 2,378 1,963 1,608Real Estate Leasing - MainlandACTIVITY DISTRIBUTION CENTERTYPE TOP TENANTSIndustrial Beam One LLCCold Pack SystemsLOCATION Regal-Piedmont PlasticsSan Diego, CaliforniaACQUISITION DATEFebruary 24, 2009ACQUISITION PRICE$26.2 millionDATE CONSTRUCTED1991 2 0 1 0 2 0 0 9 *OCCUPANCYAT2,183 2,3631 2 / 3 1 / 1 2100% 1,608 1,825GLA (IN SQ . FT.)Capital Improvements 61 275 544 252,300 544 28Average Occupancy (%) 100 92 85 85 92TYPEIndustrialLOCATIONSalt Lake City, UtahCENTENNIAL PLAZATOP TENANTSJMH InternationalSulzer PumpACQUISITION DATESeptember 4, 2003ACQUISITION PRICE$7.9 millionDATE CONSTRUCTED($INTHOUSANDS) 2 0 1 2 2 0 1 1 2 0 1 0 1979Gross Revenue 1,145 1,219 1,206 OCCUPANCYAT1 2 / 3 1 / 1 2Cash NOI 838 909 900 100%Capital Improvements 536 157 6 GLA (IN SQ . FT.)244,000Average Occupancy (%) 95 89 9558
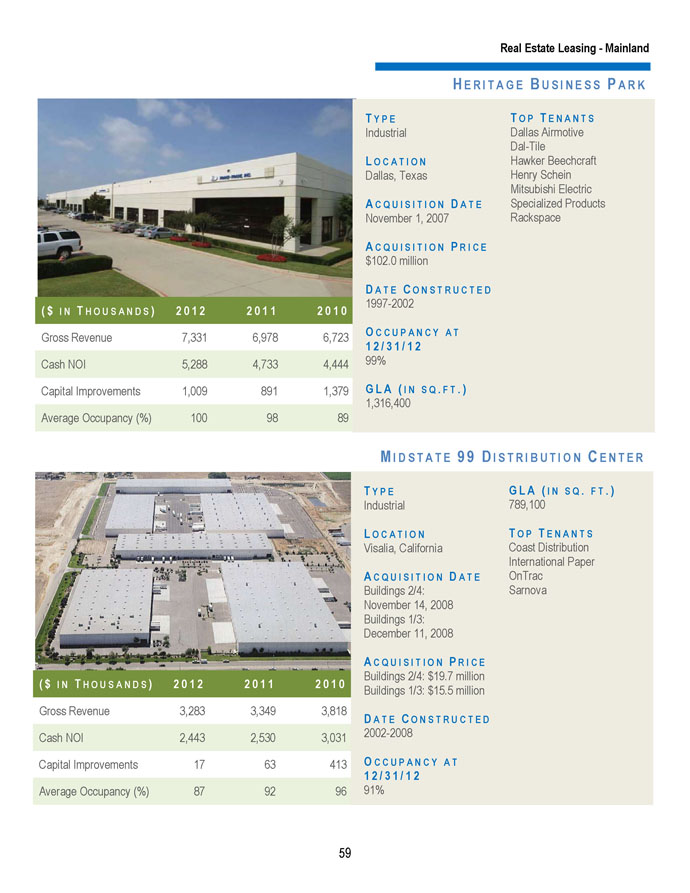
Real Estate Leasing - MainlandHERITAGE BUSINESS PARK($INTHOUSANDS) 2 0 1 2 2 0 1 1 2 0 1 0Gross Revenue 7,331 6,978 6,723Cash NOI 5,288 4,733 4,444TYPEIndustrialLOCATIONDallas, TexasACQUISITION DATENovember 1, 2007ACQUISITION PRICE $102.0 millionDATE CONSTRUCTED1997-20022 0 1 0 2 0 0 9OCCUPANCYAT6,723 7,7651 2 / 3 1 / 1 299% 4,444 5,102TOP TENANTSDallas AirmotiveDal-TileHawker BeechcraftHenry ScheinMitsubishi ElectricSpecialized ProductsRackspaceCapital Improvements 1,009 891 1,379Average Occupancy (%) 100 98 89GLA (IN SQ . FT.)1,379 161,316,40089 86MIDSTATE 99 DISTRIBUTION CENTER($INTHOUSANDS) 2 0 1 2 2 0 1 1 2 0 1 0Gross Revenue 3,283 3,349 3,818Cash NOI 2,443 2,530 3,031TYPEIndustrialLOCATIONVisalia, CaliforniaACQUISITION DATEBuildings 2/4:November 14, 2008Buildings 1/3:December 11, 2008ACQUISITION PRICEBuildings 2/4: $19.7 million Buildings 1/3: $15.5 millionDATE CONSTRUCTED2002-2008GLA (IN SQ . FT.)789,100TOP TENANTSCoast DistributionInternational PaperOnTracSarnovaCapital Improvements 17 63 413 OCCUPANCYAT1 2 / 3 1 / 1 2Average Occupancy (%) 87 92 96 91%59
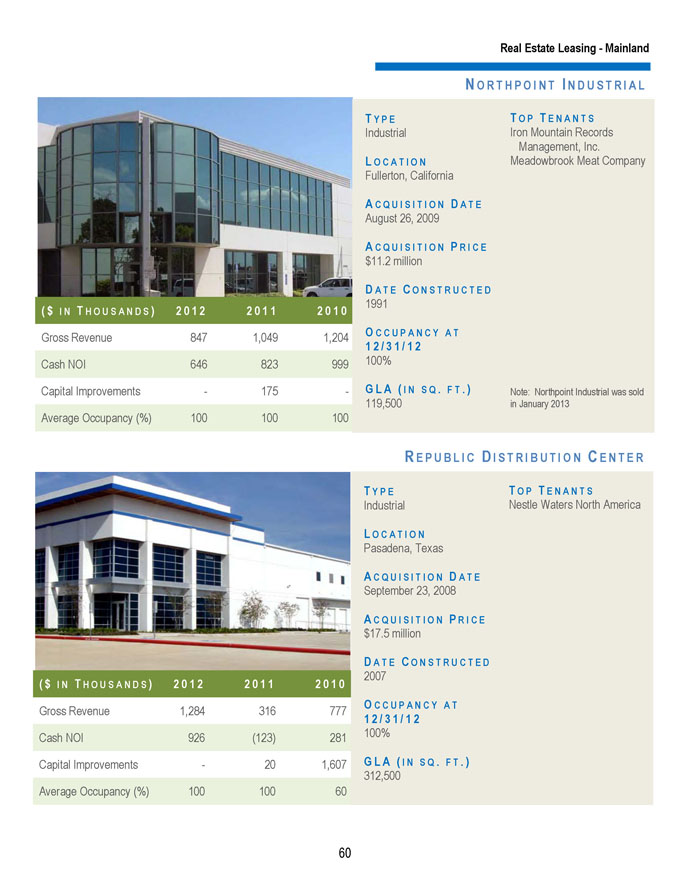
Real Estate Leasing - MainlandNORTHPOINT INDUSTRIAL($INTHOUSANDS) 2 0 1 2 2 0 1 1 2 0 1 0TYPEIndustrialLOCATIONFullerton, CaliforniaACQUISITION DATEAugust 26, 2009ACQUISITION PRICE $11.2 millionDATE CONSTRUCTED1991 2 0 1 0 2 0 0 9 *TOP TENANTSIron Mountain RecordsManagement, Inc.Meadowbrook Meat CompanyGross Revenue 847 1,049 1,204Cash NOI 646 823 999Capital Improvements - 175 -Average Occupancy (%) 100 100 100OCCUPANCYAT1,204 3941 2 / 3 1 / 1 2100% 999 342G L A ( I N - S Q . F T .) -119,500 100 100Note: Northpoint Industrial was sold in January 2013REPUBLIC DISTRIBUTION CENTERTYPEIndustrialLOCATIONPasadena, TexasACQUISITION DATESeptember 23, 2008ACQUISITION PRICE$17.5 millionDATE CONSTRUCTED($INTHOUSANDS) 2 0 1 2 2 0 1 1 2 0 1 0 2007Gross Revenue 1,284 316 777 OCCUPANCYAT1 2 / 3 1 / 1 2Cash NOI 926 (123) 281 100%Capital Improvements - 20 1,607 GLA (IN SQ . FT.)312,500Average Occupancy (%) 100 100 60TOP TENANTSNestle Waters North America60
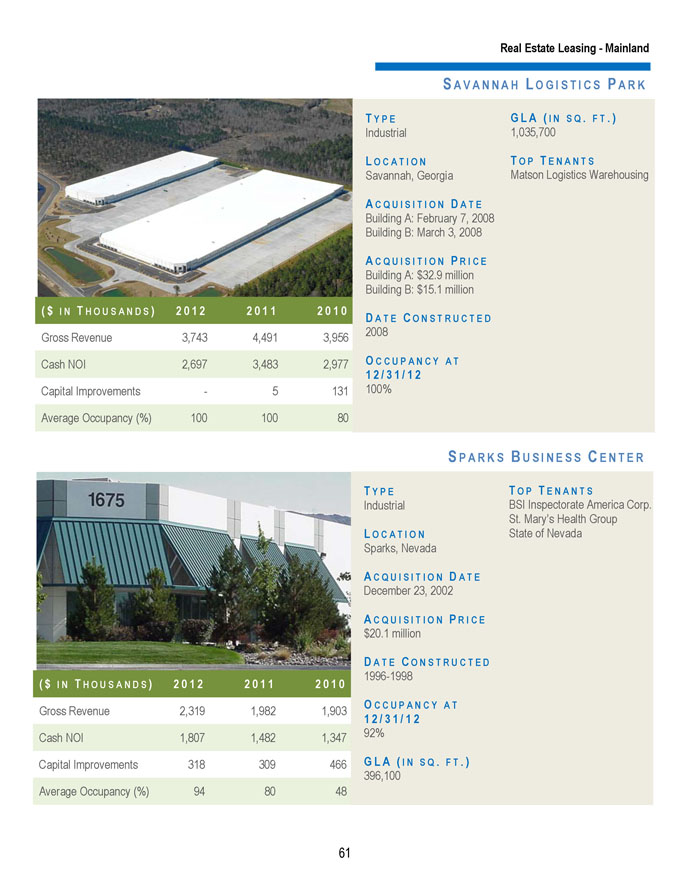
Real Estate Leasing - MainlandSAVANNAH LOGISTICS PARK($INTHOUSANDS) 2 0 1 2 2 0 1 1 2 0 1 0Gross Revenue 3,743 4,491 3,956Cash NOI 2,697 3,483 2,977Capital Improvements - 5 131Average Occupancy (%) 100 100 80TYPEIndustrialLOCATIONSavannah, GeorgiaACQUISITION DATEBuilding A: February 7, 2008 Building B: March 3, 2008ACQUISITION PRICEBuilding A: $32.9 million Building B: $15.1 million2 0 1 0 2 0 0 9DATE CONSTRUCTED2008 3,956 3,427OCCUPANCYAT2,977 2,4621 2 / 3 1 / 1 2100% 131 2,00880 76GLA (IN SQ . FT.)1,035,700TOP TENANTSMatson Logistics WarehousingSPARKS BUSINESS CENTERTYPE TOP TENANTSIndustrial BSI Inspectorate America Corp.St. Mary’s Health GroupLOCATION State of NevadaSparks, Nevada($INTHOUSANDS) 2 0 1 2 2 0 1 1 2 0 1 0Gross Revenue 2,319 1,982 1,903Cash NOI 1,807 1,482 1,347ACQUISITION DATEDecember 23, 2002ACQUISITION PRICE $20.1 millionDATE CONSTRUCTED1996-1998OCCUPANCYAT1 2 / 3 1 / 1 292%Capital Improvements 318 309 466 GLA (IN SQ . FT.)396,100Average Occupancy (%) 94 80 4861
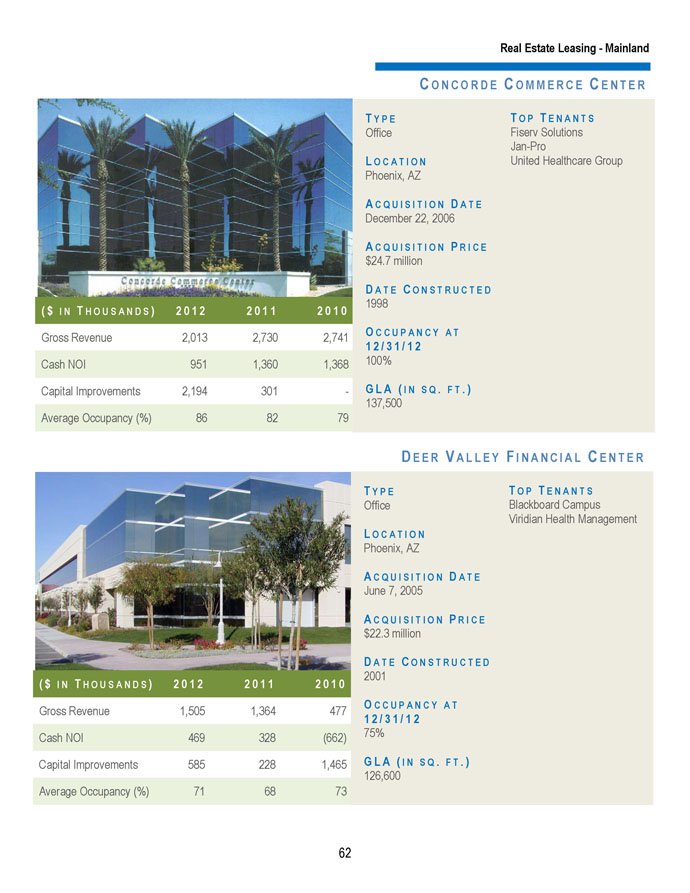
($INTHOUSANDS) 2 0 1 2 2 0 1 1 2 0 1 0Gross Revenue 2,013 2,730 2,741Cash NOI 951 1,360 1,368Capital Improvements 2,194 301 -Average Occupancy (%) 86 82 79Real Estate Leasing - MainlandCONCORDE COMMERCE CENTERTYPE TOP TENANTSOffice Fiserv SolutionsJan-ProLOCATION United Healthcare GroupPhoenix, AZACQUISITION DATEDecember 22, 2006ACQUISITION PRICE$24.7 millionDATE CONSTRUCTED1998 2 0 1 0 2 0 0 9OCCUPANCYAT2,741 2,6881 2 / 3 1 / 1 2100% 1,368 1,364G L A ( I N - S Q . F T .) 119137,50079 78DEER VALLEY FINANCIAL CENTER($INTHOUSANDS) 2 0 1 2 2 0 1 1 2 0 1 0Gross Revenue 1,505 1,364 477Cash NOI 469 328 (662)Capital Improvements 585 228 1,465Average Occupancy (%) 71 68 73TYPEOfficeLOCATIONPhoenix, AZACQUISITION DATEJune 7, 2005ACQUISITION PRICE $22.3 millionDATE CONSTRUCTED2001OCCUPANCYAT1 2 / 3 1 / 1 275%GLA (IN SQ . FT.)126,600TOP TENANTSBlackboard CampusViridian Health Management62
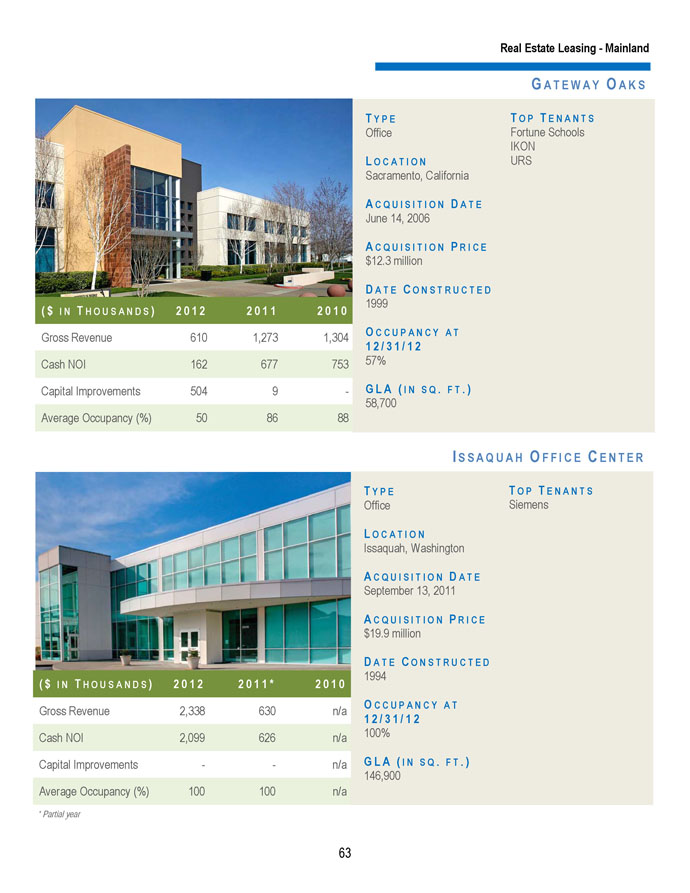
($INTHOUSANDS) 2 0 1 2 2 0 1 1 2 0 1 0Gross Revenue 610 1,273 1,304Cash NOI 162 677 753Capital Improvements 504 9 -Average Occupancy (%) 50 86 88TYPEOfficeLOCATIONSacramento, CaliforniaACQUISITION DATEJune 14, 2006ACQUISITION PRICE $12.3 millionDATE CONSTRUCTED1999 2 0 1 0 2 0 0 9 *OCCUPANCYAT541 121 2 / 3 1 / 1 257% 484 12G L A ( I N - S Q . F T .) -58,700 100 100Real Estate Leasing - MainlandGATEWAY OAKSTOP TENANTSFortune Schools IKONURSISSAQUAH OFFICE CENTER($INTHOUSANDS) 2 0 1 2 2 0 1 1 * 2 0 1 0Gross Revenue 2,338 630 n/aCash NOI 2,099 626 n/aCapital Improvements - - n/aAverage Occupancy (%) 100 100 n/a* Partial yearTYPEOfficeLOCATIONIssaquah, WashingtonACQUISITION DATESeptember 13, 2011ACQUISITION PRICE $19.9 millionDATE CONSTRUCTED1994OCCUPANCYAT1 2 / 3 1 / 1 2100%GLA (IN SQ . FT.)146,900TOP TENANTSSiemens63
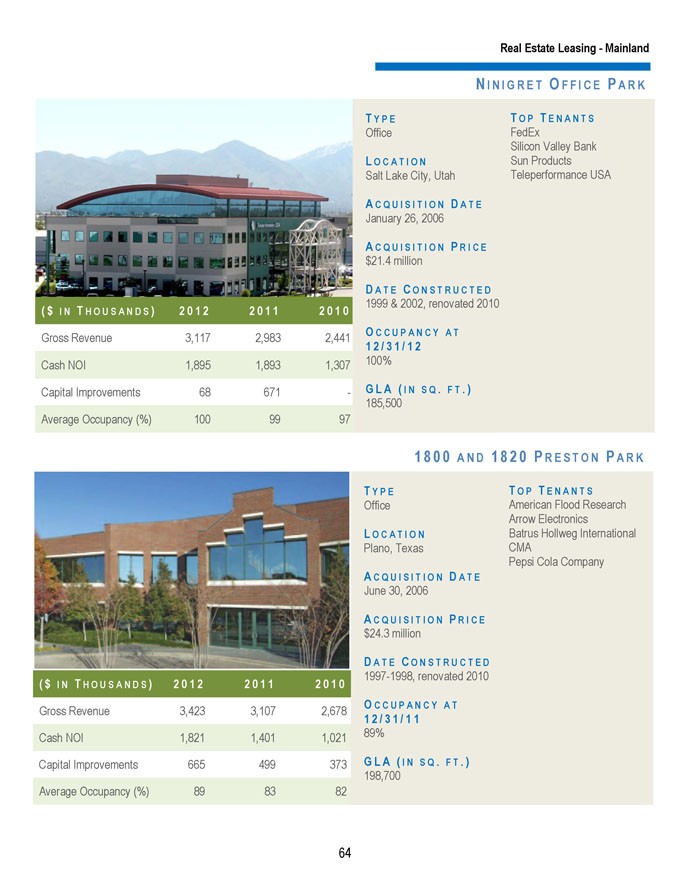
Real Estate Leasing - MainlandNINIGRET OFFICE PARK($INTHOUSANDS) 2 0 1 2 2 0 1 1 2 0 1 0Gross Revenue 3,117 2,983 2,441Cash NOI 1,895 1,893 1,307Capital Improvements 68 671 -Average Occupancy (%) 100 99 97TYPEOfficeLOCATIONSalt Lake City, UtahACQUISITION DATEJanuary 26, 2006ACQUISITION PRICE $21.4 millionDATE CONSTRUCTED1999 & 2002, renovated 20102 0 1 0 2 0 0 9OCCUPANCYATn/a n/a1 2 / 3 1 / 1 2100% n/a n/aGLA (IN SQ . FT.)185,500 n/a n/an/a n/aTOP TENANTSFedExSilicon Valley BankSun ProductsTeleperformance USA1800 AND 1820 PRESTON PARK($INTHOUSANDS) 2 0 1 2 2 0 1 1 2 0 1 0Gross Revenue 3,423 3,107 2,678Cash NOI 1,821 1,401 1,021TYPEOfficeLOCATIONPlano, TexasACQUISITION DATEJune 30, 2006ACQUISITION PRICE $24.3 millionDATE CONSTRUCTED1997-1998, renovated 2010OCCUPANCYAT1 2 / 3 1 / 1 189%TOP TENANTSAmerican Flood ResearchArrow ElectronicsBatrus Hollweg InternationalCMAPepsi Cola CompanyCapital Improvements 665 499 373 GLA (IN SQ . FT.)198,700Average Occupancy (%) 89 83 8264
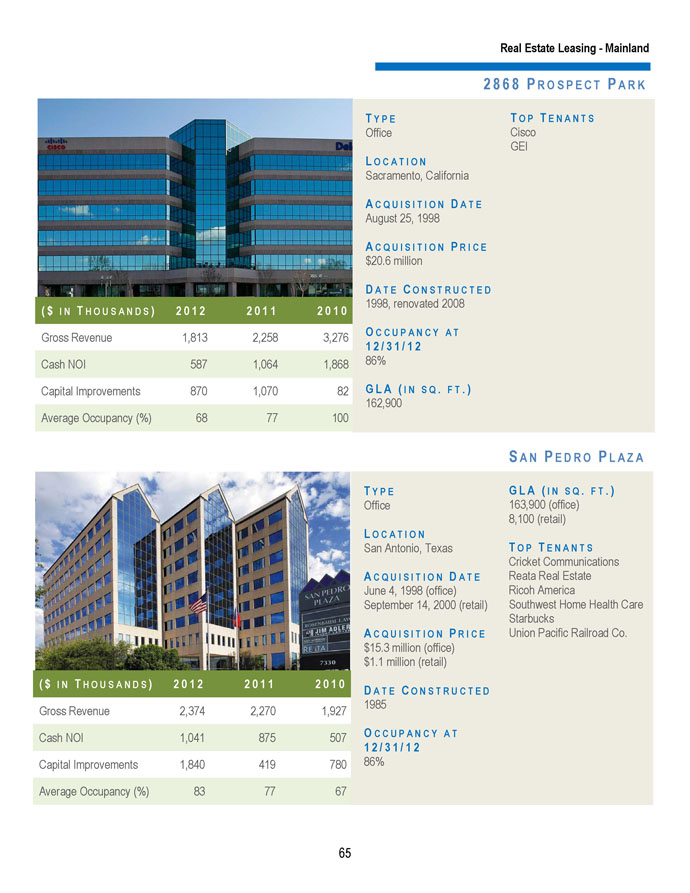
Real Estate Leasing - Mainland2868 PROSPECT PARK($INTHOUSANDS) 2 0 1 2 2 0 1 1 2 0 1 0Gross Revenue 1,813 2,258 3,276Cash NOI 587 1,064 1,868TYPEOfficeLOCATIONSacramento, CaliforniaACQUISITION DATEAugust 25, 1998ACQUISITION PRICE $20.6 millionDATE CONSTRUCTED1998, renovated 20082 0 1 0 2 0 0 9OCCUPANCYAT2,678 3,2851 2 / 3 1 / 1 286% 1,021 1,725TOP TENANTSCiscoGEIGLA (IN SQ . FT.)Capital Improvements 870 1,070 82 162,900 373 482Average Occupancy (%) 68 77 100 82 82TYPEOfficeSAN PEDRO PLAZAGLA (IN SQ . FT.)163,900 (office)8,100 (retail)($INTHOUSANDS) 2 0 1 2 2 0 1 1 2 0 1 0Gross Revenue 2,374 2,270 1,927LOCATIONSan Antonio, TexasACQUISITION DATEJune 4, 1998 (office) September 14, 2000 (retail)ACQUISITION PRICE $15.3 million (office)$1.1 million (retail)DATE CONSTRUCTED1985TOP TENANTSCricket CommunicationsReata Real EstateRicoh AmericaSouthwest Home Health CareStarbucksUnion Pacific Railroad Co.Cash NOI 1,041 875 507 OCCUPANCYAT1 2 / 3 1 / 1 2Capital Improvements 1,840 419 780 86%Average Occupancy (%) 83 77 6765
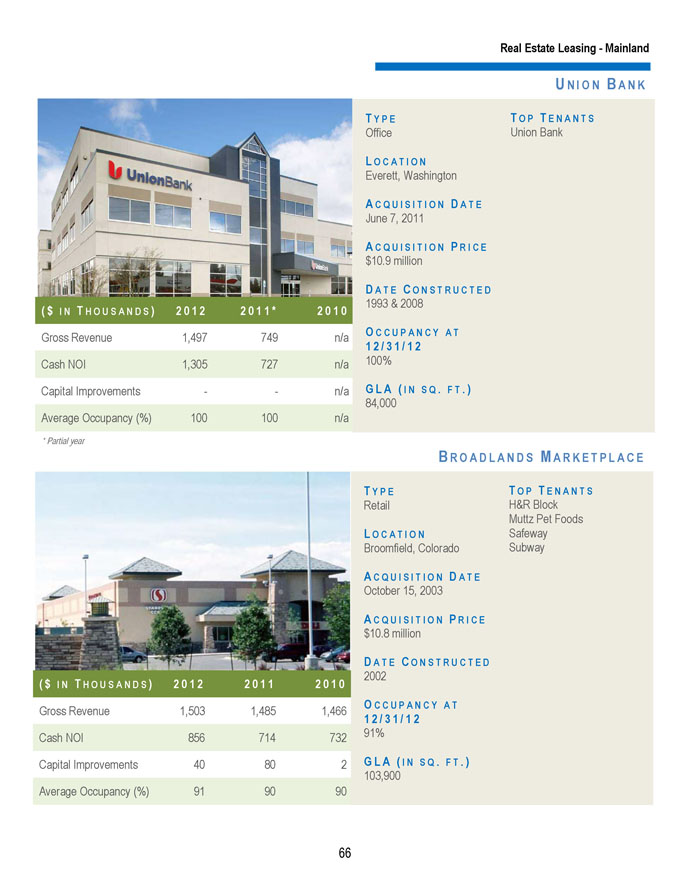
Real Estate Leasing - MainlandUNION BANK($INTHOUSANDS) 2 0 1 2 2 0 1 1 * 2 0 1 0TYPEOfficeLOCATIONEverett, WashingtonACQUISITION DATEJune 7, 2011ACQUISITION PRICE $10.9 millionDATE CONSTRUCTED1993 & 20082 0 1 1 2 0 1 0TOP TENANTSUnion Bank2 0 1 0 2 0 0 9Gross Revenue 1,497 749 n/aCash NOI 1,305 727 n/aCapital Improvements - - n/aAverage Occupancy (%) 100 100 n/a* Partial yearOCCUPANCYAT2,270 1,927 1,927 2,8241 2 / 3 1 / 1 2100% 875 507 507 1,347GLA (IN SQ . FT.)84,000 419 780 780 38977 67 67 70BROADLANDS MARKETPLACE($INTHOUSANDS) 2 0 1 2 2 0 1 1 2 0 1 0Gross Revenue 1,503 1,485 1,466Cash NOI 856 714 732Capital Improvements 40 80 2Average Occupancy (%) 91 90 90TYPERetailLOCATIONBroomfield, ColoradoACQUISITION DATEOctober 15, 2003ACQUISITION PRICE $10.8 millionDATE CONSTRUCTED2002OCCUPANCYAT1 2 / 3 1 / 1 291%GLA (IN SQ . FT.)103,900TOP TENANTSH&R BlockMuttz Pet FoodsSafewaySubway66
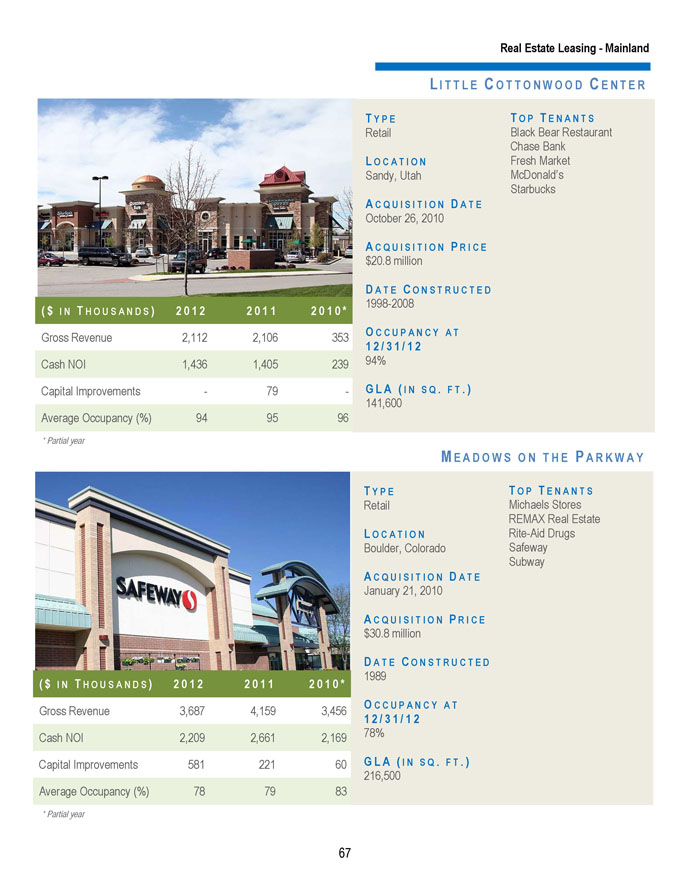
Real Estate Leasing - MainlandLITTLE COTTONWOOD CENTERTYPE TOP TENANTSRetail Black Bear RestaurantChase BankLOCATION Fresh MarketSandy, Utah McDonald’sACQUISITION DATE StarbucksOctober 26, 2010ACQUISITION PRICE$20.8 millionDATE CONSTRUCTED1998-2008($INTHOUSANDS) 2 0 1 2 2 0 1 1 2 0 1 0 * 2 0 1 1 2 0 1 0 2 0 1 0 2 0 0 9OCCUPANCYATGross Revenue 2,112 2,106 353 1,485 1,466 1,466 1,3261 2 / 3 1 / 1 2Cash NOI 1,436 1,405 239 94% 714 732 732 1,039GLA (IN SQ . FT.)Capital Improvements - 79 - 141,600 80 2 2 143Average Occupancy (%) 94 95 96 90 90 90 88* Partial year($INTHOUSANDS) 2 0 1 2 2 0 1 1 2 0 1 0 *Gross Revenue 3,687 4,159 3,456Cash NOI 2,209 2,661 2,169MEADOWS ON THE PARKWAYTYPE TOP TENANTSRetail Michaels StoresREMAX Real EstateLOCATION Rite-Aid DrugsBoulder, Colorado SafewayACQUISITION DATE SubwayJanuary 21, 2010ACQUISITION PRICE$30.8 millionDATE CONSTRUCTED1989OCCUPANCYAT1 2 / 3 1 / 1 278%Capital Improvements 581 221 60 GLA (IN SQ . FT.)216,500Average Occupancy (%) 78 79 83* Partial year67
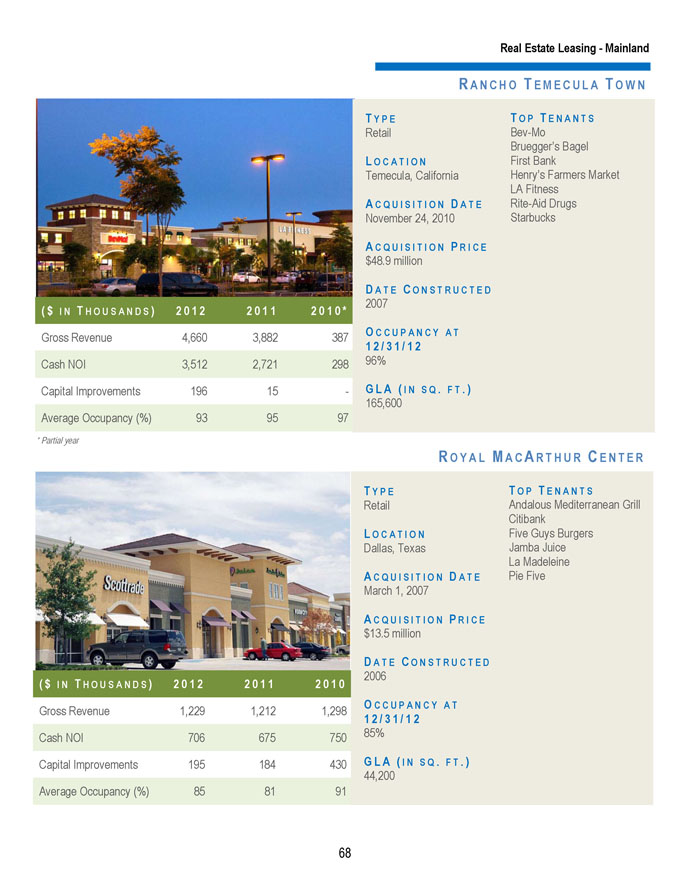
Real Estate Leasing - MainlandRANCHO TEMECULA TOWNTYPERetailLOCATIONTemecula, CaliforniaACQUISITION DATENovember 24, 2010ACQUISITION PRICE$48.9 millionDATE CONSTRUCTED($INTHOUSANDS) 2 0 1 2 2 0 1 1 2 0 1 0 * 2007Gross Revenue 4,660 3,882 387 OCCUPANCYAT1 2 / 3 1 / 1 2Cash NOI 3,512 2,721 298 96%Capital Improvements 196 15 - GLA (IN SQ . FT.)165,600Average Occupancy (%) 93 95 97* Partial yearTOP TENANTSBev-MoBruegger’s BagelFirst BankHenry’s Farmers MarketLA FitnessRite-Aid DrugsStarbucksROYALMACARTHUR CENTER($INTHOUSANDS) 2 0 1 2 2 0 1 1 2 0 1 0Gross Revenue 1,229 1,212 1,298Cash NOI 706 675 750TYPERetailLOCATIONDallas, TexasACQUISITION DATEMarch 1, 2007ACQUISITION PRICE $13.5 millionDATE CONSTRUCTED2006OCCUPANCYAT1 2 / 3 1 / 1 285%TOP TENANTSAndalous Mediterranean GrillCitibankFive Guys BurgersJamba JuiceLa MadeleinePie FiveCapital Improvements 195 184 430 GLA (IN SQ . FT.)44,200Average Occupancy (%) 85 81 9168
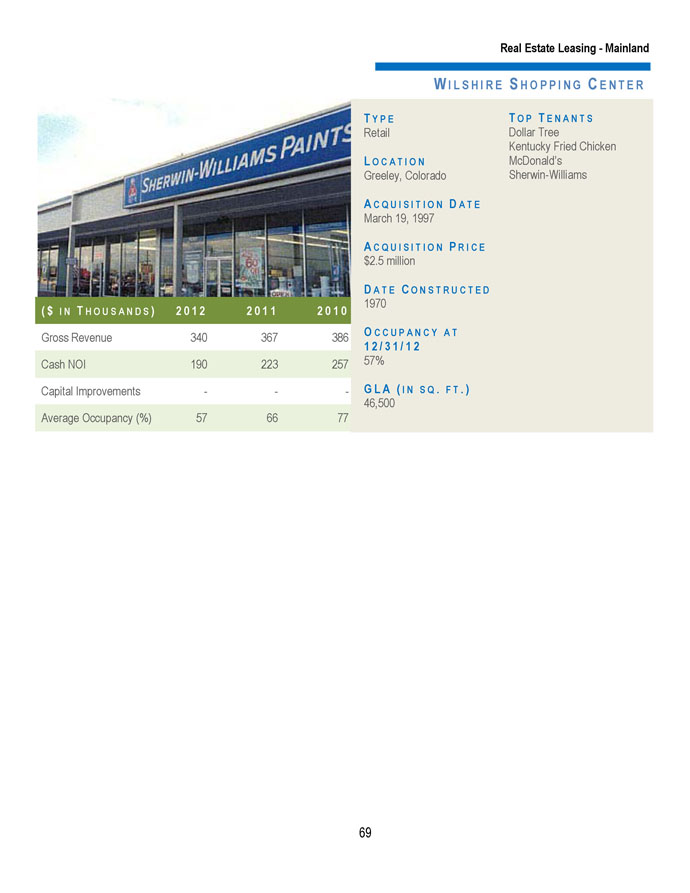
Real Estate Leasing - MainlandWILSHIRE SHOPPING CENTERTYPE TOP TENANTSRetail Dollar TreeKentucky Fried ChickenLOCATION McDonald’sGreeley, Colorado Sherwin-WilliamsACQUISITION DATEMarch 19, 1997ACQUISITION PRICE$2.5 millionDATE CONSTRUCTED($INTHOUSANDS) 2 0 1 2 2 0 1 1 2 0 1 0 1970Gross Revenue 340 367 386 OCCUPANCYAT1 2 / 3 1 / 1 2Cash NOI 190 223 257 57%Capital Improvements - - - GLA (IN SQ . FT.)46,500Average Occupancy (%) 57 66 7769