Alexander & Baldwin, Inc.’s Real Estate Supplement

As of and for the Years Ended December 31, 2013 and 2012
(Unaudited)
About This Supplement

This periodic Supplement is designed to provide current and potential shareholders of Alexander & Baldwin, Inc. with additional information regarding the Company’s Real Estate operating segments. This information is supplemental to and does not replace the information provided to shareholders in the Company’s periodic filings with the Securities and Exchange Commission.
The information contained in this Supplement is unaudited and should be read in conjunction with the Company’s quarterly and annual reports and other filings with the Securities and Exchange Commission. The Company intends to provide periodic updates to the information contained herein, but is not required, and undertakes no obligation, to revise or update forward-looking statements or any factors that may affect actual results, whether as a result of new information, future events, or circumstances occurring after the dates on the cover of this Supplement.
Feedback and suggestions regarding the contents of this Supplement are welcomed, and should be directed to Suzy P. Hollinger, Director, Investor Relations, via telephone at (808) 525-8422 or via email to shollinger@abinc.com.
Alexander & Baldwin, Inc. │Real Estate Supplement
Index to Real Estate Supplement
(Unaudited)
As of Years Ended December 31, 2013 and 2012
| Forward-Looking Statements | 3 |
| | |
| Basis of Presentation | 3 |
| | |
| Periodic Updates | 4 |
| | |
| About the Company | 5 |
| | |
| Selected Financial Data | 8 |
| | |
| Landholdings | 9 |
| | |
| Landholdings | 10 |
| | |
| Landholdings by Geographic Location (Table 1) | 10 |
| | |
| Landholdings Under Joint Venture Development (Table 2) | 10 |
| | |
| Landholdings by Type and Location (Table 3) | 11 |
| | |
| A&B Ag Zoned Land Sales Data – Maui and Kauai– 2008 to 2013 (Table 4) | 12 |
| | |
| Real Estate Development & Sales | 13 |
| | |
| Segment Strategy and Operations | 14 |
| | |
| Real Estate Development & Sales Overview (Table 5) | 15 |
| | |
| Reconciliation of Acreage Under Development (Table 5) to Landholdings (Table 3) (Table 6) | 17 |
| | |
| Development Project Information Sheets | 19 |
| | |
| Real Estate Investments | 28 |
| | |
| Future Development Project Summaries | 29 |
| | |
| Entitlement Activity | 30 |
| | |
| Real Estate Leasing | 33 |
| | |
| Segment Strategy and Operations | 34 |
| Asset Descriptions and Statistics | 37 |
| | |
| Property Detail – Hawaii Properties (Table 7) | 37 |
| | |
| Property Detail – Mainland Improved Properties (Table 8) | 39 |
| | |
| Comparable % Occupancy Data by Geographic Region and Asset Class (Table 9) | 40 |
| | |
| Weighted Average Gross Leasable Area by Geographic Region and Asset Class (Table 10) | 40 |
| | |
| Occupancy Analysis Trend - Last Five Quarters (Table 11) | 40 |
| | |
| Real Estate Leasing Net Operating Income (NOI) (Table 12) | 41 |
| | |
| Real Estate Leasing Same Store NOI (Table 13) | 41 |
| | |
| Statement on Management’s Use of Non-GAAP Financial Measures | 42 |
| | |
| Reconciliation of Real Estate Leasing Operating Profit to NOI and Same Store NOI (Non-GAAP) (Table 14) | 42 |
| | |
| Portfolio Acquisitions and Dispositions | 43 |
| | |
| 2013 and 2012 Property Portfolio Acquisitions/Dispositions (Table 15) | 43 |
| | |
| Lease Renewal Analysis | 44 |
| | |
| Lease Expirations (Table 16) | 44 |
| | |
| Portfolio Concentrations | 45 |
| | |
| Tenant Concentrations as of 12/31/13 (Table 17) | 45 |
| | |
| Hawaii Commercial Property Information Sheets | 47 |
| | |
| Mainland Commercial Property Information Sheets | 65 |
Forward-Looking Statements
This Supplement contains certain forward-looking statements, such as forecasts and projections of the Company’s future performance or statements of management’s plans and objectives. Statements in this Supplement that are not historical facts are forward-looking statements, as that term is defined in the Private Securities Litigation Reform Act of 1995. Forward-looking statements include, for example, all references to current or future years. New risk factors emerge from time to time and it is not possible for the Company to predict all such risk factors, nor can it assess the impact of all such risk factors on the Company’s business or the extent to which any factor, or combination of factors, may cause actual results to differ materially from those contained in any forward-looking statements. Accordingly, forward-looking statements cannot be relied upon as a guarantee of future results and involve a number of risks and uncertainties that could cause actual results to differ materially from those projected in the statements, including, but not limited to the factors that are described in Part I, Item 1A under the caption of “Risk Factors” of the Company’s Form 10-K, as well as factors that are described in the Company’s other filings, including subsequent filings, with the Securities and Exchange Commission (“SEC”). The Company is not required, and undertakes no obligation, to revise or update forward-looking statements or any factors that may affect actual results, whether as a result of new information, future events, or circumstances occurring after the date of this report.
Basis of Presentation
The information contained in this Supplement does not purport to disclose all items required by accounting principles generally accepted in the United States of America (GAAP). The information contained in this Supplement is unaudited and should be read in conjunction with the Company’s most recent Form 10-K and other filings with the SEC.
Periodic Updates
The Company provides quarterly updates, but undertakes no obligation to continue to provide updates, of the information contained in the tables listed below:
| Table 7: | Property Detail – Hawaii Properties |
| | |
| Table 8: | Property Detail – Mainland Improved Properties |
| | |
| Table 9: | Comparable % Occupancy Data by Geographic Region and Asset Class |
| | |
| Table 10: | Weighted Average Gross Leasable Area by Geographic Region and Asset Class |
| | |
| Table 11: | Occupancy Analysis Trend – Last Five Quarters |
| | |
| Table 12: | Real Estate Leasing NOI |
| | |
| Table 13: | Real Estate Leasing Same Store NOI |
| | |
| Table 14: | Reconciliation of Real Estate Leasing Operating Profit to NOI and Same Store NOI (Non-GAAP) |
| | |
| Table 15: | Improved Property Portfolio Acquisitions/Dispositions |
For detailed information on past quarters, refer to the quarterly supplements for 2013, which are available on the Company’s website at www.alexanderbaldwin.com.
The Company currently intends to update all other information contained herein on an annual basis.
About the Company
Alexander & Baldwin, Inc. (“A&B” or “Company”) is a Hawaii-based company, with interests in real estate development, commercial real estate, agriculture, natural materials and infrastructure construction. Founded in 1870 as a sugar plantation, the Company has evolved from its agricultural roots into complementary businesses serving the real estate, agricultural, and natural materials and construction needs of Hawaii. A&B’s operations also include 13 commercial properties and four development joint ventures on the U.S. Mainland commercial property portfolio.
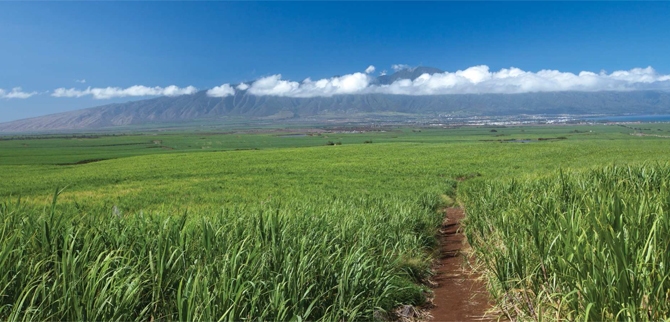
A&B has significant landholdings in Hawaii; at December 31, 2013, the Company owned 88,755 acres in the state, primarily on the islands of Maui and Kauai. A&B is responsible for the stewardship of this land and the long-term enhancement of its value. The vast majority of this land was acquired over 100 years ago to support the cultivation of sugar cane.
For a significant portion of the Company’s core Hawaii landholdings, agriculture and related uses represent the highest and best use for the foreseeable future, providing significant benefits to the community and shareholders alike. In total, roughly 87,900 acres of the Company’s land, including land leased to others, are currently designated for agriculture and conservation uses (the latter consisting mainly of the collection and transport of water for irrigation purposes and hydroelectric power production). A&B cultivates sugar on nearly 36,000 acres (including land leased from third parties) in Maui’s Central Valley. On Kauai, A&B leases roughly 5,100 acres to third parties engaged in a variety of agricultural activities, including cultivation of coffee and seed corn, and raising of livestock. The Company also utilizes its land assets to produce renewable energy, including biomass combustion, hydroelectric, and solar photovoltaic generation facilities.
A&B’s integrated approach to land management enables lands that are suitable for development to be employed at their highest and best use by undertaking planning, entitlement and development activities, where appropriate, to enhance the value of the Company’s lands, while addressing market demand and community needs. By identifying and pursuing developments and transactions that enhance the value of raw landholdings, and reinvesting proceeds from these efforts into new developments and of commercial properties, A&B creates value for shareholders and diversifies its income stream. The Company’s development activities, once limited to its legacy landholdings on Maui and Kauai, have expanded to encompass lands newly acquired for development and the participation in a number of development joint ventures throughout Hawaii. This expansion of the Company’s development activities has allowed it to leverage its expertise, market knowledge and capital resources, while also mitigating risk.
Real Estate
Real estate development and leasing activities are conducted by A&B Properties, Inc. (“A&B Properties”), a wholly owned subsidiary of A&B, and various other subsidiaries and affiliates of A&B. The Company’s real estate business consists of two segments that operate in Hawaii and on the Mainland: Development & Sales; and Leasing. The Development & Sales segment creates value through an active and comprehensive program of land stewardship, planning, entitlement, investment, development and sale of land and commercial and residential properties principally in Hawaii. The Leasing segment generates significant, stable, recurring cash flows through the ownership, operation and management of a portfolio of high-quality retail, office and industrial properties in Hawaii and on the Mainland. Cash generated by this portfolio serves as an important source of funding for A&B's real estate development activities.
Natural Materials & Construction
Natural materials and construction operations are conducted by Grace Pacific LLC (“Grace”), a wholly owned subsidiary of A&B. Grace mines, processes and sells basalt aggregate, imports sand and aggregates for sale and use, imports and markets liquid asphalt, manufactures and markets asphaltic concrete, performs asphalt paving as a prime contractor and subcontractor, manufactures and supplies precast/prestressed concrete products and provides and markets various construction- and traffic-control-related services and products. Grace was acquired by A&B on October 1, 2013.
Agribusiness
Agribusiness operations are conducted by Hawaiian Commercial & Sugar Company (“HC&S”), a division of A&B, and certain other wholly owned subsidiaries of A&B. Agribusiness produces and sells bulk raw sugar, specialty food-grade sugars and molasses, and is also a renewable energy provider on the islands of Maui and Kauai through hydroelectric and solar facilities and the cogeneration of electricity from bagasse at its sugar mill. This segment, which operates exclusively in Hawaii, also includes support services for other agricultural operations and includes general trucking services, mobile equipment maintenance and repair services.
More information about the Company can be found atwww.alexanderbaldwin.com.
Corporate Headquarters Alexander & Baldwin, Inc. 822 Bishop Street Honolulu, HI 96813 Investor Relations Suzy P. Hollinger Director, Investor Relations
(808) 525-8422
shollinger@abinc.com | Websites Alexander & Baldwin, Inc.
www.alexanderbaldwin.com A&B Properties, Inc. www.abprop.com Grace Pacific LLC www.gracepacific.com Hawaiian Commercial & Sugar Company
www.hcsugar.com Transfer Agent & Registrar Computershare P.O. BOX 30170 College Station, TX 77842-3170 Overnight correspondence: Computershare 211 Quality Circle, Suite 210 College Station, TX 77845 Shareholder website www.computershare.com/investor Shareholder online inquiries https://www-us.computershare.com/investor/Contact Stock Exchange Listing NYSE: ALEX |
Selected Financial Data
| ($ in millions) | | 2009 | | | 2010 | | | 2011 | | | 2012 | | | 2013 | | | 5-Year
Average | |
| Revenue1 | | | | | | | | | | | | | | | | | | |
| Real Estate Leasing | | | 102.5 | | | | 93.8 | | | | 99.7 | | | | 100.6 | | | | 110.4 | | | | 101.4 | |
| Real Estate Development & Sales | | | 125.5 | | | | 131.0 | | | | 59.8 | | | | 32.2 | | | | 423.0 | | | | 154.3 | |
| Natural Materials & Construction2 | | | n/a | | | | n/a | | | | n/a | | | | n/a | | | | 54.9 | | | | 54.9 | |
| Agribusiness | | | 99.6 | | | | 165.6 | | | | 157.5 | | | | 182.3 | | | | 146.1 | | | | 150.2 | |
| Reconciling items3 | | | - | | | | - | | | | - | | | | (8.3 | ) | | | - | | | | (1.7 | ) |
| Total | | | 327.6 | | | | 390.4 | | | | 317.0 | | | | 306.8 | | | | 734.4 | | | | 415.2 | |
| | | | | | | | | | | | | | | | | | | | | | | | | |
| Operating Profit 1 | | | | | | | | | | | | | | | | | | | | | | | | |
| Real Estate Leasing | | | 43.2 | | | | 35.3 | | | | 39.3 | | | | 41.6 | | | | 43.4 | | | | 40.6 | |
| Real Estate Development & Sales4 | | | 39.1 | | | | 50.1 | | | | 15.5 | | | | (4.4 | ) | | | 44.4 | | | | 28.9 | |
| Natural Materials & Construction2 | | | n/a | | | | n/a | | | | n/a | | | | n/a | | | | 2.9 | | | | 2.9 | |
| Agribusiness | | | (27.8 | ) | | | 6.1 | | | | 22.2 | | | | 20.8 | | | | 10.7 | | | | 6.4 | |
| Total | | | 54.5 | | | | 91.5 | | | | 77.0 | | | | 58.0 | | | | 101.4 | | | | 76.5 | |
| | | | | | | | | | | | | | | | | | | | | | | | | |
| Real Estate Leasing Cash NOI5 | | | 65.9 | | | | 55.7 | | | | 60.8 | | | | 63.1 | | | | 68.8 | | | | 62.9 | |
| 1 | Includes real estate discontinued operations and intersegment revenue. |
| 2 | Grace Pacific was acquired on October 1, 2013. |
| 3 | Represents the sale of a 286-acre agricultural parcel in the third quarter of 2012, which is reflected as revenue for segment reporting purposes. |
| 4 | 2012 includes $9.8 million of charges related to the non-cash write down of the carrying values of non-strategic Mainland projects that do not align with the Company’s post-separation focus on Hawaii real estate development and sales. |
| 5 | See Table 14 for a statement regarding the Company’s use of NOI and a reconciliation of Leasing operating profit to NOI for the total portfolio. |
Alexander & Baldwin, Inc. │Real Estate Supplement
Landholdings
Landholdings
As of December 31, 2013, A&B and its subsidiaries owned 88,921 acres, consisting of 88,755 acres in Hawaii and 166 acres on the Mainland.
Table 1
Landholdings By Geographic Location
December 31, 2013
| Location | | Acres | |
| Maui | | | 66,675 | |
| Kauai | | | 20,365 | |
| Oahu | | | 1,440 | |
| Molokai | | | 265 | |
| Big Island | | | 10 | |
| Total Hawaii | | | 88,755 | |
| | | | | |
| California | | | 53 | |
| Utah | | | 40 | |
| Texas | | | 24 | |
| Nevada | | | 21 | |
| Arizona | | | 19 | |
| Colorado | | | 5 | |
| Washington | | | 4 | |
| Total U.S. Mainland | | | 166 | |
| | | | | |
| Total landholdings | | | 88,921 | |
Table 1 does not include 1,070 acres held under joint venture development (see Table 2 below). The Company also leases an additional 3,000 acres on Maui, Kauai, and Oahu from third parties.
Table 2
Landholdings Under Joint Venture Development
December 31, 2013
| Project | | Original
acres | | | Acres at
12/31/13 | |
| Kukui’ula (HI) | | | 1,000 | | | | 943 | |
| Bakersfield (CA) | | | 57 | | | | 57 | |
| Ka Milo (HI) | | | 31 | | | | 20 | |
| Kai Malu (HI) | | | 25 | | | | 1 | |
| Santa Barbara Ranch (CA) | | | 22 | | | | 22 | |
| Palmdale (CA) | | | 18 | | | | 18 | |
| Crossroads (CA) | | | 7 | | | | 7 | |
| Waihonua (HI) | | | 2 | | | | 2 | |
| Total | | | 1,162 | | | | 1,070 | |
The bulk of the Company’s 88,921 acres is used for agricultural, pasture, watershed and conservation purposes. A portion of these lands is used or planned for development or other urban uses, including the development projects described in the following pages. Table 3 details the Company’s landholdings by type and location.
Table 3
Landholdings By Type and Location
December 31, 2013
| | | Maui | | | Kauai | | | Oahu | | | Big Island | | | Molokai | | | Hawaii Total
Acres | | | Mainland Total
Acres | | | Total Acres | |
| Fully entitled | | | | | | | | | | | | | | | | | | | | | | | | | | | | | | | | |
| Hawaii – development/other | | | | | | | | | | | | | | | | | | | | | | | | | | | | | | | | |
| Active development/sales | | | 248 | | | | - | | | | 14 | | | | - | | | | - | | | | 262 | | | | - | | | | 262 | |
| Future development | | | 132 | | | | 44 | | | | - | | | | - | | | | - | | | | 176 | | | | - | | | | 176 | |
| Ground leases to third parties | | | 64 | | | | 1 | | | | 51 | | | | - | | | | - | | | | 116 | | | | - | | | | 116 | |
| Land used by affiliates | | | 22 | | | | 24 | | | | - | | | | - | | | | - | | | | 46 | | | | - | | | | 46 | |
| Other, including land not planned for development | | | 16 | | | | 33 | | | | - | | | | - | | | | - | | | | 49 | | | | - | | | | 49 | |
| | | | 482 | | | | 102 | | | | 65 | | | | - | | | | - | | | | 649 | | | | - | | | | 649 | |
| Hawaii – commercial improved properties | | | 58 | | | | 18 | | | | 120 | | | | 10 | | | | - | | | | 206 | | | | - | | | | 206 | |
| Mainland – commercial improved properties | | | - | | | | - | | | | - | | | | - | | | | - | | | | - | | | | 166 | | | | 166 | |
| Subtotal – fully entitled | | | 540 | | | | 120 | | | | 185 | | | | 10 | | | | - | | | | 855 | | | | 166 | | | | 1,021 | |
| | | | | | | | | | | | | | | | | | | | | | | | | | | | | | | | | |
| Agricultural, pasture and miscellaneous | | | | | | | | | | | | | | | | | | | | | | | | | | | | | | | | |
| Hawaiian Commercial & Sugar Company | | | 33,054 | | | | - | | | | - | | | | - | | | | - | | | | 33,054 | | | | - | | | | 33,054 | |
| Leased to third parties | | | 6,308 | | | | 5,123 | | | | 75 | | | | - | | | | - | | | | 11,506 | | | | - | | | | 11,506 | |
| Other agricultural, pasture and misc. purposes | | | 10,903 | | | | 1,797 | | | | 540 | | | | - | | | | 265 | | | | 13,505 | | | | - | | | | 13,505 | |
| Subtotal – agricultural, pasture & misc. | | | 50,265 | | | | 6,920 | | | | 615 | | | | - | | | | 265 | | | | 58,065 | | | | - | | | | 58,065 | |
| | | | | | | | | | | | | | | | | | | | | | | | | | | | | | | | | |
| Watershed/conservation | | | 15,870 | | | | 13,325 | | | | 640 | | | | - | | | | - | | | | 29,835 | | | | - | | | | 29,835 | |
| | | | | | | | | | | | | | | | | | | | | | | | | | | | | | | | | |
| Total landholdings | | | 66,675 | | | | 20,365 | | | | 1,440 | | | | 10 | | | | 265 | | | | 88,755 | | | | 166 | | | | 88,921 | |
Table 4
A&B Ag Zoned Land Sales Data – Maui and Kauai
2008-2013
| | | Total acres
sold | | | Average
price per
acre | | | High | | | Low | |
| 0-5 acres | | | 5 | | | $ | 138,000 | | | $ | 175,000 | | | $ | 104,000 | |
| 5-20 acres | | | 60 | | | | 62,100 | | | | 167,800 | | | | 24,300 | |
| 20-100 acres | | | 352 | | | | 29,400 | | | | 55,700 | | | | 14,000 | |
| 100+ acres | | | 858 | | | | 23,300 | | | | 29,000 | | | | 11,300 | |
| Total | | | 1,275 | | | $ | 27,300 | | | $ | 175,000 | | | $ | 11,300 | |
Alexander & Baldwin, Inc. │Real Estate Supplement

Real Estate Development & Sales
Real Estate Development & Sales Segment Strategy and Operations
The Real Estate Development & Sales segment generates its operating profit through the development and sale of pipeline projects, raw lands, real estate investments, commercial properties from the Real Estate Leasing segment portfolio, and the equity in earnings of joint ventures.
The Development & Sales segment primarily seeks to create shareholder value through an active, comprehensive, Hawaii-centric program of land stewardship, planning, entitlement, investment, development and sale of real estate. The segment’s primary strategic objectives include:
Focus on entitlement and development of legacy Hawaii lands
A&B focuses on the development of a portion of its core landholdings in Hawaii, pursuing entitlement and development projects that respond to market demand while meeting community needs. The large amount of land that the Company owns on Maui and Kauai provides opportunities for A&B to serve a wide range of markets.
Invest in high-returning real estate opportunities in Hawaii
In addition to the development of its legacy lands, since 1998, A&B has invested in attractive development opportunities across Hawaii, leveraging market knowledge, development expertise, entitlement experience and financial strength to both create shareholder value and diversify its development portfolio and pipeline.
Expand pipeline projects for market recovery
A&B’s pipeline of development projects encompasses a broad range of real estate product types, including residential and commercial properties. A&B works to continuously expand this pipeline to meet the real estate demands.
Utilize strategic joint ventures with a wide variety of partners
A&B pursues joint ventures and other strategic relationships, where appropriate, to supplement its in-house capabilities, access third-party capital, gain access to new opportunities in the Hawaii market, diversify its pipeline, and optimize risk-adjusted returns.
Table 5 provides an overview of all of the Company’s wholly owned and joint venture development projects, and is further supplemented by project information sheets that follow the table.
Table 5
Real Estate Development and Sales Overview
December 31, 2013
| | | | | | | | | | | | | | | | | | (Dollars in millions) | | Construction timing | | Sales Closings Timing |
| Project | | Location | | Product type | | Est.
economic
interest1 | | Acres at
12/31/13 | | Planned units,
saleable acres
or gross
leasable square
feet | | Average
unit (sf) or
lot size
(acres) | | Units/acres
closed
through
12/31/13 | | Targeted sales price
range per square
foot or NOI | | Est.
project
cost2 | | A&B net
investment
as of
12/31/13 | | A&B
capital est.
20143 | | O/S
debt | | Start/Est.
start | | Est.
substantial
completion | | Start/Est.
start | | Est. end |
| ACTIVE DEVELOPMENT/SALES | | | | | | | | | | | | | | | | | | | | | | | | | | | | | | | | |
| Wholly owned (100% economic interest) | | | | | | | | | | | | | | | | | | | | | | | | | | | | | | | | |
| The Collection | | Honolulu, Oahu | | Primary residential | | | | - | | 467 units | | 904 sf | | - | | tbd | | tbd | | 4 | | tbd | | - | | tbd | | tbd | | 2017 | | 2017 |
| Haliimaile | | Haliimaile, Maui | | Primary residential | | | | 55 | | 175-200 lots | | 7,500 sf | | - | | tbd | | tbd | | 1 | | 3 | | - | | 2016 | | 2019 | | 2016 | | 2019 |
| Kahala Avenue Portfolio | | Honolulu, Oahu | | Residential | | | | 13 | | 30 lots | | 0.5 acres | | 9 lots | | $150-$385 | | 135 | | 99 | | 1 | | 42 | | n/a | | n/a | | 2013 | | 2018 |
| Keala o Wailea (MF-11) | | Wailea, Maui | | Resort residential | | | | 7 | | 70 units | | 1,450 sf | | - | | $600-$800 | | 54 | | 9 | | - | | - | | 2014 | | 2015 | | 2015 | | 2017 |
| Maui Business Park II4 | | Kahului, Maui | | Light industrial | | | | 150 | | 130 acres | | 0.5-11 acres | | 4 acres | | $38-$60 | | 102 | | 54 | | 5 | | - | | 2011 | | 2021 | | 2012 | | 2028 |
| Mililani Mauka | | Mililani, Oahu | | Retail/Office | | | | 2 | | 34,000 sf | | n/a | | - | | $1.0M stabilized NOI | | 17 | | 6 | | 6 | | - | | 2012 | | 2015 | | n/a | | n/a |
| The Ridge at Wailea (MF-19) | | Wailea, Maui | | Resort residential | | | | 7 | | 9 lots | | 0.5 acres | | - | | $60-$130 | | 9 | | 9 | | - | | - | | 2007 | | 2009 | | 2014 | | 2016 |
| Wailea B-1 | | Wailea, Maui | | Commercial/retail | | | | 16 | | 60,000 sf | | tbd | | - | | tbd | | tbd | | 5 | | 1 | | - | | tbd | | tbd | | tbd | | tbd |
| Wailea MF-7 | | Wailea, Maui | | Resort residential | | | | 13 | | 75 units | | 1,700 sf | | - | | $800-$1,100 | | 84 | | 9 | | - | | - | | 2015 | | 2017 | | 2017 | | 2018 |
| Total | | | | | | | | 263 | | | | | | | | | | | | | | | | | | | | | | | | |
| | | | | | | | | | | | | | | | | | | �� | | | | | | | | | | | | | | |
| Joint ventures | | | | | | | | | | | | | | | | | | | | | | | | | | | | | | | | |
| Ka Milo at Mauna Lani | | Kona, Hawaii | | Resort residential | | 50% | | 20 | | 137 units | | 2,000 sf | | 49 units | | $530-$800 | | 120 | | 10 | | - | | - | | 2005 | | 2016 | | 2007 | | 2016 |
| Kai Malu at Wailea | | Wailea, Maui | | Resort residential | | 50% | | 1 | | 150 units | | 2,800 sf | | 147 units | | $540-$1,080 | | 124 | | 1 | | - | | - | | 2004 | | 2008 | | 2006 | | 2014 |
| Kukui'ula | | Poipu, Kauai | | Resort residential | | 85% +/- 5% | | 943 | | Up to 1,500 units on 640 saleable acres | | 0.42 acres | | 98 lots | | $30-$130 | | 785 | | 259 | | 11 | | - | | 2006 | | 20305 | | 2006 | | 2030 |
| Waihonua at Kewalo | | Honolulu, Oahu | | Primary residential | | 75% +/- 5% | | 2 | | 341 units (340 salable) | | 1,000 sf | | - | | $450-$970 | | 210 | | 33 | | - | | - | | 2012 | | 2014 | | 2015 | | 2015 |
| | | | | | | | | 966 | | | | | | | | | | | | | | | | | | | | | | | | |
| | | | | | | | | | | | | | | | | | | | | | | | | | | | | | | | | |
| Investments | | | | | | | | | | | | | | | | | | | | | | | | | | | | | | | | |
| ONE Ala Moana | | Honolulu, Oahu | | Preferred investment | | | | | | 206 | | | | | | | | | | 20 | | - | | - | | 2013 | | 2014 | | 2014 | | 2015 |
| | | | | | | | | | | | | | | | | | | | | | | | | | | | | | | | | |
| FUTURE DEVELOPMENT | | | | | | | | | | | | | | | | | | | | | | | | | | | | | | | | |
| Wholly owned | | | | | | | | | | | | | | | | | | | | | | | | | | | | | | | | |
| Aina 'O Kane | | Kahului, Maui | | Primary res./commercial | | | | 4 | | | | | | | | | | | | | | | | | | | | | | | | |
| Brydeswood | | Kalaheo, Kauai | | Agricultural Lots | | | | 336 | | | | | | | | | | | | | | | | | | | | | | | | |
| Kahului Town Center | | Kahului, Maui | | Primary res./commercial | | | | 19 | | | | | | | | | | | | | | | | | | | | | | | | |
| Kai Olino | | Port Allen, Kauai | | Primary residential | | | | 4 | | | | | | | | | | | | | | | | | | | | | | | | |
| Wailea SF-8 | | Kihei, Maui | | Primary residential | | | | 13 | | | | | | | | | | | | | | | | | | | | | | | | |
| Wailea MF-6 | | Wailea, Maui | | Resort residential | | | | 23 | | | | | | | | | | | | | | | | | | | | | | | | |
| Wailea MF-10 | | Wailea, Maui | | Resort residential/commercial | | | | 14 | | | | | | | | | | | | | | | | | | | | | | | | |
| Wailea MF-16 | | Wailea, Maui | | Resort residential | | | | 7 | | | | | | | | | | | | | | | | | | | | | | | | |
| Wailea, other | | Wailea, Maui | | Various | | | | 71 | | | | | | | | | | | | | | | | | | | | | | | | |
| Total | | | | | | | | 491 | | | | | | | | | | | | | | | | | | | | | | | | |
Table 5(continued)
Real Estate Development and Sales Overview
December 31, 2013
| | | | | | | | | | | | | | | | | | | (Dollars in millions) | | Construction timing | | Sales Closings Timing |
| Project | | Location | | Product type | | Est.
economic
interest1 | | Acres at
12/31/13 | | Planned units,
saleable acres
or gross
leasable square
feet | | Average
unit (sf) or
lot size
(acres) | | Units/acres
closed
through
12/31/13 | | Targeted sales price
range per square
foot or NOI | | Est.
project
cost2 | | A&B net
investment
as of
12/31/13 | | A&B
capital est.
20143 | | O/S
debt | | Start/Est.
start | | Est.
substantial
completion | | Start/Est.
start | | Est. end |
| FUTURE DEVELOPMENT (Continued) | | | | | | | | | | | | | | | | | | | | | | | | | | | | | | | | |
| Joint ventures | | | | | | | | | | | | | | | | | | | | | | | | | | | | | | | | |
| Bakersfield | | Bakersfield, CA | | Retail | | | | 57 | | | | | | | | | | | | | | | | | | | | | | | | |
| Palmdale Center | | Palmdale, CA | | Office/Industrial | | | | 18 | | | | | | | | | | | | | | | | | | | | | | | | |
| Santa Barbara Ranch | | Santa Barbara, CA | | Primary residential | | | | 22 | | | | | | | | | | | | | | | | | | | | | | | | |
| | | | | | | | | 97 | | | | | | | | | | | | | | | | | | | | | | | | |
| ENTITLEMENT | | | | | | | | | | | | | | | | | | | | | | | | | | | | | | | | |
| Ele'ele Community Phase I | | Ele'ele, Kauai | | Primary residential | | | | 260 | | tbd | | | | | | | | | | | | | | | | | | | | | | |
| Kihei Residential | | Kihei, Maui | | Primary residential | | | | 95 | | up to 600 units | | | | | | | | | | | | | | | | | | | | | | |
| Wai'ale | | Kahului, Maui | | Primary residential | | | | 545 | | up to 2,550 units | | | | | | | | | | | | | | | | | | | | | | |
| | | | | | | | | 900 | | | | | | | | | | | | | | | | | | | | | | | | |
| | | | | | | | | | | | | | | | | | | | | | | | | | | | | | | | | |
| JOINT VENTURE DEVELOPMENTS HELD FOR LEASE | | | | | | | | | | | | | | | | | | | | | | | | | | | | | | | | |
| Crossroads Plaza | | Valencia, CA | | Office/retail | | | | 7 | | 56,000 s.f. | | 100% occup. | | | | | | | | | | | | | | | | | | | | |
| 1 | Economic interest represents the Company’s estimated share of distributions after return of capital contributions, based on current forecasts of sales activity. Actual results could differ materially from projected results due to the timing of expected sales, increases or decreases in estimated sales prices or costs and other factors. As a result, estimated economic interests are subject to change. |
| 2 | Includes land cost at book value and capitalized interest, but excludes sales commissions and closings costs. |
| 3 | Estimated 2014 capital is dependent on a number of factors, including timing of sales proceeds, project costs and construction progress. Construction progress, even on fully entitled projects, depends on additional government approvals, such as building permits. As a result, estimated capital expenditures, sales or leasing timing are subject to change. |
| 4 | Includes 24 acres of roadways and other infrastructure that are not saleable. |
| 5 | Represents estimated completion date for major project infrastructure and amenities. Construction activities related to parcel development will be ongoing. |
Table 6
Reconciliation of Acres Under Development (Table 5) to Landholdings (Table 3)
December 31, 2013
| | | Acres | |
| Active development/sales - wholly owned (Table 5) | | | 263 | |
| Less: | | | | |
| Gateway at Mililanu Mauka acres included in Hawaii-commercial improved properties in Table 3 | | | (1 | ) |
| Active development/sales (Table 3) | | | 262 | |
| | | | | |
| Future development - wholly owned (Table 5) | | | 491 | |
| Less: | | | | |
| Brydeswood agricultural-zoned lots included in Kauai other ag, pasture and misc. purposes in Table 3 | | | (336 | ) |
| Kahului Town Center redevelopment acres included in Hawaii-commercial improved properties in Table 3 | | | (19 | ) |
| | | | | |
| Add: | | | | |
| Ele'ele acres already entitled included in Kauai fully entitled future development in Table 3 | | | 40 | |
| Fully entitled Hawaii-development/other- future development (Table 3) | | | 176 | |
This page was intentionally left blank.
| Development Project Information Sheets |
 |
| ACTIVE DEVELOPMENT | |
| | |
| Wholly Owned | |
| | |
| The Collection | 20 |
| Haliimaile | 20 |
| Kahala Avenue Portfolio | 21 |
| Maui Business Park II | 21 |
| Mililani Mauka – Retail/Office | 22 |
| Wailea | 23 |
| | |
| Keala O Wailea (MF-11) | 24 |
| The Ridge at Wailea (MF-19) | 24 |
| Wailea B-1 | 24 |
| Wailea MF-7 | 24 |
| | |
| Joint Venture | |
| | |
| Ka Milo at Mauna Lani | 25 |
| Kukui‘ula | 26 |
| Waihonua at Kewalo | 27 |
| | |
| INVESTMENTS | |
| | |
| ONE Ala Moana | 28 |
| | |
| FUTURE DEVELOPMENTS | |
| | |
| Wholly Owned | |
| | |
| Aina ‘O Kane | 29 |
| Brydeswood | 29 |
| Kahului Town Center | 29 |
| Wailea Parcels | 29 |
| | |
| ENTITLEMENT ACTIVITY | |
| | |
| Ele’ele Community | 30 |
| Kihei Residential | 31 |
| Wai’ale Community | 31 |
| | |
| Active Development |
 |
The Collection
 | | Location |
| | Honolulu, Oahu |
| | |
| | Acquisition Date |
| | Controlled under a long-term option agreement to acquire site |
| | |
| | Acres |
| | Option to purchase 3.3 acres |
| | |
| | Units |
| | 467 |
| Project Overview |
| · Planned development of mixed-use residential community to include high-rise tower, mid-rise building and townhomes, as well as retail shops and restaurants | | · Ocean views and convenient location are expected to appeal to the local buyers the Company is targeting |
| · Controlled under a long-term option agreement to acquire site | | · As of February 20, 2013, 56% of the units available for sale were pre-sold under binding contracts |
| · Design completed and presales began on 397-unit high-rise tower on August 17, 2013 | | · The timing of construction will depend on a variety of factors, including achieving acceptable presales and completing the regulatory approval process |
| · Also to include, 16, 3-bedroom townhomes and 54 low-rise flats | | |
Haliimaile
 | | Location |
| | Haliimaile, Maui |
| | |
| | Acquisition Date |
| | Historic lands |
| | |
| | Acres |
| | 55 |
| | |
| | Lots |
| | 175-200 |
| Project Overview |
· Primary residential subdivision planned for Haliimaile
(Upcountry, Maui) | | · 10 acres are allocated for a park |
| · Project to include 175 to 200 single- and multi-family units | | · In 2012, an additional 80 acres adjacent to this subdivision, were approved by the County for future urban growth in the Maui Island Plan |
| Active Development |
|
| Kahala Avenue Portfolio |
 | | Location |
| | Honolulu, Oahu |
| | |
| | Acquisition Date |
| | September 10, 2013, December 27, 2013 |
| | |
| | Acres |
| | 16 (13 remaining) |
| | |
| | Lots |
| | 30 (27 lots acquired in September 2013, 3 lots acquired in December 2013) |
| Project Overview |
| · Original purchase of 27 lots on Kahala Avenue in September 2013 for $98 million | | · Acquisition was an off-market transaction at a substantial discount to market value |
· 3 additional lots acquired in December 2013 for $30 million
(2 oceanfront) | | · 10 lots sold since September 2013 for $53 million (9 closed in 2013, 1 in escrow and scheduled to close in April) |
| · Located on Kahala Avenue, Honolulu’s premier residential address | | |
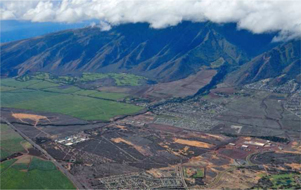
Maui Business Park II
 | | Location |
| | Kahului, Maui |
| | |
| | Acquisition Date |
| | Historic lands |
| | |
| | Acres |
| | Original: 154 (130 salable) |
| | Remaining: 126 salable |
| Project Overview |
| · Zoned for light industrial use (commercial, retail, office) | | · Adjacent to 76-acre Maui Business Park I project, Maui’s primary retail destination |
| · Well-located in Central Maui near Kahului Airport, Harbor and Maui’s primary residential districts | | · 4-acre parcel sold to Costco in January 2012 for $38 per square foot |
| · Primary source of Maui’s future commercial development lands | | · 24-acre adjacent parcel sold in November 2013 for $38 per square foot for the development of Maui’s first Target store |
| Active Development |
|
| Mililani Mauka- Retail/Office |
 | | Location |
| | Mililani, Oahu |
| | |
| | Acquisition Date |
| | December 29, 2011/June 7, 2012 |
| | |
| | Acres |
| | 9 (2 remaining for development, 7acres included in Leasing portfolio) |
| | |
| | GLA (in sq. ft.) |
| | 37,600- existing |
| | 34,000 - future |
| Project Overview |
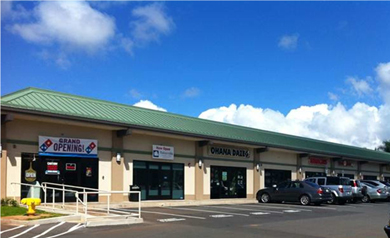
| · Fully zoned for commercial development | | · Construction of 11,500 square-foot building and a 1,500 square-foot standalone Starbucks building was completed in 2013 |
| · Well-located within the only retail shopping/office area in the Mililani Mauka community (pop. 20,000) in Central Oahu | | · Construction commenced and was substantially completed on a 16,000 square-foot building in 2013 that will be placed in service in the first quarter of 2014 |
| · Original 24,600 square-foot retail/office and land acquired with 1031 exchange funds | | · Planning and design of an 18,000 square-foot medical office building is underway |
| | | · Targeting restaurant, neighborhood retail and medical and office tenants. - Current tenants include Domino’s Pizza, Subway, Supercuts and Hakuyosha |
| Active Development |
|
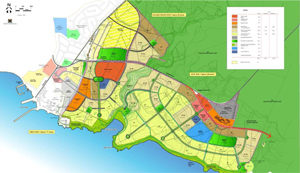
| Wailea |
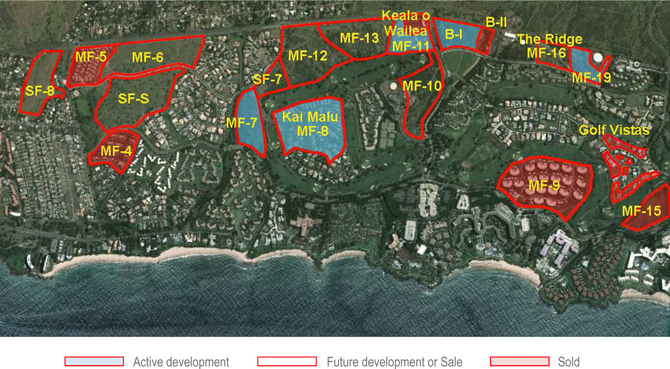
A&B was the original developer of the Wailea Resort on Maui, beginning in the 1970s and continuing until A&B sold the resort to a Japanese company in 1989. In October 2003, A&B re-acquired from the same Japanese company all of the remaining undeveloped land in the resort, consisting of 270 acres of fully zoned, residential and commercial land, for $67.1 million. This map shows the sites (outlined in red) that were reacquired in 2003. Since that time, sites MF-15, the Golf Vistas, B-II, MF-9, MF-5 and MF-4 were sold or developed, and MF-8 was contributed to the Kai Malu joint venture. A&B has approximately 170 acres of developable land remaining in the Wailea resort planned for up to 700 units; 40 acres are in active development and/or being marketed for sale.
| Active Development |
| |
| Wholly Owned |
| |
| Keala o Wailea (MF-11), The Ridge at Wailea (MF-19), B-1, MF-7 |
| |
| Joint Ventures |
| |
| Kai Malu at Wailea (MF-8, 3 units remaining) |
| |
| Future Development or Sale |
| |
| MF-6, MF-10, MF-12, MF-13, MF-16, SF-7, SF-8, SF-S |
| |
Wailea Active Development
Keala o Wailea (MF-11)
Keala o Wailea (MF-11) is a planned 70-unit multi-family development on seven acres in partnership with Armstrong Builders. The estimated sales price range is $600 to $800 per square foot.
The Ridge at Wailea (MF-19)
The Ridge at Wailea (MF-19) consists of nine, half-acre, oceanview estate lots situated on 7 acres. The estimated sales price range is $60 to $130 per square foot, with an average list price of $2 million.
Wailea B-1
The 16-acre B-1 parcel, which contains the only approved gas station site within the Wailea master plan, is planned for a retail commercial center with approximately 60,000 square feet of leasable space. Preliminary planning and design work was completed and bulk sale or development is being considered for the project.
Wailea MF-7
The 13-acre MF-7 parcel is fully designed and permitted for the development of a 75-unit multi-family project. The project has secured the required affordable housing credits and water meters.
| Active Development - Joint Ventures |
|
| Ka Milo at Mauna Lani |
 | | Location |
| | Kona, Hawaii |
| | |
| | Acquisition Date |
| | May 2004 |
| | |
| | Acres |
| | 31 (20 remaining) |
| | |
| | Units/Homes |
| | 137 total (49 sold) |
| Project Overview |
| · 137-unit resort residential community, with a mix of single-family and attached single-family homes | | · 13 units closed in 2013 at an average price of $1.1 million |
| · 51 units have been completed as of 12/31/13 | | · Units are constructed in phases based on buyer demand |
| · Onsite resort amenities include two pools, spa, exercise room, and function pavilion | | · 24 units are projected to be completed in 2014 |
| · Construction of second phase continues, focusing on single-family units | | |
| Active Development - Joint Ventures |
|
| Kukui‘ula |
 | | Location |
| | Poipu, Kauai |
| | |
| | Acquisition Date |
| | Historic lands |
| | |
| | Acres |
| | 1,000 (943 remaining) |
| | |
| | Units |
| | Up to 1,500 |
| | |
| |  |
| |
| |
| |
| |
| |
| |
| |
| |
| |
| Project Overview |
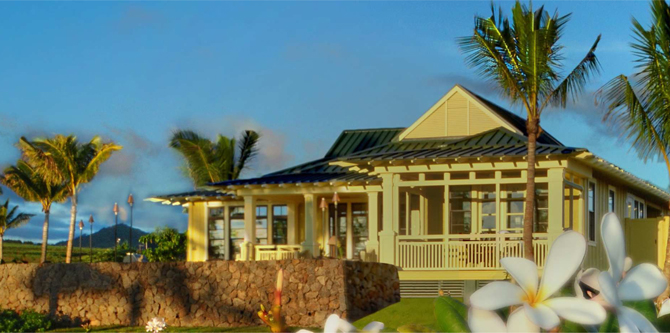
| · Luxury resort residential community in Poipu, Kauai for the development of up to 1,500 residential units on 1,000 fully entitled acres | | · Active vertical construction program, including 32 homes built and 12 under construction by the joint venture, owners or third party developers |
| · Joint venture with DMB Associates, developer of premier master-planned residential communities | | · Two cottages (average sales price $1,200 psf) and eight vacant lots (average price of $1.3 million) sold in 2013. 98 lots closed; 84 lots available as of February 20, 2014 |
· All resort amenities completed - 75,000 sq. ft. private club § Owners plantation house and golf club houses § World-class spas, pools, fitness center,
movement studio - Weiskopf-designed championship golf course - Community lake and farm - Beach pool, bar and grill | | · Property types - Premiere Estate Lots – 2+ acres ($5.8M) - The Villas – 4-bedroom, single-family, ocean view homes ($4.2M-$5M) - Club Cottages – 3-bedroom, furnished homes ($2.8M-$3M) - The Bungalows – 1 to 3-bedroom homes ($1.2M-$3M) - Custom Homesites – 20,000 sf to 2.5 acres
($1M-$4.75M) - Makai Cottages – 2 to 4 bedrooms homes, 7 floor plans ($2.2M-$4M) |
| Financial & Capital Overview |
| · Kukui’ula is a long-term, master planned project, designed to accommodate high-end resort residential growth on Kauai’s south shore over the next 15 to 25 years, and significant fluctuations in annual absorption over that time frame can be expected. The Company experienced similar absorption fluctuations over the course of its earlier, highly successful Wailea project. |
| · Sufficient project infrastructure is in place today to sell about 280 additional acres (500 to 800 units). Future infrastructure requirements would be paid for from project cash flows. |
| · GAAP accounting for the project will differ materially from cash flows, due to percentage of completion accounting. |
| · Total capital contributions to the venture as of December 31, 2013, were $266 million by A&B, which includes $30 million for the value of land contributed, and $188 million by DMB. |
| Active Dvelopment - Joint Ventures |
|
| Waihonua at Kewalo |
 | | Location |
| | Honolulu, Oahu |
| | |
| | Acquisition Date |
| | June 30, 2010 |
| | |
| | Units |
| | 341 (340 saleable) |
| | |
| | Floors |
| | 43 |
| Project Overview |
· High-rise condominium in urban Honolulu, near the
Ala Moana Center | | · Amenities include recreation deck, pool, spa, barbeque dining pavilions, fitness center, private movie theatre and visitor guest suites |
| · Well located near shopping, restaurants and beaches | | · Joint venture partners, construction loan and general contractor secured in 2012 |
| · One-, two- and three-bedroom residences averaging 1,000 square feet | | · Construction underway with completion projected in early 2015 |
| · Sales prices average approx. $725/sq. ft. | | · In July 2013, all 340 saleable units were pre-sold under binding contracts |
| Real Estate Investments |
|
Since 1998 A&B has invested in attractive real estate development and investment opportunities across Hawaii, leveraging market knowledge, development expertise, entitlement experience and financial strength to both create shareholder value and diversify its development portfolio and pipeline.
ONE Ala Moana (OAHU)
ONE Ala Moana is a 23-story condominium tower consisting of 206 luxury residential units that is being developed by a partnership of the Howard Hughes Corporation, The MacNaughton Group and Kobayashi Group. A&B made a $20 million preferred investment with profit participation. The tower is being developed at Ala Moana Center. As of April 2013, all of the 205 units available for sale were pre-sold under binding contracts. The project is under construction with a targeted completion date of late 2014.
| Future Development Project Summaries |
|
Hawaii
Aina ‘O Kane (Maui)
A residential condominium development with ground-floor commercial space planned for Kahului, Maui.
Brydeswood (Kauai)
Brydeswood is planned for 24 large agriculture estate lots in Kalaheo, Kauai.
Kahului Town Center (Maui)
Redevelopment of the 19-acre Kahului Shopping Center block is being evaluated for a combination of residential and commercial units.
Kai‘Olino (Kauai)
Kai‘Olino is planned for 75 condominium units on four acres located at the harbor at Port Allen on the island of Kauai.
Wailea Parcels (Maui) – see page 23 for description
| Entitlement Activity |
|
Successful land entitlement is a challenging, yet critical step in the development process. Similar to other high-demand, high-quality locales with a limited supply of land suitable for development, the entitlement process in Hawaii is complex, time-consuming and costly, involving a variety of state and county regulatory approvals. For example, conversion of an agriculturally zoned parcel to residential zoning usually requires the following approvals:
| · | County amendment of the county general plan and community plan to reflect the desired residential use; |
| · | State Land Use Commission (SLUC) reclassification of the parcel from the Agricultural district to the Urban district; and |
| · | County rezoning of the property to the precise residential use desired. |
A&B actively works with regulatory agencies, commissions and legislative bodies at various levels of government to entitle lands. A&B designates a parcel as fully entitled or fully zoned when all of the above-mentioned land use approvals have been obtained.
Ongoing planning and entitlement efforts are focused on the following projects:
Ele’ele Community (Kauai)
The Ele’ele Community Master Plan is an 840-acre new primary residential community east of Port Allen on Kauai. The 260-acre first phase is being pursued through Kauai’s multi-year General Plan Update Process, which commenced in 2013. This process will take approximately two to three years, after which applications for state and county zoning would be pursued, as appropriate.
Kihei Residential (Maui)

A primary residential subdivision situated on 95 acres in Kihei, on Maui’s south shore, planned for up to 600 housing units, plus complementary commercial uses. In January 2009, the SLUC approved the project’s district boundary amendment application for urban designation. Applications for zoning and community plan amendment were filed with the County in 2010. In December 2010, the Planning Commission recommended approval of the change in zoning and community plan amendment applications, and the applications were transmitted to the County Council for review and approval. County Council hearings are scheduled in the first quarter of 2014.
Wai’ale Community (Maui)
Wai’ale is a proposed master-planned community located in Central Maui. Approximately 545 acres of the project have been designated for urban growth in the Maui General Plan to accommodate up to 2,550 primary housing units, together with parks, school, civic and commercial uses. In 2012, the SLUC approved Urban designation for the project. The Company is engaged in master planning and County land use applications for rezoning and a community plan amendment to be submitted to the County. In 2013, the County acquired an adjacent 209-acre parcel to be developed as a regional park.
This page was intentionally left blank.
| Alexander & Baldwin, Inc. │Real Estate Supplement |
 |
Real Estate Leasing

| Real Estate Leasing Segment Strategy and Operations |
 |
The Real Estate Leasing segment owns, operates and manages commercial properties. It focuses on acquiring high-quality retail, office and industrial properties in good locations, effectively managing those properties to increase margins through higher occupancies and cost management, and positioning these assets for potential sale when full market value has been achieved.1 Real Estate Leasing income also includes revenue from a variety of land leases, licenses and other agreements related to real estate in Hawaii. From a strategic perspective, the relatively stable, recurring cash flows generated by the Real Estate Leasing business act to counterbalance the cyclicality inherent in Real Estate Development and Sales results, as well as support development activities.
As of December 31, 2013, A&B’s portfolio includes 60 income-producing properties comprising 5.1 million square feet of gross leasable area (2.6 million in Hawaii and 2.5 million on the Mainland).
A&B strives to increase the value of its commercial property portfolio through active management. Periodically, when A&B believes it has maximized the value of a select asset, it may market the asset for sale, or sell in response to an unsolicited offer. Upon sale, A&B will seek to redeploy the proceeds on a 1031 tax-deferred basis into a new asset with a higher return potential. Income taxes that are deferred utilizing the 1031 exchange process represent an interest-free source of capital that is used by the Company to generate incremental cash flow. Given the low historical cost basis of the Company’s lands, the strategy is particularly appealing to A&B. Over the years, the Company has deferred approximately $225 million of income taxes on the sale of raw land and improved properties. The tax benefits of the 1031 program also allow the Company to compete effectively for acquisitions, and earn competitive returns. Following separation, A&B increased its focus on Hawaii and began executing a strategy of migrating its Mainland commercial assets to Hawaii.
In 2013, the Company completed a number of significant commercial property acquisitions and dispositions in connection with the migration of its Mainland portfolio to Hawaii. The largest acquisition, which closed on December 20, 2013, consisted of retail, industrial and ground leased properties primarily located in Kailua, Oahu for $373 million. For purposes of this Supplement, information about the acquired portfolio is reported in five categories:
| 1 | Sales of commercial properties are reported in Real Estate Development and Sales segment results. |
| · | Other Oahu ground leases |
The acquisition was primarily funded by 1031 proceeds generated by the sale of six Mainland commercial properties, other 1031 proceeds (including proceeds from the sale of Maui Mall, which closed on January 6, 2014), and reverse 1031 proceeds from future commercial property and non-core land sales.
In addition to the December 20 acquisition, in 2013 the Company acquired three retail assets in Hawaii, with over 630,000 square feet (primarily on Oahu), for approximately $191 million. The Company also assumed control of The Shops at Kukui'ula, a 78,900 square-foot retail center on Kauai.
Due to the significant changes to the Company's commercial portfolio from acquisitions and dispositions, historical leasing NOI may not be indicative of future results.
Going forward, over 75% of Leasing segment NOI is expected to come from Hawaii assets, compared to 40% at the beginning of 2013.
See Table 15 for additional information on the Company’s commercial property acquisitions and dispositions in 2013.
Portfolio Segment Description
Hawaii Improved Properties
A&B’s Hawaii improved property portfolio consists of 47 retail, office and industrial properties, comprising approximately 2.6 million square feet of leasable space. The majority of the commercial properties are located on Maui and Oahu, with smaller holdings in the area of Port Allen, Kauai, and the Big Island of Hawaii.
Kailua Ground Leases
The Company leases and licenses portions of its land in Kailua on Oahu to third parties, which are categorized as “Kailua ground leases.” These leases and licenses are developed with a variety of retail and industrial commercial improvements, and cover 28 acres.
Other Oahu Ground Leases
The Company leases and licenses portions of its land in urban Oahu, which is categorized as “Other Oahu ground leases,” to third parties. These leases and licenses are developed with retail commercial improvements, and cover 23 acres.
Neighbor Island Ground Leases
The Company leases and licenses portions of its legacy lands on Maui and Kauai to third parties. These leases and licenses cover a wide variety of urban and agricultural lands, ranging from ground leases covering commercial properties, to farming and pasture leases, to licenses of remnant parcels and easement areas, to sand and aggregate quarry leases whose lease or royalty payments are based on extraction rates.
Mainland Improved Properties
On the Mainland, A&B owns a portfolio of 13 retail, office and industrial properties acquired primarily by way of 1031 tax-deferred exchanges. The Company’s Mainland portfolio comprises approximately 2.5 million square feet of leasable space.
Summarized information for the Company’s portfolio as of and for the year ended December 31, 2013 follows.
| | | Hawaii | | | Mainland | | | Total | |
| GLA (in millions) at 12/31/13 | | | | | | | | | | | | |
| Retail | | | 1.8 | | | | 0.2 | | | | 2.0 | |
| Industrial | | | 0.6 | | | | 1.2 | | | | 1.8 | |
| Office | | | 0.2 | | | | 1.1 | | | | 1.3 | |
| Total | | | 2.6 | | | | 2.5 | | | | 5.1 | |
| | | | | | | | | | | | | |
| 2013 Average Occupancy | | | | | | | | | | | | |
| Retail | | | 92 | % | | | 88 | % | | | 91 | % |
| Industrial | | | 97 | % | | | 99 | % | | | 98 | % |
| Office | | | 82 | % | | | 88 | % | | | 88 | % |
| Total | | | 93 | % | | | 95 | % | | | 95 | % |
| | | | | | | | | | | | | |
| 2013 Cash NOI (in millions)1 | | $ | 34.72 | | | $ | 34.1 | | | $ | 68.8 | |
| 1 | See Table 14 for a statement regarding the Company’s use of NOI and a reconciliation of Leasing operating profit to NOI for the total portfolio. |
| 2 | Includes $3.8 million of NOI from Hawaii ground leases |
| Real Estate Leasing Segment – Asset Descriptions and Statistics |
|
Tables 7 and 8 provide detail on the Company’s commercial real estate portfolio.
Table 7
Property Detail - Hawaii Properties
For the Year Ended 12/31/13, Except as Indicated
| Property | | Number of
properties | | | | Island | | | Gross
leasable
area at
12/31/13
(sq. ft.) | | | Leased1
2013
(percent) | | | Outstanding
debt
at 12/31/13
($ in 000s) | | | 2013 net
operating
income (NOI)2
($ in 000s) | | | % NOI to total
Hawaii
portfolio | |
| Retail: | | | | | | | | | | | | | | | | | | | | | | | | | | | | |
| Gateway at Mililani Mauka | | | 1 | | | | Oahu | | | | 18,900 | | | | 97 | | | $ | - | | | $ | 387 | | | | 1.1 | |
| Kahului Shopping Center | | | 1 | | | | Maui | | | | 48,700 | | | | 91 | | | | - | | | | 377 | | | | 1.1 | |
| Kailua Grocery Anchored3 | | | 4 | | | | Oahu | | | | 189,200 | | | | 98 | | | | 13,031 | | | | 189 | | | | 0.5 | |
| Kailua Retail Other3 | | | 11 | | | | Oahu | | | | 128,200 | | | | 95 | | | | - | | | | 120 | | | | 0.3 | |
| Kaneohe Bay Shopping Center | | | 1 | | | | Oahu | | | | 124,300 | | | | 99 | | | | - | | | | 1,931 | | | | 5.6 | |
| Kunia Shopping Center | | | 1 | | | | Oahu | | | | 60,400 | | | | 95 | | | | - | | | | 2,135 | | | | 6.1 | |
| Lahaina Square | | | 1 | | | | Maui | | | | 50,200 | | | | 68 | | | | - | | | | 509 | | | | 1.5 | |
| Lanihau Marketplace | | | 1 | | | | Hawaii | | | | 88,300 | | | | 89 | | | | - | | | | 1,583 | | | | 4.6 | |
| Maui Mall4 | | | 1 | | | | Maui | | | | 185,700 | | | | 94 | | | | - | | | | 2,892 | | | | 8.3 | |
| Napili Plaza | | | 1 | | | | Maui | | | | 45,100 | | | | 91 | | | | - | | | | 591 | | | | 1.7 | |
| Pearl Highlands Center | | | 1 | | | | Oahu | | | | 415,400 | | | | 98 | | | | 61,780 | | | | 2,788 | | | | 8.0 | |
| Port Allen Marina Center | | | 1 | | | | Kauai | | | | 23,600 | | | | 74 | | | | - | | | | 375 | | | | 1.1 | |
| The Shops at Kukui'ula | | | 1 | | | | Kauai | | | | 78,900 | | | | 80 | | | | 43,953 | | | | 494 | | | | 1.4 | |
| Waianae Mall | | | 1 | | | | Oahu | | | | 170,300 | | | | 90 | | | | 19,931 | | | | 2,730 | | | | 7.9 | |
| Waipio Shopping Center | | | 1 | | | | Oahu | | | | 113,800 | | | | 97 | | | | - | | | | 3,082 | | | | 8.9 | |
| Subtotal – Retail | | | 28 | | | | | | | | 1,741,000 | | | | 92 | | | $ | 138,695 | | | $ | 20,183 | | | | 58.1 | |
| | | | | | | | | | | | | | | | | | | | | | | | | | | | | |
| Industrial: | | | | | | | | | | | | | | | | | | | | | | | | | | | | |
| Kailua Industrial/Other3 | | | 6 | | | | Oahu | | | | 68,800 | | | | 100 | | | $ | - | | | $ | 27 | | | | 0.1 | |
| Komohana Industrial Park5 | | | 1 | | | | Oahu | | | | 238,300 | | | | 100 | | | | - | | | | 3,797 | | | | 10.9 | |
| P&L Building | | | 1 | | | | Maui | | | | 104,100 | | | | 89 | | | | - | | | | 1,001 | | | | 2.9 | |
| Port Allen | | | 3 | | | | Kauai | | | | 63,800 | | | | 99 | | | | - | | | | 615 | | | | 1.8 | |
| Waipio Industrial | | | 1 | | | | Oahu | | | | 158,400 | | | | 96 | | | | - | | | | 2,041 | | | | 5.9 | |
| Subtotal – Industrial | | | 12 | | | | | | | | 633,400 | | | | 97 | | | $ | - | | | $ | 7,481 | | | | 21.6 | |
| | | | | | | | | | | | | | | | | | | | | | | | | | | | | |
| Office: | | | | | | | | | | | | | | | | | | | | | | | | | | | | |
| Gateway at Mililani Mauka South | | | 1 | | | | Oahu | | | | 18,700 | | | | 100 | | | $ | - | | | $ | 682 | | | | 2.0 | |
| Judd Building | | | 1 | | | | Oahu | | | | 20,200 | | | | 71 | | | | - | | | | 138 | | | | 0.4 | |
| Kahului Office Building | | | 1 | | | | Maui | | | | 58,400 | | | | 81 | | | | - | | | | 1,087 | | | | 3.1 | |
| Kahului Office Center | | | 1 | | | | Maui | | | | 32,900 | | | | 74 | | | | - | | | | 452 | | | | 1.3 | |
| Lono Center | | | 1 | | | | Maui | | | | 13,400 | | | | 85 | | | | - | | | | 227 | | | | 0.7 | |
| Maui Clinic Building | | | 1 | | | | Maui | | | | 16,600 | | | | 89 | | | | - | | | | 321 | | | | 0.9 | |
| Stangenwald Building | | | 1 | | | | Oahu | | | | 27,100 | | | | 84 | | | | - | | | | 280 | | | | 0.8 | |
| Subtotal – Office | | | 7 | | | | | | | | 187,300 | | | | 82 | | | $ | - | | | $ | 3,187 | | | | 9.2 | |
Table 7 continued on the next page
Table 7(cont.)
Property Detail - Hawaii Properties
For the Year Ended 12/31/13, , Except as Indicated
| Property | | Number of
properties | | | | Island | | | Gross
leasable
area at
12/31/13
(sq. ft.) | | | Leased1
2013
(percent) | | | Outstanding
debt
at 12/31/13
($ in 000s) | | | 2013 net
operating
income (NOI)2
($ in 000s) | | | % NOI to total
Hawaii
portfolio | |
| Ground Leases | | | | | | | | | | | | | | | | | | | | | | | | | | | | |
| Kailua3 | | | 28 acres | | | | | | | | - | | | | | | | $ | - | | | $ | 136 | | | | 0.4 | |
| Other Oahu3 | | | 23 acres | | | | | | | | - | | | | | | | | - | | | | 161 | | | | 0.4 | |
| Neighbor Island | | | 3,203 acres | | | | | | | | - | | | | | | | | - | | | | 3,567 | | | | 10.3 | |
| Subtotal – Ground Leases | | | 3,254 acres | | | | | | | | - | | | | | | | $ | - | | | $ | 3,864 | | | | 11.1 | |
| Total Hawaii | | | 47 | | | | | | | | 2,561,700 | | | | 93 | | | $ | 138,695 | | | $ | 34,715 | | | | 100.0 | |
| 1 | Represents the average percentage of space leased during the period referenced or A&B’s ownership period, whichever is shorter. Space is considered leased when a tenancy agreement has been fully executed or the space is revenue producing. |
| 2 | See Table 14 for a statement regarding the Company’s use of NOI and a reconciliation of Leasing operating profit to NOI for the total portfolio. |
| 3 | Portfolio was purchased from the Kaneohe Ranch/Harold K.L. Castle Foundation on December 20, 2013. NOI and % NOI to total portfolio include results from the acquisition date through year-end. |
| 4 | On January 6, 2014, the Company closed the sale of Maui Mall. |
| 5 | Includes ground leased income. |
| Note: | For portfolio asset class and geographic occupancy see Table 9. Gross leasable area is periodically adjusted based on remeasurement or reconfiguration of space. |
Table 8
Property Detail - Mainland Improved Properties
For the Year Ended 12/31/13, Except as Indicated
| Property | | Number of
properties | | | Location | | Gross
leasable
area at
12/31/13
(sq. ft.) | | | Leased1
2013
(percent) | | | Outstanding
debt at
12/31/13
($ in 000s) | | | 2013 net
operating
income (NOI)2
($ in 000s) | | | % NOI to total
Mainland
portfolio | |
| Retail: | | | | | | | | | | | | | | | | | | | | | | | | | | |
| Little Cottonwood Center | | | 1 | | | Sandy, UT | | | 141,500 | | | | 94 | | | $ | 6,058 | | | $ | 1,379 | | | | 9.2 | |
| Royal MacArthur Center | | | 1 | | | Dallas, TX | | | 44,400 | | | | 100 | | | | - | | | | 996 | | | | 6.7 | |
| Wilshire Shopping Center | | | 1 | | | Greeley, CO | | | 46,500 | | | | 57 | | | | - | | | | 194 | | | | 1.3 | |
| Subtotal – Retail | | | 3 | | | | | | 232,400 | | | | 88 | | | $ | 6,058 | | | $ | 2,569 | | | | 17.2 | |
| | | | | | | | | | | | | | | | | | | | | | | | | | | |
| Industrial: | | | | | | | | | | | | | | | | | | | | | | | | | | |
| Midstate Hayes | | | 1 | | | Visalia, CA | | | 789,100 | | | | 95 | | | $ | 11,472 | | | $ | 2,559 | | | | 17.1 | |
| Sparks Business Center | | | 1 | | | Sparks, NV | | | 396,100 | | | | 98 | | | | - | | | | 1,695 | | | | 11.3 | |
| Subtotal – Industrial | | | 2 | | | | | | 1,185,200 | | | | 99 | | | $ | 11,472 | | | $ | 4,254 | | | | 28.4 | |
| | | | | | | | | | | | | | | | | | | | | | | | | | | |
| Office: | | | | | | | | | | | | | | | | | | | | | | | | | | |
| Concorde Commerce Center | | | 1 | | | Phoenix, AZ | | | 137,200 | | | | 100 | | | $ | - | | | $ | 133 | | | | 0.9 | |
| Deer Valley Financial Center | | | 1 | | | Phoenix, AZ | | | 126,600 | | | | 75 | | | | - | | | | 475 | | | | 3.2 | |
| Gateway Oaks | | | 1 | | | Sacramento, CA | | | 58,700 | | | | 54 | | | | - | | | | 134 | | | | 0.9 | |
| Ninigret Office Park | | | 1 | | | Salt Lake City, UT | | | 185,500 | | | | 100 | | | | - | | | | 1,834 | | | | 12.2 | |
| 1800 and 1820 Preston Park | | | 1 | | | Plano, TX | | | 198,800 | | | | 93 | | | | - | | | | 1,945 | | | | 13.0 | |
| 2868 Prospect Park | | | 1 | | | Sacramento, CA | | | 162,900 | | | | 86 | | | | - | | | | 1,299 | | | | 8.7 | |
| San Pedro Plaza | | | 1 | | | San Antonio, TX | | | 172,000 | | | | 73 | | | | - | | | | 969 | | | | 6.5 | |
| Union Bank | | | 1 | | | Everett, WA | | | 84,000 | | | | 100 | | | | - | | | | 1,350 | | | | 9.0 | |
| Subtotal – Office | | | 8 | | | | | | 1,125,700 | | | | 88 | | | $ | - | | | $ | 8,139 | | | | 54.4 | |
| | | | | | | | | | | | | | | | | | | | | | | | | | | |
| Total Mainland | | | 13 | | | | | | 2,543,300 | | | | 95 | | | $ | 17,530 | | | $ | 14,962 | | | | 100.0 | |
| 1 | Represents the average percentage of space leased during the period referenced or A&B’s ownership period, whichever is shorter. Space is considered leased when a tenancy agreement has been fully executed or the space is revenue producing. |
| 2 | See Table 14 for a statement regarding the Company’s use of NOI and a reconciliation of Leasing operating profit to NOI for the total portfolio. |
| Note: | For portfolio asset class and geographic occupancy see Table 9. Gross leasable area is periodically adjusted based on remeasurement or reconfiguration of space. |
Table 9
Comparable % Occupancy Data by Geographic Region and Asset Class
| | | 2013 | | 2012 | | Percentage point change |
| Location | | Retail | | Industrial | | Office | | Total | | Retail | | Industrial | | Office | | Total | | Retail | | Industrial | | Office | | Total |
| Hawaii improved | | 92 | | 97 | | 82 | | 93 | | 92 | | 93 | | 88 | | 92 | | - | | 4 | | (6) | | 1 |
| Mainland improved | | 88 | | 99 | | 88 | | 95 | | 86 | | 97 | | 85 | | 93 | | 2 | | 2 | | 3 | | 2 |
| Total | | 91 | | 98 | | 88 | | 95 | | 89 | | 96 | | 86 | | 93 | | 2 | | 2 | | 2 | | 2 |
Table 10
Weighted Average Gross Leasable Area by Geographic Region and Asset Class
| | | 2013 (in sq. ft.) | | 2012 (in sq. ft.) | | Percentage Change |
| Location | | Retail | | Industrial | | Office | | Total | | Retail | | Industrial | | Office | | Total | | Retail | | Industrial | | Office | | Total |
| Hawaii improved | | 1,088,300 | | 570,300 | | 187,300 | | 1,845,900 | | 698,200 | | 564,600 | | 180,400 | | 1,443,200 | | 55.9 | | 1.0 | | 3.8 | | 27.9 |
| Mainland improved | | 677,700 | | 3,969,600 | | 1,225,000 | | 5,872,300 | | 718,200 | | 4,465,600 | | 1,277,500 | | 6,461,300 | | (5.6) | | (11.1) | | (4.1) | | (9.1) |
| Total | | 1,766,000 | | 4,539,900 | | 1,412,300 | | 7,718,200 | | 1,416,400 | | 5,030,200 | | 1,457,900 | | 7,904,500 | | 24.7 | | (9.7) | | (3.1) | | (2.4) |
Table 11
Occupancy Analysis Trend – Last Five Quarters
| | | 4Q2013 | | 3Q2013 | | 2Q2013 | | 1Q2013 | | 4Q2012 |
| | | Number of
properties | | Weighted
average
sq. ft. | | Percentage
leased | | Number of
properties | | Weighted
average
sq. ft. | | Percentage
leased | | Number of
properties | | Weighted
average
sq. ft. | | Percentage
leased | | Number of
properties | | Weighted
average
sq. ft. | | Percentage
leased | | Number of
properties | | Weighted
average
sq. ft. | | Percentage
leased |
| Retail | | 31 | | 2,081,900 | | 92 | | 18 | | 1,773,600 | | 91 | | 17 | | 1,620,000 | | 90 | | 16 | | 1,588,600 | | 90 | | 15 | | 1,416,500 | | 89 |
| Industrial | | 14 | | 3,509,100 | | 99 | | 12 | | 4,829,200 | | 99 | | 13 | | 4,910,600 | | 98 | | 13 | | 4,910,700 | | 98 | | 14 | | 5,030,300 | | 97 |
| Office | | 15 | | 1,314,500 | | 86 | | 15 | | 1,412,400 | | 87 | | 16 | | 1,461,500 | | 88 | | 16 | | 1,461,200 | | 89 | | 16 | | 1,460,200 | | 89 |
| Total | | 60 | | 6,905,500 | | 95 | | 45 | | 8,015,200 | | 95 | | 46 | | 7,992,100 | | 94 | | 45 | | 7,960,500 | | 94 | | 45 | | 7,907,000 | | 94 |
Note: Gross leasable area is periodically adjusted based on remeasurement of reconfiguration of space.
Table 12
Real Estate Leasing Net Operating Income (NOI)
(in millions)
| | | 2013 | | | 2012 | | | Percentage Change | |
| Location | | Retail | | | Industrial | | | Office | | | Total | | | Retail | | | Industrial | | | Office | | | Total | | | Retail | | | Industrial | | | Office | | | Total | |
| Hawaii improved | | $ | 20.2 | | | $ | 7.5 | | | $ | 3.2 | | | $ | 30.9 | | | $ | 13.3 | | | $ | 6.6 | | | $ | 3.4 | | | $ | 23.3 | | | | 51.9 | | | | 13.6 | | | | (5.9 | ) | | | 32.6 | |
| Hawaii ground leases | | | - | | | | - | | | | - | | | | 3.8 | | | | - | | | | - | | | | - | | | | 3.5 | | | | - | | | | - | | | | - | | | | 8.6 | |
| Total Hawaii | | $ | 20.2 | | | $ | 7.5 | | | $ | 3.2 | | | $ | 34.7 | | | $ | 13.3 | | | $ | 6.6 | | | $ | 3.4 | | | $ | 26.8 | | | | 51.9 | | | | 13.6 | | | | (5.9 | ) | | | 29.5 | |
| Mainland improved | | | 8.8 | | | | 15.6 | | | | 9.7 | | | | 34.1 | | | | 8.9 | | | | 17.0 | | | | 10.4 | | | | 36.3 | | | | (1.1 | ) | | | (8.2 | ) | | | (6.7 | ) | | | (6.1 | ) |
| Total | | $ | 29.0 | | | $ | 23.1 | | | $ | 12.9 | | | $ | 68.8 | | | $ | 22.2 | | | $ | 23.6 | | | $ | 13.8 | | | $ | 63.1 | | | | 30.6 | | | | (2.1 | ) | | | (6.5 | ) | | | 9.0 | |
Table 13
Real Estate Leasing Same Store NOI1
(in millions)
| | | 2013 | | | 2012 | | | Percentage Change | |
| Location | | Retail | | | Industrial | | | Office | | | Total | | | Retail | | | Industrial | | | Office | | | Total | | | Retail | | | Industrial | | | Office | | | Total | |
| Hawaii improved | | $ | 12.9 | | | $ | 7.4 | | | $ | 2.5 | | | $ | 22.8 | | | $ | 13.0 | | | $ | 6.6 | | | $ | 3.1 | | | $ | 22.7 | | | | (0.8 | ) | | | 12.1 | | | | (19.4 | ) | | | 0.4 | |
| Hawaii ground leases | | | - | | | | - | | | | - | | | | 3.6 | | | | - | | | | - | | | | - | | | | 3.4 | | | | - | | | | - | | | | - | | | | 5.9 | |
| Total Hawaii | | $ | 12.9 | | | $ | 7.4 | | | $ | 2.5 | | | $ | 26.4 | | | $ | 13.0 | | | $ | 6.6 | | | $ | 3.1 | | | $ | 26.1 | | | | (0.8 | ) | | | 12.1 | | | | (19.4 | ) | | | 1.1 | |
| Mainland improved | | | 2.6 | | | | 4.3 | | | | 8.1 | | | | 15.0 | | | | 2.3 | | | | 4.3 | | | | 8.2 | | | $ | 14.8 | | | | 13.0 | | | | - | | | | (1.2 | ) | | | 1.4 | |
| Total | | $ | 15.5 | | | $ | 11.7 | | | $ | 10.6 | | | $ | 41.4 | | | $ | 15.3 | | | $ | 10.9 | | | $ | 11.3 | | | $ | 40.9 | | | | 1.3 | | | | 7.3 | | | | (6.2 | ) | | | 1.2 | |
| 1 | Same Store NOI relates to properties that were operated throughout the duration of both periods under comparison. |
Note: See Table 14 for a statement on the Company’s use of NOI and a reconciliation of Leasing operating profit to Real Estate Leasing NOI and Real Estate Leasing Same Store NOI.
| Statement on Management’s Use of Non-GAAP Financial Measures |
|
Net operating income (NOI) is a non-GAAP measure derived from real estate revenues (determined in accordance with GAAP, less straight-line rental adjustments) minus property operating expenses (determined in accordance with GAAP). NOI does not have any standardized meaning prescribed by GAAP, and therefore, may differ from definitions of NOI used by other companies. NOI should not be considered as an alternative to net income (determined in accordance with GAAP) as an indicator of the Company’s financial performance, or as an alternative to cash flow from operating activities as a measure of the Company’s liquidity. NOI is commonly used as a measure of operating performance because it is an indicator of the return on property investment, and provides a method of comparing property performance over time. NOI excludes general and administrative expenses, straight-line rental adjustments, interest income, interest expense, depreciation and amortization expense, and gains on sales of interests in real estate. The Company believes that the Real Estate Leasing segment’s operating profit after discontinued operations is the most directly comparable GAAP measurement to NOI. A required reconciliation of Real Estate Leasing operating profit to Real Estate Leasing segment NOI and same store NOI is as follows:
Table 14
Reconciliation of Real Estate Leasing Operating Profit to NOI and Same Store NOI (Non-GAAP)
(in millions)
| | | 2013 | | | 2012 | | | 2011 | | | 2010 | | | 2009 | |
| Real Estate Leasing segment operating profit before discontinued operations | | $ | 43.4 | | | $ | 41.6 | | | $ | 39.3 | | | $ | 35.3 | | | $ | 43.2 | |
| Less amounts reported in discontinued operations | | | (14.6 | ) | | | (17.1 | ) | | | (16.3 | ) | | | (15.9 | ) | | | (23.3 | ) |
| Real Estate Leasing segment operating profit after subtracting discontinued operations | | $ | 28.8 | | | $ | 24.5 | | | $ | 23.0 | | | $ | 19.4 | | | $ | 19.9 | |
| Adjustments: | | | | | | | | | | | | | | | | | | | | |
| Depreciation and amortization expense | | | 24.8 | | | | 22.2 | | | | 21.7 | | | | 21.1 | | | | 21.2 | |
| FASB 13 straight-line lease adjustments | | | (2.9 | ) | | | (3.6 | ) | | | (3.8 | ) | | | (4.1 | ) | | | (2.0 | ) |
| General and administrative expense | | | 3.5 | | | | 2.9 | | | | 3.6 | | | | 3.4 | | | | 3.5 | |
| Discontinued operations | | | 14.6 | | | | 17.1 | | | | 16.3 | | | | 15.9 | | | | 23.3 | |
| Real Estate Leasing total NOI | | $ | 68.8 | | | $ | 63.1 | | | $ | 60.8 | | | $ | 55.7 | | | $ | 65.9 | |
| Acquisitions/ disposition and other adjustments | | | (27.4 | ) | | | (22.2 | ) | | | | | | | | | | | | |
| Real Estate Leasing segment same store NOI1 | | $ | 41.4 | | | | 40.9 | | | | | | | | | | | | | |
| 1 | NOI related to properties that were operated throughout the duration of both periods under comparison. |
| Portfolio Acquisitions and Dispositions |
|
Table 15
2013 Property Portfolio Acquisitions/Dispositions
| Property acquired in 2013 | | Acquisition date
(month/year) | | Acquisition price
(in millions) | | | Gross leasable area
(sq. ft.) | | | Leased percentage
at acquisition | |
| Waianae Mall | | 1/13 | | $ | 30 | | | | 170,300 | | | | 93 | 1 |
| Napili Plaza | | 5/13 | | | 19 | | | | 45,100 | | | | 92 | |
| Pearl Highlands Center | | 9/13 | | | 142 | | | | 415,400 | | | | 98 | |
| The Shops at Kukui'ula2 | | 9/13 | | | - | | | | 78,900 | | | | 82 | |
| Kaneohe Ranch/Harold K.L. Castle Foundation Portfolio3 | | 12/13 | | | 373 | | | | 386,200 + 51 acres ground leased to third
parties and improved with 760,000 sq. ft. | | | | 98 | |
| Total | | | | $ | 564 | | | | 1,095,900 | | | | | |
| Property disposed in 2013 | | Disposition date
(month/year) | | Disposition price
(in millions) | | | Gross leasable area
(sq. ft.) | | | Leased percentage
at disposition | |
| Northpoint Industrial | | 1/13 | | $ | 15 | | | | 119,400 | | | | 100 | |
| Centennial Plaza | | 9/13 | | | 15 | | | | 244,000 | | | | 100 | |
| Issaquah Office Center | | 9/13 | | | 22 | | | | 146,900 | | | | 100 | |
| Republic Distribution Center | | 10/13 | | | 20 | | | | 312,500 | | | | 100 | |
| Industrial Portfolio4 | | 12/13 | | | 165 | | | | 2,604,400 | | | | 99 | |
| Retail Portfolio5 | | 12/13 | | | 101 | | | | 485,800 | | | | 88 | |
| Total | | | | $ | 338 | | | | 3,913,000 | | | | | |
2012 Property Portfolio Acquisitions/Dispositions
| Property acquired in 2012 | | Acquisition date
(month/year) | | Acquisition price
(in millions) | | | Gross leasable area
(sq. ft.) | | | Leased percentage
at acquisition | |
| Gateway at Mililani Mauka South | | 6/12 | | $ | 11 | 6 | | | 18,700 | | | | 100 | |
| Property disposed in 2012 | | Disposition date
(month/year) | | Disposition price
(in millions) | | | Gross leasable area
(sq. ft.) | | | Leased percentage
at disposition | |
| Firestone Boulevard Building | | 3/12 | | $ | 4 | | | | 28,100 | | | | 100 | |
| 1 | 79 percent occupied at closing on 1/23/13. Lease signed prior to closing, but effective on 2/1/13, brought occupancy up to 93 percent. |
| 2 | In November 2013, A&B refinanced and assumed control of The Shops at Kukui’ula. The Shops were originally developed in 2009 through a joint venture of as part of the amenities for the Kukui’ula resort. |
| 3 | Portfolio is reported in five categories: Kailua Industrial/Other, Kailua Grocery Anchored, Kailua Retail Other, Kailua ground leases and Other Oahu ground leases. |
| 4 | Industrial Portfolio includes the disposition of Activity Distribution Center, Heritage Business Center and Savannah Logistics Park. |
| 5 | Retail Portfolio includes the disposition of Broadlands Marketplace, Meadows on the Parkway and Rancho Temecula Town Center. |
| 6 | $11.4M acquisition price includes two existing buildings totaling 18,700 square feet and a 1.6-acre development parcel. |
| Lease Renewal Analysis |
|
The weighted average lease terms of our Hawaii and Mainland portfolios are 76 and 98 months, respectively, for a total portfolio lease term of 82 months. The weighted average remaining lease terms for the Hawaii and Mainland portfolios are 40 and 41 months, respectively, for a total portfolio remaining lease term of 40 months. The following Table 16 details portfolio lease expirations by year.
Table 16
Improved Property Lease Expirations
December 31, 2013
Expiration
year | | Number of
leases | | | Sq. ft. of
expiring leases | | | Percentage of
total leased
GLA | | | Annual gross
rent expiring1
($ in millions) | | | Percentage of
total annual
gross rent | | | Percentage
renewed or
re-leased | | | Percentage
change in
annual gross
rent on
renewed leases | |
| 2012 | | | | | | | 577,581 | | | | | | | | | | | | | | | | 60.0 | | | | (3.0 | ) |
| 2013 | | | | | | | 699,317 | | | | | | | | | | | | | | | | 82.0 | | | | 17.0 | |
| | | | | | | | | | | | | | | | | | | | | | | | | | | | | |
| 2014 | | | 130 | | | | 369,088 | | | | 8.4 | | | | 7.0 | | | | 9.6 | | | | | | | | | |
| 2015 | | | 150 | | | | 751,061 | | | | 17.0 | | | | 10.8 | | | | 14.8 | | | | | | | | | |
| 2016 | | | 132 | | | | 828,337 | | | | 18.7 | | | | 10.4 | | | | 14.2 | | | | | | | | | |
| 2017 | | | 82 | | | | 610,490 | | | | 13.8 | | | | 10.6 | | | | 14.5 | | | | | | | | | |
| 2018 | | | 73 | | | | 571,623 | | | | 12.9 | | | | 7.2 | | | | 9.9 | | | | | | | | | |
| 2019 | | | 41 | | | | 361,383 | | | | 8.2 | | | | 8.5 | | | | 11.6 | | | | | | | | | |
| 2020 | | | 22 | | | | 191,885 | | | | 4.3 | | | | 3.4 | | | | 4.7 | | | | | | | | | |
| 2021 | | | 10 | | | | 219,403 | | | | 5.0 | | | | 4.5 | | | | 6.2 | | | | | | | | | |
| 2022 | | | 13 | | | | 66,682 | | | | 1.5 | | | | 1.7 | | | | 2.3 | | | | | | | | | |
| 2023 | | | 19 | | | | 123,343 | | | | 2.8 | | | | 1.9 | | | | 2.6 | | | | | | | | | |
| 2024 | | | 4 | | | | 107,032 | | | | 2.4 | | | | 2.5 | | | | 3.4 | | | | | | | | | |
| Thereafter | | | 20 | | | | 221,349 | | | | 5.0 | | | | 4.5 | | | | 6.2 | | | | | | | | | |
| | | | 696 | | | | 4,421,676 | | | | 100.0 | | | $ | 73.0 | | | | 100.0 | | | | | | | | | |
1 Annual gross rent means the annualized base rent amounts of expiring leases and includes improved properties only.
Note: Totals do not include month to month leases.
Ground Lease Expirations
December 31, 2013
| Expiration year | | Annual gross
rent expiring
($ in millions) | | | Percentage
of total
annual gross
rent | |
| Month-to-month | | | 0.8 | | | | 5.3 | |
| 2014 | | | 1.9 | | | | 12.7 | |
| 2015 | | | 0.7 | | | | 4.7 | |
| 2016 | | | 0.8 | | | | 5.3 | |
| 2017 | | | 0.1 | | | | 0.7 | |
| 2018 | | | 0.4 | | | | 2.7 | |
| 2019 | | | 0.3 | | | | 2.0 | |
| 2020 | | | 0.8 | | | | 5.3 | |
| 2021 | | | 0.7 | | | | 4.7 | |
| 2022 | | | 0.3 | | | | 2.0 | |
| 2023 | | | 0.5 | | | | 3.3 | |
| 2024 | | | 0.0 | | | | 0.0 | |
| Thereafter Total | | | 7.7 | | | | 51.3 | |
| | | | 15.0 | | | | 100.0 | |
Portfolio Concentrations
Table 17
Tenant Concentrations as of 12/31/13
Largest Tenants (In-Service Properties) Based Upon Annualized Gross Revenue
| Tenant | | Primary industry | | Lease expiration year | | Annualized gross
revenue1 | | | Percentage
of annual
gross
revenue | | | GLA
(sq. ft.) | | | Percentage
of total
GLA | |
| Sam's Club | | Warehouse Club | | 2021 | | $ | 4,319,828 | | | | 4.2 | | | | 180,908 | | | | 3.6 | |
| CVS Corporation | | Drug Store / Pharmacy | | 2019, 2024, 2028 | | | 3,043,818 | | | | 3.0 | | | | 113,630 | | | | 2.2 | |
| United Healthcare Services, Inc | | Healthcare Plans | | 2019 | | | 2,201,844 | | | | 2.2 | | | | 116,186 | | | | 2.3 | |
| Foodland Super Market, Ltd. | | Supermarket & Grocery Store | | 2017, 2018, 2020, 2031 | | | 2,005,591 | | | | 1.9 | | | | 91,929 | | | | 1.8 | |
| 24 Hour Fitness USA, Inc. | | Health Club | | 2024 | | | 1,661,674 | | | | 1.6 | | | | 45,870 | | | | 0.9 | |
| International Paper | | Paper Packaging/Distribution | | 2016, 2018 | | | 1,616,231 | | | | 1.6 | | | | 370,853 | | | | 7.3 | |
| Teleperformance USA | | Call Center/Communications | | 2015 | | | 1,364,496 | | | | 1.3 | | | | 92,036 | | | | 1.8 | |
| Whole Foods Market, Inc. | | Supermarket & Grocery Store | | 2032 | | | 1,355,064 | | | | 1.3 | | | | 31,647 | | | | 0.6 | |
| Union Bank N.A. | | Banking | | 2015, 2017 | | | 1,305,222 | | | | 1.3 | | | | 84,044 | | | | 1.6 | |
| Cisco Systems, Inc. | | Technology | | 2016 | | | 1,258,332 | | | | 1.2 | | | | 49,636 | | | | 1.0 | |
| Total | | | | | | $ | 20,132,100 | | | | 19.6 | | | | 1,176,739 | | | | 23.1 | |
| 1 | Annualized GAAP revenue for the indicated period, excluding FASB straight-line adjustments and percentage rent. |
This page was intentionally left blank.
Hawaii Commercial Property Information Sheets
| Retail | |
| Gateway at Mililani Mauka | 48 |
| Kahului Shopping Center | 48 |
| Kailua Grocery Anchored | 49 |
| Kailua Retail Other | 49 |
| Kaneohe Bay Shopping Center | 50 |
| Kunia Shopping Center | 50 |
| Lahaina Square | 51 |
| Lanihau Marketplace | 51 |
| Maui Mall | 52 |
| Napili Plaza | 52 |
| Pearl Highlands Center | 53 |
| Port Allen Marina Center | 53 |
| The Shops at Kukui’ula | 54 |
| Waianae Mall | 54 |
| Waipio Shopping Center | 55 |
| Industrial | |
| Kailua Industrial Other | 56 |
| Komohana Industrial Park | 56 |
| P&L Building | 57 |
| Port Allen | 57 |
| Waipio Industrial | 58 |
| Office | |
| Gateway at Mililani Mauka South | 59 |
| Judd Building | 59 |
| Kahului Office Building | 60 |
| Kahului Office Center | 60 |
| Lono Center | 61 |
| Maui Clinic Building | 61 |
| Stangenwald Building | 62 |
| Ground Leases | |
| Kailua | 63 |
| Other Oahu | 63 |
Real Estate Leasing – Hawaii Retail
Gateway at Mililani Mauka
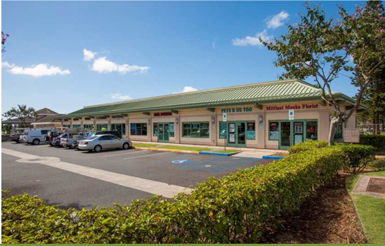 | Type Retail Location Oahu Acquisition Date December 29, 2011 Acquisition Price* $8.2 million Dates Constructed 2008, 2011, 2013 Occupancy at 12/31/13 87% GLA (in sq.ft.) 18,900 | Top Tenants Starbucks
Subway
Domino’s Pizza
Rise + Shine Cafe *Acquisition price included a 1-acre development parcel. See development project information on page 20. |
| ($ in Thousands) | 2013 | 2012 | 20111 |
| Gross Revenue | 611 | 422 | nm |
| Cash NOI | 387 | 273 | nm |
| Capital Improvements | 5,3752 | 5 | nm |
| Average Occupancy (%) | 97 | 100 | nm |
1Acquired at year end
2Includes development costs of an additional building and capital improvements
Kahului Shopping Center
 | Type Retail Location Maui Development Date 1951 Occupancy at 12/31/13 96% GLA (in sq.ft.) 48,700 Top Tenants Ah Fook’s Market Asian Cuisine Ichiban Restaurant | |
| ($ in Thousands) | 2013 | 2012 | 2011 |
| Gross Revenue | 841 | 773 | 679 |
| Cash NOI | 377 | 330 | 231 |
| Capital Improvements | 15 | - | 10 |
| Average Occupancy (%) | 91 | 83 | 80 |
Real Estate Leasing – Hawaii Retail
Kailua Grocery Anchored
 | Type Retail Location Oahu Acquisition Date December 20, 2013 Acquisition Price See Table 15 Date Constructed 1958-2012 Occupancy at 12/31/13 98% GLA (in sq.ft.) 189,200 | Properties 4 Top Tenants California Pizza Kitchen
Foodland Longs Drug Store
Pier 1 Imports
Times Supermarket
Whole Foods |
| ($ in Thousands) | 2013* | 2012 | 2011 |
| Gross Revenue | 244 | n/a | n/a |
| Cash NOI | 189 | n/a | n/a |
| Capital Improvements | - | n/a | n/a |
| Average Occupancy (%) | 98 | n/a | n/a |
* Acquired December 20, 2013
Kailua Retail Other
 | Type Retail Location Oahu Acquisition Date December 20, 2013 Acquisition Price See Table 15 Date Constructed 1947-2014 Occupancy at 12/31/13 95% GLA (in sq.ft.) 128,200 | Properties 11 Top Tenants Boots and Kimos Buona Sera Italian Restaurant Fatboy's Island Snow Jamba Juice Kailua Sailboards & Kayaks Kalapawai Cafe & Deli Peet's Coffee Starbucks |
| ($ in Thousands) | 2013* | 2012 | 2011 |
| Gross Revenue | 159 | n/a | n/a |
| Cash NOI | 120 | n/a | n/a |
| Capital Improvements | - | n/a | n/a |
| Average Occupancy (%) | 95 | n/a | n/a |
* Acquired December 20, 2013
Real Estate Leasing – Hawaii Retail
Kaneohe Bay Shopping Center
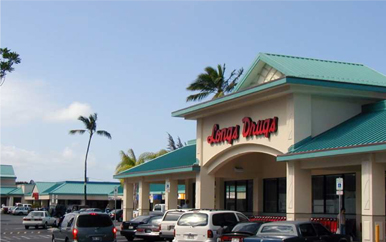 | Type Retail Location Oahu Acquisition Date June 8, 2001 Acquisition Price $13.3 million (leasehold) Date Constructed 1971, renovated 2008 Occupancy at 12/31/13 100% GLA (in sq.ft.) 124,300 | Top Tenants Brick Oven Pizza
Central Pacific Bank First Hawaiian Bank Ichiriki Restaurant
Kinkos Longs Drug Store/CVS Safeway Subway Vitamin Shoppe |
| ($ in Thousands) | 2013 | 2012 | 2011 |
| Gross Revenue | 4,602 | 4,427 | 4,465 |
| Cash NOI | 1,931 | 1,791 | 1,853 |
| Capital Improvements | 122 | 126 | 88 |
| Average Occupancy (%) | 99 | 98 | 97 |
Kunia Shopping Center
 | Type Retail Location Oahu Development Date1 2004 Occupancy at 12/31/13 95% GLA (in sq.ft.) 60,400 1A&B was the original developer of the shopping center. | Top Tenants Bank of Hawaii Cole Academy Denny’s Jack In The Box Jamba Juice Starbucks |
| ($ in Thousands) | 2013 | 2012 | 2011 |
| Gross Revenue | 3,148 | 2,931 | 2,849 |
| Cash NOI | 2,135 | 1,915 | 1,842 |
| Capital Improvements | - | 336 | 36 |
| Average Occupancy (%) | 95 | 95 | 90 |
Real Estate Leasing – Hawaii Retail
Lahaina Square
 | Type Retail Location Maui Acquisition Date November 5, 2010 Acquisition Price $4.9 million Date Constructed 1973 Occupancy at 12/31/13 68% GLA (in sq.ft.) 50,200 | Top Tenants Ace Hardware
Maui Tacos |
| ($ in Thousands) | 2013 | 2012 | 2011 |
| Gross Revenue | 919 | 833 | 900 |
| Cash NOI | 509 | 445 | 446 |
| Capital Improvements | 34 | 30 | 159 |
| Average Occupancy (%) | 68 | 63 | 67 |
Lanihau Marketplace
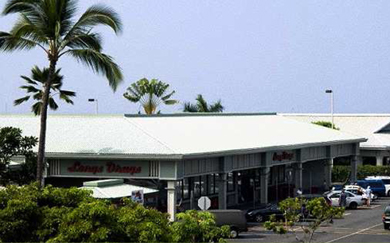 | Type Retail Location Hawaii Acquisition Date April 9, 2010 Acquisition Price $22.5 million Date Constructed 1987 Occupancy at 12/31/13 88% GLA (in sq.ft.) 88,300 | Top Tenants Baskin Robbins Kentucky Fried Chicken Longs Drug Store/CVS Sack N Save Supercuts Verizon Wireless |
| ($ in Thousands) | 2013 | 2012 | 2011 |
| Gross Revenue | 2,748 | 3,090 | 3,427 |
| Cash NOI | 1,583 | 1,921 | 2,224 |
| Capital Improvements | 4 | 218 | 26 |
| Average Occupancy (%) | 89 | 94 | 99 |
Real Estate Leasing – Hawaii Retail
Maui Mall*
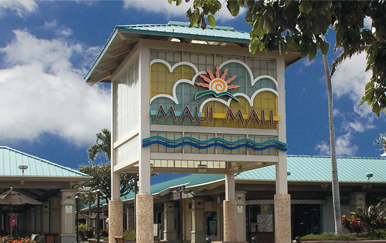 | Type Retail Location Maui Development Date 1971, renovated 2010 Occupancy at 12/31/13 97% GLA (in sq.ft.) 185,700 Top Tenants Checker’s Automotive IHOP Longs Drug Store/CVS Wallace Theatres Whole Foods | |
| ($ in Thousands) | 2013 | 2012 | 2011 |
| Gross Revenue | 4,799 | 4,973 | 4,538 |
| Cash NOI | 2,892 | 3,174 | 2,736 |
| Capital Improvements | 43 | 442 | 660 |
| Average Occupancy (%) | 94 | 94 | 94 |
* Sold January 6, 2014
Napili Plaza
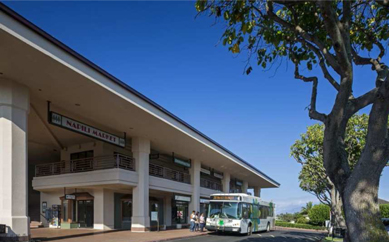 | Type Retail Location Maui Acquisition Date May 22, 2013 Acquisition Price $19.2 million Date Constructed 1991 Occupancy at 12/31/13 89% GLA (in sq.ft.) 45,100 | Top Tenants Napili Market
Napili Pharmacy |
| ($ in Thousands) | 2013* | 2012 | 2011 |
| Gross Revenue | 983 | n/a | n/a |
| Cash NOI | 591 | n/a | n/a |
| Capital Improvements | 17 | n/a | n/a |
| Average Occupancy (%) | 91 | n/a | n/a |
* Acquired May 22, 2013
Real Estate Leasing – Hawaii Retail
Pearl Highlands Center
 | Type Retail Location Oahu Acquisition Date September 17, 2013 Acquisition Price $141.5 million Date Constructed 1992-1994 Occupancy at 12/31/13 98% GLA (in sq.ft.) 415,400 | Top Tenants 24 Hour Fitness
Buffalo Wild Wings Pier 1 Regal Cinemas Ross Dress for Less Sam's Club |
| ($ in Thousands) | 2013* | 2012 | 2011 |
| Gross Revenue | 5,400 | n/a | n/a |
| Cash NOI | 2,788 | n/a | n/a |
| Capital Improvements | 26 | n/a | n/a |
| Average Occupancy (%) | 98 | n/a | n/a |
* Acquired September 17, 2013
Port Allen Marina Center
 | Type Retail Location Kauai Development Date 2002 Occupancy at 12/31/13 72% GLA (in sq.ft.) 23,600 Top Tenants Blue Dolphin Charters Captain Andy’s Holo Holo Charters Kauai Chocolate Company Port Allen Bar & Grill | |
| ($ in Thousands) | 2013 | 2012 | 2011 |
| Gross Revenue | 597 | 630 | 623 |
| Cash NOI | 375 | 421 | 421 |
| Capital Improvements | 61 | 22 | 13 |
| Average Occupancy (%) | 74 | 77 | 77 |
Real Estate Leasing – Hawaii Retail
The Shops At Kukui’ula
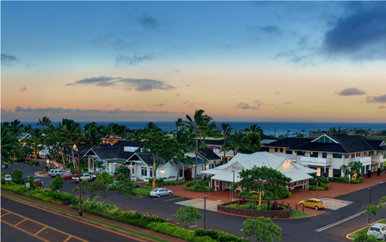 | Type Retail Location Kauai Development Date 2009 Occupancy at 12/31/13 80% GLA (in sq.ft.) 78,900 Top Tenants Josselin’s Tapas Bar & Grill Merriman’s Fish House Sunglass Hut
Tommy Bahama Tortilla Republic Grill | |
| ($ in Thousands) | 2013* | 2012 | 2011 |
| Gross Revenue | 1,269 | n/a | n/a |
| Cash NOI | 494 | n/a | n/a |
| Capital Improvements | - | n/a | n/a |
| Average Occupancy (%) | 80 | n/a | n/a |
* Acquired September 30, 2013
Waianae Mall
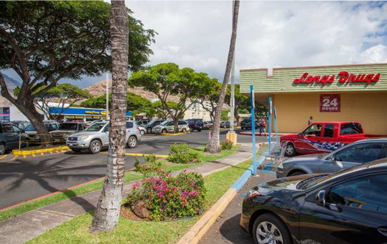 | Type Retail Location Oahu Acquisition Date January 22, 2013 Acquisition Price $29.8 million Date Constructed 1975 Occupancy at 12/31/13 89% GLA (in sq.ft.) 170,300 | Top Tenants Bank of Hawaii
Burger King
Goodyear
Jamba Juice
Longs/CVS
Starbucks |
| ($ in Thousands) | 2013* | 2012 | 2011 |
| Gross Revenue | 4,271 | n/a | n/a |
| Cash NOI | 2,730 | n/a | n/a |
| Capital Improvements | 750 | n/a | n/a |
| Average Occupancy (%) | 90 | n/a | n/a |
* Acquired January 22, 2013
Real Estate Leasing – Hawaii Retail
Waipio Shopping Center
 | Type Retail Location Oahu Acquisition Date September 4, 2009 Acquisition Price $30.9 million Date Constructed 1986-2004 Occupancy at 12/31/13 97% GLA (in sq.ft.) 113,800 | Top Tenants Aloha Gas Big City Diner Foodland Jack-In-The-Box Outback Steakhouse |
| ($ in Thousands) | 2013 | 2012 | 2011 |
| Gross Revenue | 4,393 | 4,256 | 4,174 |
| Cash NOI | 3,082 | 2,989 | 2,863 |
| Capital Improvements | - | 39 | 67 |
| Average Occupancy (%) | 97 | 98 | 98 |
Real Estate Leasing – Hawaii Industrial
Kailua Industrial Other
 | Type Industrial Location Oahu Acquisition Date December 20, 2013 Acquisition Price See Table 15 Date Constructed 1951-1974 Occupancy at 12/31/13 100% GLA (in sq.ft.) 68,800 | Properties 6 Top Tenants Enterprise Rent-A-Car Hamakua Auto Body Kailua General Store Kama’aina Kids
Pacific Island Medical |
| ($ in Thousands) | 2013* | 2012 | 2011 |
| Gross Revenue | 37 | - | - |
| Cash NOI | 27 | - | - |
| Capital Improvements | - | - | - |
| Average Occupancy (%) | 100 | - | - |
* Acquired December 20, 2013
Komohana Industrial Park
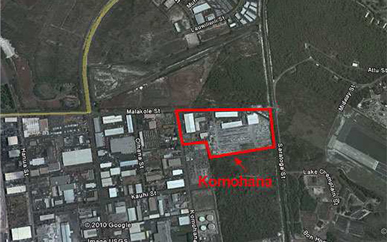 | Type Industrial Location Oahu Acquisition Date July 20, 2010 Acquisition Price $37.7 million Date Constructed 1990 Occupancy at 12/31/13 100% | GLA (in sq.ft.) 238,300 Plus 23.0 acres leased
to third-parties Top Tenants Dellew Corporation GP/RM Prestress LLC Simmons Manufacturing S&K Sales Co. |
| ($ in Thousands) | 2013 | 2012 | 2011 |
| Gross Revenue | 4,683 | 3,997 | 3,726 |
| Cash NOI | 3,797 | 3,165 | 2,883 |
| Capital Improvements | - | 135 | 167 |
| Average Occupancy (%) | 100 | 91 | 77 |
Real Estate Leasing – Hawaii Industrial
P&L Building
 | Type Industrial Location Maui Development Date 1970 Occupancy at 12/31/13 92% GLA (in sq.ft.) 104,100 Top Tenants A-American Self Storage Alltemp Air Conditioning Company Honsador Lumber Corporation Mary Charles & Associates
Maui Laminates | |
| ($ in Thousands) | 2013 | 2012 | 2011 |
| Gross Revenue | 1,274 | 1,222 | 1,292 |
| Cash NOI | 1,001 | 974 | 1,032 |
| Capital Improvements | 9 | 11 | 23 |
| Average Occupancy (%) | 89 | 87 | 96 |
Port Allen
 | Type Industrial Location Kauai Development Date 1983 - 1993 Occupancy at 12/31/13
97% GLA (in sq.ft.) 63,800 Top Tenants Aloha Professional Auto Body Kauai Island Brewing Company KIUC
Lappert’s Inc. Paradise Sports Wear | |
| ($ in Thousands) | 2013 | 2012 | 2011 |
| Gross Revenue | 832 | 799 | 684 |
| Cash NOI | 615 | 618 | 508 |
| Capital Improvements | 10 | 46 | 57 |
| Average Occupancy (%) | 99 | 96 | 94 |
Real Estate Leasing – Hawaii Industrial
Waipio Industrial
 | Type Industrial Location Oahu Acquisition Date March 4, 2009 Acquisition Price $28.3 million Date Constructed 1988-1989 Occupancy at 12/31/13 97% GLA (in sq.ft.) 158,400 | Top Tenants Arcadia City & County of
Honolulu (EMS) OfficeMax USC International |
| ($ in Thousands) | 2013 | 2012 | 2011 |
| Gross Revenue | 2,732 | 2,532 | 2,849 |
| Cash NOI | 2,041 | 1,860 | 2,154 |
| Capital Improvements | 27 | 73 | 33 |
| Average Occupancy (%) | 96 | 98 | 98 |
Real Estate Leasing – Hawaii Office
Gateway at Mililani Mauka South
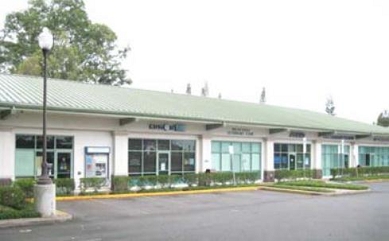 | Type Office Location Oahu Acquisition Date June 7, 2012 Acquisition Price1 $11.4 million Dates Constructed 1992, 2006, 2008 Occupancy at 12/31/13 100% GLA (in sq.ft.) 18,700 – current
18,000 – projected | Top Tenants Allstate
Hawaii State Federal Union
Kumon Mililani Veterinary
Title Guaranty
Wayland Baptist University 1Acquisition price includes a 1.2-acre development
parcel. See development project information on page 20. |
| ($ in Thousands) | 2013 | 2012 | 2011 |
| Gross Revenue | 930 | 511 | n/a |
| Cash NOI | 682 | 377 | n/a |
| Capital Improvements | 35* | - | n/a |
| Average Occupancy (%) | 100 | 100 | n/a |
* Includes development cost of an additional building and capital improvements
JUDD BUILDING
 | Type Office Location Oahu Acquisition Date June 26, 2000 Acquisition Price $3.1 million Date Constructed 1898, renovated 1979 Occupancy at 12/31/13 64% GLA (in sq.ft.) 20,200 | Top Tenants Coffman Engineers Davis, Levin, Livingston, Grande Attorneys RIM Architects |
| ($ in Thousands) | 2013 | 2012 | 2011 |
| Gross Revenue | 443 | 540 | 691 |
| Cash NOI | 138 | 221 | 372 |
| Capital Improvements | 199 | 6 | - |
| Average Occupancy (%) | 71 | 100 | 100 |
Real Estate Leasing – Hawaii Office
Kahului Office Building
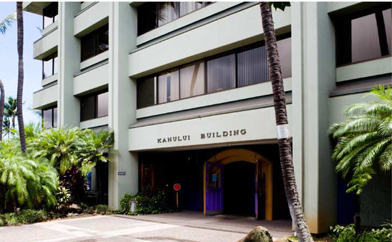 | Type Office Location Maui Development Date 1974, renovated 1996 Occupancy at 12/31/13 83% GLA (in sq.ft.) 58,400 | Top Tenants Bistro Casanova Central Pacific Bank Hawaii Medical Service Association Morgan Stanley Smith Barney Stifel Nicolas |
| ($ in Thousands) | 2013 | 2012 | 2011 |
| Gross Revenue | 2,160 | 2,408 | 2,163 |
| Cash NOI | 1,087 | 1,357 | 1,115 |
| Capital Improvements | 870 | 27 | 502 |
| Average Occupancy (%) | 81 | 87 | 92 |
Kahului Office Center
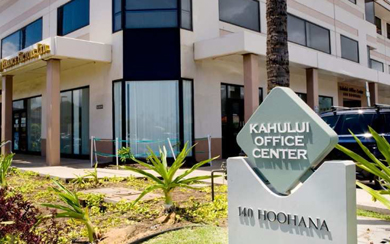 | Type Office Location Maui Development Date 1991 Occupancy at 12/31/13 85% GLA (in sq.ft.) 32,900 Top Tenants Finance Factors Hawaiiana Management
Tutti Frutti Yogurt | |
| ($ in Thousands) | 2013 | 2012 | 2011 |
| Gross Revenue | 816 | 1,071 | 1,007 |
| Cash NOI | 452 | 707 | 648 |
| Capital Improvements | 302 | 32 | 79 |
| Average Occupancy (%) | 74 | 84 | 85 |
Real Estate Leasing – Hawaii Office
Lono Center
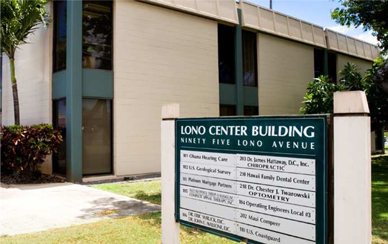 | Type Office Location Maui Acquisition Date January 9, 1991 Acquisition Price $1.4 million Date Constructed 1973 Occupancy at 12/31/13 86% GLA (in sq.ft.) 13,400 | Top tenants Dr. James Hattaway D.C.
Hawaii Dental Group
U.S. Coast Guard |
| ($ in Thousands) | 2013 | 2012 | 2011 |
| Gross Revenue | 529 | 506 | 438 |
| Cash NOI | 227 | 207 | 164 |
| Capital Improvements | 16 | - | 7 |
| Average Occupancy (%) | 85 | 84 | 84 |
Maui Clinic Building
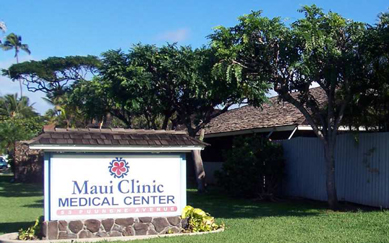 | Type Office Location Maui Acquisition Date December 1, 2008 Date Constructed 1958, renovated 2010 Occupancy at 12/31/13 64% GLA (in sq.ft.) 16,600 | Top Tenants Maui Clinic Pharmacy Maui Diagnostic Imaging Physical Therapy and Wellness Center |
| ($ in Thousands) | 2013 | 2012 | 2011 |
| Gross Revenue | 656 | 663 | 690 |
| Cash NOI | 321 | 351 | 370 |
| Capital Improvements | 25 | 17 | 36 |
| Average Occupancy (%) | 89 | 93 | 98 |
Real Estate Leasing – Hawaii Office
Stangenwald Building
 | Type Office Location Oahu Acquisition Date December 10, 1996 Acquisition Price $2.8 million Date Constructed 1901, renovated 1980 Occupancy at 12/31/13 90% GLA (in sq.ft.) 27,100 | Top Tenants Burke McPheeters and Estes
Law Firm Leather Sole
HonBlue |
| ($ in Thousands) | 2013 | 2012 | 2011 |
| Gross Revenue | 677 | 645 | 762 |
| Cash NOI | 280 | 217 | 351 |
| Capital Improvements | 550 | 251 | - |
| Average Occupancy (%) | 84 | 81 | 94 |
Real Estate Leasing – Hawaii Ground Leases
Kailua Ground Leases
 | Type Ground Lease Location Oahu Acquisition Date December 20, 2013 Acquisition Price See Table 15 Acres (in sq.ft.) 28 | Tenants Genuine Parts Company
Fortus Property Group
Macy’s West Store, Inc.
McKenna Ford
Pali Lanes, LLC |
| ($ in Thousands) | 2013* | 2012 | 2011 |
| Gross Revenue | 147 | n/a | n/a |
| Cash NOI | 136 | n/a | n/a |
| | | | |
| | | | |
* Acquired December 20, 2013
Other Oahu Ground Leases
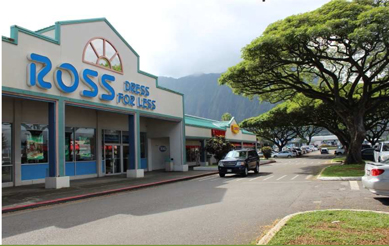 | Type Ground Lease Location Oahu Acquisition Date December 20, 2013 Acquisition Price See Table 15 Acres (in sq.ft.) 23 | Tenants Bradley Shopping
Center Company Servco Pacific Tesoro Hawaii TSM Investments, Inc.
WCSC, LLC |
| ($ in Thousands) | 2013* | 2012 | 2011 |
| Gross Revenue | 181 | n/a | n/a |
| Cash NOI | 161 | n/a | n/a |
| | | | |
| | | | |
* Acquired December 20, 2013
This page was intentionally left blank.
Mainland Commercial Property Information Sheets
| Retail | |
| Little Cottonwood Center | 66 |
| Royal MacArthur Center | 66 |
| Wilshire Shopping Center | 67 |
| Industrial | |
| Midstate Hayes | 68 |
| Sparks Business Center | 68 |
| Office | |
| Concorde Commerce Center | 69 |
| Deer Valley Financial Center | 69 |
| Gateway Oaks | 70 |
| Ninigret Office Park | 70 |
| 1800 and 1820 Preston Park | 71 |
| 2868 Prospect Park | 71 |
| San Pedro Plaza | 72 |
| Union Bank | 72 |
Real Estate Leasing – Mainland Retail
Little Cottonwood Center
 | Type Retail Location Sandy, Utah Acquisition Date October 26, 2010 Acquisition Price $20.8 million Date Constructed 1998-2008 Occupancy at 12/31/13 94% GLA (in sq. ft.) 141,500 | Top Tenants Black Bear Restaurant
Chase Bank
Fresh Market
McDonald’s Starbucks |
| ($ in Thousands) | 2013 | 2012 | 2011 |
| Gross Revenue | 2,075 | 2,112 | 2,106 |
| Cash NOI | 1,379 | 1,436 | 1,405 |
| Capital Improvements | 134 | - | 79 |
| Average Occupancy (%) | 94 | 94 | 95 |
Royal MacArthur Center
 | Type Retail Location Dallas, Texas Acquisition Date March 1, 2007 Acquisition Price $13.5 million Date Constructed 2006 Occupancy at 12/31/13 100% GLA (in sq. ft.) 44,400 | Top Tenants Andalous Mediterranean Grill
Citibank Five Guys Burgers Jamba Juice La Madeleine
Pie Five |
| ($ in Thousands) | 2013 | 2012 | 2011 |
| Gross Revenue | 1,345 | 1,229 | 1,212 |
| Cash NOI | 996 | 706 | 675 |
| Capital Improvements | 229 | 195 | 184 |
| Average Occupancy (%) | 100 | 85 | 81 |
Real Estate Leasing – Mainland Retail
Wilshire Shopping Center
 | Type Retail Location Greeley, Colorado Acquisition Date March 19, 1997 Acquisition Price $2.5 million Date Constructed 1970 Occupancy at 12/31/13 57% GLA (in sq. ft.) 46,500 | Top Tenants Dollar Tree Kentucky Fried Chicken McDonald’s Sherwin-Williams |
| ($ in Thousands) | 2013 | 2012 | 2011 |
| Gross Revenue | 346 | 340 | 367 |
| Cash NOI | 194 | 190 | 223 |
| Capital Improvements | - | - | - |
| Average Occupancy (%) | 57 | 57 | 66 |
Real Estate Leasing – Mainland Retail
Midstate Hayes
 | Type Industrial Location Visalia, California Acquisition Date Buildings 2/4: November 14, 2008 Buildings 1/3: December 11, 2008 Acquisition Price Buildings 2/4: $19.7 million Buildings 1/3: $15.5 million Date Constructed 2002-2008 Occupancy at 12/31/13 100% | GLA (in sq. ft.) 789,100 Top Tenants Coast Distribution International Paper OnTrac Sarnova |
| ($ in Thousands) | 2013 | 2012 | 2011 |
| Gross Revenue | 3,263 | 3,283 | 3,349 |
| Cash NOI | 2,559 | 2,443 | 2,530 |
| Capital Improvements | 17 | 17 | 63 |
| Average Occupancy (%) | 95 | 87 | 92 |
Sparks Business Center
 | Type Industrial Location Sparks, Nevada Acquisition Date December 23, 2002 Acquisition Price $20.1 million Date Constructed 1996-1998 Occupancy at 12/31/13 100% GLA (in sq. ft.) 396,100 | Top Tenants BSI Inspectorate America Corp. St. Mary’s Health Group State of Nevada |
| ($ in Thousands) | 2013 | 2012 | 2011 |
| Gross Revenue | 2,212 | 2,319 | 1,982 |
| Cash NOI | 1,695 | 1,807 | 1,482 |
| Capital Improvements | 174 | 318 | 309 |
| Average Occupancy (%) | 98 | 94 | 80 |
Real Estate Leasing – Mainland Office
Concorde Commerce Center
 | Type Office Location Phoenix, AZ Acquisition Date December 22, 2006 Acquisition Price $24.7 million Date Constructed 1998 Occupancy at 12/31/13 100% GLA (in sq. ft.) 137,200 | Top Tenants Fiserv Solutions Jan-Pro
United Healthcare Group |
| ($ in Thousands) | 2013 | 2012 | 2011 |
| Gross Revenue | 1,422 | 2,013 | 2,730 |
| Cash NOI | 133 | 951 | 1,360 |
| Capital Improvements | 2,694 | 2,194 | 301 |
| Average Occupancy (%) | 100 | 86 | 82 |
Deer Valley Financial Center
 | Type Office Location Phoenix, AZ Acquisition Date June 7, 2005 Acquisition Price $22.3 million Date Constructed 2001 Occupancy at 12/31/13 78% GLA (in sq. ft.) 126,600 | Top Tenants Blackboard Campus Viridian Health Management |
| ($ in Thousands) | 2013 | 2012 | 2011 |
| Gross Revenue | 1,551 | 1,505 | 1,364 |
| Cash NOI | 475 | 469 | 328 |
| Capital Improvements | 146 | 585 | 228 |
| Average Occupancy (%) | 75 | 71 | 68 |
Real Estate Leasing – Mainland Office
Gateway Oaks
 | Type Office Location Sacramento, California Acquisition Date June 14, 2006 Acquisition Price $12.3 million Date Constructed 1999 Occupancy at 12/31/13 53% GLA (in sq. ft.) 58,700 | Top Tenants Fortune Schools
IKON URS |
| ($ in Thousands) | 2013 | 2012 | 2011 |
| Gross Revenue | 567 | 610 | 1,273 |
| Cash NOI | 134 | 162 | 677 |
| Capital Improvements | - | 504 | 9 |
| Average Occupancy (%) | 54 | 50 | 86 |
Ninigret Office Park
 | Type Office Location Salt Lake City, Utah Acquisition Date January 26, 2006 Acquisition Price $21.4 million Date Constructed 1999 & 2002, renovated 2010 Occupancy at 12/31/13 100% GLA (in sq. ft.) 185,500 | Top Tenants FedEx Silicon Valley Bank Sun Products Teleperformance USA |
| ($ in Thousands) | 2013 | 2012 | 2011 |
| Gross Revenue | 3,024 | 3,117 | 2,983 |
| Cash NOI | 1,834 | 1,895 | 1,893 |
| Capital Improvements | 394 | 68 | 671 |
| Average Occupancy (%) | 100 | 100 | 99 |
Real Estate Leasing – Mainland Office
1800 and 1820 Preston Park
 | Type Office Location Plano, Texas Acquisition Date June 30, 2006 Acquisition Price $24.3 million Date Constructed 1997-1998, renovated 2010 Occupancy at 12/31/13 93% GLA (in sq. ft.) 198,800 | Top Tenants American Flood Research Arrow Electronics Batrus Hollweg International CMA Pepsi Cola Company |
| ($ in Thousands) | 2013 | 2012 | 2011 |
| Gross Revenue | 3,508 | 3,423 | 3,107 |
| Cash NOI | 1,945 | 1,821 | 1,401 |
| Capital Improvements | 1,109 | 665 | 499 |
| Average Occupancy (%) | 93 | 89 | 83 |
2868 Prospect Park
 | Type Office Location Sacramento, California Acquisition Date August 25, 1998 Acquisition Price $20.6 million Date Constructed 1998, renovated 2008 Occupancy at 12/31/13 85% GLA (in sq. ft.) 162,900 | Top Tenants Cisco GEI |
| ($ in Thousands) | 2013 | 2012 | 2011 |
| Gross Revenue | 2,452 | 1,813 | 2,258 |
| Cash NOI | 1,299 | 587 | 1,064 |
| Capital Improvements | 890 | 870 | 1,070 |
| Average Occupancy (%) | 86 | 68 | 77 |
Real Estate Leasing – Mainland Office
San Pedro Plaza
 | Type Office Location San Antonio, Texas Acquisition Date June 4, 1998 (office) September 14, 2000 (retail) Acquisition Price $15.3 million (office) $1.1 million (retail) Date Constructed 1985 Occupancy at 12/31/13 66% | GLA (in sq. ft.) 163,900 (office) 8,100 (retail) Top Tenants Cricket Communications Reata Real Estate Ricoh America Southwest Home Health Care Starbucks
Union Pacific Railroad Co. |
| ($ in Thousands) | 2013 | 2012 | 2011 |
| Gross Revenue | 2,328 | 2,374 | 2,270 |
| Cash NOI | 969 | 1,041 | 875 |
| Capital Improvements | - | 1,840 | 419 |
| Average Occupancy (%) | 73 | 83 | 77 |
Union Bank
 | Type Office Location Everett, Washington Acquisition Date June 7, 2011 Acquisition Price $10.9 million Date Constructed 1993 & 2008 Occupancy at 12/31/13 100% GLA (in sq. ft.) 84,000 | Top Tenants Union Bank |
| ($ in Thousands) | 2013 | 2012 | 2011* |
| Gross Revenue | 1,525 | 1,497 | 749 |
| Cash NOI | 1,350 | 1,305 | 727 |
| Capital Improvements | - | - | - |
| Average Occupancy (%) | 100 | 100 | 100 |
* Partial year