 Kaneohe Ranch and Harold K. L. Castle Foundation
Hawaii Assets Acquisition
November 20, 2013
DISCLOSURE
Statements in this presentation that are not historical facts are “forward-looking statements,” within the meaning of the Private Securities Litigation Reform Act of 1995, that involve a number of risks and uncertainties that could cause actual results to differ materially from those contemplated by the relevant forward-looking statement. Factors that could cause actual results to differ materially from those contemplated in the statements include, without limitation, those described in our 2012 Annual Report on Form 10-K and in our other subsequent filings with the SEC. These forward looking statements are not guarantees of future performance. We do not undertake any obligation to update our forward-looking statements.


CALL AGENDA
Opening remarks ……………………………Stan Kuriyama
Acquisition overview……………………….Chris Benjamin
Closing remarks ……………………………..Stan Kuriyama
Questions and answers
Rare opportunity to acquire one of the state’s finest portfolios
Will enhance earnings quality of A&B’s overall portfolio
Nearly entire purchase price to be paid with tax-deferred 1031 proceeds
Accelerates Mainland portfolio migration to Hawaii
Long-term returns > returns on properties
to be sold
to be sold
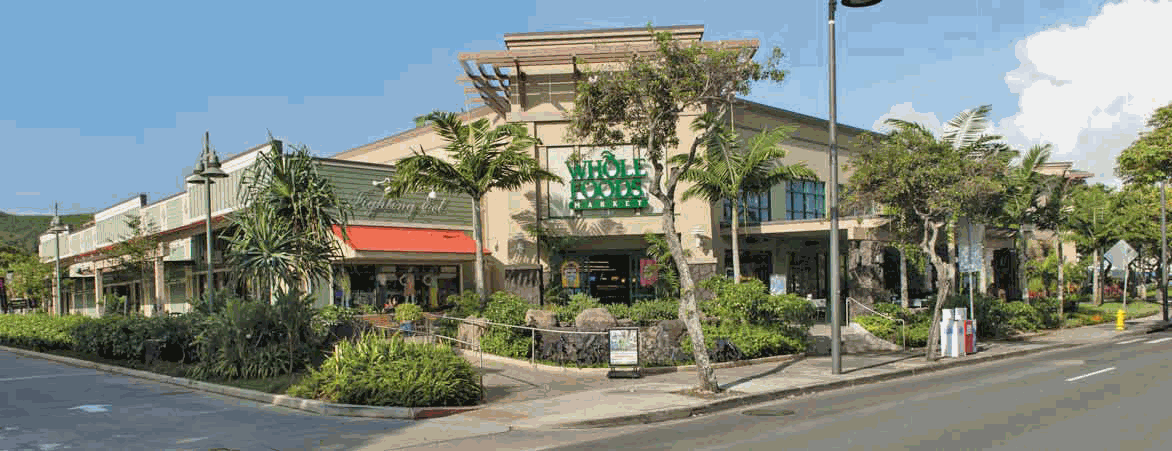
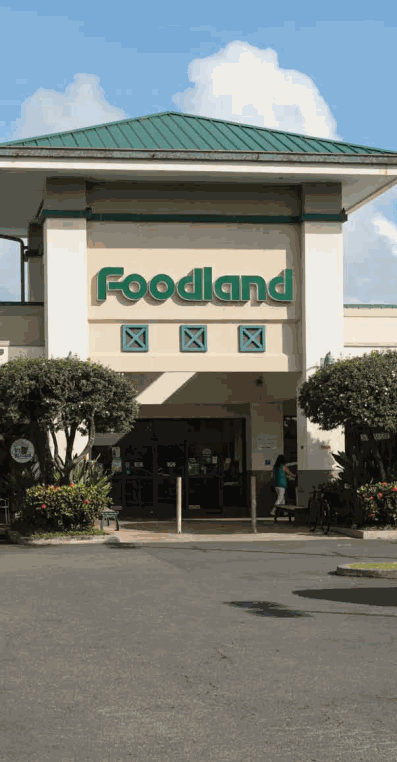
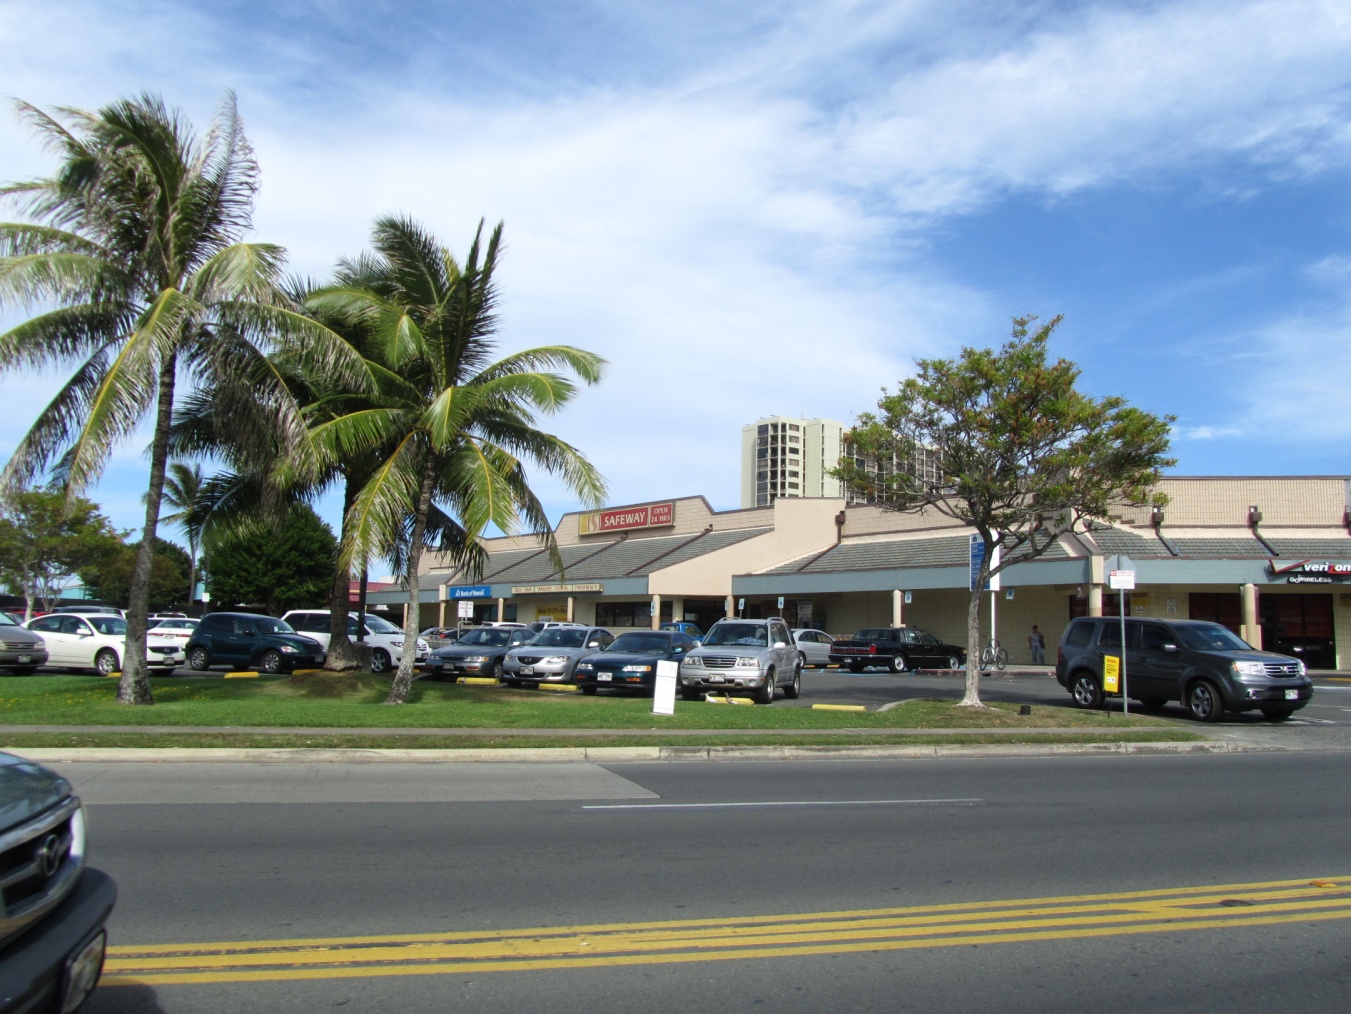
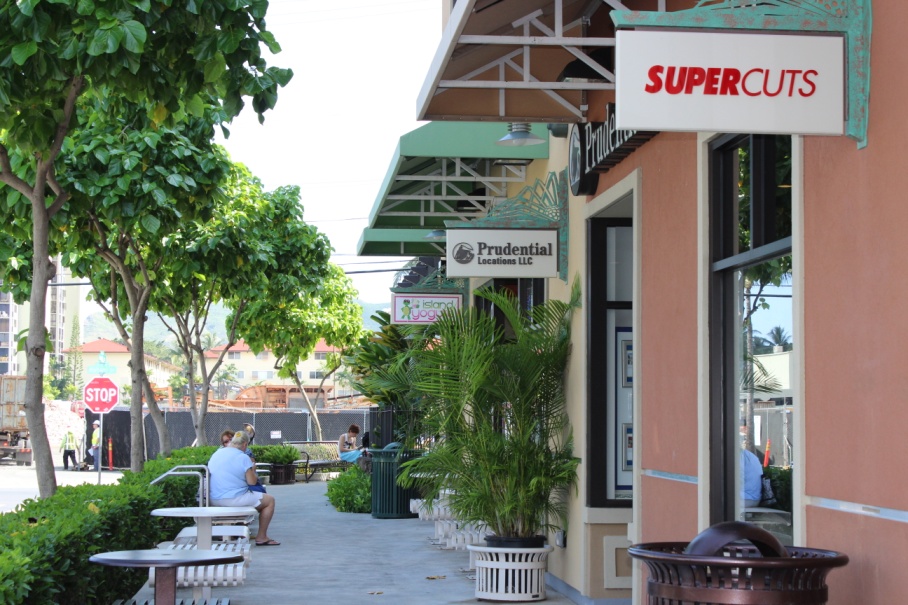
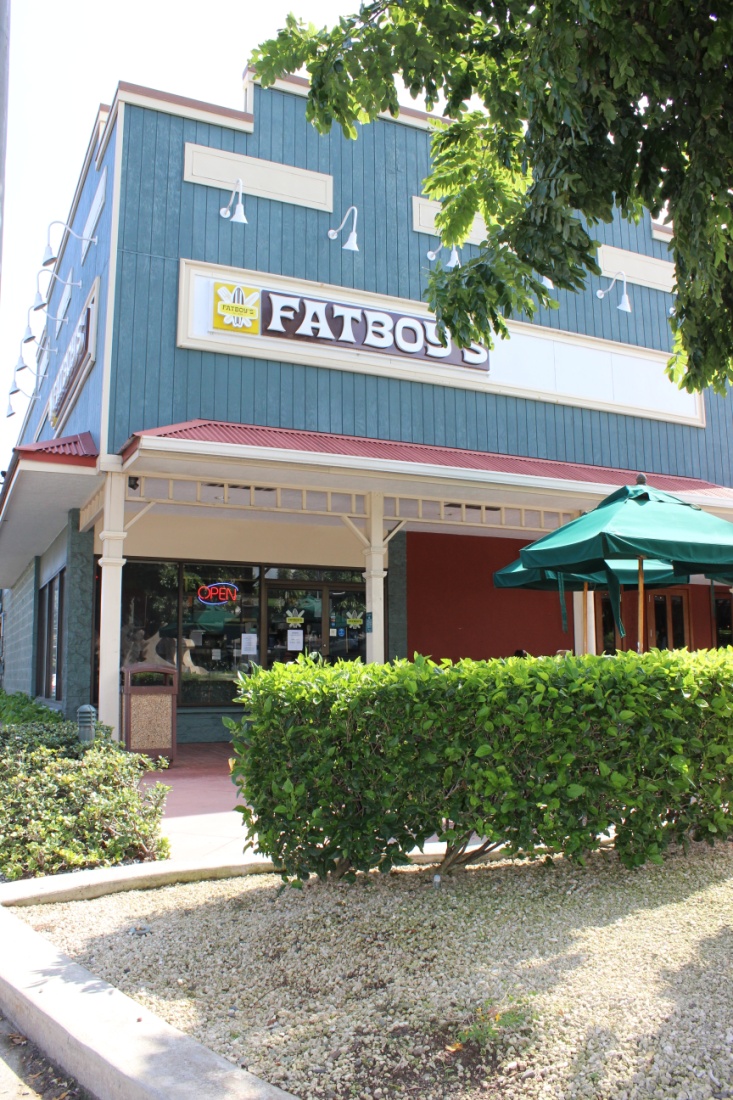
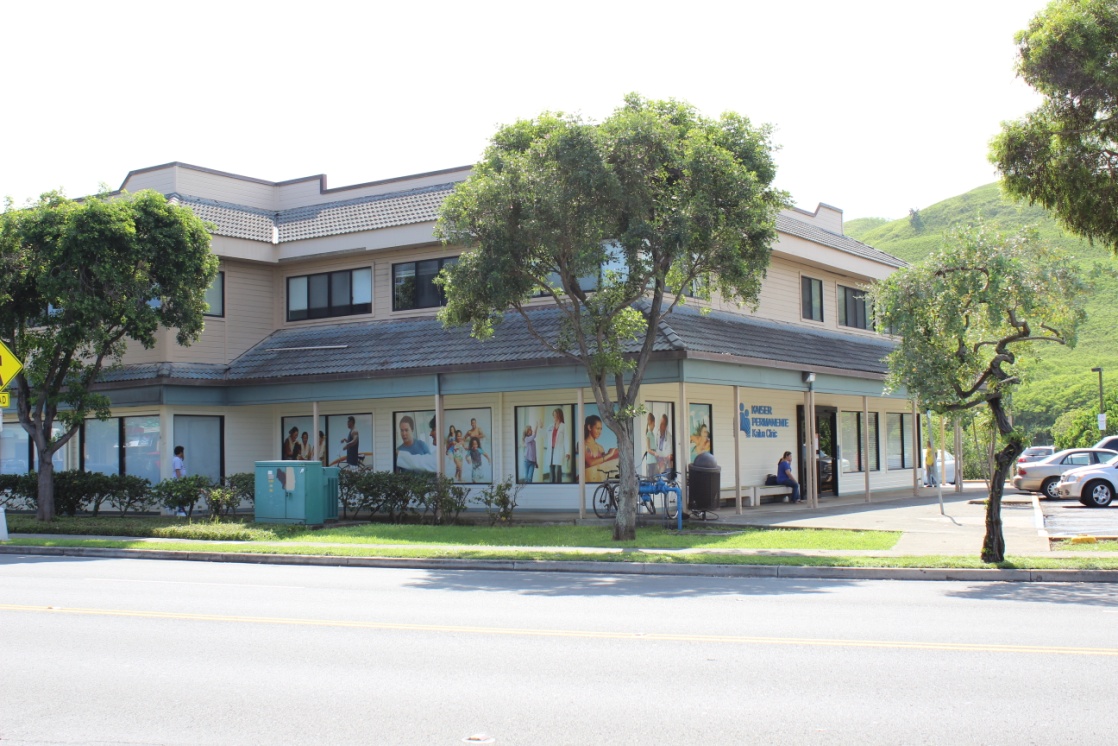
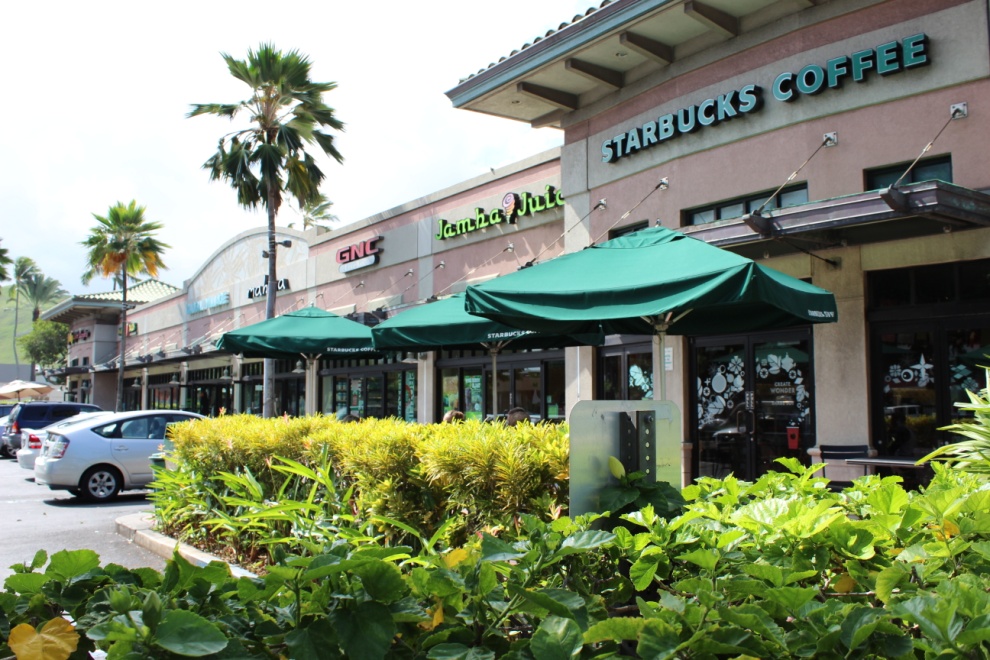
KR PORTFOLIO


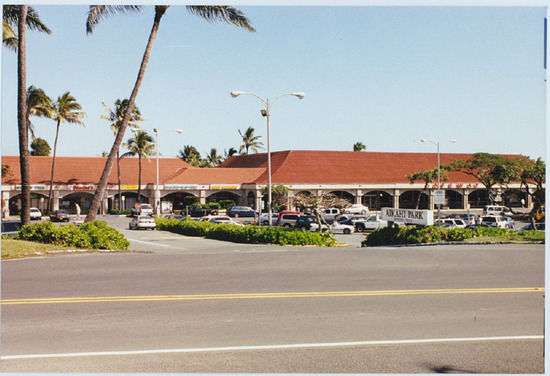

FEE SIMPLE SEGMENT
| Type | Assets | Acres | GLA (SF) | Average Annual Sales (PSF)* | Occupancy | |||
| Anchored Centers | 4 | 13 | 190,000 | $770 | 98 | % | ||
| Strip Centers | 10 | 6 | 102,000 | $475 | 99%** | |||
| Light Industrial/Flex | 8 | 4 | 94,000 | NA | 98 | % | ||
| Total | 22 | 23 | 386,000 | |||||
*Reporting tenants only **Excludes one asset under construction
GROUND LEASED SEGMENT
| Type | Assets | Acres | Tenant GLA (SF) |
| Kailua | 13 | 15 | 260,000 |
| Other Oahu | 9 | 36 | 500,000 |
| Total | 22 | 51 | 760,000 |

UNIQUE GROUND LEASED ATTRIBUTES
| • | Significant tenant investment in leasehold improvements |
▪760,000 sf of GLA constructed by tenants
| • | Highly secured cash flow |
•Scarcity of urban land in Hawaii supports land price escalation over time
•Hawaii ground leased properties trade at low cap rates

GROUND LEASE BENEFITS
| • | Costs of ownership is passed to tenant; minimal landlord ownership and operating expenses |
| • | No capital expenditure or tenant improvement costs, or depreciation expense |
| • | Minimal property management required |
| • | Annual rents based on percentage of fair market value of land leased to tenant |
| ◦ | Land values in Windward Oahu increased over 5% per annum on average for past 20 years |
| ◦ | Limited supply of commercial land |
| ◦ | Expect to capture increase in land value when ground rents reopen or reset, which occurs every 5 to 10 years |
LAND PORTFOLIO
| • | 585 acres in Kailua |
| ◦ | 76 acres of ag-zoned land |
| ◦ | 509 acres of preservation-zoned land |
| • | Limited value |
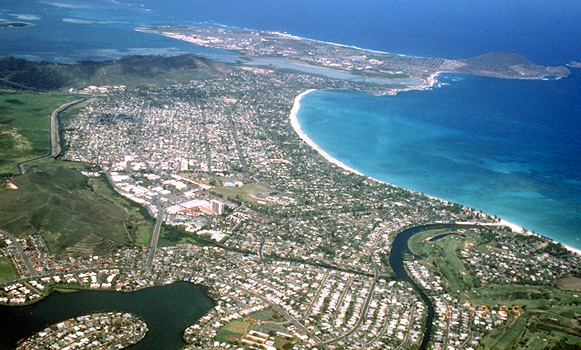
KAILUA MARKET DEMOGRAPHICS
| 16,000 | $31,000 |
| Households | Average Annual Retail Spend Per Household |
| $112,000 | 44% |
| Average Household Income | Bachelor’s Degree or Higher |
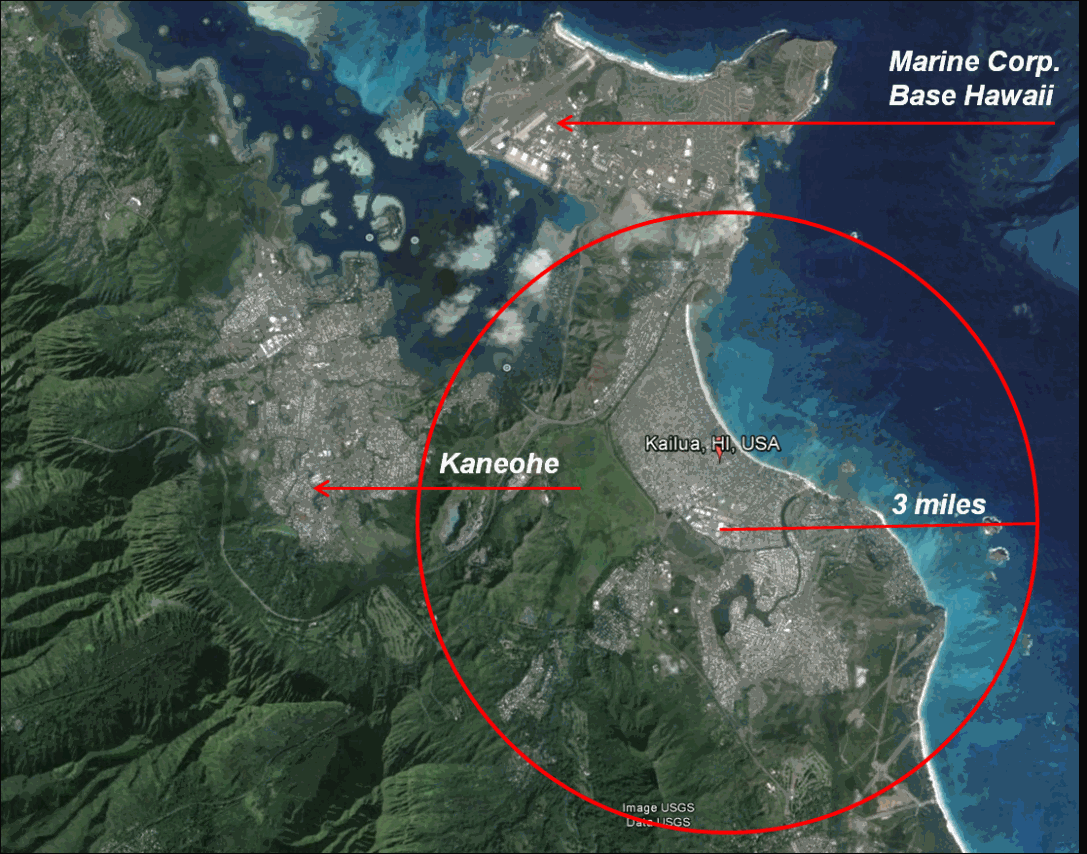
KAILUA MARKET RADIUS
| • | Fee segment includes: |
| ◦ | 50% of shopping center and strip center GLA |
| ◦ | 67% of anchored GLA |
| ◦ | 100% of Class A retail space |
| • | Adding the ground leased segment: |
| ◦ | 90% of shopping center and strip center GLA |
| ◦ | 70% of commercially zoned land |
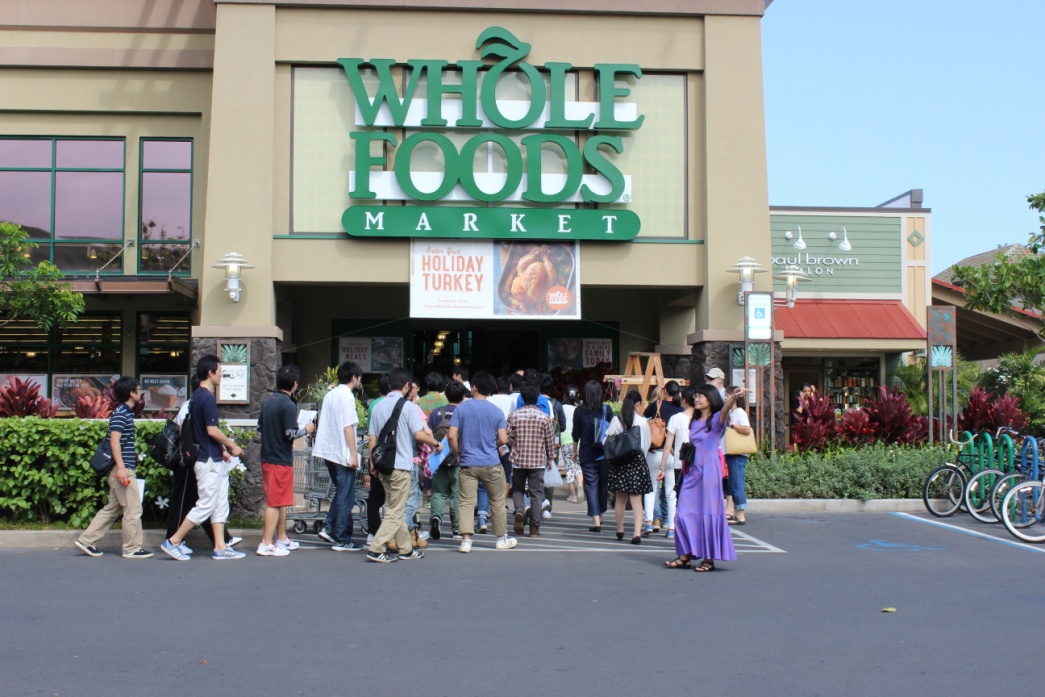
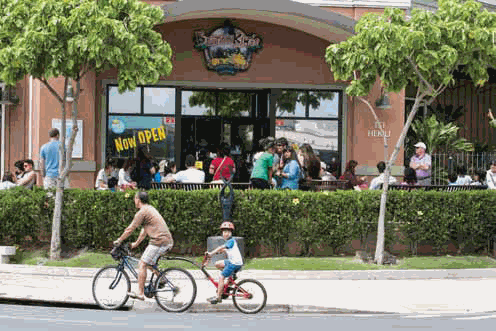
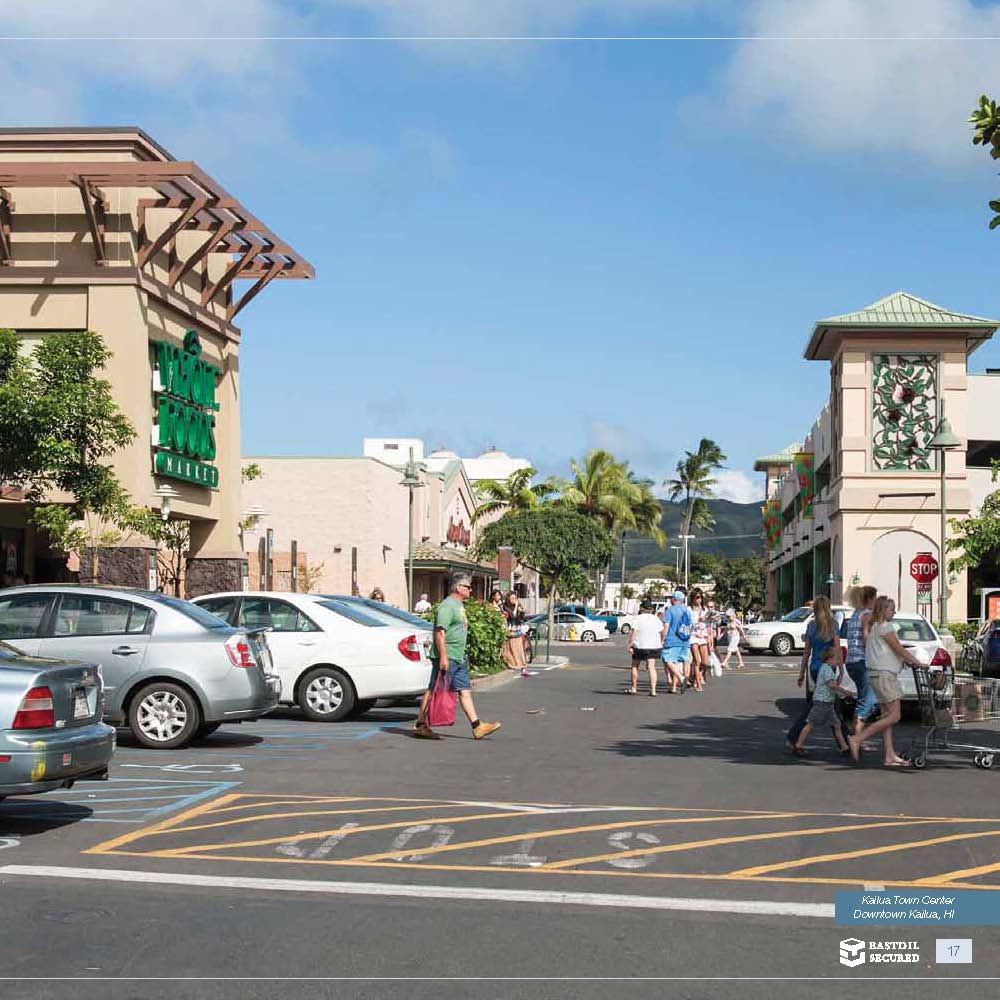
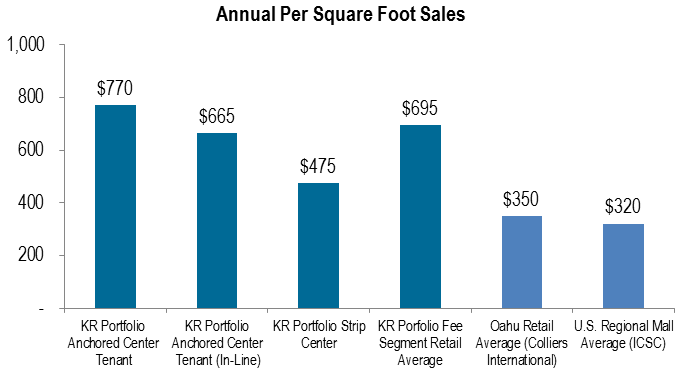
KAILUA IS A TOP PERFORMING RETAIL MARKET
| • | Fee segment reporting tenants (70% of fee segment retail GLA) |
| ◦ | 15% of GLA > $1,000 psf sales |
| ◦ | 70% of GLA > $500 psf sales |
| • | Sales performance far exceeds local and national averages |
VALUE ENHANCEMENT OPPORTUNITIES
| • | With 13 sf of retail GLA per capita, Kailua is underserved |
| ▪ | Nearly 50% below national average of 24 sf |
| • | Supports future rent growth and redevelopment opportunities that maintain the community’s unique character |

TRANSACTION OVERVIEW
| • | $373M acquisition price |
| ◦ | 70% funded with proceeds of Mainland asset sales |
| ◦ | Remaining funding from other 1031 proceeds and assumption of $12M existing mortgage debt |
| • | Acquisition cap rate of 4.9% (4.5% ground leased; 5.3% fee simple) |

TRANSACTION OVERVIEW
| • | High quality portfolio |
| ◦ | Dominant market position |
| ◦ | Serves a broad consumer base |
| ◦ | Exceptional tenant sales performance |
| ◦ | No competitive Class A product, and no new supply anticipated (beyond Target) |
| ◦ | 50% of NOI from ground leased assets produce very low risk cash flows |
| ◦ | Fee segment NOI to increase at projected compound annual growth rate of 7% to 10% |
| • | Near- and long-term upside |
–Tenant mix improvement
–Renovation of existing improvements
– Thoughtful redevelopment of existing properties to meet community needs
| • | Solidifies position as 2nd largest retail owner in Hawaii |
TRANSACTION TIMING AND FINANCING
| • | Closing expected by end of year |
| • | Financing of acquisition |
| ◦ | 70% of 1031 proceeds expected to be generated prior to close of acquisition through Mainland dispositions |
| ◦ | Balance funded through available revolver and a bridge loan |
| ◦ | Majority of reverse 1031 proceeds generated in January |

CLOSING REMARKS
| • | Modest impact on capital structure |
| • | Ample capacity to continue full pursuit of Hawaii real estate investments |
| • | Rare opportunity to acquire one of Hawaii’s largest and finest retail portfolios |
| • | Able to leverage local market knowledge to create long-term value |

 Kaneohe Ranch and Harold K. L. Castle Foundation
Hawaii Assets Acquisition
November 20, 2013