Alexander & Baldwin, Inc.
Table of Contents
|
| |
| Company Overview | |
| Company Profile | |
| Hawaii Market Information | |
| Glossary of Terms | |
| Statement on Management’s Use of Non-GAAP Financial Measures | |
| Financial Summary | |
| Table 1 – Condensed Consolidated Balance Sheets | |
| Table 2 – Condensed Consolidated Statements of Operations | |
| Table 3 – Segment Results | |
| Table 4 – Condensed Consolidated Statements of Cash Flows | |
| Table 5 – Debt Summary | |
| Table 6 – Capitalization & Financial Ratios | |
| Table 7 – Consolidated EBITDA | |
| Commercial Real Estate | |
| Table 8 – Statement of Operating Profit, Cash NOI and Same-Store Cash NOI | |
| Table 9 – Occupancy | |
| Table 10 – Cash NOI and Same-Store Cash NOI by Geography and Type | |
| Table 11 – Hawaii Improved Property Report | |
| Table 12 – Hawaii Ground Lease Report | |
| Table 13 – Mainland Improved Property Report | |
| Table 14 – Top 10 Tenants Ranked by ABR | |
| Table 15 – Lease Expiration Schedule | |
| Table 16 – New & Renewal Lease Summary | |
| Table 17 – Portfolio Repositioning, Redevelopment & Development Summary | |
| Table 18 – Transactional Activity (2013- 2017) | |
| Land Operations | |
| Table 19 – Key Active Development Projects | |
| Table 20 – Landholdings | |
| Materials & Construction | |
| Table 21 – Statement of Operating Profit, EBITDA and Adjusted EBITDA | |
| Other Supplemental Information | |
| Table 22 – Commercial Real Estate Historical Cash NOI Trends | |
Forward-Looking Statements
Statements in this Updated Supplemental Information that are not historical facts are "forward-looking statements" within the meaning of the Private Securities Litigation Reform Act of 1995 that involve a number of risks and uncertainties that could cause actual results to differ materially from those contemplated by the relevant forward-looking statement. Such forward-looking statements are subject to certain risks, uncertainties and assumptions, including prevailing market conditions.
These forward-looking statements are not guarantees of future performance. The information contained in this Updated Supplemental Information is unaudited and should be read in conjunction with Alexander & Baldwin, Inc.’s most recent Form 10-K and other filings with the SEC, which identify important factors that could affect the forward-looking statements in this Updated Supplemental Information. We do not undertake any obligation to update the Company's forward-looking statements.
Basis of Presentation
The information contained in this Updated Supplemental Information does not purport to disclose all items required by accounting principles generally accepted in the United States of America (GAAP).
Company Overview
Alexander & Baldwin, Inc.
Company Profile
Alexander & Baldwin, Inc. (the "Company") is a Hawaii real estate company with a 147-year history of being an integral piece of Hawaii and its economy. This makes us uniquely qualified to create value for shareholders through an investment and asset redeployment strategy focused on growth primarily in our commercial real estate holdings in Hawaii. In July 2017, the Company announced its decision to become a real estate investment trust ("REIT") for the 2017 tax year. This announcement sets a strategic course for the Company to concentrate its activities on investments in, and growth of, its commercial real estate holdings.
We are composed of the following:
| |
| • | A 4.7 million square foot portfolio of commercial real estate that includes 2.9 million square feet of largely grocery/drugstore-anchored retail centers in strategic locations throughout the Hawaiian islands; |
| |
| • | More than 87,000 acres of landholdings, making us the fourth largest private landowner in Hawaii. In addition, we are engaged in residential and commercial development-for-sale activities in select Hawaii locations; and |
| |
| • | Hawaii's most significant materials and construction operations, including strategic quarry and asphalt importation sites that supply the Hawaiian islands, paving activities and certain complementary operations. |
|
| | |
| Executive Officers |
| | | |
| Christopher Benjamin | | James Mead |
| President & Chief Executive Officer | | Chief Financial Officer |
| | | |
| Lance Parker | | Nelson Chun |
| President, A&B Properties | | Senior Vice President and Chief Legal Officer |
| | | |
| Gordon Yee | | Meredith Ching |
| President, Grace Pacific | | Senior Vice President, Government & Community Relations |
| | | |
| Contact Information | | Equity Research |
| | | |
| Corporate Headquarters | | Evercore ISI |
| 822 Bishop Street | | Sheila McGrath |
| Honolulu, HI 96813 | | (212) 425-3389 |
| | | sheila.mcgrath@evercore.com |
| Investor Relations | | |
| Suzy Hollinger | | JMP Securities LLC |
| Director, Investor Relations | | Peter Martin |
| (808) 525-6611 | | (415) 835-8904 |
| shollinger@abinc.com | | pmartin@jmpsecurities.com |
| | | |
| Transfer Agent & Registrar | | Sidoti & Company, LLC |
| Computershare | | Stephen O'Hara |
| P.O. Box 30170 | | (212) 894-3329 |
| College Station, TX 77842-3170 | | sohara@sidoti.com |
| (866) 422-6551 | | |
| | | Other Company Information |
| Overnight Correspondence | | |
| Computershare | | Stock exchange listing: NYSE: ALEX |
| 211 Quality Circle, Suite 210 | | Corporate website: www.alexanderbaldwin.com |
| College Station, TX 77845 | | Grace website: www.gracepacific.com |
| | | Current market capitalization: $2.0B |
Shareholder website: www.computershare.com/investor | | 3-month average trading volume: 141K |
Online inquiries: www.us-computershare.com/investor/contact | | Independent auditors: Deloitte & Touche LLP |
Alexander & Baldwin, Inc.
Hawaii Market Information
|
| | | | | |
| Hawaii Economic Highlights |
| | | | | | |
| (Percentage change, except unemployment rate) | 2015 | | 2016 | | 2017 Forecast |
| Real gross domestic product | 2.3% | | 2.1% | | 1.9% |
| Real personal income | 3.8% | | 2.7% | | 2.4% |
| Visitor expenditures | 9.0% | | 4.2% | | 5.1% |
| Visitor arrivals | 4.3% | | 3.0% | | 2.0% |
| Unemployment rate | 3.6% | | 3.0% | | 2.9% |
| Source: Hawaii State Department of Business, Economic Development & Tourism (May 12, 2017); No endorsement implied. |
|
| | | | | | | | |
| Oahu Commercial Real Estate Trends |
| |
| | | Average Asking Rent PSF/Per Month | | Change from Prior Quarter |
| | | Retail | | Industrial | | Retail | | Industrial |
| 2Q2017 | | $4.00 | | $1.24 | | (1.7)% | | 4.2% |
| 1Q2017 | | $4.07 | | $1.19 | | 3.8% | | (1.7)% |
| 4Q2016 | | $3.92 | | $1.21 | | (0.5)% | | 1.7% |
| 3Q2016 | | $3.94 | | $1.19 | | (0.8)% | | 5.3% |
| 2Q2016 | | $3.97 | | $1.13 | | 1.0% | | (3.4)% |
| |
| | | Vacancy Rate (%) | | Percentage Point Change from Prior Quarter |
| | | Retail | | Industrial | | Retail | | Industrial |
| 2Q2017 | | 7.7% | | 1.8% | | (1.5) | | 0.3 |
| 1Q2017 | * | 9.2% | | 1.5% | | 0.8 | | (0.1) |
| 4Q2016 | * | 8.4% | | 1.6% | | 2.9 | | (0.2) |
| 3Q2016 | | 5.5% | | 1.8% | | 1.3 | | 0.5 |
| 2Q2016 | | 4.2% | | 1.3% | | (0.4) | | (0.2) |
| |
| *Retail vacancy increased in 4Q2016 by Ala Moana Center GLA expansion and the addition of new GLA from International Marketplace and Ka Makana Ali’i in 1Q2017, and was also increased by the shutdown of a 147,000-square-foot Kmart store at Waikele Center. Source: Colliers International Hawaii; No endorsement implied. |
Alexander & Baldwin, Inc.
Glossary of Terms
|
| |
| ABR | Annualized Base Rent (ABR) is the current month's contractual base rent multiplied by 12. Base rent is presented without consideration of percentage rent that may, in some cases, be significant. |
| | |
| Adjusted EBITDA | Adjusted EBITDA is calculated for the Materials & Construction segment by adjusting for income attributable to noncontrolling interests from EBITDA. |
| | |
| Annualized Cash NOI | Annualized Cash NOI for Same-Store properties is calculated by dividing year-to-date Cash NOI by the number of elapsed months in the current year and multiplying the quotient by 12. |
| | |
| Backlog | Backlog represents the amount of revenue that Grace Pacific and Maui Paving, LLC, a 50-percent-owned unconsolidated affiliate, expect to realize on contracts awarded or government contracts in which Grace Pacific has been confirmed to be the lowest bidder and formal communication of the award is believed to be perfunctory. |
| | |
| Comparable Lease | Renewals and leases executed for units that have been vacated in the previous 12 months. Expansions, contractions and strategic short-term renewals are excluded from the comparable lease pool. |
| | |
| EBITDA | Earnings Before Interest, Taxes, Depreciation and Amortization (EBITDA) is calculated on a consolidated basis by adjusting the Company’s consolidated net income (loss) to exclude the impact of interest expense, income taxes, and depreciation and amortization.
EBITDA is calculated for the Materials & Construction segment by adjusting consolidated segment operating profit (which excludes interest and tax expenses), as applicable, by adding back depreciation and amortization. |
| | |
| Fixed-charge Coverage Ratio | The ratio of EBITDA to the sum of debt service (which includes interest payments and principal amortization of mortgage debt, excluding balloon payments), for the trailing twelve months. |
| | |
| GAAP | Generally accepted accounting principles (GAAP) in the United States of America. |
| | |
| GLA | Gross Leasable Area (GLA) is periodically adjusted based on remeasurement or reconfiguration of space, measured in square feet (SF). |
| | |
| Maintenance Capital Expenditures | Capital expenditures necessary to maintain building value, the current income stream and position in the market (including building improvements, tenant improvements allowances and leasing commissions). |
| | |
| Cash NOI | Cash Net Operating Income (Cash NOI) is calculated as total property revenues less direct property-related operating expenses. Cash NOI excludes straight-line rent adjustments, amortization of favorable/unfavorable leases, amortization of tenant incentives, general and administrative expenses, depreciation and amortization (including amortization of maintenance capital, tenant improvements and leasing commissions). |
| | |
| Occupancy | The percentage of square footage leased and commenced to gross leasable space at the end of the period reported. |
| | |
| Rent Spread | Percentage change in ABR in the first year of a signed lease relative to the ABR in the last year of the prior lease. |
| | |
| Same-Store | The Company reports Cash NOI on a same store basis, which includes the results of properties that were owned and operated for the entirety of the prior calendar year. The same store pool excludes properties under development or redevelopment and also excludes properties acquired or sold during the comparable reporting periods. While there is management judgment involved in classifications, new developments and redevelopments are moved into the same store pool upon one full calendar year of stabilized operation, which is typically upon attainment of market occupancy. |
| | |
| Straight-line Rent | GAAP requirement to average tenant rents over the life of the lease. |
| | |
| TTM | Trailing twelve months. |
| | |
| Year Built | Year of most recent repositioning/redevelopment or year built if no repositioning/redevelopment has occurred. |
Alexander & Baldwin, Inc.
Statement on Management’s Use of Non-GAAP Financial Measures
The Company presents the following non-GAAP financial measures in this Updated Supplemental Information:
| |
| • | Commercial Real Estate Cash NOI and Same-Store Cash NOI |
| |
| • | Materials & Construction EBITDA and Adjusted EBITDA |
The Company uses these non-GAAP measures when evaluating operating performance because management believes that they provide additional insight into the Company’s and segments' core operating results, and/or the underlying business trends affecting performance on a consistent and comparable basis from period to period. These measures generally are provided to investors as an additional means of evaluating the performance of ongoing core operations. The non-GAAP financial information presented herein should be considered supplemental to, and not as a substitute for or superior to, financial measures calculated in accordance with GAAP.
EBITDA is a non-GAAP measure used by the Company in evaluating the Company's and segments' operating performance on a consistent and comparable basis from period to period. The Company provides this information to investors as an additional means of evaluating the performance of the Company's and segments' ongoing operations. EBITDA and Adjusted EBITDA should be not be viewed as a substitute for, or superior to, financial measures calculated in accordance with GAAP.
Cash NOI is a non-GAAP measure used by the Company in evaluating the CRE segment’s operating performance as it is an indicator of the return on property investment, and provides a method of comparing performance of operations, on an unlevered basis, over time. Cash NOI should be not be viewed as a substitute for, or superior to, financial measures calculated in accordance with GAAP. In connection with the Company's decision to convert to a REIT in 2017, the Company has revised its definition of NOI to adjust Operating Profit for termination income, lease incentive amortization, and favorable/unfavorable lease amortization. We refer to amounts reported in this Updated Supplemental Information under our new definition as "Cash NOI" to distinguish from the amounts previously reported under our prior definition. While there is no standard industry definition of NOI, the Company believes its revised definition is more closely aligned with current practices of other REITs.
The calculations of these financial measures are described in the Glossary of Terms of this Updated Supplemental Information. The Company’s methods of calculating non-GAAP measures may differ from methods employed by other companies and thus may not be comparable to such other companies.
Required reconciliations of these non-GAAP financial measures to the most directly comparable financial measure calculated and presented in accordance with GAAP are set forth in the following pages of this Updated Supplemental Information:
| |
| • | Refer to Table 7 for a reconciliation of consolidated net income to EBITDA. |
| |
| • | Refer to Table 8 for a reconciliation of Commercial Real Estate operating profit to Cash NOI. |
| |
| • | Refer to Table 21 for a reconciliation of Materials & Construction operating profit to EBITDA and Adjusted EBITDA. |
Financial Summary
Alexander & Baldwin, Inc.
Table 1 - Condensed Consolidated Balance Sheets
($ in millions, unaudited)
|
| | | | | | | |
| | June 30, | | December 31, |
| | 2017 | | 2016 |
| ASSETS | | | |
| Current Assets: | | | |
| Cash and cash equivalents | $ | 11.0 |
| | $ | 2.2 |
|
| Accounts receivable, net | 39.7 |
| | 32.1 |
|
| Contracts retention | 12.5 |
| | 13.1 |
|
| Costs and estimated earnings in excess of billings on uncompleted contracts | 15.5 |
| | 16.4 |
|
| Inventories | 34.1 |
| | 43.3 |
|
| Real estate held for sale | 2.0 |
| | 1.0 |
|
| Income tax receivable | 9.8 |
| | 10.6 |
|
| Prepaid expenses and other assets | 34.4 |
| | 19.6 |
|
| Total current assets | 159.0 |
| | 138.3 |
|
| Investments in Affiliates | 398.7 |
| | 390.8 |
|
| Real Estate Developments | 184.5 |
| | 179.5 |
|
| Property – Net | 1,235.1 |
| | 1,231.6 |
|
| Intangible Assets – Net | 50.3 |
| | 53.8 |
|
| Goodwill | 102.3 |
| | 102.3 |
|
| Other Assets | 47.1 |
| | 60.0 |
|
| Total assets | $ | 2,177.0 |
| | $ | 2,156.3 |
|
| | | | |
| LIABILITIES AND EQUITY | | | |
| Current Liabilities: | | | |
| Notes payable and current portion of long-term debt | $ | 44.1 |
| | $ | 42.4 |
|
| Accounts payable | 32.2 |
| | 35.2 |
|
| Billings in excess of costs and estimated earnings on uncompleted contracts | 3.1 |
| | 3.5 |
|
| Accrued interest | 5.1 |
| | 6.3 |
|
| Deferred revenue | 0.1 |
| | 17.6 |
|
| Indemnity holdback related to Grace acquisition | 9.3 |
| | 9.3 |
|
| HC&S cessation-related liabilities | 5.2 |
| | 19.1 |
|
| Accrued and other liabilities | 29.1 |
| | 31.7 |
|
| Total current liabilities | 128.2 |
| | 165.1 |
|
| Long-term Liabilities: | | | |
| Long-term debt | 530.8 |
| | 472.7 |
|
| Deferred income taxes | 182.8 |
| | 182.0 |
|
| Accrued pension and post-retirement benefits | 63.7 |
| | 64.8 |
|
| Other non-current liabilities | 43.1 |
| | 47.7 |
|
| Total long-term liabilities | 820.4 |
| | 767.2 |
|
| Total liabilities | 948.6 |
|
| 932.3 |
|
| Commitments and Contingencies | | | |
| Redeemable Noncontrolling Interest | 10.8 |
| | 10.8 |
|
| | | | |
| Equity: | | | |
| Common stock | 1,158.9 |
| | 1,157.3 |
|
| Accumulated other comprehensive loss | (42.0 | ) | | (43.2 | ) |
| Retained earnings | 96.5 |
| | 95.2 |
|
| Total A&B shareholders' equity | 1,213.4 |
| | 1,209.3 |
|
| Noncontrolling interest | 4.2 |
| | 3.9 |
|
| Total equity | 1,217.6 |
| | 1,213.2 |
|
| Total liabilities and equity | $ | 2,177.0 |
| | $ | 2,156.3 |
|
Alexander & Baldwin, Inc.
Table 2 - Condensed Consolidated Statements of Operations
($ in millions, except per-share amounts; unaudited)
|
| | | | | | | | | | | | | | | |
| | Quarter Ended June 30, | | Six Months Ended June 30, |
| | |
| | 2017 | | 2016 | | 2017 | | 2016 |
| Operating Revenue: | | | | | | | |
| Commercial Real Estate | $ | 33.8 |
| | $ | 34.5 |
| | $ | 67.5 |
| | $ | 69.3 |
|
| Land Operations | 12.1 |
| | 5.5 |
| | 23.1 |
| | 11.5 |
|
| Materials & Construction | 52.2 |
| | 42.0 |
| | 100.7 |
| | 92.6 |
|
| Total operating revenue | 98.1 |
| | 82.0 |
| | 191.3 |
| | 173.4 |
|
| Operating Costs and Expenses: | | | | | | | |
| Cost of Commercial Real Estate | 18.9 |
| | 20.1 |
| | 37.7 |
| | 40.7 |
|
| Cost of Land Operations | 9.0 |
| | 4.6 |
| | 17.4 |
| | 10.9 |
|
| Cost of Materials & Construction | 41.7 |
| | 34.5 |
| | 80.8 |
| | 73.9 |
|
| Selling, general and administrative | 15.5 |
| | 11.3 |
| | 30.9 |
| | 27.8 |
|
| REIT evaluation/conversion costs | 2.2 |
| | 1.9 |
| | 7.0 |
| | 1.9 |
|
| Total operating costs and expenses | 87.3 |
| | 72.4 |
| | 173.8 |
| | 155.2 |
|
| Operating Income | 10.8 |
| | 9.6 |
| | 17.5 |
| | 18.2 |
|
| Other Income and (Expenses): | | | | | | | |
| Income related to joint ventures | 1.9 |
| | 1.3 |
| | 3.2 |
| | 3.4 |
|
| Gain on the sale of improved property | — |
| | 8.0 |
| | 3.0 |
| | 8.0 |
|
| Reductions in solar investments, net | (0.2 | ) | | (9.5 | ) | | (2.2 | ) | | (9.5 | ) |
| Interest and other income, net | 1.2 |
| | 0.8 |
| | 2.2 |
| | 1.1 |
|
| Interest expense | (6.2 | ) | | (6.8 | ) | | (12.4 | ) | | (13.7 | ) |
| Total other income and (expenses) | (3.3 | ) | | (6.2 | ) | | (6.2 | ) | | (10.7 | ) |
| Income from Continuing Operations Before Income Taxes | 7.5 |
| | 3.4 |
| | 11.3 |
| | 7.5 |
|
| Income tax expense | (3.5 | ) | | (0.3 | ) | | (2.7 | ) | | (0.6 | ) |
| Income from Continuing Operations | 4.0 |
| | 3.1 |
| | 8.6 |
| | 6.9 |
|
| Income (loss) from discontinued operations, net of income taxes | 0.8 |
| | (3.7 | ) | | 3.2 |
| | (14.5 | ) |
| Net Income (Loss) | 4.8 |
| | (0.6 | ) | | 11.8 |
| | (7.6 | ) |
| Income attributable to noncontrolling interest | (0.5 | ) | | (0.1 | ) | | (1.2 | ) | | (0.6 | ) |
| Net Income (Loss) Attributable to A&B Shareholders | $ | 4.3 |
| | $ | (0.7 | ) | | $ | 10.6 |
| | $ | (8.2 | ) |
| | | | | | | | |
| Basic Earnings (Loss) Per Share of Common Stock: | |
| | |
| | | | |
| Continuing operations available to A&B shareholders | $ | 0.08 |
| | $ | 0.06 |
| | $ | 0.16 |
| | $ | 0.14 |
|
| Discontinued operations available to A&B shareholders | 0.02 |
| | (0.07 | ) | | 0.07 |
| | (0.30 | ) |
| Net income (loss) available to A&B shareholders | $ | 0.10 |
| | $ | (0.01 | ) | | $ | 0.23 |
| | $ | (0.16 | ) |
| Diluted Earnings (Loss) Per Share of Common Stock: | |
| | |
| | | | |
| Continuing operations available to A&B shareholders | $ | 0.07 |
| | $ | 0.06 |
| | $ | 0.16 |
| | $ | 0.14 |
|
| Discontinued operations available to A&B shareholders | 0.02 |
| | (0.07 | ) | | 0.07 |
| | (0.30 | ) |
| Net income (loss) available to A&B shareholders | $ | 0.09 |
| | $ | (0.01 | ) | | $ | 0.23 |
| | $ | (0.16 | ) |
| | | | | | | |
| Weighted-Average Number of Shares Outstanding: | |
| | |
| | | | |
| Basic | 49.2 |
| | 49.0 |
| | 49.1 |
| | 49.0 |
|
| Diluted | 49.6 |
| | 49.4 |
| | 49.6 |
| | 49.3 |
|
| | | | | | | | |
| Amounts Available to A&B Shareholders: | | | | | | | |
| Continuing operations available to A&B shareholders, net of income taxes | $ | 3.7 |
| | $ | 3.1 |
| | $ | 8.1 |
| | $ | 6.8 |
|
| Discontinued operations available to A&B shareholders, net of income taxes | 0.8 |
| | (3.7 | ) | | 3.2 |
| | (14.5 | ) |
| Net income (loss) available to A&B shareholders | $ | 4.5 |
| | $ | (0.6 | ) | | $ | 11.3 |
| | $ | (7.7 | ) |
Alexander & Baldwin, Inc.
Table 3 - Segment Results
($ in millions, unaudited)
|
| | | | | | | | | | | | | | | |
| | Quarter Ended June 30, | | Six Months Ended June 30, |
| | |
| | 2017 | | 2016 | | 2017 | | 2016 |
| Revenue: | | | | | | | |
| Commercial Real Estate | $ | 33.8 |
| | $ | 34.5 |
| | $ | 67.5 |
| | $ | 69.3 |
|
| Land Operations | 12.1 |
| | 5.5 |
| | 23.1 |
| | 11.5 |
|
| Materials & Construction | 52.2 |
| | 42.0 |
| | 100.7 |
| | 92.6 |
|
| Total revenue | 98.1 |
| | 82.0 |
| | 191.3 |
| | 173.4 |
|
| Operating Profit (Loss): | | | | | | | |
| Commercial Real Estate | 13.4 |
| | 14.7 |
| | 27.7 |
| | 27.8 |
|
Land Operations1 | 1.7 |
| | (11.5 | ) | | (0.7 | ) | | (14.8 | ) |
| Materials & Construction | 6.7 |
| | 4.9 |
| | 12.3 |
| | 12.9 |
|
| Total operating profit | 21.8 |
| | 8.1 |
| | 39.3 |
| | 25.9 |
|
| Interest expense | (6.2 | ) | | (6.8 | ) | | (12.4 | ) | | (13.7 | ) |
| Gain on the sale of improved property | — |
| | 8.0 |
| | 3.0 |
| | 8.0 |
|
| General corporate expenses | (5.9 | ) | | (4.0 | ) | | (11.6 | ) | | (10.8 | ) |
REIT evaluation/conversion costs2 | (2.2 | ) | | (1.9 | ) | | (7.0 | ) | | (1.9 | ) |
| Income From Continuing Operations Before Income Taxes | 7.5 |
| | 3.4 |
| | 11.3 |
| | 7.5 |
|
| Income tax expense | (3.5 | ) | | (0.3 | ) | | (2.7 | ) | | (0.6 | ) |
| Income From Continuing Operations | 4.0 |
| | 3.1 |
| | 8.6 |
| | 6.9 |
|
| Income (loss) from discontinued operations, net of income tax | 0.8 |
| | (3.7 | ) | | 3.2 |
| | (14.5 | ) |
| Net Income (Loss) | 4.8 |
| | (0.6 | ) | | 11.8 |
| | (7.6 | ) |
| Income attributable to noncontrolling interest | (0.5 | ) | | (0.1 | ) | | (1.2 | ) | | (0.6 | ) |
| Net Income (Loss) Attributable to A&B Shareholders | $ | 4.3 |
| | $ | (0.7 | ) | | $ | 10.6 |
| | $ | (8.2 | ) |
1 For the quarter and six months ended June 30, 2017, Land Operations segment operating profit includes non-cash reductions of $0.2 million and $2.2 million, respectively, related to the Company's solar tax equity investments. For the quarter and six months ended June 30, 2016, Land Operations segment operating profit includes non-cash reductions of $9.5 million. The non-cash reductions are included in Reductions in solar investments, net on the condensed consolidated statement of operations.
2 Costs related to the Company's in-depth evaluation of and conversion to a REIT.
Alexander & Baldwin, Inc.
Table 4 - Condensed Consolidated Statements of Cash Flows
($ in millions, unaudited)
|
| | | | | | | |
| | Six Months Ended June 30, |
| | 2017 | | 2016 |
| Cash Flows from Operating Activities: |
| |
|
| Net income (loss) | $ | 11.8 |
| | $ | (7.6 | ) |
| Adjustments to reconcile net income to net cash provided by (used in) operations: | | | |
| Depreciation and amortization | 21.0 |
| | 54.9 |
|
| Deferred income taxes | 0.1 |
| | (19.5 | ) |
| Gains on asset transactions, net of impairment losses | (12.1 | ) | | 1.6 |
|
| Share-based compensation expense | 2.2 |
| | 2.1 |
|
| Investment in affiliates, net of distributions | 5.8 |
| | (1.9 | ) |
| Changes in operating assets and liabilities: | | | |
| Trade, contracts retention, and other receivables | (6.3 | ) | | 11.0 |
|
| Costs and estimated earnings in excess of billings on uncompleted contracts - net | 0.6 |
| | 2.9 |
|
| Inventories | 9.2 |
| | (10.1 | ) |
| Prepaid expenses, income tax receivable and other assets | (3.7 | ) | | 10.6 |
|
| Accrued pension and post-retirement benefits | 1.6 |
| | 3.1 |
|
| Accounts payable and contracts retention | (3.6 | ) | | (7.0 | ) |
| Accrued and other liabilities | (36.6 | ) | | (5.3 | ) |
| Real estate inventory sales (real estate developments held for sale) | 2.9 |
| | — |
|
| Expenditures for real estate inventory (real estate developments held for sale) | (9.5 | ) | | (5.0 | ) |
| Net cash provided by (used in) operations | (16.6 | ) | | 29.8 |
|
| | | | |
| Cash Flows from Investing Activities: | | | |
| Capital expenditures for property, plant and equipment | (23.4 | ) | | (99.8 | ) |
| Capital expenditures related to 1031 commercial property transactions | — |
| | (6.2 | ) |
| Proceeds from disposal of property and other assets | 9.7 |
| | 1.9 |
|
| Proceeds from disposals related to 1031 commercial property transactions | 6.9 |
| | 59.3 |
|
| Payments for purchases of investments in affiliates and other investments | (23.9 | ) | | (26.4 | ) |
| Proceeds from investments in affiliates and other investments | 2.0 |
| | 3.0 |
|
| Change in restricted cash associated with 1031 transactions | 5.4 |
| | 16.2 |
| Net cash used in investing activities | (23.3 | ) | | (52.0 | ) |
| | | | |
| Cash Flows from Financing Activities: | | | |
| Proceeds from issuance of long-term debt | 83.5 |
| | 132.0 |
|
| Payments of long-term debt and deferred financing costs | (35.1 | ) | | (94.3 | ) |
| Borrowings (payments) on line-of-credit agreement, net | 11.4 |
| | (4.9 | ) |
| Distribution to noncontrolling interests | (0.2 | ) | | (0.5 | ) |
| Dividends paid | (6.9 | ) | | (5.9 | ) |
| Proceeds from issuance (repurchase) of capital stock and other, net | (4.0 | ) | | 0.9 |
|
| Net cash used in financing activities | 48.7 |
| | 27.3 |
|
| | | | |
| Cash and Cash Equivalents: | | | |
| Net increase in cash and cash equivalents | 8.8 |
| | 5.1 |
|
| Balance, beginning of period | 2.2 |
| | 1.3 |
|
| Balance, end of period | $ | 11.0 |
| | $ | 6.4 |
|
Alexander & Baldwin, Inc.
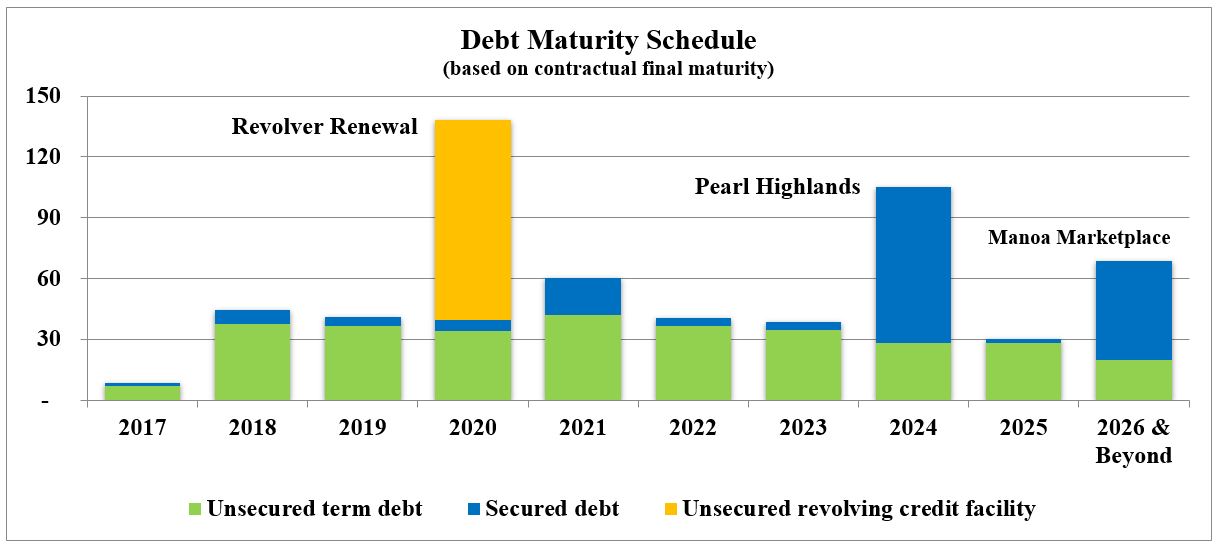
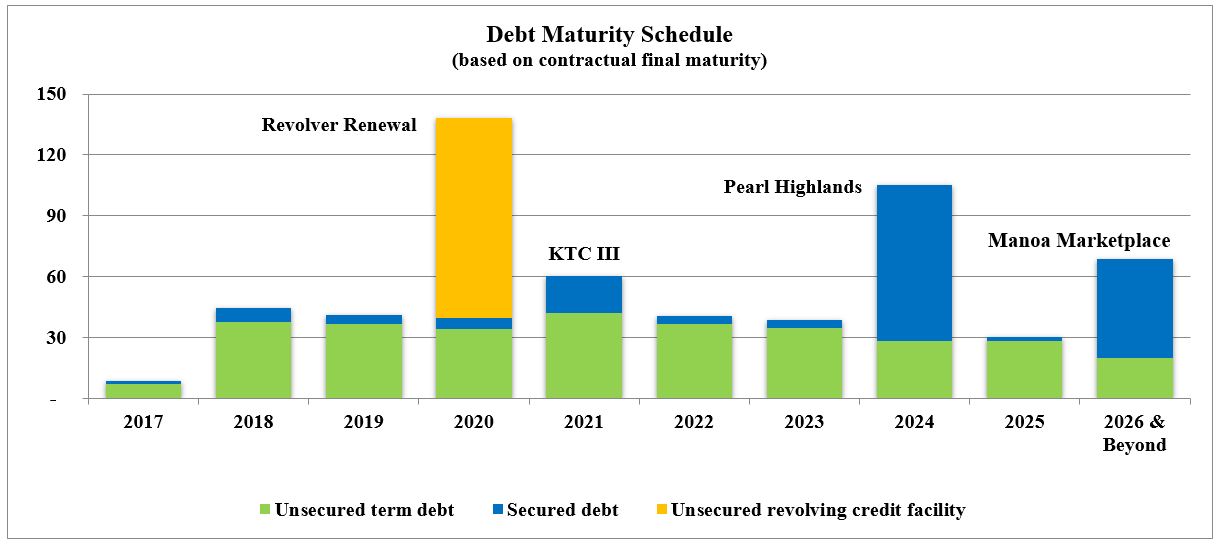
Table 5 - Debt Summary
As of June 30, 2017
($ in millions, unaudited)
|
| | | | | | | | | | | | | | | | | | | | | | | | | | | | | | | | |
| | | | | | Scheduled principal payments | | | |
| Debt: | Stated
Rate
(%) | Weighted-
average
Interest
Rate (%) | Maturity
Date | Weighted-
average
Maturity
(Years) | 2017 | 2018 | 2019 | 2020 | 2021 | Thereafter | Total
Principal | | Unamort
Deferred
Fin Cost/
(Discount)
Premium | Total |
| Secured debt: | | | | | | | | | | | | | | |
| Wells Fargo GLP Revolver | 1.93 | 1.93 | 2018 | 1.5 | $ | — |
| $ | 3.0 |
| $ | — |
| $ | — |
| $ | — |
| $ | — |
| $ | 3.0 |
| | $ | — |
| $ | 3.0 |
|
| GLP Asphalt Plant | (a) | 5.98 | 2021 | 2.4 | 0.7 |
| 1.3 |
| 1.5 |
| 1.6 |
| 0.4 |
| — |
| 5.5 |
| | (0.4 | ) | 5.1 |
|
| KTC III (second mortgage) | 3.15 | 3.15 | 2021 | 4.3 | — |
| 0.1 |
| 0.1 |
| 0.2 |
| 4.5 |
| — |
| 4.9 |
| | — |
| 4.9 |
|
| KTC III | (b) | 5.95 | 2021 | 4.3 | 0.2 |
| 0.3 |
| 0.3 |
| 0.4 |
| 9.9 |
| — |
| 11.1 |
| | (0.4 | ) | 10.7 |
|
| Pearl Highlands | 4.15 | 4.15 | 2024 | 7.0 | 0.9 |
| 1.8 |
| 1.9 |
| 1.9 |
| 2.0 |
| 79.4 |
| 87.9 |
| | 1.2 |
| 89.1 |
|
| Manoa Marketplace | (c) | 3.14 | 2029 | 11.1 | — |
| — |
| 0.5 |
| 1.6 |
| 1.7 |
| 56.2 |
| 60.0 |
| | (0.3 | ) | 59.7 |
|
| Subtotal |
| 3.90 |
| 7.9 | $ | 1.8 |
| $ | 6.5 |
| $ | 4.3 |
| $ | 5.7 |
| $ | 18.5 |
| $ | 135.6 |
| $ | 172.4 |
| | $ | 0.1 |
| $ | 172.5 |
|
| | | | | | | | | | | | | | | |
| Unsecured debt: | | | | | | | | | | | | | | |
| Unsecured term note #4 | 1.85 | 1.85 | 2017 | 0.4 | $ | 1.2 |
| $ | — |
| $ | — |
| $ | — |
| $ | — |
| $ | — |
| $ | 1.2 |
| | $ | (0.1 | ) | $ | 1.1 |
|
| Unsecured term note #2 | 2.00 | 2.00 | 2018 | 0.5 | 0.4 |
| — |
| — |
| — |
| — |
| — |
| 0.4 |
| | — |
| 0.4 |
|
| Unsecured term note #1 | 3.31 | 3.31 | 2018 | 0.9 | 0.9 |
| 1.0 |
| — |
| — |
| — |
| — |
| 1.9 |
| | — |
| 1.9 |
|
| Unsecured term note #3 | 5.19 | 5.19 | 2019 | 1.7 | 1.1 |
| 2.1 |
| 2.3 |
| — |
| — |
| — |
| 5.5 |
| | — |
| 5.5 |
|
| Prudential Series D | 6.90 | 6.90 | 2020 | 2.5 | — |
| 16.3 |
| 16.3 |
| 16.2 |
| — |
| — |
| 48.8 |
| | — |
| 48.8 |
|
| Revolving credit facility | (d) | 2.89 | 2020 | 3.5 | — |
| — |
| — |
| 98.8 |
| — |
| — |
| 98.8 |
| | — |
| 98.8 |
|
| Unsecured term note #5 | (e) | 2.82 | 2021 | 4.5 | — |
| — |
| — |
| — |
| 9.4 |
| — |
| 9.4 |
| | — |
| 9.4 |
|
| Prudential Series A | 5.53 | 5.53 | 2024 | 6.0 | — |
| — |
| — |
| — |
| 7.1 |
| 21.4 |
| 28.5 |
| | — |
| 28.5 |
|
| Prudential Series E | 3.90 | 3.90 | 2024 | 4.1 | 3.4 |
| 9.8 |
| 9.8 |
| 9.0 |
| 9.5 |
| 24.4 |
| 65.9 |
| | — |
| 65.9 |
|
| Prudential Series B | 5.55 | 5.55 | 2026 | 7.3 | — |
| — |
| — |
| — |
| 1.0 |
| 45.0 |
| 46.0 |
| | — |
| 46.0 |
|
| Prudential Series C | 5.56 | 5.56 | 2026 | 6.6 | — |
| 1.0 |
| 1.0 |
| 1.0 |
| 9.0 |
| 13.0 |
| 25.0 |
| | — |
| 25.0 |
|
| Prudential Series F | 4.35 | 4.35 | 2026 | 6.7 | — |
| — |
| — |
| 2.4 |
| 4.5 |
| 15.1 |
| 22.0 |
| | — |
| 22.0 |
|
| Prudential Series G | 3.88 | 3.88 | 2027 | 5.5 | — |
| 7.5 |
| 7.5 |
| 5.4 |
| 1.5 |
| 28.1 |
| 50.0 |
| | (0.9 | ) | 49.1 |
|
| Subtotal |
| 4.44 | | 4.7 | $ | 7.0 |
| $ | 37.7 |
| $ | 36.9 |
| $ | 132.8 |
| $ | 42.0 |
| $ | 147.0 |
| $ | 403.4 |
| | $ | (1.0 | ) | $ | 402.4 |
|
| | | | | | | | | | | | | | | |
| Total |
| 4.28 | | 5.6 | $ | 8.8 |
| $ | 44.2 |
| $ | 41.2 |
| $ | 138.5 |
| $ | 60.5 |
| $ | 282.6 |
| $ | 575.8 |
| | $ | (0.9 | ) | $ | 574.9 |
|
| | | | | | | | | | | | | | | |
| (a) Loan has a stated interest rate of LIBOR plus 1.0%, but is swapped through maturity to a 5.98% fixed rate. |
| (b) Loan has a stated interest rate of LIBOR plus 1.5%, but is swapped through maturity to a 5.95% fixed rate. |
| (c) Loan has a stated interest rate of LIBOR plus 1.35%, but is swapped through maturity to a 3.14% fixed rate. |
| (d) LIBOR plus 1.75%, based on pricing grid. |
| (e) Loan has an effective interest rate of 2.82% for 2017, and is secured by a letter of credit. |
Alexander & Baldwin, Inc.
Table 6 - Capitalization & Financial Ratios
As of June 30, 2017
($ in millions, except number of shares and stock price; unaudited)
|
| | | | | | | | |
| Debt | | | |
| Unsecured revolving credit facility | | | $ | 98.8 |
|
| Unsecured term debt | | | 303.6 |
|
| Secured debt | | | 172.5 |
|
| Total debt | | | $ | 574.9 |
|
| | | | |
| Equity | Shares | Stock Price | Market Value |
| Common stock (NYSE:ALEX) | 49,161,432 |
| $ | 41.38 |
| $ | 2,034.3 |
|
| Total equity | | | $ | 2,034.3 |
|
| | | | |
| Total Enterprise value | | | $ | 2,609.2 |
|
| Debt to Total Enterprise Value | | | 22.0 | % |
| | | | |
| Liquidity | | | |
| Cash on hand | | | $ | 11.0 |
|
| Available under unsecured, committed line of credit | | | 239.4 |
|
| Total liquidity | | | $ | 250.4 |
|
| | | | |
| Financial Ratios | | | |
| Net debt to TTM EBITDA | | 4.6 x |
|
| Fixed-charge coverage ratio | | 4.2 x |
|
| Fixed-rate debt to total debt | | 80.7 | % |
| Unencumbered CRE assets as a percent of total CRE assets (gross book value) | | 78.6 | % |
Alexander & Baldwin, Inc.
Table 7 - Consolidated EBITDA
($ in millions, unaudited)
|
| | | | | | | | | | | | | | | | | | | | |
| | | Quarter Ended June 30, | | Six Months Ended June 30, | | TTM |
| | | 2017 |
| 2016 | | 2017 | | 2016 | | June 30, 2017 |
| Net Income (Loss) | | $ | 4.8 |
| | $ | (0.6 | ) | | $ | 11.8 |
| | $ | (7.6 | ) | | $ | 11.0 |
|
| Adjustments: | | | | | | | | | | |
| Depreciation and amortization | | 10.5 |
| | 28.4 |
| | 21.0 |
| | 54.9 |
| | 85.6 |
|
| Interest expense | | 6.2 |
| | 6.8 |
| | 12.4 |
| | 13.7 |
| | 25.0 |
|
| Income tax expense (benefit) | | 3.9 |
| | (16.4 | ) | | 4.6 |
| | (19.0 | ) | | 0.8 |
|
| EBITDA | | $ | 25.4 |
| | $ | 18.2 |
| | $ | 49.8 |
| | $ | 42.0 |
| | $ | 122.4 |
|
| | | | | | | | | | | |
| Other discrete items impacting the respective periods: | | | | | | | | | | |
| Income attributable to noncontrolling interests | | (0.5 | ) | | (0.1 | ) | | (1.2 | ) | | (0.6 | ) | | (2.4 | ) |
| (Income) loss from discontinued operations before interest, income taxes and depreciation and amortization | | (1.2 | ) | | 2.3 |
| | (5.1 | ) | | (0.6 | ) | | (8.7 | ) |
| REIT evaluation/conversion costs | | 2.2 |
| | 1.9 |
| | 7.0 |
| | 1.9 |
| | 14.6 |
|
| Reduction in solar investments, net | | 0.2 |
| | 9.5 |
| | 2.2 |
| | 9.5 |
| | 2.5 |
|
| Impairment of real estate assets | | — |
| | — |
| | — |
| | — |
| | 11.7 |
|
| Net gain on sales of improved property | | — |
| | (8.0 | ) | | (3.0 | ) | | (8.0 | ) | | (2.9 | ) |
| | | | | | | | | | | |
| Other discrete items related to unconsolidated investments in affiliates: | | | | | | | | | | |
| Share of impairment of real estate assets (Land Operations segment) | | — |
| | — |
| | — |
| | — |
| | 3.5 |
|
| Share of net loss on non-core parcels (Materials & Construction segment) | | — |
| | — |
| | — |
| | — |
| | 1.0 |
|
Commercial Real Estate
Alexander & Baldwin, Inc.
Table 8 - Statement of Commercial Real Estate Operating Profit, Cash NOI and Same-Store Cash NOI
($ in millions, unaudited)
|
| | | | | | | | | | | | | | | | |
| | | Quarter Ended June 30, | | Six Months Ended June 30, |
| | | 2017 | | 2016 | | 2017 | | 2016 |
| Operating Revenues: | |
|
| |
|
|
|
|
| |
|
|
| Base rents | | $ | 23.4 |
| | $ | 24.3 |
| | $ | 46.1 |
| | $ | 48.3 |
|
| Recoveries from tenants | | 8.2 |
| | 8.0 |
| | 16.5 |
| | 15.9 |
|
| Other revenues | | 2.2 |
| | 2.2 |
| | 4.9 |
| | 5.1 |
|
| Total Commercial Real Estate revenues | | 33.8 |
| | 34.5 |
| | 67.5 |
| | 69.3 |
|
| Operating Costs and Expenses: | | | | | | | | |
| Property operations | | 9.5 |
| | 9.8 |
| | 18.7 |
| | 20.1 |
|
| Property taxes | | 2.9 |
| | 3.0 |
| | 5.9 |
| | 5.9 |
|
| Depreciation and amortization | | 6.5 |
| | 7.3 |
| | 13.1 |
| | 14.7 |
|
| Total Cost of Commercial Real Estate | | 18.9 |
| | 20.1 |
| | 37.7 |
| | 40.7 |
|
| Selling, general and administrative | | (2.0 | ) | | (0.3 | ) | | (3.2 | ) | | (1.8 | ) |
| Intersegment operating revenues (a) | | 0.5 |
| | 0.6 |
| | 1.2 |
| | 1.1 |
|
| Other income (expense), net | | — |
| | — |
| | (0.1 | ) | | (0.1 | ) |
| Operating Profit | | 13.4 |
| | 14.7 |
| | 27.7 |
| | 27.8 |
|
| Plus: Depreciation and amortization | | 6.5 |
| | 7.3 |
| | 13.1 |
| | 14.7 |
|
| Less: Straight-line lease adjustments | | (0.5 | ) | | (0.7 | ) | | (1.0 | ) | | (1.2 | ) |
| Less: Lease incentive amortization | | — |
| | — |
| | — |
| | — |
|
| Less: Favorable/(unfavorable) lease amortization | | (0.8 | ) | | (0.8 | ) | | (1.5 | ) | | (1.6 | ) |
| Less: Termination income | | — |
| | — |
| | — |
| | — |
|
| Plus: Bad debt expense | | 0.3 |
| | 0.1 |
| | 0.3 |
| | 0.3 |
|
| Less: Other (income)/expense, net | | — |
| | — |
| | 0.1 |
| | 0.1 |
|
| Plus: Selling, general, administrative and other expenses | | 2.5 |
| | 0.9 |
| | 4.2 |
| | 3.0 |
|
| Cash NOI (b) | | 21.4 |
| | 21.5 |
| | 42.9 |
| | 43.1 |
|
| Acquisitions / dispositions and other adjustments | | (1.6 | ) | | (2.6 | ) | | (3.3 | ) | | (4.9 | ) |
| Same-Store Cash NOI | | $ | 19.8 |
| | $ | 18.9 |
| | $ | 39.6 |
| | $ | 38.2 |
|
| | | | | | | | | |
| | | | | | | | | |
| Maintenance Capital Expenditures: | | | | | | | | |
| Building improvements | | $ | 1.3 |
| | $ | 2.3 |
| | $ | 2.3 |
| | $ | 3.5 |
|
| Tenant improvements | | 0.9 |
| | 1.0 |
| | 1.5 |
| | 2.4 |
|
| Leasing commissions | | 2.6 |
| | — |
| | 3.6 |
| | 1.5 |
|
| Total maintenance capital expenditures | | $ | 4.8 |
| | $ | 3.3 |
| | $ | 7.4 |
| | $ | 7.4 |
|
| | | | | | | | | |
| (a) Represents intersegment revenues, primarily base rents and expense recoveries from leases to tenants that operate as part of our Materials & Construction segment. These operating revenues, and the related rental expense incurred by these tenants, are eliminated in our consolidated results of operations. |
| (b) In connection with the Company's decision to convert to a REIT in 2017, the Company has revised its definition of NOI to adjust Operating Profit for termination income, lease incentive amortization, and favorable/unfavorable lease amortization. We refer to amounts reported in this Updated Supplemental Information under our new definition as "Cash NOI" to distinguish from the amounts previously reported under our prior definition. While there is no standard industry definition of NOI, the Company believes its revised definition is more closely aligned with current practices of other REITs. |
Alexander & Baldwin, Inc.
Table 9 - Occupancy
(unaudited)
|
| | | | | | | | | | | |
| Occupancy |
| | | | | | | | | | | | |
| | As of June 30, 2017 | | As of June 30, 2016 | | Percentage Point Change |
| | Hawaii | Mainland | Total | | Hawaii | Mainland | Total | | Hawaii | Mainland | Total |
| Retail | 93.9% | 96.0% | 94.1% | | 93.3% | 91.1% | 93.1% | | 0.6 | 4.9 | 1.0 |
| Industrial | 94.4% | 97.1% | 95.9% | | 93.1% | 98.6% | 96.2% | | 1.3 | (1.5) | (0.3) |
| Office | 89.7% | 87.5% | 88.2% | | 81.5% | 87.0% | 85.3% | | 8.2 | 0.5 | 2.9 |
| Total | 93.8% | 94.6% | 94.1% | | 92.4% | 94.9% | 93.4% | | 1.4 | (0.3) | 0.7 |
|
| | | | | | | | | | | |
| Same-Store Occupancy |
| | | | | | | |
| | As of June 30, 2017 | | As of June 30, 2016 | | Percentage Point Change |
| | Hawaii | Mainland | Total | | Hawaii | Mainland | Total | | Hawaii | Mainland | Total |
| Retail | 93.8% | 96.0% | 94.0% | | 92.9% | 91.1% | 92.7% | | 0.9 | 4.9 | 1.3 |
| Industrial | 94.4% | 97.1% | 95.9% | | 93.1% | 98.6% | 96.2% | | 1.3 | (1.5) | (0.3) |
| Office | 87.2% | 87.5% | 87.5% | | 84.6% | 87.0% | 86.4% | | 2.6 | 0.5 | 1.1 |
| Total | 93.6% | 94.6% | 94.0% | | 92.5% | 94.9% | 93.5% | | 1.1 | (0.3) | 0.5 |
Alexander & Baldwin, Inc.
Table 10 - Commercial Real Estate Cash NOI and Same-Store Cash NOI by Geography and Type
($ in millions, unaudited)
|
| | | | | | | | | | | | | | | | | | | | | | | |
| Total Portfolio Cash NOI |
| | | | | | | | |
| | Quarter Ended June 30, 2017 | | Quarter Ended June 30, 2016 | | Change |
| | Hawaii | Mainland | Total | | Hawaii | Mainland | Total | | Hawaii | Mainland | Total |
| Retail | $ | 11.7 |
| $ | 0.6 |
| $ | 12.3 |
| | $ | 11.1 |
| $ | 0.6 |
| $ | 11.7 |
| | 5.4% | —% | 5.1% |
| Industrial | 2.9 |
| 1.2 |
| 4.1 |
| | 2.8 |
| 1.2 |
| 4.0 |
| | 3.6% | —% | 2.5% |
| Office | 1.0 |
| 1.0 |
| 2.0 |
| | 1.0 |
| 2.2 |
| 3.2 |
| | —% | (54.5)% | (37.5)% |
| Ground | 3.0 |
| — |
| 3.0 |
| | 2.6 |
| — |
| 2.6 |
| | 15.4% | —% | 15.4% |
| Total | $ | 18.6 |
| $ | 2.8 |
| $ | 21.4 |
| | $ | 17.5 |
| $ | 4.0 |
| $ | 21.5 |
| | 6.3% | (30.0)% | (0.5)% |
| | | | | | | | | | | | |
| | Six Months Ended June 30, 2017 | | Six Months Ended June 30, 2016 | | Change |
| | Hawaii | Mainland | Total | | Hawaii | Mainland | Total | | Hawaii | Mainland | Total |
| Retail | $ | 23.7 |
| $ | 1.1 |
| $ | 24.8 |
|
| $ | 22.3 |
| $ | 1.0 |
| $ | 23.3 |
| | 6.3% | 10.0% | 6.4% |
| Industrial | 5.7 |
| 2.3 |
| 8.0 |
|
| 5.7 |
| 2.5 |
| 8.2 |
| | —% | (8.0)% | (2.4)% |
| Office | 2.1 |
| 2.1 |
| 4.2 |
|
| 1.8 |
| 4.4 |
| 6.2 |
| | 16.7% | (52.3)% | (32.3)% |
| Ground | 5.9 |
| — |
| 5.9 |
|
| 5.4 |
| — |
| 5.4 |
| | 9.3% | —% | 9.3% |
| Total | $ | 37.4 |
| $ | 5.5 |
| $ | 42.9 |
|
| $ | 35.2 |
| $ | 7.9 |
| $ | 43.1 |
| | 6.3% | (30.4)% | (0.5)% |
| | | | | | | | | | | | |
| Same-Store Cash NOI |
| | | | | | | | | | | | |
| | Quarter Ended June 30, 2017 | | Quarter Ended June 30, 2016 | | Change |
| | Hawaii | Mainland | Total | | Hawaii | Mainland | Total | | Hawaii | Mainland | Total |
| Retail | $ | 10.5 |
| $ | 0.6 |
| $ | 11.1 |
| | $ | 10.0 |
| $ | 0.5 |
| $ | 10.5 |
| | 5.0% | 20.0% | 5.7% |
| Industrial | 2.8 |
| 1.2 |
| 4.0 |
| | 2.8 |
| 1.2 |
| 4.0 |
| | —% | —% | —% |
| Office | 0.7 |
| 1.0 |
| 1.7 |
| | 0.7 |
| 1.0 |
| 1.7 |
| | —% | —% | —% |
| Ground | 3.0 |
| — |
| 3.0 |
| | 2.7 |
| — |
| 2.7 |
| | 11.1% | —% | 11.1% |
| Total | $ | 17.0 |
| $ | 2.8 |
| $ | 19.8 |
| | $ | 16.2 |
| $ | 2.7 |
| $ | 18.9 |
| | 4.9% | 3.7% | 4.8% |
| | | | | | | | | | | | |
| | Six Months Ended June 30, 2017 | | Six Months Ended June 30, 2016 | | Change |
| | Hawaii | Mainland | Total | | Hawaii | Mainland | Total | | Hawaii | Mainland | Total |
| Retail | $ | 21.2 |
| $ | 1.1 |
| $ | 22.3 |
|
| $ | 20.2 |
| $ | 1.0 |
| $ | 21.2 |
| | 5.0% | 10.0% | 5.2% |
| Industrial | 5.6 |
| 2.3 |
| 7.9 |
|
| 5.7 |
| 2.5 |
| 8.2 |
| | (1.8)% | (8.0)% | (3.7)% |
| Office | 1.4 |
| 2.1 |
| 3.5 |
|
| 1.4 |
| 1.9 |
| 3.3 |
| | —% | 10.5% | 6.1% |
| Ground | 5.9 |
| — |
| 5.9 |
|
| 5.5 |
| — |
| 5.5 |
| | 7.3% | —% | 7.3% |
| Total | $ | 34.1 |
| $ | 5.5 |
| $ | 39.6 |
|
| $ | 32.8 |
| $ | 5.4 |
| $ | 38.2 |
| | 4.0% | 1.9% | 3.7% |
|
| | | | |
| Annualized Cash NOI by Property Type and Geography |
| Hawaii retail | | $ | 47.4 |
|
| Hawaii industrial | (a) | 11.2 |
|
| Hawaii office | | 4.3 |
|
| Hawaii ground leases | | 11.7 |
|
| Mainland retail | | 2.2 |
|
| Mainland industrial | | 4.6 |
|
| Mainland office | | 4.2 |
|
| Total | | $ | 85.6 |
|
| | | |
| (a) The Company's Hawaii Industrial portfolio includes Honokohau, which was acquired in June 2017. Actual year-to-date Cash NOI for Honokohau was immaterial due to the timing of the acquisition. However, the Company estimates Cash NOI of approximately $0.5 million for the first year of operations following the acquisition. |
Alexander & Baldwin, Inc.
Table 11 – Hawaii Property Report
($ in thousands, except per square foot amounts; unaudited) |
| | | | | | | | | | | | | | | | | | |
| | Property (a) |
| Island | Year Built/
Renovated | Current
GLA | Occupancy | ABR | ABR
PSF | 2Q17
Cash
NOI | 2Q17 %
Cash NOI
to Hawaii
Portfolio
Cash NOI | Anchor Tenants |
| | Retail: | | | | | | | | | | |
| 1 | Pearl Highlands Center | * | Oahu | 1992-1994 | 405,000 |
| 95.5% | $ | 8,954 |
| $ | 23.33 |
| $ | 2,203 |
| 14.1% | Sam's Club, Regal Cinemas, 24 Hour Fitness |
| 2 | Kailua Retail | * | Oahu | 1947-2014 | 316,400 |
| 97.9% | 9,599 |
| 31.75 |
| 2,658 |
| 17.0% | Whole Foods Market, Foodland, CVS/Longs Drugs |
| 3 | Waianae Mall | * | Oahu | 1975 | 170,300 |
| 86.9% | 2,885 |
| 19.66 |
| 633 |
| 4.0% | CVS/Longs Drugs, City Mill |
| 4 | Manoa Marketplace |
| Oahu | 1977 | 140,600 |
| 95.1% | 4,576 |
| 34.45 |
| 1,272 |
| 8.1% | Safeway, CVS/Longs Drugs |
| 5 | Kaneohe Bay Shopping Center (Leasehold) | * | Oahu | 1971 | 125,400 |
| 100.0% | 2,905 |
| 23.16 |
| 618 |
| 3.9% | Safeway, CVS/Longs Drugs |
| 6 | Waipio Shopping Center | * | Oahu | 1986, 2004 | 113,800 |
| 98.8% | 3,028 |
| 27.51 |
| 868 |
| 5.6% | Foodland |
| 7 | Aikahi Park Shopping Center | * | Oahu | 1971 | 98,000 |
| 79.8% | 1,320 |
| 16.88 |
| 496 |
| 3.2% | Safeway |
| 8 | The Shops at Kukui'ula | * | Kauai | 2009 | 89,100 |
| 96.9% | 3,962 |
| 50.77 |
| 1,021 |
| 6.5% | CVS/Longs Drugs, Eating House, Living Foods Market |
| 9 | Lanihau Marketplace | * | Hawaii
Island | 1987 | 88,300 |
| 100.0% | 1,902 |
| 21.53 |
| 387 |
| 2.5% | Sak' N Save, CVS/Longs Drugs |
| 10 | Kunia Shopping Center | * | Oahu | 2004 | 60,600 |
| 86.4% | 1,904 |
| 39.21 |
| 446 |
| 2.8% |
|
| 11 | Kahului Shopping Center | * | Maui | 1951 | 49,900 |
| 89.7% | 547 |
| 15.64 |
| 104 |
| 0.7% |
|
| 12 | Lahaina Square | * | Maui | 1973 | 44,800 |
| 78.8% | 634 |
| 17.98 |
| 135 |
| 0.9% | Ace Hardware |
| 13 | Napili Plaza | * | Maui | 1991 | 44,400 |
| 88.4% | 1,196 |
| 30.48 |
| 351 |
| 2.2% | Napili Market |
| 14 | Gateway at Mililani Mauka | * | Oahu | 2008, 2013 | 34,900 |
| 94.0% | 1,655 |
| 51.77 |
| 444 |
| 2.8% | CVS/Longs Drugs (shadow-anchored) |
| 15 | Port Allen Marina Center | * | Kauai | 2002 | 23,600 |
| 92.0% | 517 |
| 23.86 |
| 125 |
| 0.8% |
|
| | Subtotal – Retail | | | | 1,805,100 |
| 93.9% | $ | 45,584 |
| $ | 27.50 |
| $ | 11,761 |
| 75.1% | |
| | | | | | | | | | | | |
| | Industrial: | | | | | | | | | | |
| 16 | Komohana Industrial Park | * | Oahu | 1990 | 238,300 |
| 100.0% | $ | 2,468 |
| $ | 11.65 |
| $ | 1,098 |
| 7.0% |
|
| 17 | Kaka'ako Commerce Center | * | Oahu | 1969 | 190,900 |
| 84.2% | 2,263 |
| 14.11 |
| 354 |
| 2.3% |
|
| 18 | Waipio Industrial | * | Oahu | 1988-1989 | 158,400 |
| 100.0% | 2,457 |
| 15.51 |
| 608 |
| 3.9% |
|
| 19 | P&L Warehouse | * | Maui | 1970 | 104,100 |
| 89.0% | 1,100 |
| 12.99 |
| 286 |
| 1.8% |
|
| 20 | Honokohau Industrial |
| Hawaii
Island | 2004-2006, 2008 | 73,200 |
| 93.9% | 986 |
| 14.67 |
| 52 |
| 0.3% |
|
| 21 | Kailua Industrial/Other | * | Oahu | 1951-1974 | 68,800 |
| 96.3% | 853 |
| 13.79 |
| 167 |
| 1.1% |
|
| 22 | Port Allen | * | Kauai | 1983, 1993 | 63,800 |
| 100.0% | 663 |
| 10.39 |
| 193 |
| 1.2% |
|
| 23 | Harbor Industrial | * | Maui | 1930 | 53,400 |
| 90.5% | 162 |
| 11.76 |
| 113 |
| 0.7% |
|
| | Subtotal – Industrial | | | | 950,900 |
| 94.4% | $ | 10,952 |
| $ | 13.33 |
| $ | 2,871 |
| 18.3% | |
| | | | | | | | | | | | |
| | Office: | | | | | | | | | | |
| 24 | Kahului Office Building | * | Maui | 1974 | 59,600 |
| 85.2% | $ | 1,343 |
| $ | 27.39 |
| $ | 328 |
| 2.1% |
|
| 25 | Gateway at Mililani Mauka South | (b) | Oahu | 1992, 2006 | 37,100 |
| 100.0% | 1,522 |
| 43.02 |
| 333 |
| 2.1% |
|
| 26 | Kahului Office Center | * | Maui | 1991 | 33,400 |
| 88.2% | 775 |
| 26.26 |
| 189 |
| 1.2% |
|
| 27 | Stangenwald Building | * | Oahu | 1901, 1980 | 27,100 |
| 88.6% | 451 |
| 19.25 |
| 86 |
| 0.6% |
|
| 28 | Judd Building | * | Oahu | 1898, 1979 | 20,200 |
| 86.4% | 318 |
| 18.21 |
| 72 |
| 0.5% |
|
| 29 | Lono Center | * | Maui | 1973 | 13,700 |
| 92% | 280 |
| 25.56 |
| 20 |
| 0.1% |
|
| | Subtotal – Office | | | | 191,100 |
| 89.7% | $ | 4,689 |
| $ | 28.29 |
| $ | 1,028 |
| 6.6% | |
| | Total – Hawaii Portfolio | | 2,947,100 |
| 93.8% | $ | 61,225 |
| $ | 23.15 |
| $ | 15,660 |
| 100.0% | |
|
| | | | | | | | | | |
| (a) Excludes our corporate headquarters located in Honolulu, HI. |
| (b) An 18,415 square-foot expansion was completed and added to the commercial portfolio in June 2016. |
| * Included in Same-Store portfolio. |
Alexander & Baldwin, Inc.
Table 12 – Hawaii Ground Lease Report
($ in thousands, unaudited)
|
| | | | | | | | | | | | | |
| Ground Leases (a) | | Location
(Island
or City) | Acres | Property Type | Exp. Year | Next Rent Step | Step Type | ABR | 2Q17
Cash
NOI |
| #1 | * | Oahu | 15.4 | Grocery-Anchored Retail | 2035 | 2023 | FMV Reset | $ | 2,100 |
| $ | 524 |
|
| #2 | * | Oahu | 2.8 | Grocery-Anchored Retail | 2040 | 2020 | FMV Reset | 1,344 |
| 335 |
|
| #3 | * | Maui | 5.3 | Medical Office | 2021 | — | — | 819 |
| 205 |
|
| #4 | * | Kailua | 3.4 | Grocery-Anchored Retail | 2062 | 2022 | Fixed Step | 753 |
| 188 |
|
| #5 | * | Maui | 52.0 | Heavy Industrial | 2034 | 2019 | FMV Reset | 751 |
| 188 |
|
| #6 | * | Kailua | 3.7 | Retail | 2020 | Option | FMV Reset | 694 |
| 173 |
|
| #7 | * | Kailua | 1.6 | Retail | 2017 | — | — | 565 |
| 141 |
|
| #8 | * | Kailua | 2.2 | Retail | 2062 | 2022 | Fixed Step | 485 |
| 122 |
|
| #9 | * | Oahu | 0.5 | Parking | 2018 | — | — | 270 |
| 67 |
|
| #10 | * | Oahu | 0.5 | Retail | 2019 | — | — | 252 |
| 64 |
|
| #11 | * | Oahu | 1.2 | Retail | 2022 | — | — | 237 |
| 55 |
|
| #12 | * | Maui | 0.8 | Retail | 2026 | 2017 | Fixed Step | 221 |
| 55 |
|
| #13 | * | Kailua | 3.3 | Office | 2037 | 2022 | FMV Reset | 200 |
| 50 |
|
| #14 | * | Maui | 0.4 | Office | 2017 | — | — | 195 |
| 49 |
|
| #15 | * | Maui | 0.8 | Industrial | 2020 | 2018 | Fixed Step | 183 |
| 172 |
|
| #16 | * | Kailua | 0.9 | Retail | 2033 | 2018 | FMV Reset | 181 |
| 45 |
|
| #17 | * | Maui | 0.5 | Retail | 2029 | 2017 | Fixed Step | 159 |
| 40 |
|
| #18 | * | Kailua | 0.4 | Retail | 2017 | — | — | 130 |
| 32 |
|
| #19 | * | Kailua | 1.7 | Retail | — | MTM | — | 130 |
| 30 |
|
| #20 | * | Maui | 0.4 | Retail | — | MTM | — | 128 |
| 32 |
|
| Remainder | * | Various | 18.3 | Various | Various | Various | Various | 1,459 |
| 409 |
|
| Total - Hawaii Ground Leases | 116.1 | | | | | $ | 11,256 |
| $ | 2,976 |
|
| | | | | | | | | | |
| (a) Excludes intersegment ground leases, primarily from our Materials & Construction segment, which are eliminated in our consolidated results of operations. |
| * Included in Same-Store portfolio. |
Alexander & Baldwin, Inc.
Table 13 - Mainland Property Report
($ in thousands, except per square foot amounts; unaudited)
|
| | | | | | | | | | | | | | | | | | |
| | Property | | City/State | Year Built/
Renovated | Current
GLA | Occupancy | ABR | ABR
PSF | 2Q17
Cash
NOI | 2Q17 %
Cash NOI
to Mainland
Portfolio
Cash NOI |
| | Retail: | | | | | | | | | |
| 1 |
| Little Cottonwood Center | * | Sandy, UT | 1998, 2008 | 141,500 |
| 95.9% | $ | 1,548 |
| $ | 11.52 |
| $ | 401 |
| 14.3% |
| 2 |
| Royal MacArthur Center | * | Dallas, TX | 2006 | 44,900 |
| 96.4% | 933 |
| 24.05 |
| 225 |
| 8.1% |
| | Subtotal – Retail | | | | 186,400 |
| 96.0% | $ | 2,481 |
| $ | 14.33 |
| $ | 626 |
| 22.4% |
| | | | | | | | | | | |
| | Industrial: | | | | | | | | | |
| 3 |
| Midstate 99 Distribution Center | * | Visalia, CA | 2002, 2008 | 790,200 |
| 95.6% | $ | 3,045 |
| $ | 4.03 |
| $ | 724 |
| 25.9% |
| 4 |
| Sparks Business Center | * | Sparks, NV | 1996-1998 | 396,100 |
| 100.0% | 1,963 |
| 5.16 |
| 450 |
| 16.1% |
| | Subtotal – Industrial | | | | 1,186,300 |
| 97.1% | $ | 5,008 |
| $ | 4.41 |
| $ | 1,174 |
| 42.0% |
| | | | | | | | | | | |
| | Office: | | | | | | | | | |
| 5 |
| 1800 and 1820 Preston Park | * | Plano, TX | 1997-1998 | 198,800 |
| 84.9% | $ | 3,259 |
| $ | 19.88 |
| $ | 422 |
| 15.1% |
| 6 |
| Concorde Commerce Center | * | Phoenix, AZ | 1998 | 138,700 |
| 91.1% | 2,635 |
| 20.91 |
| 380 |
| 13.6% |
| 7 |
| Deer Valley Financial Center | * | Phoenix, AZ | 2001 | 126,600 |
| 87.8% | 1,811 |
| 20.04 |
| 193 |
| 6.9% |
| | Subtotal – Office | | | | 464,100 |
| 87.5% | $ | 7,705 |
| $ | 20.26 |
| $ | 995 |
| 35.6% |
| | Total - Mainland Portfolio | | | | 1,836,800 |
| 94.6% | $ | 15,194 |
| $ | 8.99 |
| $ | 2,795 |
| 100.0% |
| | | | | | | | | | | |
| | Portfolio Summary | | | | Current
GLA | Occupancy | | | 2Q17
Cash
NOI | 2Q17 %
Cash NOI
to Total
Portfolio
Cash NOI |
| | | | | |
| | Hawaii Portfolio | 2,947,100 |
| 93.8% | | | $ | 15,660 |
| 73.1% |
| | Hawaii Ground Leases |
|
|
| | | 2,976 |
| 13.9% |
| | Mainland Portfolio | 1,836,800 |
| 94.6% | | | 2,795 |
| 13.0% |
| | Dispositions |
|
|
| | | 6 |
| —% |
| | Total Portfolio | 4,783,900 |
| 94.1% | | | $ | 21,437 |
| 100.0% |
| | |
| | * Included in Same-Store portfolio |
Alexander & Baldwin, Inc.
Table 14 - Top 10 Tenants Ranked by ABR
($ in thousands, unaudited)
Total Portfolio
|
| | | | | | | | | | |
| Tenant (a) | ABR | | % of Total
Portfolio
ABR | | GLA | | % of Total
Portfolio
GLA |
| Sam's Club | $ | 3,308 |
| | 4.3% | | 180,908 |
| | 3.8% |
| CVS Corporation (including Longs Drugs) | 2,623 |
| | 3.4% | | 150,411 |
| | 3.1% |
| United Healthcare Services | 2,270 |
| | 3.1% | | 108,100 |
| | 2.3% |
| Foodland Supermarket & related companies | 1,849 |
| | 2.4% | | 112,929 |
| | 2.4% |
| 24 Hour Fitness USA | 1,375 |
| | 1.8% | | 45,870 |
| | 1.0% |
| Albertsons Companies (including Safeway) | 1,316 |
| | 1.7% | | 168,621 |
| | 3.4% |
| Whole Foods Market | 1,210 |
| | 1.6% | | 31,647 |
| | 0.7% |
| Office Depot | 1,138 |
| | 1.5% | | 75,824 |
| | 1.6% |
| Keystone Automotive Operations | 1,016 |
| | 1.3% | | 230,300 |
| | 4.8% |
| International Paper | 978 |
| | 1.3% | | 252,040 |
| | 5.3% |
| Total | $ | 17,083 |
| | 22.4% | | 1,356,650 |
| | 28.4% |
Hawaii Portfolio
|
| | | | | | | | | | |
| Tenant (a) | ABR | | % of Total
Portfolio
ABR | | GLA | | % of Total
Portfolio
GLA |
| Sam's Club | $ | 3,308 |
| | 4.3% | | 180,908 |
| | 3.8% |
| CVS Corporation (including Longs Drugs) | 2,623 |
| | 3.4% | | 150,411 |
| | 3.1% |
| Foodland Supermarket & related companies | 1,849 |
| | 2.4% | | 112,929 |
| | 2.4% |
| 24 Hour Fitness USA | 1,375 |
| | 1.8% | | 45,870 |
| | 1.0% |
| Whole Foods Market | 1,210 |
| | 1.6% | | 31,647 |
| | 0.7% |
| Office Depot | 1,138 |
| | 1.5% | | 75,824 |
| | 1.5% |
| Albertsons Companies (including Safeway) | 1,015 |
| | 1.3% | | 105,745 |
| | 2.2% |
| Ross Dress for Less | 890 |
| | 1.2% | | 35,308 |
| | 0.7% |
| Liberty Dialysis Hawaii | 840 |
| | 1.1% | | 23,271 |
| | 0.5% |
| Simmons Manufacturing | 828 |
| | 1.1% | | 63,280 |
| | 1.3% |
| Total | $ | 15,076 |
| | 19.7% | | 825,193 |
| | 17.2% |
| | | | | | | | |
| (a) Excludes intersegment ground leases, primarily from our Materials & Construction segment, which are eliminated in our consolidated results of operations. |
Alexander & Baldwin, Inc.
Table 15 - Lease Expiration Schedule
As of June 30, 2017
($ in thousands, unaudited)
|
| | | | | | | | | | | | |
| Total Portfolio |
| Expiration Year | Number
of Leases | | Square
Footage of
Expiring Leases | | % of Total
Portfolio
Leased GLA | | ABR
Expiring | | % of Total
Portfolio
Expiring ABR |
| 2017 | 98 | | 653,580 |
| | 14.6% | | $ | 7,847 |
| | 9.3% |
| 2018 | 154 | | 851,610 |
| | 18.9% | | 10,534 |
| | 12.4% |
| 2019 | 148 | | 631,376 |
| | 14.0% | | 13,657 |
| | 16.1% |
| 2020 | 117 | | 561,602 |
| | 12.5% | | 10,725 |
| | 12.6% |
| 2021 | 101 | | 485,603 |
| | 10.8% | | 11,093 |
| | 13.1% |
| 2022 | 66 | | 262,073 |
| | 5.8% | | 7,104 |
| | 8.4% |
| 2023 | 28 | | 169,740 |
| | 3.8% | | 3,080 |
| | 3.6% |
| 2024 | 16 | | 180,876 |
| | 4.0% | | 4,617 |
| | 5.4% |
| 2025 | 21 | | 59,082 |
| | 1.3% | | 2,396 |
| | 2.8% |
| 2026 | 11 | | 35,966 |
| | 0.8% | | 1,759 |
| | 2.1% |
| Thereafter | 30 | | 393,708 |
| | 8.8% | | 8,445 |
| | 9.9% |
| Month-to-month | 107 |
| 210,266 |
|
| 4.7% |
| 3,688 |
|
| 4.3% |
| Total | 897 |
| 4,495,481 |
|
| 100.0% |
| $ | 84,945 |
|
| 100.0% |
|
| | | | | | | | | | | | |
| Hawaii Retail Portfolio |
| Expiration Year | Number
of Leases | | Square
Footage of
Expiring Leases | | % of total
Hawaii
Retail
Leased GLA | | ABR
Expiring | | % of Total
Hawaii
Retail
Expiring ABR |
| 2017 | 43 | | 115,062 |
| | 6.8% | | $ | 2,906 |
| | 5.8% |
| 2018 | 82 | | 160,880 |
| | 9.5% | | 5,484 |
| | 10.9% |
| 2019 | 74 | | 258,495 |
| | 15.3% | | 7,156 |
| | 14.3% |
| 2020 | 74 | | 213,478 |
| | 12.6% | | 6,298 |
| | 12.6% |
| 2021 | 61 | | 262,602 |
| | 15.5% | | 7,303 |
| | 14.6% |
| 2022 | 41 | | 97,884 |
| | 5.8% | | 4,132 |
| | 8.3% |
| 2023 | 19 | | 89,767 |
| | 5.3% | | 2,097 |
| | 4.2% |
| 2024 | 11 | | 145,692 |
| | 8.6% | | 3,777 |
| | 7.5% |
| 2025 | 17 | | 48,201 |
| | 2.9% | | 2,173 |
| | 4.3% |
| 2026 | 8 | | 17,469 |
| | 1.0% | | 834 |
| | 1.7% |
| Thereafter | 20 | | 218,111 |
| | 12.9% | | 6,026 |
| | 12.0% |
| Month-to-month | 48 |
| 64,236 |
|
| 3.8% |
| 1,912 |
|
| 3.8% |
| Total | 498 | | 1,691,876 |
| | 100.0% | | $ | 50,098 |
| | 100.0% |
|
| | | | | | | | | | | | |
| Hawaii Industrial Portfolio |
| Expiration Year | Number
of Leases | | Square
Footage of
Expiring Leases | | % of Total
Hawaii
Industrial
Leased GLA | | ABR
Expiring | | % of Total
Hawaii
Industrial
Expiring ABR |
| 2017 | 30 | | 126,798 |
| | 14.1% | | $ | 1,561 |
| | 12.4% |
| 2018 | 41 | | 117,189 |
| | 13.1% | | 1,690 |
| | 13.5% |
| 2019 | 35 | | 94,258 |
| | 10.5% | | 1,366 |
| | 10.9% |
| 2020 | 18 | | 119,364 |
| | 13.3% | | 1,584 |
| | 12.6% |
| 2021 | 17 | | 152,131 |
| | 17.0% | | 2,154 |
| | 17.1% |
| 2022 | 10 | | 77,616 |
| | 8.7% | | 1,306 |
| | 10.4% |
| 2023 | — | | — |
| | —% | | — |
| | —% |
| 2024 | — | | — |
| | —% | | — |
| | —% |
| 2025 | — | | — |
| | —% | | — |
| | —% |
| 2026 | — | | — |
| | —% | | — |
| | —% |
| Thereafter | 2 | | 76,255 |
| | 8.5% | | 1,458 |
| | 11.6% |
| Month-to-month | 44 |
| 132,634 |
|
| 14.8% |
| 1,448 |
|
| 11.5% |
| Total | 197 | | 896,245 |
| | 100.0% | | $ | 12,567 |
| | 100.0% |
Alexander & Baldwin, Inc.
Table 16 - New & Renewal Lease Summary
As of June 30, 2017
(Unaudited)
|
| | | | | | | | | | | | | | | | | | | | |
| | | | | | | Comparable Leases Only |
| Total - New and Renewal | Leases | GLA | New
ABR
PSF | TI PSF | Weighted-
Average
Lease Term
(Years) | Leases | GLA | New
ABR
PSF | Old
ABR
PSF | Rent
Spread |
| 2nd Quarter - 2017 | 57 | 309,664 |
| $ | 19.16 |
| $ | 13.07 |
| 4.9 | 43 | 208,758 |
| $ | 19.30 |
| $ | 16.11 |
| 19.8% |
| 1st Quarter - 2017 | 43 | 317,646 |
| $ | 15.93 |
| $ | 4.66 |
| 5.8 | 33 | 158,162 |
| $ | 18.55 |
| $ | 16.38 |
| 13.3% |
| 4th Quarter - 2016 | 54 | 408,770 |
| $ | 12.55 |
| $ | 8.97 |
| 2.9 | 35 | 308,804 |
| $ | 10.57 |
| $ | 9.99 |
| 5.8% |
| 3rd Quarter - 2016 | 49 | 145,553 |
| $ | 18.06 |
| $ | 4.93 |
| 3.6 | 33 | 85,617 |
| $ | 19.10 |
| $ | 17.47 |
| 9.4% |
| Trailing four quarters | 203 | 1,181,633 |
| $ | 15.87 |
| $ | 8.39 |
| 4.3 | 144 | 761,341 |
| $ | 15.58 |
| $ | 13.84 |
| 12.6% |
| | | | | | | | | | | |
| Total - New Leases | Leases | GLA | New
ABR
PSF | TI PSF | Weighted-
Average
Lease Term
(Years) | Leases | GLA | New
ABR
PSF | Old
ABR
PSF | Rent
Spread |
| 2nd Quarter - 2017 | 20 | 107,333 |
| $ | 19.71 |
| $ | 2.56 |
| 4.1 | 6 | 6,427 |
| $ | 33.07 |
| $ | 23.95 |
| 38.1% |
| 1st Quarter - 2017 | 15 | 169,094 |
| $ | 13.62 |
| $ | 8.53 |
| 4.6 | 5 | 9,610 |
| $ | 18.66 |
| $ | 18.05 |
| 3.4% |
| 4th Quarter - 2016 | 28 | 128,545 |
| $ | 20.31 |
| $ | 28.53 |
| 5.9 | 9 | 28,579 |
| $ | 26.03 |
| $ | 23.72 |
| 9.7% |
| 3rd Quarter - 2016 | 22 | 70,157 |
| $ | 18.04 |
| $ | 9.26 |
| 4.4 | 6 | 10,221 |
| $ | 26.69 |
| $ | 22.98 |
| 16.1% |
| Trailing four quarters | 85 | 475,129 |
| $ | 17.46 |
| $ | 12.70 |
| 4.8 | 26 | 54,837 |
| $ | 25.69 |
| $ | 22.62 |
| 13.6% |
| | | | | | | | | | | |
| Total - Renewal Leases | Leases | GLA | New
ABR
PSF | TI PSF | Weighted-
Average
Lease Term
(Years) | Leases | GLA | New
ABR
PSF | Old
ABR
PSF | Rent
Spread |
| 2nd Quarter - 2017 | 37 | 202,331 |
| $ | 18.87 |
| $ | 18.64 |
| 5.3 | 37 | 202,331 |
| $ | 18.87 |
| $ | 15.86 |
| 18.9% |
| 1st Quarter - 2017 | 28 | 148,552 |
| $ | 18.55 |
| $ | 0.26 |
| 7.2 | 28 | 148,552 |
| $ | 18.55 |
| $ | 16.27 |
| 14.0% |
| 4th Quarter - 2016 | 26 | 280,225 |
| $ | 8.99 |
| $ | — |
| 1.5 | 26 | 280,225 |
| $ | 8.99 |
| $ | 8.59 |
| 4.7% |
| 3rd Quarter - 2016 | 27 | 75,396 |
| $ | 18.07 |
| $ | 0.90 |
| 2.9 | 27 | 75,396 |
| $ | 18.07 |
| $ | 16.72 |
| 8.1% |
| Trailing four quarters | 118 | 706,504 |
| $ | 14.80 |
| $ | 5.49 |
| 3.9 | 118 | 706,504 |
| $ | 14.80 |
| $ | 13.16 |
| 12.5% |
| | | | | | | | | | | |
| | | | | | | | | | | |
| | Quarter Ended June 30, 2017 | | TTM Ended June 30, 2017 | |
| | Leases | GLA | ABR
PSF | Rent
Spread | | Leases | GLA | ABR
PSF | Rent
Spread | |
| Hawaii | | | | | | | | | | |
| Retail | 27 | 81,727 |
| $ | 31.11 |
| 35.8% | | 106 | 238,008 |
| $ | 36.83 |
| 20.8% | |
| Industrial | 20 | 156,612 |
| $ | 13.02 |
| 11.6% | | 48 | 316,470 |
| $ | 13.85 |
| 10.1% | |
| Office | 6 | 16,173 |
| $ | 21.86 |
| (4.6)% | | 22 | 42,540 |
| $ | 25.69 |
| (3.8)% | |
| Mainland | | | | | | | | | | |
| Retail | 1 | 1,300 |
| $ | 18.00 |
| No comps | | 8 | 19,937 |
| $ | 17.79 |
| 5.6% | |
| Industrial | 1 | 13,823 |
| $ | 11.52 |
| 2.7% | | 10 | 490,505 |
| $ | 5.31 |
| 3.9% | |
| Office | 2 | 40,029 |
| $ | 20.36 |
| No comps | | 9 | 74,173 |
| $ | 19.35 |
| 3.5% | |
Alexander & Baldwin, Inc.
Table 17 - Commercial Real Estate Portfolio Repositioning, Redevelopment & Development Summary
As of June 30, 2017
($ in millions, unaudited)
|
| | | | | | | | | | | | |
| | | | | | | | | | | | | |
| | | | | | | | | | | Leasing Activity |
| Project | Phase | Target
In-service | Target
Stabilization | Value of Land
& Related Costs
Contributed to
Project
(Book Value) | Total Estimated
Project Capital
Costs, Inclusive
of Land Basis | Project Capital
Costs Incurred
to Date | Estimated
Incremental
Stabilized
Cash NOI | Estimated
Stabilized
Yield on Total
Project Capital
Costs | Projected
GLA | %
Leased | %
LOI | Total |
| Repositioning & Redevelopment | | | | | | | | | | | | |
Pearl Highlands Center -
Food Court/Regal renovation (a) | Construction | Late 2017 | 1Q18 | N/A | $6.0 | $1.0 | $0.6 | 10.0-10.3% | 54,000 | 44 | 22 | 66 |
| Lau Hala Shops repositioning | Construction | 2018 | 1Q19 | N/A | 21.0 | 4.3 | 1.9-2.4 | 9.0-11.4% | 48,400 | 48 | 39 | 87 |
| Development for Hold | | | | | |
|
|
| | | |
| Ho'okele Shopping Center (b) | Pre-leasing | Late 2019 | 2Q20 | 4.3 | 41.9 | 5.4 | 3.1-3.6 | 7.5-8.5% | 94,000 | 64 | — | 64 |
| Total | | | | $4.3 | $68.9 | $10.7 | $5.6-6.6 | 8.1-9.6% | 196,400 | | | |
| | | | | | | | | | | | | |
| (a) Includes $3.0 million of tenant improvement capital to Regal Entertainment to renovate that provides a 10.3% yield on cost. |
| (b) The Company contributed land from its legacy landholdings adjacent to Maui Business Park (Phase II) to the Ho'okele Shopping Center development project. The carrying value of this parcel, including certain previously incurred infrastructure improvements and related costs, was $4.3 million at contribution. The stabilized yield on cost was determined utilizing this book value. If the Company had instead contributed the land, infrastructure improvements and related costs at market value, management estimates that the stabilized yield on the project would be lower by approximately 100 basis points. |
Alexander & Baldwin, Inc.
Table 18 - Commercial Real Estate Transactional Activity (2013-2017)
($ in millions, unaudited)
|
| | | | | | | | |
| Dispositions | | | | | |
| Property | Type | Location
(Island/City, State) | Date
(Month/Year) | Sales Price | GLA |
| The Maui Clinic Building | Office | Maui, HI | 1/17 | $ | 3.4 |
| 16,600 |
|
| Ninigret Office Park | Office | Salt Lake City, UT | 6/16 | 30.4 |
| 185,500 |
|
| Gateway Oaks | Office | Sacramento, CA | 6/16 | 8.0 |
| 59,700 |
|
| Prospect Park | Office | Sacramento, CA | 6/16 | 22.3 |
| 163,300 |
|
| Union Bank | Office | Everett, WA | 12/15 | 10.0 |
| 84,000 |
|
| San Pedro Plaza | Office | San Antonio, TX | 5/15 | 16.7 |
| 171,900 |
|
| Wilshire Shopping Center | Retail | Greeley, CO | 3/15 | 4.3 |
| 46,500 |
|
| Maui Mall | Retail | Maui, HI | 1/14 | 64.1 |
| 185,700 |
|
| Portfolio | |
| 12/13 | 165.1 |
| 2,604,400 |
|
| Activity Distribution Center | Industrial | San Diego, CA | | 32.5 |
| 252,300 |
|
| Heritage Business Park | Industrial | Dallas, TX | | 93.4 |
| 1,316,400 |
|
| Savannah Logistics Park | Industrial | Savannah, GA | | 39.2 |
| 1,035,700 |
|
| Portfolio | |
| 12/13 | 101.0 |
| 485,800 |
|
| Broadlands Marketplace | Retail | Broomfield, CO | | 11.0 |
| 103,900 |
|
| Meadows on the Parkway | Retail/Office | Boulder, CO | | 33.0 |
| 216,400 |
|
| Rancho Temecula Town Center | Retail | Temecula, CA | | 57.0 |
| 165,500 |
|
| Republic Distribution Center | Industrial | Houston, TX | 10/13 | 19.4 |
| 312,500 |
|
| Centennial Plaza | Industrial | Salt Lake City, UT | 9/13 | 15.0 |
| 244,000 |
|
| Issaquah Office Center | Office | Issaquah, WA | 9/13 | 22.3 |
| 146,900 |
|
| Northpoint Industrial | Industrial | Fullerton, CA | 1/13 | 14.9 |
| 119,400 |
|
| Total | | | | $ | 496.9 |
| 4,826,200 |
|
| | | | | | |
| Acquisitions | | | | | |
| Property | Type | Location
(Island/City, State) | Date
(Month/Year) | Purchase Price | GLA |
| Honokohau Industrial | Industrial | Hawaii Island, HI | 6/17 | $ | 10.1 |
| 73,200 |
|
| 2927 East Manoa Road | Ground Lease | Oahu, HI | 12/16 | 2.8 |
| N/A |
|
| Manoa Marketplace | Retail | Oahu, HI | 1/16 | 82.4 |
| 139,300 |
|
| Aikahi Park Shopping Center (Leasehold) | Retail | Oahu, HI | 5/15 | 1.6 |
| 98,000 |
|
| Kaka'ako Commerce Center | Industrial | Oahu, HI | 12/14 | 39.1 |
| 204,400 |
|
| Kailua Portfolio | Retail/Industrial/
Ground Lease | Oahu, HI | 12/13 | 372.6 |
| 386,200 |
|
| The Shops at Kukui'ula (a) | Retail | Kauai, HI | 9/13 | — |
| 78,900 |
|
| Pearl Highlands Center | Retail | Oahu, HI | 9/13 | 141.5 |
| 415,400 |
|
| Napili Plaza | Retail | Maui, HI | 5/13 | 19.2 |
| 45,100 |
|
| Waianae Mall | Retail | Oahu, HI | 1/13 | 29.8 |
| 170,300 |
|
| Total | | | | $ | 699.1 |
| 1,610,800 |
|
| | | | | | |
| (a) In November 2013, the Company refinanced and acquired The Shops at Kukui'ula. The Shops were originally developed in 2009 through a joint venture as part of the amenities for the Kukui'ula development project. |
Land Operations
Alexander & Baldwin, Inc.
Table 19 - Key Active Development Projects
As of June 30, 2017
($ in millions except per square foot amounts, unaudited)
|
| | | | | | | | | | | | | | | | | | | | | | | | | | | | | |
| | | | | | | | | | | Construction Timing | | Sales Closings Timing |
| Project | Location | Product
Type | Est.
Economic
Interest | Planned
Units or
Saleable
Acres | Average
Size
Unit (SF)
or Lot
(Acres) | Units/
Acres
Closed | Unit/
Acres
Remaining | Target
Sales Price
Range
(PSF) | Est.
Total
Project
Cost | A&B
Projected
Capital
Commitment
(JVs Only) | Total
Project
Costs
Incurred
to Date | A&B Gross
Investment
(Life to Date) | A&B Net
Investment
(Current
Book Value) | | Start /
Est. Start | Est.
Substantial
Completion | | Start /
Est. Start | Est. End |
| | | | (a) | | | | | | (b) | (c) | | | (d) | | (e) | (e) | | (e) | (e) |
Kahala Avenue
Portfolio | Honolulu,
Oahu | Residential | 100% | 17
acres | 0.5
acres | 12.2
acres | 4.8
acres | $150-$385 | $ | 135 |
| N/A |
| $ | 134 |
| $ | 134 |
| $ | 44 |
| | N/A | N/A | | 2013 | 2018 |
| The Collection | Honolulu,
Oahu | Primary
residential | 90%
+/-5% | 465
units | 904 SF | 453
units | 12
units | $785 | $ | 285 |
| $ | 54 |
| $ | 266 |
| $ | 54 |
| $ | 16 |
| | 2014 | 2016 | | 2016 | 2018 |
Keala o Wailea
(MF-11) | Wailea,
Maui | Resort
residential | 65%
+/-5% | 70
units | 1,385 SF | — | 70
units | $600-$1,000 | $ | 64 |
| $ | 9 |
| $ | 40 |
| $ | 9 |
| $ | 9 |
| | 2015 | 2018 | | 2017 | 2018 |
Kamalani
(Increment 1) | Kihei,
Maui | Primary
residential | 100% | 170
units | 994 SF | — | 170
units | $400 | $ | 64 |
| N/A |
| $ | 26 |
| $ | 26 |
| $ | 26 |
| | 2016 | 2019 | | 2017 | 2019 |
Ka Milo at
Mauna Lani | Kona,
Hawaii
Island | Resort
residential | 50% | 137
units | 2,165 SF | 92
units | 45
units | $530-$800 | $ | 125 |
| $ | 16 |
| $ | 101 |
| $ | 16 |
| $ | 5 |
| | 2005 | 2018 | | 2007 | 2020 |
The Ridge at Wailea
(MF-19) | Wailea,
Maui | Resort
residential | 100% | 5
acres | 0.5
acres | 1
acre | 4
acres | $60-$100 | $ | 10 |
| N/A |
| $ | 9 |
| $ | 9 |
| $ | 8 |
| | 2007 | 2009 | | 2014 | 2020 |
Maui Business Park
(Phase II) | Kahului,
Maui | Light
industrial
lots | 100% | 125
acres | 0.5-11
acres | 31
acres | 94
acres | $38-$60 | $ | 77 |
| N/A |
| $ | 59 |
| $ | 59 |
| $ | 39 |
| | 2011 | 2021 | | 2012 | 2030+ |
| Kukui'ula (f) | Poipu,
Kauai | Resort
residential | 85%
+/- 5% | 640
acres | 0.42
acres | 108
acres | 532
acres | $40-$110 | $ | 854 |
| $ | 318 |
| $ | 543 |
| $ | 308 |
| $ | 297 |
| | 2006 | 2030 | | 2006 | 2030+ |
| | | | | | | | | | | | | | | | | | | | |
| (a) Estimated economic interest represents the Company's estimated share of distributions after return of capital contributions based on current forecasts of sales activity. Actual results could differ materially from projected results due to the timing of expected sales, increases or decreases in estimated sales prices or costs and other factors. As a result, estimated economic interests are subject to change. Further, as it relates to certain of our joint venture projects, information disclosed herein is obtained from our joint venture partners, who maintain the books and records of the related ventures. |
| (b) Includes land cost at book value, including capitalized interest, but excluding sales commissions and closing costs. |
| (c) Includes land cost at contribution value and total expected A&B capital to be contributed. The estimate includes due diligence costs and capitalized interest, but excludes capital projected to be contributed by equity partners, third-party debt, and amounts expected to be funded from project cash flows and/or buyer deposits. |
| (d) The book value of active development projects includes land stated at its acquisition value. In the case of development projects on A&B's historical landholdings, such as Kamalani and Maui Business Park, the value of land would be approximately $150 per acre. |
| (e) Estimated or actual dates. Estimated substantial construction completion for Kukui'ula represents the estimated completion date for major project infrastructure and amenities. Construction activities related to parcel development is expected to continue past 2030. |
| (f) In addition to the main Kukui'ula project included herein, with a book value of $297 million, the Company has investments in three other Kukui'ula-related residential development joint ventures with a combined book value of $28 million at June 30, 2017. |
Alexander & Baldwin, Inc.
Table 20 - Landholdings as of June 30, 2017
(Unaudited) |
| | | | | | | | | | | | | | | | |
| Type | Maui | Kauai | Oahu | Molokai | Hawaii Island | Total
Hawaii
Acres | Mainland | Total Acres |
| Land under commercial properties/ urban ground leases | 96 |
| 19 |
| 185 |
| — |
| 15 |
| 315 |
| 124 |
| 439 |
|
| Land in active development | 202 |
| — |
| 5 |
| — |
| — |
| 207 |
| — |
| 207 |
|
| Land used in other operations | 22 |
| 20 |
| — |
| — |
| — |
| 42 |
| — |
| 42 |
|
| Urban land, not in active development/use | | | | | | | | |
| Developable, with full or partial infrastructure | 149 |
| 7 |
| — |
| — |
| — |
| 156 |
| — |
| 156 |
|
| Developable, with limited or no infrastructure | 186 |
| 28 |
| — |
| — |
| — |
| 214 |
| — |
| 214 |
|
| Other | 13 |
| 7 |
| — |
| — |
| — |
| 20 |
| — |
| 20 |
|
| Subtotal - Urban land, not in active development | 348 |
| 42 |
| — |
| — |
| — |
| 390 |
| — |
| 390 |
|
| Agriculture-related | | | | | | | | |
| Agriculture | 48,208 |
| 6,631 |
| 75 |
| — |
| — |
| 54,914 |
| — |
| 54,914 |
|
| In urban entitlement process | 357 |
| 260 |
| — |
| — |
| — |
| 617 |
| — |
| 617 |
|
| Conservation & preservation | 15,848 |
| 13,309 |
| 639 |
| — |
| — |
| 29,796 |
| — |
| 29,796 |
|
| Subtotal - Agriculture-related | 64,413 |
| 20,200 |
| 714 |
| — |
| — |
| 85,327 |
| — |
| 85,327 |
|
| Materials & Construction | 1 |
| — |
| 541 |
| 264 |
| — |
| 806 |
| — |
| 806 |
|
| Total landholdings | 65,082 |
| 20,281 |
| 1,445 |
| 264 |
| 15 |
| 87,087 |
| 124 |
| 87,211 |
|
| | | | | | | | | |
| Revised Classifications of Agricultural Lands |
| | | | | | | | | |
Higher use potential agricultural land encompasses a broad range of lands whose use, in the foreseeable future, could include uses other than large scale agricultural production or ranching. This category includes lands in the urbanization process, lands whose characteristics (location, views, etc.) make them candidates for other uses, lands which are suitable for smaller farms and ranches, and lands which may currently be employed in other uses. The overwhelming majority of these lands remain in active agricultural or agriculture-related, permitted uses. Most of A&B's historical agricultural land sales are from lands in this classification. |
Core agricultural land encompasses lands that will likely be utilized for large scale crop production, pasture or related uses for the foreseeable future, and includes the majority of lands designated by the Company as Important Agricultural Lands, which is a state designation of lands that are capable of producing sustained high agricultural yields. |
Supporting agricultural and conservation land encompasses the Company’s nearly 30,000 acres of conservation lands, as well as agricultural lands with functional, but non-productive, agricultural uses, such as infrastructure (e.g., ditches, reservoirs) and roads, and agriculturally-zoned lands whose topography makes active agricultural operations impractical (e.g., gulches, wastelands, drainage areas). |
| |
The above classification of lands is subject to change, based on the ongoing re-evaluation of future use potential that will occur over time.
|
| | | | | | | | | |
The following classifications are based on management's assessment of potential use (not actual use) as of June 30, 2017: |
| Type | Maui | Kauai | Oahu | Molokai | Hawaii Island | Total
Hawaii
Acres | Mainland | Total Acres |
| Higher use potential | 14,048 |
| 2,530 |
| 75 |
| — |
| — |
| 16,653 |
| — |
| 16,653 |
|
| Core agricultural | 31,589 |
| 4,145 |
| | — |
| — |
| 35,734 |
| — |
| 35,734 |
|
| Supporting and conservation | 18,776 |
| 13,525 |
| 639 |
| — |
| — |
| 32,940 |
| — |
| 32,940 |
|
| Total agricultural lands | 64,413 |
| 20,200 |
| 714 |
| — |
| — |
| 85,327 |
| — |
| 85,327 |
|
Alexander & Baldwin, Inc.
Table 20 - Landholdings as of June 30, 2017 (continued)
(Unaudited)
|
| | | | | | | | | | | |
| Recent A&B Agricultural-zoned Land Sales Data - Maui & Kauai 2012 - 2Q17 |
| The Company's historic sales of agricultural-zoned lands have consisted of land in the "Higher use potential" category only. Therefore, the land sales data presented below does not provide relevant benchmarking data with regards to the Company's "Core agricultural" and "Supporting and conservation" landholdings. |
| Total
Acres
Sold | Weighted-
Average
Price
per Acre | High | Low |
| 0-5 acres | 9 |
| $ | 114,750 |
| $ | 151,600 |
| $ | 84,400 |
|
| 5-20 acres | 67 |
| $ | 75,900 |
| $ | 120,525 |
| $ | 35,600 |
|
| 20-100 acres | 468 |
| $ | 28,650 |
| $ | 55,700 |
| $ | 13,750 |
|
| 100+ acres | 1,570 |
| $ | 25,800 |
| $ | 35,450 |
| $ | 14,600 |
|
| Total/weighted-average | 2,114 |
| $ | 28,400 |
| $ | 151,600 |
| $ | 13,750 |
|
|
| | | | | | | | | | | |
| Recent A&B Urban-zoned Land Sales Data - Maui & Kauai 2012 - 2Q17 |
| The majority of the Company's historic sales of urban lands have been those in the "Developable, with full or partial infrastructure" category. |
| | Total
Acres
Sold | Weighted-
Average
Price
per Acre | High | Low |
| 0-3 acres | 10 |
| $ | 2,288,250 |
| $ | 4,346,200 |
| $ | 1,829,500 |
|
| 3-25 acres | 57 |
| $ | 1,674,500 |
| $ | 2,288,250 |
| $ | 1,184,200 |
|
| Total/weighted average | 67 |
| $ | 1,766,000 |
| $ | 4,346,200 |
| $ | 1,184,200 |
|
Materials & Construction
Alexander & Baldwin, Inc.
Table 21 - Materials & Construction Statement of Operating Profit, EBITDA and Adjusted EBITDA
($ in millions, unaudited)
|
| | | | | | | | | | | | | | | | | | | |
| | Quarter Ended June 30, | | Six Months Ended June 30, | | TTM |
| | 2017 | | 2016 | | 2017 | | 2016 | | June 30, 2017 |
| Operating Profit | $ | 6.7 |
| | $ | 4.9 |
| | $ | 12.3 |
| | $ | 12.9 |
| | $ | 22.7 |
|
| Depreciation and amortization | 3.1 |
| | 3.0 |
| | 6.1 |
| | 5.9 |
| | 11.9 |
|
| EBITDA | 9.8 |
| | 7.9 |
| | 18.4 |
| | 18.8 |
| | 34.6 |
|
| Income attributable to non-controlling interest (a) | (0.6 | ) | | (0.1 | ) | | (1.3 | ) | | (0.6 | ) | | (2.5 | ) |
| Adjusted EBITDA | $ | 9.2 |
| | $ | 7.8 |
| | $ | 17.1 |
| | $ | 18.2 |
| | $ | 32.1 |
|
| | | | | | | | | | |
| (a) The Company's GPRM prestress operating unit is a 50% owned consolidated joint venture and GLP Asphalt is a 70% owned consolidated joint venture. |
| | | | | | | | | | |
| | Quarter Ended June 30, | | Six Months Ended June 30, | | TTM |
| | 2017 | | 2016 | | 2017 | | 2016 | | June 30, 2017 |
| EBITDA margin | 18.8 | % | | 18.8 | % | | 18.3 | % | | 20.3 | % | | 17.4 | % |
| Asphalt tons delivered (tons in thousands) | 142.4 |
| | 86.9 |
| | 277.1 |
| | 204.8 |
| | 517.2 |
|
| Aggregate tons delivered (tons in thousands) | 181.3 |
| | 159.5 |
| | 346.6 |
| | 342.7 |
| | 700.0 |
|
| Crew days lost to weather | 59.0 |
| | 52.5 |
| | 98.5 |
| | 80.5 |
| | 250.5 |
|
| Total available crew days | 444.0 |
| | 378.0 |
| | 894.0 |
| | 755.0 |
| | 1,794.5 |
|
| % days lost to weather | 13.3 | % | | 13.9 | % | | 11.0 | % | | 10.7 | % | | 14.0 | % |
| Backlog (as of period end, in millions) | $ | 214.6 |
| | $ | 264.1 |
| |
| |
| | |
| | | | | | | | | | |
Materials: The Company owns centrally located quarries and an asphalt import terminal, which provide products that include hot mix asphalt, ready-mix concrete, construction aggregate, and asphalt. |
| | | |
Specialty Construction: The Company is vertically integrated and is a contractor that engages in road maintenance and construction, manufactures and sells prestressed and precast concrete products, roadway signage and guardrails, and provides traffic control services and related equipment. |
| | | | | | | | | | |
| The Company operates under brand names that include Grace Pacific, GP Roadway Solutions, GPRM Prestress, and GP Maintenance Solutions. |
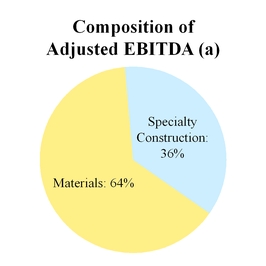
(a) Represents composition percentage for the trailing twelve month period.
Other Supplemental Information
Alexander & Baldwin, Inc.
Table 22 - Commercial Real Estate Historical Cash NOI Trends
($ in millions, unaudited)
|
| | | | | | | | | | |
| | | 2016 | | 2012 | | Change |
| Operating Profit | | $ | 54.8 |
| | $ | 41.6 |
| | 31.7% |
| Less: Amounts reported in discontinued operations | | — |
| | (17.1 | ) | | (100.0)% |
| Operating Profit from Continuing Operations | | 54.8 |
| | 24.5 |
| | 123.7% |
| Plus: Depreciation and amortization | | 28.4 |
| | 22.2 |
| | 27.9% |
| Less: Straight-line lease adjustments | | (2.1 | ) | | (3.6 | ) | | (41.7)% |
| Less: Lease incentive amortization | | 0.1 |
| | 0.1 |
| | —% |
| Less: Favorable/(unfavorable) lease amortization | | (3.3 | ) | | (1.1 | ) | | 200.0% |
| Less: Termination income | | (0.1 | ) | | (0.2 | ) | | (50.0)% |
| Plus: Bad debt expense | | 0.1 |
| | 0.1 |
| | —% |
| Less: Other (income)/expense, net | | — |
| | (0.3 | ) | | (100.0)% |
| Plus: Selling, general, administrative and other expenses | | 5.2 |
| | 3.1 |
| | 67.7% |
| Plus: Amounts reported in discontinued operations | | — |
| | 17.1 |
| | (100.0)% |
| Cash NOI | | $ | 83.1 |
| | $ | 61.9 |
| | 34.2% |