Brookfield Property Partners L.P.
Condensed Consolidated Balance Sheets
| Unaudited | | | | | As of | | |
| (US$ Millions) | | Note | | | Jun. 30, 2014 | | | Dec. 31, 2013 | |
| Assets | | | | | | | | | | | | |
| Non-current assets | | | | | | | | | | | | |
| Investment properties | | | 5 | | | $ | 36,511 | | | $ | 34,153 | |
| Equity accounted investments | | | 6 | | | | 9,299 | | | | 9,281 | |
| Participating loan interests | | | 7 | | | | 676 | | | | 747 | |
| Hotel assets | | | 8 | | | | 2,243 | | | | 2,432 | |
| Other non-current assets | | | 9 | | | | 3,589 | | | | 2,802 | |
| Loans and notes receivable | | | 10 | | | | 107 | | | | 20 | |
| | | | | | | | 52,425 | | | | 49,435 | |
| Current assets | | | | | | | | | | | | |
| Loans and notes receivable | | | 10 | | | | 87 | | | | 608 | |
| Accounts receivable and other | | | 11 | | | | 1,105 | | | | 1,035 | |
| Cash and cash equivalents | | | | | | | 1,504 | | | | 1,368 | |
| | | | | | | | 2,696 | | | | 3,011 | |
| Total assets | | | | | | $ | 55,121 | | | $ | 52,446 | |
| | | | | | | | | | | | | |
| Liabilities and equity | | | | | | | | | | | | |
| Non-current liabilities | | | | | | | | | | | | |
| Debt obligations | | | 12 | | | $ | 20,173 | | | $ | 16,520 | |
| Capital securities | | | 13 | | | | 2,260 | | | | 2,181 | |
| Other non-current liabilities | | | | | | | 424 | | | | 250 | |
| Deferred tax liabilities | | | | | | | 2,121 | | | | 1,532 | |
| | | | | | | | 24,978 | | | | 20,483 | |
| Current liabilities | | | | | | | | | | | | |
| Debt obligations | | | 12 | | | | 3,422 | | | | 5,120 | |
| Capital securities | | | 13 | | | | 187 | | | | 188 | |
| Accounts payable and other liabilities | | | 15 | | | | 1,836 | | | | 1,665 | |
| | | | | | | | 5,445 | | | | 6,973 | |
| Total liabilities | | | | | | | 30,423 | | | | 27,456 | |
| | | | | | | | | | | | | |
| Equity | | | | | | | | | | | | |
| Limited partners(1) | | | 16 | | | | 5,615 | | | | 2,528 | |
| General partner(1) | | | 16 | | | | 4 | | | | 4 | |
| Non-controlling interests attributable to: | | | | | | | | | | | | |
| Redeemable/exchangeable and special limited partnership units(1) | | | 16,17 | | | | 11,979 | | | | 11,092 | |
| Limited partnership units of Brookfield Office Properties Exchange LP(1) | | | 16,17 | | | | 724 | | | | ― | |
| Interests of others in operating subsidiaries and properties | | | 17 | | | | 6,376 | | | | 11,366 | |
| Total equity | | | | | | | 24,698 | | | | 24,990 | |
| Total liabilities and equity | | | | | | $ | 55,121 | | | $ | 52,446 | |
| (1) | The partnership’s equity interests include general partnership units (“GP Units”), publicly traded limited partnership units (“LP Units”), redeemable/exchangeable partnership units (“Redeemable/Exchangeable Partnership Units”) and special limited partnership units (“Special LP Units”) of the operating partnership and limited partnership units of Brookfield Office Properties Exchange LP (“Exchange LP Units”). Holders of the GP Units, LP Units, Redeemable/Exchangeable Partnership Units, Special LP Units and Exchange LP Units are collectively referred to as the “unitholders”. |
See accompanying notes to the condensed consolidated financial statements.
Brookfield Property Partners L.P.
Condensed Consolidated Statements of Income
| Unaudited | | | | | Three months ended Jun. 30, | | | Six months ended Jun. 30, | |
| (US$ Millions, except per unit information) | | Note | | | 2014 | | | 2013 | | | 2014 | | | 2013 | |
| Commercial property revenue | | | 18 | | | $ | 742 | | | $ | 711 | | | $ | 1,465 | | | $ | 1,459 | |
| Hospitality revenue | | | | | | | 264 | | | | 331 | | | | 539 | | | | 660 | |
| Investment and other revenue | | | 19 | | | | 209 | | | | 44 | | | | 266 | | | | 99 | |
| Total revenue | | | | | | | 1,215 | | | | 1,086 | | | | 2,270 | | | | 2,218 | |
| Direct commercial property expense | | | 20 | | | | 331 | | | | 293 | | | | 645 | | | | 598 | |
| Direct hospitality expense | | | 21 | | | | 202 | | | | 262 | | | | 415 | | | | 514 | |
| Interest expense | | | | | | | 307 | | | | 276 | | | | 595 | | | | 543 | |
| Depreciation and amortization | | | 22 | | | | 37 | | | | 54 | | | | 76 | | | | 87 | |
| Administration and other expense | | | 23 | | | | 95 | | | | 65 | | | | 179 | | | | 111 | |
| Total expenses | | | | | | | 972 | | | | 950 | | | | 1,910 | | | | 1,853 | |
| Fair value gains, net | | | 24 | | | | 1,014 | | | | 376 | | | | 1,582 | | | | 590 | |
| Share of net earnings from equity accounted investments | | | 6 | | | | 301 | | | | 162 | | | | 529 | | | | 394 | |
| Income before income taxes | | | | | | | 1,558 | | | | 674 | | | | 2,471 | | | | 1,349 | |
| Income tax expense | | | 14 | | | | 269 | | | | 196 | | | | 689 | | | | 295 | |
| Net income | | | | | | | 1,289 | | | | 478 | | | | 1,782 | | | | 1,054 | |
| | | | | | | | | | | | | | | | | | | | | |
| Net income attributable to: | | | | | | | | | | | | | | | | | | | | |
| Limited partners(1) | | | | | | $ | 270 | | | $ | 44 | | | $ | 347 | | | $ | 44 | |
| General partner(1) | | | | | | | ― | | | | ― | | | | ― | | | | ― | |
| Brookfield Asset Management Inc.(2) | | | | | | | ― | | | | (97 | ) | | | ― | | | | 232 | |
| Non-controlling interests attributable to: | | | | | | | | | | | | | | | | | | | | |
| Redeemable/exchangeable and special limited partnership units(1) | | | | | | | 574 | | | | 206 | | | | 866 | | | | 206 | |
| Limited partnership units of Brookfield Office Properties Exchange LP | | | | | | | 48 | | | | ― | | | | 51 | | | | ― | |
| Interests of others in operating subsidiaries and properties | | | | | | | 397 | | | | 325 | | | | 518 | | | | 572 | |
| | | | | | | | 1,289 | | | | 478 | | | | 1,782 | | | | 1,054 | |
| Net income per LP Unit: | | | | | | | | | | | | | | | | | | | | |
| Basic(3) | | | 16 | | | $ | 1.29 | | | $ | 0.54 | | | $ | 2.16 | | | $ | 0.54 | |
| Diluted(3) | | | 16 | | | $ | 1.25 | | | $ | 0.54 | | | $ | 2.12 | | | $ | 0.54 | |
| (1) | For periods subsequent to April 15, 2013. |
| (2) | For the periods prior to April 15, 2013. |
| (3) | Net income per LP Unit have been presented effective for the period from the date of the Spin-off on April 15, 2013, as this is the date of legal entitlement of earnings to the LP Unit holders. |
See accompanying notes to the condensed consolidated financial statements.
Brookfield Property Partners L.P.
Condensed Consolidated Statements of Comprehensive Income
| Unaudited | | | | | Three months ended Jun. 30, | | | Six months ended Jun. 30, | |
| (US$ Millions) | | Note | | | 2014 | | | 2013 | | | 2014 | | | 2013 | |
| Net income | | | | | | $ | 1,289 | | | $ | 478 | | | $ | 1,782 | | | $ | 1,054 | |
| Other comprehensive income (loss): | | | 26 | | | | | | | | | | | | | | | | | |
| Foreign currency translation | | | | | | | 101 | | | | (615 | ) | | | 136 | | | | (749 | ) |
| Cash flow hedges | | | | | | | (46 | ) | | | 72 | | | | (91 | ) | | | 117 | |
| Available-for-sale securities | | | | | | | 4 | | | | ― | | | | 3 | | | | 6 | |
| Equity accounted investments | | | | | | | 53 | | | | (38 | ) | | | 53 | | | | (38 | ) |
| Total other comprehensive income (loss) | | | | | | | 112 | | | | (581 | ) | | | 101 | | | | (664 | ) |
| Total comprehensive income (loss) | | | | | | | 1,401 | | | | (103 | ) | | | 1,883 | | | | 390 | |
Comprehensive income attributable to: | | | | | | | | | | | | | | | | | | | | |
| Limited partners(1) | | | | | | | | | | | | | | | | | | | | |
| Net income | | | | | | | 270 | | | | 44 | | | | 347 | | | | 44 | |
| Other comprehensive income (loss) | | | | | | | 18 | | | | (55 | ) | | | 15 | | | | (55 | ) |
| | | | | | | | 288 | | | | (11 | ) | | | 362 | | | | (11 | ) |
| General partner(1) | | | | | | | | | | | | | | | | | | | | |
| Net income | | | | | | | ― | | | | ― | | | | ― | | | | ― | |
| Other comprehensive income (loss) | | | | | | | ― | | | | ― | | | | ― | | | | ― | |
| | | | | | | | ― | | | | ― | | | | ― | | | | ― | |
| Brookfield Asset Management Inc.(2) | | | | | | | | | | | | | | | | | | | | |
| Net income | | | | | | | ― | | | | (97 | ) | | | ― | | | | 232 | |
| Other comprehensive income (loss) | | | | | | | ― | | | | 36 | | | | ― | | | | (25 | ) |
| | | | | | | | ― | | | | (61 | ) | | | ― | | | | 207 | |
| Non-controlling interests | | | | | | | | | | | | | | | | | | | | |
| Redeemable/exchangeable and special limited partnership units(1) | | | | | | | | | | | | | | | | | | | | |
| Net income | | | | | | | 574 | | | | 206 | | | | 866 | | | | 206 | |
| Other comprehensive income (loss) | | | | | | | 38 | | | | (265 | ) | | | 28 | | | | (265 | ) |
| | | | | | | | 612 | | | | (59 | ) | | | 894 | | | | (59 | ) |
| Limited partnership units of Brookfield Office Properties Exchange LP(1) | | | | | | | | | | | | | | | | | | | | |
| Net income | | | | | | | 48 | | | | ― | | | | 51 | | | | ― | |
| Other comprehensive income (loss) | | | | | | | 3 | | | | ― | | | | 3 | | | | ― | |
| | | | | | | | 51 | | | | ― | | | | 54 | | | | ― | |
| Interests of others in operating subsidiaries and properties(1) | | | | | | | | | | | | | | | | | | | | |
| Net income | | | | | | | 397 | | | | 325 | | | | 518 | | | | 572 | |
| Other comprehensive income (loss) | | | | | | | 53 | | | | (297 | ) | | | 55 | | | | (319 | ) |
| | | | | | | | 450 | | | | 28 | | | | 573 | | | | 253 | |
| Total comprehensive income (loss) | | | | | | $ | 1,401 | | | $ | (103 | ) | | $ | 1,883 | | | $ | 390 | |
| (1) | For periods subsequent to April 15, 2013. |
| (2) | For the periods prior to April 15, 2013. |
See accompanying notes to the condensed consolidated financial statements.
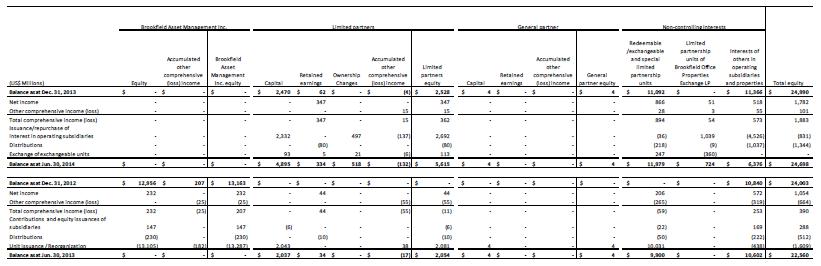
Brookfield Property Partners L.P.
Condensed Consolidated Statements of Changes in Equity
Brookfield Property Partners L.P.
Condensed Consolidated Statements of Cash Flows
| Unaudited | | | | | Six months ended Jun. 30, | |
| (US$ Millions) | | Note | | | 2014 | | | 2013 | |
| Operating activities | | | | | | | | | | | | |
| Net income | | | | | | $ | 1,782 | | | $ | 1,054 | |
| Share of equity accounted earnings, net of distributions | | | | | | | (130 | ) | | | (394 | ) |
| Fair value (gains) losses, net | | | 24 | | | | (1,582 | ) | | | (590 | ) |
| Deferred income tax expense | | | 14 | | | | 649 | | | | 318 | |
| Depreciation and amortization | | | 22 | | | | 76 | | | | 87 | |
| Working capital and other | | | | | | | (370 | ) | | | (308 | ) |
| | | | | | | | 425 | | | | 167 | |
| Financing activities | | | | | | | | | | | | |
| Debt obligations, issuance | | | | | | | 5,949 | | | | 3,518 | |
| Debt obligations, repayments | | | | | | | (4,232 | ) | | | (2,201 | ) |
| Capital securities redeemed | | | | | | | ― | | | | (201 | ) |
| Non-controlling interests, issued | | | | | | | 711 | | | | 90 | |
| Non-controlling interests, purchased | | | | | | | (1,538 | ) | | | ― | |
| Distributions to non-controlling interests in operating subsidiaries | | | | | | | (807 | ) | | | (224 | ) |
| Contributions from Brookfield Asset Management Inc. | | | | | | | ― | | | | 19 | |
| Distributions to Brookfield Asset Management Inc. | | | | | | | (218 | ) | | | (206 | ) |
| Distributions to unitholders of the operating partnership | | | | | | | (80 | ) | | | (60 | ) |
| Distributions to holders of Exchange LP units | | | | | | | (9 | ) | | | ― | |
| Distributions to general partnership unitholders | | | | | | | ― | | | | (1 | ) |
| | | | | | | | (224 | ) | | | 734 | |
| Investing activities | | | | | | | | | | | | |
| Investment properties, proceeds of dispositions | | | | | | | 629 | | | | 221 | |
| Investment properties, investments | | | | | | | (1,050 | ) | | | (805 | ) |
| Investment in equity accounted investments | | | | | | | ― | | | | (144 | ) |
| Proceeds from sale of investments | | | | | | | ― | | | | 114 | |
| Investments in associates, dispositions | | | | | | | 111 | | | | ― | |
| Investments in associates, additions | | | | | | | (33 | ) | | | ― | |
| Financial assets, dispositions | | | | | | | 1,182 | | | | 131 | |
| Financial assets, acquisitions | | | | | | | (1,035 | ) | | | ― | |
| Other property, plant and equipment, dispositions | | | | | | | 140 | | | | ― | |
| Other property, plant and equipment, investments | | | | | | | (20 | ) | | | ― | |
| Foreign currency hedges of net investments | | | | | | | ― | | | | (21 | ) |
| Loans and notes receivable, collected | | | | | | | ― | | | | 164 | |
| Loans and notes receivable, advanced | | | | | | | ― | | | | (119 | ) |
| Restricted cash and deposits | | | | | | | ― | | | | (18 | ) |
| Acquisitions of subsidiaries, net of disposition | | | | | | | (1 | ) | | | 54 | |
| Capital expenditures – development and redevelopment | | | | | | | ― | | | | (128 | ) |
| Capital expenditures – commercial properties | | | | | | | ― | | | | (167 | ) |
| | | | | | | | (77 | ) | | | (718 | ) |
| Cash and cash equivalents | | | | | | | | | | | | |
| Net change in cash and cash equivalents during the period | | | | | | | 124 | | | | 183 | |
| Effect of exchange rate fluctuations on cash and cash equivalents held in foreign currencies | | | | | | | 12 | | | | (26 | ) |
| Balance, beginning of period | | | | | | | 1,368 | | | | 894 | |
| Balance, end of period | | | | | | $ | 1,504 | | | $ | 1,051 | |
| | | | | | | | | | | | | |
| Supplemental cash flow information | | | | | | | | | | | | |
| Cash paid for: | | | | | | | | | | | | |
| Income taxes | | | | | | $ | 70 | | | $ | 57 | |
| Interest (excluding dividends on capital securities) | | | | | | $ | 570 | | | $ | 425 | |
See accompanying notes to the condensed consolidated financial statements.
Brookfield Property Partners L.P.
Notes to the Condensed Consolidated Financial Statements
| NOTE | 1. Organization and NATURE OF THE Business |
Brookfield Property Partners L.P. (“BPY” or the “partnership”) was formed as a limited partnership established under the laws of Bermuda, pursuant to a limited partnership agreement dated January 3, 2013, as amended and restated on August 8, 2013. BPY is a subsidiary of Brookfield Asset Management Inc. (“Brookfield Asset Management” or the “parent company”) and is the primary entity through which the parent company and its affiliates own, operate, and invest in commercial and other income producing property on a global basis.
The partnership’s sole material asset is a 34% managing general partnership unit interest in Brookfield Property L.P. (the “operating partnership”), which holds the partnership’s interest in commercial and other income producing property operations. Prior to August 8, 2013, the partnership’s interest in the operating partnership was comprised solely of a limited partnership interest in class A limited partnership units (the “Class A LP Units”) of the operating partnership. Effective August 8, 2013, the Class A LP Units were renamed managing general partner units. The managing general partner units provide the partnership with the power to direct the relevant activities of the operating partnership.
The partnership’s limited partnership units are listed and publicly traded on the New York Stock Exchange (“NYSE”) and the Toronto Stock Exchange (“TSX”) under the symbols ‘‘BPY’’ and ‘‘BPY.UN’’, respectively. The registered head office of the partnership is 73 Front Street, 5th Floor, Hamilton HM 12, Bermuda.
| NOTE | 2. Summary of significant accounting policies |
| a) | Statement of compliance |
The interim condensed consolidated financial statements of the partnership and its subsidiaries have been prepared in accordance with International Accounting Standard (“IAS”) 34,Interim Financial Reporting (“IAS 34”), as issued by the International Accounting Standards Board (“IASB”). Accordingly, certain information and footnote disclosures normally included in the consolidated financial statements prepared in accordance with International Financial Reporting Standards (“IFRS”) as issued by the IASB, have been omitted or condensed.
These condensed consolidated financial statements as of and for the three and six months ended June 30, 2014 were approved and authorized for issue by the Board of Directors of the partnership on August 6, 2014.
The interim condensed consolidated financial statements are prepared using the same accounting policies and methods as those used in the consolidated financial statements for the year ended December 31, 2013, except for the impact of adoption of the accounting standard described below. Consequently, the information included in these interim condensed consolidated financial statements should be read in conjunction with the consolidated financial statements and accompanying notes included in the partnership’s annual report on Form 20-F for the year ended December 31, 2013.
The interim condensed consolidated financial statements are unaudited and reflect all adjustments (consisting of normal recurring adjustments) which are, in the opinion of management, necessary for a fair statement of results for the interim periods presented in accordance with IFRS. The results reported in these interim condensed consolidated financial statements should not necessarily be regarded as indicative of results that may be expected for the entire year.
The interim condensed consolidated financial statements are prepared on a going concern basis and have been presented in U.S. dollars rounded to the nearest million unless otherwise indicated.
| c) | Change in operating segments |
In April 2014, the partnership realigned its operating segments as a result of changes to the organizational and governance structure of the partnership’s businesses to align the structures more closely with the nature of the partnership’s investments, such as the acquisition of additional interests in Brookfield Office Properties Inc. (“Brookfield Office Properties” or “BPO”). Such realignment gave rise to changes in how the partnership presents information for financial reporting and management decision-making purposes. Consequently, the partnership’s operating segments now consist of i) Office, ii) Retail, iii) Industrial, and iv) Multi-family and Hotels. All prior period segment disclosures have been recast to reflect changes in the partnership’s operating segments. Certain other prior year amounts have been reclassified to conform to the current year presentation. See Note 31,Segmented Information, for further discussion.
The preparation of the partnership’s interim condensed consolidated financial statements in accordance with IAS 34 requires the use of certain critical accounting estimates and assumptions. It also requires management to exercise judgment in applying the partnership’s accounting policies. The accounting policies and critical estimates and assumptions have been set out in Note 2,Significant Accounting Policies, to the partnership’s consolidated financial statements for the year ended December 31, 2013 and have been consistently applied in the preparation of the interim condensed consolidated financial statements as of and for the three and six months ended June 30, 2014.
| e) | Adoption of Accounting Standard |
In May 2013, the IASB issued IFRIC Interpretation 21,Levies (“IFRIC 21”), which was developed by the IFRS Interpretations Committee. The partnership adopted IFRIC 21 effective January 1, 2014. IFRIC 21 addresses when an entity should recognize a liability to pay a government levy other than income taxes. IFRIC 21 is an interpretation of IAS 37,Provisions, Contingent Liabilities and Contingent Assets (“IAS 37”). IAS 37 sets out criteria for the recognition of a liability, one of which requires an entity to have a present obligation as a result of a past event. IFRIC 21 clarifies that the obligating event that gives rise to a liability to pay a levy is the activity described in the relevant legislation that triggers the payment of the levy. The adoption of this guidance did not have any significant impact on the partnership’s interim condensed consolidated financial statements.
| f) | Continuity of interests |
On April 15, 2013, Brookfield Asset Management completed a spin-off of its commercial property operations (the “Business”) to the partnership (the “Spin-off”), which was effected by way of a special dividend of units of the partnership to holders of Brookfield Asset Management’s Class A and B limited voting shares as of March 26, 2013. Brookfield Asset Management directly and indirectly controlled the Business prior to the Spin-off and continues to control the partnership subsequent to the Spin-off through its interests in the partnership. As a result of this continuing common control, there is insufficient substance to justify a change in the measurement of the Business. Accordingly, the partnership has reflected the Business in its financial position and results of operations using Brookfield Asset Management’s carrying values prior to the Spin-off.
To reflect the continuity of interests, the interim condensed consolidated financial statements provide comparative information of the Business for the periods prior to the Spin-off, as previously reported by Brookfield Asset Management. The economic and accounting impact of contractual relationships created or modified in conjunction with the Spin-off have been reflected prospectively from the date of the Spin-off and have not been reflected in the results of operations or financial position of the partnership prior to April 15, 2013 as such items were in fact not created or modified prior thereto. Accordingly, the financial information for the periods prior to April 15, 2013 is presented based on the historical financial information for the contributed operations as previously reported by Brookfield Asset Management. For the periods after the Spin-off, the results are based on the actual results of the partnership, including the adjustments associated with the Spin-off and the execution of several new and amended agreements including management service and relationship agreements (see Note 29,Related Parties, for further discussion). Certain of these new or amended agreements resulted in differences in the basis of accounting as recorded by Brookfield Asset Management and as recorded by the partnership.
| NOTE | 3. ACQUISITION OF BROOKFIELD OFFICE PROPERTIES INC. |
As of December 31, 2013, the partnership’s interest in Brookfield Office Properties consisted of 49% of its outstanding common shares and 97% of its outstanding voting preferred shares. On February 12, 2014, the partnership and its indirect subsidiaries Brookfield Office Properties Exchange LP (“Exchange LP”) and Brookfield Property Split Corp. (“BOP Split”, and collectively with BPY and Exchange LP, the “Purchasers”), announced the commencement of the tender offer to acquire any or all of the common shares of Brookfield Office Properties that they did not already own (the “Offer”). Under the Offer, Brookfield Office Properties shareholders were able to elect to receive one BPY limited partnership unit or $20.34 in cash for each BPO common share rendered, subject in each case to pro-ration based on a maximum number of BPY limited partnership units and maximum cash consideration equating to approximately 67% and 33%, respectively, of the total number of BPO common shares subject to the Offer. BOP Split was incorporated as a wholly-owned subsidiary of Brookfield BPY Holdings Inc., a primary holding subsidiary of the partnership, to acquire common stock of BPO under the Offer and was established as a preferred share issuer.
Immediately after completion of the Offer, the Purchasers owned 92% of the outstanding BPO common shares. In June 2014, the Purchasers completed a subsequent acquisition of all the remaining BPO common shares by way of a plan of arrangement (the “Arrangement”) under Canadian corporate law. Pursuant to shareholder elections under the Arrangement, holders of BPO securities received the following consideration:
Pursuant to the terms of the Arrangement, BPO shareholders were able to receive either one limited partnership unit of BPY or $20.34 in cash for each BPO common share held, subject to pro-ration. Shareholders electing to receive BPY limited partnership units, or exchangeable limited partnership units of Exchange LP (the “Exchange LP Units”), received one limited partnership unit for each BPO common share tendered (or deemed tendered). Canadian BPO shareholders were given the option to receive, in lieu of BPY Units, Exchange LP units. Exchange LP Units are exchangeable at any time on a one-for-one basis, at the option of the holder, for BPY Units, subject to certain terms and applicable law. An Exchange LP Unit provides a holder thereof with economic terms which are substantially equivalent to those of a BPY Unit.
Holders of outstanding BPO Convertible Preference Shares series, which consist of the Class AAA Preference Shares, Series G, Series H, Series J, and Series K of BPO, were given the option to elect either:
| i. | to exchange their BPO Convertible Preference Shares for BOP Split senior preferred shares (“BOP Split Senior Preferred Shares”), subject to minimum listing requirements and a maximum of 1,000,000 BOP Split Senior Preferred Shares issued per series, pro-rated, or |
| ii. | to continue holding their BPO Convertible Preference Shares, the conditions of which were modified in order to provide for the BPO Convertible Preference Shares to be exchangeable into BPY limited partnership units rather than convertible into BPO common shares. |
| c) | Class A Voting Preferred Shares |
All Class A Series A and B voting preferred shares owned by BPO, other than those held by the Purchasers or their subsidiaries, were redeemed by BPO for cash.
Under IFRS 10,Consolidated Financial Statements, the buy-out of a non-controlling interest by a parent is accounted for as an equity transaction. As a result of the Offer and Arrangement, BPY owns 100% of the issued and outstanding common shares of BPO. Prior to the Arrangement, BPO was consolidated by BPY. Subsequent to the Arrangement, BPY will continue to consolidate BPO. In addition, and in accordance with IAS 32,Financial Instruments: Presentation(“IAS 32”), transaction costs associated with such a transaction are accounted for as a deduction of equity in the consolidated financial statements. As a result, the partnership deducted approximately $25 million from equity for the six months ended June 30, 2014.
| NOTE | 4. BUSINESS ACQUISITIONS AND COMBINATIONS |
The partnership accounts for business combinations using the acquisition method of accounting under IFRS 3,Business Combinations (“IFRS 3”), pursuant to which the cost of acquiring a business is allocated to its identifiable tangible and intangible assets and liabilities on the basis of the estimated fair values at the date of acquisition. The partnership completed the following acquisitions during the six months ended June 30, 2014. Financial results of each transaction are included within the partnership’s condensed consolidated statements of income from the dates of each acquisition.
In June 2014, the partnership acquired an additional 50% interest in KPMG Tower in Sydney for a net purchase price of approximately $130 million bringing its ownership in the property to 100%. The acquisition of the additional interest in KPMG Tower is accounted for as a business combination in accordance with IFRS 3 and KPMG Tower has been consolidated by the partnership since the acquisition date. Prior to the acquisition date, KPMG Tower was accounted for as an investment in joint operations.
In January 2014, the partnership purchased an additional 23.6% interest in Five Manhattan West (previously known as 450 West 33rd Street) for a net purchase price of $57 million, which includes cash consideration of $50 million and the settlement of a $7 million loan receivable. As a result, the partnership’s ownership in Five Manhattan West increased to 98.6%. The partnership has consolidated Five Manhattan West as a result of the business combination in accordance with IFRS 3 since the acquisition date, prior to which it was accounted for as an investment in joint venture under the equity method of accounting.
The following table summarizes the impact of significant acquisitions during the six months ended June 30, 2014 that resulted in consolidation:
(US$ Millions) | | Five Manhattan West(2) | | KPMG Tower | | Other Business Combinations | | Total |
| Cash and cash equivalents | $ | 54 | $ | ― | $ | ― | $ | 54 |
| Accounts receivable and other | | 3 | | ― | | 1 | | 4 |
| Investment properties | | 653 | | 130 | | 158 | | 941 |
| Total assets | | 710 | | 130 | | 159 | | 999 |
| Less: | | | | | | | | |
| Accounts payable and other liabilities | | (2) | | ― | | (1) | | (3) |
| Debt obligations | | (462) | | ― | | ― | | (462) |
| Non-controlling interests(1) | | (4) | | ― | | ― | | (4) |
| Net assets acquired | $ | 242 | $ | 130 | $ | 158 | $ | 530 |
| | | | | | | | | |
| Consideration | $ | 57 | $ | 130 | $ | 158 | $ | 345 |
| (1) | Includes non-controlling interests recognized on business combinations measured as the proportionate share of fair value of the assets and liabilities on the date of acquisition. |
| (2) | Consideration for the acquisition of Five Manhattan West is before considering the existing investment in joint venture accounted for under the equity method of accounting. |
In the period from the acquisition date to June 30, 2014, the partnership recorded revenue and net income in connection with these acquisitions of approximately $26 million and $3 million, respectively. If the acquisitions had occurred on January 1, 2014, the partnership’s total revenue and net income would have been $2,312 million and $1,789 million, respectively, for the six months ended June 30, 2014.
Acquisition-related costs, which primarily relates to legal and consulting fees, are expensed as incurred in accordance with IFRS 3 and are included in administration and other expense on the condensed consolidated statements of income.
| NOTE | 5. iNVESTMENT PROPERTIES |
The following table is a roll forward of investment property balances for the six months ended June 30, 2014 and the year ended December 31, 2013:
| | | |
| | Six months ended Jun. 30, 2014 | Year ended Dec. 31, 2013 |
| | Commercial properties | Commercial developments | Total | Commercial properties | Commercial developments | Total |
| (US$ Millions) |
| Balance, beginning of period | $ | 31,679 | $ | 2,474 | $ | 34,153 | $ | 30,211 | $ | 1,485 | $ | 31,696 |
| Additions: | | | | | | | | | | | | |
| Property acquisitions | | 1,284 | | 331 | | 1,615 | | 4,224 | | 637 | | 4,861 |
| Capital expenditures | | 23 | | 68 | | 91 | | 514 | | 490 | | 1,004 |
| Property dispositions(1) | | (1,182) | | (48) | | (1,230) | | (1,340) | | (193) | | (1,533) |
| Fair value gains (losses), net | | 1,145 | | 151 | | 1,296 | | 805 | | 143 | | 948 |
| Change in presentation on Spin-off(2) | | ― | | ― | | ― | | (1,421) | | ― | | (1,421) |
| Change in basis of presentation(3) | | ― | | ― | | ― | | (175) | | (36) | | (211) |
| Foreign currency translation | | 344 | | 41 | | 385 | | (1,264) | | (66) | | (1,330) |
| Other | | 148 | | 53 | | 201 | | 125 | | 14 | | 139 |
| Balance, end of period | $ | 33,441 | $ | 3,070 | $ | 36,511 | $ | 31,679 | $ | 2,474 | $ | 34,153 |
| (1) | Property dispositions represent the carrying value on date of sale. |
| (2) | Certain investment properties have been reclassified to equity accounted investments and participating loan notes to reflect the accounting impact of contractual relationships created or modified in conjunction with the Spin-off. |
| (3) | Due to the reorganization of ownership interests between the partnership and Brookfield Asset Management in 2013, certain operating and development assets have been reclassified to/from equity accounted investments, as they were held through entities that the partnership previously consolidated and are now equity accounted investments. |
The partnership’s investment properties balance consists of both commercial properties and commercial developments. The partnership determines the fair value of each commercial property based upon, among other things, rental income from current leases and assumptions about rental income from future leases reflecting market conditions at the applicable balance sheet dates, less future cash outflows (including rental payments and other outflows) in respect of such leases. Where available, the partnership determines the fair value of commercial properties based on recent sales of similar property in the same location and condition and subject to a similar leasing profile. Where comparable current sales in an active market do not exist, the partnership considers information from a variety of sources, including: i) discounted cash flows based on reliable estimates of future cash flows, supported by the terms of existing lease and other contracts, and evidence such as current market rents for similar properties in the same location and condition, using discount rates to reflect uncertainty in the amount and timing of the cash flows; ii) recent prices of similar properties in less active markets, with adjustments to reflect any change in economic conditions since the date of the observed transactions that occurred at those prices, including market rents and discount or capitalization rates; and iii) current prices in an active market for properties of a different nature, condition or location, including differences in leasing and other contracts.
In certain cases, these sources will suggest different conclusions about the fair value of an investment property. In such cases, the partnership considers the reasons for any such differences in validating the most reliable estimate of fair value. Investment property valuations are completed by undertaking one of two accepted income approach methods, which include either: i) discounting the expected future cash flows, generally over a term of 10 years including a terminal value based on the application of a capitalization rate to estimated year 11 cash flows; or ii) undertaking a direct capitalization approach whereby a capitalization rate is applied to estimated current year cash flows. Fair values are primarily determined by discounting the expected future cash flows as opposed to the direct capitalization approach. In determining the appropriateness of the methodology applied, the partnership considers the relative uncertainty of the timing and amount of expected cash flows and the impact such uncertainty would have in arriving at a reliable estimate of fair value. In circumstances where there is low uncertainty as to the timing and amount of expected cash flows, which is primarily due to the lease profile, maturity and the market in which the property is located, a discounted cash flow approach is applied.
Commercial developments are also measured using a discounted cash flow model, net of costs to complete, as of the balance sheet date. Development sites in the planning phases are measured using comparable market values for similar assets.
In accordance with its policy, the partnership measures and records its commercial properties and developments using valuations prepared by management. The partnership does not measure or record its properties based on valuations prepared by external valuation professionals.
Values are most sensitive to changes in discount rates and timing or variability of cash flows. The key valuation metrics for the partnership’s consolidated commercial properties and equity accounted investments are set forth in the following tables below on a weighted-average basis:
| | | Jun. 30, 2014 | Dec. 31, 2013 |
Consolidated Properties | Primary valuation method | Discount Rate | Terminal Capitalization Rate | Investment Horizon (yrs.) | Discount Rate | Terminal Capitalization Rate | Investment Horizon (yrs.) | |
| | | | | | | | | |
| Office | | | | | | | | |
| United States | Discounted cash flow | 7.4% | 6.1% | 11 | 7.5% | 6.3% | 11 | |
| Canada | Discounted cash flow | 6.4% | 5.7% | 11 | 6.4% | 5.7% | 11 | |
| Australia | Discounted cash flow | 8.3% | 7.1% | 10 | 8.4% | 7.2% | 10 | |
| Europe | Discounted cash flow | 6.7% | 5.3% | 10 | 6.7% | 5.3% | 10 | |
| Retail | | | | | | | | |
| Brazil | Discounted cash flow | 9.0% | 7.2% | 10 | 9.0% | 7.2% | 10 | |
| Australia | Discounted cash flow | 10.5% | 12.0% | 10 | 10.3% | 9.5% | 10 | |
| Industrial | Discounted cash flow | 8.2% | 7.6% | 10 | 8.9% | 7.7% | 10 | |
| Multi-family(1) | Direct capitalization | 5.8% | n/a | n/a | 6.0% | n/a | n/a | |
| (1) | The valuation method used to value multi-family properties is the direct capitalization method. The rates presented as the discount rate relate to the overall implied capitalization rate. The terminal capitalization rate and investment horizon are not applicable. |
| | | Jun. 30, 2014 | Dec. 31, 2013 |
Equity Accounted Investments(1) | Primary valuation method | Discount Rate | Terminal Capitalization Rate | Investment Horizon (yrs.) | Discount Rate | Terminal Capitalization Rate | Investment Horizon (yrs.) |
| | | | | | | | |
| Office | | | | | | | |
| United States | Discounted cash flow | 6.4% | 5.6% | 9 | 6.6% | 5.9% | 9 |
| Australia | Discounted cash flow | 8.6% | 7.3% | 10 | 8.7% | 7.3% | 10 |
| Retail | | | | | | | |
| United States | Discounted cash flow | 7.6% | 5.8% | 10 | 7.6% | 5.8% | 10 |
| Industrial | Discounted cash flow | 7.4% | 6.7% | 10 | 7.8% | 7.0% | 10 |
| Multi-family(2) | Direct capitalization | 5.6% | n/a | n/a | 5.6% | n/a | n/a |
| (1) | See Note 6 for further discussion on the partnership’s equity accounted investments. |
| (2) | The valuation method used to value multi-family investments is the direct capitalization method. The rates presented as the discount rate relates to the overall implied capitalization rate. The terminal capitalization rate and investment horizon are not applicable. |
| NOTE | 6. EQUITY ACCOUNTED INVESTMENTS |
The partnership has investments in joint arrangements that are joint ventures, and also has investments in associates. Joint ventures hold individual commercial properties and developments that the partnership owns together with co-owners where decisions relating to the relevant activities of the joint venture require the unanimous consent of the co-owners.
Details of the partnership’s investments in joint ventures and associates, which have been accounted for following the equity method, are as follows:
| | | | Proportion of Ownership Interests/ Voting Rights Held by the Partnership | | Carrying value |
(US$ Millions) | Principal Activity | Principal Place of Business | Jun. 30, 2014 | Dec. 31, 2013 | | Jun. 30, 2014 | | Dec. 31, 2013 |
| Joint Ventures | | | | | | | | |
| 245 Park Avenue, New York | Property holding company | United States | 51% | 51% | $ | 680 | $ | 653 |
| Grace Building, New York | Property holding company | United States | 50% | 50% | | 513 | | 695 |
| Five Manhattan West, New York (1) | Property holding company | United States | n/a | 75% | | ― | | 191 |
| E&Y Complex, Sydney | Property holding company | Australia | 50% | 50% | | 247 | | 236 |
| Republic Plaza(2) | Property holding company | United States | 50% | n/a | | 99 | | ― |
| Other | Various | Various | 12%-83% | 13%-83% | | 866 | | 906 |
| | | | | | 2,405 | | 2,681 |
| Associates | | | | | | | | |
| General Growth Properties, Inc. (“GGP”) | Real Estate Investment Trust | United States | 29% | 28% | | 6,307 | | 6,044 |
| Rouse Properties, Inc. (“Rouse”) | Real Estate Investment Trust | United States | 34% | 39% | | 415 | | 399 |
| Other | Various | Various | 24%-42% | 24%-42% | | 172 | | 157 |
| | | | | | | 6,894 | | 6,600 |
| Total equity accounted investments | | | | | $ | 9,299 | $ | 9,281 |
| (1) | See Note 4 for further discussion. |
| (2) | At December 31, 2013, Republic Plaza was consolidated and presented at fair value within investment properties on the condensed consolidated balance sheet as the partnership’s ownership of the property, through BPO, was 100%. See below for further discussion. |
In April 2014, BPO sold 50% of its interest in Republic Plaza, which is located in Denver, Colorado, through the establishment of a 50/50 joint venture partnership for approximately $98 million. Republic Plaza was previously consolidated within investment properties on the condensed consolidated balance sheet. BPO continues to retain joint control of the resulting joint venture in accordance with IFRS 11,Joint Arrangements, and as of the sale date, recorded and presented Republic Plaza as an equity accounted investment on the condensed consolidated balance sheet at $98 million. BPO has retained management and leasing responsibilities at Republic Plaza.
The fair value of the common shares of GGP held by the partnership based on the trading price of GGP common stock as of June 30, 2014 is $6 billion (December 31, 2013 - $5 billion). The fair value of the common shares of Rouse held by the partnership based on the trading price of Rouse common stock as of June 30, 2014 is $332 million (December 31, 2013 - $430 million). There are no quoted market prices for the partnership’s other equity accounted investments.
Summarized financial information in respect of the partnership’s equity accounted investments is provided below:
| (US$ Millions) | | Jun. 30, 2014 | | | Dec. 31, 2013 | |
| Non-current assets | | $ | 50,798 | | | $ | 49,681 | |
| Current assets | | | 1,959 | | | | 1,695 | |
| Total assets | | $ | 52,757 | | | $ | 51,376 | |
| Non-current liabilities | | | 22,170 | | | | 20,945 | |
| Current liabilities | | | 1,609 | | | | 2,325 | |
| Total liabilities | | | 23,779 | | | | 23,270 | |
| Net assets | | $ | 28,978 | | | $ | 28,106 | |
| Partnership’s share of net assets | | $ | 9,299 | | | $ | 9,281 | |
| | | Three months ended Jun. 30, | | | Six months ended Jun. 30, | |
| (US$ Millions) | | 2014 | | | 2013 | | | 2014 | | | 2013 | |
| Revenue | | $ | 1,000 | | | $ | 1,074 | | | $ | 2,013 | | | $ | 2,283 | |
| Expense | | | 393 | | | | 795 | | | | 945 | | | | 1,589 | |
| Income before fair value gains, net | | | 607 | | | | 279 | | | | 1,068 | | | | 694 | |
| Fair value gains, net | | | 349 | | | | 92 | | | | 618 | | | | 556 | |
| Net income | | | 956 | | | | 371 | | | | 1,686 | | | | 1,250 | |
| Partnership’s share of net earnings | | $ | 301 | | | $ | 162 | | | $ | 529 | | | $ | 394 | |
| | | | | | | | | | | | | | | | | |
| NOTE | 7. Participating loan interests |
Participating loan interests represent interests in certain properties in Australia that do not provide the partnership with control over the entity that owns the underlying property and are accounted for as loans and receivables and held at amortized cost on the condensed consolidated balance sheets. The instruments, which are receivable from a wholly-owned subsidiary of Brookfield Asset Management, have contractual maturity dates of September 26, 2020 and February 1, 2023, subject to the partnership’s prior right to convert into direct ownership interests in the underlying commercial properties, and have contractual interest rates that vary with the results of operations of those properties.
The outstanding principal of the participating loan interests relates to the following properties:
| (US$ Millions) | Participation Interest | | | | | |
| Name of Property | Maturity | | Jun. 30, 2014 | | Dec. 31, 2013 |
| Darling Park Complex, Sydney | 30% | Sep. 26, 2020 | $ | 175 | $ | 161 |
| IAG House, Sydney | 50% | Sep. 26, 2020 | | 117 | | 110 |
| NAB House, Sydney(1) | ― | Sep. 26, 2020 | | ― | | 105 |
| Bourke Place Trust, Melbourne | 43% | Sep. 26, 2020 | | 194 | | 174 |
| Jessie Street, Sydney | 100% | Feb. 1, 2023 | | 150 | | 130 |
| Fujitsu Centre, Sydney(2) | ― | Feb. 1, 2023 | | ― | | 30 |
| Infrastructure House, Canberra | 100% | Feb. 1, 2023 | | 40 | | 37 |
| Total participating loan interests | | | $ | 676 | $ | 747 |
| (1) | During the first quarter of 2014, BPO sold its 25% participating interest in NAB House in Sydney for approximately $105 million in net proceeds. |
| (2) | During the second quarter of 2014, the partnership sold its economic interest in Fujitsu Centre for approximately $33 million in net proceeds. |
Included in the balance of participating loan interests is an embedded derivative representing the partnership’s right to participate in the changes in the fair value of the referenced properties. The embedded derivative is measured at fair value with changes in fair value reported through earnings in fair value gains, net on the condensed consolidated statements of income. The carrying value of the embedded derivative as at June 30, 2014 is $47 million (December 31, 2013 - $56 million).
For the three and six month periods ended June 30, 2014, the partnership recognized interest income on the participating loan interests of $13 million (2013 – $13 million) and $27 million (2013 – $13 million), respectively, and fair value gains of $19 million (2013 – $22 million) and $15 million (2013 – $22 million), respectively.
Summarized financial information in respect of the properties underlying the partnership’s investment in participating loan interests is set out below:
| (US$ Millions) | | Jun. 30, 2014 | | | Dec. 31, 2013 | |
| Non-current assets | | $ | 2,327 | | | $ | 2,678 | |
| Current assets | | | 58 | | | | 53 | |
| Total assets | | | 2,385 | | | | 2,731 | |
| Non-current liabilities | | | 648 | | | | 363 | |
| Current liabilities | | | 22 | | | | 660 | |
| Total liabilities | | | 670 | | | | 1,023 | |
| Net assets | | $ | 1,715 | | | $ | 1,708 | |
| | | Three months ended Jun. 30, | | | Six months ended Jun. 30, | |
| (US$ Millions) | | 2014 | | | 2013 | | | 2014 | | | 2013 | |
| Revenues | | $ | 52 | | | $ | 62 | | | $ | 104 | | | $ | 62 | |
| Expenses | | | 23 | | | | 28 | | | | 49 | | | | 28 | |
| Earnings before fair value gains, net | | | 29 | | | | 34 | | | | 55 | | | | 34 | |
| Fair value gains, net | | | 24 | | | | 44 | | | | 20 | | | | 44 | |
| Net earnings | | $ | 53 | | | $ | 78 | | | $ | 75 | | | $ | 78 | |
Hotel assets primarily consist of the partnership’s hotel properties received as part of the acquisitions of Paradise Island Holdings Limited (“Atlantis”) and BREF HR, LLC (“Hard Rock”). Hotel assets are presented on a cost basis, net of accumulated fair value changes and accumulated depreciation. Accumulated fair value changes include unrealized revaluations of hotel assets using the revaluation method, which are recorded in revaluation surplus as a component of equity, as well as unrealized impairment losses recorded in net income. The partnership determines the fair value of these assets on an annual basis as of December 31 by discounting the expected future cash flows using internal valuations.
The following table presents the change to the components of the partnership’s hotel assets from the beginning of the year:
| (US$ Millions) | | Jun. 30, 2014 | | | Dec. 31, 2013 | |
| Cost | | | | | | | | |
| Balance, beginning of the period | | $ | 2,569 | | | $ | 3,129 | |
| Net additions (dispositions) | | | (133 | ) | | | 133 | |
| Foreign exchange translation | | | ― | | | | (85 | ) |
| Change in basis of presentation(1) | | | ― | | | | (608 | ) |
| | | | 2,436 | | | | 2,569 | |
| Accumulated fair value changes | | | | | | | | |
| Balance, beginning of the period | | | 129 | | | | 1 | |
| Increase from revaluation | | | ― | | | | 138 | |
| Provision for impairment | | | ― | | | | (7 | ) |
| Disposals | | | ― | | | | (3 | ) |
| | | | 129 | | | | 129 | |
| Accumulated depreciation | | | | | | | | |
| Balance, beginning of the period | | | (266 | ) | | | (160 | ) |
| Depreciation | | | (56 | ) | | | (125 | ) |
| Change in basis of presentation(1) | | | ― | | | | 19 | |
| | | | (322 | ) | | | (266 | ) |
| Total hotel assets | | $ | 2,243 | | | $ | 2,432 | |
| (1) | Certain hotel assets in Australia, which are held through an entity which was previously consolidated by the partnership through September 29, 2013, have been reclassified to equity accounted investments as of September 30, 2013. |
| NOTE | 9. OTHER NON-CURRENT ASSETS |
The components of other non-current assets are as follows:
| (US$ Millions) | | Jun. 30, 2014 | | | Dec. 31, 2013 | |
| Securities designated as fair value through profit or loss (“FVTPL”) | | $ | 1,799 | | | $ | 1,068 | |
| Derivative assets | | | 1,104 | | | | 868 | |
| Securities designated as available-for-sale (“AFS”) | | | 151 | | | | 124 | |
| Goodwill | | | 128 | | | | 120 | |
| Other | | | 407 | | | | 622 | |
| Total other non-current assets | | $ | 3,589 | | | $ | 2,802 | |
| a) | Securities designated as FVTPL |
Securities designated as FVTPL are financial assets that are stated at fair value on the consolidated balance sheets, with any gains or losses arising on remeasurement recognized in fair value gains, net on the consolidated statements of income.
Securities designated as FVTPL primarily includes the partnership’s 22% common equity interest in Canary Wharf Group plc (“Canary Wharf”), a privately held commercial property investment and development company in the United Kingdom, and a $500 million investment in preferred equity of China Xintiandi (“CXTD”), an entity whose common equity is wholly-owned by Hong Kong listed developer Shui On Land. CXTD owns Shui On Land’s portfolio of retail and office properties in Shanghai.
The partnership has determined that it does not exercise significant influence over these aforementioned entities.
Derivative assets include the carrying amount of warrants to purchase shares of common stock of GGP with a carrying amount of $1,074 million (December 31, 2013 - $868 million). The fair value of the GGP warrants as of June 30, 2014 was determined using a Black-Scholes option pricing model, assuming a 3.4 year term (December 31, 2013 - 3.9 year term), 51% volatility (December 31, 2013 - 51% volatility), and a risk free interest rate of 1.00% (December 31, 2013 - 1.49%).
| c) | Securities designated as AFS |
Securities designated as AFS are financial assets that are stated at fair value on the condensed consolidated balance sheets, with any fair value gains or losses recognized in other comprehensive income and reclassified to net income upon sale or impairment.
At June 30, 2014 securities designated as AFS includes $106 million (December 31, 2013 – $105 million) which represents the partnership’s 10% common equity interest and $92 million preferred equity interest in 1625 Eye Street in Washington, D.C. The preferred equity securities, bearing a fixed dividend of 6.50%, are redeemable by the issuer at par in 2016 and are pledged as security for a loan payable to the issuer in the amount of $92 million (December 31, 2013 – $92 million) recognized in other non-current financial liabilities.
Securities designated as AFS also includes $30 million as of June 30, 2014 which represents the partnership’s 10% common equity interest in Heritage Plaza in Houston that resulted from the disposition of a 41% interest, net of a 49% non-controlling interest, in the property during the first quarter of 2014. The 49% non-controlling interest previously consolidated was also disposed of.
Goodwill represents a portfolio premium recognized in connection with the historical purchase of the partnership’s Brazilian retail assets. The partnership performs an annual goodwill impairment test during the fourth quarter of the fiscal year using carrying amounts as of December 31. Should certain events or indicators of impairment occur between annual impairment tests, the partnership will perform the impairment test as those events or indicators occur. The partnership assesses goodwill impairment at the cash generating unit level.
Other primarily includes the partnership’s finite-lived intangible assets which are presented on a cost basis, net of accumulated amortization and accumulated impairment losses on the condensed consolidated balance sheets. These intangible assets primarily represent the trademark and licensing assets acquired as part of the acquisitions of Atlantis and Hard Rock. Intangible assets with indefinite useful lives and intangible assets not yet available for use are tested for impairment at least annually, and whenever there is an indication that the asset may be impaired. As of June 30, 2014, the amount of accumulated amortization related to the finite-lived intangible assets was approximately $55 million (December 31, 2013 - $43 million).
| | | |
| NOTE | 10.LOANS AND NOTES RECEIVABLE |
Loans and notes receivable are financial assets that are carried at amortized cost on the consolidated balance sheets with interest income recognized following the effective interest method on the consolidated statements of income. Notes receivables purchased at a discount are also carried at amortized cost with discounts amortized over the remaining expected life of the loan following the effective interest method. A loan is considered impaired when, based upon current information and events, it is probable that the partnership will be unable to collect all amounts due for both principal and interest according to the contractual terms of the loan agreement. Loans are evaluated individually for impairment given the unique nature and size of each loan. On a quarterly basis, the partnership’s subsidiaries perform a quarterly review of all collateral properties underlying the loans receivable for each collateralized loan. There is no impairment of loans and notes receivable for the three and six month periods ended June 30, 2014.
Loans and notes receivable are generally secured by commercial and other income producing property.
| (US$ Millions) | Interest Rate | Maturity Date | Jun. 30, 2014 | Dec. 31, 2013 |
| Fixed rate | 2.5% - 15.0% | On demand/sale | $ | 7 | $ | 21 |
| Variable rate | 3M Euribor + 2.5% (50%); 3M Euribor + 4% (50%); Bank Rate + 2.0% | On demand / completion of construction | | 92 | | 607 |
| Non-interest bearing | | | | 95 | | ― |
| | | | $ | 194 | $ | 628 |
| | | | | | | |
| Current | | | $ | 87 | $ | 608 |
| Non-current | | | | 107 | | 20 |
| Total loans and notes receivable | | | $ | 194 | $ | 628 |
In the second quarter of 2014, notes receivable denominated in Euros and carried at amortized cost were repaid to the partnership for cash at par value plus accrued interest.
NOTE 11.ACCOUNTS RECEIVABLE AND OTHER
The components of accounts receivable and other are as follows:
| (US$ Millions) | | | | | | Jun. 30, 2014 | Dec. 31, 2013 |
| Accounts receivable(1) | | | | | | $ | 530 | $ | 386 |
| Restricted cash and deposits | | | | | | | 337 | | 337 |
| Other current assets | | | | | | | 238 | | 312 |
| Total accounts receivable and other | | | | | | $ | 1,105 | $ | 1,035 |
| (1) | See Note 29, Related Parties, for further discussion. |
Restricted cash and deposits are considered restricted when they are subject to contingent rights of third parties that prevent the assets’ use for current purposes.
The partnership’s debt obligations include the following:
| | Jun. 30, 2014 | Dec. 31, 2013 |
(US$ Millions) | Weighted-Average Rate | | Debt Balance | Weighted-Average Rate | | Debt Balance |
| Unsecured facilities | | | | | | |
| Brookfield Office Properties’ revolving facility | 2.6% | $ | 675 | 3.5% | $ | 336 |
| Brookfield Office Properties’ senior unsecured notes | 4.2% | | 325 | 4.2% | | 327 |
| Brookfield Property Partners’ credit facility | 2.5% | | 2,430 | 3.0% | | 496 |
| | | | | | | |
| Funds subscription credit facility | 1.8% | | 121 | 1.8% | | 645 |
| | | | | | | |
| Secured debt obligations | | | | | | |
| Fixed rate | 5.4% | | 10,745 | 5.1% | | 10,077 |
| Variable rate | 4.5% | | 9,299 | 3.9% | | 9,759 |
| Total debt obligations | | $ | 23,595 | | $ | 21,640 |
| | | | | | | |
| Current | | $ | 3,422 | | $ | 5,120 |
| Non-current | | | 20,173 | | | 16,520 |
| Total debt obligations | | $ | 23,595 | | $ | 21,640 |
Debt obligations include foreign currency denominated debt in the functional currencies of the borrowing subsidiaries. Debt obligations by currency are as follows:
| (US$ Millions) | Jun. 30, 2014 | Dec. 31, 2013 |
U.S. Dollars | Local Currency | U.S. Dollars | Local Currency |
| U.S. dollars | $ | 16,286 | $ | 16,286 | $ | 15,047 | $ | 15,047 |
| Canadian dollars | | 3,071 | C$ | 3,277 | | 2,845 | C$ | 3,022 |
| Australian dollars | | 2,092 | A$ | 2,218 | | 1,711 | A$ | 1,919 |
| Brazilian reais | | 787 | R$ | 1,733 | | 743 | R$ | 1,740 |
| British pounds | | 1,170 | £ | 684 | | 1,021 | £ | 617 |
| Euros | | 189 | € | 138 | | 273 | € | 199 |
| Total debt obligations | $ | 23,595 | | | $ | 21,640 | | |
| NOTE | 13.cAPITAL sECURITIES |
The partnership has the following capital securities outstanding as of June 30, 2014 and December 31, 2013:
| (US$ Millions, except where noted) | | Shares
Outstanding | | | Cumulative Dividend Rate | | | Jun. 30, 2014 | | | Dec. 31, 2013 | |
| Class B Junior Preferred Shares | | | 30,000,000 | | | | 5.75 | % | | $ | 750 | | | $ | 750 | |
| Class C Junior Preferred Shares | | | 20,000,000 | | | | 6.75 | % | | | 500 | | | | 500 | |
| BPO Class AAA Preferred Shares: | | | | | | | | | | | | | | | | |
| Series G(1) | | | 3,400,000 | | | | 5.25 | % | | | 85 | | | | 110 | |
| Series H(1) | | | 7,000,000 | | | | 5.75 | % | | | 164 | | | | 188 | |
| Series J(1) | | | 7,000,000 | | | | 5.00 | % | | | 164 | | | | 188 | |
| Series K(1) | | | 5,000,000 | | | | 5.20 | % | | | 118 | | | | 142 | |
| BOP Split Senior Preferred Shares: | | | | | | | | | | | | | | | | |
| Series 1 | | | 1,000,000 | | | | 5.25 | % | | | 24 | | | | – | |
| Series 2 | | | 1,000,000 | | | | 5.75 | % | | | 23 | | | | – | |
| Series 3 | | | 1,000,000 | | | | 5.00 | % | | | 23 | | | | – | |
| Series 4 | | | 1,000,000 | | | | 5.20 | % | | | 24 | | | | – | |
| Capital Securities – Fund Subsidiaries(2) | | | – | | | | – | | | | 572 | | | | 491 | |
| Total capital securities | | | | | | | | | | $ | 2,447 | | | $ | 2,369 | |
| | | | | | | | | | | | | | | | | |
| Current | | | | | | | | | | $ | 187 | | | $ | 188 | |
| Non-current | | | | | | | | | | | 2,260 | | | | 2,181 | |
| Total capital securities | | | | | | | | | | $ | 2,447 | | | $ | 2,369 | |
| (1) | Subsequent to the privatization of BPO on June 9, 2014, Brookfield Property Split Corp. owns 1,000,000 shares of each Series G, Series H, Series J and Series K capital securities, which has been reflected as a reduction in outstanding shares of each series of the BPO Class AAA Preferred Shares. |
| (2) | The Capital Securities - Fund Subsidiaries represent the equity interests in Brookfield DTLA Holdings LLC (“DTLA”) held by co-investors in the fund which have been classified as a liability, rather than as non-controlling interest, as holders of these interests can cause DTLA to redeem their interests in the fund for cash equivalent to the fair value of the interests on October 15, 2023, and on every fifth anniversary thereafter. Capital securities – fund subsidiaries are measured at redemption amount. |
The terms of BPO’s Class AAA Preferred Shares, Series G, H, J and K, have been amended such that these shares are exchangeable into BPY units and no longer convertible into BPO common stock. As discussed previously, in connection with the Arrangement, holders of such securities were given the option, subject to an overall limit of 1,000,000 shares per series and certain other conditions, to exchange their BPO Convertible Preference Shares for BPO Split Senior Preferred Shares. Subsequent to the Arrangement, 1,000,000 such shares of each series were issued in exchange for the same number of BPO Convertible Preference Shares, which are now held by BOP Split.
Capital securities includes $516 million (December 31, 2013 – $518 million) repayable in Canadian dollars of C$550 million (December 31, 2013 – C$550 million).
Cumulative preferred dividends on the capital securities are payable quarterly, as and when declared by the Board of Directors of Brookfield BPY Holdings Inc. and BPO. On April 24, 2014 the Board of Directors of BPO declared quarterly dividends payable for the Class AAA Series G, H, J and K preferred shares.
As stated in Note 3, holders of outstanding BPO Convertible Preference Shares series were given the option to elect to exchange their BPO Convertible Preference shares for BOP Split Senior Preferred Shares. In accordance with IAS 32 and IAS 1,Presentation of Financial Statements, the BOP Split Senior Preferred Shares are presented as current liabilities within capital securities on the condensed consolidated balance sheets as there is a contractual obligation to deliver cash as well as a retraction provision that permits holders of each series of shares to retract the BOP Split Senior Preferred Shares at any time.
The holders of each series of the BOP Split Senior Preferred Shares are each entitled to receive fixed cumulative preferential cash dividends, if, as and when declared by the Board of Directors of BOP Split. Dividends on each series of the BOP Split Senior Preferred Shares accrue daily from the date of issue (less any tax required to be deducted and withheld by BOP Split) and are payable quarterly on the last day of March, June, September and December in each year. The first dividend paid on the BOP Split Senior Preferred Shares will be for the full quarter ended September 30, 2014. The first dividend on the BOP Split Senior Preferred Shares issued pursuant to the Arrangement will be calculated as if the BOP Split Senior Preferred Shares were issued on July 1, 2014, regardless of the date that such shares were actually issued.
The partnership is a flow-through entity for tax purposes and as such is not subject to Bermudian taxation. However, income taxes are recognized for the amount of taxes payable by the primary holding subsidiaries of the partnership (“Holding Entities”), any direct or indirect corporate subsidiaries of the Holding Entities, and for the impact of deferred tax assets and liabilities related to such entities.
The major components of income tax expense include the following:
| | | Three months ended Jun. 30, | | | Six months ended Jun. 30, | |
| (US$ Millions) | | 2014 | | | 2013 | | | 2014 | | | 2013 | |
| Current income tax (recovery) | | $ | 13 | | | $ | (47 | ) | | $ | 40 | | | $ | (23 | ) |
| Deferred income tax | | | 256 | | | | 243 | | | | 649 | | | | 318 | |
| Income tax expense | | $ | 269 | | | $ | 196 | | | $ | 689 | | | $ | 295 | |
The increase in income tax expense relates primarily to increased revenue, deferred taxes due to a change in legislation, which affects the rate at which some of the partnership’s temporary differences will be taxed and an increase in deferred taxes relating to the purchase of additional interest in BPO.
| NOTE | 15.aCCOUNTS PAYABLE AND OTHER LIABILITIES |
The components of accounts payable and other liabilities are as follows:
| (US$ Millions) | | Jun. 30, 2014 | | | Dec. 31, 2013 | |
| Accounts payable and accrued liabilities | | $ | 1,642 | | | $ | 1,541 | |
| Other liabilities | | | 194 | | | | 124 | |
| Total accounts payable and other liabilities | | $ | 1,836 | | | $ | 1,665 | |
Included in accounts payable and other liabilities are derivative liabilities with a carrying amount of $191 million at June 30, 2014 (December 31, 2013 – $128 million).
NOTE 16.eQUITY
The partnership’s capital structure is comprised of five classes of partnership units: general partnership units (“GP Units”) and limited partnership units (“LP Units”), redeemable/exchangeable partnership units of the operating partnership (“Redeemable/Exchangeable Partnership Units”), special limited partnership units of the operating partnership (“Special LP Units”), and limited partnership units of Exchange LP (“Exchange LP Units”). Prior to the Spin-off, equity otherwise not attributable to interests of others in operating subsidiaries and properties had been allocated to Brookfield Asset Management.
| a) | General and limited partnership equity |
GP units entitle the holder the right to govern the financial and operating policies of the partnership. The GP units are entitled to a 1% general partnership interest, equity enhancement distributions and incentive distributions from the operating partnership. The managing general partner of BPY is Brookfield Property Partners Limited, a wholly-owned subsidiary of Brookfield Asset Management.
LP Units entitle the holder to their proportionate share of distributions and are listed and publicly traded on the NYSE and the TSX. Each LP Unit entitles the holder thereof to one vote for the purposes of any approval at a meeting of limited partners, provided that holders of the Redeemable/Exchangeable Partnership Units that are exchanged for LP Units will only be entitled to a maximum number of votes in respect of the Redeemable/Exchangeable Partnership Units equal to 49% of the total voting power of all outstanding units.
GP units and LP Units outstanding are as follows:
| | General partnership units | Limited partnership units | Total |
| (Thousands of units) | Jun. 30, 2014 | Dec. 31,
2013 | Jun. 30,
2014 | Dec. 31,
2013 | Jun. 30,
2014 | Dec. 31,
2013 |
| Outstanding, beginning of period | 139 | – | 102,522 | – | 102,661 | – |
| Issued on Spin-off | – | 139 | – | 80,091 | – | 80,230 |
Issued on November 1, 2013 for the acquisition of incremental interest in GGP | – | – | – | 22,431 | – | 22,431 |
Issued on March 20, April 1, and June 9 2014 for the acquisition of incremental BPO shares | – | – | 124,871 | – | 124,871 | – |
| Exchange LP Units exchanged | – | – | 15,906 | – | 15,906 | – |
| Distribution Reinvestment Program | – | – | 43 | – | 43 | – |
| Outstanding, end of period | 139 | 139 | 243,342 | 102,522 | 243,481 | 102,661 |
| b) | Units of the operating partnership held by Brookfield Asset Management |
Redeemable/Exchangeable Partnership Units
The Redeemable/Exchangeable Partnership Units are non-voting limited partnership interests in the operating partnership and have the same economic attributes in all respects with the partnership’s LP Units. Beginning on April 15, 2015, the Redeemable/Exchangeable Partnership Units may, at the request of the holder, be redeemed in whole or in part, for cash in an amount equal to the market value of one of the partnership’s LP Units multiplied by the number of units to be redeemed (subject to certain adjustments). This right is subject to the partnership’s right, at its sole discretion, to elect to acquire any unit presented for redemption in exchange for one LP unit (subject to certain customary adjustments). If the partnership elects not to exchange the Redeemable/Exchangeable Partnership Units for LP Units, the Redeemable/Exchangeable Partnership Units are required to be redeemed for cash. The Redeemable/Exchangeable Partnership Units provide the holder the direct economic benefits and exposures to the underlying performance of the partnership and accordingly to the variability of the distributions of the operating partnership, whereas the partnership’s unitholders have indirect access to the economic benefits and exposures of the operating partnership through direct ownership interest in the partnership which owns a direct interest in the managing general partner units of the operating partnership.
Redeemable/Exchangeable Partnership Units outstanding are as follows:
| | Redeemable/Exchangeable Partnership Units |
| (Thousands of units) | Jun. 30, 2014 | Dec. 31, 2013 |
| Outstanding, beginning of period | | 432,649 | | – |
| Issued on Spin-off | | – | | 381,329 |
| Issued on November 15, 2013 for the acquisition of incremental interest in GGP | | – | | 51,320 |
| Outstanding, end of period | | 432,649 | | 432,649 |
Special limited partnership units
Prior to August 8, 2013, Property Special LP held 1% of the GP units of the partnership and as part of the reorganization effected on August 8, 2013, these units were transferred to be 1% Special LP Units. This reorganization was made in order to simplify the partnership’s governance structure and to more clearly delineate the partnership’s governance rights in respect of the operating partnership.
There were 4,759,997 Special LP Units outstanding at June 30, 2014 and December 31, 2013, respectively.
| c) | Limited partnership units of Brookfield Office Properties Exchange LP |
Exchange LP Units were issued in March and June 2014 to certain Canadian holders of common shares of BPO who elected to receive such units for each BPO common share tendered in the Offer or the Arrangement by such shareholder. The Exchange LP Units are exchangeable at any time on a one-for-one basis, at the option of the holder, subject to their terms and applicable law, for LP Units. An Exchange LP Unit provides a holder thereof with economic terms that are substantially equivalent to those of a LP Unit of the partnership. Subject to certain conditions and applicable law, Exchange LP will have the right, commencing on the seventh anniversary of the completion of the Arrangement to redeem all of the then outstanding Exchange LP Units.
Exchange LP Units are outstanding as follows:
| | Limited Partnership Units of Brookfield Office Properties Exchange LP |
| (Thousands of units) | Jun. 30, 2014 | Dec. 31, 2013 |
| Outstanding, beginning of period | | – | | – |
| Issued on March 20, April 1, and June 9 2014 for the acquisition of incremental BPO shares | | 48,126 | | – |
| Exchange LP Units exchanged(1) | | (15,906) | | – |
| Outstanding, end of period | | 32,220 | | – |
| (1) | Approximately 15.9 million Exchange LP Units issued for the acquisition of incremental BPO shares are held by an indirect subsidiary of the partnership. |
Distributions made to each class of partnership units are as follows:
| | | Three months ended Jun. 30, | | | Six months ended Jun. 30, | |
| (US$ Millions, except per unit information) | | | 2014 | | | | 2013 | (1) | | | 2014 | | | | 2013 | (1) |
| General partner | | $ | – | | | $ | – | | | $ | – | | | $ | – | |
| Limited partners | | | 54 | | | | 10 | | | | 80 | | | | 10 | |
| Holders of: | | | | | | | | | | | | | | | | |
| Redeemable/exchangeable partnership units | | | 108 | | | | 50 | | | | 216 | | | | 50 | |
| Special limited partnership units | | | 1 | | | | – | | | | 2 | | | | – | |
| Limited partnership units of Exchange LP | | | 9 | | | | – | | | | 9 | | | | – | |
| Total distributions | | | 172 | | | | 60 | | | | 307 | | | | 60 | |
| Per unit(2) | | $ | 0.25 | | | $ | 0.13 | | | $ | 0.50 | | | $ | 0.13 | |
| (1) | For the period from April 15, 2013, the date of the Spin-off, to June 30, 2013. |
| (2) | Per unit outstanding on the record date for each. |
The partnership’s net income per LP Unit and weighted average units outstanding are calculated as follows:
| | | Three months ended Jun. 30, | | | Six months ended Jun. 30, | |
| (US$ Millions) | | 2014 | | | 2013 | | | 2014 | | | 2013 | |
| Net income attributable to limited partners – basic | | $ | 270 | | | $ | 44 | | | $ | 347 | | | $ | 44 | |
| Dilutive effect of conversion of BPO Convertible Preferred Shares | | | 1 | | | | – | | | | 1 | | | | – | |
| Net income attributable to limited partners – diluted | | | 271 | | | | 44 | | | | 348 | | | | 44 | |
| | | | | | | | | | | | | | | | | |
| Weighted average units outstanding – basic | | | 209.9 | | | | 80.2 | | | | 160.4 | | | | 80.2 | |
| Dilutive effect of conversion of BPO Convertible Preferred Shares(1) | | | 6.3 | | | | – | | | | 3.2 | | | | – | |
| Weighted average units outstanding - diluted | | | 216.2 | | | | 80.2 | | | | 163.6 | | | | 80.2 | |
| (1) | The calculation of diluted earnings per unit of the partnership also includes the dilutive impact of the BPO Convertible Preferred Shares as such shares, subsequent to the Arrangement, are convertible into BPY Units. |
| NOTE | 17.NON-CONTROLLING INTERESTS |
Non-controlling interests consists of the following:
| (US$ Millions) | | Jun. 30, 2014 | | | Dec. 31, 2013 | |
| Redeemable/Exchangeable and special limited partnership units | | $ | 11,979 | | | $ | 11,092 | |
| Limited partnership units of Exchange L.P. | | | 724 | | | | – | |
| Interest of others in operating subsidiaries and properties: | | | | | | | | |
| Preferred shares held by Brookfield Asset Management Inc. | | | 25 | | | | 25 | |
| Preferred equity of subsidiaries | | | 1,659 | | | | 1,614 | |
| Non-controlling interests in subsidiaries and properties | | | 4,692 | | | | 9,727 | |
| Total interests of others in operating subsidiaries and properties | | | 6,376 | | | | 11,366 | |
| Total non-controlling interests | | $ | 19,079 | | | $ | 22,458 | |
Non-controlling interests in subsidiaries and properties consist of the following:
| | | | Proportion of economic interests held by non-controlling interests | | | | |
| (US$ Millions) | Principal Place of Business | | Jun. 30, 2014 | Dec. 31, 2013 | | Jun. 30, 2014 | | Dec. 31, 2013 |
| Brookfield Office Properties Inc.(1) | U.S., Canada, Australia, U.K | | – | 51% | $ | 1,178 | $ | 6,723 |
Brookfield Brazil Retail Fundo de Investimento em Participacões | Brazil | | 65% | 65% | | 992 | | 936 |
| IDI Realty, LLC | U.S. | | 72% | 72% | | 819 | | 801 |
| Gazeley Limited | U.K., Germany, France, Italy, Spain | | 72% | 72% | | 329 | | 254 |
| BREF ONE, LLC | U.S., Bahamas | | 67% | 67% | | 363 | | 369 |
| Other | Various | | 18%-88% | 18%-88% | | 1,011 | | 644 |
| Total non-controlling interests in subsidiaries and properties | | | | $ | 4,692 | $ | 9,727 |
| (1) | Includes non-controlling interests in BPO subsidiaries which vary from 0.6%-50.0%. |
In the first quarter of 2014, the partnership acquired 220.0 million common shares of BPO pursuant to its Offer to acquire any or all of the common shares of BPO not beneficially owned by the partnership. Consequently, the partnership increased its ownership interest in the common shares of BPO from approximately 49% at December 31, 2013 to 92% at March 31, 2014, resulting in a corresponding reduction in the proportion of the economic interests in Brookfield Office Properties held by non-controlling interests from 51% to 8%. In the second quarter of 2014, the Purchasers acquired the remaining BPO common shares pursuant to the Arrangement, representing approximately 8% of the BPO common shares. As of June 9, 2014, BPY owns 100% of the issued and outstanding common shares of BPO resulting in a corresponding reduction in the proportion of the economic interests in BPO’s common shares held by non-controlling interests from 8% at March 31, 2014 to nil.
Other non-controlling interests in subsidiaries and properties consist of earnings attributable to interests not owned by BPO at 100% in other assets and funds and preferred shares issued by BPO.
| NOTE | 18.COMMERCIAL PROPERTY REVENUE |
The components of commercial property revenue are as follows:
| | | Three months ended Jun. 30, | | | Six months ended Jun. 30, | |
| (US$ Millions) | | 2014 | | | 2013 | | | 2014 | | | 2013 | |
| Base rent | | $ | 667 | | | $ | 607 | | | $ | 1,309 | | | $ | 1,301 | |
| Straight- line rent | | | 25 | | | | 27 | | | | 50 | | | | 56 | |
| Lease termination | | | 8 | | | | – | | | | 12 | | | | – | |
| Other | | | 42 | | | | 77 | | | | 94 | | | | 102 | |
| Total commercial property revenue | | $ | 742 | | | $ | 711 | | | $ | 1,465 | | | $ | 1,459 | |
| NOTE | 19.INVESTMENT AND OTHER REVENUE |
The components of investment and other revenue are as follows:
| | Three months ended Jun. 30, | Six months ended Jun. 30, |
| (US$ Millions) | | 2014 | | 2013 | | 2014 | | 2013 |
| Fee revenue | $ | 9 | $ | 13 | $ | 16 | $ | 27 |
| Dividend income | | 19 | | 2 | | 22 | | 2 |
| Interest income | | 55 | | 14 | | 80 | | 32 |
| Participating loan notes | | 13 | | 13 | | 27 | | 13 |
| Other | | 113 | | 2 | | 121 | | 25 |
| Total investment and other revenue | $ | 209 | $ | 44 | $ | 266 | $ | 99 |
| | | |
| NOTE | 20.DIRECT COMMERCIAL PROPERTY EXPENSE |
The components of direct commercial property expense are as follows:
| | Three months ended Jun. 30, | Six months ended Jun. 30, |
| (US$ Millions) | | 2014 | | 2013 | | 2014 | | 2013 |
| Employee compensation and benefits | $ | 32 | $ | 21 | $ | 69 | $ | 52 |
| Property maintenance | | 158 | | 140 | | 312 | | 281 |
| Real estate taxes | | 102 | | 94 | | 197 | | 189 |
| Ground rents | | 8 | | 8 | | 17 | | 17 |
| Other | | 31 | | 30 | | 50 | | 59 |
| Total direct commercial property expense | $ | 331 | $ | 293 | $ | 645 | $ | 598 |
| NOTE | 21.DIRECT HOSPITALITY EXPENSE |
The components of direct hospitality expense are as follows:
| | Three months ended Jun. 30, | Six months ended Jun. 30, |
| (US$ Millions) | | 2014 | | 2013 | | 2014 | | 2013 |
| Employee compensation and benefits | $ | 69 | $ | 95 | $ | 145 | $ | 191 |
| Marketing and advertising | | 9 | | 12 | | 23 | | 26 |
| Cost of food, beverage, and retail goods sold | | 18 | | 22 | | 36 | | 42 |
| Maintenance and utilities | | 25 | | 27 | | 47 | | 50 |
| Other | | 81 | | 106 | | 164 | | 205 |
| Total direct hospitality expense | $ | 202 | $ | 262 | $ | 415 | $ | 514 |
| | | |
| NOTE | 22.depreciation and amortization |
The components of depreciation and amortization expense are as follows:
| | Three months ended Jun. 30, | Six months ended Jun. 30, |
| (US$ Millions) | | 2014 | | 2013 | | 2014 | | 2013 |
| Depreciation and amortization of real estate assets | $ | 27 | $ | 43 | $ | 56 | $ | 65 |
| Depreciation and amortization of non-real estate assets | | 10 | | 11 | | 20 | | 22 |
| Total depreciation and amortization | $ | 37 | $ | 54 | $ | 76 | $ | 87 |
| NOTE | 23.administration and other expense |
The components of administration and other expense are as follows:
| | Three months ended Jun. 30, | Six months ended Jun. 30, |
| (US$ Millions) | | 2014 | | 2013 | | 2014 | | 2013 |
| Employee compensation and benefits | $ | 37 | $ | 32 | $ | 63 | $ | 60 |
| Management fees | | 25 | | 11 | | 43 | | 11 |
| Other | | 33 | | 22 | | 73 | | 40 |
| Total administration and other expense | $ | 95 | $ | 65 | $ | 179 | $ | 111 |
| NOTE | 24.fair value gains, net |
The components of fair value gains, net, are as follows:
| | Three months ended Jun. 30, | Six months ended Jun. 30, |
| (US$ Millions) | | 2014 | | 2013 | | 2014 | | 2013 |
| Investment properties | $ | 926 | $ | 394 | $ | 1,296 | $ | 608 |
| Financial instruments | | 149 | | – | | 397 | | 46 |
| Other fair value gains (losses) | | (61) | | (18) | | (111) | | (64) |
| Total fair value gains, net | $ | 1,014 | $ | 376 | $ | 1,582 | $ | 590 |
| | | |
| NOTE | 25.share- based compensation |
Immediately following the plan of arrangement through which the outstanding common shares of BPO were acquired by BPY, options and other share-based compensation awards outstanding at BPO as of the acquisition date were redeemed for cash and/or exchanged for new share-based compensation plans linked to interests in the partnership. The following is a summary of the partnership’s shared based compensation plans:
Awards under the BPY Unit Option Plan (“BPY Awards”) generally vest 20% per year over a period of five years and expire 10 years after the grant date, with the exercise price set at the time such options were granted and generally equal to the market price of an LP Unit on the NYSE on the last trading day preceding the grant date. Upon exercise of a vested BPY Award, the participant is entitled to receive a cash payment equal to the amount by which the fair market value of an LP Unit at the date of exercise exceeds the exercise price of the BPY Award. Subject to a separate adjustment arising from forfeitures, the estimated expense is revalued every reporting period using the Black-Scholes model as a result of the cash settlement provisions of the plan. In terms of measuring expected life of the BPY Awards with various term lengths and vesting periods, BPY will segregate each set of similar BPY Awards and, if different, exercise price, into subgroups and apply a weighted average within each group.
As of June 30, 2014, the total number of BPY Awards granted was 22,246,624 with a weighted average price of $19.73.
Consequences for BPO option holders:
| i. | For holders of vested in-the-money BPO options: Each participant’s vested in-the-money BPO options were redeemed for a cash payment equal to the in-the-money amount on the transaction closing date of June 9, 2014 (the “Closing Date”); |
| ii. | For holders of unvested in-the-money BPO options: Each participant was granted BPY Awards equivalent in number to the outstanding BPO options held prior to the Closing Date. The grant price was equal to the closing price of a BPY Unit on the NYSE on the last trading day prior to the Closing Date less the in-the-money amount of the exchanged BPO Options on the Closing Date. These BPY Awards have expiry dates and vesting terms consistent with the unvested BPO options exchanged; |
| iii. | For holders of out-of-the money BPO options: Each participant was granted BPY Awards equivalent in number to the outstanding out-of-the money BPO options (vested and unvested) held prior to the Closing Date. The exercise price was equal the closing price of a BPY Unit on the NYSE on the last trading day prior to the Closing Date. These BPY Awards have a 10-year term and a 5-year vesting period; |
| iv. | For participants receiving 2013 compensation: New share-based compensation awards were granted on the Closing Date related to 2013 performance to participants. These BPY Awards have an exercise price equal to the closing price of a BPY share on the NYSE on the last trading day prior to the Closing Date and a 10-year term and 5-year vesting period. Participants were given the option to receive a portion of their 2013 compensation in restricted LP Units (as discussed below). |
The partnership estimated the fair value of the BPY Awards granted during the year using the Black-Scholes valuation model. The following assumptions were utilized:
| | | Jun. 30, 2014 |
| Weighted average unit price | US$ | 19.73 |
| Weighted average fair value per option | US$ | 2.72 |
| Average term to exercise | In Years | 6.93 |
| Unit price volatility | % | 30 |
| Liquidity discount | % | 25 |
| Weighted average annual dividend yield | % | 4 |
| Risk-free rate | % | 2.26% |
| b) | Restricted BPY LP Unit Plan |
The Restricted BPY LP Unit Plan provides for awards to participants of LP Units purchased on the NYSE (“Restricted Units”). Under the Restricted BPY LP Unit Plan, units awarded generally vest over a period of five years, except as otherwise determined or for Restricted Units awarded in lieu of a cash bonus as elected by the participant, which may vest immediately. The estimated total compensation cost measured at grant date is evenly recognized over the vesting period of five years.
As of June 30, 2014, the total number of Restricted Units granted was 320,544 with a weighted average price of US$20.79.
| c) | Restricted BPY LP Unit Plan (Canada) |
The Restricted BPY LP Unit Plan (Canada) is substantially similar to the Restricted BPY LP Unit Plan described above, except that the plan is for Canadian employees, there is a five year hold period, and purchases of units are made on the TSX instead of the NYSE.
As of June 30, 2014, the total number of Canadian Restricted Units granted was 19,410 with a weighted average price of C$22.14.
| NOTE | 26.other comprehensive income (loss) |
Other comprehensive income (loss) consists of the following:
| | Three months ended Jun. 30, | Six months ended Jun. 30, |
| (US$ Millions) | | 2014 | | 2013 | | 2014 | | 2013 |
| Items that may be reclassified to net income: | | | | | | | | |
| Foreign currency translation | | | | | | | | |
Net unrealized foreign currency translation gains (losses) in respect of foreign Operations, net of income taxes | $ | 206 | $ | (649) | $ | 264 | $ | (818) |
Gains (losses) on hedges of net investments in foreign operations, net of income taxes for the three and six months ended June 30, 2014 of $18 million and $31, respectively (2013 – nil and nil) (1) | | (105) | | 34 | | (128) | | 69 |
| | | 101 | | (615) | | 136 | | (749) |
| Cash flow hedges | | | | | | | | |
Gains (losses) on derivatives designated as cash flow hedges, net of income taxes for the three and six months ended June 30, 2014 of $16 million and $31 million, respectively (2013 - $25 million and $31 million) | | (46) | | 69 | | (91) | | 111 |
Reclassification of gains on derivatives designated as cash flow hedges, net of income taxes | | – | | 3 | | – | | 6 |
| | | (46) | | 72 | | (91) | | 117 |
| Available-for-sale securities | | | | | | | | |
| Change in unrealized gains on available-for-sale securities, net of income taxes | | 4 | | – | | 3 | | 6 |
| | | 4 | | – | | 3 | | 6 |
| Equity accounted investments | | | | | | | | |
Share of unrealized foreign currency translations gains (losses) in respect of foreign operations, net of income taxes | | 53 | | (38) | | 53 | | (38) |
| | | 53 | | (38) | | 53 | | (38) |
| Total other comprehensive income (loss) | $ | 112 | $ | (581) | $ | 101 | $ | (664) |
| (1) | Unrealized gains (losses) on hedges of net investments in foreign operations are with a related party. |
| NOTE | 27.OBLIGATIONS guarantees, contingencies and other |
In the normal course of operations, the partnership and its consolidated entities execute agreements that provide for indemnification and guarantees to third parties in transactions such as business dispositions, business acquisitions, sales of assets and sales of services.
The partnership’s operating subsidiaries have also agreed to indemnify its directors and certain of its officers and employees. The nature of substantially all of the indemnification undertakings prevent the partnership from making a reasonable estimate of the maximum potential amount that it could be required to pay third parties as the agreements do not specify a maximum amount and the amounts are dependent upon the outcome of future contingent events, the nature and likelihood of which cannot be determined at this time. Historically, neither the partnership nor its consolidated subsidiaries have made significant payments under such indemnification agreements.
The partnership and its operating subsidiaries may be contingently liable with respect to litigation and claims that arise from time to time in the normal course of business or otherwise. A specific litigation, with a judgment amount of $59 million (A$63 million), is being pursued against one of the partnership’s subsidiaries related to security on a defaulted loan. Management has determined that the most probable cash outflow related to the litigation being pursued against the company is $25 million (A$27 million), which has been fully provided for in the partnership’s financial statements. The partnership settled this specific litigation subsequent to June 30, 2014. See Note 32,Subsequent Events, for further information.
The partnership, through its 50% interest in London Wall Place LP, has a £125 million commitment at June 30, 2014 in respect of obligations under a pre-let agreement relating to 1 London Wall Place, which allows the joint venture partners, including the partnership, to commence formal construction of the development as soon as demolition work has been completed.
At June 30, 2014, the partnership has commitments totaling approximately C$260 million for the development of Bay Adelaide East in Toronto and Brookfield Place East Tower in Calgary and approximately A$228 million for the development of Brookfield Place Perth Tower 2.
The partnership maintains insurance on its properties in amounts and with deductibles that it believes are in line with what owners of similar properties carry. The partnership maintains all risk property insurance and rental value coverage (including coverage for the perils of flood, earthquake and named windstorm). The partnership does not conduct its operations, other than those of equity accounted investments, through entities that are not fully or proportionately consolidated in these financial statements, and has not guaranteed or otherwise contractually committed to support any material financial obligations not reflected in these financial statements.
During 2013, Brookfield Asset Management announced the final close on the $4.4 billion Brookfield Strategic Real Estate Partners fund, a global private fund focused on making opportunistic investments in commercial property. The partnership, as lead investor, committed approximately $1.3 billion to the fund.
| NOTE | 28.financial instruments |
| a) | Derivatives and hedging activities |
The partnership and its operating entities use derivative and non-derivative instruments to manage financial risks, including interest rate, commodity, equity price and foreign exchange risks. The use of derivative contracts is governed by documented risk management policies and approved limits. The partnership does not use derivatives for speculative purposes. The partnership and its operating entities use the following derivative instruments to manage these risks:
| • | foreign currency forward contracts to hedge exposures to Canadian Dollar, Australian Dollar, British Pound, and Euro denominated net investments in foreign subsidiaries and foreign currency denominated financial assets; |
| • | interest rate swaps to manage interest rate risk associated with planned refinancings and existing variable rate debt; |
| • | interest rate caps to hedge interest rate risk on certain variable rate debt; and |
| • | total return swaps on BPO’s shares to economically hedge exposure to variability in its share price under its deferred share unit plan. |
The partnership also designates Canadian Dollar financial liabilities of certain of its operating entities as hedges of its net investments in its Canadian operations.
Interest Rate Hedging
The following table provides the partnership’s outstanding derivatives that are designated as cash flow hedges of variability in interest rates associated with forecasted fixed rate financings and existing variable rate debt as of June 30, 2014 and December 31, 2013:
| (US$ millions) | Hedging item | | Notional | Rates | Maturity dates | | Fair value |
| Jun. 30, 2014 | Interest rate swaps of fixed US$ debt | $ | 1,995 | 2.3% - 4.9% | Nov. 2024 to Jun. 2029 | $ | (153) |
| | Interest rate swaps of fixed C$ debt | | 47 | 2.8% | Dec. 2024 | | – |
| | Interest rate swaps of US$ LIBOR debt | | 483 | 0.6% - 2.2% | Dec. 2015 to Nov. 2020 | | (5) |
| | Interest rate caps of US$ LIBOR debt | | 1,725 | 3.0% - 5.8% | Sep. 2014 to Oct. 2018 | | – |
| | Interest rate swaps of £ LIBOR debt | | 229 | 1.1% | Sep. 2017 | | 3 |
| | Interest rate swaps of A$ BBSW/BBSY debt | | 632 | 3.5% - 5.9% | Jan. 2016 to Jul. 2017 | | (34) |
| Dec. 31, 2013 | Interest rate swaps of fixed US$ debt | $ | 1,505 | 2.3% and 4.7% | Jun. 2024 to Jun. 2026 | $ | (32) |
| | Interest rate swaps of fixed C$ debt | | 47 | 2.8% | Dec. 2024 | | 3 |
| | Interest rate swaps of US$ LIBOR debt | | 784 | 0.6% - 2.2% | May 2014 to Nov. 2020 | | (1) |
| | Interest rate caps of US$ LIBOR debt | | 2,246 | 3.0% - 5.8% | Jan. 2014 to Oct. 2018 | | 2 |
| | Interest rate swaps of £ LIBOR debt | | 222 | 1.1% | Sep. 2017 | | 3 |
| | Interest rate swaps of A$ BBSW/BBSY debt | | 936 | 3.5% - 5.9% | Jan. 2014 to Jul. 2017 | | (37) |
For the three and six months ended June 30, 2014 and 2013, the amount of hedge ineffectiveness recorded in interest expense in connection with the partnership’s interest rate hedging activities was not significant.
Foreign Currency Hedging
The partnership has derivatives designated as net investment hedges of its investments in foreign subsidiaries. As of June 30, 2014, the partnership had hedged a notional amount of £981 million (December 31, 2013 - £770 million) at rates between £0.60/US$ and £0.63/US$ using foreign currency forward contracts maturing between July 2014 and June 2015. In addition, as of June 30, 2014, the partnership had hedged a notional amount of €288 million (December 31, 2013 - €550 million) at rates between €0.72/US$ and €0.74/US$ using foreign currency forward contracts maturing in August 2014. The partnership had also hedged, as of June 30, 2014, a notional amount of A$1,369 million (December 31, 2013 – A$535 million) at rates between A$1.06/US$ and A$1.14/US$ using foreign currency forward contracts maturing between July 2014 and March 2015.
The fair value of the partnership’s outstanding foreign currency forwards as of June 30, 2014 is a loss of $118 million (December 31, 2013 – loss of $27 million).
In addition, as of June 30, 2014, the partnership had designated C$1,413 million (December 31, 2013 – C$900 million) of Canadian dollar financial liabilities as hedges against the partnership’s net investment in Canadian operations.
Other Derivatives
The following table provides details of the partnership’s other derivatives that have been entered into to manage financial risks as of June 30, 2014 and December 31, 2013:
(US$ millions) | Derivative type | | Fair Value(2) | Maturity dates | Rates | | Fair value (gain)/loss | Classification of gain/loss |
| Jun. 30, 2014 | Total return swap(1) | $ | – | – | – | $ | (3) | General and administrative expense |
| | Interest rate caps | | 400 | Mar. 2016 | 3.65% | | – | General and administrative expense |
| | Interest rate caps | | 350 | Jul. 2017 | 3.25% | | – | General and administrative expense |
| | Interest rate caps | | 2,175 | Sep. 2014 | 4.50% | | – | General and administrative expense |
| Dec. 31, 2013 | Total return swap(1) | $ | 1 | – | – | $ | (5) | General and administrative expense |
| | Interest rate caps | | 400 | Mar. 2016 | 3.65% | | – | General and administrative expense |
| | Interest rate caps | | 882 | Apr. 2014 | 2.50% | | – | General and administrative expense |
| | Interest rate caps | | 2,270 | Apr. 2014 | 4.50% | | – | General and administrative expense |
| (1) | Relates to the total return swap on BPO’s shares in connection with its deferred share unit plans which was settled for C$1 million during the second quarter of 2014. |
| (2) | Interest rate caps are presented at their notional amount. |
The other derivatives have not been designated as hedges for accounting purposes.
| b) | Measurement and classification of financial instruments |
Classification and Measurement
The following table outlines the classification and measurement basis, and related fair value for disclosures, of the financial assets and liabilities in the interim condensed consolidated financial statements:
| | | | Jun. 30, 2014 | Dec. 31, 2013 |
(US$ Millions) | Classification | Measurement basis | Carrying value | Fair value | Carrying value | Fair value |
| Financial assets | | | | | | | | | | |
| Participating loan interests | Loans and receivables | Amortized cost | $ | 676 | $ | 676 | $ | 747 | $ | 747 |
| Loans and notes receivable | Loans and receivables | Amortized cost | | 194 | | 194 | | 628 | | 628 |
| Other non-current assets | | | | | | | | | | |
| Securities designated as FVTPL | FVTPL | Fair Value | | 1,799 | | 1,799 | | 1,068 | | 1,068 |
| Derivative assets | FVTPL | Fair Value | | 1,104 | | 1,104 | | 868 | | 868 |
| Securities designated as AFS | AFS | Fair Value | | 151 | | 151 | | 124 | | 124 |
| Other receivables | Loans and receivables | Amortized cost | | 95 | | 95 | | 95 | | 95 |
| Accounts receivable and other | | | | | | | | | | |
| Other receivables | Loans and receivables | Amortized cost | | 1,105 | | 1,105 | | 1,035 | | 1,035 |
| Cash and cash equivalents | Loans and receivables | Amortized cost | | 1,504 | | 1,504 | | 1,368 | | 1,368 |
| Total financial assets | | | $ | 6,628 | $ | 6,628 | $ | 5,933 | $ | 5,933 |
| | | | | | | | | | | |
| Financial liabilities | | | | | | | | | | |
| Debt obligations | Other liabilities | Amortized cost | $ | 23,595 | $ | 24,707 | $ | 21,640 | $ | 22,003 |
| Capital securities | Other liabilities | Amortized cost | | 2,447 | | 2,490 | | 2,369 | | 2,380 |
| Other non-current liabilities | | | | | | | | | | |
Other non-current financial liabilities | Other liabilities | Amortized cost(1) | | 424 | | 424 | | 250 | | 250 |
Accounts payable and other liabilities | Other liabilities | Amortized cost(2) | | 1,836 | | 1,836 | | 1,665 | | 1,665 |
| Total financial liabilities | | | $ | 28,302 | $ | 29,457 | $ | 25,924 | $ | 26,298 |
| (1) | Includes derivative liabilities measured at fair value of approximately $80 million and nil as of June 30, 2014 and December 31, 2013, respectively. |
| (2) | Includes derivative liabilities measured at fair value of approximately $191 million and $128 million as of June 30, 2014 and December 31, 2013, respectively. |
Fair Value Hierarchy
Fair value is defined as the price that would be received to sell an asset or paid to transfer a liability in an orderly transaction between market participants at the measurement date (i.e., an exit price). Fair value measurement establishes a hierarchy of valuation techniques based on whether the inputs to those valuation techniques are observable or unobservable. Quoted market prices (unadjusted) in active markets represent a Level 1 valuation. When quoted market prices in active markets are not available, the partnership maximizes the use of observable inputs within valuation models. When all significant inputs are observable, the valuation is classified as Level 2. Valuations that require the significant use of unobservable inputs are considered Level 3, which reflect the partnership’s market assumptions and are noted below. This hierarchy requires the use of observable market data when available.
The following table outlines financial assets and liabilities measured at fair value in the financial statements and the level of the inputs used to determine those fair values in the context of the hierarchy as defined above:
| | | Jun. 30, 2014 | | | Dec. 31, 2013 | |
| (US$ Millions) | | Level 1 | | | Level 2 | | | Level 3 | | | Total | | | Level 1 | | | Level 2 | | | Level 3 | | | Total | |
| | | | | | | | | | | | | | | | | | | | | | | | | |
| Financial assets | | | | | | | | | | | | | | | | | | | | | | | | | | | | | | | | |
Participating loan interests –
embedded derivative | | $ | – | | | $ | – | | | $ | 47 | | | $ | 47 | | | $ | – | | | $ | – | | | $ | 56 | | | $ | 56 | |
| Other non-current assets | | | | | | | | | | | | | | | | | | | | | | | | | | | | | | | | |
| Securities designated as FVTPL | | | – | | | | 7 | | | | 1,792 | | | | 1,799 | | | | – | | | | – | | | | 1,068 | | | | 1,068 | |
| Securities designated as AFS | | | – | | | | – | | | | 151 | | | | 151 | | | | – | | | | – | | | | 124 | | | | 124 | |
| Derivative assets | | | – | | | | 37 | | | | 1,074 | | | | 1,111 | | | | – | | | | 70 | | | | 868 | | | | 938 | |
| Total financial assets | | $ | – | | | $ | 44 | | | $ | 3,064 | | | $ | 3,108 | | | $ | – | | | $ | 70 | | | $ | 2,116 | | | $ | 2,186 | |
| | | | | | | | | | | | | | | | | | | | | | | | | | | | | | | | | |
| Financial liabilities | | | | | | | | | | | | | | | | | | | | | | | | | | | | | | | | |
Accounts payable and non-current
other liabilities | | | – | | | | 271 | | | | – | | | | 271 | | | | – | | | | 128 | | | | – | | | | 128 | |
| Total financial liabilities | | $ | – | | | $ | 271 | | | $ | – | | | $ | 271 | | | $ | – | | | $ | 128 | | | $ | – | | | $ | 128 | |
There were no transfers between levels during the three and six month periods ended June 30, 2014.
A reconciliation of fair value measurements in Level 3 is presented below:
| | Jun. 30, 2014 | Dec. 31, 2013 |
(US$ Millions) | Financial Assets | Financial Liabilities | Financial Assets | Financial Liabilities |
| Balance, beginning of period | $ | 2,116 | $ | – | $ | 1,709 | $ | 54 |
| Acquisitions | | 527 | | – | | 353 | | – |
| Dispositions | | (5) | | – | | (85) | | (54) |
| Fair value gains (losses), net and OCI | | 426 | | – | | 149 | | – |
| Other | | – | | – | | (10) | | – |
| Balance, end of period | $ | 3,064 | $ | – | $ | 2,116 | $ | – |
In the normal course of operations, the partnership enters into the transactions with related parties on market terms. These transactions have been measured at exchange value and are recognized in the interim condensed consolidated financial statements.
The immediate parent of the partnership is the general partner. The ultimate parent of the partnership is Brookfield Asset Management. Other related parties of the partnership include the partnership’s and Brookfield Asset Management’s subsidiaries and operating entities.
Since the Spin-off, the partnership has a management agreement with its service providers, wholly-owned subsidiaries of Brookfield Asset Management. Pursuant to a Master Services Agreement, on a quarterly basis, the partnership pays a base management fee (“base management fee”), to the service provider equal to $12.5 million per quarter ($50 million annually). The base management fee for the three and six months ended June 30, 2014 was $12.5 million and $25 million, respectively. The base management fee for the period from Spin-off to June 30, 2013 was $10.5 million.
Additionally, the partnership pays a quarterly equity enhancement distribution to Special L.P., a wholly-owned subsidiary of Brookfield Asset Management, of 0.3125% of the amount by which the operating partnership’s total capitalization value at the end of each quarter exceeds its total capitalization value immediately following the Spin-off, subject to certain adjustments. For purposes of calculating the equity enhancement distribution at each quarter end, the capitalization of the partnership is equal to the volume weighted average of the closing prices of the partnership’s units on the NYSE (or other exchange or market where the partnership’s units are principally traded) for each of the last five trading days of the applicable quarter multiplied by the number of issued and outstanding units of the partnership on the last of those days (assuming full conversion of Brookfield Asset Management’s interest in the partnership into units of the partnership), plus the amount of third-party debt, net of cash, with recourse to the partnership and the operating partnership and certain holding entities held directly by the operating partnership. The equity enhancement distribution for the three and six month periods ended June 30, 2014 was $12.4 million and $18.3 million, respectively. The equity enhancement distribution for the period from Spin-off to June 30, 2013 was nil.
The following table summarizes transactions with related parties:
| | Three months ended Jun. 30, | Six months ended Jun. 30, |
| (US$ Millions) | 2014 | 2013 | 2014 | 2013 |
| Commercial property revenue(1) | $ | 6 | $ | 2 | $ | 7 | $ | 4 |
| Interest and other income | | 15 | | 17 | | 29 | | 19 |
| Interest expense on debt obligations | | 1 | | 5 | | 6 | | 7 |
| Interest on capital securities paid to Brookfield Asset Management | | 20 | | – | | 40 | | – |
| Administration expense(2) | | 10 | | 31 | | 20 | | 55 |
| Management fees paid | | 23 | | 27 | | 62 | | 41 |
| (US$ Millions) | | Jun. 30, 2014 | | Dec. 31, 2013 |
| Participating loan interests | $ | 676 | $ | 747 |
| Loans and notes receivable(3) | | 191 | | 293 |
| Receivables and other assets | | 99 | | 11 |
| Debt obligations | | 260 | | 341 |
| Other liabilities | | 123 | | 98 |
| Capital securities owned by Brookfield Asset Management | | 1,250 | | 1,250 |
| (1) | Amounts received from Brookfield Asset Management and its subsidiaries for the rental of office premises. |
| (2) | Amounts paid to Brookfield Asset Management and its subsidiaries for administrative services. |
| (3) | Includes $95 million receivable from Brookfield Asset Management upon the earlier of the partnership's exercise of its option to convert its participating loan interests into direct ownership of the Australian portfolio or the maturity of the participating loan notes. |
| | | |
| NOTE | 30.Subsidiary PUBLIC ISSUERS |
BOP Split was incorporated for the purpose of being an issuer of preferred shares and owning the Purchasers’ additional investment in BPO Common Shares. Pursuant to the terms of the arrangement, holders of outstanding BPO Convertible Preference Shares Series G, H, J and K, which were convertible into BPO common shares, were able to exchange their shares for BOP Split Senior Preferred Shares, subject to certain conditions. The BOP Split Senior Preferred shares are listed on the TSX and began trading on June 11, 2014. All shares issued by BOP Split are retractable by the holders at any time for cash.
The following table provides consolidated summary financial information for the partnership, BOP Split, and the Holding Entities:
(US$ Millions)
For the three months ended
Jun. 30, 2014 | | Brookfield Property Partners L.P. | | | Brookfield Property Split Corp. | | | Holding Entities(3) | | | Other
Subsidiaries | | | Consolidating Adjustments(2) | | | Brookfield Property Partners L.P. consolidated | |
| Revenue | | $ | – | | | $ | – | | | $ | 73 | | | $ | 1,215 | | | $ | (73 | ) | | $ | 1,215 | |
| Net income attributable to unitholders(1) | | | 298 | | | | 281 | | | | 893 | | | | 539 | | | | (1,119 | ) | | | 892 | |
| | | | | | | | | | | | | | | | | | | | | | | | | |
For the three months ended
Jun. 30, 2013 | | | | | | | | | | | | | | | | | | | | | | | | |
| Revenue | | $ | – | | | $ | – | | | $ | 46 | | | $ | 1,086 | | | $ | (46 | ) | | $ | 1,086 | |
| Net income attributable to unitholders(1) | | | 22 | | | | – | | | | 153 | | | | 107 | | | | (129 | ) | | | 153 | |
For the six months ended
Jun. 30, 2014 | | | | | | | | | | | | | | | | | | | | | | | | |
| Revenue | | $ | – | | | $ | – | | | $ | 147 | | | $ | 2,270 | | | $ | (147 | ) | | $ | 2,270 | |
Net income attributable to
unitholders(1) | | | 373 | | | | 282 | | | | 1,264 | | | | 835 | | | | (1,490 | ) | | | 1,264 | |
| | | | | | | | | | | | | | | | | | | | | | | | | |
For the six months ended
Jun. 30, 2013 | | | | | | | | | | | | | | | | | | | | | | | | |
| Revenue | | $ | – | | | $ | – | | | $ | 46 | | | $ | 2,218 | | | $ | (46 | ) | | $ | 2,218 | |
Net income attributable to
unitholders(1) | | | 22 | | | | – | | | | 484 | | | | 436 | | | | (460 | ) | | | 482 | |
| (1) | Includes net income attributable to limited partners, general partner, non-controlling interest - Redeemable/Exchangeable and special limited partnership units and non-controlling interest - Limited partnership units of Exchange LP. |
| (2) | Includes elimination of intercompany transactions and balances necessary to present the partnership on a consolidated basis. |
| (3) | Includes Brookfield Property L.P., Brookfield BPY Holdings Inc., Brookfield BPY Retail Holdings II Inc., BPY Bermuda Holdings Limited and BPY Bermuda Holdings II Limited. |
(US$ Millions)
As of Jun. 30, 2014 | | Brookfield Property Partners L.P. | | | Brookfield Property Split Corp. | | | Holding Entities | | | Other
Subsidiaries | | | Consolidating Adjustments | | | Brookfield Property Partners L.P. consolidated | |
| Current assets | | $ | – | | | $ | – | | | $ | 142 | | | $ | 2,554 | | | $ | – | | | $ | 2,696 | |
| Non- current assets | | | 8,584 | | | | 5,392 | | | | 20,746 | | | | 52,425 | | | | (34,722 | ) | | | 52,425 | |
| Current liabilities | | | – | | | | – | | | | 215 | | | | 5,230 | | | | – | | | | 5,445 | |
| Non-current liabilities | | | – | | | | 3,258 | | | | 2,346 | | | | 19,374 | | | | – | | | | 24,978 | |
Equity attributable to non-controlling
interests of others in operating
subsidiaries and properties | | | – | | | | – | | | | 5 | | | | 6,371 | | | | – | | | | 6,376 | |
| Equity attributable to unitholders(1) | | | 8,584 | | | | 2,134 | | | | 18,322 | | | | 24,004 | | | | (34,722 | ) | | | 18,322 | |
| | | | | | | | | | | | | | | | | | | | | | | | | |
| As of Dec. 31, 2013 | | | | | | | | | | | | | | | | | | | | | | | | |
| Current assets | | $ | – | | | $ | – | | | $ | 6 | | | $ | 3,005 | | | $ | – | | | $ | 3,011 | |
| Non- current assets | | | 2,590 | | | | – | | | | 15,330 | | | | 49,435 | | | | (17,920 | ) | | | 49,435 | |
| Current liabilities | | | – | | | | – | | | | 109 | | | | 6,864 | | | | – | | | | 6,973 | |
| Non-current liabilities | | | – | | | | – | | | | 1,598 | | | | 18,885 | | | | – | | | | 20,483 | |
Equity attributable to non-controlling
interests of others in operating
subsidiaries and properties | | | – | | | | – | | | | 5 | | | | 11,361 | | | | – | | | | 11,366 | |
| Equity attributable to unitholders(1) | | | 2,590 | | | | – | | | | 13,624 | | | | 15,330 | | | | (17,920 | ) | | | 13,624 | |
| (1) | Includes net income attributable to limited partners, general partner, non-controlling interest - Redeemable/Exchangeable and special limited partnership units and non-controlling interest - Limited partnership units of Exchange LP. |
| | | |
| NOTE | 31.SEGMENT INFORMATION |
IFRS 8,Operating Segments, requires operating segments to be determined based on internal reports that are regularly reviewed by the chief operating decision maker (“CODM”) for the purpose of allocating resources to the segment and to assessing its performance. Prior to April 1, 2014, the partnership managed the business in three operating segments: i) Office, ii) Retail, and iii) Multi-family, Industrial, and Hotels. As discussed in Note 2(c), the partnership realigned its operating segments as a result of changes to the organizational structure of its businesses, following the acquisition of additional interests in BPO. Beginning April 1, 2014, the partnership has four operating segments that include i) Office, ii) Retail, iii) Industrial, and iv) Multi-family and Hotels that are independently and regularly reviewed and managed by the CODM. Certain amounts are allocated to the partnership’s corporate operations based on the determination that those activities should not be used to evaluate a segment’s operating performance.
The CODM measures and evaluates the performance of the partnership’s operating segments based on net operating income (“NOI”) and funds from operations (“FFO”). Some of these performance metrics do not have standardized meanings prescribed by IFRS and therefore may differ from similar metrics used by other companies and organizations. The partnership defines these measures as follows:
| i. | NOI - revenues from properties in our commercial and hospitality operations less direct property expenses. |
| ii. | FFO - net income, prior to realized gains (losses) on the sale of investment properties, fair value changes, depreciation and amortization of real estate assets, and income taxes less non-controlling interests of others in operating subsidiaries and properties share of these items. When determining FFO, the partnership includes the proportionate share of the FFO of equity accounted investments. |
| c) | Reportable segment measures |
The following summary presents certain financial information regarding our operating segments for the three and six month periods ended June 30, 2014 and 2013.
| (US$ Millions) | Total revenue | NOI | FFO | |
| Three months ended Jun. 30, | 2014 | 2013 | 2014 | 2013 | 2014 | 2013 |
| Office | $ | 804 | $ | 644 | $ | 351 | $ | 359 | $ | 170 | $ | 91 |
| Retail | | 50 | | 37 | | 25 | | 27 | | 103 | | 65 |
| Industrial | | 48 | | 21 | | 15 | | 8 | | 3 | | (1) |
| Multi-family and Hotels | | 313 | | 384 | | 82 | | 93 | | 18 | | 14 |
| Corporate | | – | | – | | – | | – | | (86) | | (36) |
| Total | $ | 1,215 | $ | 1,086 | $ | 473 | $ | 487 | $ | 208 | $ | 133 |
| | | | | | | | | | | | | | |
| (US$ Millions) | Total revenue | NOI | FFO | |
| Six months ended Jun. 30, | 2014 | 2013 | 2014 | 2013 | 2014 | 2013 |
| Office | $ | 1,462 | $ | 1,314 | $ | 696 | $ | 734 | $ | 265 | $ | 200 |
| Retail | | 85 | | 77 | | 51 | | 54 | | 218 | | 135 |
| Industrial | | 89 | | 41 | | 30 | | 20 | | 5 | | – |
| Multi-family and Hotels | | 634 | | 780 | | 167 | | 199 | | 32 | | 30 |
| Corporate | | – | | 6 | | – | | – | | (148) | | (49) |
| Total | $ | 2,270 | $ | 2,218 | $ | 944 | $ | 1,007 | $ | 372 | $ | 316 |
| | | | | | | | | | | | | | |
The following summary presents information about certain balance sheet items of the partnership, on a segmented basis, as of June 30, 2014 and December 31, 2013:
| | Total assets | Total liabilities | Total equity attributable to unitholders |
| (US$ Millions) | Jun. 30, 2014 | Dec. 31, 2013 | Jun. 30, 2014 | Dec. 31, 2013 | Jun. 30, 2014 | Dec. 31, 2013 |
| Office | $ | 36,383 | $ | 34,725 | $ | 18,086 | $ | 17,509 | $ | 15,113 | $ | 7,910 |
| Retail | | 10,692 | | 9,492 | | 915 | | 848 | | 8,398 | | 7,704 |
| Industrial | | 2,934 | | 2,759 | | 1,317 | | 1,241 | | 434 | | 463 |
| Multi-family and Hotels | | 4,988 | | 5,375 | | 3,811 | | 4,235 | | 578 | | 462 |
| Corporate | | 124 | | 95 | | 6,294 | | 3,623 | | (6,201) | | (2,915) |
| Total | $ | 55,121 | $ | 52,446 | $ | 30,423 | $ | 27,456 | $ | 18,322 | $ | 13,624 |
The following table provides a reconciliation of NOI and FFO to net income attributable to unitholders for the three and six months ended June 30, 2014 and 2013:
| | Three months ended Jun. 30, | Six months ended Jun. 30, |
| (US$ Millions) | | 2014 | | 2013 | | 2014 | | 2013 |
| Commercial property revenue | $ | 742 | $ | 711 | $ | 1,465 | $ | 1,459 |
| Hospitality revenue | | 264 | | 331 | | 539 | | 660 |
| Direct commercial property expense | | (331) | | (293) | | (645) | | (598) |
| Direct hospitality expense | | (202) | | (262) | | (415) | | (514) |
| NOI | | 473 | | 487 | | 944 | | 1,007 |
| Investment and other revenue | | 209 | | 44 | | 266 | | 99 |
| Share of equity accounted income excluding fair value gains | | 131 | | 95 | | 273 | | 199 |
| Interest expense | | (307) | | (276) | | (595) | | (543) |
| Administration and other expense | | (95) | | (65) | | (179) | | (111) |
| Depreciation and amortization of non-real estate assets | | (10) | | (11) | | (20) | | (22) |
| Non-controlling interests of others in operating subsidiaries and properties in FFO | | (193) | | (141) | | (317) | | (313) |
| FFO(1) | | 208 | | 133 | | 372 | | 316 |
| Depreciation and amortization of real estate assets | | (27) | | (43) | | (56) | | (65) |
| Fair value gains, net | | 1,014 | | 376 | | 1,582 | | 590 |
| Share of equity accounted fair value gains | | 170 | | 67 | | 256 | | 195 |
| Income tax expense | | (269) | | (196) | | (689) | | (295) |
| Non-controlling interests of others in operating subsidiaries and properties in non-FFO | | (204) | | (184) | | (201) | | (259) |
| Net income attributable to unitholders(1) | | 892 | | 153 | | 1,264 | | 482 |
Net income attributable to non-controlling interests of others in operating subsidiaries and properties | | 397 | | 325 | | 518 | | 572 |
| Net income | $ | 1,289 | $ | 478 | $ | 1,782 | $ | 1,054 |
| (1) | Represents interests attributable to LP Units and Exchange LP and REU’s (defined as Redeemable/Exchangeable and special limited partnership units). The interests attributable to limited partner units of Exchange LP and REU’s are presented as non-controlling interests in the condensed consolidated statements of income. |
On July 18, 2014, the partnership settled a specific litigation that was being pursued against the partnership for A$27 million. See Note 27 for further information.