Management’s Discussion and Analysis of Financial Results
INTRODUCTION
This management’s discussion and analysis (“MD&A”) of Brookfield Property Partners L.P. (“BPY”, the “partnership”, or “we”) covers the financial position as of March 31, 2017 and December 31, 2016 and results of operations for the three months ended March 31, 2017 and 2016. This MD&A should be read in conjunction with the unaudited condensed consolidated financial statements (the “Financial Statements”) and related notes as of March 31, 2017, included elsewhere in this report, and our annual report for the year ended December 31, 2016 on Form 20-F.
STATEMENT REGARDING FORWARD-LOOKING STATEMENTS AND USE OF NON-IFRS MEASURES
This MD&A, particularly “Objectives and Financial Highlights – Overview of the Business” and “Additional Information – Trend Information”, contains “forward-looking information” within the meaning of Canadian provincial securities laws and applicable regulations and “forward-looking statements” within the meaning of “safe harbor” provisions of the United States Private Securities Litigation Reform Act of 1995. Forward-looking statements include statements that are predictive in nature, depend upon or refer to future events or conditions, include statements regarding our operations, business, financial condition, expected financial results, performance, prospects, opportunities, priorities, targets, goals, ongoing objectives, strategies and outlook, as well as the outlook for North American and international economies for the current fiscal year and subsequent periods, and include words such as “expects”, “anticipates”, “plans”, “believes”, “estimates”, “seeks”, “intends”, “targets”, “projects”, “forecasts”, “likely”, or negative versions thereof and other similar expressions, or future or conditional verbs such as “may”, “will”, “should”, “would” and “could”.
Although we believe that our anticipated future results, performance or achievements expressed or implied by the forward-looking statements and information are based upon reasonable assumptions and expectations, the reader should not place undue reliance on forward-looking statements and information because they involve known and unknown risks, uncertainties and other factors, many of which are beyond our control, which may cause our actual results, performance or achievements to differ materially from anticipated future results, performance or achievement expressed or implied by such forward-looking statements and information.
Factors that could cause actual results to differ materially from those contemplated or implied by forward-looking statements include, but are not limited to: risks incidental to the ownership and operation of real estate properties including local real estate conditions; the impact or unanticipated impact of general economic, political and market factors in the countries in which we do business; the ability to enter into new leases or renew leases on favorable terms; business competition; dependence on tenants’ financial condition; the use of debt to finance our business; the behavior of financial markets, including fluctuations in interest and foreign exchanges rates; uncertainties of real estate development or redevelopment; global equity and capital markets and the availability of equity and debt financing and refinancing within these markets; risks relating to our insurance coverage; the possible impact of international conflicts and other developments including terrorist acts; potential environmental liabilities; changes in tax laws and other tax related risks; dependence on management personnel; illiquidity of investments; the ability to complete and effectively integrate acquisitions into existing operations and the ability to attain expected benefits therefrom; operational and reputational risks; catastrophic events, such as earthquakes and hurricanes; and other risks and factors detailed from time to time in our documents filed with the securities regulators in Canada and the United States, as applicable.
We caution that the foregoing list of important factors that may affect future results is not exhaustive. When relying on our forward-looking statements or information, investors and others should carefully consider the foregoing factors and other uncertainties and potential events. Except as required by law, we undertake no obligation to publicly update or revise any forward-looking statements or information, whether written or oral, that may be as a result of new information, future events or otherwise.
We disclose a number of financial measures in this MD&A that are calculated and presented using methodologies other than in accordance with International Financial Reporting Standards (“IFRS”) as issued by the International Accounting Standards Board (“IASB”). We utilize these measures in managing our business, including performance measurement, capital allocation and valuation purposes and believe that providing these performance measures on a supplemental basis to our IFRS results is helpful to investors in assessing our overall performance. These financial measures should not be considered as a substitute for similar financial measures calculated in accordance with IFRS. We caution readers that these non-IFRS financial measures may differ from the calculations disclosed by other businesses, and as a result, may not be comparable to similar measures presented by others. Reconciliations of these non-IFRS financial measures to the most directly comparable financial measures calculated and presented in accordance with IFRS, where applicable, are included within this MD&A.
OBJECTIVES AND FINANCIAL HIGHLIGHTS
BASIS OF PRESENTATION
Our sole material asset is our 37% interest in Brookfield Property L.P. (the “Operating Partnership”). As we have the ability to direct its activities pursuant to our rights as owners of the general partner units, we consolidate the Operating Partnership. Accordingly, our Financial Statements reflect 100% of its assets, liabilities, revenues, expenses and cash flows, including non-controlling interests therein, which capture the ownership interests of other third parties.
We also discuss the results of operations on a segment basis, consistent with how we manage our business. The partnership’s operating segments are organized into four reportable segments: i) Core Office, ii) Core Retail, iii) Opportunistic and iv) Corporate. These segments are independently and regularly reviewed and managed by the Chief Executive Officer, who is considered the Chief Operating Decision Maker.
Our partnership’s equity interests include general partnership units (“GP Units”), publicly traded limited partnership units (“LP Units”), redeemable/exchangeable partnership units of the Operating Partnership (“Redeemable/Exchangeable Partnership Units”), special limited partnership units of the Operating Partnership (“Special LP Units”) and limited partnership units of Brookfield Office Properties Exchange L (“Exchange LP Units”). Holders of the GP Units, LP Units, Redeemable/Exchangeable Partnership Units, Special LP Units, and Exchange LP Units will be collectively referred to throughout this MD&A as “Unitholders”. The LP Units, Redeemable/Exchangeable Partnership Units and Exchange LP Units have the same economic attributes in all respects, except that the Redeemable/Exchangeable Partnership Units have provided Brookfield Asset Management Inc. (“Brookfield Asset Management”) the right to request that its units be redeemed for cash consideration. In the event that Brookfield Asset Management exercises this right, our partnership has the right, at its sole discretion, to satisfy the redemption request with its LP Units, rather than cash, on a one-for-one basis. As a result, Brookfield Asset Management, as holder of Redeemable/ Exchangeable Partnership Units, participates in earnings and distributions on a per unit basis equivalent to the per unit participation of the LP Units of our partnership. However, given the redeemable feature referenced above, we present the Redeemable/ Exchangeable Partnership Units as a component of non-controlling interests. The Exchange LP Units are exchangeable at any time on a one-for-one basis, at the option of the holder, for LP Units. As a result of this redemption feature, we present the Exchange LP Units as a component of non-controlling interests.
This MD&A includes financial data for the three months ended March 31, 2017 and includes material information up to May 10, 2017. Financial data has been prepared using accounting policies in accordance with IFRS as issued by the IASB. Non-IFRS measures used in this MD&A are reconciled to or calculated from such financial information. Unless otherwise specified, all operating and other statistical information is presented as if we own 100% of each property in our portfolio, regardless of whether we own all of the interests in each property, excluding information relating to our interests in China Xintiandi. We believe this is the most appropriate basis on which to evaluate the performance of properties in the portfolio relative to each other and others in the market. All dollar references, unless otherwise stated, are in millions of U.S. Dollars. Canadian Dollars (“C$”), Australian Dollars (“A$”), British Pounds (“£”), Euros (“€”), Brazilian Reais (“R$”), Indian Rupees (“₨”), Chinese Yuan (“C¥”), South Korean Won (“₩”), and United Arab Emirates Dirham (“AED”) are identified where applicable.
Additional information is available on our website at bpy.brookfield.com, or on www.sedar.com or www.sec.gov.
OVERVIEW OF THE BUSINESS
We are Brookfield Asset Management’s flagship public commercial property entity and the primary vehicle through which it invests in real estate on a global basis. We are a globally-diversified owner and operator of high-quality properties that typically generate stable and sustainable cash flows over the long term. Our goal is to be a leading global owner and operator of real estate, providing investors with a diversified exposure to some of the most iconic properties in the world and to acquire high-quality assets at a discount to replacement cost or intrinsic value. With approximately 16,000 employees involved in Brookfield Asset Management’s real estate businesses around the globe, we have built operating platforms across our three reporting segments:
| |
| • | Core Office segment, which includes our 100% common equity interest in Brookfield Office Properties Inc. (“BPO”) and our 50% interest in Canary Wharf Group plc (“Canary Wharf”); |
| |
| • | Core Retail segment, which includes our 29% interest in GGP Inc. (“GGP”) (34% on a fully diluted basis, assuming all outstanding warrants are exercised); and |
| |
| • | Opportunistic segment through investments in Brookfield-sponsored real estate funds. |
Through these platforms, we have amassed a portfolio of premier properties and development sites around the globe, including:
| |
| • | 146 office properties totaling approximately 101 million square feet primarily located in the world’s leading commercial markets such as New York, London, Los Angeles, Washington, D.C., Sydney, Toronto, and Berlin; |
| |
| • | Office and urban multifamily development sites that enable the construction of 32 million square feet of new properties; |
| |
| • | 127 regional malls and urban retail properties containing over 125 million square feet in the United States; |
| |
| • | 112 opportunistic office properties comprising over 29 million square feet of office space in the United States, United Kingdom, Brazil, India and South Korea; |
| |
| • | Over 26 million square feet of opportunistic retail space across 43 properties across the United States and in select Brazilian markets; |
| |
| • | Over 45 million square feet of industrial space across 183 industrial properties, primarily consisting of modern logistics assets in North America and Europe; |
| |
| • | Approximately 29,300 multifamily units across 100 properties throughout the United States; |
| |
| • | Eighteen hospitality assets with over 13,700 rooms across North America, Europe and Australia; |
| |
| • | 336 properties that are leased to automotive dealerships across the United States and Canada on a triple net lease basis; |
| |
| • | 189 self-storage facilities comprising approximately 15 million square feet throughout the United States; |
| |
| • | Sixteen student housing properties with over 6,800 beds in the United Kingdom; and |
| |
| • | 135 manufactured housing communities with approximately 32,300 sites across the United States. |
Our diversified portfolio of high-quality office and retail assets in some of the world’s most dynamic markets has a stable cash flow profile due to its long-term leases. In addition, as a result of the mark-to-market of rents upon lease expiry, escalation provisions in leases and projected increases in occupancy, these assets should generate strong same-property net operating income (“NOI”) growth without significant capital investment. Furthermore, we expect to earn between 8% and 11% unlevered, pre-tax returns on construction costs for our development and redevelopment projects and 20% on our equity invested in Brookfield-sponsored real estate opportunity funds. With this cash flow profile, our goal is to pay an attractive annual distribution to our Unitholders and to grow our distribution by 5% to 8% per annum.
Overall, we seek to earn leveraged after-tax returns of 12% to 15% on our invested capital. These returns will be comprised of current cash flow and capital appreciation. Capital appreciation will be reflected in the fair value gains that flow through our income statement as a result of our revaluation of investment properties in accordance with IFRS to reflect initiatives that increase property level cash flows, change the risk profile of the asset, or to reflect changes in market conditions. From time to time, we will convert some or all of these unrealized gains to cash through asset sales, joint ventures or refinancings.
We believe our global scale and best-in-class operating platforms provide us with a unique competitive advantage as we are able to efficiently allocate capital around the world toward those sectors and geographies where we see the greatest returns. We actively recycle assets on our balance sheet as they mature and reinvest the proceeds into higher yielding investment strategies, further enhancing returns. In addition, due to the scale of our stabilized portfolio and flexibility of our balance sheet, our business model is self-funding and does not require us to access capital markets to fund our continued growth.
PERFORMANCE MEASURES
We expect to generate returns to Unitholders from a combination of cash flow earned from our operations and capital appreciation. Furthermore, if we are successful in increasing cash flow earned from our operations we will be able to increase distributions to Unitholders to provide them with an attractive current yield on their investment.
To measure our performance against these targets, we focus on NOI, same-property NOI, funds from operations (“FFO”), Company FFO, fair value changes, net income attributable to Unitholders and equity attributable to Unitholders. Some of these performance metrics do not have standardized meanings prescribed by IFRS and therefore may differ from similar metrics used by other companies. We define each of these measures as follows:
| |
| • | NOI: revenues from our commercial and hospitality operations of consolidated properties less direct commercial property and hospitality expenses. |
| |
| • | Same-property NOI: a subset of NOI, which excludes NOI that is earned from assets acquired, disposed of or developed during the periods presented, or not of a recurring nature, and from opportunistic assets. |
| |
| • | FFO: net income, prior to fair value gains, net, depreciation and amortization of real estate assets, and income taxes less non-controlling interests of others in operating subsidiaries and properties therein. When determining FFO, we include our proportionate share of the FFO of unconsolidated partnerships and joint ventures and associates, as well as gains (or losses) related to properties developed for sale. |
| |
| • | Company FFO: FFO before the impact of depreciation and amortization of non-real estate assets, transaction costs, gains (losses) associated with non-investment properties, imputed interest and the FFO that would have been attributable to the partnership’s shares of GGP if all outstanding warrants of GGP were exercised on a cashless basis. It also includes dilution adjustments to undiluted FFO as a result of the net settled warrants. |
| |
| • | Fair value changes: includes the increase or decrease in the value of investment properties that is reflected in the consolidated statements of income. |
| |
| • | Net income attributable to Unitholders: net income attributable to holders of GP Units, LP Units, Redeemable/Exchangeable Partnership Units, Special LP Units and Exchange LP Units. |
| |
| • | Equity attributable to Unitholders: equity attributable to holders of GP Units, LP Units, Redeemable/Exchangeable Partnership Units, Special LP Units and Exchange LP Units. |
NOI is a key indicator of our ability to impact operating performance of our properties. We seek to grow NOI through pro-active management and leasing of our properties. Same-property NOI allows us to segregate the performance of leasing and operating initiatives on the portfolio from the impact to performance of investing activities and “one-time items”, which for the historical periods presented consist primarily of lease termination income.
We also consider FFO an important measure of our operating performance. FFO is a widely recognized measure that is frequently used by securities analysts, investors and other interested parties in the evaluation of real estate entities, particularly those that own and operate income producing properties. Our definition of FFO includes all of the adjustments that are outlined in the National Association of Real Estate Investment Trusts (“NAREIT”) definition of FFO, including the exclusion of gains (or losses) from the sale of investment properties, the add back of any depreciation and amortization related to real estate assets and the adjustment for unconsolidated partnerships and joint ventures. We also add back the gains (or losses) related to properties developed for sale. In addition to the adjustments prescribed by NAREIT, we also make adjustments to exclude any unrealized fair value gains (or losses) that arise as a result of reporting under IFRS, and income taxes that arise as certain of our subsidiaries are structured as corporations as opposed to real estate investment trusts (“REITs”). These additional adjustments
result in an FFO measure that is similar to that which would result if our partnership was organized as a REIT that determined net income in accordance with generally accepted accounting principles in the United States (“U.S. GAAP”), which is the type of organization on which the NAREIT definition is premised. Our FFO measure will differ from other organizations applying the NAREIT definition to the extent of certain differences between the IFRS and U.S. GAAP reporting frameworks, principally related to the recognition of lease termination income. Because FFO excludes fair value gains (losses), including equity accounted fair value gains (losses), realized gains (losses) on the sale of investment properties, depreciation and amortization of real estate assets and income taxes, it provides a performance measure that, when compared year-over-year, reflects the impact on operations from trends in occupancy rates, rental rates, operating costs and interest costs, providing perspective not immediately apparent from net income. We reconcile FFO to net income on page 9 rather than cash flow from operating activities as we believe net income is the most comparable measure.
In addition, we consider Company FFO a useful measure for securities analysts, investors and other interested parties in the evaluation of our partnership’s performance. Company FFO, similar to FFO discussed above, provides a performance measure that reflects the impact on operations of trends in occupancy rates, rental rates, operating costs and interest costs. In addition, the adjustments to Company FFO relative to FFO allow the partnership insight into these trends for the real estate operations, by adjusting for non-real estate components.
Net income attributable to unitholders is used by the partnership to evaluate the performance of the partnership as a whole as each of the unitholders participates in the economics of the partnership equally. In calculating net income attributable to unitholders per unit, the partnership excludes the impact of mandatorily convertible preferred units in determining the average number of units outstanding as the holders of mandatorily convertible preferred units do not participate in current earnings.
In addition to monitoring, analyzing and reviewing earnings performance, we also review initiatives and market conditions that contribute to changes in the fair value of our investment properties. These value changes, combined with earnings, represent a total return on the equity attributable to Unitholders and form an important component in measuring how we have performed relative to our targets.
We also consider the following items to be important drivers of our current and anticipated financial performance:
| |
| • | Increases in occupancies by leasing vacant space and pre-leasing pending developments; |
| |
| • | Increases in rental rates through maintaining or enhancing the quality of our assets and as market conditions permit; and |
| |
| • | Reductions in operating costs through achieving economies of scale and diligently managing contracts. |
We also believe that key external performance drivers include the availability of the following:
| |
| • | Debt capital at a cost and on terms conducive to our goals; |
| |
| • | Equity capital at a reasonable cost; |
| |
| • | New property acquisitions and other investments that fit into our strategic plan; and |
| |
| • | Investors for dispositions of peak value or non-core assets. |
FINANCIAL STATEMENTS ANALYSIS
REVIEW OF CONSOLIDATED FINANCIAL RESULTS
In this section, we review our financial position and consolidated performance as of March 31, 2017 and December 31, 2016 and for the three months ended March 31, 2017 and 2016. Further details on our results from operations and our financial positions are contained within the “Segment Performance” section beginning on page 12.
Our investment approach is to acquire high-quality assets at a discount to replacement cost or intrinsic value. We have been actively pursuing this strategy through our flexibility to allocate capital to real estate sectors and geographies with the best risk-adjusted returns and to participate in transactions through our investments in various Brookfield Asset Management-sponsored real estate funds. Some of the more significant transactions are highlighted below:
Significant Developments in the first quarter of 2017
During the first quarter of 2017, we acquired a portfolio of manufactured housing communities across the U.S. for consideration of approximately $768 million in our Opportunistic segment, including the assumption of debt. We also acquired a portfolio of office properties across the U.S. for consideration of approximately $214 million in our Opportunistic segment. In our Core office segment, we sold a 50% interest in the Principal Place - Commercial development for £346 million and a realized gain of $203 million. We retained joint control of the resulting joint venture and will account for our remaining interest as an equity accounted investment. In addition, we reclassified our equity accounted investment in 245 Park Avenue in New York to assets held for sale. We sold our interest in the property subsequent to quarter-end on May 5, 2017.
Significant Developments in the first quarter of 2016
During the first quarter of 2016, we acquired a portfolio of self-storage facilities across the U.S. for consideration of approximately $320 million in our Opportunistic segment, including the assumption of debt. In our Core Office segment, we sold World Square Retail in Sydney for A$285 million and a realized gain of $112 million and Royal Centre in Vancouver for C$428 million and a realized gain of $171 million.
Summary Operating Results
|
| | | | | | |
| | Three months ended Mar. 31, | |
| (US$ Millions) | 2017 |
| 2016 |
|
| Commercial property revenue | $ | 995 |
| $ | 820 |
|
| Hospitality revenue | 374 |
| 392 |
|
| Investment and other revenue | 159 |
| 35 |
|
| Total revenue | 1,528 |
| 1,247 |
|
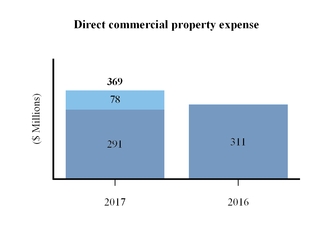
| Direct commercial property expense | 369 |
| 311 |
|
| Direct hospitality expense | 263 |
| 265 |
|
| Investment and other expense | 122 |
| — |
|
| Interest expense | 472 |
| 416 |
|
| Depreciation and amortization | 63 |
| 64 |
|
| General and administrative expense | 151 |
| 131 |
|
| Total expenses | 1,440 |
| 1,187 |
|
| Fair value (losses) gains, net | (76 | ) | 337 |
|
| Share of earnings from equity accounted investments | 333 |
| 130 |
|
| Income before taxes | 345 |
| 527 |
|
| Income tax expense | 158 |
| 87 |
|
| Net income | $ | 187 |
| $ | 440 |
|
| Net income attributable to non-controlling interests of others in operating subsidiaries and properties | 353 |
| 189 |
|
| Net (loss) income attributable to Unitholders | $ | (166 | ) | $ | 251 |
|
| | | |
NOI(1) | $ | 737 |
| $ | 636 |
|
FFO(1) | $ | 202 |
| $ | 195 |
|
Company FFO(1) | $ | 237 |
| $ | 217 |
|
| |
(1) | This is a non-IFRS measure our partnership uses to assess the performance of its operations as described in the “Performance Measures” section on page 3. An analysis of the measures and reconciliation to IFRS measures is included in the “Reconciliation of Non-IFRS measures” section starting on page 9. |
Our basic and diluted net income attributable to Unitholders per unit and weighted average units outstanding are calculated as follows:
|
| | | | | | |
| | Three months ended Mar. 31, | |
| (US$ Millions, except per share information) | 2017 |
| 2016 |
|
Net (loss) income attributable to Unitholders - basic(1) | $ | (166 | ) | $ | 251 |
|
Dilutive effect of conversion of capital securities - corporate(2) | — |
| 10 |
|
| Net (loss) income attributable to Unitholders - diluted | $ | (166 | ) | $ | 261 |
|
| | | |
Weighted average number of units outstanding - basic(1) | 776.9 |
| 781.2 |
|
Conversion of capital securities - corporate and options(2) | — |
| 38.3 |
|
| Weighted average number of units outstanding - diluted | 776.9 |
| 819.5 |
|
Net (loss) income per unit attributable to Unitholders - basic(1) | $ | (0.21 | ) | $ | 0.32 |
|
Net (loss) income per unit attributable to Unitholders - diluted(2) | $ | (0.21 | ) | $ | 0.32 |
|
| |
(1) | Basic net income attributable to Unitholders per unit requires the inclusion of preferred shares of the Operating Partnership that are mandatorily convertible into LP Units without an add back to earnings of the associated carry on the preferred shares. |
| |
(2) | The effect of the conversion of capital securities and options is anti-dilutive for the three months ended March 31, 2017. |
Commercial property revenue and direct commercial property expense
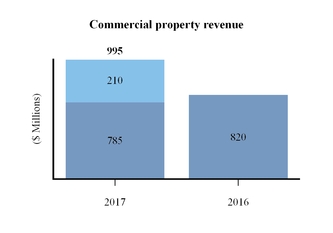

For the three months ended March 31, 2017, commercial property revenue increased by $175 million compared to the same period in the prior year, as a result of incremental capital allocated to higher yielding opportunistic activities, and same-property growth in our Core Office segment. Acquisitions made in 2016 and 2017, including the acquisition of the mixed-use International Finance Center Seoul (“IFC”) complex, the privatization of Rouse Properties, Inc. (“Rouse”), and acquisitions of self-storage, student housing, and manufactured housing portfolios contributed to a $210 million increase in revenue. These increases were offset by the disposition or partial disposition of mature office assets, some of which resulted in the deconsolidation of certain commercial properties that provided the capital to pursue the aforementioned acquisitions. Significant dispositions, full or partial, include One Shelley Street in Sydney, One New York Plaza in New York City, Royal Centre in Vancouver and Moor Place in London.
Direct commercial property expense increased by $58 million largely additional expense relating to acquisitions during 2016 and 2017 as mentioned above. These increases were offset by the disposition of mature assets and the deconsolidation of certain commercial assets. Margins in 2017 were 62.9%, an improvement of 0.8% over 2016.
Hospitality revenue and direct hospitality expense
Hospitality revenue decreased to $374 million for the three months ended March 31, 2017, compared to $392 million in the same period in the prior year. Direct hospitality expense decreased to $263 million for the three months ended March 31, 2017, compared to $265 million in the same period in the prior year. Margins in 2017 were 29.7%, a decrease of 2.7% over 2016. The decrease is primarily the result of the timing of the Easter holiday, which occurred during the first quarter in 2016 and the second quarter in 2017.
Investment and other revenue and investment and other expense
Investment and other revenue includes management fees, leasing fees, development fees, interest income and other non-rental revenue. Investment and other revenue increased by $124 million for the three months ended March 31, 2017 as compared to the same period in the prior year. Investment and other expense increased by $122 million for the three months ended March 31, 2017 as compared to the same period in the prior year. These increases were primarily due to revenue and expenses we recorded from the sale of develop-for-sale assets in our multifamily and industrial businesses.
Interest expense
Interest expense increased by $56 million for the three months ended March 31, 2017 as compared to the same period in the prior year. This was due to the assumption of debt obligations as a result of acquisition activity and through incremental debt raised from temporary drawdowns on our credit facilities to source the capital required for acquisitions and an increase in the weighted average variable interest rate during the year. These increases were partially offset by disposition activity and the impact of foreign exchange.
General and administrative expense
General and administrative expense increased by $20 million for the three months ended March 31, 2017 as compared to the same period in the prior year. This increase was primarily attributable to operating costs of newly acquired entities offset by dispositions of mature assets during the period. In addition, we recorded transaction expenses during the first quarter of 2017, related to acquisitions, of $21 million compared to $11 million during the first quarter of 2016.
Fair value gains, net
While we measure and record our commercial properties and developments using valuations prepared by management in accordance with our policy, external appraisals and market comparables, when available, are used for recently acquired properties and to support our valuations.
|
| |
| |
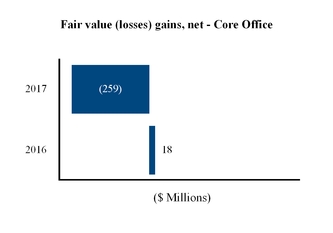
Fair value losses, net for our Core Office sector of ($259) million were recognized in the three months ended March 31, 2017. These losses primarily related to properties in Downtown New York as a result of changes in valuation metrics and leasing activity.
The prior year included fair value gains related to properties in New York, Vancouver and Sydney as a result of leasing and transaction activity, including a fair value gain realized on the disposition of Royal Centre during the first quarter of 2016. These gains were offset by fair value losses on energy-dependent markets, including Houston and Calgary. |
| |
| |
| |
| |
| |
| |
| |
| |
| |
| |
|
| |
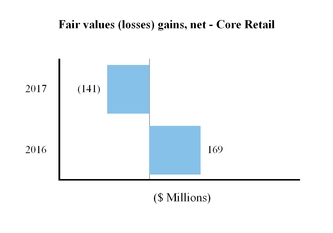
| | Fair value (losses) gains, net for the Core Retail segment relate to the depreciation or appreciation of our warrants in GGP which fluctuate with changes in the market price of the underlying shares. |
| |
| |
| |
| |
| |
| |
| |
| |
| |
|
| |
| |
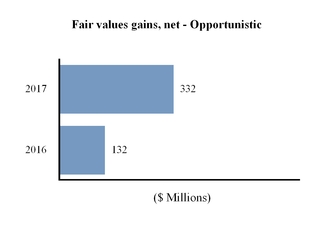
Fair value gains, net for the Opportunistic segment of $332 million were recognized in the three months ended March 31, 2017, including a $115 million bargain purchase gain on our manufactured housing portfolio as a result of changes in the underlying market conditions since signing the purchase and sale agreement. In addition, we recorded fair value gains from our multifamily portfolio, due to increases in rental rates, resulting from renovation work that has been completed to date. Additionally, in our opportunistic office portfolio, market conditions in India improved, resulting in discount and capitalization rate compression. |
| |
| |
| |
| |
| |
| |
| |
| |
| |
In addition, for the three months ended March 31, 2017, we recorded fair value losses, net of $8 million (2016 - fair value gains, net of $18 million), primarily related to mark-to-market adjustments of financial instruments and the settlement of derivative contracts during the quarter.
Share of net earnings from equity accounted investments
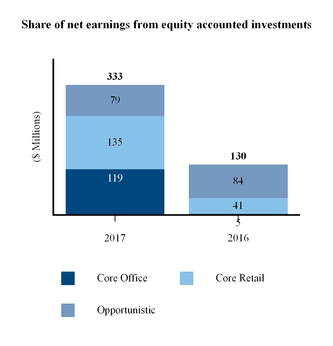
Our most material equity accounted investments are Canary Wharf and Manhattan West in our Core Office sector, GGP in our Core Retail sector and the Diplomat hotel and our interest in the second value-add multifamily fund in our Opportunistic segment.
|
|
Our share of net earnings from equity accounted investments was $333 million for the three months ended March 31, 2017, which represents an increase of $203 million compared to the prior year. The increase was driven by our Core Office sector as a result of fair value gains on developments in the United Kingdom. Additionally, the prior year included losses on certain derivative contracts within our equity accounted investments during the quarter, which contributed to an ($88) million fair value loss from equity accounted investments.
|
Reconciliation of Non-IFRS measures
As described in the “Performance Measures” section on page 3, our partnership uses non-IFRS measures to assess the performance of its operations. An analysis of the measures and reconciliation to IFRS measures is included below.
Commercial property NOI increased by $117 million to $626 million during the three months ended March 31, 2017 compared with $509 million during the same period in the prior year. The increase was primarily driven by new acquisitions across our portfolio offset by the disposition of mature assets, the deconsolidation of certain assets following partial dispositions thereof and the negative impact of foreign exchange.
Hospitality NOI decreased by $16 million to $111 million during the three months ended March 31, 2017 compared with $127 million during the same period in the prior year. This decrease is primarily due to seasonality and weaker performance at the Atlantis as a result of the timing of the Easter holiday compared to the prior year.
The following table reconciles NOI to net income for the three months ended March 31, 2017 and 2016:
|
| | | | | | |
| | Three months ended Mar. 31, | |
| (US$ Millions) | 2017 |
| 2016 |
|
| Commercial property revenue | $ | 995 |
| $ | 820 |
|
| Direct commercial property expense | (369 | ) | (311 | ) |
| Commercial property NOI | 626 |
| 509 |
|
| Hospitality revenue | 374 |
| 392 |
|
| Direct hospitality expense | (263 | ) | (265 | ) |
| Hospitality NOI | 111 |
| 127 |
|
| Total NOI | 737 |
| 636 |
|
| Investment and other revenue | 159 |
| 35 |
|
| Share of net earnings from equity accounted investments | 333 |
| 130 |
|
| Interest expense | (472 | ) | (416 | ) |
| Depreciation and amortization | (63 | ) | (64 | ) |
| General and administrative expense | (151 | ) | (131 | ) |
| Investment and other expense | (122 | ) | — |
|
| Fair value (losses) gains, net | (76 | ) | 337 |
|
| Income before taxes | 345 |
| 527 |
|
| Income tax expense | (158 | ) | (87 | ) |
| Net income | $ | 187 |
| $ | 440 |
|
| Net income attributable to non-controlling interests | 353 |
| 189 |
|
| Net (loss) income attributable to Unitholders | $ | (166 | ) | $ | 251 |
|
The following table reconciles net income to FFO for the three months ended March 31, 2017 and 2016:
|
| | | | | | |
| | Three months ended Mar. 31, | |
| (US$ Millions) | 2017 |
| 2016 |
|
| Net income | $ | 187 |
| $ | 440 |
|
| Add (deduct): | | |
| Fair value losses (gains), net | 76 |
| (337 | ) |
| Share of equity accounted fair value (gains) losses, net | (121 | ) | 88 |
|
| Depreciation and amortization of real estate assets | 57 |
| 59 |
|
| Income tax expense | 158 |
| 87 |
|
| Non-controlling interests in above items | (155 | ) | (142 | ) |
| FFO | $ | 202 |
| $ | 195 |
|
| Add (deduct): | | |
Depreciation and amortization of real-estate assets, net(1) | 6 |
| 6 |
|
Transaction costs, net(1) | 14 |
| 9 |
|
Gains/losses associated with non-investment properties, net(1) | (1 | ) | (6 | ) |
Imputed interest(2) | 5 |
| — |
|
Net contribution from GGP warrants(3) | 11 |
| 13 |
|
| Company FFO | $ | 237 |
| $ | 217 |
|
| |
(1) | Presented net of non-controlling interests. |
| |
(2) | Represents imputed interest on commercial developments accounted for under the equity method. |
| |
(2) | Represents incremental FFO that would have been attributable to the partnership’s share of GGP, if all outstanding warrants of GGP had been exercised on a cashless basis. It also includes the dilution adjustments to FFO as a result of the net settled warrants. |
FFO increased to $202 million during the three months ended March 31, 2017 compared with $195 million during the same period in the prior year. The increase was driven by acquisition activity since the prior period, including IFC, Rouse, a self-storage portfolio in the U.S., a student housing portfolio in the U.K. and a manufactured housing portfolio in the U.S. FFO also increased as a result positive same-property growth in our Core Office and Core Retail segments. The increase was partially offset by dispositions of mature assets throughout the period and the negative impact of foreign exchange.
Statement of Financial Position Highlights and Key Metrics
|
| | | | | | |
| (US$ Millions) | Mar. 31, 2017 |
| Dec. 31, 2016 |
|
| Investment properties | | |
| Commercial properties | $ | 48,697 |
| $ | 45,699 |
|
| Commercial developments | 2,705 |
| 3,085 |
|
| Equity accounted investments | 16,708 |
| 16,844 |
|
| Property, plant and equipment | 5,407 |
| 5,357 |
|
| Cash and cash equivalents | 1,791 |
| 1,456 |
|
| Assets held for sale | 782 |
| 147 |
|
| Total assets | 81,574 |
| 78,127 |
|
| Debt obligations | 36,043 |
| 33,519 |
|
| Liabilities associated with assets held for sale | — |
| 61 |
|
| Total equity | 34,241 |
| 34,161 |
|
| Equity attributable to Unitholders | $ | 21,992 |
| $ | 22,358 |
|
Equity per unit(1) | $ | 30.42 |
| $ | 30.72 |
|
| |
(1) | Assumes conversion of mandatorily convertible preferred shares. See page 12 for additional information. |
As of March 31, 2017, we had $81,574 million in total assets, compared with $78,127 million at December 31, 2016. This $3,447 million increase reflects acquisition activity since the prior year, including the acquisition of a manufactured housing portfolio, an office portfolio in the U.S. and One Post Street, an office building in San Francisco.
Our investment properties are comprised of commercial, operating, rent-producing properties and commercial developments including active sites and those in planning for future development and land. Commercial properties increased from $45,699 million at the end of 2016 to $48,697 million at March 31, 2017. The increase was largely due to the acquisitions mentioned above, as well as incremental capital spend to maintain or enhance properties and the positive impact of foreign exchange. This was offset by the full or partial disposition of certain assets during the current year.
Commercial developments consist of commercial property development sites, density rights and related infrastructure. The total fair value of development land and infrastructure was $2,705 million at March 31, 2017, a decrease of $380 million from the balance at December 31, 2016. The decrease is primarily attributable to the sale of a 50% interest in Principal Place - Commercial in the United Kingdom during the period, partially offset by incremental capital spend on our active developments.
The following table presents the changes in investment properties from December 31, 2016 to March 31, 2017:
|
| | | | | | |
| Mar. 31, 2017 |
| (US$ Millions) | Commercial properties |
| Commercial developments |
|
| Commercial properties, beginning of period | $ | 45,699 |
| $ | 3,085 |
|
| Acquisitions | 2,709 |
| 30 |
|
| Capital expenditures | 190 |
| 197 |
|
| Dispositions | (245 | ) | (649 | ) |
| Fair value gains, net | (148 | ) | 44 |
|
| Foreign currency translation | 472 |
| 30 |
|
| Transfer between commercial properties and commercial developments | 32 |
| (32 | ) |
| Reclassifications to assets held for sale and other changes | (12 | ) | — |
|
| Commercial properties, end of period | $ | 48,697 |
| $ | 2,705 |
|
Equity accounted investments, decreased by $136 million since December 31, 2016 primarily due to the reclassification of $704 million from equity accounted investments to assets held for sale, which represents our interest in 245 Park Avenue in New York. We sold our interest in the property subsequent to quarter-end on May 5, 2017. This decrease was partially offset by the addition of our remaining interest in Principal Place - Commercial upon sale of a 50% interest in the property and the strengthening of the British Pound against the U.S. Dollar, primarily related to our investment in Canary Wharf.
The following table presents a roll-forward of changes in our equity accounted investments:
|
| | | |
| (US$ Millions) | Mar. 31, 2017 |
|
| Equity accounted investments, beginning of period | $ | 16,844 |
|
| Additions | 246 |
|
| Disposals and return of capital distributions | (26 | ) |
| Share of net income | 333 |
|
| Distributions received | (81 | ) |
| Foreign exchange | 106 |
|
| Reclassification to assets held for sale | (704 | ) |
| Other | (10 | ) |
| Equity accounted investments, end of period | $ | 16,708 |
|
Property, plant and equipment increased by $50 million since December 31, 2016, primarily as the result capital spend and the positive impact of foreign exchange related to our Center Parcs UK portfolio and a hotel at the IFC, partially offset by depreciation expense during the current year.
As of March 31, 2017, assets held for sale included our interest in 245 Park Avenue in New York, one industrial asset in France, a portfolio of industrial assets in Texas and four triple net lease assets in the United States, as we intend to sell controlling interests in these properties to third parties in the next 12 months.
The following table presents changes in our assets held for sale from December 31, 2016 to March 31, 2017:
|
| | | |
| (US$ Millions) | Mar. 31, 2017 |
|
| Assets held for sale, beginning of period | 147 |
|
| Reclassification to/(from) assets held for sale, net | 741 |
|
| Disposals | (107 | ) |
| Fair value adjustments | 1 |
|
| Assets held for sale, end of period | $ | 782 |
|
Our debt obligations increased to $36,043 million at March 31, 2017 from $33,519 million at December 31, 2016. Contributing to this increase was the addition of property-specific borrowings related to acquisition activity during the period, as noted above. These increases were partially offset by the disposition of encumbered assets during the period and the repayment of temporary draws on credit facilities used to fund these acquisitions.
The following table presents additional information on our partnership’s outstanding debt obligations:
|
| | | | | | |
| (US$ Millions) | Mar. 31, 2017 |
| Dec. 31, 2016 |
|
| Corporate borrowings | $ | 735 |
| $ | 1,152 |
|
| Funds subscription facilities | 1,476 |
| 828 |
|
| Non-recourse borrowings | | |
| Property-specific borrowings | 32,536 |
| 30,070 |
|
| Subsidiary borrowings | 1,296 |
| 1,469 |
|
| Total debt obligations | $ | 36,043 |
| $ | 33,519 |
|
| Current | 4,655 |
| 5,096 |
|
| Non-current | 31,388 |
| 28,423 |
|
| Total debt obligations | $ | 36,043 |
| $ | 33,519 |
|
The following table presents the components used to calculate equity attributable to Unitholders per unit:
|
| | | | | | |
| (US$ Millions, except unit information) | Mar. 31, 2017 |
| Dec. 31, 2016 |
|
| Total equity | $ | 34,241 |
| $ | 34,161 |
|
| Less: | | |
| Interests of others in operating subsidiaries and properties | 12,249 |
| 11,803 |
|
| Equity attributable to Unitholders | 21,992 |
| 22,358 |
|
| Mandatorily convertible preferred shares | 1,580 |
| 1,574 |
|
| Total equity attributable to unitholders | 23,572 |
| 23,932 |
|
| Partnership units | 704,787,396 |
| 709,133,314 |
|
| Mandatorily convertible preferred shares | 70,038,910 |
| 70,038,910 |
|
| Total partnership units | 774,826,306 |
| 779,172,224 |
|
| Equity attributable to unitholders per unit | $ | 30.42 |
| $ | 30.72 |
|
Equity attributable to Unitholders was $21,992 million at March 31, 2017, a decrease of $366 million from the balance at December 31, 2016. Assuming the conversion of mandatorily convertible preferred shares, equity attributable to unitholders decreased to $30.42 per unit at March 31, 2017 from $30.72 per unit at December 31, 2016. The decrease was a result of an increase in interests of others in operating subsidiaries following new acquisitions during the period. This decrease was partially offset by fair value gains and income from equity accounted investments recorded during the period, as well as income from new investments.
Interests of others in operating subsidiaries and properties was $12,249 million at March 31, 2017, an increase of $446 million from the balance of $11,803 million at December 31, 2016. The increase was primarily a result of the acquisition of new investments through Brookfield-sponsored funds in which the partnership is a limited partner.
SUMMARY OF QUARTERLY RESULTS
|
| | | | | | | | | | | | | | | | | | | | | | | | |
| | 2017 | 2016 | 2015 |
| (US$ Millions, except per unit information) | Q1 |
| Q4 |
| Q3 |
| Q2 |
| Q1 |
| Q4 |
| Q3 |
| Q2 |
|
| Revenue | $ | 1,528 |
| $ | 1,363 |
| $ | 1,409 |
| $ | 1,333 |
| $ | 1,247 |
| $ | 1,267 |
| $ | 1,267 |
| $ | 1,170 |
|
| Direct operating costs | 632 |
| 639 |
| 621 |
| 594 |
| 576 |
| 573 |
| 573 |
| 504 |
|
| Net income | 187 |
| 92 |
| 1,616 |
| 569 |
| 440 |
| 1,157 |
| 435 |
| 1,165 |
|
| Net (loss) income attributable to unitholders | (166 | ) | (62 | ) | 1,255 |
| 349 |
| 251 |
| 863 |
| 193 |
| 1,026 |
|
| Net (loss) income per share attributable to unitholders - basic | $ | (0.21 | ) | $ | (0.08 | ) | $ | 1.61 |
| $ | 0.45 |
| $ | 0.32 |
| $ | 1.10 |
| $ | 0.25 |
| $ | 1.31 |
|
| Net (loss) income per share attributable to unitholders - diluted | $ | (0.21 | ) | $ | (0.08 | ) | $ | 1.56 |
| $ | 0.44 |
| $ | 0.32 |
| $ | 1.06 |
| $ | 0.25 |
| $ | 1.26 |
|
Revenue varies from quarter to quarter due to acquisitions and dispositions of commercial and other income producing assets, changes in occupancy levels, as well as the impact of leasing activity at market net rents. In addition, revenue also fluctuates as a result of changes in foreign exchange rates and seasonality. Seasonality primarily affects our retail assets, wherein the fourth quarter exhibits stronger performance in conjunction with the holiday season. In addition, our North American hospitality assets generally have stronger performance in the winter and spring months compared to the summer and fall months, while our European hospitality assets exhibit the strongest performance during the summer months. Fluctuations in our net income is also impacted by the fair value of properties in the period to reflect changes in valuation metrics driven by market conditions or property cash flows.
SEGMENT PERFORMANCE
Our operations are organized into four operating segments which include Core Office, Core Retail, Opportunistic and Corporate.
The following table presents FFO by segment:
|
| | | | | | |
| | Three months ended Mar. 31, | |
| (US$ Millions) | 2017 |
| 2016 |
|
| Core Office | $ | 147 |
| $ | 144 |
|
| Core Retail | 99 |
| 103 |
|
| Opportunistic | 69 |
| 64 |
|
| Corporate | (113 | ) | (116 | ) |
| FFO | $ | 202 |
| $ | 195 |
|
The following table presents equity attributable to Unitholders by segment as of March 31, 2017 and December 31, 2016:
|
| | | | | | |
| (US$ Millions) | Mar. 31, 2017 |
| Dec. 31, 2016 |
|
| Core Office | $ | 14,369 |
| $ | 14,626 |
|
| Core Retail | 8,649 |
| 8,707 |
|
| Opportunistic | 4,888 |
| 4,653 |
|
| Corporate | (5,914 | ) | (5,628 | ) |
| Equity attributable to Unitholders | $ | 21,992 |
| $ | 22,358 |
|
Core Office
Our Core Office segment consists of interests in 146 office properties totaling approximately 101 million square feet, which are located primarily in the world’s leading commercial markets such as New York, London, Los Angeles, Washington, D.C., Sydney, Toronto, and Berlin, among others and consists primarily of our 100% common share interest in BPO and our 50% joint venture interest in Canary Wharf.
The following table presents FFO and net income attributable to Unitholders in our Core Office segment for the three months ended March 31, 2017 and 2016:
|
| | | | | | |
| | Three months ended Mar. 31, | |
| (US$ Millions) | 2017 |
| 2016 |
|
| FFO | $ | 147 |
| $ | 144 |
|
| Net (loss) income attributable to Unitholders | (190 | ) | 83 |
|
FFO from our Core Office segment was $147 million for the three months ended March 31, 2017 as compared to $144 million in the same period in the prior year. This increase is largely attributable to rental income being recognized from same-property growth, offset by the impact of full and partial dispositions and the impact of foreign exchange.
Net income attributable to Unitholders decreased by $273 million to $(190) million during the three months ended March 31, 2017 as compared to $83 million during the same period in 2016. The decrease was primarily a result of higher fair value losses recorded due to valuation metrics and leasing during the period primarily in Downtown New York.
The following table presents key operating metrics for our Core Office portfolio as at and for the three months ended March 31, 2017 and 2016:
|
| | | | | | | | | | | | |
| | Consolidated | Unconsolidated |
| (US$ Millions, except where noted) | Mar. 31, 2017 |
| Mar. 31, 2016 |
| Mar. 31, 2017 |
| Mar. 31, 2016 |
|
| Total portfolio: | | | | |
NOI(1) | $ | 274 |
| $ | 283 |
| $ | 111 |
| $ | 124 |
|
| Number of properties | 74 |
| 86 |
| 72 |
| 67 |
|
| Leasable square feet (in thousands) | 51,206 |
| 54,939 |
| 30,594 |
| 26,792 |
|
| Occupancy | 88.7 | % | 91.1 | % | 92.8 | % | 93.8 | % |
In-place net rents (per square foot)(2) | $ | 32.80 |
| $ | 27.47 |
| $ | 37.85 |
| $ | 39.67 |
|
| Same-property: | | | | |
NOI(1,2) | $ | 269 |
| $ | 256 |
| $ | 108 |
| $ | 111 |
|
| Number of properties | 66 |
| 66 |
| 56 |
| 56 |
|
| Leasable square feet (in thousands) | 50,782 |
| 50,690 |
| 25,013 |
| 25,020 |
|
| Occupancy | 91.0 | % | 91.1 | % | 92.2 | % | 93.7 | % |
In-place net rents (per square foot)(2) | $ | 28.35 |
| $ | 27.67 |
| $ | 43.16 |
| $ | 44.42 |
|
| |
(1) | NOI for unconsolidated properties is presented on a proportionate basis, representing the Unitholders’ interest in the properties. |
| |
(2) | Prior period presented using the March 31, 2017 exchange rate. |
NOI from our consolidated properties decreased to $274 million during the three months ended March 31, 2017 from $283 million during the same period in 2016. This decrease was primarily due to dispositions in New York, Vancouver, Sydney, and London, offset by the incremental NOI contribution from new leases, primarily in Downtown New York.
Same-property NOI for our consolidated properties for the three months ended March 31, 2017 compared with the same period in the prior year increased by $13 million to $269 million. This increase was primarily the result of lease commencements in Downtown New York and higher in-place net rents.
NOI from our unconsolidated properties, which is presented on a proportionate basis, decreased by $13 million to $111 million during the three months ended March 31, 2017, compared to $124 million during the period in the prior year. This decrease primarily reflects the inclusion of Principal Place - Commercial in unconsolidated properties.
The following table presents certain key operating metrics related to leasing activity in our Core Office segment for the three months ended March 31, 2017 and 2016:
|
| | | | | | |
| | Total portfolio |
| (US$ Millions, except where noted) | Mar. 31, 2017 |
| Mar. 31, 2016 |
|
| Leasing activity (square feet in thousands) | | |
| New leases | 913 |
| 723 |
|
| Renewal leases | 1,177 |
| 781 |
|
| Total leasing activity | 2,090 |
| 1,504 |
|
| Average term (in years) | 8.2 |
| 8.2 |
|
Year one leasing net rents (per square foot)(1) | $ | 33.38 |
| $ | 30.10 |
|
Average leasing net rents (per square foot)(1) | 37.12 |
| 30.91 |
|
Expiring net rents (per square foot)(1) | 29.61 |
| 29.53 |
|
Estimated market net rents for similar space (per square foot)(1) | 39.34 |
| 38.36 |
|
| Tenant improvement and leasing costs (per square foot) | 84.98 |
| 22.43 |
|
| |
(1) | Presented using normalized foreign exchange rates, using the March 31, 2017 exchange rate. |
For the three months ended March 31, 2017, we leased approximately 2.1 million square feet at average in-place net rents of $37.12 per square foot. Approximately 44% of our leasing activity represented new leases. Our overall Core Office portfolio’s in-place net rents are currently 17% below market net rents, which gives us confidence that we will be able to increase our NOI in the coming years, as we sign new leases. For the three months ended March 31, 2017, tenant improvements and leasing costs related to leasing activity were $84.98 per square foot, compared to $22.43 per square foot in the prior year.
We calculate net rent as the annualized amount of cash rent receivable from leases on a per square foot basis including tenant expense reimbursements, less operating expenses being incurred for that space, excluding the impact of straight-lining rent escalations or amortization of free rent periods. This measure represents the amount of cash, on a per square foot basis, generated from leases in a given period.
The following table presents fair value (losses) from consolidated and unconsolidated investments in our Core Office segment for the three months ended March 31, 2017 and 2016:
|
| | | | | | |
| | Three months ended Mar. 31, | |
| (US$ Millions) | 2017 |
| 2016 |
|
| Consolidated properties | $ | (259 | ) | $ | 18 |
|
Unconsolidated properties(1) | 29 |
| (75 | ) |
| Total fair value (losses), net | $ | (230 | ) | $ | (57 | ) |
| |
(1) | Fair value gains for unconsolidated properties are presented on a proportionate basis, representing the Unitholders’ interest in the investment. |
We recorded fair value losses, net of $230 million in the three months ended March 31, 2017 as compared to $57 million in the same period in the prior year. The loss was driven by fair value losses on our New York office portfolios in the current period, partially offset by fair value gains in our Sydney and Toronto office portfolios. The prior year included fair value losses on derivative contracts in Canary Wharf, partially offset by fair value gains in our New York and Vancouver portfolios.
The key valuation metrics for commercial properties in our Core Office segment on a weighted-average basis are as follows:
|
| | | | | | | | | | | |
| | Mar. 31, 2017 | Dec. 31, 2016 |
| | Discount rate |
| Terminal capitalization rate |
| Investment horizon (years) | Discount rate |
| Terminal capitalization rate |
| Investment horizon (years) |
|
| Consolidated properties | | | | | | |
| United States | 7.0 | % | 5.7 | % | 12 | 6.8 | % | 5.6 | % | 12 |
|
| Canada | 6.2 | % | 5.5 | % | 10 | 6.2 | % | 5.5 | % | 10 |
|
| Australia | 7.1 | % | 6.1 | % | 10 | 7.3 | % | 6.1 | % | 10 |
|
| Europe | 6.0 | % | 5.0 | % | 12 | 6.0 | % | 5.0 | % | 12 |
|
| Brazil | 9.3 | % | 7.5 | % | 10 | 9.3 | % | 7.5 | % | 10 |
|
| Unconsolidated properties | | | | | | |
| United States | 6.4 | % | 5.4 | % | 11 | 6.3 | % | 5.3 | % | 11 |
|
| Australia | 7.1 | % | 6.0 | % | 10 | 7.1 | % | 6.0 | % | 10 |
|
Europe(1) | 5.1 | % | 4.8 | % | 10 | 5.1 | % | 4.8 | % | 10 |
|
| |
(1) | Certain properties are in the United Kingdom accounted for under the equity method are valued using both discounted cash flow and yield models. For comparative purposes, the discount and terminal capitalization rates and investment horizon calculated under the discounted cash flow method are presented in the table above. |
The following table provides an overview of the financial position of our Core Office segment as at March 31, 2017 and December 31, 2016:
|
| | | | | | |
| (US$ Millions) | Mar. 31, 2017 |
| Dec. 31, 2016 |
|
| Investment properties | | |
| Commercial properties | $ | 23,329 |
| $ | 23,102 |
|
| Commercial developments | 1,778 |
| 2,297 |
|
| Equity accounted investments | 7,098 |
| 7,390 |
|
| Participating loan interests | 446 |
| 471 |
|
| Accounts receivable and other | 836 |
| 869 |
|
| Cash and cash equivalents | 431 |
| 398 |
|
| Assets held for sale | 704 |
| — |
|
| Total assets | $ | 34,622 |
| $ | 34,527 |
|
| Debt obligations | 13,433 |
| 13,328 |
|
| Capital securities | 974 |
| 1,091 |
|
| Accounts payable and other liabilities | 1,328 |
| 1,403 |
|
| Deferred tax liabilities | 1,400 |
| 1,310 |
|
| Non-controlling interests of others in operating subsidiaries and properties | 3,118 |
| 2,769 |
|
| Equity attributable to Unitholders | $ | 14,369 |
| $ | 14,626 |
|
Equity attributable to Unitholders decreased by $257 million to $14,369 million at March 31, 2017 from $14,626 million at December 31, 2016. The decrease was primarily a result of reinvesting net proceeds from the disposition of mature assets into higher-yielding opportunistic investments.
Commercial properties totaled $23,329 million at March 31, 2017, compared to $23,102 million at December 31, 2016. The increase was primarily due to the acquisition of One Post Street in San Francisco and the positive impact of foreign exchange, offset by valuation losses.
Commercial developments decreased by $519 million between December 31, 2016 and March 31, 2017. The decrease is as a result of the subsequent transfer of our interest in the Principal Place - Commercial to equity accounted investments as a result of the sale of a 50% interest in the property, partially offset by incremental capital expenditures on active developments during the period.
The following table summarizes the scope and progress of active developments in our Core Office segment as of March 31, 2017:
|
| | | | | | | | | | | | | | | | | | |
| | Total square feet under construction (in 000’s) |
| Proportionate square feet under construction (in 000’s) |
| Expected date of cash stabilization | | Cost | Loan |
| (Millions, except square feet in thousands) | Percent pre-leased | Total(1) |
| To-date |
| Total |
| Drawn |
|
| Office: | | | | | | | | |
L’Oreal Brazil Headquarters, Rio de Janeiro(2) | 197 |
| 92 |
| Q4 2017 | 100% | R$ | 137 |
| R$ | 113 |
| R$ | — |
| R$ | — |
|
| Brookfield Place East Tower, Calgary | 1,400 |
| 1,400 |
| Q3 2018 | 81% | C$ | 726 |
| C$ | 623 |
| C$ | 575 |
| C$ | 353 |
|
London Wall Place, London(2) | 505 |
| 253 |
| Q2 2020 | 71% | £ | 203 |
| £ | 177 |
| £ | 137 |
| £ | 98 |
|
One Manhattan West, Midtown New York(2) | 2,117 |
| 1,186 |
| Q4 2020 | 37% | $ | 1,063 |
| $ | 340 |
| $ | 700 |
| $ | 129 |
|
655 New York Avenue, Washington, D.C.(2) | 766 |
| 383 |
| Q2 2021 | 70% | $ | 285 |
| $ | 127 |
| $ | 200 |
| $ | 34 |
|
| 100 Bishopsgate, London | 938 |
| 938 |
| Q1 2023 | 60% | £ | 875 |
| £ | 454 |
| £ | 515 |
| £ | 112 |
|
1 Bank Street, London(2) | 715 |
| 358 |
| Q1 2023 | 40% | £ | 247 |
| £ | 89 |
| £ | 225 |
| £ | — |
|
| Multifamily: | | | | | | | | |
Three Manhattan West, Midtown New York(2) | 587 |
| 329 |
| Q3 2018 | n/a | $ | 414 |
| $ | 332 |
| $ | 268 |
| $ | 172 |
|
Camarillo, California(2) | 413 |
| 409 |
| Q1 2019 | n/a | $ | 127 |
| $ | 56 |
| $ | 83 |
| $ | 9 |
|
Principal Place - Residential, London(2)(3) | 303 |
| 152 |
| Q1 2019 | n/a | £ | 190 |
| £ | 74 |
| £ | 122 |
| £ | 16 |
|
One and Three York Square & Belvedere Gardens(2)(3) | 529 |
| 132 |
| Q3 2019 | n/a | £ | 164 |
| £ | 67 |
| £ | 96 |
| £ | 17 |
|
New District - 10 Park Drive(2)(3) | 269 |
| 135 |
| Q4 2019 | n/a | £ | 117 |
| £ | 71 |
| £ | 98 |
| £ | 12 |
|
Studio Plaza, Maryland(2) | 343 |
| 296 |
| Q4 2019 | n/a | $ | 106 |
| $ | 28 |
| $ | 69 |
| $ | — |
|
Greenpoint Landing Building G, New York(2) | 250 |
| 238 |
| Q4 2019 | n/a | $ | 273 |
| $ | 96 |
| $ | 179 |
| $ | — |
|
Newfoundland, London(2) | 546 |
| 273 |
| Q4 2020 | n/a | £ | 242 |
| £ | 96 |
| £ | 174 |
| £ | — |
|
New District - 8 Water Street & 2 George Street, London(2) | 371 |
| 186 |
| Q4 2020 | n/a | £ | 151 |
| £ | 78 |
| £ | 115 |
| £ | 12 |
|
| Total | 10,249 |
| 6,760 |
| | | | | | |
| |
(1) | Net of NOI earned during stabilization. |
| |
(2) | Cost and construction loan information is presented on a proportionate basis at our ownership in these developments. |
| |
(3) | Represents condominium/market sale developments. |
The following table presents changes in our partnership’s equity accounted investments in the Core Office segment from December 31, 2016 to March 31, 2017:
|
| | | |
| (US$ Millions) | Mar. 31, 2017 |
|
| Equity accounted investments, beginning of period | $ | 7,390 |
|
| Additions | 226 |
|
| Share of net income, including fair value gains | 119 |
|
| Distributions received | (21 | ) |
| Foreign exchange | 91 |
|
| Reclassification to assets held for sale | (704 | ) |
| Other | (3 | ) |
| Equity accounted investments, end of period | $ | 7,098 |
|
Equity accounted investments decreased by $292 million since December 31, 2016 to $7,098 million at March 31, 2017. The decrease was primarily driven by the transfer of our interest in 245 Park Avenue to assets held for sale during the period. This decrease was partially offset by the addition of Principal Place - Commercial that was deconsolidated as a result of a partial disposition, the impact of the strengthening British Pound, and share of net income.
At March 31, 2017, we have interests in one property classified as assets held for sale, as mentioned above, as we intend to sell controlling interests in this property to a third party in the next 12 months.
Debt obligations increased from $13,328 million at December 31, 2016 to $13,433 million at March 31, 2017. This increase is the result of refinancing activity of property-level debt related to office properties and drawdowns on existing facilities to fund capital expenditures on development properties.
The following table provides additional information on our outstanding capital securities in our Core Office segment:
|
| | | | | | | | | | |
| (US$ Millions) | Shares outstanding |
| Cumulative dividend rate |
| Mar. 31, 2017 |
| Dec. 31, 2016 |
|
| BPO Class AAA Preferred Shares: | | | | |
Series G(1) | 3,120,314 |
| 5.25 | % | $ | 78 |
| $ | 81 |
|
Series J(1)(2) | 2,434,062 |
| 5.00 | % | 46 |
| 123 |
|
Series K(2) | — |
| 5.20 | % | — |
| 93 |
|
| BPO Class B Preferred Shares: | | | | |
Series 1(3) | 3,600,000 |
| 70% of bank prime |
| — |
| — |
|
Series 2(3) | 3,000,000 |
| 70% of bank prime |
| — |
| — |
|
| Capital Securities – Fund Subsidiaries | | | 850 |
| 794 |
|
| Total capital securities | | | $ | 974 |
| $ | 1,091 |
|
| |
(1) | BPY and its subsidiaries own 1,003,549 and 370,733 shares of Series G and Series J Class AAA preferred shares of BPO as of March 31, 2017, respectively, which has been reflected as a reduction in outstanding shares of the BPO Class AAA Preferred Shares. |
| |
(2) | On March 31, 2017, BPO redeemed 4,760,750 shares of Series J and 5,909,250 shares of Series K Class AAA preferred shares of BPO for C$25.00 plus accrued and unpaid dividends The partnership held 1,000,000 and 1,004,586 shares of the Series J and K shares, respectively, prior to redemption. |
| |
(3) | Class B, Series 1 and 2 capital securities - corporate are owned by Brookfield Asset Management. BPO has an offsetting loan receivable against these securities earning interest at 95% of bank prime. |
We had $850 million of capital securities – fund subsidiaries outstanding at March 31, 2017 as compared to $794 million at December 31, 2016. Capital securities – fund subsidiaries includes $808 million (December 31, 2016 - $753 million) of equity interests in Brookfield DTLA Holdings LLC (“DTLA”) held by co-investors in the fund, which have been classified as a liability, rather than as non-controlling interest, as holders of these interests can cause DTLA to redeem their interests in the fund for cash equivalent to the fair value of the interests on October 15, 2023, and on every fifth anniversary thereafter. In addition, capital securities – fund subsidiaries also includes $42 million at March 31, 2017 (December 31, 2016 - $41 million) which represents the equity interests held by the partnership’s co-investor in the D.C. Fund which have been classified as a liability, rather than as non-controlling interest, due to the fact that on June 18, 2023, and on every second anniversary thereafter, the holders of these interests can redeem their interests in the D.C. Fund for cash equivalent to the fair value of the interests.
Reconciliation of Non-IFRS Measures – Core Office
The key components of NOI in our Core Office segment are presented below:
|
| | | | | | |
| | Three months ended Mar. 31, | |
| (US$ Millions) | 2017 |
| 2016 |
|
| Commercial property revenue | $ | 503 |
| $ | 514 |
|
| Direct commercial property expense | (229 | ) | (231 | ) |
| Total NOI | $ | 274 |
| $ | 283 |
|
The following table reconciles Core Office NOI to net income for the three months ended March 31, 2017 and 2016:
|
| | | | | | |
| | Three months ended Mar. 31, | |
| (US$ Millions) | 2017 |
| 2016 |
|
| Same-property net operating income | $ | 269 |
| $ | 256 |
|
| Currency variance | — |
| (3 | ) |
| Net operating income related to acquisitions and dispositions | 5 |
| 30 |
|
| Total NOI | 274 |
| 283 |
|
| Investment and other revenue | 22 |
| 20 |
|
| Interest expense | (161 | ) | (167 | ) |
| Depreciation and amortization on non-real estate assets | (3 | ) | (4 | ) |
| Share of net earnings from equity accounted investments | 119 |
| 5 |
|
| General and administrative expense | (42 | ) | (35 | ) |
| Fair value (losses) gains, net | (259 | ) | 18 |
|
| Income before taxes | (50 | ) | 120 |
|
| Income tax expense | (91 | ) | (21 | ) |
| Net (loss) income | (141 | ) | 99 |
|
| Net income attributable to non-controlling interests | 49 |
| 16 |
|
| Net (loss) income attributable to Unitholders | $ | (190 | ) | $ | 83 |
|
The following table reconciles Core Office net income to FFO for the three months ended March 31, 2017 and 2016:
|
| | | | | | |
| | Three months ended Mar. 31, | |
| (US$ Millions) | 2017 |
| 2016 |
|
| Net income | $ | (141 | ) | $ | 99 |
|
| Add (deduct): | | |
| Fair value losses (gains), net | 259 |
| (18 | ) |
| Share of equity accounted fair value losses (gains), net | (29 | ) | 75 |
|
| Income tax expense | 91 |
| 21 |
|
| Non-controlling interests in above items | (33 | ) | (33 | ) |
| FFO | $ | 147 |
| $ | 144 |
|
The following table reconciles Core Office share of net earnings from equity accounted investments for three months ended March 31, 2017 and 2016:
|
| | | | | | |
| | Three months ended Mar. 31, | |
| (US$ Millions) | 2017 |
| 2016 |
|
| Unconsolidated properties NOI | $ | 111 |
| $ | 124 |
|
| Unconsolidated properties fair value gains, net | 29 |
| (75 | ) |
| Other | (21 | ) | (44 | ) |
| Share of net earnings from equity accounted investments | $ | 119 |
| $ | 5 |
|
Core Retail
Our Core Retail segment consists of 127 regional malls and urban retail properties containing 125 million square feet in the United States through our 29% interest in GGP (34% on a fully-diluted basis, assuming all outstanding warrants are exercised). Our investment in GGP is accounted for under the equity method.
The following table presents FFO and net income attributable to Unitholders in our Core Retail segment for the three months ended March 31, 2017 and 2016:
|
| | | | | | |
| | Three months ended Mar. 31, | |
| (US$ Millions) | 2017 |
| 2016 |
|
| FFO | $ | 99 |
| $ | 103 |
|
| Net income attributable to Unitholders | (6 | ) | 210 |
|
FFO earned in our Core Retail platform for the three months ended March 31, 2017 was $99 million compared to $103 million for the same period in the prior year. The impact of asset sales was partially offset by same-property growth in our portfolio.
Net income attributable to Unitholders decreased by $216 million to $(6) million for the three months ended March 31, 2017 as compared to $210 million during the same period in the prior year. The decrease in net income attributable to Unitholders is primarily due to greater mark-to-market adjustments on our investment in GGP warrants, as a result of a decrease in GGP’s share price in the current quarter as compared to an increase in the comparative quarter in the prior year.
The following table presents key operating metrics in our Core Retail portfolio as at and for the three months ended March 31, 2017 and 2016:
|
| | | | | | |
| | Unconsolidated |
| (US$ Millions, except where noted) | Mar. 31, 2017 |
| Mar. 31, 2016 |
|
| NOI: | | |
Total portfolio(1) | $ | 164 |
| $ | 169 |
|
Same-property(1) | 162 |
| 159 |
|
| Number of malls and urban retail properties | 127 |
| 128 |
|
| Leasable square feet (in thousands) | 125,166 |
| 125,806 |
|
Occupancy(2) | 94.7 | % | 95.3 | % |
In-place net rents (per square foot)(2) | 62.92 |
| 62.42 |
|
Tenant Sales (per square foot)(2) | 591 |
| 588 |
|
| |
(1) | NOI for unconsolidated properties is presented on a proportionate basis, representing the Unitholders’ interest in the investments. |
| |
(2) | Presented on a same-property basis. |
NOI, which is presented on a proportionate basis, decreased to $164 million from $169 million in the prior year, due to the impact of dispositions, which was partially offset by same-property growth. On a same-property basis, NOI on unconsolidated properties increased by $3 million to $162 million from $159 million due to higher in-place net rents, partially offset by a decrease in occupancy.
The results of our operations are primarily driven by changes in occupancy and in-place rental rates. The following table presents new and renewal leases for the trailing 12 months compared to expiring leases for the prior tenant in the same suite, for leases where the downtime between new and previous tenant is less than 24 months, among other metrics.
|
| | | | | | |
| | Total Portfolio |
| (US$ Millions, except where noted) | Mar. 31, 2017 |
| Mar. 31, 2016 |
|
| Number of leases | 1,505 |
| 1,438 |
|
| Leasing activity (square feet in thousands) | 4,834 |
| 4,020 |
|
| Average term in years | 6.8 |
| 7.2 |
|
Initial rent per square foot(1) | $ | 63.60 |
| $ | 66.37 |
|
Expiring rent per square foot(2) | 57.53 |
| 58.73 |
|
| Initial rent spread per square foot | 6.07 |
| 7.64 |
|
| % change | 10.5 | % | 13.0 | % |
| Tenant allowances and leasing costs | 39 |
| 33 |
|
| |
(1) | Represents initial rent over the term consisting of base minimum rent and common area costs. |
| |
(2) | Represents expiring rent at end of lease consisting of base minimum rent and common area costs. |
Through March 31, 2017, we leased approximately 4.8 million square feet at initial rents approximately 10.5% higher than expiring net rents on a suite-to-suite basis. Additionally, for the three months ended March 31, 2017, tenant allowances and leasing costs related to leasing activity were $39 million compared to $33 million during the same period in the prior year.
Our Core Retail portfolio occupancy rate at March 31, 2017 was 94.7%, down 0.6% from the prior year. In our Core Retail segment, we use in-place rents as a measure of leasing performance. In-place rents are calculated on a cash basis and consist of base minimum rent, plus reimbursements of common area costs, and real estate taxes. In-place rents increased to $62.92 at March 31, 2017 from $62.42 at March 31, 2016, as a result of strong leasing activity across our portfolio.
The following table presents our fair value gains (losses), net from our investment in GGP for the three months ended March 31, 2017 and 2016:
|
| | | | | | |
| | Three months ended Mar. 31, | |
| (US$ Millions) | 2017 |
| 2016 |
|
| Fair value (losses) gains, net from GGP warrants | $ | (141 | ) | $ | 169 |
|
Fair value gains, net from GGP(1) | 36 |
| (62 | ) |
| Total fair value (losses) gains | $ | (105 | ) | $ | 107 |
|
| |
(1) | Fair value gains for unconsolidated properties are presented on a proportionate basis, representing the Unitholders’ interest in the investments. |
We recorded total fair value losses, net of $105 million and fair value gains, net of $107 million in our Core Retail segment for the three months ended March 31, 2017 and 2016, respectively. The decrease is primarily attributable to a depreciation of the GGP warrants as a result of a decrease in the market price of the underlying shares in the current quarter compared to appreciation of the GGP warrants as a result of an increase in the market price of the underlying shares in the same period in the prior year.
The key valuation metrics of these properties in our Core Retail segment on a weighted-average basis are presented in the following table. The valuations are most sensitive to changes in the discount rate and timing or variability of cash flows.
|
| | | | | | | | | | | |
| | Mar. 31, 2017 | Dec. 31, 2016 |
| | Discount rate |
| Terminal capitalization rate |
| Investment horizon (years) | Discount rate |
| Terminal capitalization rate |
| Investment horizon (years) |
|
| Unconsolidated properties | | | | | | |
| United States | 7.4 | % | 5.9 | % | 10 | 7.4 | % | 5.9 | % | 10 |
|
Equity attributable to Unitholders in the Core Retail segment decreased by $58 million at March 31, 2017 from December 31, 2016 due to the decrease in the value of GGP warrants discussed above, offset by net income.
The following table presents an overview of the financial position of our Core Retail segment as at March 31, 2017 and December 31, 2016:
|
| | | | | | |
| (US$ Millions) | Mar. 31, 2017 |
| Dec. 31, 2016 |
|
| Equity accounted investments | $ | 7,536 |
| $ | 7,453 |
|
| GGP warrants | 1,113 |
| 1,254 |
|
| Total assets | $ | 8,649 |
| $ | 8,707 |
|
| Total liabilities | — |
| — |
|
| Equity attributable to Unitholders | $ | 8,649 |
| $ | 8,707 |
|
Equity accounted investments increased by $83 million driven by positive net income, including valuation gains on unconsolidated properties, partially offset by dividends received from GGP during the current period.
The following table presents a roll-forward of our partnership’s equity accounted investments from December 31, 2016 to March 31, 2017:
|
| | | |
| (US$ Millions) | Mar. 31, 2017 |
|
| Equity accounted investments, beginning of period | $ | 7,453 |
|
| Additions | — |
|
| Disposals and return of capital distributions | — |
|
| Share of net income, including fair value gains | 135 |
|
| Distributions received | (56 | ) |
| Foreign exchange | 4 |
|
| Other | — |
|
| Equity accounted investments, end of period | $ | 7,536 |
|
Reconciliation of Non-IFRS Measures – Core Retail
The following table reconciles Core Retail NOI to net income for the three months ended March 31, 2017 and 2016:
|
| | | | | | |
| | Three months ended Mar. 31, | |
| (US$ Millions) | 2017 |
| 2016 |
|
| Commercial property revenue | $ | — |
| $ | — |
|
| Direct commercial property expense | — |
| — |
|
| Total NOI | $ | — |
| $ | — |
|
| Fair value (losses) gains, net | (141 | ) | 169 |
|
| Share of net earnings from equity accounted investments | 135 |
| 41 |
|
| Income (loss) before taxes | (6 | ) | 210 |
|
| Income tax (expense) | — |
| — |
|
| Net (loss) income | (6 | ) | 210 |
|
| Net income attributable to non-controlling interests | — |
| — |
|
| Net (loss) income attributable to Unitholders | $ | (6 | ) | $ | 210 |
|
The following table reconciles Core Retail net income to FFO for the three months ended March 31, 2017 and 2016:
|
| | | | | | |
| | Three months ended Mar. 31, | |
| (US$ Millions) | 2017 |
| 2016 |
|
| Net income | $ | (6 | ) | $ | 210 |
|
| Add (deduct): | | |
| Share of equity accounted fair value (gains) losses, net | (36 | ) | 62 |
|
| Fair value losses (gains), net | 141 |
| (169 | ) |
| FFO | $ | 99 |
| $ | 103 |
|
Opportunistic
Our Opportunistic segment is comprised of the following:
| |
| • | 112 office properties comprising over 29 million square feet of office space in the United States, United Kingdom, Brazil and Asia; |
| |
| • | Over 26 million square feet of retail space across 43 properties across the United States and in select Brazilian markets; |
| |
| • | Over 45 million square feet of industrial space across 183 industrial properties, primarily consisting of modern logistics assets in North America and Europe; |
| |
| • | Approximately 29,300 multifamily units across 100 properties throughout the United States; |
| |
| • | Eighteen hospitality assets with over 13,700 rooms in North America, Europe and Australia; |
| |
| • | 336 properties that are leased to automotive dealerships across North America on a triple net lease basis; |
| |
| • | 189 self-storage facilities comprising approximately 15 million square feet throughout the United States; |
| |
| • | Sixteen student housing properties with over 6,800 beds in the United Kingdom; and |
| |
| • | 135 manufactured housing communities with approximately 32,300 sites across the United States. |
The following table presents NOI, FFO and net income attributable to Unitholders in our Opportunistic segment for the three months ended March 31, 2017 and 2016:
|
| | | | | | |
| | Three months ended Mar. 31, | |
| (US$ Millions) | 2017 |
| 2016 |
|
| NOI | $ | 463 |
| $ | 353 |
|
| FFO | 69 |
| 64 |
|
| Net income attributable to Unitholders | 183 |
| 111 |
|
Since the prior year, we have made significant investments in our Opportunistic segment. We have also invested in new asset classes, including manufactured housing. These investments are the primary driver of the increased earnings for the periods presented. These investments include the following:
| |
| • | Acquired a manufactured housing portfolio in the first quarter of 2017; |
| |
| • | Acquired the IFC in South Korea, a 5.4 million square feet mixed-use complex in the fourth quarter of 2016; |
| |
| • | Acquired the remaining common shares of Rouse in the third quarter of 2016; |
| |
| • | Acquired a portfolio of 16 student housing properties across the United Kingdom throughout 2016; |
| |
| • | Acquired the Vintage Estate hotel and specialty retail center in Napa Valley, CA in the second quarter of 2016; |
| |
| • | Acquired a portfolio of 189 self-storage facilities across the United States throughout 2016 and 2017; |
Contributing to the increase in net income attributable to Unitholders were net income from the acquisitions noted above, as well as fair value gains, particularly related to our manufactured housing assets in the U.S, our opportunistic office portfolios in India and Brazil, our multifamily assets in the U.S., our self-storage facilities in the U.S., and our triple net lease portfolio in the U.S. and Canada.
The following table presents key operating metrics for our Opportunistic portfolio as at March 31, 2017 and 2016:
|
| | | | | | | | | | | | | |
| | Equity attributable to Unitholders | March 31, 2017 |
| (US$ Millions, except where noted) | Mar. 31, 2017 |
| Dec. 31, 2016 |
| Number of properties |
| Total area (sq. ft. in thousands) |
| Units of measure | Occupancy % |
|
| Opportunistic Office | $ | 1,062 |
| $ | 951 |
| 112 |
| 29,442 |
| Sq. ft. | 84.8 | % |
| Opportunistic Retail | 1,003 |
| 967 |
| 43 |
| 26,209 |
| Sq. ft. | 82.3 | % |
| Industrial | 529 |
| 558 |
| 183 |
| 45,409 |
| Sq. ft. | 93.0 | % |
| Multifamily | 758 |
| 762 |
| 100 |
| 29,274 |
| Units | 95.3 | % |
| Hospitality | 630 |
| 598 |
| 18 |
| 13,732 |
| Rooms | n/a |
|
| Triple Net Lease | 317 |
| 428 |
| 336 |
| 16,963 |
| Sq. ft. | 100.0 | % |
| Self-storage | 160 |
| 158 |
| 189 |
| 14,721 |
| Sq. ft. | 87.6 | % |
| Student Housing | 80 |
| 69 |
| 16 |
| 6,838 |
| Beds | 98.7 | % |
| Manufactured Housing | 172 |
| — |
| 135 |
| 32,268 |
| Sites | 85.5 | % |
| Finance Funds | 177 |
| 162 |
| n/a |
| n/a |
| n/a | n/a |
|
| Total | $ | 4,888 |
| $ | 4,653 |
|
|
|
|
| | |
The following table presents the contributions to fair value gains, net from consolidated and unconsolidated investments in our Opportunistic segment:
|
| | | | | | |
| | Three months ended Mar. 31, | |
| (US$ Millions) | 2017 |
| 2016 |
|
| Consolidated properties | $ | 332 |
| $ | 132 |
|
Unconsolidated properties(1) | 56 |
| 49 |
|
| Total fair value gains, net | $ | 388 |
| $ | 181 |
|
| |
(1) | Fair value gains for unconsolidated investments are presented on a proportionate basis, representing the Unitholders’ interest in the investments. |
The key valuation metrics of our Opportunistic properties on a weighted-average basis are presented in the following table. The valuations are most sensitive to changes in the discount rate and timing or variability of cash flows.
|
| | | | | | | | | | | | |
| | Mar. 31, 2017 | Dec. 31, 2016 |
| | Discount rate |
| Terminal capitalization rate |
| Investment horizon (years) |
| Discount rate |
| Terminal capitalization rate |
| Investment horizon (years) |
|
| Consolidated properties | | | | | | |
| Opportunistic Office | 8.9 | % | 6.7 | % | 8 |
| 9.9 | % | 7.6 | % | 7 |
|
| Opportunistic Retail | 9.9 | % | 7.7 | % | 11 |
| 10.2 | % | 8.1 | % | 12 |
|
| Industrial | 7.4 | % | 6.5 | % | 10 |
| 7.4 | % | 6.6 | % | 10 |
|
Multifamily(1) | 4.9 | % | n/a |
| n/a |
| 4.9 | % | n/a |
| n/a |
|
Triple Net Lease(1) | 6.2 | % | n/a |
| n/a |
| 6.1 | % | n/a |
| n/a |
|
Self-storage(1) | 5.7 | % | n/a |
| n/a |
| 6.2 | % | n/a |
| n/a |
|
Student Housing(1) | 5.9 | % | n/a |
| n/a |
| 5.9 | % | n/a |
| n/a |
|
Manufactured Housing(1) | 5.9 | % | n/a |
| n/a |
| n/a |
| n/a |
| n/a |
|
| Unconsolidated properties | | | | | | |
| Opportunistic Office | 7.7 | % | 6.1 | % | 10 |
| 7.7 | % | 6.0 | % | 10 |
|
| Opportunistic Retail | 11.0 | % | 9.0 | % | 10 |
| 11.0 | % | 9.0 | % | 10 |
|
| Industrial | 6.8 | % | 6.1 | % | 10 |
| 6.9 | % | 6.1 | % | 10 |
|
Multifamily(1) | 5.5 | % | n/a |
| n/a |
| 5.1 | % | n/a |
| n/a |
|
| |
(1) | The valuation method used to value multifamily, triple net lease, self-storage, student housing and manufactured housing properties is the direct capitalization method which is presented in the discount rate column. The terminal capitalization rate and investment horizon are not applicable under this methodology. |
The following table presents equity attributable to Unitholders in our Opportunistic segment:
|
| | | | | | |
| (US$ Millions) | Mar. 31, 2017 |
| Dec. 31, 2016 |
|
| Investment properties | $ | 26,295 |
| $ | 23,385 |
|
| Property, plant and equipment | 5,323 |
| 5,278 |
|
| Equity accounted investments | 2,074 |
| 2,001 |
|
| Accounts receivable and other | 3,092 |
| 2,899 |
|
| Cash and cash equivalents | 808 |
| 808 |
|
| Assets held for sale | 78 |
| 147 |
|
| Total assets | $ | 37,670 |
| $ | 34,518 |
|
| Debt obligations | 20,399 |
| 18,211 |
|
| Capital securities | 432 |
| 183 |
|
| Accounts payable and other liabilities | 2,073 |
| 1,980 |
|
| Liabilities associated with assets held for sale | — |
| 61 |
|
| Non-controlling interests of others in operating subsidiaries and properties | 9,878 |
| 9,430 |
|
| Equity attributable to Unitholders | $ | 4,888 |
| $ | 4,653 |
|
The increase in investment properties is primarily the result of our acquisition activity, primarily our manufactured housing portfolio, and valuation gains, as well as capital spend.
The increase in property, plant and equipment was the result of capital spend during the quarter and the positive impact of foreign exchange, partially offset by depreciation.
Equity accounted investments increased during the three months ended March 31, 2017 primarily a result of net income from these investments during the period.
Assets held for sale and related liabilities as of March 31, 2017 include certain industrial assets in Texas and France as well as certain triple net lease assets in the United States, as we intend to sell controlling interests in these properties to third parties in the next 12 months.
Debt obligations increased due to the acquisition activity mentioned above.
Reconciliation of Non-IFRS Measures - Opportunistic
NOI to net income:
|
| | | | | | |
| | Three months ended Mar. 31, | |
| (US$ Millions) | 2017 |
| 2016 |
|
| Commercial property revenue | $ | 492 |
| $ | 306 |
|
| Hospitality revenue | 374 |
| 392 |
|
| Direct commercial property expense | (140 | ) | (80 | ) |
| Direct hospitality expense | (263 | ) | (265 | ) |
| Total NOI | 463 |
| 353 |
|
| Investment and other revenue | 137 |
| 15 |
|
| Interest expense | (240 | ) | (175 | ) |
| General and administrative expense | (61 | ) | (49 | ) |
| Investment and other expense | (122 | ) | — |
|
| Depreciation and amortization | (60 | ) | (60 | ) |
| Fair value gains, net | 332 |
| 132 |
|
| Share of net earnings from equity accounted investments | 79 |
| 84 |
|
| Income before taxes | 528 |
| 300 |
|
| Income tax expense | (35 | ) | (11 | ) |
| Net income | 493 |
| 289 |
|
| Net income attributable to non-controlling interests | 310 |
| 178 |
|
| Net income attributable to Unitholders | $ | 183 |
| $ | 111 |
|
The following table reconciles Opportunistic net income to FFO for the three months ended March 31, 2017 and 2016:
|
| | | | | | |
| | Three months ended Mar. 31, | |
| (US$ Millions) | 2017 |
| 2016 |
|
| Net income | $ | 493 |
| $ | 289 |
|
| Add (deduct): | | |
| Fair value gains, net | (332 | ) | (132 | ) |
| Share of equity accounted fair value (gains), net | (56 | ) | (49 | ) |
| Depreciation and amortization of real estate assets | 57 |
| 59 |
|
| Income tax expense | 35 |
| 11 |
|
| Non-controlling interests in above items | (128 | ) | (114 | ) |
| FFO | $ | 69 |
| $ | 64 |
|
Corporate
The following table presents FFO and net income attributable to Unitholders in our corporate segment for the three months ended March 31, 2017 and 2016:
|
| | | | | | |
| | Three months ended Mar. 31, | |
| (US$ Millions) | 2017 |
| 2016 |
|
| FFO | $ | (113 | ) | $ | (116 | ) |
| Net income attributable to Unitholders | (153 | ) | (153 | ) |
Certain amounts are allocated to our corporate segment as those activities should not be used to evaluate our segments’ operating performance. FFO was a loss of $113 million for the three months ended March 31, 2017 compared to a loss of $116 million in the same period in the prior year. Interest expense contributes to this loss and for the three months ended March 31, 2017 was $71 million, which is comprised of $48 million of interest expense paid on capital securities and $23 million of interest expense on our credit facilities. This compares to interest expense of $74 million in the prior year.
Another component of FFO is general and administrative expense, which, for the three months ended March 31, 2017 was $48 million, comprised of $25 million of asset management fees, $5 million of equity enhancement fees and $18 million of other corporate costs. General and administrative expense for the three months ended March 31, 2016 was $47 million and was comprised of $26 million of asset management fees, $8 million of equity enhancement fees and $13 million of other corporate costs.
In addition, during the three months ended March 31, 2017, we recorded fair value losses, net of $8 million (March 31, 2016 - fair value gains, net of $18 million) primarily related to the settlement of foreign currency forward contracts during the period. Consistent with our risk management policy, the partnership uses such derivative instruments to hedge cash flows in foreign currencies. For further information on the partnership’s use of derivative contracts, please refer to “Derivative Financial Instruments” below.
As of March 31, 2017, we also recorded income tax expense of $32 million allocated to the corporate segment compared to $55 million in the same period in the prior year related to deferred tax liabilities of our holding companies and their subsidiaries.
The following table presents equity attributable to Unitholders at the corporate level:
|
| | | | | | |
| (US$ Millions) | Mar. 31, 2017 |
| Dec. 31, 2016 |
|
| Accounts receivable and other | $ | 81 |
| $ | 125 |
|
| Cash and cash equivalents | 552 |
| 250 |
|
| Total assets | 633 |
| 375 |
|
| Debt obligations | 2,211 |
| 1,980 |
|
| Capital securities | 2,902 |
| 2,897 |
|
| Deferred tax liabilities | 462 |
| 431 |
|
| Accounts payable and other liabilities | 1,719 |
| 1,091 |
|
| Non-controlling interests | (747 | ) | (396 | ) |
| Equity attributable to Unitholders | $ | (5,914 | ) | $ | (5,628 | ) |
The corporate balance sheet includes corporate debt and capital securities from our partnership. The increase in corporate debt obligations is primarily a result of an increase in our credit facilities to fund acquisitions in the second real estate opportunity fund during the quarter.
On December 4, 2014, our partnership issued $1,800 million of exchangeable preferred equity securities (“Preferred Equity Units”) to Qatar Investment Authority (“QIA”). At March 31, 2017 and December 31, 2016, the balance related to the Preferred Equity Units recorded within capital securities was $1,580 million and $1,574 million, respectively.
The change in non-controlling interest is primarily related to non-controlling interests in the second Brookfield Asset Management-sponsored opportunity fund.
The following table provides additional information on our outstanding capital securities – corporate:
|
| | | | | | | | | | | |
| (US$ Millions) | | Shares Outstanding |
| Cumulative Dividend Rate |
| Mar. 31, 2017 |
| Dec. 31, 2016 |
|
| Operating Partnership Class A Preferred Equity Units: | | | | |
| Series 1 | | 24,000,000 |
| 6.25 | % | $ | 543 |
| $ | 541 |
|
| Series 2 | | 24,000,000 |
| 6.50 | % | 524 |
| 522 |
|
| Series 3 | | 24,000,000 |
| 6.75 | % | 513 |
| 511 |
|
| Brookfield BPY Holdings Inc. Junior Preferred Shares: | | | | |
| Class B Junior Preferred Shares | | 30,000,000 |
| 5.75 | % | 750 |
| 750 |
|
| Class C Junior Preferred Shares | | 20,000,000 |
| 6.75 | % | 500 |
| 500 |
|
| BOP Split Corp. Senior Preferred Shares: | | | | |
| Class A Series 1 | | 924,390 |
| 5.25 | % | 23 |
| 24 |
|
| Class A Series 2 | | 699,165 |
| 5.75 | % | 13 |
| 13 |
|
| Class A Series 3 | | 913,194 |
| 5.00 | % | 17 |
| 17 |
|
| Class A Series 4 | | 984,586 |
| 5.20 | % | 19 |
| 19 |
|
| Total capital securities - corporate | | | $ | 2,902 |
| $ | 2,897 |
|
In addition, as at March 31, 2017, we had $15 million (December 31, 2016 - $15 million) of preferred shares with a cumulative dividend rate of 5% outstanding. The preferred shares were issued by various holding entities of our partnership.
Reconciliation of Non-IFRS Measures – Corporate
Net income to FFO:
|
| | | | | | |
| | Three months ended Mar. 31, | |
| (US$ Millions) | 2017 |
| 2016 |
|
| Net income (loss) | $ | (159 | ) | $ | (158 | ) |
| Add (deduct): | | |
| Fair value losses (gains), net | 8 |
| (18 | ) |
| Income tax expense | 32 |
| 55 |
|
| Non-controlling interests in above items | 6 |
| 5 |
|
| FFO | $ | (113 | ) | $ | (116 | ) |
LIQUIDITY AND CAPITAL RESOURCES
The capital of our business consists of debt obligations, capital securities, preferred stock and equity. Our objective when managing this capital is to maintain an appropriate balance between holding a sufficient amount of equity capital to support our operations and reducing our weighted average cost of capital to improve our return on equity. As at March 31, 2017, capital totaled $75 billion (December 31, 2016 - $72 billion).
We attempt to maintain a level of liquidity to ensure we are able to participate in investment opportunities as they arise and to better withstand sudden adverse changes in economic circumstances. Our primary sources of liquidity include cash, undrawn committed credit facilities, construction facilities, cash flow from operating activities and access to public and private capital markets. In addition, we structure our affairs to facilitate monetization of longer-duration assets through financings and co-investor participations.
We seek to increase income from our existing properties by maintaining quality standards for our properties that promote high occupancy rates and support increases in rental rates while reducing tenant turnover and related costs, and by controlling operating expenses. Consequently, we believe our revenue, along with proceeds from financing activities and divestitures, will continue to provide the necessary funds to cover our short-term liquidity needs. However, material changes in the factors described above may adversely affect our net cash flows.
Our principal liquidity needs for the current year and for periods beyond include:
| |
| • | Debt service requirements; |
| |
| • | Distributions to Unitholders; |
| |
| • | Capital expenditures deemed mandatory, including tenant improvements; |
| |
| • | Development costs not covered under construction loans; |
| |
| • | Investing activities which could include: |
| |
| ◦ | Discretionary capital expenditures; |
| |
| ◦ | Future developments; and |
| |
| ◦ | Repurchases of our units. |
We plan to meet these liquidity needs by accessing our group-wide liquidity of $6,099 million at March 31, 2017 as highlighted in the table below. In addition, we have the ability to supplement this liquidity through cash generated from operating activities, asset sales, co-investor interests and financing opportunities.
|
| | | | | | |
| (US$ Millions) | Mar. 31, 2017 |
| Dec. 31, 2016 |
|
| Corporate cash and cash equivalents | $ | 242 |
| $ | 125 |
|
| Available committed corporate credit facilities | 761 |
| 869 |
|
| Available subordinated credit facilities | 320 |
| 253 |
|
| Corporate liquidity | 1,323 |
| 1,247 |
|
| Proportionate cash retained at subsidiaries | 1,040 |
| 1,102 |
|
| Proportionate availability under construction facilities | 2,844 |
| 3,013 |
|
| Proportionate availability under subsidiary credit facilities | 892 |
| 992 |
|
Group-wide liquidity(1) | $ | 6,099 |
| $ | 6,354 |
|
| |
(1) | This includes liquidity of investments which are not controlled and can only be obtained through distributions which the partnership does not control. |
We finance our assets principally at the operating company level with asset-specific debt that generally has long maturities, few restrictive covenants and with recourse only to the asset. We endeavor to maintain prudent levels of debt and strive to ladder our principal repayments over a number of years.
The following table summarizes our secured debt obligations on investment properties by contractual maturity over the next five years and thereafter:
|
| | | |
| (US$ Millions) | Mar. 31, 2017 |
|
| Remainder of 2017 | $ | 2,847 |
|
| 2018 | 4,089 |
|
| 2019 | 3,208 |
|
| 2020 | 1,888 |
|
| 2021 | 5,264 |
|
| 2022 and thereafter | 10,909 |
|
| Deferred financing costs | (247 | ) |
| Secured debt obligations | $ | 27,958 |
|
| Loan to value | 54.4 | % |
We generally believe that we will be able to either extend the maturity date, repay, or refinance the debt that is scheduled to mature in 2017-2018.
Our partnership’s operating subsidiaries are subject to limited covenants in respect of their corporate debt and are in full compliance with all such covenants at March 31, 2017. The partnership’s operating subsidiaries are also in compliance with all covenants and other capital requirements related to regulatory or contractual obligations of material consequence to our partnership.
For the three month periods ended March 31, 2017 and 2016, the partnership made distributions to unitholders of $207 million and $199 million, respectively. This compares to cash flow from operating activities of $786 million and $70 million for each period. The cash flow from operating activities exceeded distributions for the three month period ended March 31, 2016. The partnership has a number of alternatives at its disposal to fund any difference between the cash flow from operating activities and distributions to unitholders. The partnership is not a passive investor and typically holds positions of control or significant influence over assets in which it invests, enabling the partnership to influence distributions from those assets. The partnership will, from time to time, convert some or all of the unrealized fair value gains on investment properties to cash through asset sales, joint ventures or refinancings. The partnership may access its credit facilities in order to temporarily fund its distributions as a result of timing differences between the payments of distributions and cash receipts from its investments. For the three month period ended March 31, 2016, the partnership funded the gap between its distributions and cash flow from operating activities through approximately $314 million of realized gains on the disposition of assets with meaningful returns on capital, respectively. Distributions made to unitholders which exceed cash flow from operating activities in future periods may be considered to be a return of capital to unitholders as defined in Canadian Securities Administrators’ National Policy 41-201 - Income Trusts and Indirect Offerings.
RISKS AND UNCERTAINTIES
The financial results of our business are impacted by the performance of our properties and various external factors influencing the specific sectors and geographic locations in which we operate, including: macro-economic factors such as economic growth, changes in currency, inflation and interest rates; regulatory requirements and initiatives; and litigation and claims that arise in the normal course of business.
Our property investments are generally subject to varying degrees of risk depending on the nature of the property. These risks include changes in general economic conditions (including the availability and costs of mortgage funds), local conditions (including an oversupply of space or a reduction in demand for real estate in the markets in which we operate), the attractiveness of the properties to tenants, competition from other landlords with competitive space and our ability to provide adequate maintenance at an economical cost.
Certain significant expenditures, including property taxes, maintenance costs, mortgage payments, insurance costs and related charges, must be made regardless of whether a property is producing sufficient income to service these expenses. Certain properties are subject to mortgages which require substantial debt service payments. If we become unable or unwilling to meet mortgage payments on any property, losses could be sustained as a result of the mortgagee’s exercise of its rights of foreclosure or sale. We believe the stability and long-term nature of our contractual revenues effectively mitigates these risks.
We are affected by local, regional, national and international economic conditions and other events and occurrences that affect the markets in which we own assets. A protracted decline in economic conditions would cause downward pressure on our operating margins and asset values as a result of lower demand for space.
Substantially all of our properties are located in North America, Europe and Australia, with a growing presence in South America and Asia. A prolonged downturn in the economies of these regions would result in reduced demand for space and number of prospective tenants and will affect the ability of our properties to generate significant revenue. If there is an increase in operating costs resulting from inflation and other factors, we may not be able to offset such increases by increasing rents.
We are subject to risks that affect the retail environment, including unemployment, weak income growth, lack of available consumer credit, industry slowdowns and plant closures, consumer confidence, increased consumer debt, poor housing market conditions, adverse weather conditions, natural disasters and the need to pay down existing obligations. All of these factors could negatively affect consumer spending, and adversely affect the sales of our retail tenants. This could have an unfavorable effect on our operations and our ability to attract new retail tenants.
As owners of office, retail, and industrial properties, lease rollovers also present a risk, as continued growth of rental income is dependent on strong leasing markets to ensure expiring leases are renewed and new tenants are found promptly to fill vacancies. Refer to “Lease Rollover Risk” below for further details.
For a more detailed description of the risk factors facing our business, please refer to the section entitled Item 3.D. “Key Information - Risk Factors” in our December 31, 2016 annual report on Form 20-F.
Credit Risk
Credit risk arises from the possibility that tenants may be unable to fulfill their lease commitments. We mitigate this risk by ensuring that our tenant mix is diversified and by limiting our exposure to any one tenant. We also maintain a portfolio that is diversified by property type so that exposure to a business sector is lessened. Government and government agencies comprise 8% of our Core Office segment tenant base and, as at March 31, 2017, no one tenant comprises more than this.
The following list shows the largest tenants by leasable area in our Core Office portfolio and their respective credit ratings and exposure as at March 31, 2017:
|
| | | | |
| Tenant | Primary location | Credit rating(1) | Exposure (%)(2) |
|
| Government and Government Agencies | Various | AAA/AA+ | 8.0 | % |
| Barclays | London | BBB | 2.5 | % |
| Morgan Stanley | NY/Toronto/London | A- | 2.3 | % |
CIBC World Markets(3) | Calgary/NY/Toronto | A+ | 1.8 | % |
| Suncor Energy Inc. | Calgary/Houston | A- | 1.6 | % |
| Bank of Montreal | Calgary/Toronto | A+ | 1.3 | % |
| Bank of America | Merrill Lynch | Denver/NY/LA/Toronto/D.C. | A/A- | 1.3 | % |
| Deloitte | Calgary/Houston/LA/Toronto | Not Rated | 1.3 | % |
| JPMorgan Chase & Co. | Denver/Houston/LA/NY | A | 1.2 | % |
| Royal Bank of Canada | Various | AA- | 1.1 | % |
| Total | | | 22.4 | % |
| |
(1) | From Standard & Poor’s Rating Services, Moody’s Investment Services, Inc. or DBRS Limited. |
(2) Prior to considering the partnership’s interest in partially-owned properties.
(3) CIBC World Markets leases 1.1 million square feet at 300 Madison Avenue in New York, of which they sublease 925,000 square feet to PricewaterhouseCoopers LLP and
approximately 100,000 square feet to Sumitomo Corporation of America.
The following list reflects the largest tenants in our Core Retail portfolio as at March 31, 2017. The largest ten tenants in our portfolio accounted for approximately 21.1% of minimum rents, tenant recoveries and other.
|
| | | |
| Tenant | DBA | Exposure (%)(1) |
|
| L Brands, Inc. | Victoria's Secret, Bath & Body Works, PINK, Henri Bendel | 3.6 | % |
| Foot Locker, Inc | Footlocker, Champs Sports, Footaction USA, House of Hoops, SIX:02 | 2.8 | % |
| The Gap, Inc | Gap, Banana Republic, Old Navy, Athleta | 2.7 | % |
| Forever 21 Retail, Inc | Forever 21 | 2.2 | % |
| Abercrombie & Fitch Stores, Inc | Abercrombie, Abercrombie & Fitch, Hollister | 2.0 | % |
| Ascena Retail Group | Dress Barn, Justice, Lane Bryant, Maurices, Ann Taylor, Loft | 1.7 | % |
| Signet Jewelers Limited | Zales, Gordon's, Kay, Jared | 1.7 | % |
| Genesco Inc | Journeys, Lids, Underground Station, Johnston & Murphy | 1.5 | % |
| Luxottica Group S.P.A. | Lenscrafters, Sunglass Hut, Pearle Vision | 1.5 | % |
| Express, Inc | Express, Express Men | 1.4 | % |
| Total | | 21.1 | % |
| |
(1) | Exposure is a percentage of minimum rents and tenant recoveries. |
Lease Roll-over Risk
Lease roll-over risk arises from the possibility that we may experience difficulty renewing leases as they expire or in re-leasing space vacated by tenants upon early lease expiry. We attempt to stagger the lease expiry profile so that we are not faced with disproportionate amounts of space expiring in any one year. On average, approximately 10% of our office, retail and industrial leases mature annually up to 2021. We further mitigate this risk by maintaining a diversified portfolio mix by geographic location and by pro-actively leasing space in advance of its contractual expiry. We do not consider the lease-roll risk for our multifamily, hospitality, triple net lease, self-storage, student housing and manufactured housing portfolios as the lease lives in each of these respective portfolios are relatively short.
The following table sets out lease expiries, by square footage, for our office, retail and industrial portfolios at March 31, 2017, including our unconsolidated investments:
|
| | | | | | | | | | | | | | | | | | | | |
| (Sq. ft. in thousands) | Current |
| 2017 |
| 2018 |
| 2019 |
| 2020 |
| 2021 |
| 2022 |
| 2023 |
| 2024 and beyond |
| Total |
|
| Core Office | 6,940 |
| 1,752 |
| 4,721 |
| 4,239 |
| 5,522 |
| 5,715 |
| 5,733 |
| 5,654 |
| 41,524 |
| 81,800 |
|
| Total % expiring | 8.5 | % | 2.1 | % | 5.8 | % | 5.2 | % | 6.8 | % | 7.0 | % | 7.0 | % | 6.9 | % | 50.7 | % | 100.0 | % |
Core Retail(1) | 2,251 |
| 3,626 |
| 6,049 |
| 6,051 |
| 4,400 |
| 4,664 |
| 4,419 |
| 3,663 |
| 18,381 |
| 53,504 |
|
| Total % expiring | 4.2 | % | 6.8 | % | 11.3 | % | 11.3 | % | 8.2 | % | 8.7 | % | 8.3 | % | 6.8 | % | 34.4 | % | 100.0 | % |
| Opportunistic Office | 3,316 |
| 1,544 |
| 1,907 |
| 2,954 |
| 3,156 |
| 3,386 |
| 1,542 |
| 289 |
| 3,751 |
| 21,845 |
|
| Total % expiring | 15.2 | % | 7.1 | % | 8.7 | % | 13.5 | % | 14.4 | % | 15.5 | % | 7.1 | % | 1.3 | % | 17.2 | % | 100.0 | % |
Opportunistic Retail(1) | 1,431 |
| 1,012 |
| 1,527 |
| 1,331 |
| 1,320 |
| 1,207 |
| 765 |
| 653 |
| 4,111 |
| 13,357 |
|
| Total % expiring | 10.7 | % | 7.6 | % | 11.4 | % | 10.0 | % | 9.9 | % | 9.0 | % | 5.7 | % | 4.9 | % | 30.8 | % | 100.0 | % |
| Industrial | 3,189 |
| 1,526 |
| 7,037 |
| 5,558 |
| 6,312 |
| 5,804 |
| 3,085 |
| 1,994 |
| 10,904 |
| 45,409 |
|
| Total % expiring | 7.0 | % | 3.4 | % | 15.5 | % | 12.2 | % | 13.9 | % | 12.8 | % | 6.8 | % | 4.4 | % | 24.0 | % | 100.0 | % |
(1) Represents regional malls only and excludes traditional anchor and specialty leasing agreements.
Tax Risk
We are subject to income taxes in various jurisdictions, and our tax liabilities are dependent upon the distribution of income among these different jurisdictions. Our effective income tax rate is influenced by a number of factors, including changes in tax law, tax treaties, interpretation of existing laws, and our ability to sustain our reporting positions on examination. Changes in any of those factors could change our effective tax rate, which could adversely affect our profitability and results of operations.
Environmental Risk
As an owner of real property, we are subject to various federal, provincial, state and municipal laws relating to environmental matters. Such laws provide that we could be liable for the costs of removing certain hazardous substances and remediating certain hazardous locations. The failure to remove such substances or remediate such locations, if any, could adversely affect our ability to sell such real estate or to borrow using such real estate as collateral and could potentially result in claims against us. We are not aware of any material non-compliance with environmental laws at any of our properties nor are we aware of any pending or threatened investigations or actions by environmental regulatory authorities in connection with any of our properties or any pending or threatened claims relating to environmental conditions at our properties.
We will continue to make the necessary capital and operating expenditures to ensure that we are compliant with environmental laws and regulations. Although there can be no assurances, we do not believe that costs relating to environmental matters will have a materially adverse effect on our business, financial condition or results of operations. However, environmental laws and regulations can change and we
may become subject to more stringent environmental laws and regulations in the future, which could have an adverse effect on our business, financial condition or results of operations.
Economic Risk
Real estate is relatively illiquid. Such illiquidity may limit our ability to vary our portfolio promptly in response to changing economic or investment conditions. Also, financial difficulties of other property owners resulting in distressed sales could depress real estate values in the markets in which we operate.
Our commercial properties generate a relatively stable source of income from contractual tenant rent payments. Continued growth of rental income is dependent on strong leasing markets to ensure expiring leases are renewed and new tenants are found promptly to fill vacancies. We are substantially protected against short-term market conditions, as most of our leases are long-term in nature with an average term of over six years.
Insurance Risk
Our insurance may not cover some potential losses or may not be obtainable at commercially reasonable rates. We maintain insurance on our properties in amounts and with deductibles that we believe are in line with what owners of similar properties carry. We maintain all risk property insurance and rental value coverage (including coverage for the perils of flood, earthquake and weather catastrophe).
Interest Rate and Financing Risk
We have an on-going need to access debt markets to refinance maturing debt as it comes due. There is a risk that lenders will not refinance such maturing debt on terms and conditions acceptable to us or on any terms at all. Our strategy to stagger the maturities of our mortgage portfolio attempts to mitigate our exposure to excessive amounts of debt maturing in any one year and to maintain relationships with a large number of lenders to limit exposure to any one counterparty.
Approximately 49% of our outstanding debt obligations at March 31, 2017 are floating rate debt compared to 50% at December 31, 2016. This debt is subject to fluctuations in interest rates. A 100 basis point increase in interest rates relating to our corporate and commercial floating rate debt obligations would result in an increase in annual interest expense of approximately $176 million. A 100 basis point increase in interest rates relating to fixed rate debt obligations due within one year would result in an increase in annual interest expense of approximately $21 million upon refinancing. In addition, we have exposure to interest rates within our equity accounted investments. We have mitigated, to some extent, the exposure to interest rate fluctuations through interest rate derivative contracts. See “Derivative Financial Instruments” below in this MD&A.
At March 31, 2017, our consolidated debt to capitalization was 48% (December 31, 2016 – 47%). It is our view this level of indebtedness is conservative given the cash flow characteristics of our properties and the fair value of our assets. Based on this, we believe that all debts will be financed or repaid as they come due in the foreseeable future.
Foreign Exchange Risk
As at and for the three months ended March 31, 2017, approximately 34% of our assets and 30% of our revenues originated outside the United States and consequently are subject to foreign currency risk due to potential fluctuations in exchange rates between these currencies and the U.S. Dollar. To mitigate this risk, we attempt to maintain a natural hedged position with respect to the carrying value of assets through debt agreements denominated in local currencies and, from time to time, supplemented through the use of derivative contracts as discussed under “Derivative Financial Instruments”.
DERIVATIVE FINANCIAL INSTRUMENTS
We and our operating entities use derivative and non-derivative instruments to manage financial risks, including interest rate, commodity, equity price and foreign exchange risks. The use of derivative contracts is governed by documented risk management policies and approved limits. We do not use derivatives for speculative purposes. We and our operating entities use the following derivative instruments to manage these risks:
| |
| • | Foreign currency forward contracts to hedge exposures to Canadian Dollar, Australian Dollar, British Pound, Euro, Chinese Yuan, Brazilian Real, Indian Rupee and South Korean Won denominated investments in foreign subsidiaries and foreign currency denominated financial assets; |
| |
| • | Interest rate swaps to manage interest rate risk associated with planned refinancings and existing variable rate debt; and |
| |
| • | Interest rate caps to hedge interest rate risk on certain variable rate debt. |
We also designate Canadian Dollar financial liabilities of certain of our operating entities as hedges of our net investments in our Canadian operations.
Interest Rate Hedging
The following table provides the partnership’s outstanding derivatives that are designated as cash flow hedges of variability in interest rates associated with forecasted fixed rate financings and existing variable rate debt as of March 31, 2017 and December 31, 2016:
|
| | | | | | | | | |
| (US$ Millions) | Hedging item | Notional |
| Rates | Maturity dates | Fair value |
|
| Mar. 31, 2017 | Interest rate caps of US$ LIBOR debt | $ | 3,574 |
| 2.5% - 5.8% | Apr. 2017 - Jun. 2020 | $ | — |
|
| | Interest rate swaps of US$ LIBOR debt | 775 |
| 0.7% - 2.2% | Jun. 2018 - Nov. 2020 | (3 | ) |
| | Interest rate caps of £ LIBOR debt | 457 |
| 1.3% - 2.5% | Aug. 2017 - Dec. 2019 | — |
|
| | Interest rate swaps of £ LIBOR debt | 86 |
| 1.0% - 1.5% | Apr. 2020 - Jun 2021 | 2 |
|
| | Interest rate swaps of € EURIBOR debt | 38 |
| 0.7% - 1.4% | Oct. 2017 - Apr. 2021 | (1 | ) |
| | Interest rate swaps of C$ LIBOR debt | 44 |
| 3.7% | Nov. 2021 | — |
|
| | Interest rate swaps of A$ BBSW/BBSY debt | 69 |
| 3.5% | Jul. 2017 | — |
|
| | Interest rate swaps on forecasted fixed rate debt | 100 |
| 4.0% | Jun. 2029 | (11 | ) |
| Dec. 31, 2016 | Interest rate caps of US$ LIBOR debt | $ | 4,933 |
| 2.5% - 5.8% | Jan. 2017 - Jun. 2020 | $ | — |
|
| | Interest rate swaps of US$ LIBOR debt | 502 |
| 1.5% - 2.2% | Jun. 2018 - Nov. 2020 | (6 | ) |
| | Interest rate caps of £ LIBOR debt | 37 |
| 2.5% | Aug. 2017 | — |
|
| | Interest rate swaps of £ LIBOR debt | 85 |
| 1.0% - 1.5% | Apr. 2020 - Jun. 2021 | 2 |
|
| | Interest rate swaps of € EURIBOR debt | 146 |
| 0.3% - 1.4% | Oct. 2017 - Apr. 2021 | (4 | ) |
| | Interest rate swaps of C$ LIBOR debt | 44 |
| 3.7% | Nov. 2021 | — |
|
| | Interest rate swaps of A$ BBSW/BBSY debt | 65 |
| 1.9% | Jul. 2017 | (1 | ) |
| | Interest rate swaps on forecasted fixed rate debt | 300 |
| 3.7% - 4.0% | Jun. 2027 - Jun. 2029 | (34 | ) |
For the three months ended March 31, 2017, the amount of hedge ineffectiveness recorded in earnings in connection with the partnership’s interest rate hedging activities was $2 million (2016 - $5 million).
Foreign Currency Hedging
The following table provides the partnership’s outstanding derivatives that are designated as net investments in foreign subsidiaries or cash flow hedges as of March 31, 2017 and December 31, 2016:
|
| | | | | | | | | |
| (US$ Millions) | Hedging item | | Notional |
| Rates | Maturity dates | Fair value |
|
| Mar. 31, 2017 | Net investment hedges | € | 650 |
| €0.88/$ - €0.94/$ | Apr. 2017 - Mar. 2018 | $ | 2 |
|
| | Net investment hedges | £ | 3,703 |
| £0.77/$ - £0.82/$ | Apr. 2017 - Jun. 2018 | (73 | ) |
| | Net investment hedges | A$ | 2,417 |
| A$1.30/$ - A$1.41/$ | Apr. 2017 - Jul. 2018 | (33 | ) |
| | Net investment hedges | C¥ | 1,807 |
| C¥6.77/$ - C¥7.20/$ | Jun. 2017 - Mar. 2018 | (3 | ) |
| | Cash flow hedges | R$ | 500 |
| R$3.19/$ | Jun. 2017 | — |
|
| | Net investment hedges | ₩ | 590,600 |
| ₩1,135.30/$ - ₩1,181.45/$ | Sep. 2017 - Dec. 2017 | (18 | ) |
| | Cash flow hedges | Rs | 16,000 |
| Rs69.85/$ - Rs70.60/$ | Sep. 2017 | 14 |
|
| | Cash flow hedges | C$ | — |
| C$1.31/$ - C$1.33/$ | Apr. 2017 | (4 | ) |
| Dec. 31, 2016 | Net investment hedges | € | 600 |
| €0.87/$ - €0.94/$ | Feb. 2017 - Feb. 2018 | $ | 8 |
|
| | Net investment hedges | £ | 3,664 |
| £0.68/$ - £0.82/$ | Jan. 2017 - Jan. 2018 | (18 | ) |
| | Net investment hedges | A$ | 1,967 |
| A$1.32/$ - A$1.41/$ | Jan. 2017 - Dec. 2017 | 36 |
|
| | Net investment hedges | C¥ | 1,750 |
| C¥6.77/$ - C¥7.20/$ | Feb. 2017 - Dec. 2017 | 7 |
|
| | Net investment hedges | R$ | — |
| R$3.27/$ - R$3.83/$ | Jan. 2017 - Feb. 2017 | (9 | ) |
| | Cash flow hedges | R$ | 500 |
| R$3.35/$ | Mar. 2017 | 1 |
|
| | Net investment hedges | ₩ | 585,600 |
| ₩1,135.30/$ - ₩1,167.90/$ | Sep. 2017 - Dec. 2017 | 22 |
|
| | Cash flow hedges | Rs | 12,500 |
| Rs67.84/$ - Rs70.60/$ | Feb. 2017 - Sep. 2017 | 1 |
|
In addition to the above, our partnership has designated C$220 million (December 31, 2016 - C$690 million) of Canadian Dollar financial liabilities as hedges against our partnership’s net investment in Canadian operations.
For the three months ended March 31, 2017 and 2016, the amount of hedge ineffectiveness recorded in earnings in connection with the partnership’s foreign currency hedging activities was not significant.
Other Derivatives
The following table presents details of the partnership’s other derivatives that have been entered into to manage financial risks as of March 31, 2017 and December 31, 2016:
|
| | | | | | | | | |
| (US$ Millions) | Derivative type | Notional |
| Maturity dates |
Rates | Fair value (gain)/loss |
|
| Mar. 31, 2017 | Interest rate swaps on forecasted fixed rate debt | $ | 1,660 |
| Jun. 2028 - Jun. 2029 | 2.3% - 6.0% | $ | (197 | ) |
| | Interest rate caps | 1,125 |
| Jul. 2017 - Jun. 2020 | 2.5% - 11.0% | — |
|
| | Interest rate swaps of € EURIBOR debt | 111 |
| Sep. 2018 - Oct. 2019 | 0.3% - 1.4% | (2 | ) |
| Dec. 31, 2016 | Interest rate swaps on forecasted fixed rate debt | 1,460 |
| Jun. 2018 - Nov. 2028 | 1.9% - 6.0% | (172 | ) |
| | Interest rate caps | 350 |
| Jul. 2017 | 3.25% | — |
|
For the three months ended March 31, 2017, our partnership recognized fair value losses, net of approximately $2 million related to the settlement of certain forward starting interest rate swaps that have not been designated as hedges.
For the three months ended March 31, 2017, our partnership has swaptions with a notional amount of totaling $1,660 million (December 31, 2016 - $1,660 million), with a 1.00% rate and maturity dates from June 2017 to November 2018. The fair value of these derivatives as of March 31, 2017 was $1 million.
The other derivatives have not been designated as hedges for accounting purposes.
RELATED PARTIES
In the normal course of operations, the partnership enters into transactions with related parties. These transactions are recognized in the consolidated financial statements. These transactions have been measured at exchange value and are recognized in the consolidated financial statements. The immediate parent of the partnership is the general partner. The ultimate parent of the partnership is Brookfield Asset Management. Other related parties of the partnership include the partnership’s and Brookfield Asset Management’s subsidiaries and operating entities, certain joint ventures and associates accounted for under the equity method, as well as officers of such entities and their spouses.
The partnership has a management agreement with its service providers, wholly-owned subsidiaries of Brookfield Asset Management. Pursuant to a Master Services Agreement, the partnership pays a base management fee (“base management fee”), to the service providers equal to 0.5% of the total capitalization of the partnership, subject to an annual minimum of $50 million plus annual inflation adjustments. The amount of the equity enhancement distribution is reduced by the amount by which the base management fee is greater than $50 million per annum, plus annual inflation adjustments.
The base management fee for the three months ended March 31, 2017 was $25 million (2016 - $26 million). The equity enhancement distribution for the three months ended March 31, 2017 was $5 million (2016 - $8 million).
In connection with the issuance of Preferred Equity Units to QIA in the fourth quarter of 2014, Brookfield Asset Management has contingently agreed to acquire the seven-year and ten-year tranches of Preferred Equity Units from QIA for the initial issuance price plus accrued and unpaid distributions and to exchange such units for Preferred Equity Units with terms and conditions substantially similar to the twelve-year tranche to the extent that the market price of the LP Units is less than 80% of the exchange price at maturity.
The following table summarizes transactions with related parties:
|
| | | | | | |
| (US$ Millions) | Mar. 31, 2017 |
| Dec 31, 2016 |
|
| Balances outstanding with related parties: | | |
| Participating loan interests | $ | 446 |
| $ | 471 |
|
| Equity accounted investments | 107 |
| 110 |
|
Loans and notes receivable(1) | 49 |
| 46 |
|
| Receivables and other assets | 8 |
| 71 |
|
| Deposit from Brookfield Asset Management | (1,000 | ) | (500 | ) |
| Property-specific debt obligations | (342 | ) | (323 | ) |
| Other liabilities | (110 | ) | (136 | ) |
| Capital securities held by Brookfield Asset Management | (1,250 | ) | (1,250 | ) |
| Preferred shares held by Brookfield Asset Management | (15 | ) | (15 | ) |
| |
(1) | At March 31, 2017, includes $49 million (December 31, 2016 - $46 million) receivable from Brookfield Asset Management upon the earlier of the partnership’s exercise of its option to convert its participating loan interests into direct ownership of the Australian portfolio or the maturity of the participating loan interests. |
|
| | | | | | |
| | Three months ended Mar. 31, | |
| (US$ Millions) | 2017 |
| 2016 |
|
| Transactions with related parties: | | |
Commercial property revenue(1) | $ | 4 |
| $ | 5 |
|
| Management fee income | 1 |
| 1 |
|
| Interest and other income | — |
| 1 |
|
| Participating loan interests (including fair value gains, net) | 12 |
| 25 |
|
| Interest expense on debt obligations | 9 |
| 30 |
|
| Interest on capital securities held by Brookfield Asset Management | 19 |
| 19 |
|
General and administrative expense(2) | 49 |
| 57 |
|
Construction costs(3) | 70 |
| 97 |
|
| |
(1) | Amounts received from Brookfield Asset Management and its subsidiaries for the rental of office premises. |
| |
(2) | Includes amounts paid to Brookfield Asset Management and its subsidiaries for management fees, management fees associated with the partnership’s private funds, and administrative services. |
| |
(3) | Includes amounts paid to Brookfield Asset Management and its subsidiaries for construction costs of development properties. |
During the first quarter of 2017, our partnership and QIA each acquired a 25% interest in two multifamily developments from Canary Wharf for a combined consideration of £70 million, representing costs incurred to the date of sale plus the equity funding required to complete the developments.
During the first quarter of 2017, our partnership along with Brookfield Premier Real Estate Partners (“BPREP”) acquired a 25% and 75% interest, respectively, of One Post Street, an office building in San Francisco, California for $245 million. We will account for the acquisition on a consolidated basis.
ADDITIONAL INFORMATION
CRITICAL ACCOUNTING POLICIES, ESTIMATES, AND JUDGEMENTS
USE OF ESTIMATES
The preparation of our financial statements requires management to make judgments, estimates and assumptions that affect the reported amounts of assets and liabilities, disclosure of contingent assets and liabilities at the date of the financial statements and the reported amounts of revenues and expenses during the reporting period. Our estimates are based on historical experience and on various other assumptions that are believed to be reasonable under the circumstances. The result of our ongoing evaluation of these estimates forms the basis for making judgments about the carrying values of assets and liabilities and the reported amounts of revenues and expenses that are not readily apparent from other sources. Actual results may differ from these estimates under different assumptions.
For further reference on accounting policies and critical judgments and estimates, see our significant accounting policies contained in Note 2 to the December 31, 2016 consolidated financial statements.
TREND INFORMATION
We will seek to increase the cash flows from our office and retail property activities through continued leasing activity as described below. In particular, we are operating below our historical office occupancy level in the United States, which provides the opportunity to expand cash flows through higher occupancy. In addition, we believe that most of our markets have favorable outlooks, which we believe also provides an opportunity for strong growth in lease rates. We do, however, still face a meaningful amount of lease rollover in 2017 and 2018, which may restrain FFO growth from this part of our portfolio in the near future. Our beliefs as to the opportunities for our partnership to increase its occupancy levels, lease rates and cash flows are based on assumptions about our business and markets that management believes are reasonable in the circumstances. There can be no assurance as to growth in occupancy levels, lease rates or cash flows. See “Statement Regarding Forward-looking Statements and Use of Non-IFRS Measures”.
Transaction activity is picking up across our global real estate markets and we are considering a number of different opportunities to acquire single assets, development sites and portfolios at attractive returns. In our continued effort to enhance returns through capital reallocation, we are also looking to divest all of, or a partial interest in, a number of mature assets to capitalize on existing market conditions.
Given the small amount of new office and retail development that occurred over the last decade and the near total development halt during the global financial crisis, we see an opportunity to advance our development inventory in the near term in response to demand we are seeing in our major markets. In addition, we continue to reposition and redevelop existing retail properties, in particular, a number of the highest performing shopping centers in the United States.
OFF-BALANCE SHEET ARRANGEMENTS
We do not have any off-balance sheet arrangements that have or are reasonably likely to have a material current or future effect on our financial condition, changes in financial condition, revenues or expenses, results of operations, liquidity, capital expenditures or capital resources that is material to investors.
CONTROLS AND PROCEDURES
INTERNAL CONTROL OVER FINANCIAL REPORTING
There have been no changes made in our internal control over financial reporting that have occurred during the three months ended March 31, 2017, that have materially affected, or are reasonably likely to materially affect, our internal control over financial reporting.
Corporate Information
CORPORATE PROFILE
Brookfield Property Partners is one of the world’s largest commercial real estate companies, with over $65 billion in total assets. We are leading owners, operators and investors in commercial property assets, with a diversified portfolio that includes 146 premier office properties and 127 best-in-class retail malls around the world. We also hold interests in multifamily, triple net lease, industrial, hospitality, self-storage, student housing and manufactured housing assets. Brookfield Property Partners is listed on the New York and Toronto stock exchanges. Further information is available at bpy.brookfield.com. Important information may be disseminated exclusively via the website; investors should consult the site to access this information.
Brookfield Property Partners is the flagship listed real estate company of Brookfield Asset Management, a leading global alternative asset manager with approximately $250 billion in assets under management.
BROOKFIELD PROPERTY PARTNERS
73 Front Street, 5th Floor
Hamilton, HM 12
Bermuda
Tel: (441) 294-3309
bpy.brookfield.com
UNITHOLDERS INQUIRIES
Brookfield Property Partners welcomes inquiries from Unitholders, analysts, media representatives and other interested parties. Questions relating to investor relations or media inquiries can be directed to Matt Cherry, Senior Vice President, Investor Relations and Communications at (212) 417-7488 or via e-mail at matthew.cherry@brookfield.com. Inquiries regarding financial results can be directed to Bryan Davis, Chief Financial Officer at (212) 417-7166 or via e-mail at bryan.davis@brookfield.com. Unitholder questions relating to distributions, address changes and unit certificates should be directed to the partnership’s transfer agent, CST Trust Company, as listed below.
CST TRUST COMPANY
By mail: P.O. Box 4229
Station A
Toronto, Ontario, M5W 0G1
Tel: (416) 682-3860; (800) 387-0825
Fax: (888) 249-6189
E-mail: inquiries@canstockta.com
Web site: www.canstockta.com
COMMUNICATIONS
We strive to keep our Unitholders updated on our progress through a comprehensive annual report, quarterly interim reports and periodic press releases.
Brookfield Property Partners maintains a website, bpy.brookfield.com, which provides access to our published reports, press releases, statutory filings, supplementary information and unit and distribution information as well as summary information on the partnership.
We maintain an investor relations program and respond to inquiries in a timely manner. Management meets on a regular basis with investment analysts and Unitholders to ensure that accurate information is available to investors.