UNITED STATES
SECURITIES AND EXCHANGE COMMISSION
WASHINGTON, D.C. 20549
FORM 20-F
(Mark One)
| ¨ | REGISTRATION STATEMENT PURSUANT TO SECTION 12(b) or (g) OF THE SECURITIES EXCHANGE ACT OF 1934 |
OR
| ý | ANNUAL REPORT PURSUANT TO SECTION 13 OR 15(d) OF THE SECURITIES EXCHANGE ACT OF 1934 |
For the fiscal year ended December 31, 2019
OR
| ¨ | TRANSITION REPORT PURSUANT TO SECTION 13 OR 15(d) OF THE SECURITIES EXCHANGE ACT OF 1934 |
OR
| ¨ | SHELL COMPANY REPORT PURSUANT TO SECTION 13 OR 15(d) OF THE SECURITIES EXCHANGE ACT OF 1934 |
Commission file number: 001-35505
Brookfield Property Partners L.P.
| (Exact name of Registrant as specified in its charter) |
| N/A |
| (Translation of Registrant’s name into English) |
| Bermuda |
| (Jurisdiction of incorporation or organization) |
| 73 Front Street, 5th Floor, Hamilton, HM 12 Bermuda |
(Address of principal executive office)
Bryan K. Davis
Brookfield Property Partners L.P.
73 Front Street, 5th Floor
Hamilton, HM 12, Bermuda
Tel: +441-294-3309
| (Name, Telephone, Email and/or Facsimile number and Address of Company Contact Person) |
Securities registered or to be registered pursuant to Section 12(b) of the Act.
| Title of each class | Trading Symbol(s) | Name of each exchange on which registered | ||
Limited Partnership Units | BPY | Nasdaq Stock Market | ||
| Limited Partnership Units | BPY.UN | Toronto Stock Exchange | ||
| Preferred Units, Series 1 | BPYPP | Nasdaq Stock Market | ||
| Preferred Units, Series 2 | BPYPO | Nasdaq Stock Market | ||
| Preferred Units, Series 3 | BPYPN | Nasdaq Stock Market | ||
Securities registered or to be registered pursuant to Section 12(g) of the Act.
None
Securities for which there is a reporting obligation pursuant to Section 15(d) of the Act.
None
Indicate the number of outstanding shares of each of the issuer’s classes of capital or common stock as of the close of the period covered by the annual report: 439,801,308 Limited Partnership Units as of December 31, 2019.
Indicate by check mark if the registrant is a well-known seasoned issuer, as defined in Rule 405 of the Securities Act.
Yes x | No ¨ |
If this report is an annual or transition report, indicate by check mark if the registrant is not required to file reports pursuant to Section 13 or 15(d) of the Securities Exchange Act of 1934.
Yes ¨ | No x |
Indicate by check mark whether the registrant (1) has filed all reports required to be filed by Section 13 or 15(d) of the Securities Exchange Act of 1934 during the preceding 12 months (or for such shorter period that the registrant was required to file such reports), and (2) has been subject to such filing requirements for the past 90 days.
Yes x | No ¨ |
Indicate by check mark whether the registrant has submitted electronically every Interactive Data File required to be submitted pursuant to Rule 405 of Regulation S-T (§232.405 of this chapter) during the preceding 12 months (or for such shorter period that the registrant was required to submit such files).
Yes x | No ¨ |
Indicate by check mark whether the registrant is a large accelerated filer, an accelerated filer, a non-accelerated filer, or an emerging growth company. See definition of “large accelerated filer”, “accelerated filer”, and “emerging growth company” in Rule 12b-2 of the Exchange Act.
Large accelerated filer x | Accelerated filer ¨ | Non-accelerated filer ¨ | Emerging growth company ¨ |
If an emerging growth company that prepares its financial statements in accordance with U.S. GAAP, indicate by check mark if the registrant has elected not to use the extended transition period for complying with any new or revised financial accounting standards provided pursuant to Section 13(a) of the Exchange Act ¨
Indicate by check mark which basis of accounting the registrant has used to prepare the financial statements included in this filing:
U.S. GAAP ¨ | International Financial Reporting Standards as issued by the International Accounting Standards Board | x | Other ¨ |
If “Other” has been checked in response to the previous question, indicate by check mark which financial statement item the registrant has elected to follow.
Item 17 ¨ | Item 18 ¨ |
If this is an annual report, indicate by check mark whether the registrant is a shell company (as defined in Rule 12b-2 of the Exchange Act).
Yes ¨ | No x |
Table of Contents
| Page | ||
| ITEM 1. | ||
| ITEM 2. | ||
| ITEM 3. | ||
| 3.A. | ||
| 3.B. | ||
| 3.C. | ||
| 3.D. | ||
| ITEM 4. | ||
| 4.A. | ||
| 4.B. | ||
| 4.C. | ||
| 4.D. | ||
| ITEM 4A. | ||
| ITEM 5. | ||
| 5.A. | ||
| 5.B. | ||
| 5.C. | ||
| 5.D. | ||
| 5.E. | ||
- 3 -
| 5.F. | ||
| ITEM 6. | ||
| 6.A. | ||
| 6.B. | ||
| 6.C. | ||
| 6.D. | ||
| 6.E. | ||
| ITEM 7. | ||
| 7.A. | ||
| 7.B. | ||
| 7.C. | ||
| ITEM 8. | ||
| 8.A. | ||
| 8.B. | ||
| ITEM 9. | ||
| 9.A. | ||
| 9.B. | ||
| 9.C. | ||
| 9.D. | ||
| 9.E. | ||
| 9.F. | ||
| ITEM 10. | ||
| 10.A. | ||
- 4 -
| 10.B. | ||
| 10.C. | ||
| 10.D. | ||
| 10.E. | ||
| 10.F. | ||
| 10.G. | ||
| 10.H | ||
| 10.I. | ||
| ITEM 11. | ||
| ITEM 12. | ||
| ITEM 13. | ||
| ITEM 14. | ||
| ITEM 15. | ||
| ITEM 16. | ||
| 16A. | ||
| 16B. | ||
| 16C. | ||
| 16D. | ||
| 16E. | ||
| 16F. | ||
| 16G. | ||
- 5 -
| 16H. | ||
| ITEM 17. | ||
| ITEM 18. | ||
| ITEM 19. | ||
- 6 -
INTRODUCTION AND USE OF CERTAIN TERMS
We have prepared this Form 20-F using a number of conventions, which you should consider when reading the information contained herein. Unless otherwise indicated or the context otherwise requires, in this Form 20-F:
| • | all operating and other statistical information is presented as if we own 100% of each property in our portfolio, regardless of whether we own all of the interests in each property; and |
| • | all information on financial results is presented in accordance with International Financial Reporting Standards (“IFRS”) as issued by the International Accounting Standards Board, or IASB, other than certain non-IFRS financial measures which are defined under “Use of Non-IFRS Measures” below. |
In this Form 20-F, unless the context suggests otherwise, references to “we”, “us” and “our” are to Brookfield Property Partners L.P., the BPR Group, the Property Partnership, the Holding Entities and the operating entities, each as defined below, taken together on a consolidated basis. Unless the context suggests otherwise, in this Form 20-F references to:
| • | “AO LTIP Units” are to the BPY AO LTIP Units of the Property Partnership; |
| • | “assets under management” are to assets managed by us or by Brookfield on behalf of our third-party investors, as well as our own assets, and also include capital commitments that have not yet been drawn. Our calculation of assets under management may differ from that employed by other asset managers and, as a result, this measure may not be comparable to similar measures presented by other asset managers; |
| • | “BPR” are to Brookfield Property REIT Inc.; |
| • | “BPR Group” are to BPR, BPR OP, L.P. and any of their direct or indirect subsidiaries; |
| • | “BPR Master Services Agreement” means the master services agreement among BPR, the service providers named therein, and certain other subsidiaries of BPR and Brookfield Asset Management who are parties thereto; |
| • | “BPR Units” are to the shares of Class A Stock of BPR, par value $0.01 per share, which are intended to be economic equivalent to the LP Units of our partnership; |
| • | “BPY General Partner” are to the general partner of our company, which is Brookfield Property Partners Limited, an indirect wholly-owned subsidiary of Brookfield Asset Management; |
| • | “Brookfield Asset Management” are to Brookfield Asset Management Inc.; |
| • | “Brookfield” are to Brookfield Asset Management and any subsidiary of Brookfield Asset Management, other than us; |
| • | “Class A Preferred Unitholder” are to the third-party holder of the Class A Preferred Units; |
| • | “Class A Preferred Units” are to the Class A preferred limited partnership units of the Property Partnership, Series 1, 2 and 3, that are exchangeable for LP Units of our company pursuant to the Preferred Unit Exchange Mechanism; |
| • | “commercial property” or “commercial properties” are to commercial and other real property that generates or has the potential to generate income, including office, retail, multifamily, logistics, hospitality, self-storage, triple net lease, manufactured housing and student housing, but does not include, among other things, residential land development, home building, construction, real estate advisory and other similar operations or services; |
| • | “fully-exchanged basis” assume the exchange of certain issued and outstanding securities that are exchangeable into LP Units, including the exchange of the issued and outstanding Redemption-Exchange Units in accordance with the Redemption-Exchange Mechanism, the exchange of the issued and outstanding Class A Preferred Units in accordance with the Preferred Unit Exchange Mechanism and the exchange of the issued and outstanding exchangeable limited partnership units of Brookfield Office Properties Exchange LP not held by us; |
| • | “FV LTIP Units” are to the FV LTIP Units of the Property Partnership; |
| • | “GGP” are to GGP Inc.; |
- 7 -
| • | “Holding Entities” are to the primary holding subsidiaries of the Property Partnership, from time to time, through which it indirectly holds all of our interests in our operating entities; |
| • | “LP Units” are to the non-voting limited partnership units of our company, other than Preferred Units; |
| • | “Master Services Agreement” are to the amended and restated master services agreement among the Service Recipients, the Service Providers, and certain other subsidiaries of Brookfield Asset Management who are parties thereto; |
| • | “operating entities” are to the entities in which the Holding Entities hold interests and that directly or indirectly hold our real estate assets or that perform real estate management services for our real estate assets other than entities in which the Holding Entities hold interests for investment purposes only of less than 5% of the equity securities; |
| • | “our business” are to our business of owning, operating and investing in commercial property, both directly and through our operating entities; |
| • | “our company”, “BPY” or “our partnership” are to Brookfield Property Partners L.P., a Bermuda exempted limited partnership; |
| • | “our limited partnership agreement” are to the second amended and restated limited partnership agreement of our company; |
| • | “our portfolio” are to the commercial property assets in our Core Office, Core Retail and LP Investments segments, as applicable; |
| • | “our units” and “units of our company” are to the non-voting limited partnership units in our company, including LP Units and Preferred Units, and references to “our unitholders” are to the holders of our units. References to “Unitholders” are to holders of general partnership units of our partnership (“GP Units”), LP Units, Redemption-Exchange Units, special limited partnership units of the Property Partnership (“Special LP Units”), AO LTIP Units, FV LTIP Units, exchangeable limited partnership units of Brookfield Office Properties Exchange L.P. (“Exchange LP Units”) and BPR Units; |
| • | “Preferred Units” or “Preferred Equity Units” are to the preferred limited partnership units in the capital of BPY, currently consisting of the Class A Cumulative Redeemable Perpetual Units, Series 1 (“Preferred Units, Series 1”), the Class A Cumulative Redeemable Perpetual Units, Series 2 (“Preferred Units, Series 2”), and the Class A Cumulative Redeemable Perpetual Units, Series 3 (“Preferred Units, Series 3”); |
| • | “Preferred Unit Exchange Mechanism” are to the mechanism by which the Class A Preferred Unitholder may exchange the Class A Preferred Units for LP Units of our company, as more fully described in Item 10.B. “Additional Information - Memorandum and Articles of Association - Description of the Property Partnership Limited Partnership Agreement - Preferred Unit-Exchange Mechanism”; |
| • | “Property Partnership” or the “Operating Partnership” are to Brookfield Property L.P., a Bermuda exempted limited partnership; |
| • | “Property Partnership Preferred Units” are to the preferred limited partnership units of the Property Partnership, currently consisting of the Class A Preferred Units and the Class A Cumulative Redeemable Perpetual Units, Series 5, 6 and 7; |
| • | “Property Special LP” are to Brookfield Property Special L.P., an indirect wholly-owned subsidiary of Brookfield Asset Management, which is the sole special limited partner of the Property Partnership; |
| • | “Redemption-Exchange Mechanism” are to the mechanism by which Brookfield may request redemption of its Redemption-Exchange Units in whole or in part in exchange for cash, subject to the right of our company to acquire such interests (in lieu of such redemption) in exchange for LP Units of our company, as more fully described in Item 10.B. “Additional Information - Memorandum and Articles of Association - Description of the Property Partnership Limited Partnership Agreement - Redemption-Exchange Mechanism”; |
| • | “Redemption-Exchange Units” or “Redeemable/Exchangeable Partnership Units” are to the non-voting limited partnership interests in the Property Partnership that are redeemable for cash, subject to the right of our company to acquire such interests (in lieu of such redemption) in exchange for LP Units of our company, pursuant to the Redemption-Exchange Mechanism; |
- 8 -
| • | “Service Providers” are to the subsidiaries of Brookfield Asset Management that provide services to us pursuant to our Master Services Agreement, and unless the context otherwise requires, any other affiliate of Brookfield that is appointed from time to time to act as a service provider pursuant to our Master Services Agreement or to whom any service provider has subcontracted for the provision of such services; |
| • | “Service Recipients” are to our company, the Property Partnership, the Holding Entities and, at the option of the Holding Entities, any wholly-owned subsidiary of a Holding Entity excluding any operating entity; and |
| • | “Spin-off” are to the special dividend of LP Units by Brookfield Asset Management on April 15, 2013 as described under Item 4.A. “Information on the Company - History and Development of the Company”. |
Historical Performance and Market Data
This Form 20-F contains information relating to our business as well as historical performance and market data for Brookfield Asset Management and certain of its business groups. When considering this data, you should bear in mind that historical results and market data may not be indicative of the future results that you should expect from us.
Financial Information
The financial information contained in this Form 20-F is presented in U.S. Dollars and, unless otherwise indicated, has been prepared in accordance with IFRS. Amounts in “$” are to U.S. Dollars and amounts in Canadian Dollars (“C$”), Australian Dollars (“A$”), British Pounds (“£”), Euros (“€”), Brazilian Reais (“R$”), Indian Rupees (“₨”), Chinese Yuan (“C¥”), South Korean Won (“₩”) and United Arab Emirates Dirham (“AED”) are identified where applicable.
Use of Non-IFRS Measures
To measure our performance, we focus on Net Operating Income (“NOI”), same-property NOI, funds from operations (“FFO”), Company FFO, net income attributable to Unitholders and equity attributable to Unitholders. Some of these performance metrics do not have standardized meanings prescribed by IFRS and therefore may differ from similar metrics used by other companies. We define each of these measures as follows:
| • | NOI: revenues from our commercial properties operations less direct commercial property expenses (“Commercial property NOI”) and revenues from our hospitality operations less direct hospitality expenses (“Hospitality NOI”). |
| • | Same-property NOI: a subset of NOI, which excludes NOI that is earned from assets acquired, disposed of or developed during the periods presented, not of a recurring nature, or from LP Investments assets. |
| • | FFO: net income, prior to fair value gains, net, depreciation and amortization of real estate assets, and income taxes less non-controlling interests of others in operating subsidiaries and properties therein. When determining FFO, we include our proportionate share of the FFO of unconsolidated partnerships and joint ventures and associates, as well as gains (or losses) related to properties developed for sale. |
| • | Company FFO: FFO before the impact of depreciation and amortization of non-real estate assets, transaction costs, gains (losses) associated with non-investment properties, imputed interest on equity accounted investments and the partnership’s share of Brookfield Strategic Real Estate Partners III (“BSREP III”) FFO. The partnership accounts for its investment in BSREP III as a financial asset and the income (loss) of the fund is not presented in our partnership’s results. Distributions from BSREP III, recorded as dividend income under IFRS, are removed from investment and other income for Company FFO presentation. |
| • | Net Income Attributable to Unitholders: net income attributable to holders of GP Units, LP Units, Redeemable/Exchangeable Partnership Units, Special LP Units, Exchange LP Units, FV LTIP Units and BPR Units. |
| • | Equity Attributable to Unitholders: equity attributable to holders of GP Units, LP Units, Redeemable/Exchangeable Partnership Units, Special LP Units, Exchange LP Units, FV LTIP Units and BPR Units. |
NOI is a key indicator of our ability to impact the operating performance of our properties. We seek to grow NOI through pro-active management and leasing of our properties. Same-property NOI in our Core Office and Core Retail segments allows us to segregate the impact of leasing and operating initiatives on the portfolio from the impact of investing activities and “one-time items”, which for the historical periods presented consist primarily of lease termination income.
- 9 -
We also consider FFO an important measure of our operating performance. FFO is a widely recognized measure that is frequently used by securities analysts, investors and other interested parties in the evaluation of real estate entities, particularly those that own and operate income producing properties. Our definition of FFO includes all of the adjustments that are outlined in the National Association of Real Estate Investment Trusts (“NAREIT”), definition of FFO, including the exclusion of gains (or losses) from the sale of investment properties, the add back of any depreciation and amortization related to real estate assets and the adjustment for unconsolidated partnerships and joint ventures. In addition to the adjustments prescribed by NAREIT, we also make adjustments to exclude any unrealized fair value gains (or losses) that arise as a result of reporting under IFRS, and income taxes that arise as certain of our subsidiaries are structured as corporations as opposed to real estate investment trusts (“REITs”). These additional adjustments result in an FFO measure that is similar to that which would result if our partnership was organized as a REIT that determined net income in accordance with generally accepted accounting principles in the United States (“U.S. GAAP”) which is the type of organization on which the NAREIT definition is premised. Our FFO measure will differ from other organizations applying the NAREIT definition to the extent of certain differences between the IFRS and U.S. GAAP reporting frameworks, principally related to the timing of revenue recognition from lease terminations and sale of properties. Because FFO excludes fair value gains (losses), including equity accounted fair value gains (losses), realized gains (losses) on the sale of investment properties, depreciation and amortization of real estate assets and income taxes, it provides a performance measure that, when compared year-over-year, reflects the impact on operations from trends in occupancy rates, rental rates, operating costs and interest costs, providing perspective not immediately apparent from net income.
In addition, we consider Company FFO a useful measure for securities analysts, investors and other interested parties in the evaluation of our partnership’s performance. Company FFO, similar to FFO discussed above, provides a performance measure that reflects the impact on operations of trends in occupancy rates, rental rates, operating costs and interest costs. In addition, the adjustments to Company FFO relative to FFO allow the partnership insight into these trends for the real estate operations, by adjusting for non-real estate components.
Net income attributable to Unitholders and Equity attributable to Unitholders are used by the partnership to evaluate the performance of the partnership as a whole as each of the Unitholders participates in the economics of the partnership equally.
Under Item 5.A. “Operating and Financial Review and Prospects - Operating Results - Financial Statements Analysis - Review of Consolidated Results - Reconciliation of Non-IFRS Measures”, we provide a reconciliation to net income (loss) for the periods presented. We urge you to review the IFRS financial measures in this Form 20-F, including the financial statements, the notes thereto and the other financial information contained herein, and not to rely on any single financial measure to evaluate our company.
- 10 -
SPECIAL NOTE REGARDING FORWARD-LOOKING STATEMENTS
This Form 20-F contains “forward-looking information” within the meaning of applicable securities laws and regulations. Forward-looking statements include statements that are predictive in nature, depend upon or refer to future events or conditions, include statements regarding our operations, business, financial condition, expected financial results, performance, prospects, opportunities, priorities, targets, goals, ongoing objectives, strategies and outlook, as well as the outlook for North American and international economies for the current fiscal year and subsequent periods, and include words such as “expects”, “anticipates”, “plans”, “believes”, “estimates”, “seeks”, “intends”, “targets”, “projects”, “forecasts”, “likely”, or negative versions thereof and other similar expressions, or future or conditional verbs such as “may”, “will”, “should”, “would” and “could”.
Although we believe that our anticipated future results, performance or achievements expressed or implied by the forward-looking statements and information are based upon reasonable assumptions and expectations, the reader should not place undue reliance on forward-looking statements and information because they involve known and unknown risks, uncertainties and other factors, many of which are beyond our control, which may cause our actual results, performance or achievements to differ materially from anticipated future results, performance or achievement expressed or implied by such forward-looking statements and information.
Factors that could cause actual results to differ materially from those contemplated or implied by forward-looking statements include, but are not limited to: risks incidental to the ownership and operation of real estate properties including local real estate conditions; the impact or unanticipated impact of general economic, political and market factors in the countries in which we do business; the ability to enter into new leases or renew leases on favorable terms; business competition; dependence on tenants’ financial condition; the use of debt to finance our business; the behavior of financial markets, including fluctuations in interest and foreign exchanges rates; uncertainties of real estate development or redevelopment; global equity and capital markets and the availability of equity and debt financing and refinancing within these markets; risks relating to our insurance coverage; the possible impact of international conflicts and other developments including terrorist acts; potential environmental liabilities; changes in tax laws and other tax related risks; dependence on management personnel; illiquidity of investments; the ability to complete and effectively integrate acquisitions into existing operations and the ability to attain expected benefits therefrom; operational and reputational risks; catastrophic events, such as earthquakes and hurricanes; and other risks and factors detailed from time to time in our documents filed with the securities regulators in Canada and the United States, as applicable.
We caution that the foregoing list of important factors that may affect future results is not exhaustive. When relying on our forward-looking statements or information, investors and others should carefully consider the foregoing factors and other uncertainties and potential events. Except as required by law, we undertake no obligation to publicly update or revise any forward-looking statements or information, whether written or oral, that may be as a result of new information, future events or otherwise.
- 11 -
PART I
ITEM 1. IDENTITY OF DIRECTORS, SENIOR MANAGEMENT, AND ADVISERS
Not applicable.
ITEM 2. OFFER STATISTICS AND EXPECTED TIMETABLE
Not applicable.
ITEM 3. KEY INFORMATION
3.A. SELECTED FINANCIAL DATA
The following tables present selected financial data for our company as of and for the periods indicated:
| Years ended Dec. 31, | |||||||||||||||
| (US$ Millions, except per unit information) | 2019 | 2018 | 2017 | 2016 | 2015 | ||||||||||
| Total revenue | $ | 8,203 | $ | 7,239 | $ | 6,135 | $ | 5,352 | $ | 4,853 | |||||
| Net income | 3,157 | 3,654 | 2,468 | 2,717 | 3,766 | ||||||||||
| Net income attributable to LP Units | 884 | 764 | 136 | 660 | 1,064 | ||||||||||
| Net income attributable to GP Units | — | — | — | — | 1 | ||||||||||
| Net income per LP Unit | 1.89 | 2.28 | 0.48 | 2.30 | 3.72 | ||||||||||
| Distributions per LP Unit | 1.32 | 1.26 | 1.18 | 1.12 | 1.06 | ||||||||||
FFO(1) | 1,147 | 866 | 873 | 895 | 710 | ||||||||||
(1) | FFO is a non-IFRS measure. See “Introduction and Use of Certain Terms - Use of Non-IFRS Measures” and Item 5.A, “Operating and Financial Review and Prospects - Operating Results- Financial Statements Analysis - Review of Consolidated Financial Results”. |
| (US$ Millions) | Dec. 31, 2019 | Dec. 31, 2018 | Dec. 31, 2017 | Dec. 31, 2016 | Dec. 31, 2015 | ||||||||||
| Investment properties | $ | 75,511 | $ | 80,196 | $ | 51,357 | $ | 48,784 | $ | 41,599 | |||||
| Equity accounted investments | 20,764 | 22,698 | 19,761 | 16,844 | 17,638 | ||||||||||
| Total assets | 111,643 | 122,520 | 84,347 | 78,127 | 71,866 | ||||||||||
| Debt obligations | 55,390 | 63,811 | 36,884 | 33,519 | 30,526 | ||||||||||
| Capital securities | 3,075 | 3,385 | 4,165 | 4,171 | 4,031 | ||||||||||
| Total equity | 44,935 | 46,740 | 35,124 | 34,161 | 30,933 | ||||||||||
Equity attributable to Unitholders(1) | 28,530 | 28,284 | 22,186 | 22,358 | 21,958 | ||||||||||
(1) | As at December 31, 2019, 2018, 2017, 2016 and 2015, refers to holders of LP Units, GP Units, Redemption-Exchange Units, Special LP Units, Exchange LP Units, FV LTIP Units and BPR Units, as applicable. |
3.B. CAPITALIZATION AND INDEBTEDNESS
Not applicable.
3.C. REASONS FOR THE OFFER AND USE OF PROCEEDS
Not applicable.
- 12 -
3.D. RISK FACTORS
You should carefully consider the following factors in addition to the other information set forth in this Form 20-F. If any of the following risks actually occur, our business, financial condition and results of operations and the value of our units would likely suffer.
Risks Relating to Our Business
Our economic performance and the value of our assets are subject to the risks incidental to the ownership and operation of real estate assets.
Our economic performance, the value of our assets and, therefore, the value of our units are subject to the risks normally associated with the ownership and operation of real estate assets, including but not limited to:
| • | downturns and trends in the national, regional and local economic conditions where our properties and other assets are located; |
| • | the cyclical nature of the real estate industry; |
| • | local real estate market conditions, such as an oversupply of commercial properties, including space available by sublease, or a reduction in demand for such properties; |
| • | changes in interest rates and the availability of financing; |
| • | competition from other properties; |
| • | changes in market rental rates and our ability to rent space on favorable terms; |
| • | the bankruptcy, insolvency, credit deterioration or other default of our tenants; |
| • | the need to periodically renovate, repair and re-lease space and the costs thereof; |
| • | increases in maintenance, insurance and operating costs; |
| • | civil disturbances, earthquakes and other natural disasters, pandemics or terrorist acts or acts of war which may result in uninsured or underinsured losses; |
| • | the decrease in the attractiveness of our properties to tenants; |
| • | the decrease in the underlying value of our properties; and |
| • | certain significant expenditures, including property taxes, maintenance costs, mortgage payments, insurance costs and related charges that must be made regardless of whether a property is producing sufficient income to service these expenses. |
We are dependent upon the economic conditions of the markets where our assets are located.
We are affected by local, regional, national and international economic conditions and other events and occurrences that affect the markets in which we own assets. A protracted decline in economic conditions will cause downward pressure on our operating margins and asset values as a result of lower demand for space.
Our properties are largely located in North America, Europe and Australia but also include a growing presence in Brazil and Asia. A prolonged downturn in one or more of these economies or the economy of any other country where we own property would result in reduced demand for space and number of prospective tenants and will affect the ability of our properties to generate significant revenue. If there is an increase in operating costs resulting from inflation and other factors, we may not be able to offset such increases by increasing rents.
- 13 -
We are subject to foreign currency risk and our risk management activities may adversely affect the performance of our operations.
Some of our assets and operations are in countries where the U.S. Dollar is not the functional currency. These operations pay distributions in currencies other than the U.S. Dollar which we must convert to U.S. Dollars prior to making distributions on our units. A significant depreciation in the value of such foreign currencies may have a material adverse effect on our business, financial condition and results of operations.
When managing our exposure to such market risks, we may use forward contracts, options, swaps, caps, collars and floors or pursue other strategies or use other forms of derivative instruments. The success of any hedging or other derivative transactions that we enter into generally will depend on our ability to structure contracts that appropriately offset our risk position. As a result, while we may enter into such transactions in order to reduce our exposure to market risks, unanticipated market changes may result in poorer overall investment performance than if the transaction had not been executed. Such transactions may also limit the opportunity for gain if the value of a hedged position increases.
We are subject to interest rate risk and a rise in interest rates may adversely affect us and the value of an investment in our units.
A number of our assets are interest rate sensitive: increases in long-term interest rates will, absent all else, decrease the value of these assets by reducing the present value of the cash flows expected to be produced by the asset. If interest rates were to rise, it may affect the market perceived or actual value of our assets and/or distributions and consequently the market price of our units may decline in value. Additionally, an increase in interest rates could decrease the amount buyers may be willing to pay for our properties, thereby reducing the market value of our properties and limiting our ability to sell properties or to obtain mortgage financing secured by our properties. Further, increased interest rates may effectively increase the cost of properties we acquire to the extent we utilize leverage for those acquisitions and may result in a reduction in our acquisitions to the extent we reduce the amount we offer to pay for properties, due to the effect of increased interest rates, to a price that sellers may not accept.
We face risks associated with the use of debt to finance our business, including refinancing risk.
We incur debt in the ordinary course of our business and therefore are subject to the risks associated with debt financing. The risks associated with our debt financing, including the following, may adversely affect our financial condition and results of operations:
| • | cash flows may be insufficient to meet required payments of principal and interest; |
| • | payments of principal and interest on borrowings may leave insufficient cash resources to pay operating expenses; |
| • | we may not be able to refinance indebtedness on our properties at maturity due to business and market factors, including: disruptions in the capital and credit markets; the estimated cash flows of our properties and other assets; the value of our properties and other assets; and financial, competitive, business and other factors, including factors beyond our control; and |
| • | if refinanced, the terms of a refinancing may not be as favorable as the original terms of the related indebtedness. |
Our operating entities have a significant degree of leverage on their assets. Highly leveraged assets are inherently more sensitive to declines in revenues, increases in expenses and interest rates, and adverse market conditions. A leveraged company’s income and net assets also tend to increase or decrease at a greater rate than would otherwise be the case if money had not been borrowed. As a result, the risk of loss associated with a leveraged company, all other things being equal, is generally greater than for companies with comparatively less debt. Leverage may also result in a requirement for liquidity, which may force the sale of assets at times of low demand and/or prices for such assets.
We rely on our operating entities to provide our company with the funds necessary to make distributions on our units and meet our financial obligations. The leverage on our assets may affect the funds available to our company if the terms of the debt impose restrictions on the ability of our operating entities to make distributions to our company. In addition, our operating entities generally have to service their debt obligations before making distributions to our company or their parent entity. The Property Partnership is also required to make distributions to preferred unitholders before making distributions to us.
- 14 -
We have substantial indebtedness, and we may incur substantially more indebtedness in the future, and are subject to certain refinancing risks.
In addition to our $2.8 billion of corporate credit facilities, we may also incur indebtedness under future credit facilities or other debt-like instruments, in addition to any asset-level indebtedness. We may also issue debt or debt-like instruments in the market, which may or may not be rated. Should such debt or debt-like instruments be rated, a credit downgrade will have an adverse impact on the cost of such debt.
If we are unable to refinance our indebtedness on acceptable terms, or at all, we may need to dispose of one or more of our properties or other assets upon disadvantageous terms. In addition, prevailing interest rates or other factors at the time of refinancing could increase our interest expense, and if we mortgage property to secure payment of indebtedness and are unable to make mortgage payments, the mortgagee could foreclose upon such property or appoint a receiver to receive an assignment of our rents and leases. This may adversely affect our ability to make distributions or payments to our unitholders and lenders.
Changes in our credit ratings may have an adverse effect on our financial position and ability to raise capital.
We cannot assure you that any credit rating assigned to our partnership, any of our subsidiaries or any of our subsidiaries’ securities will remain in effect for any given period of time or that any rating will not be lowered or withdrawn entirely by the relevant rating agency. A lowering or withdrawal of such ratings may have an adverse effect on our financial position and ability to raise capital.
Restrictive covenants in our indebtedness may limit management’s discretion with respect to certain business matters.
Instruments governing any of our indebtedness or indebtedness of our operating entities or their subsidiaries may contain restrictive covenants limiting our discretion with respect to certain business matters. These covenants could place significant restrictions on, among other things, our ability to create liens or other encumbrances, to make distributions to our unitholders or make certain other payments, investments, loans and guarantees and to sell or otherwise dispose of assets and merge or consolidate with another entity. These covenants could also require us to meet certain financial ratios and financial condition tests. A failure to comply with any such covenants could result in a default which, if not cured or waived, could permit acceleration of the relevant indebtedness.
If we are unable to manage our interest rate risk effectively, our cash flows and operating results may suffer.
Advances under credit facilities and certain property-level mortgage debt bear interest at a variable rate. We may incur further indebtedness in the future that also bears interest at a variable rate or we may be required to refinance our debt at higher rates. In addition, though we attempt to manage interest rate risk, there can be no assurance that we will hedge such exposure effectively or at all in the future. Accordingly, increases in interest rates above that which we anticipate based upon historical trends would adversely affect our cash flows.
The Financial Conduct Authority in the United Kingdom has announced that it will cease to compel banks to participate in LIBOR after 2021. This change to the administration of LIBOR, and any other reforms to benchmark interest rates, could create significant risks and challenges for us. The discontinuance of, or changes to, benchmark interest rates may require adjustments to agreements to which we and other market participants are parties, as well as to related systems and processes.
We face potential adverse effects from tenant defaults, bankruptcies or insolvencies.
A commercial tenant may experience a downturn in its business, which could cause the loss of that tenant as a tenant or weaken its financial condition and result in its inability to make rental payments when due or, for retail tenants, a reduction in percentage rent payable. If a tenant defaults, we may experience delays and incur costs in enforcing our rights as landlord and protecting our investments.
We cannot evict a tenant solely because of its bankruptcy. In addition, in certain jurisdictions where we own properties, a court may authorize a tenant to reject and terminate its lease. In such a case, our claim against the tenant for unpaid, future rent would be subject to a statutory cap that might be substantially less than the remaining rent owed under the lease. In any event, it is unlikely that a bankrupt or insolvent tenant will pay the full amount it owes under a lease. The loss of rental payments from tenants and costs of re-leasing would adversely affect our cash flows and results of operations. In the case of our retail properties, the bankruptcy or insolvency of an anchor tenant or tenant with stores at many of our properties would cause us to suffer lower revenues and operational difficulties, including difficulties leasing the remainder of the property. Significant expenses associated with each property, such as mortgage payments, real estate taxes and maintenance costs, are generally not reduced when
- 15 -
circumstances cause a reduction in income from the property. In the event of a significant number of lease defaults and/or tenant bankruptcies, our cash flows may not be sufficient to pay cash distributions to our unitholders and repay maturing debt or other obligations.
Reliance on significant tenants could adversely affect our results of operations.
Many of our properties are occupied by one or more significant tenants and, therefore, our revenues from those properties are materially dependent on our relationships with and the creditworthiness and financial stability of those tenants. Our business would be adversely affected if any of those tenants failed to perform or renew certain of their significant leases for any reason, or otherwise became insolvent, declared bankruptcy or otherwise refused to pay rent in a timely fashion or at all. In the event of a default by one or more significant tenants, we may experience delays in enforcing our rights as landlord and may incur substantial costs in protecting our investment and re-leasing the property. If a lease of a significant tenant is terminated, it may be difficult, costly and time consuming to attract new tenants and lease the property for the rent previously received. In addition, the loss of a significant tenant (particularly if related to one of our signature projects, or if otherwise widely publicized) could cause harm to our reputation.
Our inability to enter into renewal or new leases with tenants on favorable terms or at all for all or a substantial portion of space that is subject to expiring leases would adversely affect our cash flows and operating results.
Our properties generate revenue through rental payments made by tenants of the properties. Upon the expiry of any lease, there can be no assurance that the lease will be renewed or the tenant replaced. The terms of any renewal or replacement lease may be less favorable to us than the existing lease. We would be adversely affected, in particular, if any major tenant ceases to be a tenant and cannot be replaced on similar or better terms or at all. Additionally, we may not be able to lease our properties to an appropriate mix of tenants. Retail tenants may negotiate leases containing exclusive rights to sell particular types of merchandise or services within a particular retail property. These provisions may limit the number and types of prospective tenants for the vacant space in such properties.
Our competitors may adversely affect our ability to lease our properties which may cause our cash flows and operating results to suffer.
Each segment of the real estate industry is competitive. Numerous other developers, managers and owners of commercial properties compete with us in seeking tenants and, in the case of our multifamily properties, there are numerous housing alternatives which compete with our properties in attracting residents. Some of the properties of our competitors may be newer, better located or better capitalized. These competing properties may have vacancy rates higher than our properties, which may result in their owners being willing to make space available at lower prices than the space in our properties, particularly if there is an oversupply of space available in the market. Competition for tenants could have an adverse effect on our ability to lease our properties and on the rents that we may charge or concessions that we must grant, which may cause our cash flows and operating results to suffer.
Our ability to realize our strategies and capitalize on our competitive strengths are dependent on the ability of our operating entities to effectively operate our large group of commercial properties, maintain good relationships with tenants, and remain well-capitalized, and our failure to do any of the foregoing would affect our ability to compete effectively in the markets in which we do business.
Our insurance may not cover some potential losses or may not be obtainable at commercially reasonable rates, which could adversely affect our financial condition and results of operations.
We maintain insurance on our properties in amounts and with deductibles that we believe are in line with what owners of similar properties carry; however, our insurance may not cover some potential losses or may not be obtainable at commercially reasonable rates in the future.
There also are certain types of risks (such as war, environmental contamination such as toxic mold, and lease and other contract claims) that are either uninsurable or not economically insurable. Should any uninsured or underinsured loss occur, we could lose our investment in, and anticipated profits and cash flows from, one or more properties, and we would continue to be obligated to repay any recourse mortgage indebtedness on such properties.
- 16 -
Possible terrorist activity could adversely affect our financial condition and results of operations and our insurance may not cover some losses due to terrorism or may not be obtainable at commercially reasonable rates.
Possible terrorist attacks in the markets where our properties are located may result in declining economic activity, which could reduce the demand for space at our properties, reduce the value of our properties and harm the demand for goods and services offered by our tenants.
Additionally, terrorist activities could directly affect the value of our properties through damage, destruction or loss. Our Core Office portfolio is concentrated in large metropolitan areas, some of which have been or may be perceived to be subject to terrorist attacks. Many of our office properties consist of high-rise buildings, which may also be subject to this actual or perceived threat. Our insurance may not cover some losses due to terrorism or may not be obtainable at commercially reasonable rates.
We are subject to risks relating to development and redevelopment projects.
On a strategic and selective basis, we may develop and redevelop properties. The real estate development and redevelopment business involves significant risks that could adversely affect our business, financial condition and results of operations, including the following:
| • | we may not be able to complete construction on schedule or within budget, resulting in increased debt service expense and construction costs and delays in leasing the properties; |
| • | we may not have sufficient capital to proceed with planned redevelopment or expansion activities; |
| • | we may abandon redevelopment or expansion activities already under way, which may result in additional cost recognition; |
| • | we may not be able to obtain, or may experience delays in obtaining, all necessary zoning, land-use, building, occupancy and other governmental permits and authorizations; |
| • | we may not be able to lease properties at all or on favorable terms, or occupancy rates and rents at a completed project might not meet projections and, therefore, the project might not be profitable; |
| • | construction costs, total investment amounts and our share of remaining funding may exceed our estimates and projects may not be completed and delivered as planned; and |
| • | upon completion of construction, we may not be able to obtain, or obtain on advantageous terms, permanent financing for activities that we have financed through construction loans. |
We are subject to risks that affect the retail environment.
We are subject to risks that affect the retail environment, including unemployment, weak income growth, lack of available consumer credit, industry slowdowns and plant closures, low consumer confidence, increased consumer debt, poor housing market conditions, adverse weather conditions, natural disasters and the need to pay down existing obligations. Any of these factors could negatively affect consumer spending and adversely affect the sales of our retail tenants. This could have an unfavorable effect on our operations and our ability to attract new retail tenants.
In addition, our retail tenants face competition from retailers at other regional malls, outlet malls and other discount shopping centers, discount shopping clubs, catalogue companies, and through internet sales and telemarketing. Competition of these types could reduce the percentage rent payable by certain retail tenants and adversely affect our revenues and cash flows. Additionally, our retail tenants are dependent on perceptions by retailers and shoppers of the safety, convenience and attractiveness of our retail properties. If retailers and shoppers perceive competing properties and other retailing options such as the internet to be more convenient or of a higher quality, our revenues may be adversely affected.
Some of our retail lease agreements include a co-tenancy provision which allows the mall tenant to pay a reduced rent amount and, in certain instances, terminate the lease, if we fail to maintain certain occupancy levels at the mall. In addition, certain of our tenants have the ability to terminate their leases prior to the lease expiration date if their sales do not meet agreed upon thresholds. Therefore, if occupancy, tenancy or sales fall below certain thresholds, rents we are entitled to receive from our retail tenants would be reduced and our ability to attract new tenants may be limited.
- 17 -
The computation of cost reimbursements from our retail tenants for common area maintenance, insurance and real estate taxes is complex and involves numerous judgments including interpretation of lease terms and other tenant lease provisions. Most tenants make monthly fixed payments of common area maintenance, insurance, real estate taxes and other cost reimbursements and, after the end of the calendar year, we compute each tenant’s final cost reimbursements and issue a bill or credit for the full amount, after considering amounts paid by the tenant during the year. The billed amounts could be disputed by the tenant or become the subject of a tenant audit or even litigation. There can be no assurance that we will collect all or any portion of these amounts.
A shift in retail shopping from brick and mortar stores to online shopping may have an adverse impact on our cash flow, financial condition and results of operations.
Many retailers operating brick and mortar stores have made online sales a vital piece of their business. The shift to online shopping may cause declines in brick and mortar sales generated by certain of our tenants and may cause certain of our tenants to reduce the size or number of their retail locations in the future. As a result, our cash flow, financial condition, and results of operations could be adversely affected.
We are subject to risks associated with the multifamily residential industry.
We are subject to risks associated with the multifamily residential industry, including the level of mortgage interest rates which may encourage tenants to purchase rather than lease and housing and governmental programs that provide assistance and rent subsidies to tenants. If the demand for multifamily properties is reduced, income generated from our multifamily residential properties and the underlying value of such properties may be adversely affected.
In addition, certain jurisdictions regulate the relationship of an owner and its residential tenants. Commonly, these laws require a written lease, good cause for eviction, disclosure of fees, and notification to residents of changed land use, while prohibiting unreasonable rules, retaliatory evictions, and restrictions on a resident’s choice of landlords. Apartment building owners have been the subject of lawsuits under various “Landlord and Tenant Acts” and other general consumer protection statutes for coercive, abusive or unconscionable leasing and sales practices. If we become subject to litigation, the outcome of any such proceedings may materially adversely affect us for long periods of time. A few jurisdictions may offer more significant protection to residential tenants. In addition to state or provincial regulation of the landlord-tenant relationship, numerous towns and municipalities impose rent control on apartment buildings. The imposition of rent control on our multifamily residential units could have a materially adverse effect on our results of operations.
We may be adversely affected by trends in the office real estate industry.
Some businesses increasingly permit employee telecommuting, flexible work schedules, open workplaces and teleconferencing. There is also an increasing trend of businesses utilizing shared office and co-working spaces. These practices enable businesses to reduce their space requirements. These trends could over time erode the overall demand for office space and, in turn, place downward pressure on occupancy, rental rates and property valuations. A reduced demand for office space could have an adverse impact on our business, cash flow, financial condition and results of operations.
We are subject to risks associated with the hospitality industry.
We are subject to risks associated with the hospitality industry, including: the relative attractiveness of our hotel properties and the level of services provided to guests; dependence on business and leisure travel and tourism; the seasonality of the hotel industry, which may cause our results of operations to vary on a quarterly basis; perceptions regarding the safety and conditions at our hospitality properties; and the appeal to travelers of the local markets in which our hotels are located which could have an adverse effect on our financial condition and results of operations.
A business disruption may adversely affect our financial condition and results of operations.
Our business is vulnerable to damages from any number of sources, including computer viruses, unauthorized access, energy blackouts, natural disasters, pandemics, terrorism, war and telecommunication failures. Any system failure or accident that causes interruptions in our operations could result in a material disruption to our business. For example, major health issues and pandemics, such as the coronavirus that has impacted China's population, commerce and travel and has spread to other countries, may adversely affect trade and global and local economies. Given the ongoing and dynamic nature of the circumstances, it is difficult to predict the impact of the coronavirus outbreak on our business. The extent of such impact will depend on future developments, which are highly uncertain and cannot be predicted, including new information which may emerge concerning the severity of the coronavirus and actions taken to contain the coronavirus or its impact, among others. If we are unable to recover from a business disruption on a timely basis, our financial condition and results of operations would be adversely affected. We
- 18 -
may also incur additional costs to remedy damages caused by such disruptions, which could adversely affect our financial condition and results of operations.
Our failure to maintain effective internal controls could have a material adverse effect on our business.
Pursuant to Section 404 of the Sarbanes-Oxley Act, our management has delivered a report that assesses the effectiveness of our internal controls over financial reporting (in which they concluded that these internal controls are effective) and our independent registered public accounting firm has delivered an attestation report on our management’s assessment of, and the operating effectiveness of, our internal controls over financial reporting in conjunction with their opinion on our audited consolidated financial statements. Any failure to maintain adequate internal controls over financial reporting or to implement required, new or improved controls, or difficulties encountered in their implementation, could cause us to report material weaknesses in our internal controls over financial reporting and could result in errors or misstatements in our consolidated financial statements that could be material. If we were to conclude that our internal controls over financial reporting were not effective, investors could lose confidence in our reported financial information and the price of our units could decline. Our failure to achieve and maintain effective internal controls could have a material adverse effect on our business in the future, our access to the capital markets and investors’ perception of us. In addition, material weaknesses in our internal controls could require significant expense and management time to remediate.
The failure of our information technology systems, or an act of deliberate cyber terrorism, could adversely impact our reputation and financial performance.
We operate in businesses that are dependent on information systems and technology. Our information systems and technology may not continue to be able to accommodate our growth, and the cost of maintaining such systems may increase from its current level, either of which could have a material adverse effect on us.
We rely on third-party service providers to manage certain aspects of our business, including for certain information systems and technology, data processing systems, and the secure processing, storage and transmission of information. Any interruption or deterioration in the performance of these third parties or failures of their information systems and technology could impair the quality of our operations and could adversely affect our business and reputation.
We rely on certain information technology systems which may be subject to cyber terrorism intended to obtain unauthorized access to our proprietary information, destroy data or disable, degrade or sabotage our systems, through the introduction of computer viruses, cyber-attacks and other means, and could originate from a variety of sources including our own employees or unknown third parties. Any such breach or compromise could also go undetected for an extended period. There can be no assurance that measures implemented to protect the integrity of our systems will provide adequate protection or enable us to detect and remedy any such breaches or compromises in a timely manner or at all. If our information systems are compromised, we could suffer a disruption in one or more of our businesses. This could have a negative impact on our financial condition and results of operations or result in reputational damage.
Because certain of our assets are illiquid, we may not be able to sell these assets when appropriate or when desired.
Large commercial properties like the ones that we own can be hard to sell, especially if local market conditions are poor. Such illiquidity could limit our ability to diversify our assets promptly in response to changing economic or investment conditions.
Additionally, financial difficulties of other property owners resulting in distressed sales could depress real estate values in the markets in which we operate in times of illiquidity. These restrictions reduce our ability to respond to changes in the performance of our assets and could adversely affect our financial condition and results of operations.
We face risks associated with property acquisitions.
Competition from other well-capitalized real estate investors, including both publicly traded real estate investment trusts and institutional investment funds, may significantly increase the purchase price of, or prevent us from acquiring, a desired property. Acquisition agreements will typically contain conditions to closing, including completion of due diligence to our satisfaction or other conditions that are not within our control, which may not be satisfied. Acquired properties may be located in new markets where we may have limited knowledge and understanding of the local economy, an absence of business relationships in the area or unfamiliarity with local government and applicable laws and regulations. We may be unable to finance acquisitions on favorable terms or newly acquired properties may fail to perform as expected. We may underestimate the costs necessary to bring an acquired property up to standards established for its intended market position or we may be unable to quickly and efficiently integrate new acquisitions into our existing operations. We may also acquire properties subject to liabilities and without any recourse, or with
- 19 -
only limited recourse, with respect to unknown liabilities. Each of these factors could have an adverse effect on our results of operations and financial condition.
We do not control certain businesses that our LP Investments are invested in, and therefore we may not be able to realize some or all of the benefits that we expect to realize from those entities.
We do not have control of certain businesses our LP Investments are invested in. Our interests in those entities subject us to the operating and financial risks of their businesses, the risk that the relevant company may make business, financial or management decisions that we do not agree with, and the risk that we may have differing objectives than the entities in which we have interests. Because we do not have the ability to exercise control over those entities, we may not be able to realize some or all of the benefits that we expect to realize from those entities. For example, we may not be able to cause such operating entities to make distributions to us in the amount or at the time that we need or want such distributions. In addition, we rely on the internal controls and financial reporting controls of the companies in which we invest and the failure of such companies to maintain effective controls or comply with applicable standards may adversely affect us.
We do not have sole control over the properties that we own with co-venturers, partners, fund investors or co-tenants or over the revenues and certain decisions associated with those properties, which may limit our flexibility with respect to these investments.
We participate in joint ventures, partnerships, funds and co-tenancies affecting many of our properties. Such investments involve risks not present were a third party not involved, including the possibility that our co-venturers, partners, fund investors or co-tenants might become bankrupt or otherwise fail to fund their share of required capital contributions. The bankruptcy of one of our co-venturers, partners, fund investors or co-tenants could materially and adversely affect the relevant property or properties. Pursuant to bankruptcy laws, we could be precluded from taking some actions affecting the estate of the other investor without prior court approval which would, in most cases, entail prior notice to other parties and a hearing. At a minimum, the requirement to obtain court approval may delay the actions we would or might want to take. If the relevant joint venture or other investment entity has incurred recourse obligations, the discharge in bankruptcy of one of the other investors might result in our ultimate liability for a greater portion of those obligations than would otherwise be required.
Additionally, our co-venturers, partners, fund investors or co-tenants might at any time have economic or other business interests or goals that are inconsistent with those of our company, and we could become engaged in a dispute with any of them that might affect our ability to develop or operate a property. In addition, we do not have sole control of certain major decisions relating to these properties, including decisions relating to: the sale of the properties; refinancing; timing and amount of distributions of cash from such properties; and capital improvements. For example, when we invest in Brookfield-sponsored real estate funds, there is often a finite term to the fund’s investments which could lead to certain investments being sold prior to the date we would otherwise choose.
In some instances, where we are the property manager for a joint venture, the joint venture retains joint approval rights over various material matters such as the budget for the property, specific leases and our leasing plan. Moreover, in certain property management arrangements the other venturer can terminate the property management agreement in limited circumstances relating to enforcement of the property manager’s obligations. In addition, the sale or transfer of interests in some of our joint ventures and partnerships is subject to rights of first refusal or first offer and some joint venture and partnership agreements provide for buy-sell or similar arrangements. Such rights may be triggered at a time when we may not want to sell but we may be forced to do so because we may not have the financial resources at that time to purchase the other party’s interest. Such rights may also inhibit our ability to sell an interest in a property or a joint venture or partnership within our desired time frame or on any other desired basis.
We have significant interests in Brookfield-sponsored real estate funds, and poor investment returns in these funds could have a negative impact on our financial condition and results of operations.
We have, and expect to continue to have in the future, significant interests in Brookfield-sponsored real estate funds, and poor investment returns in these funds, due to either market conditions or underperformance (relative to their competitors or to benchmarks), could negatively affect our financial condition and results of operations. In addition, interests in such funds are subject to the risks inherent in the ownership and operation of real estate and real estate-related businesses and assets generally.
We are subject to risks associated with commercial property loans.
We have, and expect to continue to have in the future, significant interests in Brookfield-sponsored real estate finance funds which have interests in loans or participations in loans, or securities whose underlying performance depends on loans made
- 20 -
with respect to a variety of commercial real estate. Such interests are subject to normal credit risks as well as those generally not associated with traditional debt securities. The ability of the borrowers to repay the loans will typically depend upon the successful operation of the related real estate project and the availability of financing. Any factors that affect the ability of the project to generate sufficient cash flow could have a material effect on the value of these interests. Security underlying such interests will generally be in a junior or subordinate position to senior financing. These investments will not always benefit from the same or similar financial and other covenants as those enjoyed by the debt ranking ahead of these investments or benefit from cross-default provisions. Moreover, it is likely that these funds will be restricted in the exercise of their rights in respect of their investments by the terms of subordination agreements with the debt ranking ahead of the mezzanine capital. Accordingly, we may not be able to take the steps necessary to protect our investments in a timely manner or at all and there can be no assurance that the rate of return objectives of any particular investment will be achieved. To protect our original investment and to gain greater control over the underlying assets, these funds may elect to purchase the interest of a senior creditor or take an equity interest in the underlying assets, which may require additional investment requiring us to expend additional capital.
Our ownership of underperforming real estate properties involves significant risks and potential additional liabilities.
Our LP Investments segment holds interests in certain real estate properties with weak financial conditions, poor operating results, substantial financial needs, negative net worth or special competitive problems, or that are over-leveraged. Our ownership of underperforming real estate properties involves significant risks and potential additional liabilities. Our exposure to such underperforming properties may be substantial in relation to the market for those interests and distressed assets may be illiquid and difficult to sell or transfer. As a result, it may take a number of years for the fair value of such interests to ultimately reflect their intrinsic value as perceived by us.
We face risks relating to the jurisdictions of our operations.
Our operations are subject to significant political, economic and financial risks, which vary by jurisdiction, and may include:
| • | changes in government policies or personnel; |
| • | restrictions on currency transfer or convertibility; |
| • | changes in labor relations; |
| • | less developed or efficient financial markets than in North America; |
| • | fluctuations in foreign exchange rates; |
| • | the absence of uniform accounting, auditing and financial reporting standards, practices and disclosure requirements; |
| • | less government supervision and regulation; |
| • | a less developed legal or regulatory environment; |
| • | heightened exposure to corruption risk; |
| • | political hostility to investments by foreign investors; and |
| • | difficulty in enforcing contractual obligations and expropriation or confiscation of assets. |
Political instability and unfamiliar cultural factors could adversely impact the value of our investments.
We are subject to geopolitical uncertainties in all jurisdictions in which we operate, including North America. We also make investments in businesses that are based outside of North America and we may pursue investments in unfamiliar markets, which may expose us to additional risks not typically associated with investing in North America. We may not properly adjust to the local culture and business practices in such markets, and there is the prospect that we may hire personnel or partner with local persons who might not comply with our culture and ethical business practices; either scenario could result in the failure of our initiatives in new markets and lead to financial losses for us and our operating entities. There are risks of political instability in several of our major markets and in other parts of the world in which we conduct business, including, for example, the Korean Peninsula, from factors such as political conflict, income inequality, refugee migration, terrorism, the potential break-up of political or economic unions (or the departure of a union member) and political corruption; the materialization of one or more of these risks
- 21 -
could negatively affect our financial performance. For example, it is unclear how the withdrawal of the United Kingdom from the European Union (“Brexit”) may impact the economies of the United Kingdom, the European Union countries and other nations where we are invested. Brexit could significantly disrupt the free movement of goods, services, and people between the United Kingdom and the European Union and result in increased legal and regulatory complexities, as well as potential higher costs of conducting business in Europe. Any of these effects of Brexit, among others, could adversely affect our financial position, results of operations or cash flows.
Unforeseen political events in markets where we own and operate assets and may look to for further growth of our businesses, such as the United States, Brazil, European and Asian markets, may create economic uncertainty that has a negative impact on our financial performance. Such uncertainty could cause disruptions to our businesses, including affecting the business of and/or our relationships with our customers and suppliers, as well as altering the relationship among tariffs and currencies, including the value of the British pound and the Euro relative to the U.S. dollar. Disruptions and uncertainties could adversely affect our financial condition, operating results and cash flows. In addition, political outcomes in the markets in which we operate may also result in legal uncertainty and potentially divergent national laws and regulations, which can contribute to general economic uncertainty. Economic uncertainty impacting us and our managed entities could be exacerbated by near-term political events, including those in the United States, Brazil, Europe, Asia and elsewhere.
Our operations in China subject us to increased risks, including risks related to evolving economic, political and social conditions.
Our business is subject to risks inherent in doing business internationally. In particular, we face risks relating to our business in China. For the year ended December 31, 2019, less than 1% of our assets were in China. In recent years, the Chinese government has been reforming its economic and political systems, and we expect this to continue. Although we believe that these reforms have had a positive effect on our ability to do business in China, we cannot assure you that these reforms will continue or that the Chinese government will not take actions that impair our business in China. In addition, recent international unrest involving mounting trade tension between China and the United States presents additional risks and uncertainties. If our ability to do business in China is adversely impacted, our business, results of operation and financial condition could be materially adversely affected.
We are subject to possible health and safety and environmental liabilities and other possible liabilities.
As an owner of real property, we are subject to various laws relating to environmental matters. We could be liable under these laws for the costs of removal and remediation of certain hazardous substances or wastes present in our buildings, released or deposited on or in our properties or disposed of at other locations. These costs could be significant and reduce the cash available for our business which could have an adverse effect on our business, financial condition and results of operations. The failure to remove or remediate such substances could adversely affect our ability to sell our properties or our ability to borrow using real estate as collateral and could potentially result in claims or other proceedings against us, which could have an adverse effect on our business, financial condition and results of operations. Environmental laws and regulations can change rapidly and we may become subject to more stringent environmental laws and regulations in the future. Compliance with more stringent environmental laws and regulations could have an adverse effect on our business, financial condition or results of operations.
The ownership and operation of our assets carry varying degrees of inherent risk or liability related to worker and tenant health and safety and the environment, including the risk of government imposed orders to remedy unsafe conditions and potential civil liability. Compliance with health, safety and environmental standards and the requirements set out in our licenses, permits and other approvals are important to our business. We have incurred and will continue to incur significant capital and operating expenditures to comply with health, safety and environmental standards and to obtain and comply with licenses, permits and other approvals and to assess and manage potential liability exposure. Nevertheless, we may be unsuccessful in obtaining or maintaining an important license, permit or other approval or become subject to government orders, investigations, inquiries or other proceedings (including civil claims) relating to health, safety and environmental matters. The occurrence of any of these events or any changes, additions to, or more rigorous enforcement of, health, safety and environmental standards, licenses, permits or other approvals could have a significant impact on our operations and/or result in material expenditures. As a consequence, no assurance can be given that additional environmental and health and safety issues relating to presently known or unknown matters will not require unanticipated expenditures, or result in fines, penalties or other consequences (including changes to operations) material to our business and operations.
Negative publicity could damage our reputation and business.
Our ability to attract and retain tenants, investors and employees is impacted by our reputation. Also, negative publicity can expose us to litigation and regulatory action could damage our reputation, adversely affect our ability to attract and retain
- 22 -
tenants and employees, and divert management’s attention from day-to-day operations. The loss of significant tenants could also negatively impact our reputation. Significant harm to our reputation can also arise from employee misconduct, unethical behavior, environmental matters, litigation or regulatory outcomes, failing to deliver minimum or required standards of safety, service and quality, compliance failures, unintended disclosure of confidential information and the activities of our tenants and counterparties, including vendors.
We may be exposed to actual or alleged fraud, bribery, corruption, other illegal acts, inadequate or failed internal processes or systems or from external events which could lead to significant losses and harm to our reputation.
We may suffer a significant loss resulting from fraud, bribery, corruption, other illegal acts, inadequate or failed internal processes or systems, or from external events, such as security threats affecting our ability to operate. We operate in different markets and rely on our employees and certain third-parties to follow our policies and processes as well as applicable laws with respect to their activities. Risk of illegal acts or failed systems is managed through our infrastructure, controls, systems, policies and people, complemented by central groups focusing on enterprise-wide management of specific operational risks such as fraud, trading, outsourcing, and business disruption, as well as personnel and systems risks. Failure to adequately manage these risks could result in direct or indirect financial loss, reputational impact, regulatory censure or failure in the management of other risks such as credit or market risk.
There is an increasing global focus on the implementation and enforcement of anti-bribery and corruption legislation, and this focus has heightened the risks that we face in this area, particularly as we expand our operations globally. We are subject to a number of laws and regulations governing payments and contributions to public officials or other third parties, including restrictions imposed by the U.S. Foreign Corrupt Practices Act and similar laws in non-U.S. jurisdictions, such as the U.K. Bribery Act and the Canadian Corruption of Foreign Public Officials Act. This increased global focus on anti-bribery and corruption enforcement may also lead to more investigations, both formal and informal, in this area, the results of which cannot be predicted.
Different laws that are applicable to us may contain conflicting provisions, making our compliance more difficult. The policies and procedures we have implemented to protect against non-compliance with anti-bribery and corruption legislation may be inadequate. If we fail to comply with these laws and regulations, we could be exposed to claims for damages, financial penalties, reputational harm, incarceration of our employees, restrictions on our operations and other liabilities, which could negatively affect our operating results and financial condition. In addition, we may be subject to successor liability for violations under these laws or other acts of bribery committed by companies in which we or our funds invest.
Instances of bribery, fraud, accounting irregularities and other improper, illegal or corrupt practices can be difficult to detect, and fraud and other deceptive practices can be widespread in certain jurisdictions. We invest in emerging market countries that may not have established stringent anti-bribery and corruption laws and regulations, or where existing laws and regulations may not be consistently enforced or that are perceived to have materially higher levels of corruptions according to international rating standards. For example, we invest in jurisdictions that are perceived to have materially higher levels of corruption according to international rating standards, such as China, India and Brazil. Due diligence on investment opportunities in these jurisdictions is frequently more challenging because consistent and uniform commercial practices in such locations may not have developed or do not meet international standards. Bribery, fraud, accounting irregularities and corrupt practices can be especially difficult to detect in such locations.
We face risks associated with our tenants and contractual counterparties being designated “Prohibited Persons” by the Office of Foreign Assets Control.
Pursuant to Executive Order 13224 and other laws, the Office of Foreign Assets Control of the United States Department of the Treasury (“OFAC”) maintains a list of persons designated as terrorists or who are otherwise blocked or banned. OFAC regulations and other laws prohibit conducting business or engaging in transactions with prohibited persons. Certain of our loan and other agreements require us to comply with OFAC requirements. Our leases and other agreements, in general, require the other party to comply with OFAC requirements. If a tenant or other party with whom we contract is placed on the OFAC list, we may be required to terminate the lease or other agreement. Any such termination could result in a loss of revenue or a damage claim by the other party that the termination was wrongful.
We may be subject to litigation.
In the ordinary course of our business, we may be subject to litigation from time to time. The outcome of any such proceedings may materially adversely affect us and may continue without resolution for long periods of time. Any litigation may consume substantial amounts of our management’s time and attention, and that time and the devotion of these resources to litigation may, at times, be disproportionate to the amounts at stake in the litigation.
- 23 -
The acquisition, ownership and disposition of real property expose us to certain litigation risks which could result in losses, some of which may be material. Litigation may be commenced with respect to a property we have acquired in relation to activities that took place prior to our acquisition of such property. In addition, at the time of disposition of an individual property, a potential buyer may claim that it should have been afforded the opportunity to purchase the asset or alternatively that such buyer should be awarded due diligence expenses incurred or statutory damages for misrepresentation relating to disclosures made, if such buyer is passed over in favor of another as part of our efforts to maximize sale proceeds. Similarly, successful buyers may later sue us under various damage theories, including those sounding in tort, for losses associated with latent defects or other problems. We may also be exposed to litigation resulting from the activities of our tenants or their customers.
Climate change may adversely impact our operations and markets.
There is growing concern from members of the scientific community and the general public that an increase in global average temperatures due to emissions of greenhouse gases and other human activities have or will cause significant changes in weather patterns and increase the frequency and severity of climate stress events. Climate change, including the impact of global warming, creates physical and financial risk. Physical risks from climate change include an increase in sea level and changes in weather conditions, such as an increase in intense precipitation and extreme heat events, as well as tropical and non-tropical storms.
We own buildings in coastal locations that may be particularly susceptible to climate stress events or adverse localized effects of climate change, such as sea-level rise and increased storm frequency or intensity. The occurrence of one or more natural disasters, such as hurricanes, fires, floods, and earthquakes (whether or not caused by climate change), could cause considerable damage to our properties, disrupt our operations and negatively impact our financial performance. To the extent these events result in significant damage to or closure of one or more of our buildings, our operations and financial performance could be adversely affected through lost tenants and an inability to lease or re-lease the space. In addition, these events could result in significant expenses to restore or remediate a property, increases in fuel (or other energy) prices or a fuel shortage and increases in the costs of insurance if they result in significant loss of property or other insurable damage.
Risks Relating to Us and Our Structure
Our company relies on the Property Partnership and, indirectly, the Holding Entities and our operating entities to provide us with the funds necessary to pay distributions and meet our financial obligations.
Our company’s sole direct investments are its managing general partnership interest in the Property Partnership, which owns almost all of the common shares or equity interests, as applicable, of the Holding Entities, through which we hold our interests in the operating entities and an interest in BP US REIT LLC, which holds the partnership’s interest in certain commercial and other income producing property operations. Our company has no independent means of generating revenue. As a result, we depend on distributions and other payments from the Property Partnership and, indirectly, the Holding Entities and our operating entities to provide us with the funds necessary to pay distributions on our units and to meet our financial obligations. The Property Partnership, the Holding Entities and our operating entities are legally distinct from our company and they are generally required to service their debt obligations before making distributions to us or their parent entity, as applicable, thereby reducing the amount of our cash flow available to pay distributions on our units, fund working capital and satisfy other needs. In addition, the Property Partnership is required to make distributions to its preferred unitholders before making distributions to us. Any other entities through which we may conduct operations in the future will also be legally distinct from our company and may be restricted in their ability to pay dividends and distributions or otherwise make funds available to our company under certain conditions.
We anticipate that the only distributions our company will receive in respect of our managing general partnership interests in the Property Partnership will consist of amounts that are intended to assist our company in making distributions to our unitholders in accordance with our company’s distribution policy and to allow our company to pay expenses as they become due.
We may not be able to continue paying comparable or growing cash distributions to our unitholders in the future.
Our company intends to make quarterly cash distributions of approximately $1.33 per LP Unit on an annualized basis. However, despite our projections, there can be no assurance that we will be able to make such distributions or meet our target growth rate range of 5% to 8% annually.
Although we may use distributions from our operating entities, the proceeds of sales of certain of our direct investments and/or borrowings to fund any shortfall in distributions, we may not be able to do so on a consistent and sustainable basis. Our ability to make distributions will depend on several other factors, some of which are out of our control, including, among other things, general economic conditions, our results of operations and financial condition, the amount of cash that is generated by our
- 24 -
operations and investments, restrictions imposed by the terms of any indebtedness that is incurred to finance our operations and investments or to fund liquidity needs, levels of operating and other expenses, and contingent liabilities, any or all of which could prevent us from meeting our anticipated distribution levels. Finally, the BPY General Partner has sole authority to determine when and if our distributions will be made in respect of our units, and there can be no assurance that the BPY General Partner will declare and pay the distributions on our units as intended or at all.
Our company is not, and does not intend to become, regulated as an investment company under the U.S. Investment Company Act of 1940 (the “Investment Company Act”) (and similar legislation in other jurisdictions) and if our company were deemed an “investment company” under the Investment Company Act applicable restrictions would make it impractical for us to operate as contemplated.
The Investment Company Act and the rules thereunder (and similar legislation in other jurisdictions) provide certain protections to investors and impose certain restrictions on companies that are registered as investment companies. Among other things, such rules limit or prohibit transactions with affiliates, impose limitations on the issuance of debt and equity securities and impose certain governance requirements. Our company has not been and does not intend to become regulated as an investment company and our company intends to conduct its activities so it will not be deemed to be an investment company under the Investment Company Act (and similar legislation in other jurisdictions). In order to ensure that our company is not deemed to be an investment company, we may be required to materially restrict or limit the scope of our operations or plans, we will be limited in the types of acquisitions that we may make and we may need to modify our organizational structure or dispose of assets that we would not otherwise dispose of. Moreover, if anything were to happen that would potentially cause our company to be deemed an investment company under the Investment Company Act, it would be impractical for us to operate as intended, agreements and arrangements between and among us and Brookfield would be impaired and our business, financial condition and results of operations would be materially adversely affected. Accordingly, we would be required to take extraordinary steps to address the situation, such as the amendment or termination of our Master Services Agreement, the restructuring of our company and the Holding Entities, the amendment of our limited partnership agreement or the termination of our company, any of which would materially adversely affect the value of our units. In addition, if our company were deemed to be an investment company under the Investment Company Act, it would be taxable as a corporation for U.S. federal income tax purposes, and such treatment would materially adversely affect the value of our units. See Item 10.E. “Additional Information - Taxation - U.S. Tax Considerations - Partnership Status of Our Company and the Property Partnership”.
Our company is a “foreign private issuer” under U.S. securities laws and as a result is subject to disclosure obligations different from requirements applicable to U.S. domestic registrants listed on the Nasdaq Stock Market (the “Nasdaq”).
Although our company is subject to the periodic reporting requirement of the U.S. Securities Exchange Act of 1934, as amended (the “Exchange Act”), the periodic disclosure required of foreign private issuers under the Exchange Act is different from periodic disclosure required of U.S. domestic registrants. Therefore, there may be less publicly available information about us than is regularly published by or about other public companies in the United States and our company is exempt from certain other sections of the Exchange Act that U.S. domestic registrants would otherwise be subject to, including the requirement to provide our unitholders with information statements or proxy statements that comply with the Exchange Act. In addition, insiders and large unitholders of our company are not obligated to file reports under Section 16 of the Exchange Act and certain of the governance rules imposed by the Nasdaq are inapplicable to our company.
Our company is a “SEC foreign issuer” under Canadian securities regulations and is exempt from certain requirements of Canadian securities laws.
Although our company is a reporting issuer in Canada, we are a “SEC foreign issuer” and exempt from certain Canadian securities laws relating to continuous disclosure obligations and proxy solicitation as long as we comply with certain reporting requirements applicable in the United States, provided that the relevant documents filed with the U.S. Securities and Exchange Commission (the “SEC”), are filed in Canada and sent to our unitholders in Canada to the extent and in the manner and within the time required by applicable U.S. requirements. Therefore, there may be less publicly available information in Canada about us than is regularly published by or about other reporting issuers in Canada.
We may be subject to the risks commonly associated with a separation of economic interest from control or the incurrence of debt at multiple levels within an organizational structure.
Our ownership and organizational structure is similar to structures whereby one company controls another company which in turn holds controlling interests in other companies; thereby, the company at the top of the chain may control the company at the bottom of the chain even if its effective equity position in the bottom company is less than a controlling interest. Brookfield is the sole shareholder of the BPY General Partner and, as a result of such ownership of the BPY General Partner, Brookfield
- 25 -
controls the appointment and removal of the BPY General Partner’s directors and, accordingly, exercises substantial influence over us. In turn, we often have a majority controlling interest or a significant influence in our investments. In addition, Brookfield has an effective economic interest in our business of approximately 51% as of the date of this Form 20-F and over time may reduce this economic interest while still maintaining its controlling interest. Therefore, Brookfield may use its control rights in a manner that conflicts with the economic interests of our other unitholders. For example, despite the fact that our company has a conflicts policy in place which addresses the requirement for independent approval and other requirements for transactions in which there is greater potential for a conflict of interest to arise, including transactions with affiliates of Brookfield, because Brookfield exerts substantial influence over us, and, in turn, over our investments, there is a greater risk of transfer of assets of our investments at non-arm’s length values to Brookfield and its affiliates. In addition, debt incurred at multiple levels within the chain of control could exacerbate the separation of economic interest from controlling interest at such levels, thereby creating an incentive to leverage our company and our investments. Any such increase in debt would also make us more sensitive to declines in revenues, increases in expenses and interest rates, and adverse market conditions. The servicing of any such debt would also reduce the amount of funds available to pay distributions to our company and ultimately to our unitholders.
Risks Relating to Our Relationship with Brookfield
Brookfield exercises substantial influence over us and we are highly dependent on the Service Providers.
Brookfield is the sole shareholder of the BPY General Partner. As a result of its ownership of the BPY General Partner, Brookfield is able to control the appointment and removal of the BPY General Partner’s directors and, accordingly, exercises substantial influence over our company and over Property Partnership for which our company is the managing general partner. In addition, the Service Providers, wholly-owned subsidiaries of Brookfield, provide management and administration services to us pursuant to our Master Services Agreement. Our company and the Property Partnership depend on the management and administration services provided by the Service Providers. Brookfield personnel that provide services to us are not required to have as their primary responsibility the management and administration of our company or the Property Partnership or to act exclusively for either of us. Any failure to effectively manage our business operations or to implement our strategy could have a material adverse effect on our business, financial condition and results of operations.
Brookfield has no obligation to source acquisition opportunities for us and we may not have access to all acquisitions of commercial properties that Brookfield identifies.
Our ability to grow depends in part on Brookfield’s ability to identify and present us with acquisition opportunities. Brookfield established our company to be its flagship public commercial property entity and the primary entity through which it invests in real estate on a global basis. However, Brookfield has no obligation to source acquisition opportunities for us. In addition, Brookfield has not agreed to commit to us any minimum level of dedicated resources for the pursuit of acquisitions. There are a number of factors that could materially and adversely impact the extent to which suitable acquisition opportunities are made available to us by Brookfield.
For example:
| • | it is an integral part of Brookfield’s (and our) strategy to pursue acquisitions through consortium arrangements with institutional investors, strategic partners and/or financial sponsors and to form partnerships (including private funds, joint ventures and similar arrangements) to pursue such acquisitions on a specialized or global basis. Although Brookfield has agreed with us that it will not enter any such arrangements that are suitable for us without giving us opportunity to participate in them, there is no minimum level of participation to which we will be entitled; |
| • | the same professionals within Brookfield’s organization that are involved in sourcing acquisitions that are suitable for us are responsible for sourcing opportunities for the vehicles, consortiums and partnerships referred to above, as well as having other responsibilities within Brookfield’s broader asset management business. Limits on the availability of such individuals could result in a limitation on the number of acquisition opportunities sourced for us; |
| • | Brookfield will only recommend acquisition opportunities that it believes to be suitable and appropriate. Our focus is on investing in, owning, operating, developing and recycling a portfolio of high quality assets, not investments such as infrastructure-related, renewable power-related, or other operations-oriented enterprises that are not deemed suitable and/or appropriate for us. Legal, regulatory, tax and other commercial considerations will likewise be an important consideration in determining whether an opportunity is suitable and/or appropriate for us and will limit our ability to participate in certain acquisitions; and |
- 26 -
| • | in addition to structural limitations, the question of whether a particular acquisition is suitable and/or appropriate for us is highly subjective and is dependent on a number of portfolio construction and management factors including our liquidity position at the relevant time, the expected risk-return profile of the opportunity, its fit with the balance of our investments and related operations, other opportunities that we may be pursuing or otherwise considering at the relevant time, our interest in preserving capital in order to secure other opportunities and/or to meet other obligations, and other factors. If Brookfield determines that an opportunity is not suitable or appropriate for us, it may still pursue such opportunity on its own behalf or on behalf of a Brookfield-sponsored vehicle, partnership or consortium such as Brookfield Infrastructure Partners L.P., Brookfield Renewable Partners L.P., Brookfield Business Partners L.P., and one or more Brookfield-sponsored private funds or other investment vehicles or programs. |
In making these determinations, Brookfield may be influenced by factors that result in a misalignment or conflict of
interest. See Item 7.B., “Major Shareholders and Related Party Transactions - Related Party Transactions - Relationship with
Brookfield - Conflicts of Interest.”
The departure of some or all of Brookfield’s professionals could prevent us from achieving our objectives.
We depend on the diligence, skill and business contacts of Brookfield’s professionals and the information and opportunities they generate during the normal course of their activities. Our future success will depend on the continued service of these individuals, who are not obligated to remain employed with Brookfield. Brookfield has experienced departures of key professionals in the past and may do so in the future, and we cannot predict the impact that any such departures will have on our ability to achieve our objectives. The departure of a significant number of Brookfield’s professionals for any reason, or the failure to appoint qualified or effective successors in the event of such departures, could have a material adverse effect on our ability to achieve our objectives. Our limited partnership agreement and our Master Services Agreement do not require Brookfield to maintain the employment of any of its professionals or to cause any particular professionals to provide services to us or on our behalf.
Control of our company may be transferred directly or indirectly to a third party without unitholder consent.
The BPY General Partner may transfer its general partnership interest to a third party, including in a merger or consolidation or in a transfer of all or substantially all of its assets. Furthermore, at any time, the shareholder of the BPY General Partner may sell or transfer all or part of its shares in the BPY General Partner. Unitholder consent will not be sought in either case. If a new owner were to acquire ownership of the BPY General Partner and to appoint new directors or officers of its own choosing, it would be able to exercise substantial influence over our policies and procedures and exercise substantial influence over our management, our distributions and the types of acquisitions that we make. Such changes could result in our capital being used to make acquisitions in which Brookfield has no involvement or in making acquisitions that are substantially different from our targeted acquisitions. Additionally, we cannot predict with any certainty the effect that any transfer in the control of our company the BPY General Partner would have on the trading price of our units or our ability to raise capital or make investments in the future, because such matters would depend to a large extent on the identity of the new owner and the new owner’s intentions. As a result, our future would be uncertain and our business, financial condition and results of operations may suffer.
Brookfield may increase its ownership of our company and the Property Partnership relative to other unitholders.
Brookfield currently holds a significant portion of the issued and outstanding interests in the Property Partnership through Special LP Units and Redemption-Exchange Units. The Redemption-Exchange Units are redeemable for cash or exchangeable for LP Units in accordance with the Redemption-Exchange Mechanism, which could result in Brookfield eventually owning a larger portion of our issued and outstanding LP Units (including other issued and outstanding LP Units that Brookfield currently owns).
Brookfield may also reinvest incentive distributions in exchange for Redemption-Exchange Units or LP Units. Additional units of the Property Partnership acquired, directly or indirectly, by Brookfield are redeemable for cash or exchangeable for LP Units in accordance with the Redemption-Exchange Mechanism. See Item 10.B., “Additional Information - Memorandum and Articles of Association - Description of the Property Partnership Limited Partnership Agreement - Redemption-Exchange Mechanism”. Brookfield may also purchase additional LP Units of our company in the market. Any of these events may result in Brookfield increasing its ownership of our company.
Our organizational and ownership structure, as well as our contractual arrangements with Brookfield, may create significant conflicts of interest that may be resolved in a manner that is not in our best interests or the best interests of our unitholders.
Our organizational and ownership structure involves a number of relationships that may give rise to conflicts of interest between us and our unitholders, on the one hand, and Brookfield, on the other hand. In certain instances, the interests of Brookfield
- 27 -
may differ from the interests of our company and our unitholders, including with respect to the types of acquisitions made, the timing and amount of our distributions, the redeployment of returns generated by our operations, the use of leverage when making acquisitions and the appointment of outside advisors and service providers, including as a result of the reasons described under Item 7.B. “Major Shareholders and Related Party Transactions - Related Party Transactions - Relationship with Brookfield - Conflicts of Interest”.
In addition, the Service Providers, affiliates of Brookfield, provide management services to us pursuant to our Master Services Agreement. Pursuant to our Master Services Agreement, we pay a base management fee to the Service Providers equal to 0.5% of the total capitalization of our partnership, subject to an annual minimum of $50 million (plus the amount of any annual escalation by the specified inflation factor) and taking into account any management fees payable under the BPR Master Services Agreement. Additionally, the Property Partnership pays a quarterly equity enhancement distribution to Property Special LP of 0.3125% of the amount by which the company’s total capitalization value at the end of each quarter exceeds its total capitalization value determined immediately following the Spin-off, subject to certain adjustments. Property Special LP also receives incentive distributions based on an amount by which quarterly distributions on the limited partnership units of the Property Partnership exceed specified target levels as set forth in the Property Partnership’s limited partnership agreement. For a further explanation of the equity enhancement and incentive distributions, together with examples of how such amounts are calculated, see Item 10.B. “Additional Information - Memorandum and Articles of Association - Description of the Property Partnership Limited Partnership Agreement - Distributions”. This relationship may give rise to conflicts of interest between us and our unitholders, on the one hand, and Brookfield, on the other, as Brookfield’s interests may differ from our interests and those of our unitholders.
The BPY General Partner, the sole shareholder of which is Brookfield, has sole authority to determine whether our company will make distributions and the amount and timing of these distributions. The arrangements we have with Brookfield may create an incentive for Brookfield to take actions that would have the effect of increasing distributions and fees payable to it, which may be to the detriment of our company and our unitholders. For example, because the base management fee and the equity enhancement distribution are calculated based on our market value, it may create an incentive for Brookfield to increase or maintain our company’s total capitalization over the near-term when other actions may be more favorable to us or our unitholders. Similarly, Brookfield may take actions to increase our distributions in order to ensure it is paid incentive distributions in the near-term when other investments or actions may be more favorable to us or our unitholders. Likewise, Brookfield may take actions to decrease distributions on LP Units or defer acquisitions in order to increase our market value in the near-term when making such distributions or acquisitions may be more favorable to us or our unitholders.
Our arrangements with Brookfield set in the context of an affiliated relationship and may contain terms that are less favorable than those which otherwise might have been obtained from unrelated parties.
The terms of our arrangements with Brookfield were effectively determined by Brookfield in the context of the Spin-off. While the BPY General Partner’s independent directors are aware of the terms of these arrangements and approved the arrangements on our behalf at the time of the Spin-off, they did not negotiate the terms. These terms, including terms relating to compensation, contractual duties, conflicts of interest and Brookfield’s ability to engage in outside activities, including activities that compete with us, our activities and limitations on liability and indemnification, may be less favorable than otherwise might have resulted if the negotiations had involved unrelated parties. The transfer agreements under which our assets and operations were acquired from Brookfield do not contain representations and warranties or indemnities relating to the underlying assets and operations.
Brookfield and Oaktree operate their respective investment businesses largely independently, and do not expect to coordinate or consult on investment decisions, which may give rise to conflicts of interest and make it more difficult to mitigate certain conflicts of interest.
Brookfield and Oaktree Capital Group, LLC together with its affiliates (“Oaktree”) operate their respective investment businesses largely independently pursuant to an information barrier, and Brookfield does not expect to coordinate or consult with Oaktree with respect to investment activities and/or decisions. In addition, neither Brookfield nor Oaktree is expected to be subject to any internal approvals over its investment activities and decisions by any person who would have knowledge and/or decision-making control of the investment decisions of the other. As a result, it is expected that our company and our portfolio companies, as well as Brookfield, Brookfield-sponsored vehicles, consortiums and/or partnerships (including private funds, joint ventures and similar arrangements) (collectively, “Brookfield Accounts”) that we are invested in and their portfolio companies, will engage in activities and have business relationships that give rise to conflicts (and potential conflicts) of interests between them, on the one hand, and Oaktree, Oaktree-managed funds and accounts (collectively, “Oaktree Accounts”) and their portfolio companies, on the other hand. These conflicts (and potential conflicts) of interests may include: (i) competing from time to time for the same investment opportunities, (ii) the pursuit by Oaktree Accounts of investment opportunities suitable for our company and Brookfield Accounts that we are invested in, without making such opportunities available to us or those Brookfield Accounts, and (iii) the formation or establishment of new Oaktree Accounts that could compete or otherwise conduct their affairs without regard as to whether or
- 28 -
not they adversely impact our company and/or Brookfield Accounts that we are invested in. Investment teams managing the activities of our company and/or Brookfield Accounts that we are invested in are not expected to be aware of, and will not have the ability to manage, such conflicts.
Our company and/or Brookfield Accounts that we are invested in could be adversely impacted by Oaktree’s activities. Competition from Oaktree Accounts for investment opportunities could also, under certain circumstances, adversely impact the purchase price of our (direct and/or indirect) investments. As a result of different investment objectives, views and/or interests in investments, Oaktree will manage certain Oaktree Accounts in a way that is different than from the interests of our company and/or Brookfield Accounts that we are invested in, which could adversely impact our (direct and/or direct) investments. For more information, see Item 7.B., “Related Party Transactions - Conflicts of Interest and Fiduciary Duties - Oaktree”.
Brookfield and Oaktree are likely to be deemed to be affiliates for purposes of certain laws and regulations, which may result in, among other things, earlier public disclosure of investments by our company and/or Brookfield Accounts that we are invested in.
Brookfield and Oaktree are likely to be deemed to be affiliates for purposes of certain laws and regulations, notwithstanding their operational independence and/or information barrier, and it is anticipated that, from time to time, our company and/or Brookfield Accounts that we are invested in and Oaktree Accounts may each have significant positions in one or more of the same issuers. As such, Brookfield and Oaktree will likely need to aggregate certain investment holdings, including holdings of our company, Brookfield Accounts that we are invested in and Oaktree Accounts for certain securities law purposes and other regulatory purposes. Consequently, Oaktree’s activities could result in earlier public disclosure of investments by our company and/or Brookfield Accounts that we are invested in, restrictions on transactions by our company and/or Brookfield Accounts that we are invested in (including the ability to make or dispose of certain investments at certain times), adverse effects on the prices of investments made by our company and/or Brookfield Accounts that we are invested in, potential short-swing profit disgorgement, penalties and/or regulatory remedies, among others. For more information, see Item 7.B., “Related Party Transactions - Conflicts of Interest and Fiduciary Duties - Oaktree”.
Breaches of the information barrier and related internal controls by Brookfield and/or Oaktree could result in significant adverse consequences to Brookfield and Oaktree and/or Brookfield Accounts that we are invested in, amongst others.
Although information barriers were implemented to address the potential conflicts of interests and regulatory, legal and contractual requirements of our company, Brookfield and Oaktree may decide, at any time and without notice to our company or our unitholders, to remove or modify the information barrier between Brookfield and Oaktree. In addition, there may be breaches (including inadvertent breaches) of the information barriers and related internal controls by Brookfield and/or Oaktree.
To the extent that the information barrier is removed or is otherwise ineffective and Brookfield has the ability to access analysis, model and/or information developed by Oaktree and its personnel, Brookfield will not be under any obligation or other duty to access such information or effect transactions for our company and/or Brookfield Accounts that we are invested in in accordance with such analysis and models, and in fact may be restricted by securities laws from doing so. In such circumstances, Brookfield may make investment decisions for our company and/or Brookfield Accounts that we are invested in that differ from those it would have made if Brookfield had pursued such information, which may be disadvantageous to our company and/or Brookfield Accounts that we are invested in.
The breach or failure of our information barriers could result in our company obtaining material non-public information, which may restrict our company from acquiring or disposing investments and ultimately impact the returns generated for our business. In addition, any such breach or failure could also result in potential regulatory investigations and claims for securities laws violations in connection with our direct and/or indirect investment activities. Any inadvertent trading on material non-public information, or perception of trading on material non-public information, could have a significant adverse effect on Brookfield’s reputation, result in the imposition of regulatory or financial sanctions, and negatively impact Brookfield’s ability to provide investment management services to its clients, all of which could result in negative financial impact to the investment activities of our company and/or Brookfield Accounts that we are invested in. For more information, see Item 7.B., “Related Party Transactions - Conflicts of Interest and Fiduciary Duties - Oaktree”.
The BPY General Partner may be unable or unwilling to terminate our Master Services Agreement.
Our Master Services Agreement provides that the Service Recipients may terminate the agreement only if: (i) the Service Providers default in the performance or observance of any material term, condition or covenant contained in the agreement in a manner that results in material harm to the Service Recipients and the default continues unremedied for a period of 60 days after written notice of the breach is given to the Service Providers; (ii) the Service Providers engage in any act of fraud, misappropriation
- 29 -
of funds or embezzlement against any Service Recipient that results in material harm to the Service Recipients; (iii) the Service Providers are grossly negligent in the performance of their duties under the agreement and such negligence results in material harm to the Service Recipients; or (iv) upon the happening of certain events relating to the bankruptcy or insolvency of the Service Providers. In addition, because the BPY General Partner is an affiliate of Brookfield, it likely will be unwilling to terminate our Master Services Agreement, even in the case of a default. If the Service Providers’ performance does not meet the expectations of investors, and the BPY General Partner is unable or unwilling to terminate our Master Services Agreement, the market price of our units could suffer. Furthermore, the termination of our Master Services Agreement would terminate our company’s rights under the Relationship Agreement. See Item 7.B. “Major Shareholders and Related Party Transactions - Related Party Transactions - Relationship with Brookfield - Relationship Agreement”.
The liability of the Service Providers is limited under our arrangements with them and we have agreed to indemnify the Service Providers against claims that they may face in connection with such arrangements, which may lead them to assume greater risks when making decisions relating to us than they otherwise would if acting solely for their own account.
Under our Master Services Agreement, the Service Providers have not assumed any responsibility other than to provide or arrange for the provision of the services described in our Master Services Agreement in good faith and will not be responsible for any action that the BPY General Partner takes in following or declining to follow its advice or recommendations. In addition, under our limited partnership agreement, the liability of the BPY General Partner and its affiliates, including the Service Providers, is limited to the fullest extent permitted by law to conduct involving bad faith, fraud, gross negligence or willful misconduct or, in the case of a criminal matter, action that was known to have been unlawful. The liability of the Service Providers under our Master Services Agreement is similarly limited. In addition, we have agreed to indemnify the Service Providers to the fullest extent permitted by law from and against any claims, liabilities, losses, damages, costs or expenses incurred them or threatened in connection with our business, investments and activities or in respect of or arising from our Master Services Agreement or the services provided by the Service Providers, except to the extent that such claims, liabilities, losses, damages, costs or expenses are determined to have resulted from the conduct in respect of which such persons have liability as described above. These protections may result in the Service Providers tolerating greater risks when making decisions than otherwise would be the case, including when determining whether to use and the extent of leverage in connection with acquisitions. The indemnification arrangements to which the Service Providers are a party may also give rise to legal claims for indemnification that are adverse to us and our unitholders.
Risks Relating to Our Units
The price of our units may fluctuate significantly and you could lose all or part of the value of your units.
The market price of our units may fluctuate significantly and you could lose all or part of the value of your units. Factors that may cause the price of our units to vary include:
| • | changes in our financial performance and prospects, or in the financial performance and prospects of companies engaged in businesses that are similar to us; |
| • | public announcements about our business, including our development projects, pending investments and significant transactions, our significant tenants and properties or any negative publicity; |
| • | changes in laws or regulations, or new interpretations or applications of laws and regulations, that are applicable to us; |
| • | sales of our units by our unitholders, including by Brookfield and/or other significant holders of our units; |
| • | general economic trends and other external factors, including those resulting from actual or threatened acts of war, incidents of terrorism or responses to such events; |
| • | speculation in the press or investment community regarding us or factors or events that may directly or indirectly affect us; |
| • | our access to capital or other funding sources and our ability to raise capital on favorable terms; |
| • | a loss of any major funding source; and |
| • | volatility in the market price of the BPR Units, which may be impacted by: (i) public announcements made by BPR; (ii) changes in stock market analyst recommendations or earnings estimates regarding BPR; (iii) actual or anticipated |
- 30 -
fluctuations in BPR’s operating results or future prospects; and (iv) future issuances or sales of BPR Units by BPR and/or its significant stockholders.
Securities markets in general have experienced extreme volatility that has often been unrelated to the operating performance of particular companies or partnerships. Any broad market fluctuations may adversely affect the trading price of our units.
The exchange of BPR Units for newly issued LP Units could negatively affect the market price of our LP Units, and additional
issuances of BPR Units would be dilutive.
Each BPR Unit is redeemable by the holder thereof into the cash equivalent of one (1) LP Unit; however, we may elect, in our sole discretion, to satisfy such redemption request by acquiring such BPR Units in exchange for the issuance of a new LP Unit. If we elect to issue LP Units in satisfaction of any such redemption request, a significant amount of additional LP Units may be issued from time to time which could have a negative impact on the market price for LP Units. In addition, BPR may in the future sell additional BPR Units in connection with raising capital as well as for acquisitions. Such additional BPR Units issued in the future will also be exchangeable into LP Units as described above, and, accordingly, if so exchanged, would dilute the percentage interest of existing unitholders and may reduce the market price of our LP Units.
In addition, pursuant to a Rights Agreement, Brookfield Asset Management has agreed that in the event that neither BPR nor BPY satisfies its obligations to deliver cash and/or LP Units in connection with BPR Units tendered for redemption, then Brookfield Asset Management will satisfy, or cause to be satisfied, such obligations by delivering cash and/or LP Units to the tendering holders. The delivery by Brookfield Asset Management of LP Units it owns could negatively affect the market price of our LP Units.
Our company may issue additional units in the future in lieu of incurring indebtedness which may dilute existing holders of our units or our company may issue securities that have rights and privileges that are more favorable than the rights and privileges accorded to holders of our units.
Our company may issue additional securities, including units and options, rights, warrants and appreciation rights relating to partnership securities for any purpose and for such consideration and on such terms and conditions as the BPY General Partner may determine. The BPY General Partner’s board of directors will be able to determine the class, designations, preferences, rights, powers and duties of any additional partnership securities, including any rights to share in our company’s profits, losses and distributions, any rights to receive partnership assets upon a dissolution or liquidation of our company and any redemption, conversion and exchange rights. The BPY General Partner may use such authority to issue additional units or additional securities exchangeable for our LP Units which would dilute existing holders of our units, or to issue securities with rights and privileges that are more favorable than those of our units. You will not have any right to consent to or otherwise approve the issuance of any such securities or the terms on which any such securities may be issued.
Future sales or issuances of our units in the public markets, or the perception of such sales, could depress the market price of our units.
The sale or issuance of a substantial number of our units or other equity-related securities (including BPR Units) in the public markets, or the perception that such sales could occur, could depress the market price of our units and impair our ability to raise capital through the sale of additional equity securities. Although Brookfield intends to maintain a significant interest in our company, Brookfield expects its interests in the Property Partnership to be reduced over time through mergers, treasury issuances or secondary sales which could also depress the market price of our units. We cannot predict the effect that future sales or issuances of units, other equity-related securities (including BPR Units), or the limited partnership units of the Property Partnership would have on the market price of our units.
Our unitholders do not have a right to vote on partnership matters or to take part in the management of our company.
Under our limited partnership agreement, our unitholders are not entitled to vote on matters relating to our company, such as acquisitions, dispositions or financings, or to participate in the management or control of our company. In particular, our unitholders do not have the right to remove the BPY General Partner, to cause the BPY General Partner to withdraw from our company, to cause a new general partner to be admitted to our partnership, to appoint new directors to the BPY General Partner’s board of directors, to remove existing directors from the BPY General Partner’s board of directors or to prevent a change of control of the BPY General Partner. In addition, except as prescribed by applicable laws, our unitholders’ consent rights apply only with respect to certain amendments to our limited partnership agreement. As a result, unlike holders of common stock of a corporation, our unitholders are not able to influence the direction of our company, including its policies and procedures, or to cause a change
- 31 -
in its management, even if they are dissatisfied with our performance. Consequently, our unitholders may be deprived of an opportunity to receive a premium for their units in the future through a sale of our company and the trading price of our units may be adversely affected by the absence or a reduction of a takeover premium in the trading price.
Our company is a Bermuda exempted limited partnership and it may not be possible for our investors to serve process on or enforce U.S. or Canadian judgments against us.
Our company is a Bermuda exempted limited partnership and a substantial portion of our assets are located outside the United States and Canada. In addition, certain of the directors of the BPY General Partner and certain members of the senior management team of the Service Providers who are principally responsible for providing us with management services reside outside of the United States and Canada. As a result, it may be difficult or impossible for U.S. or Canadian investors to effect service of process within the United States or Canada upon us or our directors and management of the Service Providers, or to enforce, against us or these persons, judgments obtained in the U.S. or Canadian courts predicated upon the civil liability provisions of U.S. federal securities laws or Canadian securities laws. We believe that there is doubt as to the enforceability in Bermuda, in original actions or in actions to enforce judgments of U.S. or Canadian courts, of claims predicated solely upon U.S. federal securities laws or Canadian securities laws. See Item 10.B. “Additional Information - Memorandum and Articles of Association - Description of Our LP Units, Preferred Units and Our Limited Partnership Agreement - Our Units”.
Risks Relating to Taxation
General
We participate in transactions and make tax calculations for which the ultimate tax determination may be uncertain.
We participate in many transactions and make tax calculations during the course of our business for which the ultimate tax determination is uncertain. While we believe we maintain provisions for uncertain tax positions that appropriately reflect our risk, these provisions are made using estimates of the amounts expected to be paid based on a qualitative assessment of several factors. It is possible that liabilities associated with one or more transactions may exceed our provisions due to audits by, or litigation with, relevant taxing authorities which may materially affect our financial condition and results of operations.
Changes in tax law and practice may have a material adverse effect on the operations of our company, the Holding Entities, and our operating entities and, as a consequence, the value of our assets and the net amount of distributions payable to our unitholders.
Our structure, including the structure of the Holding Entities and our operating entities, is based on prevailing taxation law and practice in the local jurisdictions in which we operate. Any change in tax legislation (including in relation to taxation rates) and practice in these jurisdictions could adversely affect these entities, as well as the net amount of distributions payable to our unitholders. Taxes and other constraints that would apply to our operating entities in such jurisdictions may not apply to local institutions or other parties, and such parties may therefore have a significantly lower effective cost of capital and a corresponding competitive advantage in pursuing such acquisitions.
Our company’s ability to make distributions depends on it receiving sufficient cash distributions from its underlying operations, and we cannot assure our unitholders that we will be able to make cash distributions to them in amounts that are sufficient to fund their tax liabilities.
Our Holding Entities and operating entities may be subject to local taxes in each of the relevant territories and jurisdictions in which they operate, including taxes on income, profits or gains and withholding taxes. As a result, our company’s cash available for distribution is indirectly reduced by such taxes, and the post-tax return to our unitholders is similarly reduced by such taxes. We intend for future acquisitions to be assessed on a case-by-case basis and, where possible and commercially viable, structured so as to minimize any adverse tax consequences to our unitholders as a result of making such acquisitions.
In general, a unitholder that is subject to income tax in Canada or the United States must include in income its allocable share of our company’s items of income, gain, loss, and deduction (including, so long as it is treated as a partnership for tax purposes, our company’s allocable share of those items of the Property Partnership) for each of our company’s fiscal years ending with or within such unitholder’s tax year. See Item 10.E. “Additional Information - Taxation - U.S. Tax Considerations - Partnership Status of Our Company and the Property Partnership”. However, the cash distributed to a unitholder may not be sufficient to pay the full amount of such unitholder’s tax liability in respect of its investment in our company, because each unitholder’s tax liability depends on such unitholder’s particular tax situation and the tax treatment of the underlying activities or assets of our company.
- 32 -
If our company is unable to distribute cash in amounts that are sufficient to fund our unitholders’ tax liabilities, each of our unitholders will still be required to pay income taxes on its share of our company’s taxable income.
Our unitholders may be subject to non-U.S., state and local taxes and return filing requirements as a result of owning our units.
Based on our method of operation and the ownership of our operating entities indirectly through corporate Holding Entities, we do not expect any unitholder, solely as a result of owning our units, to be subject to any additional income taxes imposed on a net basis or additional tax return filing requirements in any jurisdiction in which we conduct activities or own property. However, our method of operation and current structure may change, and there can be no assurance that our unitholders, solely as a result of owning our units, will not be subject to certain taxes, including non-U.S., state and local income taxes, unincorporated business taxes and estate, inheritance or intangible taxes imposed by the various jurisdictions in which we do business or own property now or in the future, even if our unitholders do not reside in any of these jurisdictions. Consequently, our unitholders may also be required to file non-U.S., state and local income tax returns in some or all of these jurisdictions. Further, our unitholders may be subject to penalties for failure to comply with these requirements. It is the responsibility of each unitholder to file all U.S. federal, non-U.S., state and local tax returns that may be required of such unitholder.
Our unitholders may be exposed to transfer pricing risks.
To the extent that our company, the Property Partnership, the Holding Entities or our operating entities enter into transactions or arrangements with parties with whom they do not deal at arm’s length, including Brookfield, the relevant tax authorities may seek to adjust the quantum or nature of the amounts received or paid by such entities if they consider that the terms and conditions of such transactions or arrangements differ from those that would have been made between persons dealing at arm’s length. This could result in more tax (and penalties and interest) being paid by such entities, and therefore the return to investors could be reduced. For Canadian tax purposes, a transfer pricing adjustment may in certain circumstances result in additional income being allocated to a unitholder with no corresponding cash distribution or in a dividend being deemed to be paid by a Canadian-resident to a non-arm’s length non-resident, which deemed dividend is subject to Canadian withholding tax.
The BPY General Partner believes that the base management fee and any other amount that is paid to the Service Providers is commensurate with the value of the services being provided by the Service Providers and comparable to the fees or other amounts that would be agreed to in an arm’s length arrangement. However, no assurance can be given in this regard.
If the relevant tax authority were to assert that an adjustment should be made under the transfer pricing rules to an amount that is relevant to the computation of the income of the Property Partnership or our company, such assertion could result in adjustments to amounts of income (or loss) allocated to our unitholders by our company for tax purposes. In addition, we might also be liable for transfer pricing penalties in respect of transfer pricing adjustments unless reasonable efforts were made to determine, and use, arm’s length transfer prices. Generally, reasonable efforts in this regard are only considered to be made if contemporaneous documentation has been prepared in respect of such transactions or arrangements that support the transfer pricing methodology.
The U.S. Internal Revenue Service (the “IRS”) or Canada Revenue Agency (the “CRA”) may not agree with certain assumptions and conventions that we use to comply with applicable U.S. and Canadian federal income tax laws or to report income, gain, loss, deduction, and credit to our unitholders.
We apply certain assumptions and conventions to comply with applicable tax laws and to report income, gain, deduction, loss, and credit to a unitholder in a manner that reflects such unitholder’s beneficial ownership of partnership items, taking into account variation in ownership interests during each taxable year because of trading activity. However, these assumptions and conventions may not be in compliance with all aspects of the applicable tax requirements. A successful IRS or CRA challenge to such assumptions or conventions could adversely affect the amount of tax benefits available to our unitholders and could require that items of income, gain, deduction, loss, or credit, including interest deductions, be adjusted, reallocated or disallowed in a manner that adversely affects our unitholders. See Item 10.E. “Additional Information - Taxation”.
United States
If our company or the Property Partnership were to be treated as a corporation for U.S. federal income tax purposes, the value of our units might be adversely affected.
The value of our units to our unitholders depends in part on the treatment of our company and the Property Partnership as partnerships for U.S. federal income tax purposes. However, in order for our company to be treated as a partnership for U.S.
- 33 -
federal income tax purposes, under present law, 90% or more of our company’s gross income for every taxable year must consist of qualifying income, as defined in Section 7704 of the U.S. Internal Revenue Code of 1986, as amended (the “U.S. Internal Revenue Code”) and our company must not be required to register, if it were a U.S. corporation, as an investment company under the Investment Company Act and related rules. Although the BPY General Partner intends to manage our affairs so that our company will not need to be registered as an investment company if it were a U.S. corporation and so that it will meet the 90% test described above in each taxable year, our company may not meet these requirements, or current law may change so as to cause, in either event, our company to be treated as a corporation for U.S. federal income tax purposes. If our company (or the Property Partnership) were treated as a corporation for U.S. federal income tax purposes, adverse U.S. federal income tax consequences could result for our unitholders and our company (or the Property Partnership, as applicable), as described in greater detail in Item 10.E. “Additional Information - Taxation - U.S. Tax Considerations - Partnership Status of Our Company and the Property Partnership”.
The failure of certain of our operating entities (or certain of their subsidiaries) to qualify as REITs under U.S. federal income tax rules generally would have adverse tax consequences which could result in a material reduction in cash flow and after-tax return for our unitholders and thus could result in a reduction of the value of our units.
Certain of our operating entities (and certain of their subsidiaries), including operating entities in which we do not have a controlling interest, intend to qualify for taxation as REITs for U.S. federal income tax purposes. However, no assurance can be provided that any such entity will qualify as a REIT. An entity’s ability to qualify as a REIT depends on its satisfaction of certain asset, income, organizational, distribution, shareholder ownership, and other requirements on a continuing basis. No assurance can be provided that the actual results of operations for any particular entity in a given taxable year will satisfy such requirements. If any such entity were to fail to qualify as a REIT in any taxable year, it would be subject to U.S. federal income tax on its net taxable income at regular corporate rates, and distributions would not be deductible by it in computing its taxable income. Any such corporate tax liability could be substantial and could materially reduce the amount of cash available for distribution to our company, which in turn would materially reduce the amount of cash available for distribution to our unitholders or investment in our business and could have an adverse impact on the value of our units. Unless entitled to relief under certain U.S. federal income tax rules, any entity which so failed to qualify as a REIT would also be disqualified from taxation as a REIT for the four taxable years following the year during which it ceased to qualify as a REIT.
We may be subject to U.S. “backup” withholding tax or other U.S. withholding taxes if any unitholder fails to comply with U.S. tax reporting rules or if the IRS or other applicable state or local taxing authority does not accept our withholding methodology, and such excess withholding tax cost will be an expense borne by our company and, therefore, by all of our unitholders on a pro rata basis.
We may become subject to U.S. backup withholding tax or other U.S. withholding taxes with respect to any unitholder who fails to timely provide our company (or the applicable clearing agent or other intermediary) with an IRS Form W-9 or IRS Form W-8, as the case may be, or if the withholding methodology we use is not accepted by the IRS or other applicable state or local taxing authority. See Item 10.E. “Additional Information - Taxation - U.S. Tax Considerations - Administrative Matters - Withholding and Backup Withholding”. To the extent that any unitholder fails to timely provide the applicable form (or such form is not properly completed), or should the IRS or other applicable state or local taxing authority not accept our withholding methodology, our company might treat such U.S. backup withholding taxes or other U.S. withholding taxes as an expense, which would be borne indirectly by all of our unitholders on a pro rata basis. As a result, our unitholders that fully comply with their U.S. tax reporting obligations may bear a share of such burden created by other unitholders that do not comply with the U.S. tax reporting rules.
Tax-exempt organizations may face certain adverse U.S. tax consequences from owning our units.
The BPY General Partner intends to use commercially reasonable efforts to structure our activities to avoid generating income connected with the conduct of a trade or business (which income generally would constitute “unrelated business taxable income” (“UBTI”) to the extent allocated to a tax-exempt organization). However, no assurance can be provided that we will not generate UBTI in the future. In particular, UBTI includes income attributable to debt-financed property, and we are not prohibited from financing the acquisition of property with debt. In addition, a tax-exempt organization might be allocated UBTI if our company’s indirect investment in a REIT were to give rise to “excess inclusion income”. The potential for income to be characterized as UBTI could make our units an unsuitable investment for a tax-exempt organization, as addressed in greater detail in Item 10.E. “Additional Information - Taxation - U.S. Tax Considerations - Consequences to U.S. Holders - U.S. Taxation of Tax-Exempt U.S. Holders of Our Units”.
- 34 -
If our company were engaged in a U.S. trade or business, non-U.S. persons would face certain adverse U.S. tax consequences from owning our units.
Based on our organizational structure, as well as our expected income and assets, the BPY General Partner currently believes that our company is unlikely to earn income treated as effectively connected with a U.S. trade or business, including effectively connected income attributable to the sale of a “United States real property interest”, as defined in the U.S. Internal Revenue Code. If our company were deemed to be engaged in a U.S. trade or business, or to realize gain from the sale or other disposition of a U.S. real property interest, Non-U.S. Holders (as defined in Item 10.E. “Additional Information - Taxation - U.S. Tax Considerations”) generally would be required to file U.S. federal income tax returns and could be subject to U.S. federal withholding tax at the highest marginal U.S. federal income tax rates applicable to ordinary income. If, contrary to expectation, our company were engaged in a U.S. trade or business, then gain or loss from the sale of our units by a Non-U.S. Holder would be treated as effectively connected with such trade or business to the extent that such Non-U.S. Holder would have had effectively connected gain or loss had our company sold all of its assets at their fair market value as of the date of such sale. In such case, any such effectively connected gain generally would be taxable at the regular graduated U.S. federal income tax rates, and the amount realized from such sale generally would be subject to a 10% U.S. federal withholding tax. See Item 10.E. “Additional Information - Taxation - U.S. Tax Considerations - Consequences to Non-U.S. Holders”.
To meet U.S. federal income tax and other objectives, our company and the Property Partnership may invest through U.S. and non-U.S. Holding Entities that are treated as corporations for U.S. federal income tax purposes, and such Holding Entities may be subject to corporate income tax.
To meet U.S. federal income tax and other objectives, our company and the Property Partnership may invest through U.S. and non-U.S. Holding Entities that are treated as corporations for U.S. federal income tax purposes, and such Holding Entities may be subject to corporate income tax. Consequently, items of income, gain, loss, deduction, or credit realized in the first instance by our operating entities will not flow, for U.S. federal income tax purposes, directly to the Property Partnership, our company, or our unitholders, and any such income or gain may be subject to a corporate income tax, in the United States or other jurisdictions, at the level of the Holding Entity. Any such additional taxes may adversely affect our company’s ability to maximize its cash flow.
Our unitholders taxable in the United States may be viewed as holding an indirect interest in an entity classified as a “passive foreign investment company” or “controlled foreign corporation” for U.S. federal income tax purposes.
U.S. Holders may face adverse U.S. tax consequences arising from the ownership of an indirect interest in a “passive foreign investment company” (“PFIC”)_or in a “controlled foreign corporation” (“CFC”). These investments may produce taxable income prior to the receipt of cash relating to such income, and U.S. Holders will be required to take such income into account in determining their gross income subject to tax. In addition, all or a portion of any gain realized upon the sale of a CFC may be taxable at ordinary income rates. Further, with respect to gain realized upon the sale of and excess distributions from a PFIC for which an election for current inclusions is not made, such income would be taxable at ordinary income rates and subject to an additional tax equivalent to an interest charge on the deferral of income inclusions from the PFIC. See Item 10.E. “Additional Information - Taxation - U.S. Tax Considerations - Consequences to U.S. Holders - Passive Foreign Investment Companies” and “Taxation - U.S. Tax Considerations - Consequences to U.S. Holders - Controlled Foreign Corporations”. Each U.S. Holder should consult its own tax adviser regarding the implications of the PFIC and CFC rules for an investment in our units.
Tax gain or loss from the disposition of our units could be more or less than expected.
Upon the sale of our units, a U.S. Holder will generally recognize gain or loss for U.S. federal income tax purposes equal to the difference between the amount realized and such holder’s adjusted tax basis in such units. Prior distributions to a U.S. Holder in excess of the total net taxable income allocated to such holder will have decreased such unitholder’s tax basis in our units. Therefore, such excess distributions will increase a U.S. Holder’s taxable gain or decrease such holder’s taxable loss when our units are sold, and may result in a taxable gain even if the sale price is less than the original cost. A portion of the amount realized, whether or not representing gain, could be ordinary income to such U.S. Holder.
Our partnership structure involves complex provisions of U.S. federal income tax law for which no clear precedent or authority may be available. The tax characterization of our partnership structure is also subject to potential legislative, judicial, or administrative change and differing interpretations, possibly on a retroactive basis.
The U.S. federal income tax treatment of our unitholders depends in some instances on determinations of fact and interpretations of complex provisions of U.S. federal income tax law for which no clear precedent or authority may be available. Our unitholders should be aware that the U.S. federal income tax rules, particularly those applicable to partnerships, are constantly under review by the Congressional tax-writing committees and other persons involved in the legislative process, the IRS, the U.S.
- 35 -
Treasury Department and the courts, frequently resulting in changes which could adversely affect the value of our units or cause our company to change the way it conducts its activities. For example, changes to the U.S. federal tax laws and interpretations thereof could make it more difficult or impossible for our company to be treated as a partnership that is not taxable as a corporation for U.S. federal income tax purposes, change the character or treatment of portions of our company’s income, reduce the net amount of distributions available to our unitholders, or otherwise affect the tax considerations of owning our units. In addition, our company’s organizational documents and agreements permit the BPY General Partner to modify our limited partnership agreement, without the consent of our unitholders, to address such changes. These modifications could have a material adverse impact on our unitholders. See Item 10.E. “Additional Information - Taxation - U.S. Tax Considerations - Administrative Matters - New Legislation or Administrative or Judicial Action”.
Our company’s delivery of required tax information for a taxable year may be subject to delay, which could require a unitholder who is a U.S. taxpayer to request an extension of the due date for such unitholder’s income tax return.
Our company has agreed to use commercially reasonable efforts to provide U.S. tax information (including IRS Schedule K-1 information needed to determine a unitholder’s allocable share of our company’s income, gain, losses, and deductions) no later than 90 days after the close of each calendar year. However, providing this U.S. tax information to our unitholders will be subject to delay in the event of, among other reasons, the late receipt of any necessary tax information from lower-tier entities. It is therefore possible that, in any taxable year, a unitholder will need to apply for an extension of time to file such unitholder’s tax returns. See Item 10.E. “Additional Information - Taxation - U.S. Tax Considerations - Administrative Matters - Information Returns and Audit Procedures”.
If the IRS makes an audit adjustment to our income tax returns, it may assess and collect any taxes (including penalties and interest) resulting from such audit adjustment directly from us, in which case cash available for distribution to our unitholders might be substantially reduced.
For taxable years beginning after December 31, 2017, if the IRS makes an audit adjustment to our income tax returns, it may assess and collect any taxes (including penalties and interest) resulting from such audit adjustment directly from our company instead of unitholders (as under prior law). We may be permitted to elect to have the BPY General Partner and our unitholders take such audit adjustment into account in accordance with their interests in us during the taxable year under audit. However, there can be no assurance that we will choose to make such election or that it will be available in all circumstances. If we do not make the election, and we pay taxes, penalties, or interest as a result of an audit adjustment, then cash available for distribution to our unitholders might be substantially reduced. As a result, our current unitholders might bear some or all of the cost of the tax liability resulting from such audit adjustment, even if our current unitholders did not own our units during the taxable year under audit. The foregoing considerations also apply with respect to our company’s interest in the Property Partnership.
Under the Foreign Account Tax Compliance provisions of the Hiring Incentives to Restore Employment Act of 2010 (“FATCA”) certain payments made or received by our company may be subject to a 30% federal withholding tax, unless certain requirements are met.
Under FATCA, a 30% withholding tax may apply to certain payments of U.S.-source income made to our company, the Property Partnership, the Holding Entities, or the operating entities, or by our company to a unitholder, unless certain requirements are met, as described in greater detail in Item 10.E “Additional Information - Taxation - U.S. Tax Considerations - Administrative Matters - Foreign Account Tax Compliance”. To ensure compliance with FATCA, information regarding certain unitholders’ ownership of our units may be reported to the IRS or to a non-U.S. governmental authority. Our unitholders should consult their own tax advisers regarding the consequences under FATCA of an investment in our units.
Canada
If the subsidiaries that are corporations, or non-resident subsidiaries, and that are not resident or deemed to be resident in Canada for purposes of the Income Tax Act (Canada), or, together with the regulations thereunder, the Tax Act, and that are “controlled foreign affiliates” (“CFAs”) as defined in the Tax Act, in which the Property Partnership directly holds an equity interest earn income that is “foreign accrual property income” (“FAPI”) as defined in the Tax Act, our unitholders may be required to include amounts allocated from our company in computing their income for Canadian federal income tax purposes even though there may be no corresponding cash distribution.
Any of the non-resident subsidiaries in which the Property Partnership directly holds an equity interest are expected to be CFAs of the Property Partnership. If any CFA of the Property Partnership or any direct or indirect subsidiary thereof that is itself a CFA of the Property Partnership (an “Indirect CFA”) earns income that is characterized as FAPI in a particular taxation year of the CFA or Indirect CFA, the FAPI allocable to the Property Partnership must be included in computing the income of the
- 36 -
Property Partnership for Canadian federal income tax purposes for the fiscal period of the Property Partnership in which the taxation year of that CFA or Indirect CFA ends, whether or not the Property Partnership actually receives a distribution of that FAPI. Our company will include its share of such FAPI of the Property Partnership in computing its income for Canadian federal income tax purposes and our unitholders will be required to include their proportionate share of such FAPI allocated from our company in computing their income for Canadian federal income tax purposes. As a result, our unitholders may be required to include amounts in their income for Canadian federal income tax purposes even though they have not and may not receive an actual cash distribution of such amounts. The Tax Act contains anti-avoidance rules to address certain foreign tax credit generator transactions, or the Foreign Tax Credit Generator Rules. Under the Foreign Tax Credit Generator Rules, the “foreign accrual tax”, as defined in the Tax Act, applicable to a particular amount of FAPI included in the Property Partnership’s income in respect of a particular “foreign affiliate”, as defined in the Tax Act, of the Property Partnership may be limited in certain specified circumstances. See Item 10.E. “Additional Information - Taxation - Certain Material Canadian Federal Income Tax Considerations”.
Our unitholders may be required to include imputed amounts in their income for Canadian federal income tax purposes in accordance with section 94.1 of the Tax Act.
Section 94.1 of the Tax Act contains rules relating to interests in entities that are not resident or deemed to be resident in Canada for purposes of the Tax Act or not situated in Canada (and certain exempt foreign trusts as defined in subsection 94(1) of the Tax Act), other than a CFA of the taxpayer, or Non-Resident Entities, that could in certain circumstances cause income to be imputed to our unitholders for Canadian federal income tax purposes, either directly or by way of allocation of such income imputed to our company or to the Property Partnership. See Item 10.E. “Additional Information - Taxation - Certain Material Canadian Federal Income Tax Considerations”.
Our unitholders’ foreign tax credits for Canadian federal income tax purposes will be limited if the Foreign Tax Credit Generator Rules apply in respect of the foreign “business income tax” or “non-business income tax”, each as defined in the Tax Act, paid by our company or the Property Partnership to a foreign country.
Under the Foreign Tax Credit Generator Rules, the foreign “business-income tax” or “non-business-income tax” for Canadian federal income tax purposes for any taxation year may be limited in certain circumstances. If the Foreign Tax Credit Generator Rules apply, the allocation to a unitholder of foreign “business income tax” or “non-business income tax” paid by our company or the Property Partnership, and therefore, such unitholder’s foreign tax credits for Canadian federal income tax purposes, will be limited. See Item 10.E. “Additional Information - Taxation - Certain Material Canadian Federal Income Tax Considerations”.
Our unitholders who are not and are not deemed to be resident in Canada for purposes of the Tax Act and who do not use or hold, and are not deemed to use or hold, their units of our company in connection with a business carried on in Canada, or non-resident limited partners, may be subject to Canadian federal income tax with respect to any Canadian source business income earned by our company or the Property Partnership if our company or the Property Partnership were considered to carry on business in Canada.
If our company or the Property Partnership were considered to carry on business in Canada for purposes of the Tax Act, non-resident limited partners would be subject to Canadian federal income tax on their proportionate share of any Canadian source business income earned or considered to be earned by our company, subject to the potential application of the safe harbour rule in section 115.2 of the Tax Act and any relief that may be provided by any relevant income tax treaty or convention.
The BPY General Partner intends to manage the affairs of our company and the Property Partnership, to the extent possible, so that they do not carry on business in Canada and are not considered or deemed to carry on business in Canada for purposes of the Tax Act. Nevertheless, because the determination of whether our company or the Property Partnership is carrying on business and, if so, whether that business is carried on in Canada, is a question of fact that is dependent upon the surrounding circumstances, the CRA, might contend successfully that either or both of our company and the Property Partnership carries on business in Canada for purposes of the Tax Act.
If our company or the Property Partnership is considered to carry on business in Canada or is deemed to carry on business in Canada for the purposes of the Tax Act, non-resident limited partners that are corporations would be required to file a Canadian federal income tax return for each taxation year in which they are a non-resident limited partner regardless of whether relief from Canadian taxation is available under an applicable income tax treaty or convention. Non-resident limited partners who are individuals would only be required to file a Canadian federal income tax return for any taxation year in which they are allocated income from our company from carrying on business in Canada that is not exempt from Canadian taxation under the terms of an applicable income tax treaty or convention.
- 37 -
Non-resident limited partners may be subject to Canadian federal income tax on capital gains realized by our company or the Property Partnership on dispositions of “taxable Canadian property” as defined in the Tax Act.
A non-resident limited partner will be subject to Canadian federal income tax on its proportionate share of capital gains realized by our company or the Property Partnership on the disposition of “taxable Canadian property” other than “treaty protected property”, as defined in the Tax Act. “Taxable Canadian property” includes, but is not limited to, property that is used or held in a business carried on in Canada and shares of corporations that are not listed on a “designated stock exchange”, as defined in the Tax Act, if more than 50% of the fair market value of the shares is derived from certain Canadian properties during the 60-month period immediately preceding the particular time. Property of our company and the Property Partnership generally will be “treaty-protected property” to a non-resident limited partner if the gain from the disposition of the property would, because of an applicable income tax treaty or convention, be exempt from tax under the Tax Act. Our company and the Property Partnership are not expected to realize capital gains or losses from dispositions of “taxable Canadian property”. However, no assurance can be given in this regard. Non-resident limited partners will be required to file a Canadian federal income tax return in respect of a disposition of “taxable Canadian property” by our company or the Property Partnership unless the disposition is an “excluded disposition” for the purposes of section 150 of the Tax Act. However, non-resident limited partners that are corporations will still be required to file a Canadian federal income tax return in respect of a disposition of “taxable Canadian property” that is an “excluded disposition” for the purposes of section 150 of the Tax Act if tax would otherwise be payable under Part I of the Tax Act by such non-resident limited partners in respect of the disposition but is not because of an applicable income tax treaty or convention (otherwise than in respect of a disposition of “taxable Canadian property” that is “treaty-protected property” of the corporation). In general, an “excluded disposition” is a disposition of property by a taxpayer in a taxation year where: (a) the taxpayer is a non-resident of Canada at the time of the disposition; (b) no tax is payable by the taxpayer under Part I of the Tax Act for the taxation year; (c) the taxpayer is not liable to pay any amounts under the Tax Act in respect of any previous taxation year (other than certain amounts for which the CRA holds adequate security); and (d) each “taxable Canadian property” disposed of by the taxpayer in the taxation year is either: (i) “excluded property” (as defined in subsection 116(6) of the Tax Act); or (ii) property in respect of the disposition of which a certificate under subsection 116(2), (4) or (5.2) of the Tax Act has been issued by the CRA. Non-resident limited partners should consult their own tax advisors with respect to the requirements to file a Canadian federal income tax return in respect of a disposition of “taxable Canadian property” by our company or the Property Partnership.
Non-resident limited partners may be subject to Canadian federal income tax on capital gains realized on the disposition of our units if our units are “taxable Canadian property”.
Any capital gain arising from the disposition or deemed disposition of our units by a non-resident limited partner will be subject to taxation in Canada, if, at the time of the disposition or deemed disposition, our units are “taxable Canadian property” of the non-resident limited partner, unless our units are “treaty-protected property” to such non-resident limited partner. In general, our units will not constitute “taxable Canadian property” of any non-resident limited partner at the time of disposition or deemed disposition, unless (a) at any time in the 60-month period immediately preceding the disposition or deemed disposition, more than 50% of the fair market value of our units was derived, directly or indirectly (excluding through a corporation, partnership or trust, the shares or interests in which were not themselves “taxable Canadian property”), from one or any combination of: (i) real or immovable property situated in Canada; (ii) “Canadian resource properties”, as defined in the Tax Act; (iii) “timber resource properties”, as defined in the Tax Act; and (iv) options in respect, of or interests in, or for civil law rights in, such property, whether or not such property exists, or (b) our units are otherwise deemed to be “taxable Canadian property”. Since our company’s assets will consist principally of units of the Property Partnership, our units would generally be “taxable Canadian property” at a particular time if the units of the Property Partnership held by our company derived, directly or indirectly (excluding through a corporation, partnership or trust, the shares or interests in which were not themselves “taxable Canadian property”) more than 50% of their fair market value from properties described in (i) to (iv) above, at any time in the 60-month period preceding the particular time. The BPY General Partner does not expect our units to be “taxable Canadian property” of any non-resident limited partner at any time but no assurance can be given in this regard. See Item 10.E. “Taxation - Certain Material Canadian Federal Income Tax Considerations”. Even if our units constitute “taxable Canadian property”, units of our company will be “treaty protected property” if the gain on the disposition of our units is exempt from tax under the Tax Act under the terms of an applicable income tax treaty or convention. If our units constitute “taxable Canadian property”, non-resident limited partners will be required to file a Canadian federal income tax return in respect of a disposition of our units unless the disposition is an “excluded disposition” (as discussed above). If our units constitute “taxable Canadian property”, non-resident limited partners should consult their own tax advisors with respect to the requirement to file a Canadian federal income tax return in respect of a disposition of our units.
Non-resident limited partners may be subject to Canadian federal income tax reporting and withholding tax requirements on the disposition of “taxable Canadian property”.
Non-resident limited partners who dispose of “taxable Canadian property”, other than “excluded property” and certain other property described in subsection 116(5.2) of the Tax Act (or who are considered to have disposed of such property on the
- 38 -
disposition of such property by our company or the Property Partnership) are obligated to comply with the procedures set out in section 116 of the Tax Act and obtain a certificate pursuant to the Tax Act. In order to obtain such certificate, the non-resident limited partner is required to report certain particulars relating to the transaction to CRA not later than 10 days after the disposition occurs. Our units are not expected to be “taxable Canadian property” and neither our company nor the Property Partnership is expected to dispose of property that is “taxable Canadian property” but no assurance can be given in this regard.
Payments of dividends or interest (other than interest not subject to Canadian federal withholding tax) by residents of Canada to the Property Partnership will be subject to Canadian federal withholding tax and we may be unable to apply a reduced rate taking into account the residency or entitlement to relief under an applicable income tax treaty or convention of our unitholders.
Our company and the Property Partnership will each be deemed to be a non-resident person in respect of certain amounts paid or credited or deemed to be paid or credited to them by a person resident or deemed to be resident in Canada, including dividends or interest. Dividends or interest (other than interest not subject to Canadian federal withholding tax) paid or deemed to be paid by a person resident or deemed to be resident in Canada to the Property Partnership will be subject to withholding tax under Part XIII of the Tax Act at the rate of 25%. However, the CRA’s administrative practice in similar circumstances is to permit the rate of Canadian federal withholding tax applicable to such payments to be computed by looking through the partnership and taking into account the residency of the partners (including partners who are resident in Canada) and any reduced rates of Canadian federal withholding tax that any non-resident partners may be entitled to under an applicable income tax treaty or convention, provided that the residency status and entitlement to treaty benefits can be established. In determining the rate of Canadian federal withholding tax applicable to amounts paid by the Holding Entities to the Property Partnership, we expect the Holding Entities to look-through the Property Partnership and our company to the residency of the partners of our company (including partners who are resident in Canada) and to take into account any reduced rates of Canadian federal withholding tax that non-resident limited partners may be entitled to under an applicable income tax treaty or convention in order to determine the appropriate amount of Canadian federal withholding tax to withhold from dividends or interest paid to the Property Partnership. However, there can be no assurance that the CRA will apply its administrative practice in this context. If the CRA’s administrative practice is not applied and the Holding Entities withhold Canadian federal withholding tax from applicable payments on a look-through basis, the Holding Entities may be liable for additional amounts of Canadian federal withholding tax plus any associated interest and penalties. Under the Canada-United States Tax Convention (1980) (the “Treaty”) a Canadian resident payer is required in certain circumstances to look-through fiscally transparent partnerships, such as our company and the Property Partnership, to the residency and Treaty entitlements of their partners and take into account the reduced rates of Canadian federal withholding tax that such partners may be entitled to under the Treaty.
While the BPY General Partner expects the Holding Entities to look-through our company and the Property Partnership in determining the rate of Canadian federal withholding tax applicable to amounts paid or deemed to be paid by the Holding Entities to the Property Partnership, we may be unable to accurately or timely determine the residency of our unitholders for purposes of establishing the extent to which Canadian federal withholding taxes apply or whether reduced rates of withholding tax apply to some or all of our unitholders. In such a case, the Holding Entities will withhold Canadian federal withholding tax from all payments made to the Property Partnership that are subject to Canadian federal withholding tax at the rate of 25%. Canadian resident unitholders will be entitled to claim a credit for such taxes against their Canadian federal income tax liability, but non-resident limited partners will need to take certain steps to receive a refund or credit in respect of any such Canadian federal withholding taxes withheld equal to the difference between the withholding tax at a rate of 25% and the withholding tax at the reduced rate they are entitled to under an applicable income tax treaty or convention. See Item 10.E. “Additional Information - Taxation - Certain Material Canadian Federal Income Tax Considerations” for further detail. Our unitholders should consult their own tax advisors concerning all aspects of Canadian federal withholding taxes.
Our units may or may not continue to be “qualified investments” under the Tax Act for registered plans.
Provided that our units are listed on a “designated stock exchange” (which currently includes the Nasdaq and the Toronto Stock Exchange (the “TSX”), our units will be “qualified investments” under the Tax Act for a trust governed by a registered retirement savings plan (“RRSP”), deferred profit sharing plan, registered retirement income fund (“RRIF”), registered education savings plan (“RESP”), registered disability savings plan (“RDSP”) and a tax-free savings account (“TFSA”). However, there can be no assurance that our units will continue to be listed on a “designated stock exchange”. There can also be no assurance that tax laws relating to “qualified investments” will not be changed. Taxes may be imposed in respect of the acquisition or holding of non-qualified investments by such registered plans and certain other taxpayers and with respect to the acquisition or holding of “prohibited investments”, as defined in the Tax Act, by a RRSP, RRIF, TFSA, RDSP or RESP.
Generally, our units will not be a “prohibited investment” for a trust governed by an RRSP, RRIF, TFSA, RDSP or RESP provided that the annuitant under the RRSP or RRIF, the holder of the TFSA or RDSP or the subscriber of the RESP, as the case may be, deals at arm’s length with our company for purposes of the Tax Act and does not have a “significant interest” as defined
- 39 -
in the Tax Act for purposes of the prohibited investment rules, in our company. Our unitholders who will hold our units in an RRSP, RRIF, TFSA, RDSP or RESP should consult with their own tax advisors regarding the application of the foregoing prohibited investment rules having regard to their particular circumstances.
The Canadian federal income tax consequences to our unitholders could be materially different in certain respects from those described in this Form 20-F if our company or the Property Partnership is a “SIFT partnership”, as defined in the Tax Act.
Under the rules in the Tax Act applicable to a “SIFT partnership” (the “SIFT Rules”) certain income and gains earned by a “SIFT partnership” will be subject to income tax at the partnership level at a rate similar to a corporation, and allocations of such income and gains to its partners will be taxed as a dividend from a “taxable Canadian corporation”, as defined in the Tax Act. In particular, a “SIFT partnership” will generally be required to pay a tax on the total of its income from businesses carried on in Canada, income from “non-portfolio properties”, as defined in the Tax Act, other than taxable dividends, and taxable capital gains from dispositions of “non-portfolio properties”. “Non-portfolio properties” include, among other things, equity interests or debt of corporations, trusts or partnerships that are resident in Canada, and of non-resident persons or partnerships the principal source of income of which is one or any combination of sources in Canada (other than a “portfolio investment entity” as defined in the Tax Act), that are held by the “SIFT partnership” and have a fair market value that is greater than 10% of the equity value of such entity, or that have, together with debt or equity that the “SIFT partnership” holds of entities affiliated (within the meaning of the Tax Act) with such entity, an aggregate fair market value that is greater than 50% of the equity value of the “SIFT partnership”. The tax rate that is applied to the above mentioned sources of income and gains is set at a rate equal to the “net corporate income tax rate”, plus the “provincial SIFT tax rate”, each as defined in the Tax Act.
A partnership will be a “SIFT partnership” throughout a taxation year if at any time in the taxation year (i) it is a “Canadian resident partnership” as defined in the Tax Act, (ii) “investments”, as defined in the Tax Act, in the partnership are listed or traded on a stock exchange or other public market and (iii) it holds one or more “non-portfolio properties”. For these purposes, a partnership will be a “Canadian resident partnership” at a particular time if (a) it is a “Canadian partnership” as defined in the Tax Act at that time, (b) it would, if it were a corporation, be resident in Canada (including, for greater certainty, a partnership that has its central management and control located in Canada) or (c) it was formed under the laws of a province. A “Canadian partnership” for these purposes is a partnership all of whose members are resident in Canada or are partnerships that are “Canadian partnerships”.
Under the SIFT Rules, our company and the Property Partnership could each be a “SIFT partnership” if it is a “Canadian resident partnership”. However, the Property Partnership would not be a “SIFT partnership” if our company is a “SIFT partnership” regardless of whether the Property Partnership is a “Canadian resident partnership” on the basis that the Property Partnership would be an “excluded subsidiary entity” as defined in the Tax Act. Our company and the Property Partnership will be a “Canadian resident partnership” if the central management and control of these partnerships is located in Canada. This determination is a question of fact and is expected to depend on where the BPY General Partner is located and exercises central management and control of the partnerships. The BPY General Partner will take appropriate steps so that the central management and control of these entities is not located in Canada such that the SIFT Rules should not apply to our company or to the Property Partnership at any relevant time. However, no assurance can be given in this regard. If our company or the Property Partnership is a “SIFT partnership”, the Canadian federal income tax consequences to our unitholders could be materially different in certain respects from those described in Item 10.E. “Additional Information - Taxation - Certain Material Canadian Federal Income Tax Considerations”. In addition, there can be no assurance that the SIFT Rules will not be revised or amended in the future such that the SIFT Rules will apply.
- 40 -
ITEM 4. INFORMATION ON THE COMPANY
4.A. HISTORY AND DEVELOPMENT OF THE COMPANY
Our company was established on January 3, 2013 as a Bermuda exempted limited partnership registered under the Bermuda Limited Partnership Act 1883, as amended, and the Bermuda Exempted Partnerships Act 1992, as amended. Our company’s head and registered office is 73 Front Street, 5th Floor, Hamilton HM 12, Bermuda, and our company’s telephone number is +441 294 3309.
Our company was established by Brookfield Asset Management as its primary vehicle to make investments across all strategies in real estate. Our goal is to be the leading global owner and operator of high-quality real estate, that generates sustainable and growing distributions to our unitholders and capital appreciation of our asset base over the long term. Our LP Units are listed on the Nasdaq and the TSX under the symbols “BPY” and “BPY.UN”, respectively, and our Preferred Units are listed on the Nasdaq under the symbols “BPYPP”, “BPYPO” and “BPYPN”, respectively.
On April 15, 2013, Brookfield Asset Management completed a spin-off of its commercial property operations to our partnership which was effected by way of a special dividend of units of our partnership to holders of Brookfield Asset Management’s Class A and B limited voting shares. Each holder of the shares received one partnership unit for approximately every 17.42 shares, representing 44.7% of the limited partnership interest in our partnership, with Brookfield Asset Management retaining units of our partnership, Redemption-Exchange Units, and a 1% general partner interest in the Property Partnership through Property Special LP, which was then known as Brookfield Property GP L.P. Our general partner is an indirect wholly-owned subsidiary of Brookfield Asset Management. In addition, wholly-owned subsidiaries of Brookfield Asset Management provide management services to us pursuant to our Master Services Agreement.
On August 28, 2018, we acquired all of the outstanding shares of common stock of GGP other than those shares previously held by our partnership and our affiliates (which represented a 34% interest in GGP prior to the acquisition). In connection with the acquisition, we formed Brookfield Property REIT Inc., which is an issuer of public securities that are intended to offer economic equivalence to an investment in our partnership in the form of a U.S. REIT stock. The BPR Units and Series A preferred stock of BPR trade on the Nasdaq under the symbols “BPR” and “BPRAP”, respectively. In the acquisition, former GGP shareholders elected to receive, for each GGP common share, subject to proration, either $23.50 in cash or either one LP Unit or one BPR Unit. As a result of the acquisition of GGP, approximately 161 million BPR Units and 88 million LP Units were issued to former GGP shareholders.
For a description of our principal capital expenditures in the last three fiscal years and a discussion of our acquisitions and dispositions during the year ended December 31, 2019, please see Item 5.A. “Operating and Financial Review and Prospects - Operating Results”.
We are subject to the informational requirements of the Exchange Act. In accordance with these requirements, we file reports and other information as a foreign private issuer with the SEC. You may also inspect reports and other information regarding registrants, such as us, that file electronically with the SEC without charge at a website maintained by the SEC at www.sec.gov. See Item 10.H “Documents on Display”.
- 41 -
4.B. BUSINESS OVERVIEW
Overview of our Business
Our partnership is Brookfield Asset Management’s primary vehicle to make investments across all strategies in real estate. Our goal is to be a leading global owner and operator of high-quality real estate, that generates sustainable and growing distributions to our unitholders and capital appreciation of our asset base over the long term. With approximately 22,000 employees involved in Brookfield’s real estate businesses around the globe, we have built operating platforms in various real estate sectors, including:
| CORE OFFICE PORTFOLIO | CORE RETAIL PORTFOLIO | |||
| Class A office assets in gateway markets around the globe | 100 of the top 500 malls in the United States | |||
| l | 136 premier properties | l | 122 best-in-class malls and urban retail properties | |
| l | 93 million square feet | l | 120 million square feet | |
| l | 93% occupancy | l | 96% occupancy | |
| l | 8.5 year average lease term | |||
| LP INVESTMENTS PORTFOLIO | ||||
| Invested in mispriced portfolios and/or properties with significant value-add | ||||
Our diversified Core portfolios consist of high-quality office and retail assets in some of the world’s most dynamic markets which have stable cash flow as a result of their long-term leases. We target between a 10% and 12% total return on our Core portfolios. The drivers of these targets include the mark-to-market of rents upon lease expiry, escalation provisions in leases and projected increases in occupancy that should generate strong same-property NOI growth without significant capital investment. Furthermore, we target earning between 6% and 11% unlevered, pre-tax returns on construction costs for our development and redevelopment projects. We currently have approximately 12 million square feet of active development projects underway with another 6 million square feet in planning stages. Our development track record reflects successful completions on time and on budget. We expect that this portion of our balance sheet will be meaningful to earnings growth in our Core businesses throughout the next five to ten years as projects reach completion and begin to contribute rental revenue to our earnings.
Our LP Investments portfolio includes our equity invested in Brookfield-sponsored real estate opportunity funds, which target high-quality assets with operational upside across various real estate sectors, including office, retail, multifamily, logistics, hospitality, self-storage, triple net lease, manufactured housing and student housing. We target an average gross 20% total return on our LP Investments portfolio and a 2.0x multiple of capital on the equity we invest into these vehicles. These investments, unlike our Core portfolios, have a defined hold period and typically generate the majority of profits from a gain recognized from realization events including the sale of an asset or portfolio of assets, or exit of the entire investment. The combination of these gains and FFO earned represent our earnings on capital invested in these funds and provide liquidity to support our target distributions.
Overall, we seek to earn leveraged after-tax total returns of 12% to 15% on our invested capital. These returns will be comprised of current cash flow, distribution growth and capital appreciation. With our diversified cash flow profile from our Core Office, Core Retail, and LP Investments portfolios, our goal is to pay an attractive annual distribution to our unitholders and to grow our distribution by 5% to 8% per annum. Capital appreciation will be reflected in the fair value gains that flow through our income statement as a result of our revaluation of investment properties in accordance with IFRS to reflect initiatives that increase property level cash flows, change the risk profile of the asset, reflect changes in market conditions, or portfolio premiums realized upon sale of these assets. From time to time, we will convert some or all of these unrealized gains to cash through asset sales, joint ventures or refinancings.
We believe our global scale and best-in-class operating platforms provide us with a unique competitive advantage as we are able to efficiently allocate capital around the world toward those sectors and geographies where we see the greatest returns. We actively recycle assets on our balance sheet as they mature and reinvest the proceeds into higher yielding investment strategies, further enhancing returns. In addition, due to the scale of our stabilized portfolio and flexibility of our balance sheet, we believe our business model is self-funding and does not require us to access capital markets to fund our continued growth.
- 42 -
Our Business Strategy
Our strategy is to be the leading globally-diversified owner and operator of commercial properties. Due to the cyclical nature of the real estate industry, we believe that a real estate portfolio diversified by property type and geography will perform consistently over time. Furthermore, since property valuations fluctuate considerably based on market sentiment and other factors, we believe that the flexibility to shift capital to sectors and geographies that are out of favor will enable us to earn premium returns on the capital that we invest.
We are currently targeting investments across our various portfolios. In summary, our strategy is to acquire high-quality assets on a value basis, utilize our operating entities to add value through pro-active management, develop “best-in-class” properties at a discount to asset valuations, recycle capital for re-investment in new opportunities and finance on a non-recourse basis with investment grade metrics.
Leverage Brookfield’s operating experience, execution abilities and global relations
| • | Through our operating entities around the globe, we receive real-time information regarding market conditions and opportunities, which helps us identify the investments that offer the best risk-adjusted returns and give us competitive advantages in the marketplace. |
| • | Our teams in each of the regions that we target have developed strong local relationships and partnerships. Through these local networks, we originate proprietary transactions that are generally priced at more favorable valuations than competitive processes. |
| • | Brookfield has a long history of leading multi-faceted transactions such as recapitalizations. We utilize our structuring expertise to execute these types of transactions, whereby we can acquire high quality assets at a discount to their intrinsic value. |
Utilize our operating entities to add value through pro-active management
| • | Within our operating entities, we pursue opportunities to maximize revenues in each market, such as optimizing tenant relationships to increase occupancy and raise rents. |
| • | We also identify opportunities to redevelop our existing assets that offer premium risk-adjusted returns. |
| • | Finally, we make add-on acquisitions that can be integrated into our operating entities. |
Develop “best-in-class” properties at a discount to asset valuations
| • | In markets where asset valuations are at a premium to development cost, we selectively pursue development projects that offer attractive risk-adjusted returns. |
| • | Our development strategy is relatively low risk. Before investing a material amount of capital, we generally meet prudent pre-leasing hurdles and secure construction financing and maximum-price contracts. We bring in capital partners on a project-specific basis in order to mitigate risk and manage our cash flow profile. Finally, we monetize land parcels in order to reduce our investment in land. |
Recycle capital for re-investment in new opportunities
| • | Once we have stabilized an asset, we will consider a full or partial sale in order to recycle capital from these assets, which effectively have low costs of capital, for re-investment in new opportunities with higher rates of return. |
| • | For Core assets, our preference is to sell down interests in assets to institutional investors, which enables us to preserve our operating entities and earn incremental fee income. |
- 43 -
Finance on a non-recourse basis with investment grade metrics
| • | We predominantly utilize asset-level debt. We size the non-recourse debt with investment grade metrics in order to provide broad access to capital throughout market cycles and optimize our cost of capital. |
| • | In order to mitigate risk, we generally raise debt financing in local currency, and our debt portfolio is largely fixed rate through issuance of fixed coupon debt or use of interest rate derivatives. |
| • | We seek to ladder maturities in order to reduce refinancing risk. |
For LP Investments transactions, our strategy is to pursue acquisitions through private funds and/or consortium arrangements with institutional investors in order to manage our level of exposure to these higher risk investments. Brookfield has a strong track record of leading such consortiums and partnerships.
Competitive Strengths
We believe that a number of competitive strengths differentiate us from other commercial real estate companies.
| • | Global Scale. With approximately 22,000 employees involved in Brookfield’s real estate business globally, we have operating entities with scale in each of our targeted sectors and geographies. With the real-time information that we receive regarding market conditions and opportunities, we believe we are well-positioned to opportunistically originate transactions that offer the highest risk-adjusted returns. |
| • | Sector and Geographic Diversification. With a portfolio of assets in the office, retail, multifamily, logistics, hospitality, self-storage, triple net lease, manufactured housing and student housing asset classes located primarily in North America, Europe and Australia, with a growing presence in Brazil and Asia, we have diversified cash flows that increase stability and over time should lower our cost of capital. As a result of this diversity, combined with Brookfield’s sponsorship and its strong institutional relationships, we believe that we should have access to capital across market cycles. This should enable us to take advantage of attractive opportunities as they arise. |
| • | Superior Record of Executing Transactions. Brookfield’s real estate group has a long track record of leading multi-faceted transactions, whereby it utilizes its structuring capabilities to invest in high-quality assets on a value basis. Additionally, Brookfield has demonstrated an ability to develop “best-in-class” assets in markets where asset valuations are in excess of development costs, earning attractive returns on equity. |
| • | Strong Organic Cash Flow Growth. As a result of escalation provisions in a majority of our leases, the mark-to-market of rents as long-term leases expire and our ability to increase occupancy/permanent occupancy primarily in our Core Office and Core Retail portfolios, we have a strong foundation for organic cash flow growth. We expect to have flexibility to utilize this incremental cash flow to increase our distribution to our unitholders or fund other growth initiatives. |
| • | Attractive Portfolio of Development/Redevelopment Opportunities. Within our Core Office, Core Retail and LP Investments businesses we have a portfolio of development and redevelopment opportunities that offer premium returns on invested capital. We will seek to capture the value of this pipeline through a combination of investment of capital to build-out such projects and sell-downs to partners at values that reflect the development value that has been created. |
| • | Relationship with Brookfield. As Brookfield’s flagship public commercial property entity, we are the primary vehicle through which it invests in real estate on a global basis. As a result, our unitholders benefit from Brookfield’s global presence, operating experience, execution capabilities and relationships. Furthermore, with Brookfield’s substantial liquidity and strong relationships with banks and institutional investors, we may be able to participate in attractive investments that we could not have executed on a stand-alone basis. |
- 44 -
Operating Entities
Our business is organized in three operating sectors: Core Office, Core Retail and LP Investments. The capital invested in these operating entities is through a combination of: direct investment; investments in asset level partnerships or joint venture arrangements; and participation in private equity funds and consortiums. Combining both publicly-listed and private institutional capital provides a competitive advantage in flexibility and access to capital to fund growth.
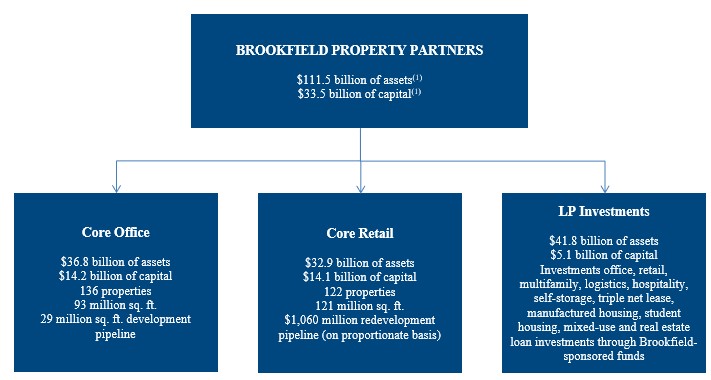
(1) | Represents assets and equity attributable to Unitholders related to our operating segments and excludes corporate assets and obligations. |
Core Office
Our Core Office portfolio consists of interests in 136 high-quality office properties totaling approximately 93 million square feet, which are located primarily in the world’s leading commercial markets such as New York, London, Los Angeles, Washington, D.C., Sydney, Toronto, and Berlin, as well as approximately 12 million square feet of active office and multifamily developments. We believe that these assets have a stable cash flow profile due to long-term leases in place. We target between a 10% and 12% total return on our Core Office portfolio. The drivers of these targets include the mark-to-market of rents upon lease expiry, escalation provisions in leases and projected increases in occupancy that should generate strong same-property NOI growth without significant capital investment. Furthermore, we target earning between 8% and 11% unlevered, pre-tax returns on construction costs from our development pipeline.
Within our Core Office business, we remain focused on the following strategic priorities:
| • | Realizing value from our properties through proactive leasing and select redevelopment and repositioning initiatives to convert assets to higher yielding (or cash flow generating) properties; |
| • | Managing capital prudently, by utilizing conservative financing structures, including the disposition of select mature or non-core assets; and |
| • | Advancing development projects to create “best-in-class” new stock in premium locations. |
Our Core Office portfolio occupancy stands at 93% leased at December 31, 2019 and reflects average in-place net rent of $37.31 per square foot compared to average market net rent of $40.07 per square foot, allowing for 7% potential to capture on higher rents on the upcoming expiration of leases.
- 45 -
Another important characteristic of our Core Office portfolio is the credit quality of our tenants. We focus on tenant credit quality in order to ensure the long-term sustainability of rental revenues through economic cycles. The following list shows major tenants in our Core Office portfolio by leased area and their respective credit ratings and lease commitments as at December 31, 2019.
| Tenant | Primary Location | Credit Rating(1) | Exposure (%)(2) | |
| Government and Government Agencies | Various | AA+/AAA | 7.6 | % |
| Morgan Stanley | NY/London | A- | 2.7 | % |
| Barclays | London/Toronto/Calgary | BBB- | 2.1 | % |
CIBC World Markets(3) | Calgary//Toronto/NY | AA | 1.9 | % |
| Suncor Energy Inc. | Calgary | BBB+ | 1.8 | % |
| Cenovus | Calgary | BB+ | 1.5 | % |
| Bank of Montreal | Calgary/Toronto | AA | 1.5 | % |
| Deloitte | Various | Not Rated | 1.4 | % |
| Bank of America | Merrill Lynch | Various | A | 1.3 | % |
| Amazon | NY/London | A- | 1.3 | % |
| Total | 23.1 | % | ||
(1) | From Standard & Poor’s Rating Services, Moody’s Investment Services, Inc. or DBRS Limited. |
(2) | Prior to considering partnership interests in partially-owned properties. |
(3) | CIBC World Markets leases 1.1 million square feet at 300 Madison Avenue in New York, of which they sublease 940,000 square feet to PricewaterhouseCoopers LLP and approximately 100,000 square feet to Sumitomo Corporation of America. |
Another important strategy for our Core Office business is to sign long-term leases in order to mitigate risk, reduce our overall re-tenanting costs and ensure stable and sustainable cash flows. As at December 31, 2019, the average lease term of our Core Office business was 8.5 years, compared to 8.3 years at December 31, 2018. We typically commence discussions with tenants regarding their space requirements well in advance of the contractual expiration.
A portion of our Core Office business is owned through joint venture, partnership, consortium or other arrangements with institutional partners. Prospectively, as we recycle capital, our preference is to sell down interests in assets to institutional partners and to continue to manage the assets on behalf of ourselves and the investors. We believe that this strategy enables us to enhance returns on our capital through associated fees, which represent an important area of growth.
Our development pipeline is a significant component of value of our Core Office business, and we expect this pipeline to contribute significantly to earnings and provide attractive returns on capital upon stabilization. As at December 31, 2019, we held interests in centrally located development sites with total development potential of approximately 29 million square feet primarily in the United States, Canada, Europe and Australia.
We classify our Core Office development sites into three categories: (i) active development, (ii) active planning and (iii) held for development. Of the approximately 29 million square feet in our office development pipeline, 12 million square feet are in the active development stage, 6 million square feet are in the active planning stage and 11 million square feet are held for future development. With all of our development sites, we proceed with construction when our risk adjusted return hurdles and preleasing targets have been met.
Core Retail
Our Core Retail segment consists of 122 best-in-class retail properties containing over 120 million square feet in the United States. These assets have a stable cash flow profile due to long-term leases in place. We target between a 10% and 12% total return on our Core Retail portfolio. The drivers of these targets include the mark-to-market of rents upon lease expiry, escalation provisions in leases and operating expense monitoring that are expected to generate same-property NOI growth. Furthermore, we expect to earn between 6% and 8% unlevered, pre-tax returns on construction costs from our redevelopment pipeline, which is also expected to drive NOI growth.
Our primary objective for this segment is to be an owner and operator of best-in-class retail properties that provide an outstanding environment and experience for our communities, retailers, and consumers. The strategy for our Core Retail business includes:
| • | increasing the permanent occupancy of our regional mall portfolio by converting temporary leases to permanent leases and leasing vacant space; |
- 46 -
| • | renewing or replacing expiring leases at greater rental rates; |
| • | actively recycling capital through the disposition of assets and investing in whole or partial interests in high-quality regional malls, anchor pads and repaying debt; and |
| • | continuing to execute on our existing redevelopment projects and seeking additional opportunities within our portfolio for redevelopment. |
As of December 31, 2019, the portfolio was 96.4% leased, compared to 96.5% leased at December 31, 2018. On a suite-to-suite basis, the leases commencing occupancy in the trailing 12 months exhibited initial rents that were 3.6% higher than the final rents paid on expiring leases.
For the year ended December 31, 2019, the largest tenant in our Core Retail portfolio, L Brands, Inc. (based on common parent ownership), accounted for approximately 3.8% of rents. Our three largest tenants in the Core Retail portfolio, L Brands, Inc., Foot Locker, Inc., and LVMH, in aggregate, comprised approximately 9.4% of rents.
Competition within the retail property sector is strong. We compete for tenants and visitors to our malls with other malls in close proximity as well as online retailers. We believe the high quality of our properties enables us to compete effectively for retailers and consumers. In order to maintain and increase our competitive position within the marketplace we:
| • | strategically locate tenants within each property to achieve a merchandising strategy that promotes traffic, cross-shopping and maximizes sales; |
| • | introduce new concepts to the property which may include restaurants, theaters, grocery stores, first-to-market retailers, and e-commerce retailers; |
| • | utilize our properties with the opportunities to add other potential uses such as residential, hospitality and office space to complement our retail experience; |
| • | invest capital to provide the right environment for our tenants and consumers, including aesthetic, technological, and infrastructure improvements; and |
| • | ensure our properties are clean, secure and comfortable. |
A portion of our Core Retail business is owned through joint venture, partnership or other arrangements with institutional partners. Prospectively, as we recycle capital, our preference is to sell down interests in assets to institutional partners and to continue to manage the assets on behalf of ourselves and the investors. We believe that this strategy enables us to enhance returns on our capital through associated fees, which represent an important area of growth.
Our redevelopment pipeline is a significant component of value of our Core Retail business. We have redevelopment activities with an estimated cost to the company totaling approximately $583 million in the pipeline. We continue to evaluate a number of other redevelopment projects to further enhance the quality of our assets.
LP Investments
Through investments in Brookfield-sponsored real estate funds created to earn attractive returns, we have interests in various real estate sectors around the globe including office, retail, multifamily, logistics, hospitality, self-storage, triple net lease, manufactured housing and student housing. Our ownership in these holdings ranges from 26% to 50%.
LP Investments - Office
Our LP Investments - Office business consists of 113 opportunistic office properties comprising of approximately 43 million square feet of office space in the United States, United Kingdom, Brazil and Asia. Our LP Investments - Office strategy is to acquire high-quality portfolios and/or in office properties at a discount to replacement cost or intrinsic value and execute strategies to increase occupancy and rental rates, expand on developments and achieve opportunistic returns through NOI growth and fair value appreciation.
- 47 -
LP Investments - Retail
Our LP Investments - Retail business is comprised of approximately 27 million square feet of opportunistic retail space across 42 properties across the United States and in select Brazilian markets. Similar to our LP Investments - Office business, our strategy is to acquire high-quality portfolios and/or retail properties at a discount to replacement cost or intrinsic value and execute strategies to increase occupancy and rental rates, expand on developments and achieve opportunistic returns through NOI growth and fair value appreciation.
Multifamily
Our multifamily business consists of 51 properties with approximately 15,670 multifamily units across the United States. Our strategy is to selectively develop properties in high growth, supply-constrained markets. We leverage our track record of successfully entitling land for development of multifamily properties and managing construction in order to maximize returns. We also seek opportunities to redevelop well-located, older assets and earn an attractive return on this capital by raising rents, which are still a significant discount to new products.
Logistics
Our logistics business consists of approximately 1 million square feet of logistics space at 1 property, consisting of modern logistics assets in China. Our logistics strategy is to acquire older generation logistics properties that we can redevelop into state-of-the-art product. We also seek to selectively develop projects in supply constrained markets that are critical to the global supply chain. We leverage our long track record of successfully entitling land in these markets and our global relationships with retailers and other logistics companies to negotiate anchor leases to support such projects.
Hospitality
Our hospitality business consists of interests in 130 hospitality assets with over 26,400 rooms across North America, Europe and Australia. Our strategy is to employ a disciplined approach to asset selection and target investments with significant value creation opportunities. We seek to invest in hotels and hospitality related ventures in which we can use our operational expertise to add value. These strategies include, but are not limited to, renovations, repositioning, rebranding, management modification, channel distribution management, expense control and creative capital structuring.
Self-storage
Our self-storage business consists of 100 self-storage facilities comprising approximately 9 million square feet throughout the United States. Our strategy is to acquire new locations, and upgrade existing properties in order to meet and exceed target projections.
Triple Net Lease
Our triple net lease business consists of 278 properties that are leased to automotive dealerships across the United States and Canada on a triple net lease basis. Our strategy is to grow the business by acquiring new locations, upgrading existing facilities and constructing new stores.
Manufactured Housing
Our manufactured housing business consists of 136 manufactured housing communities with over 32,400 sites across the United States. Our strategy is to grow this business through add-on acquisitions of properties, upgrading existing properties, and internalized facilities management and marketing.
Student Housing
Our student housing business consists of 50 student housing properties with approximately 18,800 beds in the United Kingdom. Our student housing business operates in strong markets with highly ranked universities throughout the United Kingdom. Our strategy is to grow this business through add-on acquisitions of properties, upgrading existing properties, and internalized facilities management and marketing.
- 48 -
Geographic Distribution
As of December 31, 2019, approximately 69.4% of our assets and 72.2% of our revenues originated from the United States with the remaining 30.6% of our assets and 27.8% of our revenues originating from Canada, Australia, United Kingdom, Europe, Brazil and Asia.
Distribution Policy
Our distribution policy is to retain sufficient cash flow within our operations to cover tenant improvements, leasing costs and other sustaining capital expenditures and to pay out substantially all remaining cash flow. In order to finance development projects, acquisitions and other investments, we plan to recycle capital or raise external capital. We believe that a payout ratio of 80% of our FFO should accomplish this objective. We have invested a substantial amount of capital in development and redevelopment projects primarily in our Core Office and Core Retail segments. Once we realize stabilized cash flow from these initiatives, we expect the growth in our payout to meet our target range of 5% to 8% per annum.
We established our distribution level and our targeted distribution growth rate based on projections of the amount of FFO that we will generate in the short to medium term. These projections reflect the in-place cash flow of all of our investments and our capital investment plans. In a number of our operating entities, we are retaining operating cash flow for reinvestment. As a result, we are required to finance, in the short term, payment of our distributions to our unitholders. To maintain our distributions at the current level, we have a number of alternatives available to us, including (a) using borrowings under our committed revolving credit facilities; (b) electing to accrue and/or waive distributions to be made in respect of the Redemption-Exchange Units that are held by Brookfield Asset Management in accordance with the Property Partnership’s limited partnership agreement; (c) paying off all or a portion of the fees owed to the Service Providers pursuant to the Master Services Agreement through the issuance of LP Units and/or Redemption-Exchange Units; (d) paying of any equity enhancement distributions to Property Special LP through the issuance of Redemption-Exchange Units; and (e) utilizing distributions of other operating entities from cash flow from operations, asset sales and/or refinancings. We are not a passive investor and we typically hold positions of control or significant influence over assets in which we invest, enabling us to influence distributions from those assets.
The current quarterly distribution on our LP Units is $0.3325 per LP Unit (or $1.33 per LP Unit on an annualized basis). Despite our projections and the alternative methods available to maintain our distribution level, there can be no assurance that we will be able to maintain an annual distribution of $1.33 per LP Unit or meet our target growth rate. Based on amounts received in distributions from our operating entities and our projected operating cash flow from our direct investments, our proposed distributions are significantly greater than such amounts.
Additionally, our ability to make distributions will depend on a number of factors, some of which are out of our control, including, among other things, general economic conditions, our results of operations and financial condition, the amount of cash that is generated by our operations and investments, restrictions imposed by the terms of any indebtedness that is incurred to finance our operations, payment of distributions on our Preferred Units, investments or to fund liquidity needs, levels of operating and other expenses, and contingent liabilities. Furthermore, the Property Partnership, the Holding Entities and our operating entities are legally distinct from our company and they are generally required to service their debt and other obligations, such as distributions to preferred unitholders, before making distributions to us or their parent entity as applicable, thereby reducing the amount of our cash flow available to pay distributions on our units, fund working capital and satisfy other needs.
Competition and Marketing
The nature and extent of competition we face varies from property to property and business to business. Our direct competitors include other office, retail, multifamily, logistics, hospitality, self-storage, triple net lease, manufactured housing and student housing operating companies; public and private real estate companies and funds; commercial property developers and other owners of real estate that engage in similar businesses. In addition, we face competition in our retail business from alternatives to traditional mall shopping, particularly online shopping.
We believe the principal factors that our tenants consider in making their leasing decisions include: rental rates; quality, design and location of properties; total number and geographic distribution of properties; management and operational expertise; and financial position of the landlord. Based on these criteria, we believe that the size and scope of our operating entities, as well as the overall quality and attractiveness of our individual properties, enable us to compete effectively for tenants in our local markets. We benefit from using the “Brookfield” name and the “Brookfield” logo in connection with our marketing activities in as Brookfield has a strong reputation throughout the global real estate industry.
- 49 -
Governmental, Legal and Arbitration Proceedings
Our company has not been since its formation and is not currently subject to any material governmental, legal or arbitration proceedings which may have or have had a significant impact on our company’s financial position or profitability nor is our company aware of any such proceedings that are pending or threatened.
We are occasionally named as a party in various claims and legal proceedings which arise during the normal course of our business. We review each of these claims, including the nature of the claim, the amount in dispute or claimed and the availability of insurance coverage. Although there can be no assurance as to the resolution of any particular claim, we do not believe that the outcome of any claims or potential claims of which we are currently aware will have a material adverse effect on us.
Regulation
Our business is subject to a variety of federal, state, provincial and local laws and regulations relating to the ownership and operation of real property, including the following:
| • | We are subject to various laws relating to environmental matters. We could be liable under these laws for the costs of removal and remediation of certain hazardous substances or wastes existing in, or released or deposited on or in our properties or disposed of at other locations. |
| • | We must comply with regulations under building codes and human rights codes that generally require that public buildings be made accessible to disabled persons. |
| • | We must comply with laws and regulations concerning zoning, design, construction and similar matters, including regulations which impose restrictive zoning and density requirements. |
| • | We are also subject to state, provincial and local fire and life safety requirements. |
These laws and regulations may change and we may become subject to more stringent laws and regulations in the future. Compliance with more stringent laws and regulations could have an adverse effect on our business, financial condition or results of operations. We have established policies and procedures for environmental management and compliance, and we have incurred and will continue to incur significant capital and operating expenditures to comply with health, safety and environmental laws and to obtain and comply with licenses, permits and other approvals and to assess and manage potential liability exposure.
Environmental, Social and Governance
As a leading global owner and operator of high-quality real estate on a global basis, a strong environmental, social and governance (“ESG”) culture has always been an integral part of how we operate our business. We believe that having a robust ESG strategy is crucial for us to create long-term value for our unitholders.
Brookfield has an effective economic interest in our business of approximately 51% and affiliates of Brookfield Asset Management provide services to us under the Master Services Agreement. Brookfield encourages a common set of ESG principles across its business, while at the same time recognizing that the geographic and sector diversity of our portfolio requires tailored, local management and responsibility. The following are Brookfield’s and our partnership’s ESG principles:
| • | Ensuring the well-being and safety of employees |
| ◦ | Employee Well-Being: Meet or exceed all applicable labor laws and standards, which includes respecting human rights, offering competitive wages and implementing nondiscriminatory, fully inclusive hiring practices. |
| ◦ | Health & Safety: Aim to have zero serious safety incidents by encouraging consistent health and safety principles across the organization. |
| • | Be good stewards |
| ◦ | Community Engagement: Engage with community groups potentially affected by our actions to ensure that their interests, safety and well-being are appropriately integrated into our decision-making. |
| ◦ | Philanthropy: Empower employees to participate in, and use resources to give back, to local communities. |
- 50 -
| • | Mitigate the impact of operations on the environment |
| ◦ | Environmental Stewardship: Strive to minimize environmental impact and improve efficient use of resources over time. |
| • | Conduct business according to the highest ethical and legal/regulatory standards |
| ◦ | Governance, Ethics and Fairness: Operate with high ethical standards by conducting business activities in compliance with applicable legal and regulatory requirements, and consistent with our Code of Business Conduct and Ethics. |
| ◦ | Transparency: Be accessible to our investors and stakeholders by being responsive to requests for information and timely in our communication. |
ESG and the Investment Process
ESG culture is embedded throughout the investment process, starting with the due diligence of a potential investment through to the exit process. During the initial due diligence phase, Brookfield uses its operating expertise to identify material ESG risks and opportunities relevant to a potential investment. In completing these initial assessments, internal experts are used and, as needed, third-party consultants.
To ensure ESG considerations are fully integrated in the due diligence phase, the investment team prepares a detailed memorandum outlining the merits of the transaction and disclosing potential risks, mitigants and value creation opportunities. Senior management of our Service Providers discuss material ESG issues and potential mitigation strategies, including bribery and corruption risks, health and safety risks, and legal risks, as well as environmental and social risks.
Post-acquisition, local management teams are accountable for the implementation of ESG initiatives within their operations, in accordance with Brookfield and our partnership’s ESG principles. This ensures full alignment between responsibility, authority, experience and execution. This approach is particularly important given the wide range of industries and locations in which we invest that require tailored ESG risk identification and management systems to mitigate unique risks and capitalize on distinct opportunities.
Environmental Initiatives
We pride ourselves on contributing positively to the local communities in which we operate. This means we continually strive to minimize our impact on the environment, while balancing the need for economic growth. We demonstrate respect for the natural environment and take steps to protect it by investing in green technologies, encouraging environmentally sound construction methods, and promoting strategies to minimize our carbon footprint. Green initiatives in our portfolio include energy reduction, use of alternative energy sources such as solar, water conservation, recycling, enhanced indoor air quality, alternative transportation parking, environmentally friendly cleaning materials and erosion control.
Our commitment to sustainability and intelligent design has earned us global recognition. 90% of our eligible global office area has achieved a sustainability designation. Across our portfolio we hold 67 LEED certifications, 88 Energy Star certifications in the United States, 51 BOMA 360 office certifications in the United States and Canada, 26 NABERS certifications in Australia, 9 Green Star certifications and 3 BREEAM certifications.
Social Initiatives
The health and safety of employees is a top priority. This is why we target zero serious safety incidents and foster a culture of safe practice and leadership. Safety training and protocols are constantly refined by our businesses, and health and safety incident metrics are reviewed regularly.
We believe that giving back is essential to doing good business. Across our operations in the United States, Canada, Brazil, Europe, Asia and Australia, we enhance our communities by supporting cultural initiatives and hosting local events, and we encourage our business partners to do the same. Brookfield has a history of deep involvement in philanthropy and continually works to instill a culture of charitable giving and volunteerism among employees and business partners.
Governance Initiatives
Upholding fair and effective business practices is a cornerstone of being a responsible global citizen. Our partnership has adopted strong governance practices to ensure our activities are conducted with the utmost honesty and integrity and in full compliance with all legal and regulatory requirements. Our Code of Business Conduct and Ethics and Anti-bribery and Corruption
- 51 -
Policy set out the commitments expected by us. We maintain a reporting hotline to report suspected unethical, illegal or unsafe behavior.
We are also deeply aware of the benefits that diversity and inclusion add to a workplace and to our ability to achieve better business outcomes. We adopted a Positive Work Environment Policy, which consolidates Brookfield’s previous regional harassment policies into one global policy and sets a consistent and high standard across all jurisdictions by explicitly expressing commitment to maintaining a workplace free from discrimination, violence and harassment.
We are proud of the commitment we have made to ESG. The initiatives we undertake and the investments we make in building our business are guided by our core set of values around sustainable development and ESG, as we encourage a culture and organization that we believe can be successful today and in the future.
4.C. ORGANIZATIONAL STRUCTURE
Organizational Chart
The chart on the following page represents a simplified summary of our organizational structure as of December 31, 2019. “GP Interest” denotes a general partnership interest and “LP Interest” denotes a limited partnership interest. Certain subsidiaries through which Brookfield Asset Management holds units of our company have been omitted.
- 52 -
This chart should be read in conjunction with the explanation of our ownership and organizational structure on the following pages.
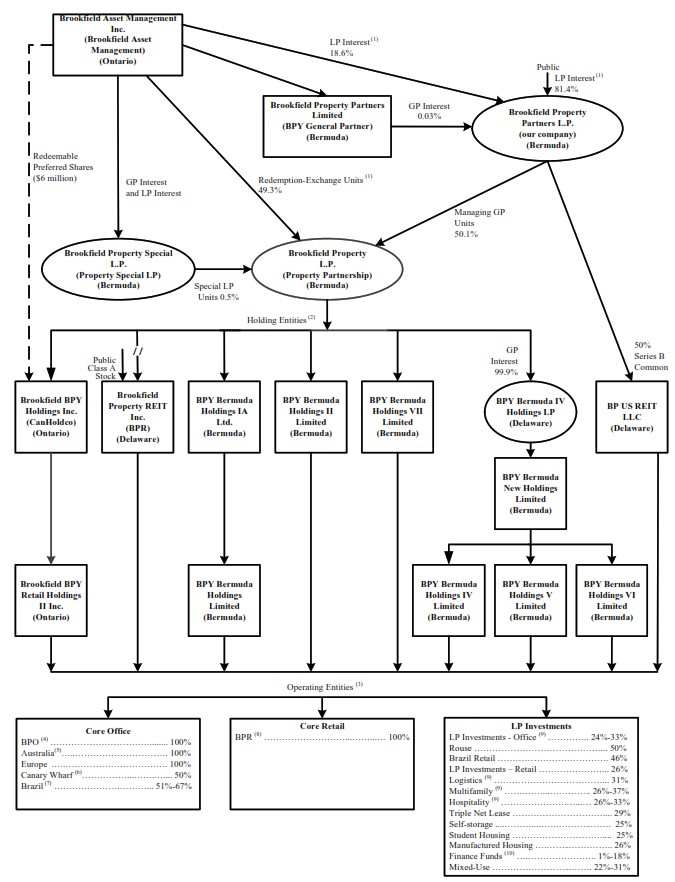
- 53 -
(1) | As of December 31, 2019, public holders own LP Units of our company representing an 81% limited partnership interest in our company, and Brookfield owns the remaining LP Units of our company, representing a 19% limited partnership interest in our company. Assuming the exchange of the Redemption-Exchange Units in accordance with the Redemption-Exchange Mechanism and the exchange of the issued and outstanding Exchange LP Units not held by us and the issued and outstanding BPR Units, Brookfield has a 55% interest in our company. On a fully-exchanged basis and taking into account the exchange of the issued and outstanding BPR Units, public holders (excluding the Class A Preferred Unitholder) would own LP Units of our company representing a 42% interest in our company, the Class A Preferred Unitholder would own LP Units of our company representing a 7% interest in our company and Brookfield would own the remaining LP Units of our company, representing a 51% interest in our company. Brookfield also has an approximately 49% interest in the Property Partnership through Brookfield’s ownership of Redemption-Exchange Units and Special LP Units. On a fully-exchanged basis, our company would directly own 99% of the limited partnership interests in the Property Partnership. |
(2) | The Property Partnership owns, directly or indirectly, all of the common shares or equity interests, as applicable, of the Holding Entities. Brookfield holds $1 million of Class B junior preferred shares of Brookfield BPY Holdings Inc. (“CanHoldco”) as of December 31, 2019. In addition, Brookfield holds $5 million of Class A senior preferred shares of each of CanHoldco and of two wholly-owned subsidiaries of other Holding Entities, which preferred shares are entitled to vote with the common shares of the applicable entity. Brookfield has an aggregate of 2% of the votes to be cast in respect of CanHoldco and 1% of the votes to be cast in respect of any of the other applicable entities. See Item 7.B. “Major Shareholders and Related Party Transactions - Related Party Transactions - Relationship with Brookfield - Preferred Shares of Certain Holding Entities”. |
(3) | Certain of the operating entities and intermediate holding companies that are directly or indirectly owned by the Holding Entities and that directly or indirectly hold our real estate assets are not shown on the chart. All percentages listed represent our economic interest in the applicable entity or group of assets, which may not be the same as our voting interest in those entities and groups of assets. All interests are rounded to the nearest one percent and are calculated as at December 31, 2019. |
(4) | The majority of our Core Office portfolio is held through Brookfield Office Properties, Inc. (“BPO”). We own 100% of its outstanding common shares and outstanding voting preferred shares as well as interests in certain series of its non-voting preferred shares. |
(5) | Our Australian office business consists of our direct interest in our Australian office properties not held through BPO. |
(6) | Our interest in Canary Wharf is held through a joint venture owned 50% by our company and 50% by the Class A Preferred Unitholder. |
(7) | Our Brazilian office business, includes 67% ownership of an office building in Rio de Janeiro, Brazil and our interest in an office building in the Faria Lima section of São Paulo, Brazil. |
(8) | Our economic interest in BPR is 100% as BPR Units are intended to be economically equivalent to LP Units. Our voting interest is 95% of the voting stock of BPR through our 100% ownership of BPR’s Series B preferred stock, Class B-1 stock, Class B-2 stock and Class C stock. The balance of the voting rights in respect of BPR are held by the public holders of the BPR Units. |
(9) | Our economic interest set forth above is reflected as a range because our LP Investments are held through Brookfield-sponsored real estate funds in which we hold varying interests. |
(10) | Our interest in one of our opportunistic real estate finance funds is owned by the Property Partnership. |
- 54 -
The following table provides the percentage of voting securities owned, or controlled or directed, directly or indirectly, by us, and our economic interest in our operating entities included in our organizational chart set out above under “- Organizational Chart”.
| Name | Economic Interest(1) | Voting Interest(1) | |
| Core Office | |||
BPO(2) | 100% | 100% | |
| Australia | 100% | 100% | |
| Europe | 100% | 100% | |
| Canary Wharf | 50% | 50% | |
| Brazil | 51% - 67% | 51% - 67% | |
| Core Retail | |||
| BPR | 100% | 95% | |
| LP Investments | |||
LP Investments - Office(3,4) | 24% - 33% | — | |
| Rouse | 50% | 33% | |
Brazil Retail(3) | 46% | — | |
LP Investments - Retail(4) | 26% | — | |
Logistics(3,4) | 31% | — | |
Multifamily(3,4) | 26% - 37% | — | |
Hospitality(3,4) | 26% - 33% | — | |
Triple Net Lease(3,4) | 29% | — | |
Self-storage(3,4) | 25% | — | |
Student Housing(3,4) | 25% | — | |
Manufactured Housing(3,4) | 26% | — | |
Finance Funds(3,4) | 1% - 18% | — | |
Mixed-Use(3,4) | 22% - 31% | — | |
(1) | All interests are rounded to the nearest one percent and are calculated as at December 31, 2019. |
(2) | Our interest in BPO consists of 100% of its outstanding common shares and outstanding voting preferred shares, as well as interests in certain series of its non-voting preferred shares. |
(3) | We hold our economic interest in these assets primarily through limited partnership interests in Brookfield-sponsored real estate funds. By their nature, limited partnership interests do not have any voting rights. |
(4) | Our economic interest set forth above is reflected as a range because our LP Investments are primarily held through Brookfield-sponsored real estate funds in which we hold varying interests. |
- 55 -
Our Company
In connection with the Spin-off, we acquired from Brookfield Asset Management substantially all of its commercial property operations, including its office, retail, multifamily and logistics assets. We are Brookfield Asset Management’s primary vehicle to make investments across all strategies in real estate. We are positioned to take advantage of Brookfield’s global presence, providing our unitholders with the opportunity to benefit from Brookfield’s operating experience, execution abilities and global relationships. As of December 31, 2019, Brookfield Asset Management has an effective economic interest in our business of approximately 55%.
Property Partnership
Our company’s sole direct investments are a managing general partnership interest in the Property Partnership and an interest in BP US REIT LLC. Our company serves as the managing general partner of the Property Partnership and has sole authority for the management and control of the Property Partnership.
Our company owns a direct 50% interest in the Property Partnership through ownership of Managing General Partner Units. Our company also owns the Property Partnership Preferred Units, Series 5, 6 and 7. Brookfield has an approximately 49% interest in the Property Partnership through Brookfield’s ownership of Redemption-Exchange Units. Brookfield’s interest in the Property Partnership also includes a special limited partnership interest held by Property Special LP, a wholly-owned subsidiary of Brookfield Asset Management, which entitles it to receive equity enhancement distributions and incentive distributions from the Property Partnership. Holders of our units, other than Brookfield, including the Class A Preferred Unitholder and the holders of the AO LTIP Units and FV LTIP Units, hold the remaining approximate 1% economic interest in the Property Partnership. See Item 7.B. “Major Shareholders and Related Party Transactions - Related Party Transactions - Relationship with Brookfield - Equity Enhancement and Incentive Distributions”.
Our Service Providers
The Service Providers, wholly-owned subsidiaries of Brookfield Asset Management, provide management services to us pursuant to our Master Services Agreement. The senior management team that is principally responsible for providing us with management services include many of the same executives that have successfully overseen and grown Brookfield’s global real estate business.
The BPY General Partner
The BPY General Partner, a wholly-owned subsidiary of Brookfield Asset Management, has sole authority for the management and control of our company. Holders of our units, in their capacities as such, may not take part in the management or control of the activities and affairs of our company and do not have any right or authority to act for or to bind our company or to take part or interfere in the conduct or management of our company. See Item 10.B. “Additional Information - Memorandum and Articles of Association - Description of Our LP Units, Preferred Units and Our Limited Partnership Agreement”.
Property Special LP
Property Special LP is a special limited partner of the Property Partnership. The general partner of Property Special LP is Brookfield Asset Management. Property Special LP is entitled to receive equity enhancement distributions and incentive distributions from the Property Partnership as a result of its ownership of the Special LP Units. See Item 7.B. “Major Shareholders and Related Party Transactions Related Party Transactions”.
Holding Entities
Our company indirectly holds its interests in our operating entities through the Holding Entities, most of which were formed in connection with the Spin-off. The Property Partnership owns, directly or indirectly, all of the common shares or equity interests, as applicable, of the Holding Entities. Brookfield holds $1 million of redeemable Class B junior preferred shares of CanHoldco, one of our Holding Entities. In addition, Brookfield holds $5 million of Class A preferred shares of CanHoldco and of two wholly-owned subsidiaries of other Holding Entities. See Item 7.B. “Major Shareholders and Related Party Transactions - Related Party Transactions - Relationship with Brookfield - Preferred Shares of Certain Holding Entities”.
- 56 -
Operating Sectors
Our business is organized in three sectors: Core Office, Core Retail and LP Investments. The capital invested in these sectors is through a combination of: direct investment; investments in asset level partnerships or joint venture arrangements; and participation in private equity funds and consortiums.
4.D. PROPERTY, PLANTS AND EQUIPMENT
See Item 4.B. “Information on the Company - Business Overview”, Item 4.C. “Information on the Company - Organizational Structure”, Item 5.A. “Operating and Financial Review and Prospects - Operating Results” and Item 18 “Financial Statements”.
ITEM 4A. UNRESOLVED STAFF COMMENTS
Not applicable.
- 57 -
ITEM 5. OPERATING AND FINANCIAL REVIEW AND PROSPECTS
5.A. OPERATING RESULTS
OBJECTIVES AND FINANCIAL HIGHLIGHTS
INTRODUCTION
This management’s discussion and analysis (“MD&A”) of Brookfield Property Partners L.P. (“BPY”, the “ partnership”, “we”, “us”, or “our”) covers the financial position as of December 31, 2019 and 2018 and results of operations for the years ended December 31, 2019, 2018, and 2017. The information in this MD&A should be read in conjunction with the audited consolidated financial statements as of December 31, 2019 and 2018 and each of the years ended December 31, 2019, 2018, and 2017 (the “Financial Statements”) and related notes contained elsewhere in this Form 20-F.
In addition to historical information, this MD&A contains forward-looking statements. Readers are cautioned that these forward-looking statements are subject to risks and uncertainties that could cause actual results to differ materially from those reflected in the forward-looking statements. See “Special Note Regarding Forward-Looking Statements”.
BASIS OF PRESENTATION
Our sole direct investments are a 50% managing general partnership unit interest in Brookfield Property L.P. (the “Operating Partnership”) and an interest in BP US REIT LLC. As we have the ability to direct its activities pursuant to our rights as owners of the general partner units, we consolidate the Operating Partnership. Accordingly, our Financial Statements reflect 100% of its assets, liabilities, revenues, expenses and cash flows, including non-controlling interests therein, which capture the ownership interests of other third parties.
We also discuss the results of operations on a segment basis, consistent with how we manage our business. On July 1, 2018, the partnership realigned its LP Investments segment (formerly referred to as Opportunistic) to include the corporate function of the Brookfield-sponsored real estate opportunity funds, previously included in the Corporate segment, to more closely align with how the partnership now presents financial information to the chief operating decision maker (“CODM”) and investors. As of December 31, 2019, the partnership is organized into four reportable segments: i) Core Office, ii) Core Retail, iii) LP Investments and iv) Corporate. These segments are independently and regularly reviewed and managed by the Chief Executive Officer, who is considered the CODM.
Our partnership’s equity interests include general partnership units (“GP Units”), publicly traded limited partnership units (“LP Units”), redeemable/exchangeable partnership units of the Operating Partnership (“Redeemable/Exchangeable Partnership Units”), special limited partnership units of the Operating Partnership (“Special LP Units”), FV LTIP Units of the Operating Partnership (“FV LTIP Units”), limited partnership units of Brookfield Office Properties Exchange LP (“Exchange LP Units”), Class A stock, par value $0.01 per share, (“BPR Units”) of Brookfield Property REIT Inc. (“BPR”) and Class A Cumulative Redeemable Perpetual Preferred Units, Series 1, Series 2 and Series 3 (“Preferred Equity Units”). Holders of the GP Units, LP Units, Redeemable/Exchangeable Partnership Units, Special LP Units, FV LTIP Units, Exchange LP Units and BPR Units will be collectively referred to throughout this MD&A as “Unitholders”. The LP Units, Redeemable/Exchangeable Partnership Units, Exchange LP Units and BPR Units have the same economic attributes in all respects, except that the holders of Redeemable/Exchangeable Partnership Units and BPR Units have the right to request that their units be redeemed for cash consideration. In the event that Brookfield Asset Management Inc. (“Brookfield Asset Management”), as the holder of the Redeemable/Exchangeable Partnership Units exercises this right, our partnership has the right, at its sole discretion, to satisfy the redemption request with its LP Units, rather than cash, on a one-for-one basis. As a result, Brookfield Asset Management, as holder of Redeemable/Exchangeable Partnership Units, participates in earnings and distributions on a per unit basis equivalent to the per unit participation of the LP Units of our partnership. However, given the redemption feature referenced above and the fact that they were issued by our subsidiary, we present the Redeemable/Exchangeable Partnership Units as a component of non-controlling interests. The Exchange LP Units are exchangeable at any time on a one-for-one basis, at the option of the holder, for LP Units. We present the Exchange LP Units as a component of non-controlling interests. BPR Units provide their holders with the right to request that their units be redeemed for cash consideration. In the event the holders of BPR Units exercise this right, our partnership has the right at its sole discretion, to satisfy the redemption request with its LP Units, rather than cash, on a one-for-one basis. As a result, BPR Units participates in earnings and distributions on a per unit basis equivalent to the per unit participation of LP Units of our partnership. We present BPR Units as a component of non-controlling interest.
This MD&A includes financial data for the year ended December 31, 2019 and includes material information up to the date of this Form 20-F. Financial data has been prepared using accounting policies in accordance with International Financial Reporting Standard (“IFRS”) as issued by the International Accounting Standards Board (“IASB”). Non-IFRS measures used in this MD&A are reconciled to or calculated from such financial information. Unless otherwise specified, all operating and other
- 58 -
statistical information is presented as if we own 100% of each property in our portfolio, regardless of whether we own all of the interests in each property. We believe this is the most appropriate basis on which to evaluate the performance of properties in the portfolio relative to each other and others in the market. All dollar references, unless otherwise stated, are in millions of U.S. Dollars. Canadian Dollars (“C$”), Australian Dollars (“A$”), British Pounds (“£”), Euros (“€”), Brazilian Reais (“R$”), Indian Rupees (“₨”), Chinese Yuan (“C¥”), South Korean Won (“₩”) and United Arab Emirates Dirham (“AED”) are identified where applicable.
We present certain financial information on a proportionate basis. Financial information presented on a proportionate basis provides further information on the financial performance and position of the partnership as a whole, including certain investments which are accounted for under the equity method. We believe that proportionate financial information assists analysts and investors in determining the partnership’s economic interests in its consolidated and unconsolidated investments. The proportionate financial information reflects the financial position and performance of the partnership’s economic ownership of each investment that the partnership does not wholly own.
This proportionate information is not, and is not intended to be, a presentation in accordance with IFRS. Other companies may calculate their proportionate financial information differently than us, limiting its usefulness as a comparative measure. As a result of these limitations, the proportionate information should not be considered in isolation or as a substitute for the partnership’s financial statements as reported under IFRS.
OVERVIEW OF OUR BUSINESS
We are Brookfield Asset Management’s primary vehicle to make investments across all strategies in real estate. Our goal is to be a leading global owner and operator of high-quality real estate, that generates sustainable and growing distributions to our unitholders and capital appreciation of our asset base over the long term. With approximately 22,000 employees involved in Brookfield Asset Management’s real estate businesses around the globe, we have built operating platforms in various real estate sectors, including in our:
| CORE OFFICE PORTFOLIO | CORE RETAIL PORTFOLIO | |||
| Class A office assets in gateway markets around the globe | 100 of the top 500 malls in the United States | |||
| l | 136 premier properties | l | 122 best-in-class malls and urban retail properties | |
| l | 93 million square feet | l | 120 million square feet | |
| l | 93% occupancy | l | 96% occupancy | |
| l | 8.5 year average lease term | |||
| LP INVESTMENTS PORTFOLIO | ||||
| Invested in mispriced portfolios and/or properties with significant value-add | ||||
Our diversified Core portfolios consist of high-quality office and retail assets in some of the world’s most dynamic markets which have stable cash flow as a result of their long-term leases. We target between a 10% and 12% total return on our Core portfolios. The drivers of these targets include the mark-to-market of rents upon lease expiry, escalation provisions in leases and projected increases in occupancy that should generate strong same-property net operating income (“NOI”) growth without significant capital investment. Furthermore, we target earning between 6% and 11% unlevered, pre-tax returns on construction costs for our development and redevelopment projects. We currently have approximately 12 million square feet of active development projects underway with another 6 million square feet in planning stages. Our development track record reflects successful completions on time and on budget. We expect that this portion of our balance sheet will be meaningful to earnings growth in our Core businesses throughout the next five to ten years as projects reach completion and begin to contribute rental revenue to our earnings.
Our LP Investments portfolio includes our equity invested in Brookfield-sponsored real estate opportunity funds, which target high-quality assets with operational upside across various real estate sectors, including office, retail, multifamily, logistics, hospitality, self-storage, triple net lease, manufactured housing and student housing. We target an average gross 20% total return on our LP Investments portfolio and a 2.0x multiple of capital on the equity we invest into these vehicles. These investments, unlike our Core portfolios, have a defined hold period and typically generate the majority of profits from a gain recognized from realization events including the sale of an asset or portfolio of assets, or exit of the entire investment. The combination of these gains and FFO earned represent our earnings on capital invested in these funds and provide liquidity to support our target distributions.
- 59 -
Overall, we seek to earn leveraged after-tax total returns of 12% to 15% on our invested capital. These returns will be comprised of current cash flow, distribution growth and capital appreciation. With our diversified cash flow profile from our Core Office, Core Retail, and LP Investments portfolios, our goal is to pay an attractive annual distribution to our Unitholders and to grow our distribution by 5% to 8% per annum. Capital appreciation will be reflected in the fair value gains that flow through our income statement as a result of our revaluation of investment properties in accordance with IFRS to reflect initiatives that increase property level cash flows, change the risk profile of the asset, reflect changes in market conditions, or portfolio premiums realized upon sale of these assets. From time to time, we will convert some or all of these unrealized gains to cash through asset sales, joint ventures or refinancings.
We believe our global scale and best-in-class operating platforms provide us with a unique competitive advantage as we are able to efficiently allocate capital around the world toward those sectors and geographies where we see the greatest returns. We actively recycle assets on our balance sheet as they mature and reinvest the proceeds into higher yielding investment strategies, further enhancing returns. In addition, due to the scale of our stabilized portfolio and flexibility of our balance sheet, we believe our business model is self-funding and does not require us to access capital markets to fund our continued growth.
PERFORMANCE MEASURES
We expect to generate returns to Unitholders from a combination of healthy distributions and capital appreciation. Furthermore, if we are successful in increasing cash flow earned from our operations and distributions from return of capital and realization events from our LP Investments portfolio, we expect to be able to increase distributions at the targeted rate of 5% to 8% per annum to Unitholders to provide them with an attractive total return on their investment.
We also consider the following items to be important drivers of our current and anticipated financial performance:
| • | increases in occupancies by leasing vacant space and pre-leasing active developments; |
| • | increases in rental rates through maintaining or enhancing the quality of our assets and as market conditions permit; and |
| • | reductions in operating costs through achieving economies of scale and diligently managing contracts. |
We also believe that key external performance drivers include the availability of the following:
| • | debt capital at a cost and on terms conducive to our goals; |
| • | equity capital at a reasonable cost; |
| • | new property acquisitions and other investments that fit into our strategic plan; and |
| • | opportunities to dispose of peak value or non-core assets. |
In addition to monitoring, analyzing and reviewing earnings performance, we also review initiatives and market conditions that contribute to changes in the fair value of our investment properties. These fair value changes, combined with earnings, represent a total return on the equity attributable to Unitholders and form an important component in measuring how we have performed relative to our targets.
To measure our performance against these targets, as described above, and measure our operating performance, we focus on NOI, same-property NOI, funds from operations (“FFO”), Company FFO, net income attributable to Unitholders and equity attributable to Unitholders. Some of these performance metrics do not have standardized meanings prescribed by IFRS and therefore may differ from similar metrics used by other companies.
| • | NOI: revenues from our commercial properties operations less direct commercial property expenses (“Commercial property NOI”) and revenues from our hospitality operations less direct hospitality expenses (“Hospitality NOI”). |
| • | Same-property NOI: a subset of NOI, which excludes NOI that is earned from assets acquired, disposed of or developed during the periods presented, not of a recurring nature, or from LP Investments assets. |
| • | FFO: net income, prior to fair value gains, net, depreciation and amortization of real estate assets, and income taxes less non-controlling interests of others in operating subsidiaries and properties therein. When determining FFO, we |
- 60 -
include our proportionate share of the FFO of unconsolidated partnerships and joint ventures and associates, as well as gains (or losses) related to properties developed for sale.
| • | Company FFO: FFO before the impact of depreciation and amortization of non-real estate assets, transaction costs, gains (losses) associated with non-investment properties, imputed interest on equity accounted investments and the partnership’s share of Brookfield Strategic Real Estate Partners III (“BSREP III”) FFO. The partnership accounts for its investment in BSREP III as a financial asset and the income (loss) of the fund is not presented in the partnership’s results. Distributions from BSREP III, recorded as dividend income under IFRS, are removed from investment and other income for Company FFO presentation. |
| • | Net income attributable to Unitholders: net income attributable to holders of GP Units, LP Units, Redeemable/Exchangeable Partnership Units, Special LP Units, Exchange LP Units, FV LTIP Units and BPR Units. |
| • | Equity attributable to Unitholders: equity attributable to holders of GP Units, LP Units, Redeemable/Exchangeable Partnership Units, Special LP Units, Exchange LP Units, FV LTIP Units and BPR Units. |
NOI is a key indicator of our ability to impact the operating performance of our properties. We seek to grow NOI through pro-active management and leasing of our properties. Same-property NOI in our Core Office and Core Retail segments allows us to segregate the impact of leasing and operating initiatives on the portfolio from the impact of investing activities and “one-time items”, which for the historical periods presented consist primarily of lease termination income. We reconcile NOI to net income on page 71.
We also consider FFO an important measure of our operating performance. FFO is a widely recognized measure that is frequently used by securities analysts, investors and other interested parties in the evaluation of real estate entities, particularly those that own and operate income producing properties. Our definition of FFO includes all of the adjustments that are outlined in the National Association of Real Estate Investment Trusts (“NAREIT”) definition of FFO, including the exclusion of gains (or losses) from the sale of investment properties, the add back of any depreciation and amortization related to real estate assets and the adjustment for unconsolidated partnerships and joint ventures. In addition to the adjustments prescribed by NAREIT, we also make adjustments to exclude any unrealized fair value gains (or losses) that arise as a result of reporting under IFRS, and income taxes that arise as certain of our subsidiaries are structured as corporations as opposed to real estate investment trusts (“REITs”). These additional adjustments result in an FFO measure that is similar to that which would result if our partnership was organized as a REIT that determined net income in accordance with generally accepted accounting principles in the United States (“U.S. GAAP”), which is the type of organization on which the NAREIT definition is premised. Our FFO measure will differ from other organizations applying the NAREIT definition to the extent of certain differences between the IFRS and U.S. GAAP reporting frameworks, principally related to the timing of revenue recognition from lease terminations and sale of properties. Because FFO excludes fair value gains (losses), including equity accounted fair value gains (losses), realized gains (losses) on the sale of investment properties, depreciation and amortization of real estate assets and income taxes, it provides a performance measure that, when compared year-over-year, reflects the impact on operations from trends in occupancy rates, rental rates, operating costs and interest costs, providing perspective not immediately apparent from net income. We do not use FFO as a measure of cash flow generated from operating activities. We reconcile FFO to net income on page 71 as we believe net income is the most comparable measure.
In addition, we consider Company FFO a useful measure for securities analysts, investors and other interested parties in the evaluation of our partnership’s performance. Company FFO, similar to FFO discussed above, provides a performance measure that reflects the impact on operations of trends in occupancy rates, rental rates, operating costs and interest costs. In addition, the adjustments to Company FFO relative to FFO allow the partnership insight into these trends for the real estate operations, by adjusting for non-real estate components. We reconcile net income to Company FFO on page 71.
Net income attributable to Unitholders and Equity attributable to Unitholders are used by the partnership to evaluate the performance of the partnership as a whole as each of the Unitholders participates in the economics of the partnership equally. We reconcile Net income attributable to Unitholders to net income on page 71 and Equity attributable to Unitholders to total equity on page 74.
- 61 -
FAIR VALUE OF INVESTMENT AND HOSPITALITY PROPERTIES
Investment properties
We measure all investment properties at fair value, including those held within equity accounted investments. Valuations are prepared at a balance sheet date with changes to those values recognized as gains or losses in the statement of income. Our valuations are generally prepared at the individual property level by internal investment professionals with the appropriate expertise in the respective industry, geography and asset type. We leverage their extensive expertise and experience in the valuation of properties accumulated through involvement in acquisitions and dispositions, negotiations with lenders and interactions with institutional private fund investors. Additionally, a number of properties are externally appraised each year and the results of those appraisals are compared to the partnership’s internally prepared values.
Substantially all of our investment properties are valued using one of two accepted income approaches, the discounted cash flow approach or the direct capitalization approach. The valuation methodology utilized is generally determined by asset class. Our office and retail assets are typically valued using a discounted cash flow methodology while our multifamily, self-storage, triple net lease, manufactured housing, student housing, and logistics assets are typically valued using a direct capitalization methodology.
Under the discounted cash flow approach, cash flows for each property are forecast for an assumed holding period, generally, ten-years. A capitalization rate is applied to the terminal year net operating income and an appropriate discount rate is applied to those cash flows to determine a value at the reporting date. The forecast cash flows include assumptions prepared at the property level for lease renewal probabilities, downtime, capital expenditures, future leasing rates and associated leasing costs. The majority of property cash flows consist of contracted leases as a result of our core real estate portfolio having a combined 94.8% occupancy level and an average seven year lease life. Valuation assumptions, such as discount rates and terminal value multiples, are determined by the relevant investment professionals and applied to the cash flows to determine the values.
Under the direct capitalization method, a capitalization rate is applied to estimated stabilized annual net operating income to determine value. Capitalization rates are determined by our investment professionals based on market data from comparable transactions and third-party reports.
Hospitality properties
Hospitality properties are valued annually at December 31 with increases in fair value generally recognized as revaluation surplus in the statement of comprehensive income, unless the increase reverses a previously recognized revaluation loss recorded through prior period net income. Our hospitality properties are valued on an individual location basis using a depreciated replacement cost approach. These valuations are generally prepared by external valuation professionals using information provided by management of the operating business. The fair value estimates for hospitality properties represent the estimated fair value of the property, plant and equipment of the hospitality business only and do not include any associated intangible assets.
Valuation methodology
All of our valuations are subject to various layers of review and controls as part of our financial reporting processes. These controls are part of our system of internal control over financial reporting that is assessed by management on an annual basis. Under the discounted cash flow model, the base cash flows are determined as part of our annual business planning process, prepared within each operating business and reviewed by the senior management teams responsible for each segment, along with senior investment professionals responsible for the relevant asset classes. Valuation assumptions such as discount rates and terminal capitalization rates are compared to market data, third party reports, research material and broker opinions as part of the review process.
External valuations
We have a number of properties externally appraised each year to support our valuation process and for other business purposes. We compare the results of those external appraisals to our internally prepared values and reconcile significant differences when they arise. During 2019, we obtained 203 external appraisals of our properties representing a gross property value of $55 billion (or 27% of the portfolio). These external appraisals were within 1% of management’s valuations. Also, each year we sell a number of assets, which provides support for our valuations, as we typically contract at prices comparable to our IFRS values.
- 62 -
FINANCIAL STATEMENTS ANALYSIS
REVIEW OF CONSOLIDATED FINANCIAL RESULTS
In this section, we review our consolidated performance for the years ended December 31, 2019, 2018, and 2017 and our financial position as of December 31, 2019, and 2018. Further details on our results from operations and our financial position are contained within the “Segment Performance” section on page 76.
The following acquisitions and dispositions of consolidated properties affected our consolidated results in the comparative periods for the years ended December 31, 2019, 2018, and 2017:
In our Core Office segment:
| • | In the fourth quarter of 2019, we acquired an incremental 50% interest in One and Two London Wall Place in London for approximately £177 million ($229 million) and as a result, gained control. These assets were previously accounted for under the equity method and are now consolidated. |
| • | In the fourth quarter of 2019, we sold our interest in Jessie Street Centre in Sydney for approximately A$412 million ($282 million) and a realized gain of approximately A$82 million ($56 million). |
| • | In the third quarter of 2019, we sold our interest in the Darling Park office complex in Sydney for approximately A$638 million ($438 million) and a realized gain of approximately A$247 million ($169 million). We sold 3 Spring Street in Sydney for approximately A$173 million ($119 million) and a realized gain of approximately A$98 million ($67 million). |
| • | In the second quarter of 2019, we sold our interest in 2001 M Street in Washington, D.C. for approximately $121 million and a realized gain of approximately $32 million. |
| • | In the fourth quarter of 2018, we sold 10 Shelley Street in Sydney for A$533 million ($379 million) and a realized gain of A$149 million ($104 million). We sold 12 Shelley Street in Sydney for A$270 million ($192 million) and a realized gain of A$111 million ($78 million). We sold Queen’s Quay Terminal in Toronto for C$261 million ($191 million) and a realized gain of C$173 million ($127 million). We sold our 25% interest in Jean Edmonds Tower in Ottawa for C$47 million ($34 million) and a realized gain of C$5 million ($4 million). |
| • | In the fourth quarter of 2018, we launched Brookfield Premier Real Estate Partners Pooling LLC Australia (“BPREP Australia”), an open-ended fund. We contributed interests in Jessie Street, 52 Goulburn Street and 680 George Street in Sydney and 235 St Georges Terrace in Perth to BPREP Australia. Our interest in BPREP Australia is 39%, with the remaining interest of 61% held by external investors. We continue to consolidate the properties contributed to BPREP Australia, except for 680 George Street, which we continue to account for under the equity method. |
| • | In the third quarter of 2018, we acquired a development in the South Bronx, New York for consideration of $166 million. |
| • | In the third quarter of 2018, we sold 27.5% of our interest in a portfolio of operating and development assets in New York. We retain control over and continue to consolidate these assets after the sale. The interest was sold to Brookfield Asset Management. |
| • | In the first quarter of 2018, we acquired 333 West 34th Street in New York for $255 million through a joint venture with Brookfield Premier Real Estate Partners Pooling LLC (“BPREP”). |
| • | In the first quarter of 2018, we sold a 50% interest in Bay Adelaide Centre East and West Towers in Toronto for approximately C$850 million ($660 million) and we sold our interest in 1801 California Street in Denver for $286 million. |
In our Core Retail segment:
| • | In the fourth quarter of 2019, we acquired our joint venture partner’s incremental interest in four properties including Park Meadows in Colorado, Towson Town Center in Maryland, Perimeter Mall in Georgia, and Shops at Merrick Park in Florida, bringing our ownership in each of the malls to 100%. Concurrently, we sold our interest in Bridgewater Commons in New Jersey to the joint venture partner. Prior to the acquisition of the four assets, our joint venture interest was accounted for under the equity method and is now consolidated. |
| • | In the third quarter of 2019, we acquired an incremental 49.7% interest in 730 Fifth Avenue in New York for approximately $779 million. Prior to the acquisition, our 50% joint venture interest was reflected as an equity accounted investment. As a result of the acquisition, we gained control of the investment and consolidated its results. |
- 63 -
| • | In the fourth quarter of 2018, we sold a 49% interest in Fashion Place in Utah for approximately $291 million. We retained joint control of the resulting joint venture and continue to account for our remaining interest as an equity accounted investment. |
| • | On August 28, 2018, we acquired all of the outstanding shares of common stock of GGP Inc. (“GGP acquisition”) other than those shares previously held by the partnership and our affiliates, which represented a 34% interest in GGP Inc. (“GGP”) prior to the acquisition. We consolidated the results of BPR beginning August 28, 2018. The previous investment, which was reflected as an equity accounted investment, was derecognized at the time of acquisition. |
In our LP Investments segment:
| • | In the fourth quarter of 2019, we sold five multifamily assets in the United States in the Brookfield Strategic Real Estate Partners I (“BSREP I”) fund for approximately $1.1 billion and a realized gain of approximately $203 million. |
| • | In the third quarter of 2019, we sold a portfolio of triple-net lease assets in the United States in the BSREP I fund, for approximately $585 million and a realized gain of approximately $36 million. |
| • | In the second quarter of 2019, we sold a portfolio of office assets in California in the BSREP I fund, for approximately $270 million and a realized gain of approximately $114 million. |
| • | In the first quarter of 2019, BSREP III held its final close with total equity commitments of $15 billion. Prior to final close, we had committed to 25%, or a controlling interest in the fund and as a result, had previously consolidated the investments made to date. Upon final close, on January 31, 2019, we reduced our commitment to $1.0 billion, representing a 7% non-voting position. As a result, we lost control and deconsolidated our investment in the fund. |
| • | In the fourth quarter of 2018, we sold a logistics portfolio in the United States in the BSREP I fund for approximately $3.4 billion and a realized gain of approximately $1.1 billion. |
| • | In the fourth quarter of 2018, in the BSREP III fund, we acquired a portfolio of mixed-use assets across the United States (“Forest City acquisition”) for consideration of $6,948 million, a student housing portfolio in France for consideration of €279 million ($318 million) and a hotel in Florida for consideration of $222 million. These investments were deconsolidated in 2019 as mentioned above. |
| • | In the third quarter of 2018, in the BSREP III fund, we acquired a 100% leasehold interest in 660 Fifth Avenue, a commercial office asset in New York, for consideration of $1,299 million, and two community malls in Shanghai for consideration of C¥728 million ($110 million). These investments were deconsolidated in 2019 as mentioned above. |
| • | In the third quarter of 2018, we sold a portfolio of 112 self-storage properties in the BSREP II fund for approximately $1.3 billion and realized a gain of approximately $292 million. |
| • | In the second quarter of 2018, in the BSREP II fund, we acquired an office building in Chicago for consideration of $35 million and an office portfolio in Mumbai for consideration of ₨2,726 million ($41 million). |
| • | In the first quarter of 2018, in the BSREP II fund, we acquired a portfolio of extended stay hotels across the United States for consideration of $764 million, a portfolio of student housing properties in the United Kingdom for consideration of £518 million ($739 million) and a United Kingdom based owner and operator of serviced apartments for consideration of £209 million ($287 million). |
| • | In the first quarter of 2018, we sold the Hard Rock Hotel and Casino in Las Vegas for $510 million. |
For the purposes of the following comparison discussion between the years ended December 31, 2019 and December 31, 2018, the above transactions are referred to as the investment activities. In addition to the investment activities, we will use same-property NOI from our Core Office and Core Retail segments to evaluate our operating results.
For the comparison discussions between the years ended December 31, 2018 and December 31, 2017, please refer to Item 5. “Operating and Financial Review and Prospects” of our Annual Report on Form 20-F for the year ended December 31, 2018, filed with the SEC on March 1, 2019.
- 64 -
Summary of Operating Results
| (US$ Millions) | 2019 | 2018 | 2017 | ||||||
| Net income | $ | 3,157 | $ | 3,654 | $ | 2,468 | |||
Net income attributable to Unitholders(1) | 1,956 | 1,978 | 375 | ||||||
NOI(1) | 4,414 | 3,869 | 3,144 | ||||||
FFO(1) | 1,147 | 866 | 873 | ||||||
Company FFO(1) | 1,345 | 1,179 | 1,017 | ||||||
(1) | This is a non-IFRS measure our partnership uses to assess the performance of its operations as described in the “Performance Measures” section on page 60. An analysis of the measures and reconciliation to IFRS measures is included in the “Reconciliation of Non-IFRS measures” section on page 71. |
Net income for the year ended December 31, 2019 decreased to $3,157 million from $3,654 million during 2018. Net income per unit attributable to Unitholders for the year ended December 31, 2019 was $1.89 compared with $2.28 during 2018. The decrease is primarily attributable to fair value losses recognized on our Core Retail portfolio in the current year, reflecting updated cashflow assumptions and valuation metrics, as compared to gains recognized in 2018. These decreases were partially offset by a full year of NOI from the GGP acquisition compared to four months of NOI in the prior year. Additionally, the prior year benefited from fair value gains associated with our since-sold logistics portfolio in the United States, our office portfolio in India and a gain on extinguishment of debt associated with the sale of a hospitality asset.
FFO increased to $1,147 million for the year ended December 31, 2019 from $866 million in 2018. The increase was driven by incremental NOI from GGP as mentioned above, strong same-property growth in our Core Office segment and lower transactions costs as compared to prior year, which were largely associated with the acquisitions of GGP and Forest City Realty Inc. (“Forest City”). These increases were partially offset by higher interest expense and general and administrative costs due to the GGP acquisition and other investment activities as well as the negative impact of foreign currency translation.
Operating Results
| (US$ Millions) Years ended Dec. 31, | 2019 | 2018 | 2017 | ||||||
| Commercial property revenue | $ | 5,691 | $ | 5,043 | $ | 4,192 | |||
| Hospitality revenue | 1,909 | 1,913 | 1,648 | ||||||
| Investment and other revenue | 603 | 283 | 295 | ||||||
| Total revenue | 8,203 | 7,239 | 6,135 | ||||||
| Direct commercial property expense | 1,967 | 1,851 | 1,617 | ||||||
| Direct hospitality expense | 1,219 | 1,236 | 1,079 | ||||||
| Investment and other expense | 82 | 26 | 138 | ||||||
| Interest expense | 2,924 | 2,464 | 1,967 | ||||||
| Depreciation and amortization | 341 | 308 | 275 | ||||||
| General and administrative expense | 882 | 1,032 | 614 | ||||||
| Total expenses | 7,415 | 6,917 | 5,690 | ||||||
| Fair value gains, net | 596 | 2,466 | 1,254 | ||||||
| Share of net earnings from equity accounted investments | 1,969 | 947 | 961 | ||||||
| Income before income taxes | 3,353 | 3,735 | 2,660 | ||||||
| Income tax expense | 196 | 81 | 192 | ||||||
| Net income | 3,157 | 3,654 | 2,468 | ||||||
Net income attributable to non-controlling interests of others in operating subsidiaries and properties | 1,201 | 1,676 | 2,093 | ||||||
Net income attributable to Unitholders(1) | $ | 1,956 | $ | 1,978 | $ | 375 | |||
(1) | This is a non-IFRS measure our partnership uses to assess the performance of its operations as described in the “Performance Measures” section on page 60. An analysis of the measures and reconciliation to IFRS measures is included in the “Reconciliation of Non-IFRS measures” section starting on page 71. |
- 65 -
Our basic and diluted net income per unit attributable to Unitholders and weighted average units outstanding are calculated as follows:
| (US$ Millions, except per unit information) Years ended Dec. 31, | 2019 | 2018 | 2017 | ||||||
| Net income | $ | 3,157 | $ | 3,654 | $ | 2,468 | |||
| Less: Non-controlling interests | 1,201 | 1,676 | 2,093 | ||||||
| Less: Preferred unit dividends | 15 | — | — | ||||||
Net income attributable to Unitholders – basic(1) | 1,941 | 1,978 | 375 | ||||||
Dilutive effect of conversion of capital securities – corporate and options(2) | 8 | 27 | — | ||||||
| Net income attributable to Unitholders – diluted | 1,949 | 2,005 | 375 | ||||||
Weighted average number of units outstanding – basic(1) | 1,025.0 | 866.9 | 774.7 | ||||||
Conversion of capital securities – corporate and options(2) | 6.7 | 18.5 | 1.2 | ||||||
| Weighted average number of units outstanding – diluted | 1,031.7 | 885.4 | 775.9 | ||||||
Net income attributable to Unitholders per unit – basic(1)(3) | $ | 1.89 | $ | 2.28 | $ | 0.48 | |||
Net income attributable to Unitholders per unit – diluted(2)(3) | $ | 1.89 | $ | 2.26 | $ | 0.48 | |||
(1) | Basic net income attributable to Unitholders per unit requires the inclusion of preferred shares of the Operating Partnership that are mandatorily convertible into LP Units without an add back to earnings of the associated carry on the preferred shares. |
(2) | The effect of the conversion of capital securities is anti-dilutive for the year ended December 31, 2017. |
(3) | Net income attributable to Unitholders is a non-IFRS measure as described in the “Performance Measures” section on page 60. |
Commercial property revenue and direct commercial property expense
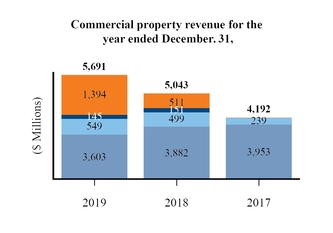
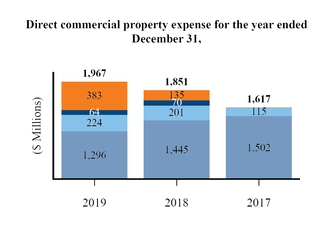
 |  |  | ||
In 2019, commercial property revenue increased by $648 million compared to 2018 due to the GGP acquisition and same-property growth in our Core Office segment. The GGP acquisition contributed $1,394 million to commercial property revenue as compared to $511 million in 2018 as the GGP acquisition closed in the third quarter of 2018. The results for GGP prior to the transaction were accounted for under the equity method. Our Core Office portfolio generated 7% same-property growth, largely driven by leasing activity in Downtown New York and Toronto. Same-property growth in our Core Office segment contributed $73 million over 2018. These increases were partially offset by the disposition of mature assets and the deconsolidation of certain assets following partial dispositions in addition to the negative impact of foreign currency translation.
Direct commercial property expense increased by $116 million largely due to additional expenses relating to the GGP acquisition and property transactions. Margins in 2019 were 65.4%; an improvement of 3.4% compared to 2018 and an improvement of 6.5% compared to 2017.
Commercial property NOI increased to $3,724 million for the year ended December 31, 2019 compared with $3,192 million during 2018. The increase was primarily driven by the GGP acquisition and same-property growth offset by the disposition of mature assets, the deconsolidation of certain assets and the negative impact of foreign currency translation as mentioned above.
- 66 -
Hospitality revenue and direct hospitality expense
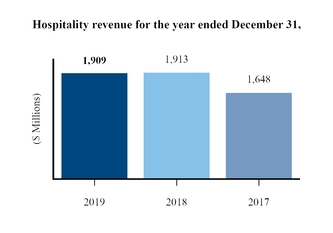

Hospitality revenue decreased slightly to $1,909 million for the year ended December 31, 2019 from $1,913 million in 2018. Direct hospitality expense decreased slightly to $1,219 million in 2019 from $1,236 million in 2018. Margins were 36.1% in 2019, an improvement of 2.1% over 2018 and 4.7% over 2017.
Hospitality NOI was relatively flat at $690 million for the year ended December 31, 2019 compared to $677 million during the same period in the prior year. The slight increase is primarily due to investment activity partially offset by dispositions, the deconsolidation of BSREP III investments and the negative impact of foreign currency translation.
Investment and other revenue and investment and other expense
Investment and other revenue includes management fees, leasing fees, development fees, interest income and other non-rental revenue. Investment and other revenue increased by $320 million for the year ended December 31, 2019 as compared to the prior year. The increase is primarily due to $195 million of investment and other revenue from Core Retail compared to $73 million in the prior year, primarily consisting of fee revenues earned from our joint ventures arrangements from the GGP acquisition. Also contributing to the increase is higher development management and joint venture partner fees within Core Office as development activity has increased and we have entered into new joint venture arrangements that contribute fees. Additionally, we earned a performance-based fee of $51 million for achieving certain milestones at Five Manhattan West during the current year and earned revenue associated with the sale of develop-for-sale assets in our multifamily portfolio.
Investment and other expense increased by $56 million for the year ended December 31, 2019 as compared to the prior year. The increase is due to expenses associated with the sale of develop-for-sale assets in our multifamily portfolio.
Interest expense
Interest expense increased by $460 million for the year ended December 31, 2019 as compared to the prior year. This increase was primarily due to the assumption of debt obligations and the acquisition debt incurred in connection with the acquisition of GGP. Additionally, interest expense from other property acquisitions and corporate bond issuances contributed to the increase, partially offset by disposition activity, the deconsolidation of our interests in investments held in BSREP III and lower average revolving corporate debt balances.
General and administrative expense
General and administrative expense decreased by $150 million for the year ended December 31, 2019 compared to the prior year. The decrease was due to the deconsolidation of BSREP III investments which had general and administrative expense of $11 million for the year ended December 31, 2019 compared to $348 million in the same period in the prior year, which was primarily due to transaction and operating costs from Forest City in the prior year. Also contributing to the decrease were lower transactions costs relating to the GGP acquisition. These decreases were partially offset by a full year of operating costs related to the GGP acquisition, as compared to four months in the prior year and investment activity. The consolidation of GGP resulted in general and administrative expense of $258 million for the year ended December 31, 2019 as compared to $89 million in the same period in the prior year, when we had four months of consolidated results for GGP.
- 67 -
Fair value gains, net
Fair value gains, net includes valuation gains (losses) on commercial properties and developments as well as mark-to-market adjustments on financial instruments and derivatives and foreign currency gains (losses) on disposal of assets denominated in foreign currencies. While we measure and record our commercial properties and developments using valuations prepared by management in accordance with our policy, external appraisals and market comparables, when available, are used to support our valuations.
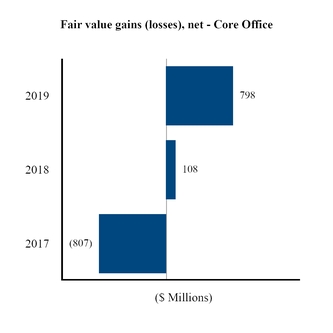
Fair value gains, net for our Core Office segment were $798 million for the year ended December 31, 2019 which primarily relate to gains at 100 Bishopsgate in London as the development nears substantial completion, fair value gains in Brazil due to improved market outlook and historically low interest rates and fair value gains in Australia due to capitalization rate compression supported by improving market conditions. Additionally, there were gains recognized in the first quarter of 2019 within our New York portfolio to reflect market conditions. Fair value gains, net for our Core Office segment in the year ended December 31, 2018 were $108 million. These gains primarily related to our Sydney and Toronto portfolios based on market transactions and leasing activity, and gains from disposition of an interest in Bay Adelaide Centre East and West Towers in Toronto and 1801 California Street in Denver. These gains were partially offset by losses in our Downtown New York portfolio. |

Fair value losses, net for our Core Retail segment were $686 million for the year ended December 31, 2019. The losses reflect updated cashflow assumptions and valuation metrics. Fair value gains, net of $412 million were recognized for Core Retail for the year ended December 31, 2018, and were attributable to a bargain gain recognized on the GGP acquisition. |
- 68 -
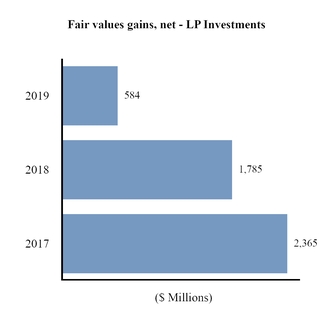
Fair value gains, net for our LP Investments segment for the year ended December 31, 2019 were $584 million primarily due to our office portfolio in Brazil which benefited from discount rate compression due to improved market conditions and historically low interest rates and our India and student housing portfolios which benefited from capitalization rate compression. These gains were partially offset by fair value losses, net from our retail portfolio as result of lower capitalization rates and updated cashflows. Fair value gains, net for the LP Investments segment in 2018 was $1,785 million. Total net gains were attributable to the sale of our U.S. logistics portfolio in the fourth quarter of 2018 and due to leasing activity in our India office portfolio. Gains were also recognized from the completion of several developments during the period as well as the sale of a self-storage portfolio. In the second quarter of 2018, we recorded a gain on extinguishment of debt associated with the sale of the Hard Rock Hotel and Casino. These increases were partially offset by fair value losses on our retail portfolio. |
In addition, we recorded fair value losses of $100 million (December 31, 2018 - fair value gains of $161 million and December 31, 2017 - fair value losses of $36 million), related to mark-to-market adjustments of financial instruments and the settlement of derivative contracts during the quarter. The prior year gains related to obtaining control over Brookfield Global Real Estate Special Opportunities Inc. (“BGRESOI”) after converting our loan interest in the entity and becoming the 100% common equity holder.
- 69 -
Share of net earnings from equity accounted investments
Our most significant equity accounted investments are Canary Wharf and Manhattan West in our Core Office sector, Ala Moana Center in Hawaii, Fashion Show and Grand Canal Shoppes in Las Vegas in our Core Retail segment and our interest in the retail fund in Brazil in our LP Investments segment.
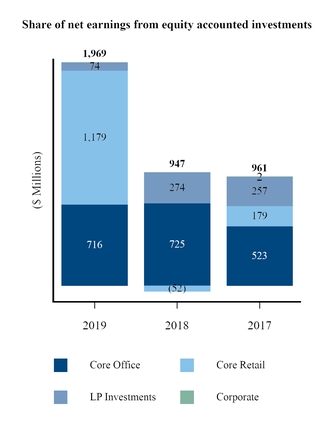
Our share of net earnings from equity accounted investments for the year ended December 31, 2019 was $1,969 million, which represents an increase of $1,022 million, compared to the prior year. The increase was primarily due to Core Retail fair value gains recognized at 730 Fifth Avenue, prior to our additional interest acquired in the third quarter of 2019 which resulted in consolidation, and Ala Moana Center in the second quarter of 2019. This increase was partially offset by a lower share of net earnings from equity accounted investments from LP Investments mainly due to the disposition of a logistics portfolio in the fourth quarter of 2018. |
Income tax expense (benefit)
The increase in income tax expense for the year ended December 31, 2019 is primarily due to the reversal of deferred tax liabilities relating to legislative and entity tax status change, an internal restructuring of the ownership of certain retail investments and the recognition of previously unrecognized net operating losses occurring in 2018.
- 70 -
Reconciliation of Non-IFRS measures
As described in the “Performance Measures” section on page 60, our partnership uses non-IFRS measures to assess the performance of its operations. An analysis of the measures and reconciliation to IFRS measures is included below.
The following table reconciles net income to NOI for the years ended December 31, 2019, 2018, and 2017:
| (US$ Millions) Years ended Dec. 31, | 2019 | 2018 | 2017 | ||||||
| Commercial property revenue | $ | 5,691 | $ | 5,043 | $ | 4,192 | |||
| Direct commercial property expense | (1,967 | ) | (1,851 | ) | (1,617 | ) | |||
| Commercial property NOI | 3,724 | 3,192 | 2,575 | ||||||
| Hospitality revenue | 1,909 | 1,913 | 1,648 | ||||||
| Direct hospitality expense | (1,219 | ) | (1,236 | ) | (1,079 | ) | |||
| Hospitality NOI | 690 | 677 | 569 | ||||||
| Total NOI | 4,414 | 3,869 | 3,144 | ||||||
| Investment and other revenue | 603 | 283 | 295 | ||||||
| Share of net earnings from equity accounted investments | 1,969 | 947 | 961 | ||||||
| Interest expense | (2,924 | ) | (2,464 | ) | (1,967 | ) | |||
| Depreciation and amortization | (341 | ) | (308 | ) | (275 | ) | |||
| General and administrative expenses | (882 | ) | (1,032 | ) | (614 | ) | |||
| Investment and other expense | (82 | ) | (26 | ) | (138 | ) | |||
| Fair value gains, net | 596 | 2,466 | 1,254 | ||||||
| Income before income taxes | 3,353 | 3,735 | 2,660 | ||||||
| Income tax (expense) benefit | (196 | ) | (81 | ) | (192 | ) | |||
| Net income | 3,157 | 3,654 | 2,468 | ||||||
| Net income attributable to non-controlling interests of others in operating subsidiaries and properties | 1,201 | 1,676 | 2,093 | ||||||
| Net income attributable to Unitholders | $ | 1,956 | $ | 1,978 | $ | 375 | |||
The following table reconciles net income to FFO and Company FFO for the years ended December 31, 2019, 2018, and 2017:
| (US$ Millions) Years ended Dec. 31, | 2019 | 2018 | 2017 | ||||||
| Net income | $ | 3,157 | $ | 3,654 | $ | 2,468 | |||
| Add (deduct): | |||||||||
| Fair value gains, net | (596 | ) | (2,466 | ) | (1,254 | ) | |||
| Share of equity accounted fair value gains, net | (1,055 | ) | (114 | ) | (82 | ) | |||
| Depreciation and amortization of real-estate assets | 283 | 264 | 244 | ||||||
| Income tax expense (benefit) | 196 | 81 | 192 | ||||||
| Non-controlling interests in above items | (838 | ) | (553 | ) | (695 | ) | |||
| FFO | 1,147 | 866 | 873 | ||||||
| Add (deduct): | |||||||||
Depreciation and amortization of real-estate assets, net(1) | 40 | 35 | 27 | ||||||
Transaction costs, net(1) | 96 | 221 | 41 | ||||||
Gains/losses associated with non-investment properties, net(1) | (1 | ) | 6 | — | |||||
Imputed interest(2) | 49 | 51 | 38 | ||||||
Net contribution from GGP warrants(3) | — | — | 38 | ||||||
BSREP III earnings(4) | 14 | — | — | ||||||
| Company FFO | $ | 1,345 | $ | 1,179 | $ | 1,017 | |||
(1) | Presented net of non-controlling interests. |
(2) | Represents imputed interest associated with financing the partnership’s share of commercial developments accounted for under the equity method. |
(3) | Represents incremental FFO that would have been attributable to the partnership’s share of GGP, if all outstanding warrants of GGP had been exercised. Prior to the third quarter of 2017, the adjustment assumed net settlement of the outstanding warrants. For the third quarter of 2017, the adjustment is based on the cash settlement for all applicable warrants to reflect the partnership's settlement of the warrants on such basis which occurred in the fourth quarter of 2017. |
(4) | BSREP III is now accounted for as a financial asset which results in FFO being recognized in line with distributions received. As such, the BSREP III earnings adjustment picks up our proportionate share of the Company FFO. |
- 71 -
Summary of Financial Position
| (US$ Millions, except per unit information) | Dec. 31, 2019 | Dec. 31, 2018 | ||||
| Investment properties: | ||||||
| Commercial properties | $ | 71,565 | $ | 76,014 | ||
| Commercial developments | 3,946 | 4,182 | ||||
| Equity accounted investments | 20,764 | 22,698 | ||||
| Property, plant and equipment | 7,278 | 7,506 | ||||
| Cash and cash equivalents | 1,438 | 3,288 | ||||
| Assets held for sale | 387 | 1,004 | ||||
| Total assets | 111,643 | 122,520 | ||||
| Debt obligations | 55,390 | 63,811 | ||||
| Liabilities associated with assets held for sale | 140 | 163 | ||||
| Total equity | 44,935 | 46,740 | ||||
Equity attributable to Unitholders(1) | $ | 28,530 | $ | 28,284 | ||
Equity per unit(2) | $ | 29.72 | $ | 28.72 | ||
(1) | Equity attributable to Unitholders is a non-IFRS measure as described in the “Performance Measures” section on page 60. |
(2) | Assumes conversion of mandatorily convertible preferred shares. See page 74 for additional information. |
As of December 31, 2019, we had $111,643 million in total assets, compared with $122,520 million at December 31, 2018. The decrease of $10,877 million was primarily due to the deconsolidation of BSREP III investments upon reducing our commitment to the fund on final close, which resulted in loss of control; our commitment to the fund is 7% compared to 25% at December 31, 2018.
Commercial properties represent operating, rent-producing properties. Commercial properties decreased from $76,014 million at the end of 2018 to $71,565 million at the end of the current year. The decrease was largely due to the deconsolidation of BSREP III investments, the full or partial disposition of certain assets during the current year and valuation losses within our retail portfolio. These decreases were partially offset by the impact of the adoption of IFRS 16, Leases (“IFRS 16”) which requires the recognition of right-of-use asset and resulted in $752 million of assets recorded at December 31, 2019. Additionally, investment activity, incremental capital spent to maintain or enhance our properties, valuation gains within our Core Office and LP Investments portfolios and the positive impact of foreign currency translation based on closing spot rates, contributed to the offset.
Commercial developments consist of commercial property development sites, density rights and related infrastructure. The total fair value of development land and infrastructure was $3,946 million at December 31, 2019, a decrease of $236 million from the balance at December 31, 2018. The decrease is primarily due to the partial sale of several development assets into the Brookfield Opportunity Zone fund (“BOZ”) in 2019, which resulted in the deconsolidation of our interest in these assets and subsequent accounting classification as a financial asset. Additionally, the deconsolidation of BSREP III investments contributed to the decrease. These decreases were partially offset by incremental capital spend on our active developments, gains recognized at 100 Bishopsgate in London and other developments as they near completion and the positive impact of foreign currency translation.
- 72 -
The following table presents the changes in investment properties from December 31, 2018 to December 31, 2019:
| Dec. 31, 2019 | ||||||
| (US$ Millions) | Commercial properties | Commercial developments | ||||
| Investment properties, beginning of year | $ | 76,014 | $ | 4,182 | ||
| Acquisitions | 6,797 | 246 | ||||
| Capital expenditures | 1,540 | 1,229 | ||||
Accounting policy change(1) | 704 | 22 | ||||
Dispositions(2) | (742 | ) | (37 | ) | ||
| Fair value gains, net | 301 | 557 | ||||
| Foreign currency translation | 69 | 72 | ||||
| Transfer between commercial properties and commercial developments | 354 | (354 | ) | |||
Impact of deconsolidation due to loss of control(3) | (10,701 | ) | (798 | ) | ||
| Reclassifications to assets held for sale and other changes | (2,771 | ) | (1,173 | ) | ||
| Investment properties, end of year | $ | 71,565 | $ | 3,946 | ||
(1) | Includes the impact of the adoption of IFRS 16 through the recognition of right-of-use assets. See Note 2, Summary of Significant Accounting Policies for further information. |
(2) | Property dispositions represent the carrying value on date of sale. |
(3) | Includes the impact of the deconsolidation of BSREP III investments. See Note 5, Investment Properties for further information. |
Equity accounted investments decreased by $1,934 million since December 31, 2018 primarily as a result of the deconsolidation of BSREP III during the first quarter of 2019, and the associated interests in properties held through joint ventures, primarily through Forest City.
The following table presents a roll-forward of changes in our equity accounted investments:
| (US$ Millions) | Dec. 31, 2019 | ||
| Equity accounted investments, beginning of year | $ | 22,698 | |
| Additions | 684 | ||
| Disposals and return of capital distributions | (764 | ) | |
| Share of net earnings from equity accounted investments | 1,969 | ||
| Distributions received | (470 | ) | |
| Foreign currency translation | 127 | ||
| Reclassification to assets held for sale | (189 | ) | |
Impact of deconsolidation due to loss of control(1) | (1,434 | ) | |
Other(2) | (1,857 | ) | |
| Equity accounted investments, end of year | $ | 20,764 | |
(1) | Includes the impact of the deconsolidation of BSREP III investments. See Note 5, Investment Properties for further information. |
(2) | Includes the impact of the acquisition of incremental interest in our existing equity accounted investments, primarily in Core Retail. As a result, we gained control of the investments and will consolidate its results. See Note 7, Equity Accounted Investments for further information. |
Property, plant and equipment decreased by $228 million since December 31, 2018, primarily due to deconsolidation of BSREP III investments, which includes a portfolio of serviced apartments in the United Kingdom and two hotel properties in Florida. These decreases were offset by capital spend during the current year, the impact of IFRS 16 requiring the recognition of right-of-use property, plant and equipment and the positive impact of foreign currency translation.
As of December 31, 2019, assets held for sale primarily included our equity accounted investment in a hotel in Florida, an office asset in California and six triple net lease assets in United States.
- 73 -
The following table presents changes in our assets held for sale from December 31, 2018 to December 31, 2019:
| (US$ Millions) | Dec. 31, 2019 | ||
| Balance, beginning of year | $ | 1,004 | |
| Reclassification to/(from) assets held for sale, net | 3,387 | ||
| Disposals | (4,038 | ) | |
| Fair value adjustments | 14 | ||
| Foreign currency translation | (5 | ) | |
| Other | 25 | ||
| Assets held for sale | $ | 387 | |
Our debt obligations decreased to $55,390 million as at December 31, 2019 from $63,811 million as at December 31, 2018. Contributing to this decrease was the deconsolidation of BSREP III due to loss of control as mentioned above. Also contributing to the decrease was a paydown of the partnership’s credit facilities. These decreases were partially offset by the addition of property-specific borrowings and senior secured notes during the period and the positive impact of foreign currency translation.
The following table presents additional information on our partnership’s outstanding debt obligations:
| (US$ Millions) | Dec. 31, 2019 | Dec. 31, 2018 | ||||
| Corporate borrowings | $ | 1,902 | $ | 2,159 | ||
| Funds subscription facilities | 57 | 4,517 | ||||
| Non-recourse borrowings: | ||||||
| Property-specific borrowings | 47,465 | 50,406 | ||||
| Subsidiary borrowings | 5,966 | 6,729 | ||||
| Total debt obligations | 55,390 | 63,811 | ||||
| Current | 8,825 | 5,874 | ||||
| Non-current | 46,565 | 57,937 | ||||
| Total debt obligations | $ | 55,390 | $ | 63,811 | ||
The following table presents the components used to calculate equity attributable to Unitholders per unit:
| (US$ Millions, except unit information) | Dec. 31, 2019 | Dec. 31, 2018 | ||||
| Total equity | $ | 44,935 | $ | 46,740 | ||
| Less: | ||||||
| Interests of others in operating subsidiaries and properties | 15,985 | 18,456 | ||||
| Preferred equity | 420 | — | ||||
| Equity attributable to Unitholders | 28,530 | 28,284 | ||||
| Mandatorily convertible preferred shares | 1,650 | 1,622 | ||||
| Total equity attributable to unitholders | 30,180 | 29,906 | ||||
| Partnership units | 945,413,656 | 971,144,432 | ||||
| Mandatorily convertible preferred shares | 70,051,024 | 70,038,910 | ||||
| Total partnership units | 1,015,464,680 | 1,041,183,342 | ||||
| Total equity attributable to Unitholders per unit | $ | 29.72 | $ | 28.72 | ||
Equity attributable to Unitholders was $28,530 million at December 31, 2019, an increase of $246 million from the balance at December 31, 2018. The increase was primarily due to net income during the year partially offset by repurchases of LP Units and BPR Units and distributions. Assuming the conversion of mandatorily convertible preferred shares, equity attributable to Unitholders increased to $29.72 per unit at December 31, 2019 from $28.72 per unit at December 31, 2018.
Interests of others in operating subsidiaries and properties was $15,985 million at December 31, 2019, a decrease of $2,471 million from the balance at December 31, 2018. The decrease was primarily a result of the deconsolidation of BSREP III.
- 74 -
SUMMARY OF QUARTERLY RESULTS
| 2019 | 2018 | |||||||||||||||||||||||
| (US$ Millions, except per unit information) | Q4 | Q3 | Q2 | Q1 | Q4 | Q3 | Q2 | Q1 | ||||||||||||||||
| Revenue | $ | 2,087 | $ | 2,017 | $ | 2,026 | $ | 2,073 | $ | 2,140 | $ | 1,828 | $ | 1,651 | $ | 1,620 | ||||||||
Direct operating costs(1) | 783 | 776 | 785 | 842 | 837 | 793 | 716 | 741 | ||||||||||||||||
| Net income | 1,551 | 870 | 23 | 713 | 858 | 722 | 1,051 | 1,023 | ||||||||||||||||
| Net income attributable to Unitholders | 1,022 | 474 | 127 | 333 | 534 | 380 | 534 | 530 | ||||||||||||||||
| Net income attributable to Unitholders per unit – basic | $ | 1.00 | $ | 0.46 | $ | 0.12 | $ | 0.32 | $ | 0.51 | $ | 0.44 | $ | 0.69 | $ | 0.69 | ||||||||
| Net income attributable to Unitholders per unit – diluted | $ | 1.00 | $ | 0.46 | $ | 0.12 | $ | 0.32 | $ | 0.51 | $ | 0.43 | $ | 0.68 | $ | 0.68 | ||||||||
(1) | We adopted IFRS 16 in 2019 using the modified retrospective method. The comparative information for periods prior to 2019 has not been restated and is reported under the accounting standards effective for those periods. |
Revenue varies from quarter to quarter due to acquisitions and dispositions of commercial and other income producing assets, changes in occupancy levels, as well as the impact of leasing activity at market net rents. In addition, revenue also fluctuates as a result of changes in foreign exchange rates and seasonality. Seasonality primarily affects our retail assets, wherein the fourth quarter exhibits stronger performance in conjunction with the holiday season. In addition, our North American hospitality assets generally have stronger performance in the winter and spring months compared to the summer and fall months, while our European hospitality assets exhibit the strongest performance during the summer months. Fluctuations in our net income is also impacted by the fair value of properties in the period to reflect changes in valuation metrics driven by market conditions or property cash flows.
- 75 -
SEGMENT PERFORMANCE
Our operations are organized into four operating segments which include Core Office, Core Retail, LP Investments and Corporate.
The following table presents FFO by segment:
| (US$ Millions) Years ended Dec. 31, | 2019 | 2018 | 2017 | ||||||
| Core Office | $ | 582 | $ | 520 | $ | 534 | |||
| Core Retail | 707 | 552 | 486 | ||||||
| LP Investments | 268 | 228 | 281 | ||||||
| Corporate | (410 | ) | (434 | ) | (428 | ) | |||
| FFO | $ | 1,147 | $ | 866 | $ | 873 | |||
The following table presents equity attributable to Unitholders by segment as of December 31, 2019 and 2018:
| (US$ Millions) | Dec. 31, 2019 | Dec. 31, 2018 | ||||
| Core Office | $ | 14,240 | $ | 14,199 | ||
| Core Retail | 14,138 | 14,136 | ||||
| LP Investments | 5,126 | 5,204 | ||||
| Corporate | (4,974 | ) | (5,255 | ) | ||
| Equity attributable to Unitholders | $ | 28,530 | $ | 28,284 | ||
Core Office
Overview
Our Core Office portfolio consists of interests in 136 high-quality office properties totaling approximately 93 million square feet, which are located primarily in the world’s leading commercial markets such as New York, London, Los Angeles, Washington, D.C., Sydney, Toronto, and Berlin, as well as approximately 12 million square feet of active office and multifamily developments and office redevelopments. We believe these assets have a stable cash flow profile due to long-term leases in place. We target between a 10% and 12% total return on our Core Office portfolio. The drivers of these targets include the mark-to-market of rents upon lease expiry, escalation provisions in leases and projected increases in occupancy, that should generate strong same-property NOI growth without significant capital investment. Furthermore, we expect to earn 8% and 11% unlevered, pre-tax returns on construction costs from our development pipeline.
Summary of Operating Results
The following table presents FFO and net income attributable to Unitholders in our Core Office segment for the years ended December 31, 2019, 2018, and 2017:
| (US$ Millions) Years ended Dec. 31, | 2019 | 2018 | 2017 | ||||||
| FFO | $ | 582 | $ | 520 | $ | 534 | |||
| Net income attributable to Unitholders | 1,504 | 934 | (4 | ) | |||||
FFO from our Core Office segment was $582 million for the year ended December 31, 2019 as compared to $520 million in 2018. This increase was largely attributable to same-property growth driven by lease commencements mainly in New York, higher development management fees from increased development activity and joint venture partner fees from assets that we have sold interests to joint venture partners. Additionally, we earned $51 million for a performance-based fee earned at Five Manhattan during the year. These increases were partially offset by dispositions as mentioned in property transactions and the negative impact of foreign currency translation.
Net income attributable to Unitholders from our Core Office segment for 2019 was $1,504 million compared to $934 million in 2018. This increase is largely attributable to fair value gains primarily related to 100 Bishopsgate in London as the development nears substantial completion and valuation gains on our Australian and New York assets to reflect market conditions. These increases were partially offset by dispositions and the negative impact of foreign currency translation.
- 76 -
Leasing Activity
The following table presents key operating metrics for our Core Office portfolio for the years ended December 31, 2019 and 2018:
| (US$ Millions, except where noted) | Consolidated | Unconsolidated | ||||||||||
| As at and for the years ended Dec. 31, | 2019 | 2018 | 2019 | 2018 | ||||||||
| Total portfolio: | ||||||||||||
NOI(1) | $ | 1,104 | $ | 1,087 | $ | 406 | $ | 451 | ||||
| Number of properties | 72 | 71 | 64 | 71 | ||||||||
| Leasable square feet (in thousands) | 47,646 | 47,480 | 27,993 | 30,479 | ||||||||
| Occupancy | 92.0 | % | 92.7 | % | 94.6 % | 94.6 | % | |||||
In-place net rents (per square foot)(2) | $ | 30.31 | $ | 28.99 | $ | 42.08 | $ | 44.57 | ||||
| Same-property: | ||||||||||||
NOI(2) | $ | 1,071 | $ | 998 | $ | 412 | $ | 389 | ||||
| Number of properties | 70 | 70 | 60 | 60 | ||||||||
| Leasable square feet (in thousands) | 47,388 | 47,361 | 26,535 | 26,602 | ||||||||
| Occupancy | 91.9 | % | 92.6 % | 94.9 % | 94.6 % | |||||||
In-place net rents (per square foot)(2) | $ | 30.25 | $ | 29.46 | $ | 44.25 | $ | 44.29 | ||||
(1) | NOI for unconsolidated properties is presented on a proportionate basis, representing the Unitholders’ interest in the property. See “Reconciliation of Non-IFRS Measures - Core Office” below for a description of the key components of NOI in our Core Office segment. |
(2) | Presented using normalized foreign exchange rates, using the December 31, 2019 exchange rate. |
NOI from our consolidated properties increased slightly to $1,104 million in 2019 from $1,087 million in 2018 primarily due to strong same-property NOI, NOI from completed development properties that were operational during the year and the acquisition of the incremental interest in One and Two London Wall Place in London, which was previously accounted for under the equity method. These increases were partially offset by dispositions in Sydney, Toronto and Denver since the prior year and the negative impact of foreign currency translation.
Same-property NOI for our consolidated properties for the year ended December 31, 2019 compared with the prior year increased by $73 million to $1,071 million. This increase was primarily the result of higher in-place net rents and lease commencements.
NOI from our unconsolidated properties, which is presented on a proportionate basis, declined to $406 million in 2019 from $451 million in 2018. This decrease is due to dispositions since the prior year and the negative impact of foreign currency translation. These decreases were partially offset by higher same-property NOI.
The following table presents certain key operating metrics related to leasing activity in our Core Office segment:
| Total portfolio year-to-date | ||||||
| (US$ millions, except where noted) | Dec. 31, 2019 | Dec. 31, 2018 | ||||
| Leasing activity (in thousands of square feet) | ||||||
| New leases | 3,788 | 3,973 | ||||
| Renewal leases | 4,047 | 3,796 | ||||
| Total leasing activity | 7,835 | 7,769 | ||||
| Average term (in years) | 8.5 | 8.3 | ||||
Year-one leasing net rents (per square foot)(1) | $ | 38.50 | $ | 34.01 | ||
Average leasing net rents (per square foot)(1) | 42.47 | 36.98 | ||||
Expiring net rents (per square foot)(1) | 32.13 | 33.56 | ||||
Estimated market net rents for similar space(1) | 40.07 | 39.13 | ||||
| Tenant improvements and leasing costs (per square foot) | 66.09 | 53.04 | ||||
(1) | Presented using normalized foreign exchange rates, using the December 31, 2019 exchange rate. |
For the year ended December 31, 2019, we leased approximately 7.8 million square feet at average in-place net rents approximately 32% higher than expiring net rents. Approximately 48% of our leasing activity represented new leases. Our overall Core Office portfolio’s in-place net rents are currently 7% below market net rents, and accordingly we believe that we will be able to increase our NOI in the coming years, as we sign new leases. For the year ended December 31, 2019, tenant improvements and leasing costs were $66.09 per square foot, compared to $53.04 per square foot in the prior year.
- 77 -
We calculate net rent as the annualized amount of cash rent receivable from leases on a per square foot basis, including tenant expense reimbursements, less operating expenses being incurred for that space, excluding the impact of straight-lining rent escalations or amortization of free rent periods. This measure represents the amount of cash, on a per square foot basis, generated from leases in a given period.
Valuation Metrics
The key valuation metrics for commercial properties in our Core Office segment on a weighted-average basis are as follows:
| Dec. 31, 2019 | Dec. 31, 2018 | ||||||||||
Discount rate | Terminal capitalization rate | Investment horizon | Discount rate | Terminal capitalization rate | Investment horizon | ||||||
| Consolidated properties: | |||||||||||
| United States | 7.0 | % | 5.6 | % | 12 | 6.9 | % | 5.6 | % | 12 | |
| Canada | 5.9 | % | 5.2 | % | 10 | 6.0 | % | 5.4 | % | 10 | |
| Australia | 6.8 | % | 5.9 | % | 10 | 7.0 | % | 6.2 | % | 10 | |
Europe(1) | 4.6 | % | 4.1 | % | 11 | — | % | — | % | — | |
| Brazil | 7.9 | % | 7.4 | % | 10 | 9.6 | % | 7.7 | % | 6 | |
| Unconsolidated properties: | |||||||||||
| United States | 6.8 | % | 4.9 | % | 11 | 6.6 | % | 5.1 | % | 10 | |
| Australia | 6.5 | % | 5.2 | % | 10 | 6.7 | % | 5.7 | % | 10 | |
Europe(2) | 4.6 | % | 5.0 | % | 10 | 4.7 | % | 4.9 | % | 10 | |
(1) | We acquired an incremental interest in One and Two London Wall Place in London in 2019. The investments were previously accounted for under the equity method. |
(2) | Certain properties in Europe accounted for under the equity method are valued using both discounted cash flow and yield models. For comparative purposes, the discount and terminal capitalization rates and investment horizon calculated under the discounted cash flow method are presented in the table above. |
Financial Position
The following table provides an overview of the financial position of our Core Office segment as at December 31, 2019 and 2018:
| (US$ Millions) | Dec. 31, 2019 | Dec. 31, 2018 | ||||
| Investment properties: | ||||||
| Commercial properties | $ | 23,025 | $ | 21,350 | ||
| Commercial developments | 3,058 | 2,182 | ||||
| Equity accounted investments | 8,882 | 8,365 | ||||
| Participating loan interests | — | 268 | ||||
| Accounts receivable and other | 1,186 | 1,218 | ||||
| Cash and cash equivalents | 607 | 678 | ||||
| Assets held for sale | — | 34 | ||||
| Total assets | 36,758 | 34,095 | ||||
| Debt obligations | 13,856 | 11,922 | ||||
| Capital securities | 922 | 813 | ||||
| Accounts payable and other liabilities | 1,801 | 1,345 | ||||
| Deferred tax liability | 1,013 | 953 | ||||
| Non-controlling interests of others in operating subsidiaries and properties | 4,926 | 4,863 | ||||
| Equity attributable to Unitholders | $ | 14,240 | $ | 14,199 | ||
Equity attributable to Unitholders increased by $41 million to $14,240 million at December 31, 2019 from $14,199 million at December 31, 2018. The increase relates to net income earned during the year and the positive impact of foreign currency translation.
Commercial properties totaled $23,025 million at December 31, 2019, compared to $21,350 million at December 31, 2018. This increase was driven primarily by the incremental interest acquisition in One and Two London Wall Place in London, the adoption of IFRS 16 which requires the recognition of right-of-use assets, as well as incremental capital spent to maintain or enhance properties partially offset by dispositions.
- 78 -
Commercial developments increased by $876 million between December 31, 2018 and December 31, 2019, and was primarily due to incremental capital spend on our active developments and gains recognized at 100 Bishopsgate in London as the development nears completion.
The following table presents changes in our partnership’s equity accounted investments in the Core Office segment from December 31, 2018 to December 31, 2019:
| (US$ Millions) | Dec. 31, 2019 | ||
| Equity accounted investment, beginning of year | $ | 8,365 | |
| Additions | 308 | ||
| Disposals and return of capital distributions | (94 | ) | |
| Share of net income, including fair value gains (losses) | 716 | ||
| Distributions received | (97 | ) | |
| Foreign exchange | 140 | ||
| Reclassification from assets held for sale | 34 | ||
Other(1) | (490 | ) | |
| Equity accounted investments, end of year | $ | 8,882 | |
(1) | We acquired an incremental interest in One and Two London Wall Place in London in 2019 and have control over the assets. As a result, we now consolidate our interest in the assets. |
Equity accounted investments increased by $517 million to $8,882 million at December 31, 2019 compared to the prior year-end. The increase was driven by our share of income, contributions to our development assets held in joint ventures and the positive impact of foreign currency translation. These increases were partially offset by the change in treatment of One and Two London Wall Place in London from equity accounted investments to commercial properties following our acquisition of an incremental interest and the change in treatment of BPREP from an equity accounted investment to financial asset due to a reduction in our ownership.
Debt obligations increased from $11,922 million at December 31, 2018 to $13,856 million at December 31, 2019. This increase is the result of refinancing activity of property-level debt related to office properties and drawdowns on existing facilities to fund capital expenditures on development properties.
The following table provides additional information on our outstanding capital securities in our Core Office segment:
| (US$ Millions, except where noted) | Shares outstanding | Cumulative dividend rate | Dec. 31, 2019 | Dec. 31, 2018 | ||||
| BPO Class B Preferred Shares: | ||||||||
Series 1(1) | 3,600,000 | 70% of bank prime | — | — | ||||
Series 2(1) | 3,000,000 | 70% of bank prime | — | — | ||||
| Capital Securities – Fund Subsidiaries | 922 | 813 | ||||||
| Total capital securities | $ | 922 | $ | 813 | ||||
(1) | BPO Class B Preferred Shares, Series 1 and 2 capital securities - corporate are owned by Brookfield Asset Management. BPO has an offsetting loan receivable against these securities earning interest at 95% of bank prime. |
We had $922 million of capital securities – fund subsidiaries outstanding at December 31, 2019 (December 31, 2018 - $813 million). Capital securities – fund subsidiaries includes $859 million (December 31, 2018 - $775 million) of equity interests in Brookfield DTLA Holdings LLC (“DTLA”) held by our co-investors in the fund, which have been classified as a liability, rather than as non-controlling interests, as the holders of these interests can compel DTLA to redeem their interests in the fund for cash equivalent to the fair value of the interests on October 15, 2023 and on every fifth anniversary thereafter. In addition, capital securities – fund subsidiaries also includes $62 million (December 31, 2018 - $38 million) which represents the equity interests held by our co-investor in Brookfield D.C. Office Partners LLC ("D.C. Fund") which have been classified as a liability, rather than as non-controlling interest, due to the fact that on June 18, 2023, and on every second anniversary thereafter, the holders of these interests can redeem their interests in the D.C. Fund for cash equivalent to the fair value of the interests.
- 79 -
Active Developments
The following table summarizes the scope and progress of active developments in our Core Office segment as of December 31, 2019:
| Total square feet under construction (in 000’s) | Proportionate square feet under construction (in 000’s) | Expected date of accounting stabilization | Cost | Loan | |||||||||||||||
| (Millions, except square feet in thousands) | Percent pre-leased | Total(1) | To-date | Total | Drawn | ||||||||||||||
| Office: | |||||||||||||||||||
| 100 Bishopsgate, London | 938 | 938 | Q2 2020 | 87 | % | £ | 845 | £ | 784 | £ | 491 | £ | 491 | ||||||
One Manhattan West, Midtown New York(2) | 2,081 | 853 | Q4 2020 | 91 | % | $ | 795 | $ | 678 | $ | 554 | $ | 431 | ||||||
Manhattan West Retail, Midtown New York(2) | 70 | 39 | Q1 2021 | 50 | % | $ | 117 | $ | 72 | $ | 62 | $ | 11 | ||||||
Wood Wharf, Office, London(2) | 423 | 211 | Q2 2021 | 44 | % | £ | 125 | £ | 44 | £ | 93 | £ | — | ||||||
ICD Brookfield Place, Dubai(2) | 1,091 | 545 | Q1 2022 | 22 | % | AED | 1,487 | AED | 1,275 | AED | 908 | AED | 761 | ||||||
| Bay Adelaide North, Toronto | 820 | 820 | Q3 2023 | 86 | % | C$ | 498 | C$ | 140 | C$ | 350 | C$ | — | ||||||
Two Manhattan West, Midtown New York(2) | 1,955 | 1,095 | Q4 2023 | 25 | % | $ | 1,329 | $ | 358 | $ | — | $ | — | ||||||
| Office Redevelopment: | |||||||||||||||||||
| 388 George Street, Sydney | 441 | 221 | Q3 2021 | 54 | % | A$ | 185 | A$ | 69 | A$ | 167 | A$ | 49 | ||||||
| 110 Avenue of the Americas, Midtown New York | 376 | 136 | Q2 2022 | 95 | % | $ | 113 | $ | 33 | $ | — | $ | — | ||||||
| Multifamily: | |||||||||||||||||||
Wood Wharf - 10 Park Drive, London(2)(3) | 269 | 135 | Q2 2020 | n/a | £ | 102 | £ | 94 | £ | 80 | £ | 54 | |||||||
Southbank Place(2)(3) | 541 | 135 | Q2 2020 | n/a | £ | 168 | £ | 136 | £ | 95 | £ | 69 | |||||||
Greenpoint Landing Building F, New York(2) | 348 | 331 | Q4 2020 | n/a | $ | 347 | $ | 267 | $ | 206 | $ | 100 | |||||||
Newfoundland, London(2) | 545 | 273 | Q2 2021 | n/a | £ | 249 | £ | 232 | £ | 174 | £ | 120 | |||||||
Wood Wharf - One Park Drive, London(2)(3) | 430 | 215 | Q2 2021 | n/a | £ | 221 | £ | 162 | £ | 135 | £ | — | |||||||
Wood Wharf - 8 Water Street & 2 George Street, London(2) | 371 | 186 | Q3 2021 | n/a | £ | 151 | £ | 113 | £ | 96 | £ | 63 | |||||||
755 Figueroa, Los Angeles(2) | 791 | 374 | Q2 2024 | n/a | $ | 257 | $ | 31 | $ | 166 | $ | 5 | |||||||
| Hotel: | |||||||||||||||||||
Pendry Manhattan West, Midtown New York(2) | 184 | 103 | Q2 2023 | — | % | $ | 157 | $ | 82 | $ | — | $ | — | ||||||
| Total | 11,674 | 6,610 | |||||||||||||||||
(1) | Net of NOI earned during stabilization. |
(2) | Cost and construction loan information is presented on a proportionate basis at our ownership in these developments. |
(3) | Represents condominium/market sale developments. |
Our development pipeline consists of prominent, large-scale projects located primarily in the high growth markets of London and New York. For the office developments, we generally look to secure anchor leases before launching the projects. We monitor the scope and progress of our active developments and have an established track record of completion on time and within budget. We have recently completed office towers in the prime markets of Toronto, London, and Perth and completed two urban multifamily developments in New York. In the near term we expect to complete two landmark office towers in New York and London. Our current office and redevelopment projects stand at an average 61% pre-leased. Our recently completed developments, along with our active pipeline are a large contributing factor to our target growth of 10% to 12% on our Core Office portfolio.
Reconciliation of Non-IFRS Measures – Core Office
The key components of NOI in our Core Office segment are presented below:
| (US$ Millions) Years ended Dec. 31, | 2019 | 2018 | 2017 | ||||||
| Commercial property revenue | $ | 1,903 | $ | 1,962 | $ | 2,020 | |||
Hospitality revenue(1) | 12 | 17 | 26 | ||||||
| Direct commercial property expense | (797 | ) | (879 | ) | (948 | ) | |||
Direct hospitality expense(1) | (14 | ) | (13 | ) | (13 | ) | |||
| Total NOI | $ | 1,104 | $ | 1,087 | $ | 1,085 | |||
(1) | Hospitality revenue and Direct hospitality expense within our Core Office segment primarily consists of revenue and expenses incurred at a hotel adjacent to the Allen Center in Houston. |
- 80 -
The following table reconciles Core Office NOI to net income for the years ended December 31, 2019, 2018, and 2017:
| (US$ Millions) Years ended Dec. 31, | 2019 | 2018 | 2017 | ||||||
| Same-property NOI | $ | 1,007 | $ | 930 | $ | 910 | |||
| Currency variance | — | 12 | 18 | ||||||
| NOI related to acquisitions and dispositions | 97 | 145 | 157 | ||||||
| Total NOI | 1,104 | 1,087 | 1,085 | ||||||
| Investment and other revenue | 234 | 126 | 101 | ||||||
| Interest expense | (606 | ) | (598 | ) | (641 | ) | |||
| Depreciation and amortization on non-real estate assets | (11 | ) | (13 | ) | (14 | ) | |||
| Investment and other expense | (15 | ) | — | — | |||||
| General and administrative expense | (250 | ) | (197 | ) | (164 | ) | |||
| Fair value gains, net | 798 | 108 | (807 | ) | |||||
| Share of net earnings from equity accounted investments | 716 | 725 | 523 | ||||||
| Income before income taxes | 1,970 | 1,238 | 83 | ||||||
| Income tax benefit (expense) | (123 | ) | (54 | ) | 42 | ||||
| Net income | 1,847 | 1,184 | 125 | ||||||
| Net income attributable to non-controlling interests | 343 | 250 | 129 | ||||||
| Net income attributable to Unitholders | $ | 1,504 | $ | 934 | $ | (4 | ) | ||
The following table reconciles Core Office net income to FFO for the years ended December 31, 2019, 2018, and 2017:
| (US$ Millions) Years ended Dec. 31, | 2019 | 2018 | 2017 | ||||||
| Net income | $ | 1,847 | $ | 1,184 | $ | 125 | |||
| Add (deduct): | |||||||||
| Fair value gains, net | (798 | ) | (108 | ) | 807 | ||||
| Share of equity accounted fair value gains, net | (420 | ) | (459 | ) | (222 | ) | |||
| Depreciation and amortization of real estate assets | 3 | 2 | 1 | ||||||
| Income tax (benefit) expense | 123 | 54 | (42 | ) | |||||
| Non-controlling interests in above items | (173 | ) | (153 | ) | (135 | ) | |||
| FFO | $ | 582 | $ | 520 | $ | 534 | |||
The following table reconciles Core Office share of net earnings from equity accounted investment for the years ended December 31, 2019, 2018, and 2017:
| (US$ Millions) Years ended Dec. 31, | 2019 | 2018 | 2017 | ||||||
| Unconsolidated properties NOI | $ | 406 | $ | 451 | $ | 423 | |||
| Unconsolidated properties fair value gains, net and income tax expense | 420 | 459 | 222 | ||||||
| Other | (110 | ) | (185 | ) | (122 | ) | |||
| Share of net earnings from equity accounted investments | $ | 716 | $ | 725 | $ | 523 | |||
Core Retail
Overview
Our Core Retail segment consists of 122 best-in-class regional malls and urban retail properties containing over 120 million square feet in the United States. These assets have a stable cash flow profile due to long-term leases in place. We target between a 10% and 12% total return on our Core Retail portfolio. The drivers of these targets include the mark-to-market of rents upon lease expiry, escalation provisions in leases and operating expense monitoring that should generate same-property NOI growth. Furthermore, we expect to earn between 5% and 8% unlevered, pre-tax returns on construction costs from our redevelopment pipeline, which will also drive NOI growth. NOI growth has been partially offset by the impact of tenant bankruptcies over the last 12 to 18 months, of which 75% of that space has already been leased to new tenants.
During the first quarter of 2018, we entered into a definitive agreement with GGP for our partnership to acquire all of the outstanding shares of common stock of GGP other than those shares currently held by us and our affiliates. The acquisition of GGP was finalized on August 28, 2018. In the transaction, GGP shareholders received, for each GGP common share, either $23.50 in cash or either one LP Unit or one BPR Unit, subject to proration based on aggregate cash consideration of $9.25 billion. We
- 81 -
now consolidate our interest in BPR (formerly GGP). Prior to the acquisition in the third quarter of 2018, our investment in GGP was accounted for under the equity method.
Summary of Operating Results
The following table presents FFO and net income attributable to Unitholders in our Core Retail segment for the years ended December 31, 2019, 2018, and 2017:
| (US$ Millions) Years ended Dec. 31, | 2019 | 2018 | 2017 | ||||||
| FFO | $ | 707 | $ | 552 | $ | 486 | |||
| Net income attributable to Unitholders | 659 | 456 | (89 | ) | |||||
FFO earned in our Core Retail segment for the year ended December 31, 2019 was $707 million compared to $552 million in the prior year. The increase is due to a full year of consolidated NOI from BPR (formerly GGP) in the current year compared to four months of consolidated NOI and eight months of share of net income from equity accounted investment when our interest in GGP was 34% in the prior year, as the GGP acquisition closed in the third quarter of 2018. These increases were partially offset by higher interest expense, including new corporate acquisition debt and senior note debt, and general and administrative expenses associated with our incremental ownership.
Net income attributable to Unitholders from our Core Retail segment increased by $203 million to $659 million in 2019 compared to $456 million in 2018. This increase in net income attributable to Unitholders is primarily attributable to FFO earnings from our incremental ownership in GGP and fair value gains recognized on our equity accounted investments, mainly Ala Moana Center. The prior year included fair value losses recognized on our equity accounted investment prior to the GGP acquisition. These increases were partially offset by the fair value losses on our consolidated portfolio as it reflects updated cashflow assumptions and valuation metrics.
Leasing Activity
The following table presents key operating metrics in our Core Retail portfolio for the years ended December 31, 2019 and 2018:
| (US$ Millions, except where noted) | ||||||
| As at and for the years ended Dec. 31, | 2019 | 2018 | ||||
| NOI: | ||||||
Total portfolio(1) | $ | 1,736 | $ | 1,141 | ||
| Total portfolio: | ||||||
| Number of malls and urban retail properties | 122 | 124 | ||||
| Leasable square feet (in thousands) | 120,526 | 121,435 | ||||
Occupancy(2) | 96.4 | % | 96.5 | % | ||
In-place net rents (per square foot)(2) | $ | 61.74 | $ | 61.44 | ||
NOI weighted sales (per square foot)(2) | $ | 798 | $ | 753 | ||
(1) | NOI is presented on a proportionate basis. The prior period represents 4 months of our consolidated results of BPR and 8 months of activity from our 34% interest in GGP (prior to the GGP acquisition in the third quarter of 2018). |
(2) | Presented on a same-property basis. |
NOI, which is presented on a proportionate basis, increased to $1,736 million from $1,141 million in the prior year due to our increased ownership in GGP.
The results of our operations are primarily driven by changes in occupancy and in-place rental rates. The following table presents new and renewal leases for the trailing 12 months compared to expiring leases for the prior tenant in the same suite, for leases where the downtime between new and previous tenant is less than 24 months, among other metrics.
- 82 -
| Total portfolio | ||||||
| (US$ Millions, except where noted) | Dec. 31, 2019 | Dec. 31, 2018 | ||||
| Number of leases | 1,329 | 1,239 | ||||
| Leasing activity (in thousands of square feet) | 5,256 | 4,408 | ||||
| Average term in years | 6.5 | 7.1 | ||||
Initial rent (per square foot)(1) | $ | 60.58 | $ | 70.35 | ||
Expiring rent (per square foot)(2) | 58.47 | 63.60 | ||||
| Initial rent spread (per square foot) | 2.11 | 6.75 | ||||
| % Change | 3.6 | % | 10.6 | % | ||
| Tenant allowances and leasing costs | $ | 200 | $ | 190 | ||
(1) | Represents initial rent over the term consisting of base minimum rent and common area costs. |
(2) | Represents expiring rent at end of lease consisting of base minimum rent and common area costs. |
Through December 31, 2019, we leased approximately 5.3 million square feet at initial rents approximately 3.6% higher than expiring net rents on a suite-to-suite basis.
Our Core Retail portfolio occupancy rate at December 31, 2019 was 96.4%, which is flat compared to occupancy rates at December 31, 2018. In our Core Retail segment, we use in-place rents as a measure of leasing performance. In-place rents are calculated on a cash basis and consist of base minimum rent, plus reimbursements of common area costs, and real estate taxes. In-place rents increased to $61.74 at December 31, 2019 from $61.44 at December 31, 2018. Strong leasing during the year from non-traditional tenants across our Core Retail portfolio kept occupancy rates relatively flat.
Valuation Metrics
The key valuation metrics of properties in our Core Retail segment on a weighted-average basis are presented in the following table. The valuations are most sensitive to changes in the discount rate and timing or variability of cash flows.
| Dec. 31, 2019 | Dec. 31, 2018 | |||||||||
| Discount Rate | Terminal capitalization rate | Investment horizon | Discount Rate | Terminal capitalization rate | Investment horizon | |||||
| Consolidated properties: | ||||||||||
| United States | 6.7 | % | 5.4 | % | 10 | 7.1 | % | 6.0 | % | 12 |
| Unconsolidated properties: | ||||||||||
| United States | 6.3 | % | 4.9 | % | 10 | 6.6 | % | 5.3 | % | 11 |
Financial Position
The following table presents an overview of the financial position of our Core Retail segment as at December 31, 2019 and 2018:
| (US$ Millions) | Dec. 31, 2019 | Dec. 31, 2018 | ||||
| Investment properties | ||||||
| Commercial properties | $ | 21,561 | $ | 17,224 | ||
| Commercial developments | — | 383 | ||||
| Equity accounted investments | 10,555 | 11,158 | ||||
| Accounts receivable and other | 609 | 646 | ||||
| Cash and cash equivalents | 196 | 247 | ||||
| Total assets | 32,921 | 29,658 | ||||
| Less: | ||||||
| Debt obligations | 16,107 | 13,052 | ||||
| Accounts payable and other liabilities | 821 | 674 | ||||
| Deferred tax liability | 68 | 23 | ||||
| Non-controlling interests of others in operating subsidiaries and properties | 1,787 | 1,773 | ||||
| Total equity attributable to Unitholders | $ | 14,138 | $ | 14,136 | ||
Equity attributable to Unitholders in the Core Retail segment was relatively flat from December 31, 2018 to December 31, 2019 primarily due to net income earned during the year and several incremental interest acquisitions from our joint venture partners including Park Meadows in Colorado, Towson Town Center in Maryland, Perimeter Mall in Georgia, Shops at Merrick Park in Florida and 730 Fifth Avenue in New York, bringing our ownership in each of the malls to 100%, where prior to the acquisitions were accounted for under the equity method. After gaining control of these five investments, we consolidated the
- 83 -
commercial properties and the property-level debt. These increases were partially offset by distribution of income during the period and the $95 million issuer bid buyback of BPR Units in the first quarter of 2019.
The following table presents a roll-forward of our partnership’s equity accounted investments for the year ended December 31, 2019:
| (US$ Millions) | Dec. 31, 2019 | ||
| Equity accounted investments, beginning of year | $ | 11,158 | |
| Additions | 197 | ||
| Disposals and return of capital distributions | (166 | ) | |
| Share of net earnings from equity accounted investments | 1,179 | ||
| Distributions | (486 | ) | |
Other(1) | (1,327 | ) | |
| Equity accounted investments, end of year | $ | 10,555 | |
(1) | We acquired an incremental interest in Park Meadows in Colorado, Towson Town Center in Maryland, Perimeter Mall in Georgia, Shops at Merrick Park in Florida and 730 Fifth Avenue in New York during the year, bringing our ownership in each of the malls to 100%. As a result, we now consolidate our interest in these assets. |
Equity accounted investments decreased by $603 million to $10,555 million. The decrease is primarily due to the incremental interest acquisitions from our joint venture partners as mentioned above, distributions during the year and a disposal of our interest in one property to our joint venture partner during the year. These decreases were partially offset by the share of net earnings BPR’s property-level joint ventures earned and fair value gains recognized at higher-tiered malls during the period.
Reconciliation of Non-IFRS Measures – Core Retail
The key components of NOI in our Core Retail segment are presented below:
| (US$ Millions) Years ended Dec. 31, | 2019 | 2018 | 2017 | ||||||
| Commercial property revenue | $ | 1,394 | $ | 511 | $ | — | |||
| Direct commercial property expense | (383 | ) | (135 | ) | — | ||||
| Total NOI | $ | 1,011 | $ | 376 | $ | — | |||
The following table reconciles Core Retail net income to net income attributable to Unitholders for the years ended December 31, 2019, 2018, and 2017:
| (US$ Millions) Years ended Dec. 31, | 2019 | 2018 | 2017 | ||||||
| Total NOI | $ | 1,011 | $ | 376 | $ | — | |||
| Investment and other revenue | 195 | 73 | — | ||||||
| Interest expense | (683 | ) | (218 | ) | — | ||||
| Depreciation and amortization on real estate assets | (24 | ) | (6 | ) | — | ||||
| Investment and other expense | — | — | — | ||||||
| General and administrative expense | (258 | ) | (89 | ) | — | ||||
| Fair value gains (losses), net | (686 | ) | 412 | (268 | ) | ||||
| Share of net earnings from equity accounted investments | 1,179 | (52 | ) | 179 | |||||
| Income before income taxes | 734 | 496 | (89 | ) | |||||
| Income tax benefit (expense) | (8 | ) | (6 | ) | — | ||||
| Net income | $ | 726 | $ | 490 | $ | (89 | ) | ||
Net income attributable to non-controlling interests of others in operating subsidiaries and properties | 67 | 34 | — | ||||||
| Net income attributable to Unitholders | $ | 659 | $ | 456 | $ | (89 | ) | ||
- 84 -
The following table reconciles Core Retail net income to FFO for the years ended December 31, 2019, 2018, and 2017:
| (US$ Millions) Years ended Dec. 31, | 2019 | 2018 | 2017 | ||||||
| Net income | $ | 726 | $ | 490 | $ | (89 | ) | ||
| Add (deduct): | |||||||||
| Fair value (gains) losses, net | 686 | (412 | ) | 268 | |||||
| Share of equity accounted fair value gains, net | (643 | ) | 505 | 307 | |||||
| Income tax (benefit) expense | 8 | 6 | — | ||||||
| Non-controlling interests in above items | (70 | ) | (37 | ) | — | ||||
| FFO | $ | 707 | $ | 552 | $ | 486 | |||
The following table reconciles Core Retail share of net earnings from equity accounted investment for the years ended December 31, 2019, 2018, and 2017:
| (US$ Millions) Years ended Dec. 31, | 2019 | 2018 | 2017 | ||||||
| Unconsolidated properties NOI | $ | 906 | $ | 1,141 | $ | 701 | |||
| Unconsolidated properties fair value gains, net and income tax expense | 643 | (505 | ) | (307 | ) | ||||
| Other | (370 | ) | (688 | ) | (215 | ) | |||
| Share of net earnings from equity accounted investments | $ | 1,179 | $ | (52 | ) | $ | 179 | ||
LP Investments (formerly referred to as Opportunistic)
Overview
Our LP Investments portfolio includes our equity invested in Brookfield-sponsored real estate opportunity funds, which target high-quality assets with operational upside across various real estate sectors, including office, retail, multifamily, logistics, hospitality, triple net lease, self-storage, student housing and manufactured housing. We target an average 20% total return on our LP Investments portfolio and a 2.0x multiple of capital on the equity we invest into these vehicles.
The partnership has interests in the following Brookfield-sponsored real estate opportunity funds:
| • | BSREP I - 31% interest in BSREP I, which is an opportunistic real estate fund with $4.4 billion in committed capital in aggregate, targeting gross returns of 20%. The fund is in its 8th year, is fully invested and is executing realizations. |
| • | BSREP II - 26% interest in BSREP II, which is an opportunistic real estate fund with $9.0 billion in committed capital in aggregate, targeting gross returns of 20%. The fund is in its 5th year and is fully invested. |
| • | BSREP III - 7% interest in BSREP III, which is an opportunistic real estate fund with $15.0 billion in committed capital in aggregate, targeting gross returns of 20%; The fund is in its 3rd year. |
| • | A blended 36% interest in two value-add multifamily funds totaling $1.8 billion targeting gross returns of 16%. These funds seek to invest in a geographically diverse portfolio of U.S. multifamily properties through acquisition and development. |
| • | A 33% interest in a $600 million fund which owns the Atlantis Paradise Island resort in the Bahamas. |
| • | A blended 13% interest in a series of real estate debt funds totaling $5.4 billion which seek to invest in commercial real estate debt secured by properties in strategic locations. |
While our economic interest in these funds are less than 50% in each case, we generally consolidate the portfolios held through the LP Investments as Brookfield Asset Management’s oversight as general partner together with our exposure to variable returns of the investments through our LP interests provide us with control over the investments. We do not consolidate our interest in BSREP III as our 7% non-voting interest does not provide us with control over the investment and therefore is accounted for as a financial asset.
- 85 -
Summary of Operating Results
Our LP investments, unlike our Core portfolios, have a defined hold period and typically generate the majority of profits from realization events including the sale of an asset or portfolio of assets, or the exit of the entire investment. The combination of gains from realization events and FFO earned during the hold period represent our earnings on capital invested in these funds and, once distributed by the Brookfield-sponsored real estate opportunity funds, provide liquidity to support our target distributions.
The following table presents distributions received on our LP Investments in Brookfield-sponsored real estate opportunity funds received on sale or refinancing events within the funds for the years ended December 31, 2019, 2018, and 2017:
| (US$ Millions) Years ended Dec. 31, | 2019 | 2018 | 2017 | ||||||
| Return of invested capital | $ | 475 | $ | 446 | $ | 385 | |||
| Distribution of earnings and gains on invested capital | 892 | 949 | 890 | ||||||
| Total LP Investments distributions | 1,367 | 1,395 | 1,275 | ||||||
| Less: Incentive fees | (181 | ) | (32 | ) | — | ||||
| Total LP Investments distributions, net | 1,186 | 1,363 | 1,275 | ||||||
During the year ended December 31, 2019, distribution of earnings and gains on invested capital primarily related to distributions of income from our office assets in India, Brazil and South Korea and Center Parcs in the United Kingdom, as well as the realization gains on the disposition of multifamily assets in our second value-add multifamily fund, disposition of multifamily assets within our BSREP I investments, our interest in a retail portfolio in China, an office portfolio in California and dispositions within our office portfolio in Brazil. Total LP Investments distributions for the year ended December 31, 2019 were net of incentive fees associated with the dispositions mentioned above and upfinancing of our office portfolio in India as several developments near completion. Distribution of earnings and gains on invested capital in the prior periods are primarily due to distributions of income from our office and multifamily assets.
.
The following table presents FFO and net income attributable to Unitholders in our LP Investments segment for the years ended December 31, 2019, 2018, and 2017:
| (US$ Millions) Years ended Dec. 31, | 2019 | 2018 | 2017 | ||||||
| FFO | $ | 268 | $ | 228 | $ | 281 | |||
| Net income attributable to Unitholders | 285 | 636 | 933 | ||||||
FFO in our LP Investments segment increased by $40 million for the year ended December 31, 2019 primarily driven by NOI earned from investment activity. These increases were partially offset by disposition activity, higher interest expense and the negative impact of foreign currency translation.
Net income attributable to Unitholders from our LP Investments segment decreased by $351 million for the year ended December 31, 2019, driven by fair value losses in our LP Investments retail portfolio from updated cashflow assumptions. Additionally, the prior year benefited from valuation gains, particularly related to our industrial portfolio in the United States and our office assets in India, as well as a gain on extinguishment of debt associated with the sale of the Hard Rock Hotel and Casino. These decreases were partially offset by fair value gains in our office portfolio in Brazil which resulted from discount rate compression due to improved market conditions and historically low interest rates, as well as fair value gains in India which resulted from capitalization rate compression.
- 86 -
Financial Position
The following table presents equity attributable to Unitholders in our LP Investments segment:
| (US$ Millions) | Dec. 31, 2019 | Dec. 31, 2018 | ||||
| Investment properties | $ | 27,867 | $ | 39,057 | ||
| Property, plant and equipment | 7,028 | 7,333 | ||||
| Equity accounted investments | 1,327 | 3,175 | ||||
| Accounts receivable and other | 4,634 | 5,777 | ||||
| Cash and cash equivalents | 595 | 2,298 | ||||
| Assets held for sale | 387 | 970 | ||||
| Total assets | 41,838 | 58,610 | ||||
| Less: | ||||||
| Debt obligations | 23,525 | 36,678 | ||||
| Capital securities | 431 | 460 | ||||
| Accounts payable and other liabilities | 3,361 | 4,303 | ||||
| Liabilities associated with assets held for sale | 140 | 163 | ||||
| Non-controlling interests of others in operating subsidiaries and properties | 9,255 | 11,802 | ||||
| Equity attributable to Unitholders | $ | 5,126 | $ | 5,204 | ||
The decrease in investment properties is primarily the result of the deconsolidation of BSREP III investments and the sales of a portfolio of triple-net lease assets, a portfolio of office assets in California and a portfolio of multifamily assets in New York, partially offset by investment activity since the prior year, mostly in our office portfolios. Additionally, we had valuation gains from our office portfolios in Brazil and India and our student housing portfolio in the United Kingdom.
The decrease in property, plant and equipment is the result of the deconsolidation of BSREP III investments, which include a portfolio of serviced apartments in the United Kingdom and two hotel properties in Florida. These decreases were offset by capital spend during the current year and the positive impact of foreign currency translation related to our Center Parcs portfolio in the United Kingdom.
Equity accounted investments decreased primarily due to the deconsolidation of BSREP III during the first quarter of 2019, the reclassification of our equity accounted interest in a hotel Florida to assets held for sale, as well as distributions of income and return of capital. These decreases were partially offset by net income from these investments.
Assets held for sale and related liabilities as of December 31, 2019 includes our equity accounted investment in a hotel in Florida, an office asset in California and six triple net lease assets in U.S., as we intend to sell controlling interests in these properties to third parties in the next 12 months.
Debt obligations decreased due to the deconsolidation of BSREP III as mentioned in investment activity.
- 87 -
Reconciliation of Non-IFRS Measures - LP Investments
The following table reconciles LP Investments NOI to net income for the years ended December 31, 2019, 2018, and 2017:
| (US$ Millions) Years ended Dec. 31, | 2019 | 2018 | 2017 | ||||||
| Commercial property revenue | $ | 2,394 | $ | 2,570 | $ | 2,172 | |||
| Hospitality revenue | 1,897 | 1,896 | 1,622 | ||||||
| Direct commercial property expense | (787 | ) | (837 | ) | (669 | ) | |||
| Direct hospitality expense | (1,205 | ) | (1,223 | ) | (1,066 | ) | |||
| Total NOI | 2,299 | 2,406 | 2,059 | ||||||
| Investment and other revenue | 161 | 78 | 193 | ||||||
| Interest expense | (1,389 | ) | (1,357 | ) | (1,059 | ) | |||
| General and administrative expense | (198 | ) | (597 | ) | (285 | ) | |||
| Investment and other expense | (67 | ) | (26 | ) | (138 | ) | |||
| Depreciation and amortization | (306 | ) | (289 | ) | (261 | ) | |||
| Fair value gains, net | 584 | 1,785 | 2,365 | ||||||
| Share of net earnings from equity accounted investments | 74 | 274 | 257 | ||||||
| Income before income taxes | 1,158 | 2,274 | 3,131 | ||||||
| Income tax (expense) | (83 | ) | (247 | ) | (234 | ) | |||
| Net income | 1,075 | 2,027 | 2,897 | ||||||
| Net income attributable to non-controlling interests of others in operating subsidiaries and properties | 790 | 1,391 | 1,964 | ||||||
| Net income attributable to Unitholders | $ | 285 | $ | 636 | $ | 933 | |||
The following table reconciles LP Investments net income to FFO for the years ended December 31, 2019, 2018, and 2017:
| (US$ Millions) Years ended Dec. 31, | 2019 | 2018 | 2017 | ||||||
| Net income | $ | 1,075 | $ | 2,027 | $ | 2,897 | |||
| Add (deduct): | |||||||||
| Fair value (gains), net | (584 | ) | (1,785 | ) | (2,365 | ) | |||
| Share of equity accounted fair value gains, net | 8 | (160 | ) | (167 | ) | ||||
| Depreciation and amortization of real estate assets | 280 | 261 | 243 | ||||||
| Income tax expense | 83 | 247 | 234 | ||||||
| Non-controlling interests in above items | (594 | ) | (362 | ) | (561 | ) | |||
| FFO | $ | 268 | $ | 228 | $ | 281 | |||
Corporate
Certain amounts are allocated to our Corporate segment in our management reports as those activities are not used to evaluate our segments’ operating performance.
Summary of Operating Results
The following table presents FFO and net income attributable to Unitholders in our corporate segment for the years ended December 31, 2019, 2018, and 2017:
| (US$ Millions) Years ended Dec. 31, | 2019 | 2018 | 2017 | ||||||
| FFO | $ | (410 | ) | $ | (434 | ) | $ | (428 | ) |
| Net income (loss) attributable to Unitholders | (492 | ) | (48 | ) | (465 | ) | |||
FFO from our Corporate segment was a loss of $410 million for the year ended December 31, 2019 compared to a loss of $434 million in the prior year.
Interest expense for the year ended December 31, 2019 was $246 million, which reflects $152 million of interest expense on capital securities and $94 million of interest expense on our credit facilities and corporate bonds. This compares to interest expense of $291 million in the prior year and $267 million in 2017.
- 88 -
Another component of FFO is general and administrative expense, which for the year ended December 31, 2019, was $176 million, and includes $107 million of asset management fees, $26 million of equity enhancement fees and $43 million of other corporate costs. This compares to general and administrative expense of $149 million in the prior year and $165 million in 2017. The increase is largely driven by an increase in the management fees which is determined, in part, based on the LP Units trading price, which was higher in 2019 as compared to the prior year.
In 2019, income tax benefit allocated to the corporate segment was $18 million (2018 - income tax benefit of $226 million and 2017 - expense of nil). The current year income tax benefit allocated to the corporate segment related to the decrease of deferred tax liabilities of our holding companies and their subsidiaries. The prior year benefit relates to a deferred tax benefit as a result of the acquisition of a controlling interest in GGP.
Financial Position
The following table presents equity attributable to Unitholders in our Corporate segment:
| (US$ Millions) | Dec. 31, 2019 | Dec. 31, 2018 | ||||
| Accounts receivable and other | $ | 86 | $ | 92 | ||
| Cash and cash equivalents | 40 | 65 | ||||
| Total assets | 126 | 157 | ||||
| Debt obligations | 1,902 | 2,159 | ||||
| Capital securities | 1,722 | 2,112 | ||||
| Deferred tax liabilities | 101 | 91 | ||||
| Accounts payable and other liabilities | 938 | 1,032 | ||||
| Preferred equity | 420 | — | ||||
| Non-controlling interests | 17 | 18 | ||||
| Equity attributable to Unitholders | $ | (4,974 | ) | $ | (5,255 | ) |
The corporate balance sheet includes corporate debt and capital securities from our partnership. The increase in equity attributable to Unitholders is due to repayment of our credit facilities and redemptions of Class B Junior Preferred Shares of Brookfield BPY Holdings Inc., partially offset by an increase in loans and notes payable due to Brookfield Asset Management.
During the first quarter of 2019, we issued $178 million of our Class A Cumulative Redeemable Perpetual Preferred Units, Series 1 at a coupon rate of 6.5% per annum, payable quarterly in arrears.
During the third quarter of 2019, we issued $242 million of our Class A Cumulative Redeemable Perpetual Preferred Units, Series 2 at a coupon rate of 6.375% per annum, payable quarterly in arrears.
In addition, as of December 31, 2019, we had $15 million (2018 - $16 million) of preferred shares with a cumulative dividend rate of 5% outstanding. The preferred shares were issued by various holding entities of our partnership.
The following table provides additional information on our outstanding capital securities – corporate:
| (US$ Millions, except where noted) | Shares outstanding | Cumulative dividend rate | Dec. 31, 2019 | Dec. 31, 2018 | ||||||
| Operating Partnership Class A Preferred Equity Units: | ||||||||||
| Series 1 | 24,000,000 | 6.25 | % | $ | 574 | $ | 562 | |||
| Series 2 | 24,000,000 | 6.50 | % | 546 | 537 | |||||
| Series 3 | 24,000,000 | 6.75 | % | 530 | 523 | |||||
| Brookfield BPY Holdings Inc. Junior Preferred Shares: | ||||||||||
Class B Junior Preferred Shares(1) | — | 7.64 | % | — | 420 | |||||
| BOP Split Senior Preferred Shares: | ||||||||||
| Series 1 | 924,390 | 5.25 | % | 23 | 23 | |||||
| Series 2 | 699,165 | 5.75 | % | 13 | 13 | |||||
| Series 3 | 909,814 | 5.00 | % | 18 | 17 | |||||
| Series 4 | 940,486 | 5.20 | % | 18 | 17 | |||||
| Total capital securities | $ | 1,722 | $ | 2,112 | ||||||
(1) | In 2019, approximately $420 million of the Brookfield BPY Holdings Inc. Class B Junior Preferred Shares, held by Brookfield Asset Management, were redeemed. |
- 89 -
Reconciliation of Non-IFRS Measures – Corporate
The following table reconciles Corporate net income to net income attributable to Unitholders for the years ended December 31, 2019, 2018, and 2017:
| (US$ Millions) Years ended Dec. 31, | 2019 | 2018 | 2017 | ||||||
| Net income (loss) | $ | (491 | ) | $ | (47 | ) | $ | (465 | ) |
| Net income attributable to non-controlling interests of others in operating subsidiaries and properties | 1 | 1 | — | ||||||
| Net income attributable to Unitholders | $ | (492 | ) | $ | (48 | ) | $ | (465 | ) |
The following table reconciles Corporate net income to FFO for the years ended December 31, 2019, 2018, and 2017:
| (US$ Millions) Years ended Dec. 31, | 2019 | 2018 | 2017 | ||||||
| Net income (loss) | (491 | ) | (47 | ) | (465 | ) | |||
| Add (deduct): | |||||||||
| Fair value (gains) losses, net | 100 | (161 | ) | 36 | |||||
| Income tax (benefit) expense | (18 | ) | (226 | ) | — | ||||
| Non-controlling interests in above items | (1 | ) | — | 1 | |||||
| FFO | $ | (410 | ) | $ | (434 | ) | $ | (428 | ) |
RISKS AND UNCERTAINTIES
The financial results of our business are impacted by the performance of our properties and various external factors influencing the specific sectors and geographic locations in which we operate, including: macro-economic factors such as economic growth, changes in currency, inflation and interest rates; regulatory requirements and initiatives; and litigation and claims that arise in the normal course of business.
Our property investments are generally subject to varying degrees of risk depending on the nature of the property. These risks include changes in general economic conditions (including the availability and costs of mortgage funds), local conditions (including an oversupply of space or a reduction in demand for real estate in the markets in which we operate), the attractiveness of the properties to tenants, competition from other landlords with competitive space and our ability to provide adequate maintenance at an economical cost.
Certain significant expenditures, including property taxes, maintenance costs, mortgage payments, insurance costs and related charges, must be made regardless of whether a property is producing sufficient income to service these expenses. Certain properties are subject to mortgages which require substantial debt service payments. If we become unable or unwilling to meet mortgage payments on any property, losses could be sustained as a result of the mortgagee’s exercise of its rights of foreclosure or sale. We believe the stability and long-term nature of our contractual revenues effectively mitigates these risks.
We are affected by local, regional, national and international economic conditions and other events and occurrences that affect the markets in which we own assets. A protracted decline in economic conditions would cause downward pressure on our operating margins and asset values as a result of lower demand for space.
The majority of our properties are located in North America, Europe and Australia, with a growing presence in South America and Asia. A prolonged downturn in the economies of these regions would result in reduced demand for space and number of prospective tenants and will affect the ability of our properties to generate significant revenue. If there is an increase in operating costs resulting from inflation and other factors, we may not be able to offset such increases by increasing rents.
We are subject to risks that affect the retail environment, including unemployment, weak income growth, lack of available consumer credit, industry slowdowns and plant closures, consumer confidence, increased consumer debt, poor housing market conditions, adverse weather conditions, natural disasters, pandemics and the need to pay down existing obligations. All of these factors could negatively affect consumer spending, and adversely affect the sales of our retail tenants. This could have an unfavorable effect on our operations and our ability to attract new retail tenants. In addition, our retail tenants face competition from retailers at other regional malls, outlet malls and other discount shopping centers, discount shopping clubs, catalogue companies, and through internet sales and telemarketing. Competition of these types could reduce the percentage rent payable by certain retail tenants and adversely affect our revenues and cash flows.
- 90 -
As owners of office and retail properties, lease rollovers also present a risk, as continued growth of rental income is dependent on strong leasing markets to ensure expiring leases are renewed and new tenants are found promptly to fill vacancies. Refer to “Lease Rollover Risk” below for further details.
For a more detailed description of the risk factors facing our business, please refer to the section entitled Item 3.D. “Key Information - Risk Factors” elsewhere in this annual report on Form 20-F.
Credit Risk
Credit risk arises from the possibility that tenants may be unable to fulfill their lease commitments. We mitigate this risk by ensuring that our tenant mix is diversified and by limiting our exposure to any one tenant. We also maintain a portfolio that is diversified by property type so that exposure to a business sector is lessened. Government and government agencies comprise 7.6% of our Core Office segment tenant base and, as at December 31, 2019, no one tenant comprises more than this.
The following list shows the largest tenants by leasable area in our Core Office portfolio and their respective credit ratings and exposure as at December 31, 2019:
| Tenant | Primary Location | Credit Rating(1) | Exposure (%)(2) | |
| Government and Government Agencies | Various | AA+/AAA | 7.6 | % |
| Morgan Stanley | NY/London | A- | 2.7 | % |
| Barclays | London/Toronto/Calgary | BBB- | 2.1 | % |
CIBC World Markets(3) | Calgary//Toronto/NY | AA | 1.9 | % |
| Suncor Energy Inc. | Calgary | BBB+ | 1.8 | % |
| Cenovus | Calgary | BB+ | 1.5 | % |
| Bank of Montreal | Calgary/Toronto | AA | 1.5 | % |
| Deloitte | Various | Not Rated | 1.4 | % |
| Bank of America | Merrill Lynch | Various | A | 1.3 | % |
| Amazon | NY/London | A- | 1.3 | % |
| Total | 23.1 | % | ||
(1) | From Standard & Poor’s Rating Services, Moody’s Investment Services, Inc. or DBRS Limited. |
(2) | Exposure is a percentage of total leasable square feet. |
(3) | CIBC World Markets leases 1.1 million square feet at 300 Madison Avenue in New York, of which they sublease 940,000 square feet to PricewaterhouseCoopers LLP and approximately 100,000 square feet to Sumitomo Corporation of America. |
The following list reflects the largest tenants in our Core Retail portfolio as at December 31, 2019. The largest ten tenants in our portfolio accounted for approximately 21.3% of minimum rents, tenant recoveries and other.
| Tenant | Doing Business As: | Exposure (%)(1) | |
| L Brands, Inc. | Victoria's Secret, Bath & Body Works, PINK | 3.8 | % |
| Foot Locker, Inc. | Footlocker, Champs Sports, Footaction USA, House of Hoops | 2.9 | % |
| LVMH | Louis Vuitton, Sephora, Fendi, Bulgari, Dior, Tag Heuer | 2.7 | % |
| The Gap, Inc. | Gap, Banana Republic, Old Navy, Athleta | 2.3 | % |
| Forever 21 Retail, Inc. | Forever 21 | 2.0 | % |
| Signet Jewelers Limited | Zales, Gordon's, Kay, Jared | 1.6 | % |
| American Eagle Outfitters, Inc. | American Eagle, Aerie | 1.5 | % |
| Ascena Retail Group | Ann Taylor, Loft, Justice, Lane Bryant | 1.5 | % |
| Abercrombie & Fitch Stores, Inc. | Abercrombie, Abercrombie & Fitch, Hollister | 1.5 | % |
| Express, Inc. | Express, Express Men, Express Factory | 1.5 | % |
| Total | 21.3 | % | |
(1) | Exposure is a percentage of minimum rents and tenant recoveries. |
Lease Roll-over Risk
Lease roll-over risk arises from the possibility that we may experience difficulty renewing leases as they expire or in re-leasing space vacated by tenants upon early lease expiry. We attempt to stagger the lease expiry profile so that we are not faced with disproportionate amounts of space expiring in any one year. On average, approximately 7.6% of our Core Office and Core Retail leases mature annually up to 2024. Our Core Office and Core Retail leases have a weighted average remaining lease life of approximately 7.2 years. We further mitigate this risk by maintaining a diversified portfolio mix by geographic location and by pro-actively leasing space in advance of its contractual expiry.
- 91 -
The following table sets out lease expiries, by square footage, for our office, retail and logistics portfolios at December 31, 2019, including our unconsolidated investments:
| (Sq. ft. in thousands) | Current | 2020 | 2021 | 2022 | 2023 | 2024 | 2025 | 2026 | 2027 and | Total | |||||||||||
| Beyond | |||||||||||||||||||||
| Core Office | 5,614 | 1,825 | 3,612 | 5,820 | 3,627 | 3,882 | 5,276 | 4,406 | 43,416 | 77,478 | |||||||||||
| Expiring % | 7.2 | % | 2.4 | % | 4.7 | % | 7.5 | % | 4.7 | % | 5.0 | % | 6.8 | % | 5.7 | % | 56.0 | % | 100.0 | % | |
Core Retail(1) | 2,024 | 5,697 | 5,800 | 6,163 | 5,170 | 6,062 | 5,075 | 3,892 | 13,642 | 53,525 | |||||||||||
| Expiring % | 3.8 | % | 10.6 | % | 10.8 | % | 11.5 | % | 9.7 | % | 11.3 | % | 9.5 | % | 7.3 | % | 25.5 | % | 100.0 | % | |
(1) | Represents regional malls only and excludes traditional anchor and specialty leasing agreements. |
Tax Risk
We are subject to income taxes in various jurisdictions, and our tax liabilities are dependent upon the distribution of income among these different jurisdictions. Our effective income tax rate is influenced by a number of factors, including changes in tax law, tax treaties, interpretation of existing laws, and our ability to sustain our reporting positions on examination. Changes in any of those factors could change our effective tax rate, which could adversely affect our profitability and results of operations.
Environmental Risk
As an owner of real property, we are subject to various federal, provincial, state and municipal laws relating to environmental matters. Such laws provide that we could be liable for the costs of removing certain hazardous substances and remediating certain hazardous locations. The failure to remove such substances or remediate such locations, if any, could adversely affect our ability to sell such real estate or to borrow using such real estate as collateral and could potentially result in claims against us. We are not aware of any material non-compliance with environmental laws at any of our properties nor are we aware of any pending or threatened investigations or actions by environmental regulatory authorities in connection with any of our properties or any pending or threatened claims relating to environmental conditions at our properties.
We will continue to make the necessary capital and operating expenditures to ensure that we are compliant with environmental laws and regulations. Although there can be no assurances, we do not believe that costs relating to environmental matters will have a materially adverse effect on our business, financial condition or results of operations. However, environmental laws and regulations can change and we may become subject to more stringent environmental laws and regulations in the future, which could have an adverse effect on our business, financial condition or results of operations.
Economic Risk
Real estate is relatively illiquid. Such illiquidity may limit our ability to vary our portfolio promptly in response to changing economic or investment conditions. Also, financial difficulties of other property owners resulting in distressed sales could depress real estate values in the markets in which we operate.
Our commercial properties generate a relatively stable source of income from contractual tenant rent payments. Continued growth of rental income is dependent on strong leasing markets to ensure expiring leases are renewed and new tenants are found promptly to fill vacancies. We are substantially protected against short-term market conditions, as most of our leases are long-term in nature with an average term of over seven years.
Insurance Risk
Our insurance may not cover some potential losses or may not be obtainable at commercially reasonable rates. We maintain insurance on our properties in amounts and with deductibles that we believe are in line with what owners of similar properties carry. We maintain all risk property insurance and rental value coverage (including coverage for the perils of flood, earthquake and weather catastrophe).
- 92 -
Interest Rate and Financing Risk
We have an on-going need to access debt markets to refinance maturing debt as it comes due. There is a risk that lenders will not refinance such maturing debt on terms and conditions acceptable to us or on any terms at all. Our strategy to stagger the maturities of our mortgage portfolio attempts to mitigate our exposure to excessive amounts of debt maturing in any one year and to maintain relationships with a large number of lenders to limit exposure to any one counterparty.
Approximately 45% of our outstanding debt obligations at December 31, 2019 are floating rate debt compared to 47% at December 31, 2018. This debt is subject to fluctuations in interest rates. A 100 basis point increase in interest rates relating to our corporate and commercial floating rate debt obligations would result in an increase in annual interest expense of approximately $250 million. A 100 basis point increase in interest rates relating to fixed rate debt obligations due within one year would result in an increase in annual interest expense of approximately $7 million upon refinancing. In addition, we have exposure to interest rates within our equity accounted investments. We have mitigated, to some extent, the exposure to interest rate fluctuations through interest rate derivative contracts. See “Derivative Financial Instruments” below in this MD&A.
At December 31, 2019, our consolidated debt to capitalization was 54% (December 31, 2018 – 56%). It is our view this level of indebtedness is conservative given the cash flow characteristics of our properties and the fair value of our assets. Based on this, we believe that all debts will be financed or repaid as they come due in the foreseeable future.
Foreign Exchange Risk
As at and for the year ended December 31, 2019, approximately 31% of our assets and 28% of our revenues originated outside the United States and consequently are subject to foreign currency risk due to potential fluctuations in exchange rates between these currencies and the U.S. Dollar. To mitigate this risk, we attempt to maintain a natural hedged position with respect to the carrying value of assets through debt agreements denominated in local currencies and, from time to time, supplemented through the use of derivative contracts as discussed under “Derivative Financial Instruments”.
The following table shows the impact of a 10% change in foreign exchange rates on net income and other comprehensive income:
| Dec. 31, 2019 | |||||||||
| (Millions) | Equity attributable to Unitholders | OCI | Net income | ||||||
Canadian Dollar(1) | C$ | 377 | $ | (29 | ) | $ | — | ||
| Australian Dollar | A$ | 2,154 | (151 | ) | — | ||||
| British Pound | £ | 3,275 | (434 | ) | — | ||||
| Euro | € | 339 | (38 | ) | — | ||||
| Brazilian Real | R$ | 3,310 | (82 | ) | — | ||||
| Indian Rupee | Rs | 26,628 | (37 | ) | — | ||||
| Chinese Yuan | C¥ | 933 | (13 | ) | — | ||||
| South Korean Won | ₩ | 160,969 | (14 | ) | — | ||||
| United Arab Emirates Dirham | AED | 683 | (19 | ) | — | ||||
| Czech Koruna | CZK | 10 | — | — | |||||
| Hungarian Forint | HUF | 314 | — | — | |||||
| Poland Zloty | PLN | 3 | — | — | |||||
| Total | $ | (817 | ) | $ | — | ||||
(1) | Net of Canadian Dollar denominated loans. |
- 93 -
| Dec. 31, 2018 | |||||||||
| (Millions) | Equity attributable to Unitholders | OCI | Net income | ||||||
Canadian Dollar(1) | C$ | 58 | $ | (4 | ) | $ | — | ||
| Australian Dollar | A$ | 2,977 | (210 | ) | — | ||||
| British Pound | £ | 3,965 | (506 | ) | — | ||||
| Euro | € | 505 | (58 | ) | — | ||||
| Brazilian Real | R$ | 2,823 | (73 | ) | — | ||||
| Indian Rupee | Rs | 25,022 | (36 | ) | — | ||||
| Hong Kong Dollar | HK$ | (75 | ) | 1 | — | ||||
| Chinese Yuan | C¥ | 1,593 | (23 | ) | — | ||||
| South Korean Won | ₩ | 245,507 | (22 | ) | — | ||||
| United Arab Emirates Dirham | AED | 451 | (12 | ) | — | ||||
| Total | $ | (943 | ) | $ | — | ||||
(1) | Net of Canadian Dollar denominated loans. |
| Dec. 31, 2017 | |||||||||
| (Millions) | Equity attributable to Unitholders | OCI | Net income | ||||||
Canadian Dollar(1) | C$ | 4 | $ | — | $ | — | |||
| Australian Dollar | A$ | 2,679 | (209 | ) | — | ||||
| British Pound | £ | 3,719 | (503 | ) | — | ||||
| Euro | € | 213 | (26 | ) | — | ||||
| Brazilian Real | R$ | 2,591 | (78 | ) | — | ||||
| Indian Rupee | Rs | 15,904 | (25 | ) | — | ||||
| Hong Kong Dollar | HK$ | (75 | ) | 1 | — | ||||
| Chinese Yuan | C¥ | 1,207 | (19 | ) | — | ||||
| South Korean Won | ₩ | 232,345 | (22 | ) | — | ||||
| United Arab Emirates Dirham | AED | 451 | (12 | ) | — | ||||
| Total | $ | (893 | ) | $ | — | ||||
(1) | Net of Canadian Dollar denominated loans. |
- 94 -
DERIVATIVE FINANCIAL INSTRUMENTS
We and our operating entities use derivative and non-derivative instruments to manage financial risks, including interest rate, commodity, equity price and foreign exchange risks. The use of derivative contracts is governed by documented risk management policies and approved limits. We do not use derivatives for speculative purposes. We and our operating entities use the following derivative instruments to manage these risks:
| • | Foreign currency forward contracts to hedge exposures to Canadian Dollar, Australian Dollar, British Pound, Euro, Chinese Yuan, Brazilian Real, Indian Rupee and South Korean Won denominated investments in foreign subsidiaries and foreign currency denominated financial assets; |
| • | Interest rate swaps to manage interest rate risk associated with planned refinancings and existing variable rate debt; |
| • | Interest rate caps to hedge interest rate risk on certain variable rate debt; and |
| • | Cross currency swaps to manage interest rate and foreign currency exchange rates on existing variable rate debt. |
We also designate Canadian Dollar financial liabilities of certain of our operating entities as hedges of our net investments in our Canadian operations.
Interest Rate Hedging
The following table provides our partnership’s outstanding derivatives that are designated as cash flow hedges of variability in interest rates associated with forecasted fixed rate financings and existing variable rate debt as of December 31, 2019 and 2018:
| (US$ Millions) | Hedging item | Notional | Rates | Maturity dates | Fair value | ||||
| Dec. 31, 2019 | Interest rate caps of US$ LIBOR debt | $ | 7,774 | 2.7% - 6.0% | May. 2020 - Sep. 2023 | $ | — | ||
| Interest rate swaps of US$ LIBOR debt | 2,877 | 1.4% - 2.7% | Feb. 2020 - Feb. 2024 | (57 | ) | ||||
| Interest rate caps of £ LIBOR debt | 3,096 | 2.0% - 2.5% | Jan. 2021 - Jan. 2022 | — | |||||
| Interest rate swaps of £ LIBOR debt | 74 | 1.5% | Apr. 2020 | — | |||||
| Interest rate caps of € EURIBOR debt | 109 | 1.3% | Apr. 2021 | — | |||||
| Interest rate caps of C$ LIBOR debt | 184 | 3.0% | Oct. 2020 - Oct. 2022 | — | |||||
| Cross currency swaps of C$ LIBOR Debt | 600 | 4.3% - 5.0% | Oct. 2021 - Mar. 2024 | (95 | ) | ||||
| Dec. 31, 2018 | Interest rate caps of US$ LIBOR debt | $ | 8,180 | 2.3% - 6.0% | Jan. 2019 - Sep. 2023 | $ | 2 | ||
| Interest rate swaps of US$ LIBOR debt | 1,731 | 1.6% - 2.8% | Feb. 2020 - May 2024 | (2 | ) | ||||
| Interest rate caps of £ LIBOR debt | 486 | 2.0% | Apr. 2020 - Jan. 2021 | — | |||||
| Interest rate swaps of £ LIBOR debt | 67 | 1.5% | Apr. 2020 | — | |||||
| Interest rate caps of € EURIBOR debt | 115 | 1.0% - 1.3% | Apr. 2020 - Apr. 2021 | — | |||||
| Interest rate caps of C$ LIBOR debt | 176 | 3.0% | Oct. 2020 - Oct. 2022 | — | |||||
| Interest rate swaps of C$ LIBOR debt | 56 | 4.6% | Sep. 2023 | — | |||||
| Interest rate swaps on forecasted fixed rate debt | 100 | 4.0% | Jun. 2019 | (114 | ) | ||||
For the year ended December 31, 2019, the amount of hedge ineffectiveness recorded in earnings in connection with our partnership’s interest rate hedging activities totaled $22 million. (December 31, 2018 - $37 million).
- 95 -
Foreign Currency Hedging
The following table presents the partnership's outstanding derivatives that are designated as net investment hedges in foreign subsidiaries or cash flow hedges as of December 31, 2019 and 2018:
| (US$ Millions) | Hedging item | Net Notional | Rates | Maturity dates | Fair value | ||||
| Dec. 31, 2019 | Net investment hedges | € | 245 | €0.85/$ - €0.91/$ | Mar. 2020 - Jul. 2020 | 7 | |||
| Net investment hedges | £ | 2,444 | £0.74/$ - £0.85/$ | Jan. 2020 - Sep. 2021 | (247 | ) | |||
| Net investment hedges | A$ | 238 | A$1.38/$ - A$1.48/$ | Mar. 2020 - Mar. 2021 | (5 | ) | |||
| Net investment hedges | C¥ | 962 | C¥6.75/$ - C¥7.16/$ | Apr. 2020 - Jun. 2021 | — | ||||
| Net investment hedges | C$ | 355 | C$1.31/$ - C$1.33/$ | Jun. 2020 - Sep. 2021 | — | ||||
| Net investment hedges | R$ | 1,582 | R$4.16/$ - R$4.16/$ | Jun. 2020 - Jun. 2020 | (10 | ) | |||
| Net investment hedges | ₩ | 720,095 | ₩1,149.50/$ - ₩1,174.30/$ | Mar. 2020 - Mar. 2021 | (7 | ) | |||
| Net investment hedges | Rs | — | Rs71.78/$ - Rs73.01/$ | Mar. 2020 - Apr. 2020 | — | ||||
| Net investment hedges | £ | 77 | £0.88/€ - £0.93/€ | Jan. 2020 - Apr. 2021 | — | ||||
| Cross currency swaps of C$ LIBOR debt | C$ | 800 | C$1.29/$ - C$1.33/$ | Oct. 2021 - Jul. 2023 | (8 | ) | |||
| Dec. 31, 2018 | Net investment hedges | € | 649 | €0.78/$ - €0.88/$ | Jan. 2019 - May 2020 | $ | 13 | ||
| Net investment hedges | £ | 3,175 | £0.70/$ - £0.79/$ | Feb. 2019 - Mar. 2020 | 104 | ||||
| Net investment hedges | A$ | 1,038 | A$1.28/$ - A$1.42/$ | Jan. 2019 - Mar. 2020 | 20 | ||||
| Net investment hedges | C¥ | 2,672 | C¥6.35/$ - C¥6.91/$ | Jan. 2019 - Nov. 2019 | 6 | ||||
| Net investment hedges | C$ | 118 | C$1.29/$ - C$1.34/$ | Oct. 2019 - Nov 2019 | 4 | ||||
| Net investment hedges | R$ | 158 | R$3.90/$ - R$4.24/$ | Jan. 2019 - Jun. 2019 | (9 | ) | |||
| Net investment hedges | ₩ | 618,589 | ₩1,087.00/$ - ₩1,130.90/$ | Jan. 2019 - Nov. 2019 | 1 | ||||
| Net investment hedges | Rs | 31,422 | Rs67.44/$ - Rs70.39/$ | Feb. 2019 - May 2019 | 3 | ||||
| Net investment hedges | £ | 77 | £0.88/€ - £0.92/€ | Jan. 2019 - Feb. 2020 | (1 | ) | |||
| Cross currency swaps of C$ LIBOR debt | C$ | 800 | C$1.29/$ - C$1.33/$ | Oct. 2021 - Jul. 2023 | (31 | ) | |||
For the years ended December 31, 2019 and 2018, the amount of hedge ineffectiveness recorded in earnings in connection with the partnership’s foreign currency hedging activities was not significant.
Other Derivatives
The following tables provide detail of the partnership’s other derivatives, not designated as hedges for accounting purposes, that have been entered into to manage financial risks as of December 31, 2019 and December 31, 2018:
| (US$ millions) | Derivative type | Notional | Rates | Maturity dates | Fair value | ||||
| Dec. 31, 2019 | Interest rate caps | $ | 5,663 | 2.5% - 5.0% | Mar. 2020 - Nov. 2021 | $ | — | ||
| Interest rate swaps on forecasted fixed rate debt | 1,285 | 1.1% - 6.4% | Jun. 2020 - Sep. 2031 | (149 | ) | ||||
| Interest rate swaps of US$ debt | 2,003 | 1.7% - 4.6% | Nov. 2020 - Sep. 2023 | (14 | ) | ||||
| Dec. 31, 2018 | Interest rate caps | $ | 9,750 | 3.0% - 7.0% | Mar. 2019 - Jan. 2022 | $ | 1 | ||
| Interest rate swaps on forecasted fixed rate debt | 1,660 | 2.3% - 6.1% | Jun. 2019 - Nov. 2030 | (67 | ) | ||||
| Interest rate swaps of US$ debt | 835 | 2.4% - 5.8% | Jul. 2019 - Oct. 2039 | (14 | ) | ||||
| Interest rate swaps on fixed rate debt | 180 | 4.5% - 7.3% | Feb. 2019 - Jul. 2023 | 2 | |||||
Our partnership recognized fair value (losses) gains, net of approximately $(70) million (December 31, 2018 - gain of $29 million) related to the settlement of certain forward starting interest rate swaps that have not been designated as hedges.
RELATED PARTIES
In the normal course of operations, the partnership enters into transactions with related parties. These transactions are recognized in the consolidated financial statements. These transactions have been measured at exchange value and are recognized in the consolidated financial statements. The immediate parent of the partnership is the BPY General Partner. The ultimate parent of the partnership is Brookfield Asset Management. Other related parties of the partnership include the partnership’s and Brookfield Asset Management’s subsidiaries and operating entities, certain joint ventures and associates accounted for under the equity method, as well as officers of such entities and their spouses.
The partnership has a management agreement with its service providers, wholly-owned subsidiaries of Brookfield Asset Management. Pursuant to a Master Services Agreement, the partnership pays a base management fee (“base management fee”), to
- 96 -
the service providers equal to 0.5% of the total capitalization of the partnership, subject to an annual minimum of $50 million, plus annual inflation adjustments. The calculation of the equity enhancement distribution is reduced by the amount by which the base management fee is greater than $50 million per annum, plus annual inflation adjustments, to maintain a fee level in aggregate that would be the same as prior to the amendment. In connection with the GGP acquisition, the Master Services Agreement was amended so that the base management fee took into account any management fee payable by BPR under its master services agreement with Brookfield Asset Management and certain of its subsidiaries.
The base management fee for the year ended December 31, 2019 was $107 million (2018 - $83 million, 2017 - $104 million). The equity enhancement distribution for the year ended December 31, 2019 was $26 million (2018 - $1 million, 2017 - $26 million).
In connection with the issuance of Preferred Equity Units to the Class A Preferred Unitholder in 2014, Brookfield Asset Management has contingently agreed to acquire the seven-year and ten-year tranches of Preferred Equity Units from the Class A Preferred Unitholder for the initial issuance price plus accrued and unpaid distributions and to exchange such units for Preferred Equity Units with terms and conditions substantially similar to the twelve-year tranche to the extent that the market price of the LP Units is less than 80% of the exchange price at maturity.
The following table summarizes transactions and balances with related parties:
| (US$ Millions) | Dec. 31, 2019 | Dec. 31, 2018 | ||||
| Balances outstanding with related parties: | ||||||
| Participating loan interests | $ | — | $ | 268 | ||
| Net (payables)/receivables within equity accounted investments | (81 | ) | (26 | ) | ||
Loans and notes receivable(1) | 102 | 54 | ||||
| Receivables and other assets | 17 | 50 | ||||
Deposit and promissory note from Brookfield Asset Management(2) | — | (733 | ) | |||
Property-specific obligations(3) | — | (231 | ) | |||
| Loans and notes payable and other liabilities | (196 | ) | (50 | ) | ||
Capital securities held by Brookfield Asset Management(4) | — | (420 | ) | |||
| Preferred shares held by Brookfield Asset Management | (15 | ) | (15 | ) | ||
(1) | At December 31, 2019, includes nil (December 31, 2018 - $54 million) receivable from Brookfield Asset Management upon the earlier of the exercise of our option to convert our participating loan interests into direct ownership of the Australian portfolio or the maturity of the participating loan interests. |
(2) | The deposit and promissory note from Brookfield Asset Management were repaid during the year ended December 31, 2019. |
(3) | We exercised our option to acquire properties in Australia from Brookfield Asset Management during the year, therefore the property-specific obligations are now consolidated. |
(4) | In 2019, approximately $420 million of the Brookfield BPY Holdings Inc. Class B Junior Preferred Shares, held by Brookfield Asset Management, were redeemed. |
| (US$ Millions) Years ended Dec. 31, | 2019 | 2018 | 2017 | ||||||
| Transactions with related parties: | |||||||||
Commercial property revenue(1) | $ | 26 | $ | 22 | $ | 19 | |||
| Management fee income | 35 | 5 | 6 | ||||||
| Participating loan interests (including fair value gains, net) | 50 | 53 | 86 | ||||||
| Interest expense on debt obligations | 48 | 44 | 29 | ||||||
| Interest on capital securities held by Brookfield Asset Management | 8 | 64 | 83 | ||||||
General and administrative expense(2) | 198 | 192 | 204 | ||||||
Construction costs(3) | 411 | 397 | 295 | ||||||
Incentive Fees(4) | 104 | — | — | ||||||
(1) | Amounts received from Brookfield Asset Management and its subsidiaries for the rental of office premises. |
(2) | Includes amounts paid to Brookfield Asset Management and its subsidiaries for management fees, management fees associated with the Brookfield-sponsored real estate opportunistic funds, and administrative services. |
(3) | Includes amounts paid to Brookfield Asset Management and its subsidiaries for construction costs of development properties. |
(4) | Represents incentive fees the partnership is obligated to pay to the general partner of the partnership’s various fund investments. |
During the fourth quarter of 2019, we converted our economic interest, through our participating loan agreements, in a portfolio of properties in Australia owned by Brookfield Asset Management into direct ownership interests.
During the third and fourth quarters of 2019, we sold partial interest in two multifamily developments in Brooklyn, NY and a retail development in Connecticut into the BOZ fund. Upon the final close of BOZ fund in the fourth quarter of 2019, our interests in these development assets were diluted, which resulted in the deconsolidation of the assets and accounting classification as a financial asset.
- 97 -
During the first quarter of 2018, we along with BPREP acquired a 25% and 75% interest, respectively, in 333 West 34th Street, an office building in New York for $255 million.
During the third quarter of 2018, we sold 27.5% of our interest in a portfolio of operating and development assets in New York. We retain control over and will continue to consolidate these assets after the sale. The interest was sold to Brookfield Asset Management for consideration of approximately $1.4 billion.
During the fourth quarter of 2018, we launched BPREP Australia, an open-ended fund. We contributed interests in Jessie Street, 52 Goulburn Street and 680 George Street in Sydney and 235 St Georges Terrace in Perth to BPREP Australia. Our interest in BPREP Australia is 39%, with the remaining interest of 61% held by external investors. We will continue to consolidate the properties contributed to BPREP Australia, except for 680 George Street, which we will continue to account for under the equity method.
- 98 -
PORTFOLIO LISTING
The following table presents details of our property portfolio as of December 31, 2019:
| Core Office Property Portfolio | Assets under management | Proportionate at subsidiary level(1) | Proportionate to Unitholders(2) | Proportionate to LP Unitholders(3) | |||||||||||||||||||||||||||||
| Dec. 31, 2019 | Number of properties | % Leased | Leasable | Parking | Total | Owned % | Leasable | Total | Leasable | Total | Leasable | Total | |||||||||||||||||||||
| (Sq. ft in 000’s) | |||||||||||||||||||||||||||||||||
| CONSOLIDATED PROPERTIES | |||||||||||||||||||||||||||||||||
| United States | |||||||||||||||||||||||||||||||||
| Midtown New York | 2 | 100.0 | % | 1,466 | 31 | 1,497 | 80.9 | % | 1,194 | 1,211 | 1,194 | 1,211 | 599 | 608 | |||||||||||||||||||
| Downtown New York | 6 | 96.5 | % | 7,950 | 488 | 8,438 | 72.6 | % | 5,769 | 6,123 | 5,769 | 6,123 | 2,892 | 3,070 | |||||||||||||||||||
| Washington, D.C. | 12 | 91.6 | % | 2,887 | 1,796 | 4,683 | 94.1 | % | 2,719 | 4,407 | 2,719 | 4,407 | 1,363 | 2,209 | |||||||||||||||||||
| Los Angeles | 8 | 83.3 | % | 8,620 | 4,283 | 12,903 | 47.3 | % | 4,078 | 6,104 | 4,078 | 6,104 | 2,045 | 3,061 | |||||||||||||||||||
| Houston | 5 | 81.4 | % | 5,022 | 1,185 | 6,207 | 86.6 | % | 4,363 | 5,373 | 4,363 | 5,373 | 2,188 | 2,694 | |||||||||||||||||||
| San Francisco | 2 | 86.0 | % | 623 | 6 | 629 | 33.1 | % | 206 | 208 | 206 | 208 | 104 | 105 | |||||||||||||||||||
| 35 | 88.8 | % | 26,568 | 7,789 | 34,357 | 68.2 | % | 18,329 | 23,426 | 18,329 | 23,426 | 9,191 | 11,747 | ||||||||||||||||||||
| Canada | |||||||||||||||||||||||||||||||||
| Toronto | 10 | 98.7 | % | 8,780 | 1,704 | 10,484 | 55.7 | % | 4,835 | 5,844 | 4,835 | 5,844 | 2,425 | 2,931 | |||||||||||||||||||
| Calgary | 9 | 93.4 | % | 7,176 | 1,215 | 8,391 | 58.7 | % | 4,307 | 4,923 | 4,307 | 4,923 | 2,160 | 2,469 | |||||||||||||||||||
| Ottawa | 5 | 91.3 | % | 1,180 | 696 | 1,876 | 25.1 | % | 298 | 471 | 298 | 471 | 150 | 237 | |||||||||||||||||||
| 24 | 96.0 | % | 17,136 | 3,615 | 20,751 | 54.2 | % | 9,440 | 11,238 | 9,440 | 11,238 | 4,735 | 5,637 | ||||||||||||||||||||
| Australia and New Zealand | |||||||||||||||||||||||||||||||||
| Sydney | 1 | 99.5 | % | 248 | 74 | 322 | 24.1 | % | 60 | 78 | 60 | 78 | 30 | 39 | |||||||||||||||||||
| Melbourne | 2 | 99.9 | % | 509 | 15 | 524 | 49.5 | % | 252 | 260 | 252 | 260 | 127 | 131 | |||||||||||||||||||
| Brisbane | 1 | 86.6 | % | 301 | 34 | 335 | 49.9 | % | 151 | 167 | 151 | 167 | 76 | 84 | |||||||||||||||||||
| Perth | 4 | 95.2 | % | 1,886 | 271 | 2,157 | 81.4 | % | 1,535 | 1,755 | 1,535 | 1,755 | 770 | 880 | |||||||||||||||||||
| 8 | 95.5 | % | 2,944 | 394 | 3,338 | 67.7 | % | 1,998 | 2,260 | 1,998 | 2,260 | 1,003 | 1,134 | ||||||||||||||||||||
| United Kingdom | |||||||||||||||||||||||||||||||||
| London | 3 | 95.6 | % | 509 | 16 | 525 | 100.0 | % | 509 | 525 | 509 | 525 | 255 | 263 | |||||||||||||||||||
| 3 | 95.6 | % | 509 | 16 | 525 | 100.0 | % | 509 | 525 | 509 | 525 | 255 | 263 | ||||||||||||||||||||
| Brazil | |||||||||||||||||||||||||||||||||
| São Paulo | 1 | 100.0 | % | 276 | 209 | 485 | 51.0 | % | 141 | 248 | 141 | 248 | 71 | 125 | |||||||||||||||||||
| Rio de Janeiro | 1 | 100.0 | % | 213 | 64 | 277 | 67.0 | % | 142 | 185 | 142 | 185 | 72 | 94 | |||||||||||||||||||
| 2 | 100.0 | % | 489 | 273 | 762 | 26.7 | % | 283 | 433 | 283 | 433 | 143 | 219 | ||||||||||||||||||||
| Total Consolidated Properties | 72 | 92.0 | % | 47,646 | 12,087 | 59,733 | 63.4 | % | 30,559 | 37,882 | 30,559 | 37,882 | 15,327 | 19,000 | |||||||||||||||||||
| UNCONSOLIDATED PROPERTIES | |||||||||||||||||||||||||||||||||
| United States | |||||||||||||||||||||||||||||||||
| Midtown New York | 3 | 93.1 | % | 3,477 | 87 | 3,564 | 36.4 | % | 1,255 | 1,284 | 1,255 | 1,284 | 1,051 | 1,066 | |||||||||||||||||||
| Downtown New York | 2 | 97.0 | % | 4,927 | 65 | 4,992 | 23.2 | % | 1,149 | 1,156 | 1,149 | 1,156 | 573 | 576 | |||||||||||||||||||
| Washington, D.C. | 12 | 90.7 | % | 2,963 | 959 | 3,922 | 42.5 | % | 1,255 | 1,658 | 1,255 | 1,658 | 626 | 827 | |||||||||||||||||||
| Los Angeles | 2 | 92.0 | % | 371 | 389 | 760 | 42.0 | % | 157 | 321 | 157 | 321 | 78 | 160 | |||||||||||||||||||
| Houston | 1 | 98.9 | % | 1,135 | 699 | 1,834 | 10.0 | % | 113 | 183 | 113 | 183 | 56 | 91 | |||||||||||||||||||
| Denver | 1 | 88.2 | % | 1,337 | 512 | 1,849 | 50.0 | % | 669 | 924 | 669 | 924 | 334 | 461 | |||||||||||||||||||
| 21 | 93.9 | % | 14,210 | 2,711 | 16,921 | 32.8 | % | 4,598 | 5,526 | 4,598 | 5,526 | 2,718 | 3,181 | ||||||||||||||||||||
| Australia and New Zealand | |||||||||||||||||||||||||||||||||
| Sydney | 1 | 100.0 | % | 731 | 134 | 865 | 24.0 | % | 176 | 208 | 176 | 208 | 88 | 104 | |||||||||||||||||||
| Melbourne | 1 | 99.9 | % | 858 | 341 | 1,199 | 50.0 | % | 429 | 599 | 429 | 599 | 214 | 299 | |||||||||||||||||||
| 2 | 99.9 | % | 1,589 | 475 | 2,064 | 39.1 | % | 605 | 807 | 605 | 807 | 302 | 403 | ||||||||||||||||||||
| United Kingdom | |||||||||||||||||||||||||||||||||
| London | 25 | 96.1 | % | 9,716 | 1,152 | 10,868 | 43.7 | % | 4,180 | 4,749 | 4,180 | 4,749 | 2,086 | 2,370 | |||||||||||||||||||
| 25 | 96.1 | % | 9,716 | 1,152 | 10,868 | 43.7 | % | 4,180 | 4,749 | 4,180 | 4,749 | 2,086 | 2,370 | ||||||||||||||||||||
| Germany | |||||||||||||||||||||||||||||||||
| Berlin | 16 | 88.8 | % | 2,478 | 1,169 | 3,647 | 25.0 | % | 620 | 913 | 620 | 912 | 310 | 456 | |||||||||||||||||||
| 16 | 88.8 | % | 2,478 | 1,169 | 3,647 | 25.0 | % | 620 | 913 | 620 | 912 | 310 | 456 | ||||||||||||||||||||
| Total Unconsolidated Properties | 64 | 94.6 | % | 27,993 | 5,507 | 33,500 | 35.9 | % | 10,003 | 11,995 | 10,003 | 11,994 | 5,416 | 6,410 | |||||||||||||||||||
| Total Core Office Properties | 136 | 92.9 | % | 75,639 | 17,594 | 93,233 | 53.5 | % | 40,562 | 49,877 | 40,562 | 49,876 | 20,743 | 25,410 | |||||||||||||||||||
(1) | Reflects our partnership’s interest before considering non-controlling interests in operating subsidiaries. |
(2) | Reflects our partnership’s interest net of non-controlling interests described in note (1) above. |
(3) | Reflects our partnership’s proportionate interest net of non-controlling interests described in note (2) above and the Redeemable/Exchangeable Partnership Units and Special LP Units held by Brookfield Asset Management and Exchange LP Units. |
- 99 -
| Opportunistic Office Property Portfolio | Assets under management | Proportionate at subsidiary level(1) | Proportionate to Unitholders(2) | Proportionate to LP Unitholders(3) | |||||||||||||||||||||||||||||
| Dec. 31, 2019 | Number of properties | % Leased | Leasable | Parking | Total | Owned % | Leasable | Total | Leasable | Total | Leasable | Total | |||||||||||||||||||||
| (Sq. ft in 000’s) | |||||||||||||||||||||||||||||||||
| CONSOLIDATED PROPERTIES | |||||||||||||||||||||||||||||||||
| United States | |||||||||||||||||||||||||||||||||
| Washington, D.C. | 13 | 81.2 | % | 2,048 | — | 2,048 | 100.0 | % | 2,048 | 2,048 | 523 | 523 | 262 | 262 | |||||||||||||||||||
| Los Angeles | 2 | 18.1 | % | 1,980 | 782 | 2,762 | 100.0 | % | 1,980 | 2,763 | 510 | 711 | 256 | 357 | |||||||||||||||||||
| Chicago | 1 | 61.4 | % | 1,448 | — | 1,448 | 100.0 | % | 1,448 | 1,448 | 370 | 370 | 186 | 186 | |||||||||||||||||||
| San Francisco / San Jose | 2 | 73.5 | % | 409 | — | 409 | 100.0 | % | 409 | 409 | 105 | 105 | 53 | 53 | |||||||||||||||||||
| Houston | 5 | 69.6 | % | 4,207 | 571 | 4,778 | 100.0 | % | 4,207 | 4,778 | 1,075 | 1,221 | 539 | 612 | |||||||||||||||||||
| Dallas | 6 | 67.9 | % | 467 | — | 467 | 100.0 | % | 467 | 467 | 142 | 142 | 71 | 71 | |||||||||||||||||||
| 29 | 61.1 | % | 10,559 | 1,353 | 11,912 | 100.0 | % | 10,559 | 11,913 | 2,725 | 3,072 | 1,367 | 1,541 | ||||||||||||||||||||
| United Kingdom | |||||||||||||||||||||||||||||||||
| London | 1 | 97.5 | % | 661 | 48 | 709 | 100.0 | % | 661 | 709 | 203 | 218 | 102 | 109 | |||||||||||||||||||
| 1 | 97.5 | % | 661 | 48 | 709 | 100.0 | % | 661 | 709 | 203 | 218 | 102 | 109 | ||||||||||||||||||||
| Brazil | |||||||||||||||||||||||||||||||||
| Rio de Janeiro | 5 | 91.5 | % | 1,720 | — | 1,720 | 100.0 | % | 1,720 | 1,720 | 554 | 554 | 278 | 278 | |||||||||||||||||||
| São Paulo | 4 | 73.5 | % | 1,221 | — | 1,221 | 100.0 | % | 1,221 | 1,221 | 394 | 394 | 198 | 198 | |||||||||||||||||||
| 9 | 84.0 | % | 2,941 | — | 2,941 | 100.0 | % | 2,941 | 2,941 | 948 | 948 | 476 | 476 | ||||||||||||||||||||
| India | |||||||||||||||||||||||||||||||||
| NCR (Delhi region) | 41 | 90.6 | % | 11,431 | 6,581 | 18,012 | 90.5 | % | 10,348 | 16,306 | 3,386 | 5,335 | 1,698 | 2,675 | |||||||||||||||||||
| Kolkata | 12 | 90.8 | % | 3,055 | 1,097 | 4,152 | 100.0 | % | 3,055 | 4,152 | 1,000 | 1,358 | 501 | 681 | |||||||||||||||||||
| Mumbai | 21 | 87.6 | % | 5,551 | — | 5,551 | 100.0 | % | 5,551 | 5,551 | 1,789 | 1,789 | 897 | 897 | |||||||||||||||||||
| 74 | 89.8 | % | 20,037 | 7,678 | 27,715 | 93.8 | % | 18,954 | 26,009 | 6,175 | 8,482 | 3,096 | 4,253 | ||||||||||||||||||||
| Total Consolidated Properties | 113 | 80.6 | % | 34,198 | 9,079 | 43,277 | 96.1 | % | 33,115 | 41,572 | 10,051 | 12,720 | 5,041 | 6,379 | |||||||||||||||||||
| Total Opportunistic Office Properties | 113 | 80.6 | % | 34,198 | 9,079 | 43,277 | 96.1 | % | 33,115 | 41,572 | 10,051 | 12,720 | 5,041 | 6,379 | |||||||||||||||||||
(1) | Reflects our partnership’s interest before considering non-controlling interests in operating subsidiaries. |
(2) | Reflects our partnership’s interest net of non-controlling interests described in note (1) above. |
(3) | Reflects our partnership’s proportionate interest net of non-controlling interests described in note (2) above and the Redeemable/Exchangeable Partnership Units and Special LP Units held by Brookfield Asset Management and Exchange LP Units. |
Core Retail Property Portfolio(1) | Assets under management | Proportionate at subsidiary level(2) | Proportionate to Unitholders(3) | Proportionate to LP Unitholders(4) | |||||||||||||||||
| Dec. 31, 2019 | Number of properties | % Leased | Total | Owned % | Total | Total | Total | ||||||||||||||
| (Sq. ft. in 000’s) | |||||||||||||||||||||
| CONSOLIDATED PROPERTIES | |||||||||||||||||||||
| U.S. Properties | |||||||||||||||||||||
| Pacific region | 9 | 95.4 | % | 5,871 | 99.7 | % | 5,855 | 4,321 | 2,167 | ||||||||||||
| Southwest region | 10 | 96.4 | % | 11,353 | 99.7 | % | 11,322 | 5,159 | 2,587 | ||||||||||||
| East North Central region | 7 | 96.4 | % | 5,943 | 99.7 | % | 5,927 | 3,663 | 1,837 | ||||||||||||
| Southeast region | 5 | 96.3 | % | 5,486 | 99.7 | % | 5,471 | 3,109 | 1,559 | ||||||||||||
| Mideast region | 8 | 95.9 | % | 7,382 | 98.1 | % | 7,239 | 4,313 | 2,163 | ||||||||||||
| Mountain region | 5 | 94.2 | % | 5,035 | 99.7 | % | 5,021 | 2,556 | 1,282 | ||||||||||||
| Northeast region | 13 | 94.7 | % | 9,502 | 99.0 | % | 9,408 | 5,845 | 2,931 | ||||||||||||
| West North Central region | 5 | 94.8 | % | 4,686 | 99.7 | % | 4,673 | 2,908 | 1,458 | ||||||||||||
| Total Consolidated Properties | 62 | 95.6 | % | 55,258 | 99.4 | % | 54,916 | 31,874 | 15,984 | ||||||||||||
| UNCONSOLIDATED PROPERTIES | |||||||||||||||||||||
| U.S. Properties | |||||||||||||||||||||
| Pacific region | 10 | 97.6 | % | 10,649 | 49.7 | % | 5,298 | 3,368 | 1,689 | ||||||||||||
| Southwest region | 7 | 98.8 | % | 10,218 | 48.7 | % | 4,972 | 2,489 | 1,248 | ||||||||||||
| East North Central region | 7 | 95.6 | % | 7,755 | 49.4 | % | 3,830 | 2,752 | 1,380 | ||||||||||||
| Southeast region | 11 | 94.7 | % | 10,722 | 47.6 | % | 5,106 | 2,849 | 1,429 | ||||||||||||
| Mideast region | 8 | 96.1 | % | 8,299 | 46.6 | % | 3,869 | 2,181 | 1,094 | ||||||||||||
| Mountain region | 7 | 97.3 | % | 8,209 | 50.6 | % | 4,155 | 2,447 | 1,227 | ||||||||||||
| Northeast region | 5 | 97.3 | % | 4,780 | 46.1 | % | 2,206 | 1,307 | 655 | ||||||||||||
| West North Central region | 5 | 96.5 | % | 4,636 | 57.1 | % | 2,645 | 1,256 | 630 | ||||||||||||
| Total Unconsolidated Properties | 60 | 96.7 | % | 65,268 | 49.2 | % | 32,081 | 18,649 | 9,352 | ||||||||||||
| Total Core Retail Properties | 122 | 96.4 | % | 120,526 | 80.9 | % | 86,997 | 50,523 | 25,336 | ||||||||||||
- 100 -
(1) | Does not include non-regional malls |
(2) | Reflects our partnership’s interest before considering non-controlling interests of others in operating subsidiaries. |
(3) | Reflects our partnership’s interest net of non-controlling interests described in note (2) above. |
(4) | Reflects our partnership’s proportionate interest net of non-controlling interests described in note (3) above and the Redeemable/Exchangeable Partnership Units and Special LP Units held by Brookfield Asset Management and Exchange LP Units. |
Opportunistic Retail Property Portfolio(1) | Assets under management | Proportionate at subsidiary level(2) | Proportionate to Unitholders(3) | Proportionate to LP Unitholders(4) | |||||||||||||||||
| Dec. 31, 2019 | Number of properties | % Leased | Total | Owned % | Total | Total | Total | ||||||||||||||
| (Sq. ft. in 000’s) | |||||||||||||||||||||
| CONSOLIDATED PROPERTIES | |||||||||||||||||||||
| U.S. Properties | |||||||||||||||||||||
| Pacific region | 8 | 88.4 | % | 6,365 | 100.0 | % | 6,365 | 3,203 | 1,606 | ||||||||||||
| Southwest region | 6 | 83.9 | % | 3,169 | 100.0 | % | 3,169 | 1,519 | 762 | ||||||||||||
| East North Central region | 6 | 84.0 | % | 4,294 | 100.0 | % | 4,294 | 2,161 | 1,084 | ||||||||||||
| Southeast region | 3 | 85.4 | % | 2,915 | 87.8 | % | 2,559 | 1,288 | 646 | ||||||||||||
| Mideast region | 5 | 87.9 | % | 3,990 | 100.0 | % | 3,990 | 2,008 | 1,007 | ||||||||||||
| Mountain region | 5 | 88.4 | % | 1,724 | 100.0 | % | 1,724 | 868 | 435 | ||||||||||||
| Northeast region | 4 | 86.9 | % | 2,329 | 63.0 | % | 1,468 | 618 | 310 | ||||||||||||
| 37 | 86.5 | % | 24,786 | 95.1 | % | 23,569 | 11,665 | 5,850 | |||||||||||||
| Total Consolidated Properties | 37 | 86.5 | % | 24,786 | 95.1 | % | 23,569 | 11,665 | 5,850 | ||||||||||||
| UNCONSOLIDATED PROPERTIES | |||||||||||||||||||||
| Brazil | |||||||||||||||||||||
| São Paulo | 3 | 97.3 | % | 805 | 42.1 | % | 339 | 157 | 78 | ||||||||||||
| Rio de Janeiro | 2 | 96.9 | % | 961 | 73.1 | % | 703 | 324 | 163 | ||||||||||||
| 5 | 97.1 | % | 1,766 | 59.0 | % | 1,042 | 481 | 241 | |||||||||||||
| Total Unconsolidated Properties | 5 | 97.1 | % | 1,766 | 59.0 | % | 1,042 | 481 | 241 | ||||||||||||
| Total Opportunistic Retail Properties | 42 | 87.2 | % | 26,552 | 92.7 | % | 24,611 | 12,146 | 6,091 | ||||||||||||
(1) | Does not include non-regional malls; includes anchor space. |
(2) | Reflects our partnership’s interest before considering non-controlling interests of others in operating subsidiaries. |
(3) | Reflects our partnership’s interest net of non-controlling interests described in note (2) above. |
(4) | Reflects our partnership’s proportionate interest net of non-controlling interests described in note (3) above and the Redeemable/Exchangeable Partnership Units and Special LP Units held by Brookfield Asset Management and Exchange LP Units. |
| Logistics Property Portfolio | Assets under management | Proportionate at subsidiary level(1) | Proportionate to Unitholders(2) | Proportionate to LP Unitholders(3) | ||||||||||||||
| Dec. 31, 2019 | Number of properties | Total | Owned % | Total | Total | Total | ||||||||||||
| (Sq. ft. in 000’s) | ||||||||||||||||||
| CONSOLIDATED PROPERTIES | ||||||||||||||||||
| China | 1 | 357 | 76.0 | % | 271 | 84 | 42 | |||||||||||
| 1 | 357 | 76.0 | % | 271 | 84 | 42 | ||||||||||||
| Total Logistics Properties | 1 | 357 | 76.0 | % | 271 | 84 | 42 | |||||||||||
(1) | Reflects our partnership’s interest before considering non-controlling interests of others in operating subsidiaries. |
(2) | Reflects our partnership’s interest net of non-controlling interests described in note (1) above. |
(3) | Reflects our partnership’s proportionate interest net of non-controlling interests described in note (2) above and the Redeemable/Exchangeable Partnership Units and Special LP Units held by Brookfield Asset Management and Exchange LP Units. |
- 101 -
| Multifamily Property Portfolio | Assets under management | Proportionate at subsidiary level(1) | Proportionate to Unitholders(2) | Proportionate to LP Unitholders(3) | ||||||||||||||
| Dec. 31, 2019 | Number of properties | Total | Owned % | Total | Total | Total | ||||||||||||
| (Units) | ||||||||||||||||||
| CONSOLIDATED PROPERTIES | ||||||||||||||||||
| United States | ||||||||||||||||||
| Ohio | 15 | 2,884 | 100.0 | % | 2,884 | 736 | 369 | |||||||||||
| Virginia | 6 | 1,882 | 100.0 | % | 1,882 | 480 | 241 | |||||||||||
| California | 4 | 1,488 | 100.0 | % | 1,488 | 444 | 223 | |||||||||||
| Georgia | 3 | 1,304 | 100.0 | % | 1,304 | 354 | 178 | |||||||||||
| Florida | 4 | 1,294 | 100.0 | % | 1,294 | 330 | 166 | |||||||||||
| Nevada | 3 | 1,194 | 100.0 | % | 1,194 | 356 | 179 | |||||||||||
| New York | 1 | 1,190 | 100.0 | % | 1,190 | 361 | 181 | |||||||||||
| Texas | 3 | 855 | 100.0 | % | 855 | 232 | 116 | |||||||||||
| North Carolina | 3 | 850 | 100.0 | % | 850 | 217 | 109 | |||||||||||
| Maryland | 3 | 841 | 100.0 | % | 841 | 245 | 123 | |||||||||||
| Indiana | 3 | 836 | 100.0 | % | 836 | 213 | 107 | |||||||||||
| Arizona | 1 | 168 | 100.0 | % | 168 | 50 | 25 | |||||||||||
| Total Consolidated Properties | 49 | 14,786 | 100.0 | % | 14,786 | 4,018 | 2,017 | |||||||||||
| UNCONSOLIDATED PROPERTIES | ||||||||||||||||||
| United States | ||||||||||||||||||
| California | 2 | 882 | 100.0 | % | 882 | 225 | 113 | |||||||||||
| Total Unconsolidated Properties | 2 | 882 | 100.0 | % | 882 | 225 | 113 | |||||||||||
| Total Multifamily Properties | 51 | 15,668 | 100.0 | % | 15,668 | 4,243 | 2,130 | |||||||||||
(1) | Reflects our partnership’s interest before considering non-controlling interests of others in operating subsidiaries and properties. |
(2) | Reflects our partnership’s interest net of non-controlling interests described in note (1) above. |
(3) | Reflects our partnership’s proportionate interest net of non-controlling interests described in note (2) above and the Redeemable/Exchangeable Partnership Units and Special LP Units held by Brookfield Asset Management and Exchange LP Units. |
| Hospitality Property Portfolio | Assets under management | Proportionate at subsidiary level(1) | Proportionate to Unitholders(2) | Proportionate to LP Unitholders(3) | ||||||||||||||
| Dec. 31, 2019 | Number of properties | Total | Owned % | Total | Total | Total | ||||||||||||
| (Rooms) | ||||||||||||||||||
| CONSOLIDATED PROPERTIES | ||||||||||||||||||
| North America | 118 | 17,577 | 100.0 | % | 17,577 | 4,727 | 2,370 | |||||||||||
| United Kingdom | 6 | 4,819 | 100.0 | % | 4,819 | 1,315 | 659 | |||||||||||
| Canada | 1 | 1,372 | 100.0 | % | 1,372 | 351 | 176 | |||||||||||
| Total Consolidated Properties | 125 | 23,768 | 100.0 | % | 23,768 | 6,393 | 3,205 | |||||||||||
| UNCONSOLIDATED PROPERTIES | ||||||||||||||||||
| North America | 4 | 2,225 | 72.5 | % | 1,614 | 376 | 189 | |||||||||||
| Australia | 1 | 433 | 100.0 | % | 433 | 136 | 68 | |||||||||||
| Total Unconsolidated Properties | 5 | 2,658 | 77.0 | % | 2,047 | 512 | 257 | |||||||||||
| Total Hospitality Properties | 130 | 26,426 | 97.7 | % | 25,815 | 6,905 | 3,462 | |||||||||||
(1) | Reflects our partnership’s interest before considering non-controlling interests of others in operating subsidiaries. |
(2) | Reflects our partnership’s interest net of non-controlling interests described in note (1) above. |
(3) | Reflects our partnership’s proportionate interest net of non-controlling interests described in note (3) above and the Redeemable/Exchangeable Partnership Units and Special LP Units held by Brookfield Asset Management and Exchange LP Units. |
| Triple Net Lease Property Portfolio | Assets under management | Proportionate at subsidiary level(1) | Proportionate to Unitholders(2) | Proportionate to LP Unitholders(3) | ||||||||||||||
| Dec. 31, 2019 | Number of properties | Total | Owned % | Total | Total | Total | ||||||||||||
| (Sq. ft. in 000’s) | ||||||||||||||||||
| CONSOLIDATED PROPERTIES | ||||||||||||||||||
| North America | 278 | 15,465 | 100.0 | % | 15,465 | 4,430 | 2,221 | |||||||||||
| Total Consolidated Properties | 278 | 15,465 | 100.0 | % | 15,465 | 4,430 | 2,221 | |||||||||||
| Total Triple Net Lease Properties | 278 | 15,465 | 100.0 | % | 15,465 | 4,430 | 2,221 | |||||||||||
(1) | Reflects our partnership’s interest before considering non-controlling interests of others in operating subsidiaries. |
- 102 -
(2) | Reflects our partnership’s interest net of non-controlling interests described in note (1) above. |
(3) | Reflects our partnership’s proportionate interest net of non-controlling interests described in note (2) above and the Redeemable/Exchangeable Partnership Units and Special LP Units held by Brookfield Asset Management and Exchange LP Units. |
| Self-Storage Property Portfolio | Assets under management | Proportionate at subsidiary level(1) | Proportionate to Unitholders(2) | Proportionate to LP Unitholders(3) | ||||||||||||||
| Dec. 31, 2019 | Number of properties | Total | Owned % | Total | Total | Total | ||||||||||||
| (Sq. ft. in 000’s) | ||||||||||||||||||
| CONSOLIDATED PROPERTIES | ||||||||||||||||||
| United States | 100 | 8,512 | 100.0 | % | 8,512 | 2,122 | 1,064 | |||||||||||
| Total Consolidated Properties | 100 | 8,512 | 100.0 | % | 8,512 | 2,122 | 1,064 | |||||||||||
| Total Self-Storage Properties | 100 | 8,512 | 100.0 | % | 8,512 | 2,122 | 1,064 | |||||||||||
(1) | Reflects our partnership’s interest before considering non-controlling interests of others in operating subsidiaries. |
(2) | Reflects our partnership’s interest net of non-controlling interests described in note (1) above. |
(3) | Reflects our partnership’s proportionate interest net of non-controlling interests described in note (2) above and the Redeemable/Exchangeable Partnership Units and Special LP Units held by Brookfield Asset Management and Exchange LP Units. |
| Student Housing Property Portfolio | Assets under management | Proportionate at subsidiary level(1) | Proportionate to Unitholders(2) | Proportionate to LP Unitholders(3) | ||||||||||||||
| Dec. 31, 2019 | Number of properties | Total | Owned % | Total | Total | Total | ||||||||||||
| (Beds) | ||||||||||||||||||
| CONSOLIDATED PROPERTIES | ||||||||||||||||||
| United Kingdom | 50 | 18,799 | 100.0 | % | 18,799 | 4,757 | 2,386 | |||||||||||
| Total Consolidated Properties | 50 | 18,799 | 100.0 | % | 18,799 | 4,757 | 2,386 | |||||||||||
| Total Student Housing Properties | 50 | 18,799 | 100.0 | % | 18,799 | 4,757 | 2,386 | |||||||||||
(1) | Reflects our partnership’s interest before considering non-controlling interests of others in operating subsidiaries. |
(2) | Reflects our partnership’s interest net of non-controlling interests described in note (1) above. |
(3) | Reflects our partnership’s proportionate interest net of non-controlling interests described in note (2) above and the Redeemable/Exchangeable Partnership Units and Special LP Units held by Brookfield Asset Management and Exchange LP Units. |
| Manufactured Housing Property Portfolio | Assets under management | Proportionate at subsidiary level(1) | Proportionate to Unitholders(2) | Proportionate to LP Unitholders(3) | ||||||||||||||
| Dec. 31, 2019 | Number of properties | Total | Owned % | Total | Total | Total | ||||||||||||
| (Sites) | ||||||||||||||||||
| CONSOLIDATED PROPERTIES | ||||||||||||||||||
| United States | 136 | 32,424 | 100.0 | % | 32,424 | 8,288 | 4,156 | |||||||||||
| Total Consolidated Properties | 136 | 32,424 | 100.0 | % | 32,424 | 8,288 | 4,156 | |||||||||||
| Total Manufactured Housing Properties | 136 | 32,424 | 100.0 | % | 32,424 | 8,288 | 4,156 | |||||||||||
(1) | Reflects our partnership’s interest before considering non-controlling interests of others in operating subsidiaries. |
(2) | Reflects our partnership’s interest net of non-controlling interests described in note (1) above. |
(3) | Reflects our partnership’s proportionate interest net of non-controlling interests described in note (2) above and the Redeemable/Exchangeable Partnership Units and Special LP Units held by Brookfield Asset Management and Exchange LP Units. |
- 103 -
CRITICAL ACCOUNTING POLICIES, ESTIMATES AND JUDGMENTS
The discussion and analysis of our financial condition and results of operations is based upon the Financial Statements, which have been prepared in accordance with IFRS as issued by the IASB. The preparation of the consolidated financial statements, in conformity with IFRS, requires management to make estimates and assumptions that affect the carrying amounts of assets and liabilities and disclosure of contingent assets and liabilities at the date of the consolidated financial statements and the reported amounts of revenues and expenses during the reporting period. Actual results could differ from these estimates.
Our most critical accounting policies are those that we believe are the most important in portraying our financial condition and results of operations, and require the most subjectivity and estimates by our management.
Investment Properties
Investment properties include commercial properties held to earn rental income and commercial developments that are being constructed or developed for future use as commercial properties. Commercial properties and commercial developments are recorded at fair value, determined based on available market evidence, at the balance sheet date. Substantially all our investment properties are valued using one of two accepted income approaches, the discounted cash flow approach or the direct capitalization approach. Under the discounted cash flow approach, cash flows for each property are forecast for an assumed holding period, generally, ten-years. A capitalization rate is applied to the terminal year net operating income and an appropriate discount rate is applied to those cash flows to determine a value at the reporting date. Under the direct capitalization method, a capitalization rate is applied to estimated stabilized annual net operating income to determine value. We have a number of properties externally appraised each year to support our valuation process and for other business purposes. We compare the results of those external appraisals to our internally prepared values and reconcile significant differences when they arise. Discount and terminal capitalization rates are verified by comparing to market data, third-party reports, research material and brokers opinions. Valuations of investment properties are most sensitive to changes in the discount rate and timing or variability of cash flows. Decreases (increases) in the discount rate or capitalization rate result in increases (decreases) of fair value. Such decreases (increases) may be mitigated by decreases (increases) in cash flows included in the valuation analysis, as circumstances that typically give rise to increased interest rates (e.g., strong economic growth, inflation) usually give rise to increased cash flows at the asset level. We adopted IFRS 16 effective January 1, 2019. We applied IFRS 16 using the modified retrospective approach and comparative periods are not restated. The adoption of IFRS 16 resulted in the recognition of right-of-use assets and lease liabilities for those leases previously classified as operating leases.
Borrowing costs associated with direct expenditures on properties under development or redevelopment are capitalized. Borrowing costs are also capitalized on the purchase cost of a site or property acquired specifically for development or redevelopment in the short-term but only where activities necessary to prepare the asset for development or redevelopment are in progress. The amount of borrowing costs capitalized is determined first by reference to borrowings specific to the project, where relevant, and otherwise by applying a weighted average cost of borrowings to eligible expenditures after adjusting for borrowings associated with other specific developments. Where borrowings are associated with specific developments, the amount capitalized is the gross cost incurred on those borrowings less any incidental investment income. Borrowing costs are capitalized from the commencement of the development until the date of practical completion. The capitalization of borrowing costs is suspended if there are prolonged periods when development activity is interrupted. We consider practical completion to have occurred when the property is capable of operating in the manner intended by management. Generally, this occurs upon completion of construction and receipt of all necessary occupancy and other material permits. Where we have pre-leased space as of or prior to the start of the development and the lease requires us to construct tenant improvements which enhance the value of the property, practical completion is considered to occur on completion of such improvements.
Initial direct leasing costs we incur in negotiating and arranging tenant leases are added to the carrying amount of investment properties.
Business Combinations
We adopted the Amendments to IFRS 3, Business Combinations (“IFRS 3 Amendments”) for business combinations or asset acquisitions occurring after January 1, 2019 in advance of its mandatory effective date January 1, 2020. IFRS 3 Amendments clarifies the definition of a business in determining whether an acquisition is a business combination or an asset acquisition. We account for business combinations in which control is acquired under the acquisition method. We consider three criteria that include input, process and output to assess whether acquired assets and assumed liabilities meet the definition of a business. The acquisition price is the aggregate of the fair values, at the date of exchange, of assets given, liabilities incurred or assumed, and equity instruments issued in exchange for control of the acquiree. As a result, our partnership recognizes the acquiree’s identifiable assets and assumed liabilities at their acquisition-date fair values, except for non-current assets classified as held-for-sale, which are recognized at fair value less costs to sell. We also evaluate whether there are intangible assets acquired that have not previously been recognized by the acquiree and recognize them as identifiable intangible assets. The interests of non-controlling shareholders in the acquiree are initially measured at their proportion of the net fair value of the identifiable assets and assumed liabilities recognized.
- 104 -
To the extent that the acquisition price exceeds the fair value of the net identifiable assets, the excess is recorded as goodwill. To the extent the fair value of consideration paid is less than the fair value of net identifiable assets, the excess is recognized as a bargain purchase gain in our partnership’s net income for the respective reporting period.
Where a business combination is achieved in stages, previously held interests in the acquired entity are re-measured to fair value at the acquisition date, which is the date control is obtained, and the resulting gain or loss, if any, is recognized in net income. Amounts arising from interests in the acquiree prior to the acquisition date that have previously been recognized in other comprehensive income are reclassified to net income. Changes in our partnership’s ownership interest of an investee that do not result in a change of control are accounted for as equity transactions and are recorded as a component of equity. Acquisition costs are recorded as an expense in the reporting period as incurred.
In applying this policy, judgment is applied in determining whether an acquisition meets the definition of a business combination or an asset acquisition by considering the nature of the assets acquired, the processes applied to those assets and if the required processes are substantive in nature.
Basis of Accounting for Investees
We consolidate an investee when we control the investee, with control existing if and only if we have power over the investee; exposure, or rights, to variable returns from our involvement with the investee; and the ability to use our power over the investee to affect the amount of our partnership’s returns. Whether we consolidate or equity account an investee may have a significant impact on the presentation of our consolidated financial statements, especially as it relates to the consolidation of the operating partnership.
In determining if we have power over an investee, we make judgments when identifying which activities of the investee are relevant in significantly affecting returns of the investee and the extent of our existing rights that give us the current ability to direct the relevant activities of the investee. We also make judgments to determine the amount of potential voting rights which provides us or unrelated parties voting powers, the existence of contractual relationships that provide us voting power, the ability to appoint directors and the ability of other investors to remove us as a manager or general partner. We enter into voting agreements to provide our partnership with the ability to contractually direct the relevant activities of the investee (formally referred to as “power” within IFRS 10, Consolidated Financial Statements). In assessing if we have exposure, or rights, to variable returns from our involvement with the investee we make judgments concerning whether returns from an investee are variable and how variable those returns are on the basis of the substance of the arrangement, the size of those returns and the size of those returns relative to others, particularly in circumstances where our voting interest differs from our ownership interest in an investee. In determining if we have the ability to use our power over the investee to affect the amount of our returns we make judgments when we are an investor as to whether we are a principal or agent and whether another entity with decision-making rights is acting as an agent for us. If we determine that we are acting as an agent, as opposed to principal, we do not control the investee.
Revaluation Method Hospitality Assets
We account for our investments in hospitality properties as property, plant and equipment under the revaluation model. Hospitality properties are recognized initially at cost or fair value if acquired in a business combination and subsequently carried at fair value at the balance sheet date less any accumulated impairment and subsequent accumulated depreciation. Fair values of North American hospitality properties and the short-break destinations across the United Kingdom owned by Center Parcs UK are determined using a depreciated replacement cost method based on the age, physical condition and the construction costs of the assets. Fair values of the hospitality assets are also reviewed in reference to each hospitality asset’s enterprise value which is determined using a discounted cash flow model.
Revaluations of hospitality properties are performed annually at December 31, the end of the fiscal year, to ensure that the carrying amount does not differ significantly from fair value. Where the carrying amount of an asset is increased as a result of a revaluation, the increase is recognized in other comprehensive income and accumulated in equity within revaluation surplus, unless the increase reverses a previously recognized revaluation loss recorded through prior period net income, in which case that portion of the increase is recognized in net income. Where the carrying amount of an asset is decreased, the decrease is recognized in other comprehensive income to the extent of any balance existing in revaluation surplus in respect of the asset, with the remainder of the decrease recognized in net income. Revaluation gains are recognized in other comprehensive income, and are not subsequently recycled into profit or loss. The cumulative revaluation surplus is transferred directly to retained earnings when the asset is derecognized.
Taxation
We apply judgment in determining the tax rate applicable to our REIT operating entities and identifying the temporary differences related to such operating entities with respect to which deferred income taxes are recognized. Deferred taxes related to temporary differences arising in our partnership’s REIT operating entities, joint ventures and associates are measured based on the tax rates applicable to distributions received by the investor entity on the basis that REITs can deduct dividends or distributions paid
- 105 -
such that their liability for income taxes is substantially reduced or eliminated for the year, and we intend that these entities will continue to distribute their taxable income and continue to qualify as REITs for the foreseeable future.
We measure deferred income taxes associated with our investment properties based on our specific intention with respect to each asset at the end of the reporting period. Where we have a specific intention to sell a property in the foreseeable future or where existing contractual arrangements create an intention to sell in the future, deferred taxes on the building portion of the investment property are measured based on the tax consequences following from the disposition of the property. Otherwise, deferred taxes are measured on the basis the carrying value of the investment property will be recovered substantially through use. Judgment is required in determining the manner in which the carrying amount of each investment property will be recovered.
We also make judgments with respect to the taxation of gains inherent in our investments in foreign subsidiaries and joint ventures. While we believe that the recovery of our original investment in these foreign subsidiaries and joint ventures will not result in additional taxes, certain unremitted gains inherent in those entities could be subject to foreign taxes depending on the manner of realization.
Revenue Recognition
For investment properties, we account for our leases with tenants as operating leases as we have retained substantially all of the risks and benefits of ownership of our investment properties. Revenue recognition under a lease commences when the tenant has a right to use the leased asset. Generally, this occurs on the lease commencement date or, where our partnership is required to make additions to the property in the form of tenant improvements which enhance the value of the property, upon substantial completion of the improvements. The total amount of contractual rents expected from operating leases is recognized on a straight-line basis over the term of the lease, including contractual base rent and subsequent rent increases as a result of rent escalation clauses. A rent receivable, included within the carrying amount of investment properties, is used to record the difference between the rental revenue recorded and the contractual amount received.
Rent receivables and related revenue also includes percentage participating rents and recoveries of operating expenses. However, recoveries of operating expenses in relation to property taxes as well as property insurance are a component of other rental revenue, separate from the rest of recovery revenue. Percentage participating rents are recognized when tenants’ specified sales targets have been met. Operating expense recoveries, rental or non-rental revenue, are recognized in the period that recoverable costs are chargeable to tenants.
With regards to hospitality revenue, we recognize revenue on rooms, food and other revenue as services are provided. We recognize room revenue net of taxes and levies. Advance deposits are deferred and included in accounts payable and other liabilities until services are provided to the customer. We recognize the difference between gaming wins and losses from casino gaming activities as gaming revenue. We recognize liabilities for funds deposited by patrons before gaming play occurs and for chips in the patrons’ possession, both of which are included in accounts payable and other liabilities. Revenue and expenses from tour operations include the sale of travel and leisure packages and are recognized on the day the travel package begins. Amounts collected in advance from guests are deferred and included in accounts payable and other liabilities until such amounts are earned.
Financial Instruments
We classify our financial instruments into categories based on the purpose for which the instrument was acquired or issued, its characteristics and our designation of the instrument. The category into which we classify financial instruments determines its measurement basis (e.g., fair value or amortized cost) subsequent to initial recognition. We hold financial instruments that represent secured debt and equity interests in commercial properties that are measured at fair value. Estimation of the fair value of these instruments is subject to the estimates and assumptions associated with the valuation of investment properties. When designating derivatives in cash flow hedging relationships, we make assumptions about the timing and amount of forecasted transactions, including anticipated financings and refinancings.
Fair value is the amount that willing parties would accept to exchange a financial instrument based on the current market for instruments with the same risk, principal and remaining maturity. The fair value of interest bearing financial assets and liabilities is determined by discounting the contractual principal and interest payments at estimated current market interest rates for the instrument. Current market rates are determined by reference to current benchmark rates for a similar term and current credit spreads for debt with similar terms and risk.
Use of Estimates
Our partnership makes estimates and assumptions that affect carried amounts of assets and liabilities, disclosure of contingent assets and liabilities and the reported amount of earnings for the period. Actual results could differ from estimates. The estimates and assumptions that are critical to the determination of the amounts reported in the consolidated financial statements relate to the following:
- 106 -
(i) Fair value of investment property
Our partnership determines the fair value of each commercial property based upon, among other things, rental income from current leases and assumptions about rental income from future leases reflecting market conditions at the applicable balance sheet dates, less future cash outflows (including rental payments and other outflows) in respect of such leases. Investment property valuations are completed by undertaking one of two accepted income approach methods, which include either: i) discounting the expected future cash flows, generally over a term of 10 years including a terminal value based on the application of a capitalization rate to estimated year 11 cash flows; or ii) undertaking a direct capitalization approach whereby a capitalization rate is applied to estimated current year cash flows. In determining the appropriateness of the methodology applied, the partnership considers the relative uncertainty of the timing and amount of expected cash flows and the impact such uncertainty would have in arriving at a reliable estimate of fair value. The partnership prepares these valuations considering asset and market specific factors, as well as observable transactions for similar assets. The determination of fair value requires the use of estimates, which the partnership determines using external information including market data, third-party reports and research and observable conditions, where possible, in conjunction with internal analysis.
Commercial developments are also measured using a discounted cash flow model, net of costs to complete, as of the balance sheet date. Development sites in the planning phases are measured using comparable market values for similar assets. We generally do not measure or record our properties at values prepared by external valuation professionals.
(ii) Fair value of financial instruments
We have certain financial assets and liabilities with embedded participation features related to the values of investment properties whose fair values are based on the fair values of the related properties.
We hold other financial instruments that represent equity interests in investment property entities that are measured at fair value as these financial instruments are designated as fair value through profit or loss or fair value through other comprehensive income. Estimation of the fair value of these instruments is also subject to the estimates and assumptions associated with investment properties.
The fair value of interest rate caps is determined based on generally accepted pricing models using quoted market interest rates for the appropriate term. Interest rate swaps are valued at the present value of estimated future cash flows and discounted based on applicable yield curves derived from market interest rates.
Application of the effective interest method to certain financial instruments involves estimates and assumptions about the timing and amount of future principal and interest payments.
Future Accounting Policy Changes
There are no accounting policies issued that the partnership expects to adopt in the future and which the partnership expects will have a material impact.
5.B. LIQUIDITY AND CAPITAL RESOURCES
The capital of our business consists of debt obligations, capital securities, preferred stock and equity. Our objective when managing this capital is to maintain an appropriate balance between holding a sufficient amount of equity capital to support our operations and reducing our weighted average cost of capital to improve our return on equity. At December 31, 2019, capital totaled $103 billion compared with $114 billion at December 31, 2018.
We attempt to maintain a level of liquidity to ensure we are able to participate in investment opportunities as they arise and to better withstand sudden adverse changes in economic circumstances. Our primary sources of liquidity include cash, undrawn committed credit facilities, construction facilities, cash flow from operating activities and access to public and private capital markets. In addition, we structure our affairs to facilitate monetization of longer-duration assets through financings and co-investor participations.
We seek to increase income from our existing properties by maintaining quality standards for our properties that promote high occupancy rates and support increases in rental rates while reducing tenant turnover and related costs, and by controlling operating expenses. Consequently, we believe our revenue, along with proceeds from financing activities and divestitures, will continue to provide the necessary funds to cover our short-term liquidity needs. However, material changes in the factors described above may adversely affect our net cash flows.
Our principal liquidity needs for the current year and for periods beyond include:
| • | Recurring expenses; |
- 107 -
| • | Debt service requirements; |
| • | Distributions to unitholders; |
| • | Capital expenditures deemed mandatory, including tenant improvements; |
| • | Development costs not covered under construction loans; |
| • | Unfunded committed capital to funds; |
| • | Investing activities which could include: |
| ◦ | Fulfilling our capital commitments to various funds; |
| ◦ | Discretionary capital expenditures; |
| ◦ | Property acquisitions; |
| ◦ | Future developments; and |
| ◦ | Repurchase of our units. |
We plan to meet these liquidity needs by accessing our group-wide liquidity of $6,881 million at December 31, 2019 as highlighted in the table below. In addition, we have the ability to supplement this liquidity through cash generated from operating activities, asset sales, co-investor interests and financing opportunities.
| (US$ Millions) | Dec. 31, 2019 | Dec. 31, 2018 | ||||
| Proportionate cash retained at subsidiaries | 1,587 | 2,057 | ||||
| Proportionate availability under subsidiary credit facilities | 4,058 | 3,092 | ||||
| Proportionate availability under construction facilities | 1,236 | 1,544 | ||||
Group-wide liquidity(1) | $ | 6,881 | $ | 6,693 | ||
(1) | This includes liquidity of investments which are not controlled and can only be obtained through distributions which the partnership does not control. |
We finance our assets principally at the operating company level with asset-specific debt that generally has long maturities, few restrictive covenants and with recourse only to the asset. We endeavor to maintain prudent levels of debt and strive to ladder our principal repayments over a number of years.
The following table summarizes our secured debt obligations on investment properties by contractual maturity over the next five years and thereafter:
| (US$ Millions, except where noted) | Dec. 31, 2019 | ||
| 2020 | $ | 5,657 | |
| 2021 | 8,270 | ||
| 2022 | 3,908 | ||
| 2023 | 3,617 | ||
| 2024 | 8,507 | ||
| Thereafter | 11,676 | ||
| Deferred financing costs | (374 | ) | |
| Secured debt obligations | $ | 41,261 | |
| Debt to capital ratio | 55 | % | |
We generally believe that we will be able to either extend the maturity date, repay, or refinance the debt that is scheduled to mature in 2020 to 2021. Currently our debt to capital ratio is 55%. We are focused on decreasing our debt to capital ratio to 50% through repayment of capital securities and credit facilities with cash flows that we expect from the completion of our active development pipeline with completion dates of 2020 to 2022.
Our partnership’s operating subsidiaries are subject to limited covenants in respect of their corporate debt and are in full compliance with all such covenants at December 31, 2019. The partnership’s operating subsidiaries are also in compliance with all covenants and other capital requirements related to regulatory or contractual obligations of material consequence to our partnership. Summaries of our debt profile for each of our segments are included elsewhere in this Form 20-F.
For the years ended December 31, 2019, 2018 and 2017, the partnership made distributions to unitholders of $1,266 million, $1,059 million and $830 million, respectively. This compares to cash flow from operating activities of $624 million, $1,357 million and $639 million, respectively, for each of the three years then ended. In 2019 and 2017, distributions exceeded cash flow from operating activities. The partnership has a number of alternatives at its disposal to fund any difference between the cash flow from operating activities and distributions to unitholders. The partnership is not a passive investor and typically holds positions of control or significant influence over assets in which it invests, enabling the partnership to influence distributions
- 108 -
from those assets. The partnership will, from time to time, convert some or all of the unrealized fair value gains on investment properties to cash through asset sales, joint ventures or refinancings. The partnership may access its credit facilities in order to temporarily fund its distributions as a result of timing differences between the payments of distributions and cash receipts from its investments. In 2019 and 2017, the partnership funded the gap between its distributions and cash flow from operating activities through approximately $167 million and $1,779 million of realized gains from the disposition of assets with meaningful returns on capital, respectively. Distributions made to unitholders which exceed cash flow from operating activities in future periods may be considered to be a return of capital to unitholders as defined in Canadian Securities Administrators’ National Policy 41-201 - Income Trusts and Indirect Offerings.
5.C. RESEARCH AND DEVELOPMENT, PATENTS AND LICENSES, ETC.
Not applicable.
5.D. TREND INFORMATION
We will seek to increase the cash flows from our Core Office and Core Retail property activities through continued leasing activity as described below. In particular, we are operating below our historical office occupancy level, which provides the opportunity to expand cash flows through higher occupancy. In addition, we believe that most of our markets have favorable outlooks, which we believe also provides an opportunity for strong growth in lease rates. Our beliefs as to the opportunities for our partnership to increase occupancy levels, lease rates and cash flows are based on assumptions about our business and markets that management believes are reasonable in the circumstances. There can be no assurance as to growth in occupancy levels, lease rates or cash flows. See “Special Note Regarding Forward-Looking Statements”.
We believe our global scale and best-in-class operating platforms provide us with a unique competitive advantage as we are able to efficiently allocate capital around the world toward those sectors and geographies where we see the greatest returns. We actively recycle assets on our balance sheet as they mature and reinvest the proceeds into higher yielding investment strategies, further enhancing returns. In addition, due to the scale of our stabilized portfolio and flexibility of our balance sheet, our business model is self-funding and does not require us to access capital markets to fund our continued growth.
Given the small amount of new office and retail development that occurred over the last decade and the near total development halt during the global financial crisis, we see an opportunity to advance our development inventory in the near term in response to demand we are seeing in our major markets. In addition, we continue to reposition and redevelop existing retail properties, in particular, a number of the highest performing shopping centers in the United States.
5.E. OFF-BALANCE SHEET ARRANGEMENTS
We do not have any off-balance sheet arrangements that have or are reasonably likely to have a material current or future effect on our financial condition, changes in financial condition, revenues or expenses, results of operations, liquidity, capital expenditures or capital resources that is material to investors.
- 109 -
5.F. TABULAR DISCLOSURE OF CONTRACTUAL OBLIGATIONS
The following table summarizes our significant contractual obligations as of December 31, 2019:
| (US$ Millions) | Payments due by period | ||||||||||||||||||||
| Dec. 31, 2019 | Total | < 1 Year | 1 Year | 2 Years | 3 Years | 4 Years | > 5 Years | ||||||||||||||
Debt obligations(1) | $ | 55,390 | $ | 8,829 | $ | 9,315 | $ | 5,605 | $ | 6,011 | $ | 10,781 | $ | 14,849 | |||||||
| Capital securities | 3,075 | 75 | 1,536 | 141 | 1 | 547 | 775 | ||||||||||||||
| Lease obligations | 5,301 | 78 | 79 | 77 | 77 | 77 | 4,913 | ||||||||||||||
Commitments(2) | 1,138 | 499 | 226 | 401 | 12 | — | — | ||||||||||||||
Interest expense(3): | |||||||||||||||||||||
| Debt obligations | 9,792 | $ | 2,295 | $ | 1,865 | $ | 1,558 | $ | 1,331 | $ | 990 | $ | 1,753 | ||||||||
| Capital securities | 732 | 151 | 151 | 111 | 106 | 106 | 107 | ||||||||||||||
| Interest rate swaps | (1 | ) | 4 | 1 | (3 | ) | (2 | ) | (1 | ) | — | ||||||||||
(1) | Debt obligations is net of deferred financing costs of $418 million. |
(2) | Primarily consists of construction commitments on commercial developments. |
(3) | Represents aggregate interest expense expected to be paid over the term of the obligations. Variable interest rate payments have been calculated based on current rates. |
5.G. SAFE HARBOR
See “Special Note Regarding Forward-Looking Statements”.
- 110 -
ITEM 6. DIRECTORS, SENIOR MANAGEMENT AND EMPLOYEES
6.A. DIRECTORS AND SENIOR MANAGEMENT
Governance
As required by law, our limited partnership agreement provides for the management and control of our company by a general partner rather than a board of directors and officers. The BPY General Partner serves as our company’s general partner and has a board of directors. The BPY General Partner has sole responsibility and authority for the central management and control of our company, which is exercised through its board of directors. Accordingly, references herein to “our directors” and “our board” refer to the board of directors of the BPY General Partner.
The following table presents certain information concerning the current board of directors of the BPY General Partner:
Name and Residence(1) | Age | Position with the BPY General Partner | Principal Occupation |
Caroline Atkinson Washington, D.C., United States | 67 | Director | Senior Advisor to Rock Creek investment firm |
| Jeffrey M. Blidner Toronto, Canada | 71 | Director | Vice Chair of Brookfield Asset Management |
| Soon Young Chang Dubai, United Arab Emirates | 60 | Director | Director of Dubai World; Senior Advisor of Investment Corporation of Dubai |
| Richard B. Clark New York, United States | 61 | Chairman of the Board, Director | Managing Partner of Brookfield Asset Management and Chairman, Brookfield Property Group |
Omar Carneiro da Cunha(3) Rio de Janeiro, Brazil | 73 | Director | Senior Partner of Dealmaker Ltd. and BOND Consultoria Empresarial e Participacoes |
Scott Cutler Los Altos, United States | 50 | Director | Chief Executive Officer, StockX |
Stephen DeNardo(2) Stamford, United States | 66 | Director | Managing Director and President and Chief Executive Officer of RiverOak Investment Corp., LLC |
Louis Joseph Maroun(2)(3) Warwick, Bermuda | 69 | Director | Chairman of Sigma Real Estate Advisors/Sigma Capital Corporation |
Lars Rodert(2)(3) Stockholm, Sweden | 58 | Lead Independent Director, Director | Founder and Chief Executive Officer of ÖstVäst Capital Management |
(1) | The business address for each of the directors is 73 Front Street, 5th Floor, Hamilton, HM 12, Bermuda. |
(2) | Member of the audit committee. Mr. DeNardo is the Chair of the audit committee and is the audit committee financial expert. |
(3) | Member of the governance and nominating committee. Mr. Maroun is the Chair of the governance and nominating committee. |
Set forth below is biographical information for the BPY General Partner’s current directors. All of the BPY General Partner’s directors are also directors of BPR.
Caroline Atkinson. Ms. Atkinson is a Senior Adviser to Rock Creek investment firm in Washington D.C. and a trustee of the International Institute of Strategic Studies in London. Ms. Atkinson is an Oxford-trained economist with more than two decades of experience working as a senior policymaker in international economics and finance and as an executive in technology. She has held senior positions at Google Inc. (“Google”) the U.S. government, The International Monetary Fund and The Bank of England. Most recently, Ms. Atkinson was the Head of Global Policy for Google. Prior to joining Google, Ms. Atkinson worked for President Barack Obama as the Deputy National Security Adviser for International Economics at the White House. She was the President’s personal representative to major international economic summits, including the G-7/8 and the G-20. She was also the Advisor to Treasury Secretaries, Robert Rubin and Lawrence Summers. She has advised leading U.S. companies on global business and economic issues. Ms. Atkinson is a Member of the Board Executive Committee for the Peterson Institute for International Economics, and a Member of Council on Foreign Relations and the Economic Club of New York.
Jeffrey M. Blidner. Mr. Blidner is Vice Chairman of Brookfield Asset Management. Mr. Blidner is also Chief Executive Officer of Brookfield’s Private Funds Group, Chairman and a director of Brookfield Business Partners L.P. and Brookfield Renewable Partners L.P. and a director of Brookfield Asset Management and Brookfield Infrastructure Partners L.P. Prior to joining Brookfield in 2000, Mr. Blidner was a senior partner at a Canadian law firm.
Soon Young Chang. Dr. Chang is a member of the board of directors of Dubai World. Dr. Chang serves as Senior Advisor to the Investment Corporation of Dubai, providing strategic counsel and lending his global perspective to the investment arm of the Dubai Government. Dr. Chang is the founder and chairman of Midas International Asset Management Company, an international
- 111 -
asset management fund which manages over $5 billion. He is also a founding partner of Sentinel Advisor, a New York-based arbitrage fund. Dr. Chang has served as an advisor to a variety of financial institutions, including Korea National Pension Corporation, Hyundai International Merchant Bank and Templeton-Ssangyong Investment Trust Company. Dr. Chang received his Master’s and Doctoral degrees from the George Washington University in the United States and has authored many books and articles on the subject of financial engineering.
Richard B. Clark. Mr. Clark is a Managing Partner of Brookfield Asset Management, Chairman of Brookfield Property Group and Chairman of the board of directors of our company and BPR. He has over 30 years of real estate experience. Mr. Clark has been employed by Brookfield and its predecessors since 1984 in various senior roles including President and Chief Executive Officer of Brookfield Property Group and BPY. Mr. Clark holds a Bachelor of Science in Business from the Indiana University of Pennsylvania.
Omar Carneiro da Cunha. Mr. Cunha is a Senior Partner with Dealmaker Ltd., a consultancy and M&A advisory firm, with a focus in telecommunications, information technology, oil & gas and retail, and has also been a Senior Partner of BOND Consultoria Empresarial e Participacoes since 1994. He was the Chairman of “Bob’s”, a Brazilian fast food company, from 1995 to 2008, a director of the Energisa Group since 1996, and a director of Grupo Libra from 2010 to 2019. In 2005, Mr. Cunha was the Deputy Chairman and Chief Executive Officer of VARIG Brazilian Airline. From 1995 to 1998, Mr. Cunha was the President of AT&T Brasil and a member of the Management Committee of AT&T International. Prior to that, Mr. Cunha worked for 27 years in Brazil and abroad for the Royal Dutch/Shell Group, and was President of Shell Brasil, Billiton Metals and Shell Quimica from 1991 to 1994. Mr. Cunha is currently a member of the board of the American Chamber of Commerce for Brazil.
Scott Cutler. Mr. Cutler is the Chief Executive Officer of StockX, a private consumer e-commerce marketplace. He previously was Senior Vice President, Americas at eBay from 2017 to 2019, where he oversaw the Americas business unit, including the United States, Latin America, and Canada. Mr. Cutler joined eBay as President of eBay’s StubHub business in April 2015 after nine years as an Executive Vice President at the New York Stock Exchange (the “NYSE”). During his tenure at NYSE, Mr. Cutler transformed it into the number one global exchange and was responsible for over $1 trillion in capital raised and helped take some of the world’s most iconic brands of the last decade public. Mr. Cutler holds a B.S. degree in Economics from Brigham Young University (“BYU”) and a J.D. from the University of California, Hasting College of Law. He also serves on the board of Vibrant Emotional Health and is a trustee on the National Advisory Committee for his alma mater BYU.
Stephen DeNardo. Mr. DeNardo is currently managing director and president and Chief Executive Officer of RiverOak Investment Corp., LLC and has held this position since 1999. From 1997 to 1999 he was Partner and Senior Vice President of ING Realty Partners, where he managed a $1 billion portfolio. Prior to his employment with ING Realty Partners, he was President of ARES Realty Capital from 1991 to 1997, where he managed a $5 billion portfolio of diversified debt and equity assets. Before joining ARES Realty Capital, he was a Partner at First Winthrop Corporation. Mr. DeNardo has held a license as a Certified Public Accountant since 1978 and is a Chartered Global Management Accountant. He also has a B.S. in Accounting from Fairleigh Dickinson University.
Louis Joseph Maroun. Mr. Maroun is the Founder and Chairman of Sigma Real Estate Advisors and Sigma Capital Corporation, which specializes in international real estate advisory services. Prior to this role, Mr. Maroun was the Executive Chairman of ING Real Estate Canada, and held executive positions in a number of real estate companies where he was responsible for overseeing operations, real estate transactions, asset and property management, as well as many other related functions. Mr. Maroun also is on the board of directors of Brookfield Renewable Energy Partners L.P., and Summit Industrial Income REIT. Mr. Maroun graduated from the University of New Brunswick in 1972 with a Bachelor’s degree, followed by a series of post graduate studies and in January of 2007, after a long and successful career in investment real estate, Mr. Maroun was elected to the position of Fellow of the Royal Institute of Chartered Surveyors.
Lars Rodert. Mr. Rodert is the founder and Chief Executive Officer of ÖstVäst Capital Management (“OVCM”). Mr. Rodert has 30 years of experience in the global investment industry. Prior to OVCM, Mr. Rodert spent 11 years as a Global Investment Manager for IKEA Treasury. Before joining IKEA, Mr. Rodert was with SEB Asset Management for 10 years as Chief Investment Officer and responsible for SEB Global Funds. Prior to SEB, Mr. Rodert spent 10 years in North America with five years at Investment Bank Gordon Capital and five years as a partner with a private investment holding company, Robur et. Securitas. Mr. Rodert is a director of PCCW Limited, an information and communications technology company. Mr. Rodert holds a Master of Science Degree in Business and Economics from Stockholm University.
- 112 -
Our Management
The Service Providers, wholly-owned subsidiaries of Brookfield Asset Management, provide management services to us pursuant to our Master Services Agreement. Brookfield has built its property business through the integration of formative portfolio acquisitions and single asset transactions over several decades and throughout all phases of the real estate investment cycle. The Service Providers’ investment and asset management professionals are complemented by the depth of real estate investment and operational expertise throughout our operating entities which specialize in office, retail, multifamily, logistics, hospitality, self-storage, triple net lease, manufactured housing and student housing, generating significant and stable operating cash flows. Members of Brookfield’s senior management and other individuals from Brookfield’s global affiliates are drawn upon to fulfill the Service Providers’ obligations to provide us with management services under our Master Services Agreement.
The following table presents certain information concerning the Chief Executive Officer and the Chief Financial Officer of our Service Providers:
| Name | Age | Years of Experience | Years at Brookfield | Position with one of the Service Providers |
| Brian W. Kingston | 46 | 22 | 19 | Chief Executive Officer |
| Bryan K. Davis | 46 | 24 | 21 | Chief Financial Officer |
Set forth below is biographical information for Messrs. Kingston and Davis.
Brian W. Kingston. Mr. Kingston was named Chief Executive Officer in 2015. He is also a Managing Partner at Brookfield Asset Management and Chief Executive Officer of Brookfield Property Group. Mr. Kingston joined Brookfield in 2001 and has been engaged in a wide range of merger and acquisition activities. From 2008 to 2013 he led Brookfield’s Australian business activities, holding the positions of Chief Executive Officer of Brookfield Office Properties Australia, Chief Executive Officer of Prime Infrastructure and Chief Financial Officer of Multiplex.
Bryan K. Davis. Mr. Davis was named Chief Financial Officer in 2015. He is also a Managing Partner at Brookfield Asset Management. Prior to that, he was Chief Financial Officer of Brookfield’s global office property company for eight years and spent five years in senior finance roles. Mr. Davis also held various senior finance positions including Chief Financial Officer of Trilon Financial Corporation, Brookfield Asset Management’s financial services subsidiary. Prior to joining Brookfield Asset Management in 1999, Mr. Davis was involved in providing restructuring and advisory services at Deloitte & Touche LLP. He is a Chartered Accountant and holds a Bachelor of Commerce degree from Queen’s University.
The directors and officers of the BPY General Partner and our Service Providers and their associates, as a group, beneficially own, directly or indirectly, or exercise control and direction over, our units representing in the aggregate less than 1% of our issued and outstanding units on a fully-exchanged basis.
6.B. COMPENSATION
The BPY General Partner pays each of its directors $125,000 per year for serving on its board of directors and various board committees. The BPY General Partner pays the chair of the audit committee an additional $20,000 per year and pays the other members of the audit committee an additional $10,000 per year for serving in such positions. The BPY General Partner also pays the lead independent director an additional $10,000 per year. Directors also receive an annual retainer of $15,000 paid by BPR for serving as a director of BPR.
The BPY General Partner does not have any employees. Our partnership has entered into a Master Services Agreement with the Service Providers pursuant to which each Service Provider and certain other affiliates of Brookfield provide, or arrange for other Service Providers to provide, day-to-day management and administrative services for our company, the Property Partnership and the Holding Entities. The fees payable under the Master Service Agreement are set forth under Item 7.B. “Major Shareholders and Related Party Transactions - Related Party Transactions - Our Master Services Agreement - Management Fee”.
Pursuant to our Master Services Agreement, members of Brookfield’s senior management and other individuals from Brookfield’s global affiliates are drawn upon to fulfill obligations under the Master Services Agreement. However, these individuals, including the Brookfield employees identified in the table under Item 6.A. “Directors, Senior Management and Employees - Directors and Senior Management - Our Management”, are not compensated by our company or the BPY General Partner. Instead, they are compensated by Brookfield.
- 113 -
6.C. BOARD PRACTICES
Board Structure, Practices and Committees
The structure, practices and committees of the BPY General Partner’s board of directors, including matters relating to the size and composition of the board of directors, the election and removal of directors, requirements relating to board action and the powers delegated to board committees, are governed by the BPY General Partner’s bye-laws. The BPY General Partner’s board of directors is responsible for supervising the management, control, power and authority of the BPY General Partner except as required by applicable law or the bye-laws of the BPY General Partner. The following is a summary of certain provisions of those bye-laws that affect our company’s governance.
Size, Independence and Composition of the Board of Directors
The BPY General Partner’s board of directors may consist of between three and eleven directors or such other number of directors as may be determined from time to time by a resolution of the BPY General Partner’s shareholders and subject to its bye-laws. The board is currently set at nine directors and a majority of the directors of the BPY General Partner’s board of directors are independent. In addition, the BPY General Partner’s bye-laws provide that not more than 50% of the directors (as a group) or the independent directors (as a group) may be residents of any one jurisdiction (other than Bermuda and any other jurisdiction designated by the board of directors from time to time).
Pursuant to the investor agreement between us and the Class A Preferred Unitholder dated December 4, 2014, the Class A Preferred Unitholder is entitled, for so long as it owns an aggregate limited partnership interest in our company of at least 5% of our issued and outstanding LP Units on a fully-diluted basis, to designate one individual to the BPY General Partner’s board of directors. Such individual must meet the standards of independence established by the Nasdaq and the TSX and be reasonably acceptable to the board of directors. As of the date of this Form 20-F, the Class A Preferred Unitholder has not exercised this right.
Lead Independent Director
The BPY General Partner’s board of directors has selected Mr. Rodert to serve as lead independent director. The lead independent director’s primary role is to facilitate the functioning of the board (independently of the Service Providers and Brookfield), and to maintain and enhance the quality of our company’s corporate governance practices. The lead independent director presides over the private sessions of the independent directors of the BPY General Partner that take place following each meeting of the board and conveys the results of these meetings to the chair of the board. In addition, the lead independent director is available, when appropriate, for consultation and direct communication with our unitholders or other stakeholders of our company.
Election and Removal of Directors
The BPY General Partner’s board of directors is appointed by its shareholders and each of its current directors will serve until the earlier of his or her death, resignation or removal from office. Any director designated by the Class A Preferred Unitholder may be removed or replaced by the Class A Preferred Unitholder at any time. Vacancies on the board of directors may be filled and additional directors may be added by a resolution of the BPY General Partner’s shareholders or a vote of the directors then in office. A director may be removed from office by a resolution duly passed by the BPY General Partner’s shareholders. A director will be automatically removed from the board of directors if he or she becomes bankrupt, insolvent or suspends payments to his or her creditors, or becomes prohibited by law from acting as a director.
Action by the Board of Directors
The BPY General Partner’s board of directors may take action in a duly convened meeting at which a quorum is present or by a written resolution signed by all directors then holding office. The BPY General Partner’s board of directors holds a minimum of four meetings per year. When action is to be taken at a meeting of the board of directors, the affirmative vote of a majority of the votes cast is required for any action to be taken. Depending on the size of the board of directors, each director shall be entitled to a number of votes set forth in the bye-laws of the BPY General Partner such that any director designated by the Class A Preferred Unitholder will have less than 10% of the aggregate number of votes that may be cast by all directors taken together.
Transactions Requiring Approval by the Governance and Nominating Committee
The BPY General Partner’s governance and nominating committee has approved a conflicts policy which addresses the approval and other requirements for transactions in which there is greater potential for a conflict of interest to arise.
- 114 -
These transactions include:
| • | acquisitions by us from, and dispositions by us to, Brookfield; |
| • | the dissolution of our partnership or the Property Partnership; |
| • | any material amendment to our Master Services Agreement, the Relationship Agreement, our limited partnership agreement or the Property Partnership’s limited partnership agreement; |
| • | any material service agreement or other material arrangement pursuant to which Brookfield will be paid a fee, or other consideration other than any agreement or arrangement contemplated by our Master Services Agreement; |
| • | termination of, or any determinations regarding indemnification under, our Master Services Agreement, our limited partnership agreement or the Property Partnership’s limited partnership agreement; and |
| • | any other material transaction involving us and Brookfield. |
Our conflicts policy requires the transactions described above to be approved by the BPY General Partner’s governance and nominating committee. Pursuant to our conflicts policy, the BPY General Partner’s governance and nominating committee may grant approvals for any of the transactions described above in the form of general guidelines, policies or procedures in which case no further special approval will be required in connection with a particular transaction or matter permitted thereby. The conflicts policy can be amended at the discretion of the BPY General Partner’s governance and nominating committee. See Item 7.B. “Major Shareholders and Related Party Transactions - Related Party Transactions - Relationship with Brookfield - Conflicts of Interest”.
Service Contracts
There are no service contracts with directors that provide benefit upon termination of office or services.
Director Unit Ownership Requirements
The BPY General Partner believes that directors can better represent our unitholders if they have economic exposure to our company themselves. Our company expects that non-Brookfield-employed directors, or outside directors, should hold sufficient LP Units of our company or BPR Units such that the acquisition costs of such securities held by such directors are equal to at least two times their annual retainer, as determined by the board of directors from time to time.
Outside directors are required to purchase LP Units and/or BPR Units on an annual basis in an amount not less than 20% of the minimum economic ownership requirement until the requirement is met. Outside directors are required to achieve this minimum economic ownership within five years of joining the board. In the event of an increase in the annual retainer fee, the outside directors will have two years from the date of the change to comply with the ownership requirement. In the case of outside directors who have served on the board less than five years at the date of the change, such directors will be required to comply with the ownership requirement by the date that is the later of: (i) the fifth anniversary of their appointment to the board, and (ii) two years following the date of the change in retainer fee. Six of our outside directors have met this minimum economic ownership requirement.
Transactions in which a Director has an Interest
A director who directly or indirectly has an interest in a contract, transaction or arrangement with the BPY General Partner, our company or certain of our affiliates is required to disclose the nature of his or her interest to the full board of directors. Such disclosure may generally take the form of a general notice given to the board of directors to the effect that the director has an interest in a specified company or firm and is to be regarded as interested in any contract, transaction or arrangement with that company or firm or its affiliates. A director may participate in any meeting called to discuss or any vote called to approve the transaction in which the director has an interest and no transaction approved by the board of directors will be void or voidable solely because the director was present at or participates in the meeting in which the approval was given provided that the board of directors or a board committee authorizes the transaction in good faith after the director’s interest has been disclosed or the transaction is fair to the BPY General Partner and our company at the time it is approved.
- 115 -
Transactions Requiring Unitholder Approval
Limited partners have consent rights with respect to certain fundamental matters and related party transactions (in accordance with Multilateral Instrument 61-101 - Protection of Minority Security Holders in Special Transactions of the Canadian Securities Administrators (“MI 61-101”) and on any other matters that require their approval in accordance with applicable securities laws and stock exchange rules. See “Description of the Property Partnership Limited Partnership Agreement - Amendment of the Property Partnership Limited Partnership Agreement”, “Description of the Property Partnership Limited Partnership Agreement - Opinion of Counsel and Limited Partner Approval”, and “Description of the Property Partnership Limited Partnership Agreement - Withdrawal of the Managing General Partner”.
Audit Committee
The BPY General Partner’s board of directors is required to maintain an audit committee that operates pursuant to a written charter. The audit committee is required to consist solely of independent directors and each member must be financially literate. Not more than 50% of the audit committee members may be residents of any one jurisdiction (other than Bermuda and any other jurisdiction designated by the board of directors from time to time).
The audit committee is responsible for assisting and advising the BPY General Partner’s board of directors with respect to:
| • | our accounting and financial reporting processes; |
| • | the integrity and audits of our financial statements; |
| • | our compliance with legal and regulatory requirements; and |
| • | the qualifications, performance and independence of our independent accountants. |
The audit committee is responsible for engaging our independent auditors, reviewing the plans and results of each audit engagement with our independent auditors, approving professional services provided by our independent accountants, considering the range of audit and non-audit fees charged by our independent auditors and reviewing the adequacy of our internal accounting controls.
See Item 6.A. “Directors, Senior Management and Employees - Directors and Senior Management” for the names of the directors currently on the audit committee.
Governance and Nominating Committee
The BPY General Partner’s board of directors is required to maintain at all times a governance and nominating committee that operates pursuant to a written charter. The governance and nominating committee is required to consist solely of independent directors and not more than 50% of the governance and nominating committee members may be residents of any one jurisdiction (other than Bermuda and any other jurisdiction designated by the board of directors from time to time).
The governance and nominating committee has approved a conflicts policy which addresses the approval and other requirements for transactions in which there is a greater potential for a conflict of interest to arise. The governance and nominating committee may be required to approve any such transactions. See “- Transactions Requiring Approval by the Governance and Nominating Committee”.
The governance and nominating committee is responsible for approving the appointment by the sitting directors of a person to the office of director and for recommending a slate of nominees for election as directors by the BPY General Partner’s shareholders. The governance and nominating committee is responsible for assisting and advising the BPY General Partner’s board of directors with respect to matters relating to the general operation of the board of directors, our company’s governance, the governance of the BPY General Partner and the performance of its board of directors. The governance and nominating committee is responsible for reviewing and making recommendations to the board of directors of the BPY General Partner concerning the remuneration of directors and committee members and any changes in the fees to be paid pursuant to our Master Services Agreement.
See Item 6.A. “Directors, Senior Management and Employees - Directors and Senior Management” for the names of the directors currently on the governance and nominating committee.
- 116 -
Indemnification and Limitations on Liability
Our Limited Partnership Agreement
The laws of Bermuda permit the partnership agreement of a limited partnership, such as our company, to provide for the indemnification of a partner, the officers and directors of a partner and any other person against any and all claims and demands whatsoever, except to the extent that the indemnification may be held by the courts of Bermuda to be contrary to public policy or to the extent that the laws of Bermuda prohibit indemnification against personal liability that may be imposed under specific provisions of the laws of Bermuda. The laws of Bermuda also permit a partnership to pay or reimburse an indemnified person’s expenses in advance of a final disposition of a proceeding for which indemnification is sought. See Item 10.B. “Additional Information - Memorandum and Articles of Association - Description of Our LP Units, Preferred Units and Our Limited Partnership Agreement - Indemnification; Limitations on Liability” for a description of the indemnification arrangements in place under our limited partnership agreement.
The BPY General Partner’s Bye-laws
The laws of Bermuda permit the bye-laws of an exempted company, such as the BPY General Partner, to provide for the indemnification of its officers, directors and shareholders and any other person designated by the company against any and all claims and demands whatsoever, except to the extent that the indemnification may be held by the courts of Bermuda to be contrary to public policy or to the extent that the laws of Bermuda prohibit indemnification against personal liability that may be imposed under specific provisions of Bermuda law, such as the prohibition under the Bermuda Companies Act 1981 to indemnify liabilities arising from fraud or dishonesty. The BPY General Partner’s bye-laws provide that, as permitted by the laws of Bermuda, it will pay or reimburse an indemnified person’s expenses in advance of a final disposition of a proceeding for which indemnification is sought.
Under the BPY General Partner’s bye-laws, the BPY General Partner is required to indemnify, to the fullest extent permitted by law, its affiliates, directors, officers, resident representatives, shareholders and employees, any person who serves on a governing body of the Property Partnership or any of its subsidiaries and certain others against any and all losses, claims, damages, liabilities, costs or expenses (including legal fees and expenses), judgments, fines, penalties, interest, settlements or other amounts arising from any and all claims, demands, actions, suits or proceedings, incurred by an indemnified person in connection with our company’s investments and activities or in respect of or arising from their holding such positions, except to the extent that the claims, liabilities, losses, damages, costs or expenses are determined to have resulted from the indemnified person’s bad faith, fraud or willful misconduct, or in the case of a criminal matter, action that the indemnified person knew to have been unlawful. In addition, under the BPY General Partner’s bye-laws: (i) the liability of such persons has been limited to the fullest extent permitted by law and except to the extent that their conduct involves bad faith, fraud or willful misconduct, or in the case of a criminal matter, action that the indemnified person knew to have been unlawful; and (ii) any matter that is approved by the independent directors will not constitute a breach of any duties stated or implied by law or equity, including fiduciary duties. The BPY General Partner’s bye-laws require it to advance funds to pay the expenses of an indemnified person in connection with a matter in which indemnification may be sought until it is determined that the indemnified person is not entitled to indemnification.
Insurance
Our partnership has obtained insurance coverage under which the directors of the BPY General Partner are insured, subject to the limits of the policy, against certain losses arising from claims made against such directors by reason of any acts or omissions covered under the policy in their respective capacities as directors of the BPY General Partner, including certain liabilities under securities laws. The insurance applies in certain circumstances where we may not indemnify the BPY General Partner’s directors and officers for their acts or omissions.
6.D. EMPLOYEES
While certain of our operating entities have employees, the BPY General Partner, our partnership, the Property Partnership and the Holding Entities do not have any employees. Our partnership has entered into a Master Services Agreement with the Service Providers pursuant to which each Service Provider and certain other affiliates of Brookfield provide, or arrange for other Service Providers to provide, day-to-day management and administrative services for our company, the Property Partnership and the Holding Entities. The fees payable under the Master Service Agreement are set forth under Item 7.B. “Major Shareholders and Related Party Transactions - Related Party Transactions - Our Master Services Agreement - Management Fee”.
- 117 -
6.E. SHARE OWNERSHIP
Each of the directors and officers of the BPY General Partner own less than 1% of our units. Units of our partnership may be issued to such directors and officers through our distribution reinvestment plan described in Item 10.B. “Additional Information - Memorandum and Articles of Association - Description of Our LP Units, Preferred Units and Our Limited Partnership Agreement - Distribution Reinvestment Plan” and through our Unit-based compensation plans described in Item 18 “Financial Statements - Note 31 - Unit-Based Compensation”.
ITEM 7. MAJOR SHAREHOLDERS AND RELATED PARTY TRANSACTIONS
7.A. MAJOR SHAREHOLDERS
As of February 21, 2020, there are 442,248,044 LP Units of our company outstanding. To our knowledge, as of February 21, 2020, no person or company, other than Brookfield Asset Management, Partners Limited and the Class A Preferred Unitholder, beneficially owns or controls or directs, directly or indirectly, more than 5 % of our LP Units. See also the information contained in this Form 20-F under Item 10.B. “Additional Information - Memorandum and Articles of Association - Description of Our LP Units, Preferred Units and Our Limited Partnership Agreement”.
As of February 21, 2020, 280,411 of our outstanding LP Units were held by 2,736 holders of record in the United States, not including LP Units of our company held of record by the Depository Trust Company (“DTC”). As of February 21, 2020, DTC was the holder of record of 142,291,875 LP Units.
As of February 21, 2020, 188,530 of our outstanding LP Units were held by 3,727 holders of record in Canada, not including LP Units of our company held of record by Clearing and Depository Services Inc. (“CDS”). As of February 21, 2020, CDS was the holder of record of 299,460,950 LP Units.
The following table presents information regarding the beneficial ownership of our company, as of February 21, 2020, by each person or entity that we know beneficially owns 5 % or more of our company.
| Units Outstanding | ||||
| Name and Address | Units Owned(1) | Percentage | ||
Brookfield Asset Management Inc.(2) Suite 300, Brookfield Place, 181 Bay Street Toronto, Ontario, M5J 2T3 | 517,548,182 | 50 | % | |
Partners Limited(3) Suite 300, Brookfield Place, 181 Bay Street Toronto, Ontario, M5J 2T3 | 521,161,628 | 51 | % | |
Qatar Investment Authority(4) Q-Tel Tower Diplomatic Area Street, West Bay Doha, Qatar | 70,038,910 | 7 | % | |
(1) | Units Owned includes LP Units, and for Brookfield Asset Management and Partners Limited, also includes Redemption-Exchange Units, and for Brookfield Asset Management, also includes GP Units and Special LP Units. |
(2) | Brookfield beneficially owns 81,723,887 of our LP Units, 432,649,105 Redemption-Exchange Units and 3,036,315 BPR Units. Brookfield has a 59 % interest in our company assuming the exchange of the Redemption-Exchange Units and the Exchange LP Units not held by us, and a 52 % interest in our company on a fully-exchanged basis. |
(3) | Partners Limited is a corporation whose principal business mandate is to hold shares of Brookfield Asset Management, directly or indirectly, for the long-term. Partners Limited’s holdings of our company include the Brookfield Asset Management holdings noted in footnote (2) plus 3,613,446 of our LP Units held directly by its subsidiary, Partners Value Investments L.P. |
(4) | Represents ownership on a fully-exchanged basis. |
Our major unitholders have the same voting rights as all other holders of our LP Units.
- 118 -
7.B. RELATED PARTY TRANSACTIONS
RELATIONSHIP WITH BROOKFIELD
Brookfield Asset Management
Brookfield Asset Management is a leading global alternative asset manager with approximately $545 billion of assets under management across real estate, infrastructure, renewable power, private equity and credit. Brookfield owns and operates long-life assets and businesses, many of which form the backbone of the global economy. Utilizing its global reach, access to large-scale capital and operational expertise, Brookfield offers a range of alternative investment products to investors around the world including public and private pension plans, endowments and foundations, sovereign wealth funds, financial institutions, insurance companies and private wealth investors. Brookfield Asset Management is listed on the NYSE and TSX under the symbols BAM and BAM.A, respectively.
Brookfield believes its operating experience is an essential differentiating factor in its past ability to generate significant risk-adjusted returns. In addition, Brookfield has demonstrated particular expertise in sourcing and executing large-scale multi-faceted transactions across a wide spectrum of real estate sectors and geographies.
As a global alternative asset manager, Brookfield brings a strong and proven corporate platform supporting legal, tax, operations oversight, investor reporting, portfolio administration and other client services functions. Brookfield’s management team is multi-disciplinary, comprising investment and operations professionals, each with significant expertise in evaluating and executing investment opportunities and investing on behalf of itself and institutional investors.
We are an affiliate of Brookfield. We have entered into a number of agreements and arrangements with Brookfield in order to enable us to be established as a separate entity and pursue our vision of being a leading owner and operator of high quality commercial real estate assets. While we believe that our ongoing relationship with Brookfield provides us with a unique competitive advantage as well as access to opportunities that would otherwise not be available to us, we operate very differently from an independent, stand-alone entity. We describe below this relationship as well as potential conflicts of interest (and the methods for resolving them) and other material considerations arising from our relationship with Brookfield.
Relationship Agreement
Our company, the Property Partnership, the Holding Entities, the Service Providers and Brookfield Asset Management have entered into an agreement, referred to as the Relationship Agreement, that governs aspects of the relationship among them. Pursuant to the Relationship Agreement, Brookfield Asset Management has agreed that we will serve as the primary entity through which acquisitions of commercial property will be made by Brookfield Asset Management and its affiliates on a global basis.
In the commercial property industry, it is common for assets to be owned through consortiums and partnerships of institutional equity investors and owner/operators such as ourselves. Accordingly, an integral part of our strategy is to pursue acquisitions through arrangements with institutional investors, strategic partners or financial sponsors and to form partnerships to pursue acquisitions on a specialized or global basis.
Brookfield Asset Management has a strong track record of leading such consortiums and partnerships and actively managing underlying assets to improve performance. Brookfield has also established and manages a number of private investment entities, managed accounts, joint ventures, consortiums, partnerships and investment funds whose investment objectives include the acquisition of commercial property and Brookfield may in the future establish similar funds. Nothing in the Relationship Agreement limits or restricts Brookfield from establishing or advising these or similar entities or limits or restricts any such entities from carrying out any investment. Brookfield Asset Management has agreed that it will offer our company the opportunity to take up Brookfield’s share of any investment through these consortium arrangements or by one of these entities that involves the acquisition of commercial property that is suitable for us, subject to certain limitations.
Under the terms of the Relationship Agreement, our company, the Property Partnership and the Holding Entities have acknowledged and agreed that Brookfield carries on a diverse range of businesses worldwide, including the development, ownership and/or management of commercial property, and investing (and advising on investing) in commercial property, or loans, debt instruments and other securities with underlying collateral or exposure to commercial property and that except as explicitly provided in the Relationship Agreement, the Relationship Agreement does not in any way limit or restrict Brookfield from carrying on its business.
- 119 -
Our ability to grow depends in part on Brookfield identifying and presenting us with acquisition opportunities. Brookfield’s commitment to us and our ability to take advantage of opportunities is subject to a number of limitations such as our financial capacity, the suitability of the acquisition in terms of the underlying asset characteristics and its fit with our strategy, limitations arising from the tax and regulatory regimes that govern our affairs and certain other restrictions. See Item 3.D. “Key Information - Risk Factors - Risks Relating to Our Relationship with Brookfield”. Under the terms of the Relationship Agreement, our company, the Property Partnership and the Holding Entities have acknowledged and agreed that, subject to providing us the opportunity to participate on the basis described above, Brookfield may pursue other business activities and provide services to third parties that compete directly or indirectly with us. In addition, Brookfield has established or advised, and may continue to establish or advise, other entities that rely on the diligence, skill and business contacts of Brookfield’s professionals and the information and acquisition opportunities they generate during the normal course of their activities. Our company, the Property Partnership and the Holding Entities have acknowledged and agreed that some of these entities may have objectives that overlap with our objectives or may acquire commercial property that could be considered appropriate acquisitions for us, and that Brookfield may have financial incentives to assist those other entities over us. If any of the Service Providers determine that an opportunity is not suitable for us, Brookfield may still pursue such opportunity on its own behalf. Our company, the Property Partnership and the Holding Entities have further acknowledged and agreed that nothing in the Relationship Agreement will limit or restrict: (i) Brookfield’s ability to make any investment recommendation or take any other action in connection with its public securities business; (ii) Brookfield from investing in any loans or debt securities or from taking any action in connection with any loan or debt security notwithstanding that the underlying collateral comprises or includes commercial property provided that the original purpose of the investment was not to acquire a controlling interest in such property; or (iii) Brookfield from acquiring or holding an investment of less than 5% of the outstanding shares of a publicly traded company or from carrying out any other investment in a company or real estate portfolio where the underlying assets do not principally constitute commercial property. Due to the foregoing, we expect to compete from time to time with other affiliates of Brookfield Asset Management or other third parties for access to the benefits that we expect to realize from Brookfield Asset Management’s involvement in our business.
In the event of the termination of our Master Services Agreement, the Relationship Agreement would also terminate, including Brookfield’s commitments to provide us with acquisition opportunities, as described above.
Under the Relationship Agreement, our company, the Property Partnership and the Holding Entities have agreed that none of Brookfield nor any affiliate, director, officer, employee, contractor, agent, advisor, member, partner, shareholder or other representative of Brookfield, will be liable to us for any claims, liabilities, losses, damages, costs or expenses (including legal fees) arising in connection with the business, investments and activities in respect of or arising from the Relationship Agreement, except to the extent that the claims, liabilities, losses, damages, costs or expenses are determined to have resulted from the person’s bad faith, fraud, willful misconduct or gross negligence, or in the case of a criminal matter, action that the person knew to have been unlawful. The maximum amount of the aggregate liability of Brookfield, or any of its affiliates, or of any director, officer, employee, contractor, agent, advisor, member, partner, shareholder or other representative of Brookfield, will be equal to the amounts previously paid in the two most recent calendar years by the Service Recipients pursuant to our Master Services Agreement.
Other Services
Brookfield may provide services to our operating entities which are outside the scope of our Master Services Agreement under arrangements that are on market terms and conditions, or otherwise permitted or approved by independent directors, pursuant to our conflicts policy, and pursuant to which Brookfield will receive fees. The services that may be provided under these arrangements include financial advisory, property management, facilities management, development, relocation services, construction activities, marketing or other services.
Preferred Shares of Certain Holding Entities
Brookfield holds $1 million of Class B redeemable preferred shares of CanHoldco, one of our Holding Entities. The Class B preferred shares are entitled to receive a cumulative preferential dividend equal to 5.0% plus the prevailing yield for 5-year U.S. Treasury Notes, which equals to 7.64%. CanHoldco may redeem the Class B preferred shares at any time and must redeem all of the outstanding Class B preferred shares on the tenth anniversary of their issuance. Brookfield has a right of retraction for the Class B preferred shares. The Class B preferred shares are entitled to vote with the common shares of CanHoldco.
In connection with the issuance of the Class A Preferred Units, Brookfield has agreed with the Class A Preferred Unitholder that the Class A Preferred Units will rank pari passu with CanHoldco’s Class B preferred shares in the payment of dividends, and that this will not prevent CanHoldco from redeeming its preferred shares except in the event of a dissolution, liquidation or winding-up of CanHoldco, in which case the Class A Preferred Units will rank pari passu with CanHoldco’s preferred shares.
- 120 -
Brookfield holds $1 million of Class B junior preferred shares of CanHoldco. In addition, Brookfield holds an aggregate of $15 million of Class A senior preferred shares of CanHoldco and of two wholly-owned subsidiaries of the Holding Entities, which preferred shares are entitled to vote with the common shares of the applicable entity. These shares are entitled to receive a cumulative preferential cash dividend equal to 5% as and when declared by the board of directors of the applicable entity and are redeemable at the option of the applicable entity, subject to certain limitations, at any time after the twentieth anniversary of their issuance. Brookfield has an aggregate of 2% of the votes to be cast in respect of CanHoldco and 1% of the votes to be cast in respect of each of the other applicable entities.
Redemption-Exchange Mechanism
The holders of Redemption-Exchange Units of the Property Partnership have the right to require the Property Partnership to redeem all or a portion of the Redemption-Exchange Units for either (a) cash in an amount equal to the market value of one of our LP Units multiplied by the number of LP Units to be redeemed (subject to certain adjustments) or (b) such other amount of cash as may be agreed by the relevant holder and the Property Partnership, subject to our company’s right to acquire such interests (in lieu of redemption) in exchange for LP Units. See Item 10.B. “Additional Information - Memorandum and Articles of Association - Description of the Property Partnership Limited Partnership Agreement - Redemption-Exchange Mechanism”. Taken together, the effect of the redemption right and the right of exchange is that the holders of Redemption-Exchange Units will receive LP Units, or the value of such LP Units, at the election of our company. Should we determine not to exercise our right of exchange, cash required to fund a redemption of Redemption-Exchange Units will likely be financed by a public offering of our units.
Registration Rights Agreement
Our company has entered into a customary registration rights agreement with Brookfield pursuant to which we have agreed that, upon the request of Brookfield, our company will file one or more registration statements to register for sale, under the U.S. Securities Act of 1933, as amended (collectively, the “Securities Act”) or one or more prospectuses to qualify the distribution in Canada, any LP Units held by Brookfield (including LP Units of our company acquired pursuant to the Redemption-Exchange Mechanism). Under the registration rights agreement, our company is not required to file a U.S. registration statement or a Canadian prospectus unless Brookfield requests that LP Units having a value of at least $50 million be registered or qualified. In the registration rights agreement, we have agreed to pay expenses in connection with such registration and sales, except for any underwriting discounts or commissions, which will be borne by the selling unitholder, and to indemnify Brookfield for material misstatements or omissions in the registration statement and/or prospectus.
Equity Enhancement and Incentive Distributions
Property Special LP, a wholly-owned subsidiary of Brookfield Asset Management, is entitled to receive equity enhancement distributions and incentive distributions from the Property Partnership as a result of its ownership of the special limited partnership interest in the Property Partnership. Property Special LP will receive quarterly equity enhancement distributions equal to 0.3125% of the amount by which our company’s total capitalization value exceeds an initial reference value determined based on the market capitalization immediately following the Spin-off, subject to certain adjustments. In addition, Property Special LP will receive incentive distributions calculated in increments based on the amount by which quarterly distributions on the limited partnership units of the Property Partnership exceed specified target levels as set forth in the Property Partnership’s limited partnership agreement.
We believe these arrangements create an incentive for Brookfield to manage our company in a way that helps us achieve our goal of creating value for our unitholders both through distributions and capital appreciation. For a further explanation of the equity enhancement and incentive distributions, together with examples of how such amounts are calculated, see Item 10.B. “Additional Information - Memorandum and Articles of Association - Description of the Property Partnership Limited Partnership Agreement - Distributions”.
Property Special LP may, at its sole discretion, elect to reinvest equity enhancement distributions and incentive distributions in exchange for Redemption-Exchange Units.
To the extent that any Holding Entity or any operating entity pays to Brookfield any comparable performance or incentive distribution, the amount of any future incentive distributions will be reduced in an equitable manner to avoid duplication of distributions.
- 121 -
General Partner Distributions
Pursuant to our limited partnership agreement, the BPY General Partner is entitled to receive a general partner distribution equal to 0.2% of the total distributions of our company.
Special Limited Partner Distributions
Pursuant to the limited partnership agreement of the Property Partnership, Property Special LP is entitled to receive a distribution from the Property Partnership equal to a share of the total distributions of the Property Partnership in proportion to Property Special LP’s percentage interest in the Property Partnership which will be equal to 1% of the total distributions of the Property Partnership. See Item 10.B. “Additional Information - Memorandum and Articles of Association - Description of the Property Partnership Limited Partnership Agreement - Distributions”.
Indemnification Arrangements
Subject to certain limitations, Brookfield and its directors, officers, agents, subcontractors, contractors, delegates, members, partners, shareholders and employees generally benefit from indemnification provisions and limitations on liability that are included in our limited partnership agreement, the BPY General Partner’s bye-laws, the Property Partnership’s limited partnership agreement, our Master Services Agreement and other arrangements with Brookfield. See Item 7.B. “Major Shareholders and Related Party Transactions - Related Party Transactions - Our Master Services Agreement”, Item 10.B. “Additional Information - Memorandum and Articles of Association - Description of Our LP Units, Preferred Units and Our Limited Partnership Agreement - Indemnification; Limitations on Liability” and Item 10.B. “Additional Information - Memorandum and Articles of Association - Description of the Property Partnership Limited Partnership Agreement - Indemnification; Limitations on Liability”.
Maturity of Class A Preferred Units
The Class A Preferred Units are exchangeable at the option of the Class A Preferred Unitholder into LP Units at a price of $25.70 per unit and were issued on December 4, 2014 in three tranches of $600 million each, with an average dividend yield of 6.5% and maturities of seven, ten and twelve years. After three years for the seven-year tranche and four years for the ten- and twelve-year tranches, we can effectively require the Class A Preferred Unitholder to exchange the Class A Preferred Units into LP Units as long as our LP Units are trading at or above 125%, 130% and 135%, respectively, of the exchange price. Upon maturity, the Class A Preferred Units that remain outstanding will be redeemed in exchange for LP Units valued at the 20-day, volume-weighted average trading price at such time. To the extent that the market price of our LP Units is less than 80% of the exchange price at maturity, Brookfield has contingently agreed to acquire the seven-year and ten-year tranches of Class A Preferred Units from the Class A Preferred Unitholder for the initial issuance price plus accrued and unpaid distributions and to exchange such units for preferred units of the Property Partnership with terms and conditions substantially similar to the twelve-year tranche. Brookfield has also agreed with the Class A Preferred Unitholder to grant Brookfield the right to purchase all or any portion of the Class A Preferred Units held by the Class A Preferred Unitholder at maturity, and to grant the Class A Preferred Unitholder the right to sell all or any portion of the Class A Preferred Units held by the Class A Preferred Unitholder at maturity, in each case at a price equal to the issue price for such Class A Preferred Units plus accrued and unpaid dividends.
Conflicts of Interest and Fiduciary Duties
As a global alternative asset manager with various business lines, significant assets under management and a long history of owning and operating assets and businesses across various industries, sectors and geographies, Brookfield leverages its broad reach, expertise and relationships in managing its clients’ (including our company’s) investment and asset management activities. As such, our organizational, ownership and management structure and strategy involve a number of aspects and relationships that give rise to conflicts (and potential conflicts) of interest considerations between our company and our unitholders, on the one hand, and Brookfield and Brookfield Accounts, on the other hand. While Brookfield (directly and/or indirectly) benefits from these aspects and relationship, Brookfield believes that they are in the best interest of its clients (including our company).
The discussion below sets out certain of these conflicts of interest, but does not purport to be a complete list or explanation of all potential conflicts of interest. While Brookfield acts in good faith to resolve all potential conflicts in a manner that is fair and equitable taking into account the facts and circumstances known to it at the time, there can be no assurance that any recommendation or determination made by Brookfield will be most beneficial or favorable to us, or would not have been different if additional information were available to it. Potential conflicts of interest generally will be resolved in accordance with the principles summarized herein and in accordance with the conflicts policy that has been approved by the BPY General Partner's independent directors. The conflicts policy was put in place in recognition of the benefit to our company of our relationship with Brookfield and our intent to seek to maximize the benefits from this relationship. The policy generally provides for potential
- 122 -
conflicts to be resolved on the basis of transparency and, in certain circumstances, third-party validation and approvals. As it is not possible to predict all of the types of conflicts that may arise, the policy focuses on addressing the principal activities that are expected to give rise to potential or actual conflicts of interest, including our investment activities, our participation in Brookfield Accounts, transactions with Brookfield (and Brookfield Accounts), and engagements of Brookfield affiliates (or of us by Brookfield Accounts), including engagements for operational services entered into between underlying operating entities.
As described elsewhere herein, we pursue acquisition opportunities in various ways, including indirectly through investments in Brookfield Accounts or directly by investing alongside Brookfield Accounts. Any references in this Item 7.B. "Related Party Transactions-Conflicts of Interest and Fiduciary Duties" to our acquisitions, investments, assets, expenses, portfolio companies or other terms should be understood to mean such items held, incurred or undertaken directly by us or indirectly by us through our investment in one or more Brookfield Accounts.
| • | Allocation of Investment Opportunities. In recommending acquisition opportunities, Brookfield has significant discretion to determine the suitability and/or appropriateness of opportunities for us and to allocate such opportunities among us, Brookfield, Brookfield Accounts, and/or third parties as it deems appropriate in its sole discretion. Brookfield and Brookfield Accounts have (and future Brookfield Accounts may in the future have) investment mandates that overlap with our investment mandate, including Brookfield Accounts that invest in, own, operate, develop and recycle portfolios of real estate assets, and in which we generally expect to be a significant investor. In addition, Brookfield has provided, and will in the future provide (without notice to our unitholders), priority rights with respect to certain investment opportunities, including all or a select geographic, industry or other subset of opportunities, to certain Brookfield Accounts (but not to us) or to other persons pursuant to contractual or other arrangements. In particular, Brookfield Accounts with real estate, infrastructure, renewable power, or technology focused investment mandates generally have been (and will in the future be) given priority with respect to investment opportunities that are suitable and appropriate for them. As a result, in certain cases, Brookfield Accounts will compete with, or have priority over, our company in respect of investment opportunities, and opportunities that would otherwise be suitable for us will not be made available to us, we will receive a smaller allocation of such opportunities than would otherwise have been the case, or we will receive an allocation of such opportunities on different terms than Brookfield or Brookfield Accounts (which may be less favorable than otherwise would have been the case). |
The question of whether a particular opportunity is suitable and/or appropriate for us, and to the extent it is the amount of such opportunity to be allocated to us, is highly subjective and will be made in Brookfield's sole discretion in a manner that Brookfield believes is fair and equitable and based on various portfolio construction and management factors, including among others: (i) the size, nature and type of the opportunity (including the expected risk-return profile of the investment, expected holding period and its fit with the balance of our investments and related operations), (ii) the amount of capital available for investment, (iii) principles of diversification of assets (including whether we will participate in the opportunity through our investment in Brookfield Accounts), (iv) the nature and extent of involvement in the transaction and the sourcing of the transaction by the Brookfield investment professionals that manage our company, (v) the nature of potential acquirers upon disposition, (vi) our expected future capacity, (vii) cash and liquidity needs (including our interest in preserving capital in order to secure other opportunities and/or to meet other obligations), (viii) the availability of other appropriate or similar investment opportunities (including opportunities that we may be pursuing or otherwise considering at the relevant time) and (ix) other considerations deemed relevant by Brookfield (including legal, regulatory, tax, timing and similar considerations). If Brookfield determines that an opportunity is not suitable or appropriate for us, it could still pursue such opportunity on its own behalf or on behalf of one or more Brookfield Accounts. As a result, there are likely to be differences in the overall performance of our company, Brookfield and Brookfield Accounts that have overlapping investment mandates.
In allocating investment opportunities among us, Brookfield and Brookfield Accounts (including Brookfield Accounts that have investment mandates that overlap with that of our company), Brookfield will face certain potential conflicts of interest between the interests of our company, its interests and the interests of Brookfield Accounts. These potential conflicts will be exacerbated in situations where Brookfield has larger interests in Brookfield Accounts than its interest in our company, where Brookfield is entitled to higher fees from Brookfield Accounts than from our company, where portfolio managers making an allocation decision are entitled to performance-based compensation from Brookfield or a Brookfield Account, or where there are capacity constraints with respect to a particular strategy or opportunity as a result of, for example, position limits and/or regulatory reporting obligations applicable to Brookfield. In addition, as an investment changes over time, additional conflicts of interest are expected to arise, including as a result of earlier investment allocation decisions. Brookfield will make investment allocation decisions taking into account our company’s, Brookfield’s and Brookfield Accounts’ investment mandates and interests.
| • | Allocation of Broken-Deal Expenses. We will incur expenses with respect to the consideration and pursuit of transactions that are not ultimately consummated, referred to as broken-deal expenses, including through our investments in Brookfield |
- 123 -
Accounts. Examples of broken-deal expenses include (i) research costs, (ii) fees and expenses of legal, financial, accounting, consulting or other advisers (including Brookfield) in connection with conducting due diligence or otherwise pursuing a particular non-consummated transaction, (iii) fees and expenses in connection with arranging financing for a particular non-consummated transaction, (iv) travel costs, (v) deposits or down payments that are forfeited in connection with, or amounts paid as a penalty for, a particular non-consummated transaction and (vi) other expenses incurred in connection with activities related to a particular non-consummated transaction. Broken-deal expenses generally will be allocated among our company, Brookfield and Brookfield Accounts in the manner that Brookfield determines to be fair and equitable, which may be pro rata or on a different basis.
| • | Co-Investment Opportunities and Expenses. Because of the scale of typical real estate related investment opportunities, we offer portions of certain acquisition opportunities for co-investment. In addition, because our strategy includes completing acquisitions through Brookfield Accounts, we will likely make co-investments with Brookfield and Brookfield Accounts. Decisions regarding whether and to which parties to offer co-investment opportunities are made by Brookfield and are based on a number of factors, including portfolio construction, strategic or other considerations, taking into account the specific facts and circumstances relating to each potential co-investment opportunity. As a result, from time to time, we expect to offer (or receive from Brookfield Accounts) larger or smaller portions of co-investment opportunities than would otherwise have been the case or no portion of certain opportunities. |
In our capacity as a co-investor, we will typically bear our pro rata share of fees, costs and expenses related to the discovery, investigation, development, acquisition or consummation, ownership, maintenance, monitoring, hedging and disposition of our co-investments and we may be required to pay our pro rata share of fees, costs and expenses related to potential investments that are not consummated, such as broken deal expenses (including “reverse” breakup fees). Brookfield will endeavor to allocate such fees, costs and expenses on a fair and equitable basis. Notwithstanding the foregoing, certain potential co-investors may not agree to pay or otherwise bear fees, costs and expenses related to unconsummated co-investments. In addition, in certain circumstances, potential co-investors may not bear such fees, costs and expenses, including because they have not yet been identified (or their anticipated allocation has not yet been identified) as of the time such potential investment ceases to be pursued, are not yet committed to such potential investment or are not contractually required to bear such fees, costs and expenses. In those events, such fees, costs and expenses will (i) be considered our operating expenses and be borne by us (in connection with co-investment opportunities that we offered) or (ii) be considered operating expenses of, and be borne by, the Brookfield Account (in connection with co-investments offered by the Brookfield Account), a pro-rata portion of which will be borne by us through our investment in the Brookfield Account.
| • | Other Activities of Our Investment Personnel. The same professionals within Brookfield's organization who are involved in sourcing and executing acquisitions that are suitable for us are responsible for sourcing and executing opportunities for Brookfield Accounts as well as having other responsibilities within Brookfield's broader asset management business. Limits on the availability of such individuals will likewise result in a limitation on the availability of acquisition opportunities for us, and such individuals' broader responsibilities will potentially conflict with their responsibilities to us. These potential conflicts may be exacerbated in situations where Brookfield or its employees are entitled to greater fees, incentive compensation or other remuneration in connection with their activities for other Brookfield Accounts relative to their activities for our company or where there are differences in investments made for us relative to investments made for other Brookfield Accounts (including the Investing Affiliate (as defined below)). |
| • | Investments by Brookfield Personnel. The partners, members, shareholders, directors, officers and employees of Brookfield (“Brookfield Personnel”) are permitted to buy and sell securities or other investments for their own or their family members’ accounts (including through Brookfield Accounts), subject to the limitations described below. Positions may be taken by such Brookfield Personnel that are the same, different from, or made at different times than positions taken directly or indirectly for us. To reduce the possibility of (a) potential conflicts between our investment activities and those of Brookfield Personnel, and (b) us being materially adversely affected by Brookfield Personnel’s personal trading activities, Brookfield has established policies and procedures relating to personal securities trading. To this end, Brookfield Personnel that participate in managing our investment activities are generally restricted from engaging in personal trading activities (unless such activities are conducted through accounts over which the personnel have no influence or control), and other personnel generally must pre-clear proposed personal trades. In addition, Brookfield’s policies include prohibitions on insider trading, front running, trading in securities that are on Brookfield’s securities watch list, trading in securities that are subject to a black-out period and other restrictions. |
- 124 -
| • | Investments by the Investing Affiliate. Certain Brookfield executives own a substantial majority of an entity that makes investments for its own account (the “Investing Affiliate”). The Investing Affiliate’s activities are managed separately from our (or any Brookfield Account’s) activities. There is no formal informational barrier between the Investing Affiliate and the rest of Brookfield. Brookfield has adopted protocols designed to ensure that the Investing Affiliate’s activities do not materially adversely affect our (and Brookfield Accounts’) activities and to ensure that potential conflicts are resolved in a manner pursuant to which our (and Brookfield Accounts’) interests are, to the extent feasible, prioritized relative to the Investing Affiliate’s. |
| • | Warehousing Investments. From time to time, Brookfield will “warehouse” certain investments on our behalf, i.e., Brookfield will make an investment on our behalf and transfer it to us at a later date at cost plus a pre-agreed interest rate, after we have raised sufficient capital, including financing, to support the acquisition. Similarly, from time to time we will warehouse one or more investments for a Brookfield Account in which we are invested (or expect to invest) and transfer the warehoused investments to the applicable Brookfield Account at cost plus a pre-agreed interest rate, once the Brookfield Account has raised sufficient capital, including financing, to support the acquisition. In the event the applicable Brookfield Account does not obtain sufficient capital and/or financing to purchase the warehoused investment and we cannot find another buyer for the investment, we would be forced to retain the investment, the value of which may have increased or declined. |
| • | Transacting with Brookfield. When permitted by applicable law and subject to and in accordance with our conflicts policy, from time to time we buy investments from and/or sell investments to Brookfield and/or Brookfield Accounts. While such transactions generally require the approval of the BPY General Partner’s independent directors and, in connection with transactions with a Brookfield Account, the advisory committee of the applicable Brookfield Account, there can be no assurance that such transactions will be effected or that such transactions will be effected in the manner that is most favorable to us as a party to any such transaction. |
| • | Terms of an Investment by Our Company May Benefit or Disadvantage Brookfield or A Brookfield Account. In making decisions with regard to certain potential investments by our company (or by a Brookfield Account in which we are invested), Brookfield faces certain conflicts of interest between the interests of our company (or the Brookfield Account), on the one hand, and the interests of Brookfield, the Investing Affiliate and/or Brookfield Account(s) that have already made related investments, on the other hand. Similarly, prospective investments by Brookfield or Brookfield Account(s) present conflicts of interest with respect to investments held by our company. Subject to applicable law and our conflicts policy, Brookfield from time to time causes our company to invest in securities, bank loans or other obligations of companies affiliated with or advised by Brookfield or in which Brookfield, the Investing Affiliate or a Brookfield Account has an equity, debt or other interest, or to engage in investment transactions that result in Brookfield, the Investing Affiliate or a Brookfield Account getting an economic benefit, being relieved of obligations or divested of investments. For example, from time to time we make debt or equity investments in entities which are expected to use the proceeds of such investment to repay loans from Brookfield or a Brookfield Account. Depending on the circumstance, Brookfield or such Brookfield Account would benefit if our company invested more money, thus providing sufficient funds to repay Brookfield or the Brookfield Account, or it would benefit if the loans remained outstanding and Brookfield or such Brookfield Account continued to receive payment under the existing loans, if the loans were on attractive terms (including an attractive interest rate) from the perspective of Brookfield or such Brookfield Account. Alternatively, from time to time Brookfield and/or Brookfield Account(s) are in the position of making an investment that could be used to repay loans from our company, which would present the opposite conflict. Similar conflicts arise in other situations as well. For example, in certain circumstances, we pursue take-private, asset purchase or other material transactions with an issuer in which Brookfield, the Investing Affiliate or a Brookfield Account is invested, which results in a benefit to Brookfield, the Investing Affiliate or the Brookfield Account. In situations where our activities enhance Brookfield’s, the Investing Affiliate’s or a Brookfield Account’s profitability, Brookfield could take its, the Investing Affiliate’s or the Brookfield Account’s interests into consideration in connection with actions it takes on our behalf. |
| • | Investments with Related Parties. In certain circumstances, we will participate in investments that involve Brookfield or Brookfield Accounts in equity or debt positions within a transaction. For example, from time to time Brookfield or Brookfield Accounts will: (a) enter into a joint transaction with us; (b) be borrowers of certain investments or lenders in respect of our company; or (c) invest in different levels of an issuer’s capital structure. As a result of the various conflicts and related issues described herein, we could sustain losses during periods in which Brookfield or Brookfield Accounts achieve profits generally or with respect to particular investments, or could achieve lower profits or higher losses than would have been the case had the conflicts described herein not existed. |
- 125 -
Brookfield Accounts invest in a broad range of asset classes throughout the corporate capital structure, including debt positions (either junior or senior to our positions) and equity securities (either common or preferred). It is possible that we will hold an interest in one part of a company’s capital structure while Brookfield or a Brookfield Account holds an interest in another. The interests of Brookfield or Brookfield Accounts in such investments could differ from our interests and could have been acquired at different times, at different prices and/or subject to different terms and conditions. Brookfield and/or Brookfield Accounts may dispose of their interests at different times and on different terms than us.
In situations in which we invest alongside Brookfield or a Brookfield Account, conflicts of interest will potentially arise with respect to the nature and timing of the initial investment and purchase price, the allocation of control rights and the strategic objectives or timing of transactions, including in connection with the disposition of all or part of an investment. These conflicts could result from various factors, including investments in different levels of the capital structure, different investment objectives, different measurements of control, different risk profiles, different rights with respect to disposition alternatives, different investment horizons and/or different target rates of return.
As a result of these differences, Brookfield or Brookfield Accounts expect to manage such interests in a way that is different from ours (including, for example, by investing in different portions of an issuer’s capital structure, investing in the same portion but on different terms, obtaining exposure to the investment using different types of securities or instruments, voting securities in a different manner, and/or acquiring or disposing of its interests at different times than us). In connection with the foregoing, Brookfield or Brookfield Accounts could pursue or enforce rights or activities, or refrain from pursuing or enforcing rights or activities, with respect to a particular investment in which we have invested, even though such actions or inaction could adversely affect us. For example, if an issuer in which we have an investment and in which Brookfield or a Brookfield Account also has an investment, but at a different portion of the capital structure, becomes distressed or defaults on its obligations, Brookfield will have conflicting loyalties between its duties to us and to itself or to the Brookfield Account. In such a situation Brookfield, acting on behalf of itself or a Brookfield Account, could seek a liquidation, reorganization or restructuring of the issuer that would have an adverse effect on our holdings in the same issuer, and our transactions may be effected at prices or terms that would be less favorable than would otherwise have been the case (or vice versa). In addition, in the event that Brookfield or Brookfield Accounts hold voting securities of an issuer in which we hold loans, bonds, or other credit-related securities, Brookfield or such Brookfield Accounts may have the right to vote on certain matters that have an adverse effect on the positions held by us. Furthermore, to the extent that Brookfield or a Brookfield Account has holdings in the same issuer as us, Brookfield has an incentive to take its interests or the interests of such Brookfield Account into consideration in connection with actions it takes on behalf of our company, even though taking such interests into account could adversely affect us.
In addition, from time to time we and Brookfield or a Brookfield Account may jointly acquire a portfolio of assets and thereafter divide up the assets. In this circumstance, Brookfield will determine the purchase price associated with each asset, which price may not represent the price we would have paid if we had acquired only the assets we ultimately retain. Furthermore, from time to time we and Brookfield or a Brookfield Account may jointly enter into a binding agreement to acquire an investment. If Brookfield or such Brookfield Account is unable to consummate such investment, we could be subject to additional liabilities, including the potential loss of any deposit or the obligation to fund the entire investment. In addition, from time to time we provide for the repayment of indebtedness and/or the satisfaction of guarantees on behalf of a Brookfield Account in connection with investments made by such Brookfield Account alongside our company. Likewise, from time to time Brookfield Account(s) in which we are invested provide for the repayment of indebtedness and/or the satisfaction of guarantees on behalf of co-investment vehicles in connection with investments made by such vehicles alongside the Brookfield Account. In such circumstances, certain investors will benefit from such provision for repayment of indebtedness and/or the satisfaction of guarantees even though those investors are not providing the same level of credit support as our company (or the Brookfield Account, as applicable). In the event the Brookfield Account (or a co-invest vehicle) does not satisfy its share of any payment in respect of any such borrowing, we (or the Brookfield Account in which we are invested, as applicable) will be contractually obligated to satisfy their share even if our company (or the Brookfield Account) does not have recourse against the investor(s) benefiting from such support.
Subject to Brookfield policies, information barriers and applicable legal restrictions, other parts of Brookfield have and expect (but are under no obligation) to refer investment opportunities to us, including investments in issuers in which Brookfield Accounts have existing investments. Referrals of such related investments give rise to potential conflicts of interest, including that an investment by our company will in certain circumstances benefit such Brookfield Accounts.
In situations in which we invest alongside Brookfield or a Brookfield Account, conflicts of interest exist with respect to the nature and timing of the initial investment and purchase price, the allocation of control rights, strategic objectives, timing of transactions, such as the disposition of all or part of an investment, or resolution of a liability in connection with an investment. These conflicts result from various factors, including investments in different levels of the capital structure,
- 126 -
different measurements of control, different risk profiles, different rights with respect to disposition alternatives, different investment horizons and different target rates of return.
As a result of the various conflicts and related issues described above, we could sustain losses during periods in which Brookfield or Brookfield Account(s) achieve profits generally or with respect to particular holdings, or could achieve lower profits or higher losses than would have been the case had the conflicts described above not existed.
| • | Excess Funds Liquidity Arrangement with Related Parties. We have an arrangement in place with Brookfield pursuant to which we may lend Brookfield excess funds from time to time and it lends us excess funds from time to time. This arrangement is intended to enhance the use of excess funds between us and Brookfield when the lender has excess funds and the borrower has a business need for the capital (including, without limitation, to fund operating / investment activities and/or to pay down higher cost capital), providing (i) to the lender, a higher rate of return on the funds than it otherwise would be able to achieve in the market and (ii) to the borrower, a lower cost of funds than it otherwise would be able to obtain in the market. |
Brookfield, in its capacity as our Service Provider, determines when it is appropriate for us to lend excess funds to, or borrow excess funds from, Brookfield. Brookfield has similar arrangements with other affiliates for whom it serves in one or more capacities, including (among others) promoter, principal investor and investment manager. It is therefore possible that, from time to time and to the extent that Brookfield determines this to be in the best interests of the parties: (i) funds that are placed on deposit with Brookfield by our partnership will, in the discretion of Brookfield on a case-by-case basis, be lent on to other affiliates of Brookfield and (ii) funds that are placed on deposit with Brookfield by other Brookfield affiliates will, in the discretion of Brookfield on a case-by-case basis, be lent on to our partnership. Because the interest rates charged are reflective of the credit ratings of the applicable borrowers, any loans by Brookfield to its affiliates, including our partnership (as applicable), generally will be at higher interest rates than the rates then applicable to any balances deposited with Brookfield by our partnership or other Brookfield affiliates (as applicable). These differentials are approved according to protocols described below. Accordingly, Brookfield also benefits from these arrangements and will earn a profit as a result of the differential in lending rates.
Amounts we lend to or borrow from Brookfield pursuant to this arrangement generally are repayable at any time upon either side’s request, and Brookfield generally ensures that the borrower has sufficient available capital from another source in order to meet potential repayment demands. As noted above, Brookfield determines the interest rate to be applied to borrowed/loaned amounts taking into account each party’s credit rating and the interest rate that would otherwise be available to it in similar transactions on an arms’ length basis with unrelated parties.
Conflicts of interest arising for Brookfield under this arrangement have been approved by the governance and nominating committee in accordance with our conflicts policy.
| • | Pursuit of Investment Opportunities by Certain Non-Controlled Affiliates. Certain companies affiliated with Brookfield (a) are controlled, in whole or in part, by persons other than Brookfield, including, for example, joint ventures or similar arrangements with third parties where Brookfield does not have complete control; (b) are separated from Brookfield pursuant to an information barrier; or (c) do not coordinate or consult with Brookfield with respect to investment decisions (collectively, “Non-Controlled Affiliates”). Such Non-Controlled Affiliates are likely to have investment mandates that overlap with our investment mandate giving rise to potential conflicts. For example, from time to time such Non-Controlled Affiliates or investment vehicles managed by such Non-Controlled Affiliates will pursue investment opportunities which are suitable for us but which are not made available to us since such Non-Controlled Affiliates do not consult with and/or are not wholly controlled by Brookfield. Similarly, certain of Brookfield’s investment activities are managed independently of, and carried out without any reference to the management of our company. In certain instances, there are information barriers in place pursuant to which investment operations are managed independently of each other and information is not generally shared relating to such activities. |
| • | Arrangements with Brookfield. Our relationship with Brookfield involves a number of arrangements pursuant to which Brookfield provides various services, including access to financing arrangements and acquisition opportunities. Certain of these arrangements were effectively determined by Brookfield in the context of the Spin-off, and could contain terms that are less favorable than those which otherwise might have been negotiated between unrelated parties. Circumstances may arise in which these arrangements will need to be amended or new arrangements will need to be entered into, and conflicts of interest between our company and Brookfield will arise in negotiating such new or amended arrangements. Furthermore, Brookfield is generally entitled to share in the returns generated by our operations, which creates an incentive for it to assume greater risks when making decisions than it otherwise would in the absence of such arrangements. In addition, our investment in Brookfield Accounts provides Brookfield with certain ancillary benefits, such as satisfying Brookfield's commitment to |
- 127 -
invest in such accounts (which Brookfield would otherwise need to satisfy from different sources) and assisting Brookfield in marketing the Brookfield Accounts.
| • | Brookfield Personnel Arrangements. In the ordinary course, Brookfield employees are hired or retained by, or seconded or otherwise allocated to (in whole or in part), our company and/or portfolio companies that we are directly or indirectly invested in for performance of operating services or roles that in the normal course are expected to be carried out by our (or the relevant portfolio company’s) personnel. In connection with any such arrangement, all or a portion of the compensation and overhead expenses relating to such employees (including base salaries, benefits and incentive compensation (which may include long term incentive awards of equity or options for equity in Brookfield), among other things) will directly or indirectly be borne by us or the applicable portfolio companies. The compensation and overhead expenses relating to such employees generally will be within the market compensation range for the roles filled in the relevant market based on one or more of the following: (i) market compensation studies or guidance provided by third parties, (ii) recent market hires made by the relevant portfolio company for comparable positions, (iii) the employee’s peers at Brookfield and the portfolio company, and/or (iv) specific compensation reviews conducted by compensation consultants. For these purposes, given how certain compensation arrangements are structured and valued (particularly various forms of incentive compensation that vest over time and whose value upon payment is based on estimates) and how overhead expenses are generally allocated, in each case requiring certain judgments and assumptions, there can be no assurance that portfolio companies (and indirectly our company) will not bear higher costs than they would have had had such expenses been valued, allocated or charged differently. |
Brookfield and its personnel will receive certain intangible and/or other benefits and/or perquisites arising or resulting from their activities on behalf of our company and/or portfolio companies in which we are (directly or indirectly) invested which will not reduce fees or other expenses or otherwise be shared with our company and/or our portfolio companies. For example, airline travel and hotel stays incurred as direct or indirect expenses of our company and/or portfolio companies in which we are (directly or indirectly) invested typically may result in “miles” or “points” or credit in loyalty/status programs, and such benefits and/or amounts will, whether or not de minimis or difficult to value, inure exclusively to Brookfield and/ or such personnel (and not our company and/or our portfolio companies) even though the cost of the underlying service is borne by directly or indirectly by our company and/or our portfolio companies. In addition, Brookfield has in the past and expects to continue to make available certain discount programs to its employees as a result of Brookfield’s relationship with a portfolio company, such as “friends and family” and similar discounts.
| • | Brookfield Investments in Companies. Brookfield (or Brookfield Accounts) will from time to time make equity or other investments in companies or businesses that provide services to or otherwise contract with us, Brookfield Accounts in which we are invested or our direct or indirect portfolio companies. In particular, Brookfield has in the past entered into, and expects to continue to enter into, relationships with companies in technology and other sectors and industries in which Brookfield has broad expertise and knowledge, whereby Brookfield acquires an equity or other interest in such companies that may, in turn, transact with us, Brookfield Accounts in which we are invested or our direct or indirect portfolio companies. For example, Brookfield (through an investment program referred to as Brookfield Technology Partners) invests in emerging technology companies that develop and offer technology products that are expected to be of relevance to us, Brookfield Accounts in which we are invested or our direct or indirect portfolio companies (as well as third-party companies). In connection with such relationships, Brookfield refers, introduces or otherwise facilitates transactions between such companies and us, Brookfield Accounts in which we are invested or our direct or indirect portfolio companies. In all cases, Brookfield seeks to ensure that the transactions are in the best interests of our company, the Brookfield Accounts in which we are invested and/or our direct or indirect portfolio companies, with terms to be determined in good faith as fair, reasonable and equitable under the circumstances. However, these transactions also result in benefits to Brookfield, including via increased profitability of the relevant company as well as financial incentives and/or milestones which benefit Brookfield (including through increased equity allotments), which are likely in some cases to be significant. Such financial incentives that inure to or benefit Brookfield (or Brookfield Accounts) pose an incentive for Brookfield to cause us, Brookfield Accounts in which we are invested or our direct or indirect portfolio companies to enter into such transactions that may not have otherwise been entered into. Financial incentives derived from relationships with such companies will generally not be shared with us. Furthermore, such transactions are likely to contribute to the development of expertise, reputational benefits and/or the development of new products or services by Brookfield and/or the companies or businesses that Brookfield is invested in, which Brookfield will seek to capitalize on to generate additional benefits that are likely to inure solely to Brookfield (or Brookfield Accounts) and not to us. For the avoidance of doubt, any of the arrangements and/or benefits described in this paragraph will not require notice to, or the consent of, our unitholders. Brookfield may take its own interests into account in considering and making determinations regarding these matters. |
| • | Sharing of Services. In certain circumstances, in order to create efficiencies and optimize performance, one or more of our investments, portfolio companies or assets will determine to share the operational, legal, financial, back-office or other |
- 128 -
resources of another of our investments, portfolio companies or assets, or of an investment, portfolio company or asset of Brookfield or a Brookfield Account. In connection therewith, the costs and expenses related to such services will be allocated among the relevant entities on a basis that Brookfield determines in good faith is fair and equitable (but which will be inherently subjective, and there can be no assurance that we will not bear a disproportionate amount of any costs, including Brookfield’s internal costs).
| • | Related Party Transactions. We (including our portfolio companies and portfolio companies of Brookfield Accounts that we are invested in) are and will be counterparties in agreements, transactions and other arrangements with other Brookfield Accounts (including their portfolio companies) for the provision of goods and services, purchase and sale of assets and other matters that would otherwise be transacted with independent third parties. Some of these agreements, transactions and other arrangements would not have been entered into but for the affiliation or relationship with Brookfield and, in certain cases, are expected to replace agreements, transactions and/or arrangements with third parties. These agreements, transactions and other arrangements will involve payment of fees and other amounts and/or other benefits to Brookfield Accounts and their portfolio companies (including, in certain cases, performance-based compensation), none of which will result in any offset to management and other fees payable by our company to Brookfield. Such agreements, transactions and other arrangements will generally be entered into without the consent or direct involvement of the BPY General Partner’s independent directors or our unitholders. |
These agreements, transactions or other arrangements are expected to be entered into in the ordinary course. In certain cases, they will be entered into with active participation by Brookfield and in other cases by the portfolio companies’ management teams independently of Brookfield. In all cases, Brookfield will seek to ensure that the agreements, transactions or other arrangements are in the portfolio companies’ best interests, with terms to be determined in good faith as fair, reasonable and equitable under the circumstances. However, there can be no assurance that the terms of any such agreement, transaction or other arrangement will be executed on an arm’s length basis, be as favorable to the applicable portfolio company as otherwise would be the case if the counterparty were not related to Brookfield, or be the same as those that other Brookfield Accounts and their portfolio companies receive from the counterparty. In some circumstances, we and our portfolio companies may receive better terms from the counterparty than from an independent counterparty. In other cases, these terms may be worse.
While these agreements, transactions and/or arrangements raise potential conflicts considerations, Brookfield believes that our access to Brookfield Accounts and their portfolio companies enhances our capabilities and is an integral part of our operations.
| • | Information Sharing. Because of the extensive scope of Brookfield’s activities, Brookfield often has or obtains information that can be utilized by Brookfield across multiple strategies. For example, information Brookfield has or acquires through its management of Brookfield Accounts and/or its own investing activities is used by Brookfield to identify or evaluate potential investments for us. Conversely, information Brookfield has or acquires in connection with our activities is used for the benefit of Brookfield and/or Brookfield Accounts (and, for the avoidance of doubt, Brookfield will have no duty (contractual, fiduciary or otherwise) to keep such information confidential from, or not to use such information in connection with the investment activities of, itself and/or Brookfield Accounts). Brookfield will trade, or may cause Brookfield Accounts to trade, on the basis of information it has or obtained through our investment and operations activities. In some cases, this trading will result in Brookfield and/or a Brookfield Account taking a position that is different from, and potentially adverse to, a position taken by our company, or result in Brookfield or a Brookfield Account benefiting from our investment activities. Brookfield has implemented policies and procedures to mitigate potential conflicts of interest and address certain regulatory requirements and contractual restrictions with respect to communication and information sharing. Such policies and procedures generally reduce synergies across Brookfield’s various activities and negatively affect Brookfield’s or our ability to pursue attractive investment opportunities that would otherwise be available to Brookfield or us if such policies and procedures were not implemented. From time to time, such policies and procedures will result in our company, Brookfield or Brookfield Accounts having reduced investment opportunities or investment flexibility, or otherwise restrict us, Brookfield or Brookfield Accounts in their activities with respect to such information. |
Regardless of the existence of information barriers, Brookfield will not have any obligation or other duty to make available for our benefit any information regarding Brookfield’s trading activities, strategies or views, or the activities, strategies or views used for other Brookfield Accounts. Furthermore, to the extent that Brookfield has access to analysis, models and/ or information developed by Brookfield and its personnel, Brookfield will not be under any obligation or other duty to effect transactions on behalf of our company in accordance with such analysis and models. In the event Brookfield elects not to share certain information with us, we may make investment decisions that differ from those it would have made if Brookfield had provided such information, which may be disadvantageous to us.
- 129 -
| • | Material Non-Public Information; Trading Restrictions. From time to time, our ability to buy or sell certain securities will be restricted by applicable securities laws, regulatory requirements, information held by Brookfield, contractual obligations applicable to Brookfield, and potential reputational risks relating to our company, Brookfield and/or Brookfield Accounts (including Brookfield’s internal policies designed to comply with these and similar requirements). As a result, from time to time Brookfield will not engage in transactions or other activities for, or enforce certain rights in favor of, our company due to Brookfield’s activities outside our company, regulatory requirements, policies, and reputational risk assessments. |
Brookfield will possess material, non-public information about companies that would limit our ability to buy and sell securities related to those companies (or, potentially, to other companies). For example, Brookfield personnel take seats on boards of directors of, or have board of directors observer rights with respect to, portfolio companies in which Brookfield invests (including on our behalf). In addition, Brookfield often obtains access to confidential information relating to investment opportunities that it considers. As a result, Brookfield will be limited and/or restricted in its ability to trade in the securities of the companies about which it has obtained material non-public information. This will adversely affect our ability to make and/or dispose of certain investments during certain times.
Furthermore, Brookfield (including Brookfield businesses that are separated by information barriers), Brookfield Accounts and our company are deemed to be affiliates for purposes of certain laws and regulations and it is anticipated that, from time to time, our company, Brookfield and Brookfield Accounts will each have positions (which in some cases will be significant) in one or more of the same issuers. As such, Brookfield needs to aggregate certain investment holdings, including holdings of Brookfield, our company and Brookfield Accounts for certain securities laws purposes (including trading restrictions under Rule 144 under the Securities Act, complying with reporting obligations under Section 13 of the Exchange Act and the reporting and short-swing profit disgorgement obligations under Section 16 of the Exchange Act) and other regulatory purposes (including (i) public utility companies and public utility holding companies; (ii) bank holding companies; (iii) owners of broadcast licenses, airlines, railroads, water carriers and trucking concerns; (iv) casinos and gaming businesses; and (v) public service companies (such as those providing gas, electric or telephone services)). Consequently, activities by Brookfield and Brookfield Accounts could result in earlier public disclosure of investments by our company and/or Brookfield Accounts that we are invested in, restrictions on transactions by our company and/or Brookfield Accounts that we are invested in (including the ability to make or dispose of certain investments at certain times), adverse effects on the prices of investments made by our company and/or Brookfield Accounts that we are invested in, potential short-swing profit disgorgement, penalties and/or regulatory remedies, or otherwise create conflicts of interests for our company and/or Brookfield Accounts that we are invested in.
| • | Client and Other Relationships. Brookfield pursues other business activities and provides certain services (including, in each case, through portfolio companies that it and Brookfield Accounts invest in) that compete directly with our business activities without providing us with an opportunity to participate, which results in the allocation of Brookfield's resources, personnel and acquisition and business opportunities to others that compete with us. In addition, certain portfolio companies in which we, Brookfield and/or Brookfield Accounts are invested in provide investment banking and other advisory services to third parties with respect to assets in which we are invested or seeking to invest. The interests of such portfolio companies in such circumstances generally will conflict with (and be adverse to) our interests, and we generally will compete with such portfolio companies (and their third party clients) in pursuing certain investments. Brookfield generally implements policies and procedures (including, for example, information barriers) to mitigate potential conflicts of interest and address certain regulatory requirements relating to these potential circumstances. |
| • | Limited Liability of Brookfield. The liability of Brookfield and its directors is limited under our arrangements with them, and we have agreed to indemnify Brookfield and its directors against claims, liabilities, losses, damages, costs or expenses which they may face in connection with those arrangements, which may lead them to assume greater risks when making decisions than they otherwise would if such decisions were being made solely for Brookfield’s own account, or may give rise to legal claims for indemnification that are adverse to the interests of our unitholders. |
| • | Valuation of Our Investments. Brookfield performs certain valuation services related to our securities and assets. Brookfield performs such services in accordance with its valuation policies. From time to time, Brookfield will value a similar or identical asset differently for our company than for itself or a Brookfield Account, including because our company, Brookfield and Brookfield Accounts are subject to different valuation guidelines pursuant to our and their respective governing agreements (e.g., in connection with differing applicable regulatory restrictions), different third-party vendors are hired to perform valuation functions for our company, Brookfield or the Brookfield Accounts, or otherwise. In addition, Brookfield faces a conflict with respect to valuations generally because of their effect on Brookfield’s fees and other compensation. |
- 130 -
| • | Brookfield Public Securities Group. Brookfield is an active participant, as agent and principal, in the global fixed income, currency, commodity, equities and other markets. Certain of Brookfield’s investment activities are managed independently of, and carried out without any reference to, the management of our company. For example, Brookfield invests, trades or makes a market in the equity, debt or other interests of certain of our portfolio companies without regard to the impact on us of such activities. In particular, Brookfield’s Public Securities Group (“PSG”) manages investment funds and accounts that invest in public debt and equity markets. There is currently an information barrier in place pursuant to which PSG manages its investment operations independently of other parts of Brookfield and does not generally share information relating to such activities. Consequently, neither we nor PSG consults the other about, or has awareness of, investment decisions made by the other, and neither is subject to any internal approvals over its investment decisions by any person who would have knowledge of the investment decisions of the other. As a result, PSG will not share investment opportunities that may otherwise be suitable for our company with us, and our company will have no rights with respect to such opportunities. In addition, in certain circumstances, funds and/or accounts managed by PSG will hold an interest in one of our investments and, as a result of different investment objectives and views, PSG is likely to manage such interests in a way that is different from us (including, for example, by investing in different portions of an issuer’s capital structure, short selling securities, voting securities in a different manner, and/or selling its interests at different times than us). As a result of the information sharing barrier, our investment team may not be aware of, and may not have the ability to manage, such conflicts. Brookfield has discretion at any time, and without notice to our unitholders, to remove or modify such information barrier. In the event that the information barrier is removed or modified, Brookfield would be subject to certain protocols, obligations and restrictions in managing our company, including, for example, conflicts-management protocols, aggregated regulatory reporting obligations and certain potential investment-related restrictions. |
| • | Oaktree. In 2019, Brookfield acquired approximately 61% of the business of Oaktree. Oaktree is a global investment manager with significant assets under management, emphasizing an opportunistic, value-oriented and risk-controlled approach to investments in credit, private equity, real assets and listed equities. Brookfield and Oaktree operate their respective investment businesses largely independently pursuant to an information barrier, with each remaining under its current brand and led by its existing management and investment teams. |
It is expected that our company and our portfolio companies, as well as Brookfield, Brookfield Accounts that we are invested in and their portfolio companies, will engage in activities and have business relationships that give rise to conflicts (and potential conflicts) of interest between them, on the one hand, and Oaktree Accounts, and their portfolio companies, on the other hand. For so long as Brookfield and Oaktree manage their investment operations independently of each other pursuant to an information barrier, Oaktree, Oaktree Accounts and their respective portfolio companies generally will not be treated as affiliates of our company, our portfolio companies, Brookfield, Brookfield Accounts and their portfolio companies, and conflicts (and potential conflicts) considerations, including in connection with allocation of investment opportunities, investment and trading activities, and agreements, transactions and other arrangements entered into with Oaktree, Oaktree Accounts and their portfolio companies, generally will be managed as summarized herein.
There is (and in the future will continue to be) some degree of overlap in investment strategies and investments pursued by our company (directly and indirectly) and Oaktree Accounts. Nevertheless, Brookfield does not expect to coordinate or consult with Oaktree with respect to investment activities and/or decisions. This absence of coordination and consultation, and the information barrier described above, will in some respects serve to mitigate conflicts of interests between our company and Oaktree Accounts; however, these same factors also will give rise to certain conflicts and risks in connection with our and Oaktree’s investment activities, and make it more difficult to mitigate, ameliorate or avoid such situations. For example, because Brookfield and Oaktree are not expected to coordinate or consult with each other about investment activities and/or decisions, and neither Brookfield nor Oaktree is expected to be subject to any internal approvals over its investment activities and decisions by any person who would have knowledge and/or decision-making control of the investment decisions of the other, Oaktree Accounts will be entitled to pursue investment opportunities that are suitable for our company and Brookfield Accounts that we are invested in, but which are not made available to us or those Brookfield Accounts. Our company and Brookfield Accounts that we are invested in, on the one hand, and Oaktree Accounts, on the other hand, are also expected to compete, from time to time, for the same investment opportunities. Such competition could, under certain circumstances, adversely impact the purchase price of our (direct and/or indirect) investments. Oaktree will have no obligation to, and generally will not, share investment opportunities that may be suitable for our company and Brookfield Accounts that we are invested in with Brookfield, and our company and Brookfield Accounts that we are invested in will have no rights with respect to any such opportunities.
In addition, Oaktree will not be restricted from forming or establishing new Oaktree Accounts, such as additional funds or successor funds. Moreover, Brookfield expects to provide Oaktree, from time to time, with (i) access to marketing-related support, including, for example, strategy sessions, introductions to investor relationships and other marketing facilitation activities, and (ii) strategic oversight and business development support, including general market expertise and introductions
- 131 -
to market participants such as portfolio companies, their management teams and other relationships. Certain such Oaktree Accounts could compete with or otherwise conduct their affairs without regard as to whether or not they adversely impact our company and/or Brookfield Accounts that we are invested in. In addition, Oaktree Accounts will be permitted to make investments of the type that are suitable for our company and Brookfield Accounts that we are invested in without the consent of the clients or Brookfield. From time to time, our company and/or Brookfield Accounts that we are invested in, on the one hand, and Oaktree Accounts, on the other hand, are expected to purchase or sell an investment from each other, as well as jointly pursue one or more investments. In addition, from time to time, Oaktree Accounts are expected to hold an interest in an investment held by our company and/or Brookfield Accounts that we are invested in (or potential investment), and/or subsequently purchase (or sell) an interest in an investment held by our company and/or Brookfield Accounts that we are invested in (or potential investment). In such situations, Oaktree Accounts could benefit from our (direct or indirect) activities. Conversely, our company and/or Brookfield Accounts that we are invested in could be adversely impacted by Oaktree’s activities. In addition, as a result of different investment objectives, views and/or interests in investments, it is expected that Oaktree will manage certain Oaktree Accounts’ interests in a way that is different from the interests of our company and/or Brookfield Accounts that we are invested in (including, for example, by investing in different portions of an issuer’s capital structure, short selling securities, voting securities or exercising rights it holds in a different manner, and/or selling its interests at different times than our company and/or Brookfield Accounts that we are invested in), which could adversely impact our (direct and/or indirect) interests. Oaktree and Oaktree Accounts are also expected to take positions, give advice and provide recommendations that are different, and potentially contrary to those which are taken by, or given or provided to, our company and/or Brookfield Accounts that we are invested in, and are expected to hold interests that potentially are adverse to those held by our company (directly or indirectly). Our company and/or Brookfield Accounts that we are invested in, on the one hand, and Oaktree Accounts, on the other hand, will in certain cases have divergent interests, including the possibility that the interests of our company and/or Brookfield Accounts that we are invested in are subordinated to Oaktree Accounts’ interests or are otherwise adversely affected by Oaktree Accounts’ involvement in and actions related to the investment. Oaktree will not have any obligation or other duty to make available for the benefit of our company and/or Brookfield Accounts that we are invested in any information regarding its activities, strategies and/or views.
Oaktree may provide similar information, support and/or knowledge to Brookfield, and the conflicts (and potential conflicts) of interest described above will apply equally in those circumstances.
The potential conflicts of interest described herein are expected to be magnified as a result of the lack of information sharing and coordination between Brookfield and Oaktree. Investment teams managing the activities of our company and/or Brookfield Accounts that we are invested in are not expected to be aware of, and will not have the ability to manage, such conflicts. This will be the case even if they are aware of Oaktree’s investment activities through public information.
Brookfield and Oaktree may decide, at any time and without notice to our company or our unitholders, to remove or modify the information barrier between Brookfield and Oaktree. In the event that the information barrier is removed or modified, it would be expected that Brookfield and Oaktree will adopt certain protocols designed to address potential conflicts and other considerations relating to the management of their investment activities in a different or modified framework.
Breaches (including inadvertent breaches) of the information barrier and related internal controls by Brookfield and/or Oaktree could result in significant consequences to Brookfield (and Oaktree) as well as have a significant adverse impact on our company and/or Brookfield Accounts that we are invested in, including (among others) potential regulatory investigations and claims for securities laws violations in connection with our direct and/or indirect investment activities. These events could have adverse effects on Brookfield’s reputation, result in the imposition of regulatory or financial sanctions, negatively impact Brookfield’s ability to provide investment management services to the clients, all of which could result in negative financial impact to the investment activities of our company and/or Brookfield Accounts that we are invested in.
To the extent that the information barrier is removed or otherwise ineffective and Brookfield has the ability to access analysis, models and/or information developed by Oaktree and its personnel, Brookfield will not be under any obligation or other duty to access such information or effect transactions for our company and/or Brookfield Accounts that we are invested in in accordance with such analysis and models, and in fact may be restricted by securities laws from doing so. As noted under “Related Party Transactions” above, we (including our portfolio companies and portfolio companies of Brookfield Accounts that we are invested in) are and will be counterparties in agreements, transactions and other arrangements with other Brookfield Accounts (including their portfolio companies) for the provision of goods and services, purchase and sale of assets and other matters that would otherwise be transacted with independent third parties. Similarly, we (including our portfolio companies and portfolio companies of Brookfield Accounts that we are invested in) are and will be counterparties in arrangements with Oaktree, Oaktree Accounts and/or their portfolio companies to the extent practicable pursuant to the
- 132 -
information barrier. These arrangements will give rise to the same potential conflicts considerations (and be resolved in the same manner) as set out under “Related Party Transactions.”
As a global alternative asset manager with significant assets under management and a long history of owning and operating assets and businesses across various industries, sectors and geographies, Brookfield leverages its broad reach, expertise and relationships in managing the investment and asset management activities of our company and/or Brookfield Accounts that we are invested in. Brookfield expects to similarly leverage its relationship with Oaktree, Oaktree Accounts and/or their portfolio companies to the extent practicable pursuant to the information barrier. These activities give rise to conflicts (and potential conflicts) of interest considerations as Brookfield (indirectly) benefits from them. However, Brookfield believes that these activities are in the best interest of our company and/or Brookfield Accounts that we are invested in.
Among other things, portfolio companies that we are invested in (directly or indirectly) are and will be counterparties in agreements, transactions and other arrangements with Oaktree Accounts’ portfolio companies for the provision of goods and services, purchase and sale of assets and other matters that would otherwise be transacted with independent third parties. These agreements, transactions and other arrangements will involve payment of fees and other amounts and/or other benefits to Oaktree Accounts’ portfolio companies, none of which will result in any offset to the management and other fees paid by our company to Brookfield. Such agreements, transactions and other arrangements will generally be entered into without the consent or direct involvement of the General Partner’s independent directors or our unitholders.
These agreements, transactions or other arrangements are expected to be entered into in the ordinary course. In certain cases, they will be entered into with active participation by Brookfield and in other cases by the portfolio companies’ management teams independently of Brookfield. In all cases, Brookfield will seek to ensure that the agreements, transactions or other arrangements are in our (direct and indirect) portfolio companies’ best interests, with terms to be determined in good faith as fair, reasonable and equitable under the circumstances. However, there can be no assurance that the terms of any such agreement, transaction or other arrangement will be executed on an arm’s length basis, be as favorable to the applicable portfolio company as otherwise would be the case if the counterparty were not related to Oaktree, or be the same as those that other Oaktree Accounts’ portfolio companies receive from the counterparty. In some circumstances, our (direct and indirect) portfolio companies may receive better terms from an Oaktree Account portfolio company than from an independent counterparty. In other cases, these terms may be worse.
Brookfield may from time to time engage Oaktree, Oaktree Accounts and/or their portfolio companies to provide certain services to our company, Brookfield Accounts that we are invested in and their portfolio companies, including without limitation non-investment management related services and other services that would otherwise be provided by third-party service providers or Brookfield affiliates, as the case may be. Each such engagement will be in accordance with disclosures set out herein or in the applicable Brookfield Account’s offering documents.
In addition, Oaktree may from time to time engage our company or our (direct or indirect) portfolio companies to provide services to Oaktree Accounts and/or their portfolio companies, and the conflicts (and potential conflicts) of interest described above will apply equally for each such engagement.
| • | Service Providers. Our service providers or service providers of our portfolio companies (including deal sourcers, consultants, lenders, brokers, accountants, attorneys and outside directors) may be (or their affiliates may be) unitholders and/or sources of investment opportunities and counterparties therein, or may otherwise participate in transactions or other arrangements with us and/or Brookfield or Brookfield Accounts. Furthermore, employees of Brookfield or Brookfield portfolio companies have and may in the future have family members or relatives employed by service providers (particularly the large, global providers) to Brookfield, Brookfield Accounts, us, and portfolio companies that we are directly or indirectly invested in. These factors create incentives for Brookfield in deciding whether to select such a service provider. Notwithstanding the foregoing, Brookfield will only select a service provider to the extent Brookfield determines that doing so is appropriate for us given all surrounding facts and circumstances and is consistent with Brookfield’s responsibilities under applicable law, provided that, for the avoidance of doubt, Brookfield often will not seek out the lowest-cost option when engaging such service providers as other factors or considerations typically prevail over cost. |
In addition, Brookfield, Brookfield Accounts and our partnership will from time to time engage common service providers. In such circumstances, there may be a conflict of interest between Brookfield and Brookfield Accounts, on the one hand, and us, on the other hand, in determining whether to engage such service providers. Further, our service providers may charge different rates to different recipients based on the specific services provided, the personnel providing the services, or other factors. As a result, the rates paid with respect to these service providers by us, on the one hand, may be more or less favorable than the rates paid by Brookfield or Brookfield Accounts, on the other hand.
- 133 -
Without limitation of the foregoing, conflicts arise with respect to Brookfield’s selection of financial institutions or other third parties to provide services to us and its negotiation of fees payable to such parties. Brookfield has relationships with many financial institutions and other third parties, which may introduce prospective investors, afford Brookfield the opportunity to market its services to certain qualified investors at no additional cost, provide benchmarking analysis or third-party verification of market rates, or provide other services (e.g., consulting services) at favorable or below market rates. Such relationships create incentives for Brookfield to select one financial institution over another. For example, in connection with the disposition of a portfolio company, several financial institutions with which Brookfield has pre-existing business relationships may provide valuation services through a bidding process. Although Brookfield will select the financial institution it believes is the most appropriate in the circumstances, the relationships between the financial institution and Brookfield as described herein will have an influence on Brookfield in deciding whether to select such a financial institution to underwrite the disposition, and may influence the financial institution in the terms offered.
| • | Advisors. Brookfield engages or retains strategic advisors, senior advisors, operating partners, executive advisors, consultants and/or other professionals who are not employees or affiliates of Brookfield (including former Brookfield employees as well as current and former executive officers of Brookfield portfolio companies) and who are expected, from time to time, to receive payments from, or allocations or performance-based compensation with respect to, our portfolio companies (as well as from us, Brookfield or Brookfield Accounts in which we are invested). In such circumstances, such payments from, or allocations or performance-based compensation with respect to, our direct and indirect portfolio companies and/or our company or Brookfield Accounts in which we are invested generally will be treated as expenses of our company or such Brookfield Accounts. These strategic advisors, senior advisors, operating partners, executive advisors, consultants and/or other professionals (which may include certain former Brookfield employees) in certain circumstances are offered the ability to co-invest alongside our company, including in those investments in which they are involved (and for which they may be entitled to receive performance-based compensation, which will reduce our returns), or otherwise participate in equity plans for management of a portfolio company. In certain cases, these persons are likely to have certain attributes of Brookfield “employees” (e.g., they have dedicated offices at Brookfield, participate in general meetings and events for Brookfield personnel, work on Brookfield matters as their primary or sole business activity, have Brookfield-related email addresses, and/or participate in certain benefit arrangements typically reserved for Brookfield employees) even though they are not considered Brookfield employees, affiliates or personnel. Where applicable, Brookfield allocates the costs of such personnel to the applicable portfolio companies, to us and/or to Brookfield Accounts in which we are invested. Payments or allocations to Brookfield’s strategic advisors, senior advisors, operating partners, executive advisors, consultants and other similar professionals can be expected to increase the overall costs and expenses borne indirectly by our unitholders. There can be no assurance that any of the strategic advisors, senior advisors, operating partners, executive advisors, consultants and/or other professionals will continue to serve in such roles and/or continue their arrangements with Brookfield and/or any portfolio companies or Brookfield Accounts. |
| • | Diverse Interests. The various types of investors in and beneficiaries of our company, including Brookfield, have conflicting investment, tax and other interests with respect to their interests. When considering a potential investment for us, Brookfield will generally consider our investment objectives, not the investment objectives of any particular investor or beneficiary. Certain of Brookfield’s decisions, including with respect to tax or other reporting positions, will be more beneficial to one type of investor or beneficiary than another, or to Brookfield, than to investors or beneficiaries unaffiliated with Brookfield. Brookfield reserves the right on behalf of itself and its affiliates to take actions adverse to us or other Brookfield Accounts in these circumstances, including withholding amounts to pay actual or potential tax liabilities. |
Furthermore, our company and any entities with which we co-invest generally will have conflicting investment, tax and other interests with respect to the investments we make directly or indirectly. Conflicts of interest arise in connection with the structure of the investments or decisions made by Brookfield which may be more beneficial for another investing entity and its partners, on the one hand, than for us and our unitholders, on the other hand (or vice versa) (for instance, the manner in which investments are structured, financed and/or harvested may produce tax results that are favorable to an investing entity targeted to non-U.S. investors, but not to us (or vice versa), or are favorable to a taxable investor, as compared to a tax- exempt investor (or vice versa)).
| • | Reputational Considerations. Given the nature of its broader platform, Brookfield has an interest in preserving its reputation, including with respect to certain of its affiliates’ statuses as publicly traded vehicles, and in certain circumstances, such reputational considerations may conflict with our interests. The BPY General Partner or Brookfield have made (and will likely make) decisions on our behalf for reputational reasons that may not be directly aligned with the interests of our unitholders or consistent with the determination the BPY General Partner or Brookfield otherwise would have made absent its interest in Brookfield’s broader reputation. For example, Brookfield has limited (and will in the future limit) transactions and activities on our behalf for reputational or other reasons, including where Brookfield is providing (or may provide) advice or services to an entity involved in such activity or transaction, where a Brookfield Account is or may be engaged |
- 134 -
in the same or a related activity or transaction to that being considered on our behalf, where a Brookfield Account has an interest in an entity involved in such activity or transaction, or where such activity or transaction on behalf of or in respect of our company could affect the BPY General Partner, Brookfield, Brookfield Accounts or their activities.
| • | Possible Future Activities. Brookfield expects to expand the range of services that it provides over time. Except as provided herein, Brookfield will not be restricted in the scope of its business or in the performance of any services (whether now offered or undertaken in the future) even if such activities could give rise to conflicts of interest, and whether or not such conflicts are described herein. Brookfield has, and will continue to develop, relationships with a significant number of companies, financial sponsors and their senior managers, including relationships with companies that may hold or may have held investments similar to those intended to be made by us. These companies may themselves represent appropriate investment opportunities for us or may compete with us for investment opportunities. |
See Item 3.D. “Key Information - Risk Factors - Risks Relating to Our Relationship with Brookfield - Our organizational and ownership structure, as well as our contractual arrangements with Brookfield, may create significant conflicts of interest that may be resolved in a manner that is not in the best interests of our company or the best interests of our unitholders”.
As noted above, activities and transactions that give rise to potential conflicts of interests between our company and our unitholders, on the one hand, and Brookfield and Brookfield Accounts, on the other hand, generally will be resolved in accordance with the principles summarized herein and in accordance with a conflicts policy that has been approved by the BPY General Partner’s independent directors. The conflicts policy was put in place in recognition of the benefit to our company of our relationship with Brookfield and our intent to seek to maximize the benefits from this relationship, and generally provides for potential conflicts to be resolved on the basis of transparency and, where applicable, third party validation and approvals. The policy focuses on addressing the principal activities that give rise to potential conflicts of interests, including our investment activities, our participation in Brookfield Accounts, transactions with Brookfield (and Brookfield Accounts), and engagements of Brookfield affiliates (or of us by Brookfield Accounts), including engagements for operational services entered into between underlying operating entities.
Pursuant to the conflicts policy, Brookfield is required to seek the prior approval of the BPY General Partner’s independent directors for certain transactions, including: (i) acquisitions by our company from, and dispositions by our company to, Brookfield and Brookfield Accounts; (ii) the dissolution of our company; (iii) any material amendment to our Master Services Agreement, the Relationship Agreement, or our limited partnership agreement; (iv) any material service agreement or other material arrangement pursuant to which Brookfield will be paid a fee, or other consideration other than any agreement or arrangement contemplated by our Master Services Agreement; (v) termination of, or any determinations regarding indemnification under, our Master Services Agreement, or our limited partnership agreement; and (vi) any other material transaction involving our company and Brookfield. Pursuant to the conflicts policy, the BPY General Partner’s independent directors have granted (and may in the future grant) prior approvals for certain type of transactions and/or activities provided that such transactions and/or activities are conducted in accordance with pre-approved guidelines and/or parameters.
In addition, the conflicts policy provides that acquisitions that are carried out jointly by us and Brookfield, or in the context of a Brookfield Account that we participate in, be carried out on the basis that the consideration paid by us be no more, on a per share or proportionate basis, than the consideration paid by Brookfield or other participants, as applicable. The policy also provides that any fees or carried interest payable in respect of our proportionate investment, or in respect of an acquisition made solely by us, must be credited in the manner contemplated by our limited partnership agreement, where applicable, or that such fees or carried interest must either have been negotiated with another arm’s length participant or otherwise demonstrated to be on market terms (or better). The policy also provides that in transactions involving (i) an acquisition by our company of an asset from Brookfield or (ii) the purchase by us and Brookfield of different assets, a fairness opinion or a valuation or appraisal by a qualified expert be obtained. These requirements are in addition to any disclosure, approval, or valuation requirements that may arise under applicable law.
In certain circumstances, transactions and/or activities are likely to be related party transactions and/or activities for the purposes of, and subject to certain requirements of, MI 61-101. MI 61-101 provides a number of circumstances in which a transaction between an issuer and a related party may be subject to valuation and minority approval requirements. See “Canadian Securities Law Exemptions” below for application of MI 61-101 to our company.
Our limited partnership agreement and the Property Partnership’s limited partnership agreement (together the “Limited Partnership Agreements”) contain various provisions that modify the scope of the fiduciary duties that are owed to us and our unitholders. These duties include the duties of care and loyalty. In the absence of provisions in the Limited Partnership Agreements of our company and the Property Partnership to the contrary, the duty of loyalty would generally prohibit the BPY General Partner
- 135 -
and the Property Partnership’s managing general partner from taking any action or engaging in any transaction as to which it has a conflict of interest. The Limited Partnership Agreements each prohibit the limited partners from advancing claims that otherwise might raise issues as to compliance with fiduciary duties or applicable law. For example, the agreements provide that the BPY General Partner, the Property Partnership’s managing general partner and their affiliates do not have any obligation under the Limited Partnership Agreements, or as a result of any duties stated or implied by law or equity, including fiduciary duties, to present business or acquisition opportunities to our company, the Property Partnership, any Holding Entity or any other holding entity established by us. They also allow affiliates of the BPY General Partner to engage in activities that compete with us or our activities. In addition, the agreements permit the BPY General Partner to take into account the interests of third parties, including Brookfield, when resolving conflicts of interest.
These provisions are detrimental to our unitholders because they limit the scope of the fiduciary duty and permit conflicts of interest to be resolved in a manner that is not always in our best interests or the best interests of our unitholders. We believe it is necessary to modify the scope of the fiduciary duties that are owed to us and our unitholders, as described above, due to our organizational and ownership structure and the potential conflicts of interest created thereby. Without modifying those duties, the ability of the BPY General Partner to attract and retain experienced and capable directors and to take actions that we believe are necessary for the carrying out of our business would be unduly limited due to their concern about potential liability.
Canadian Securities Law Exemptions
MI 61-101 provides a number of circumstances in which a transaction between an issuer and a related party may be subject to valuation and minority approval requirements. An exemption from such requirements is available when the fair market value of the transaction is not more than 25% of the market capitalization of the issuer. Our company has been granted exemptive relief from the requirements of MI 61-101 that, subject to certain conditions, permits it to be exempt from the minority approval and valuation requirements for transactions that would have a value of less than 25% of our market capitalization, if the indirect equity interest in our company, which is held in the form of Redemption-Exchange Units, or in the form of non-voting Exchange LP Units, is included in the calculation of our company’s market capitalization. As a result, the 25% threshold, above which the minority approval and valuation requirements apply, is increased to include the approximate 50% indirect interest in our company held in the form of Redemption-Exchange Units. See Item 7.B. “Major Shareholders and Related Party Transactions - Related Party Transactions - Relationship with Brookfield - Conflicts of Interest” above and Item 10.B. “Additional Information - Memorandum and Articles of Association – Description of Our LP Units, Preferred Units and Our Limited Partnership Agreement – Exchange LP Units and the Support Agreement” below.
Although our company is a reporting issuer in Canada, it is an “SEC foreign issuer” under Canadian securities regulations and exempt from certain Canadian securities laws relating to continuous disclosure obligations and proxy solicitation as long as we comply with certain reporting requirements applicable in the United States, provided that the relevant documents filed with the SEC are filed in Canada and sent to our unitholders in Canada to the extent and in the manner and within the time required by applicable U.S. requirements. Therefore, there may be less publicly available information in Canada about us than is regularly published by or about other reporting issuers in Canada. Our company has undertaken to the provincial and territorial securities regulatory authorities in Canada that to the extent it complies with the foreign private issuer disclosure regime under U.S. securities law:
| • | our company will only rely on the exemptions in Part 4 of National Instrument 71-102 - Continuous Disclosure and Other Exemptions Relating to Foreign Issuers; |
| • | our company will not rely on any exemption from the foreign private issuer disclosure regime; |
| • | our company will file its financial statements pursuant to Part 4 of National Instrument 51-102 - Continuous Disclosure Obligations (“NI 51-102”) except that our company does not have to comply with the conditions in section 4.2 of NI 51-102 if it files such financial statements on or before the date that it is required to file its Form 20-F with the SEC; |
| • | our company will file an interim financial report as set out in Part 4 of NI 51-102 and the management’s discussion and analysis as set out in Part 5 of NI 51-102 for each period commencing on the first day of the financial year and ending nine, six, or three months before the end of the financial year; |
| • | our company will file a material change report as set out in Part 7 of NI 51-102 in respect of any material change in the affairs of our company that is not reported or filed by our company on SEC Form 6-K; and |
| • | our company will include in any prospectus filed by our company financial statements or other information about any acquisition that would have been or would be a significant acquisition for the purposes of Part 8 of NI 51-102 that our |
- 136 -
company has completed or has progressed to a state where a reasonable person would believe that the likelihood of our company completing the acquisition is high if the inclusion of the financial statements is necessary for the prospectus to contain full, true and plain disclosure of all materials facts relating to the securities being distributed. The requirement to include financial statements or other information will be satisfied by including or incorporating by reference (a) the financial statements or other information as set out in Part 8 of NI 51-102, or (b) satisfactory alternative financial statements or other information, unless at least nine months of the operations of the acquired business or related businesses are incorporated into our company’s current annual financial statements included or incorporated by reference in the prospectus.
OUR MASTER SERVICES AGREEMENT
The Service Recipients have entered into a Master Services Agreement pursuant to which the Service Providers have agreed to provide or arrange for other Service Providers to provide management and administration services to our company and the other Service Recipients.
The following is a summary of certain provisions of our Master Services Agreement. Because this description is only a summary of our Master Services Agreement, it does not necessarily contain all of the information that you may find useful. We therefore urge you to review our Master Services Agreement in its entirety. Our Master Services Agreement is available electronically on the website of the SEC at www.sec.gov and on our SEDAR profile at www.sedar.com and is available to our unitholders as described under Item 10.C. “Additional Information - Material Contracts” and Item 10.H. “Additional Information - Documents on Display”.
Appointment of the Service Providers and Services Rendered
Under our Master Services Agreement, the Service Recipients have appointed the Service Providers to provide or arrange for the provision of the following services:
| • | supervising the carrying out of all day-to-day management, secretarial, accounting, banking, treasury, administrative, liaison, representative, regulatory and reporting functions and obligations; |
| • | providing overall strategic advice to the Holding Entities including advising with respect to the expansion of their business into new markets; |
| • | supervising the establishment and maintenance of books and records; |
| • | identifying and recommending to the Holding Entities acquisitions or dispositions from time to time and, where requested to do so, assisting in negotiating the terms of such acquisitions or dispositions; |
| • | recommending and, where requested to do so, assisting in the raising of funds whether by way of debt, equity or otherwise, including the preparation, review or distribution of any prospectus or offering memorandum in respect thereof and assisting with communications support in connection therewith; |
| • | recommending to the Holding Entities suitable candidates to serve on the boards of directors or the equivalent governing bodies of our operating entities; |
| • | making recommendations with respect to the exercise of any voting rights to which the Holding Entities are entitled in respect of our operating entities; |
| • | making recommendations with respect to the payment of dividends by the Holding Entities or any other distributions by the Service Recipients, including distributions by our company to our unitholders; |
| • | monitoring and/or oversight of the applicable Service Recipient’s accountants, legal counsel and other accounting, financial or legal advisors and technical, commercial, marketing and other independent experts, and managing litigation in which a Service Recipient is sued or commencing litigation after consulting with, and subject to the approval of, the relevant board of directors or its equivalent; |
| • | attending to all matters necessary for any reorganization, bankruptcy proceedings, dissolution or winding up of a Service Recipient, subject to approval by the relevant board of directors or its equivalent; |
- 137 -
| • | supervising the making of all tax elections, determinations and designations, the timely calculation and payment of taxes payable and the filing of all tax returns due, by each Service Recipient; |
| • | supervising the preparation of the Service Recipients’ annual consolidated financial statements, quarterly interim financial statements and other public disclosure; |
| • | making recommendations in relation to and effecting the entry into insurance of each Service Recipient’s assets, together with other insurances against other risks, including directors and officers insurance as the relevant Service Provider and the relevant board of directors or its equivalent may from time to time agree; |
| • | arranging for individuals to carry out the functions of principal executive, accounting and financial officers for our company only for purposes of applicable securities laws; |
| • | providing individuals to act as senior officers of the Holding Entities as agreed from time to time, subject to the approval of the relevant board of directors or its equivalent; |
| • | providing advice, when requested, to the Service Recipients regarding the maintenance of compliance with applicable laws and other obligations; and |
| • | providing all such other services as may from time to time be agreed with the Service Recipients that are reasonably related to the Service Recipient’s day-to-day operations. |
The Service Providers’ activities are subject to the supervision of the board of directors or equivalent governing body of the BPY General Partner and of each of the other Service Recipients, as applicable. The relevant governing body remains responsible for all investment and divestment decisions made by the Service Recipient.
Any Service Provider may, from time to time, appoint an affiliate of Brookfield to act as a new Service Provider under our Master Services Agreement, effective upon the execution of a joinder agreement by the new Service Provider.
Management Fee
Pursuant to our Master Services Agreement, we pay a base management fee to the Service Providers equal to 0.5% of the total capitalization of our partnership, subject to an annual minimum of $50 million (plus the amount of any annual escalation by the specified inflation factor) and taking into account any management fees payable under the BPR Master Services Agreement. For any quarter in which the BPY General Partner determines that there is insufficient available cash to pay the base management fee as well as the next regular distribution on our units, the Service Recipients may elect to pay all or a portion of the base management fee in our units or Redemption-Exchange Units, subject to certain conditions.
Pursuant to the BPR Master Services Agreement, BPR and its subsidiaries pay to affiliates of Brookfield Asset Management a comparable base management fee for the provision of management services to the BPR Group. Additionally, BPR and its subsidiaries also pay comparable incentive distributions to the ones paid by the Property Partnership.
Reimbursement of Expenses and Certain Taxes
We also reimburse the Service Providers for any out-of-pocket fees, costs and expenses incurred in the provision of the management and administration services, including those of any third party. However, the Service Recipients are not required to reimburse the Service Providers for the salaries and other remuneration of their management, personnel or support staff who carry out any services or functions for such Service Recipients under the Master Services Agreement or overhead for such persons.
The relevant Service Recipient reimburses the Service Providers for all other out-of-pocket fees, costs and expenses incurred in connection with the provision of the services including those of any third party. Such out-of-pocket fees, costs and expenses include, among other things: (i) fees, costs and expenses relating to any debt or equity financing; (ii) fees, costs and expenses incurred in connection with the general administration of any Service Recipient in respect of services; (iii) taxes, licenses and other statutory fees or penalties levied against or in respect of a Service Recipient; (iv) amounts owed by the Service Providers under indemnification, contribution or similar arrangements; (v) fees, costs and expenses relating to our financial reporting, regulatory filings and investor relations and the fees, costs and expenses of agents, advisors and other persons who provide services to or on behalf of a Service Recipient; and (vi) any other fees, costs and expenses incurred by the Service Providers that are reasonably necessary for the performance by the Service Providers of their duties and functions under our Master Services Agreement.
- 138 -
In addition, the Service Recipients are required to pay all fees, costs and expenses incurred in connection with the investigation, acquisition, holding or disposal of any asset or business that is made or that is proposed to be made by us. Such additional fees, expenses and costs represent out-of-pocket costs associated with investment activities that will be undertaken pursuant to our Master Services Agreement.
The Service Recipients are also required to pay or reimburse the Service Providers for all sales, use, value added, goods and services, harmonized sales, withholding or other taxes or customs duties or other governmental charges levied or imposed by reason of our Master Services Agreement or any agreement it contemplates, other than income taxes, corporation taxes, capital taxes or other similar taxes payable by the Service Providers, which are personal to the Service Providers.
Our company is also required to reimburse Brookfield Asset Management for all amounts paid to the rights agent (i) pursuant to the Rights Agreement between Brookfield Asset Management and Wilmington Trust, National Association, entered into in connection with the GGP acquisition including, in respect of services rendered, out-of-pocket expenses, counsel fees and other disbursements incurred in the administration and execution of the Rights Agreement and the exercise and performance of the rights agent’s duties thereunder, and (ii) in respect of any indemnification provided to the rights agent pursuant to the Rights Agreement.
Assignment
Our Master Services Agreement may not be assigned by the Service Providers without the prior written consent of our company except that (i) any Service Provider may subcontract or arrange for the provision of services by another Service Provider, provided that the Service Providers remain liable under the agreement, and (ii) any of the Service Providers may assign the agreement to an affiliate or to a person that is its successor by way of merger, amalgamation or acquisition of the business of the Service Provider.
Termination
Our Master Services Agreement continues in perpetuity until terminated in accordance with its terms. However, the Service Recipients may terminate our Master Services Agreement upon written notice of termination from the BPY General Partner to the Service Providers if any of the following occurs:
| • | any of the Service Providers defaults in the performance or observance of any material term, condition or covenant contained in the agreement in a manner that results in material harm to the Service Recipients and the default continues unremedied for a period of 60 days after written notice of the breach is given to such Service Provider; |
| • | any of the Service Providers engages in any act of fraud, misappropriation of funds or embezzlement against any Service Recipient that results in material harm to the Service Recipients; |
| • | any of the Service Providers is grossly negligent in the performance of its obligations under the agreement and such gross negligence results in material harm to the Service Recipients; or |
| • | certain events relating to the bankruptcy or insolvency of each of the Service Providers. |
The Service Recipients have no right to terminate for any other reason, including if any of the Service Providers or Brookfield experiences a change of control. The BPY General Partner may only terminate our Master Services Agreement on behalf of our company with the prior unanimous approval of the BPY General Partner’s independent directors.
Our Master Services Agreement expressly provides that our Master Services Agreement may not be terminated by the BPY General Partner due solely to the poor performance or the underperformance of any of our operations.
The Service Providers may terminate our Master Services Agreement upon written notice of termination to the BPY General Partner if any Service Recipient defaults in the performance or observance of any material term, condition or covenant contained in the agreement in a manner that results in material harm to the Service Providers and the default continues unremedied for a period of 60 days after written notice of the breach is given to the Service Recipient. The Service Providers may also terminate our Master Services Agreement upon the occurrence of certain events relating to the bankruptcy or insolvency of the Service Recipients.
If our Master Services Agreement is terminated, the Relationship Agreement and any of Brookfield Asset Management’s obligations under the Relationship Agreement will also terminate.
- 139 -
Indemnification and Limitations on Liability
Under our Master Services Agreement, the Service Providers have not assumed and do not assume any responsibility other than to provide or arrange for the provision of the services called for thereunder in good faith and will not be responsible for any action that the Service Recipients take in following or declining to follow the advice or recommendations of the Service Providers. In addition, under our Master Services Agreement, the Service Providers and the related indemnified parties will not be liable to the Service Recipients for any act or omission, except for conduct that involved bad faith, fraud, willful misconduct, gross negligence or in the case of a criminal matter, conduct that the indemnified person knew was unlawful. The maximum amount of the aggregate liability of the Service Providers or any of their affiliates, or of any director, officer, agent, subcontractor, contractor, delegate, member, partner, shareholder, employee or other representative of the Service Providers or any of their affiliates, will be equal to the amounts previously paid by the Service Recipients in respect of services pursuant to our Master Services Agreement in the two most recent calendar years. The Service Recipients have agreed to indemnify the Service Providers, their affiliates, directors, officers, agents, subcontractors, delegates, members, partners, shareholders and employees to the fullest extent permitted by law from and against any claims, liabilities, losses, damages, costs or expenses (including legal fees) incurred by an indemnified person or threatened in connection with our respective businesses, investments and activities or in respect of or arising from our Master Services Agreement or the services provided by the Service Providers, except to the extent that the claims, liabilities, losses, damages, costs or expenses are determined to have resulted from the indemnified person’s bad faith, fraud or willful misconduct, gross negligence or in the case of a criminal matter, action that the indemnified person knew to have been unlawful.
Outside Activities
Our Master Services Agreement does not prohibit the Service Providers or their affiliates from pursuing other business activities or providing services to third parties that compete directly or indirectly with us.
U.S. Investment Advisers Act of 1940
Brookfield Asset Management Private Institutional Capital Adviser US, LLC (“BAM PIC US”) one of the Service Providers under our Master Services Agreement, is registered as an investment adviser under the Advisers Act. As such, BAM PIC US is subject to the rules and regulations applicable to registered investment advisers.
BAM PIC US is under common control with certain Brookfield advisory affiliates which are not currently registered under the Advisers Act. Investment professionals performing services on behalf of BAM PIC US that may be employed by such advisory affiliates are subject to the supervision of BAM PIC US. In addition to these investment professionals, BAM PIC US also uses other personnel, resources and administrative services of its advisory and non‐advisory affiliates.
Additional information regarding BAM PIC US is set forth in its Form ADV. A copy of Part 1 and Part 2A of the BAM PIC US Form ADV is available on the SEC’s website (www.adviserinfo.sec.gov).
VOTING AGREEMENTS
Our company and Brookfield have determined that it is advisable for certain subsidiaries of our company to have the ability to control the entities through which we hold certain of our operating entities (the “Specified Entities”) including certain of our investments by Brookfield-sponsored real estate funds. Accordingly, subsidiaries of our company have entered into voting agreements to provide us with the ability to elect to have voting rights over the Specified Entities.
Pursuant to the voting agreements, voting rights, if elected, with respect to any of the Specified Entities will be voted in accordance with the direction of these subsidiaries with respect to certain matters, including: (i) the election of a majority of directors or their equivalent, if any; (ii) any merger, amalgamation, consolidation, business combination or other similar material corporate transaction, except in connection with any internal reorganization that does not result in a change of control; (iii) any plan or proposal for a complete or partial liquidation or dissolution, or any reorganization or any case, proceeding or action seeking relief under any existing laws or future laws relating to bankruptcy or insolvency; (iv) any amendment to its governing documents; or (v) any commitment or agreement to do any of the foregoing.
OTHER RELATED PARTY TRANSACTIONS
From time to time, Brookfield may place funds on deposit with us, on terms approved by the governance and nominating committee. Any deposit balance is due on demand and interest paid on such deposits is at market terms. At December 31, 2019, our deposit balance with Brookfield was nil and earned interest of less than $1 million for year ended December 31, 2019.
- 140 -
An integral part of our partnership’s strategy is to participate with institutional investors in Brookfield-sponsored real estate funds that target acquisitions that suit our partnership’s profile. In the normal course of business, our partnership has made commitments to Brookfield-sponsored real estate funds to fund these target acquisitions in the future, if and when identified.
For a description of specific transactions in 2019 with Brookfield, Brookfield-related entities and other related parties, see Item 5.A. “Operating and Financial Review and Prospects - Operating Results - Related Parties”.
INDEBTEDNESS OF DIRECTORS AND EXECUTIVE OFFICERS
To the knowledge of our company, no current or former director, officer or employee of our company, nor any associate or affiliate of any of them, is or was indebted to our company at any time since its formation.
The aggregate indebtedness to BPO (one of our operating entities) or its subsidiaries of all officers, directors and employees and former officers, directors and employees of BPO and its subsidiaries is nil. No loans have been extended by BPO since July 30, 2002 to directors, executives or senior officers of BPO. Richard B. Clark, the Chairman of the board of directors of the BPY General Partner and the former CEO of BPO, had an outstanding non-interest bearing loan from BPO of C$698,726 which was repaid in 2019. The largest amount outstanding of such loan during the 12 months ended December 31, 2019 was C$698,726. Mr. Clark’s securities purchased with the loan were held as security for the loan.
7.C. INTERESTS OF EXPERTS AND COUNSEL
Not applicable.
ITEM 8. FINANCIAL INFORMATION
8.A. CONSOLIDATED STATEMENTS AND OTHER FINANCIAL INFORMATION
See Item 18. “Financial Statements”.
8.B. SIGNIFICANT CHANGES
On January 15, 2020, we issued medium term notes for C$400 million at 3.93% per annum, with a term of seven years. Interest on the notes is payable semi-annually.
On January 15, 2020, additionally we issued medium term notes for C$100 million at 4.346% per annum, at an effective yield of 3.02%, with a term of 3.5 years. Interest on the notes is payable semi-annually.
On February 4, 2020, the board of directors declared a quarterly distribution on our LP Units of $0.3325 per unit ($1.33 on an annualized basis) payable on March 31, 2020 to unitholders of record at the close of business on February 28, 2020.
On February 18, 2020, we issued $287.5 million of our Class A Cumulative Redeemable Perpetual Preferred Units, Series 3 at a coupon rate of 5.75% per annum, payable quarterly in arrears.
ITEM 9. THE OFFER AND LISTING
9.A. OFFER AND LISTING DETAILS
Our LP Units are listed on the Nasdaq and TSX under the symbols “BPY” and “BPY.UN”, respectively. Our Preferred Units, Series 1, 2 and Series 3 are listed on the Nasdaq under the symbols “BPYPP”, “BPYPO” and “BPYPN”, respectively.
9.B. PLAN OF DISTRIBUTION
Not applicable.
- 141 -
9.C. MARKETS
See Item 9.A. “The Offer and Listing - Offer and Listing Details” above.
9.D. SELLING SHAREHOLDERS
Not applicable.
9.E. DILUTION
Not applicable.
9.F. EXPENSES OF THE ISSUE
Not applicable.
ITEM 10. ADDITIONAL INFORMATION
10.A. SHARE CAPITAL
Not applicable.
10.B. MEMORANDUM AND ARTICLES OF ASSOCIATION
DESCRIPTION OF OUR LP UNITS, PREFERRED UNITS AND OUR LIMITED PARTNERSHIP AGREEMENT
The following is a description of the material terms of our LP Units, Preferred Units and our limited partnership agreement. Because this description is only a summary of the terms of our LP Units, Preferred Units and our limited partnership agreement, you should read our limited partnership agreement. Our limited partnership agreement is available electronically on the website of the SEC at www.sec.gov and on our SEDAR profile at www.sedar.com and is available to our holders as described under Item 10.C. “Additional Information - Material Contracts” and Item 10.H. “Additional Information - Documents on Display”.
Formation and Duration
Our company is a Bermuda exempted limited partnership registered under the Bermuda Limited Partnership Act 1883 and the Bermuda Exempted Partnerships Act 1992. Our company has a perpetual existence and will continue as a limited liability partnership unless terminated or dissolved in accordance with our limited partnership agreement. Our partnership interests consist of LP Units and Preferred Units, which represent limited partnership interests in our company, and any additional partnership interests representing limited partnership interests that we may issue in the future as described below under “- Issuance of Additional Partnership Interests”.
Management
As required by law, our limited partnership agreement provides for the management and control of our company by a general partner, the BPY General Partner.
Nature and Purpose
Under our limited partnership agreement, the purpose of our company is to: acquire and hold interests in the Property Partnership and, subject to the approval of the BPY General Partner, interests in any other entity; engage in any activity related to the capitalization and financing of our company’s interests in such entities; serve as the managing general partner of the Property Partnership and execute and deliver, and perform the functions of a managing general partner of the Property Partnership specified in, the limited partnership agreement of the Property Partnership; and engage in any other activity that is incidental to or in furtherance of the foregoing and that is approved by the BPY General Partner and that lawfully may be conducted by a limited partnership organized under the Bermuda Limited Partnership Act 1883, the Bermuda Exempted Partnerships Act 1992 and our limited partnership agreement.
- 142 -
Holders of Our Units
Our units are non-voting limited partnership interests in our company. A holder of our units does not hold a share of a body corporate. Unitholders of our company do not have statutory rights normally associated with ownership of shares of a corporation including, for example, the right to bring “oppression” or “derivative” actions. The rights of holders of our units are based on our limited partnership agreement, amendments to which may be proposed only by or with the consent of the BPY General Partner as described below under “- Amendment of Our Limited Partnership Agreement”. Our units have no par or other stated value.
Units of our company represent a fractional limited partnership interest in our company and do not represent a direct investment in our company’s assets and should not be viewed by investors as direct securities of our company’s assets. Holders of our units are not entitled to the withdrawal or return of capital contributions in respect of our units, except to the extent, if any, that distributions are made to such holders pursuant to our limited partnership agreement or upon the liquidation of our company as described below under “- Liquidation and Distribution of Proceeds” or as otherwise required by applicable law. Except to the extent expressly provided in our limited partnership agreement, a holder of our units does not have priority over any other holder of our units, either as to the return of capital contributions or as to profits, losses or distributions.
Except to the extent expressly provided in our limited partnership agreement, holders of our units do not have the ability to call special meetings, and holders of our units are not entitled to vote on matters relating to our company except as described below under “- No Management or Control; Limited Voting”. Any action that may be taken at a meeting may be taken without a meeting if written consent is solicited by or on behalf of the BPY General Partner and it receives approval of not less than the minimum percentage of support necessary to authorize or take such action at a meeting as described below under “- Meetings”.
Our Preferred Units
Our Preferred Units rank senior to our LP Units with respect to priority in the payment of distributions and in the distribution of the assets in the event of the liquidation, dissolution or winding-up of our company, whether voluntary or involuntary. Each series of Preferred Units ranks on parity with every other series of Preferred Units with respect to priority in the payment of distributions and in the distribution of the assets in the event of the liquidation, dissolution or winding-up of our company, whether voluntary or involuntary. Each series of Preferred Units ranks on parity with every other series of Preferred Units with respect to priority in the return of capital contributions or as to profits, losses and distributions.
Prior to March 31, 2024, September 30, 2024 and March 31, 2025, we may redeem our Preferred Units, Series 1, 2 and 3, respectively, after certain ratings events as provided for in our limited partnership agreement. At any time on or after March 31, 2024, September 30, 2024 and March 31, 2025, we may redeem, in whole or in part, our Preferred Units, Series 1, 2 and 3 at a redemption price of $25.00 per unit, plus an amount equal to all accumulated and unpaid distributions thereon to, but excluding, the date of redemption, whether or not declared. We may also redeem the Preferred Units, Series 1, 2 and 3 upon the occurrence of certain change of control triggering events, delisting events and changes in tax law events as provided for in our limited partnership agreement. We must generally provide not less than 30 days’ and not more than 60 days’ written notice of any such redemption. Any such redemption would be effected only out of funds legally available for such purpose and will be subject to compliance with the provisions of our outstanding indebtedness.
As of the date of this annual report, there are (i) 7,360,000 Preferred Units, Series 1 outstanding and trading on Nasdaq under the ticker symbol “BPYPP” (which units were publicly issued on March 21, 2019 and April 8, 2019 at $25.00 per unit); (ii) 10,000,000 Preferred Units, Series 2 outstanding and trading on Nasdaq under the ticker symbol “BPYPO” (which units were publicly issued on August 20, 2019 at $25.00 per unit) and (iii) 11,500,000 Preferred Units, Series 3 outstanding and trading on Nasdaq under the ticker symbol “BPYPN” (which units were publicly issued on February 18, 2020 at $25.00 per unit).
Exchange LP Units and the Support Agreement
In connection with the acquisition of BPO, Canadian residents had the election to receive in exchange for their common shares an Exchange LP Unit instead of our LP Units, which allowed for full or partial deferral of capital gains for Canadian federal income tax purposes. Holders of Exchange LP Units are entitled to receive distributions economically equivalent to the distributions, if any, paid from time to time by us on our LP Units. Exchange LP Units are not transferrable, except upon the death of a holder.
Holders of Exchange LP Units are entitled at any time to retract (i.e., to require Exchange LP to redeem) any or all Exchange LP Units held by them and to receive in exchange one of our LP Units, plus the full amount of all declared and unpaid distributions on the Exchange LP Units and all distributions declared on one of our LP Units that have not yet been declared or
- 143 -
paid on the Exchange LP Units (the “Distribution Amount”), if any. Instead of Exchange LP redeeming the retracted units, we have a call right to purchase all but not less than all of the units covered by the retraction request.
Exchange LP has the right, commencing on the seventh anniversary of the initial take-up date of the offer to acquire the common shares of BPO, to redeem all of the then outstanding Exchange LP Units for a purchase price equal to one of our LP Units for each outstanding Exchange LP Unit plus the Distribution Amount, if any. The redemption date may be accelerated if certain conditions are met. As an alternative to Exchange LP exercising its redemption right, we can require that each holder of Exchange LP Units sell all the Exchange LP Units held by such holder to us on the redemption date upon payment by us to such holder of the purchase price for such Exchange LP Units.
Under the Support Agreement between us and Exchange LP, we have covenanted that, so long as such Exchange LP Units not owned by us or our subsidiaries are outstanding, we will, among other things: (a) not declare or pay any distribution on our LP Units unless (i) on the same day Exchange LP declares or pays, as the case may be, an equivalent distribution on the Exchange LP Units and (ii) Exchange LP has sufficient money to pay such distribution; (b) take actions reasonably necessary to ensure that the declaration date, record date and payment date for distributions on the Exchange LP Units are the same as those for any corresponding distributions on our LP Units; and (c) take all actions reasonably necessary to enable Exchange LP to pay the liquidation amount, the retraction price or the redemption price to the holders of the Exchange LP Units in the event of a liquidation, dissolution or winding up of Exchange LP, a retraction request by a holder of Exchange LP Units or a redemption of Exchange LP Units, as the case may be.
The Support Agreement also provides that, without the prior approval of Exchange LP and the holders of Exchange LP Units, we will not distribute LP Units or rights to subscribe for LP Units or other property or assets to all or substantially all of our holders, change any of the rights, privileges or other terms of our LP Units, or change the then outstanding number of LP Units into a lesser or greater number, unless the same or an equivalent distribution on, or change to, the Exchange LP Units is made simultaneously. In the event of any proposed cash offer, share exchange offer, issuer bid, take-over bid or similar transaction affecting our LP Units, we and Exchange LP will use reasonable best efforts to take all actions necessary or desirable to enable holders of Exchange LP Units to participate in such transaction to the same extent and on an economically equivalent basis as our holders.
The foregoing is a summary of certain of the material terms of the Exchange LP Units, as set out in the limited partnership agreement of Exchange LP, and the Support Agreement and is qualified in its entirety by reference to the full text of the limited partnership agreement of Exchange LP and the Support Agreement, which are available electronically on the website of the SEC at www.sec.gov and on our SEDAR profile at www.sedar.com.
Class A Preferred Units and Redemption-Exchange Units
The Class A Preferred Units of the Property Partnership are exchangeable into LP Units in accordance with the Preferred Unit Exchange Mechanism and the Redemption-Exchange Units are exchangeable into LP Units in accordance with the Redemption-Exchange Mechanism.
Distribution Reinvestment Plan
We have a distribution reinvestment plan for holders of LP Units resident in Canada and the United States. The Property Partnership also has a distribution reinvestment plan. Holders of LP Units who are not resident in Canada or the United States may participate in the distribution reinvestment plan provided that there are not any laws or governmental regulations that may limit or prohibit them from doing so. The following is a summary of the principal terms of our company’s distribution reinvestment plan.
Pursuant to the distribution reinvestment plan, holders of LP Units can elect to have distributions paid on LP Units held by them automatically reinvested in additional LP Units in accordance with the terms of the plan. Distributions to be reinvested in LP Units under the distribution reinvestment plan are reduced by the amount of any applicable withholding tax.
Distributions due to plan participants are paid to the plan agent for the benefit of the plan participants and, if a plan participant has elected to have his or her distributions automatically reinvested, or applied, on behalf of such plan participant to the purchase of additional LP Units, such purchases will be made from our company on the distribution date at a price per LP Unit calculated by reference to the volume weighted average of the trading price for LP Units on the Nasdaq for the five trading days immediately preceding the date the relevant distribution is paid by our company.
- 144 -
As soon as reasonably practicable after each distribution payment date, a statement of account will be mailed to each participant setting out the amount of the relevant cash distribution reinvested, the price of each LP Unit purchased, the number of LP Units purchased under the distribution reinvestment plan on the distribution payment date and the total number of LP Units, computed to four decimal places, held for the account of the participant under the distribution reinvestment plan (or, in the case of beneficial holders, CDS will receive such statement on behalf of the beneficial holders participating in the plan). While our company does not issue fractional LP Units, a plan participant’s entitlement to LP Units purchased under the distribution reinvestment plan may include a fraction of a LP Unit and such fractional LP Units shall accumulate. A cash adjustment for any fractional LP Units will be paid by the plan agent upon the withdrawal from or termination by a plan participant of his or her participation in the distribution reinvestment plan or upon termination of the distribution reinvestment plan at a price per LP Unit based upon the closing price for our LP Units on the Nasdaq on the trading day immediately preceding such withdrawal or termination. A registered holder may, at any time, obtain LP Unit certificates for any number of whole LP Units held for the participant’s account under the plan by notifying the plan agent. Certificates for LP Units acquired under the plan will not be issued to participants unless specifically requested. Prior to pledging, selling or otherwise transferring LP Units held for a participant’s account (except for sale of LP Units through the plan agent), a registered holder must request that his or her LP Units be electronically transferred to his or her brokerage account or a LP Unit certificate be issued. The automatic reinvestment of distributions under the plan will not relieve participants of any income tax obligations applicable to such distributions. No brokerage commissions are payable in connection with the purchase of LP Units under the distribution reinvestment plan and all administrative costs are borne by our company.
Holders of LP Units can terminate their participation in the distribution reinvestment plan by providing, or by causing to be provided, notice to the plan agent. Such notice, if actually received by the plan agent no later than five business days prior to a record date, will have effect in respect of the distribution to be made as of such date. Thereafter, distributions to such LP Unitholders will be in cash. In addition, our LP Unitholders may request that all or part of their LP Units be sold. When LP Units are sold through the plan agent, a holder will receive the proceeds less a handling charge and any brokerage trading fees. Our company is able to terminate the distribution reinvestment plan, in its sole discretion, upon notice to the plan participants and the plan agent, but such action will have no retroactive effect that would prejudice a participant’s interest. Our company is also able to amend, modify or suspend the distribution reinvestment plan at any time in its sole discretion, provided that our company, through the plan agent, gives notice of any amendment, modification or suspension to the distribution reinvestment plan that in our company’s opinion may materially prejudice participants.
The Property Partnership has a corresponding distribution reinvestment plan in respect of distributions made to our company and to holders of the Redemption-Exchange Units. Our company does not intend to reinvest distributions it receives from the Property Partnership in the Property Partnership’s distribution reinvestment plan except to the extent that holders of LP Units elect to reinvest distributions pursuant to our distribution reinvestment plan. Brookfield has advised our company that it may from time to time reinvest distributions it receives from us in respect of our LP Units or units from the Property Partnership in respect of the Redemption-Exchange Units pursuant to the distribution reinvestment plans of our company or the Property Partnership, as applicable. To the extent Brookfield reinvests distributions it receives on our LP Units, it will receive additional LP Units of our company. To the extent Brookfield elects to reinvest distributions it receives from the Property Partnership pursuant to the Property Partnership’s distribution reinvestment plan, it will receive Redemption-Exchange Units. Such Redemption-Exchange Units received by Brookfield also would become subject to the Redemption-Exchange Mechanism and may therefore result in Brookfield acquiring additional LP Units of our company.
Issuance of Additional Partnership Interests
Subject to the rights of the holders of BPY’s Preferred Units to approve issuances of additional partnership interests that are either (i) on parity with the Preferred Units when the cumulative distributions on the Preferred Units or any parity securities are in arrears or (ii) ranking senior to the Preferred Units with respect to priority in the payment of distributions and in the distribution of the assets in the event of the liquidation, dissolution or winding-up of BPY whether voluntary or involuntary, and to any approval required by applicable law and the approval of any applicable securities exchange, the BPY General Partner has broad rights to cause our company to issue additional partnership interests (including additional LP Units and/or preferred units) and may cause us to issue additional partnership interests (including new classes of partnership interests and options, rights, warrants and appreciation rights relating to such interests) for any partnership purpose, at any time and on such terms and conditions as it may determine without the approval of any limited partners. Any additional partnership interests may be issued in one or more classes, or one or more series of classes, with such designations, preferences, rights, powers and duties (which may be senior to existing classes and series of partnership interests) as may be determined by the BPY General Partner in its sole discretion, all without the approval of our unitholders.
- 145 -
Investments in Property Partnership
If and to the extent that our company raises funds by way of the issuance of equity or debt securities, or otherwise, pursuant to a public offering, private placement or otherwise, an amount equal to the proceeds will be invested in the Property Partnership, unless otherwise agreed by us and the Property Partnership.
Capital Contributions
No partner has the right to withdraw any or all of its capital contribution. The limited partners have no liability for further capital contributions to our company. Each limited partner’s liability will be limited to the amount of capital such partner is obligated to contribute to our company for its limited partner interest plus its share of any undistributed profits and assets, subject to certain exceptions. See “- Limited Liability” below.
Distributions
Subject to the rights of holders of Preferred Units to receive cumulative preferential cash distributions in accordance with their series terms, distributions to partners of our company will be made only as determined by the BPY General Partner in its sole discretion. However, the BPY General Partner will not be permitted to cause our company to make a distribution if it does not have sufficient cash on hand to make the distribution (including as a result of borrowing), the distribution would render it insolvent, or if, in the opinion of the BPY General Partner, the distribution would leave it with insufficient funds to meet any future or contingent obligations, or the distribution would contravene the Bermuda Limited Partnership Act 1883. For greater certainty, our company, the Property Partnership or one or more of the Holding Entities may (but none is obligated to) borrow money in order to obtain sufficient cash to make a distribution. The amount of taxes withheld or paid by us in respect of LP Units held by limited partners or the BPY General Partner shall be treated either as a distribution to such partner or as a general expense of our company as determined by the BPY General Partner in its sole discretion.
The BPY General Partner has sole authority to determine whether our company will make distributions and the amount and timing of these distributions. However, BPY will not be permitted to make a distribution on LP Units unless all accrued distributions have been paid in respect of the Preferred Units, and all other units of BPY ranking prior to or on a parity with the Preferred Units with respect to the payment of distributions.
Subject to certain adjustments as provided for in our limited partnership agreement, holders of the Preferred Units, Series 1 are entitled to receive a cumulative quarterly fixed distribution at a rate of 6.50% annually. Subject to certain adjustments as provided for in our limited partnership agreement, holders of the Preferred Units, Series 2 are entitled to receive a cumulative quarterly fixed distribution at a rate of 6.375% annually. Subject to certain adjustments as provided for in our limited partnership agreement, holders of the Preferred Units, Series 3 are entitled to receive a cumulative quarterly fixed distribution at a rate of 5.750% annually. Distributions to holders of Preferred Units in accordance with their terms rank higher in priority than distributions to holders of LP Units. Subject to the terms of any Preferred Units outstanding at the time, any distributions from our partnership will be made to the limited partners holding LP Units based on the quotient of the number of LP Units held by the limited partner divided by the total number of all GP Units and LP Units then outstanding, expressed as a percentage.
Further, the BPY General Partner has adopted a distribution policy pursuant to which our company intends to make quarterly cash distributions to holders of LP Units in such amounts as are determined in its sole discretion. The quarterly distribution is currently anticipated to be approximately $1.33 per LP Unit on an annualized basis. Our distribution policy is to retain sufficient cash flow within our operations to cover tenant improvements, leasing costs and other sustaining capital expenditures and to pay out substantially all remaining cash flow. In order to finance development projects, acquisitions and other investments, we plan to raise external capital. We believe that a payout ratio of 80% of FFO should accomplish this objective. See Item 5.A. “Operating and Financial Review and Prospects - Operating Results” for a discussion of FFO. We have invested a substantial amount of capital in development and redevelopment projects primarily in our Core Office and Core Retail businesses. Once we realize stabilized cash flow from these initiatives, we expect the growth in our payout to meet its target range of 5% to 8% annually. Our company, the Property Partnership or one or more Holding Entities may (but none is obligated to) borrow money in order to obtain sufficient cash to make a distribution.
From time to time our distributions may exceed the above percentages as a result of acquisitions that are attractive on a long-term cash flow and/or return basis but are not immediately accretive to FFO. However, there can be no assurance that we will be able to make distributions in the amounts discussed above or meet our target growth rate. Our company’s ability to make distributions will depend on our company receiving sufficient distributions from the Property Partnership, which in turn will depend on the Property Partnership receiving sufficient distributions from the Holding Entities, and we cannot assure you that our company
- 146 -
will in fact make cash distributions as intended. In particular, the amount and timing of distributions will depend upon a number of factors, including, among others, our actual results of operations and financial condition, the amount of cash that is generated by our operations and investments, restrictions imposed by the terms of any indebtedness that is incurred to leverage our operations and investments or to fund liquidity needs, levels of operating and other expenses, contingent liabilities and other factors that the BPY General Partner deems relevant.
Distributions made by the Property Partnership will be made pro rata with respect to the Property Partnership’s managing general partnership interest owned by us and those limited partnership interests owned by Brookfield and holders of AO LTIP Units and FV LTIP Units. Our company’s ability to make distributions will also be subject to additional risks and uncertainties, including those set forth in this Form 20-F under Item 3.D. “Key Information - Risk Factors - Risks Relating to Us and Our Structure” and Item 5. “Operating and Financial Review and Prospects”. In particular, see Item 3.D “Key Information - Risk Factors - We may not be able to continue paying comparable or growing cash distributions to our unitholders in the future” and “Risks Relating to Our Relationship with Brookfield - Our organizational and ownership structure, as well as our contractual arrangements with Brookfield, may create significant conflicts of interest that may be resolved in a manner that is not in our best interests or the best interests of our unitholders.” In addition, the BPY General Partner will not be permitted to cause our company to make a distribution if we do not have sufficient cash on hand to make the distribution, if the distribution would render our company insolvent or if, in the opinion of the BPY General Partner, the distribution would leave us with insufficient funds to meet any future or contingent obligations, or the distribution would contravene the Bermuda Limited Partnership Act of 1883.
Allocations of Income and Losses
Limited partners (other than partners holding Preferred Units) share in the net profits and net losses of our company generally in accordance with their respective percentage interest in our company.
Net income and net losses for U.S. federal income tax purposes will be allocated for each taxable year or other relevant period among our partners (other than partners holding Preferred Units) using a monthly, quarterly or other permissible convention pro rata on a per unit basis, except to the extent otherwise required by law or pursuant to tax elections made by our company. Each item of income, gain, loss and deduction so allocated to a partner of our partnership (other than partners holding Preferred Units) generally will be the same source and character as though such partner had realized the item directly.
The income for Canadian federal income tax purposes of our company for a given fiscal year will be allocated to each partner in an amount calculated by multiplying such income by a fraction, the numerator of which is the sum of the distributions received by such partner with respect to such fiscal year and the denominator of which is the aggregate amount of the distributions made by our company to partners with respect to such fiscal year; provided that the numerator and denominator will not include any distributions on the Preferred Units that are in satisfaction of accrued distributions on the Preferred Units that were not paid in a previous fiscal year where the BPY General Partner determines that the inclusion of such distributions would result in a holder of Preferred Units being allocated more income than it would have been if the distributions were paid in the fiscal year in which they were accrued. To such end, any person who was a partner at any time during such fiscal year but who has transferred all of their units before the last day of that fiscal year may be deemed to be a partner on the last day of such fiscal year for the purposes of subsection 96(1) of the Tax Act. Generally, the source and character of items of income so allocated to a partner with respect to a fiscal year of our company will be the same source and character as the distributions received by such partner with respect to such fiscal year. The BPY General Partner may adjust allocations of items that would otherwise be made pursuant to the terms of our limited partnership agreement to the extent necessary to avoid an adverse effect on our company’s limited partners, subject to the approval of a committee of the board of directors of the BPY General Partner made up of independent directors.
If, with respect to a given fiscal year, no distribution is made by our company or we have a loss for Canadian federal income tax purposes, one quarter of the income, or loss, as the case may be, for Canadian federal income tax purposes of our company for such fiscal year, will be allocated to the partners of record at the end of each calendar quarter ending in such fiscal year as follows:(i) to holders of Preferred Units in respect of Preferred Units held by them on each such date, such amount of the income for Canadian tax purposes or the loss for Canadian tax purposes, as the case may be, as the BPY General Partner determines is reasonable in the circumstances having regard to such factors as the BPY General Partner considers to be relevant, including, without limitation, the relative amount of capital contributed to our company on the issuance of Preferred Units as compared to all other units and the relative fair market value of the Preferred Units as compared to all other units, and (ii) to the partners other than in respect of Preferred Units, the remaining amount of the income for Canadian tax purposes or the loss for Canadian tax purposes, as the case may be, pro rata to their respective percentage interests in our company, which in the case of the BPY General Partner shall mean 0.2%, and in the case of all of our unitholders shall mean in the aggregate 99.8%, which aggregate percentage interest shall be allocated among the limited partners in the proportion that the number of our units held at each such date by a limited partner (other than Preferred Units) is of the total number of our units (other than Preferred Units) issued and outstanding
- 147 -
at each such date. Generally, the source and character of such income or losses so allocated to a partner at the end of each calendar quarter will be the same source and character as the income or loss earned or incurred by our company in such calendar quarter.
Limited Liability
Assuming that a limited partner does not participate in the control or management of our company or conduct the affairs of, sign or execute documents for or otherwise bind our company within the meaning of the Bermuda Limited Partnership Act 1883 and otherwise acts in conformity with the provisions of our limited partnership agreement, such partner’s liability under the Bermuda Limited Partnership Act 1883 and our limited partnership agreement will be limited to the amount of capital such partner is obligated to contribute to our company for its limited partner interest plus its share of any undistributed profits and assets, except as described below.
If it were determined, however, that a limited partner was participating in the control or management of our company or conducting the affairs of, signing or executing documents for or otherwise binding our company (or purporting to do any of the foregoing) within the meaning of the Bermuda Limited Partnership Act 1883 or the Bermuda Exempted Partnerships Act 1992, such limited partner would be liable as if it were a general partner of our partnership in respect of all debts of our company incurred while that limited partner was so acting or purporting to act. Neither our limited partnership agreement nor the Bermuda Limited Partnership Act 1883 specifically provides for legal recourse against the BPY General Partner if a limited partner were to lose limited liability through any fault of the BPY General Partner. While this does preclude a limited partner from seeking legal recourse, we are not aware of any precedent for such a claim in Bermuda case law.
No Management or Control; Limited Voting
Our company’s limited partners, in their capacities as such, may not take part in the management or control of the activities and affairs of our company and do not have any right or authority to act for or to bind our company or to take part or interfere in the conduct or management of our company. Limited partners are not entitled to vote on matters relating to our company, although holders of LP Units are entitled to consent to certain matters with respect to certain amendments to our limited partnership agreement and certain matters with respect to the withdrawal of the BPY General Partner as described in further detail below. Each LP Unit entitles the holder thereof to one vote for the purposes of any approvals of holders of LP Units.
Holders of Preferred Units generally have no voting rights (except as otherwise provided by law and except for meetings of holders of Preferred Units as a class, and meetings of all holders of the Preferred Units, Series 1, Series 2 and Series 3 as a series, respectively). However, we may not adopt an amendment to our limited partnership agreement that has a material adverse effect on the powers, preferences, duties or special rights of the Preferred Units as a class (or the Preferred Units, Series 1, Preferred Units, Series 2 and/or the Preferred Units, Series 3, each as a series) unless such amendment (i) is approved by a resolution signed by the holders of Preferred Units as a class (or the Preferred Units, Series 1, Preferred Units, Series 2 and/or the Preferred Units, Series 3, each as a series) owning not less than the percentage of the Preferred Units as a class (or the Preferred Units, Series 1, Preferred Units, Series 2 and/or the Preferred Units, Series 3, each as a series) that would be necessary to authorize such action at a meeting of the holders of the Preferred Units as a class (or the Preferred Units, Series 1, Preferred Units, Series 2 and/or the Preferred Units, Series 3, each as a series) at which all holders of the Preferred Units as a class (or the Preferred Units, Series 1, Preferred Units, Series 2 and/or the Preferred Units, Series 3, each as a series) were present and voted or were represented by proxy or (ii) is passed by an affirmative vote of at least 66 2/3% of the votes cast at a meeting of holders of the Preferred Units as a class (or the Preferred Units, Series 1, Preferred Units, Series 2 and/or the Preferred Units, Series 3, each as a series) duly called for that purpose and at which the holders of at least 33 1/3% of the outstanding Preferred Units as a class (or the Preferred Units, Series 1, Preferred Units, Series 2 and/or the Preferred Units, Series 3, each as a series) are present or represented by proxy.
Further, unless we have received the affirmative vote or consent of the holders of at least 66 2/3% of the outstanding Preferred Units, voting as a class together with holders of any other parity securities upon which like voting rights have been conferred and are exercisable, we may not (i) create or issue any parity securities to the Preferred Units if the cumulative distributions on Preferred Units or any parity securities are in arrears or (ii) create or issue any senior securities to the Preferred Units.
In addition to their rights under our limited partnership agreement, limited partners have consent rights with respect to certain fundamental matters and related party transactions (in accordance with MI 61-101) and on any other matters that require their approval in accordance with applicable securities laws and stock exchange rules. Each unit entitles the holder thereof to one vote for the purposes of any approvals of holders of units.
- 148 -
Meetings
The BPY General Partner may call special meetings of the limited partners at a time and place outside of Canada determined by the BPY General Partner on a date not less than 10 days nor more than 60 days after the mailing of notice of the meeting. The limited partners do not have the ability to call a special meeting. Only holders of record on the date set by the BPY General Partner (which may not be less than 10 nor more than 60 days before the meeting) are entitled to notice of any meeting.
Written consents may be solicited only by or on behalf of the BPY General Partner. Any such consent solicitation may specify that any written consents must be returned to our company within the time period, which may not be less than 20 days, specified by the BPY General Partner.
For purposes of determining holders of partnership interests entitled to provide consents to any action described above, the BPY General Partner may set a record date, which may be not less than 10 nor more than 60 days before the date by which record holders are requested in writing by the BPY General Partner to provide such consents. Only those holders of partnership interests on the record date established by the BPY General Partner will be entitled to provide consents with respect to matters as to which a consent right applies.
Amendment of Our Limited Partnership Agreement
Amendments to our limited partnership agreement may be proposed only by or with the consent of the BPY General Partner. To adopt a proposed amendment, other than the amendments that do not require limited partner approval discussed below, the BPY General Partner must seek approval of a majority of our outstanding units required to approve the amendment, either by way of a meeting of the limited partners to consider and vote upon the proposed amendment or by written approval.
Notwithstanding the above, in addition to any other approvals required by law, we may not adopt an amendment to our limited partnership agreement that has a material adverse effect on the powers, preferences, duties or special rights of the Preferred Units as a class (or the Preferred Units, Series 1, Preferred Units, Series 2 and/or the Preferred Units, Series 3, each as a series) unless such amendment (i) is approved by a resolution signed by the holders of Preferred Units as a class (or the Preferred Units, Series 1, Preferred Units, Series 2 and/or the Preferred Units, Series 3, each as a series) owning not less than the percentage of the Preferred Units as a class (or the Preferred Units, Series 1, Preferred Units, Series 2 and/or the Preferred Units, Series 3, each as a series) that would be necessary to authorize such action at a meeting of the holders of the Preferred Units as a class (or the Preferred Units, Series 1, Preferred Units, Series 2 and/or the Preferred Units, Series 3, each as a series) at which all holders of the Preferred Units as a class (or the Preferred Units, Series 1, Preferred Units, Series 2 and/or the Preferred Units, Series 3, each as a series) were present and voted or were represented by proxy or (ii) is passed by an affirmative vote of at least 66 2/3% of the votes cast at a meeting of holders of the Preferred Units as a class (or the Preferred Units, Series 1, Preferred Units, Series 2 and/or the Preferred Units, Series 3, each as a series) duly called for that purpose and at which the holders of at least 33 1/3% of the outstanding Preferred Units as a class (or the Preferred Units, Series 1, Preferred Units, Series 2 and/or the Preferred Units, Series 3, each as a series) are present or represented by proxy.
Prohibited Amendments
No amendment may be made that would:
| 1) | enlarge the obligations of any limited partner without its consent, except that any amendment that would have a material adverse effect on the rights or preferences of any class of partnership interests in relation to other classes of partnership interests may be approved by at least a majority of the type or class of partnership interests so affected; or |
| 2) | enlarge the obligations of, restrict in any way any action by or rights of, or reduce in any way the amounts distributable, reimbursable or otherwise payable by our company to, the BPY General Partner or any of its affiliates without the consent of the BPY General Partner, which may be given or withheld in its sole discretion. |
The provision of our limited partnership agreement preventing the amendments having the effects described in clauses (1) and (2) above can be amended upon the approval of the holders of at least 90% of the outstanding units.
- 149 -
No Limited Partner Approval
Subject to applicable law, the BPY General Partner may generally make amendments to our limited partnership agreement without the approval of any limited partner to reflect:
| 1) | a change in the name of our company, the location of our registered office or our registered agent; |
| 2) | the admission, substitution or withdrawal of partners in accordance with our limited partnership agreement; |
| 3) | a change that the BPY General Partner determines is reasonable and necessary or appropriate for our company to qualify or to continue our company’s qualification as an exempted limited partnership under the laws of Bermuda or a partnership in which the limited partners have limited liability under the laws of any jurisdiction or is necessary or advisable in the opinion of the BPY General Partner to ensure that our company will not be treated as an association taxable as a corporation or otherwise taxed as an entity for tax purposes; |
| 4) | an amendment that the BPY General Partner determines to be necessary or appropriate to address certain changes in tax regulations, legislation or interpretation; |
| 5) | an amendment that is necessary, in the opinion of our counsel, to prevent our company or the BPY General Partner or its directors or officers, from in any manner being subjected to the provisions of the Investment Company Act or similar legislation in other jurisdictions; |
| 6) | an amendment that the BPY General Partner determines in its sole discretion to be necessary or appropriate for the creation, authorization or issuance of any class or series of partnership interests or options, rights, warrants or appreciation rights relating to partnership securities; |
| 7) | any amendment expressly permitted in our limited partnership agreement to be made by the BPY General Partner acting alone; |
| 8) | any amendment that the BPY General Partner determines in its sole discretion to be necessary or appropriate to reflect and account for the formation by our company of, or its investment in, any corporation, partnership, joint venture, limited liability company or other entity, as otherwise permitted by our limited partnership agreement; |
| 9) | a change in our company’s fiscal year and related changes; or |
| 10) | any other amendments substantially similar to any of the matters described in (1) through (9) above. |
In addition, the BPY General Partner may make amendments to our limited partnership agreement without the approval of any limited partner if those amendments, in the discretion of the BPY General Partner:
| 1) | do not adversely affect our company’s limited partners considered as a whole (including any particular class of partnership interests as compared to other classes of partnership interests) in any material respect; |
| 2) | are necessary or appropriate to satisfy any requirements, conditions or guidelines contained in any opinion, directive, order, ruling or regulation of any governmental agency or judicial authority; |
| 3) | are necessary or appropriate to facilitate the trading of our units or to comply with any rule, regulation, guideline or requirement of any securities exchange on which our units are or will be listed for trading; |
| 4) | are necessary or appropriate for any action taken by the BPY General Partner relating to splits or combinations of our units under the provisions of our limited partnership agreement; or |
| 5) | are required to effect the intent of the provisions of our limited partnership agreement or are otherwise contemplated by our limited partnership agreement. |
Opinion of Counsel and Limited Partner Approval
The BPY General Partner will not be required to obtain an opinion of counsel that an amendment will not result in a loss of limited liability to the limited partners if one of the amendments described above under “- No Limited Partner Approval” should
- 150 -
occur. No other amendments to our limited partnership agreement will become effective without the approval of holders of at least 90% of our units, unless our company obtains an opinion of counsel to the effect that the amendment will not (i) cause our company to be treated as an association taxable as a corporation or otherwise taxable as an entity for tax purposes (provided that for U.S. tax purposes the BPY General Partner has not made the election described below under “- Election to be Treated as a Corporation”), or (ii) affect the limited liability under the Bermuda Limited Partnership Act 1883 of any of our company’s limited partners.
In addition to the above restrictions, any amendment that would have a material adverse effect on the rights or preferences of any type or class of partnership interests in relation to other classes of partnership interests will also require the approval of the holders of at least a majority of the outstanding partnership interests of the class so affected.
In addition, any amendment that reduces the voting percentage required to take any action must be approved by the written consent or affirmative vote of limited partners whose aggregate outstanding voting units constitute not less than the voting requirement sought to be reduced.
Sale or Other Disposition of Assets
Our limited partnership agreement generally prohibits the BPY General Partner, without the prior approval of the holders of at least 66 2/3% of the voting power of our LP Units, from causing our company to, among other things, sell, exchange or otherwise dispose of all or substantially all of our assets in a single transaction or a series of related transactions. However, the BPY General Partner, in its sole discretion, may mortgage, pledge, hypothecate or grant a security interest in all or substantially all of our assets (including for the benefit of persons who are not our company or our company’s subsidiaries) without that approval. The BPY General Partner may also sell all or substantially all of our assets under any forced sale of any or all of our assets pursuant to the foreclosure or other realization upon those encumbrances without that approval.
Take-Over Bids
If, within 120 days after the date of a take-over bid, as defined in the Securities Act (Ontario), the take-over bid is accepted by holders of not less than 90% of our outstanding LP Units, other than LP Units held at the date of the take-over bid by the offeror or any affiliate or associate of the offeror, and the offeror acquires the LP Units deposited or tendered under the take-over bid, the offeror will be entitled to acquire LP Units not deposited under the take-over bid on the same terms as the LP Units acquired under the take-over bid.
Election to be Treated as a Corporation
If the BPY General Partner determines in its sole discretion that it is no longer in our company’s best interests to continue as a partnership for U.S. federal income tax purposes, the BPY General Partner may elect to treat our company as an association or as a publicly traded partnership taxable as a corporation for U.S. federal (and applicable state) income tax purposes.
Termination and Dissolution
Our company will terminate upon the earlier to occur of: (i) the date on which all of our company’s assets have been disposed of or otherwise realized by us and the proceeds of such disposals or realizations have been distributed to partners; (ii) the service of notice by the BPY General Partner, with the special approval of a majority of its independent directors, that in its opinion the coming into force of any law, regulation or binding authority renders illegal or impracticable the continuation of our company; and (iii) at the election of the BPY General Partner, if our company, as determined by the BPY General Partner, is required to register as an “investment company” under the Investment Company Act or similar legislation in other jurisdictions.
Our partnership will be dissolved upon the withdrawal of the BPY General Partner as the general partner of our partnership (unless a successor entity becomes the general partner as described in the following sentence or the withdrawal is effected in compliance with the provisions of our limited partnership agreement that are described below under “- Withdrawal of the BPY General Partner”) or the date on which any court of competent jurisdiction enters a decree of judicial dissolution of our partnership or an order to wind-up or liquidate the BPY General Partner without the appointment of a successor in compliance with the provisions of our limited partnership agreement that are described below under “- Withdrawal of the BPY General Partner”. Our partnership will be reconstituted and continue without dissolution if within 30 days of the date of dissolution (and provided a notice of dissolution has not been filed with the Bermuda Monetary Authority), a successor general partner executes a transfer deed pursuant to which the new general partner assumes the rights and undertakes the obligations of the general partner, but only if our partnership receives an opinion of counsel that the admission of the new general partner will not result in the loss of limited liability of any limited partner.
- 151 -
Liquidation and Distribution of Proceeds
Upon our dissolution, unless our company is continued as a new limited partnership, the liquidator authorized to wind-up our company’s affairs will, acting with all of the powers of the BPY General Partner that the liquidator deems necessary or appropriate in its judgment, liquidate our company’s assets and apply the proceeds of the liquidation first, to discharge our company’s liabilities as provided in our limited partnership agreement and by law, second to the holders any Preferred Units in accordance with the terms of such Preferred Units and thereafter to the partners holding LP Units pro rata according to the percentages of their respective partnership interests as of a record date selected by the liquidator. The liquidator may defer liquidation of our assets for a reasonable period of time or distribute assets to partners in kind if it determines that an immediate sale or distribution of all or some of our company’s assets would be impractical or would cause undue loss to the partners.
Withdrawal of the BPY General Partner
The BPY General Partner may withdraw as the general partner without first obtaining approval of our unitholders by giving written notice to the other partners, and that withdrawal will not constitute a violation of our limited partnership agreement.
Upon the withdrawal of a general partner, the holders of at least a majority of our LP Units may select a successor to that withdrawing general partner. If a successor is not selected, or is selected but an opinion of counsel regarding limited liability, tax matters and the Investment Company Act (and similar legislation in other jurisdictions) cannot be obtained, our company will be dissolved, wound up and liquidated. See “- Termination and Dissolution” above.
In the event of the withdrawal of a general partner, where such withdrawal will violate our limited partnership agreement, a successor general partner will have the option to purchase the general partnership interest of the departing general partner for a cash payment equal to its fair market value. Under all other circumstances where a general partner withdraws, the departing general partner will have the option to require the successor general partner to purchase the general partnership interest of the departing general partner for a cash payment equal to its fair market value. In each case, this fair market value will be determined by agreement between the departing general partner and the successor general partner. If no agreement is reached within 30 days of the general partner’s departure, an independent investment banking firm or other independent expert selected by the departing general partner and the successor general partner will determine the fair market value. If the departing general partner and the successor general partner cannot agree upon an expert within 45 days of the general partner’s departure, then an expert chosen by agreement of the experts selected by each of them will determine the fair market value.
If the option described above is not exercised by either the departing general partner or the successor general partner, the departing general partner’s general partnership interest will automatically convert into units pursuant to a valuation of those interests as determined by an investment banking firm or other independent expert selected in the manner described in the preceding paragraph.
Transfer of the General Partnership Interest
The BPY General Partner may transfer all or any part of its general partnership interests without first obtaining approval of our unitholders. As a condition of this transfer, the transferee must: (i) be an affiliate of the general partner of the Property Partnership (or the transfer must be made concurrently with a transfer of the general partnership units of the Property Partnership to an affiliate of the transferee); (ii) agree to assume the rights and duties of the BPY General Partner to whose interest that transferee has succeeded; (iii) agree to assume and be bound by the provisions of our limited partnership agreement; and (iv) furnish an opinion of counsel regarding limited liability, tax matters and the Investment Company Act (and similar legislation in other jurisdictions). Any transfer of the general partnership interest is subject to prior notice to and approval of the relevant Bermuda regulatory authorities. At any time, the members of the BPY General Partner may sell or transfer all or part of their shares in the BPY General Partner without the approval of our unitholders.
Partnership Name
If the BPY General Partner ceases to be the general partner of our partnership and our new general partner is not an affiliate of Brookfield, our company will be required by our limited partnership agreement to change our name to a name that does not include “Brookfield” and which could not be capable of confusion in any way with such name. Our limited partnership agreement explicitly provides that this obligation shall be enforceable and waivable by the BPY General Partner notwithstanding that it may have ceased to be the general partner of our partnership.
- 152 -
Transactions with Interested Parties
The BPY General Partner, its affiliates and their respective partners, members, directors, officers, employees and shareholders, which we refer to as “interested parties,” may become limited partners or beneficially interested in limited partners and may hold, dispose of or otherwise deal with our units with the same rights they would have if the BPY General Partner was not a party to our limited partnership agreement. An interested party will not be liable to account either to other interested parties or to our company, our company’s partners or any other persons for any profits or benefits made or derived by or in connection with any such transaction.
Our limited partnership agreement permits an interested party to sell investments to, purchase assets from, vest assets in and enter into any contract, arrangement or transaction with our company, the Property Partnership, any of the Holding Entities, any operating entity or any other holding entity established by our company and may be interested in any such contract, transaction or arrangement and shall not be liable to account either to our company, the Property Partnership, any of the Holding Entities, any operating entity or any other holding entity established by our company or any other person in respect of any such contract, transaction or arrangement, or any benefits or profits made or derived therefrom, by virtue only of the relationship between the parties concerned, subject to the bye-laws of the BPY General Partner.
Outside Activities of the BPY General Partner; Conflicts of Interest
Under our limited partnership agreement, the BPY General Partner is required to maintain as its sole activity the activity of acting as the general partner of our partnership. The BPY General Partner is not permitted to engage in any business or activity or incur or guarantee any debts or liabilities except in connection with or incidental to its performance as general partner or incurring, guaranteeing, acquiring, owning or disposing of debt or equity securities of the Property Partnership, a Holding Entity or any other holding entity established by our company.
Our limited partnership agreement provides that each person who is entitled to be indemnified by our company (other than the BPY General Partner), as described below under “- Indemnification; Limitations on Liability”, will have the right to engage in businesses of every type and description and other activities for profit, and to engage in and possess interests in business ventures of any and every type or description, irrespective of whether: (i) such businesses and activities are similar to our activities; or (ii) such businesses and activities directly compete with, or disfavor or exclude, the BPY General Partner, our company, the Property Partnership, any Holding Entity, any operating entity or any other holding entity established by us. Such business interests, activities and engagements will be deemed not to constitute a breach of our limited partnership agreement or any duties stated or implied by law or equity, including fiduciary duties, owed to any of the BPY General Partner, our company, the Property Partnership, any Holding Entity, any operating entity and any other holding entity established by us (or any of their respective investors), and shall be deemed not to be a breach of the BPY General Partner’s fiduciary duties or any other obligation of any type whatsoever of the BPY General Partner. None of the BPY General Partner, our company, the Property Partnership, any Holding Entity, any operating entity, any other holding entity established by us or any other person shall have any rights by virtue of our limited partnership agreement or our partnership relationship established thereby or otherwise in any business ventures of any person who is entitled to be indemnified by our company as described below under “- Indemnification; Limitations on Liability”.
The BPY General Partner and the other indemnified persons described in the preceding paragraph do not have any obligation under our limited partnership agreement or as a result of any duties stated or implied by law or equity, including fiduciary duties, to present business or investment opportunities to our company, our unitholders, the Property Partnership, any Holding Entity, any operating entity or any other holding entity established by our company. These provisions do not affect any obligation of an indemnified person to present business or investment opportunities to our company, the Property Partnership, any Holding Entity, any operating entity or any other holding entity established by our company pursuant to the Relationship Agreement or a separate written agreement between such persons.
Any conflicts of interest and potential conflicts of interest that are approved by the BPY General Partner’s governance and nominating committee from time to time will be deemed approved by all partners. Pursuant to our conflicts policy, by a majority vote, independent directors may grant approvals for any of the transactions described above in the form of general guidelines, policies or procedures in which case no further special approval will be required in connection with a particular transaction or matter permitted thereby. See Item 7.B. “Major Shareholders and Related Party Transactions - Related Party Transactions - Relationship with Brookfield - Conflicts of Interest”.
Indemnification; Limitations on Liability
Under our limited partnership agreement, our company is required to indemnify to the fullest extent permitted by law the BPY General Partner and any of its affiliates (and their respective officers, directors, agents, shareholders, partners, members and
- 153 -
employees), any person who serves on a governing body of the Property Partnership, a Holding Entity, operating entity or any other holding entity established by our company and any other person designated by the BPY General Partner as an indemnified person, in each case, against all losses, claims, damages, liabilities, costs or expenses (including legal fees and expenses), judgments, fines, penalties, interest, settlements and other amounts arising from any and all claims, demands, actions, suits or proceedings, incurred by an indemnified person in connection with our investments and activities or by reason of their holding such positions, except to the extent that the claims, liabilities, losses, damages, costs or expenses are determined to have resulted from the indemnified person’s bad faith, fraud or willful misconduct, or in the case of a criminal matter, action that the indemnified person knew to have been unlawful. In addition, under our limited partnership agreement: (i) the liability of such persons has been limited to the fullest extent permitted by law, except to the extent that their conduct involves bad faith, fraud or willful misconduct, or in the case of a criminal matter, action that the indemnified person knew to have been unlawful; and (ii) any matter that is approved by the independent directors of the BPY General Partner will not constitute a breach of our limited partnership agreement or any duties stated or implied by law or equity, including fiduciary duties. Our limited partnership agreement requires us to advance funds to pay the expenses of an indemnified person in connection with a matter in which indemnification may be sought until it is determined that the indemnified person is not entitled to indemnification.
Accounts, Reports and Other Information
Under our limited partnership agreement, within the time required by applicable laws and regulations, including any rules of any applicable securities exchange, the BPY General Partner is required to prepare financial statements in accordance with IFRS or such other appropriate accounting principles as determined from time to time and make publicly available as of a date selected by the BPY General Partner, in its sole discretion, our company’s financial statements together with a statement of the accounting policies used in their preparation, such information as may be required by applicable laws and regulations and such information as the BPY General Partner deems appropriate. Our company’s annual financial statements must be audited by an independent accounting firm of international standing. Our company’s quarterly financial statements may be unaudited and will be made available publicly as and within the time period required by applicable laws and regulations, including any rules of any applicable securities exchange.
The BPY General Partner is also required to use commercially reasonable efforts to prepare and send to the limited partners of our partnership on an annual basis a Schedule K-1 (or equivalent). The BPY General Partner will, where reasonably possible, prepare and send information required by the non-U.S. limited partners of our partnership for U.S. federal income tax reporting purposes. The BPY General Partner will also use commercially reasonable efforts to supply information required by limited partners of our partnership for Canadian federal income tax purposes.
Governing Law; Submission to Jurisdiction
Our limited partnership agreement is governed by and will be construed in accordance with the laws of Bermuda. Under our limited partnership agreement, each of our company’s partners (other than governmental entities prohibited from submitting to the jurisdiction of a particular jurisdiction) will submit to the non-exclusive jurisdiction of any court in Bermuda in any dispute, suit, action or proceeding arising out of or relating to our limited partnership agreement. Each partner waives, to the fullest extent permitted by law, any immunity from jurisdiction of any such court or from any legal process therein and further waives, to the fullest extent permitted by law, any claim of inconvenient forum, improper venue or that any such court does not have jurisdiction over the partner. Any final judgment against a partner in any proceedings brought in a court in Bermuda will be conclusive and binding upon the partner and may be enforced in the courts of any other jurisdiction of which the partner is or may be subject, by suit upon such judgment. The foregoing submission to jurisdiction and waivers will survive the dissolution, liquidation, winding up and termination of our company.
Transfers of Units
We are not required to recognize any transfer of our units until certificates, if any, evidencing such units are surrendered for registration of transfer. Each person to whom a unit is transferred (including any nominee holder or an agent or representative acquiring such unit for the account of another person) will be admitted to our partnership as a partner with respect to the unit so transferred subject to and in accordance with the terms of our limited partnership agreement. Any transfer of our units will not entitle the transferee to share in the profits and losses of our company, to receive distributions, to receive allocations of income, gain, loss, deduction or credit or any similar item or to any other rights to which the transferor was entitled until the transferee becomes a partner and a party to our limited partnership agreement.
- 154 -
By accepting a unit for transfer in accordance with our limited partnership agreement, each transferee will be deemed to have:
| • | executed our limited partnership agreement and become bound by the terms thereof; |
| • | granted an irrevocable power of attorney to the BPY General Partner or the liquidator of our company and any officer thereof to act as such partner’s agent and attorney-in-fact to execute, swear to, acknowledge, deliver, file and record in the appropriate public offices: (i) all certificates, documents and other instruments relating to the existence or qualification of our company as an exempted limited partnership (or a partnership in which the limited partners have limited liability) in Bermuda and in all jurisdictions in which our company may conduct activities and affairs or own property; any amendment, change, modification or restatement of our limited partnership agreement, subject to the requirements of our limited partnership agreement; the dissolution and liquidation of our company; the admission or withdrawal of any partner of our partnership or any capital contribution of any partner of our partnership; the determination of the rights, preferences and privileges of any class or series of units or other partnership interests of our company, and any tax election with any limited partner or general partner on behalf of our partnership or the partners; and (ii) subject to the requirements of our limited partnership agreement, all ballots, consents, approvals, waivers, certificates, documents and other instruments necessary or appropriate, in the sole discretion of the BPY General Partner or the liquidator of our company, to make, evidence, give, confirm or ratify any voting consent, approval, agreement or other action that is made or given by our company’s partners or is consistent with the terms of our limited partnership agreement or to effectuate the terms or intent of our limited partnership agreement; |
| • | made the consents and waivers contained in our limited partnership agreement; and |
| • | ratified and confirmed all contracts, agreements, assignments and instruments entered into on behalf of our company in accordance with our limited partnership agreement, including the granting of any charge or security interest over the assets of our company and the assumption of any indebtedness in connection with the affairs of our company. |
The transfer of any unit and the admission of any new partner to our partnership will not constitute any amendment to our limited partnership agreement.
Book-Based System
Our units may be represented in the form of one or more fully registered unit certificates held by, or on behalf of, CDS or DTC, as applicable, as custodian of such certificates for the participants of CDS or DTC, registered in the name of CDS or DTC or their respective nominee, and registration of ownership and transfers of our units may be effected through the book-based system administered by CDS or DTC as applicable.
DESCRIPTION OF THE PROPERTY PARTNERSHIP LIMITED PARTNERSHIP AGREEMENT
The following is a description of the material terms of the Property Partnership’s limited partnership agreement. You are not a limited partner of the Property Partnership and do not have any rights under its limited partnership agreement. However, our company is the managing general partner of the Property Partnership and is responsible for the management and control of the Property Partnership.
We have included a summary of what we believe are the most important provisions of the Property Partnership’s limited partnership agreement because we conduct our operations through the Property Partnership and the Holding Entities and our rights with respect to our partnership interest in the Property Partnership are governed by the terms of the Property Partnership’s limited partnership agreement. Because this description is only a summary of the terms of the agreement, you should read the Property Partnership’s limited partnership agreement. The agreement is available electronically on the website of the SEC at www.sec.gov and on our SEDAR profile at www.sedar.com and is available to our unitholders as described under Item 10.C. “Additional Information - Material Contracts” and Item 10.H. “Additional Information - Documents on Display”.
Formation and Duration
The Property Partnership is a Bermuda exempted limited partnership registered under the Bermuda Limited Partnership Act 1883 and the Bermuda Exempted Partnerships Act 1992. The Property Partnership has a perpetual existence and will continue as a limited liability partnership unless our partnership is terminated or dissolved in accordance with its limited partnership agreement.
- 155 -
Management
As required by law, the Property Partnership’s limited partnership agreement provides for the management and control of the Property Partnership by its managing general partner, our company.
Nature and Purpose
Under its limited partnership agreement, the purpose of the Property Partnership is to: acquire and hold interests in the Holding Entities and, subject to the approval of our company, any other entity; engage in any activity related to the capitalization and financing of the Property Partnership’s interests in such entities; and engage in any other activity that is incidental to or in furtherance of the foregoing and that is approved by our company and that lawfully may be conducted by a limited partnership organized under the Bermuda Limited Partnership Act 1883, the Bermuda Exempted Partnerships Act 1992 and our limited partnership agreement.
Units
As of the date hereof, the Property Partnership has six classes of units: Redemption-Exchange Units, Special LP Units, Managing General Partner Units, Property Partnership Preferred Units, AO LTIP Units and FV LTIP Units.
Holders of any class of Property Partnership units are not entitled to the withdrawal or return of capital contributions in respect of their units, except to the extent, if any, that distributions are made to such holders pursuant to the Property Partnership’s limited partnership agreement or upon the dissolution of the Property Partnership as described below under “- Dissolution” or as otherwise required by applicable law. Holders of the Property Partnership’s units are not entitled to vote on matters relating to the Property Partnership except as described below under “- No Management or Control”. Except to the extent expressly provided in the Property Partnership’s limited partnership agreement and except as pursuant to the terms of any Property Partnership Preferred Units outstanding, a holder of Property Partnership units will not have priority over any other holder of the Property Partnership’s units, either as to the return of capital contributions or as to profits, losses or distributions. The Property Partnership Preferred Units rank senior to the other units of the Property Partnership with respect to priority in the payment of distributions and in the distribution of the assets in the event of the liquidation, dissolution or winding-up of the Property Partnership, whether voluntary or involuntary. Each series of Property Partnership Preferred Units ranks on a parity with every other series of Property Partnership Preferred Units with respect to priority in the payment of distributions and in the distribution of assets in the event of the liquidation, dissolution or winding-up of the Property Partnership, whether voluntary or involuntary.
Except with respect to the Property Partnership Preferred Units, the Property Partnership’s limited partnership agreement does not contain any restrictions on ownership of the Property Partnership’s units. The units of the Property Partnership have no par or other stated value.
All of the outstanding Redemption-Exchange Units and Special LP Units are held by certain wholly-owned subsidiaries of Brookfield Asset Management, and all of the outstanding Managing General Partner Units, Property Partnership Preferred Units, Series 5, 6 and 7 are held by our company. All of the outstanding Class A Preferred Units, Series 1, 2 and 3 are held by the Class A Preferred Unitholder. All of the outstanding AO LTIP Units are held by certain employees and former employees of GGP, which were issued to them in connection with the GGP acquisition. All of the outstanding FV LTIP Units are held by our employees and officers and employees of Brookfield.
Issuance of Additional Partnership Interests
Subject to the rights of the holders of Property Partnership Preferred Units to approve issuances of additional partnership interests ranking senior to the Property Partnership Preferred Units with respect to priority in the payment of distributions and in the distribution of the assets in the event of the liquidation, dissolution or winding-up of the Property Partnership, whether voluntary or involuntary, and subject to any approval required by applicable law, the Property Partnership may issue additional partnership interests (including Managing General Partner Units, Property Partnership Preferred Units, Special LP Units, Redemption-Exchange Units and FV LTIP Units as well as new classes of partnership interests and options, rights, warrants and appreciation rights relating to such interests) for any partnership purpose, at any time and on such terms and conditions as our company may determine without the approval of any limited partners. Any additional partnership interests may be issued in one or more classes, or one or more series of classes, with such designations, preferences, rights, powers and duties (which may be senior to existing classes and series of partnership interests) as may be determined by our company in its sole discretion, all without the approval of our unitholders.
- 156 -
Redemption-Exchange Mechanism
At any time, the holders of the Redemption-Exchange Units have the right to require the Property Partnership to redeem all or a portion of the Redemption-Exchange Units for cash, subject to our company’s right to acquire such interests for LP Units as described below. Any such holder may exercise its right of redemption by delivering a notice of redemption to the Property Partnership and our company.
A holder of Redemption-Exchange Units who delivers a notice of redemption will receive, on the redemption-exchange date and subject to our company’s right to acquire such interests (in lieu of redemption) in exchange for LP Units of our company, either (a) cash in an amount equal to the market value of one of our LP Units (as determined by reference to the five day volume weighted average of the trading price of our LP Units on the principal stock exchange for our LP Units based on trading volumes) multiplied by the number of LP Units to be redeemed or (b) such other amount of cash as may be agreed by such holder and the Property Partnership. Upon its receipt of the redemption notice, our company will have a right to elect, at its sole discretion, to acquire all (but not less than all) Redemption-Exchange Units presented to the Property Partnership for redemption in exchange for LP Units of our company on a one-for-one basis. Upon a redemption, the holder’s right to receive distributions with respect to the Redemption-Exchange Units so redeemed will cease.
The date of exchange specified in any redemption notice may not be less than five business days nor more than twenty business days after the date upon which the redemption notice is received by the Property Partnership and our company. At any time prior to the applicable redemption-exchange date, any holder of Redemption-Exchange Units who delivers a redemption notice will be entitled to withdraw such redemption notice.
Class A Preferred Units
The Class A Preferred Units were issued to the Class A Preferred Unitholder on December 4, 2014 in three tranches of $600 million each ($1.8 billion in the aggregate), with an average dividend yield of 6.5% and maturities of seven, ten and twelve years. In addition, a holder of the Class A Preferred Units is entitled to receive an additional distribution, or excess distribution, in any quarter in which the greater of (i) the aggregate distributions declared on an exchange number of our LP Units and (ii) the aggregate distributions paid on an exchange number of the Redemption-Exchange Units divided by an exchange ratio, exceeds the base distribution such holder is entitled to receive for such quarter. Pursuant to the terms of the Class A Preferred Units, the Property Partnership shall not declare or pay dividends on its Managing General Partner Units or Redemption-Exchange Units, or buy back such units, unless it has paid or also pays any arrears of dividends to the holder of the Class A Preferred Units.
In connection with the issuance of the Class A Preferred Units, our company has agreed to guarantee the obligation of the Property Partnership to pay a liquidation amount in the event of the liquidation, dissolution or winding-up of the Property Partnership equal to the issue price per each Class A Preferred Unit together with all accrued and unpaid dividends. Such guarantee ranks junior to any indebtedness of our company, pari passu with all obligations of our company in respect of any Preferred Units interested issued by our company from time to time, and senior to all obligations of our company with respect of all other non-preferred partnership units issued by our company from time to time.
Our company has entered into an investor agreement with the Class A Preferred Unitholder in connection with the issuance of the Class A Preferred Units pursuant to which we have agreed that, upon the request of a holder of the Class A Preferred Units, our company will file up to four registration statements to register for sale, under the Securities Act or up to four prospectuses to qualify the distribution in Canada, any of our LP Units acquired pursuant to the Preferred Unit Exchange Mechanism. Our company is not required to file a U.S. registration statement or a Canadian prospectus unless such holder requests that LP Units having a value of at least $50 million be registered or qualified. We have agreed to pay expenses in connection with such registration and sales, except for any underwriting discounts or commissions, which will be borne by the selling unitholder, and to indemnify the selling unitholder for material misstatements or omissions in the registration statement and/or prospectus.
Pursuant to the investor agreement, the Class A Preferred Unitholder is also entitled, for so long as it owns an aggregate limited partnership interest in our company of at least 5% of our issued and outstanding LP Units on a fully-diluted basis, to designate one individual to the BPY General Partner’s board of directors. Such individual must meet the standards of independence established by the Nasdaq and the TSX and be reasonably acceptable to the board of directors.
The Class A Preferred Unitholder is not entitled to transfer the Class A Preferred Units (or the LP Units into which they are exchangeable) except in accordance with the investor agreement. The rights under the investor agreement are only transferable to an affiliate of the Class A Preferred Unitholder.
- 157 -
Preferred Unit Exchange Mechanism
The Class A Preferred Units are exchangeable at the option of a holder of such Class A Preferred Units into LP Units at an exchange price of $25.70 per unit. After three years for the seven-year tranche and four years for the ten- and twelve-year tranches, we can effectively require a holder of such Class A Preferred Units to exchange the Class A Preferred Units into LP Units as long as our LP Units are trading at or above 125%, 130% and 135%, respectively, of the exchange price. Upon maturity, the Class A Preferred Units that remain outstanding will be redeemed in exchange for LP Units valued at the 20-day, volume-weighted average trading price at such time. To the extent that the market price of our LP Units is less than 80% of the exchange price at maturity, Brookfield has contingently agreed to acquire the seven-year and ten-year tranches of Class A Preferred Units from the holder of Class A Preferred Units for the initial issuance price plus accrued and unpaid distributions and to exchange such units for Class A Preferred Units with terms and conditions substantially similar to the twelve-year tranche.
AO LTIP Units
The AO LTIP Units were granted to certain employees and former employees of GGP in connection with the closing of the GGP acquisition pursuant to the Brookfield Property Partners BPY Unit Option Plan (GGP). The vesting terms of these grants are based on the vesting terms attached to the original GGP awards that were cancelled in connection with the GGP acquisition. Each AO LTIP Unit will vest within ten years of its original grant date by GGP. Both vested and unvested AO LTIP Units are entitled to distributions by the Property Partnership as described below. Vested AO LTIP Units are convertible at the option of the holder into that number of Redemption-Exchange Units based on the increase in value of our units from the time of closing of the GGP acquisition to the time of conversion.
FV LTIP Units
The FV LTIP Units may be granted from time to time pursuant to the Brookfield Property L.P. FV LTIP Unit Plan. Unless otherwise provided in the respective award agreement, FV LTIP Units fully vest on grant for FV LTIP Units granted in lieu of cash bonus or vest 20% annually over a period of five years, subject to continued service. Both vested and unvested FV LTIP Units are entitled to distributions by the Property Partnership as described below. Distributions on unvested FV LTIP Units are subject to a clawback of 50% of the value of the distributions received on such unvested FV LTIP Units if the underlying FV LTIP Units do not vest. FV LTIP Units which are vested, “booked up” and held for at least two years are redeemable at the option of the holder for either (i) an equal number of BPR Units or LP Units, or (ii) cash with an equal value based on the volume weighted average trading price of our LP Units over the five trading days prior to redemption. Our company may elect to deliver cash or equity. A holder of FV LTIP Units cannot transfer all or any portion of his or her FV LTIP Units except to the extent that rights may pass to a beneficiary or legal representative upon the death of a holder, or as expressly approved by the administrator of the plan.
Distributions
Subject to the rights of holders of Property Partnership Preferred Units to receive cumulative preferential cash distributions in accordance with the terms of the series of Property Partnership Preferred Units, distributions by the Property Partnership will be made in the sole discretion of our company. The holders of Property Partnership Preferred Units, Series 5, 6 and 7 will be entitled to receive the same distribution as the holders of BPY’s Preferred Units, Series 1, 2 and 3, respectively. However, our company will not be permitted to cause the Property Partnership to make a distribution if the Property Partnership does not have sufficient cash on hand to make the distribution, the distribution would render the Property Partnership insolvent or if, in the opinion of our company, the distribution would or might leave the Property Partnership with insufficient funds to meet any future or contingent obligations, or the distribution would contravene the Bermuda Limited Partnership Act 1883. For greater certainty, the Property Partnership or one or more of the Holding Entities may (but none is obligated to) borrow money in order to obtain sufficient cash to make a distribution.
Except as set forth below, prior to the dissolution of the Property Partnership, distributions of available cash (if any), including cash that has been borrowed for such purpose, in any given quarter will be made by the Property Partnership as follows, referred to as the Regular Distribution Waterfall:
| • | first, 100% of any available cash to our company until our company has been distributed an amount equal to our expenses and outlays for the quarter properly incurred; |
| • | second, but only at such times as there are no Property Partnership Preferred Units outstanding, to the extent distributions in respect of Redemption-Exchange Units have been deferred in previous quarters (as described in the next paragraph), 100% to all the holders of Redemption-Exchange Units pro rata in proportion to their respective percentage interests (which |
- 158 -
will be calculated using Redemption-Exchange Units only) (which distribution will be treated as having been made pursuant to the sixth and seventh provision below, as applicable) of all amounts that have been deferred in previous quarters and not yet recovered to the holders of Redemption-Exchange Units;
| • | third, an equity enhancement distribution of 100% of any available cash then remaining to Property Special LP until an amount equal to 0.3125% of the amount by which our company’s total capitalization value exceeds the total capitalization value of our company determined immediately following the Spin-off has been distributed to Property Special LP, provided that for any quarter in which our company determines that there is insufficient cash to pay this equity enhancement distribution, our company may elect to pay all or a portion of this distribution in Redemption-Exchange Units. This distribution for any quarter will be reduced by an amount equal to (i) the proportion of each cash payment in relation to such quarter made by an operating entity to Brookfield, including any payment made in the form of a dividend, distribution or other profit entitlement, which our company determines to be comparable to this equity enhancement distribution that is attributable to the amount that a Service Recipient has committed and/or contributed at such time (either as debt or equity) to such operating entity (and, in the case of a commitment, as set forth in the terms of the subscription agreement or other underlying documentation with respect to such operating entity at or prior to such time), provided that the aggregate amount of any such payments under this clause (i) will not exceed an amount equal to 0.3125% of the amount the Service Recipient has so committed and/or contributed and the deduction of such amount will not result in this equity enhancement adjustment being less than zero; (ii) any dividend, distribution or other profit entitlement made by BPR’s operating entities to Brookfield |
and (iii) the amount, if any, by which 0.125% of the total capitalization value of our company on the last day of such quarter exceeds $12.5 million (plus the amount of any annual escalation by the specified inflation factor), provided that the deduction of such amount under this clause (iv) will not result in this equity enhancement adjustment being less than zero. The total capitalization value of our company will be equal to the aggregate of the value of all of our outstanding units and the securities of other Service Recipients that are not held by our company, the Property Partnership, the Holding Entities, the operating entities or any other direct or indirect subsidiary of a Holding Entity, plus all outstanding third party debt (including, generally, debt owed to Brookfield but not amounts owed under the Brookfield revolving credit facility that was in place at closing of the Spin-off) with recourse against our company, the Property Partnership or a Holding Entity, less all cash held by such entities;
| • | fourth, 100% of any available cash then remaining to holders of Property Partnership Preferred Units pro rata to their respective relative percentage of Property Partnership Preferred Units held (determined by reference to the aggregate value of the issue price of the Property Partnership Preferred Units held by each such holder relative to the aggregate value of the issue price of all Property Partnership Preferred Units outstanding), until an amount equal to all preferential distributions to which the holders of the Property Partnership Preferred Units are entitled under the terms of the Property Partnership Preferred Units then outstanding (including any excess distribution and any outstanding accrued and unpaid preferential distributions from prior periods) has been distributed in respect of each Property Partnership Preferred Unit outstanding during such quarter; |
| • | fifth, at any time that Property Partnership Preferred Units are outstanding, 100% of any available cash then remaining to holders of Redemption-Exchange Units pro rata in proportion to their respective percentage interests (which will be calculated using Redemption-Exchange Units only) (which distribution will be treated as having been made pursuant to the sixth and seventh provision below, as applicable) all amounts that have been deferred in previous quarters pursuant to the third provision above); |
| • | sixth, 100% of any available cash then remaining to the owners of the Property Partnership’s partnership interests (other than owners of the Property Partnership Preferred Units), pro rata to their percentage interests (the percentage interests as to any holder of Property Partnership Preferred Units shall be zero), until an amount equal to the First Distribution Threshold, of $0.275 per unit, has been distributed in respect of each partnership interest of the Property Partnership during such quarter; |
| • | seventh, 85% of any available cash then remaining to the owners of the Property Partnership’s partnership interests (other than owners of the Property Partnership Preferred Units), pro rata to their percentage interests (the percentage interests as to any holder of Property Partnership Preferred Units shall be zero), and an incentive distribution of 15% to Property Special LP, until an amount equal to the Second Distribution Threshold, of $0.30 per unit, has been distributed in respect of each partnership interest of the Property Partnership (other than Property Partnership Preferred Units) during such quarter; and |
| • | thereafter; 75% of any available cash then remaining to the owners of the Property Partnership’s partnership interests (other than owners of the Property Partnership Preferred Units), pro rata to their percentage interests (the percentage interests as to any holder of Property Partnership Preferred Units shall be zero), and an incentive distribution of 25% to Property Special LP. |
- 159 -
Notwithstanding the above, an AO LTIP Unit participates in the distributions made by the Property Partnership as if it were a Redemption-Exchange Unit in accordance with its designated fractional percentage interest.
In 2019, we paid $24.8 million equity enhancement distributions and no incentive distributions to Property Special LP. Set forth below is an example of how the base management fee, equity enhancement and incentive distributions to be made to Property Special LP are calculated on a quarterly and annualized basis. The figures used below are for illustrative purposes only and are not indicative of our company’s expectations.
| Quarterly | Annualized | ||||||||||||
| Illustrative Base Management Fee Calculation | Per Unit ($) | Total ($m) | Per Unit ($) | Total ($m) | |||||||||
Capitalization at illustrative quarter-end(1) | |||||||||||||
| Market value of our company’s LP Units per unit | $ | — | 17,129.6 | $ | — | 17,129.6 | |||||||
| Add: Brookfield Group preferred shares | 559.8 | 559.8 | |||||||||||
| Add: Class A Preferred Units | 1,800.0 | 1,800.0 | |||||||||||
| Add: Recourse debt, net of cash | 2,022.3 | 2,022.3 | |||||||||||
| Total capitalization | $ | 21,511.7 | $ | 21,511.7 | |||||||||
| Base management fee rate | 0.125 | % | 0.500 | % | |||||||||
| Base management fee | $ | 26.9 | $ | 107.6 | |||||||||
(1) | Based on the number of LP Units, Exchange LP Units and Redemption-Exchange Units as of December 31, 2019. For purposes of calculating the quarter end total capitalization, securities were valued based on their volume weighted average trading price on the principal stock exchange (Nasdaq) for the preceding five trading days. For illustrative purposes only, the example above assumes a value of $18.14 per LP Unit. |
| Quarterly | Annualized | |||||||||||||
| Illustrative Equity Enhancement Distribution Calculation | Units (m) | Per Unit ($) | Total ($m) | Per Unit ($) | Total ($m) | |||||||||
Initial capitalization(1) | ||||||||||||||
| Market value of our company’s LP Units per unit | $ | — | $ | — | ||||||||||
| Our company’s LP Units | 80.2 | |||||||||||||
Redemption-Exchange Units held by Brookfield(2) | 386.1 | |||||||||||||
| Total units | 466.3 | |||||||||||||
| Total market value | $ | 10,218.2 | $ | 10,218.2 | ||||||||||
| Preferred shares of holding entities held by Brookfield | 1,275.0 | 1,275.0 | ||||||||||||
| Recourse debt, net of cash | (25.0 | ) | (25.0 | ) | ||||||||||
| Total capitalization | $ | 11,468.2 | $ | 11,468.2 | ||||||||||
Capitalization at illustrative quarter end(3) | ||||||||||||||
| Market value of our company’s units per unit | $ | — | $ | — | ||||||||||
| GP Units and LP Units | 440.0 | |||||||||||||
| Exchange LP Units | 2.9 | |||||||||||||
Redemption-Exchange Units held by Brookfield(2) | 437.4 | |||||||||||||
| Class A shares of BPR | 64.0 | |||||||||||||
| Total units | 944.3 | |||||||||||||
| Total market value | $ | 17,129.6 | $ | 17,129.6 | ||||||||||
| Preferred shares of holding entities held by Brookfield | 559.8 | 559.8 | ||||||||||||
| Class A Preferred Units | 1,800.0 | 1,800.0 | ||||||||||||
| Recourse debt, net of cash | 2,022.3 | 2,022.3 | ||||||||||||
| Total capitalization | $ | 21,511.7 | $ | 21,511.7 | ||||||||||
| Increase in total capitalization | $ | 10,043.5 | $ | 10,043.5 | ||||||||||
| Days in quarter / year | 90 | 365 | ||||||||||||
Fraction of quarter / year(4) | 100.00 | % | 100.00 | % | ||||||||||
| Equity enhancement distribution fee rate | 0.3125 | % | 1.25 | % | ||||||||||
| Gross equity enhancement distribution to Property Special LP | $ | 31.4 | $ | 125.6 | ||||||||||
Fee offsets(5) | (25.2 | ) | (100.8 | ) | ||||||||||
| Net equity | $ | 6.2 | $ | 24.8 | ||||||||||
(1) | For purposes of calculating the equity enhancement distribution at each quarter end, the initial total capitalization against which the quarter end total capitalization is measured will always be our company’s total capitalization immediately following the Spin-off. For purposes of calculating the initial total |
- 160 -
capitalization, securities were valued based on their volume weighted average trading price on the principal stock exchange (NYSE) for the 30 trading days commencing on April 15, 2013, the date of the Spin-off.
(2) | Includes (a) Redemption-Exchange Units of the Property Partnership that are held by Brookfield and that are redeemable for cash or exchangeable for our company’s LP Units in accordance with the Redemption-Exchange Mechanism and (b) Special LP Units held by Property Special LP. For purposes of calculating total capitalization, the value of these securities is assumed to be equal to the value of our company’s LP Units. |
(3) | Based on the number of LP Units, Exchange LP Units and Redemption-Exchange Units as of December 31, 2019. For purposes of calculating the quarter end total capitalization, securities were valued based on their volume weighted average trading price on the principal stock exchange (Nasdaq) for the preceding five trading days. For illustrative purposes only, the example above assumes a value of $18.14 per LP Unit. |
(4) | The example above assumes a full illustrative quarter and a full illustrative year. The equity enhancement distribution fee will be pro-rated for any partial payment period. |
(5) | The equity enhancement distribution for any quarter will be reduced by an amount equal to (i) the proportion of each cash payment in relation to such quarter made by an operating entity to Brookfield, including any payment made in the form of a dividend, distribution or other profit entitlement, which our company determines to be comparable to the equity enhancement distribution that is attributable to the amount that a Service Recipient has committed and/or contributed at such time (either as debt or equity) to such operating entity (and, in the case of a commitment, as set forth in the terms of the subscription agreement or other underlying documentation with respect to such operating entity at or prior to such time), provided that the aggregate amount of any such payments under this clause (i) will not exceed an amount equal to 0.3125% of the amount the Service Recipient has so committed and/or contributed and the deduction of such amount will not result in this equity enhancement adjustment being less than zero; (ii) any dividend, distribution or other profit entitlement made by BPR’s operating entities to Brookfield and (iii) the amount, if any, by which 0.125% of the total capitalization value of our company on the last day of such quarter exceeds $12.5 million (plus the amount of any annual escalation by the specified inflation factor), provided that the deduction of such amount under this clause (ii) will not result in this equity enhancement adjustment being less than zero. For any quarter in which our company determines that there is insufficient cash to pay the equity enhancement distribution, our company may elect to pay all or a portion of this distribution in Redemption-Exchange Units. |
| Quarterly | Annualized | |||||||||||||
| Illustrative Incentive Distribution Calculation | Units (m) | Per Unit ($) | Total ($m) | Per Unit ($) | Total ($m) | |||||||||
| Illustrative distribution | $ | 0.330 | $ | 1.320 | ||||||||||
| First distribution threshold | $ | 0.275 | ||||||||||||
Total units of Property Partnership(1) | 945.8 | |||||||||||||
| Total first distribution | $ | 260.1 | $ | 1,040.4 | ||||||||||
| Distribution in excess of first distribution threshold | $ | 0.025 | $ | 0.100 | ||||||||||
Total units of Property Partnership(1) | 945.8 | |||||||||||||
| Second distribution to all partners | $ | 23.6 | $ | 94.4 | ||||||||||
| 15% incentive distribution to Property Special LP | 4.2 | 16.8 | ||||||||||||
| Total second distribution | $ | 27.8 | $ | 111.2 | ||||||||||
| Distribution in excess of second distribution threshold | $ | 0.030 | $ | 0.120 | ||||||||||
Total units of Property Partnership(1) | 945.8 | |||||||||||||
| Third distribution to all partners | $ | 28.4 | $ | 113.6 | ||||||||||
| 25% incentive distribution to Property Special LP | 9.5 | 38.0 | ||||||||||||
| Total third distribution | $ | 37.9 | $ | 151.6 | ||||||||||
| Total distributions to partners of the Property Partnership (including incentive distributions) | $ | 325.8 | $ | 1,303.2 | ||||||||||
| Incentive distributions | $ | 13.6 | $ | 54.4 | ||||||||||
| Less: Incentive Distribution Account Credits | (13.6 | ) | (54.4 | ) | ||||||||||
| Net Incentive Distribution payable to Brookfield Asset Management | $ | — | $ | — | ||||||||||
| Total incentive distributions to Property Special LP | $ | — | $ | — | ||||||||||
(1) | Based on the number of units on December 31, 2019. Includes (a) Managing General Partner Units of the Property Partnership held by our company, (b) Redemption-Exchange Units of the Property Partnership that are held by Brookfield and that are redeemable for cash or exchangeable for the company’s units in accordance with the Redemption-Exchange Mechanism and (c) Special LP Units of the Property Partnership held by Property Special LP. |
The table below quantifies, on a quarterly and annualized basis, all management fees and equity enhancement and incentive distributions that would be earned based on the equity enhancement and incentive distribution examples set forth above. The table below is for illustrative purposes only and is not indicative of our company’s expectations.
| Quarterly | Annualized | |||||
| Total Illustrative Amounts | $m | $m | ||||
Base management fee(1) | $ | 26.8 | $ | 107.2 | ||
| Equity enhancement distribution | 6.2 | 24.8 | ||||
| Incentive distribution | — | — | ||||
| Total | $ | 33.0 | $ | 132.0 | ||
(1) | The annual base management fee paid by our partnership to Brookfield Asset Management is 0.5% of the total capitalization of our partnership, subject to an annual minimum of $50 million, plus annual inflation adjustments. The equity enhancement distribution is reduced by the amount by which the base management fee is greater than $50 million per annum, plus annual inflation adjustments. |
- 161 -
If, prior to the dissolution of the Property Partnership, except at any time that Property Partnership Preferred Units are outstanding, available cash in any quarter is not sufficient to pay a distribution to the owners of all Property Partnership interests, pro rata to their percentage interest, then our company may elect to pay the distribution at the then current level first to our company, in respect of the Managing General Partner Units held by our company, and then to the holders of the Redemption-Exchange Units to the extent practicable, and shall accrue any such deficiency for payment from available cash in future quarters as described above.
If, prior to the dissolution of the Property Partnership, and subject to the terms of any Property Partnership Preferred Units then outstanding, available cash is deemed by our company, in its sole discretion, to be (i) attributable to sales or other dispositions of the Property Partnership’s assets, and (ii) representative of unrecovered capital, then such available cash shall be distributed (x) to the partners of the Property Partnership other than the holders of Property Partnership Preferred Units in proportion to the unrecovered capital attributable to the Property Partnership interests (other than Property Partnership Preferred Units) held by the partners until such time as the unrecovered capital attributable to each such partnership interest is equal to zero and (y) to holders of FV LTIP Units in an amount per FV LTIP Unit equal to (A) the amount distributed per Managing General Partner Unit pursuant to clause (x) multiplied by (B) 100% or any such designated lower percentage for performance-based FV LTIP Units; provided that distributions in respect of an FV LTIP Unit shall be limited to the holder’s economic capital account balance attributable to such FV LTIP Unit as of the date of distribution. Thereafter, distributions of available cash made by the Property Partnership (to the extent made prior to dissolution) will be made in accordance with the Regular Distribution Waterfall.
Upon the occurrence of an event resulting in the dissolution of the Property Partnership, all cash and property of the Property Partnership in excess of that required to discharge the Property Partnership’s liabilities will be distributed as follows: (i) to the extent such cash and/or property is attributable to a realization event occurring prior to the event of dissolution, such cash and/or property will be distributed in accordance with the Regular Distribution Waterfall and/or the distribution waterfall applicable to unrecovered capital, (ii) only if there are no Property Partnership Preferred Units outstanding, the aggregate amount of distributions previously deferred in respect of the Redemption-Exchange Units and not previously recovered and (iii) all other cash and/or property will be distributed in the manner set forth below:
| • | first, 100% to our company until our company has received an amount equal to the excess of: (i) the amount of our outlays and expenses incurred during the term of the Property Partnership; over (ii) the aggregate amount of distributions received by our company pursuant to the first tier of the Regular Distribution Waterfall during the term of the Property Partnership; |
| • | second, 100% to Property Special LP until Property Special LP has received an amount equal to the fair market value of the equity enhancement distribution entitlement, as determined by a qualified independent valuator in accordance with the Property Partnership’s limited partnership agreement, provided that such amount may not exceed 2.5 times the aggregate equity enhancement distribution payments made to Property Special LP during the immediately prior 24 months; |
| • | third, 100% to holders of the Property Partnership Preferred Units, pro rata to their respective relative percentage of Property Partnership Preferred Units held (determined by reference to the aggregate value of the issue price of the Property Partnership Preferred Units held by each such holder relative to the aggregate value of the issue price of all Property Partnership Preferred Units outstanding), until an amount equal to all preferential distribution to which the holders of the Property Partnership Preferred Units are entitled in the event of dissolution, liquidation, or winding-up of the Property Partnership under the terms of the Property Partnership Preferred Units then outstanding (including any outstanding accrued and unpaid preferential distributions from prior periods) has been distributed in respect of each Property Partnership Preferred Unit outstanding; |
| • | fourth, if there are Property Partnership Preferred Units outstanding, an amount equal to the amount of cash or property held by the Property Partnership at such time, that is attributable to a realization event occurring prior to a dissolution event and that has been deemed by our company, in its sole discretion, to be (i) attributable to sales or other dispositions of the Property Partnership’s assets, and (ii) representative of unrecovered capital, shall be distributed to the partners of the Property Partnership other than holders of Property Partnership Preferred Units in proportion to the unrecovered capital attributable to the Property Partnership interests (other than Property Partnership Preferred Units) held by the partners until such time as the unrecovered capital attributable to each such partnership interest is equal to zero, as if such distribution were a distribution occurring prior to dissolution; |
| • | fifth, if there are Property Partnership Preferred Units outstanding, to holders of Redemption-Exchange Units pro rata in proportion to their respective percentage interests (which will be calculated using Redemption-Exchange Units only), the aggregate amount of distributions previously deferred and not previously recovered; |
- 162 -
| • | sixth, 100% to the partners of the Property Partnership other than holders of Property Partnership Preferred Units, in proportion to their respective amounts of unrecovered capital in the Property Partnership; |
| • | seventh, 100% to the owners of the Property Partnership’s partnership interests other than holders of Property Partnership Preferred Units, pro rata to their percentage interests (the percentage interest as to the holders of Property Partnership Preferred Units shall be zero), until an amount has been distributed in respect of each partnership interest of the Property Partnership equal to the excess of: (i) the First Distribution Threshold for each quarter during the term of the Property Partnership (subject to adjustment upon the subsequent issuance of additional partnership interests in the Property Partnership); over (ii) the aggregate amount of distributions made in respect of a partnership interest of Property Partnership other than Property Partnership Preferred Units pursuant to the sixth tier of the Regular Distribution Waterfall during the term of the Property Partnership (subject to adjustment upon the subsequent issuance of additional partnership interests in the Property Partnership); |
| • | eighth, 85% to the owners of the Property Partnership’s partnership interests other than holders of Property Partnership Preferred Units, pro rata to their percentage interests (the percentage interest as to the holders of Property Partnership Preferred Units shall be zero) and 15% to Property Special LP, until an amount has been distributed in respect of each partnership interest of the Property Partnership equal to the excess of: (i) the Second Distribution Threshold less the First Distribution Threshold for each quarter during the term of the Property Partnership (subject to adjustment upon the subsequent issuance of additional partnership interests in the Property Partnership); over (ii) the aggregate amount of distributions made in respect of a partnership interest of the Property Partnership other than Property Partnership Preferred Units pursuant to the seventh tier of the Regular Distribution Waterfall during the term of the Property Partnership (subject to adjustment upon the subsequent issuance of additional partnership interests in the Property Partnership); and |
| • | thereafter, 75% to the owners of the Property Partnership’s partnership interests other than holders of Property Partnership Preferred Units, pro rata to their percentage interests, and 25% to Property Special LP. |
Notwithstanding the above, an AO LTIP Unit will participate in distributions as if it had been converted in accordance with its terms into Redemption-Exchange Units as of the date of such distributions.
Each partner’s percentage interest is determined by the relative portion of all outstanding partnership interests, other than Property Partnership Preferred Units, held by that partner from time to time and is adjusted upon and reflects the issuance of additional partnership interests of the Property Partnership. In addition, the unreturned capital attributable to each of our partnership interests, as well as certain of the distribution thresholds set forth above, may be adjusted pursuant to the terms of the limited partnership agreement of the Property Partnership so as to ensure the uniformity of the economic rights and entitlements of: (i) the previously outstanding Property Partnership’s partnership interests; and (ii) the subsequently-issued Property Partnership’s partnership interests.
The limited partnership agreement of the Property Partnership provides that, to the extent that any Holding Entity or any operating entity pays to Brookfield any comparable performance or incentive distribution, the amount of any incentive distributions paid to Property Special LP in accordance with the distribution entitlements described above will be reduced in an equitable manner to avoid duplication of distributions.
Property Special LP may elect, at its sole discretion, to reinvest equity enhancement distributions and incentive distributions in Redemption-Exchange Units.
No Management or Control
The Property Partnership’s limited partners, in their capacities as such, may not take part in the management or control of the activities and affairs of the Property Partnership and do not have any right or authority to act for or to bind the Property Partnership or to take part or interfere in the conduct or management of the Property Partnership. Limited partners are not entitled to vote on matters relating to the Property Partnership, although holders of units are entitled to consent to certain matters as described below under “- Amendment of the Property Partnership Limited Partnership Agreement”, “- Opinion of Counsel and Limited Partner Approval”, and “- Withdrawal of the Managing General Partner” which may be effected only with the consent of the holders of the percentages of outstanding units of the Property Partnership specified below. For purposes of any approval required from holders of the Property Partnership’s units, if holders of Redemption-Exchange Units are entitled to vote, they will be entitled to one vote per unit held subject to a maximum number of votes equal to 49% of the total voting power of all units of the Property Partnership then issued and outstanding. Each unit entitles the holder thereof to one vote for the purposes of any approvals of holders of units.
- 163 -
Meetings
Our company may call special meetings of the limited partners of the Property Partnership at a time and place outside of Canada determined by us on a date not less than 10 days nor more than 60 days after the mailing of notice of the meeting. Special meetings of the limited partners may also be called by limited partners owning 50% or more of the outstanding partnership interests of the class or classes for which a meeting is proposed. For this purpose, our partnership interests outstanding do not include partnership interests owned by our company or Brookfield. Only holders of record on the date set by our company (which may not be less than 10 days nor more than 60 days before the meeting) are entitled to notice of any meeting.
Except for meetings of the holders of Property Partnership Preferred Units as a class or meetings of the holders of a series thereof, the holders of Property Partnership Preferred Units are not entitled to receive notice of, attend, or vote at any meeting of holders of Property Partnership units.
Amendment of the Property Partnership Limited Partnership Agreement
Amendments to the Property Partnership’s limited partnership agreement may be proposed only by or with the consent of our company. To adopt a proposed amendment, other than the amendments that do not require limited partner approval discussed below, our company must seek approval of a majority of the Property Partnership’s outstanding units required to approve the amendment, either by way of a meeting of the limited partners to consider and vote upon the proposed amendment or by written approval. For this purpose, the Redemption-Exchange Units will not constitute a separate class and will vote together with the other outstanding limited partnership units of the Property Partnership.
For purposes of any approval required from holders of the Property Partnership’s units, if holders of Redemption-Exchange Units are entitled to vote, they will be entitled to one vote per unit held subject to a maximum number of votes equal to 49% of the total voting power of all units of the Property Partnership then issued and outstanding.
Further, in addition to any other approvals required by law, a majority of the class or series, as applicable, of Property Partnership Preferred Units must approve, either by way of a meeting to consider and vote upon the proposed amendment or by written approval, all amendments to the rights, privileges, restrictions and conditions attaching to Property Partnership Preferred Units as a class or applicable series thereof.
Prohibited Amendments
No amendment may be made that would:
| 1) | enlarge the obligations of any limited partner of the Property Partnership without its consent, except that any amendment that would have a material adverse effect on the rights or preferences of any class of partnership interests in relation to other classes of partnership interests may be approved by at least a majority of the type or class of partnership interests so affected; or |
| 2) | enlarge the obligations of, restrict in any way any action by or rights of, or reduce in any way the amounts distributable, reimbursable or otherwise payable by the Property Partnership to Property Special LP or any of its affiliates without the consent of Property Special LP which may be given or withheld in its sole discretion. |
The provision of the Property Partnership’s limited partnership agreement preventing the amendments having the effects described in clauses (1) or (2) above can be amended upon the approval of the holders of at least 90% of the outstanding limited partnership units of the Property Partnership.
No Limited Partner Approval
Subject to applicable law, our company may generally make amendments to the Property Partnership’s limited partnership agreement without the approval of any limited partner to reflect:
| 1) | a change in the name of the Property Partnership, the location of the Property Partnership’s registered office or the Property Partnership’s registered agent; |
| 2) | the admission, substitution, withdrawal or removal of partners in accordance with the limited partnership agreement of the Property Partnership; |
- 164 -
| 3) | a change that our company determines is reasonable and necessary or appropriate for the Property Partnership to qualify or to continue its qualification as an exempted limited partnership under the laws of Bermuda or a partnership in which the limited partners have limited liability under the laws of any jurisdiction or is necessary or advisable in the opinion of our company to ensure that the Property Partnership will not be treated as an association taxable as a corporation or otherwise taxed as an entity for tax purposes; |
| 4) | an amendment that our company determines to be necessary or appropriate to address certain changes in tax regulations, legislation or interpretation; |
| 5) | an amendment that is necessary, in the opinion of counsel, to prevent the Property Partnership or our company or its directors or officers, from in any manner being subjected to the provisions of the Investment Company Act or similar legislation in other jurisdictions; |
| 6) | an amendment that our company determines in its sole discretion to be necessary or appropriate for the creation, authorization or issuance of any class or series of partnership interests or options, rights, warrants or appreciation rights relating to partnership interests; |
| 7) | any amendment expressly permitted in the Property Partnership’s limited partnership agreement to be made by our company acting alone; |
| 8) | any amendment that our company determines in its sole discretion to be necessary or appropriate to reflect and account for the formation by the Property Partnership of, or its investment in, any corporation, partnership, joint venture, limited liability company or other entity, as otherwise permitted by the Property Partnership’s limited partnership agreement; |
| 9) | a change in the Property Partnership’s fiscal year and related changes; |
| 10) | any amendment concerning the computation or allocation of specific items of income, gain, expense or loss among the partners that, in the sole discretion of our company, is necessary or appropriate to: (i) comply with the requirements of applicable law; (ii) reflect the partners’ interests in the Property Partnership; or (iii) consistently reflect the distributions made by the Property Partnership to the partners pursuant to the terms of the limited partnership agreement of the Property Partnership; |
| 11) | any amendment that our company determines in its sole discretion to be necessary or appropriate to address any statute, rule, regulation, notice, or announcement that affects or could affect the U.S. federal income tax treatment of any allocation or distribution related to any interest of our company in the profits of the Property Partnership; or |
| 12) | any other amendments substantially similar to any of the matters described in (1) through (11) above. |
In addition, our company may make amendments to the Property Partnership’s limited partnership agreement without the approval of any limited partner if those amendments, in the discretion of our company:
| 1) | do not adversely affect the Property Partnership’s limited partners considered as a whole (including any particular class of partnership interests as compared to other classes of partnership interests) in any material respect; |
| 2) | are necessary or appropriate to satisfy any requirements, conditions or guidelines contained in any opinion, directive, order, ruling or regulation of any governmental agency or judicial authority; |
| 3) | are necessary or appropriate for any action taken by our company relating to splits or combinations of units under the provisions of the Property Partnership’s limited partnership agreement; or |
| 4) | are required to effect the intent expressed in the final registration statement and prospectus of our company filed in connection with the Spin-off or the intent of the provisions of the Property Partnership’s limited partnership agreement or are otherwise contemplated by the Property Partnership’s limited partnership agreement. |
Opinion of Counsel and Limited Partner Approval
Our company will not be required to obtain an opinion of counsel that an amendment will not result in a loss of limited liability to the limited partners if one of the amendments described above under “- No Limited Partner Approval” should occur. Any other amendment to the Property Partnership’s limited partnership agreement will only become effective either with the
- 165 -
approval of at least 90% of the Property Partnership’s units or if an opinion of counsel is obtained to effect that the amendment will not (i) cause the Property Partnership to be treated as an association taxable as a corporation or otherwise taxable as an entity for tax purposes (provided that for U.S. tax purposes our company has not made the election described below under “- Election to be Treated as a Corporation”), or (ii) affect the limited liability under the Bermuda Limited Partnership Act 1883 of any of the Property Partnership’s limited partners.
In addition to the above restrictions, any amendment that would have a material adverse effect on the rights or preferences of any type or class of partnership interests in relation to other classes of partnership interests will also require the approval of the holders of at least a majority of the outstanding partnership interests of the class so affected.
In addition, any amendment that reduces the voting percentage required to take any action must be approved by the written consent or affirmative vote of limited partners whose aggregate outstanding voting units constitute not less than the voting requirement sought to be reduced.
Sale or Other Disposition of Assets
The Property Partnership’s limited partnership agreement generally prohibits our company, without the prior approval of the holders of a majority of the units of the Property Partnership, other than Property Partnership Preferred Units, from causing the Property Partnership to, among other things, sell, exchange or otherwise dispose of all or substantially all of the Property Partnership’s assets in a single transaction or a series of related transactions, including by approving on the Property Partnership’s behalf the sale, exchange or other disposition of all or substantially all of the assets of the Property Partnership’s subsidiaries. However, our company, in its sole discretion, may mortgage, pledge, hypothecate or grant a security interest in all or substantially all of the Property Partnership’s assets (including for the benefit of persons who are not the Property Partnership or the Property Partnership’s subsidiaries) without that approval. Our company may also sell all or substantially all of the Property Partnership’s assets under any forced sale of any or all of the Property Partnership’s assets pursuant to the foreclosure or other realization upon those encumbrances without that approval.
Election to be Treated as a Corporation
If our company determines that it is no longer in the Property Partnership’s best interests to continue as a partnership for U.S. federal income tax purposes, our company may elect to treat the Property Partnership as an association or as a publicly traded partnership taxable as a corporation for U.S. federal (and applicable state) income tax purposes.
Dissolution
The Property Partnership will dissolve and its affairs will be wound up upon the earlier to occur of: (i) the service of notice by our company, with the approval of a majority of the members of the independent directors of the BPY General Partner, that in the opinion of our company the coming into force of any law, regulation or binding authority renders illegal or impracticable the continuation of the Property Partnership; (ii) the election of our company if the Property Partnership, as determined by our company, is required to register as an “investment company” under the Investment Company Act or similar legislation in other jurisdictions; (iii) the date that our company withdraws from the Property Partnership (unless a successor entity becomes the managing general partner of the Property Partnership as described below under “- Withdrawal of the Managing General Partner”); (iv) the date on which any court of competent jurisdiction enters a decree of judicial dissolution of the Property Partnership or an order to wind-up or liquidate our company without the appointment of a successor in compliance with the provisions of the Property Partnership’s limited partnership agreement that are described below under “- Withdrawal of the Managing General Partner”; and (v) the date on which our company decides to dispose of, or otherwise realize proceeds in respect of, all or substantially all of the Property Partnership’s assets in a single transaction or series of transactions.
The Property Partnership will be reconstituted and continue without dissolution if within 30 days of the date of dissolution (and provided that a notice of dissolution with respect to the Property Partnership has not been filed with the Bermuda Monetary Authority), a successor managing general partner executes a transfer deed pursuant to which the new managing general partner assumes the rights and undertakes the obligations of the original managing general partner, but only if the Property Partnership receives an opinion of counsel that the admission of the new managing general partner will not result in the loss of limited liability of any limited partner of the Property Partnership.
- 166 -
Withdrawal of the Managing General Partner
Our company may withdraw as managing general partner of the Property Partnership without first obtaining approval of unitholders of the Property Partnership by giving written notice, and that withdrawal will not constitute a violation of the limited partnership agreement.
Upon the withdrawal of our company, the holders of at least a majority of outstanding units of the Property Partnership may select a successor to that withdrawing managing general partner. If a successor is not selected, or is selected but an opinion of counsel regarding limited liability, tax matters and the Investment Company Act (and similar legislation in other jurisdictions) cannot be obtained, the Property Partnership will be dissolved, wound up and liquidated. See “- Dissolution” above.
Our company may not be removed as managing general partner by the partners of the Property Partnership.
In the event of the withdrawal of a managing general partner as a result of certain events relating to the bankruptcy, insolvency or dissolution of that managing general partner, which withdrawal will violate the Property Partnership’s limited partnership agreement, a successor managing general partner will have the option to purchase the Managing General Partner Units of the departing managing general partner for a cash payment equal to its fair market value. Under all other circumstances where a managing general partner withdraws, the departing managing general partner will have the option to require the successor managing general partner to purchase the Managing General Partner Units of the departing managing general partner for a cash payment equal to its fair market value. In each case, this fair market value will be determined by agreement between the departing managing general partner and the successor managing general partner. If no agreement is reached within 30 days of the managing general partner’s departure, an independent investment banking firm or other independent expert selected by the departing managing general partner and the successor managing general partner will determine the fair market value. If the departing managing general partner and the successor managing general partner cannot agree upon an expert within 45 days of the managing general partner’s departure, then an expert chosen by agreement of the experts selected by each of them will determine the fair market value.
If the option described above is not exercised by either the departing managing general partner or the successor managing general partner, the departing managing general partner’s Managing General Partner Units will automatically convert into units of the Property Partnership pursuant to a valuation of those interests as determined by an investment banking firm or other independent expert selected in the manner described in the preceding paragraph.
Transfer of the Managing General Partner Units
Our company may transfer all or any part of its Managing General Partner Units without first obtaining approval of any unitholder of the Property Partnership. As a condition of this transfer, the transferee must: (i) be an affiliate of the BPY General Partner (or the transfer must be made concurrently with a transfer of the GP Units to an affiliate of the transferee); (ii) agree to assume the rights and duties of the managing general partner to whose interest that transferee has succeeded; (iii) agree to assume the provisions of the Property Partnership’s limited partnership agreement; and (iv) furnish an opinion of counsel regarding limited liability, tax matters and the Investment Company Act (and similar legislation in other jurisdictions). Any transfer of the Managing General Partner Units is subject to prior notice to and approval of the relevant Bermuda regulatory authorities. At any time, the BPY General Partner may transfer all or any part of its general partnership interests in our company without the approval of our unitholders as described under Item 10.B. “Additional Information - Memorandum and Articles of Association - Description of Our LP Units, Preferred Units and Our Limited Partnership Agreement - Transfer of the General Partnership Interest”.
Transactions with Interested Parties
Our company, its affiliates and their respective partners, members, directors, officers, employees and shareholders, which we refer to as “interested parties”, may become limited partners or beneficially interested in limited partners and may hold, dispose of or otherwise deal with units of the Property Partnership with the same rights they would have if our company were not a party to the limited partnership agreement of the Property Partnership. An interested party will not be liable to account either to other interested parties or to the Property Partnership, its partners or any other persons for any profits or benefits made or derived by or in connection with any such transaction.
The limited partnership agreement of the Property Partnership permits an interested party to sell investments to, purchase assets from, vest assets in and enter into any contract, arrangement or transaction with our company, the Property Partnership, any of the Holding Entities, any operating entity or any other holding entity established by the Property Partnership and may be interested in any such contract, transaction or arrangement and shall not be liable to account either to the Property Partnership, any of the Holding Entities, any operating entity or any other holding entity established by the Property Partnership or any other
- 167 -
person in respect of any such contract, transaction or arrangement, or any benefits or profits made or derived therefrom, by virtue only of the relationship between the parties concerned, subject to the bye-laws of the BPY General Partner.
Outside Activities of the Managing General Partner
In accordance with our limited partnership agreement, our company is authorized to: (i) acquire and hold interests in the Property Partnership and, subject to the approval of the BPY General Partner, interests in any other entity; (ii) engage in any activity related to the capitalization and financing of our company’s interests in the Property Partnership and such other entities; (iii) serve as the managing general partner of the Property Partnership and execute and deliver, and perform the functions of a managing general partner specified in, the limited partnership agreement of the Property Partnership; and (iv) engage in any other activity that is incidental to or in furtherance of the foregoing and that is approved by the BPY General Partner and that lawfully may be conducted by a limited partnership organized under the Bermuda Limited Partnership Act 1883, the Bermuda Exempted Partnerships Act 1992 and our limited partnership agreement.
The Property Partnership’s limited partnership agreement provides that each person who is entitled to be indemnified by the Property Partnership, as described below under “- Indemnification; Limitations on Liability”, will have the right to engage in businesses of every type and description and other activities for profit, and to engage in and possess interests in business ventures of any and every type or description, irrespective of whether: (i) such businesses and activities are similar to our activities; or (ii) such businesses and activities directly compete with, or disfavor or exclude, the BPY General Partner, our company, the Property Partnership, any Holding Entity, any operating entity, or any other holding entity established by the Property Partnership. Such business interests, activities and engagements will be deemed not to constitute a breach of the Property Partnership’s limited partnership agreement or any duties stated or implied by law or equity, including fiduciary duties, owed to any of the BPY General Partner, our company, the Property Partnership, any Holding Entity, any operating entity, and any other holding entity established by the Property Partnership (or any of their respective investors), and shall be deemed not to be a breach of our company’s fiduciary duties or any other obligation of any type whatsoever of our company. None of the BPY General Partner, our company, the Property Partnership, any Holding Entity, operating entity, any other holding entity established by the Property Partnership or any other person shall have any rights by virtue of the Property Partnership’s limited partnership agreement or our partnership relationship established thereby or otherwise in any business ventures of any person who is entitled to be indemnified by the Property Partnership as described below under “- Indemnification; Limitations on Liability”.
Our company and the other indemnified persons described in the preceding paragraph do not have any obligation under the Property Partnership’s limited partnership agreement or as a result of any duties stated or implied by law or equity, including fiduciary duties, to present business or investment opportunities to the Property Partnership, the limited partners of the Property Partnership, any Holding Entity, operating entity, or any other holding entity established by the Property Partnership. These provisions do not affect any obligation of such indemnified person to present business or investment opportunities to our company, the Property Partnership, any Holding Entity, any operating entity or any other holding entity established by the Property Partnership pursuant to the Relationship Agreement or any separate written agreement between such persons.
Accounts, Reports and Other Information
Under the Property Partnership’s limited partnership agreement, our company is required to prepare financial statements in accordance with IFRS or such other appropriate accounting principles as determined from time to time by our company, in its sole discretion.
Our company is also required to use commercially reasonable efforts to prepare and send to the limited partners of the Property Partnership on an annual basis a Schedule K-1 (or equivalent). Our company will also, where reasonably possible, prepare and send information required by the non-U.S. limited partners of the Property Partnership for U.S. federal income tax reporting purposes.
Indemnification; Limitations on Liability
Under the Property Partnership’s limited partnership agreement, it is required to indemnify to the fullest extent permitted by law the BPY General Partner, our company and any of their respective affiliates (and their respective officers, directors, agents, shareholders, partners, members and employees), any person who serves on a governing body of the Property Partnership, a Holding Entity, operating entity or any other holding entity established by our company and any other person designated by its general partner as an indemnified person, in each case, against all losses, claims, damages, liabilities, costs or expenses (including legal fees and expenses), judgments, fines, penalties, interest, settlements and other amounts arising from any and all claims, demands, actions, suits or proceedings, incurred by an indemnified person in connection with its business, investments and activities or by reason of their holding such positions, except to the extent that the claims, liabilities, losses, damages, costs or expenses are
- 168 -
determined to have resulted from the indemnified person’s bad faith, fraud or willful misconduct, or in the case of a criminal matter, action that the indemnified person knew to have been unlawful. In addition, under the Property Partnership’s limited partnership agreement: (i) the liability of such persons has been limited to the fullest extent permitted by law, except to the extent that their conduct involves bad faith, fraud or willful misconduct, or in the case of a criminal matter, action that the indemnified person knew to have been unlawful; and (ii) any matter that is approved by the independent directors will not constitute a breach of any duties stated or implied by law or equity, including fiduciary duties. The Property Partnership’s limited partnership agreement requires it to advance funds to pay the expenses of an indemnified person in connection with a matter in which indemnification may be sought until it is determined that the indemnified person is not entitled to indemnification.
Governing Law
The Property Partnership’s limited partnership agreement is governed by and will be construed in accordance with the laws of Bermuda.
- 169 -
10.C. MATERIAL CONTRACTS
The following are the only material contracts, other than contracts entered into in the ordinary course of business, which have been entered into by us in the two years preceding the date of this Form 20-F or prior to that which remain outstanding:
| 1) | Support Agreement, dated March 19, 2014, between Brookfield Property Partners L.P. and Brookfield Office Properties Exchange LP described under Item 10.B “Additional Information - Memorandum and Articles of Association - Description of Our LP Units, Preferred Units and Our Limited Partnership Agreement”; |
| 2) | Second Amended and Restated Master Services Agreement dated August 27, 2018 by and among Brookfield Asset Management, the Service Recipients and the Service Providers described under Item 7.B. “Major Shareholders and Related Party Transactions - Related Party Transactions - Our Master Services Agreement”; |
| 3) | Relationship Agreement dated April 15, 2013 by and among Brookfield Asset Management, our company and the Service Providers and others described under Item 7.B. “Major Shareholders and Related Party Transactions - Related Party Transactions - Relationship with Brookfield - Relationship Agreement”; |
| 4) | Registration Rights Agreement dated April 10, 2013 between our company and Brookfield Asset Management described under Item 7.B. “Major Shareholders and Related Party Transactions - Related Party Transactions - Relationship with Brookfield - Registration Rights Agreement”; |
| 5) | Second Amended and Restated Limited Partnership Agreement of our partnership dated August 8, 2013 described under Item 10.B. “Additional Information - Memorandum and Articles of Association - Description of Our LP Units, Preferred Units and Our Limited Partnership Agreement”; |
| 6) | Fourth Amended and Restated Limited Partnership Agreement of the Property Partnership dated February 20, 2019 described under Item 10.B. “Additional Information - Memorandum and Articles of Association - Description of the Property Partnership Limited Partnership Agreement”; |
| 7) | Guarantee Agreement between our company and the Class A Preferred Unitholder dated December 4, 2014 described under Item 10.B. “Additional Information - Memorandum and Articles of Association - Description of the Property Partnership Limited Partnership Agreement - Class A Preferred Units”; |
| 8) | Investor Agreement between our company and the Class A Preferred Unitholder dated December 4, 2014 described under Item 10.B. “Additional Information - Memorandum and Articles of Association - Description of the Property Partnership Limited Partnership Agreement - Class A Preferred Units”; |
| 9) | Refinancing Agreement by and among our company, the Property Partnership and Brookfield Asset Management dated December 4, 2014 described under Item 7.B. “Major Shareholders and Related Party Transactions - Related Party Transactions - Relationship with Brookfield - Maturity of Class A Preferred Units”; and |
| 10) | First Amendment to the Second Amended and Restated Limited Partnership Agreement of our partnership dated November 5, 2015 described under Item 10.B. “Additional Information - Memorandum and Articles of Association - Description of Our LP Units, Preferred Units and Our Limited Partnership Agreement”; |
11) Second Amendment to the Second Amended and Restated Limited Partnership Agreement of our partnership dated March 21, 2019 described under Item 10.B. “Additional Information - Memorandum and Articles of Association - Description of Our LP Units, Preferred Units and Our Limited Partnership Agreement”;
12) Third Amendment to the Second Amended and Restated Limited Partnership Agreement of our partnership dated August 20, 2019 described under Item 10.B. “Additional Information - Memorandum and Articles of Association - Description of Our LP Units, Preferred Units and Our Limited Partnership Agreement”;
13) Fourth Amendment to the Second Amended and Restated Limited Partnership Agreement of our partnership dated February 18, 2020 described under Item 10.B. “Additional Information - Memorandum and Articles of Association - Description of Our LP Units, Preferred Units and Our Limited Partnership Agreement”;
- 170 -
14) First Amendment to the Fourth Amended and Restated Limited Partnership Agreement of the Property Partnership dated March 21, 2019 described under Item 10.B. “Additional Information - Memorandum and Articles of Association - Description of the Property Partnership Limited Partnership Agreement”;
15) Second Amendment to the Fourth Amended and Restated Limited Partnership Agreement of the Property Partnership dated April 28, 2019 described under Item 10.B. “Additional Information - Memorandum and Articles of Association - Description of the Property Partnership Limited Partnership Agreement”;
16) Third Amendment to the Fourth Amended and Restated Limited Partnership Agreement of the Property Partnership dated August 20, 2019 described under Item 10.B. “Additional Information - Memorandum and Articles of Association - Description of the Property Partnership Limited Partnership Agreement”; and
17) Fourth Amendment to the Fourth Amended and Restated Limited Partnership Agreement of the Property Partnership dated February 18, 2020 described under Item 10.B. “Additional Information - Memorandum and Articles of Association - Description of the Property Partnership Limited Partnership Agreement”.
Copies of the agreements noted above are available, free of charge, from the BPY General Partner and are available electronically on the website of the SEC at www.sec.gov and on our SEDAR profile at www.sedar.com . Written requests for such documents should be directed to our Corporate Secretary at 73 Front Street, 5th Floor, Hamilton HM 12, Bermuda.
10.D. EXCHANGE CONTROLS
There are currently no governmental laws, decrees, regulations or other legislation of Bermuda which restrict the import or export of capital or the remittance of dividends, interest or other payments to non-residents of Bermuda holding our units.
10.E. TAXATION
The following summary discusses certain material U.S. and Canadian tax considerations related to the holding and disposition of our units as of the date hereof. Prospective purchasers of our units are advised to consult their own tax advisers concerning the consequences under the tax laws of the country of which they are resident or in which they are otherwise subject to tax of making an investment in our units.
U.S. Tax Considerations
This summary discusses certain material U.S. federal income tax considerations to our unitholders relating to the receipt, holding and disposition of our units as of the date hereof. This summary is based on provisions of the U.S. Internal Revenue Code, on the regulations promulgated thereunder (the “U.S. Treasury Regulations”) and on published administrative rulings, judicial decisions, and other applicable authorities, all as in effect on the date hereof and all of which are subject to change at any time, possibly with retroactive effect. This summary is necessarily general and may not apply to all categories of investors, some of whom may be subject to special rules, including, without limitation, persons that own (directly, indirectly or constructively, applying certain attribution rules) 5% or more of our units, dealers in securities or currencies, financial institutions or financial services entities, mutual funds, life insurance companies, persons that hold our units as part of a straddle, hedge, constructive sale or conversion transaction with other investments, persons whose units are loaned to a short seller to cover a short sale of units, persons whose functional currency is not the U.S. Dollar, persons who have elected mark-to-market accounting, persons who hold our units through a partnership or other entity treated as a pass-through entity for U.S. federal income tax purposes, persons for whom our units are not a capital asset, persons who are liable for the alternative minimum tax and certain U.S. expatriates or former long-term residents of the United States. This summary does not address any tax consequences to holders of preferred units. Tax-exempt organizations are addressed separately below. The actual tax consequences of the ownership and disposition of our units will vary depending on your individual circumstances.
For purposes of this discussion, a “U.S. Holder” is a beneficial owner of one or more of our units that is for U.S. federal tax purposes: (i) an individual citizen or resident of the United States; (ii) a corporation (or other entity treated as a corporation for U.S. federal income tax purposes) created or organized in or under the laws of the United States, any state thereof or the District of Columbia; (iii) an estate the income of which is subject to U.S. federal income taxation regardless of its source; or (iv) a trust (a) that is subject to the primary supervision of a court within the United States and all substantial decisions of which one or more U.S. persons have the authority to control or (b) that has a valid election in effect under applicable U.S. Treasury Regulations to be treated as a U.S. person.
- 171 -
A “Non-U.S. Holder” is a beneficial owner of one or more of our units, other than a U.S. Holder or an entity classified as a partnership or other fiscally transparent entity for U.S. federal tax purposes.
If a partnership holds our units, the tax treatment of a partner of such partnership generally will depend upon the status of the partner and the activities of our company. Partners of partnerships that hold our units should consult their own tax advisers.
This discussion does not constitute tax advice and is not intended to be a substitute for tax planning. You should consult your own tax adviser concerning the U.S. federal, state and local income tax consequences particular to your ownership and disposition of our units, as well as any tax consequences under the laws of any other taxing jurisdiction.
Partnership Status of Our Company and the Property Partnership
Each of our company and the Property Partnership has made a protective election to be classified as a partnership for U.S. federal tax purposes. An entity that is treated as a partnership for U.S. federal tax purposes, generally incurs no U.S. federal income tax liability. Instead, each partner is required to take into account its allocable share of items of income, gain, loss, deduction, or credit of our company in computing its U.S. federal income tax liability, regardless of whether cash distributions are made. Distributions of cash by a partnership to a partner generally are not taxable unless the amount of cash distributed to a partner is in excess of the partner’s adjusted basis in its partnership interest.
An entity that would otherwise be classified as a partnership for U.S. federal income tax purposes may nonetheless be taxable as a corporation if it is a “publicly traded partnership”, unless an exception applies. Our company is publicly traded. However, an exception, referred to as the “Qualifying Income Exception”, exists with respect to a publicly traded partnership if (i) at least 90% of such partnership’s gross income for every taxable year consists of “qualifying income” and (ii) the partnership would not be required to register under the Investment Company Act if it were a U.S. corporation. Qualifying income includes certain interest income, dividends, real property rents, gains from the sale or other disposition of real property, and any gain from the sale or disposition of a capital asset or other property held for the production of income that otherwise constitutes qualifying income.
The BPY General Partner intends to manage the affairs of our company and the Property Partnership so that our company will meet the Qualifying Income Exception in each taxable year. Accordingly, the BPY General Partner believes that our company will be treated as a partnership and not as a corporation for U.S. federal income tax purposes.
If our company fails to meet the Qualifying Income Exception, other than a failure which is determined by the IRS to be inadvertent and which is cured within a reasonable time after discovery, or if our company is required to register under the Investment Company Act, our company will be treated as if it had transferred all of its assets, subject to liabilities, to a newly formed corporation, on the first day of the year in which our company fails to meet the Qualifying Income Exception, in return for stock in such corporation, and then distributed the stock to our unitholders in liquidation. This deemed contribution and liquidation could result in the recognition of gain (but not loss) to U.S. Holders, except that U.S. Holders generally would not recognize the portion of such gain attributable to stock or securities of non-U.S. corporations held by us. If, at the time of such contribution, our company were to have liabilities in excess of the tax basis of its assets, U.S. Holders generally would recognize gain in respect of such excess liabilities upon the deemed transfer. Thereafter, our company would be treated as a corporation for U.S. federal income tax purposes.
If our company were treated as a corporation in any taxable year, either as a result of a failure to meet the Qualifying Income Exception or otherwise, our company’s items of income, gain, loss, deduction, or credit would be reflected only on our company’s tax return rather than being passed through to our unitholders, and our company would be subject to U.S. corporate income tax and potentially branch profits tax with respect to its income, if any, effectively connected with a U.S. trade or business. Moreover, under certain circumstances, our company might be classified as a PFIC, for U.S. federal income tax purposes, and a U.S. Holder would be subject to the rules applicable to PFICs discussed below. See “- Consequences to U.S. Holders - Passive Foreign Investment Companies”. Subject to the PFIC rules, distributions made to U.S. Holders would be treated as taxable dividend income to the extent of our company’s current or accumulated earnings and profits. Any distribution in excess of current and accumulated earnings and profits would first be treated as a tax-free return of capital to the extent of a U.S. Holder’s adjusted tax basis in its units. Thereafter, to the extent such distribution were to exceed a U.S. Holder’s adjusted tax basis in its units, the distribution would be treated as gain from the sale or exchange of such units. The amount of a distribution treated as a dividend could be eligible for reduced rates of taxation, provided certain conditions are met. In addition, dividends, interest and certain other passive income received by our company with respect to U.S. investments generally would be subject to U.S. withholding tax at a rate of 30% (although certain Non-U.S. Holders nevertheless might be entitled to certain treaty benefits in respect of their allocable share of such income) and U.S. Holders would not be allowed a tax credit with respect to any such tax withheld. In addition, the “portfolio interest” exemption would not apply to certain interest income of our company (although certain Non-
- 172 -
U.S. Holders nevertheless might be entitled to certain treaty benefits in respect of their allocable share of such income). Depending on the circumstances, additional adverse U.S. federal income tax consequences could result under the anti-inversion rules described in Section 7874 of the U.S. Internal Revenue Code, the U.S. Treasury Regulations under Section 385 of the U.S. Internal Revenue Code, or other provisions of the U.S. Internal Revenue Code, as implemented by the U.S. Treasury Regulations and IRS administrative guidance. Based on the foregoing consequences, the treatment of our company as a corporation could materially reduce a holder’s after-tax return and therefore could result in a substantial reduction of the value of our units. If the Property Partnership were to be treated as a corporation for U.S. federal income tax purposes, consequences similar to those described above would apply.
The remainder of this summary assumes that our company and the Property Partnership will be treated as partnerships for U.S. federal tax purposes. We expect that a substantial portion of the items of income, gain, deduction, loss, or credit realized by our company will be realized in the first instance by the Property Partnership and allocated to our company for reallocation to our unitholders. Unless otherwise specified, references in this section to realization of our company’s items of income, gain, loss, deduction, or credit include a realization of such items by the Property Partnership (or other lower tier partnership) and the allocation of such items to our company.
Consequences to U.S. Holders
Holding of Our Units
Income and Loss. If you are a U.S. Holder, you will be required to take into account, as described below, your allocable share of our company’s items of income, gain, loss, deduction, and credit for each of our company’s taxable years ending with or within your taxable year. Each item generally will have the same character and source as though you had realized the item directly. You must report such items without regard to whether any distribution has been or will be received from our company. Our company intends to make cash distributions to all of our unitholders on a quarterly basis in amounts generally expected to be sufficient to permit U.S. Holders to fund their estimated U.S. tax obligations (including U.S. federal, state, and local income taxes) with respect to their allocable shares of our company’s net income or gain. However, based upon your particular tax situation and simplifying assumptions that our company will make in determining the amount of such distributions, and depending upon whether you elect to reinvest such distributions pursuant to the distribution reinvestment plan, if available, your tax liability might exceed cash distributions made to you, in which case any tax liabilities arising from your ownership of our units would need to be satisfied from your own funds.
With respect to U.S. Holders who are individuals, certain dividends paid by a corporation (including certain qualified foreign corporations) to our company and that are allocable to such U.S. Holders may qualify for reduced rates of taxation. A qualified foreign corporation includes a foreign corporation that is eligible for the benefits of specified income tax treaties with the United States. In addition, a foreign corporation is treated as a qualified corporation with respect to its shares that are readily tradable on an established securities market in the United States. Among other exceptions, U.S. Holders who are individuals will not be eligible for reduced rates of taxation on any dividends if the payer is a PFIC for the taxable year in which such dividends are paid or for the preceding taxable year. Nor will such reduced rates of taxation generally apply to dividends paid by a REIT. Dividends received by non-corporate U.S. Holders may be subject to an additional Medicare tax on unearned income of 3.8% (see “-Medicare Tax” below). U.S. Holders that are corporations generally will not be entitled to a “dividends received deduction” in respect of dividends paid by non-U.S. corporations or REITs in which our company (through the Property Partnership) owns stock. You should consult your own tax adviser regarding the application of the foregoing rules in light of your particular circumstances.
For U.S. federal income tax purposes, your allocable share of our company’s items of income, gain, loss, deduction, or credit will be governed by our limited partnership agreement if such allocations have “substantial economic effect” or are determined to be in accordance with your interest in our company. Similarly, our company’s allocable share of items of income, gain, loss, deduction, or credit of the Property Partnership will be governed by the limited partnership agreement of the Property Partnership if such allocations have “substantial economic effect” or are determined to be in accordance with our interest in the Property Partnership. The BPY General Partner believes that, for U.S. federal income tax purposes, such allocations should be given effect, and the BPY General Partner intends to prepare and file tax returns based on such allocations. If the IRS were to successfully challenge the allocations made pursuant to either our company’s limited partnership agreement or the limited partnership agreement of the Property Partnership, then the resulting allocations for U.S. federal income tax purposes might be less favorable than the allocations set forth in such agreements.
Basis. In general, you will have an initial tax basis in your units equal to the sum of (i) the amount of cash paid for our units and (ii) your share of our company’s liabilities, if any. That basis will be increased by your share of our company’s income and by increases in your share of our company’s liabilities, if any. That basis will be decreased, but not below zero, by distributions you receive from our company, by your share of our company’s losses, and by any decrease in your share of our company’s
- 173 -
liabilities. Under applicable U.S. federal income tax rules, a partner in a partnership has a single, or “unitary”, tax basis in his or her partnership interest. As a result, any amount you pay to acquire additional units (including through the distribution reinvestment plan) will be averaged with the adjusted tax basis of units owned by you prior to the acquisition of such additional units.
For purposes of the foregoing rules, the rules discussed immediately below, and the rules applicable to a sale or exchange of our units, our company’s liabilities generally will include our company’s share of any liabilities of the Property Partnership.
Limits on Deductions for Losses and Expenses. Your deduction of your allocable share of our company’s losses will be limited to your tax basis in our units and, if you are an individual or a corporate holder that is subject to the “at risk” rules, to the amount for which you are considered to be “at risk” with respect to our company’s activities, if that is less than your tax basis. In general, you will be at risk to the extent of your tax basis in our units, reduced by (i) the portion of that basis attributable to your share of our company’s liabilities for which you will not be personally liable (excluding certain qualified non-recourse financing) and (ii) any amount of money you borrow to acquire or hold our units, if the lender of those borrowed funds owns an interest in our company, is related to you, or can look only to your units for repayment. Your at-risk amount generally will increase by your allocable share of our company’s income and gain and decrease by distributions you receive from our company and your allocable share of losses and deductions. You must recapture losses deducted in previous years to the extent that distributions cause your at-risk amount to be less than zero at the end of any taxable year. Losses disallowed or recaptured as a result of these limitations will carry forward and will be allowable to the extent that your tax basis or at-risk amount, whichever is the limiting factor, subsequently increases. Upon the taxable disposition of our units, any gain recognized by you can be offset by losses that were previously suspended by the at-risk limitation, but may not be offset by losses suspended by the basis limitation. Any excess loss above the gain previously suspended by the at-risk or basis limitations may no longer be used. Under the Tax Cuts and Jobs Act, non-corporate taxpayers are not permitted to deduct “excess business losses” for taxable years beginning after December 31, 2017, and before January 1, 2026. You should consult your own tax adviser regarding the limitations on the deductibility of losses under the U.S. Internal Revenue Code.
Limitations on Deductibility of Organizational Expenses and Syndication Fees. In general, neither our company nor any U.S. Holder may deduct organizational or syndication expenses. Similar rules apply to organizational or syndication expenses incurred by the Property Partnership. Syndication fees (which would include any sales or placement fees or commissions) must be capitalized and cannot be amortized or otherwise deducted.
Limitations on Interest Deductions. Your share of our company’s interest expense, if any, is likely to be treated as “investment interest” expense. For a non-corporate U.S. Holder, the deductibility of “investment interest” expense generally is limited to the amount of such holder’s “net investment income”. Net investment income includes gross income from property held for investment and amounts treated as portfolio income under the passive loss rules, less deductible expenses, other than interest, directly connected with the production of investment income, but generally does not include gains attributable to the disposition of property held for investment. Your share of our company’s dividend and interest income will be treated as investment income, although “qualified dividend income” subject to reduced rates of tax in the hands of an individual will only be treated as investment income if such individual elects to treat such dividend as ordinary income not subject to reduced rates of tax. In addition, state and local tax laws may disallow deductions for your share of our company’s interest expense. Under Section 163(j) of the U.S. Internal Revenue Code, additional limitations may apply to a corporate U.S. Holder’s share of our company’s interest expense, if any.
Deductibility of Partnership Investment Expenditures by Individual Partners and by Trusts and Estates. Under the Tax Cuts and Jobs Act, individuals and certain estates and trusts will not be permitted to claim miscellaneous itemized deductions for taxable years beginning after December 31, 2017, and before January 1, 2026. Such miscellaneous itemized deductions may include the operating expenses of our company, including our company’s allocable share of the base management fee or any other management fees.
Treatment of Distributions
Distributions of cash by our company generally will not be taxable to you to the extent of your adjusted tax basis (described above) in our units. Any cash distributions in excess of your adjusted tax basis generally will be considered to be gain from the sale or exchange of our units (described below). Such gain generally will be treated as capital gain and will be long-term capital gain if your holding period for our units exceeds one year. A reduction in your allocable share of our liabilities, and certain distributions of marketable securities by our company, if any, will be treated similar to cash distributions for U.S. federal income tax purposes.
- 174 -
Sale or Exchange of Our Units
You will recognize gain or loss on the sale or taxable exchange of our units equal to the difference, if any, between the amount realized and your tax basis in our units sold or exchanged. Your amount realized will be measured by the sum of the cash or the fair market value of other property received plus your share of our company’s liabilities, if any.
Gain or loss recognized by you upon the sale or exchange of our units generally will be taxable as capital gain or loss and will be long-term capital gain or loss if our units were held for more than one year as of the date of such sale or exchange. Assuming you have not elected to treat your share of our company’s investment in any PFIC as a “qualified electing fund”, gain attributable to such investment in a PFIC would be taxable in the manner described below in “-Passive Foreign Investment Companies”. In addition, certain gain attributable to our investment in a CFC may be characterized as ordinary income, and certain gain attributable to “unrealized receivables” or “inventory items” could be characterized as ordinary income rather than capital gain. For example, if our company were to hold debt acquired at a market discount, accrued market discount on such debt would be treated as “unrealized receivables”. The deductibility of capital losses is subject to limitations.
Each U.S. Holder who acquires our units at different times and intends to sell all or a portion of our units within a year of the most recent purchase should consult its own tax adviser regarding the application of certain “split holding period” rules to such sale and the treatment of any gain or loss as long-term or short-term capital gain or loss.
Medicare Tax
U.S. Holders that are individuals, estates, or trusts may be required to pay a 3.8% Medicare tax on the lesser of (i) the excess of such U.S. Holders’ “modified adjusted gross income” (or “adjusted gross income” in the case of estates and trusts) over certain thresholds and (ii) such U.S. Holders’ “net investment income” (or “undistributed net investment income” in the case of estates and trusts). Net investment income generally includes your allocable share of our company’s income, as well as gain realized by you from a sale of our units. Special rules relating to the 3.8% Medicare tax may apply to dividends and gain, if any, derived by U.S. Holders with respect to our company’s interest in a PFIC or CFC. See “- Consequences to U.S. Holders - Passive Foreign Investment Companies” and “- Consequences to U.S. Holders - Controlled Foreign Corporations”. U.S. Holders should consult their own tax advisers regarding the implications of the 3.8% Medicare tax for the ownership and disposition of our units.
Foreign Tax Credit Limitations
If you are a U.S. Holder, you generally will be entitled to a foreign tax credit with respect to your allocable share of creditable foreign taxes paid on our company’s income and gain. Complex rules may, depending on your particular circumstances, limit the availability or use of foreign tax credits. Gain from the sale of our company’s investments may be treated as U.S.-source gain. Consequently, you may not be able to use the foreign tax credit arising from any foreign taxes imposed on such gain unless the credit can be applied (subject to applicable limitations) against U.S. tax due on other income treated as derived from foreign sources. Certain losses that our company incurs may be treated as foreign-source losses, which could reduce the amount of foreign tax credits otherwise available.
Deduction for Qualified Business Income
Under the Tax Cuts and Jobs Act, for taxable years beginning after December 31, 2017, and before January 1, 2026, U.S. taxpayers who have domestic “qualified business income” from a partnership generally are entitled to deduct the lesser of such qualified business income or 20% of taxable income. The 20% deduction is also allowed for “qualified publicly traded partnership income” and “qualified REIT dividends”. A U.S. Holder’s allocable share of our company’s income is not expected to be treated as qualified business income or as qualified publicly traded partnership income. However, a non-corporate U.S. Holder’s allocable share of ordinary dividends from a REIT may qualify as “qualified REIT dividends” eligible for the 20% deduction. You should consult your own tax adviser regarding the implications of the foregoing rules for an investment in our units.
Section 754 Election
Our company and the Property Partnership have each made the election permitted by Section 754 of the U.S. Internal Revenue Code (the “Section 754 Election”). The Section 754 Election cannot be revoked without the consent of the IRS. The Section 754 Election generally requires our company to adjust the tax basis in its assets, or inside basis, attributable to a transferee of our units under Section 743(b) of the U.S. Internal Revenue Code to reflect the purchase price paid by the transferee for our units. This election does not apply to a person who purchases units directly from us. For purposes of this discussion, a transferee’s inside basis in our company’s assets will be considered to have two components: (i) the transferee’s share of our company’s tax
- 175 -
basis in our company’s assets, or common basis, and (ii) the adjustment under Section 743(b) of the U.S. Internal Revenue Code to that basis. The foregoing rules would also apply to the Property Partnership.
Generally, a Section 754 Election would be advantageous to a transferee U.S. Holder if such holder’s tax basis in its units were higher than such units’ share of the aggregate tax basis of our company’s assets immediately prior to the transfer. In that case, as a result of the Section 754 Election, the transferee U.S. Holder would have a higher tax basis in its share of our company’s assets for purposes of calculating, among other items, such holder’s share of any gain or loss on a sale of our company’s assets. Conversely, a Section 754 Election would be disadvantageous to a transferee U.S. Holder if such holder’s tax basis in its units were lower than such units’ share of the aggregate tax basis of our company’s assets immediately prior to the transfer. Thus, the fair market value of our units may be affected either favorably or adversely by the election.
Whether or not the Section 754 Election is made, if our units are transferred at a time when our company has a “substantial built-in loss” in its assets, our company will be obligated to reduce the tax basis in the portion of such assets attributable to such units.
The calculations involved in the Section 754 Election are complex, and the BPY General Partner advises that it will make such calculations on the basis of assumptions as to the value of our company’s assets and other matters. Each U.S. Holder should consult its own tax adviser as to the effects of the Section 754 Election.
Uniformity of Our Units
Because we cannot match transferors and transferees of our units, we must maintain the uniformity of the economic and tax characteristics of our units to a purchaser of our units. In the absence of uniformity, we may be unable to comply fully with a number of U.S. federal income tax requirements. A lack of uniformity can result from a literal application of certain U.S. Treasury Regulations to our company’s Section 743(b) adjustments, a determination that our company’s Section 704(c) allocations are unreasonable, or other reasons. Section 704(c) allocations would be intended to reduce or eliminate the disparity between tax basis and the value of our company’s assets in certain circumstances, including on the issuance of additional units. In order to maintain the fungibility of all of our units at all times, we will seek to achieve the uniformity of U.S. tax treatment for all purchasers of our units which are acquired at the same time and price (irrespective of the identity of the particular seller of our units or the time when our units are issued by our company), through the application of certain tax accounting principles that the BPY General Partner believes are reasonable for our company. However, the IRS may disagree with us and may successfully challenge our application of such tax accounting principles. Any non-uniformity could have a negative impact on the value of our units.
Foreign Currency Gain or Loss
Our company’s functional currency is the U.S. Dollar, and our company’s income or loss is calculated in U.S. Dollars. It is likely that our company will recognize “foreign currency” gain or loss with respect to transactions involving non-U.S. Dollar currencies. In general, foreign currency gain or loss is treated as ordinary income or loss. You should consult your own tax adviser regarding the tax treatment of foreign currency gain or loss.
Passive Foreign Investment Companies
U.S. Holders may be subject to special rules applicable to indirect investments in foreign corporations, including an investment through our company in a PFIC. A PFIC is defined as any foreign corporation with respect to which (after applying certain look-through rules) either (i) 75% or more of its gross income for a taxable year is “passive income” or (ii) 50% or more of its assets in any taxable year (generally based on the quarterly average of the value of its assets) produce or are held for the production of “passive income”. There are no minimum stock ownership requirements for PFICs. If you hold an interest in a foreign corporation for any taxable year during which the corporation is classified as a PFIC with respect to you, then the corporation will continue to be classified as a PFIC with respect to you for any subsequent taxable year during which you continue to hold an interest in the corporation, even if the corporation’s income or assets would not cause it to be a PFIC in such subsequent taxable year, unless an exception applies.
Subject to certain elections described below, any gain on the disposition of stock of a PFIC owned by you indirectly through our company, as well as income realized on certain “excess distributions” by such PFIC, would be treated as though realized ratably over the shorter of your holding period of our units or our company’s holding period for the PFIC. Such gain or income generally would be taxable as ordinary income, and dividends paid by the PFIC would not be eligible for the preferential tax rates for dividends paid to non-corporate U.S. Holders. In addition, an interest charge would apply, based on the tax deemed deferred from prior years.
- 176 -
If you were to elect to treat your share of our company’s interest in a PFIC as a “qualified electing fund”, such election a “QEF Election”, for the first year you were treated as holding such interest, then in lieu of the tax consequences described in the paragraph immediately above, you would be required to include in income each year a portion of the ordinary earnings and net capital gains of the PFIC, even if not distributed to our company or to you. A QEF Election must be made by you on an entity-by-entity basis. To make a QEF Election, you must, among other things, (i) obtain a PFIC annual information statement (through an intermediary statement supplied by our company) and (ii) prepare and submit IRS Form 8621 with your annual income tax return. To the extent reasonably practicable, we intend to timely provide you with information related to the PFIC status of each entity we are able to identify as a PFIC, including information necessary to make a QEF Election with respect to each such entity. Any such election should be made for the first year our company holds an interest in such entity or for the first year in which you hold our units, if later. Under certain circumstances, we may be permitted to make a QEF Election on behalf of all U.S. Holders with respect to a PFIC held indirectly. However, no assurance can be provided that we will make any such QEF Election, if available.
Once you have made a QEF Election for an entity, such election applies to any additional shares of interest in such entity acquired directly or indirectly, including through additional units acquired after the QEF Election is made (such as units acquired under the distribution reinvestment plan, if available). If you were to make a QEF Election after the first year that you were treated as holding an interest in a PFIC, the adverse tax consequences relating to PFIC stock would continue to apply with respect to the pre-QEF Election period, unless you were to make a “purging election”. The purging election would create a deemed sale of your previously held share of our company’s interests in a PFIC. The gain recognized by the purging election would be subject to the special tax and interest charge rules, which treat the gain as an excess distribution, as described above. As a result of the purging election, you would have a new basis and holding period in your share of our company’s interests in the PFIC. U.S. Holders should consult their own tax advisers as to the manner in which such direct inclusions could affect their allocable share of our company’s income and their tax basis in our units and the advisability of making a QEF Election or a purging election.
U.S. Treasury Regulations under Section 1411 of the U.S. Internal Revenue Code contain special rules for applying the 3.8% Medicare tax (as described above under “- Medicare Tax”) to U.S. persons owning an interest in a PFIC. Under the special rules, if you are a non-corporate U.S. Holder that has made a QEF Election with respect to our company’s interest in a PFIC, then you are permitted to make a special election to treat your share of the ordinary earnings and net capital gains of the PFIC as net investment income for purposes of the 3.8% Medicare tax. If you do not make the special election, you may be required to calculate your basis in our units for purposes of the 3.8% Medicare tax in a manner that differs from the calculation of your basis in our units for U.S. federal income tax purposes generally. You should consult your own tax adviser regarding the implications of the special election, as well as the other implications of the 3.8% Medicare tax and the U.S. Treasury Regulations under Section 1411 of the U.S. Internal Revenue Code for your ownership and disposition of our units.
In the case of a PFIC that is a publicly traded foreign company, and in lieu of making a QEF Election, an election may be made to “mark to market” the stock of such publicly traded foreign company on an annual basis. Pursuant to such an election, you would include in each year as ordinary income the excess, if any, of the fair market value of such stock over its adjusted basis at the end of the taxable year. No assurance can be provided that any of our existing or future Holding Entities or operating entities will qualify as PFICs that are publicly traded or that a mark-to-market election will be available for any such entity. You should consult your own tax adviser regarding the availability of the mark-to-market election with respect to any PFIC in which you are treated as owning an interest through our company.
Based on our organizational structure, as well as our company’s expected income and assets, the BPY General Partner currently believes that one or more of our existing Holding Entities and operating entities are likely to be classified as PFICs. Moreover, we may in the future acquire certain investments or operating entities through one or more Holding Entities treated as corporations for U.S. federal income tax purposes, and such future Holding Entities or other companies in which we acquire an interest may be treated as PFICs. In addition, in order to ensure that we satisfy the Qualifying Income Exception, among other reasons, we may decide to hold an existing or future operating entity through a Holding Entity that would be classified as a PFIC. See “-Investment Structure” below.
Subject to certain exceptions, a U.S. person who directly or indirectly owns an interest in a PFIC generally is required to file an annual report with the IRS, and the failure to file such report could result in the imposition of penalties on such U.S. person and in the extension of the statute of limitations with respect to federal income tax returns filed by such U.S. person. The application of the PFIC rules to U.S. Holders is uncertain in certain respects, and the PFIC rules remain subject to recently proposed U.S. Treasury Regulations yet to be made final. You should consult your own tax adviser regarding the PFIC rules, including the foregoing filing requirements and the recently proposed U.S. Treasury Regulations, as well as the advisability of making a QEF Election, a special election under the U.S. Treasury Regulations under Section 1411 of the U.S. Internal Revenue Code, or a mark-to-market election, as applicable, with respect to any PFIC in which you are treated as owning an interest through our company.
- 177 -
Controlled Foreign Corporations
A non-U.S. entity will be treated as a CFC if it is treated as a corporation for U.S. federal income tax purposes and more than 50% of (i) the total combined voting power of all classes of stock of the non-U.S. entity entitled to vote or (ii) the total value of the stock of the non-U.S. entity is owned by U.S. Shareholders on any day during the taxable year of such non-U.S. entity. For this purpose, a “U.S. Shareholder” with respect to a non-U.S. entity means a U.S. person (including a U.S. partnership) that owns (directly, indirectly or constructively) 10% or more of the total combined voting power of all classes of stock of the non-U.S. entity entitled to vote or 10% or more of the total value of shares of all classes of stock of the non-U.S. entity.
If a U.S. partnership in which we own an interest is a U.S. Shareholder of a CFC, then a U.S. Holder may be required to include in income its allocable share of the CFC’s “Subpart F” income. Subpart F income generally includes dividends, interest, net gain from the sale or disposition of securities, non-actively managed rents, and certain other generally passive types of income. The aggregate Subpart F income inclusions in any taxable year relating to a particular CFC are limited to such CFC’s current earnings and profits. Such inclusions will be treated as ordinary income (whether or not such inclusions are attributable to net capital gains). Thus, a U.S. Holder may be required to report as ordinary income its allocable share of the CFC’s Subpart F income without corresponding receipts of cash and may not benefit from capital gain treatment with respect to the portion of any earnings attributable to net capital gains of the CFC.
Your tax basis in your units will be increased to reflect any required Subpart F income. Such income will be treated as income from sources within the United States, for certain foreign tax credit purposes, to the extent derived by the CFC from U.S. sources. Subpart F income will not be eligible for the reduced rate of tax applicable to certain dividends paid by qualified foreign corporations to individual U.S. persons. See above under “- Consequences to U.S. Holders - Holding of Our Units - Income and Loss”. Amounts included as Subpart F income with respect to direct and indirect investments generally will not be taxable again when actually distributed by the CFC.
Whether or not any CFC has Subpart F income, any gain allocated to you from our disposition of an equity interest in a CFC will be treated as dividend income to the extent of your allocable share of the current and/or accumulated earnings and profits of the CFC. In this regard, earnings would not include any amounts previously taxed pursuant to the CFC rules. However, net losses (if any) of a CFC will not pass through to U.S. Holders.
As described above under “- Consequences to U.S. Holders - Passive Foreign Investment Companies”, U.S. Treasury Regulations under Section 1411 of the U.S. Internal Revenue Code contain special rules for applying the 3.8% Medicare tax to U.S. persons owning an interest in a PFIC. Similar rules apply to U.S. Shareholders of a CFC. You should consult your own tax adviser regarding the implications of these special rules.
If a non-U.S. entity held by us through a U.S. partnership (treated as a U.S. Shareholder of such non-U.S. entity) is classified as both a CFC and a PFIC, then you will be required to include amounts in income with respect to such non-U.S. entity either under the CFC rules described under this subheading, or under the PFIC rules described under “- Consequences to U.S. Holders - Passive Foreign Investment Companies”, but not both. The interaction of these rules is complex, and you should consult your own tax adviser in this regard.
Based on our organizational structure, the BPY General Partner currently believes that one or more of our existing Holding Entities and operating entities are likely to be classified as CFCs. Moreover, we may in the future acquire certain investments or operating entities through one or more Holding Entities treated as corporations for U.S. federal income tax purposes, and such future Holding Entities or other companies in which we acquire an interest may be treated as CFCs. The application of the CFC rules to U.S. Holders is uncertain in certain respects, and the CFC rules, as amended by the Tax Cuts and Jobs Act, remain subject to proposed U.S. Treasury Regulations yet to be made final, as well as other guidance yet to be issued. Specifically, under recently proposed U.S. Treasury Regulations on which we may be permitted to rely, only U.S. Holders that are U.S. Shareholders would be required to include in income their allocable shares of a CFC’s Subpart F income. You should consult your own tax adviser regarding the implications of the CFC rules for your ownership and disposition of our units.
Investment Structure
To ensure that our company meets the Qualifying Income Exception for publicly traded partnerships (discussed above) and complies with certain requirements in its limited partnership agreement, among other reasons, we may structure certain investments through an entity classified as a corporation for U.S. federal income tax purposes. Such investments will be structured as determined in the sole discretion of the BPY General Partner generally to be efficient for our unitholders. However, because our unitholders will be located in numerous taxing jurisdictions, no assurance can be given that any such investment structure will
- 178 -
benefit all our unitholders to the same extent, and such an investment structure might even result in additional tax burdens on some unitholders. As discussed above, if any such entity were a non-U.S. corporation, it might be considered a PFIC or CFC. If any such entity were a U.S. corporation, it would be subject to U.S. federal net income tax on its income, including any gain recognized on the disposition of its investments. In addition, if the investment were to involve U.S. real property, gain recognized on the disposition of the investment by a corporation generally would be subject to corporate level tax, whether the corporation were a U.S. or a non-U.S. corporation.
U.S. Withholding Taxes
Although each U.S. Holder is required to provide us with an IRS Form W-9, we nevertheless may be unable to accurately or timely determine the tax status of our unitholders for purposes of determining whether U.S. withholding applies to payments made by our company to some or all of our unitholders. In such a case, payments made by our company to U.S. Holders might be subject to U.S. “backup” withholding at the applicable rate or other U.S. withholding taxes. You would be able to treat as a credit your allocable share of any U.S. withholding taxes paid in the taxable year in which such withholding taxes were paid and, as a result, you might be entitled to a refund of such taxes from the IRS. In the event you transfer or otherwise dispose of some or all of your units, special rules might apply for purposes of determining whether you or the transferee of such units were subject to U.S. withholding taxes in respect of income allocable to, or distributions made on account of, such units or entitled to refunds of any such taxes withheld. See below “Administrative Matters-Certain Effects of a Transfer of Units”. You should consult your own tax adviser regarding the treatment of U.S. withholding taxes.
Transferor/Transferee Allocations
Our company may allocate items of income, gain, loss, and deduction using a monthly convention, whereby any such items recognized in a given month by our company are allocated to our unitholders as of a specified date of such month. As a result, if you transfer your units, you might be allocated income, gain, loss, and deduction realized by our company after the date of the transfer. Similarly, if you acquire additional units, you might be allocated income, gain, loss, and deduction realized by our company prior to your ownership of such units.
Section 706 of the U.S. Internal Revenue Code generally governs allocations of items of partnership income and deductions between transferors and transferees of partnership interests, and the U.S. Treasury Regulations provide a safe harbor allowing a publicly traded partnership to use a monthly simplifying convention for such purposes. However, it is not clear that our company’s allocation method complies with the requirements. If our company’s convention were not permitted, the IRS might contend that our company’s taxable income or losses must be reallocated among our unitholders. If such a contention were sustained, your tax liabilities might be adjusted to your detriment. The BPY General Partner is authorized to revise our company’s method of allocation between transferors and transferees (as well as among investors whose interests otherwise vary during a taxable period).
U.S. Federal Estate Tax Consequences
If our units are included in the gross estate of a U.S. citizen or resident for U.S. federal estate tax purposes, then a U.S. federal estate tax might be payable in connection with the death of such person. Individual U.S. Holders should consult their own tax advisers concerning the potential U.S. federal estate tax consequences with respect to our units.
Certain Reporting Requirements
A U.S. Holder who invests more than $100,000 in our company may be required to file IRS Form 8865 reporting the investment with such U.S. Holder’s U.S. federal income tax return for the year that includes the date of the investment. You may be subject to substantial penalties if you fail to comply with this and other information reporting requirements with respect to an investment in our units. You should consult your own tax adviser regarding such reporting requirements.
U.S. Taxation of Tax-Exempt U.S. Holders of Our Units
Income recognized by a U.S. tax-exempt organization is exempt from U.S. federal income tax except to the extent of the organization’s UBTI. UBTI is defined generally as any gross income derived by a tax-exempt organization from an unrelated trade or business that it regularly carries on, less the deductions directly connected with that trade or business. In addition, income arising from a partnership (or other entity treated as a partnership for U.S. federal income tax purposes) that holds operating assets or is otherwise engaged in a trade or business generally will constitute UBTI. Notwithstanding the foregoing, UBTI generally does not include any dividend income, interest income, certain other categories of passive income, or capital gains realized by a tax-exempt organization, so long as such income is not “debt-financed”, as discussed below. The BPY General Partner currently
- 179 -
believes that our company should not be regarded as engaged in a trade or business, and anticipates that any operating assets held by our company will be held through entities that are treated as corporations for U.S. federal income tax purposes.
The exclusion from UBTI does not apply to income from “debt-financed property”, which is treated as UBTI to the extent of the percentage of such income that the average acquisition indebtedness with respect to the property bears to the average tax basis of the property for the taxable year. If an entity treated as a partnership for U.S. federal income tax purposes incurs acquisition indebtedness, a tax-exempt partner in such partnership will be deemed to have acquisition indebtedness equal to its allocable portion of such acquisition indebtedness. If any such indebtedness were used by our company or by the Property Partnership to acquire property, such property generally would constitute debt-financed property, and any income from or gain from the disposition of such debt-financed property allocated to a tax-exempt organization generally would constitute UBTI to such tax-exempt organization. In addition, even if such indebtedness were not used either by our company or by the Property Partnership to acquire property but were instead used to fund distributions to our unitholders, if a tax-exempt organization subject to taxation in the United States were to use such proceeds to make an investment outside our company, the IRS might assert that such investment constitutes debt-financed property to such unitholder with the consequences noted above. The BPY General Partner does not expect our company or the Property Partnership to directly incur debt to acquire property, and the BPY General Partner does not believe that our company or the Property Partnership will generate UBTI attributable to debt-financed property in the future. Moreover, the BPY General Partner intends to use commercially reasonable efforts to structure the activities of our company and the Property Partnership, respectively, to avoid generating UBTI. However, neither our company nor the Property Partnership is prohibited from incurring indebtedness, and no assurance can be provided that neither our company nor the Property Partnership will generate UBTI attributable to debt-financed property in the future.
Tax-exempt organizations will be subject to special rules applicable to an indirect investment by our company in a REIT. Based upon an IRS ruling, distributions paid by a REIT to our company and allocated to a tax-exempt organization generally should not give rise to UBTI, provided that (i) our interest in the REIT is not debt-financed, (ii) the tax-exempt organization’s interest in our company is not debt-financed and is not used in an unrelated trade or business, and (iii) the REIT does not hold an asset, such as an interest in a “taxable mortgage pool” or a residual interest in a “real estate mortgage investment conduit”, that gives rise to “excess inclusion income”. Special rules apply to social clubs, voluntary employee benefit associations, supplemental unemployment benefit trusts, and qualified group legal services plans exempt from federal income taxation under Sections 501(c)(7), (c)(9), (c)(17), and (c)(20) of the U.S. Internal Revenue Code.
Tax-exempt U.S. Holders should consult their own tax advisers regarding the tax consequences of an investment in our units.
Consequences to Non-U.S. Holders
Based on our organizational structure, as well as our company’s expected income and assets, the BPY General Partner currently believes that our company is unlikely to earn income treated as effectively connected with a U.S. trade or business, including effectively connected income attributable to the sale of a “United States real property interest”, as defined in the U.S. Internal Revenue Code. Specifically, our company intends not to make an investment, whether directly or through an entity which would be treated as a partnership for U.S. federal income tax purposes, if the BPY General Partner believes at the time of such investment that such investment would generate income treated as effectively connected with a U.S. trade or business. If, as anticipated, our company is not treated as engaged in a U.S. trade or business or as deriving income which is treated as effectively connected with a U.S. trade or business, and provided that a Non-U.S. Holder is not itself engaged in a U.S. trade or business, then such Non-U.S. Holder generally will not be subject to U.S. tax return filing requirements solely as a result of owning our units and generally will not be subject to U.S. federal income tax on its allocable share of our company’s interest and dividends from non-U.S.-sources or gain from the sale or other disposition of securities or real property located outside of the United States.
However, there can be no assurance that the law will not change or that the IRS will not deem our company to be engaged in a U.S. trade or business. If, contrary to the BPY General Partner’s expectations, our company is treated as engaged in a U.S. trade or business, then a Non-U.S. Holder generally would be required to file a U.S. federal income tax return, even if no effectively connected income were allocable to it. If our company were to have income treated as effectively connected with a U.S. trade or business, then a Non-U.S. Holder would be required to report that income and would be subject to U.S. federal income tax at the regular graduated rates. In addition, our company might be required to withhold U.S. federal income tax on such Non-U.S. Holder’s distributive share of such income. A corporate Non-U.S. Holder might also be subject to branch profits tax at a rate of 30%, or at a lower treaty rate, if applicable. If, contrary to expectation, our company were engaged in a U.S. trade or business, then gain or loss from the sale of our units by a Non-U.S. Holder would be treated as effectively connected with such trade or business to the extent that such Non-U.S. Holder would have had effectively connected gain or loss had our company sold all of its assets at their fair market value as of the date of such sale. In such case, any such effectively connected gain generally would be taxable at the regular graduated U.S. federal income tax rates, and the amount realized from such sale generally would be subject to a 10% U.S.
- 180 -
federal withholding tax. The 10% U.S. federal withholding tax temporarily is suspended with respect to the disposition of an interest in a publicly traded partnership until proposed U.S. Treasury Regulations or other guidance has been made final.
In general, even if our company is not engaged in a U.S. trade or business, and assuming you are not otherwise engaged in a U.S. trade or business, you will nonetheless be subject to a withholding tax of 30% on the gross amount of certain U.S.-source income which is not effectively connected with a U.S. trade or business. Income subjected to such a flat tax rate is income of a fixed or determinable annual or periodic nature, including dividends and certain interest income. Such withholding tax may be reduced or eliminated with respect to certain types of income under an applicable income tax treaty between the United States and your country of residence or under the “portfolio interest” rules or other provisions of the U.S. Internal Revenue Code, provided that you provide proper certification as to your eligibility for such treatment. Notwithstanding the foregoing, and although each Non-U.S. Holder is required to provide us with an IRS Form W-8, we nevertheless may be unable to accurately or timely determine the tax status of our investors for purposes of establishing whether reduced rates of withholding apply to some or all of our investors. In such a case, your allocable share of distributions of U.S.-source dividends and interest income will be subject to U.S. withholding tax at a rate of 30%. Further, if you would not be subject to U.S. tax based on your tax status or otherwise were eligible for a reduced rate of U.S. withholding, you might need to take additional steps to receive a credit or refund of any excess withholding tax paid on your account, which could include the filing of a non-resident U.S. income tax return with the IRS. Among other limitations applicable to claiming treaty benefits, if you reside in a treaty jurisdiction which does not treat our company as a pass-through entity, you might not be eligible to receive a refund or credit of excess U.S. withholding taxes paid on your account. In the event you transfer or otherwise dispose of some or all of your units, special rules may apply for purposes of determining whether you or the transferee of such units are subject to U.S. withholding taxes in respect of income allocable to, or distributions made on account of, such units or entitled to refunds of any such taxes withheld. See “-Administrative Matters-Certain Effects of a Transfer of Units”. You should consult your own tax adviser regarding the treatment of U.S. withholding taxes.
Special rules may apply to any Non-U.S. Holder (i) that has an office or fixed place of business in the United States; (ii) that is present in the United States for 183 days or more in a taxable year; or (iii) that is (a) a former citizen or long-term resident of the United States, (b) a foreign insurance company that is treated as holding a partnership interest in our company in connection with its U.S. business, (c) a PFIC, (d) a CFC or (e) a corporation that accumulates earnings to avoid U.S. federal income tax. You should consult your own tax adviser regarding the application of these special rules.
Taxes in Other Jurisdictions
Based on our expected method of operation and the ownership of our operating entities indirectly through corporate Holding Entities, we do not expect any unitholder, solely as a result of owning our units, to be subject to any additional income taxes imposed on a net basis or additional tax return filing requirements in any jurisdiction in which we conduct activities or own property. However, our method of operation and current structure may change, and there can be no assurance that, solely as a result of owning our units, you will not be subject to certain taxes, including non-U.S., state and local income taxes, unincorporated business taxes and estate, inheritance or intangible taxes imposed by the various jurisdictions in which we do business or own property now or in the future, even if you do not reside in any of these jurisdictions. Consequently, you may also be required to file non-U.S., state and local income tax returns in some or all of these jurisdictions. Further, you may be subject to penalties for failure to comply with these requirements. It is your responsibility to file all U.S. federal, state, local, and non-U.S. tax returns that may be required of you.
Income or gain from investments held by our company may be subject to withholding or other taxes in jurisdictions outside the United States, except to the extent an income tax treaty applies. If you wish to claim the benefit of an applicable income tax treaty, you might be required to submit information to one or more of our company, an intermediary, or a tax authority in such jurisdiction. You should consult your own tax adviser regarding the U.S. federal, state, local, and non-U.S. tax consequences of an investment in our company.
Administrative Matters
Information Returns and Audit Procedures
We have agreed to use commercially reasonable efforts to furnish to you, within 90 days after the close of each calendar year, U.S. tax information (including IRS Schedule K-1), which describes on a U.S. Dollar basis your share of our company’s income, gain, loss, and deduction for our preceding taxable year. However, providing this U.S. tax information to our unitholders will be subject to delay in the event of, among other reasons, the late receipt of any necessary tax information from lower-tier entities. It is therefore possible that, in any taxable year, you will need to apply for an extension of time to file your tax returns. In preparing this U.S. tax information, we will use various accounting and reporting conventions, some of which have been
- 181 -
mentioned in the previous discussion, to determine your share of income, gain, loss, and deduction. The IRS may successfully contend that certain of these reporting conventions are impermissible, which could result in an adjustment to your income or loss.
Our company may be audited by the IRS. Adjustments resulting from an IRS audit could require you to adjust a prior year’s tax liability and result in an audit of your own tax return. Any audit of your tax return could result in adjustments not related to our company’s tax returns, as well as those related to our company’s tax returns. For taxable years beginning after December 31, 2017, if the IRS makes an audit adjustment to our income tax returns, it may assess and collect any taxes (including penalties and interest) resulting from such audit adjustment directly from our company instead of unitholders (as under prior law). We may be permitted to elect to have the BPY General Partner and our unitholders take such audit adjustment into account in accordance with their interests in us during the taxable year under audit. However, there can be no assurance that we will choose to make such election or that it will be available in all circumstances. If we do not make the election, and we pay taxes, penalties, or interest as a result of an audit adjustment, then cash available for distribution to our unitholders might be substantially reduced. As a result, our current unitholders might bear some or all of the cost of the tax liability resulting from such audit adjustment, even if our current unitholders did not own our units during the taxable year under audit. The foregoing considerations also apply with respect to our company’s interest in the Property Partnership.
For taxable years beginning on or before December 31, 2017, the BPY General Partner will act as our company’s “tax matters partner.” As the tax matters partner, the BPY General Partner will have the authority, subject to certain restrictions, to act on behalf of our company in connection with any administrative or judicial review of our company’s items of income, gain, loss, deduction, or credit. For taxable years beginning after December 31, 2017, a “partnership representative” designated by our company will have the sole authority to act on behalf of our company in connection with such administrative or judicial review. In particular, our partnership representative will have the sole authority to bind both our former and current unitholders and to make certain elections on behalf of our company pursuant to the partnership audit rules.
The application of the partnership audit rules to our company and our unitholders is uncertain. You should consult your own tax adviser regarding the implications of the partnership audit rules for an investment in our units.
Tax Shelter Regulations and Related Reporting Requirements
If we were to engage in a “reportable transaction”, we (and possibly our unitholders) would be required to make a detailed disclosure of the transaction to the IRS in accordance with regulations governing tax shelters and other potentially tax-motivated transactions. A transaction may be a reportable transaction based upon any of several factors, including the fact that it is a type of tax avoidance transaction publicly identified by the IRS as a “listed transaction” or “transaction of interest”, or that it produces certain kinds of losses exceeding certain thresholds. An investment in our company may be considered a “reportable transaction” if, for example, our company were to recognize certain significant losses in the future. In certain circumstances, a unitholder who disposes of an interest in a transaction resulting in the recognition by such holder of significant losses in excess of certain threshold amounts may be obligated to disclose its participation in such transaction. Certain of these rules are unclear, and the scope of reportable transactions can change retroactively. Therefore, it is possible that the rules may apply to transactions other than significant loss transactions.
Moreover, if we were to participate in a reportable transaction with a significant purpose to avoid or evade tax, or in any listed transaction, you might be subject to significant accuracy related penalties with a broad scope, for those persons otherwise entitled to deduct interest on federal tax deficiencies, non-deductibility of interest on any resulting tax liability, and in the case of a listed transaction, an extended statute of limitations. We do not intend to participate in any reportable transaction with a significant purpose to avoid or evade tax, nor do we intend to participate in any listed transactions. However, no assurance can be provided that the IRS will not assert that we have participated in such a transaction.
You should consult your own tax adviser concerning any possible disclosure obligation under the regulations governing tax shelters with respect to the disposition of our units.
Taxable Year
Our company uses the calendar year as its taxable year for U.S. federal income tax purposes. Under certain circumstances which we currently believe are unlikely to apply, a taxable year other than the calendar year may be required for such purposes.
Withholding and Backup Withholding
For each calendar year, we will report to you and to the IRS the amount of distributions that we pay, and the amount of tax (if any) that we withhold on these distributions. The proper application to our company of the rules for withholding under
- 182 -
Sections 1441 through 1446 of the U.S. Internal Revenue Code (applicable to certain dividends, interest, and amounts treated as effectively connected with a U.S. trade or business, among other items) is unclear. Because the documentation we receive may not properly reflect the identities of our unitholders at any particular time (in light of possible sales of our units), we may over-withhold or under-withhold with respect to a particular unitholder. For example, we may impose withholding, remit such amount to the IRS and thus reduce the amount of a distribution paid to a Non-U.S. Holder. It may be the case, however, that the corresponding amount of our income was not properly allocable to such holder, and the appropriate amount of withholding should have been less than the actual amount withheld. Such Non-U.S. Holder would be entitled to a credit against the holder’s U.S. federal income tax liability for all withholding, including any such excess withholding. However, if the withheld amount were to exceed the holder’s U.S. federal income tax liability, the holder would need to apply for a refund to obtain the benefit of such excess withholding. Similarly, we may fail to withhold on a distribution, and it may be the case that the corresponding income was properly allocable to a Non-U.S. Holder and that withholding should have been imposed. In such case, we intend to pay the under-withheld amount to the IRS, and we may treat such under-withholding as an expense that will be borne indirectly by all unitholders on a pro rata basis (since we may be unable to allocate any such excess withholding tax cost to the relevant Non-U.S. Holder).
Under the backup withholding rules, you may be subject to backup withholding tax with respect to distributions paid unless: (i) you are an exempt recipient and demonstrate this fact when required; or (ii) provide a taxpayer identification number, certify as to no loss of exemption from backup withholding tax, and otherwise comply with the applicable requirements of the backup withholding tax rules. A U.S. Holder that is exempt should certify such status on a properly completed IRS Form W-9. A Non-U.S. Holder may qualify as an exempt recipient by submitting a properly completed IRS Form W-8. Backup withholding is not an additional tax. The amount of any backup withholding from a payment to you will be allowed as a credit against your U.S. federal income tax liability and may entitle you to a refund from the IRS, provided you supply the required information to the IRS in a timely manner.
If you do not timely provide our company, or the applicable nominee, broker, clearing agent, or other intermediary, with IRS Form W-9 or IRS Form W-8, as applicable, or such form is not properly completed, then our company may become subject to U.S. backup withholding taxes in excess of what would have been imposed had our company or the applicable intermediary received properly completed forms from all of our unitholders. For administrative reasons, and in order to maintain the fungibility of our units, such excess U.S. backup withholding taxes, and if necessary similar items, may be treated by our company as an expense that will be borne indirectly by all unitholders on a pro rata basis (e.g., since it may be impractical for us to allocate any such excess withholding tax cost to the unitholders that failed to timely provide the proper U.S. tax forms).
Foreign Account Tax Compliance
FATCA imposes a 30% withholding tax on “withholdable payments” made to a “foreign financial institution” or a “non-financial foreign entity”, unless such financial institution or entity satisfies certain information reporting or other requirements. Withholdable payments include certain U.S.-source income, such as interest, dividends, and other passive income. Recently proposed U.S. Treasury Regulations eliminate the requirement to withhold tax under FATCA on gross proceeds from the sale or disposition of property that can produce U.S.-source interest or dividends. The IRS has announced that taxpayers are permitted to rely on the proposed regulations until final U.S. Treasury Regulations are issued.
We intend to comply with FATCA, so as to ensure that the 30% withholding tax does not apply to any withholdable payments received by our company, the Property Partnership, the Holding Entities, or the operating entities. Nonetheless, the 30% withholding tax may apply to your allocable share of distributions attributable to withholdable payments, unless you properly certify your FATCA status on IRS Form W-8 or IRS Form W-9 (or other applicable form) and satisfy any additional requirements under FATCA.
In compliance with FATCA, information regarding certain unitholders’ ownership of our units may be reported to the IRS or to a non-U.S. governmental authority. FATCA remains subject to modification by an applicable intergovernmental agreement between the United States and another country, such as the agreement in effect between the United States and Bermuda for cooperation to facilitate the implementation of FATCA, or by future U.S. Treasury Regulations or guidance. You should consult your own tax adviser regarding the consequences under FATCA of an investment in our units.
Information Reporting with Respect to Foreign Financial Assets
Under U.S. Treasury Regulations, certain U.S. persons that own “specified foreign financial assets” with an aggregate fair market value exceeding either $50,000 on the last day of the taxable year or $75,000 at any time during the taxable year generally are required to file an information report with respect to such assets with their tax returns. Significant penalties may apply to persons who fail to comply with these rules. Specified foreign financial assets include not only financial accounts maintained in foreign financial institutions, but also, unless held in accounts maintained by a financial institution, any stock or
- 183 -
security issued by a non-U.S. person, any financial instrument or contract held for investment that has an issuer or counterparty other than a U.S. person, and any interest in a foreign entity. The failure to report information required under the current regulations could result in substantial penalties and in the extension of the statute of limitations with respect to federal income tax returns filed by you. You should consult your own tax adviser regarding the possible implications of these U.S. Treasury Regulations for an investment in our units.
Certain Effects of a Transfer of Units
Our company may allocate items of income, gain, loss, deduction, and credit using a monthly convention, whereby any such items recognized in a given month by our company are allocated to our unitholders as of a specified date of such month. Any U.S. withholding taxes applicable to dividends received by the Property Partnership (and, in turn, our company) generally will be withheld by our company only when such dividends are paid. Because our company generally intends to distribute amounts received in respect of dividends shortly after receipt of such amounts, it is generally expected that any U.S. withholding taxes withheld by our company on such amounts will correspond to our unitholders who were allocated income and who received the distributions in respect of such amounts. The Property Partnership may invest in debt obligations or other securities for which the accrual of interest or income thereon is not matched by a contemporaneous receipt of cash. Any such accrued interest or other income would be allocated pursuant to such monthly convention. Consequently, our unitholders may recognize income in excess of cash distributions received from our company, and any income so included by a unitholder would increase the basis such unitholder has in our units and would offset any gain (or increase the amount of loss) realized by such unitholder on a subsequent disposition of its units. In addition, U.S. withholding taxes generally would be withheld by our company only on the payment of cash in respect of such accrued interest or other income, and, therefore, it is possible that some unitholders would be allocated income which might be distributed to a subsequent unitholder, and such subsequent unitholder would be subject to withholding at the time of distribution. As a result, the subsequent unitholder, and not the unitholder who was allocated income, would be entitled to claim any available credit with respect to such withholding.
The Property Partnership has invested and will continue to invest in certain Holding Entities and operating entities organized in non-U.S. jurisdictions, and income and gain from such investments may be subject to withholding and other taxes in such jurisdictions. If any such non-U.S. taxes were imposed on income allocable to a U.S. Holder, and such holder were thereafter to dispose of its units prior to the date distributions were made in respect of such income, under applicable provisions of the U.S. Internal Revenue Code and U.S. Treasury Regulations, the unitholder to whom such income was allocated (and not the unitholder to whom distributions were ultimately made) would, subject to other applicable limitations, be the party permitted to claim a credit for such non-U.S. taxes for U.S. federal income tax purposes. Thus a unitholder may be affected either favorably or adversely by the foregoing rules. Complex rules may, depending on a unitholder’s particular circumstances, limit the availability or use of foreign tax credits, and you are urged to consult your own tax adviser regarding all aspects of foreign tax credits.
Nominee Reporting
Persons who hold an interest in our company as a nominee for another person may be required to furnish to us:
| a) | the name, address and taxpayer identification number of the beneficial owner and the nominee; |
| b) | whether the beneficial owner is (1) a person that is not a U.S. person, (2) a foreign government, an international organization, or any wholly owned agency or instrumentality of either of the foregoing, or (3) a tax-exempt entity; |
| c) | the amount and description of units held, acquired, or transferred for the beneficial owner; and |
| d) | specific information including the dates of acquisitions and transfers, means of acquisitions and transfers, and acquisition cost for purchases, as well as the amount of net proceeds from sales. |
Brokers and financial institutions may be required to furnish additional information, including whether they are U.S. persons and specific information on units they acquire, hold, or transfer for their own account. A penalty of $250 per failure (as adjusted for inflation), up to a maximum of $3,000,000 per calendar year (as adjusted for inflation), generally is imposed by the U.S. Internal Revenue Code for the failure to report such information to us. The nominee is required to supply the beneficial owner of our units with the information furnished to us.
New Legislation or Administrative or Judicial Action
The U.S. federal income tax treatment of our unitholders depends, in some instances, on determinations of fact and interpretations of complex provisions of U.S. federal income tax law for which no clear precedent or authority may be available. You should be aware that the U.S. federal income tax rules, particularly those applicable to partnerships, are constantly under review (including currently) by the Congressional tax-writing committees and other persons involved in the legislative process, the IRS, the U.S. Treasury Department and the courts, frequently resulting in revised interpretations of established concepts,
- 184 -
statutory changes, revisions to regulations and other modifications and interpretations, any of which could adversely affect the value of our units and be effective on a retroactive basis. For example, changes to the U.S. federal tax laws and interpretations thereof could make it more difficult or impossible for our company to be treated as a partnership that is not taxable as a corporation for U.S. federal income tax purposes, change the character or treatment of portions of our company’s income, reduce the net amount of distributions available to our unitholders, or otherwise affect the tax considerations of owning our units. Such changes could also affect or cause our company to change the way it conducts its activities and adversely affect the value of our units.
Our company’s organizational documents and agreements permit the BPY General Partner to modify our limited partnership agreement from time to time, without the consent of our unitholders, to elect to treat our company as a corporation for U.S. federal tax purposes, or to address certain changes in U.S. federal income tax regulations, legislation or interpretation. In some circumstances, such revisions could have a material adverse impact on some or all of our unitholders.
THE FOREGOING DISCUSSION IS NOT INTENDED AS A SUBSTITUTE FOR CAREFUL TAX PLANNING. THE TAX MATTERS RELATING TO OUR COMPANY AND UNITHOLDERS ARE COMPLEX AND ARE SUBJECT TO VARYING INTERPRETATIONS. MOREOVER, THE EFFECT OF EXISTING INCOME TAX LAWS, THE MEANING AND IMPACT OF WHICH IS UNCERTAIN, AND OF PROPOSED CHANGES IN INCOME TAX LAWS WILL VARY WITH THE PARTICULAR CIRCUMSTANCES OF EACH UNITHOLDER, AND IN REVIEWING THIS ANNUAL REPORT ON FORM 20-F THESE MATTERS SHOULD BE CONSIDERED. EACH UNITHOLDER SHOULD CONSULT ITS OWN TAX ADVISER WITH RESPECT TO THE U.S. FEDERAL, STATE, LOCAL, AND OTHER TAX CONSEQUENCES OF ANY INVESTMENT IN OUR UNITS.
Certain Material Canadian Federal Income Tax Considerations
The following is a summary of the principal Canadian federal income tax consequences under the Tax Act of the holding and disposition of units of our company generally applicable to a unitholder, who for purposes of the Tax Act and at all relevant times, holds our units as capital property, deals at arm’s length with and is not affiliated with our company, the Property Partnership, the BPY General Partner and their respective affiliates (a “Holder”). Generally, our units will be considered to be capital property to a Holder, provided that the Holder does not use or hold our units in the course of carrying on a business of trading or dealing in securities and has not acquired them in one or more transactions considered to be an adventure or concern in the nature of trade.
This summary is not applicable to a Holder: (i) that is a “financial institution” as defined in the Tax Act for purposes of the “mark-to-market” property rules, (ii) that is a “specified financial institution” as defined in the Tax Act, (iii) who makes or has made a functional currency reporting election pursuant to section 261 of the Tax Act, (iv) an interest in which would be a “tax shelter investment” as defined in the Tax Act or who acquires our units as a “tax shelter investment” (and this summary assumes that no such persons hold our units), (v) that has, directly or indirectly, a “significant interest” as defined in subsection 34.2(1) of the Tax Act in our company, (vi) if any affiliate of our company is, or becomes as part of a series of transactions that includes the acquisition of units of our company, a “foreign affiliate” for purposes of the Tax Act of such Holder or of any corporation that does not deal at arm’s length with such Holder for purposes of the Tax Act, or (vii) that has entered into or will enter into a “derivative forward agreement”, as defined in the Tax Act, in respect of our units. Any such Holders should consult their own tax advisors with respect to an investment in our units.
This summary is based on the current provisions of the Tax Act, all specific proposals to amend the Tax Act publicly announced by or on behalf of the Minister of Finance (Canada) prior to the date hereof (the “Tax Proposals”) and the current published administrative and assessing policies and practices of the CRA. This summary assumes that all Tax Proposals will be enacted in the form proposed but no assurance can be given that the Tax Proposals will be enacted in the form proposed or at all. This summary does not otherwise take into account or anticipate any changes in law, whether by judicial, administrative or legislative decision or action, or changes in the CRA’s administrative and assessing policies and practices, nor does it take into account provincial, territorial or foreign income tax legislation or considerations, which may differ significantly from those described herein. This summary is not exhaustive of all possible Canadian federal income tax consequences that may affect our unitholders. Holders should consult their own tax advisors in respect of the provincial, territorial or foreign income tax consequences to them of holding and disposing of our units.
This summary assumes that neither our company nor the Property Partnership is a “tax shelter” as defined in the Tax Act or a “tax shelter investment”. However, no assurance can be given in this regard.
This summary also assumes that neither our company nor the Property Partnership will be a “SIFT partnership” at any relevant time for purposes of the SIFT Rules on the basis that neither our company nor the Property Partnership will be a “Canadian resident partnership” at any relevant time. However, there can be no assurance that the SIFT Rules will not be revised or amended such that the SIFT Rules will apply.
- 185 -
This summary does not address the deductibility of interest on money borrowed to acquire our units nor whether any amounts in respect of our units could be “split income” for the purposes of the Tax Act.
This summary is of a general nature only and is not intended to be, nor should it be construed to be, legal or tax advice to any particular Holder, and no representation with respect to the Canadian federal income tax consequences to any particular Holder is made. Consequently, Holders are advised to consult their own tax advisors with respect to their particular circumstances. See also Item 3.D. “Risk Factors - Risks Relating to Taxation - Canada”.
For purposes of the Tax Act, all amounts relating to the acquisition, holding or disposition of our units must be expressed in Canadian dollars including any distributions, adjusted cost base and proceeds of disposition. For purposes of the Tax Act, amounts denominated in a currency other than the Canadian dollar generally must be converted into Canadian dollars using the appropriate exchange rate determined in accordance with the detailed rules in the Tax Act in that regard.
Taxation of Canadian Resident Limited Partners
The following portion of the summary is generally applicable to a Holder who, for purposes of the Tax Act and at all relevant times, is resident or deemed to be resident in Canada (a “Canadian Limited Partner”).
Computation of Income or Loss
Each Canadian Limited Partner is required to include (or, subject to the “at-risk rules” discussed below, entitled to deduct) in computing his or her income for a particular taxation year the Canadian Limited Partner’s share of the income (or loss) of our company for its fiscal year ending in, or coincidentally with, the Canadian Limited Partner’s taxation year end, whether or not any of that income is distributed to the Canadian Limited Partner in the taxation year and regardless of whether or not our units were held throughout such year.
Our company will not itself be a taxable entity and is not expected to be required to file an income tax return in Canada for any taxation year. However, the income (or loss) of our company for a fiscal period for purposes of the Tax Act will be computed as if it were a separate person resident in Canada and the partners will be allocated a share of that income (or loss) in accordance with our limited partnership agreement. The income (or loss) of our company will include our company’s share of the income (or loss) of the Property Partnership for a fiscal year determined in accordance with the Property Partnership’s limited partnership agreement. For this purpose, our company’s fiscal year end and that of the Property Partnership will be December 31.
The income for tax purposes of our company for a given fiscal year will be allocated to each Canadian Limited Partner in an amount calculated by multiplying such income by a fraction, the numerator of which is the sum of the distributions received by such Canadian Limited Partner with respect to such fiscal year and the denominator of which is the aggregate amount of the distributions made by our company to all partners with respect to such fiscal year, provided that the numerator and denominator will not include any distributions on the preferred units that are in satisfaction of accrued distributions on the preferred units that were not paid in a previous fiscal year of our company where the BPY General Partner determines that the inclusion of such distributions would result in a holder of the preferred units being allocated more income than it would have been if the distributions were paid in the fiscal year of our company in which they were accrued.
If, with respect to a given fiscal year, no distribution is made by our company to our unitholders or our company has a loss for tax purposes, one quarter of the income, or loss, as the case may be, for tax purposes for such fiscal year that is allocable to our unitholders, will be allocated to our unitholders of record at the end of each calendar quarter ending in such fiscal year as follows: (i) to the holders of the preferred units in respect of the preferred units held by them on each such date, such amount of our company’s income or loss for tax purposes, as the case may be, as the BPY General Partner determines is reasonable in the circumstances having regard to such factors as the BPY General Partner considers to be relevant, including, without limitation, the relative amount of capital contributed to our company on the issuance of the preferred units as compared to all other units and the relative fair market value of the preferred units as compared to all other units, and (ii) to the partners, other than in respect of the preferred units, the remaining amount of our company’s income or loss for tax purposes, as the case may be, pro rata in the proportion that the number of units of our company held at each such date by a unitholder is of the total number of units of our company (other than the preferred units) that are issued and outstanding at each such date.
The income of our company as determined for purposes of the Tax Act may differ from its income as determined for accounting purposes and may not be matched by cash distributions. In addition, for purposes of the Tax Act, all income (or losses) of our company and the Property Partnership must be calculated in Canadian currency. Where our company (or the Property
- 186 -
Partnership) holds investments denominated in U.S. dollars or other foreign currencies, gains and losses may be realized by our company (or the Property Partnership) as a consequence of fluctuations in the relative values of the Canadian and foreign currencies.
In computing the income (or loss) of our company, deductions may be claimed in respect of reasonable administrative costs, interest and other expenses incurred by our company for the purpose of earning income, subject to the relevant provisions of the Tax Act. Our company may also deduct from its income for the year a portion of the reasonable expenses, if any, incurred by our company to issue our units. The portion of such issue expenses deductible by our company in a taxation year is 20% of such issue expenses, pro-rated where our company’s taxation year is less than 365 days.
In general, a Canadian Limited Partner’s share of any income (or loss) of our company from a particular source will be treated as if it were income (or loss) of the Canadian Limited Partner from that source, and any provisions of the Tax Act applicable to that type of income (or loss) will apply to the Canadian Limited Partner. Our company will invest in general partnership units of the Property Partnership. In computing our company’s income (or loss) under the Tax Act, the Property Partnership will itself be deemed to be a separate person resident in Canada which computes its income (or loss) and allocates to its partners their respective share of such income (or loss). Accordingly, the source and character of amounts included in (or deducted from) the income of Canadian Limited Partners on account of income (or loss) earned by the Property Partnership generally will be determined by reference to the source and character of such amounts when earned by the Property Partnership.
A Canadian Limited Partner’s share of taxable dividends received or considered to be received by our company in a fiscal year from a corporation resident in Canada will be treated as a dividend received by the Canadian Limited Partner and will be subject to the normal rules in the Tax Act applicable to such dividends, including the enhanced gross-up and dividend tax credit for “eligible dividends” as defined in the Tax Act when the dividend received by the Property Partnership is designated as an “eligible dividend”.
Foreign taxes paid by our company or the Property Partnership and taxes withheld at source on amounts paid or credited to our company or the Property Partnership (other than for the account of a particular partner) will be allocated pursuant to the governing partnership agreement. Each Canadian Limited Partner’s share of the “business-income tax” and “non-business-income tax” paid to the government of a foreign country for a year will be creditable against its Canadian federal income tax liability to the extent permitted by the detailed foreign tax credit rules contained in the Tax Act. Although the foreign tax credit rules are designed to avoid double taxation, the maximum credit is limited. Because of this, and because of timing differences in recognition of expenses and income and other factors, the foreign tax credit rules may not provide a full foreign tax credit for the “business-income tax” and “non-business-income tax” paid by our company or the Property Partnership to the government of a foreign country. The Tax Act contains anti-avoidance rules to address certain foreign tax credit generator transactions. Under the Foreign Tax Credit Generator Rules, the foreign “business-income tax” or “non-business-income tax” allocated to a Canadian Limited Partner for the purpose of determining such Canadian Limited Partner’s foreign tax credit for any taxation year may be limited in certain circumstances, including where a Canadian Limited Partner’s share the income of our company or the Property Partnership under the income tax laws of any country (other than Canada) under whose laws the income of our company or the Property Partnership is subject to income taxation (the “Relevant Foreign Tax Law”) is less than the Canadian Limited Partner’s share of such income for purposes of the Tax Act. For this purpose, a Canadian Limited Partner is not considered to have a lesser direct or indirect share of the income of our company or the Property Partnership under the Relevant Foreign Tax Law than for the purposes of the Tax Act solely because, among other reasons, of a difference between the Relevant Foreign Tax Law and the Tax Act in the manner of computing the income of our company or the Property Partnership or in the manner of allocating the income of our company or the Property Partnership because of the admission or withdrawal of a partner. No assurance can be given that the Foreign Tax Credit Generator Rules will not apply to any Canadian Limited Partner. If the Foreign Tax Credit Generator Rules apply, the allocation to a Canadian Limited Partner of foreign “business-income tax” or “non-business-income tax” paid by our company or the Property Partnership, and therefore such Canadian Limited Partner’s foreign tax credits, will be limited.
Our company and the Property Partnership will each be deemed to be a non-resident person in respect of certain amounts paid or credited or deemed to be paid or credited to them by a person resident or deemed to be resident in Canada, including dividends or interest. Dividends or interest (other than interest not subject to Canadian federal withholding tax) paid or deemed to be paid by a person resident or deemed to be resident in Canada to the Property Partnership will be subject to withholding tax under Part XIII of the Tax Act at the rate of 25%. However, the CRA’s administrative practice in similar circumstances is to permit the rate of Canadian federal withholding tax applicable to such payments to be computed by looking through the partnership and taking into account the residency of the partners (including partners who are resident in Canada) and any reduced rates of Canadian federal withholding tax that any non-resident limited partners may be entitled to under an applicable income tax treaty or convention, provided that the residency status and entitlement to the treaty benefits can be established. In determining the rate of Canadian federal withholding tax applicable to amounts paid by the Holding Entities to the Property Partnership, the BPY General Partner expects the Holding Entities to look-through the Property Partnership and our company to the residency of the partners of our company (including partners who are resident in Canada) and to take into account any reduced rates of Canadian federal withholding
- 187 -
tax that non-resident partners may be entitled to under an applicable income tax treaty or convention in order to determine the appropriate amount of Canadian federal withholding tax to withhold from dividends or interest paid to the Property Partnership. However, there can be no assurance that the CRA will apply its administrative practice in this context. Under the Treaty, a Canadian resident payer is required in certain circumstances to look-through fiscally transparent partnerships, such as our company and the Property Partnership, to the residency and Treaty entitlements of their partners and to take into account the reduced rates of Canadian federal withholding tax that such partners may be entitled to under the Treaty.
If our company incurs losses for tax purposes, each Canadian Limited Partner will be entitled to deduct in the computation of income for tax purposes the Canadian Limited Partner’s share of any net losses for tax purposes of our company for its fiscal year to the extent that the Canadian Limited Partner’s investment is “at-risk” within the meaning of the Tax Act. The Tax Act contains “at-risk rules” which may, in certain circumstances, restrict the deduction of a limited partner’s share of any losses of a limited partnership. The BPY General Partner does not anticipate that our company or the Property Partnership will incur losses but no assurance can be given in this regard. Accordingly, Canadian Limited Partners should consult their own tax advisors for specific advice with respect to the potential application of the “at-risk rules”.
Section 94.1 of the Tax Act contains rules relating to interests held by a taxpayer in Non-Resident Entities that could, in certain circumstances, cause income to be imputed to Canadian Limited Partners, either directly or by way of allocation of such income imputed to our company or the Property Partnership. These rules would apply if it is reasonable to conclude, having regard to all the circumstances, that one of the main reasons for the Canadian Limited Partner, our company or the Property Partnership acquiring, holding or having an investment in a Non-Resident Entity is to derive a benefit from “portfolio investments” in certain assets from which the Non-Resident Entity may reasonably be considered to derive its value in such a manner that taxes under the Tax Act on income, profits and gains from such assets for any year are significantly less than they would have been if such income, profits and gains had been earned directly. In determining whether this is the case, section 94.1 of the Tax Act provides that consideration must be given to, among other factors, the extent to which the income, profits and gains for any fiscal period are distributed in that or the immediately following fiscal period. No assurance can be given that section 94.1 of the Tax Act will not apply to a Canadian Limited Partner, our company or the Property Partnership. If these rules apply to a Canadian Limited Partner, our company or the Property Partnership, income, determined by reference to a prescribed rate of interest plus two percent applied to the “designated cost”, as defined in section 94.1 of the Tax Act, of the interest in the Non-Resident Entity, will be imputed directly to the Canadian Limited Partners or to our company or the Property Partnership and allocated to the Canadian Limited Partners in accordance with the rules in section 94.1 of the Tax Act. The rules in section 94.1 of the Tax Act are complex and Canadian Limited Partners should consult their own tax advisors regarding the application of these rules to them in their particular circumstances.
Dividends paid to the Property Partnership by a CFA of the Property Partnership will be included in computing the income of the Property Partnership. To the extent that any CFA or Indirect CFA of the Property Partnership earns income that is characterized as FAPI in a particular taxation year of the CFA or Indirect CFA, the FAPI allocable to the Property Partnership under the rules in the Tax Act must be included in computing the income of the Property Partnership for Canadian federal income tax purposes for the fiscal period of the Property Partnership in which the taxation year of that CFA or Indirect CFA ends, whether or not the Property Partnership actually receives a distribution of that FAPI. Our company will include its share of such FAPI of the Property Partnership in computing its income for Canadian federal income tax purposes and Canadian Limited Partners will be required to include their proportionate share of such FAPI allocated from our company in computing their income for Canadian federal income tax purposes. As a result, Canadian Limited Partners may be required to include amounts in their income even though they have not and may not receive an actual cash distribution of such amounts. If an amount of FAPI is included in computing the income of the Property Partnership for Canadian federal income tax purposes, an amount may be deductible in respect of the “foreign accrual tax” applicable to the FAPI. Any amount of FAPI included in income net of the amount of any deduction in respect of “foreign accrual tax” will increase the adjusted cost base to the Property Partnership of its shares of the particular CFA in respect of which the FAPI was included. At such time as the Property Partnership receives a dividend of this type of income that was previously included in the Property Partnership’s income as FAPI, such dividend will effectively not be included in computing the income of the Property Partnership and there will be a corresponding reduction in the adjusted cost base to the Property Partnership of the particular CFA shares. Under the Foreign Tax Credit Generator Rules, the “foreign accrual tax” applicable to a particular amount of FAPI included in the Property Partnership’s income in respect of a particular “foreign affiliate” of the Property Partnership may be limited in certain specified circumstances, including where the direct or indirect share of the income allocated to any member of the Property Partnership (which is deemed for this purpose to include a Canadian Limited Partner) that is a person resident in Canada or a “foreign affiliate” of such a person is, under a Relevant Foreign Tax Law, less than such member’s share of such income for purposes of the Tax Act. No assurance can be given that the Foreign Tax Credit Generator Rules will not apply to the Property Partnership. For this purpose, a Canadian Limited Partner is not considered to have a lesser direct or indirect share of the income of the Property Partnership under the Relevant Foreign Tax Law than for the purposes of the Tax Act solely because, among other reasons, of a difference between the Relevant Foreign Tax Law and the Tax Act in the manner of computing the income of the Property Partnership or in the manner of allocating the income of the Property Partnership because of the
- 188 -
admission or withdrawal of a partner. If the Foreign Tax Credit Generator Rules apply, the “foreign accrual tax” applicable to a particular amount of FAPI included in the Property Partnership’s income in respect of a particular “foreign affiliate” of the Property Partnership will be limited.
Disposition of Our Units
The disposition (or deemed disposition) by a Canadian Limited Partner of our units will result in the realization of a capital gain (or capital loss) by such Canadian Limited Partner in the amount, if any, by which the proceeds of disposition of our units, less any reasonable costs of disposition, exceed (or are exceeded by) the adjusted cost base of such units. Subject to the general rules on averaging of cost base, the adjusted cost base of a Canadian Limited Partner’s units of our company would generally be equal to: (i) the actual cost of our units (excluding any portion thereof financed with limited recourse indebtedness); plus (ii) the share of the income of our company allocated to the Canadian Limited Partner for fiscal years of our company ending before the relevant time in respect of our units; less (iii) the aggregate of the pro-rata share of losses of our company allocated to the Canadian Limited Partner (other than losses which cannot be deducted because they exceed the Canadian Limited Partner’s “at-risk” amount) for the fiscal years of our company ending before the relevant time in respect of our units; and less (iv) the Canadian Limited Partner’s distributions received from our company made before the relevant time in respect of our units.
The foregoing discussion of the calculation of the adjusted cost base assumes that each class or series of partnership interests in our company are treated as separate property for purposes of the Tax Act. However, the CRA’s position is to treat all the different types of interests in a partnership that a partner may hold as one capital property, including for purposes of determining the adjusted cost base of all such partnership interests. As a result, on a disposition of a particular type of unit, a partner’s total adjusted cost base is required to be allocated in a reasonable manner to the particular type of unit being disposed of. As acknowledged by the CRA, there is no particular method for determining a reasonable allocation of the adjusted cost base of a partnership interest to the part of the partnership interest that is disposed of. Furthermore, more than one method may be reasonable. If the CRA’s position applies, on a disposition by a Canadian Limited Partner of a particular type of unit of our company, the Canadian Limited Partner should generally be able to allocate his or her adjusted cost base in a manner that treats the different classes or series of units of our company as separate property. Accordingly, the BPY General Partner intends to provide partners with partnership information returns using such allocation.
Where a Canadian Limited Partner disposes of all of its units of our company, it will no longer be a partner of our company. If, however, a Canadian Limited Partner is entitled to receive a distribution from our company after the disposition of all such units, then the Canadian Limited Partner will be deemed to dispose of such units at the later of: (i) the end of the fiscal year of our company during which the disposition occurred; and (ii) the date of the last distribution made by our company to which the Canadian Limited Partner was entitled. The share of the income (or loss) of our company for tax purposes for a particular fiscal year which is allocated to a Canadian Limited Partner who has ceased to be a partner will generally be added (or deducted) in the computation of the adjusted cost base of the Canadian Limited Partner’s units of our company immediately prior to the time of the disposition.
A Canadian Limited Partner will generally realize a deemed capital gain if, and to the extent that, the adjusted cost base of the Canadian Limited Partner’s units of our company is negative at the end of any fiscal year of our company. In such a case, the adjusted cost base of the Canadian Limited Partner’s units of our company will be nil at the beginning of the next fiscal year of our company.
Canadian Limited Partners should consult their own tax advisors for advice with respect to the specific tax consequences to them of disposing of units of our company.
Taxation of Capital Gains and Capital Losses
In general, one-half of a capital gain realized by a Canadian Limited Partner must be included in computing such Canadian Limited Partner’s income as a taxable capital gain. One-half of a capital loss is deducted as an allowable capital loss against taxable capital gains realized in the year and any remainder may be deducted against net taxable capital gains in any of the three years preceding the year or any year following the year to the extent and under the circumstances described in the Tax Act.
Special rules in the Tax Act may apply to disallow the one-half treatment on all or a portion of a capital gain realized on a disposition of our units if a partnership interest is acquired by a tax-exempt person or a non-resident person (or by a partnership or trust (other than certain trusts) of which a tax-exempt person or a non-resident person is a member or beneficiary, directly or indirectly through one or more partnerships or trusts (other than certain trusts)). Canadian Limited Partners contemplating such a disposition should consult their own tax advisors in this regard.
- 189 -
A Canadian Limited Partner that is throughout the relevant taxation year a “Canadian-controlled private corporation” as defined in the Tax Act may be liable to pay an additional refundable tax on its “aggregate investment income”, as defined in the Tax Act, for the year, which is defined to include taxable capital gains.
Alternative Minimum Tax
Canadian Limited Partners that are individuals or trusts may be subject to the alternative minimum tax rules. Such Canadian Limited Partners should consult their own tax advisors.
Eligibility for Investment
Provided that our units are listed on a “designated stock exchange” (which currently includes the Nasdaq and the TSX), our units will be “qualified investments” under the Tax Act for trusts governed by RRSPs, deferred profit sharing plans, RESPs, RDSPs and TFSAs, all as defined in the Tax Act.
Notwithstanding the foregoing, an annuitant under an RRSP or RRIF, a holder of a TFSA or an RDSP or a subscriber of an RESP, as the case may be, will be subject to a penalty tax if our units held in the RRSP, RRIF, TFSA, RDSP or RESP are a “prohibited investments”, as defined in the Tax Act, for the RRSP, RRIF, TFSA, RDSP or RESP, as the case may be. Our units will generally not be a “prohibited investment” if the annuitant under the RRSP or RRIF, the holder of the TFSA or RDSP or the subscriber of an RESP, as applicable, deals at arm’s length with our company for purposes of the Tax Act and does not have a “significant interest”, as defined in the Tax Act for purposes of the “prohibited investment” rules, in our company. Canadian Limited Partners who will hold our units in an RRSP, RRIF, TFSA, RDSP or RESP should consult with their own tax advisors regarding the application of the foregoing “prohibited investment” rules having regard to their particular circumstances.
Taxation of Non-Canadian Limited Partners
The following portion of the summary is generally applicable to a Holder who, for purposes of the Tax Act and at all relevant times, is not, and is not deemed to be, resident in Canada and who does not use or hold and is not deemed to use or hold our units in connection with a business carried on in Canada (a “Non-Canadian Limited Partner”).
The following portion of the summary assumes that (i) our units are not and will not at any relevant time constitute “taxable Canadian property” of any Non-Canadian Limited Partner, and (ii) our company and the Property Partnership will not dispose of property that is “taxable Canadian property”. “Taxable Canadian property” includes, but is not limited to, property that is used or held in a business carried on in Canada and shares of corporations that are not listed on a “designated stock exchange” if more than 50% of the fair market value of the shares is derived from certain Canadian properties in the 60-month period immediately preceding the particular time. In general, our units will not constitute “taxable Canadian property” of any Non-Canadian Limited Partner at the time of disposition or deemed disposition, unless (a) at any time in the 60-month period immediately preceding the disposition or deemed disposition, more than 50% of the fair market value of our units was derived, directly or indirectly (excluding through a corporation, partnership or trust, the shares or interests in which were not themselves “taxable Canadian property”), from one or any combination of: (i) real or immovable property situated in Canada; (ii) “Canadian resource properties”; (iii) “timber resource properties”; and (iv) options in respect of, or interests in, or for civil law rights in, such property, whether or not such property exists, or (b) our units are otherwise deemed to be “taxable Canadian property”. Since our company’s assets will consist principally of units of the Property Partnership, our units would generally be “taxable Canadian property” at a particular time if the units of the Property Partnership held by our company derived, directly or indirectly (excluding through a corporation, partnership or trust, the shares or interests in which were not themselves “taxable Canadian property”), more than 50% of their fair market value from properties described in (i) to (iv) above, at any time in the 60-month period preceding the particular time. The BPY General Partner does not expect our units to be “taxable Canadian property” at any relevant time and does not expect our company or the Property Partnership to dispose of “taxable Canadian property”. However, no assurance can be given in this regard.
The following portion of the summary also assumes that neither our company nor the Property Partnership will be considered to carry on business in Canada. The BPY General Partner intends to organize and conduct the affairs of each of these entities, to the extent possible, so that neither of these entities should be considered to carry on business in Canada for purposes of the Tax Act. However, no assurance can be given in this regard. If either of these entities carry on business in Canada, the tax implications to our company or the Property Partnership and to Non-Canadian Limited Partners may be materially and adversely different than as set out herein.
Special rules, which are not discussed in this summary, may apply to a Non-Canadian Limited Partner that is an insurer carrying on business in Canada and elsewhere.
- 190 -
Taxation of Income or Loss
A Non-Canadian Limited Partner will not be subject to Canadian federal income tax under Part I of the Tax Act on its share of income from a business carried on by our company (or the Property Partnership) outside Canada or the non-business-income earned by our company (or the Property Partnership) from sources in Canada. However, a Non-Canadian Limited Partner may be subject to Canadian federal withholding tax under Part XIII of the Tax Act, as described below.
Our company and the Property Partnership will each be deemed to be a non-resident person in respect of certain amounts paid or credited or deemed to be paid or credited to them by a person resident or deemed to be resident in Canada, including dividends or interest. Dividends or interest (other than interest not subject to Canadian federal withholding tax) paid or deemed to be paid by a person resident or deemed to be resident in Canada to the Property Partnership will be subject to withholding tax under Part XIII of the Tax Act at the rate of 25%. However, the CRA’s administrative practice in similar circumstances is to permit the rate of Canadian federal withholding tax applicable to such payments to be computed by looking through the partnership and taking into account the residency of the partners (including partners who are resident in Canada) and any reduced rates of Canadian federal withholding tax that any non-resident partners may be entitled to under an applicable income tax treaty or convention, provided that the residency status and entitlement to the treaty benefits can be established. In determining the rate of Canadian federal withholding tax applicable to amounts paid by the Holding Entities to the Property Partnership, the BPY General Partner expects the Holding Entities to look-through the Property Partnership and our company to the residency of the partners of our company (including partners who are resident in Canada) and to take into account any reduced rates of Canadian federal withholding tax that Non-Canadian Limited Partners may be entitled to under an applicable income tax treaty or convention in order to determine the appropriate amount of Canadian federal withholding tax to withhold from dividends or interest paid to the Property Partnership. However, there can be no assurance that the CRA will apply its administrative practice in this context. Under the Treaty, a Canadian resident payer is required in certain circumstances to look-through fiscally transparent partnerships, such as our company and the Property Partnership, to the residency and Treaty entitlements of their partners and take into account the reduced rates of Canadian federal withholding tax that such partners may be entitled to under the Treaty.
10.F. DIVIDENDS AND PAYING AGENTS
Not applicable.
10.G. STATEMENT BY EXPERTS
Not applicable.
10.H DOCUMENTS ON DISPLAY
Our company is subject to the information filing requirements of the Exchange Act, and accordingly is required to file periodic reports and other information with the SEC. As a foreign private issuer under the SEC’s regulations, we file annual reports on Form 20-F and furnish other reports on Form 6-K. The information disclosed in our reports may be less extensive than that required to be disclosed in annual and quarterly reports on Forms 10-K and 10-Q required to be filed with the SEC by U.S. issuers. Moreover, as a foreign private issuer, we are not subject to the proxy requirements under Section 14 of the Exchange Act, and the BPY General Partner’s directors and our major unitholders are not subject to the insider short swing profit reporting and recovery rules under Section 16 of the Exchange Act. The SEC maintains an Internet website at www.sec.gov that contains reports, proxy and information statements and other information regarding issuers that file electronically with the SEC. You may obtain our SEC filings on the SEC website or on our website bpy.brookfield.com. The information on our website is not part of this annual report.
In addition, our company is required by Canadian securities laws to file documents electronically with Canadian securities regulatory authorities and these filings are available on our SEDAR profile at www.sedar.com. Written requests for such documents should be directed to our Corporate Secretary at 73 Front Street, 5th Floor, Hamilton HM 12, Bermuda.
10.I. SUBSIDIARY INFORMATION
Not applicable.
- 191 -
ITEM 11. QUANTITATIVE AND QUALITATIVE DISCLOSURES ABOUT MARKET RISK
See the information contained in this Form 20-F under Item 5.A. “Operating and Financial Review and Prospects - Operating Results - Risks and Uncertainties - Derivative Financial Instruments”.
ITEM 12. DESCRIPTION OF SECURITIES OTHER THAN EQUITY SECURITIES
Not applicable.
PART II
ITEM 13. DEFAULTS, DIVIDEND ARREARAGES AND DELINQUENCIES
None.
ITEM 14. MATERIAL MODIFICATIONS TO THE RIGHTS OF SECURITY HOLDERS AND USE OF PROCEEDS
Not applicable.
ITEM 15. CONTROLS AND PROCEDURES
Disclosure Controls and Procedures
As of December 31, 2019, an evaluation of the effectiveness of our “disclosure controls and procedures” (as defined in Rules 13a-15(e) and 15d-15(e) of the Exchange Act) was carried out under the supervision and with the participation of persons performing the functions of principal executive and principal financial officers for us and our Service Providers. Based upon that evaluation, the persons performing the functions of principal executive and principal financial officers for us have concluded that, as of December 31, 2019, our disclosure controls and procedures were effective: (i) to ensure that information required to be disclosed by us in the reports that we file or submit under the Exchange Act is recorded, processed, summarized and reported within the time periods specified in the SEC’s rules and forms; and (ii) to ensure that information required to be disclosed by us in the reports that we file or submit under the Exchange Act is accumulated and communicated to our management, including the persons performing the functions of principal executive and principal financial officers for us, to allow timely decisions regarding required disclosure.
It should be noted that while our management, including persons performing the functions of principal executive and principal financial officers for us, believe our disclosure controls and procedures provide a reasonable level of assurance that such controls and procedures are effective, they do not expect that our disclosure controls and procedures or internal controls will prevent all error and all fraud. A control system, no matter how well conceived or operated, can provide only reasonable, not absolute, assurance that the objectives of the control system are met.
Management’s Annual Report on Internal Control over Financial Reporting
Our management is responsible for establishing and maintaining adequate internal control over financial reporting, as such term is defined in Exchange Act Rules 13a-15(f). Under the supervision and with the participation of our management, including persons performing the functions of principal executive and principal financial officers for us, we conducted an evaluation of the effectiveness of our internal control over financial reporting as of December 31, 2019, based on the criteria established in Internal Control-Integrated Framework (2013) issued by the Committee of Sponsoring Organizations of the Treadway Commission. Based on this assessment, our management concluded that our internal control over financial reporting was effective as of December 31, 2019.
Internal control systems, no matter how well designed, have inherent limitations. Therefore, even those systems determined to be effective can provide only reasonable assurance with respect to financial statement preparation and presentation. Also, projections of any evaluation of effectiveness to future periods are subject to the risk that controls may become inadequate because of changes in conditions, or that the degree of compliance with the policies or procedures may deteriorate.
- 192 -
Report of Independent Registered Public Accounting Firm
The effectiveness of our internal control over financial reporting as of December 31, 2019 has been audited by Deloitte LLP, Independent Registered Public Accounting Firm, who have also audited the financial statements of our company, as stated in their reports which are included herein.
Changes in Internal Control
There was no change in our internal control over financial reporting during the year ended December 31, 2019, that has materially affected, or is reasonably likely to materially affect, our internal control over financial reporting.
ITEM 16. [RESERVED]
ITEM 16A. AUDIT COMMITTEE FINANCIAL EXPERTS
The BPY General Partner’s board of directors has determined that Stephen DeNardo possesses specific accounting and financial management expertise and that he is an audit committee financial expert as defined by the SEC and is independent within the meaning of the rules of the Nasdaq. The BPY General Partner’s board of directors has also determined that other members of the Audit Committee have sufficient experience and ability in finance and compliance matters to enable them to adequately discharge their responsibilities.
ITEM 16B. CODE OF ETHICS
On April 4, 2013, the BPY General Partner adopted a Code of Conduct and Ethics (the “Code”) that applies to the members of the board of directors of the BPY General Partner, our company and any officers or employees of the BPY General Partner. The Code is reviewed and updated annually. We have posted a copy of the Code on our website at bpy.brookfield.com.
ITEM 16C. PRINCIPAL ACCOUNTANT FEES AND SERVICES
The BPY General Partner has retained Deloitte LLP to act as our company’s independent registered public accounting firm.
The table below summarizes the fees for professional services rendered by Deloitte LLP for the audit of our annual financial statements for the periods ended December 31, 2019 and 2018.
| December 31, 2019 | December 31, 2018 | |||||||||
| (US$ Thousands) | Total | % | Total | % | ||||||
Audit fees(1) | $ | 10,384 | 36 | % | $ | 10,769 | 37 | % | ||
Audit-related fees(2) | 17,580 | 62 | % | 18,000 | 62 | % | ||||
Tax fees(3) | 33 | — | % | 441 | 1 | % | ||||
Other(4) | 540 | 2 | % | 37 | — | % | ||||
| Total | $ | 28,537 | 100 | % | $ | 29,247 | 100 | % | ||
(1) | Audit fees include fees for the audit of our annual consolidated financial statements, internal control over financing reporting and interim reviews of the consolidated financial statements included in our quarterly interim reports. This category also includes fees for comfort letters, consents and review of certain documents filed with securities regulatory authorities. |
(2) | Audit-related fees include fees for the audit or review of financial statements for certain of our subsidiaries, including audits of individual properties to comply with lender, joint venture partner or tenant requirements. |
(3) | Tax fees are principally for assistance in tax return preparation and tax advisory services. |
(4) | All other fees include fees for certain permissible consulting and advisory services, including assistance with corporate and social responsibility reporting. |
The audit committee of the BPY General Partner pre-approves all audit and non-audit services provided to our partnership by Deloitte LLP.
ITEM 16D. EXEMPTIONS FROM THE LISTING STANDARDS FOR AUDIT COMMITTEES
None.
- 193 -
ITEM 16E. PURCHASES OF EQUITY SECURITIES BY THE ISSUER AND AFFILIATED PURCHASERS
Under our normal course issuer bid, our company may, during the twelve-month period commencing August 20, 2019 and ending August 19, 2020, purchase on the TSX, the Nasdaq and any alternative Canadian trading system, up to 35,252,769 of our LP Units, representing approximately 10% of our issued and outstanding LP Units. During the year ended December 31, 2019, we purchased 8,270,704 of our LP Units at an average price of $19.11 per unit under our normal course issuer bid.
Under our substantial issuer bid, our company purchased by way of a “modified Dutch auction” 13,981,214 of our LP Units.
| As of Dec. 31, 2019 | |||||||||
| Month | (a) Total number of units purchased | (b) Average price paid per unit | (c) Total number of units purchased as part of publicly announced plans or programs | (d) Maximum number of units that may yet be purchased under the plans or programs | |||||
Mar. 2019(1) | 13,981,214 | $ | 21.00 | 13,981,214 | — | ||||
Apr. 2019(2) | 597,826 | 20.90 | 597,826 | 3,520,907 | |||||
May 2019(2) | 1,349,695 | 19.32 | 1,349,695 | 2,171,212 | |||||
Jun. 2019(2) | 733,093 | 18.53 | 733,093 | 1,438,119 | |||||
Jul. 2019(2) | 396,712 | 18.90 | 396,712 | 1,041,407 | |||||
Aug. 2019(2) | 702,820 | 18.83 | 702,820 | 34,952,769 | |||||
Sep. 2019(2) | 750,000 | 19.61 | 750,000 | 34,202,769 | |||||
Oct. 2019(2) | 1,041,067 | 19.14 | 1,041,067 | 33,161,702 | |||||
Nov.2019(2) | 1,049,491 | 18.96 | 1,049,491 | 32,112,211 | |||||
Dec. 2019(2) | 1,650,000 | 18.57 | 1,650,000 | 30,462,211 | |||||
| Total | 22,251,918 | 22,251,918 | |||||||
(1) | Our company purchased 13,981,214 of our LP Units at a price of $21.00 under the substantial issuer bid, which was announced on February 11, 2019. The offer to purchase our LP Units under the substantial issuer bid expired at 5:00 p.m. on March 25, 2019. |
(2) | Under our normal course issuer bid, our company may, during the twelve-month period commencing August 20, 2019 and ending August 19, 2020, purchase on the TSX, the Nasdaq and any alternative Canadian trading system, approximately 10% of our issued and outstanding LP Units. |
ITEM 16F. CHANGE IN REGISTRANT’S CERTIFYING ACCOUNTANT
None.
ITEM 16G. CORPORATE GOVERNANCE
Subject to certain exceptions, Nasdaq permits foreign private issuers to follow home country practice in lieu of Nasdaq’s
corporate governance requirements. Our corporate practices are not materially different from those required of domestic limited
partnerships under the Nasdaq listing standards, except that we follow Bermuda law in respect of approval of equity compensation
plans and material amendments thereto, which only requires approval by the board of directors of the BPY General Partner, whereas
Nasdaq rules generally require unitholder approval of such plans and amendments.
ITEM 16H. MINING SAFETY DISCLOSURE
Pursuant to Section 1503(a) of the Dodd-Frank Wall Street Reform and Consumer Protection Act of 2010, issuers that are operators, or that have a subsidiary that is an operator, of a coal or other mine in the United States are required to disclose in their periodic reports filed with the SEC information regarding specified health and safety violations, orders and citations, related assessments and legal actions, and mining-related fatalities under the regulation of the Federal Mine Safety and Health Administration (the “MSHA”) under the Federal Mine Safety and Health Act of 1977, as amended, (the “Mine Act”). During the fiscal year ended December 31, 2019, our company did not have any mines in the United States subject to regulation by MSHA under the Mine Act.
- 194 -
PART III
ITEM 17. FINANCIAL STATEMENTS
Not applicable.
ITEM 18. FINANCIAL STATEMENTS
See the list of financial statements beginning on page F-1 which are filed as part of the annual report on Form 20-F.
ITEM 19. EXHIBITS
| Number | Description | |
Certificate of registration of our company, registered as of January 3, 2013(1) | ||
Second Amended and Restated Limited Partnership Agreement of our company, dated August 8, 2013(2) | ||
First Amendment to the Second Amended and Restated Limited Partnership Agreement of our company, dated November 5, 2015(3) | ||
Second Amendment to the Second Amended and Restated Limited Partnership Agreement of our company, dated March 21, 2019(4) | ||
Third Amendment to the Second Amended and Restated Limited Partnership Agreement of our company, dated August 20, 2019(5) | ||
Fourth Amendment to the Second Amended and Restated Limited Partnership Agreement of our company, dated February 18, 2020(6) | ||
Description of Securities(13) | ||
Second Amended and Restated Master Services Agreement by and among Brookfield Asset Management, the Service Recipients and the Service Providers, dated August 27, 2018(7) | ||
Fourth Amended and Restated Limited Partnership Agreement of the Property Partnership, dated February 20, 2019(8) | ||
First Amendment to the Fourth Amended and Restated Limited Partnership Agreement of the Property Partnership, dated March 21, 2019(4) | ||
Second Amendment to the Fourth Amended and Restated Limited Partnership Agreement of the Property Partnership, dated April 28, 2019(9) | ||
Third Amendment to the Fourth Amended and Restated Limited Partnership Agreement of the Property Partnership, dated August 20, 2019(5) | ||
Fourth Amendment to the Fourth Amended and Restated Limited Partnership Agreement of the Property Partnership, dated February 18, 2020(6) | ||
- 195 -
Relationship Agreement among our company, the Property Partnership, the Holding Entities, the Service Providers and Brookfield Asset Management, dated April 15, 2013(10) | ||
Registration Rights Agreement between our company and Brookfield Asset Management dated April 10, 2013(10) | ||
Support Agreement, dated March 19, 2014, between Brookfield Property Partners L.P. and Brookfield Office Properties Exchange LP(11) | ||
Guarantee Agreement between our company and the Class A Preferred Unitholder dated December 4, 2014(12) | ||
Investor Agreement between our company and the Class A Preferred Unitholder dated December 4, 2014(12) | ||
Certification of Brian W. Kingston, Chief Executive Officer, Brookfield Property Group LLC, pursuant to Section 302 of the Sarbanes-Oxley Act of 2002(13) | ||
Certification of Bryan K. Davis, Chief Financial Officer, Brookfield Property Group LLC, pursuant to Section 302 of the Sarbanes-Oxley Act of 2002(13) | ||
Certification of Brian W. Kingston, Chief Executive Officer, Brookfield Property Group LLC, pursuant to 18 U.S.C. Section 1350, as adopted to Section 906 of the Sarbanes Oxley Act of 2002(13) | ||
Certification of Bryan K. Davis, Chief Financial Officer, Brookfield Property Group LLC, pursuant to 18 U.S.C. Section 1350, as adopted to Section 906 of the Sarbanes Oxley Act of 2002(13) | ||
Consent of Deloitte LLP, Independent Registered Public Accounting Firm, relating to the incorporation of the consolidated financial statements of Brookfield Property Partners L.P. into this Annual Report on Form 20-F(13) | ||
| 101.INS | XBRL Instance Document(13) | |
| 101.SCH | XBRL Taxonomy Extension Schema Document(13) | |
| 101.CAL | XBRL Taxonomy Extension Calculation Linkbase Document(13) | |
| 101.DEF | XBRL Taxonomy Extension Definition Linkbase Document(13) | |
| 101.LAB | XBRL Taxonomy Extension Label Linkbase Document(13) | |
| 101.PRE | XBRL Taxonomy Extension Presentation Linkbase Document(13) | |
(1) | Filed as an exhibit to Amendment No. 1 to Registration Statement on Form 20-F on June 12, 2012 and incorporated herein by reference. | |
(2) | Filed as an exhibit to Form 6-K on August 8, 2013 and incorporated herein by reference. | |
(3) | Filed as an exhibit to Form 20-F on March 17, 2016 and incorporated herein by reference. | |
- 196 -
(4) | Filed as an exhibit to Form 6-K on March 21, 2019 and incorporated herein by reference | |
(5) | Filed as an exhibit to Form 6-K on August 20, 2019 and incorporated herein by reference. | |
(6) | Filed as an exhibit to Form 6-K on February 18, 2020 and incorporated herein by reference | |
(7) | Filed as an exhibit to Form 6-K on August 28, 2018 and incorporated herein by reference. | |
(8) | Filed as an exhibit to Form 6-K on February 20, 2019 and incorporated herein by reference. | |
(9) | Filed as an exhibit to Form 6-K on April 30, 2019 and incorporated herein by reference. | |
(10) | Filed as an exhibit to Form 6-K on April 16, 2013 and incorporated herein by reference. | |
(11) | Filed as an exhibit to Form 6-K on March 19, 2014 and incorporated herein by reference. | |
(12) | Filed as an exhibit to Form 6-K on December 4, 2014 and incorporated herein by reference. | |
(13) | Filed herewith. | |
The registrant hereby agrees to furnish to the SEC at its request copies of long-term debt instruments defining the rights of holders of outstanding long-term debt that are not required to be filed herewith.
- 197 -
SIGNATURES
The registrant hereby certifies that it meets all of the requirements for filing on Form 20-F and that it has duly caused and authorized the undersigned to sign this annual report on its behalf.
| BROOKFIELD PROPERTY PARTNERS L.P., | ||
by its general partner, BROOKFIELD PROPERTY PARTNERS LIMITED | ||
| By: | /s/ Jane Sheere | |
| Name: Jane Sheere | ||
| Title: Secretary | ||
Date: February 28, 2020
- 198 -
Index to Financial Statements
| Page | |
| Consolidated financial statements of Brookfield Property Partners L.P. as at December 31, 2019 and 2018 and for each of the years in the three-year period ended December 31, 2019 | |
F-1
Brookfield Property Partners L.P.
Consolidated financial statements
As at December 31, 2019 and 2018 and
for the years ended December 31, 2019, 2018 and 2017
F-2
REPORT OF INDEPENDENT REGISTERED PUBLIC ACCOUNTING FIRM
To the Board of Directors and unitholders of Brookfield Property Partners L.P.
Opinion on the Financial Statements
We have audited the accompanying consolidated balance sheets of Brookfield Property Partners L.P. and subsidiaries (the "Partnership") as of December 31, 2019 and 2018, the related consolidated statements of income, comprehensive income, changes in equity and cash flows for each of the three years in the period ended December 31, 2019, and the related notes and the supplemental schedule of investment property information (collectively referred to as the "financial statements"). In our opinion, the financial statements present fairly, in all material respects, the financial position of the Partnership as of December 31, 2019 and 2018, and its financial performance and its cash flows for each of the three years in the period ended December 31, 2019, in conformity with International Financial Reporting Standards as issued by the International Accounting Standards Board.
We have also audited, in accordance with the standards of the Public Company Accounting Oversight Board (United States) (PCAOB), the Partnership's internal control over financial reporting as of December 31, 2019, based on criteria established in Internal Control - Integrated Framework (2013) issued by the Committee of Sponsoring Organizations of the Treadway Commission and our report dated February 28, 2020 expressed an unqualified opinion on the Partnership's internal control over financial reporting.
Basis for Opinion
These financial statements are the responsibility of the Partnership's management. Our responsibility is to express an opinion on the Partnership's financial statements based on our audits. We are a public accounting firm registered with the PCAOB and are required to be independent with respect to the Partnership in accordance with the U.S. federal securities laws and the applicable rules and regulations of the Securities and Exchange Commission and the PCAOB.
We conducted our audits in accordance with the standards of the PCAOB. Those standards require that we plan and perform the audit to obtain reasonable assurance about whether the financial statements are free of material misstatement, whether due to error or fraud. Our audits included performing procedures to assess the risks of material misstatement of the financial statements, whether due to error or fraud, and performing procedures that respond to those risks. Such procedures included examining, on a test basis, evidence regarding the amounts and disclosures in the financial statements. Our audits also included evaluating the accounting principles used and significant estimates made by management, as well as evaluating the overall presentation of the financial statements. We believe that our audits provide a reasonable basis for our opinion.
Critical Audit Matter
The critical audit matter communicated below is a matter arising from the current-period audit of the financial statements that was communicated or required to be communicated to the audit committee and that (1) relates to accounts or disclosures that are material to the financial statements and (2) involved our especially challenging, subjective, or complex judgments. The communication of critical audit matters does not alter in any way our opinion on the financial statements, taken as a whole, and we are not, by communicating the critical audit matter below, providing a separate opinion on the critical audit matter or on the accounts or disclosures to which it relates.
Fair Value of Investment Property - Refer to Notes 2(e), 2(v)(v) and 5 to the financial statements
Critical Audit Matter Description
The Partnership has elected the fair value model for all investment properties and accordingly measures all investment properties at fair value subsequent to initial recognition on the balance sheet. The fair value of investment properties is generally determined by management, with substantially all of the investment properties valued using one of two accepted income approaches.
While there are several assumptions that are required to determine the fair value of an investment property, the judgments with the highest degree of subjectivity and impact on fair values are future expected market rents, discount rates and terminal capitalization rates. Auditing these estimates and assumptions of certain investment properties required a high degree of auditor judgment as the estimations made by management contains significant measurement uncertainty. This resulted in the need to involve a fair value specialist.
F-3
How the Critical Audit Matter Was Addressed in the Audit
Our audit procedures related to the future expected market rents, discount rates and terminal capitalization rates used to determine the fair value of certain investment properties included the following, among others:
| • | Evaluated the effectiveness of controls over management’s process for determining the fair value of investment properties including those over the forecasts of future expected market rents, discount rates and terminal capitalization rates. |
| • | Evaluated the reasonableness of management’s forecast of future expected market rents by comparing management’s forecasts with historical results, internal communications to management and the Board of Directors and contractual information, where applicable. |
| • | With the assistance of a fair value specialist, evaluated the reasonableness of management’s forecast of future expected market rents, discount rates and terminal capitalization rates by considering recent market transactions and industry surveys. |
/s/Deloitte LLP
Chartered Professional Accountants
Licensed Public Accountants
Toronto, Canada
February 28, 2020
We have served as the Partnership's auditor since 2011.
F-4
REPORT OF INDEPENDENT REGISTERED PUBLIC ACCOUNTING FIRM
To the Board of Directors and unitholders of Brookfield Property Partners L.P.
Opinion on Internal Control over Financial Reporting
We have audited the internal control over financial reporting of Brookfield Property Partners L.P. and subsidiaries (the “Partnership”) as of December 31, 2019, based on criteria established in Internal Control - Integrated Framework (2013) issued by the Committee of Sponsoring Organizations of the Treadway Commission (COSO). In our opinion, the Partnership maintained, in all material respects, effective internal control over financial reporting as of December 31, 2019, based on criteria established in Internal Control - Integrated Framework (2013) issued by COSO.
We have also audited, in accordance with the standards of the Public Company Accounting Oversight Board (United States) (PCAOB), the consolidated financial statements as of and for the year ended December 31, 2019 of the Partnership and our report dated February 28, 2020, expressed an unqualified opinion on those financial statements.
Basis for Opinion
The Partnership’s management is responsible for maintaining effective internal control over financial reporting and for its assessment of the effectiveness of internal control over financial reporting, included in the accompanying Management’s Annual Report on Internal Control over Financial Reporting. Our responsibility is to express an opinion on the Partnership’s internal control over financial reporting based on our audit. We are a public accounting firm registered with the PCAOB and are required to be independent with respect to the Partnership in accordance with the U.S. federal securities laws and the applicable rules and regulations of the Securities and Exchange Commission and the PCAOB.
We conducted our audit in accordance with the standards of the PCAOB. Those standards require that we plan and perform the audit to obtain reasonable assurance about whether effective internal control over financial reporting was maintained in all material respects. Our audit included obtaining an understanding of internal control over financial reporting, assessing the risk that a material weakness exists, testing and evaluating the design and operating effectiveness of internal control based on the assessed risk, and performing such other procedures as we considered necessary in the circumstances. We believe that our audit provides a reasonable basis for our opinion.
Definition and Limitations of Internal Control over Financial Reporting
A company’s internal control over financial reporting is a process designed to provide reasonable assurance regarding the reliability of financial reporting and the preparation of financial statements for external purposes in accordance with generally accepted accounting principles. A company’s internal control over financial reporting includes those policies and procedures that (1) pertain to the maintenance of records that, in reasonable detail, accurately and fairly reflect the transactions and dispositions of the assets of the company; (2) provide reasonable assurance that transactions are recorded as necessary to permit preparation of financial statements in accordance with generally accepted accounting principles, and that receipts and expenditures of the company are being made only in accordance with authorizations of management and directors of the company; and (3) provide reasonable assurance regarding prevention or timely detection of unauthorized acquisition, use, or disposition of the company’s assets that could have a material effect on the financial statements.
Because of its inherent limitations, internal control over financial reporting may not prevent or detect misstatements. Also, projections of any evaluation of effectiveness to future periods are subject to the risk that controls may become inadequate because of changes in conditions, or that the degree of compliance with the policies or procedures may deteriorate.
/s/Deloitte LLP
Chartered Professional Accountants
Licensed Public Accountants
Toronto, Canada
February 28, 2020
F-5
Brookfield Property Partners L.P.
Consolidated Balance Sheets
| (US$ Millions) | Note | Dec. 31, 2019 | Dec. 31, 2018 | ||||
| Assets | |||||||
| Non-current assets | |||||||
| Investment properties | 5 | $ | 75,511 | $ | 80,196 | ||
| Equity accounted investments | 7 | 20,764 | 22,698 | ||||
| Participating loan interests | 9 | — | 268 | ||||
| Property, plant and equipment | 10 | 7,278 | 7,506 | ||||
| Goodwill | 11 | 1,041 | 1,109 | ||||
| Intangible assets | 12 | 1,162 | 1,179 | ||||
| Other non-current assets | 13 | 2,326 | 1,856 | ||||
| Loans and notes receivable | 272 | 594 | |||||
| Total non-current assets | 108,354 | 115,406 | |||||
| Current assets | |||||||
| Loans and notes receivable | 57 | 461 | |||||
| Accounts receivable and other | 14 | 1,407 | 2,361 | ||||
| Cash and cash equivalents | 1,438 | 3,288 | |||||
| Total current assets | 2,902 | 6,110 | |||||
| Assets held for sale | 15 | 387 | 1,004 | ||||
| Total assets | $ | 111,643 | $ | 122,520 | |||
| Liabilities and equity | |||||||
| Non-current liabilities | |||||||
| Debt obligations | 16 | $ | 46,565 | $ | 57,937 | ||
| Capital securities | 17 | 3,000 | 2,865 | ||||
| Other non-current liabilities | 19 | 2,162 | 2,294 | ||||
| Deferred tax liabilities | 18 | 2,515 | 2,378 | ||||
| Total non-current liabilities | 54,242 | 65,474 | |||||
| Current liabilities | |||||||
| Debt obligations | 16 | 8,825 | 5,874 | ||||
| Capital securities | 17 | 75 | 520 | ||||
| Accounts payable and other liabilities | 20 | 3,426 | 3,749 | ||||
| Total current liabilities | 12,326 | 10,143 | |||||
| Liabilities associated with assets held for sale | 15 | 140 | 163 | ||||
| Total liabilities | 66,708 | 75,780 | |||||
| Equity | |||||||
| Limited partners | 21 | 13,274 | 12,353 | ||||
| General partner | 21 | 4 | 4 | ||||
| Preferred equity | 21 | 420 | — | ||||
| Non-controlling interests attributable to: | |||||||
| Redeemable/exchangeable and special limited partnership units | 21,22 | 13,200 | 12,740 | ||||
| Limited partnership units of Brookfield Office Properties Exchange LP | 21,22 | 87 | 96 | ||||
| FV LTIP units of the Operating Partnership | 21,22 | 35 | — | ||||
| Class A shares of Brookfield Property REIT Inc. (“BPR”) | 21,22 | 1,930 | 3,091 | ||||
| Interests of others in operating subsidiaries and properties | 6,22 | 15,985 | 18,456 | ||||
| Total equity | 44,935 | 46,740 | |||||
| Total liabilities and equity | $ | 111,643 | $ | 122,520 | |||
See accompanying notes to the consolidated financial statements.
F-6
Brookfield Property Partners L.P.
Consolidated Statements of Income
| (US$ Millions, except per unit information) Years ended Dec. 31, | Note | 2019 | 2018 | 2017 | ||||||
| Commercial property revenue | 23 | $ | 5,691 | $ | 5,043 | $ | 4,192 | |||
| Hospitality revenue | 24 | 1,909 | 1,913 | 1,648 | ||||||
| Investment and other revenue | 25 | 603 | 283 | 295 | ||||||
| Total revenue | 8,203 | 7,239 | 6,135 | |||||||
| Direct commercial property expense | 26 | 1,967 | 1,851 | 1,617 | ||||||
| Direct hospitality expense | 27 | 1,219 | 1,236 | 1,079 | ||||||
| Investment and other expense | 82 | 26 | 138 | |||||||
| Interest expense | 2,924 | 2,464 | 1,967 | |||||||
| Depreciation and amortization | 28 | 341 | 308 | 275 | ||||||
| General and administrative expense | 29 | 882 | 1,032 | 614 | ||||||
| Total expenses | 7,415 | 6,917 | 5,690 | |||||||
| Fair value gains, net | 30 | 596 | 2,466 | 1,254 | ||||||
| Share of net earnings from equity accounted investments | 7 | 1,969 | 947 | 961 | ||||||
| Income before income taxes | 3,353 | 3,735 | 2,660 | |||||||
| Income tax expense | 18 | 196 | 81 | 192 | ||||||
| Net income | $ | 3,157 | $ | 3,654 | $ | 2,468 | ||||
| Net income attributable to: | ||||||||||
| Limited partners | $ | 884 | $ | 764 | $ | 136 | ||||
| General partner | — | — | — | |||||||
| Non-controlling interests attributable to: | ||||||||||
| Redeemable/exchangeable and special limited partnership units | 896 | 1,085 | 233 | |||||||
| Limited partnership units of Brookfield Office Properties Exchange LP | 6 | 17 | 6 | |||||||
| FV LTIP units of the Operating Partnership | 1 | — | — | |||||||
| Class A shares of Brookfield Property REIT Inc. | 169 | 112 | — | |||||||
| Interests of others in operating subsidiaries and properties | 1,201 | 1,676 | 2,093 | |||||||
| Total | $ | 3,157 | $ | 3,654 | $ | 2,468 | ||||
| Net income per LP Unit: | ||||||||||
| Basic | 21 | $ | 1.89 | $ | 2.28 | $ | 0.48 | |||
| Diluted | 21 | $ | 1.89 | $ | 2.26 | $ | 0.48 | |||
See accompanying notes to the consolidated financial statements.
F-7
Brookfield Property Partners L.P.
Consolidated Statements of Comprehensive Income
| (US$ Millions) Years ended Dec. 31, | Note | 2019 | 2018 | 2017 | ||||||
| Net income | $ | 3,157 | $ | 3,654 | $ | 2,468 | ||||
| Other comprehensive income (loss) | 32 | |||||||||
| Items that may be reclassified to net income: | ||||||||||
| Foreign currency translation | 63 | (788 | ) | 654 | ||||||
| Cash flow hedges | 21 | 34 | 77 | |||||||
| Available-for-sale securities (“AFS”) | — | — | (5 | ) | ||||||
| Equity accounted investments | (50 | ) | (8 | ) | 11 | |||||
| Items that will not be reclassified to net income: | ||||||||||
| Securities - fair value through other comprehensive income (“FVTOCI”) | (7 | ) | (2 | ) | — | |||||
| Share of revaluation surplus on equity accounted investments | 16 | 92 | 58 | |||||||
| Remeasurement of defined benefit obligations | (1 | ) | 2 | (1 | ) | |||||
| Revaluation surplus | 281 | 254 | 86 | |||||||
| Total other comprehensive income (loss) | 323 | (416 | ) | 880 | ||||||
| Total comprehensive income | $ | 3,480 | $ | 3,238 | $ | 3,348 | ||||
| Comprehensive income attributable to: | ||||||||||
| Limited partners | ||||||||||
| Net income | $ | 884 | $ | 764 | $ | 136 | ||||
| Other comprehensive income (loss) | 74 | (178 | ) | 183 | ||||||
| 958 | 586 | 319 | ||||||||
| General partner | ||||||||||
| Net income | — | — | — | |||||||
| Other comprehensive income (loss) | — | — | — | |||||||
| — | — | — | ||||||||
| Non-controlling interests | ||||||||||
| Redeemable/exchangeable and special limited partnership units | ||||||||||
| Net income | 896 | 1,085 | 233 | |||||||
| Other comprehensive income (loss) | 74 | (252 | ) | 312 | ||||||
| 970 | 833 | 545 | ||||||||
| Limited partnership units of Brookfield Office Properties Exchange LP | ||||||||||
| Net income | 6 | 17 | 6 | |||||||
| Other comprehensive income (loss) | 1 | (4 | ) | 8 | ||||||
| 7 | 13 | 14 | ||||||||
| FV LTIP units of the Operating Partnership | ||||||||||
| Net income | 1 | — | — | |||||||
| Other comprehensive income (loss) | — | — | — | |||||||
| 1 | — | — | ||||||||
| Class A shares of Brookfield Property REIT Inc. | ||||||||||
| Net income | 169 | 112 | — | |||||||
| Other comprehensive income (loss) | 14 | (26 | ) | — | ||||||
| 183 | 86 | — | ||||||||
| Interests of others in operating subsidiaries and properties | ||||||||||
| Net income | 1,201 | 1,676 | 2,093 | |||||||
| Other comprehensive income (loss) | 160 | 44 | 377 | |||||||
| 1,361 | 1,720 | 2,470 | ||||||||
| Total comprehensive income | $ | 3,480 | $ | 3,238 | $ | 3,348 | ||||
See accompanying notes to the consolidated financial statements.
- F-8 -
Brookfield Property Partners L.P.
Consolidated Statements of Changes in Equity
| Limited partners | General partner | Preferred Equity | Non-controlling interests | |||||||||||||||||||||||||||||||||||||||||||||||||||
| (US$ Millions) | Capital | Retained earnings | Ownership changes | Accumulated other compre-hensive (loss) income | Limited partners equity | Capital | Retained earnings | Ownership changes | Accumulated other compre-hensive (loss) income | General partner equity | Total preferred equity | Redeemable/ exchangeable and special limited partnership units | Limited partnership units of Brookfield Office Properties Exchange LP | FV LTIP units of the Operating Partnership | Class A shares of Brookfield Property REIT Inc. | Interests of others in operating subsidiaries and properties | Total equity | |||||||||||||||||||||||||||||||||||||
| Balance as at Dec. 31, 2018 | $ | 8,987 | $ | 2,234 | $ | 1,657 | $ | (525 | ) | $ | 12,353 | $ | 4 | $ | 2 | $ | (2 | ) | $ | — | $ | 4 | $ | — | $ | 12,740 | $ | 96 | $ | — | $ | 3,091 | $ | 18,456 | $ | 46,740 | ||||||||||||||||||
| Net income | — | 884 | — | — | 884 | — | — | — | — | — | — | 896 | 6 | 1 | 169 | 1,201 | 3,157 | |||||||||||||||||||||||||||||||||||||
| Other comprehensive income | — | — | — | 74 | 74 | — | — | — | — | — | — | 74 | 1 | — | 14 | 160 | 323 | |||||||||||||||||||||||||||||||||||||
| Total comprehensive income | — | 884 | — | 74 | 958 | — | — | — | — | — | — | 970 | 7 | 1 | 183 | 1,361 | 3,480 | |||||||||||||||||||||||||||||||||||||
| Distributions | — | (573 | ) | — | — | (573 | ) | — | — | — | — | — | — | (580 | ) | (4 | ) | (1 | ) | (108 | ) | (3,225 | ) | (4,491 | ) | |||||||||||||||||||||||||||||
| Preferred distributions | — | (15 | ) | — | — | (15 | ) | — | — | — | — | — | — | — | — | — | — | — | (15 | ) | ||||||||||||||||||||||||||||||||||
| Issuances / repurchases of equity interests in operating subsidiaries | (439 | ) | 9 | (38 | ) | — | (468 | ) | — | — | — | — | — | 420 | (21 | ) | — | 4 | (107 | ) | (607 | ) | (779 | ) | ||||||||||||||||||||||||||||||
| Exchange of exchangeable units | 8 | — | 2 | — | 10 | — | — | — | — | — | — | 2 | (12 | ) | — | — | — | — | ||||||||||||||||||||||||||||||||||||
| Conversion of Class A shares of Brookfield Property REIT Inc. | 701 | — | 364 | — | 1,065 | — | — | — | — | — | — | — | — | — | (1,065 | ) | — | — | ||||||||||||||||||||||||||||||||||||
| Change in relative interests of non-controlling interests | — | — | (25 | ) | (31 | ) | (56 | ) | — | — | 1 | (1 | ) | — | — | 89 | — | 31 | (64 | ) | — | — | ||||||||||||||||||||||||||||||||
| Balance as at Dec. 31, 2019 | $ | 9,257 | $ | 2,539 | $ | 1,960 | $ | (482 | ) | $ | 13,274 | $ | 4 | $ | 2 | $ | (1 | ) | $ | (1 | ) | $ | 4 | $ | 420 | $ | 13,200 | $ | 87 | $ | 35 | $ | 1,930 | $ | 15,985 | $ | 44,935 | |||||||||||||||||
| Balance as at Dec. 31, 2017 | $ | 5,613 | $ | 1,878 | $ | 140 | $ | (236 | ) | $ | 7,395 | $ | 4 | $ | 2 | $ | — | $ | — | $ | 6 | $ | — | $ | 14,500 | $ | 285 | $ | — | $ | — | $ | 12,938 | $ | 35,124 | |||||||||||||||||||
| Net income | — | 764 | — | — | 764 | — | — | — | — | — | — | 1,085 | 17 | — | 112 | 1,676 | 3,654 | |||||||||||||||||||||||||||||||||||||
| Other comprehensive income (loss) | — | — | — | (178 | ) | (178 | ) | — | — | — | — | — | — | (252 | ) | (4 | ) | — | (26 | ) | 44 | (416 | ) | |||||||||||||||||||||||||||||||
| Total comprehensive income (loss) | — | 764 | — | (178 | ) | 586 | — | — | — | — | — | — | 833 | 13 | — | 86 | 1,720 | 3,238 | ||||||||||||||||||||||||||||||||||||
| Distributions | — | (410 | ) | — | — | (410 | ) | — | — | — | — | — | — | (551 | ) | (9 | ) | — | (89 | ) | (2,739 | ) | (3,798 | ) | ||||||||||||||||||||||||||||||
| Issuances / repurchases of equity interests in operating subsidiaries | 2,137 | 2 | 86 | — | 2,225 | — | — | — | — | — | — | 27 | — | — | 3,387 | 6,537 | 12,176 | |||||||||||||||||||||||||||||||||||||
| Exchange of exchangeable units | 156 | — | 19 | (2 | ) | 173 | — | — | — | — | — | — | 31 | (204 | ) | — | — | — | — | |||||||||||||||||||||||||||||||||||
| Conversion of Class A shares of Brookfield Property REIT Inc. | 1,081 | — | 296 | — | 1,377 | — | — | — | — | — | — | 305 | — | — | (1,682 | ) | — | — | ||||||||||||||||||||||||||||||||||||
| Change in relative interests of non-controlling interests | — | — | 1,116 | (109 | ) | 1,007 | — | — | (2 | ) | — | (2 | ) | — | (2,405 | ) | 11 | — | 1,389 | — | — | |||||||||||||||||||||||||||||||||
| Balance as at Dec. 31, 2018 | $ | 8,987 | $ | 2,234 | $ | 1,657 | $ | (525 | ) | $ | 12,353 | $ | 4 | $ | 2 | $ | (2 | ) | $ | — | $ | 4 | $ | — | $ | 12,740 | $ | 96 | $ | — | $ | 3,091 | $ | 18,456 | $ | 46,740 | ||||||||||||||||||
| Balance as at Dec. 31, 2016 | $ | 5,743 | $ | 2,085 | $ | 127 | $ | (419 | ) | $ | 7,536 | $ | 4 | $ | 2 | $ | — | $ | — | $ | 6 | $ | — | $ | 14,523 | $ | 293 | $ | — | $ | — | $ | 11,803 | $ | 34,161 | |||||||||||||||||||
| Net income | — | 136 | — | — | 136 | — | — | — | — | — | — | 233 | 6 | — | — | 2,093 | 2,468 | |||||||||||||||||||||||||||||||||||||
| Other comprehensive income (loss) | — | — | — | 183 | 183 | — | — | — | — | — | — | 312 | 8 | — | — | 377 | 880 | |||||||||||||||||||||||||||||||||||||
| Total comprehensive income (loss) | — | 136 | — | 183 | 319 | — | — | — | — | — | — | 545 | 14 | — | — | 2,470 | 3,348 | |||||||||||||||||||||||||||||||||||||
| Distributions | — | (301 | ) | — | — | (301 | ) | — | — | — | — | — | — | (516 | ) | (13 | ) | — | — | (2,685 | ) | (3,515 | ) | |||||||||||||||||||||||||||||||
| Issuances / repurchases of equity interests in operating subsidiaries | (136 | ) | (42 | ) | 13 | — | (165 | ) | — | — | — | — | — | — | (53 | ) | (2 | ) | — | — | 1,350 | 1,130 | ||||||||||||||||||||||||||||||||
| Exchange of exchangeable units | 6 | — | — | — | 6 | — | — | — | — | — | — | 1 | (7 | ) | — | — | — | — | ||||||||||||||||||||||||||||||||||||
| Balance as at Dec. 31, 2017 | $ | 5,613 | $ | 1,878 | $ | 140 | $ | (236 | ) | $ | 7,395 | $ | 4 | $ | 2 | $ | — | $ | — | $ | 6 | $ | — | $ | 14,500 | $ | 285 | $ | — | $ | — | $ | 12,938 | $ | 35,124 | |||||||||||||||||||
See accompanying notes to the consolidated financial statements.
- F-9 -
Brookfield Property Partners L.P.
Consolidated Statements of Cash Flows
| (US$ Millions) Years ended Dec. 31, | Note | 2019 | 2018 | 2017 | ||||||
| Operating activities | ||||||||||
| Net income | $ | 3,157 | $ | 3,654 | $ | 2,468 | ||||
| Share of equity accounted earnings, net of distributions | (1,499 | ) | (429 | ) | (592 | ) | ||||
| Fair value (gains), net | 30 | (596 | ) | (2,466 | ) | (1,254 | ) | |||
| Deferred income tax expense (benefit) | 18 | 32 | (218 | ) | 20 | |||||
| Depreciation and amortization | 28 | 341 | 308 | 275 | ||||||
| Working capital and other | (811 | ) | 508 | (278 | ) | |||||
| 624 | 1,357 | 639 | ||||||||
| Financing activities | ||||||||||
| Debt obligations, issuance | 23,797 | 29,804 | 17,154 | |||||||
| Debt obligations, repayments | (21,127 | ) | (19,936 | ) | (14,124 | ) | ||||
| Capital securities, issued | — | — | 249 | |||||||
| Capital securities, redeemed | (420 | ) | (905 | ) | (297 | ) | ||||
| Preferred equity, issued | 420 | — | — | |||||||
| Non-controlling interests, issued | 1,432 | 3,180 | 2,391 | |||||||
| Non-controlling interests, purchased | (15 | ) | — | (480 | ) | |||||
| Repayment of lease liabilities | (17 | ) | — | — | ||||||
| Limited partnership units, issued | 13 | 501 | — | |||||||
| Limited partnership units, repurchased | (452 | ) | (81 | ) | (136 | ) | ||||
| Class A shares of Brookfield Property REIT Inc., repurchased | (102 | ) | — | — | ||||||
| Distributions to non-controlling interests in operating subsidiaries | (3,140 | ) | (2,631 | ) | (2,679 | ) | ||||
| Preferred distributions | (15 | ) | — | — | ||||||
| Distributions to limited partnership unitholders | (573 | ) | (410 | ) | (301 | ) | ||||
| Distributions to redeemable/exchangeable and special limited partnership unitholders | (580 | ) | (551 | ) | (516 | ) | ||||
| Distributions to holders of Brookfield Office Properties Exchange LP units | (4 | ) | (9 | ) | (13 | ) | ||||
| Distributions to holders of FV LTIP units of the Operating Partnership | (1 | ) | — | — | ||||||
| Distributions to holders of Class A shares of Brookfield Property REIT Inc. | (108 | ) | (89 | ) | — | |||||
| (892 | ) | 8,873 | 1,248 | |||||||
| Investing activities | ||||||||||
| Acquisitions | ||||||||||
| Investment properties | (4,549 | ) | (2,293 | ) | (1,944 | ) | ||||
| Property, plant and equipment | (372 | ) | (478 | ) | (250 | ) | ||||
| Equity accounted investments | (684 | ) | (622 | ) | (1,060 | ) | ||||
| Financial assets and other | (2,120 | ) | (1,982 | ) | (501 | ) | ||||
| Acquisition of subsidiaries | — | (12,035 | ) | (3,897 | ) | |||||
| Dispositions | ||||||||||
| Investment properties | 4,200 | 5,619 | 3,823 | |||||||
| Property, plant and equipment | 17 | 522 | — | |||||||
| Equity accounted investments | 1,109 | 1,140 | 1,006 | |||||||
| Financial assets and other | 1,775 | 1,952 | 71 | |||||||
| Disposition of subsidiaries | 43 | (21 | ) | (89 | ) | |||||
| Cash impact of deconsolidation | (1,132 | ) | (100 | ) | 905 | |||||
| Restricted cash and deposits | 102 | (108 | ) | 50 | ||||||
| (1,611 | ) | (8,406 | ) | (1,886 | ) | |||||
| Cash and cash equivalents | ||||||||||
| Net change in cash and cash equivalents during the year | (1,879 | ) | 1,824 | 1 | ||||||
| Effect of exchange rate fluctuations on cash and cash equivalents held in foreign currencies | 29 | (27 | ) | 34 | ||||||
| Balance, beginning of year | 3,288 | 1,491 | 1,456 | |||||||
| Balance, end of year | $ | 1,438 | $ | 3,288 | $ | 1,491 | ||||
| Supplemental cash flow information | ||||||||||
| Cash paid for: | ||||||||||
| Income taxes | $ | 253 | $ | 236 | $ | 82 | ||||
| Interest (excluding dividends on capital securities) | $ | 2,476 | $ | 2,253 | $ | 1,567 | ||||
See accompanying notes to the consolidated financial statements.
- F-10 -
Brookfield Property Partners L.P.
Notes to the Consolidated Financial Statements
NOTE 1. ORGANIZATION AND NATURE OF THE BUSINESS
Brookfield Property Partners L.P. (“BPY” or the “partnership”) was formed as a limited partnership under the laws of Bermuda, pursuant to a limited partnership agreement dated January 3, 2013, as amended and restated on August 8, 2013. BPY is a subsidiary of Brookfield Asset Management Inc. (“Brookfield Asset Management” or the “parent company”) and is the primary entity through which the parent company and its affiliates own, operate, and invest in commercial and other income producing property on a global basis.
The partnership’s sole direct investments are a 50% managing general partnership units (“GP Units”) interest in Brookfield Property L.P. (the “operating partnership”) and an interest in BP US REIT LLC, which holds the partnership’s interest in commercial and other income producing property operations. The GP Units provide the partnership with the power to direct the relevant activities of the operating partnership.
The partnership’s limited partnership units (“BPY Units” or “LP Units”) are listed and publicly traded on the Nasdaq Stock Market (“Nasdaq”) and the Toronto Stock Exchange (“TSX”) under the symbols “BPY” and “BPY.UN”, respectively. The partnership’s Preferred Units, Series 1, Preferred Units, Series 2, and Preferred Units, Series 3 are traded on the Nasdaq under the symbols “BPYPP”, “BPYPO”, and “BPYPN”, respectively.
The registered head office and principal place of business of the partnership is 73 Front Street, 5th Floor, Hamilton HM 12, Bermuda.
NOTE 2. SUMMARY OF SIGNIFICANT ACCOUNTING POLICIES
| a) | Statement of compliance |
These consolidated financial statements of the partnership and its subsidiaries have been prepared in accordance with International Financial Reporting Standards (“IFRS”) as issued by the International Accounting Standards Board (“IASB”).
The consolidated financial statements were approved and authorized for issue by the Board of Directors of the partnership on February 4, 2020.
| b) | Basis of presentation |
These consolidated financial statements have been prepared on a going concern basis and are presented in United States (“U.S.”) Dollars rounded to the nearest million unless otherwise indicated.
| (i) | Subsidiaries |
The consolidated financial statements include the accounts of the partnership and its subsidiaries over which the partnership has control. Control exists when the partnership has power over its investee, has exposure, or rights, to variable returns from its involvement with the investee and has the ability to use its power over the investee to affect the amount of its returns. The partnership considers all relevant facts and circumstances in assessing whether or not the partnership’s interests in the investee are sufficient to give it power over the investee.
Consolidation of a subsidiary begins on the date on which the partnership obtains control over the subsidiary and ceases when the partnership loses control over the subsidiary. Income and expenses of a subsidiary acquired or disposed of during a reporting period are consolidated only for the period when the partnership has control over the subsidiary. Changes in the partnership’s ownership interests in subsidiaries that do not result in loss of control over the subsidiary are accounted for as equity transactions whereby the difference between the amount by which the non-controlling interests are adjusted and the fair value of the consideration paid or received, are recognized directly in equity and attributed to owners of the partnership.
All accounts and transactions among the partnership and its subsidiaries are eliminated on consolidation. In cases where a subsidiary reports under a different accounting policy, adjustments are made to the financial statements of the subsidiary to present its financial position and results of operations in accordance with the partnership’s accounting policy.
Net income and each component of other comprehensive income are attributed to owners of the partnership and to non-controlling interests. Non-controlling interests in the partnership’s operating subsidiaries and properties, redeemable/exchangeable partnership units of the operating partnership (“Redeemable/Exchangeable Partnership Units”), special limited partnership units of the operating partnership (“Special LP Units”), limited partnership units of Brookfield Office Properties Exchange LP (“Exchange LP Units”), FV LTIP units of the Operating Partnership (“FV LTIP Units”) and Class A stock, par value $0.01 per share, of
- F-11 -
Brookfield Property REIT Inc. (“BPR Units”) are presented separately in equity on the consolidated balance sheets. The Redeemable/Exchangeable Partnership Units, Exchange LP Units and BPR Units have the same economic attributes as LP Units. Accordingly, the net income and components of other comprehensive income allocated to these units are equivalent to that allocated to the LP Units (on a per unit basis).
Net income and the components of comprehensive income of the partnership’s operating subsidiaries and properties are generally allocated between the partnership and non-controlling equity holders based on the relative proportion of equity interests. Certain of the partnership’s subsidiaries are subject to profit sharing arrangements with affiliated entities who hold non-controlling interests that result in allocation of income on an other than proportionate basis if specified targets are met. In these circumstances, net income is allocated between the partnership and non-controlling interests based on proportionate equity interest until the attribution of profits under the agreement is no longer subject to adjustment based on future events. In the period that allocation of the subsidiary’s cumulative earnings under the profit-sharing arrangement is no longer subject to adjustment, it is recognized as a fair value loss attributable to unitholders for the period.
| (ii) | Associates and joint ventures |
An associate is an entity over which the partnership has significant influence. Significant influence is the power to participate in the financial and operating policy decisions of the investee. The partnership is presumed to have significant influence when it holds 20 percent or more of the voting rights of an investee, unless it can be clearly demonstrated that this is not the case. The partnership does not control its associates.
A joint arrangement is an arrangement in which two or more parties have joint control. Joint control is the contractually agreed upon sharing of control where decisions about the relevant activities require the unanimous consent of the parties sharing control. A joint venture is a joint arrangement where the parties that have joint control have rights to the net assets of the arrangement. None of the parties involved have unilateral control of a joint venture.
The partnership accounts for its interests in associates and joint ventures using the equity method of accounting. Under the equity method, investment balances in an associate or joint venture are carried on the consolidated balance sheets at initial cost as adjusted for the partnership’s proportionate share of profit or loss and other comprehensive income of the joint venture or associate. When an interest in an associate or joint venture is initially acquired or increases, the partnership determines its share of the net fair value of the identifiable assets and liabilities of the investee that it has acquired, consistent with the procedure performed when acquiring control of a business. Goodwill relating to an associate or joint venture, represented as an excess of the cost of the investment over the net fair value of the partnership’s share of the net fair value of the identifiable assets and liabilities, is included in the carrying amount of the investment. Any excess of the partnership’s share of the net fair value of the associate’s or joint venture’s identifiable assets and liabilities over the cost of the investment results in a gain that is included in the partnership’s share of the associate or joint venture’s profit or loss in the period in which the investment is acquired or increases.
The partnership determines at the end of each reporting period whether there exist any indications that an investment may be impaired. If any such indication exists, the partnership estimates the recoverable amount of the asset, which is the higher of (i) fair value less costs to sell and (ii) value in use. Value in use is the present value of the future cash flows expected to be derived from such an investment and may result in a measure which is different from fair value less costs to sell. For equity accounted investments, for which quoted market prices exist, the partnership also considers whether a significant or prolonged decline in the fair value of the equity instrument below its carrying value is also objective evidence of impairment.
When the partnership transacts with a joint venture or an associate, any gain or loss is eliminated only to the extent of the partnership’s proportionate share and the remaining amounts are recognized in the partnership’s consolidated financial statements. Outstanding balances between the partnership and jointly controlled entities are not eliminated on the balance sheet.
| (iii) | Joint operations |
A joint operation is a joint arrangement whereby the parties that have joint control of the arrangement have rights to assets and obligations for liabilities relating to the arrangement. This usually results from direct interests in the assets and liabilities of an investee rather than through the establishment of a separate legal entity. None of the parties involved have unilateral control of a joint operation. The partnership recognizes its assets, its liabilities and its share of revenues and expenses of the joint operations in accordance with the IFRS applicable to the particular assets, liabilities, revenues and expenses.
When the partnership sells or contributes assets to a joint operation in which it is a joint operator, the partnership is considered to be conducting transactions with the other parties to the joint operation, and any gain or loss resulting from the transactions is recognized in the partnership’s consolidated financial statements only to the extent of the other parties’ interests in the joint
- F-12 -
operation. When the partnership purchases an asset from a joint operation in which it is a joint operator, the partnership does not recognize its share of the gain or loss until those assets are resold to a third party.
| c) | Foreign currency translation and transactions |
The U.S. Dollar is the functional currency and presentation currency of the partnership. The functional currency of each of the partnership’s subsidiaries, associates, joint ventures and joint operations is determined based on their primary economic environment, the currency in which funds from financing activities are generated and the currency in which receipts from operating activities are usually retained.
Subsidiaries, associates or joint ventures having a functional currency other than the U.S. Dollar translate the carrying amounts of their assets and liabilities when reporting to the partnership at the rate of exchange prevailing as of the balance sheet date, and their revenues and expenses at average exchange rates during the quarterly reporting period. Any gains or losses on foreign currency translation are recognized by the partnership in other comprehensive income. On disposition or partial disposition resulting in the loss of control of a foreign operation (i.e., any subsidiary, associate, or joint arrangement of the partnership with a functional currency other than the U.S. Dollar), the accumulated foreign currency translation relating to that foreign operation is reclassified to fair value gain or loss in net income. On partial disposal of a foreign operation in which control is retained, the proportionate share of the accumulated foreign currency translation relating to that foreign operation is reattributed to the non-controlling interests.
The partnership’s foreign currency transactions are translated into the functional currency using exchange rates as of the date of the transactions. At the end of each reporting period, foreign currency denominated monetary assets and liabilities are translated to the functional currency using the exchange rate prevailing as of the balance sheet date with any gain or loss recognized in net income, except for those related to monetary liabilities qualified as hedges of the partnership’s investment in foreign operations or intercompany loans with foreign operations for which settlement is neither planned nor likely to occur in the foreseeable future, which are included in other comprehensive income. Non-monetary assets and liabilities measured at fair value are translated at the exchange rate prevailing as of the date when the fair value was determined. Foreign currency denominated non-monetary assets and liabilities, measured at historic cost, are translated at the rate of exchange at the transaction date.
| d) | Cash and cash equivalents |
Cash and cash equivalents includes cash on hand and all non-restricted highly liquid investments with original maturities of three months or less.
| e) | Investment properties |
Investment properties consists of commercial properties which are principally held to earn rental income and commercial developments that are being constructed or developed for future use as commercial properties. Investment properties are measured initially at cost, or fair value if acquired in a business combination (see Note 2(p), Business Combinations, for further discussion). The cost of commercial development properties includes direct development costs, realty taxes, borrowing costs directly attributable to the development and administrative costs, e.g., salaries and overhead that are specifically attributable to a development project. The partnership elects the fair value model for all investment properties and measures them at fair value subsequent to initial recognition on the consolidated balance sheet. As a result, it is not necessary to assess the carrying amounts of the investment properties for impairment.
Substantially all of the partnership’s investment properties are valued using one of two accepted income approaches, the discounted cash flow approach or the direct capitalization approach. Under the discounted cash flow approach, cash flows for each property are forecast for an assumed holding period, generally, ten years. A capitalization rate is applied to the terminal year net operating income and an appropriate discount rate is applied to those cash flows to determine a value at the reporting date. Under the direct capitalization method, a capitalization rate is applied to estimated stabilized annual net operating income to determine value. In accordance with its policy, the partnership generally measures and records its commercial properties and developments using valuations prepared by management. However, for certain subsidiaries, the partnership relies on quarterly or annual valuations prepared by external valuation professionals. Where an external appraisal is obtained for a property that is valued using a model developed by management, the partnership compares the results of those external appraisals to its internally prepared values and reconcile significant differences when they arise. Discount and terminal capitalization rates are verified by comparing to market data, third party reports, research material and brokers opinions. Where there has been a recent market transaction for a specific property, such as an acquisition or sale of a partial interest, the partnership values the property on that basis.
Borrowing costs associated with direct expenditures on properties under development or redevelopment are capitalized. Borrowing costs are also capitalized on those properties acquired specifically for redevelopment in the short-term where activities necessary to prepare them for redevelopment are in progress. The amount of borrowing costs capitalized is determined first by borrowings specific to a property where relevant, and then by applying a weighted average borrowing cost to eligible expenditures after adjusting for borrowings specific to other developments. Where borrowings are associated with specific developments, the amount
- F-13 -
capitalized is the gross borrowing costs incurred less any incidental investment income. Borrowing costs are capitalized from the commencement of the development until the date of practical completion. The capitalization of borrowing costs is suspended if there are prolonged periods when development activity is interrupted. The partnership considers practical completion to have occurred when the property is capable of operating in the manner intended by management. Generally this occurs upon completion of construction and receipt of all necessary occupancy and other material permits. Where the partnership has pre-leased space as of or prior to the start of the development and the lease requires the partnership to construct tenant improvements which enhance the value of the property, practical completion is considered to occur on completion of such improvements.
Initial direct leasing costs incurred by the partnership in negotiating and arranging tenant leases are included in the cost of investment properties.
| f) | Assets held for sale |
Non-current assets and groups of assets and liabilities which comprise disposal groups are presented as assets held for sale where the asset or disposal group is available for immediate sale in its present condition, and the sale is highly probable. For this purpose, a sale is highly probable if management is committed to a plan to achieve the sale; there is an active program to find a buyer; the non-current asset or disposal group is being actively marketed for sale at a price that is reasonable in relation to its current fair value; the sale is anticipated to be completed within one year from the date of classification; and it is unlikely there will be significant changes to the plan or that the plan will be withdrawn. Non-current assets and disposal groups held for sale that are not investment properties are recorded at the lower of carrying amount and fair value less costs to sell on the consolidated balance sheet. Any gain or loss arising from the change in measurement basis as a result of reclassification is recognized in the profit or loss at the time of reclassification. Investment properties that are held for sale are recorded at fair value determined in accordance with IFRS 13, Fair Value Measurement.
Where a component of an entity has been disposed of, or is classified as held for sale, and it represents a separate major line of business or geographical area of operations or is a subsidiary acquired exclusively with a view to resale, the related results of operations and gain or loss on reclassification or disposition are presented in discontinued operations.
| g) | Hospitality assets |
The partnership accounts for its investments in hospitality properties as property, plant and equipment under the revaluation model. Hospitality properties are recognized initially at cost if acquired in an asset acquisition, or fair value if acquired in a business combination (see Note 2(p), Business Combinations, for further discussion) and subsequently carried at fair value at the revaluation date less any accumulated impairment and subsequent accumulated depreciation. The partnership depreciates these assets on a straight-line basis over their relevant estimated useful lives. Fair values of hospitality properties are determined using a depreciated replacement cost method based on the age, physical condition and the construction costs of the assets. Fair value estimates for hospitality properties represent the estimated fair value of the property, plant and equipment of the hospitality business only and do not include any associated intangible assets.
Revaluations of hospitality properties are performed annually at December 31, the end of the fiscal year. Where the carrying amount of an asset is increased as a result of a revaluation, the increase is recognized in other comprehensive income and accumulated in equity within revaluation surplus, unless the increase reverses a previously recognized revaluation loss recorded through prior period net income, in which case that portion of the increase is recognized in net income. Where the carrying amount of an asset is decreased, the decrease is recognized in other comprehensive income to the extent of any balance existing in revaluation surplus in respect of the asset, with the remainder recognized in net income. Revaluation gains are recognized in other comprehensive income, and are not subsequently recycled into profit or loss. The cumulative revaluation surplus is transferred directly to retained earnings when the asset is derecognized.
Certain of the partnership’s hospitality assets are right-of-use assets arising from leases where the partnership is the lessee, which are subsequently measured on a depreciated cost basis since they represent a separate class of property, plant and equipment to the partnership’s owned hospitality assets (see Note 2(j), Leases, for further discussion).
| h) | Inventory |
Develop-for-sale multifamily projects, residential development lots, homes and residential condominium projects are recorded in inventory. Residential development lots are recorded at the lower of cost, including pre-development expenditures and capitalized borrowing costs, and net realizable value, which the company determines as the estimated selling price of the inventory in the ordinary course of business in its completed state, less estimated expenses, including holding costs, costs to complete and costs to sell. Certain of the partnership’s inventory are right-of-use assets arising from leases where the partnership is the lessee, which are subsequently measured at cost subject to impairment (see Note 2(j), Leases, for further discussion).
- F-14 -
| i) | Fair value measurement |
Fair value is the price that would be received to sell an asset or paid to transfer a liability in an orderly transaction between market participants at the measurement date, regardless of whether that price is directly observable or estimated using another valuation technique. In estimating the fair value of an asset or a liability, the partnership takes into account the characteristics of the asset or liability and how market participants would take those characteristics into account when pricing the asset or liability at the measurement date.
Inputs to fair value measurement techniques are disaggregated into three hierarchical levels, which are directly based on the degree to which inputs to fair value measurement techniques are observable by market participants:
| • | Level 1 – Inputs are unadjusted, quoted prices in active markets for identical assets or liabilities at the measurement date. |
| • | Level 2 – Inputs (other than quoted prices included in Level 1) are either directly or indirectly observable for the asset or liability through correlation with market data at the measurement date and for the duration of the asset’s or liability’s anticipated life. |
| • | Level 3 – Inputs are unobservable and reflect management’s best estimate of what market participants would use in pricing the asset or liability at the measurement date. Consideration is given to the risk inherent in the valuation technique and the risk inherent in the inputs in determining the estimate. |
Fair value measurements are adopted by the partnership to calculate the carrying amounts of various assets and liabilities.
| j) | Leases |
The partnership adopted IFRS 16, Leases (“IFRS 16”) effective January 1, 2019. It supersedes IAS 17, Leases (“IAS 17”) and related interpretations. IFRS 16 brings most leases on-balance sheet as right-of-use (“ROU”) assets and lease liabilities for lessees under a single model, eliminating the distinction between operating and finance leases. Lessor accounting remains largely unchanged (see Note 2(q), Revenue Recognition for further discussion). The partnership has applied IFRS 16 using the modified retrospective approach and comparative periods are not restated. The adoption of IFRS 16 resulted in the recognition of lease liabilities for those leases previously classified as operating leases of $873 million, ROU assets of $721 million that are classified as investment properties, $122 million that are classified as property, plant and equipment, $22 million that are classified as inventory and an immaterial impact to equity. These amounts do not include the lease liabilities and ROU assets of certain investments that were deconsolidated by the partnership on January 31, 2019. See Note 5, Investment Properties for further information.
In applying IFRS 16 for the first time, the partnership has applied the following practical expedients permitted by the standard on a lease-by-lease basis. These practical expedients are only available upon adoption and cannot be applied for any new lease executed after adoption:
| • | the accounting for operating leases with a remaining lease term of less than 12 months as of January 1, 2019 as short-term leases; |
| • | the exclusion of initial direct costs for the measurement of the ROU assets; |
| • | the use of hindsight in determining the lease term where the contract contains options to extend or terminate the lease; and |
| • | adjusting the measurement of the ROU assets by the amount of any provision for onerous leases recognized under IAS 37, Provisions, Contingent Liabilities and Contingent Assets (“IAS 37”). |
The partnership has also elected not to reassess whether a contract is or contains a lease. Accordingly, the definition of a lease in accordance with IAS 17 and IFRIC 4, Determining Whether an Arrangement Contains a Lease (“IFRIC 4”) will continue to be applied to leases entered into or modified before January 1, 2019.
Lease obligations at December 31, 2018 were as follows, as disclosed in the partnership’s annual report on Form 20-F for the year-ended December 31, 2018:
| (US$ Millions) | Dec. 31, 2018 | ||
| Less than 1 year | $ | 104 | |
| 1-5 years | 401 | ||
| More than 5 years | 5,631 | ||
| Total | 6,136 | ||
- F-15 -
The lease obligations as disclosed in the table above included leases that are classified as finance leases, short-term leases and low-value leases, which are immaterial. It also included operating leases held by certain investments that were deconsolidated as of January 31, 2019. The partnership calculated the lease liabilities for the operating leases by discounting the future lease obligations at the respective incremental borrowing rates at the date of initial adoption. The weighted average lessee’s incremental borrowing rate applied to the lease liabilities recognized at the date of initial adoption was 6.8%. Total lease liabilities for the year ended December 31, 2019 consists of $43 million current lease liabilities and $889 million non-current lease liabilities. For the year ended December 31, 2019, ROU assets of $752 million that are classified as investment properties, $175 million that are classified as property, plant and equipment, $31 million that are classified as inventory.
The partnership determines at the inception of a contract if the arrangement is, or contains, a lease. A lease conveys the right to control the use of an identified asset for a period of time in exchange for consideration. The criteria specified in IFRS 16 apply to contracts entered into, or changed, on or after January 1, 2019. Lease components and non-lease components are separated on a relative stand-alone selling price basis for the partnership’s leases as lessor. For the partnership’s leases as lessee, the partnership applies the practical expedient which is available by asset class not to allocate contract consideration between lease and non-lease components. The change in definition of a lease mainly relates to the concept of control. IFRS 16 determines whether a contract contains a lease on the basis of whether the customer has the right to control the use of an identified asset for a period of time in exchange for consideration.
The partnership recognizes a ROU asset and a corresponding lease liability with respect to all lease agreements in which it is the lessee, except for leases with a lease term of 12 months or less (“short-term leases”) and leases of low value assets (“low-value leases”). For these leases, the partnership recognizes the lease payments as an expense on a straight-line basis over the lease term.
The lease liability is initially measured at the present value of the lease payments that are not paid at the commencement date, discounted using the rate implicit in the lease if that rate can be readily determined. If the rate implicit in the lease cannot be readily determined, the partnership uses the incremental borrowing rate. The incremental borrowing rate is the rate of interest that a lessee would have to pay to borrow over a similar term, and with a similar security, the funds necessary to obtain an asset of similar value to the ROU asset in a similar economic environment. This rate is expected to be similar to the interest rate implicit in the lease. Where a lease contains a parental guarantee, the incremental borrowing rate may be determined with reference to the parent rather than the lessee. The partnership uses a single discount rate to account for portfolios of leases with similar characteristics. Lease payments included in the measurement of the lease liability is comprised of i) fixed lease payments, less any lease incentives; ii) variable lease payments that depend on an index or rate, initially measured using the index or rate at the commencement date; iii) the amount expected to be payable by the lessee under residual value guarantees; iv) the exercise price of purchase options, if the lessee is reasonably certain to exercise the options; and v) payments of penalties for terminating the lease, if the lease term reflects the exercise of an option to terminate the lease. Lease liabilities are presented in Accounts payable and other liabilities (current) and Other non-current liabilities (non-current) on the consolidated balance sheets. Lease liabilities are subsequently measured under the effective interest method that is increased by the interest expense on the lease liabilities recognized on the consolidated statements of income and reduced by lease payments made that are recognized in the consolidated statements of cash flows. Lease payments not included in the measurement of lease liabilities continue to be recognized in the direct commercial property expense, direct hospitality expense or general and administrative expense lines on the consolidated statements of income.
ROU asset comprises the initial measurement of the corresponding lease liability, lease payments made at or before the commencement day and any initial direct costs. ROU assets classified as investment properties are subsequently measured at fair value. ROU assets classified as property, plant and equipment are subsequently measured on a depreciated cost basis over the lease term. If such lease transfers ownership of the underlying asset or the cost of the ROU asset reflects that the partnership expects to exercise a purchase option, the related ROU asset is depreciated over the useful life of the underlying asset. The depreciation starts at the commencement date of the lease. ROU assets classified as inventory are subsequently carried at cost subject to impairment. ROU assets are presented in the respective lines based on their classification on the consolidated balance sheets. Whenever the partnership incurs an obligation for costs to dismantle and remove a leased asset, restore the site on which it is located or restore the underlying asset to the condition required by the terms and conditions of the lease, a provision is recognized and measured under IAS 37. The costs are included in the related ROU asset.
The partnership remeasures lease liabilities and makes a corresponding adjustment to the related ROU assets when i) the lease term has changed or there is a change in the assessment of exercise of a purchase option, in which case the lease liability is remeasured by discounting the revised lease payments using a revised discount rate; ii) the lease payments have changed due to changes in an index or rate or a change in expected payment under a guaranteed residual value, in which cases the lease liability is remeasured by discounting the revised lease payments using the initial discount rate (unless the lease payments change is due to a change in a floating interest rate, in which case a revised discount rate is used); or iii) a lease contract is modified and the lease modification is not accounted for as a separate lease, in which case the lease liability is remeasured by discounting the revised lease payments using a revised discount rate.
- F-16 -
The partnership made additional disclosures in Note 5, Investment Properties, Note 10, Property, Plant And Equipment, Note 13, Other Non-Current Assets, Note 19, Other Non-Current Liabilities, Note 20, Accounts Payable And Other Liabilities, Note 26, Direct Commercial Property Expense and Note 28, Depreciation and Amortization, as a result of the adoption.
| k) | Intangible assets |
Intangible assets acquired in a business combination and recognized separately from goodwill are initially recognized at fair value at the acquisition date. The partnership’s intangible assets are comprised primarily of trademarks and licensing agreements.
Subsequent to initial recognition, intangible assets with a finite life are measured at cost less accumulated amortization and impairment losses. Amortization is calculated on a straight-line basis over the estimated useful life of the intangible asset and is recognized in net income for the respective reporting period. Intangible assets with an indefinite life are measured at cost as adjusted for subsequent impairment. Impairment tests for intangible assets with an indefinite life are performed annually. Impairment losses previously taken may be subsequently reversed in net income of future reporting periods.
| l) | Goodwill |
Goodwill represents the excess of the acquisition price paid for a business combination over the fair value of the net identifiable tangible and intangible assets and liabilities acquired. Upon initial recognition, goodwill is allocated to the cash-generating unit to which it relates. The partnership identifies a cash-generating unit as the smallest identifiable group of assets that generates cash inflows that are largely independent of the cash inflows from other assets or group of assets.
The partnership evaluates the carrying amount of goodwill annually as of December 31 or more often when events or circumstances indicate there may be an impairment. The partnership’s goodwill impairment test is performed at the cash-generating unit level. If assets within a cash-generating unit or the cash-generating unit are impaired, impairments are taken for those assets or the cash-generating unit before any goodwill impairment test is performed. In assessing whether goodwill is impaired, the partnership assesses if the carrying value of a cash-generating unit, including the allocated goodwill, exceeds its recoverable amount determined as the greater of the estimated fair value less costs to sell and the present value of future cash flows expected from the cash-generating unit. Impairment losses recognized first reduce the carrying value of goodwill and any excess is allocated to the carrying amount of assets in the cash-generating unit. Any goodwill impairment is charged to net income in the respective reporting period. Impairment losses on goodwill are not subsequently reversed.
On disposal of a subsidiary, any attributable amount of goodwill is included in determination of the gain or loss on disposal.
| m) | Financial instruments and hedge accounting |
The partnership adopted IFRS 9, Financial Instruments (“IFRS 9”) and the related consequential amendments to other IFRS standards effective January 1, 2018. IFRS 9 introduced new requirements for: 1) the classification and measurement of financial assets and financial liabilities; 2) impairment of financial assets; and 3) general hedge accounting. The partnership adopted IFRS 9 retrospectively with no restatement of comparatives. The adoption did not result in any material adjustment to the carrying amounts of financial assets, financial liabilities or opening retained earnings.
| (i) | Classification and measurement |
Financial assets and financial liabilities are recognized in the partnership’s balance sheet when the partnership becomes a party to the contractual provisions of the instrument. Financial assets and financial liabilities are initially measured at fair value. Transaction costs that are directly attributable to the acquisition or issue of financial assets and financial liabilities (other than financial assets and financial liabilities at fair value through profit or loss) are added to or deducted from the fair value of the financial assets or financial liabilities, as appropriate, on initial recognition. Transaction costs directly attributable to the acquisition of financial assets or financial liabilities at fair value through profit or loss are recognized immediately in profit or loss.
All recognized financial assets are measured subsequently in their entirety at either amortized cost or fair value, depending on the classification of the financial assets.
Debt instruments are subsequently measured at amortized cost where the financial asset is held within a business model whose objective is to hold financial assets in order to collect contractual cash flows and its contractual terms give rise on specified dates to cash flows that are solely payments of principal and interest on the principal amount outstanding. Debt instruments are measured subsequently at fair value through other comprehensive income (“FVTOCI”) where the financial asset is held within a business model whose objective is achieved by both collecting contractual cash flows and selling the financial assets and its contractual terms of the financial asset give rise on specified dates to cash flows that are solely payments of principal and interest on the principal amount outstanding. By default, all other financial assets are measured subsequently at fair value through profit or loss (“FVTPL”). Despite the foregoing, the partnership may make an irrevocable election/designation at initial recognition of a financial
- F-17 -
asset to present subsequent changes in fair value of an equity investment in other or to designate a debt investment that meets the amortized cost or FVTOCI criteria as measured at FVTPL if doing so eliminates or significantly reduces an accounting mismatch.
Debt and equity instruments issued by the partnership are classified as either financial liabilities or as equity in accordance with the substance of the contractual arrangements and the definitions of a financial liability and an equity instrument. Equity instruments issued by the partnership that meet the definition of a financial liability are presented within capital securities on the partnership’s consolidated balance sheets.
All financial liabilities are measured subsequently at amortized cost using the effective interest method or at FVTPL. Financial liabilities are measured at FVTPL when they are (i) contingent consideration of an acquirer in a business combination, (ii) held‑for‑trading, or (iii) designated as at FVTPL. A financial liability is classified as held for trading if it has been acquired principally for the purpose of repurchasing it in the near term, or on initial recognition it is part of a portfolio of identified financial instruments that is managed together and has a recent actual pattern of short‑term profit‑taking or it is a derivative, except for a derivative that is a financial guarantee contract or a designated and effective hedging instrument. A financial liability other than a financial liability held for trading or contingent consideration of an acquirer in a business combination may be designated as at FVTPL in limited circumstances specified in IFRS 9. Financial liabilities at FVTPL are measured at fair value, with any gains or losses arising on changes in fair value recognized in profit or loss to the extent that they are not part of a designated hedging relationship.
The following table presents the types of financial instruments held by the partnership within each financial instrument classification under IFRS 9:
| IAS 39 | IFRS 9 | ||
| Classification | Measurement basis | Classification and measurement basis | |
| Financial assets | |||
| Participating loan interests | Loans and receivables | Amortized cost | FVTPL |
| Loans and notes receivable | Loans and receivables | Amortized cost | Amortized cost |
| Other non-current assets | |||
| Securities designated as fair value through profit and loss (“FVTPL”) | FVTPL | Fair value | FVTPL |
| Derivative assets | FVTPL | Fair value | FVTPL |
| Securities designated as AFS | AFS | Fair value | FVTOCI |
| Restricted cash | Loans and receivables | Amortized cost | Amortized cost |
| Accounts receivable and other | |||
| Derivative assets | FVTPL | Fair value | FVTPL |
| Other receivables | Loans and receivables | Amortized cost | Amortized cost |
| Cash and cash equivalents | Loans and receivables | Amortized cost | Amortized cost |
| Financial liabilities | |||
| Debt obligations | Other liabilities | Amortized cost | Amortized cost |
| Capital securities | Other liabilities | Amortized cost | Amortized cost |
| Capital securities - fund subsidiaries | Other liabilities | Fair value | FVTPL |
| Other non-current liabilities | |||
| Loan payable | FVTPL | Fair value | FVTPL |
| Other non-current financial liabilities | Other liabilities | Amortized cost | Amortized cost |
| Derivative liabilities | FVTPL | Fair value | FVTPL |
| Accounts payable and other liabilities | Other liabilities | Amortized cost | Amortized cost |
The effective interest method is a method of calculating the amortized cost of a debt instrument and of allocating interest income over the relevant period. The effective interest rate is the rate that exactly discounts estimated future cash receipts or payments (including transaction costs and other premiums or discounts) excluding expected credit losses, through the expected life of the instrument to the gross carrying amount of the debt instrument on initial recognition. Amortized cost is the amount at which the financial instrument is measured at initial recognition minus the principal repayments, plus the cumulative amortization using the effective interest method of any difference between that initial amount and the maturity amount, adjusted for any loss allowance (in the case of financial assets).
Financial instruments carried at fair value give rise to fair value gains or losses in each reporting period. Fair values of those financial instruments are determined by reference to quoted bid or ask prices or prices within the bid ask spread, as appropriate,
- F-18 -
and when unavailable, to the closing price of the most recent transaction of that instrument. Fair values of certain financial instruments also incorporate significant use of unobservable inputs which reflect the partnership’s market assumptions. Fair value gains and losses on FVOCI financial assets are recognized in other comprehensive income. Fair value gains and losses on financial instruments designated as FVTPL are recognized in fair value gains, net.
| (ii) | Impairment of financial instruments |
The partnership recognizes a loss allowance for expected credit losses (“ECL”) on debt instruments that are measured at amortized cost or at FVTOCI and other receivables. The amount of expected credit losses is updated at each reporting date to reflect changes in credit risk since initial recognition of the respective financial instrument. For debt instruments, the partnership recognizes lifetime ECL when there has been a significant increase in credit risk since initial recognition. If the credit risk on the financial instrument has not increased significantly since initial recognition, the loss allowance for that financial instrument is measured at an amount equal to 12‑month ECL. Lifetime ECL represents the expected credit losses that will result from all possible default events over the expected life of a financial instrument. In contrast, 12‑month ECL represents the portion of lifetime ECL that is expected to result from default events on a financial instrument that are possible within 12 months after the reporting date. The partnership always recognizes lifetime ECL for other receivables. Any related loss allowances are recorded through profit or loss.
| (iii) | Derivatives and hedging |
The partnership enters into a variety of derivative financial instruments to manage its exposure to interest rate and foreign exchange rate risks, including foreign exchange forward contracts, options, interest rate swaps and interest rate caps. Derivatives are recognized initially at fair value at the date a derivative contract is entered into and are subsequently remeasured to their fair value at each reporting date. The resulting gain or loss is recognized in net income immediately unless the derivative is designated and effective as a hedging instrument, in which event the timing of the recognition in profit or loss depends on the nature of the hedge relationship.
The partnership designates certain derivatives as hedging instruments in respect of foreign currency risk and interest rate risk in cash flow hedges, fair value hedges, or hedges of net investments in foreign operations. The partnership also applies hedge accounting to certain non-derivative financial instruments designated as hedges of net investments in foreign subsidiaries. Hedge accounting is discontinued prospectively when the hedge relationship is terminated or no longer qualifies as a hedge, or when the hedging item is sold or terminated.
In a cash flow hedge, the effective portion of the change in the fair value of the hedging derivative is recognized in other comprehensive income while the ineffective portion is recognized in fair value gains, net. Hedging gains and losses recognized in accumulated other comprehensive income are reclassified to net income in the periods when the hedged item affects net income, or recognized as part of the transaction price when the hedged transaction occurs. The partnership discontinues hedge accounting only when the hedging relationship (or a part thereof) ceases to meet the qualifying criteria. This includes instances when the hedging instrument expires or is sold, terminated or exercised. The discontinuation is accounted for prospectively. Any gain or loss recognized in other comprehensive income and accumulated in the cash flow hedge reserve at that time remains in equity and is reclassified to profit or loss when the forecast transaction occurs. When a forecast transaction is no longer expected to occur, the gain or loss accumulated in cash flow hedge reserve is reclassified immediately to net income.
In a fair value hedge relationship, the fair value change on a qualifying hedging instrument is recognized in profit or loss except when the hedging instrument hedges an equity instrument designated at FVTOCI in which case it is recognized in other comprehensive income. The carrying amount of a hedged item not already measured at fair value is adjusted for the fair value change attributable to the hedged risk with a corresponding entry in profit or loss. Where hedging gains or losses are recognized in profit or loss, they are recognized in the same line as the hedged item. The partnership discontinues hedge accounting only when the hedging relationship (or a part thereof) ceases to meet the qualifying criteria). This includes instances when the hedging instrument expires or is sold, terminated or exercised. The discontinuation is accounted for prospectively. The fair value adjustment to the carrying amount of the hedged item arising from the hedged risk is amortized to profit or loss from that date.
In a net investment hedging relationship, the effective portion of the fair value of the hedging instruments is recognized in other comprehensive income and the ineffective portion is recognized in net income. The amounts recorded in accumulated other comprehensive income are reclassified to net income, together with the related cumulative translation gain or loss, when there is a disposition or partial disposition that results in the loss of control of foreign operations or the derivatives are not part of any other hedge relationships.
The partnership adopted Interest Rate Benchmark Reform - Amendments to IFRS 9, and IFRS 7, issued by the IASB in September 2019, (“IBOR Amendments”) effective October 1, 2019 in advance of its January 1, 2020 mandatory effective date. The IBOR Amendments have been applied retrospectively to hedging relationships existing at the start of the reporting period or designated subsequently, and to the amount accumulated in the cash flow hedge reserve at that date. The IBOR Amendments provide temporary
- F-19 -
relief from applying specific hedge accounting requirements to the partnership’s hedging relationships that are directly affected by IBOR reform, which primarily include US$ LIBOR, £ LIBOR, and € EURIBOR. The reliefs have the effect that IBOR reform should not generally cause hedge accounting to terminate. In assessing whether a hedge is expected to be highly effective on a forward-looking basis, the partnership assumes the interest rate benchmark on which the cash flows of the derivative which hedges borrowings is not altered by IBOR reform. These reliefs cease to apply to a hedged item or hedging instrument as applicable at the earlier of (i) when the uncertainty arising from IBOR reform is no longer present with respect to the timing and amount of the interest rate benchmark based future cash flows, and (ii) when the hedging relationship is discontinued. There was no impact since these amendments enable the partnership to continue hedge accounting for hedging relationships which have been previously designated.
It is currently expected that Secured Overnight Financing Rate (“SOFR”) will replace US$ LIBOR, Sterling Overnight Index Average (“SONIA”) will replace £ LIBOR, and Euro Short-term Rate (“€STR”) will replace EURIBOR. All of these are expected to become effective prior to December 31, 2021. The partnership is currently finalizing and implementing its transition plan to address the impact and effect changes as a result of amendments to the contractual terms of IBOR referenced floating-rate borrowings, interest rate swaps, and interest rate caps.
Note 35, Financial Instruments provides details of the hedging instruments and hedged exposures to which the IBOR Amendments are applied.
| n) | Income taxes |
The partnership is a flow-through entity for tax purposes and as such is not subject to Bermudian taxation. However, income tax expenses are recognized for taxes payable by holding entities and their direct or indirect corporate subsidiaries.
Current income tax assets and liabilities are measured at the amount expected to be paid to tax authorities by the holding entities in respect of the partnership or directly by the partnership’s taxable subsidiaries, net of recoveries, based on the tax rates and laws enacted or substantively enacted at the balance sheet date.
Deferred income tax liabilities are provided for using the liability method on temporary differences between the tax basis used in the computation of taxable income and carrying amounts of assets and liabilities in the consolidated financial statements. Deferred income tax assets are recognized for all deductible temporary differences, carry forward of unused tax credits and unused tax losses, to the extent that it is probable that deductions, tax credits and tax losses will be utilized. The carrying amounts of deferred income tax assets are reviewed at each balance sheet date and reduced to the extent it is no longer probable that the income tax asset will be recovered. Deferred income tax assets and liabilities are measured at the tax rates that are expected to apply to the period when the asset is realized or the liability settled, based on the tax rates and laws that have been enacted or substantively enacted at the balance sheet date.
| o) | Provisions |
A provision is a liability of uncertain timing or amount. Provisions are recognized when the partnership has a present obligation (legal or constructive) as a result of a past event, it is probable that the partnership will be required to settle the obligation and the amount can be reliably estimated. Provisions are not recognized for future operating losses. Provisions are measured at the present value of the expenditures expected to be required to settle the obligation using a discount rate that reflects current market assessments of the time value of money and the risks specific to the obligation. Provisions are re-measured at each balance sheet date using the current discount rate. The increase in the provision due to passage of time is recognized as interest expense.
| p) | Business combinations |
The partnership adopted the Amendments to IFRS 3, Business Combinations (“IFRS 3 Amendments”) for business combinations or asset acquisitions occurring after January 1, 2019 in advance of its mandatory effective date January 1, 2020. IFRS 3 Amendments clarifies the definition of a business in determining whether an acquisition is a business combination or an asset acquisition. It has removed the assessment of whether market participants are capable of replacing any missing inputs or processes and continuing to produce outputs and the reference to an ability to reduce costs, and requires, at a minimum, the acquired set of activities and assets to include an input and a substantive process to meet the definition of a business. IFRS 3 Amendments also provides for an optional concentration test to assess whether substantially all of the fair value of the gross assets acquired is concentrated in a single identifiable asset or group of similar identifiable assets. The partnership has adopted the amendments prospectively.
Following the adoption of the IFRS 3 Amendments, the partnership continues to account for business combinations in which control is acquired under the acquisition method. When an acquisition is made, the partnership considers the inputs, processes and outputs of the acquiree in assessing whether it meets the definition of a business. When the acquired set of activities and assets lack a substantive process, the acquisition fails to meet the definition of a business and is accounted for as asset acquisition. Assets acquired through asset acquisitions are initially measured at cost, which includes the transaction costs incurred for the acquisitions.
- F-20 -
For business combinations, consideration is the aggregate of the fair values, at the date of exchange, of assets transferred, liabilities incurred by the partnership to the former owners, and equity instruments issued in exchange for control of the acquiree. Acquisitions related costs are recognized in net income as incurred. At the acquisition date, the partnership recognizes the identifiable assets acquired and liabilities assumed at their acquisition-date fair values, except for non-current assets classified as held-for-sale, which are recognized at fair value less costs to sell, and deferred tax assets or liabilities, which are measured in accordance with IAS 12, Income Taxes. The partnership also evaluates whether there are intangible assets acquired that have not previously been recognized by the acquiree and recognizes them as identifiable intangible assets.
For business combinations, non-controlling shareholders’ interests in the acquiree are initially measured at either fair value or their proportionate share of acquiree’s identifiable assets if the non-controlling interest represents a present ownership interest that entitles its holder to a proportionate share of the acquiree’s net assets. Other components of non-controlling interests in acquirees are recognized at fair value.
Goodwill for a business combination is measured as the excess of the sum of the consideration transferred, the amount of any non‑controlling interests in the acquiree, and the fair value of the acquirer’s previously held equity interest in the acquiree (if any) over the acquisition date values of the net assets acquired. If, after reassessment, the value of the net assets acquired exceeds the sum of the consideration transferred, the amount of any non‑controlling interests in the acquiree and the fair value of the acquirer’s previously held interest in the acquiree (if any), the excess is recognized immediately in net income as a bargain purchase gain.
Where a business combination is achieved in stages, previously held interests in the acquired entity are re-measured to fair value at the acquisition date, which is the date control is obtained, and the resulting gain or loss, if any, is recognized in net income. Amounts arising from interests in the acquiree prior to the acquisition date that have previously been recognized in other comprehensive income are reclassified to net income. Changes in the partnership’s ownership interest of an investee that do not result in a change of control are accounted for as equity transactions and are recorded as a component of equity. Acquisition costs are recorded as an expense in the reporting period as incurred.
Measurement period adjustments for business combinations are adjustments that arise from additional information obtained during the ‘measurement period’ (which cannot exceed one year from the acquisition date) about facts and circumstances that existed at the acquisition date. If the initial accounting for a business combination is incomplete by the end of the reporting period in which the business combination occurs, the partnership reports provisional amounts for items for where the accounting is incomplete. Those provisional amounts are adjusted during the measurement period, or additional assets or liabilities are recognized, to reflect new information obtained about facts and circumstances that existed as of the acquisition date that, if known, would have affected the amounts recognized as of that date.
| q) | Revenue recognition |
The partnership adopted IFRS 15, Revenue from Contracts with Customers (“IFRS 15”) effective January 1, 2018. IFRS 15 specifies how and when revenue should be recognized as well as requiring more informative and relevant disclosures. The standard also requires additional disclosures about the nature, amount, timing and uncertainty of revenue and cash flows arising from customer contracts. The standard supersedes IAS 18, Revenue, IAS 11, Construction Contracts and a number of revenue-related interpretations. IFRS 15 applies to nearly all contracts with customers: the main exceptions are leases, financial instruments and insurance contracts. The partnership’s revenue from leases is outside the scope of IFRS 15. The partnership’s material revenue streams subject to IFRS 15 are hospitality revenue and non-lease components within lease arrangements arising from the recovery of certain operating expenses from tenants. The adoption of IFRS 15 did not result in any material change to the pattern of revenue recognition by the partnership. The partnership adopted the standard using the modified retrospective approach with no restatement of comparatives and did not record any adjustment upon adoption. The partnership made additional disclosures in Note 23, Commercial Property Revenue, Note 24, Hospitality Revenue and Note 39, Segment Information, as a result of the adoption. Following the adoption of IFRS 15, the partnership has separately disclosed other revenue from tenants in Note 23, Commercial Property Revenue, which consists of non-lease components within lease arrangements arising from the recovery of certain operating expenses from tenants which are accounted for in accordance with IFRS 15. Other revenue from tenants is recognized when the partnership has satisfied its performance obligation by delivering services as agreed upon in the lease agreements to tenants at an amount equal to the component of revenue allocated to such performance obligation. The recognition pattern of hospitality revenue is not impacted upon adoption of IFRS 15.
The partnership adopted IFRS 16, effective January 1, 2019. It supersedes IAS 17, and its related interpretations, (see Note 2(j), Leases, for further discussion). IFRS 16 does not change substantially how the partnership as lessor accounts for leases. Under IFRS 16, lessor accounting remains largely unchanged and the distinction between operating and finance leases is retained. The partnership made additional disclosures in Note 23, Commercial Property Revenue, as a result of the adoption of IFRS 16.
- F-21 -
| (i) | Commercial property revenue |
Revenue from investment properties is presented within commercial property revenue on the consolidated statements of income. The partnership has retained substantially all of the risks and benefits of ownership of its investment properties and therefore accounts for leases with its tenants as operating leases. Revenue recognition under a lease commences when the tenant has a right to use the leased asset. Generally, this occurs on the lease commencement date or, where the partnership is required to make additions to the property in the form of tenant improvements to enhance the value of the property, upon substantial completion of those improvements. The total amount of contractual rents expected from operating leases is recognized on a straight-line basis over the term of the lease, including contractual base rent and subsequent rent increases as a result of rent escalation clauses. A rent receivable, included within the carrying amount of investment properties, is used to record the difference between the rental revenue recorded and the contractual amount received.
Rental receivables and related revenue also includes percentage participating rents and recoveries of operating expenses. However, recoveries of operating expenses related to property taxes and insurance are deemed as other rental revenue. Percentage participating rents are recognized when tenants’ specified sales targets have been met. Operating expense recoveries classified as rental income or non-rental income are recognized in the period that recoverable costs are chargeable to tenants. Where a tenant is legally responsible for operating expenses and pays them directly in accordance with the terms of the lease, the partnership does not recognize the expenses or any related recovery revenue.
Under IFRS 16, where the partnership is the intermediate lessor, it accounts for the head lease and the sublease as two separate contracts, classifying the sublease as a finance or operating lease with reference to the right-of-use asset arising from the head lease.
| (ii) | Hospitality revenue |
Revenue from hospitality properties is presented within hospitality revenue on the consolidated statements of income. Room, food and beverage and other revenues are recognized as services are provided. The partnership recognizes room revenue net of taxes and levies. Advance deposits are deferred and included as a liability until services are provided to the customer. The partnership recognizes net wins from casino gaming activities (the difference between gaming wins and losses) as gaming revenue. The partnership recognizes liabilities for funds deposited by patrons before gaming play occurs and for chips in the patrons’ possession, both of which are included in accounts payable and other liabilities. Revenue and expenses from tour operations include the sale of travel and leisure packages and are recognized on the first day the travel package is in use.
| (iii) | Performance and management fee revenue |
Fee revenue is presented on the consolidated statements of income within investment and other revenue. Fee revenue is recognized when services are provided and the amount can be estimated reliably.
| r) | Unit-based compensation |
The partnership and its subsidiaries issue unit-based awards to certain employees and non-employee directors of certain subsidiaries. The cost of cash-settled unit-based transactions, comprised of unit options, deferred share units and restricted share units, is measured as the fair value at the grant date and expensed on a proportionate basis over the vesting period. The corresponding accrued liability is measured at each reporting date at fair value with changes in fair value recognized in net income. The cost of equity-settled unit-based transactions, comprised of unit options and restricted units, is determined as the fair value of the award on the grant date. The cost of equity-settled unit-based transactions is recognized as each tranche vests and is recorded within equity.
| s) | Redeemable/Exchangeable Partnership Units |
The Redeemable/Exchangeable Partnership Units may, at the request of the holder, be redeemed in whole or in part, for cash in an amount equal to the market value of one of the partnership’s LP Units multiplied by the number of units to be redeemed (subject to certain adjustments). This right is subject to the partnership’s right, at its sole discretion, to elect to acquire any unit presented for redemption in exchange for one of the partnership’s LP Units (subject to certain customary adjustments). If the partnership elects not to exchange the Redeemable/Exchangeable Partnership Units for LP Units, Redeemable/Exchangeable Partnership Units are required to be redeemed for cash. The Redeemable/Exchangeable Partnership Units provide the holder the direct economic benefits and exposures to the underlying performance of the operating partnership and accordingly to the variability of the distributions of the operating partnership, whereas the partnership’s unitholders have indirect access to the economic benefits and exposures of the operating partnership through direct ownership interest in the partnership which owned a direct interest in the managing general partnership interest. Accordingly, the Redeemable/Exchangeable Partnership Units have been presented within non-controlling interests on the consolidated balance sheets. The Redeemable/Exchangeable Partnership Units do not entail a contractual obligation on the part of the partnership to deliver cash and can be settled by the partnership, at its sole discretion, by issuing a fixed number of its own equity instruments.
- F-22 -
| t) | BPR Units |
BPR Units may, at the request of the holder, be redeemed in whole or in part, for cash in an amount equal to the market value of one of the partnership’s LP Units multiplied by the number of units to be redeemed (subject to certain adjustments). This right is subject to the partnership’s right, at its sole discretion, to satisfy the redemption request with its LP Units, rather than cash, on a one-for-one basis. The BPR Units provide the holder with direct economic benefits and exposures to Brookfield Properties REIT Inc. (“BPR”) and accordingly to the variability of the distributions of BPR. Accordingly, the BPR Units have been presented within non-controlling interests on the consolidated balance sheets. The BPR Units do not entail a contractual obligation on the part of the partnership to deliver cash and can be settled by the partnership, at its sole discretion, by issuing a fixed number of its own equity instruments.
| u) | Earnings per limited partnership unit |
The partnership calculates basic earnings per unit by dividing net income attributable to limited partners by the weighted average number of LP Units outstanding during the period. As the Redeemable/Exchangeable Partnership Units, Exchange LP Units and BPR Units are allocated net income equivalent to that allocated to LP Units, net income attributable to limited partners is determined based on the weighted average proportionate share of LP Units outstanding compared to the total number of LP Units, Redeemable/Exchangeable Partnership Units, Exchange LP Units and BPR Unit outstanding. The impact of the potential conversion of mandatorily convertible preferred shares, such as the exchangeable preferred equity securities (“Preferred Equity Units”) issued to a third party investor (“the Class A Preferred Unitholder”), is included in the calculation of the weighted average number of LP Units outstanding during the period without an add back to net income attributable to limited partners of the associated carry on such preferred shares. Refer to Note 17, Capital Securities, for further discussion of the Preferred Equity Units.
The partnership also calculates diluted earnings per unit by adjusting net income attributable to limited partners and the weighted average number of LP Units outstanding to reflect the impact of dilutive financial instruments. The calculation of diluted earnings per LP Unit of the partnership includes the dilutive impact of securities issued by the partnership’s subsidiaries that are convertible into LP Units of the partnership, as well as options granted to employees pursuant to the BPY Plan.
| v) | Critical judgments and estimates in applying accounting policies |
The preparation of the partnership’s consolidated financial statements requires management to make critical judgments, estimates and assumptions that affect the reported amounts of assets and liabilities and disclosure of contingent assets and liabilities at the date of the financial statements and the reported amounts of revenues and expenses that are not readily apparent from other sources, during the reporting period. These estimates and associated assumptions are based on historical experience and other factors that are considered to be relevant. Actual results may differ from these estimates. Critical judgments and estimates made by management and utilized in the normal course of preparing the partnership’s consolidated financial statements are outlined below.
| (i) | Control |
In determining whether the partnership has power over an investee, the partnership makes judgments in identifying relevant activities that would significantly affect the returns of an investee, in assessing the partnership’s voting rights or other contractual rights that would give it power to unilaterally make decisions, and in assessing rights held by other stakeholders which might give them decision-making authority. In assessing if the partnership has exposure or rights to variable returns from its involvement with the investee, the partnership makes judgments concerning the variability of the returns from an investee based on the substance of the arrangement, the absolute and relative size of those returns. In determining if the partnership has the ability to use its power to affect its returns in an investee, the partnership makes judgments in assessing whether it is acting as a principal or agent in decision-making and whether another entity with decision-making rights is acting as an agent for the partnership. Where other stakeholders have decision making authority, the partnership makes judgments as to whether its decision-making rights provide it with control, joint control or significant influence over the investee.
In addition to the above, the partnership makes judgments in respect of joint arrangements that are carried on through a separate vehicle in determining whether the partnership’s interest represents an interest in the assets and liabilities of the arrangement (a joint operation) or in its net assets (a joint venture).
| (ii) | Attribution of net income |
Certain of the partnership’s subsidiaries are subject to profit sharing arrangements between the partnership and the non-controlling equity holders. In determining whether the attribution of profits is subject to uncertainty, the partnership makes the judgment in considering a variety of factors, including but not limited to uncertainties arising from future events, timing of anticipated acquisition, disposition and financing activities, as well as past events of similar nature.
- F-23 -
| (iii) | Common control transactions |
The purchase and sale of businesses or subsidiaries between entities under common control fall outside the scope of IFRS and accordingly, management uses judgment when determining a policy to account for such transactions taking into consideration other guidance in the IFRS framework and pronouncements of other standard-setting bodies.
| (iv) | Business combinations |
Judgment is applied in determining whether an acquisition is a business combination or an asset acquisition by considering the nature of the assets acquired and the processes applied to those assets, or if the integrated set of assets and activities is capable of being conducted and managed for the purpose of providing a return to investors or other owners. Judgment is also applied in identifying acquired assets and assumed liabilities and determining their fair values.
| (v) | Investment properties |
In applying relevant accounting policies, judgment is made in determining whether certain costs are additions to the carrying amount of the property, in identifying the point at which practical completion of the development property occurs, and in identifying borrowing costs directly attributable to the carrying amount of the development property. In certain instances, on a case by case basis, the partnership applies judgment in determining whether a significant amount of development activities undertaken would trigger the reclassification of an operating property to a development property.
The key valuation assumptions in determining the fair value of investment properties include discount rates and terminal capitalization rates for properties valued using a discounted cash flow model and capitalization rates for properties valued using a direct capitalization approach. Management also uses assumptions and estimates in determining expected future cash flows in discounted cash flow models and stabilized net operating income used in values determined using the direct capitalization approach. Properties under active development are recorded at fair value using a discounted cash flow model which includes estimates in respect of the timing and cost to complete the development.
| (vi) | Investments in Australia |
Prior to the conversion of the participating loan interests in the fourth quarter of 2019, the partnership had an economic interest in a portfolio of properties in Australia owned by Brookfield Asset Management in the form of participating loan agreements that provided the partnership with an interest in the results of operations and changes in fair values of the properties in the Australian portfolio. These participating loan interests were convertible by the partnership at any time into direct ownership interests in either the properties in the Australian portfolio or the entities that had direct ownership of the property (the “property subsidiaries”). The critical judgments made in the accounting for this investment relate to the partnership’s determination that the economic interests held by the partnership in certain entities within the Australian portfolio represented controlling interests in those entities, the determination of unit of account where related financial instruments had been entered into in contemplation of each other, the recognition of certain amounts paid to the partnership’s parent as financial assets or equity transactions, and the measurement of assets and liabilities recognized as a result of transactions with entities under common control. As a result of these judgments, the partnership had accounted for its interests in certain property subsidiaries as a controlling interest in a subsidiary or an equity accounted interest in a jointly controlled entity. Interests in other properties and entities were accounted for as participating loan notes that give rise to interest income reflecting the results of operations of the underlying property and gain or losses on an embedded derivative that corresponded to the property’s change in fair value.
| (vii) | Assets held for sale |
The partnership’s accounting policies relating to assets held for sale are described in Note 2(f), Assets Held for Sale. In applying this policy, judgment is applied in determining whether sale of certain assets is highly probable, which is a necessary condition for being presented within assets held for sale.
| (viii) | Revaluation of hospitality assets |
When determining the carrying amounts under the revaluation method, the partnership uses the following critical assumptions and estimates: estimates of replacement cost and estimates of remaining economic life.
| (ix) | Income taxes |
In applying relevant accounting policies, judgments are made in determining the probability of whether deductions, tax credits and tax losses can be utilized. In addition, the consolidated financial statements include estimates and assumptions for determining the future tax rates applicable to subsidiaries and identifying the temporary differences that relate to each subsidiary. Deferred income tax assets and liabilities are measured at the tax rates that are expected to apply during the period when the assets are realized or the liabilities settled, using the tax rates and laws enacted or substantively enacted at the consolidated balance sheet dates. The partnership measures deferred income taxes associated with its investment properties based on its specific intention with respect to each asset at the end of the reporting period. Where the partnership has a specific intention to sell a property in the
- F-24 -
foreseeable future, deferred taxes on the building portion of the investment property are measured based on the tax consequences following from the disposition of the property. Otherwise, deferred taxes are measured on the basis that the carrying value of the investment property will be recovered substantially through use. Judgment is required in determining the manner in which the carrying amount of each investment property will be recovered.
The partnership also makes judgments with respect to the taxation of gains inherent in its investments in foreign subsidiaries and joint ventures. While the partnership believes that the recovery of its original investment in these foreign subsidiaries and joint ventures will not result in additional taxes, certain unremitted gains inherent in those entities could be subject to foreign taxes depending on the manner of realization.
| (x) | Leases |
In applying its accounting policy for recognition of lease revenue, the partnership makes judgments with respect to whether tenant improvements provided in connection with a lease enhance the value of the leased property, which in turn is used to determine whether these amounts are treated as additions to operating property and the point in time to recognize revenue under the lease. In addition, where a lease allows a tenant to elect to take all or a portion of any unused tenant improvement allowance as a rent abatement, the partnership must exercise judgment in determining the extent to which the allowance represents an inducement that is amortized as a reduction of lease revenue over the term of the lease.
The partnership also makes judgments in determining whether certain leases, in particular those tenant leases with long contractual terms where the lessee is the sole tenant in a property and long-term ground leases where the partnership is lessor, are operating or finance leases. The partnership has determined most of its leases are operating leases, with several finance leases that are not material. Where operating costs are paid directly by tenants, the partnership exercises judgment in determining whether those costs are expenses of the partnership or the tenant which impacts the extent to which operating costs recovery revenue is recognized.
The partnership has applied critical judgments in the application of IFRS 16, including: i) identifying whether a contract (or part of a contract) includes a lease; ii) determining whether it is reasonably certain that a lease extension or termination option will be exercised in determining lease term; iii) determining the classification of lease agreements for lessor leases; iv) determining whether variable payments are in-substance fixed; v) establishing whether there are multiple leases in an arrangement; and vi) determining the fair value method of ROU assets classified as investment properties. As lessor, the partnership also makes judgments in determining whether certain leases are operating or finance leases.
The partnership uses critical estimates in the application of IFRS 16, including the estimation of lease term and determination of the appropriate rate to discount the lease payments.
| (xi) | Financial instruments |
The critical judgments inherent in the relevant accounting policies relate to the classification of financial assets or financial liabilities, designation of financial instruments as FVTOCI or FVTPL, the assessment of the effectiveness of hedging relationships, the determination of whether the partnership has significant influence over investees with which it has contractual relationships, and the identification of embedded derivatives subject to fair value measurement in certain hybrid instruments.
Estimates and assumptions used in determining the fair value of financial instruments are: equity and commodity prices; future interest rates; the credit risk of the partnership and its counterparties; amount and timing of estimated future cash flows; discount rates and volatility utilized in option valuations.
The partnership holds other financial instruments that represent equity interests in investment property entities that are measured at fair value as these financial instruments are designated as FVTPL or FVTOCI. Estimation of the fair value of these instruments is also subject to the estimates and assumptions associated with investment properties. The fair value of interest rate caps is determined based on generally accepted pricing models using quoted market interest rates for the appropriate term. Interest rate swaps are valued at the present value of estimated future cash flows and discounted based on applicable yield curves derived from market interest rates.
| (xii) | Indicators of impairment |
Judgment is applied when determining whether indicators of impairment exist when assessing the carrying values of the partnership’s assets for potential impairment. Consideration is given to a combination of factors, including but not limited to forecasts of revenues and expenses, values derived from publicly traded prices, and projections of market trends and economic environments. Judgment is also applied when quantifying the amount of impairment loss where indicators of impairment exist.
- F-25 -
| (xiii) | Other critical judgments |
Other critical judgments utilized in the preparation of the partnership’s consolidated financial statements are: assets’ recoverable amounts; assets’ net realizable values; depreciation and amortization rates and assets’ useful lives; determination of assets held for sale and discontinued operations; impairment of goodwill and intangible assets; the determination of functional currency; the likelihood and timing of anticipated transactions for hedge accounting; and the selection of accounting policies, among others.
| (xiv) | Future accounting policies |
There are no accounting policies issued as of December 31, 2019 that the partnership expects to adopt in the future and which the partnership expects will have a material impact.
NOTE 3. BUSINESS COMBINATIONS
| a) | Completed in 2019 |
As discussed in Note 2(p), Business Combinations, the partnership adopted the IFRS 3 Amendments effective January 1, 2019 in advance of its mandatory effective date. IFRS 3 Amendments clarifies the definition of a business in determining whether an acquisition is a business combination or an asset acquisition.
The partnership did not complete any business combinations during the year ended December 31, 2019.
| b) | Completed in 2018 |
In addition to the partnership’s acquisition of GGP Inc. (“GGP”) in 2018 that is discussed in Note 4, Acquisition of GGP Inc., the partnership completed the following significant business combinations (prior to the adoption of IFRS 3 Amendments) during 2018 through Brookfield-sponsored real estate funds:
| • | On February 1, 2018, the partnership acquired a portfolio of 105 extended-stay hotel properties across the United States (“Extended-Stay Hotel Portfolio”) for total consideration of $764 million. During 2018, the partnership completed the purchase price allocation for Extended-Stay Hotel Portfolio. No material changes were made to the provisional purchase price allocation. |
| • | On February 1, 2018, the partnership acquired a portfolio of 15 student housing properties in the United Kingdom (“UK Student Housing IV”), for total consideration of £527 million ($752 million). During 2018, the partnership completed the purchase price allocation for UK Student Housing IV. No material changes were made to the provisional purchase price allocation. |
| • | On August 3, 2018, the partnership acquired a 100% leasehold interest in 660 Fifth Avenue, a commercial office asset in New York, for consideration of $1,299 million. During 2019, the partnership completed the purchase price allocation for 660 Fifth Avenue. No material changes were made to the provisional purchase price allocation. This portfolio was deconsolidated by the partnership on January 31, 2019. See Note 5, Investment Properties for further information. |
| • | On December 7, 2018, the partnership acquired all of the outstanding common shares of Forest City Realty Trust Inc. (“Forest City”), a publicly traded company which owns a portfolio of office, multifamily and mixed-use assets across the U.S, for consideration of $6,948 million. During 2019, the partnership finalized the review over the fair value of the investment properties and property debt obligations as at the acquisition date and recognized an opening equity adjustment of $549 million that mostly consisted of a bargain purchase gain. The bargain purchase gain was reflecting the discount to net asset value of the previously publicly traded shares of Forest City. No other material changes were made to the provisional purchase price allocation. This portfolio was deconsolidated by the partnership on January 31, 2019. See Note 5, Investment Properties for further information. |
The partnership also completed several individually immaterial business combinations during 2018 for total consideration of $3,948 million. The acquisitions were primarily LP Investments made by Brookfield-sponsored real estate funds to invest the funds’ capital. The partnership consolidates the acquired investments as Brookfield Asset Management’s power as general partner, together with the partnership’s LP interests, provide the partnership with control over the investments. As noted above, 660 Fifth Avenue and Forest City were deconsolidated by the partnership on January 31, 2019. See Note 5, Investment Properties for further information.
- F-26 -
The following table summarizes the amounts recognized as of the acquisition date for each major class of assets acquired and liabilities assumed in addition to the consideration and transaction costs incurred:
| (US$ Millions) | Extended- Stay Hotel Portfolio | UK Student Housing IV | 660 Fifth Avenue(3) | Forest City(3) | Other | Total | ||||||||||||
| Date of acquisition | 2/1/2018 | 2/1/2018 | 8/3/2018 | 12/7/2018 | Various | |||||||||||||
| Investment properties | $ | — | $ | 742 | $ | 1,292 | $ | 9,409 | $ | 3,846 | $ | 15,289 | ||||||
| Property, plant and equipment | 768 | 2 | — | — | 922 | 1,692 | ||||||||||||
| Equity accounted investments | 5 | — | — | 1,479 | 79 | 1,563 | ||||||||||||
| Goodwill | — | — | — | — | 96 | 96 | ||||||||||||
| Intangible assets | — | — | — | — | 54 | 54 | ||||||||||||
| Accounts receivable and other | 2 | 53 | 11 | 935 | 944 | 1,945 | ||||||||||||
| Cash and cash equivalents | 2 | 18 | — | 487 | 168 | 675 | ||||||||||||
| Total assets | 777 | 815 | 1,303 | 12,310 | 6,109 | 21,314 | ||||||||||||
| Less: | ||||||||||||||||||
| Debt obligations | — | — | — | (3,504 | ) | (1,504 | ) | (5,008 | ) | |||||||||
| Accounts payable and other | (13 | ) | (63 | ) | (4 | ) | (700 | ) | (283 | ) | (1,063 | ) | ||||||
| Deferred tax liabilities | — | — | — | — | (47 | ) | (47 | ) | ||||||||||
Non-controlling interests(1) | — | — | — | (609 | ) | (88 | ) | (697 | ) | |||||||||
| Net assets acquired | $ | 764 | $ | 752 | $ | 1,299 | $ | 7,497 | $ | 4,187 | $ | 14,499 | ||||||
Consideration(2) | $ | 764 | $ | 752 | $ | 1,299 | $ | 6,948 | $ | 3,948 | $ | 13,711 | ||||||
| Transaction costs | $ | 9 | $ | 7 | $ | 44 | $ | 202 | $ | 67 | $ | 329 | ||||||
(1) | Includes non-controlling interests recognized on business combinations measured as the proportionate share of the fair value of the assets, liabilities and contingent liabilities on the date of acquisition. |
(2) | Includes consideration paid with funds received from issuance of non-controlling interests to certain institutional investors in funds sponsored by Brookfield Asset Management. |
(3) | These investments were deconsolidated by the partnership on January 31, 2019. See Note 5, Investment Properties for further information. |
Excluding the acquisition of GGP, in the period from each acquisition date to December 31, 2018, the partnership recorded revenue and net income in connection with these acquisitions of approximately $529 million and $163 million, respectively. If the acquisitions had occurred on January 1, 2018, the partnership’s total revenue and net income would have been $8,572 million and $4,133 million, respectively, for the twelve months ended December 31, 2018.
Transaction costs, which primarily relate to legal and consulting fees, are expensed as incurred in accordance with IFRS 3 and included in general and administrative expense on the consolidated income statement.
NOTE 4. ACQUISITION OF GGP INC.
On March 26, 2018, the partnership entered into a definitive merger agreement with GGP to acquire all of the outstanding common shares of GGP other than those shares already held by the partnership and its subsidiaries. Under the terms of the agreement, GGP common shareholders had the right to elect to receive, for each GGP share, subject to proration, (i) $23.50 in cash or (ii) either one BPY unit or one BPR Unit, a new U.S. REIT security formed by recapitalizing GGP and amending its governing documents. Each BPR Unit is structured to provide an economic return equivalent to a LP Unit. The holder of a BPR Unit has the right, at any time, to request the share be redeemed for the cash equivalent to the value of a LP Unit. In the event the holder of a BPR Unit exercises this right, the partnership has the right, at its sole discretion, to satisfy the redemption request with a LP Unit rather than cash.
On July 26, 2018, GGP shareholders approved the merger which closed on August 28, 2018. On closing the partnership controlled BPR as it held 87% of the voting stock of BPR through its 100% ownership of the BPR Class B and Class C shares. The balance of the voting rights in respect of BPR are held by the holders of the BPR Units.
Based on shareholder elections, which were subject to proration, cash totaling $9.05 billion was paid by GGP to its shareholders, other than the partnership, in the form of a pre-closing dividend on August 27, 2018. According to the terms of the agreement, the consideration payable on close of the merger was reduced by the amount of the pre-closing dividend. The pre-closing dividend was funded with new term debt, property-level refinancings, proceeds from the sale of partial interests in certain GGP properties and the issuance of non-controlling interests in subsidiaries of GGP.
The acquisition of GGP was accounted for as a business combination achieved in stages. The partnership’s existing equity interest in GGP was remeasured to fair value immediately prior to the acquisition date of August 28, 2018 based on the partnership’s
- F-27 -
interest in the fair value of the identifiable net assets and liabilities of GGP at the time. As a result of this remeasurement, a loss of approximately $502 million was recognized in fair value gains, net.
Consideration paid on acquisition of control by the partnership was comprised of the following:
| • | 88 million LP Units with a fair value of $1,786 million determined with reference to the trading price of the LP Units on the closing date; |
| • | 161 million BPR Units with a fair value of $3,383 million determined with reference to the initial trading price of the BPR Unit; |
| • | Cash consideration of $200 million; and |
| • | Share-based payment awards to GGP employees with a fair value of $28 million. |
As discussed in Note 21, Equity, the BPR Units issued on closing represent a non-controlling interest in the partnership.
During 2019, the partnership completed the purchase price allocation for GGP. No material changes were made to the provisional purchase price allocation.
The following table summarizes the amounts recognized as of the acquisition date for each major class of assets acquired and liabilities assumed in addition to the consideration paid and transaction costs incurred:
| (US$ Millions) | GGP | ||
| Investment properties | $ | 17,991 | |
| Equity accounted investments | 10,829 | ||
| Property, plant and equipment | 56 | ||
| Accounts receivable and other | 592 | ||
| Cash and cash equivalents | 424 | ||
| Total assets | 29,892 | ||
| Less: | |||
| Debt obligations | (13,147 | ) | |
| Accounts payable and other | (691 | ) | |
| Deferred tax liabilities | (11 | ) | |
Non-controlling interests(1) | (1,882 | ) | |
| Net assets acquired | $ | 14,161 | |
Consideration(2) | $ | 13,240 | |
| Transaction costs | 32 | ||
(1) | Includes non-controlling interests in a subsidiary of BPR measured as the proportionate share of the fair value of the entity’s net assets on the date of acquisition. |
(2) | Includes the acquisition date fair value of the partnership’s previously held equity interest in GGP of $7,843 million. |
In connection with the acquisition of GGP, the partnership has recognized a bargain purchase gain of $921 million in fair value gains, net as the consideration paid exceeds the fair value of the assets acquired, liabilities assumed and non-controlling interests recognized on acquisition. The partnership has determined that it has identified all of the assets acquired and liabilities assumed and that each is appropriately measured. The fair value of the investment properties acquired was determined, for certain of the assets, based on transaction prices agreed with third parties for the sale of partial interests and valuation models prepared by an independent external appraiser.
In the period from August 28, 2018 to December 31, 2018, the partnership recorded revenue and net income in connection with this acquisition of approximately $588 million and $360 million, respectively. If the acquisition had occurred on January 1, 2018, the partnership’s total revenue and net income would have been $8,415 million and $4,373 million, respectively, for the year ended December 31, 2018, only including the GGP transaction.
- F-28 -
NOTE 5. INVESTMENT PROPERTIES
The following table presents a roll forward of investment property balances for the years ended December 31, 2019 and 2018:
| Year ended Dec. 31, 2019 | Year ended Dec. 31, 2018 | |||||||||||||||||
| (US$ Millions) | Commercial properties | Commercial developments | Total | Commercial properties | Commercial developments | Total | ||||||||||||
| Balance, beginning of year | $ | 76,014 | $ | 4,182 | $ | 80,196 | $ | 48,780 | $ | 2,577 | $ | 51,357 | ||||||
| Changes resulting from: | ||||||||||||||||||
Property acquisitions(1) | 6,797 | 246 | 7,043 | 31,783 | 1,658 | 33,441 | ||||||||||||
| Capital expenditures | 1,540 | 1,229 | 2,769 | 1,098 | 1,185 | 2,283 | ||||||||||||
Accounting policy change(2) | 704 | 22 | 726 | — | — | — | ||||||||||||
Property dispositions(3) | (742 | ) | (37 | ) | (779 | ) | (4,115 | ) | (451 | ) | (4,566 | ) | ||||||
| Fair value gains, net | 301 | 557 | 858 | 784 | 462 | 1,246 | ||||||||||||
| Foreign currency translation | 69 | 72 | 141 | (1,387 | ) | (121 | ) | (1,508 | ) | |||||||||
| Transfers between commercial properties and commercial developments | 354 | (354 | ) | — | 1,123 | (1,123 | ) | — | ||||||||||
Impact of deconsolidation due to loss of control(4) | (10,701 | ) | (798 | ) | (11,499 | ) | — | — | — | |||||||||
| Reclassifications of assets held for sale and other changes | (2,771 | ) | (1,173 | ) | (3,944 | ) | (2,052 | ) | (5 | ) | (2,057 | ) | ||||||
Balance, end of year(5) | $ | 71,565 | $ | 3,946 | $ | 75,511 | $ | 76,014 | $ | 4,182 | $ | 80,196 | ||||||
(1) | The prior year primarily includes the commercial properties and developments from the GGP acquisition in 2018. |
(2) | Includes the impact of the adoption of IFRS 16 through the recognition of right-of-use assets. See Note 2, Summary of Significant Accounting Policies for further information. |
(3) | Property dispositions represent the carrying value on date of sale. |
(4) | Includes the impact of the deconsolidation of Brookfield Strategic Real Estate Partners III (“BSREP III”) investments. See below for further information. |
(5) | Includes right-of-use commercial properties and commercial developments of $720 million and $32 million, respectively, as of December 31, 2019. Current lease liabilities of $38 million has been included in accounts payable and other liabilities and non-current lease liabilities of $714 million have been included in other non-current liabilities. |
The partnership determines the fair value of each commercial property based upon, among other things, rental income from current leases and assumptions about rental income from future leases reflecting market conditions at the applicable balance sheet dates, less future cash outflows in respect of such leases. Investment property valuations are generally completed by undertaking one of two accepted income approach methods, which include either: i) discounting the expected future cash flows, generally over a term of 10 years including a terminal value based on the application of a capitalization rate to estimated year 11 cash flows; or ii) undertaking a direct capitalization approach whereby a capitalization rate is applied to estimated current year cash flows. Where there has been a recent market transaction for a specific property, such as an acquisition or sale of a partial interest, the partnership values the property on that basis. In determining the appropriateness of the methodology applied, the partnership considers the relative uncertainty of the timing and amount of expected cash flows and the impact such uncertainty would have in arriving at a reliable estimate of fair value. The partnership prepares these valuations considering asset and market specific factors, as well as observable transactions for similar assets. The determination of fair value requires the use of estimates, which are internally determined and compared with market data, third-party reports and research as well as observable conditions. There are currently no known trends, events or uncertainties that the partnership reasonably believes could have a sufficiently pervasive impact across the partnership’s businesses to materially affect the methodologies or assumptions utilized to determine the estimated fair values reflected in this report. Discount rates and capitalization rates are inherently uncertain and may be impacted by, among other things, movements in interest rates in the geographies and markets in which the assets are located. Changes in estimates of discount and capitalization rates across different geographies and markets are often independent of each other and not necessarily in the same direction or of the same magnitude. Further, impacts to the partnership’s fair values of commercial properties from changes in discount or capitalization rates and cash flows are usually inversely correlated. Decreases (increases) in the discount rate or capitalization rate result in increases (decreases) of fair value. Such decreases (increases) may be mitigated by decreases (increases) in cash flows included in the valuation analysis, as circumstances that typically give rise to increased interest rates (e.g., strong economic growth, inflation) usually give rise to increased cash flows at the asset level. Refer to the table below for further information on valuation methods used by the partnership for its asset classes.
Commercial developments are also measured using a discounted cash flow model, net of costs to complete, as of the balance sheet date. Development sites in the planning phases are measured using comparable market values for similar assets.
In accordance with its policy, the partnership generally measures and records its commercial properties and developments using valuations prepared by management. However, for certain subsidiaries, the partnership relies on quarterly valuations prepared by external valuation professionals. Management compares the external valuations to the partnership’s internal valuations to review
- F-29 -
the work performed by the external valuation professionals. Additionally, a number of properties are externally appraised each year and the results of those appraisals are compared to the partnership’s internally prepared values.
2019 Transactions
BSREP III deconsolidation
In the first quarter of 2019, BSREP III held its final close with total equity commitments of $15 billion. Prior to final close, the partnership had committed to 25%, or a controlling interest in the fund and as a result, had previously consolidated the investments made to date. Upon final close, on January 31, 2019, the partnership reduced its commitment to $1 billion, representing a 7% non-voting position. As a result, the partnership lost control and deconsolidated its investment in the fund, which primarily consists of Forest City and 660 Fifth Avenue. The partnership recognizes its investment in BSREP III as a financial asset, initially recognized at fair value and remeasured on each reporting date through fair value gain or loss. As a result of the deconsolidation, investment properties decreased by $11,499 million, equity accounted investments decreased by $1,434 million, property, plant and equipment decreased by $789 million and debt obligations decreased by $13,601 million.
Adoption of IFRS 16
The impact of the January 1, 2019 adoption of IFRS 16 resulted in the recognition of ROU investment properties of $721 million. Fair value loss related to IFRS 16 ROU assets for the year ended December 31, 2019 was $5 million. As of December 31, 2019, ROU investment properties was $752 million.
The key valuation metrics for the partnership’s consolidated commercial properties are set forth in the following tables below on a weighted-average basis:
| Dec. 31, 2019 | Dec. 31, 2018 | |||||||||||
| Consolidated properties | Primary valuation method | Discount rate | Terminal capitalization rate | Investment horizon (yrs.) | Discount rate | Terminal capitalization rate | Investment horizon (yrs.) | |||||
| Core Office | ||||||||||||
| United States | Discounted cash flow | 7.0 | % | 5.6 | % | 12 | 6.9 | % | 5.6 | % | 12 | |
| Canada | Discounted cash flow | 5.9 | % | 5.2 | % | 10 | 6.0 | % | 5.4 | % | 10 | |
| Australia | Discounted cash flow | 6.8 | % | 5.9 | % | 10 | 7.0 | % | 6.2 | % | 10 | |
| Europe | Discounted cash flow | 4.6 | % | 4.1 | % | 11 | — | % | — | % | — | |
| Brazil | Discounted cash flow | 7.9 | % | 7.4 | % | 10 | 9.6 | % | 7.7 | % | 6 | |
| Core Retail | Discounted cash flow | 6.7 | % | 5.4 | % | 10 | 7.1 | % | 6.0 | % | 12 | |
| LP Investments Office | Discounted cash flow | 10.0 | % | 7.3 | % | 7 | 10.2 | % | 7.0 | % | 6 | |
| LP Investments Retail | Discounted cash flow | 8.8 | % | 7.3 | % | 10 | 8.9 | % | 7.8 | % | 9 | |
| Mixed-use | Discounted cash flow | 7.6 | % | 5.4 | % | 10 | 7.8 | % | 5.4 | % | 10 | |
Logistics(1) | Direct capitalization | 5.8 | % | n/a | n/a | 9.3 | % | 8.3 | % | 10 | ||
Multifamily(1) | Direct capitalization | 5.1 | % | n/a | n/a | 4.8 | % | n/a | n/a | |||
Triple Net Lease(1) | Direct capitalization | 6.3 | % | n/a | n/a | 6.3 | % | n/a | n/a | |||
Self-storage(1) | Direct capitalization | 5.6 | % | n/a | n/a | 5.7 | % | n/a | n/a | |||
Student Housing(1) | Direct capitalization | 5.8 | % | n/a | n/a | 5.6 | % | n/a | n/a | |||
Manufactured Housing(1) | Direct capitalization | 5.5 | % | n/a | n/a | 5.4 | % | n/a | n/a | |||
(1) | The valuation method used to value multifamily, triple net lease, self-storage, student housing, logistics and manufactured housing properties is the direct capitalization method. The rates presented as the discount rate relate to the overall implied capitalization rate. The terminal capitalization rate and investment horizon are not applicable. |
Operating investment properties with a fair value of approximately $14.1 billion (December 31, 2018 - $20.7 billion) are situated on land held under leases or other agreements largely expiring after the year 2065. Investment properties do not include any buildings held under operating leases.
- F-30 -
The following table presents the partnership’s investment properties measured at fair value in the consolidated financial statements and the level of the inputs used to determine those fair values in the context of the hierarchy as defined in Note 2(i) above.
| Dec. 31, 2019 | Dec. 31, 2018 | |||||||||||||||||||||||
| Level 3 | Level 3 | |||||||||||||||||||||||
| (US$ Millions) | Level 1 | Level 2 | Commercial properties | Commercial developments | Level 1 | Level 2 | Commercial properties | Commercial developments | ||||||||||||||||
| Core Office | ||||||||||||||||||||||||
| United States | $ | — | $ | — | $ | 15,213 | $ | 535 | $ | — | $ | — | $ | 14,415 | $ | 822 | ||||||||
| Canada | — | — | 4,633 | 173 | — | — | 4,127 | 118 | ||||||||||||||||
| Australia | — | — | 1,881 | 419 | — | — | 2,342 | 49 | ||||||||||||||||
| Europe | — | — | 936 | 1,931 | — | — | 137 | 1,194 | ||||||||||||||||
| Brazil | — | — | 361 | — | — | — | 329 | — | ||||||||||||||||
Core Retail (1) | — | — | 21,561 | — | — | — | 17,224 | 383 | ||||||||||||||||
| LP Investments | ||||||||||||||||||||||||
LP Investments Office(1) | — | — | 8,054 | 702 | — | — | 7,861 | 577 | ||||||||||||||||
| LP Investments Retail | — | — | 2,812 | — | — | — | 3,408 | 6 | ||||||||||||||||
| Logistics | — | — | 84 | 10 | — | — | 183 | — | ||||||||||||||||
| Multifamily | — | — | 2,937 | — | — | — | 4,151 | — | ||||||||||||||||
| Triple Net Lease | — | — | 4,508 | — | — | — | 5,067 | — | ||||||||||||||||
| Self-storage | — | — | 991 | 16 | — | — | 847 | 84 | ||||||||||||||||
| Student Housing | — | — | 2,445 | 160 | — | — | 2,031 | 386 | ||||||||||||||||
| Manufactured Housing | — | — | 2,446 | — | — | — | 2,369 | — | ||||||||||||||||
Mixed-Use (1) | — | — | 2,703 | — | — | — | 11,523 | 563 | ||||||||||||||||
| Total | $ | — | $ | — | $ | 71,565 | $ | 3,946 | $ | — | $ | — | $ | 76,014 | $ | 4,182 | ||||||||
(1) | Includes the impact of the deconsolidation of BSREP III investments. See above for further information. |
There were no transfers between levels within the fair value hierarchy related to investment properties during the years ended December 31, 2019 and 2018. Investment properties with a fair value of $73.2 billion (December 31, 2018 - $73.5 billion) are pledged as security for property debt.
- F-31 -
The following table presents a sensitivity analysis to the impact of a 25 basis point movement of the discount rate and terminal capitalization or overall implied capitalization rate on fair values of the partnership’s commercial properties for December 31, 2019, for properties valued using the discounted cash flow or direct capitalization method, respectively:
| Dec. 31, 2019 | |||
| (US$ Millions) | Impact on fair value of commercial properties | ||
| Core Office | |||
| United States | $ | 764 | |
| Canada | 223 | ||
| Australia | 174 | ||
| Europe | 20 | ||
| Brazil | 13 | ||
| Core Retail | 1,112 | ||
| LP Investments | |||
| LP Investments Office | 363 | ||
| LP Investments Retail | 108 | ||
| Logistics | 3 | ||
| Mixed-use | 112 | ||
| Multifamily | 130 | ||
| Triple Net Lease | 160 | ||
| Self-storage | 38 | ||
| Student Housing | 101 | ||
| Manufactured Housing | 107 | ||
| Total | $ | 3,428 | |
During the year ended December 31, 2019, the partnership capitalized a total of $1,229 million (December 31, 2018 - $1,185 million) of costs related to development properties. Included in this amount is $1,125 million (December 31, 2018 - $1,089 million) of construction and related costs and $104 million (December 31, 2018 - $96 million) of borrowing costs capitalized. The weighted average interest rate used for the capitalization of borrowing costs to development properties for the year ended December 31, 2019 is 3.7% (December 31, 2018 - 4.2%).
- F-32 -
NOTE 6. INVESTMENTS IN SUBSIDIARIES
The partnership considers all relevant facts and circumstances in determining that its decision making rights over the entities listed below are sufficient to give it power over these subsidiaries. In addition, the partnership has exposure and rights to substantial variable returns from its economic interests in these subsidiaries, even after consideration of material non-controlling interests in certain subsidiaries. The partnership is able to use its power to affect the amount of its returns and consolidates these subsidiaries.
The following table presents the partnership’s material subsidiaries as of December 31, 2019 and 2018:
| Jurisdiction of formation | Economic interest | Voting interest | |||||||
| Dec. 31, 2019 | Dec. 31, 2018 | Dec. 31, 2019 | Dec. 31, 2018 | ||||||
| Subsidiary of the partnership | |||||||||
Brookfield Property L.P.(1) | Bermuda | 50 | % | 49 | % | 100 | % | 100 | % |
| Holding entities of the operating partnership | |||||||||
| BPY Bermuda IV Holdings L.P. | Delaware | 100 | % | 100 | % | 100 | % | 100 | % |
| Brookfield BPY Retail Holdings II Inc. | Ontario | 100 | % | 100 | % | 100 | % | 100 | % |
| BPY Bermuda Holdings Limited | Bermuda | 100 | % | 100 | % | 100 | % | 100 | % |
| BPY Bermuda Holdings II Limited | Bermuda | 100 | % | 100 | % | 100 | % | 100 | % |
| Brookfield BPY Holdings Inc. | Ontario | 100 | % | 100 | % | 100 | % | 100 | % |
| BPY Bermuda Holdings IV Limited | Bermuda | 100 | % | 100 | % | 100 | % | 100 | % |
| BPY Bermuda Holdings IA Limited | Bermuda | 100 | % | 100 | % | 100 | % | 100 | % |
| BPY Bermuda Holdings V Limited | Bermuda | 100 | % | 100 | % | 100 | % | 100 | % |
| BPY Bermuda Holdings VI Limited | Bermuda | 100 | % | 100 | % | 100 | % | 100 | % |
| BPY Bermuda Holdings VII Limited | Bermuda | 100 | % | — | % | 100 | % | — | % |
| Real estate subsidiaries of the holding entities | |||||||||
| Brookfield Office Properties Inc. (“BPO”) | Canada | 100 | % | 100 | % | 100 | % | 100 | % |
Brookfield BPY Holdings (Australia) ULC(2) | Canada | 100 | % | 100 | % | — | % | — | % |
Forest City(4) | United States | — | % | 15 | % | — | % | — | % |
BPR Retail Holdings LLC(5) | United States | 100 | % | 100 | % | 95 | % | 91 | % |
BSREP CARS Sub-Pooling LLC(3) | United States | 29 | % | 29 | % | — | % | — | % |
Center Parcs UK(3) | United Kingdom | 27 | % | 27 | % | — | % | — | % |
BSREP II Aries Pooling LLC(3) | United States | 26 | % | 26 | % | — | % | — | % |
BSREP UA Holdings LLC(3) | Cayman Islands | 30 | % | 30 | % | — | % | — | % |
BSREP India Office Holdings Pte. Ltd.(3) | United States | 33 | % | 33 | % | — | % | — | % |
BSREP II Retail Upper Pooling LLC(3) | United States | 50 | % | 50 | % | 33 | % | 33 | % |
BSREP II Korea Office Holdings Pte. Ltd.(3) | South Korea | 22 | % | 22 | % | — | % | — | % |
BSREP II PBSA Ltd.(3) | Bermuda | 25 | % | 25 | % | — | % | — | % |
BSREP II MH Holdings LLC(3) | United States | 26 | % | 26 | % | — | % | — | % |
(1) | BPY holds all managing general partner units of the operating partnership and therefore has the power to direct the relevant activities and affairs of the operating partnership. The managing general partner units represent 50% and 49% of the total number of the operating partnership’s units at December 31, 2019 and 2018, respectively. |
(2) | This entity holds certain Australian properties not held through BPO. |
(3) | The partnership holds its economic interest in these assets primarily through limited partnership interests in Brookfield-sponsored real estate funds. By their nature, limited partnership interests do not have any voting rights. The partnership has entered into voting agreements to provide the partnership with the ability to contractually direct the relevant activities of the investees. |
(4) | Included non-controlling interests in recently acquired Forest City portfolio in 2018.The partnership deconsolidated Forest City on January 31, 2019. See Note 5, Investment Properties for further information. |
(5) | The partnership obtained control of GGP during the third quarter of 2018 following the acquisition of the common shares not previously held by the partnership. Please see Note 4, Acquisition of GGP Inc., for further information. The partnership controls BPR as it held 95% of the voting stock of BPR through its 100% ownership of the BPR Class B and Class C shares. The balance of the voting rights in respect of BPR are held by the holders of the BPR Units. |
- F-33 -
The table below shows details of non-wholly owned subsidiaries of the partnership that have material non-controlling interests:
| Jurisdiction of formation | Proportion of economic interests held by non- controlling interests | Non-controlling interests: Interests of others in operating subsidiaries and properties | |||||||||
| (US$ Millions) | Dec. 31, 2019 | Dec. 31, 2018 | Dec. 31, 2019 | Dec. 31, 2018 | |||||||
BPO(1) | Canada | — | % | — | % | $ | 4,808 | $ | 4,757 | ||
BPR Retail Holdings LLC(2) | United States | — | % | — | % | 1,787 | 1,773 | ||||
BSREP CARS Sub-Pooling LLC(3) | United States | 71 | % | 71 | % | 973 | 957 | ||||
| BSREP II PBSA Ltd. | Bermuda | 75 | % | 75 | % | 791 | 687 | ||||
BSREP II MH Holdings LLC(3) | United States | 74 | % | 74 | % | 773 | 700 | ||||
Center Parcs UK(3) | United Kingdom | 73 | % | 73 | % | 675 | 863 | ||||
BSREP II Aries Pooling LLC(3) | United States | 74 | % | 74 | % | 554 | 603 | ||||
BSREP II Retail Upper Pooling LLC(3) | United States | 50 | % | 50 | % | 541 | 552 | ||||
| BSREP II Korea Office Holdings Pte. Ltd. | South Korea | 78 | % | 78 | % | 484 | 766 | ||||
| BSREP India Office Holdings Pte. Ltd. | United States | 67 | % | 67 | % | 403 | 612 | ||||
BSREP UA Holdings LLC(3) | Cayman Islands | 70 | % | 70 | % | 102 | 507 | ||||
Forest City(3)(4) | United States | — | % | 85 | % | — | 3,437 | ||||
| Other | Various | 18% - 76% | 18% - 92% | 4,094 | 2,242 | ||||||
| Total | $ | 15,985 | $ | 18,456 | |||||||
(1) | Includes non-controlling interests in BPO subsidiaries which vary from 1% - 100%. |
(2) | Includes non-controlling interests in BPR subsidiaries. |
(3) | Includes non-controlling interests representing interests held by other investors in Brookfield-sponsored real estate funds and holding entities through which the partnership participates in such funds. Also includes non-controlling interests in underlying operating entities owned by these funds. |
(4) | The non-controlling interests of Forest City was deconsolidated on January 31, 2019. See Note 5, Investment Properties, for further information. |
Summarized financial information in respect of each of the partnership’s subsidiaries that have material non-controlling interests is set out below. The summarized financial information below represents amounts before intercompany eliminations.
| Dec. 31, 2019 | ||||||||||||||||||
| Equity attributable to | ||||||||||||||||||
| (US$ Millions) | Current assets | Non-current assets | Current liabilities | Non-current liabilities | Non- controlling interests | Owners of the entity | ||||||||||||
| BPO | $ | 1,705 | $ | 43,102 | $ | 7,133 | $ | 17,033 | $ | 4,979 | $ | 15,662 | ||||||
| BPR Retail Holdings LLC | 402 | 32,526 | 1,523 | 15,509 | 1,787 | 14,109 | ||||||||||||
| BSREP CARS Sub-Pooling LLC | 65 | 4,512 | 76 | 3,189 | 973 | 339 | ||||||||||||
| BSREP II PBSA Ltd. | 68 | 2,633 | 73 | 1,566 | 791 | 271 | ||||||||||||
| BSREP II MH Holdings LLC | 45 | 2,522 | 47 | 1,497 | 773 | 250 | ||||||||||||
| Center Parcs UK | 70 | 4,445 | 242 | 3,343 | 675 | 255 | ||||||||||||
| BSREP II Aries Pooling LLC | 158 | 1,880 | 487 | 808 | 554 | 189 | ||||||||||||
| BSREP II Retail Upper Pooling LLC | 109 | 2,659 | 315 | 1,360 | 541 | 552 | ||||||||||||
| BSREP II Korea Office Holdings Pte. Ltd. | 96 | 3,089 | 64 | 2,497 | 484 | 140 | ||||||||||||
| BSREP India Office Holdings Pte. Ltd. | 35 | 2,252 | 150 | 1,539 | 403 | 195 | ||||||||||||
| BSREP UA Holdings LLC | 46 | 349 | 6 | 243 | 102 | 44 | ||||||||||||
Forest City(1) | — | — | — | — | — | — | ||||||||||||
| Total | $ | 2,799 | $ | 99,969 | $ | 10,116 | $ | 48,584 | $ | 12,062 | $ | 32,006 | ||||||
(1) | The non-controlling interests of Forest City was deconsolidated on January 31, 2019. See Note 5, Investment Properties, for further information. |
- F-34 -
| Dec. 31, 2018 | ||||||||||||||||||
| Equity attributable to | ||||||||||||||||||
| (US$ Millions) | Current assets | Non-current assets | Current liabilities | Non-current liabilities | Non- controlling interests | Owners of the entity | ||||||||||||
| BPO | $ | 1,391 | $ | 38,895 | $ | 5,216 | $ | 16,521 | $ | 4,928 | $ | 13,621 | ||||||
| Forest City | 1,029 | 11,246 | 602 | 7,741 | 3,437 | 495 | ||||||||||||
| BPR Retail Holdings LLC | 478 | 29,197 | 507 | 13,241 | 1,773 | 14,154 | ||||||||||||
| BSREP CARS Sub-Pooling LLC | 38 | 5,074 | 42 | 3,776 | 957 | 337 | ||||||||||||
| Center Parcs UK | 191 | 4,110 | 242 | 2,869 | 863 | 327 | ||||||||||||
| BSREP II Korea Office Holdings Pte. Ltd. | 87 | 2,986 | 56 | 2,030 | 766 | 221 | ||||||||||||
| BSREP II MH Holdings LLC | 42 | 2,438 | 39 | 1,515 | 700 | 226 | ||||||||||||
| BSREP II PBSA Ltd. | 72 | 2,196 | 428 | 918 | 687 | 235 | ||||||||||||
| BSREP India Office Holdings Pte. Ltd. | 44 | 2,044 | 183 | 996 | 612 | 297 | ||||||||||||
| BSREP II Aries Pooling LLC | 95 | 2,246 | 330 | 1,202 | 603 | 206 | ||||||||||||
| BSREP II Retail Upper Pooling LLC | 88 | 2,956 | 970 | 976 | 552 | 546 | ||||||||||||
| BSREP UA Holdings LLC | 51 | 1,583 | 28 | 880 | 507 | 219 | ||||||||||||
| Total | $ | 3,606 | $ | 104,971 | $ | 8,643 | $ | 52,665 | $ | 16,385 | $ | 30,884 | ||||||
| Year ended Dec. 31, 2019 | ||||||||||||||||||
| Attributable to non-controlling interests | Attributable to owners of the partnership | |||||||||||||||||
| (US$ Millions) | Revenue | Net income (loss) | Total compre-hensive income | Distributions | Net income (loss) | Total compre-hensive income | ||||||||||||
| BPO | $ | 2,149 | $ | 318 | $ | 306 | $ | 77 | $ | 757 | $ | 808 | ||||||
| BPR Retail Holdings LLC | 1,592 | 66 | 67 | 122 | 652 | 657 | ||||||||||||
| BSREP CARS Sub-Pooling LLC | 317 | 67 | 62 | 48 | 23 | 21 | ||||||||||||
| BSREP II PBSA Ltd. | 148 | 144 | 173 | 85 | 49 | 59 | ||||||||||||
| BSREP II MH Holdings LLC | 239 | 62 | 62 | — | 20 | 20 | ||||||||||||
| Center Parcs UK | 658 | 47 | 139 | 320 | 17 | 51 | ||||||||||||
| BSREP II Aries Pooling LLC | 256 | 75 | 74 | 33 | 26 | 26 | ||||||||||||
| BSREP II Retail Upper Pooling LLC | 298 | (121 | ) | (121 | ) | 2 | (116 | ) | (116 | ) | ||||||||
| BSREP II Korea Office Holdings Pte. Ltd. | 219 | 52 | 26 | 131 | 15 | 7 | ||||||||||||
| BSREP India Office Holdings Pte. Ltd. | 187 | 144 | 129 | 181 | 70 | 62 | ||||||||||||
| BSREP UA Holdings LLC | 115 | (96 | ) | (96 | ) | 222 | (43 | ) | (43 | ) | ||||||||
Forest City(1) | — | — | — | — | — | — | ||||||||||||
| Total | $ | 6,178 | $ | 758 | $ | 821 | $ | 1,221 | $ | 1,470 | $ | 1,552 | ||||||
(1) | The non-controlling interests of Forest City was deconsolidated on January 31, 2019. See Note 5, Investment Properties, for further information. |
- F-35 -
| Year ended Dec. 31, 2018 | ||||||||||||||||||
| Attributable to non-controlling interests | Attributable to owners of the partnership | |||||||||||||||||
| (US$ Millions) | Revenue | Net income (loss) | Total compre-hensive income | Distributions | Net income (loss) | Total compre-hensive income | ||||||||||||
| BPO | $ | 2,159 | $ | 245 | $ | 240 | $ | 35 | $ | 147 | $ | 194 | ||||||
| Forest City | 65 | (153 | ) | (153 | ) | 21 | (27 | ) | (27 | ) | ||||||||
| BPR Retail Holdings LLC | 584 | 34 | 34 | (1 | ) | 457 | 447 | |||||||||||
| BSREP CARS Sub-Pooling LLC | 311 | 105 | 99 | 54 | 37 | 34 | ||||||||||||
| Center Parcs UK | 644 | 87 | 50 | 55 | 33 | 19 | ||||||||||||
| BSREP II Korea Office Holdings Pte. Ltd. | 211 | 96 | 69 | 8 | 28 | 20 | ||||||||||||
| BSREP II MH Holdings LLC | 248 | 132 | 132 | 8 | 42 | 42 | ||||||||||||
| BSREP II PBSA Ltd. | 131 | 68 | 20 | — | 23 | 7 | ||||||||||||
| BSREP India Office Holdings Pte. Ltd. | 176 | 245 | 209 | 11 | 119 | 102 | ||||||||||||
| BSREP II Aries Pooling LLC | 190 | 51 | 52 | 69 | 18 | 18 | ||||||||||||
| BSREP II Retail Upper Pooling LLC | 302 | (190 | ) | (191 | ) | 1 | (189 | ) | (190 | ) | ||||||||
| BSREP UA Holdings LLC | 128 | 20 | 20 | — | 9 | 9 | ||||||||||||
| Total | $ | 5,149 | $ | 740 | $ | 581 | $ | 261 | $ | 697 | $ | 675 | ||||||
| Year ended Dec. 31, 2017 | ||||||||||||||||||
| Attributable to non-controlling interests | Attributable to owners of the partnership | |||||||||||||||||
| (US$ Millions) | Revenue | Net income (loss) | Total compre-hensive income | Distributions | Net income (loss) | Total compre-hensive income | ||||||||||||
| BPO | $ | 2,224 | $ | 120 | $ | 139 | $ | 9 | $ | (718 | ) | $ | (672 | ) | ||||
| BSREP CARS Sub-Pooling LLC | 311 | 87 | 85 | 377 | 30 | 29 | ||||||||||||
| Center Parcs UK | 587 | 13 | 94 | 210 | 5 | 36 | ||||||||||||
BSREP Industrial Pooling Subsidiary L.P.(1) | 143 | 175 | 175 | 163 | 65 | 65 | ||||||||||||
| BSREP II Korea Office Holdings Pte. Ltd. | 194 | 144 | 230 | 119 | 41 | 66 | ||||||||||||
| BSREP II Aries Pooling LLC | 285 | 53 | 54 | 59 | 18 | 18 | ||||||||||||
| BSREP II Retail Upper Pooling LLC | 306 | 50 | 50 | 1 | 42 | 42 | ||||||||||||
| BSREP II MH Holdings LLC | 194 | 133 | 133 | 16 | 44 | 44 | ||||||||||||
Brookfield Strategic Real Estate Partners II Storage REIT LLC(2) | 168 | 82 | 82 | 8 | 27 | 27 | ||||||||||||
| BSREP II PBSA Ltd. | 74 | 109 | 131 | — | 37 | 44 | ||||||||||||
| BSREP UA Holdings LLC | 124 | 117 | 117 | 99 | 50 | 50 | ||||||||||||
BREF ONE, LLC(2) | 717 | (33 | ) | (8 | ) | — | (17 | ) | (5 | ) | ||||||||
BSREP II Brazil Pooling LLC(2) | 70 | 63 | 55 | 17 | 30 | 26 | ||||||||||||
| BSREP India Office Holdings Pte. Ltd. | 156 | 130 | 154 | 47 | 63 | 75 | ||||||||||||
BSREP Europe Holdings L.P.(2) | 96 | 782 | 896 | 1,289 | 359 | 419 | ||||||||||||
| Total | $ | 5,649 | $ | 2,025 | $ | 2,387 | $ | 2,414 | $ | 76 | $ | 264 | ||||||
(1) | In the fourth quarter of 2018, the partnership sold its U.S. logistics portfolio held through a Brookfield-sponsored real estate fund. |
(2) | In the current year ended December 31, 2019, these entities are presented within Other non-controlling interest as the non-controlling interests are not material. |
Certain of the partnership’s subsidiaries are subject to restrictions over the extent to which they can remit funds to the partnership in the form of cash dividends, or repayment of loans and advances as a result of borrowing arrangements, regulatory restrictions and other contractual requirements.
- F-36 -
NOTE 7. EQUITY ACCOUNTED INVESTMENTS
The partnership has investments in joint arrangements that are joint ventures, and also has investments in associates. Joint ventures hold individual commercial properties and portfolios of commercial properties and developments that the partnership owns together with co-owners where decisions relating to the relevant activities of the joint venture require the unanimous consent of the co-owners. Details of the partnership’s investments in joint ventures and associates, which have been accounted for in accordance with the equity method of accounting, are as follows:
Proportion of ownership interests/voting rights held by the partnership | Carrying value | |||||||||||
| (US$ Millions) | Principal activity | Principal place of business | Dec. 31, 2019 | Dec. 31, 2018 | Dec. 31, 2019 | Dec. 31, 2018 | ||||||
| Joint ventures | ||||||||||||
Canary Wharf Joint Venture(1) | Property holding company | United Kingdom | 50 | % | 50 | % | $ | 3,578 | $ | 3,270 | ||
| Ala Moana Center, Hawaii | Property holding company | United States | 50 | % | 50 | % | 1,946 | 1,611 | ||||
| Manhattan West, New York | Property holding company | United States | 56 | % | 56 | % | 1,918 | 1,619 | ||||
| BPR JV Pool A | Property holding company | United States | 50 | % | 50 | % | 1,882 | 1,791 | ||||
| BPR JV Pool B | Property holding company | United States | 51 | % | 51 | % | 1,366 | 1,217 | ||||
| Fashion Show, Las Vegas | Property holding company | United States | 50 | % | 50 | % | 832 | 881 | ||||
| BPR JV Pool C | Property holding company | United States | 50 | % | 50 | % | 777 | 756 | ||||
| Grace Building, New York | Property holding company | United States | 50 | % | 50 | % | 716 | 581 | ||||
| BPR JV Pool D | Property holding company | United States | 48 | % | 48 | % | 649 | 693 | ||||
| Southern Cross East, Melbourne | Property holding company | Australia | 50 | % | 50 | % | 466 | 402 | ||||
| The Grand Canal Shoppes, Las Vegas | Property holding company | United States | 50 | % | 50 | % | 414 | 608 | ||||
| One Liberty Plaza, New York | Property holding company | United States | 51 | % | 51 | % | 409 | 425 | ||||
| 680 George Street, Sydney | Property holding company | Australia | 50 | % | 50 | % | 340 | 319 | ||||
| Brookfield Brazil Retail Fundo de Investimento em Participaçõe (“Brazil Retail”) | Holding company | Brazil | 46 | % | 46 | % | 335 | 309 | ||||
| Baybrook Mall, Texas | Property holding company | United States | 51 | % | 51 | % | 332 | 235 | ||||
| Brookfield D.C. Office Partners LLC ("D.C. Fund"), Washington, D.C. | Property holding company | United States | 51 | % | 51 | % | 283 | 295 | ||||
| The Mall in Columbia, Maryland | Property holding company | United States | 50 | % | 50 | % | 282 | 268 | ||||
| BPR JV Pool F | Property holding company | United States | 51 | % | 51 | % | 278 | 185 | ||||
| BPR JV Pool G | Property holding company | United States | 68 | % | 68 | % | 254 | 225 | ||||
| Miami Design District, Florida | Property holding company | United States | 22 | % | 22 | % | 252 | 286 | ||||
BPR JV Pool E(2) | Property holding company | United States | — | % | 35 | % | — | 629 | ||||
Forest City Joint Ventures(3) | Property holding company | United States | — | % | — | % | — | 1,390 | ||||
Shops at Merrick Park, Florida(2) | Property holding company | United States | — | % | 55 | % | — | 266 | ||||
Other(4) | Various | Various | 14% - 55% | 12% - 70% | 3,119 | 3,592 | ||||||
| 20,428 | 21,853 | |||||||||||
| Associates | ||||||||||||
Diplomat Resort and Spa (“Diplomat”)(5) | Property holding company | United States | — | % | 90 | % | — | 390 | ||||
Brookfield Premier Real Estate Partners Pooling LLC (“BPREP”)(6) | Property holding company | United States | — | % | 7 | % | — | 106 | ||||
| Other | Various | Various | 23% - 31% | 23% - 31% | 336 | 349 | ||||||
| 336 | 845 | |||||||||||
| Total | $ | 20,764 | $ | 22,698 | ||||||||
(1) | Stork Holdco LP is the joint venture through which the partnership acquired Canary Wharf Group plc in London. |
(2) | The partnership acquired its joint venture partner’s incremental interest in the BPR JV Pool E and Shops at Merrick Park during 2019. The partnership will now consolidate the results of these investments. See below for further information. |
(3) | Includes the impact of the deconsolidation of BSREP III investments, primarily Forest City. See below for further information. |
(4) | Other joint ventures consists of approximately 40 joint ventures, all of which have a carrying value below $250 million. |
(5) | In the fourth quarter of 2019, the partnership reclassified its interest in the Diplomat to assets held for sale. |
(6) | In the first quarter of 2019, the partnership accounted for its interest in BPREP as a financial asset and is no longer an equity accounted investment. |
- F-37 -
(a) 2019 Transactions
The deconsolidation of BSREP III resulted in a decrease to equity accounted investments of $1,434 million. Please see Note 5, Investment Properties for further information.
In the fourth quarter of 2019, the partnership acquired its joint venture partners’ incremental interest in Park Meadows in Colorado, Towson Town Center in Maryland, Perimeter Mall in Georgia, and Shops at Merrick Park in Florida, to bring its ownership to 100% and concurrently sold its interest in Bridgewater Commons in New Jersey to the joint venture partner. Prior to the acquisition, the partnership’s joint venture interest was reflected as equity accounted investments. As a result, the partnership gained control of the investments and consolidate its results.
(b) 2018 Transactions
The partnership obtained control of GGP during the third quarter of 2018 following the acquisition of the common shares not previously held by the partnership and its subsidiaries. Subsequent to this transaction, the partnership is consolidating the financial results of GGP, including its interests in properties held through joint ventures. The partnership’s 34% interest in GGP prior to the acquisition was derecognized. Please see Note 4, Acquisition of GGP Inc., for further information.
The partnership obtained control of Forest City during the fourth quarter of 2018 following the acquisition in the BSREP III fund. Forest City included properties held through joint ventures. As mentioned above, these investments were deconsolidated in 2019.
The following table presents the change in the balance of the partnership’s equity accounted investments as of December 31, 2019 and 2018:
| (US$ Millions) Years ended Dec. 31, | 2019 | 2018 | ||||
| Equity accounted investments, beginning of year | $ | 22,698 | $ | 19,761 | ||
GGP joint ventures acquired from business acquisition(1) | — | 10,829 | ||||
Deconsolidation of pre-acquisition GGP equity interest(1) | — | (8,345 | ) | |||
| Additions | 684 | 2,174 | ||||
| Disposals and return of capital distributions | (764 | ) | (1,304 | ) | ||
| Share of net earnings from equity accounted investments | 1,969 | 947 | ||||
| Distributions received | (470 | ) | (518 | ) | ||
| Foreign currency translation | 127 | (395 | ) | |||
Reclassification to assets held for sale(2) | (189 | ) | (567 | ) | ||
Impact of deconsolidation of BSREP III(3) | (1,434 | ) | — | |||
Other comprehensive income and other(4) | (1,857 | ) | 116 | |||
| Equity accounted investments, end of year | $ | 20,764 | $ | 22,698 | ||
(1) | The partnership obtained control of GGP during the third quarter of 2018 following the acquisition of the common shares not previously held by the partnership and its subsidiaries. As a result of the acquisition, GGP’s interest in joint ventures of $10,829 million was added to the balance of equity accounted investments, offset by the deconsolidation of the partnership’s 34% interest of $7,843 million and fair value loss of $502 million from adjusting the partnership’s interest in GGP to its fair value immediately prior to acquiring control. See Note 4, Acquisition of GGP Inc., for further information. |
(2) | The partnership’s interest in the Diplomat was reclassified to assets held for sale in the fourth quarter of 2019. The partnership’s interest in China Xintiandi (“CXTD”) was reclassified to assets held for sale in the fourth quarter of 2018 and sold in the first quarter in 2019. |
(3) | Includes the impact of the deconsolidation of BSREP III investments, primarily Forest City. See above for further information. |
(4) | The partnership acquired an incremental interest in Park Meadows in Colorado, Towson Town Center in Maryland, Perimeter Mall in Georgia, Shops at Merrick Park in Florida and 730 Fifth Avenue in New York during 2019, bringing its ownership in each of the malls to 100%. As a result, the partnership now consolidate its interest in the assets. The partnership also acquired an incremental interest in One and Two London Wall Place in London during 2019. As a result, the partnership now consolidates its interest in the assets. |
- F-38 -
The key valuation metrics for the partnership’s commercial properties held within the partnership’s equity accounted investments are set forth in the table below on a weighted-average basis:
| Dec. 31, 2019 | Dec. 31, 2018 | ||||||||||
Equity accounted investments | Primary valuation method | Discount rate | Terminal capitalization rate | Investment horizon (yrs.) | Discount rate | Terminal capitalization rate | Investment horizon (yrs.) | ||||
| Core Office | |||||||||||
| United States | Discounted cash flow | 6.8 | % | 4.9 | % | 11 | 6.6 | % | 5.1 | % | 10 |
| Australia | Discounted cash flow | 6.5 | % | 5.2 | % | 10 | 6.7 | % | 5.7 | % | 10 |
| Europe | Discounted cash flow | 4.6 | % | 5.0 | % | 10 | 4.7 | % | 4.9 | % | 10 |
| Core Retail | |||||||||||
| United States | Discounted cash flow | 6.3 | % | 4.9 | % | 10 | 6.6 | % | 5.3 | % | 11 |
| LP Investments - Office | Discounted cash flow | 6.0 | % | 5.3 | % | 10 | 6.9 | % | 5.2 | % | 9 |
| LP Investments - Retail | Discounted cash flow | 7.4 | % | 6.2 | % | 10 | 8.4 | % | 7.1 | % | 10 |
Multifamily(1) | Direct capitalization | 5.3 | % | n/a | n/a | 5.2 | % | n/a | n/a | ||
(1) | The valuation method used to value multifamily investments is the direct capitalization method. The rates presented as the discount rate relate to the overall implied capitalization rate. The terminal capitalization rate and investment horizon are not applicable. |
The following tables present the gross assets and liabilities of the partnership’s equity accounted investments as of December 31, 2019 and 2018:
| Dec. 31, 2019 | |||||||||||||||
| (US$ Millions) | Current assets | Non-current assets | Current liabilities | Non-current liabilities | Net assets | ||||||||||
| Joint ventures | |||||||||||||||
| Canary Wharf Joint Venture | $ | 1,219 | $ | 13,432 | $ | 1,344 | $ | 6,151 | $ | 7,156 | |||||
| Ala Moana | 99 | 5,717 | 43 | 1,882 | 3,891 | ||||||||||
| Manhattan West | 215 | 6,502 | 1,659 | 1,633 | 3,425 | ||||||||||
| BPR JV Pool A | 218 | 5,862 | 125 | 2,191 | 3,764 | ||||||||||
| BPR JV Pool B | 230 | 6,085 | 102 | 3,534 | 2,679 | ||||||||||
| Fashion Show | 38 | 2,475 | 20 | 828 | 1,665 | ||||||||||
| BPR JV Pool C | 41 | 2,295 | 34 | 666 | 1,636 | ||||||||||
| Grace Building | 44 | 2,304 | 16 | 896 | 1,436 | ||||||||||
| BPR JV Pool D | 50 | 2,183 | 82 | 790 | 1,361 | ||||||||||
| Southern Cross East | 6 | 933 | 7 | — | 932 | ||||||||||
| The Grand Canal Shoppes | 54 | 1,782 | 35 | 974 | 827 | ||||||||||
| One Liberty Plaza | 28 | 1,666 | 39 | 854 | 801 | ||||||||||
| 680 George Street | 3 | 680 | 4 | — | 679 | ||||||||||
| Brazil Retail | 31 | 1,024 | 11 | 95 | 949 | ||||||||||
| Baybrook Mall | 14 | 883 | 11 | 236 | 650 | ||||||||||
| D.C. Fund | 50 | 1,298 | 190 | 604 | 554 | ||||||||||
| The Mall in Columbia | 27 | 867 | 9 | 321 | 564 | ||||||||||
| BPR JV Pool F | 9 | 768 | 5 | 227 | 545 | ||||||||||
| BPR JV Pool G | 13 | 733 | 15 | 360 | 371 | ||||||||||
| Miami Design District | 53 | 1,683 | 29 | 570 | 1,137 | ||||||||||
Other(1) | 1,821 | 14,706 | 1,971 | 6,236 | 8,320 | ||||||||||
| 4,263 | 73,878 | 5,751 | 29,048 | 43,342 | |||||||||||
| Associates | |||||||||||||||
| Other | 123 | 1,837 | 35 | 1,045 | 880 | ||||||||||
| 123 | 1,837 | 35 | 1,045 | 880 | |||||||||||
| Total | $ | 4,386 | $ | 75,715 | $ | 5,786 | $ | 30,093 | $ | 44,222 | |||||
(1) | BPR JV Pool E, Forest City Joint Ventures and The Shops at Merrick Park are included in Other for the current year as they have carrying values of nil due to transaction activity and deconsolidation during 2019. |
- F-39 -
| Dec. 31, 2018 | |||||||||||||||
| (US$ Millions) | Current assets | Non-current assets | Current liabilities | Non-current liabilities | Net assets | ||||||||||
| Joint ventures | |||||||||||||||
| Canary Wharf Joint Venture | $ | 666 | $ | 12,268 | $ | 577 | $ | 5,818 | $ | 6,539 | |||||
| BPR JV Pool A | 186 | 5,619 | 125 | 2,097 | 3,583 | ||||||||||
| Manhattan West | 142 | 5,455 | 681 | 2,027 | 2,889 | ||||||||||
| Ala Moana | 91 | 5,063 | 57 | 1,874 | 3,223 | ||||||||||
| Forest City | 308 | 7,729 | 330 | 4,152 | 3,555 | ||||||||||
| BPR JV Pool B | 99 | 5,909 | 107 | 3,515 | 2,386 | ||||||||||
| Fashion Show | 35 | 2,572 | 19 | 826 | 1,762 | ||||||||||
| BPR JV Pool C | 42 | 2,264 | 34 | 676 | 1,596 | ||||||||||
| BPR JV Pool D | 43 | 2,293 | 101 | 793 | 1,442 | ||||||||||
| BPR JV Pool E | 47 | 2,756 | 39 | 967 | 1,797 | ||||||||||
| The Grand Canal Shoppes | 28 | 1,832 | 23 | 625 | 1,212 | ||||||||||
| Grace Building | 32 | 2,043 | 19 | 894 | 1,162 | ||||||||||
| One Liberty Plaza | 107 | 1,604 | 23 | 855 | 833 | ||||||||||
| Southern Cross East | 5 | 805 | 7 | — | 803 | ||||||||||
| 680 George Street | 10 | 1,334 | 14 | — | 1,330 | ||||||||||
| Brazil Retail | 30 | 916 | 13 | 67 | 866 | ||||||||||
| D.C. Fund | 58 | 1,321 | 31 | 770 | 578 | ||||||||||
| Miami Design District | 49 | 1,877 | 28 | 629 | 1,269 | ||||||||||
| The Mall in Columbia | 14 | 858 | 9 | 328 | 535 | ||||||||||
| Shops at Merrick Park | 12 | 660 | 21 | 166 | 485 | ||||||||||
| Other | 1,989 | 20,588 | 2,413 | 9,140 | 11,024 | ||||||||||
| 3,993 | 85,766 | 4,671 | 36,219 | 48,869 | |||||||||||
| Associates | |||||||||||||||
| Diplomat | 24 | 837 | 23 | 405 | 433 | ||||||||||
| BPREP | 12 | 1,998 | 12 | 457 | 1,541 | ||||||||||
| Other | 366 | 1,430 | 72 | 819 | 905 | ||||||||||
| 402 | 4,265 | 107 | 1,681 | 2,879 | |||||||||||
| Total | $ | 4,395 | $ | 90,031 | $ | 4,778 | $ | 37,900 | $ | 51,748 | |||||
- F-40 -
Summarized financial information in respect of the partnership’s equity accounted investments for the years ended December 31, 2019, 2018 and 2017 is set out below:
| Year ended December 31, 2019 | ||||||||||||||||||||||||
| (US$ Millions) | Revenue | Expenses | Fair value gains (losses) | Income from EAI(1) | Net income | Other compre- hensive income | Partnership’s share of net income | Distributions received | ||||||||||||||||
| Joint ventures | ||||||||||||||||||||||||
| Canary Wharf Joint Venture | $ | 555 | $ | 320 | $ | 126 | $ | 22 | $ | 383 | $ | (11 | ) | $ | 191 | $ | 9 | |||||||
| Ala Moana | 300 | 149 | 758 | — | 909 | — | 455 | 48 | ||||||||||||||||
| Manhattan West | 201 | 136 | 155 | — | 220 | (43 | ) | 123 | 42 | |||||||||||||||
| BPR JV Pool A | 379 | 214 | 172 | — | 337 | — | 168 | 6 | ||||||||||||||||
| BPR JV Pool B | 564 | 350 | (50 | ) | 65 | 229 | — | 116 | — | |||||||||||||||
| Fashion Show | 118 | 57 | (112 | ) | — | (51 | ) | — | (26 | ) | 15 | |||||||||||||
| BPR JV Pool C | 158 | 73 | 7 | — | 92 | — | 46 | 10 | ||||||||||||||||
| Grace Building | 107 | 84 | 215 | — | 238 | — | 119 | — | ||||||||||||||||
| BPR JV Pool D | — | — | (49 | ) | 64 | 15 | — | 8 | 5 | |||||||||||||||
| Southern Cross East | 42 | 6 | 110 | — | 146 | — | 73 | 5 | ||||||||||||||||
| The Grand Canal Shoppes | 138 | 73 | (44 | ) | — | 21 | — | 11 | 21 | |||||||||||||||
| One Liberty Plaza | 134 | 84 | (25 | ) | — | 25 | (33 | ) | 13 | 9 | ||||||||||||||
| 680 George Street | 36 | 9 | 47 | — | 74 | — | 37 | 15 | ||||||||||||||||
| Brazil Retail | 59 | 54 | 157 | — | 162 | — | 75 | 39 | ||||||||||||||||
| Baybrook Mall | 45 | 26 | 204 | — | 223 | — | 114 | — | ||||||||||||||||
| D.C. Fund | 125 | 82 | (50 | ) | — | (7 | ) | — | (4 | ) | — | |||||||||||||
| The Mall in Columbia | 56 | 29 | 5 | — | 32 | — | 16 | — | ||||||||||||||||
| BPR JV Pool F | 39 | 17 | 178 | — | 200 | — | 102 | — | ||||||||||||||||
| BPR JV Pool G | 53 | 32 | 50 | — | 71 | — | 48 | — | ||||||||||||||||
| Miami Design District | 72 | 67 | (234 | ) | — | (229 | ) | — | (51 | ) | — | |||||||||||||
Other(2) | 1,746 | 1,217 | 349 | 11 | 889 | (17 | ) | 359 | 142 | |||||||||||||||
| 4,927 | 3,079 | 1,969 | 162 | 3,979 | (104 | ) | 1,993 | 366 | ||||||||||||||||
| Associates | ||||||||||||||||||||||||
| Diplomat | 172 | 181 | (6 | ) | — | (15 | ) | — | (13 | ) | 73 | |||||||||||||
| BPREP | — | — | — | — | — | — | — | — | ||||||||||||||||
| Other | 216 | 251 | (10 | ) | 3 | (42 | ) | 50 | (11 | ) | 31 | |||||||||||||
| 388 | 432 | (16 | ) | 3 | (57 | ) | 50 | (24 | ) | 104 | ||||||||||||||
| Total | $ | 5,315 | $ | 3,511 | $ | 1,953 | $ | 165 | $ | 3,922 | $ | (54 | ) | $ | 1,969 | $ | 470 | |||||||
(1) | Share of net earnings from equity accounted investments recorded by the partnership’s joint ventures and associates. |
(2) | Includes BPR JV Pool E, Forest City Joint Ventures and The Shops at Merrick Park for the current year as they have carrying values of nil due to transaction activity and deconsolidation during 2019. |
- F-41 -
| Year ended December 31, 2018 | ||||||||||||||||||||||||
| (US$ Millions) | Revenue | Expenses | Fair value gains (losses) | Income from EAI(1) | Net income | Other compre- hensive income | Partnership’s share of net income | Distributions received | ||||||||||||||||
| Joint ventures | ||||||||||||||||||||||||
| Canary Wharf Joint Venture | $ | 547 | $ | 125 | $ | (72 | ) | $ | (1 | ) | $ | 349 | $ | 8 | $ | 175 | $ | — | ||||||
| BPR JV Pool A | 162 | 77 | (5 | ) | — | 80 | — | 41 | — | |||||||||||||||
| Manhattan West | 123 | 104 | 423 | — | 442 | (15 | ) | 248 | — | |||||||||||||||
| Ala Moana | 78 | 38 | (6 | ) | — | 34 | — | 17 | 8 | |||||||||||||||
| Forest City | 48 | 35 | — | — | 13 | — | 8 | — | ||||||||||||||||
| BPR JV Pool B | 208 | 112 | (7 | ) | 8 | 97 | — | 49 | 1 | |||||||||||||||
| Fashion Show | 32 | 13 | (2 | ) | — | 17 | — | 8 | 3 | |||||||||||||||
| BPR JV Pool C | 52 | 23 | (1 | ) | — | 28 | — | 14 | 6 | |||||||||||||||
| BPR JV Pool D | — | — | — | 26 | 26 | — | 12 | 2 | ||||||||||||||||
| BPR JV Pool E | 49 | 15 | (2 | ) | — | 32 | — | 11 | 3 | |||||||||||||||
| The Grand Canal Shoppes | 30 | 18 | (1 | ) | — | 11 | — | 5 | 2 | |||||||||||||||
| Grace Building | 125 | 83 | (34 | ) | — | 8 | — | 4 | 8 | |||||||||||||||
| One Liberty Plaza | 114 | 84 | 9 | — | 39 | (10 | ) | 21 | 9 | |||||||||||||||
| Southern Cross East | 45 | 7 | 38 | — | 76 | — | 38 | — | ||||||||||||||||
| 680 George Street | 34 | 9 | 136 | — | 161 | — | 56 | 18 | ||||||||||||||||
| Brazil Retail | 61 | 30 | 59 | — | 90 | — | 41 | 20 | ||||||||||||||||
| D.C. Fund | 131 | 81 | (45 | ) | — | 5 | — | 2 | 22 | |||||||||||||||
| Miami Design District | 24 | 24 | (1 | ) | — | (1 | ) | — | — | — | ||||||||||||||
| The Mall in Columbia | 19 | 9 | (1 | ) | — | 9 | — | 5 | — | |||||||||||||||
| Shops at Merrick Park | 17 | 6 | — | — | 11 | — | 6 | 1 | ||||||||||||||||
| Other | 1,290 | 897 | 696 | (22 | ) | 1,067 | (19 | ) | 409 | 143 | ||||||||||||||
| 3,189 | 1,790 | 1,184 | 11 | 2,594 | (36 | ) | 1,170 | 246 | ||||||||||||||||
| Associates | ||||||||||||||||||||||||
GGP(2) | 1,536 | 1,221 | (1,598 | ) | 271 | (1,012 | ) | (15 | ) | (274 | ) | 214 | ||||||||||||
CXTD(3) | 142 | 60 | 18 | (3 | ) | 97 | — | 21 | 10 | |||||||||||||||
| Diplomat | 174 | 175 | — | — | (1 | ) | 77 | (1 | ) | 18 | ||||||||||||||
| BPREP | 60 | (10 | ) | 1 | — | 71 | — | 9 | 4 | |||||||||||||||
| Other | 263 | 261 | 71 | 1 | 74 | 76 | 22 | 26 | ||||||||||||||||
| 2,175 | 1,707 | (1,508 | ) | 269 | (771 | ) | 138 | (223 | ) | 272 | ||||||||||||||
| Total | $ | 5,364 | $ | 3,497 | $ | (324 | ) | $ | 280 | $ | 1,823 | $ | 102 | $ | 947 | $ | 518 | |||||||
(1) | Share of net earnings from equity accounted investments recorded by the partnership’s joint ventures and associates. |
(2) | Includes net income presented before allocation to non-controlling interests and preferred dividends from GGP prior to the GGP acquisition in the third quarter of 2018. |
(3) | The partnership sold it’s interest in CXTD in the first quarter of 2019. |
- F-42 -
| Year ended December 31, 2017 | ||||||||||||||||||||||||
| (US$ Millions) | Revenue | Expenses | Fair value gains (losses) | Income of EAI(1) | Net income | Other compre- hensive income | Partnership’s share of net income | Distributions received | ||||||||||||||||
| Joint ventures | ||||||||||||||||||||||||
| Canary Wharf Joint Venture | $ | 581 | $ | 370 | $ | (49 | ) | $ | 21 | $ | 183 | $ | 5 | $ | 91 | $ | — | |||||||
| Manhattan West | 81 | 70 | 308 | — | 319 | — | 179 | 1 | ||||||||||||||||
| Grace Building | 120 | 80 | (23 | ) | — | 17 | — | 9 | 7 | |||||||||||||||
| One Liberty Plaza | 3 | 2 | 103 | — | 104 | (7 | ) | 53 | — | |||||||||||||||
| Southern Cross East | 46 | 7 | 21 | — | 60 | — | 30 | — | ||||||||||||||||
| Brazil Retail | 48 | 29 | 31 | — | 50 | — | 23 | 11 | ||||||||||||||||
| 680 George Street | 34 | 9 | 17 | — | 42 | — | 21 | — | ||||||||||||||||
| D.C. Fund | 129 | 76 | (54 | ) | — | (1 | ) | — | (1 | ) | 23 | |||||||||||||
VAMF II(2) | 154 | 116 | 117 | 4 | 159 | — | 59 | — | ||||||||||||||||
Principal Place - Commercial(2) | 28 | 61 | 132 | — | 99 | — | 49 | — | ||||||||||||||||
Potsdamer Platz(2) | 96 | 95 | 108 | — | 109 | — | 27 | — | ||||||||||||||||
One New York Plaza(2) | 121 | 78 | (4 | ) | — | 39 | 7 | 6 | 1 | |||||||||||||||
Republic Plaza(2) | 46 | 30 | (33 | ) | — | (17 | ) | — | (9 | ) | — | |||||||||||||
75 State Street(2) | 49 | 30 | 6 | — | 25 | — | 6 | 2 | ||||||||||||||||
| 245 Park Avenue | 54 | 31 | (24 | ) | — | (1 | ) | — | — | 10 | ||||||||||||||
| Other | 259 | 111 | 148 | — | 296 | 16 | 153 | 38 | ||||||||||||||||
| 1,849 | 1,195 | 804 | 25 | 1,483 | 21 | 696 | 93 | |||||||||||||||||
| Associates | ||||||||||||||||||||||||
GGP(3)(4) | 2,405 | 1,207 | (2,307 | ) | 518 | (591 | ) | 12 | 179 | 240 | ||||||||||||||
CXTD(5) | 128 | 145 | 121 | — | 104 | — | 23 | — | ||||||||||||||||
| Diplomat | 151 | 166 | — | — | (15 | ) | 43 | (14 | ) | 6 | ||||||||||||||
| BPREP | 40 | 27 | 31 | 71 | 115 | — | 12 | 3 | ||||||||||||||||
| Other | 253 | 183 | 147 | — | 217 | 61 | 65 | 27 | ||||||||||||||||
| 2,977 | 1,728 | (2,008 | ) | 589 | (170 | ) | 116 | 265 | 276 | |||||||||||||||
| Total | $ | 4,826 | $ | 2,923 | $ | (1,204 | ) | $ | 614 | $ | 1,313 | $ | 137 | $ | 961 | $ | 369 | |||||||
(1) | Share of net earnings from equity accounted investments recorded by the partnership’s joint ventures and associates. |
(2) | In the current year ended December 31, 2019, these joint ventures are presented within Joint Ventures - Other. |
(3) | Includes net income presented before allocation to non-controlling interests and preferred dividends from GGP prior to the GGP acquisition in the third quarter of 2018. |
(4) | As a result of the partnership’s exercise of GGP warrants in 2017, the additional shares that were acquired by the partnership were acquired at a discount to the net fair value of the proportionate interest in the underlying assets acquired and liabilities assumed. The partnership recognized a $442 million gain within the partnership’s share of net income. |
(5) | The partnership sold it’s interest in CXTD in the first quarter of 2019. |
Certain of the partnership’s investment in joint ventures and associates are subject to restrictions over the extent to which they can remit funds to the partnership in the form of the cash dividends or repayments of loans and advances as a result of borrowing arrangements, regulatory restrictions and other contractual requirements.
- F-43 -
NOTE 8. INVESTMENTS IN JOINT OPERATIONS
The partnership’s interests in the following properties are subject to joint control and, accordingly, the partnership has recorded its share of the assets, liabilities, revenues, and expenses of the properties in these consolidated financial statements:
Place of incorporation and principal place of business | Ownership(1) | |||||
| Name of property | Principal activity | Dec. 31, 2019 | Dec. 31, 2018 | |||
| Brookfield Place - Retail & Parking | Property | Toronto | 56 | % | 56 | % |
| Brookfield Place III | Development property | Toronto | 54 | % | 54 | % |
| Exchange Tower | Property | Toronto | 50 | % | 50 | % |
First Canadian Place(2) | Property | Toronto | 25 | % | 25 | % |
| 2 Queen Street East | Property | Toronto | 25 | % | 25 | % |
| Bankers Hall | Property | Calgary | 50 | % | 50 | % |
| Bankers Court | Property | Calgary | 50 | % | 50 | % |
| Bankers West Parkade | Development property | Calgary | 50 | % | 50 | % |
| Suncor Energy Centre | Property | Calgary | 50 | % | 50 | % |
| Fifth Avenue Place | Property | Calgary | 50 | % | 50 | % |
| Place de Ville I | Property | Ottawa | 25 | % | 25 | % |
| Place de Ville II | Property | Ottawa | 25 | % | 25 | % |
| 300 Queen Street | Development property | Ottawa | 25 | % | 25 | % |
52 Goulburn Street(3) | Property | Sydney | 24 | % | 50 | % |
235 St Georges Terrace(3) | Property | Perth | 24 | % | 50 | % |
108 St Georges Terrace(3) | Property | Perth | 50 | % | 50 | % |
Southern Cross West(3) | Property | Melbourne | 50 | % | 50 | % |
| Shopping Patio Higienópolis | Property | São Paulo | 25 | % | 25 | % |
| Shopping Patio Higienópolis - Expansion | Development property | São Paulo | 32 | % | 32 | % |
| Shopping Patio Higienópolis - Co-Invest | Property | São Paulo | 5 | % | 5 | % |
| Shopping Patio Higienópolis Expansion - Co-Invest | Development property | São Paulo | 6 | % | 6 | % |
| G2-Infospace Gurgaon | Property | NCR-Delhi Region | 72 | % | 72 | % |
(1) | Represents ownership in these properties before non-controlling interests in subsidiaries that hold these ownership interests. |
(2) | First Canadian Place in Toronto is subject to a ground lease with respect to 50% of the land on which the property is situated. At the expiry of the ground lease, the other land owner will have the option to acquire, for a nominal amount, an undivided 50% beneficial interest in the property. |
(3) | The partnership exercised joint control over these assets through a participating loan agreement with Brookfield Asset Management. The partnership converted its interest into a direct equity interest in the entities with a direct co-ownership interest in the underlying assets. |
NOTE 9. PARTICIPATING LOAN INTERESTS
Participating loan interests represented interests in certain properties in Australia that did not provide the partnership with control over the entity that owns the underlying property and were held at FVTPL on the consolidated balance sheets. The partnership sold its remaining participating loan interest in Darling Park Complex in Sydney in the third quarter of 2019. The instruments, which were receivable from a wholly-owned subsidiary of Brookfield Asset Management, was subject to the partnership’s prior right to convert into direct ownership interests in the underlying commercial properties, and had contractual interest rates that vary with the results of operations of those properties.
The outstanding principal of the participating loan interests relates to the following property:
| (US$ Millions) | Participation interest | Carrying value | ||||||||
| Name of property | Dec. 31, 2019 | Dec. 31, 2018 | Dec. 31, 2019 | Dec. 31, 2018 | ||||||
| Darling Park Complex, Sydney | — | % | 30 | % | $ | — | $ | 268 | ||
| Total participating loan interests | $ | — | $ | 268 | ||||||
(1) | The partnership sold the Darling Park Complex in the third quarter of 2019. |
For the year ended December 31, 2019, the partnership recognized interest income on the participating loan interests of $8 million (2018 - $17 million; 2017 - $27 million) and fair value gains of $41 million (2018 - $36 million; 2017 - $59 million).
- F-44 -
NOTE 10. PROPERTY, PLANT AND EQUIPMENT
Property, plant, and equipment primarily consists of hospitality assets such as Center Parcs UK, Paradise Island Holdings Limited (“Atlantis”), a portfolio of extended-stay hotels in the United States and a hotel at IFC Seoul.
The following table presents the useful lives of each hospitality asset by class:
| Hospitality assets by class | Useful life (in years) |
| Building and building improvements | 5 to 50+ |
| Land improvements | 14 to 15 |
| Furniture, fixtures and equipment | 2 to 15 |
Hospitality properties are accounted for under the revaluation model with revaluation to fair value performed annually at December 31. Significant unobservable inputs (Level 3) in estimating hospitality property values under the revaluation method include estimates of replacement cost and estimates of remaining economic life.
Hospitality properties with a fair value of approximately $2.8 billion (December 31, 2018 - $2.3 billion) are situated on land held under leases or other agreements largely expiring after the year 2065.
The following table presents the change to the components of the partnership’s hospitality assets from the beginning of the year:
| (US$ Millions) | Dec. 31, 2019 | Dec. 31, 2018 | ||||
| Cost: | ||||||
| Balance, beginning of year | $ | 7,461 | $ | 5,451 | ||
| Acquisitions through business combinations | — | 1,748 | ||||
Accounting policy change(1) | 122 | — | ||||
| Additions | 387 | 490 | ||||
| Disposals | (52 | ) | (21 | ) | ||
| Foreign currency translation | 98 | (207 | ) | |||
Impact of deconsolidation due to loss of control and other(2) | (770 | ) | — | |||
| 7,246 | 7,461 | |||||
| Accumulated fair value changes: | ||||||
| Balance, beginning of year | 1,049 | 756 | ||||
| Revaluation gains, net | 301 | 293 | ||||
Impact of deconsolidation due to loss of control and other(2) | (7 | ) | — | |||
| 1,343 | 1,049 | |||||
| Accumulated depreciation: | ||||||
| Balance, beginning of year | (1,004 | ) | (750 | ) | ||
| Depreciation | (329 | ) | (291 | ) | ||
| Disposals | 30 | 18 | ||||
| Foreign currency translation | (15 | ) | 19 | |||
Impact of deconsolidation due to loss of control and other(2) | 7 | — | ||||
| (1,311 | ) | (1,004 | ) | |||
| Total property, plant and equipment | $ | 7,278 | $ | 7,506 | ||
(1) | Includes the impact of the adoption of IFRS 16 through the recognition of right-of-use assets. See Note 2, Summary of Significant Accounting Policies for further information. |
(2) | Includes the impact of the deconsolidation of BSREP III investments. See Note 5, Investment Properties for further information. |
NOTE 11. GOODWILL
Goodwill of $1,041 million at December 31, 2019 (December 31, 2018 - $1,109 million) was primarily attributable to Center Parcs UK and IFC Seoul. The partnership performs a goodwill impairment test annually by assessing if the carrying value of the cash-generating unit, including the allocated goodwill, exceeds its recoverable amount determined as the greater of the estimated fair value less costs to sell or the value in use.
- F-45 -
NOTE 12. INTANGIBLE ASSETS
The partnership’s intangible assets are presented on a cost basis, net of accumulated amortization and accumulated impairment losses in the consolidated balance sheets. These intangible assets primarily represent the trademark assets related to Center Parcs UK.
The trademark assets of Center Parcs UK had a carrying amount of $956 million as of December 31, 2019 (December 31, 2018 - $921 million). They have been determined to have an indefinite useful life as the partnership has the legal right to operate these trademarks exclusively in certain territories and in perpetuity. The business model of Center Parcs UK is not subject to technological obsolescence or commercial innovations in any material way.
In addition, intangible assets include the trademark and licensing assets relating to Atlantis. At December 31, 2019, intangible assets of Atlantis had a carrying value of $205 million (December 31, 2018 - $207 million). They have been determined to have an indefinite useful life as the partnership has the legal right to operate these intangible assets granted under perpetual licenses. The business model of Atlantis is not subject to technological obsolescence or commercial innovations in any material way.
| Intangible assets by class | Useful life (in years) | |
| Trademarks | Indefinite | |
| Management contracts | 40 | |
| Customer relationships | 9 | |
| Other | 4 to 7 | |
Intangible assets with indefinite useful lives and intangible assets not yet available for use, are tested for impairment at least annually, and whenever there is an indication that the asset may be impaired. Intangible assets with finite useful lives are amortized over their respective useful lives as listed above. Amortization is recorded as part of depreciation and amortization of non-real estate assets expense.
The following table presents the components of the partnership’s intangible assets as of December 31, 2019 and December 31, 2018:
| (US$ Millions) | Dec. 31, 2019 | Dec. 31, 2018 | ||||
| Cost | $ | 1,265 | $ | 1,273 | ||
| Accumulated amortization | (55 | ) | (46 | ) | ||
| Accumulated impairment losses | (48 | ) | (48 | ) | ||
| Balance, end of year | $ | 1,162 | $ | 1,179 | ||
The following table presents a roll forward of the partnership’s intangible assets December 31, 2019 and December 31, 2018:
| (US$ Millions) | Dec. 31, 2019 | Dec. 31, 2018 | ||||
| Balance, beginning of year | $ | 1,179 | $ | 1,188 | ||
| Acquisitions | 9 | 67 | ||||
| Disposals | — | 2 | ||||
| Amortization | (12 | ) | (17 | ) | ||
| Foreign currency translation | 36 | (58 | ) | |||
Impact of deconsolidation due to loss of control and other(1) | (50 | ) | (3 | ) | ||
| Balance, end of year | $ | 1,162 | $ | 1,179 | ||
(1) | Includes the impact of deconsolidation of BSREP III investments. See Note 5, Investment Properties for further information. |
- F-46 -
NOTE 13. OTHER NON-CURRENT ASSETS
The components of other non-current assets are as follows:
| (US$ Millions) | Dec. 31, 2019 | Dec. 31, 2018 | ||||
| Securities - FVTPL | $ | 1,250 | $ | 239 | ||
| Derivative assets | 10 | 13 | ||||
| Securities - FVTOCI | 121 | 260 | ||||
| Restricted cash | 154 | 161 | ||||
Inventory(1) | 507 | 435 | ||||
| Other | 284 | 748 | ||||
| Total other non-current assets | $ | 2,326 | $ | 1,856 | ||
(1) | Includes right-of-use inventory of $31 million as of December 31, 2019. |
Securities - FVTPL
Securities - FVTPL consists of its convertible preferred units of a U.S. hospitality company. The preferred units earn a cumulative dividend of 7.5% per annum compounding quarterly. Additionally, the partnership receives distributions payable in additional convertible preferred units of the U.S. hospitality operating company at 5.0% per annum compounding quarterly. In 2019, the partnership purchased an additional $238 million of convertible preferred units of a U.S. hospitality operating company. The carrying value of these convertible preferred units as of December 31, 2019 was $418 million (December 31, 2018 - $175 million).
Also included in Securities - FVTPL is the partnership’s investment in BSREP III, which is accounted for as a financial asset following the deconsolidation of its investments in the first quarter of 2019. The carrying value of the BSREP III financial asset as of December 31, 2019 was $417 million (December 31, 2018 - nil).
Securities - FVTOCI
Securities - FVTOCI represented the partnership’s retained equity interests in 1625 Eye Street in Washington, D.C. and Heritage Plaza in Houston, both property holding companies, that it previously controlled and in which it retained a non-controlling interest following disposition of these properties to third parties. The partnership managed these properties on behalf of the acquirer but did not exercise significant influence over the relevant activities of the properties. The interest in 1625 Eye Street was sold as of December 31, 2019.
NOTE 14. ACCOUNTS RECEIVABLE AND OTHER
The components of accounts receivable and other are as follows:
| (US$ Millions) | Dec. 31, 2019 | Dec. 31, 2018 | ||||
| Derivative assets | $ | 80 | $ | 234 | ||
Accounts receivable(1) | 510 | 794 | ||||
| Restricted cash and deposits | 239 | 631 | ||||
| Prepaid expenses | 278 | 317 | ||||
| Other current assets | 300 | 385 | ||||
| Total accounts receivable and other | $ | 1,407 | $ | 2,361 | ||
(1) | See Note 36, Related Parties, for further discussion. |
- F-47 -
NOTE 15. HELD FOR SALE
Non-current assets and groups of assets and liabilities which comprise disposal groups are presented as assets held for sale where the asset or disposal group is available for immediate sale in its present condition, and the sale is highly probable.
The following is a summary of the assets and liabilities that were classified as held for sale as of December 31, 2019 and December 31, 2018:
| (US$ Millions) | Dec. 31, 2019 | Dec. 31, 2018 | ||||
| Investment properties | $ | 160 | $ | 422 | ||
| Equity accounted investments | 223 | 568 | ||||
| Accounts receivables and other assets | 4 | 14 | ||||
| Assets held for sale | 387 | 1,004 | ||||
| Debt obligations | 138 | 153 | ||||
| Accounts payable and other liabilities | 2 | 10 | ||||
| Liabilities associated with assets held for sale | $ | 140 | $ | 163 | ||
The following table presents the change to the components of the assets held for sale from the beginning of the year:
| (US$ Millions) | Dec. 31, 2019 | Dec. 31, 2018 | ||||
| Balance, beginning of year | $ | 1,004 | $ | 1,433 | ||
| Reclassification to/(from) assets held for sale, net | 3,387 | 2,382 | ||||
| Disposals | (4,038 | ) | (2,819 | ) | ||
| Fair value adjustments | 14 | 81 | ||||
| Foreign currency translation | (5 | ) | (32 | ) | ||
| Other | 25 | (41 | ) | |||
| Assets held for sale | $ | 387 | $ | 1,004 | ||
At December 31, 2018, assets held for sale included ten office assets in the United States, three office assets in Brazil, two triple-net lease assets in the United States and an equity accounted investment within the LP Investments portfolio.
In the first quarter of 2019, the partnership sold nine office assets in the United States, three office assets in Brazil, one triple-net lease asset in the United States and an equity accounted investment within the LP Investments portfolio for net proceeds of approximately $844 million.
In the second quarter of 2019, the partnership sold a portfolio of office assets in California and three triple-net lease assets in the United States within the LP Investments portfolio for net proceeds of approximately $129 million.
In the third quarter of 2019, the partnership sold two office assets in Australia in the Core Office segment and a portfolio of triple-net lease assets in the United States and one office asset in the United States in the LP Investments segment for net proceeds of approximately $541 million.
At December 31, 2019, assets held for sale included its equity accounted investment in the Diplomat in Florida, an office asset in California and six triple net lease assets in the United States, as the partnership intends to sell controlling interest in these assets to third parties in the next 12 months.
- F-48 -
NOTE 16. DEBT OBLIGATIONS
The partnership’s debt obligations include the following:
| Dec. 31, 2019 | Dec. 31, 2018 | |||||||||
| (US$ Millions) | Weighted- average rate | Debt balance | Weighted- average rate | Debt balance | ||||||
| Unsecured facilities: | ||||||||||
| Brookfield Property Partners’ credit facilities | 3.33 | % | $ | 836 | 4.08 | % | $ | 1,586 | ||
| Brookfield Property Partners’ corporate bonds | 4.25 | % | 1,082 | 4.23 | % | 586 | ||||
| Brookfield Property REIT Inc. term debt | 4.17 | % | 4,010 | 4.88 | % | 4,726 | ||||
| Brookfield Property REIT Inc. senior secured notes | 5.75 | % | 1,000 | — | % | — | ||||
| Brookfield Property REIT Inc. corporate facility | 4.03 | % | 715 | 4.76 | % | 387 | ||||
| Brookfield Property REIT Inc. junior subordinated notes | 3.39 | % | 206 | 3.97 | % | 206 | ||||
Forest City Realty Trust Inc. term debt(1) | — | % | — | 6.38 | % | 1,247 | ||||
| Subsidiary borrowings | 3.27 | % | 202 | 5.62 | % | 495 | ||||
| Secured debt obligations: | ||||||||||
Funds subscription credit facilities(1)(2) | 2.83 | % | 57 | 3.85 | % | 4,517 | ||||
| Fixed rate | 4.35 | % | 28,717 | 4.41 | % | 25,545 | ||||
| Variable rate | 4.52 | % | 19,121 | 4.97 | % | 25,131 | ||||
| Deferred financing costs | (418 | ) | (462 | ) | ||||||
| Total debt obligations | $ | 55,528 | $ | 63,964 | ||||||
| Current | $ | 8,825 | $ | 5,874 | ||||||
| Non-current | 46,565 | 57,937 | ||||||||
| Debt associated with assets held for sale | 138 | 153 | ||||||||
| Total debt obligations | $ | 55,528 | $ | 63,964 | ||||||
(1) | In the first quarter of 2019, the partnership deconsolidated BSREP III due to loss of control. The Forest City term debt and the BSREP III credit facilities are no longer being consolidated. See Note 5, Investment Properties for further information. |
(2) | Funds subscription credit facilities are secured by co-investors’ capital commitments. |
Debt obligations include foreign currency denominated debt in the functional currencies of the borrowing subsidiaries. Debt obligations by local currency are as follows:
| Dec. 31, 2019 | Dec. 31, 2018 | |||||||||||||
| (US$ Millions) | U.S. Dollars | Local currency | U.S. Dollars | Local currency | ||||||||||
| U.S. dollars | $ | 39,286 | $ | $ | 39,286 | $ | 50,682 | $ | $ | 50,682 | ||||
| British pounds | 6,997 | £ | 5,279 | 5,172 | £ | 4,053 | ||||||||
| Canadian dollars | 3,431 | C$ | 4,457 | 2,688 | C$ | 3,666 | ||||||||
| South Korean Won | 1,973 | ₩ | 2,280,000 | 1,617 | ₩ | 1,805,000 | ||||||||
| Australian dollars | 1,273 | A$ | 1,814 | 1,401 | A$ | 1,988 | ||||||||
| Indian Rupee | 2,209 | Rs | 157,797 | 1,469 | Rs | 102,016 | ||||||||
| Brazilian reais | 480 | R$ | 1,935 | 684 | R$ | 2,651 | ||||||||
| China Yuan | 11 | C¥ | 78 | 70 | C¥ | 484 | ||||||||
| Euros | 286 | € | 255 | 643 | € | 561 | ||||||||
| Deferred financing costs | (418 | ) | (462 | ) | ||||||||||
| Total debt obligations | $ | 55,528 | $ | 63,964 | ||||||||||
- F-49 -
The components of changes in debt obligations, including changes related to cash flows from financing activities, are summarized in the table below:
| Non-cash changes in debt obligations | ||||||||||||||||||||
| (US$ Millions) | Dec. 31, 2018 | Debt obligation issuance, net of repayments | Deconsolidation of BSREP III | Debt from asset acquisitions | Assumed by purchaser | Amortization of deferred financing costs and (premium) discount | Foreign currency translation | Other | Dec. 31, 2019 | |||||||||||
| Debt obligations | $ | 63,964 | 2,670 | (13,601 | ) | 2,751 | (128 | ) | 105 | 251 | (484 | ) | $ | 55,528 | ||||||
NOTE 17. CAPITAL SECURITIES
The partnership had the following capital securities outstanding as of December 31, 2019 and 2018:
| (US$ Millions, except where noted) | Shares outstanding | Cumulative dividend rate | Dec. 31, 2019 | Dec. 31, 2018 | ||||||
| Operating Partnership Class A Preferred Equity Units: | ||||||||||
| Series 1 | 24,000,000 | 6.25 | % | $ | 574 | $ | 562 | |||
| Series 2 | 24,000,000 | 6.50 | % | 546 | 537 | |||||
| Series 3 | 24,000,000 | 6.75 | % | 530 | 523 | |||||
| Brookfield BPY Holdings Inc. Junior Preferred Shares: | ||||||||||
Class B Junior Preferred Shares(1) | — | 7.64 | % | — | 420 | |||||
| BPO Class B Preferred Shares: | ||||||||||
Series 1(2) | 3,600,000 | 70% of bank prime | — | — | ||||||
Series 2(2) | 3,000,000 | 70% of bank prime | — | — | ||||||
| Brookfield Property Split Corp. (“BOP Split”) Senior Preferred Shares: | ||||||||||
| Series 1 | 924,390 | 5.25 | % | 23 | 23 | |||||
| Series 2 | 699,165 | 5.75 | % | 13 | 13 | |||||
| Series 3 | 909,814 | 5.00 | % | 18 | 17 | |||||
| Series 4 | 940,486 | 5.20 | % | 18 | 17 | |||||
| BSREP II RH B LLC (“Manufactured Housing”) Preferred Capital | — | 9.00 | % | 249 | 249 | |||||
| Rouse Series A Preferred Shares | 5,600,000 | 5.00 | % | 142 | 142 | |||||
Forest City Enterprises L.P. Preferred Capital(3) | — | — | % | — | 29 | |||||
| BSREP II Vintage Estate Partners LLC (“Vintage Estates”) Preferred Shares | 10,000 | 5.00 | % | 40 | 40 | |||||
| Capital Securities – Fund Subsidiaries | 922 | 813 | ||||||||
| Total capital securities | $ | 3,075 | $ | 3,385 | ||||||
| Current | $ | 75 | $ | 520 | ||||||
| Non-current | 3,000 | 2,865 | ||||||||
| Total capital securities | $ | 3,075 | $ | 3,385 | ||||||
(1) | During the year ended December 31, 2019, approximately $420 million of the Brookfield BPY Holdings Inc. Class B Junior Preferred Shares, held by Brookfield Asset Management, were redeemed. |
(2) | Class B, Series 1 and 2 capital securities - corporate are owned by Brookfield Asset Management. BPO has an offsetting loan receivable against these securities earning interest at 95% of bank prime. |
(3) | Includes the impact of the deconsolidation of BSREP III investments, primarily Forest City. See Note 5, Investment Properties for further information. |
The capital securities presented above represent interests in the partnership or its subsidiaries that are in legal form equity and are accounted for as liabilities in accordance with IFRS 9 due to the redemption features of these instruments.
On December 4, 2014, the partnership issued $1,800 million of Preferred Equity Units to the Class A Preferred Unitholder. The Preferred Equity Units are exchangeable at the option of the Class A Preferred Unitholder into LP Units at a price of $25.70 per unit and were issued in three tranches of $600 million each, with an average dividend yield of 6.5% and maturities of seven, ten and twelve years. After three years for the seven-year tranche and four years for the ten- and twelve-year tranches, the partnership can effectively require the holder to exchange the Preferred Equity Units into LP Units as long as the LP Units are trading at or above 125%, 130% and 135%, respectively, of the exchange price. Upon maturity, the Preferred Equity Units that remain outstanding will be redeemed in exchange for LP Units valued at the 20-day, volume-weighted average trading price at such time. Brookfield Asset Management has contingently agreed to acquire the seven-year and ten-year tranches of Preferred Equity Units from the
- F-50 -
Class A Preferred Unitholder for the initial issuance price plus accrued and unpaid distributions and to exchange such units for Preferred Equity Units with terms and conditions substantially similar to the twelve-year tranche to the extent that the market price of the LP Units is less than 80% of the exchange price at maturity. The Class A Preferred Unitholder has the right to designate one member to the board of directors of the partnership. The Preferred Equity Units have been accounted for as a compound instrument comprised of (i) a financial liability representing the partnership’s obligations to redeem the Preferred Equity Units at maturity for a variable number of BPY Units and (ii) an equity instrument representing the Class A Preferred Unitholder’s right to convert the Preferred Equity Units to a fixed number of BPY Units. The cash proceeds received from issuing the Preferred Equity Units were allocated between capital securities ($1,535 million) and limited partners’ equity ($265 million). The allocation between capital securities and equity was based on first determining the liability component by discounting the cash flows associated with these securities at market interest rates. The equity component was then assigned the residual amount after deducting from the fair value of the instrument as a whole the amount separately determined for the liability component.
The holders of each series of the BOP Split Senior Preferred Shares are each entitled to receive fixed cumulative preferential cash dividends, if, as and when declared by the Board of Directors of BOP Split. Dividends on each series of the BOP Split Senior Preferred Shares are payable quarterly on the last day of March, June, September and December in each year.
Capital securities includes $249 million at December 31, 2019 (December 31, 2018 - $249 million) of preferred equity interests held by a third party investor in Manufactured Housing which have been classified as a liability, rather than as a non-controlling interest, due to the fact the holders are entitled to distributions equal to their capital balance plus 9% annual return payable in monthly distributions until maturity in December 2025.
Capital securities also includes $142 million at December 31, 2019 (December 31, 2018 - $142 million) of preferred equity interests held by a third party investor in Rouse Properties, L.P. (“Rouse”) which have been classified as a liability, rather than as a non-controlling interest, due to the fact that the interests are mandatorily redeemable on or after November 12, 2025 for a set price per unit plus any accrued but unpaid distributions; distributions are capped and accrue regardless of available cash generated.
Capital securities also includes $40 million at December 31, 2019 (December 31, 2018 - $40 million) of preferred equity interests held by the partnership’s co-investor in Vintage Estate which have been classified as a liability, rather than as non-controlling interest, due to the fact that the preferred equity interests are mandatorily redeemable on April 26, 2023 for cash at an amount equal to the outstanding principal balance of the preferred equity plus any accrued but unpaid dividend.
The Capital Securities - Fund Subsidiaries includes $859 million (December 31, 2018 - $775 million) of equity interests in Brookfield DTLA Holdings LLC (“DTLA”) held by co-investors in DTLA which have been classified as a liability, rather than as non-controlling interest, as holders of these interests can cause DTLA to redeem their interests in the fund for cash equivalent to the fair value of the interests on October 15, 2023, and on every fifth anniversary thereafter. Capital Securities – Fund Subsidiaries are measured at FVTPL.
Capital Securities - Fund Subsidiaries also includes $62 million at December 31, 2019 (December 31, 2018 - $38 million) which represents the equity interests held by the partnership’s co-investor in the D.C. Fund which have been classified as a liability, rather than as non-controlling interest, due to the fact that on June 18, 2023, and on every second anniversary thereafter, the holders of these interests can redeem their interests in the D.C. Fund for cash equivalent to the fair value of the interests.
Reconciliation of cash flows from financing activities from capital securities is shown in the table below:
| Non-cash changes on capital securities | |||||||||||||||||||||
| (US$ Millions) | Dec. 31, 2018 | Capital securities redeemed net of issued | Fair value changes | Derecognized from loss of control of subsidiaries | Foreign currency translation | Other | Dec. 31, 2019 | ||||||||||||||
| Capital securities | $ | 3,385 | $ | (420 | ) | $ | 36 | $ | (29 | ) | $ | 2 | $ | 101 | $ | 3,075 | |||||
Capital securities includes $49 million (December 31, 2018 - $47 million) repayable in Canadian Dollars of C$64 million (December 31, 2018 - C$64 million).
- F-51 -
NOTE 18. INCOME TAXES
The partnership is a flow-through entity for tax purposes and as such is not subject to Bermudian taxation. However, income taxes are recognized for the amount of taxes payable by the primary holding subsidiaries of the partnership (“Holding Entities”), any direct or indirect corporate subsidiaries of the Holding Entities and for the impact of deferred tax assets and liabilities related to such entities.
The components of net deferred tax liability are presented as follows:
| (US$ Millions) | Dec. 31, 2019 | Dec. 31, 2018 | ||||
| Deferred income tax assets: | ||||||
| Non-capital losses (Canada) | $ | 60 | $ | 41 | ||
| Capital losses (Canada) | 33 | 34 | ||||
| Net operating losses (United States) | 351 | 291 | ||||
| Non-capital losses (foreign) | 107 | 94 | ||||
| Tax credit carryforwards | 27 | 36 | ||||
| Foreign currency | 10 | 4 | ||||
| Other | 43 | 16 | ||||
| 631 | 516 | |||||
| Deferred income tax (liabilities): | ||||||
| Properties | (3,146 | ) | (2,894 | ) | ||
| (3,146 | ) | (2,894 | ) | |||
| Net deferred tax (liability) | $ | (2,515 | ) | $ | (2,378 | ) |
The changes in deferred tax balances are presented as follows:
| Recognized in | |||||||||||||||||||||
| (US$ Millions) | Dec. 31, 2018 | Income | Equity | Acquisitions and Dispositions | OCI | Other Balance Sheet | Dec. 31, 2019 | ||||||||||||||
| Deferred tax assets | $ | 516 | $ | 117 | $ | — | $ | (7 | ) | $ | 5 | $ | — | $ | 631 | ||||||
| Deferred tax (liabilities) | (2,894 | ) | (149 | ) | (7 | ) | — | (35 | ) | (61 | ) | (3,146 | ) | ||||||||
| Net deferred tax (liability) | $ | (2,378 | ) | $ | (32 | ) | $ | (7 | ) | $ | (7 | ) | $ | (30 | ) | $ | (61 | ) | $ | (2,515 | ) |
| Recognized in | |||||||||||||||||||||
| (US$ Millions) | Dec. 31, 2017 | Income | Equity | Acquisitions and Dispositions | OCI | Other Balance Sheet | Dec. 31, 2018 | ||||||||||||||
| Deferred tax assets | $ | 342 | $ | (23 | ) | $ | — | $ | 208 | $ | (11 | ) | $ | — | $ | 516 | |||||
| Deferred tax (liabilities) | (3,230 | ) | 240 | — | (32 | ) | 128 | — | (2,894 | ) | |||||||||||
| Net deferred tax (liability) | $ | (2,888 | ) | $ | 217 | $ | — | $ | 176 | $ | 117 | $ | — | $ | (2,378 | ) | |||||
During 2019, the partnership and its subsidiaries deconsolidated certain investments in BSREP III investments. This resulted in the recognition of net deferred tax (liabilities) of $7 million. During 2019, the partnership and subsidiaries finalized purchase price allocations for certain business combinations. This resulted in a decrease of $7 million of net deferred tax assets being recognized. The partnership and its subsidiaries reclassified $61 million of certain tax credits from net deferred tax (liabilities) to other assets on the balance sheet.
During 2018, the partnership and its subsidiaries acquired additional ownership in Brookfield Global Real Estate Special Opportunities Inc. causing the partnership to consolidate the investment. This resulted in the recognition of net deferred tax assets of $200 million. During 2018, the purchase price allocations for certain business combinations were completed and an additional $25 million of net deferred tax (liabilities) were recognized.
The Holding Entities and their Canadian subsidiaries have deferred tax assets of $60 million (December 31, 2018 - $41 million) related to non-capital losses that will begin to expire in 2032, and $33 million (December 31, 2018 - $34 million) related to capital losses that have no expiry. The Holding Entities and their U.S. subsidiaries have deferred tax assets of $351 million (December 31, 2018 - $291 million) related to net operating losses that will begin to expire in 2027. The Holding Entities and their foreign subsidiaries, mainly in South Korea and India, have deferred tax assets of $107 million (December 31, 2018 - $94 million) related to non-capital losses which will begin to expire in 2020.
- F-52 -
The gross deductible temporary differences, unused tax losses, and unused tax credits for which no deferred tax asset is recognized are as follows:
| (US$ Millions) | Dec. 31, 2019 | Dec. 31, 2018 | ||||
| Unused tax losses - gross | ||||||
| Net operating losses (United States) | $ | 287 | $ | 74 | ||
| Net operating losses (foreign) | 428 | 351 | ||||
| Unrecognized deductible temporary differences, unused tax losses, and unused tax credits | $ | 715 | $ | 425 | ||
The Holding Entities, their U.S. subsidiaries, and foreign subsidiaries have gross deductible temporary differences, unused tax losses, and unused tax credits which have not been recognized of $715 million (December 31, 2018 - $425 million) related to net operating losses. Approximately $83 million of the foreign net operating losses will expire by 2028. The remaining foreign net operating losses have no expiry. The majority of the U.S. net operating losses will begin to expire in 2035.
The aggregate amount of gross temporary differences associated with investments and interests in joint arrangements in subsidiaries for which deferred tax liabilities have not been recognized as of December 31, 2019 is approximately $11 billion (December 31, 2018 - $10 billion).
The major components of income tax expense include the following:
| (US$ Millions) Years ended Dec. 31, | 2019 | 2018 | 2017 | ||||||
| Current income tax expense | $ | 164 | $ | 299 | $ | 172 | |||
| Deferred income tax expense (benefit) | 32 | (218 | ) | 20 | |||||
| Income tax expense | $ | 196 | $ | 81 | $ | 192 | |||
The increase in income tax expense for the year ended December 31, 2019 compared to the prior year primarily relates to the partnership recorded a significant deferred tax recovery in 2018 as a result of the acquisition of a controlling interest in GGP.
| Years ended Dec. 31, | 2019 | 2018 | 2017 | |||
| Statutory income tax rate | 26 | % | 26 | % | 26 | % |
| Increase (decrease) in rate resulting from: | ||||||
| International operations subject to different tax rates | (14 | )% | (10 | )% | (5 | )% |
| Non-controlling interests in income of flow-through entities | (4 | )% | (11 | )% | (12 | )% |
| Change in tax rates applicable to temporary differences in other jurisdictions | (3 | )% | (5 | )% | (5 | )% |
| Other | — | % | 2 | % | 3 | % |
| Effective income tax rate | 5 | % | 2 | % | 7 | % |
As the partnership is not subject to tax, the analyses used the applicable Canadian blended Federal and Provincial tax rate as the statutory income tax rate.
- F-53 -
NOTE 19. OTHER NON-CURRENT LIABILITIES
The components of other non-current liabilities are as follows:
| (US$ Millions) | Dec. 31, 2019 | Dec. 31, 2018 | ||||
| Accounts payable and accrued liabilities | $ | 760 | $ | 1,770 | ||
Lease liabilities(1) | 889 | — | ||||
| Derivative liability | 413 | 159 | ||||
| Provisions | 78 | 352 | ||||
| Loans and notes payables | 18 | 5 | ||||
| Deferred revenue | 4 | 8 | ||||
| Total other non-current liabilities | $ | 2,162 | $ | 2,294 | ||
(1) | The impact of the adoption of IFRS 16 requires the recognition of lease liabilities. See Note 2, Summary of Significant Accounting Policies for further information. For the year ended December 31, 2019, interest expense relating to total lease liabilities (see Note 20, Accounts Payable And Other Liabilities for the current portion) was $57 million. |
NOTE 20. ACCOUNTS PAYABLE AND OTHER LIABILITIES
The components of accounts payable and other liabilities are as follows:
| (US$ Millions) | Dec. 31, 2019 | Dec. 31, 2018 | ||||
| Accounts payable and accrued liabilities | $ | 2,537 | $ | 2,466 | ||
| Loans and notes payables | 172 | 779 | ||||
| Derivative liabilities | 289 | 181 | ||||
| Deferred revenue | 342 | 302 | ||||
| Lease liabilities | 43 | — | ||||
| Other liabilities | 43 | 21 | ||||
| Total accounts payable and other liabilities | $ | 3,426 | $ | 3,749 | ||
Loans and notes payables includes nil at December 31, 2019 (December 31, 2018 - $733 million) of on-demand deposits and promissory notes from Brookfield Asset Management to the partnership. See Note 36, Related Parties, for further information.
NOTE 21. EQUITY
The partnership’s capital structure is comprised of seven classes of partnership units: GP Units, LP Units, Redeemable/Exchangeable Partnership Units, Special LP Units, Exchange LP Units, FV LTIP units of the Operating Partnership and BPR Units. In addition, the partnership issued Class A Cumulative Redeemable Perpetual Preferred Units, Series 1 in the first quarter of 2019 and Class A Cumulative Redeemable Perpetual Preferred Units, Series 2 in the third quarter of 2019 (“Preferred Equity Units”).
| a) | General and limited partnership units |
GP Units entitle the holder to the right to govern the financial and operating policies of the partnership. The GP Units are entitled to a 1% general partnership interest.
LP Units entitle the holder to their proportionate share of distributions and are listed and publicly traded on the Nasdaq and the TSX. Each LP Unit entitles the holder thereof to one vote for the purposes of any approval at a meeting of limited partners, provided that holders of the Redeemable/Exchangeable Partnership Units that are exchanged for LP Units will only be entitled to a maximum number of votes in respect of the Redeemable/Exchangeable Partnership Units equal to 49% of the total voting power of all outstanding units.
- F-54 -
The following table presents changes to the GP Units and LP Units from the beginning of the year:
| GP Units | LP Units | |||||||||||
| (Thousands of units), Years ended Dec. 31, | 2019 | 2018 | 2017 | 2019 | 2018 | 2017 | ||||||
| Outstanding, beginning of year | 139 | 139 | 139 | 424,198 | 254,989 | 260,222 | ||||||
| Issued on August 28, 2018 for the acquisition of GGP | — | — | — | — | 109,702 | — | ||||||
| Exchange LP Units exchanged | — | — | — | 425 | 7,770 | 285 | ||||||
| BPR Units exchanged | — | — | — | 36,316 | 56,166 | — | ||||||
| Distribution reinvestment program | — | — | — | 257 | 175 | 181 | ||||||
| Issued under unit-based compensation plan | — | — | — | 858 | 57 | 215 | ||||||
| Repurchases of LP Units | — | — | — | (22,252 | ) | (4,661 | ) | (5,914 | ) | |||
| Outstanding, end of year | 139 | 139 | 139 | 439,802 | 424,198 | 254,989 | ||||||
| b) | Units of the operating partnership held by Brookfield Asset Management |
Redeemable/Exchangeable Partnership Units
There were 432,649,105 Redeemable/Exchangeable Partnership Units outstanding at December 31, 2019, 2018 and 2017.
Special limited partnership units
Brookfield Property Special L.P. (“Special LP”) is entitled to receive equity enhancement distributions and incentive distributions from the operating partnership as a result of its ownership of the Special LP Units.
There were 4,759,997 Special LP Units outstanding at December 31, 2019, 2018 and 2017.
| c) | Limited partnership units of Brookfield Office Properties Exchange LP |
The Exchange LP Units are exchangeable at any time on a one-for-one basis, at the option of the holder, subject to their terms and applicable law, for LP Units. An Exchange LP Unit provides a holder thereof with economic terms that are substantially equivalent to those of a LP Unit. Subject to certain conditions and applicable law, Exchange LP will have the right, commencing June 9, 2021, to redeem all of the then outstanding Exchange LP Units at a price equal to the 20-day volume-weighted average trading price of an LP Unit plus all declared, payable, and unpaid distributions on such units.
The following table presents changes to the Exchange LP Units from the beginning of the year:
| Exchange LP Units | ||||||
| (Thousands of units) | Dec. 31, 2019 | Dec. 31, 2018 | Dec. 31, 2017 | |||
| Outstanding, beginning of year | 3,308 | 11,078 | 11,363 | |||
Exchange LP Units exchanged (1) | (425 | ) | (7,770 | ) | (285 | ) |
| Outstanding, end of year | 2,883 | 3,308 | 11,078 | |||
(1) | Exchange LP Units issued for the acquisition of incremental BPO common shares that have been exchanged are held by an indirect subsidiary of the partnership. Refer to the Consolidated Statements of Changes in Equity for the impact of such exchanges on the carrying value of Exchange LP Units. |
| d) | FV LTIP units of the Operating Partnership |
The partnership issued units under the Brookfield Property L.P. FV LTIP Unit Plan (“FV LTIP Units”) to certain participants in 2019. Each FV LTIP unit will vest over a period of five years and is redeemable for LP Units, BPR Units or a cash payment subject to a conversion adjustment. There were 1,156,114 FV LTIP Units outstanding at December 31, 2019.
| e) | Class A shares of Brookfield Property REIT Inc. |
BPR Units were issued to former GGP common shareholders who elected to receive BPR Units as consideration. Each BPR Unit is structured to provide an economic return equivalent to an LP Unit. The holder of a BPR Unit has the right, at any time, to request the share be redeemed for cash equivalent to the value of an LP Unit. In the event the holder of a BPR Unit exercises this right, the partnership has the right, at its sole discretion, to satisfy the redemption request with an LP Unit rather than cash. As a result, BPR Units participate in earnings and distribution on a per unit basis equivalent to the per unit participation of LP Units. The partnership presents BPR Units as a component of non-controlling interest.
- F-55 -
The following table presents changes to the BPR Units from the beginning of the year:
| Class A shares of Brookfield Property REIT Inc. | ||||||
| (Thousands of units) | Dec. 31, 2019 | Dec. 31, 2018 | Dec. 31, 2017 | |||
| Outstanding, beginning of year | 106,090 | — | — | |||
| Issued on August 28, 2018 for the acquisition of GGP | — | 162,324 | — | |||
BPR Units exchanged(1) | (36,316 | ) | (56,166 | ) | — | |
| Repurchase of BPR Units | (5,724 | ) | — | — | ||
| Forfeitures | (25 | ) | (68 | ) | — | |
| Outstanding, end of year | 64,025 | 106,090 | — | |||
(1) | Represents BPR Units that have been exchanged for LP Units. Refer to the Consolidated Statements of Changes in Equity for the impact of such exchanges on the carrying value of BPR Units. |
| f) | Class A Cumulative Redeemable Perpetual Preferred Units, Series 1 and 2 (“Preferred Equity Units”) |
During the year ended December 31, 2019, the partnership issued 7,360,000 Class A Cumulative Redeemable Perpetual Preferred Units, Series 1 at $25.00 per unit at a coupon rate of 6.5% and 10,000,000 Class A Cumulative Redeemable Perpetual Preferred Units, Series 2 at $25.00 per unit at a coupon rate of 6.375%. In total $434 million of gross proceeds were raised and $14 million in underwriting and issuance costs were incurred. At December 31, 2019, Preferred Equity Units had a total carrying value of $420 million.
| g) | Distributions |
Distributions made to each class of partnership units, including units of subsidiaries that are exchangeable into LP Units, are as follows:
| (US$ Millions, except per unit information) Years ended Dec. 31, | 2019 | 2018 | 2017 | ||||||
| Limited partners | $ | 573 | $ | 410 | $ | 301 | |||
| Holders of: | |||||||||
| Redeemable/exchangeable partnership units | 574 | 545 | 510 | ||||||
| Special LP Units | 6 | 6 | 6 | ||||||
| Exchange LP Units | 4 | 9 | 13 | ||||||
| FV LTIP of the Operating Partnership | 1 | — | — | ||||||
| BPR Units | 108 | 89 | — | ||||||
| Total distributions | $ | 1,266 | $ | 1,059 | $ | 830 | |||
Per unit(1) | $ | 1.32 | $ | 1.26 | $ | 1.18 | |||
(1) | Per unit outstanding on the record date for each. |
| h) | Earnings per Unit |
The partnership’s net income per LP Unit and weighted average units outstanding are calculated as follows:
| (US$ Millions) Years ended Dec. 31, | 2019 | 2018 | 2017 | ||||||
| Net income attributable to limited partners | $ | 884 | $ | 764 | $ | 136 | |||
| Income reallocation related to mandatorily convertible preferred shares | 80 | 98 | 22 | ||||||
| Less: Preferred equity dividend | (15 | ) | — | — | |||||
| Net income attributable to limited partners - basic | 949 | 862 | 158 | ||||||
Dilutive effect of conversion of preferred shares and options(1) | 8 | 35 | — | ||||||
| Net income attributable to limited partners - diluted | $ | 957 | $ | 897 | $ | 158 | |||
| (Millions of units/shares) | |||||||||
| Weighted average number of LP Units outstanding | 431.3 | 307.7 | 256.0 | ||||||
| Mandatorily convertible preferred shares | 70.1 | 70.0 | 70.0 | ||||||
| Weighted average number of LP Units outstanding - basic | 501.4 | 377.7 | 326.0 | ||||||
Dilutive effect of conversion of preferred shares and options(1) | 6.7 | 18.5 | 1.2 | ||||||
| Weighted average number of LP Units outstanding - diluted | 508.1 | 396.2 | 327.2 | ||||||
(1) | The effect of the conversion of preferred shares is anti-dilutive for the year ended December 31, 2017. |
- F-56 -
NOTE 22. NON-CONTROLLING INTERESTS
Non-controlling interests consists of the following:
| (US$ Millions) | Dec. 31, 2019 | Dec. 31, 2018 | ||||
Redeemable/Exchangeable Partnership Units and Special LP Units(1) | $ | 13,200 | $ | 12,740 | ||
Exchange LP Units(1) | 87 | 96 | ||||
FV LTIP units of the Operating Partnership(1) | 35 | — | ||||
BPR Units(1) | 1,930 | 3,091 | ||||
| Interest of others in operating subsidiaries and properties: | ||||||
| Preferred shares held by Brookfield Asset Management | 15 | 16 | ||||
| Preferred equity of subsidiaries | 3,017 | 2,830 | ||||
| Non-controlling interests in subsidiaries and properties | 12,953 | 15,610 | ||||
| Total interests of others in operating subsidiaries and properties | 15,985 | 18,456 | ||||
| Total non-controlling interests | $ | 31,237 | $ | 34,383 | ||
(1) | Each unit within these classes of non-controlling interest has economic terms substantially equivalent to those of an LP Unit. As such, income attributed to each unit or share of non-controlling interest is equivalent to that allocated to an LP Unit. The proportion of interests held by holders of the Redeemable/Exchangeable Units and Exchange LP Units changes as a result of issuances, repurchases and exchanges. Consequently, the partnership adjusted the relative carrying amounts of the interests held by limited partners and non-controlling interests based on their relative share of the equivalent LP Units. The difference between the adjusted value and the previous carrying amounts was attributed to current LP Units as ownership changes in the Consolidated Statements of Changes in Equity. |
NOTE 23. COMMERCIAL PROPERTY REVENUE
The components of commercial property revenue are as follows:
| (US$ Millions) Years ended Dec. 31, | 2019 | 2018 | 2017 | ||||||
Base rent(1) | $ | 3,814 | $ | 3,443 | $ | 3,797 | |||
| Straight-line rent | 115 | 116 | 124 | ||||||
| Lease termination | 44 | 55 | 18 | ||||||
Other lease income(1)(2) | 612 | 623 | — | ||||||
Other revenue from tenants(1)(3) | 1,106 | 806 | — | ||||||
Other(1) | — | — | 253 | ||||||
| Total commercial property revenue | $ | 5,691 | $ | 5,043 | $ | 4,192 | |||
(1) | The partnership adopted IFRS 15 in 2018 using the modified retrospective method. The comparative information has not been restated and is reported under the accounting standards effective for those periods. |
(2) | Other lease income includes parking revenue and recovery of property tax and insurance expense from tenants. |
(3) | Consists of recovery of certain operating expenses and other revenue from tenants which are accounted for in accordance with IFRS 15. |
The partnership leases properties under operating leases generally with lease terms of between 1 and 15 years, with options to extend. Minimum rental commitments under non-cancellable tenant operating leases are as follows:
| (US$ Millions) | Dec. 31, 2019 | Dec. 31, 2018 | ||||
| Less than 1 year | $ | 3,191 | $ | 3,282 | ||
| 1-5 years | 11,030 | 11,679 | ||||
| More than 5 years | 12,089 | 11,856 | ||||
| Total | $ | 26,310 | $ | 26,817 | ||
NOTE 24. HOSPITALITY REVENUE
The components of hospitality revenue are as follows:
| (US$ Millions) | 2019 | 2018 | 2017 | ||||||
Room, food and beverage(1) | $ | 1,431 | $ | 1,373 | $ | 1,648 | |||
Gaming, and other leisure activities(1) | 360 | 424 | — | ||||||
Other hospitality revenue(1) | 118 | 116 | — | ||||||
| Total hospitality revenue | $ | 1,909 | $ | 1,913 | $ | 1,648 | |||
(1) | The partnership adopted IFRS 15 in 2018 using the modified retrospective method. The comparative information has not been restated and is reported under the accounting standards effective for those periods. |
- F-57 -
NOTE 25. INVESTMENT AND OTHER REVENUE
The components of investment and other revenue are as follows:
| (US$ Millions) Years ended Dec. 31, | 2019 | 2018 | 2017 | ||||||
| Investment income | $ | 223 | $ | 68 | $ | 170 | |||
| Fee revenue | 259 | 131 | 61 | ||||||
| Dividend income | 6 | 10 | 18 | ||||||
| Interest income and other | 107 | 57 | 19 | ||||||
| Participating loan interests | 8 | 17 | 27 | ||||||
| Total investment and other revenue | $ | 603 | $ | 283 | $ | 295 | |||
NOTE 26. DIRECT COMMERCIAL PROPERTY EXPENSE
The components of direct commercial property expense are as follows:
| (US$ Millions) Years ended Dec. 31, | 2019 | 2018 | 2017 | ||||||
| Property maintenance | $ | 749 | $ | 773 | $ | 709 | |||
| Real estate taxes | 619 | 528 | 472 | ||||||
| Employee compensation and benefits | 170 | 196 | 148 | ||||||
Ground rents(1) | — | 59 | 56 | ||||||
Lease expense(2) | 16 | — | — | ||||||
| Other | 413 | 295 | 232 | ||||||
| Total direct commercial property expense | $ | 1,967 | $ | 1,851 | $ | 1,617 | |||
(1) | The partnership adopted IFRS 16 in 2019 using the modified retrospective method. The comparative information has not been restated and is reported under the accounting standards effective for those periods. |
(2) | For the year ended December 31, 2019, operating expenses relating to variable lease payments not included in the measurement of the lease liability was $16 million. |
NOTE 27. DIRECT HOSPITALITY EXPENSE
The components of direct hospitality expense are as follows:
| (US$ Millions) Years ended Dec. 31, | 2019 | 2018 | 2017 | ||||||
| Employee compensation and benefits | $ | 370 | $ | 318 | $ | 287 | |||
| Cost of food, beverage, and retail goods sold | 294 | 273 | 243 | ||||||
| Maintenance and utilities | 155 | 175 | 127 | ||||||
| Marketing and advertising | 71 | 75 | 55 | ||||||
| Other | 329 | 395 | 367 | ||||||
| Total direct hospitality expense | $ | 1,219 | $ | 1,236 | $ | 1,079 | |||
- F-58 -
NOTE 28. DEPRECIATION AND AMORTIZATION
The components of depreciation and amortization expense are as follows:
| (US$ Millions) Years ended Dec. 31, | 2019 | 2018 | 2017 | ||||||
| Depreciation and amortization of real estate assets | $ | 283 | $ | 264 | $ | 244 | |||
Depreciation and amortization of non-real estate assets(1) | 58 | 44 | 31 | ||||||
| Total depreciation and amortization | $ | 341 | $ | 308 | $ | 275 | |||
(1) | The partnership adopted IFRS 16 in 2019 using the modified retrospective method. The comparative information has not been restated and is reported under the accounting standards effective for those periods. For the year ended December 31, 2019, included $9 million of depreciation expense relating to right-of-use property, plant and equipment. |
NOTE 29. GENERAL AND ADMINISTRATIVE EXPENSE
The components of general and administrative expense are as follows:
| (US$ Millions) Years ended Dec. 31, | 2019 | 2018 | 2017 | ||||||
| Transaction costs | $ | 66 | $ | 413 | $ | 72 | |||
| Employee compensation and benefits | 366 | 247 | 199 | ||||||
| Management fees | 159 | 144 | 168 | ||||||
| Other | 291 | 228 | 175 | ||||||
| Total general and administrative expense | $ | 882 | $ | 1,032 | $ | 614 | |||
NOTE 30. FAIR VALUE GAINS, NET
The components of fair value gains, net, are as follows:
| (US$ Millions) Years ended Dec. 31, | 2019 | 2018 | 2017 | ||||||
Commercial properties(1) | $ | 301 | $ | 784 | $ | 347 | |||
| Commercial developments | 557 | 462 | 202 | ||||||
Incentive fees(2) | (104 | ) | — | — | |||||
Financial instruments and other(3) | (158 | ) | 1,220 | 705 | |||||
| Total fair value gains, net | $ | 596 | $ | 2,466 | $ | 1,254 | |||
(1) | For the year ended December 31, 2019, includes fair value loss on right-of-use investment properties of $5 million. |
(2) | Represents incentive fees the partnership is obligated to pay to the general partner of the partnership’s various fund investments. |
(3) | For the year ended December 31, 2019, primarily includes fair value losses on financial instruments of $147 million. The prior year primarily includes a gain on bargain purchase. |
NOTE 31. UNIT-BASED COMPENSATION
The partnership grants options to certain employees under its amended and restated BPY Unit Option Plan (“BPY Plan”). Pursuant to the BPY Plan, options may be settled for the in-the-money amount of the option in LP Units upon exercise. Consequently, options granted to employees under the BPY Plan are accounted for as an equity-based compensation agreement.
During the year ended December 31, 2019, the partnership incurred $25 million (2018 - $12 million; 2017 - $14 million) of expense in connection with its unit-based compensation plans.
| a) | BPY Unit Option Plan |
Awards under the BPY Plan (“BPY Awards”) generally vest 20% per year over a period of five years and expire 10 years after the grant date, with the exercise price set at the time such options were granted and generally equal to the market price of an LP Unit on the Nasdaq on the last trading day preceding the grant date. Upon exercise of a vested BPY Award, the participant is entitled to receive BPY Units or a cash payment equal to the amount by which the fair market value of an LP Unit at the date of exercise exceeds the exercise price of the BPY Award. Subject to a separate adjustment arising from forfeitures, the estimated expense is revalued every reporting period using the Black-Scholes model as a result of the cash settlement provisions of the plan for employees whose location of employment is Australia or Canada. In terms of measuring expected life of the BPY Awards with various term lengths and vesting periods, BPY will segregate each set of similar BPY Awards and, if different, exercise price, into subgroups and apply a weighted average within each group.
- F-59 -
There were no BPY Awards granted during the year ended December 31, 2019. The partnership estimated the fair value of the BPY Awards granted during the years ended December 31, 2018 and 2017 using the Black-Scholes valuation model. The following assumptions were utilized:
| Unit of measurement | Years ended Dec. 31, | ||||||
| 2019 | 2018 | 2017 | |||||
| Exercise price | US$ | — | 22.50 | 22.92 | |||
| Average term to exercise | In years | — | 7.50 | 7.50 | |||
| Unit price volatility | % | — | % | 23 | % | 25 | % |
| Liquidity discount | % | — | % | 25 | % | 25 | % |
| Weighted average of expected annual dividend yield | % | — | % | 6.50 | % | 6.50 | % |
| Risk-free rate | % | — | % | 2.82 | % | 2.37 | % |
| Weighted average fair value per option | US$ | — | 0.74 | 1.60 | |||
| i. | Equity-settled BPY Awards |
The change in the number of options outstanding under the equity-settled BPY Awards for the years ended December 31, 2019, 2018 and 2017 is as follows:
| Dec. 31, 2019 | Dec. 31, 2018 | Dec. 31, 2017 | |||||||||||||
| Years ended Dec. 31, | Number of options | Weighted average exercise price | Number of options | Weighted average exercise price | Number of options | Weighted average exercise price | |||||||||
| Outstanding, beginning of year | 13,836,213 | $ | 20.56 | 13,801,795 | $ | 20.54 | 16,338,511 | $ | 20.49 | ||||||
| Granted | — | — | 800,000 | 22.50 | 93,750 | 22.92 | |||||||||
| Exercised | (425,171 | ) | 15.06 | (36,806 | ) | 17.71 | (1,194,569 | ) | 18.97 | ||||||
| Expired/forfeited | (203,978 | ) | 21.60 | (291,625 | ) | 22.18 | (1,435,897 | ) | 21.51 | ||||||
Reclassified(1) | 6,708,125 | 20.20 | (437,151 | ) | 22.48 | — | — | ||||||||
| Outstanding, end of year | 19,915,189 | $ | 20.58 | 13,836,213 | $ | 20.56 | 13,801,795 | $ | 20.54 | ||||||
| Exercisable, end of year | 11,484,219 | $ | 20.56 | 9,628,246 | $ | 20.26 | 7,352,112 | $ | 20.22 | ||||||
(1) | Relates to the reclassification of cash-settled options for employees in Canada to equity-settled options subsequent to the amendment of the BPY Plan, which was amended on September 30, 2019. The prior year relates to the reclassification of equity-settled options for employees in Brazil to cash-settled options subsequent to the amendment of the BPY Plan, which was amended on February 7, 2018. |
The following table sets out details of options issued and outstanding at December 31, 2019, 2018 and 2017 under the equity-settled BPY Awards by expiry date:
| Dec. 31, 2019 | Dec. 31, 2018 | Dec. 31, 2017 | |||||||||||||
| Expiry date | Number of options | Weighted average exercise price | Number of options | Weighted average exercise price | Number of options | Weighted average exercise price | |||||||||
| 2020 | — | — | 226,800 | 13.07 | 226,800 | 13.07 | |||||||||
| 2021 | 389,800 | 17.44 | 246,400 | 17.44 | 246,400 | 17.44 | |||||||||
| 2022 | 987,700 | 18.09 | 508,300 | 18.07 | 517,300 | 18.07 | |||||||||
| 2023 | 1,108,420 | 16.80 | 656,220 | 16.80 | 675,420 | 16.80 | |||||||||
| 2024 | 11,794,215 | 20.59 | 7,878,998 | 20.59 | 7,946,313 | 20.59 | |||||||||
| 2025 | 1,947,979 | 25.18 | 1,376,295 | 25.18 | 1,730,210 | 25.18 | |||||||||
| 2026 | 2,793,325 | 19.51 | 2,049,450 | 19.51 | 2,365,602 | 19.51 | |||||||||
| 2027 | 93,750 | 22.92 | 93,750 | 22.92 | 93,750 | 22.92 | |||||||||
| 2028 | 800,000 | 22.50 | 800,000 | 22.50 | — | — | |||||||||
| Total | 19,915,189 | $ | 20.58 | 13,836,213 | $ | 20.56 | 13,801,795 | $ | 20.54 | ||||||
- F-60 -
| ii. | Cash-settled BPY Awards |
The change in the number of options outstanding under the cash-settled BPY Awards for the years ended December 31, 2019, 2018 and 2017 is as follows:
| Dec. 31, 2019 | Dec. 31, 2018 | Dec. 31, 2017 | ||||||||||||||
| Years ended Dec. 31, | Number of options | Weighted average exercise price | Number of options | Weighted average exercise price | Number of options | Weighted average exercise price | ||||||||||
| Outstanding, beginning of year | 7,331,416 | $ | 20.38 | 7,144,871 | $ | 20.30 | $ | 7,377,042 | $ | 20.28 | ||||||
| Granted | — | — | — | — | — | — | ||||||||||
| Exercised | (19,400 | ) | 12.63 | (3,770 | ) | 19.51 | (213,106 | ) | 19.12 | |||||||
| Expired/forfeited | — | — | (246,836 | ) | 21.87 | (19,065 | ) | 24.42 | ||||||||
Reclassified(1) | (6,708,125 | ) | 20.20 | 437,151 | 22.48 | — | — | |||||||||
| Outstanding, end of year | 603,891 | $ | 21.55 | 7,331,416 | $ | 20.38 | 7,144,871 | $ | 20.30 | |||||||
| Exercisable, end of year | 505,092 | $ | 21.48 | 5,627,610 | $ | 20.17 | 3,973,290 | $ | 19.93 | |||||||
(1) | Relates to the reclassification of cash-settled options for employees in Canada to equity-settled options subsequent to the amendment of the BPY Plan, which was amended on September 30, 2019. The prior year relates to the reclassification of equity-settled options for employees in Brazil to cash-settled options subsequent to the amendment of the BPY Plan, which was amended on February 7, 2018. |
The following table sets out details of options issued and outstanding at December 31, 2019, 2018 and 2017 under the cash-settled BPY Awards by expiry date:
| Dec. 31, 2019 | Dec. 31, 2018 | Dec. 31, 2017 | |||||||||||||
| Expiry date | Number of options | Weighted average exercise price | Number of options | Weighted average exercise price | Number of options | Weighted average exercise price | |||||||||
| 2020 | — | — | 69,000 | 13.07 | 69,000 | 13.07 | |||||||||
| 2021 | 24,000 | 17.44 | 172,800 | 17.44 | 172,800 | 17.44 | |||||||||
| 2022 | 22,200 | 17.93 | 515,800 | 18.09 | 515,800 | 18.09 | |||||||||
| 2023 | 28,800 | 16.80 | 519,000 | 16.80 | 519,000 | 16.80 | |||||||||
| 2024 | 175,416 | 20.59 | 4,278,663 | 20.59 | 4,330,286 | 20.59 | |||||||||
| 2025 | 213,038 | 25.18 | 831,834 | 25.18 | 695,376 | 25.18 | |||||||||
| 2026 | 140,437 | 19.51 | 944,319 | 19.51 | 842,609 | 19.51 | |||||||||
| Total | 603,891 | $ | 21.55 | 7,331,416 | $ | 20.38 | 7,144,871 | $ | 20.30 | ||||||
| b) | Restricted BPY LP Unit Plan |
The Brookfield Property Group Restricted BPY LP Unit Plan provides for awards to participants of LP Units purchased on the Nasdaq (“Restricted Units”). Under the Restricted BPY LP Unit Plan, units awarded generally vest over a period of five years, except as otherwise determined or for Restricted Units awarded in lieu of a cash bonus as elected by the participant, which may vest immediately. The estimated total compensation cost measured at grant date is evenly recognized over the vesting period of five years.
During 2019, the partnership granted 895,744 Restricted Units with a weighted average exercise price of $19.24.
As of December 31, 2019, the total number of Restricted Units outstanding was 797,674 (December 31, 2018 - 150,835) with a weighted average exercise price of $19.53 (December 31, 2018 - $20.97).
| c) | Restricted BPY LP Unit Plan (Canada) |
The Restricted BPY LP Unit Plan (Canada) is substantially similar to the Restricted BPY LP Unit Plan described above, except that it is for Canadian employees, there is a five year hold period, and purchases of units are made on the TSX instead of the Nasdaq.
As of December 31, 2019, the total number of Canadian Restricted Units outstanding was 393,980 (December 31, 2018 - 21,624) with a weighted average exercise price of C$25.59 (December 31, 2018 - C$22.88).
- F-61 -
| d) | Restricted BPR Unit Plan |
The Brookfield Property Group Restricted BPR Class A Stock Plan provides for awards to participants of BPR Units purchased on the Nasdaq (“Restricted BPR Units”). Under the Restricted BPR Unit Plan, units awarded generally vest over a period of five years, except as otherwise determined or for Restricted BPR Units awarded in lieu of a cash bonus as elected by the participant, which may vest immediately. The estimated total compensation cost measured at grant date is evenly recognized over the vesting period of five years.
As of December 31, 2019, the total number of Restricted BPR Units outstanding was 357,313 with a weighted average exercise price of $19.22.
| e) | BPY FV LTIP Unit Plan |
The partnership issued units of the operating partnership pursuant to the Brookfield Property L.P. FV LTIP Unit Plan to certain participants. Each FV LTIP Unit will vest over a period of five years and is redeemable for LP Units, BPR Units or a cash payment subject to a conversion adjustment.
As of December 31, 2019, the total number of FV LTIP Units outstanding was 1,156,117 with a weighted average exercise price of $18.87 to employees.
| f) | Deferred Share Unit Plan |
In addition, BPO has a deferred share unit plan, the terms of which were amended to substitute LP Units for BPO common shares subject to such deferred shares. At December 31, 2019, BPO had 1,514,124 deferred share units (December 31, 2018 - 1,458,667) outstanding and vested.
| g) | GGP LTIP Plans |
In connection with the GGP acquisition, the partnership issued options under the Brookfield Property Partners BPY Unit Option Plan (GGP) (“GGP Options”) and Appreciation Only LTIP Units (“GGP AO LTIP”) to certain GGP employees. Each GGP Option will vest within ten years following the original grant date and is redeemable for LP Units or a cash payment equal to the amount by which the fair market value of an LP Unit at the date exceeds the exercise price of the BPY Option. Each GGP AO LTIP will vest within ten years of its original grant date and is redeemable for LP Units or a cash payment subject to a conversion adjustment.
As of December 31, 2019, the total number of GGP Options outstanding was 237,881 (December 31, 2018 - 1,011,523) with a weighted average exercise price of $25.39 (December 31, 2018 - $19.71).
As of December 31, 2019, the total number of GGP AO LTIP outstanding was 1,657,948 (December 31, 2018 - 1,387,289) with a weighted average exercise price of $22.51 (December 31, 2018 - $22.51).
- F-62 -
NOTE 32. OTHER COMPREHENSIVE INCOME (LOSS)
Other comprehensive (loss) income consists of the following:
| (US$ Millions) Years ended Dec. 31, | 2019 | 2018 | 2017 | ||||||
| Items that may be reclassified to net income: | |||||||||
| Foreign currency translation | |||||||||
| Unrealized foreign currency translation gains (losses) in respect of foreign operations | $ | 207 | $ | (1,193 | ) | $ | 1,111 | ||
| Reclassification of realized foreign currency translation gains to net income on disposition of foreign operations | 26 | 19 | 118 | ||||||
| (Losses) gains on hedges of net investments in foreign operations, net of income tax expense (benefit) of $2 million (2018 - $10 million; 2017 - ($18) million) | (176 | ) | 386 | (530 | ) | ||||
| Reclassification of hedges of net investment in foreign operations (losses) to net income on disposition of foreign operations | 6 | — | (45 | ) | |||||
| 63 | (788 | ) | 654 | ||||||
| Cash flow hedges | |||||||||
| Gains (losses) on derivatives designated as cash flow hedges, net of income tax expense (benefit) of $4 million (2018 - $25 million; 2017 - $18 million) | 21 | 34 | 77 | ||||||
| 21 | 34 | 77 | |||||||
| Available-for-sale securities | |||||||||
| Net change in unrealized (losses) gains on available-for-sale securities, net of income tax of nil (2018 - nil; 2017 - nil) | — | — | (5 | ) | |||||
| — | — | (5 | ) | ||||||
| Equity accounted investments | |||||||||
| Share of unrealized foreign currency translations (losses) gains in respect of foreign operations | — | (9 | ) | 5 | |||||
| Reclassification gains from hedges of net investment in foreign operation to net income on disposition of foreign operations | 1 | — | — | ||||||
| Share of gains (losses) on derivatives designated as cash flow hedges, net of income tax expense (benefit) of nil (2018 - nil; 2017 – $1 million) | (51 | ) | 1 | — | |||||
| Share of unrealized gains (losses) on available-for-sale securities, net of income tax of nil (2018 - nil; 2017 - nil) | — | — | 6 | ||||||
| (50 | ) | (8 | ) | 11 | |||||
| Items that will not be reclassified to net income: | |||||||||
| Unrealized gains (losses) on securities - FVTOCI, net of income tax benefit of $6 million (2018 - $2 million; 2017 - nil) | (7 | ) | (2 | ) | — | ||||
| Share of revaluation surplus on equity accounted investments, net of income tax expense (benefit) of nil (2018 - ($5) million; 2017 - nil) | 16 | 92 | 58 | ||||||
| Net remeasurement gains (losses) on defined benefit plan, net of income tax expense of nil (2018 – nil; 2017 – nil) | (1 | ) | 2 | (1 | ) | ||||
| Revaluation surplus, net of income tax expense of $22 million (2018 –$1 million; 2017 – $1 million) | 281 | 254 | 86 | ||||||
| 289 | 346 | 143 | |||||||
| Total other comprehensive income (loss) | $ | 323 | $ | (416 | ) | $ | 880 | ||
- F-63 -
NOTE 33. OBLIGATIONS, GUARANTEES, CONTINGENCIES AND OTHER
In the normal course of operations, the partnership and its consolidated entities execute agreements that provide for indemnification and guarantees to third parties in transactions such as business dispositions, business acquisitions, sales of assets and sales of services.
Certain of the partnership’s operating subsidiaries have also agreed to indemnify their directors and certain of their officers and employees. The nature of substantially all of the indemnification undertakings prevent the partnership from making a reasonable estimate of the maximum potential amount that it could be required to pay third parties as the agreements do not specify a maximum amount and the amounts are dependent upon the outcome of future contingent events, the nature and likelihood of which cannot be determined at this time. Historically, neither the partnership nor its consolidated subsidiaries have made significant payments under such indemnification agreements.
The partnership and its operating subsidiaries may be contingently liable with respect to litigation and claims that arise from time to time in the normal course of business or otherwise.
At December 31, 2019, the partnership had commitments totaling:
| • | approximately $2,240 million for the development of Manhattan West in Midtown New York, Greenpoint Landing in Brooklyn, as well as the redevelopment of One Allen Center, Two Allen Center, and Three Allen Center in Houston; |
| • | approximately A$301 million ($211 million) for the development of 388 George Street in Sydney; 405 Bourke Street in Melbourne; and Elizabeth Quay in Perth; |
| • | approximately £39 million ($52 million) for the development of 100 Bishopsgate and Principal Place Residential in London; and |
| • | approximately AED212 million ($58 million) for the development of ICD Brookfield Place in Dubai. |
During 2013, Brookfield Asset Management announced the final close on the $4.4 billion first BSREP fund (“BSREP I”), a global private fund focused on making opportunistic investments in commercial property. The partnership, as lead investor, committed approximately $1.3 billion to the fund. As of December 31, 2019, there remained approximately $170 million of uncontributed capital commitments.
In April 2016, Brookfield Asset Management announced the final close on the $9.0 billion second BSREP fund (“BSREP II”) to which the partnership had committed $2.3 billion as lead investor. As of December 31, 2019, there remained approximately $755 million of uncontributed capital commitments.
In November 2017, Brookfield Asset Management announced the final close on the $2.9 billion fifth Brookfield Real Estate Finance Fund (“BREF”) to which the partnership had committed $400 million as lead investor. As of December 31, 2019, there remained approximately $235 million of uncontributed capital commitments.
In September 2018, Brookfield Asset Management announced the final close of the $1.0 billion third Brookfield Fairfield U.S. Multifamily Value Add Fund (“VAMF”) to which the partnership had committed $300 million. As of December 31, 2019, there remained approximately $180 million of uncontributed capital commitments.
In January 2019, Brookfield Asset Management announced the final close on the $15.0 billion third BSREP fund to which the partnership has committed $1.0 billion. As of December 31, 2019, there remained approximately $760 million of uncontributed capital commitments.
The partnership maintains insurance on its properties in amounts and with deductibles that it believes are in line with what owners of similar properties carry. The partnership maintains all risk property insurance and rental value coverage (including coverage for the perils of flood, earthquake and named windstorm). The partnership does not conduct its operations, other than those of equity accounted investments, through entities that are not fully or proportionately consolidated in these financial statements, and has not guaranteed or otherwise contractually committed to support any material financial obligations not reflected in these financial statements.
- F-64 -
NOTE 34. LIQUIDITY AND CAPITAL MANAGEMENT
The capital of the partnership’s business consists of debt obligations, capital securities, preferred stock and equity. The partnership’s objective when managing this capital is to maintain an appropriate balance between holding a sufficient amount of equity capital to support its operations and reducing its weighted average cost of capital to improve its return on equity. As at December 31, 2019, capital totaled $103 billion (December 31, 2018 - $114 billion).
The partnership attempts to maintain a level of liquidity to ensure it is able to participate in investment opportunities as they arise and to better withstand sudden adverse changes in economic circumstances. The partnership’s primary sources of liquidity include cash, undrawn committed credit facilities, construction facilities, cash flow from operating activities and access to public and private capital markets. In addition, the partnership structures its affairs to facilitate monetization of longer-duration assets through financings and co-investor participations.
The partnership seeks to increase income from its existing properties by maintaining quality standards for its properties that promote high occupancy rates and support increases in rental rates while reducing tenant turnover and related costs, and by controlling operating expenses. Consequently, the partnership believes its revenue, along with proceeds from financing activities and divestitures, will continue to provide the necessary funds to cover its short-term liquidity needs. However, material changes in the factors described above may adversely affect the partnership’s net cash flows.
The partnership’s principal liquidity needs for the current year and for periods beyond include:
| • | Recurring expenses; |
| • | Debt service requirements; |
| • | Distributions to unitholders; |
| • | Capital expenditures deemed mandatory, including tenant improvements; |
| • | Development costs not covered under construction loans; |
| • | Investing activities which could include: |
| ◦ | Fulfilling the partnership’s capital commitments to various funds; |
| ◦ | Discretionary capital expenditures; |
| ◦ | Property acquisitions; |
| ◦ | Future development; and |
| ◦ | Repurchase of the partnership’s units. |
Most of the partnership’s borrowings are in the form of long-term asset-specific financings with recourse only to the specific assets. Limiting recourse to specific assets ensures that poor performance within one area does not compromise the partnership’s ability to finance the balance of its operations.
In addition, the partnership may, from time to time, issue equity instruments, including, but not limited to, LP Units, preferred equity and Redeemable/Exchangeable Partnership Units, to the public in private placements in certain circumstances to provide financing for significant transactions.
The partnership’s operating subsidiaries are subject to limited covenants in respect of their corporate debt and are in full compliance with all such covenants at December 31, 2019. The partnership’s operating subsidiaries are also in compliance with all covenants and other capital requirements related to regulatory or contractual obligations of material consequence to the partnership.
The partnership’s strategy is to satisfy its liquidity needs in respect of the partnership using the partnership’s cash on hand, cash flows generated from operating activities and provided by financing activities, as well as proceeds from asset sales, primarily held in the LP Investments segment. The operating subsidiaries of the partnership also generate liquidity by accessing capital markets on an opportunistic basis.
The partnership’s principal liquidity needs for periods beyond the next year are for scheduled debt maturities, distributions, recurring and non-recurring capital expenditures, development costs, potential property acquisitions and the partnership’s capital commitments to various funds. The partnership plans to meet these needs with one or more of: cash flows from operations; construction loans; creation of new funds; proceeds from sales of assets; proceeds from sale of non-controlling interests in subsidiaries and properties; and credit facilities and refinancing opportunities.
- F-65 -
The table below presents the partnership’s contractual obligations as of December 31, 2019:
| (US$ Millions) | Payments due by period | ||||||||||||||||||||
| Dec. 31, 2019 | Total | < 1 Year | 1 Year | 2 Years | 3 Years | 4 Years | > 5 Years | ||||||||||||||
Debt obligations(1) | $ | 55,390 | $ | 8,829 | $ | 9,315 | $ | 5,605 | $ | 6,011 | $ | 10,781 | $ | 14,849 | |||||||
| Capital securities | 3,075 | 75 | 1,536 | 141 | 1 | 547 | 775 | ||||||||||||||
| Lease obligations | 5,301 | 78 | 79 | 77 | 77 | 77 | 4,913 | ||||||||||||||
Commitments(2) | 1,138 | 499 | 226 | 401 | 12 | — | — | ||||||||||||||
Interest expense(3): | |||||||||||||||||||||
| Long term debt | 9,792 | 2,295 | 1,865 | 1,558 | 1,331 | 990 | 1,753 | ||||||||||||||
| Capital securities | 732 | 151 | 151 | 111 | 106 | 106 | 107 | ||||||||||||||
| Interest rate swaps | (1 | ) | 4 | 1 | (3 | ) | (2 | ) | (1 | ) | — | ||||||||||
(1) | Debt obligations is net of deferred financing costs of $418 million. |
(2) | Primarily consists of construction commitments on commercial developments. |
(3) | Represents aggregate interest expense expected to be paid over the term of the obligations. Variable interest rate payments have been calculated based on current rates. |
NOTE 35. FINANCIAL INSTRUMENTS
| a) | Derivatives and hedging activities |
The partnership and its operating entities use derivative and non-derivative instruments to manage financial risks, including interest rate, commodity, equity price and foreign exchange risks. The use of derivative contracts is governed by documented risk management policies and approved limits. The partnership does not use derivatives for speculative purposes. The partnership and its operating entities use the following derivative instruments to manage these risks:
| • | foreign currency forward contracts to hedge exposures to Canadian Dollar, Australian Dollar, British Pound, Euro, Chinese Yuan, Brazilian Real, Indian Rupee and South Korean Won denominated net investments in foreign subsidiaries and foreign currency denominated financial assets; |
| • | interest rate swaps to manage interest rate risk associated with planned refinancings and existing variable rate debt; |
| • | interest rate caps to hedge interest rate risk on certain variable rate debt; and |
| • | cross currency swaps to manage interest rate and foreign currency exchange rates on existing variable rate debt. |
The partnership also designates Canadian Dollar financial liabilities of certain of its operating entities as hedges of its net investments in its Canadian operations.
Interest Rate Hedging
The following table provides the partnership’s outstanding derivatives that are designated as cash flow hedges of variability in interest rates associated with forecasted fixed rate financings and existing variable rate debt as of December 31, 2019 and 2018:
| (US$ Millions) | Hedging item | Notional | Rates | Maturity dates | Fair value | ||||
Dec. 31, 2019(1) | Interest rate caps of US$ LIBOR debt | $ | 7,774 | 2.7% - 6.0% | May. 2020 - Sep. 2023 | $ | — | ||
| Interest rate swaps of US$ LIBOR debt | 2,877 | 1.4% - 2.7% | Feb. 2020 - Feb. 2024 | (57 | ) | ||||
| Interest rate caps of £ LIBOR debt | 3,096 | 2.0% - 2.5% | Jan. 2021 - Jan. 2022 | — | |||||
| Interest rate swaps of £ LIBOR debt | 74 | 1.5% | Apr. 2020 | — | |||||
| Interest rate caps of € EURIBOR debt | 109 | 1.3% | Apr. 2021 | — | |||||
| Interest rate caps of C$ LIBOR debt | 184 | 3.0% | Oct. 2020 - Oct. 2022 | — | |||||
| Cross currency swaps of C$ LIBOR Debt | 600 | 4.3% - 5.0% | Oct. 2021 - Mar. 2024 | (95 | ) | ||||
| Dec. 31, 2018 | Interest rate caps of US$ LIBOR debt | $ | 8,180 | 2.3% - 6.0% | Jan. 2019 - Sep. 2023 | $ | 2 | ||
| Interest rate swaps of US$ LIBOR debt | 1,731 | 1.6% - 2.8% | Feb. 2020 - May 2024 | (2 | ) | ||||
| Interest rate caps of £ LIBOR debt | 486 | 2.0% | Apr. 2020 - Jan. 2021 | — | |||||
| Interest rate swaps of £ LIBOR debt | 67 | 1.5% | Apr. 2020 | — | |||||
| Interest rate caps of € EURIBOR debt | 115 | 1.0% - 1.3% | Apr. 2020 - Apr. 2021 | — | |||||
| Interest rate caps of C$ LIBOR debt | 176 | 3.0% | Oct. 2020 - Oct. 2022 | — | |||||
| Interest rate swaps of C$ LIBOR debt | 56 | 4.6% | Sep. 2023 | — | |||||
| Interest rate swaps on forecasted fixed rate debt | 100 | 4.0% | Jun. 2019 | (114 | ) | ||||
(1) | The IBOR Amendments disclosed in Note 2(m), Summary of Significant Accounting Policies - Financial instruments and hedge accounting, have been applied to all outstanding hedging items as of December 31, 2019 |
- F-66 -
For the year ended December 31, 2019, the amount of hedge ineffectiveness recorded in earnings in connection with the partnership’s interest rate hedging activities totaled $22 million (December 31, 2018 - $37 million).
Foreign Currency Hedging
The following table presents the partnership’s outstanding derivatives that are designated as net investment hedges in foreign subsidiaries or cash flow hedges as of December 31, 2019 and 2018:
| (US$ Millions) | Hedging item | Net Notional | Rates | Maturity dates | Fair value | ||||
| Dec. 31, 2019 | Net investment hedges | € | 245 | €0.85/$ - €0.91/$ | Mar. 2020 - Jul. 2020 | 7 | |||
| Net investment hedges | £ | 2,444 | £0.74/$ - £0.85/$ | Jan. 2020 - Sep. 2021 | (247 | ) | |||
| Net investment hedges | A$ | 238 | A$1.38/$ - A$1.48/$ | Mar. 2020 - Mar. 2021 | (5 | ) | |||
| Net investment hedges | C¥ | 962 | C¥6.75/$ - C¥7.16/$ | Apr. 2020 - Jun. 2021 | — | ||||
| Net investment hedges | C$ | 355 | C$1.31/$ - C$1.33/$ | Jun. 2020 - Sep. 2021 | — | ||||
| Net investment hedges | R$ | 1,582 | R$4.16/$ - R$4.16/$ | Jun. 2020 - Jun. 2020 | (10 | ) | |||
| Net investment hedges | ₩ | 720,095 | ₩1,149.50/$ - ₩1,174.30/$ | Mar. 2020 - Mar. 2021 | (7 | ) | |||
| Net investment hedges | Rs | — | Rs71.78/$ - Rs73.01/$ | Mar. 2020 - Apr. 2020 | — | ||||
| Net investment hedges | £ | 77 | £0.88/€ - £0.93/€ | Jan. 2020 - Apr. 2021 | — | ||||
| Cross currency swaps of C$ LIBOR debt | C$ | 800 | C$1.29/$ - C$1.33/$ | Oct. 2021 - Jul. 2023 | (8 | ) | |||
| Dec. 31, 2018 | Net investment hedges | € | 649 | €0.78/$ - €0.88/$ | Jan. 2019 - May 2020 | $ | 13 | ||
| Net investment hedges | £ | 3,175 | £0.70/$ - £0.79/$ | Feb. 2019 - Mar. 2020 | 104 | ||||
| Net investment hedges | A$ | 1,038 | A$1.28/$ - A$1.42/$ | Jan. 2019 - Mar. 2020 | 20 | ||||
| Net investment hedges | C¥ | 2,672 | C¥6.35/$ - C¥6.91/$ | Jan. 2019 - Nov. 2019 | 6 | ||||
| Net investment hedges | C$ | 118 | C$1.29/$ - C$1.34/$ | Oct. 2019 - Nov 2019 | 4 | ||||
| Net investment hedges | R$ | 158 | R$3.90/$ - R$4.24/$ | Jan. 2019 - Jun. 2019 | (9 | ) | |||
| Net investment hedges | ₩ | 618,589 | ₩1,087.00/$ - ₩1,130.90/$ | Jan. 2019 - Nov. 2019 | 1 | ||||
| Net investment hedges | Rs | 31,422 | Rs67.44/$ - Rs70.39/$ | Feb. 2019 - May 2019 | 3 | ||||
| Net investment hedges | £ | 77 | £0.88/€ - £0.92/€ | Jan. 2019 - Feb. 2020 | (1 | ) | |||
| Cross currency swaps of C$ LIBOR debt | C$ | 800 | C$1.29/$ - C$1.33/$ | Oct. 2021 - Jul. 2023 | (31 | ) | |||
For the years ended December 31, 2019 and 2018, the amount of hedge ineffectiveness recorded in earnings in connection with the partnership’s foreign currency hedging activities was not significant.
Other Derivatives
The following tables provide detail of the partnership’s other derivatives, not designated as hedges for accounting purposes, that have been entered into to manage financial risks as of December 31, 2019 and 2018:
| (US$ millions) | Derivative type | Notional | Rates | Maturity dates | Fair value | ||||
| Dec. 31, 2019 | Interest rate caps | $ | 5,663 | 2.5% - 5.0% | Mar. 2020 - Nov. 2021 | $ | — | ||
| Interest rate swaps on forecasted fixed rate debt | 1,285 | 1.1% - 6.4% | Jun. 2020 - Sep. 2031 | (149 | ) | ||||
| Interest rate swaps of US$ debt | 2,003 | 1.7% - 4.6% | Nov. 2020 - Sep. 2023 | (14 | ) | ||||
| Dec. 31, 2018 | Interest rate caps | $ | 9,750 | 3.0% - 7.0% | Mar. 2019 - Jan. 2022 | $ | 1 | ||
| Interest rate swaps on forecasted fixed rate debt | 1,660 | 2.3% - 6.1% | Jun. 2019 - Nov. 2030 | (67 | ) | ||||
| Interest rate swaps of US$ debt | 835 | 2.4% - 5.8% | Jul. 2019 - Oct. 2039 | (14 | ) | ||||
| Interest rate swaps on fixed rate debt | 180 | 4.5% - 7.3% | Feb. 2019 - Jul. 2023 | 2 | |||||
The partnership recognized fair value gains (losses), net of approximately $(70) million (December 31, 2018 - $29 million) related to the settlement of certain forward starting interest rate swaps that have not been designated as hedges.
- F-67 -
| b) | Measurement and classification of financial instruments |
Fair value is the amount that willing parties would accept to exchange a financial instrument based on the current market for instruments with the same risk, principal and remaining maturity. The fair value of interest bearing financial assets and liabilities is determined by discounting the contractual principal and interest payments at estimated current market interest rates for the instrument. Current market rates are determined by reference to current benchmark rates for a similar term and current credit spreads for debt with similar terms and risk.
Classification and Measurement
The following table outlines the classification and measurement basis, and related fair value for disclosures, of the financial assets and liabilities in the consolidated financial statements:
| Dec. 31, 2019 | Dec. 31, 2018 | ||||||||||||
| (US$ Millions) | Classification and measurement basis | Carrying value | Fair value | Carrying value | Fair value | ||||||||
| Financial assets | |||||||||||||
| Participating loan interests | FVTPL | $ | — | $ | — | $ | 268 | $ | 268 | ||||
| Loans and notes receivable | Amortized cost | 329 | 329 | 1,055 | 1,055 | ||||||||
| Other non-current assets | |||||||||||||
| Securities - FVTPL | FVTPL | 1,250 | 1,250 | 239 | 239 | ||||||||
| Derivative assets | FVTPL | 10 | 10 | 13 | 13 | ||||||||
| Securities - FVTOCI | FVTOCI | 121 | 121 | 260 | 260 | ||||||||
| Restricted cash | Amortized cost | 154 | 154 | 161 | 161 | ||||||||
| Current assets | |||||||||||||
| Derivative assets | FVTPL | 80 | 80 | 234 | 234 | ||||||||
Accounts receivable(1) | Amortized cost | 514 | 514 | 808 | 808 | ||||||||
| Restricted cash | Amortized cost | 239 | 239 | 631 | 631 | ||||||||
| Cash and cash equivalents | Amortized cost | 1,438 | 1,438 | 3,288 | 3,288 | ||||||||
| Total financial assets | $ | 4,135 | $ | 4,135 | $ | 6,957 | $ | 6,957 | |||||
| Financial liabilities | |||||||||||||
Debt obligations(2) | Amortized cost | $ | 55,528 | $ | 56,112 | $ | 63,964 | $ | 64,561 | ||||
| Capital securities | Amortized cost | 2,153 | 2,160 | 2,572 | 2,578 | ||||||||
| Capital securities - fund subsidiaries | FVTPL | 922 | 922 | 813 | 813 | ||||||||
| Other non-current liabilities | |||||||||||||
| Loan payable | FVTPL | — | — | 24 | 24 | ||||||||
| Accounts payable | Amortized cost | 778 | 778 | 1,770 | 1,770 | ||||||||
| Derivative liabilities | FVTPL | 413 | 413 | 159 | 159 | ||||||||
| Accounts payable and other liabilities | |||||||||||||
Accounts payable and other(3) | Amortized cost | 2,711 | 2,711 | 3,255 | 3,255 | ||||||||
| Derivative liabilities | FVTPL | 289 | 289 | 181 | 181 | ||||||||
| Total financial liabilities | $ | 62,794 | $ | 63,385 | $ | 72,738 | $ | 73,341 | |||||
(1) | Includes other receivables associated with assets classified as held for sale on the consolidated balance sheets in the amounts of $4 million and $14 million as of December 31, 2019 and December 31, 2018, respectively. |
(2) | Includes debt obligations associated with assets classified as held for sale on the consolidated balance sheets in the amount of $138 million and $153 million as of December 31, 2019 and December 31, 2018, respectively. |
(3) | Includes accounts payable and other liabilities associated with assets classified as held for sale on the consolidated balance sheets in the amount of $2 million and $10 million as of December 31, 2019 and December 31, 2018, respectively. |
- F-68 -
The following table outlines financial assets and liabilities measured at fair value in the financial statements and the level of the inputs used to determine those fair values in the context of the hierarchy as defined above:
| Dec. 31, 2019 | Dec. 31, 2018 | |||||||||||||||||||||||
| (US$ Millions) | Level 1 | Level 2 | Level 3 | Total | Level 1 | Level 2 | Level 3 | Total | ||||||||||||||||
| Financial assets | ||||||||||||||||||||||||
| Participating loan interests | $ | — | $ | — | $ | — | $ | — | $ | — | $ | — | $ | 268 | $ | 268 | ||||||||
| Securities designated as FVTPL | — | — | 1,250 | 1,250 | — | — | 239 | 239 | ||||||||||||||||
| Securities designated as FVTOCI | — | — | 121 | 121 | — | — | 260 | 260 | ||||||||||||||||
| Derivative assets | — | 90 | — | 90 | — | 247 | — | 247 | ||||||||||||||||
| Total financial assets | $ | — | $ | 90 | $ | 1,371 | $ | 1,461 | $ | — | $ | 247 | $ | 767 | $ | 1,014 | ||||||||
| Financial liabilities | ||||||||||||||||||||||||
| Capital securities - fund subsidiaries | $ | — | $ | — | $ | 922 | $ | 922 | $ | — | $ | — | $ | 813 | $ | 813 | ||||||||
| Derivative liabilities | — | 702 | — | 702 | — | 340 | — | 340 | ||||||||||||||||
| Loan payable | — | — | — | — | — | — | 24 | 24 | ||||||||||||||||
| Total financial liabilities | $ | — | $ | 702 | $ | 922 | $ | 1,624 | $ | — | $ | 340 | $ | 837 | $ | 1,177 | ||||||||
There were no transfers between levels during the years ended December 31, 2019 and 2018. The following table presents the valuation techniques and inputs of the partnership’s Level 2 assets and liabilities:
| Type of asset/liability | Valuation technique | |
| Foreign currency forward contracts | Discounted cash flow model - forward exchange rates (from observable forward exchange rates at the end of the reporting period) and discounted at a credit adjusted rate | |
| Interest rate contracts | Discounted cash flow model - forward interest rates (from observable yield curves) and applicable credit spreads discounted at a credit adjusted rate | |
The table below presents the valuation techniques and inputs of Level 3 assets:
| Type of asset/liability | Valuation techniques | Significant unobservable input(s) | Relationship of unobservable input(s) to fair value | |||
| Participating loan interests | Discounted cash flow model | (a) Discount rate (b) Terminal capitalization rate | (a) Decreases (increases) in the discount rate would increase (decrease) fair value (b) Increases (decreases) in the terminal capitalization rate would (decrease) increase fair value | |||
| Securities - FVTPL/FVTOCI | Net asset valuation | (a) Forward exchange rates (from observable forward exchange rates at the end of the reporting period) (b) Discount rate | (a) Increases (decreases) in the forward exchange rate would increase (decrease) fair value (b) Decreases (increases) in the discount rate would increase (decrease) fair value | |||
- F-69 -
The following table presents the change in the balance of financial assets and financial liabilities classified as Level 3 as of December 31, 2019 and 2018:
| Dec. 31, 2019 | Dec. 31, 2018 | |||||||||||
| (US$ Millions) | Financial assets | Financial liabilities | Financial assets | Financial liabilities | ||||||||
| Balance, beginning of year | $ | 767 | $ | 838 | $ | 835 | $ | 836 | ||||
| Additions | 950 | — | 201 | — | ||||||||
| Dispositions | (125 | ) | — | (7 | ) | (2 | ) | |||||
| Fair value gains, net and OCI | 206 | 8 | (14 | ) | 4 | |||||||
| Other | (427 | ) | 76 | (248 | ) | — | ||||||
| Balance, end of year | $ | 1,371 | $ | 922 | $ | 767 | $ | 838 | ||||
| c) | Market Risk |
Interest rate risk
The partnership faces interest rate risk on its variable rate financial assets and liabilities. In addition, there is interest rate risk associated with the partnership’s fixed rate debt due to the expected requirement to refinance such debt in the year of maturity. The following table outlines the impact on interest expense of a 100 basis point increase or decrease in interest rates on the partnership’s variable rate liabilities and fixed rate debt maturing within one year:
| (US$ Millions) | Dec. 31, 2019 | Dec. 31, 2018 | ||||
| Variable rate property debt | $ | 250 | $ | 382 | ||
| Fixed rate property debt due within one year | 7 | 5 | ||||
| Total | $ | 257 | $ | 387 | ||
The partnership manages interest rate risk by primarily entering into fixed rate operating property debt and staggering the maturities of its mortgage portfolio over a 10-year horizon when the market permits. The partnership also makes use of interest rate derivatives to manage interest rate risk on specific variable rate debts and on anticipated refinancing of fixed rate debt.
Foreign currency risk
The partnership is structured such that its foreign operations are primarily conducted by entities with a functional currency which is the same as the economic environment in which the operations take place. As a result, the net income impact of currency risk associated with financial instruments is limited as its financial assets and liabilities are generally denominated in the functional currency of the subsidiary that holds the financial instrument. However, the partnership is exposed to foreign currency risk on the net assets of its foreign currency denominated operations.
- F-70 -
The partnership’s exposures to foreign currencies and the sensitivity of net income and other comprehensive income, on a pre-tax basis, to a 10% change in the exchange rates relative to the U.S. dollar is summarized below:
| Dec. 31, 2019 | |||||||||
| (Millions) | Equity attributable to Unitholders | OCI | Net income | ||||||
Canadian Dollar(1) | C$ | 377 | $ | (29 | ) | $ | — | ||
| Australian Dollar | A$ | 2,154 | (151 | ) | — | ||||
| British Pound | £ | 3,275 | (434 | ) | — | ||||
| Euro | € | 339 | (38 | ) | — | ||||
| Brazilian Real | R$ | 3,310 | (82 | ) | — | ||||
| Indian Rupee | Rs | 26,628 | (37 | ) | — | ||||
| Chinese Yuan | C¥ | 933 | (13 | ) | — | ||||
| South Korean Won | ₩ | 160,969 | (14 | ) | — | ||||
| United Arab Emirates Dirham | AED | 683 | (19 | ) | — | ||||
| Czech Koruna | CZK | 10 | — | — | |||||
| Hungarian Forint | HUF | 314 | — | — | |||||
| Poland Zloty | PLN | 3 | — | — | |||||
| Total | $ | (817 | ) | $ | — | ||||
(1) | Net of Canadian Dollar denominated loans. |
| Dec. 31, 2018 | |||||||||
| (Millions) | Equity attributable to Unitholders | OCI | Net income | ||||||
Canadian Dollar(1) | C$ | 58 | $ | (4 | ) | $ | — | ||
| Australian Dollar | A$ | 2,977 | (210 | ) | — | ||||
| British Pound | £ | 3,965 | (506 | ) | — | ||||
| Euro | € | 505 | (58 | ) | — | ||||
| Brazilian Real | R$ | 2,823 | (73 | ) | — | ||||
| Indian Rupee | Rs | 25,022 | (36 | ) | — | ||||
| Hong Kong Dollar | HK$ | (75 | ) | 1 | — | ||||
| Chinese Yuan | C¥ | 1,593 | (23 | ) | — | ||||
| South Korean Won | ₩ | 245,507 | (22 | ) | — | ||||
| United Arab Emirates Dirham | AED | 451 | (12 | ) | — | ||||
| Total | $ | (943 | ) | $ | — | ||||
(1) | Net of Canadian Dollar denominated loans. |
| Dec. 31, 2017 | |||||||||
| (Millions) | Equity attributable to Unitholders | OCI | Net income | ||||||
Canadian Dollar(1) | C$ | 4 | $ | — | $ | — | |||
| Australian Dollar | A$ | 2,679 | (209 | ) | — | ||||
| British Pound | £ | 3,719 | (503 | ) | — | ||||
| Euro | € | 213 | (26 | ) | — | ||||
| Brazilian Real | R$ | 2,591 | (78 | ) | — | ||||
| Indian Rupee | Rs | 15,904 | (25 | ) | — | ||||
| Hong Kong Dollar | HK$ | (75 | ) | 1 | — | ||||
| Chinese Yuan | C¥ | 1,207 | (19 | ) | — | ||||
| South Korean Won | ₩ | 232,345 | (22 | ) | — | ||||
| United Arab Emirates Dirham | AED | 451 | (12 | ) | — | ||||
| Total | $ | (893 | ) | $ | — | ||||
(1) | Net of Canadian Dollar denominated loans. |
- F-71 -
| d) | Credit risk |
The partnership’s maximum exposure to credit risk associated with financial assets is equivalent to the carrying value of each class of financial asset as separately presented in loans and notes receivable, certain other non-current assets, accounts receivables and other, and cash and cash equivalents.
Credit risk arises on loans and notes receivables in the event that borrowers default on the repayment to the partnership. The partnership mitigates this risk by attempting to ensure that adequate security has been provided in support of such loans and notes.
Credit risk related to accounts receivable arises from the possibility that tenants may be unable to fulfill their lease commitments. The partnership mitigates this risk through diversification, ensuring that tenants meet minimum credit quality requirements and by ensuring that its tenant mix is diversified and by limiting its exposure to any one tenant. The partnership maintains a portfolio that is diversified by property type so that exposure to a business sector is lessened.
Currently no one tenant represents more than 10% of operating property revenue.
The majority of the partnership’s trade receivables are collected within 30 days. The balance of accounts receivable and loans and notes receivable past due is not significant.
- F-72 -
NOTE 36. RELATED PARTIES
In the normal course of operations, the partnership enters into transactions with related parties. These transactions are recognized in the consolidated financial statements. These transactions have been measured at exchange value and are recognized in the consolidated financial statements. The immediate parent of the partnership is the BPY General Partner. The ultimate parent of the partnership is Brookfield Asset Management. Other related parties of the partnership include the partnership’s and Brookfield Asset Management’s subsidiaries and operating entities, certain joint ventures and associates accounted for under the equity method, as well as officers of such entities and their spouses.
The partnership has a management agreement with its service providers, wholly-owned subsidiaries of Brookfield Asset Management. Pursuant to a Master Services Agreement, the partnership pays a base management fee (“base management fee”), to the service providers equal to 0.5% of the total capitalization of the partnership, subject to an annual minimum of $50 million, plus annual inflation adjustments. The calculation of the equity enhancement distribution is reduced by the amount by which the base management fee is greater than $50 million per annum, plus annual inflation adjustments, to maintain a fee level in aggregate that would be the same as prior to the amendment. In connection with the GGP acquisition, the Master Services Agreement was amended so that the base management fee took into account any management fee payable by BPR under its master services agreement with Brookfield Asset Management and certain of its subsidiaries.
The base management fee for the year ended December 31, 2019 was $107 million (2018 - $83 million, 2017 - $104 million). The equity enhancement distribution for the year ended December 31, 2019 was $26 million (2018 - $1 million, 2017 - $26 million).
In connection with the issuance of Preferred Equity Units to the Class A Preferred Unitholder in 2014, Brookfield Asset Management contingently agreed to acquire the seven-year and ten-year tranches of Preferred Equity Units from the Class A Preferred Unitholder for the initial issuance price plus accrued and unpaid distributions and to exchange such units for Preferred Equity Units with terms and conditions substantially similar to the twelve-year tranche to the extent that the market price of the LP Units is less than 80% of the exchange price at maturity.
The following table summarizes transactions and balances with related parties:
| (US$ Millions) | Dec. 31, 2019 | Dec. 31, 2018 | ||||
| Balances outstanding with related parties: | ||||||
| Participating loan interests | $ | — | $ | 268 | ||
| Net (payables)/receivables within equity accounted investments | (81 | ) | (26 | ) | ||
Loans and notes receivable(1) | 102 | 54 | ||||
| Receivables and other assets | 17 | 50 | ||||
Deposit and promissory note from Brookfield Asset Management(2) | — | (733 | ) | |||
Property-specific obligations(3) | — | (231 | ) | |||
| Loans and notes payable and other liabilities | (196 | ) | (50 | ) | ||
Capital securities held by Brookfield Asset Management(4) | — | (420 | ) | |||
| Preferred shares held by Brookfield Asset Management | (15 | ) | (15 | ) | ||
(1) | At December 31, 2019, includes nil (December 31, 2018 - $54 million) receivable from Brookfield Asset Management upon the earlier of the partnership’s exercise of its option to convert its participating loan interests into direct ownership of the Australian portfolio or the maturity of the participating loan interests. |
(2) | The deposit and promissory note from Brookfield Asset Management were repaid during the year ended December 31, 2019. |
(3) | The partnership exercised its option to acquire properties in Australia from Brookfield Asset Management during the year, therefore the property-specific obligations are now consolidated. |
(4) | In 2019, approximately $420 million of the Brookfield BPY Holdings Inc. Class B Junior Preferred Shares, held by Brookfield Asset Management, were redeemed. |
- F-73 -
| (US$ Millions) Years ended Dec. 31, | 2019 | 2018 | 2017 | ||||||
| Transactions with related parties: | |||||||||
Commercial property revenue(1) | $ | 26 | $ | 22 | $ | 19 | |||
| Management fee income | 35 | 5 | 6 | ||||||
Participating loan interests (including fair value gains, net)(2) | 50 | 53 | 86 | ||||||
| Interest expense on debt obligations | 48 | 44 | 29 | ||||||
| Interest on capital securities held by Brookfield Asset Management | 8 | 64 | 83 | ||||||
General and administrative expense(2) | 198 | 192 | 204 | ||||||
Construction costs(3) | 411 | 397 | 295 | ||||||
Incentive Fees(4) | 104 | — | — | ||||||
(1) | Amounts received from Brookfield Asset Management and its subsidiaries for the rental of office premises. |
(2) | Includes amounts paid to Brookfield Asset Management and its subsidiaries for management fees, management fees associated with the partnership’s investments in Brookfield-sponsored real estate funds, and administrative services. |
(3) | Includes amounts paid to Brookfield Asset Management and its subsidiaries for construction costs of development properties. |
(4) | Represents incentive fees the partnership is obligated to pay to the general partner of the partnership’s various fund investments. |
During the fourth quarter of 2019, the partnership converted its economic interest, through its participating loan agreements, in a portfolio of properties in Australia owned by Brookfield Asset Management into direct ownership interests
During the third and fourth quarters of 2019, the partnership sold partial interest in two multifamily developments in Brooklyn, NY and a retail development in Connecticut into the Brookfield Opportunity Zone fund (“BOZ fund”). Upon the final close of BOZ fund in the fourth quarter of 2019, the partnership’s interests in these development assets were diluted, which resulted in the deconsolidation of the assets and accounting for them as a financial asset.
During the first quarter of 2018, the partnership along with BPREP acquired a 25% and 75% interest, respectively, in 333 West 34th Street, an office building in New York for $255 million.
During the third quarter of 2018, the partnership sold 27.5% of its interest in a portfolio of operating and development assets in New York. The partnership retains control over and continues to consolidate these assets after the sale. The interest was sold to Brookfield Asset Management for consideration of approximately $1.4 billion.
During the fourth quarter of 2018, the partnership launched Brookfield Premier Real Estate Partners Pooling LLC Australia (“BPREP Australia”), an open-ended fund. The partnership contributed interests in Jessie Street, 52 Goulburn Street and 680 George Street in Sydney and 235 St Georges Terrace in Perth to BPREP Australia. The partnership’s interest in BPREP Australia is 39%, with the remaining interest of 61% held by external investors. The partnership continues to consolidate the properties contributed to BPREP Australia, except for 680 George Street, which it continues to account for under the equity method.
NOTE 37. SUBSIDIARY PUBLIC ISSUERS
BOP Split was incorporated for the purpose of being an issuer of preferred shares and owning a portion of the partnership’s investment in BPO common shares. Pursuant to the terms of a Plan of Arrangement, holders of outstanding BPO Class AAA Preferred Shares Series G, H, J and K, which were convertible into BPO common shares, were able to exchange their shares for BOP Split Senior Preferred Shares, subject to certain conditions. The BOP Split Senior Preferred shares are listed on the TSX and began trading on June 11, 2014. All shares issued by BOP Split are retractable by the holders at any time for cash.
In connection with an internal restructuring completed in July 2016, the partnership and certain of its related entities agreed to guarantee all of BPO’s Class AAA Preferred Shares and all of BPO’s debt securities issued pursuant to BPO’s indenture dated December 8, 2009.
In April 2018, the partnership formed two subsidiaries, Brookfield Property Finance ULC and Brookfield Property Preferred Equity Inc. to act as issuers of debt and preferred securities, respectively. The partnership and certain of its related entities have agreed to guarantee securities issued by these entities.
The following table provides consolidated summary financial information for the partnership, BOP Split, BPO, Brookfield Property Finance ULC, Brookfield Property Preferred Equity Inc. and the holding entities:
- F-74 -
| (US$ Millions) | Brookfield Property Partners L.P. | BOP Split Corp. | BPO | Brookfield Property Preferred Equity Inc. | Brookfield Property Finance ULC | Holding Entities(2) | Additional holding entities and eliminations(3) | Consolidating Adjustments(4) | Brookfield Property Partners L.P. consolidated | ||||||||||||||||||
| Year ended December 31, 2019 | |||||||||||||||||||||||||||
| Revenue | $ | — | $ | 32 | $ | 163 | $ | — | $ | 43 | $ | 1,767 | $ | 392 | $ | 5,806 | $ | 8,203 | |||||||||
Net income attributable to unitholders(1) | 967 | 386 | 767 | — | (41 | ) | 1,956 | 688 | (2,767 | ) | 1,956 | ||||||||||||||||
| Year ended December 31, 2018 | |||||||||||||||||||||||||||
| Revenue | $ | — | $ | 27 | $ | 166 | $ | — | $ | 8 | $ | 1,192 | $ | 167 | $ | 5,679 | $ | 7,239 | |||||||||
Net income attributable to unitholders(1) | 767 | 417 | (1,419 | ) | — | — | 1,978 | (34 | ) | 269 | 1,978 | ||||||||||||||||
| Year ended December 31, 2017 | |||||||||||||||||||||||||||
| Revenue | $ | — | $ | — | $ | 197 | $ | — | $ | — | $ | 1,518 | $ | — | $ | 4,420 | $ | 6,135 | |||||||||
Net income attributable to unitholders(1) | 138 | (409 | ) | (763 | ) | — | — | 375 | 17 | 1,017 | 375 | ||||||||||||||||
(1) | Includes net income attributable to LP Units, GP Units, Redeemable/Exchangeable Partnership Units, Special LP Units, Exchange LP Units and BPR Units. |
(2) | Includes the operating partnership, Brookfield BPY Holdings Inc., Brookfield BPY Retail Holdings II Inc., BPY Bermuda Holdings Limited, and BPY Bermuda Holdings II Limited. |
(3) | Includes BPY Bermuda Holdings IV Limited, BPY Bermuda Holdings V Limited and BPY Bermuda Holdings VI Limited, which serve as guarantors for BPO but not BOP Split, net of intercompany balances and transactions with other holding entities |
(4) | Includes elimination of intercompany transactions and balances necessary to present the partnership on a consolidated basis. |
| (US$ Millions) | Brookfield Property Partners L.P. | BOP Split Corp. | BPO | Brookfield Property Preferred Equity Inc. | Brookfield Property Finance ULC | Holding Entities(2) | Additional holding entities and eliminations(3) | Consolidating Adjustments(4) | Brookfield Property Partners L.P. consolidated | ||||||||||||||||||
| As of Dec. 31, 2019 | |||||||||||||||||||||||||||
| Current assets | $ | — | $ | 12 | $ | 127 | $ | — | $ | 673 | $ | 8,436 | $ | 176 | $ | (6,522 | ) | $ | 2,902 | ||||||||
| Non-current assets | 14,517 | 11,739 | 23,830 | — | 429 | 29,367 | 2,049 | 26,423 | 108,354 | ||||||||||||||||||
| Assets held for sale | — | — | — | — | — | — | — | 387 | 387 | ||||||||||||||||||
| Current liabilities | — | 995 | 131 | — | 15 | 5,981 | 1,129 | 4,075 | 12,326 | ||||||||||||||||||
| Non-current liabilities | — | 6,173 | 6,744 | — | 1,078 | 2,871 | 519 | 36,857 | 54,242 | ||||||||||||||||||
| Liabilities associated with assets held for sale | — | — | — | — | — | — | — | 140 | 140 | ||||||||||||||||||
| Preferred equity | 420 | — | — | — | — | — | — | — | 420 | ||||||||||||||||||
| Equity attributable to interests of others in operating subsidiaries and properties | — | — | 2,284 | — | — | — | — | 13,701 | 15,985 | ||||||||||||||||||
Equity attributable to unitholders(1) | $ | 14,097 | $ | 4,583 | $ | 14,798 | $ | — | $ | 9 | $ | 28,951 | $ | 577 | $ | (34,485 | ) | $ | 28,530 | ||||||||
| As of Dec. 31, 2018 | |||||||||||||||||||||||||||
| Current assets | $ | — | $ | 52 | $ | 151 | $ | — | $ | 596 | $ | 6,144 | $ | 330 | $ | (1,163 | ) | $ | 6,110 | ||||||||
| Non-current assets | 13,273 | 11,748 | 20,359 | — | — | 30,277 | 1,775 | 37,974 | 115,406 | ||||||||||||||||||
| Assets held for sale | — | — | — | — | — | — | — | 1,004 | 1,004 | ||||||||||||||||||
| Current liabilities | — | 2,806 | 678 | — | 593 | 5,731 | 1,834 | (1,499 | ) | 10,143 | |||||||||||||||||
| Non-current liabilities | — | 3,053 | 4,738 | — | — | 2,406 | 5 | 55,272 | 65,474 | ||||||||||||||||||
| Liabilities associated with assets held for sale | — | — | — | — | — | — | — | 163 | 163 | ||||||||||||||||||
| Equity attributable to interests of others in operating subsidiaries and properties | — | — | 2,284 | — | — | — | — | 16,172 | 18,456 | ||||||||||||||||||
Equity attributable to unitholders(1) | $ | 13,273 | $ | 5,941 | $ | 12,810 | $ | — | $ | 3 | $ | 28,284 | $ | 266 | $ | (32,293 | ) | $ | 28,284 | ||||||||
(1) | Includes net income attributable to LP Units, GP Units, Redeemable/Exchangeable Partnership Units, Special LP Units, Exchange LP Units and BPR Units. |
(2) | Includes the operating partnership, Brookfield BPY Holdings Inc., Brookfield BPY Retail Holdings II Inc., BPY Bermuda Holdings Limited, and BPY Bermuda Holdings II Limited. |
(3) | Includes BPY Bermuda Holdings IV Limited, BPY Bermuda Holdings V Limited and BPY Bermuda Holdings VI Limited, which serve as guarantors for BPO but not BOP Split, net of intercompany balances and transactions with other holding entities |
(4) | Includes elimination of intercompany transactions and balances necessary to present the partnership on a consolidated basis. |
- F-75 -
NOTE 38. PAYROLL EXPENSE
The partnership has no employees or directors; therefore the partnership does not remunerate key management personnel. Key decision makers of the partnership are all employees of Brookfield Asset Management, the ultimate parent company, who provide management services under the Master Services Agreement.
Throughout the year, the partnership’s general partner incurs director fees, a portion of which are charged to the partnership in accordance with the limited partnership agreement.
NOTE 39. SEGMENT INFORMATION
| a) | Operating segments |
IFRS 8, Operating Segments, requires operating segments to be determined based on internal reports that are regularly reviewed by the chief operating decision maker (“CODM”) for the purpose of allocating resources to the segment and to assessing its performance. On July 1, 2018, the partnership realigned its LP Investments segment (formerly referred to as Opportunistic) to include the corporate function of the Brookfield-sponsored real estate opportunity funds, previously included in the Corporate segment, to more closely align with how the partnership now presents financial information to the CODM and investors. All prior period segment disclosures have been recast to reflect the changes in the partnership’s operating segments. The partnership’s operating segments are organized into four reportable segments: i) Core Office, ii) Core Retail, iii) LP Investments and iv) Corporate. These segments are independently and regularly reviewed and managed by the Chief Executive Officer, who is considered the CODM.
| b) | Basis of measurement |
The CODM measures and evaluates the performance of the partnership’s operating segments based on funds from operations (“FFO”). This performance metric does not have standardized meanings prescribed by IFRS and therefore may differ from similar metrics used by other companies and organizations. Management believes that while not an IFRS measure, FFO is the most consistent metric to measure the partnership’s financial statements and for the purpose of allocating resources and assessing its performance.
The partnership defines FFO as net income, prior to fair value gains, net, depreciation and amortization of real estate assets, and income taxes less non-controlling interests of others in operating subsidiaries and properties share of these items. When determining FFO, the partnership also includes its proportionate share of the FFO of unconsolidated partnerships and joint ventures and associates.
| b) | Reportable segment measures |
The following summaries present certain financial information regarding the partnership’s operating segments for the year ended December 31, 2019, 2018, and 2017.
| (US$ Millions) | Total revenue | FFO | ||||||||||||||||
| Years ended Dec. 31, | 2019 | 2018 | 2017 | 2019 | 2018 | 2017 | ||||||||||||
| Core Office | $ | 2,149 | $ | 2,105 | $ | 2,147 | $ | 582 | $ | 520 | $ | 534 | ||||||
Core Retail(1) | 1,589 | 584 | — | 707 | 552 | 486 | ||||||||||||
| LP Investments | 4,452 | 4,544 | 3,987 | 268 | 228 | 281 | ||||||||||||
| Corporate | 13 | 6 | 1 | (410 | ) | (434 | ) | (428 | ) | |||||||||
| Total | $ | 8,203 | $ | 7,239 | $ | 6,135 | $ | 1,147 | $ | 866 | $ | 873 | ||||||
(1) | Represents revenue from Core Retail subsequent to the acquisition of GGP on August 28, 2018, when the partnership started consolidating Core Retail’s results. See Note 4, Acquisition of GGP Inc. for further information. The prior periods presented represent the partnership’s equity accounted interest in GGP prior to the acquisition, 34% as of December 31, 2017. |
The following summary presents the detail of total revenue from the partnership’s operating segments for the year ended December 31, 2019 and 2018:
| (US$ Millions) | Lease revenue | Other revenue from tenants | Hospitality revenue | Investment and other revenue | Total revenue | ||||||||||
| Year ended Dec. 31, 2019 | |||||||||||||||
| Core Office | $ | 1,426 | $ | 477 | $ | 12 | $ | 234 | $ | 2,149 | |||||
| Core Retail | 1,082 | 312 | — | 195 | 1,589 | ||||||||||
| LP Investments | 2,077 | 317 | 1,897 | 161 | 4,452 | ||||||||||
| Corporate | — | — | — | 13 | 13 | ||||||||||
| Total | $ | 4,585 | $ | 1,106 | $ | 1,909 | $ | 603 | $ | 8,203 | |||||
- F-76 -
| (US$ Millions) | Lease revenue | Other revenue from tenants | Hospitality revenue | Investment and other revenue | Total revenue | ||||||||||
| Year ended Dec. 31, 2018 | |||||||||||||||
| Core Office | $ | 1,604 | $ | 358 | $ | 17 | $ | 126 | $ | 2,105 | |||||
| Core Retail | 400 | 111 | — | 73 | 584 | ||||||||||
| LP Investments | 2,233 | 337 | 1,896 | 78 | 4,544 | ||||||||||
| Corporate | — | — | — | 6 | 6 | ||||||||||
| Total | $ | 4,237 | $ | 806 | $ | 1,913 | $ | 283 | $ | 7,239 | |||||
The following summary presents information about certain consolidated balance sheet items of the partnership, on a segmented basis, as of December 31, 2019 and 2018:
| Total assets | Total liabilities | |||||||||||
| (US$ Millions) | Dec. 31, 2019 | Dec. 31, 2018 | Dec. 31, 2019 | Dec. 31, 2018 | ||||||||
| Core Office | $ | 36,758 | $ | 34,095 | $ | 17,592 | $ | 15,033 | ||||
| Core Retail | 32,921 | 29,658 | 16,996 | 13,749 | ||||||||
| LP Investments | 41,838 | 58,610 | 27,457 | 41,604 | ||||||||
| Corporate | 126 | 157 | 4,663 | 5,394 | ||||||||
| Total | $ | 111,643 | $ | 122,520 | $ | 66,708 | $ | 75,780 | ||||
The following summary presents a reconciliation of FFO to net income for the years ended December 31, 2019, 2018, and 2017:
| (US$ Millions) Years ended Dec. 31, | 2019 | 2018 | 2017 | ||||||
FFO(1) | $ | 1,147 | $ | 866 | $ | 873 | |||
| Depreciation and amortization of real estate assets | (283 | ) | (264 | ) | (244 | ) | |||
| Fair value gains, net | 596 | 2,466 | 1,254 | ||||||
| Share of equity accounted income - non-FFO | 1,055 | 114 | 82 | ||||||
| Income tax benefit (expense) | (196 | ) | (81 | ) | (192 | ) | |||
| Non-controlling interests of others in operating subsidiaries and properties - non-FFO | (363 | ) | (1,123 | ) | (1,398 | ) | |||
Net income attributable to unitholders(2) | 1,956 | 1,978 | 375 | ||||||
| Non-controlling interests of others in operating subsidiaries and properties | 1,201 | 1,676 | 2,093 | ||||||
| Net income | $ | 3,157 | $ | 3,654 | $ | 2,468 | |||
(1) | FFO represents interests attributable to GP Units, LP Units, Exchange LP Units, Redeemable/Exchangeable Partnership Units, Special LP Units, FV LTIP Units and BPR Units. The interests attributable to Exchange LP Units, Redeemable/Exchangeable Units, Special LP Units, FV LTIP Units and BPR Units are presented as non-controlling interests in the consolidated statements of income. |
(2) | Includes net income attributable to general partner, limited partners, Exchange LP Units, Redeemable/Exchangeable Partnership Units, Special LP Units, FV LTIP Units and BPR Units. The interests attributable to Exchange LP Units, Redeemable/Exchangeable Units, Special LP Units, FV LTIP Units and BPR Units are presented as non-controlling interests in the consolidated statements of income. |
The following summary presents financial information by the partnership’s geographic regions in which it operates:
Total revenue for the years ended Dec. 31, | Total non-current assets as at Dec. 31, | ||||||||||||||
| (US$ Millions) | 2019 | 2018 | 2017 | 2019 | 2018 | ||||||||||
| United States | $ | 5,926 | $ | 4,914 | $ | 4,127 | $ | 75,118 | $ | 84,648 | |||||
| Canada | 536 | 563 | 462 | 5,157 | 4,535 | ||||||||||
| Australia | 210 | 240 | 227 | 3,316 | 3,631 | ||||||||||
| Europe | 901 | 944 | 829 | 15,412 | 14,051 | ||||||||||
| Brazil | 117 | 113 | 134 | 2,121 | 1,901 | ||||||||||
| China | 6 | 7 | 1 | 94 | 389 | ||||||||||
| India | 288 | 247 | 161 | 3,880 | 3,142 | ||||||||||
| South Korea | 219 | 211 | 194 | 3,089 | 2,986 | ||||||||||
| United Arab Emirates | — | — | — | 167 | 123 | ||||||||||
| Total | $ | 8,203 | $ | 7,239 | $ | 6,135 | $ | 108,354 | $ | 115,406 | |||||
- F-77 -
NOTE 40. SUBSEQUENT EVENTS
On January 15, 2020, the partnership issued medium term notes for C$400 million at 3.93% per annum, with a term of seven years. Interest on the notes are payable semi-annually.
On January 15, 2020, the partnership additionally issued medium term notes for C$100 million at 4.346% per annum, at an implied yield of 3.02%, with a term of 3.5 years. Interest on the notes are payable semi-annually.
On February 4, 2020, the board of directors declared a quarterly distribution on the partnership’s LP Units of $0.3325 per unit ($1.33 on an annualized basis) payable on March 31, 2020 to unitholders of record at the close of business on February 28, 2020.
On February 18, 2020, the partnership issued $287.5 million of our Class A Cumulative Redeemable Perpetual Preferred Units, Series 3 at a coupon rate of 5.75% per annum, payable quarterly in arrears.
- F-78 -
SCHEDULE III – SUPPLEMENTAL SCHEDULE OF INVESTMENT PROPERTY INFORMATION
The table below presents the partnership’s number of commercial properties, the related fair value, debt obligations, weighted average year of acquisition and weighted average year of construction by asset class as of December 31, 2019.
| Dec. 31, 2019 | ||||||||||
Number of properties | Fair value(1) | Debt(2) | Weighted average year of acquisition | Weighted average year of construction(3) | ||||||
| (US$ millions, except where noted) | ||||||||||
| Core Office | ||||||||||
| United States | 35 | $ | 14,889 | $ | 8,286 | 2004 | 1985 | |||
| Canada | 24 | 4,552 | 2,079 | 2002 | 1993 | |||||
| Australia | 8 | 1,881 | 1,273 | 2011 | 2008 | |||||
| Europe | 3 | 910 | 1,883 | 2019 | 2016 | |||||
| Brazil | 2 | 361 | 74 | 2014 | 2014 | |||||
| 72 | 22,593 | 13,595 | 2005 | 1990 | ||||||
| Core Retail | 62 | 21,530 | 10,305 | 2018 | 1975 | |||||
| Opportunistic Office | 112 | 8,051 | 4,928 | 2016 | 1994 | |||||
| Opportunistic Retail | 36 | 2,812 | 1,565 | 2015 | 1980 | |||||
| Logistics | 1 | 84 | 46 | 2018 | 2018 | |||||
| Multifamily | 49 | 2,853 | 2,146 | 2016 | 1996 | |||||
Triple Net Lease(4) | 260 | 4,357 | 3,171 | 2015 | 1992 | |||||
| Self-storage | 100 | 991 | 676 | 2017 | 2002 | |||||
| Student Housing | 50 | 2,445 | 1,567 | 2017 | 2012 | |||||
| Manufactured Housing | 136 | 2,446 | 1,218 | 2017 | 1974 | |||||
Mixed-Use(1) | 7 | 2,612 | 1,823 | 2016 | 2010 | |||||
| Total | 885 | 70,774 | 41,040 | 2013 | 1987 | |||||
(1) | Excludes development properties and land/parking lots with a fair value of $3,986 million. |
(2) | Excludes debt related to development properties and land in the amount of $338 million, unsecured and corporate facilities of $8,108 million and debt on hospitality assets of $6,323 million. |
(3) | Weighted against the fair value of the properties at December 31, 2019. |
(4) | Excludes land and parking lots. |
- F-79 -