Exhibit 99.2
MANAGEMENT’S DISCUSSION AND ANALYSIS
Management's discussion and analysis (“MD&A”) is dated October 25, 2022 and should be read in conjunction with the unaudited consolidated financial statements for the period ended September 30, 2022 and the audited consolidated financial statements for the year ended December 31, 2021 for a full understanding of the financial position and results of operations of Crescent Point Energy Corp. (the “Company” or “Crescent Point”).
The unaudited consolidated financial statements and comparative information for the period ended September 30, 2022 have been prepared in accordance with International Financial Reporting Standards (“IFRS”), specifically International Accounting Standard ("IAS") 34, Interim Financial Reporting, as issued by the International Accounting Standards Board ("IASB").
STRUCTURE OF THE BUSINESS
The principal undertaking of Crescent Point is to carry on the business of acquiring, developing and holding interests in petroleum and natural gas properties and assets related thereto through a general partnership and wholly owned subsidiaries. Amounts in this MD&A are in Canadian dollars unless noted otherwise. References to “US$” and "US dollars" are to United States (“U.S.”) dollars.
Overview
The Company reported adjusted funds flow from operations of $576.5 million, adjusted net earnings from operations of $242.9 million, net income of $466.4 million and generated $233.7 million of excess cash flow during the quarter. The Company reduced net debt by $269.6 million, exiting the quarter with a net debt balance of approximately $1.20 billion and a net debt to adjusted funds flow from operations ratio of 0.6 times. Strong operational execution continued during the third quarter with production averaging 133,019 boe/d and development expenditures of $308.5 million with 76 (70.7 net) wells drilled.
On July 6, 2022, the Company closed the sale of its non-core Saskatchewan Viking assets for cash proceeds of approximately $244.1 million, including closing adjustments. The assets had a net carrying value of $220.8 million, resulting in a gain of $23.3 million. On August 31, 2022, the Company completed the acquisition of certain Kaybob Duvernay assets for cash consideration of $87.0 million, further strengthening its position in the area. The Company revised its 2022 development capital expenditures guidance to $950.0 million from $875.0 to $900.0 million. This increase reflects a higher inflationary cost environment and the Company's decision to maintain an active drilling rig in its Kaybob Duvernay and North Dakota plays where it is ahead of schedule on its 2022 drilling program. Crescent Point remains on track to meet its 2022 annual average production guidance, which is now at the mid-point of its prior range of 130,000 to 134,000 boe/d.
In July the Company announced an updated return of capital framework targeting the return of up to 50 percent of discretionary excess cash flow, in addition to its base dividend. During the third quarter the Company repurchased 8.2 million common shares for aggregate consideration of $75.1 million, and subsequent to the quarter declared a special dividend of $0.035 per share payable on November 14, 2022. The third quarter share repurchases and special dividend total approximately 50 percent of third quarter discretionary excess cash flow of $188.8 million, in-line with the Company's return of capital framework. In addition, subsequent to the quarter, the Company declared a quarterly base dividend of $0.08 per share payable on January 3, 2023.
Adjusted funds flow from operations, adjusted net earnings from operations, net debt, net debt to adjusted funds flow from operations, excess cash flow and discretionary excess cash flow are specified financial measures that do not have any standardized meaning prescribed by IFRS and, therefore, may not be comparable with the calculation of similar measures presented by other entities. Refer to the Specified Financial Measures section in this MD&A for further information.
Results of Operations
Production
| | | | | | | | | | | | | | | | | | | | | | | | | | | | | | | | | | | | | | |
| Three months ended September 30 | | Nine months ended September 30 | |
| 2022 | | 2021 | | % Change | | 2022 | | 2021 | | % Change | |
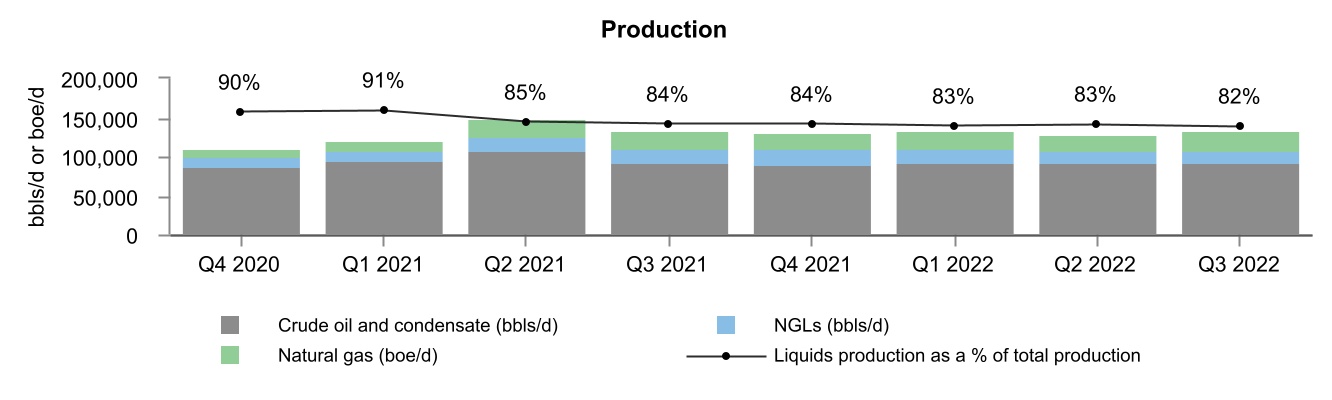
| Crude oil and condensate (bbls/d) | 91,762 | | | 92,206 | | | — | | | 91,989 | | | 98,298 | | | (6) | | |
| NGLs (bbls/d) | 17,198 | | | 18,176 | | | (5) | | | 16,793 | | | 16,719 | | | — | | |
| Natural gas (mcf/d) | 144,356 | | | 130,823 | | | 10 | | | 137,277 | | | 110,604 | | | 24 | | |
| Total (boe/d) | 133,019 | | | 132,186 | | | 1 | | | 131,662 | | | 133,451 | | | (1) | | |
| Crude oil and liquids (%) | 82 | | | 84 | | | (2) | | | 83 | | | 86 | | | (3) | | |
| Natural gas (%) | 18 | | | 16 | | | 2 | | | 17 | | | 14 | | | 3 | | |
| Total (%) | 100 | | | 100 | | | — | | | 100 | | | 100 | | | — | | |
| | | | | |
| CRESCENT POINT ENERGY CORP. | 1 |
The following is a summary of Crescent Point's production by area:
| | | | | | | | | | | | | | | | | | | | | | | | | | | | | | | | | | | | | | |
| Three months ended September 30 | | Nine months ended September 30 | |
| Production By Area (boe/d) | 2022 | | 2021 | | % Change | | 2022 | | 2021 | | % Change | |
| Saskatchewan | 66,382 | | | 75,856 | | | (12) | | | 69,842 | | | 82,655 | | | (16) | | |
| Alberta | 47,661 | | | 39,521 | | | 21 | | | 43,598 | | | 30,000 | | | 45 | | |
| North Dakota | 18,976 | | | 16,809 | | | 13 | | | 18,222 | | | 20,796 | | | (12) | | |
| Total | 133,019 | | | 132,186 | | | 1 | | | 131,662 | | | 133,451 | | | (1) | | |
Total production averaged 133,019 boe/d during the third quarter of 2022 compared to 132,186 boe/d for the third quarter of 2021. The increase is primarily due to growth in the Kaybob Duvernay as a result of the Company's successful development capital program, partially offset by the disposition of non-core Saskatchewan Viking assets in July 2022.
The Company's production averaged 131,662 boe/d for the nine months ended September 30, 2022 compared to 133,451 boe/d for the same period of 2021. The decrease is primarily due to non-core asset dispositions in southeast Saskatchewan in June 2021 and the Saskatchewan Viking disposition in July 2022, along with the effect of lower capital spending levels in 2021. Decreased production in the nine months ended September 30, 2022 was partially offset by the Kaybob Duvernay acquisition in the second quarter of 2021 and continued production growth in this area throughout 2022.
The Company's weighting to crude oil and liquids production in the three and nine months ended September 30, 2022 decreased by 2 percent and 3 percent, respectively. The decreases were primarily due to higher natural gas production as a result of production growth in the Kaybob Duvernay area and the dispositions of oil weighted assets in southeast Saskatchewan and the Saskatchewan Viking.
Exhibit 1
Marketing and Prices
| | | | | | | | | | | | | | | | | | | | | | | | | | | | | | | | | | | | | | |
| Three months ended September 30 | | Nine months ended September 30 | |
Average Selling Prices (1) | 2022 | | 2021 | | % Change | | 2022 | | 2021 | | % Change | |
| Crude oil and condensate ($/bbl) | 111.46 | | | 82.45 | | | 35 | | | 119.81 | | | 74.54 | | | 61 | | |
| NGLs ($/bbl) | 43.83 | | | 45.24 | | | (3) | | | 47.33 | | | 40.12 | | | 18 | | |
| Natural gas ($/mcf) | 6.55 | | | 4.29 | | | 53 | | | 6.69 | | | 4.07 | | | 64 | | |
| Total ($/boe) | 89.66 | | | 67.99 | | | 32 | | | 96.72 | | | 63.30 | | | 53 | | |
(1)The average selling prices reported are before realized commodity derivatives and transportation.
| | | | | |
| CRESCENT POINT ENERGY CORP. | 2 |
| | | | | | | | | | | | | | | | | | | | | | | | | | | | | | | | | | | | | | |
| Three months ended September 30 | | Nine months ended September 30 | |
| Benchmark Pricing | 2022 | | 2021 | | % Change | | 2022 | | 2021 | | % Change | |
| Crude Oil Prices | | | | | | | | | | | | |
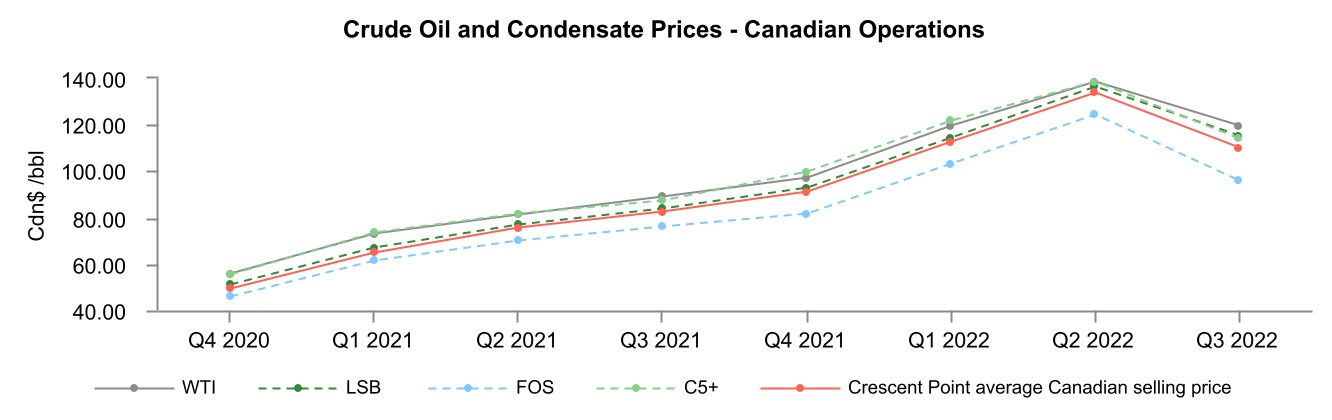
WTI crude oil (US$/bbl) (1) | 91.64 | | | 70.55 | | | 30 | | | 98.14 | | | 64.85 | | | 51 | | |
| WTI crude oil (Cdn$/bbl) | 119.63 | | | 88.97 | | | 34 | | | 125.82 | | | 81.16 | | | 55 | | |
| Crude Oil and Condensate Differentials | | | | | | | | | | | | |
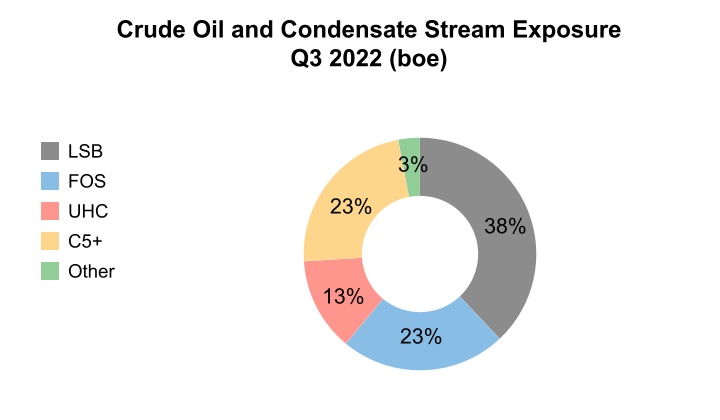
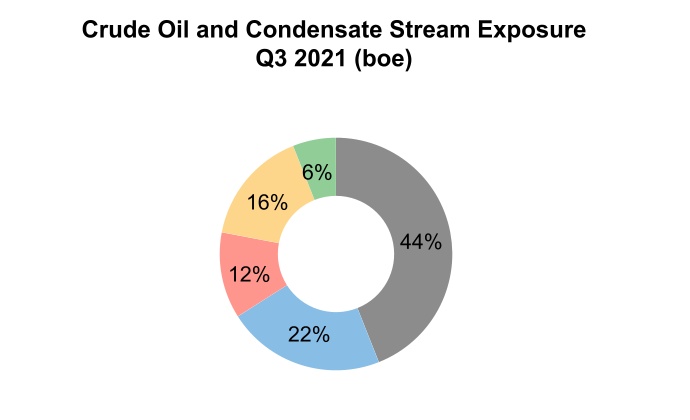
LSB crude oil (Cdn$/bbl) (2) | (4.61) | | | (5.32) | | | (13) | | | (3.85) | | | (5.24) | | | (27) | | |
FOS crude oil (Cdn$/bbl) (3) | (23.72) | | | (12.96) | | | 83 | | | (18.13) | | | (12.05) | | | 50 | | |
UHC crude oil (US$/bbl) (4) | 5.11 | | | 0.06 | | | 8,417 | | | 3.65 | | | (0.44) | | | (930) | | |
C5+ condensate (Cdn$/bbl) (5) | (5.63) | | | (1.68) | | | 235 | | | (1.14) | | | (0.34) | | | 235 | | |
| Natural Gas Prices | | | | | | | | | | | | |
AECO daily spot natural gas (Cdn$/mcf) (6) | 4.16 | | | 3.59 | | | 16 | | | 5.38 | | | 3.27 | | | 65 | | |
| AECO monthly index natural gas (Cdn$/mcf) | 5.81 | | | 3.54 | | | 64 | | | 5.56 | | | 3.11 | | | 79 | | |
NYMEX natural gas (US$/mmbtu) (7) | 8.18 | | | 4.01 | | | 104 | | | 6.77 | | | 3.18 | | | 113 | | |
| Foreign Exchange Rate | | | | | | | | | | | | |
| Exchange rate (US$/Cdn$) | 0.766 | | | 0.793 | | | (3) | | | 0.780 | | | 0.799 | | | (2) | | |
(1)WTI refers to the West Texas Intermediate crude oil price.
(2)LSB refers to the Light Sour Blend crude oil price.
(3)FOS refers to the Fosterton crude oil price, which typically receives a premium to the Western Canadian Select price.
(4)UHC refers to the Sweet at Clearbrook crude oil price.
(5)C5+ condensate refers to the Canadian C5+ condensate index.
(6)AECO refers to the Alberta Energy Company natural gas price.
(7)NYMEX refers to the New York Mercantile Exchange natural gas price.
Benchmark crude oil prices strengthened in the three and nine months ended September 30, 2022 compared to the same periods in 2021, primarily due to recovery in global demand from the impacts of the COVID-19 pandemic coupled with OPEC's inability to increase supply as planned. The Russian invasion of Ukraine and official European Union bans on waterborne Russian crude also put further pressure on supply and global inventory levels. The increase in demand has been partially offset by the effect of the release of crude oil from the Strategic Petroleum Reserve ("S.P.R.") by the U.S. government and widespread recessionary fears.
U.S. natural gas prices strengthened in the three and nine months ended September 30, 2022 compared to the same periods in 2021, primarily due to the escalation of the Russian invasion of Ukraine and resulting European sanctions, which spurred incremental strength in global gas prices and further demand for natural gas.
During the third quarter of 2022, Alberta gas prices remained higher than the previous year, however reduced takeaway capacity from pipeline maintenance put downward pressure on prices during the quarter resulting in a wider AECO differential to NYMEX.
Exhibit 2
LSB and UHC crude oil differentials improved in the three and nine months ended September 30, 2022 compared to the same periods in 2021, primarily due to planned maintenance of oil sands upgraders, which removed significant light oil supply from the market. FOS crude oil differentials widened in the three and nine months ended September 30, 2022 compared to the same periods in 2021, primarily due to discounted Western Canadian Select in the U.S. Gulf Coast as a result of the S.P.R release.
Condensate differentials weakened in the three and nine months ended September 30, 2022 compared to the same period of 2021, primarily due to depressed naphtha pricing in the U.S. Gulf Coast, which competes directly with Canadian C5+.
| | | | | |
| CRESCENT POINT ENERGY CORP. | 3 |
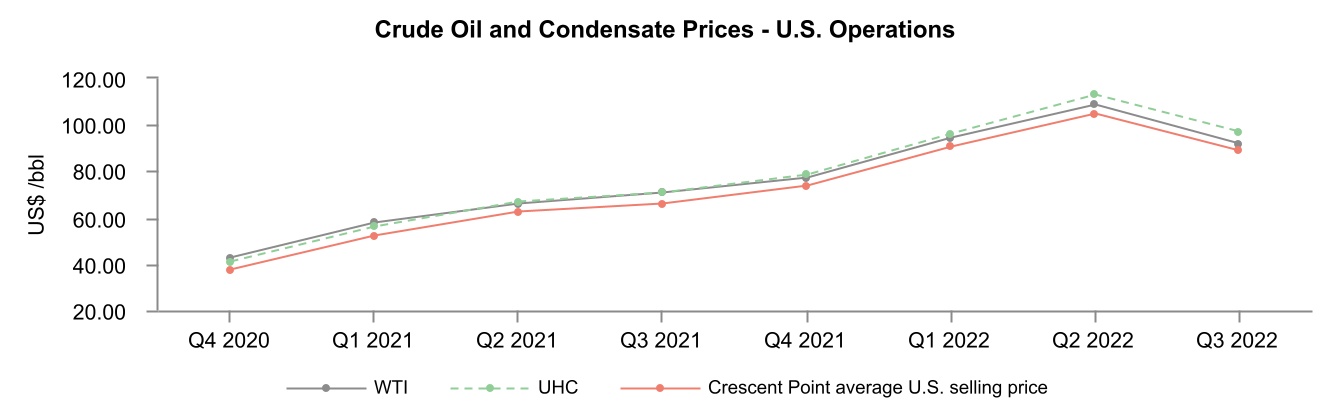
For the three months ended September 30, 2022, the Company's average selling price for crude oil and condensate increased 35 percent from the same period in 2021, primarily due to a 34 percent increase in the Cdn$ WTI benchmark price. For the nine months ended September 30, 2022, the company's average selling price for crude oil and condensate increased 61 percent, primarily due to a 55 percent increase in the Cdn$ WTI benchmark price and a narrower corporate oil price differential.
Crescent Point's corporate crude oil and condensate differential relative to Cdn$ WTI for the three months ended September 30, 2022 was $8.17 per bbl compared to $6.52 per bbl in the same period of 2021. The wider corporate oil differential was primarily due to weaker FOS and C5+ differentials, partially offset by improved UHC prices.
Crescent Point's corporate crude oil and condensate differential relative to Cdn$ WTI for the nine months ended September 30, 2022 was $6.01 per bbl compared to $6.62 per bbl in the same period of 2021. The narrower differential was driven by stronger UHC and LSB prices, partially offset by weaker FOS and C5+ differentials.
For the three months ended September 30, 2022, the Company's average selling price for NGLs remained relatively consistent with the same period in 2021. For the nine months ended September 30, 2022, the Company's average selling price for NGLs increased from $40.12 per bbl to $47.33 per bbl, from the same period in 2021. The average selling prices increased as a result of improved US$ WTI, propane and butane benchmark prices for the nine months ended September 30, 2022.
The Company's average selling price for natural gas for the three and nine months ended September 30, 2022 increased 53 percent and 64 percent, respectively, compared to the same periods in 2021, primarily as a result of the increases in the AECO daily and NYMEX benchmark prices. The Company's Canadian gas production generally trades at a slight premium to AECO pricing.
Exhibit 3
Exhibit 4
Commodity Derivatives
Management of cash flow variability is an integral component of Crescent Point's business strategy. Crescent Point regularly monitors changing business and market conditions while executing its strategic risk management program. Crescent Point proactively manages the risk exposure inherent in movements in the price of crude oil, propane, natural gas, interest rates, the Company's share price and the US/Cdn dollar exchange rate through the use of derivatives with investment-grade counterparties.
| | | | | |
| CRESCENT POINT ENERGY CORP. | 4 |
The Company's crude oil and NGL derivatives are referenced to WTI and Conway C3, respectively. The Company's natural gas derivatives are referenced to NYMEX and the AECO monthly index. Crescent Point utilizes a variety of derivatives, including swaps, collars and put options, to protect against downward commodity price movements while also providing the opportunity for some upside participation during periods of rising prices. This reduces the volatility of the selling price of crude oil and natural gas production and provides a measure of stability to the Company's cash flow. See Note 18 – "Financial Instruments and Derivatives" in the unaudited consolidated financial statements for the period ended September 30, 2022 for additional information on the Company's derivatives.
The following is a summary of the realized commodity derivative losses:
| | | | | | | | | | | | | | | | | | | | | | | | | | | | | | | | | | | | | | |
| Three months ended September 30 | | Nine months ended September 30 | |
| ($ millions, except volume amounts) | 2022 | | 2021 | | % Change | | 2022 | | 2021 | | % Change | |
Average crude oil volumes hedged (bbls/d) (1) | 41,750 | | | 42,832 | | | (3) | | | 45,065 | | | 51,892 | | | (13) | | |
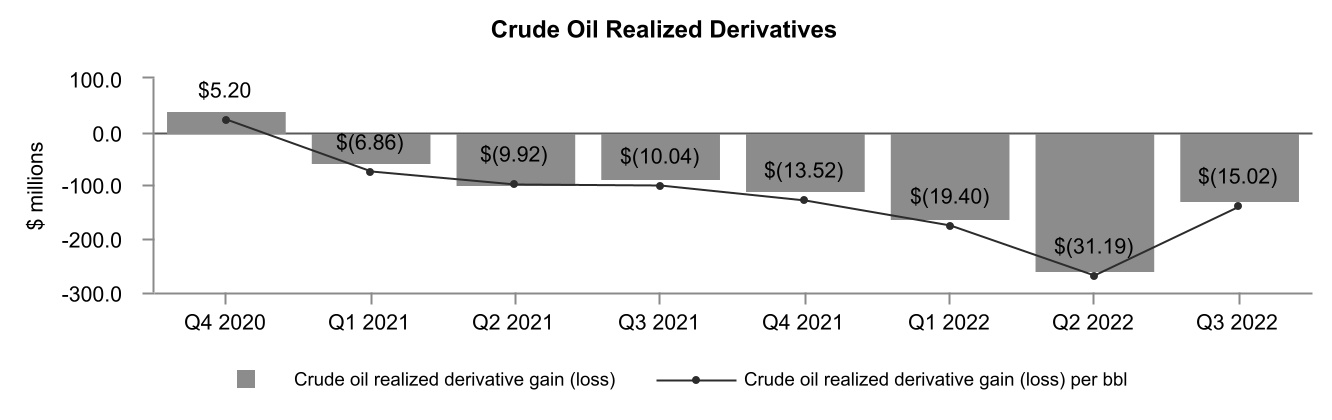
Crude oil realized derivative loss (1) | (126.8) | | | (85.2) | | | 49 | | | (548.1) | | | (241.0) | | | 127 | | |
| per bbl | (15.02) | | | (10.04) | | | 50 | | | (21.83) | | | (8.98) | | | 143 | | |
| Average NGL volumes hedged (bbls/d) | 500 | | | — | | | 100 | | | 500 | | | — | | | 100 | | |
| NGL realized derivative loss | (0.2) | | | — | | | (100) | | | (1.2) | | | — | | | (100) | | |
| per bbl | (0.09) | | | — | | | (100) | | | (0.26) | | | — | | | (100) | | |
Average natural gas volumes hedged (GJ/d) (2) (3) | 30,000 | | | 45,000 | | | (33) | | | 31,642 | | | 33,278 | | | (5) | | |
Natural gas realized derivative gain (loss) (3) | 6.8 | | | (3.0) | | | (327) | | | 3.1 | | | (4.6) | | | (167) | | |
| per GJ | 0.51 | | | (0.25) | | | (304) | | | 0.08 | | | (0.15) | | | (153) | | |
Average barrels of oil equivalent hedged (boe/d) (1) (3) | 46,989 | | | 49,941 | | | (6) | | | 50,563 | | | 57,149 | | | (12) | | |
Total realized commodity derivative losses (1) (3) | (120.2) | | | (88.2) | | | 36 | | | (546.2) | | | (245.6) | | | 122 | | |
| per boe | (9.82) | | | (7.26) | | | 35 | | | (15.20) | | | (6.74) | | | 126 | | |
(1)The crude oil realized derivative loss for the three and nine months ended September 30, 2022 and September 30, 2021 includes the realized derivative gains and losses on financial crude oil price differential contracts. The average crude oil volumes hedged and average barrels of oil equivalent hedged do not include the hedged volumes related to financial crude oil price differential contracts.
(2)GJ/d is defined as gigajoules per day.
(3)The natural gas derivative gain for the three and nine months ended September 30, 2022 includes the realized derivative gains on financial natural gas price differential contracts. The average natural gas volumes hedged and average barrels of oil equivalent hedged do not include the hedged volumes related to financial natural gas price differentials contracts.
The Company's realized derivative losses for crude oil were $126.8 million and $548.1 million for the three and nine months ended September 30, 2022, respectively, compared to $85.2 million and $241.0 million for the same periods in 2021. The increased realized derivative losses were primarily attributable to the increase in the Cdn$ WTI benchmark price.
The Company's realized derivative losses for NGLs were $0.2 million and $1.2 million for the three and nine months ended September 30, 2022, respectively, compared to nil for the same periods of 2021. The losses in 2022 were due to increases in the Conway C3 benchmark prices compared to the Company's average derivative NGL prices.
Crescent Point's realized derivative gains for natural gas were $6.8 million and $3.1 million for the three and nine months ended September 30, 2022, respectively, compared to losses of $3.0 million and $4.6 million for the same periods in 2021. The gains relate to the Company's financial natural gas differential contracts as a result of the wider AECO to NYMEX differential. The derivative gains in 2022 on differential contracts were partially offset by losses on AECO benchmark derivative contracts, primarily as a result of the higher AECO monthly index price.
Exhibit 5
| | | | | |
| CRESCENT POINT ENERGY CORP. | 5 |
The following is a summary of the Company's unrealized commodity derivative gains (losses):
| | | | | | | | | | | | | | | | | | | | | | | | | | | | | | | | | | | | | | |
| Three months ended September 30 | | Nine months ended September 30 | |
| ($ millions) | 2022 | | 2021 | | % Change | | 2022 | | 2021 | | % Change | |
Crude oil (1) | 269.0 | | | (18.6) | | | (1,546) | | | 78.4 | | | (203.4) | | | (139) | | |
NGL (1) | 0.6 | | | (1.7) | | | (135) | | | (0.1) | | | (1.7) | | | (94) | | |
| Natural gas | 14.1 | | | (1.8) | | | (883) | | | 21.8 | | | (8.8) | | | (348) | | |
| Total unrealized commodity derivative gains (losses) | 283.7 | | | (22.1) | | | (1,384) | | | 100.1 | | | (213.9) | | | (147) | | |
(1)Comparative period revised to reflect current period presentation.
During the third quarter of 2022, the Company recognized a total unrealized derivative gain of $283.7 million on its commodity contracts compared to a total unrealized derivative loss of $22.1 million in the same period of 2021, primarily attributable to the position of crude oil derivative contracts as a result of the decrease in Cdn$ WTI forward benchmark prices at September 30, 2022 compared to June 30, 2022 and the maturity of out-of-the-money contracts during the quarter.
In the nine months ended September 30, 2022, the Company recognized a total unrealized derivative gain of $100.1 million on its commodity contracts compared to a total unrealized derivative loss of $213.9 million in the same period of 2021. The unrealized derivative gain in 2022 was primarily attributable to the maturity of out-of-the-money derivative contracts, partially offset by an increase in the Cdn$ WTI forward benchmark prices at September 30, 2022 compared to December 31, 2021.
Oil and Gas Sales
| | | | | | | | | | | | | | | | | | | | | | | | | | | | | | | | | | | | | | |
| Three months ended September 30 | | Nine months ended September 30 | |
($ millions) (1) | 2022 | | 2021 | | % Change | | 2022 | | 2021 | | % Change | |
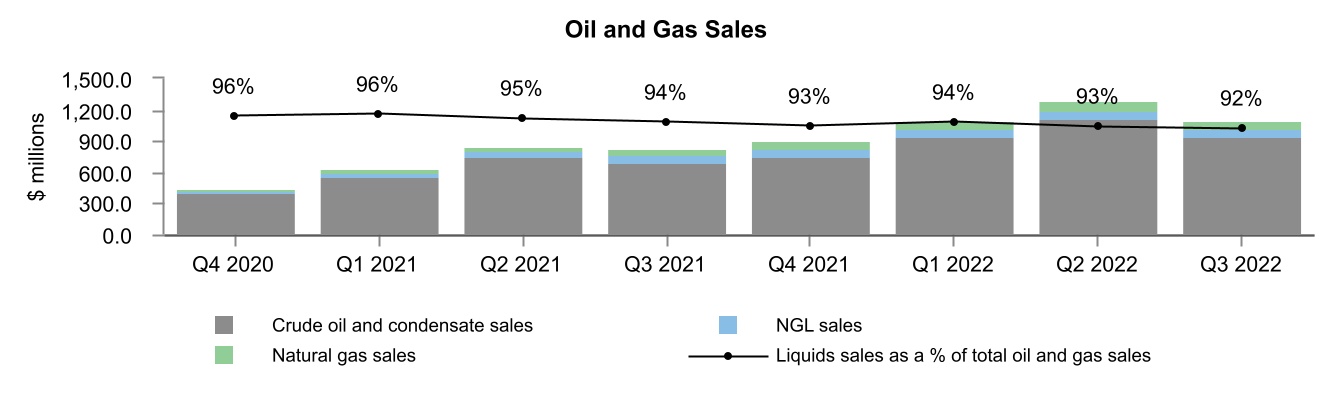
| Crude oil and condensate sales | 940.9 | | | 699.4 | | | 35 | | | 3,008.8 | | | 2,000.2 | | | 50 | | |
| NGL sales | 69.4 | | | 75.6 | | | (8) | | | 217.0 | | | 183.1 | | | 19 | | |
| Natural gas sales | 87.0 | | | 51.7 | | | 68 | | | 250.7 | | | 122.8 | | | 104 | | |
| Total oil and gas sales | 1,097.3 | | | 826.7 | | | 33 | | | 3,476.5 | | | 2,306.1 | | | 51 | | |
(1)Oil and gas sales are reported before realized commodity derivatives.
Total oil and gas sales increased by 33 percent and 51 percent in the three and nine months ended September 30, 2022, respectively, compared to the same periods in 2021. The increases were primarily due to the increase in realized crude oil and natural gas prices.
Exhibit 6
Royalties
| | | | | | | | | | | | | | | | | | | | | | | | | | | | | | | | | | | | | | |
| Three months ended September 30 | | Nine months ended September 30 | |
| ($ millions, except % and per boe amounts) | 2022 | | 2021 | | % Change | | 2022 | | 2021 | | % Change | |
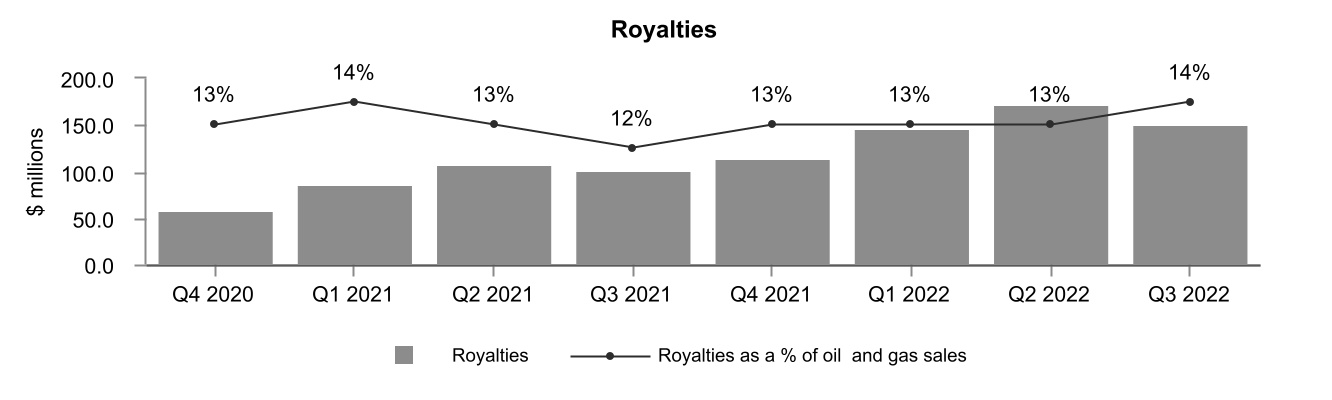
| Royalties | 150.9 | | | 101.5 | | | 49 | | | 470.0 | | | 294.0 | | | 60 | | |
| As a % of oil and gas sales | 14 | | | 12 | | | 2 | | | 14 | | | 13 | | | 1 | | |
| Per boe | 12.33 | | | 8.35 | | | 48 | | | 13.08 | | | 8.07 | | | 62 | | |
Royalties increased 49 percent and 60 percent in the three and nine months ended September 30, 2022, respectively, compared to the same 2021 periods. This increase was largely due to the increase in oil and gas sales in both periods. Royalties as a percentage of oil and gas sales increased in the three and nine months ended September 30, 2022, reflecting higher benchmark oil and gas prices which increased crown royalty rates.
| | | | | |
| CRESCENT POINT ENERGY CORP. | 6 |
Exhibit 7
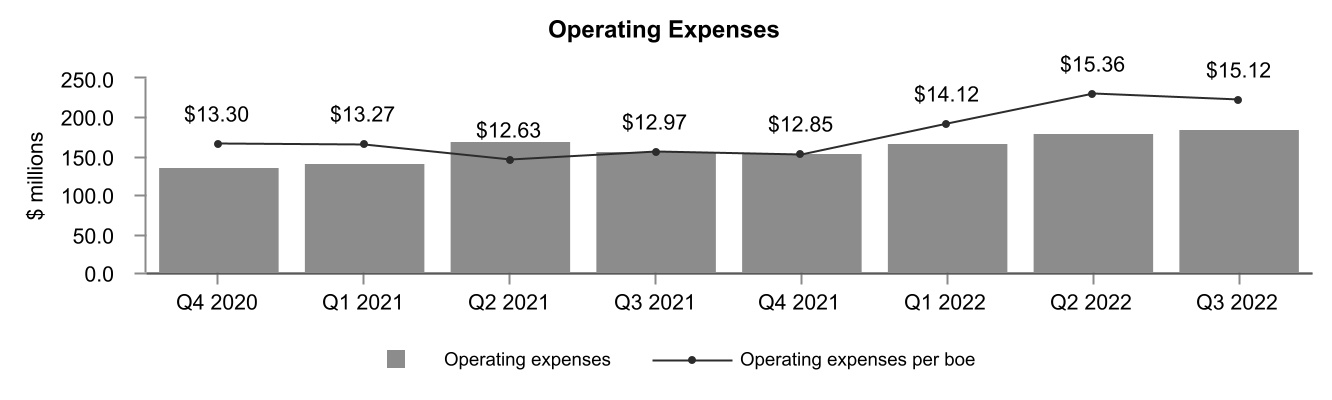
Operating Expenses
| | | | | | | | | | | | | | | | | | | | | | | | | | | | | | | | | | | | | | |
| Three months ended September 30 | | Nine months ended September 30 | |
| ($ millions, except per boe amounts) | 2022 | | 2021 | | % Change | | 2022 | | 2021 | | % Change | |
| Operating expenses | 185.0 | | | 157.7 | | | 17 | | | 534.2 | | | 471.1 | | | 13 | | |
| Per boe | 15.12 | | | 12.97 | | | 17 | | | 14.86 | | | 12.93 | | | 15 | | |
Operating expenses increased 17 percent and 13 percent in the three and nine months ended September 30, 2022, respectively, compared to the same periods in 2021. The increases were primarily attributable to general inflationary pressures across multiple cost categories, including third party processing fees, electricity rates, labour, fuel and trucking expenditures. As a result of stronger commodity prices, the Company also increased its well servicing and maintenance activity levels. On a per boe basis, operating costs increased 17 percent and 15 percent in the three and nine months ended September 30, 2022, respectively, compared to the same periods in 2021.
The Company has revised its annual operating expense guidance for 2022 due to the anticipated impacts of inflationary pressures on operating costs. Refer to the Guidance section of this MD&A for further information.
Exhibit 8
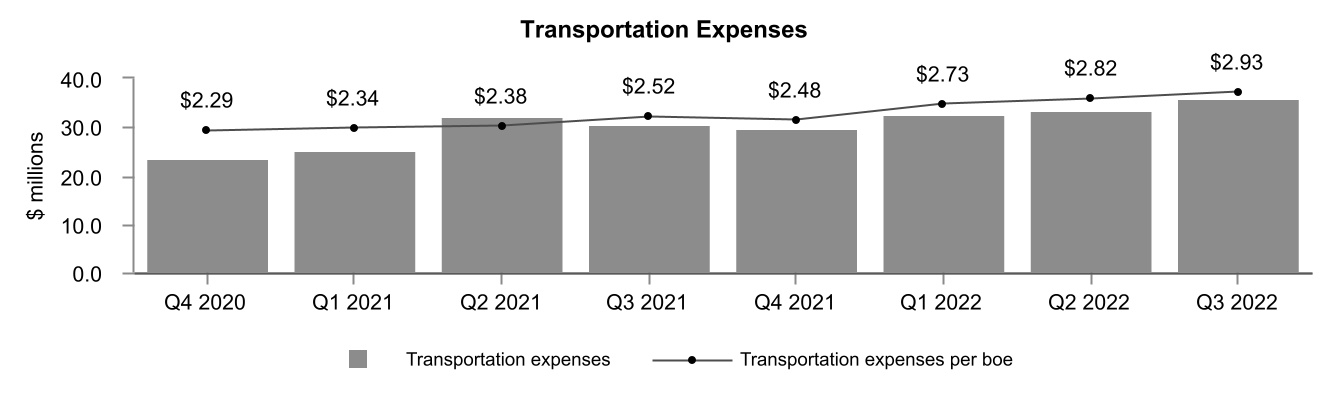
Transportation Expenses
| | | | | | | | | | | | | | | | | | | | | | | | | | | | | | | | | | | | | | |
| Three months ended September 30 | | Nine months ended September 30 | |
| ($ millions, except per boe amounts) | 2022 | | 2021 | | % Change | | 2022 | | 2021 | | % Change | |
| Transportation expenses | 35.9 | | | 30.6 | | | 17 | | | 101.7 | | | 87.9 | | | 16 | | |
| Per boe | 2.93 | | | 2.52 | | | 16 | | | 2.83 | | | 2.41 | | | 17 | | |
Transportation expenses increased 17 percent and 16 percent in the three and nine months ended September 30, 2022, respectively, compared to the same periods in 2021, primarily due to higher pipeline tolls and tariffs and increased trucking activity. On a per boe basis, transportation expenses increased by $0.41 per boe and $0.42 per boe in the three and nine months ended September 30, 2022, respectively, compared to the same periods in 2021.
| | | | | |
| CRESCENT POINT ENERGY CORP. | 7 |
Exhibit 9
Netback
| | | | | | | | | | | | | | | | | | | | | | | | | | | | | | | | | | | | | | |
| Three months ended September 30 | | Nine months ended September 30 | |
| 2022 | | 2021 | | | | 2022 | | 2021 | | | |
| Total (2) ($/boe) | | Total (2) ($/boe) | | % Change | | Total (2) ($/boe) | | Total (2) ($/boe) | | % Change | |
| Oil and gas sales | 89.66 | | | 67.99 | | | 32 | | | 96.72 | | | 63.30 | | | 53 | | |
| Royalties | (12.33) | | | (8.35) | | | 48 | | | (13.08) | | | (8.07) | | | 62 | | |
| Operating expenses | (15.12) | | | (12.97) | | | 17 | | | (14.86) | | | (12.93) | | | 15 | | |
| Transportation expenses | (2.93) | | | (2.52) | | | 16 | | | (2.83) | | | (2.41) | | | 17 | | |
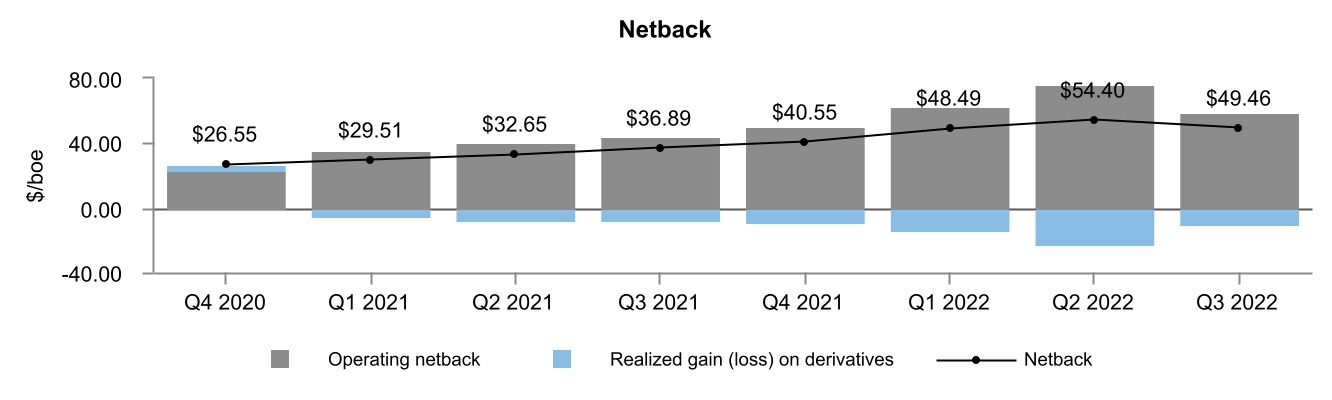
Operating netback (1) | 59.28 | | | 44.15 | | | 34 | | | 65.95 | | | 39.89 | | | 65 | | |
| Realized loss on commodity derivatives | (9.82) | | | (7.26) | | | 35 | | | (15.20) | | | (6.74) | | | 126 | | |
Netback (1) | 49.46 | | | 36.89 | | | 34 | | | 50.75 | | | 33.15 | | | 53 | | |
(1)Specified financial measure that does not have any standardized meaning prescribed by IFRS and, therefore, may not be comparable with the calculation of similar measures presented by other entities. Refer to the Specified Financial Measures section in this MD&A for further information.
(2)The dominant production category for the Company's properties is crude oil and condensate. These properties include associated natural gas and NGL volumes, therefore, the total operating netback and netback have been presented.
The Company's operating netback for the three and nine months ended September 30, 2022 increased significantly to $59.28 per boe and $65.95 per boe, respectively, from $44.15 per boe and $39.89 per boe in the same periods of 2021. The increases in the Company's operating netback were primarily due to the increase in average selling price, partially offset by higher royalties and the increases in operating and transportation expenses. The increases in the Company's netback was a result of the increase in the operating netback, partially offset by an increased realized loss on commodity derivatives.
Exhibit 10
| | | | | |
| CRESCENT POINT ENERGY CORP. | 8 |
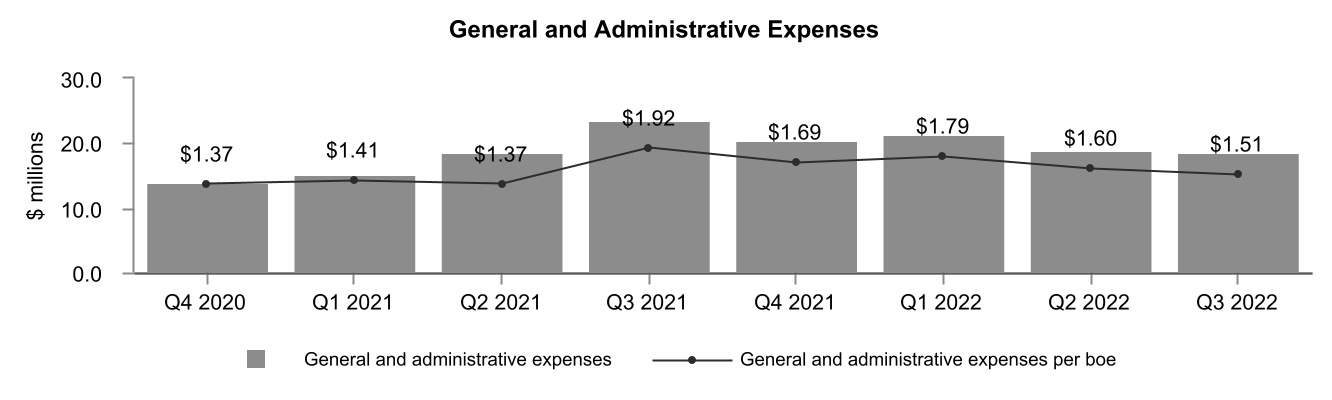
General and Administrative Expenses
| | | | | | | | | | | | | | | | | | | | | | | | | | | | | | | | | | | | | | |
| Three months ended September 30 | | Nine months ended September 30 | |
| ($ millions, except per boe amounts) | 2022 | | 2021 | | % Change | | 2022 | | 2021 | | % Change | |
| Gross general and administrative expenses | 35.2 | | | 35.8 | | | (2) | | | 102.2 | | | 105.8 | | | (3) | | |
| Overhead recoveries | (5.7) | | | (4.5) | | | 27 | | | (15.1) | | | (14.1) | | | 7 | | |
| Capitalized | (8.1) | | | (7.5) | | | 8 | | | (25.1) | | | (22.5) | | | 12 | | |
| Total general and administrative expenses | 21.4 | | | 23.8 | | | (10) | | | 62.0 | | | 69.2 | | | (10) | | |
| Transaction costs | (2.9) | | | (0.4) | | | 625 | | | (3.3) | | | (12.2) | | | (73) | | |
| General and administrative expenses | 18.5 | | | 23.4 | | | (21) | | | 58.7 | | | 57.0 | | | 3 | | |
| Per boe | 1.51 | | | 1.92 | | | (21) | | | 1.63 | | | 1.56 | | | 4 | | |
General and administrative ("G&A") expenses and G&A per boe decreased 21 percent in the three months ended September 30, 2022 compared to the same period in 2021. The decrease in G&A is primarily attributable to one-time closure costs related to the closure of the Company's U.S. corporate office in the third quarter of 2021.
G&A expenses and G&A per boe increased 3 percent and 4 percent, respectively, in the nine months ended September 30, 2022 compared to the same period in 2021. The increases are primarily attributable to higher employee costs with the return to office and higher professional fees, partially offset by one-time U.S. corporate office closure costs in the third quarter of 2021.
Exhibit 11
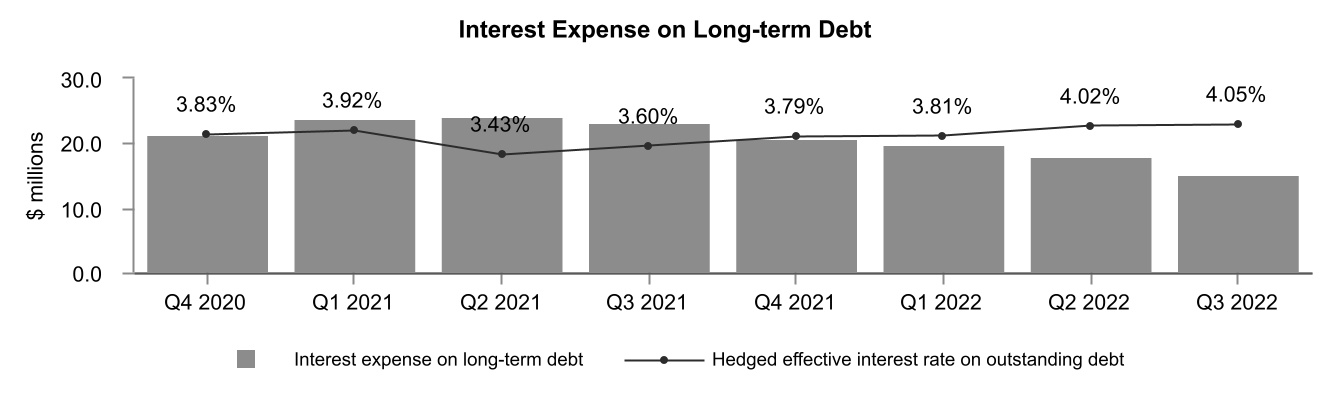
Interest Expense
| | | | | | | | | | | | | | | | | | | | | | | | | | | | | | | | | | | | | | |
| Three months ended September 30 | | Nine months ended September 30 | |
| ($ millions, except per boe amounts) | 2022 | | 2021 | | % Change | | 2022 | | 2021 | | % Change | |
| Interest expense on long-term debt | 15.3 | | | 23.2 | | | (34) | | | 53.1 | | | 71.1 | | | (25) | | |
| Unrealized gain on interest derivative contracts | (5.9) | | | (3.7) | | | 59 | | | (5.6) | | | (1.3) | | | 331 | | |
| Interest expense | 9.4 | | | 19.5 | | | (52) | | | 47.5 | | | 69.8 | | | (32) | | |
| Per boe | 0.77 | | | 1.60 | | | (52) | | | 1.32 | | | 1.92 | | | (31) | | |
Interest expense on long-term debt decreased 34 percent and 25 percent in the three and nine months ended September 30, 2022, respectively, compared to the same periods in 2021, primarily due to the Company's lower average debt balances.
At September 30, 2022, all of the Company's outstanding long-term debt had fixed interest rates.
| | | | | |
| CRESCENT POINT ENERGY CORP. | 9 |
Exhibit 12
Foreign Exchange Loss
| | | | | | | | | | | | | | | | | | | | | | | | | | | | | | | | | | | | | | |
| Three months ended September 30 | | Nine months ended September 30 | |
| ($ millions) | 2022 | | 2021 | | % Change | | 2022 | | 2021 | | % Change | |
| Realized gain on CCS - principal | — | | | 27.8 | | | (100) | | | 63.8 | | | 3.9 | | | 1,536 | | |
| Translation of US dollar long-term debt | (76.9) | | | (53.7) | | | 43 | | | (107.6) | | | 20.0 | | | (638) | | |
Unrealized gain (loss) on CCS - principal and foreign
exchange swaps | 63.4 | | | 13.3 | | | 377 | | | 20.9 | | | (31.3) | | | (167) | | |
| Other | 5.7 | | | 3.0 | | | 90 | | | 8.3 | | | 1.0 | | | 730 | | |
| Foreign exchange loss | (7.8) | | | (9.6) | | | (19) | | | (14.6) | | | (6.4) | | | 128 | | |
The Company hedges its foreign exchange exposure using a combination of cross currency swaps ("CCS") and foreign exchange swaps. During the nine months ended September 30, 2022, the Company realized a $63.8 million gain on CCS related to senior guaranteed note maturities and LIBOR loan maturities. The Company did not have any senior guaranteed note maturities or LIBOR loan maturities in the third quarter of 2022.
The Company records foreign exchange gains or losses on the period end translation of US dollar long-term debt and related accrued interest. For the three and nine months ended September 30, 2022, the Company recorded foreign exchange losses of $76.9 million and $107.6 million, respectively, which were attributed to the weaker Canadian dollar at September 30, 2022 as compared to June 30, 2022 and December 31, 2021, respectively.
For the three and nine months ended September 30, 2022, Crescent Point recorded unrealized gains on foreign exchange derivatives of $63.4 million and $20.9 million, respectively, due to the impact of the weaker forward Canadian dollar on the Company's CCS at September 30, 2022 as compared to June 30, 2022 and December 31, 2021, respectively.
Share-based Compensation Expense
| | | | | | | | | | | | | | | | | | | | | | | | | | | | | | | | | | | | | | |
| Three months ended September 30 | | Nine months ended September 30 | |
| ($ millions, except per boe amounts) | 2022 | | 2021 | | % Change | | 2022 | | 2021 | | % Change | |
| Share-based compensation costs | 2.7 | | | 10.6 | | | (75) | | | 56.1 | | | 56.5 | | | (1) | | |
| Realized gain on equity derivative contracts | (0.1) | | | — | | | (100) | | | (26.2) | | | (9.7) | | | 170 | | |
| Unrealized (gain) loss on equity derivative contracts | 3.5 | | | (1.9) | | | (284) | | | 9.3 | | | (15.4) | | | (160) | | |
| Capitalized | (1.0) | | | (1.5) | | | (33) | | | (11.0) | | | (10.6) | | | 4 | | |
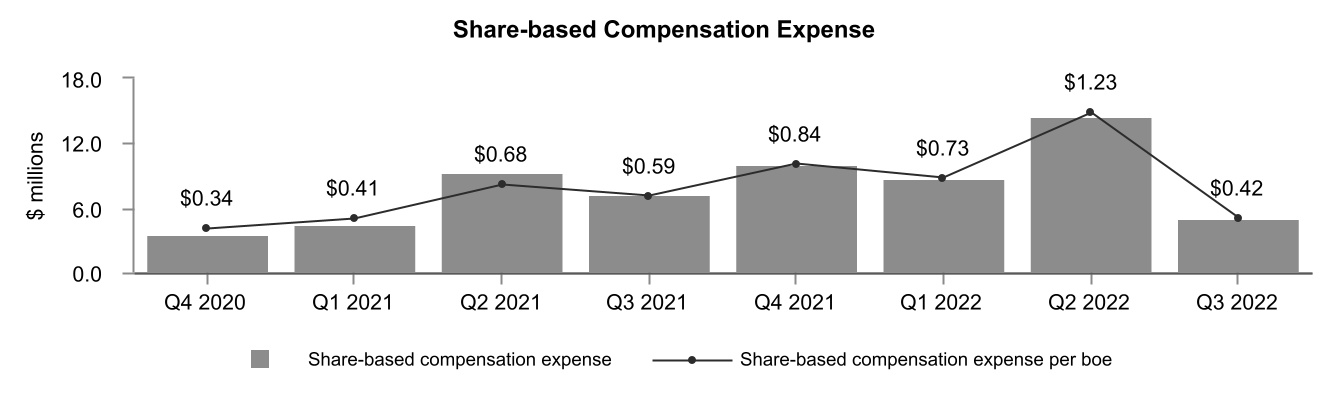
| Share-based compensation expense | 5.1 | | | 7.2 | | | (29) | | | 28.2 | | | 20.8 | | | 36 | | |
| Per boe | 0.42 | | | 0.59 | | | (29) | | | 0.78 | | | 0.57 | | | 37 | | |
During the three and nine months ended September 30, 2022, the Company recorded share-based compensation ("SBC") costs of $2.7 million and $56.1 million, respectively, compared to $10.6 million and $56.5 million in the same respective periods of 2021. The lower SBC costs in the third quarter of 2022 primarily relate to a decrease in the Company's share price at September 30, 2022 compared to June 30, 2022 and a lower number of awards outstanding during the third quarter of 2022 compared to the same period in 2021. The lower SBC costs in the first nine months of 2022 are primarily attributable to a lower number of awards outstanding, partially offset by an increase in the Company's share price at September 30, 2022 compared to December 31, 2021 and higher performance achievements associated with the Performance Share Unit ("PSU") Plan in 2022 compared to the same period in 2021.
| | | | | |
| CRESCENT POINT ENERGY CORP. | 10 |
During the three and nine months ended September 30, 2022, the Company recognized unrealized losses on equity derivative contracts of $3.5 million and $9.3 million respectively, compared to unrealized gains of $1.9 million and $15.4 million in the same respective periods of 2021. The unrealized loss in the third quarter of 2022 was primarily due to the decrease in the Company's share price at September 30, 2022 compared to June 30, 2022. In the nine months ended September 30, 2022, the unrealized loss was primarily due to the maturity of in-the-money equity derivative contracts in the first quarter of 2022, partially offset by the increase in the Company's share price at September 30, 2022 compared to December 31, 2021. In the nine months ended September 30, 2022, the Company also recognized a realized gain of $26.2 million, which was primarily due to the maturity of in-the-money equity derivative contracts in the first quarter of 2022.
Exhibit 13
The following table summarizes the number of restricted shares, Employee Share Value Plan ("ESVP") awards, Performance Share Units, Deferred Share Units ("DSUs") and stock options outstanding:
| | | | | | | | | | | | | | |
| September 30, 2022 | | December 31, 2021 | |
Restricted Share Bonus Plan (1) | 2,357,878 | | | 3,267,717 | | |
| Employee Share Value Plan | 5,316,076 | | | 8,329,291 | | |
Performance Share Unit Plan (2) | 4,119,089 | | | 3,214,620 | | |
| Deferred Share Unit Plan | 1,653,645 | | | 1,556,780 | | |
Stock Option Plan (3) | 4,233,913 | | | 5,839,464 | | |
(1)At September 30, 2022, the Company was authorized to issue up to 11,340,918 common shares (December 31, 2021 - 12,924,280 common shares).
(2)Based on underlying units before any effect of performance multipliers.
(3)At September 30, 2022, the weighted average exercise price is $4.42 per share (December 31, 2021 - $4.04 per share).
As of the date of this report, the Company had 2,244,738 restricted shares, 5,312,580 ESVP awards, 4,119,089 PSUs, 1,726,131 DSUs and 4,232,913 stock options outstanding.
Depletion, Depreciation and Amortization
| | | | | | | | | | | | | | | | | | | | | | | | | | | | | | | | | | | | | | |
| Three months ended September 30 | | Nine months ended September 30 | |
| ($ millions, except per boe amounts) | 2022 | | 2021 | | % Change | | 2022 | | 2021 | | % Change | |
| Depletion and depreciation | 246.0 | | | 203.4 | | | 21 | | | 694.0 | | | 525.0 | | | 32 | | |
| Amortization of exploration and evaluation undeveloped land | 1.2 | | | 14.3 | | | (92) | | | 12.4 | | | 41.4 | | | (70) | | |
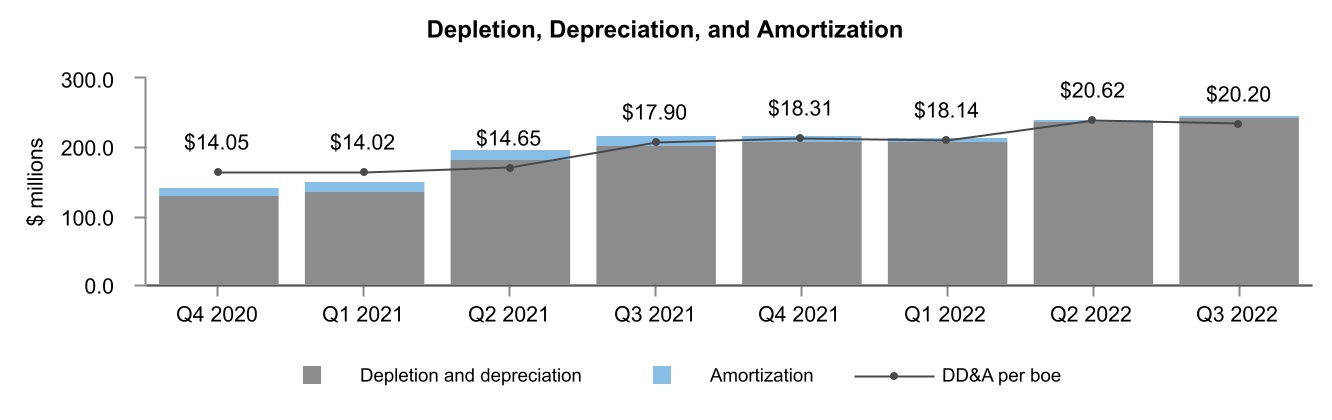
| Depletion, depreciation and amortization | 247.2 | | | 217.7 | | | 14 | | | 706.4 | | | 566.4 | | | 25 | | |
| | | | | | | | | | | | |
| | | | | | | | | | | | |
| Per boe | 20.20 | | | 17.90 | | | 13 | | | 19.65 | | | 15.55 | | | 26 | | |
For the three and nine months ended September 30, 2022, the Company's depletion, depreciation and amortization ("DD&A") rate increased to $20.20 per boe and $19.65 per boe, respectively, compared to $17.90 per boe and $15.55 per boe in the same periods in 2021. The increase in the DD&A rate per boe in the third quarter of 2022 was primarily attributable to the impairment reversal recorded in the first quarter of 2022, which increased the carrying value of the Company's property, plant and equipment ("PP&E"), partially offset by the Saskatchewan Viking disposition in July 2022. The increase in the DD&A rate per boe in the nine months ended September 30, 2022, was primarily due to the factors discussed above in the third quarter of 2022, in addition to the impairment reversal recorded in the second quarter of 2021, which increased the carrying value of the Company's PP&E.
DD&A increased 14 percent and 25 percent in the three and nine months ended September 30, 2022, respectively, compared to the same periods in 2021, primarily due to higher DD&A rates, partially offset by lower amortization of exploration and evaluation ("E&E") undeveloped land.
| | | | | |
| CRESCENT POINT ENERGY CORP. | 11 |
Exhibit 14
Impairment Reversal
| | | | | | | | | | | | | | | | | | | | | | | | | | | | | | | | | | | | | | |
| Three months ended September 30 | | Nine months ended September 30 | |
| ($ millions, except per boe amounts) | 2022 | | 2021 | | % Change | | 2022 | | 2021 | | % Change | |
| | | | | | | | | | | | |
| | | | | | | | | | | | |
| | | | | | | | | | | | |
| | | | | | | | | | | | |
| Impairment reversal | — | | | — | | | — | | | (1,484.9) | | | (2,514.4) | | | (41) | | |
| | | | | | | | | | | | |
| | | | | | | | | | | | |
| | | | | | | | | | | | |
| Per boe | — | | | — | | | — | | | (41.31) | | | (69.02) | | | (40) | | |
In the first quarter of 2022, the Company recognized an impairment reversal of $1.48 billion on its development and production assets due to the increase in forecast benchmark commodity prices at March 31, 2022 compared to June 30, 2021, which was the last time the Company completed an impairment test on its development and production assets. In the second quarter of 2021, the Company recognized an impairment reversal of $2.51 billion on its development and production assets, primarily due to the increase in forecast benchmark commodity prices at June 30, 2021. See Note 5 – "Property, Plant and Equipment" in the unaudited consolidated financial statements for the period ended September 30, 2022 for further information.
Taxes
| | | | | | | | | | | | | | | | | | | | | | | | | | | | | | | | | | | | | | |
| Three months ended September 30 | | Nine months ended September 30 | |
| ($ millions) | 2022 | | 2021 | | % Change | | 2022 | | 2021 | | % Change | |
| Current tax expense | — | | | — | | | — | | | — | | | — | | | — | | |
| Deferred tax expense | 153.4 | | | 74.3 | | | 106 | | | 601.6 | | | 604.6 | | | — | | |
Current Tax Expense
In both the three and nine months ended September 30, 2022 and September 30, 2021, the Company recorded current tax expense of nil. Refer to the Company's Annual Information Form for the year ended December 31, 2021 for information on the Company's expected tax horizon.
Deferred Tax Expense
In the three and nine months ended September 30, 2022, the Company recorded deferred tax expense of $153.4 million and $601.6 million, respectively, compared to $74.3 million and $604.6 million in the same periods of 2021. The deferred tax expense in the third quarter of 2022 primarily relates to the pre-tax income recorded in the period. The deferred tax expense in the nine months ended September 30, 2022 primarily relates to pre-tax income mainly resulting from the impairment reversal, partially offset by a change in estimate for future usable tax pools due to higher forecast commodity prices.
| | | | | |
| CRESCENT POINT ENERGY CORP. | 12 |
Cash Flow from Operating Activities, Adjusted Funds Flow from Operations, Net Income and Adjusted Net Earnings from Operations
| | | | | | | | | | | | | | | | | | | | | | | | | | | | | | | | | | | | | | |
| Three months ended September 30 | | Nine months ended September 30 | |
| ($ millions, except per share amounts) | 2022 | | 2021 | | % Change | | 2022 | | 2021 | | % Change | |
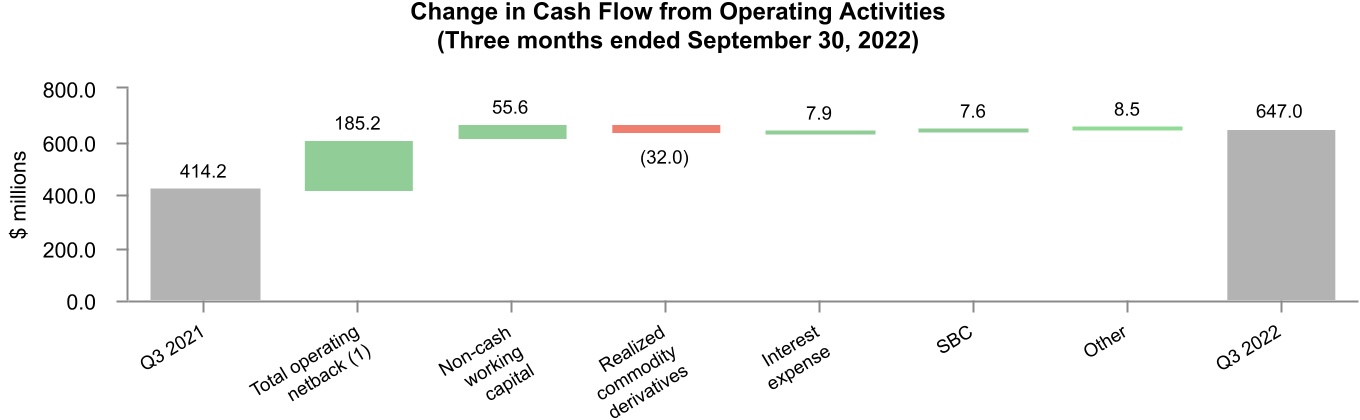
| Cash flow from operating activities | 647.0 | | | 414.2 | | | 56 | | | 1,602.7 | | | 1,003.4 | | | 60 | | |
| | | | | | | | | | | | |
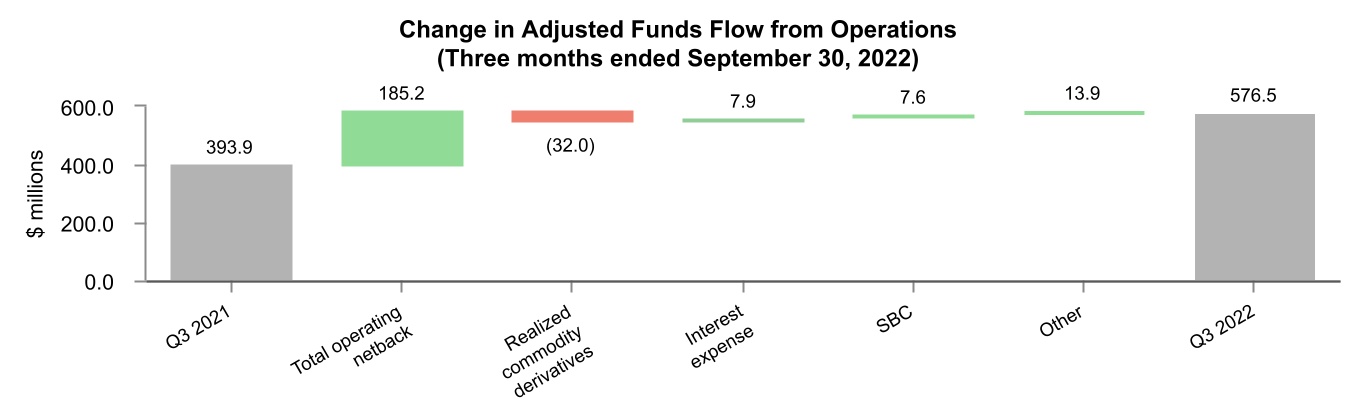
Adjusted funds flow from operations (1) | 576.5 | | | 393.9 | | | 46 | | | 1,709.6 | | | 1,044.4 | | | 64 | | |
| | | | | | | | | | | | |
| Net income | 466.4 | | | 77.5 | | | 502 | | | 1,981.5 | | | 2,242.5 | | | (12) | | |
| Net income per share - diluted | 0.82 | | | 0.13 | | | 531 | | | 3.44 | | | 3.93 | | | (12) | | |
| | | | | | | | | | | | |
Adjusted net earnings from operations (1) | 242.9 | | | 142.6 | | | 70 | | | 755.9 | | | 355.3 | | | 113 | | |
Adjusted net earnings from operations per share - diluted (1) | 0.43 | | | 0.24 | | | 79 | | | 1.31 | | | 0.62 | | | 111 | | |
(1)Specified financial measure that does not have any standardized meaning prescribed by IFRS and, therefore, may not be comparable with the calculation of similar measures presented by other entities. Refer to the Specified Financial Measures section in this MD&A for further information.
Cash flow from operating activities increased from $414.2 million in the third quarter of 2021 to $647.0 million in the third quarter of 2022. In the nine months ended September 30, 2022, cash flow from operating activities increased from $1.00 billion to $1.60 billion. Changes in cash flow from operating activities were due to fluctuations in adjusted funds flow from operations ("FFO") and working capital.
Exhibit 15
(1)Specified financial measure that does not have any standardized meaning prescribed by IFRS and, therefore, may not be comparable with the calculation of similar measures presented by other entities. Refer to the Specified Financial Measures section in this MD&A for further information.
The Company's adjusted FFO increased in both the three and nine months ended September 30, 2022 to $576.5 million and $1.71 billion, respectively, compared to $393.9 million and $1.04 billion in the same periods of 2021. The increases were primarily a result of the higher total operating netback, partially offset by the increased realized commodity derivative losses.
Exhibit 16
| | | | | |
| CRESCENT POINT ENERGY CORP. | 13 |
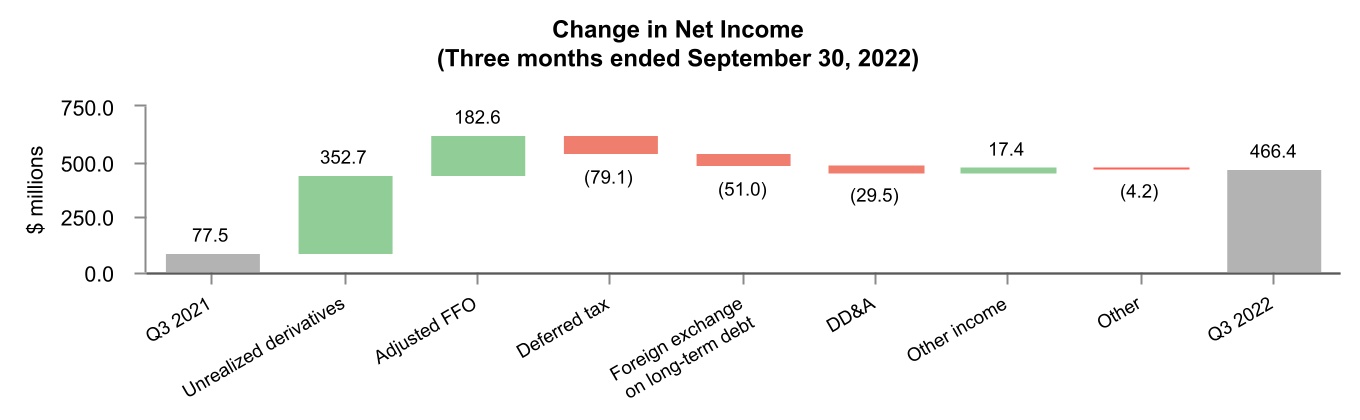
In the three months ended September 30, 2022, the Company reported net income of $466.4 million compared to $77.5 million in the same period of 2021, primarily as a result of the unrealized derivative gains and an increase to adjusted FFO. In the third quarter of 2022, the Company recorded net income per share - diluted of $0.82 compared to $0.13 in the same period of 2021.
In the nine months ended September 30, 2022, the Company reported net income of $1.98 billion compared to $2.24 billion in the same period of 2021, primarily as a result of the lower impairment reversal recorded in the first quarter of 2022 compared to the impairment reversal recorded in the second quarter of 2021, partially offset by an increase in adjusted FFO and unrealized derivative gains. In the nine months ended September 30, 2022, the Company recorded net income per share - diluted of $3.44 compared to $3.93 in the same period of 2021.
Exhibit 17
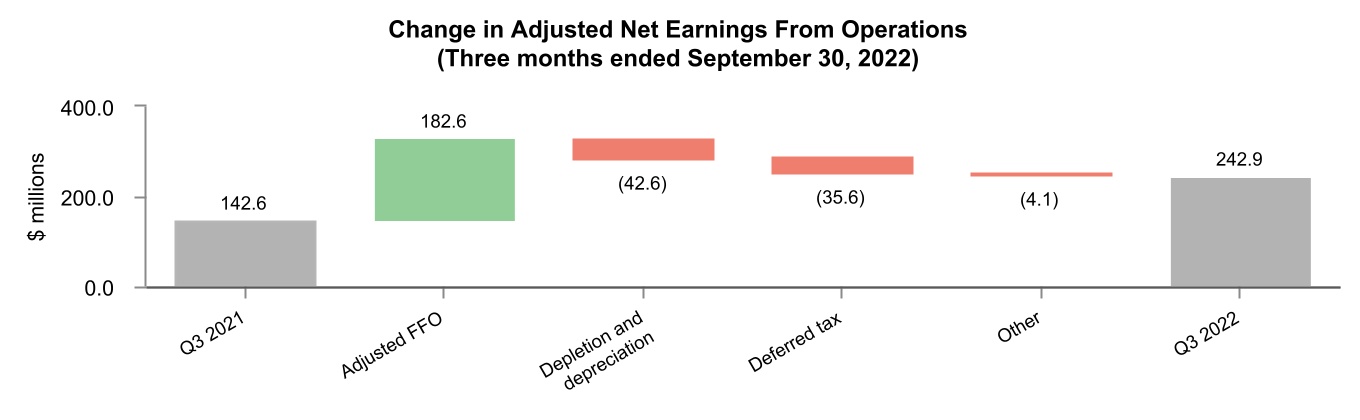
The Company reported adjusted net earnings from operations for the three months ended September 30, 2022 of $242.9 million compared to $142.6 million in the same period of 2021, primarily due to the increase in adjusted FFO, partially offset by the increase in depletion and depreciation and fluctuations in deferred taxes. Adjusted net earnings from operations per share - diluted for the third quarter of 2022 increased to $0.43 from $0.24 in the third quarter of 2021.
The Company's adjusted net earnings from operations for the nine months ended September 30, 2022 was $755.9 million compared to $355.3 million in the same period of 2021, primarily due to the increase in adjusted FFO, partially offset by the increase in depletion and depreciation and fluctuations in deferred taxes. Adjusted net earnings from operations per share - diluted for the nine months ended September 30, 2022 increased to $1.31 from $0.62 in the same period of 2021.
Exhibit 18
Excess Cash Flow and Discretionary Excess Cash Flow
For the three and nine months ended September 30, 2022, excess cash flow increased to $233.7 million and $900.8 million, respectively, from $201.5 million and $606.0 million in the same periods of 2021, primarily as a result of the increases in adjusted FFO, partially offset by higher capital expenditures and decommissioning expenditures. Discretionary excess cash flow for the three and nine months ended September 30, 2022 increased to $188.8 million and $819.0 million, respectively, from $182.5 million and $584.2 million in the same periods of 2021, as a result of the increase in excess cash flow, partially offset by the increase in base dividends.
| | | | | |
| CRESCENT POINT ENERGY CORP. | 14 |
Dividends
| | | | | | | | | | | | | | | | | | | | | | | | | | | | | | | | | | | | | | |
| Three months ended September 30 | | Nine months ended September 30 | |
| ($ millions, except per share amounts) | 2022 | | 2021 | | % Change | | 2022 | | 2021 | | % Change | |
| Dividends declared to shareholders | 44.9 | | | 19.0 | | | 136 | | | 81.8 | | | 21.8 | | | 275 | | |
| Dividends declared to shareholders per share | 0.0800 | | | 0.0325 | | | 146 | | | 0.1450 | | | 0.0375 | | | 287 | | |
In July 2022, Crescent Point declared a quarterly cash dividend of $0.08 per share to be paid on October 3, 2022.
Subsequent to the third quarter of 2022, the Company declared a special cash dividend, based on third quarter 2022 results, of $0.035 per share to be paid on November 14, 2022. The Company also declared a quarterly cash base dividend of $0.08 per share payable on January 3, 2023.
Capital Expenditures
| | | | | | | | | | | | | | | | | | | | | | | | | | | | | | | | | | | | | | |
| Three months ended September 30 | | Nine months ended September 30 | |
| ($ millions) | 2022 | | 2021 | | % Change | | 2022 | | 2021 | | % Change | |
| Capital acquisitions | 88.2 | | | 0.9 | | | 9,700 | | | 89.4 | | | 937.2 | | | (90) | | |
| Capital dispositions | (244.1) | | | (3.8) | | | 6,324 | | | (284.8) | | | (98.9) | | | 188 | | |
| Development capital expenditures | 308.5 | | | 187.1 | | | 65 | | | 709.7 | | | 394.7 | | | 80 | | |
| Land expenditures | 5.7 | | | 1.2 | | | 375 | | | 15.0 | | | 4.1 | | | 266 | | |
Capitalized administration (1) | 9.1 | | | 9.0 | | | 1 | | | 35.9 | | | 32.6 | | | 10 | | |
| Corporate assets | 0.9 | | | 0.8 | | | 13 | | | 1.9 | | | 1.8 | | | 6 | | |
| Total | 168.3 | | | 195.2 | | | (14) | | | 567.1 | | | 1,271.5 | | | (55) | | |
(1)Capitalized administration excludes capitalized equity-settled SBC.
Capital Acquisitions and Dispositions
Major Property Acquisitions and Dispositions
Saskatchewan Viking Disposition
On July 6, 2022, the Company disposed of its non-core Saskatchewan Viking assets for consideration of $244.1 million. These assets had a net carrying value of $220.8 million, resulting in a gain of $23.3 million.
Kaybob Duvernay Acquisition
On August 31, 2022, the Company acquired certain Kaybob Duvernay assets for total consideration of $87.0 million ($61.8 million was allocated to PP&E and $28.0 million was allocated to E&E assets, including $2.8 million related to decommissioning liability).
Minor Property Acquisitions and Dispositions
In the nine months ended September 30, 2022, the Company completed minor property acquisitions and dispositions for total net consideration received of $38.3 million. These assets had a net carrying value of $35.5 million, resulting in a gain of $2.8 million.
Development Capital Expenditures
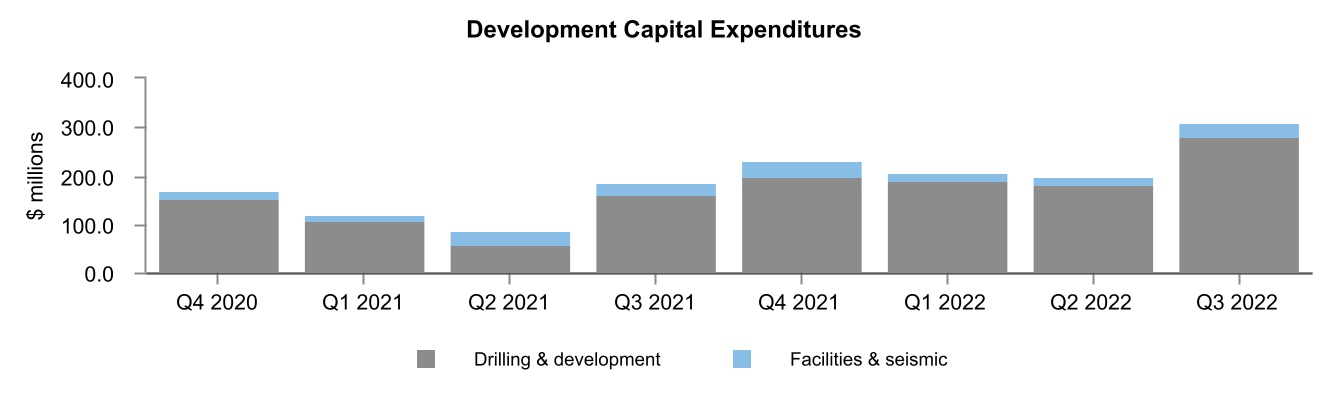
The Company's development capital expenditures for the three months ended September 30, 2022 were $308.5 million, compared to $187.1 million in the same period of 2021. In the third quarter of 2022, 76 (70.7 net) wells were drilled and $27.7 million was spent on facilities and seismic.
The Company's development capital expenditures for the nine months ended September 30, 2022 were $709.7 million, compared to $394.7 million in the same period of 2021. In the nine months ended September 30, 2022, 167 (157.2 net) wells were drilled and $57.9 million was spent on facilities and seismic.
Refer to the Guidance section in this MD&A for Crescent Point's development capital expenditure guidance for 2022.
| | | | | |
| CRESCENT POINT ENERGY CORP. | 15 |
Exhibit 19
Lease Liability
At September 30, 2022, the Company had $125.9 million of lease liabilities for contracts related to office space, fleet vehicles and equipment.
Decommissioning Liability
The decommissioning liability decreased by $33.0 million in the third quarter of 2022, from $714.5 million at June 30, 2022 to $681.5 million at September 30, 2022. The decrease primarily relates to the liabilities disposed through capital dispositions and liabilities settled through the Company's abandonment and reclamation program. The liability is based on estimated undiscounted cash flows before inflation to settle the obligation of $872.2 million.
Liquidity and Capital Resources
| | | | | | | | | | | | | | |
Capitalization Table ($ millions, except share, per share, ratio and percent amounts) | September 30, 2022 | | December 31, 2021 | |
Net debt (1) | 1,198.3 | | | 2,005.0 | | |
| Shares outstanding | 559,323,042 | | | 579,484,032 | | |
| Market price at end of period (per share) | 8.50 | | | 6.75 | | |
| Market capitalization | 4,754.2 | | | 3,911.5 | | |
Enterprise value (1) | 5,952.5 | | | 5,916.5 | | |
Net debt as a percentage of enterprise value (1) | 20 | | | 34 | | |
Adjusted funds flow from operations (1) (2) | 2,142.1 | | | 1,476.9 | | |
Net debt to adjusted funds flow from operations (1) (3) | 0.6 | | | 1.4 | | |
(1)Specified financial measure that does not have any standardized meaning prescribed by IFRS and, therefore, may not be comparable with the calculation of similar measures presented by other entities. Refer to the Specified Financial Measures section in this MD&A for further information.
(2)The sum of adjusted funds flow from operations for the trailing four quarters.
(3)The net debt reflects the financing of acquisitions, however, the adjusted funds flow from operations only reflects adjusted funds flow from operations generated from the acquired properties since the closing date of the acquisitions.
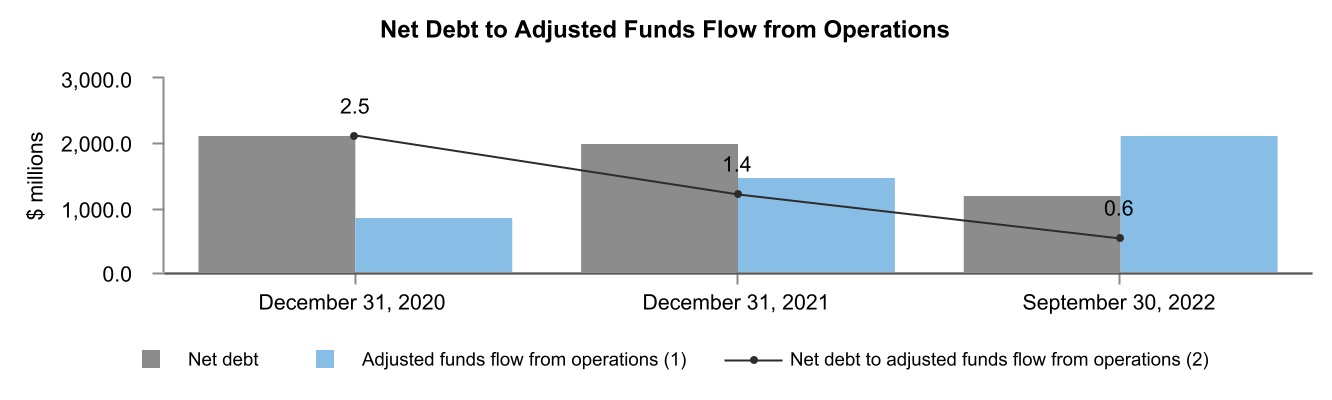
At September 30, 2022, Crescent Point's enterprise value was $5.95 billion and the Company was capitalized with 80 percent equity compared to $5.92 billion and 66 percent at December 31, 2021, respectively. The Company's net debt to adjusted funds flow from operations ratio at September 30, 2022 decreased to 0.6 times from 1.4 times at December 31, 2021. The decrease was largely due to a reduction in net debt as a result of excess cash flow generated in the first nine months of 2022, and higher adjusted funds flow from operations, primarily as a result of the increase in the Cdn$ WTI benchmark price.
Crescent Point's market capitalization increased to $4.75 billion at September 30, 2022, from $3.91 billion at December 31, 2021, primarily due to the increase in the Company's share price.
| | | | | |
| CRESCENT POINT ENERGY CORP. | 16 |
Exhibit 20
(1)The sum of adjusted funds flow from operations for the trailing four quarters.
(2)The net debt reflects the financing of acquisitions, however, the adjusted funds flow from operations only reflects adjusted funds flow from operations generated from the acquired properties since the closing date of the acquisitions.
The Company has combined revolving credit facilities of $2.30 billion, including a $2.20 billion syndicated unsecured credit facility with eleven banks and a $100.0 million unsecured operating credit facility with one Canadian chartered bank. The current maturity date of the facilities is November 26, 2025. As at September 30, 2022, the Company was undrawn on its bank credit facilities and had $2.7 million outstanding pursuant to letters of credit.
At September 30, 2022, the Company has senior guaranteed notes of US$921.0 million and Cdn$195.0 million outstanding. The notes are unsecured and rank pari passu with the Company's bank credit facilities and carry a bullet repayment on maturity. Crescent Point entered into various CCS to hedge its foreign exchange exposure on its US dollar long-term debt. During the nine months ended September 30, 2022, the Company repaid senior guaranteed note maturities of US$200.0 million and Cdn$25.0 million.
The Company is in compliance with all debt covenants at September 30, 2022 which are listed in the table below:
| | | | | | | | | | | | | | |
| Covenant Description | Maximum Ratio | | September 30, 2022 | |
Senior debt to adjusted EBITDA (1) (2) | 3.5 | | 0.65 | |
Total debt to adjusted EBITDA (1) (3) | 4.0 | | 0.65 | |
Senior debt to capital (2) (4) | 0.55 | | 0.17 | |
(1)Adjusted EBITDA is calculated as earnings before interest, taxes, depletion, depreciation, amortization, impairment and impairment reversals, adjusted for certain non-cash items. Adjusted EBITDA is calculated on a trailing twelve month basis adjusted for material acquisitions and dispositions.
(2)Senior debt is calculated as the sum of amounts drawn on the combined facilities, outstanding letters of credit and the principal amount of the senior guaranteed notes.
(3)Total debt is calculated as the sum of senior debt plus subordinated debt. Crescent Point does not have any subordinated debt.
(4)Capital is calculated as the sum of senior debt and shareholders' equity and excludes the effect of unrealized derivative gains or losses and the adoption of IFRS 16.
The Company's ongoing working capital requirements are expected to be financed through cash, adjusted funds flow from operations and its bank credit facilities.
Shareholders' Equity
At September 30, 2022, Crescent Point had 559.3 million common shares issued and outstanding compared to 579.5 million common shares at December 31, 2021. The decrease of 20.2 million shares is due to shares purchased for cancellation under the Normal Course Issuer Bid ("NCIB"), partially offset by shares issued pursuant to the Restricted Share Bonus Plan and stock options exercised pursuant to the Stock Option Plan.
As of the date of this report, the Company had 556,500,191 common shares outstanding.
Normal Course Issuer Bid
On March 4, 2022, the Company announced the acceptance by the Toronto Stock Exchange of its notice to implement an NCIB. The NCIB allows the Company to purchase, for cancellation, up to 57,309,975 common shares, or 10 percent of the Company's public float, as at February 28, 2022. The NCIB commenced on March 9, 2022 and is due to expire on March 8, 2023.
In the nine months ended September 30, 2022, the Company purchased 22.7 million common shares for a total consideration of $207.7 million. The total cost paid, including commissions and fees, was recognized directly as a reduction in shareholders' equity. Under the NCIB, all common shares purchased are cancelled.
| | | | | |
| CRESCENT POINT ENERGY CORP. | 17 |
Critical Accounting Estimates
There have been no changes in Crescent Point's critical accounting estimates in the period ended September 30, 2022. Further information on the Company's critical accounting policies and estimates can be found in the notes to the annual consolidated financial statements and MD&A for the year ended December 31, 2021.
| | | | | |
| CRESCENT POINT ENERGY CORP. | 18 |
Summary of Quarterly Results
| | | | | | | | | | | | | | | | | | | | | | | | | | | | | | | | | | | | |
| 2022 | 2021 | 2020 |
| ($ millions, except per share amounts) | Q3 | Q2 | Q1 | | Q4 | Q3 | Q2 | Q1 | | Q4 | | |
| Oil and gas sales | 1,097.3 | | 1,286.5 | | 1,092.7 | | | 900.4 | | 826.7 | | 849.2 | | 630.2 | | | 447.8 | | | |
| | | | | | | | | | | | |
| Average daily production | | | | | | | | | | | | |
| Crude oil and condensate (bbls/d) | 91,762 | | 91,250 | | 92,971 | | | 88,544 | | 92,206 | | 107,444 | | 95,276 | | | 87,512 | | | |
| NGLs (bbls/d) | 17,198 | | 16,139 | | 17,039 | | | 20,884 | | 18,176 | | 18,608 | | 13,319 | | | 13,033 | | | |
| Natural gas (mcf/d) | 144,356 | | 130,724 | | 136,667 | | | 125,871 | | 130,823 | | 135,531 | | 64,732 | | | 64,033 | | | |
| Total (boe/d) | 133,019 | | 129,176 | | 132,788 | | | 130,407 | | 132,186 | | 148,641 | | 119,384 | | | 111,217 | | | |
| | | | | | | | | | | | |
| Net income (loss) | 466.4 | | 331.5 | | 1,183.6 | | | 121.6 | | 77.5 | | 2,143.3 | | 21.7 | | | (51.2) | | | |
| Net income (loss) per share | 0.83 | | 0.58 | | 2.05 | | | 0.21 | | 0.13 | | 3.68 | | 0.04 | | | (0.10) | | | |
| Net income (loss) per share – diluted | 0.82 | | 0.58 | | 2.03 | | | 0.21 | | 0.13 | | 3.65 | | 0.04 | | | (0.10) | | | |
| | | | | | | | | | | | |
Adjusted net earnings from operations (1) | 242.9 | | 272.1 | | 240.9 | | | 160.0 | | 142.6 | | 117.6 | | 95.1 | | | 85.6 | | | |
Adjusted net earnings from operations per share (1) | 0.43 | | 0.48 | | 0.42 | | | 0.27 | | 0.25 | | 0.20 | | 0.18 | | | 0.16 | | | |
Adjusted net earnings from operations per share – diluted (1) | 0.43 | | 0.47 | | 0.41 | | | 0.27 | | 0.24 | | 0.20 | | 0.18 | | | 0.16 | | | |
| | | | | | | | | | | | |
| Cash flow from operating activities | 647.0 | | 529.6 | | 426.1 | | | 492.4 | | 414.2 | | 285.5 | | 303.7 | | | 245.1 | | | |
| | | | | | | | | | | | |
Adjusted funds flow from operations (1) | 576.5 | | 599.1 | | 534.0 | | | 432.5 | | 393.9 | | 387.8 | | 262.7 | | | 220.2 | | | |
| | | | | | | | | | | | |
Adjusted working capital surplus (deficiency) (1) | 47.9 | | (40.9) | | (91.8) | | | (201.6) | | (108.8) | | (16.1) | | (55.9) | | | (93.4) | | | |
| Total assets | 10,437.6 | | 10,279.4 | | 10,412.5 | | | 9,171.2 | | 9,231.5 | | 9,283.4 | | 6,610.7 | | | 6,645.9 | | | |
| Total liabilities | 3,224.6 | | 3,501.3 | | 3,901.2 | | | 3,765.9 | | 3,897.4 | | 4,044.4 | | 3,777.5 | | | 3,823.1 | | | |
Net debt (1) | 1,198.3 | | 1,467.9 | | 1,775.2 | | | 2,005.0 | | 2,138.8 | | 2,324.2 | | 2,013.4 | | | 2,149.2 | | | |
| | | | | | | | | | | | |
| | | | | | | | | | | | |
| Weighted average shares – diluted (millions) | 567.4 | | 575.9 | | 582.7 | | | 587.7 | | 587.1 | | 587.8 | | 536.6 | | | 534.4 | | | |
| | | | | | | | | | | | |
| Capital acquisitions | 88.2 | | 0.3 | | 0.9 | | | 5.2 | | 0.9 | | 936.3 | | — | | | — | | | |
| Capital dispositions | (244.1) | | (37.8) | | (2.9) | | | (0.1) | | (3.8) | | (87.9) | | (7.2) | | | 1.1 | | | |
| Development capital expenditures | 308.5 | | 196.9 | | 204.3 | | | 229.5 | | 187.1 | | 88.4 | | 119.2 | | | 169.4 | | | |
| | | | | | | | | | | | |
| Dividends declared | 44.9 | | 37.1 | | (0.2) | | | 26.0 | | 19.0 | | 1.5 | | 1.3 | | | 1.4 | | | |
| Dividends declared per share | 0.0800 | | 0.0650 | | — | | | 0.0450 | | 0.0325 | | 0.0025 | | 0.0025 | | | 0.0025 | | | |
(1)Specified financial measure that does not have any standardized meaning prescribed by IFRS and, therefore, may not be comparable with the calculation of similar measures presented by other entities. Refer to the Specified Financial Measures section in this MD&A for further information.
Over the past eight quarters, the Company's oil and gas sales have fluctuated due to volatility in the Cdn$ WTI benchmark price, changes in production and fluctuations in corporate oil price differentials. The Company's production has fluctuated due to changes in its development capital spending levels, acquisitions and dispositions, voluntary shut-ins and subsequent reactivations, and natural declines.
Net income (loss) has fluctuated over the past eight quarters primarily due to changes in PP&E impairment charges and reversals, changes in adjusted funds flow from operations, unrealized derivative gains and losses, which fluctuate with changes in forward market prices and foreign exchange rates, gains and losses on capital dispositions, and fluctuations in deferred tax expense.
Adjusted net earnings from operations has fluctuated over the past eight quarters, primarily due to changes in adjusted funds flow from operations, depletion and share-based compensation expense along with associated fluctuations in deferred tax expense.
Capital expenditures have also fluctuated throughout this period due to the timing of acquisitions, dispositions and changes in the Company's development capital spending levels which vary based on a number of factors, including the prevailing commodity price environment.
| | | | | |
| CRESCENT POINT ENERGY CORP. | 19 |
Internal Control Update
Crescent Point is required to comply with Multilateral Instrument 52-109 Certification of Disclosure on Issuers' Annual and Interim Filings. The certificate requires that Crescent Point disclose in the interim MD&A any weaknesses or changes in Crescent Point's internal control over financial reporting that occurred during the period that have materially affected, or are reasonably likely to materially affect Crescent Point's internal controls over financial reporting. Crescent Point confirms that no such weaknesses or changes were identified in the Company's internal controls over financial reporting during the third quarter of 2022.
Guidance
Crescent Point's guidance for 2022 is as follows:
| | | | | | | | | | | | | | |
| Prior (1) | | Revised | |
Total Annual Average Production (boe/d) (2) | 130,000 - 134,000 | | 132,000 | |
| | | | |
| Capital Expenditures | | | | |
| Development capital expenditures ($ millions) | $875 - $900 | | $950 | |
| Capitalized administration ($ millions) | $40 | | $45 | |
Total ($ millions) (3) | $915 - $940 | | $995 | |
| | | | |
| Other Information for 2022 Guidance | | | | |
Reclamation activities ($ millions) (4) | $20 | | $20 | |
| Capital lease payments ($ millions) | $20 | | $20 | |
| Annual operating expenses ($/boe) | $13.75 - $14.25 | | $14.75 | |
| Royalties | 13.5% - 14.0% | | 13.75% | |
| | | | |
| | | | |
| | | | |
| | | | |
| | | | |
| | | | |
| | | | |
| | | | |
| | | | |
(1)Prior guidance published in the Company's July 6, 2022 press release.
(2)Total annual average production (boe/d) is comprised of approximately 80% Oil, Condensate & NGLs and 20% Natural Gas.
(3)Land expenditures and net property acquisitions and dispositions are not included. Development capital expenditures spend is allocated on an approximate basis as follows: 90% drilling & development and 10% facilities & seismic.
(4)Reflects Crescent Point's portion of its expected total budget.
Return of Capital Outlook
| | | | | | | | | | | | | | |
| Base Dividend | | | | |
| Current quarterly base dividend per share | | | $0.08 | |
| Additional Return of Capital | | | | |
% of discretionary excess cash flow (1) (2) | | | 50% | |
(1)Discretionary excess cash flow is calculated as excess cash flow less base dividends. Specified financial measure that does not have any standardized meaning prescribed by IFRS and, therefore, may not be comparable with the calculation of similar measures presented by other entities. Refer to the Specified Financial Measures section in this MD&A for further information.
(2)This % is part of a framework that targets to return up to 50% of discretionary excess cash flow to shareholders.
Additional information relating to Crescent Point, including the Company's December 31, 2021 Annual Information Form, which along with other relevant documents are available on SEDAR at www.sedar.com and on EDGAR at www.sec.gov/edgar.
| | | | | |
| CRESCENT POINT ENERGY CORP. | 20 |
Specified Financial Measures
Throughout this MD&A, the Company uses the terms “total operating netback”, “total netback”, "operating netback", "netback", “adjusted funds flow from operations”, "excess cash flow", "discretionary excess cash flow", "adjusted working capital (surplus) deficiency", “net debt”, “enterprise value”, “net debt to adjusted funds flow from operations”, "net debt as a percentage of enterprise value", “adjusted net earnings from operations”, “adjusted net earnings from operations per share” and “adjusted net earnings from operations per share - diluted”. These terms do not have any standardized meaning as prescribed by IFRS and, therefore, may not be comparable with the calculation of similar measures presented by other issuers.
Total operating netback and total netback are historical non-GAAP financial measures. Total operating netback is calculated as oil and gas sales, less royalties, operating and transportation expenses. Total netback is calculated as total operating netback plus realized commodity derivative gains and losses. Total operating netback and total netback are common metrics used in the oil and gas industry and are used to measure operating results to better analyze performance against prior periods on a comparable basis. The most directly comparable financial measure to total operating netback and total netback is oil and gas sales.
The following table reconciles oil and gas sales to total operating netback and total netback:
| | | | | | | | | | | | | | | | | | | | | | | | | | | | | | | | | | | | | | |
| Three months ended September 30 | | Nine months ended September 30 | |
| ($ millions) | 2022 | | 2021 | | % Change | | 2022 | | 2021 | | % Change | |
| | | | | | | | | | | | |
| Oil and gas sales | 1,097.3 | | | 826.7 | | | 33 | | | 3,476.5 | | | 2,306.1 | | | 51 | | |
| Royalties | (150.9) | | | (101.5) | | | 49 | | | (470.0) | | | (294.0) | | | 60 | | |
| Operating expenses | (185.0) | | | (157.7) | | | 17 | | | (534.2) | | | (471.1) | | | 13 | | |
| Transportation expenses | (35.9) | | | (30.6) | | | 17 | | | (101.7) | | | (87.9) | | | 16 | | |
| Total operating netback | 725.5 | | | 536.9 | | | 35 | | | 2,370.6 | | | 1,453.1 | | | 63 | | |
| Realized loss on commodity derivatives | (120.2) | | | (88.2) | | | 36 | | | (546.2) | | | (245.6) | | | 122 | | |
| Total netback | 605.3 | | | 448.7 | | | 35 | | | 1,824.4 | | | 1,207.5 | | | 51 | | |
Operating netback and netback are non-GAAP ratios and are calculated as total operating netback and total netback, respectively, divided by total production. Operating netback and netback are common metrics used in the oil and gas industry and are used to measure operating results on a per boe basis.
Adjusted funds flow from operations is a capital management measure and is calculated based on cash flow from operating activities before changes in non-cash working capital, transaction costs and decommissioning expenditures funded by the Company. Transaction costs are excluded as they vary based on the Company's acquisition and disposition activity and to ensure that this metric is more comparable between periods. Decommissioning expenditures are discretionary and are excluded as they may vary based on the stage of the Company's assets and operating areas. The most directly comparable financial measure to adjusted funds flow from operations is cash flow from operating activities. Adjusted funds flow from operations is a key measure that assesses the ability of the Company to finance dividends, potential share repurchases, operating activities, capital expenditures and debt repayments. Adjusted funds flow from operations as presented is not intended to represent cash flow from operating activities, net earnings or other measures of financial performance calculated in accordance with IFRS. See Note 12 – "Capital Management" in the unaudited consolidated financial statements for the period ended September 30, 2022 for additional information on the Company's capital management.
Excess cash flow is a historical non-GAAP financial measure and is defined as adjusted funds flow from operations less capital expenditures, payments on lease liability, decommissioning expenditures funded by the Company and other items (excluding net acquisitions and dispositions). The most directly comparable financial measure to excess cash flow disclosed in the Company's financial statements is cash flow from operating activities. Excess cash flow is a key measure that assesses the ability of the Company to finance dividends, potential share repurchases, debt repayments and returns-based growth. The Company has previously presented excess cash flow as net of dividends. To provide a more comparable definition of excess cash flow to other issuers, excess cash flow is now presented prior to dividends.
Discretionary excess cash flow is a historical non-GAAP financial measure and is defined as excess cash flow less base dividends. The most directly comparable financial measure to discretionary excess cash flow disclosed in the Company's financial statements is cash flow from operating activities. Discretionary excess cash flow is a key measure that assesses the funds available for reinvestment in the Company’s business or for return of capital to shareholders beyond the base dividend.
| | | | | |
| CRESCENT POINT ENERGY CORP. | 21 |
The following table reconciles cash flow from operating activities to adjusted funds flow from operations, excess cash flow and discretionary excess cash flow:
| | | | | | | | | | | | | | | | | | | | | | | | | | | | | | | | | | | | | | |
| Three months ended September 30 | | Nine months ended September 30 | |
| ($ millions) | 2022 | | 2021 (1) | | % Change | | 2022 | | 2021 (1) | | % Change | |
| Cash flow from operating activities | 647.0 | | | 414.2 | | | 56 | | | 1,602.7 | | | 1,003.4 | | | 60 | | |
| Changes in non-cash working capital | (79.3) | | | (23.7) | | | 235 | | | 86.8 | | | 17.5 | | | 396 | | |
| Transaction costs | 2.9 | | | 0.4 | | | 625 | | | 3.3 | | | 12.2 | | | (73) | | |
Decommissioning expenditures (2) | 5.9 | | | 3.0 | | | 97 | | | 16.8 | | | 11.3 | | | 49 | | |
| Adjusted funds flow from operations | 576.5 | | | 393.9 | | | 46 | | | 1,709.6 | | | 1,044.4 | | | 64 | | |
| Capital expenditures | (324.2) | | | (198.1) | | | 64 | | | (762.5) | | | (433.2) | | | 76 | | |
| Payments on lease liability | (5.1) | | | (5.4) | | | (6) | | | (15.3) | | | (15.6) | | | (2) | | |
| Decommissioning expenditures | (5.9) | | | (3.0) | | | 97 | | | (16.8) | | | (11.3) | | | 49 | | |
Other items (3) | (7.6) | | | 14.1 | | | (154) | | | (14.2) | | | 21.7 | | | (165) | | |
| | | | | | | | | | | | |
| Excess cash flow | 233.7 | | | 201.5 | | | 16 | | | 900.8 | | | 606.0 | | | 49 | | |
Dividends (4) | (44.9) | | | (19.0) | | | 136 | | | (81.8) | | | (21.8) | | | 275 | | |
| Discretionary excess cash flow | 188.8 | | | 182.5 | | | 3 | | | 819.0 | | | 584.2 | | | 40 | | |
(1)Comparative period revised to reflect current period presentation.
(2)Excludes amounts received from government subsidy programs.
(3)Other items include, but are not limited to, unrealized gains and losses on equity derivative contracts and transaction costs. Other items exclude net acquisitions and dispositions.
(4)Dividends is equivalent to base dividends as there were no special dividends declared in the three and nine months ended September 30, 2022 and September 30, 2021.
Adjusted working capital (surplus) deficiency is a capital management measure and is calculated as accounts payable and accrued liabilities, dividends payable and long-term compensation liability net of equity derivative contracts, less cash, accounts receivable, prepaids and deposits, including deposit on acquisition and long-term investments. Adjusted working capital (surplus) deficiency is a component of net debt and is a measure of the Company's liquidity.
The following table reconciles adjusted working capital (surplus) deficiency:
| | | | | | | | | | | | | | | | | | | | |
| ($ millions) | September 30, 2022 | | December 31, 2021 | | % Change | |
| Accounts payable and accrued liabilities | 503.8 | | | 450.7 | | | 12 | | |
| Dividends payable | 44.9 | | | 43.5 | | | 3 | | |
Long-term compensation liability (1) | 45.9 | | | 42.6 | | | 8 | | |
| Cash | (225.5) | | | (13.5) | | | 1,570 | | |
| Accounts receivable | (400.0) | | | (314.3) | | | 27 | | |
| Prepaids and deposits | (17.0) | | | (7.4) | | | 130 | | |
| | | | | | |
| | | | | | |
| Adjusted working capital (surplus) deficiency | (47.9) | | | 201.6 | | | (124) | | |
(1)Includes current portion of long-term compensation liability and is net of equity derivative contracts.
Net debt is a capital management measure and is calculated as long-term debt plus adjusted working capital (surplus) deficiency, excluding the unrealized foreign exchange on translation of US dollar long-term debt. The most directly comparable financial measure to net debt disclosed in the Company's financial statements is long-term debt. Net debt is a key measure of the Company's liquidity.
The following table reconciles long-term debt to net debt:
| | | | | | | | | | | | | | | | | | | | |
| ($ millions) | September 30, 2022 | | December 31, 2021 | | % Change | |
Long-term debt (1) | 1,456.8 | | | 1,970.2 | | | (26) | | |
| Adjusted working capital (surplus) deficiency | (47.9) | | | 201.6 | | | (124) | | |
| | | | | | |
| Unrealized foreign exchange on translation of US dollar long-term debt | (210.6) | | | (166.8) | | | 26 | | |
| Net debt | 1,198.3 | | | 2,005.0 | | | (40) | | |
(1)Includes current portion of long-term debt.
Enterprise value is a supplementary financial measure and is calculated as market capitalization plus net debt. Enterprise value is used to assess the valuation of the Company. Refer to the Liquidity and Capital Resources section in this MD&A for further information.
Net debt to adjusted funds flow from operations is a capital management measure and is calculated as the period end net debt divided by the sum of adjusted funds flow from operations for the trailing four quarters. Net debt as a percentage of enterprise value is a supplementary financial measure and is calculated as net debt divided by enterprise value. The measures of net debt to adjusted funds flow from operations and net debt as a percentage of enterprise value are used to measure the Company's overall debt position and to measure the strength of the Company's balance sheet. Crescent Point monitors these measures and uses them as key measures in capital allocation decisions including capital spending levels, returns to shareholders including dividends and share repurchases, and financial considerations.
| | | | | |
| CRESCENT POINT ENERGY CORP. | 22 |
Adjusted net earnings from operations is a historical non-GAAP financial measure and is calculated based on net income before amortization of E&E undeveloped land, impairment or impairment reversals, unrealized derivative gains or losses, unrealized foreign exchange gain or loss on translation of hedged US dollar long-term debt, unrealized gains or losses on long-term investments, gains or losses on the sale of long-term investments, gains or losses on capital acquisitions and dispositions and deferred tax related to these adjustments. Adjusted net earnings from operations is a key measure of financial performance that is more comparable between periods. The most directly comparable financial measure to adjusted net earnings from operations disclosed in the Company's financial statements is net income.
The following table reconciles net income to adjusted net earnings from operations:
| | | | | | | | | | | | | | | | | | | | | | | | | | | | | | | | | | | | | | |
| Three months ended September 30 | | Nine months ended September 30 | |
| ($ millions) | 2022 | | 2021 | | % Change | | 2022 | | 2021 | | % Change | |
| Net income | 466.4 | | | 77.5 | | | 502 | | | 1,981.5 | | | 2,242.5 | | | (12) | | |
| Amortization of E&E undeveloped land | 1.2 | | | 14.3 | | | (92) | | | 12.4 | | | 41.4 | | | (70) | | |
| Impairment reversal | — | | | — | | | — | | | (1,484.9) | | | (2,514.4) | | | (41) | | |
| Unrealized derivative (gains) losses | (349.5) | | | 3.2 | | | (11,022) | | | (117.3) | | | 228.5 | | | (151) | | |
| Unrealized foreign exchange (gain) loss on translation of hedged US dollar long-term debt | 76.9 | | | 25.9 | | | 197 | | | 43.8 | | | (23.9) | | | (283) | | |
| Unrealized (gain) loss on long-term investments | — | | | 3.0 | | | (100) | | | — | | | (3.1) | | | (100) | | |
| Gain on sale of long-term investments | — | | | (7.0) | | | (100) | | | — | | | (7.0) | | | (100) | | |
| Gain on capital dispositions | (23.3) | | | (1.9) | | | 1,126 | | | (26.1) | | | (58.4) | | | (55) | | |
| Deferred tax adjustments | 71.2 | | | 27.6 | | | 158 | | | 346.5 | | | 449.7 | | | (23) | | |
| Adjusted net earnings from operations | 242.9 | | | 142.6 | | | 70 | | | 755.9 | | | 355.3 | | | 113 | | |
Adjusted net earnings from operations per share and adjusted net earnings from operations per share - diluted are non-GAAP ratios and are calculated as adjusted net earnings from operations divided by the number of weighted average basic and diluted shares outstanding, respectively. Adjusted net earnings from operations presents a measure of financial performance that is more comparable between periods. Adjusted net earnings from operations as presented is not intended to represent net earnings or other measures of financial performance calculated in accordance with IFRS.
Management believes the presentation of the specified financial measures above provide useful information to investors and shareholders as the measures provide increased transparency and the ability to better analyze performance against prior periods on a comparable basis.
| | | | | |
| CRESCENT POINT ENERGY CORP. | 23 |
Forward-Looking Information
Certain statements contained in this management's discussion and analysis constitute forward-looking statements and are based on Crescent Point's beliefs and assumptions based on information available at the time the assumption was made. By its nature, such forward-looking information involves known and unknown risks, uncertainties and other factors that may cause actual results or events to differ materially from those anticipated in such forward-looking statements. The Company believes the expectations reflected in those forward-looking statements are reasonable but no assurance can be given that these expectations will prove to be correct and such forward-looking statements should not be unduly relied upon. These statements are effective only as of the date of this report. Crescent Point undertakes no obligation to update publicly or revise any forward-looking statements, whether as a result of new information, future events or otherwise, unless required to do so pursuant to applicable law.
Any “financial outlook” or “future oriented financial information” in this management’s discussion and analysis, as defined by applicable securities legislation, has been approved by management of Crescent Point. Such financial outlook or future oriented financial information is provided for the purpose of providing information about management’s current expectations and plans relating to the future. Readers are cautioned that reliance on such information may not be appropriate for other purposes.
Certain statements contained in this MD&A, including statements related to Crescent Point's capital expenditures, projected asset growth, view and outlook toward future commodity prices, drilling activity and statements that contain words such as "could", "should", "can", "anticipate", "expect", "believe", "will", "may", “projected”, “sustain”, “continues”, “strategy”, “potential”, “projects”, “grow”, “take advantage”, “estimate” and similar expressions and statements relating to matters that are not historical facts constitute "forward-looking information" within the meaning of applicable Canadian securities legislation. The material assumptions and factors in making these forward-looking statements are disclosed in this MD&A under the headings "Overview", "Commodity Derivatives", “Liquidity and Capital Resources” and “Guidance”.
In particular, forward-looking statements include:
| | | | | |
l Crescent Point's approach to proactively manage the risk exposure inherent in movements in the price of crude oil, propane, natural gas, the Company's share price, the US/Cdn dollar exchange rate and interest rates through the use of derivatives with investment-grade counterparties; l Return of capital framework, targeting the return of up to 50 percent of discretionary excess cash flow, in addition to base dividend; l Crescent Point's use of derivatives to reduce the volatility of the selling price of its crude oil and natural gas production and how this provides a measure of stability to cash flow; l The extent and effectiveness of hedges; l Higher forecast commodity prices used to estimate useable tax pools;
| l The Company's Canadian gas production generally trading at a slight premium to AECO pricing; l Crescent Point's 2022 production and capital expenditures guidance, and other information forming part of the 2022 guidance; l Crescent Point's return of capital outlook including dividend expectations and additional return of capital target as a percentage of discretionary excess cash flow; l The Company's liquidity and financial flexibility; l NCIB expectations; and l Estimated undiscounted and uninflated cash flows to settle decommissioning liability.
|
This information contains certain forward-looking estimates that involve substantial known and unknown risks and uncertainties, many of which are beyond Crescent Point's control. Such risks and uncertainties include, but are not limited to: financial risk of marketing reserves at an acceptable price given market conditions; volatility in market prices for oil and natural gas, decisions or actions of OPEC and non-OPEC countries in respect of supplies of oil and gas; delays in business operations or delivery of services due to pipeline restrictions, rail blockades, outbreaks, blowouts and business closures and social distancing measures mandated by public health authorities in response to COVID-19, including current and new variants thereof; the risk of carrying out operations with minimal environmental impact; industry conditions including changes in laws and regulations including the adoption of new environmental laws and regulations and changes in how they are interpreted and enforced; uncertainties associated with estimating oil and natural gas reserves; risks and uncertainties related to oil and gas interests and operations on Indigenous lands; economic risk of finding and producing reserves at a reasonable cost; uncertainties associated with partner plans and approvals; operational matters related to non-operated properties; increased competition for, among other things, capital, acquisitions of reserves and undeveloped lands; competition for and availability of qualified personnel or management; incorrect assessments of the value and likelihood of acquisitions and dispositions, and exploration and development programs; unexpected geological, technical, drilling, construction, processing and transportation problems; the impact of severe weather events; availability of insurance; fluctuations in foreign exchange and interest rates; stock market volatility; general economic, market and business conditions, including uncertainty in the demand for oil and gas and economic activity in general as a result of the COVID-19 pandemic; changes in interest rates and inflation; uncertainties associated with regulatory approvals; geopolitical conflicts, including the Russian invasion of Ukraine; uncertainty of government policy changes; the impact of the implementation of the Canada-United States-Mexico Agreement; uncertainty regarding the benefits and costs of dispositions; failure to complete acquisitions and dispositions; uncertainties associated with credit facilities and counterparty credit risk; changes in income tax laws, tax laws, crown royalty rates and incentive programs relating to the oil and gas industry; the wide-ranging impacts of the COVID-19 pandemic, including on demand, health and supply chain; and other factors, many of which are outside the control of the Company.
Therefore, Crescent Point's actual results, performance or achievement could differ materially from those expressed in, or implied by, these forward-looking estimates and if such actual results, performance or achievements transpire or occur, or if any of them do so, there can be no certainty as to what benefits or detriments Crescent Point will derive therefrom.
| | | | | |
| CRESCENT POINT ENERGY CORP. | 24 |
Crude oil and condensate, and natural gas information is provided in accordance with the United States Financial Accounting Standards Board ("FASB") Topic 932 - "Extractive Activities - Oil and Gas" and where applicable, financial information is prepared in accordance with International Financial Reporting Standards ("IFRS").
The Company files its reserves information under National Instrument 51-101 - "Standards of Disclosure of Oil and Gas Activities" (NI 51-101), which prescribes the standards for the preparation and disclosure of reserves and related information for companies listed in Canada.
There are significant differences to the type of volumes disclosed and the basis from which the volumes are economically determined under the United States Securities and Exchange Commission (“SEC”) requirements and NI 51-101. The SEC requires disclosure of net reserves, after royalties, using 12-month average prices and current costs; whereas NI 51-101 requires Company gross reserves, before royalties, using forecast pricing and costs. Therefore the difference between the reported numbers under the two disclosure standards may be material.
Barrels of oil equivalent (“boe”) may be misleading, particularly if used in isolation. A boe conversion ratio of 6 mcf : 1 bbl is based on an energy equivalency conversion method primarily applicable at the burner tip and does not represent a value equivalency at the wellhead. Given that the value ratio based on the current price of crude oil and condensate as compared to natural gas is significantly different from the energy equivalency of oil, utilizing a conversion on a 6:1 basis may be misleading as an indication of value. Oil and gas metrics such as operating netback and netback do not have standardized meaning and as such may not be reliable, and should not be used to make comparisons.
NI 51-101 includes condensate within the natural gas liquids (NGLs) product type. The Company has disclosed condensate as combined with crude oil and separately from other natural gas liquids in this MD&A since the price of condensate as compared to other natural gas liquids is currently significantly higher and the Company believes that this crude oil and condensate presentation provides a more accurate description of its operations and results therefrom.
The Company’s aggregate average production for the three and nine months ended September 30, 2022 and September 30, 2021 and the references to “natural gas”, “crude oil" and "condensate”, reported in this MD&A consist of the following product types, as defined in NI 51-101 and using a conversion ratio of 6 mcf : 1 bbl where applicable:
| | | | | | | | | | | | | | | | | | | | | | | | | | | | | | |
| Three months ended September 30 | | Nine months ended September 30 | |
| 2022 | | 2021 | | | | 2022 | | 2021 | | | |
| Light & Medium Crude Oil (bbl/d) | 12,347 | | | 15,046 | | | | | 14,477 | | | 18,651 | | | | |
| Heavy Crude Oil (bbl/d) | 4,102 | | | 4,199 | | | | | 4,080 | | | 4,196 | | | | |
| Tight Oil (bbl/d) | 54,030 | | | 58,233 | | | | | 54,455 | | | 64,689 | | | | |
| Total Crude Oil (bbl/d) | 70,479 | | | 77,478 | | | | | 73,012 | | | 87,536 | | | | |
| | | | | | | | | | | | |
| NGLs (bbl/d) | 38,481 | | | 32,904 | | | | | 35,770 | | | 27,481 | | | | |
| | | | | | | | | | | | |
| Shale Gas (mcf/d) | 134,049 | | | 117,339 | | | | | 126,892 | | | 98,959 | | | | |
| Conventional Natural Gas (mcf/d) | 10,307 | | | 13,484 | | | | | 10,385 | | | 11,644 | | | | |
| Total Natural Gas (mcf/d) | 144,356 | | | 130,823 | | | | | 137,277 | | | 110,603 | | | | |
| | | | | | | | | | | | |
| Total (boe/d) | 133,019 | | | 132,186 | | | | | 131,662 | | | 133,451 | | | | |
The Company’s aggregate production for the past eight quarters and the references to “natural gas”, “crude oil" and "condensate”, reported in this MD&A consist of the following product types, as defined in NI 51-101 and using a conversion ratio of 6 mcf : 1 bbl where applicable:
| | | | | | | | | | | | | | | | | | | | | | | | | | | | |
| 2022 | | 2021 | | 2020 |
| Q3 | Q2 | Q1 | | Q4 | Q3 | Q2 | Q1 | | Q4 |
| Light & Medium Crude Oil (bbl/d) | 12,347 | | 15,752 | | 15,365 | | | 15,517 | | 15,046 | | 20,181 | | 20,699 | | | 21,025 | |
| Heavy Crude Oil (bbl/d) | 4,102 | | 4,103 | | 4,034 | | | 4,226 | | 4,199 | | 4,269 | | 4,118 | | | 4,276 | |
| Tight Oil (bbl/d) | 54,030 | | 53,521 | | 55,837 | | | 55,965 | | 58,233 | | 65,595 | | 70,459 | | | 62,211 | |
| Total Crude Oil (bbl/d) | 70,479 | | 73,376 | | 75,236 | | | 75,708 | | 77,478 | | 90,045 | | 95,276 | | | 87,512 | |
| | | | | | | | | | |
| NGLs (bbl/d) | 38,481 | | 34,013 | | 34,774 | | | 33,720 | | 32,904 | | 36,007 | | 13,319 | | | 13,033 | |
| | | | | | | | | | |
| Shale Gas (mcf/d) | 134,049 | | 119,924 | | 126,622 | | | 115,482 | | 117,339 | | 125,830 | | 53,198 | | | 52,370 | |
| Conventional Natural Gas (mcf/d) | 10,307 | | 10,800 | | 10,045 | | | 10,389 | | 13,484 | | 9,701 | | 11,534 | | | 11,663 | |
| Total Natural Gas (mcf/d) | 144,356 | | 130,724 | | 136,667 | | | 125,871 | | 130,823 | | 135,531 | | 64,732 | | | 64,033 | |
| | | | | | | | | | |
| Total (boe/d) | 133,019 | | 129,176 | | 132,788 | | | 130,407 | | 132,186 | | 148,641 | | 119,384 | | | 111,217 | |
| | | | | |
| CRESCENT POINT ENERGY CORP. | 25 |
| | | | | | | | |
Directors Barbara Munroe, Chair (6) James Craddock (2) (3) (5) John Dielwart (3) (4) Ted Goldthorpe (1) (5) Mike Jackson (1) (5) Jennifer Koury (2) (5) Francois Langlois (1) (3) (4) Myron Stadnyk (2) (3) (4) Mindy Wight (1) (2) Craig Bryksa (4) (1) Member of the Audit Committee of the Board of Directors (2) Member of the Human Resources and Compensation Committee of the Board of Directors (3) Member of the Reserves Committee of the Board of Directors (4) Member of the Environment, Safety and Sustainability Committee of the Board of Directors (5) Member of the Corporate Governance and Nominating Committee (6) Chair of the Board serves in an ex officio capacity on each Committee Officers Craig Bryksa President and Chief Executive Officer Ken Lamont Chief Financial Officer Ryan Gritzfeldt Chief Operating Officer Mark Eade Senior Vice President, General Counsel and Corporate Secretary Garret Holt Senior Vice President, Corporate Development Michael Politeski Vice President, Finance and Treasurer Shelly Witwer Vice President, Business Development Head Office Suite 2000, 585 - 8th Avenue S.W. Calgary, Alberta T2P 1G1 Tel: (403) 693-0020 Fax: (403) 693-0070 Toll Free: (888) 693-0020 Banker The Bank of Nova Scotia Calgary, Alberta | | Auditor PricewaterhouseCoopers LLP Calgary, Alberta Legal Counsel Norton Rose Fulbright Canada LLP Calgary, Alberta Evaluation Engineers McDaniel & Associates Consultants Ltd. Calgary, Alberta Registrar and Transfer Agent Investors are encouraged to contact Crescent Point's Registrar and Transfer Agent for information regarding their security holdings: Computershare Trust Company of Canada 600, 530 - 8th Avenue S.W. Calgary, Alberta T2P 3S8 Tel: (403) 267-6800 Stock Exchanges Toronto Stock Exchange - TSX New York Stock Exchange - NYSE Stock Symbol CPG Investor Contacts Shant Madian Vice President, Capital Markets (403) 693-0020
Sarfraz Somani Manager, Investor Relations (403) 693-0020 |
| | | | | |
| CRESCENT POINT ENERGY CORP. | 26 |