Exhibit 99.2
MANAGEMENT’S DISCUSSION AND ANALYSIS
Management's discussion and analysis (“MD&A”) is dated May 9, 2024 and should be read in conjunction with the unaudited consolidated financial statements for the period ended March 31, 2024 for a full understanding of the financial position and results of operations of Crescent Point Energy Corp. (the “Company” or “Crescent Point”). Except as otherwise noted, the results of operations present only continuing operations. Comparative period results have been revised to reflect current period presentation.
The unaudited consolidated financial statements and comparative information for the period ended March 31, 2024, are presented under IFRS Accounting Standards as issued by the International Accounting Standards Board.
Structure of the Business
The principal undertaking of Crescent Point is to carry on the business of acquiring, developing and holding interests in petroleum and natural gas properties and assets related thereto through a general partnership and wholly owned subsidiaries. Amounts in this MD&A are in Canadian dollars unless noted otherwise. References to “US$” and "US dollars" are to United States (“U.S.”) dollars.
Overview
Crescent Point's first quarter 2024 results were highlighted by continued operational execution and the successful integration of the Alberta Montney assets of Hammerhead Energy Inc. ('Hammerhead"), which were acquired in December 2023. Total production averaged 198,551 boe/d for the quarter, up 43 percent from the first quarter of 2023, primarily attributable to growing volumes in the Alberta Montney. The first quarter saw an active capital program, with development capital expenditures of $398.6 million and 45 (38.8 net) wells drilled. The Company continued to realize a strong operating netback of $36.60 per boe despite weaker oil differentials during the first quarter, mainly due to the Company's improved cost structure associated with its Kaybob Duvernay and Alberta Montney assets.
Crescent Point achieved strong first quarter financial results, with adjusted funds flow from operations of $568.2 million, adjusted net earnings from operations of $187.0 million, and excess cash flow of $130.8 million. The Company reduced net debt by $155.2 million, ending the quarter with net debt of $3.58 billion or 1.5 times net debt to adjusted funds flow from operations. The Company recorded a non-cash impairment during the quarter related to certain assets being classified as held for sale, which resulted in a net loss of $411.7 million.
During the first quarter, the Company closed the sale of its Southern Alberta assets for total consideration of $38.1 million after closing adjustments along with the disposition of its Swan Hills assets for total consideration of $80.5 million after closing adjustments.
The Company remained active with its hedging portfolio during the quarter, protecting against commodity price volatility. The Company has approximately 45 percent of its oil and liquids production and over 30 percent of its natural gas production hedged throughout the remainder of 2024, and approximately 10 percent of its oil and liquids production and 30 percent of its natural gas production hedged in the first half of 2025, net of royalty interest.
Subsequent to the quarter, the Company announced the disposition of non-core Saskatchewan assets for $600.0 million, prior to closing adjustments. The Company expects to direct net proceeds from the disposition toward its balance sheet to reduce long-term debt. In conjunction with the disposition, Crescent Point revised its 2024 annual average production guidance to 191,000 - 199,000 boe/d. Development capital expenditures guidance of $1.40 - $1.50 billion remained unchanged as a result of minimal spending budgeted for these assets for the remainder of 2024.
Development capital expenditures, operating netback, adjusted funds flow from operations, adjusted net earnings from operations, excess cash flow, net debt and net debt to adjusted funds flow from operations are specified financial measures that do not have any standardized meaning prescribed by IFRS and, therefore, may not be comparable with the calculation of similar measures presented by other entities. Refer to the Specified Financial Measures section in this MD&A for further information.
| | | | | |
| CRESCENT POINT ENERGY CORP. | 1 |
Presentation of Continuing and Discontinued Operations
In 2023, the Company completed the disposition of its North Dakota assets, which made up its Northern U.S. cash-generating unit ("CGU"). The Northern U.S. CGU represented a geographical area of the Company's operations, therefore, its results were classified as a discontinued operation in accordance with IFRS 5 Non-current Assets Held for Sale and Discontinued Operations. Refer to the Discontinued Operations in this MD&A for further information. The financial results for the period ended March 31, 2024 and March 31, 2023, are presented below to reconcile continuing and discontinued operations to total results.
The following table summarizes the Company's financial results from continuing and discontinued operations for the period ended March 31, 2024 and March 31, 2023:
| | | | | | | | | | | | | | | | | | | | | | | | | | | | | | | | | | | | | | | | | |
| | Three months ended March 31, 2024 | | Three months ended March 31, 2023 | |
| ($ millions) | | Continuing | | Discontinued | | Total | | Continuing (1) | | Discontinued (1) | | Total | |
| REVENUE AND OTHER INCOME | | | | | | | | | | | | | |
| Oil and gas sales | | 1,107.9 | | | — | | | 1,107.9 | | | 762.0 | | | 151.6 | | | 913.6 | | |
| Purchased product sales | | 28.3 | | | — | | | 28.3 | | | 19.8 | | | — | | | 19.8 | | |
| Royalties | | (113.9) | | | — | | | (113.9) | | | (86.0) | | | (38.5) | | | (124.5) | | |
| Oil and gas revenue | | 1,022.3 | | | — | | | 1,022.3 | | | 695.8 | | | 113.1 | | | 808.9 | | |
| Commodity derivative gains (losses) | | (213.3) | | | — | | | (213.3) | | | 13.2 | | | — | | | 13.2 | | |
| Other income (loss) | | 1.5 | | | (12.8) | | | (11.3) | | | 8.5 | | | — | | | 8.5 | | |
| | 810.5 | | | (12.8) | | | 797.7 | | | 717.5 | | | 113.1 | | | 830.6 | | |
| EXPENSES | | | | | | | | | | | | | |
| Operating | | 251.0 | | | — | | | 251.0 | | | 169.0 | | | 23.4 | | | 192.4 | | |
| Purchased product | | 29.8 | | | — | | | 29.8 | | | 20.5 | | | — | | | 20.5 | | |
| Transportation | | 81.8 | | | — | | | 81.8 | | | 32.8 | | | 2.7 | | | 35.5 | | |
| General and administrative | | 28.6 | | | — | | | 28.6 | | | 24.0 | | | 0.7 | | | 24.7 | | |
| Interest | | 60.8 | | | — | | | 60.8 | | | 16.0 | | | — | | | 16.0 | | |
| Foreign exchange gain | | (1.8) | | | — | | | (1.8) | | | (3.0) | | | — | | | (3.0) | | |
| Share-based compensation | | 12.2 | | | — | | | 12.2 | | | 17.5 | | | — | | | 17.5 | | |
| Depletion, depreciation and amortization | | 344.1 | | | — | | | 344.1 | | | 186.4 | | | 45.3 | | | 231.7 | | |
| Impairment | | 512.3 | | | — | | | 512.3 | | | — | | | — | | | — | | |
| Accretion and financing | | 6.8 | | | — | | | 6.8 | | | 7.0 | | | 0.1 | | | 7.1 | | |
| | 1,325.6 | | | — | | | 1,325.6 | | | 470.2 | | | 72.2 | | | 542.4 | | |
| Net income (loss) before tax | | (515.1) | | | (12.8) | | | (527.9) | | | 247.3 | | | 40.9 | | | 288.2 | | |
| | | | | | | | | | | | | |
| Tax expense (recovery) | | | | | | | | | | | | | |
| Current | | — | | | — | | | — | | | — | | | — | | | — | | |
| Deferred | | (116.2) | | | — | | | (116.2) | | | 62.5 | | | 9.0 | | | 71.5 | | |
| Net income (loss) | | (398.9) | | | (12.8) | | | (411.7) | | | 184.8 | | | 31.9 | | | 216.7 | | |
(1)Comparative period revised to reflect current period presentation.
Results of Operations
Production
| | | | | | | | | | | | | | | | | | | | | | | | | | |
| Three months ended March 31 | | | |
| 2024 | | 2023 | | % Change | | | | | | | |
| Crude oil and condensate (bbls/d) | 113,607 | | | 78,191 | | | 45 | | | | | | | | |
| NGLs (bbls/d) | 19,077 | | | 13,562 | | | 41 | | | | | | | | |
| Natural gas (mcf/d) | 395,204 | | | 157,690 | | | 151 | | | | | | | | |
| Production from continuing operations (boe/d) | 198,551 | | | 118,035 | | | 68 | | | | | | | | |
| Production from discontinued operations (boe/d) | — | | | 21,245 | | | (100) | | | | | | | | |
| Total average daily production (boe/d) | 198,551 | | | 139,280 | | | 43 | | | | | | | | |
| Crude oil and liquids - continuing operations (%) | 67 | | | 78 | | | (11) | | | | | | | | |
| Natural gas - continuing operations (%) | 33 | | | 22 | | | 11 | | | | | | | | |
| Total (%) | 100 | | | 100 | | | — | | | | | | | | |
| | | | | |
| CRESCENT POINT ENERGY CORP. | 2 |
The following is a summary of Crescent Point's production by area:
| | | | | | | | | | | | | | | | | | | | | | | | | | |
| Three months ended March 31 | | | |
| Production By Area (boe/d) | 2024 | | 2023 | | % Change | | | | | | | |
| Alberta | 136,810 | | | 53,704 | | | 155 | | | | | | | | |
| Saskatchewan | 61,741 | | | 64,331 | | | (4) | | | | | | | | |
| Production from continuing operations | 198,551 | | | 118,035 | | | 68 | | | | | | | | |
| Production from discontinued operations - North Dakota | — | | | 21,245 | | | (100) | | | | | | | | |
| Total average daily production | 198,551 | | | 139,280 | | | 43 | | | | | | | | |
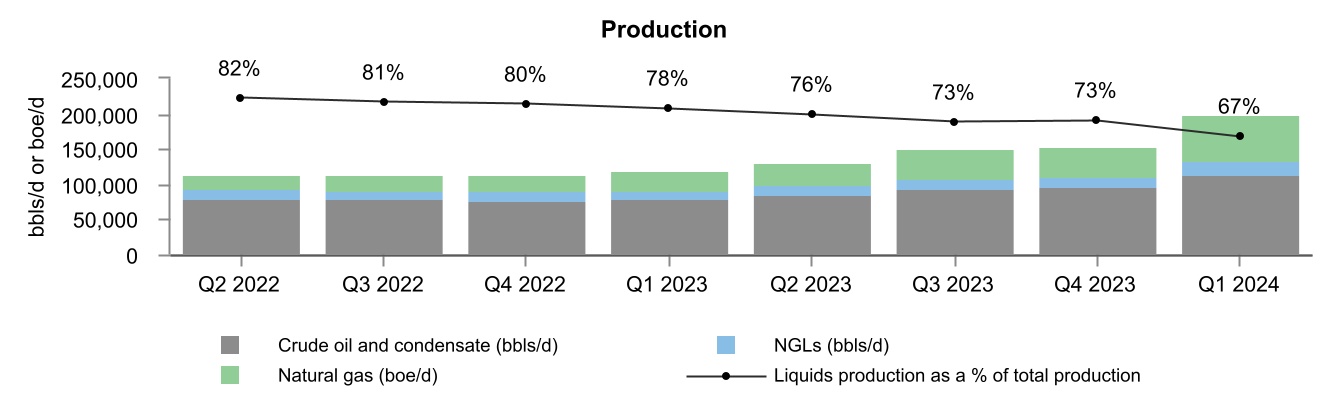
Production from continuing operations averaged 198,551 boe/d during the first quarter of 2024 compared to 118,035 boe/d in the first quarter of 2023, representing an increase of 68 percent. The increase is primarily due to the acquisitions of the Alberta Montney assets in May and December 2023, along with organic growth from the Company's development program.
The Company's weighting to crude oil and liquids production in the three months ended March 31, 2024, decreased by 11 percent. The decrease was mainly due to the increased production in the Alberta Montney assets mentioned above, which have a higher weighting of natural gas production.
Exhibit 1
(1)The results are presented on a continuing operations basis. Comparative period results have been revised to reflect current period presentation.
Marketing and Prices
| | | | | | | | | | | | | | | | | | | | | | | | | | |
| Three months ended March 31 | | | |
Average Selling Prices (1) | 2024 | | 2023 | | % Change | | | | | | | |
| Crude oil and condensate ($/bbl) | 90.22 | | | 92.64 | | | (3) | | | | | | | | |
| NGLs ($/bbl) | 37.38 | | | 41.63 | | | (10) | | | | | | | | |
| Natural gas ($/mcf) | 3.07 | | | 4.17 | | | (26) | | | | | | | | |
| Total ($/boe) | 61.32 | | | 71.73 | | | (15) | | | | | | | | |
(1)The average selling prices reported are before realized commodity derivatives and transportation.
| | | | | |
| CRESCENT POINT ENERGY CORP. | 3 |
| | | | | | | | | | | | | | | | | | | | | | | | | | |
| Three months ended March 31 | | | |
| Benchmark Pricing | 2024 | | 2023 | | % Change | | | | | | | |
| Crude Oil Prices | | | | | | | | | | | | |
WTI crude oil (US$/bbl) (1) | 76.97 | | | 76.11 | | | 1 | | | | | | | | |
| WTI crude oil (Cdn$/bbl) | 103.73 | | | 102.85 | | | 1 | | | | | | | | |
| Crude Oil and Condensate Differentials | | | | | | | | | | | | |
LSB crude oil (Cdn$/bbl) (2) | (14.22) | | | (8.74) | | | 63 | | | | | | | | |
FOS crude oil (Cdn$/bbl) (3) | (22.84) | | | (31.16) | | | (27) | | | | | | | | |
MSW crude oil (Cdn$/bbl) (4) | (11.64) | | | (3.85) | | | 202 | | | | | | | | |
C5+ condensate (Cdn$/bbl) (5) | (5.62) | | | 5.03 | | | (212) | | | | | | | | |
| Natural Gas Prices | | | | | | | | | | | | |
AECO daily spot natural gas (Cdn$/mcf) (6) | 2.51 | | | 3.23 | | | (22) | | | | | | | | |
| AECO monthly index natural gas (Cdn$/mcf) | 2.04 | | | 4.35 | | | (53) | | | | | | | | |
NYMEX natural gas (US$/mmbtu) (7) | 2.24 | | | 3.43 | | | (35) | | | | | | | | |
| Foreign Exchange Rate | | | | | | | | | | | | |
| Exchange rate (US$/Cdn$) | 0.742 | | | 0.740 | | | — | | | | | | | | |
(1)WTI refers to the West Texas Intermediate crude oil price.
(2)LSB refers to the Light Sour Blend crude oil price.
(3)FOS refers to the Fosterton crude oil price, which typically receives a premium to the Western Canadian Select ("WCS") price.
(4)MSW refers to Mixed Sweet Blend crude oil price.
(5)C5+ condensate refers to the Canadian C5+ condensate index.
(6)AECO refers to the Alberta Energy Company natural gas price.
(7)NYMEX refers to the New York Mercantile Exchange natural gas price.
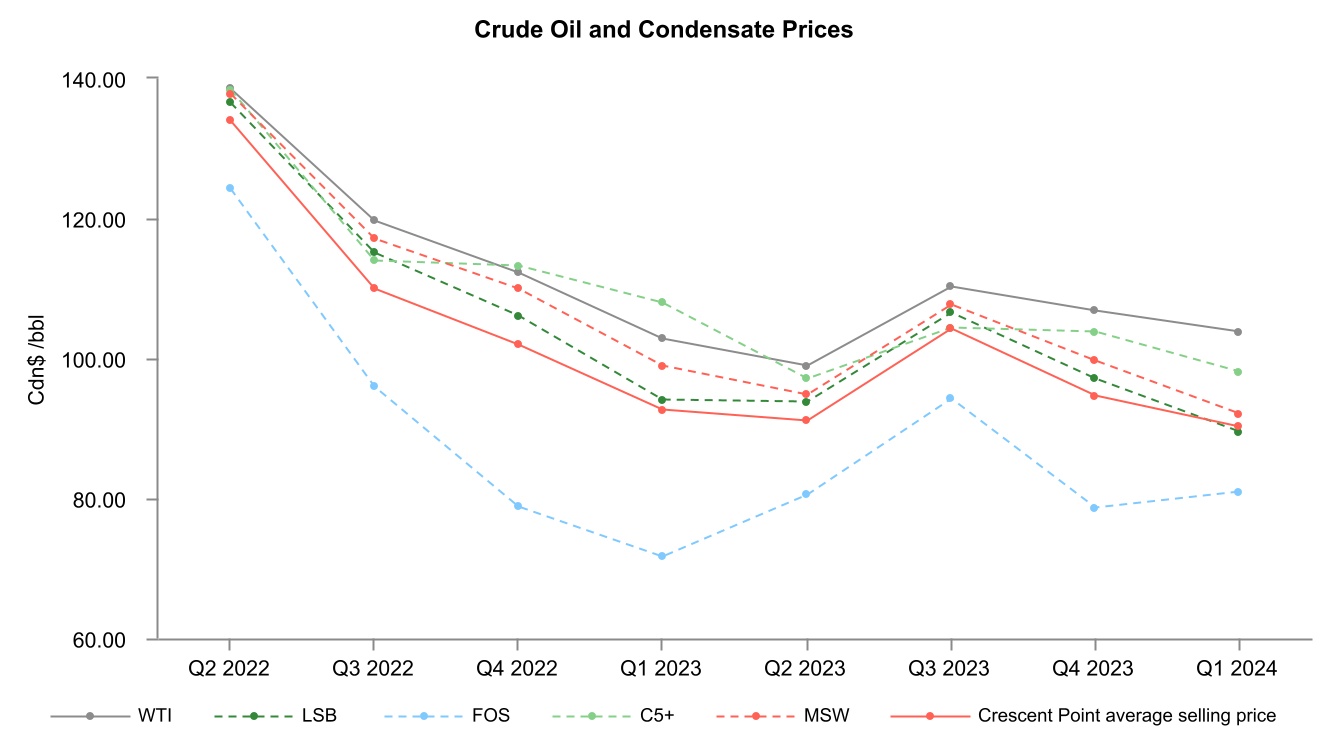
Benchmark crude oil prices remained consistent in the three months ended March 31, 2024, compared to the same period in 2023. Supply concerns around the conflicts in Ukraine and the Middle East and the extension of OPEC+ production cuts were largely offset by demand concerns around worldwide economic uncertainty.
Natural gas prices were significantly lower in the first quarter of 2024 compared to the same period in 2023, primarily due to a mild winter across most of North America, which resulted in below-average demand and led to large storage inventory levels. Increased production in both the U.S. and Canada provided further downward pressure on natural gas prices. The AECO daily and NYMEX benchmark prices decreased 22 percent and 35 percent, respectively, in the three months ended March 31, 2024 compared to the same period in 2023.
Exhibit 2
LSB and MSW crude oil differentials weakened in the three months ended March 31, 2024, compared to the same period in 2023, primarily due to increased crude oil supply in the Western Canadian Sedimentary Basin ("WCSB") coupled with inventory builds and delays on the Trans Mountain pipeline ("TMX") expansion in-service date. The delay of the TMX expansion increased apportionment on the Enbridge mainline, which reduced the available capacity to transport light and heavy crude out of the WCSB.
FOS crude oil differentials strengthened in the three months ended March 31, 2024, compared to the same period of 2023, primarily due to narrower WCS differentials. WCS differentials were unusually wide in the first quarter of 2023, largely due to the Strategic Petroleum Reserve release by the U.S. government and outages at North American refineries that process heavy crude oil.
Condensate differentials weakened in the three months ended March 31, 2024, compared to the same period in 2023, primarily due to higher production and weaker MSW pricing, which encouraged the market to blend sweet crude oil into the condensate stream and contributed to oversupply. Condensate inventory levels increased and exceeded the five year average, keeping differentials depressed.
| | | | | |
| CRESCENT POINT ENERGY CORP. | 4 |
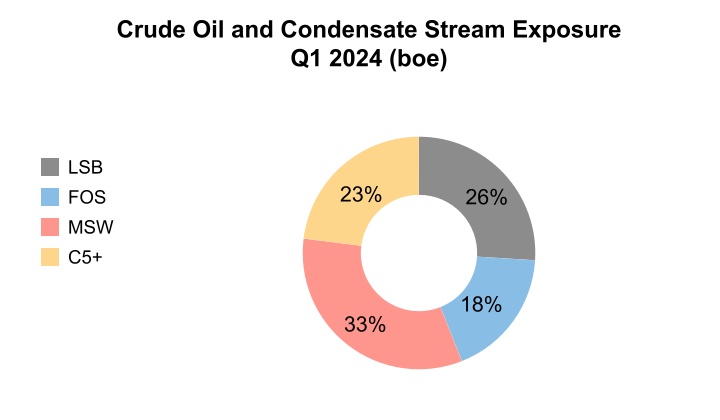
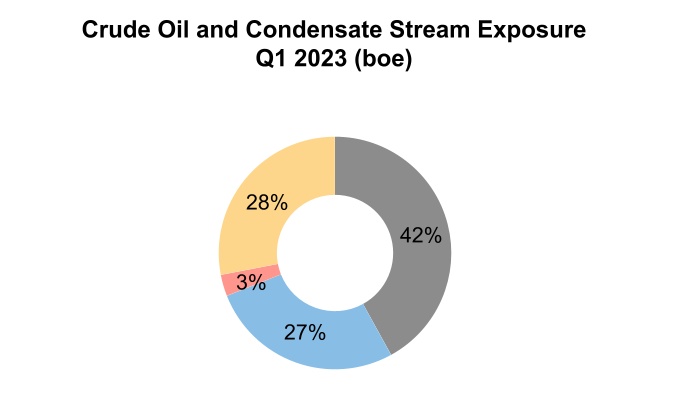
For the three months ended March 31, 2024, the Company's average selling price for crude oil and condensate decreased 3 percent from the same period in 2023. Although the Cdn$ WTI benchmark price remained consistent, weaker differentials adversely impacted the Company's realized prices. Crescent Point's corporate crude oil and condensate differential relative to Cdn$ WTI in the three months ended March 31, 2024 was $13.51 per bbl compared to $10.21 per bbl in 2023. The wider corporate differential was driven by weaker crude oil differentials, partially offset by additional exposure to MSW due to the acquisition of the Alberta Montney assets.
For the three months ended March 31, 2024, the Company's average selling price for NGLs decreased 10 percent from the same period in 2023, primarily due to a reduction in butane prices, partially offset by an increase in propane prices. The reduction in butane prices was largely due to record high inventories in the U.S. as a result of increased domestic production.
The Company's average selling price for natural gas decreased 26 percent in the three months ended March 31, 2024 compared to the same period in 2023, as a result of weaker AECO daily and NYMEX benchmark prices. The Company's gas production primarily trades at a slight premium to AECO pricing due to the Company selling a portion of its portfolio to U.S. markets.
Exhibit 3
Commodity Derivatives
Management of cash flow variability is an integral component of Crescent Point's business strategy. Crescent Point regularly monitors changing business and market conditions while executing its strategic risk management program. Crescent Point proactively manages the risk exposure inherent in movements in the price of crude oil, natural gas, interest rates, the Company's share price and the US/Cdn dollar exchange rate through the use of derivatives with investment-grade counterparties.
The Company's crude oil derivatives are referenced to WTI. The Company's natural gas derivatives are referenced to NYMEX and the AECO monthly index. Crescent Point utilizes a variety of derivatives, including swaps, swaptions, collars and put options, to protect against downward commodity price movements while also providing the opportunity for some upside participation during periods of rising prices. This reduces the volatility of the selling price of crude oil, NGLs and natural gas production and provides a measure of stability to the Company's cash flow. See Note 21 – "Financial Instruments and Derivatives" in the unaudited consolidated financial statements for the period ended March 31, 2024, for additional information on the Company's derivatives.
| | | | | |
| CRESCENT POINT ENERGY CORP. | 5 |
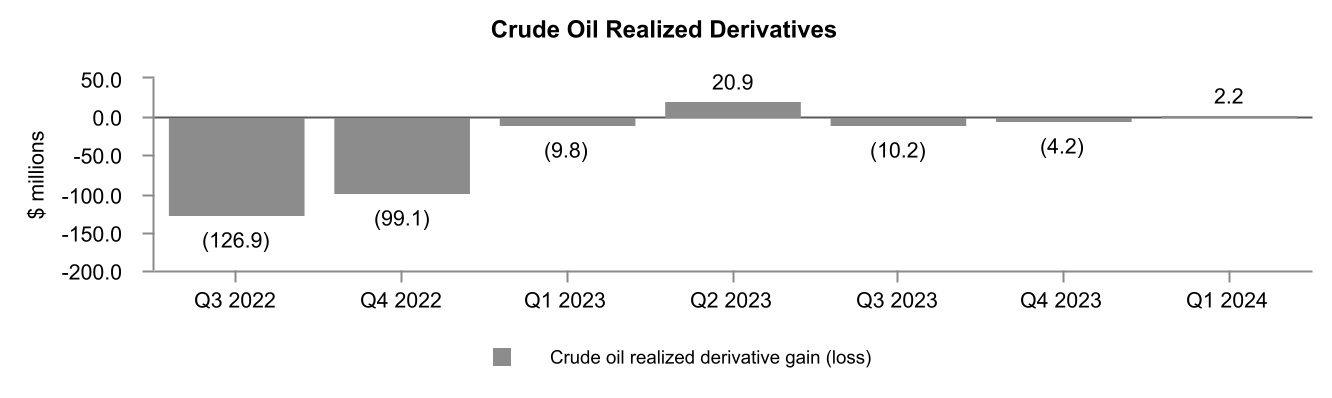
The following is a summary of the realized commodity derivative gains (losses):
| | | | | | | | | | | | | | | | | | | | | | | | | | |
| Three months ended March 31 | | | |
| ($ millions, except volume amounts) | 2024 | | 2023 | | % Change | | | | | | | |
| Average crude oil volumes hedged (bbls/d) | 57,861 | | | 21,000 | | | 176 | | | | | | | | |
| Crude oil realized derivative gain (loss) | 2.2 | | | (9.8) | | | (122) | | | | | | | | |
| per bbl - continuing operations | 0.21 | | | (1.39) | | | (115) | | | | | | | | |
| | | | | | | | | | | | |
| | | | | | | | | | | | |
| | | | | | | | | | | | |
Average natural gas volumes hedged (GJ/d) (1) (2) | 120,735 | | | 30,000 | | | 302 | | | | | | | | |
Natural gas realized derivative gain (2) | 2.3 | | | 2.4 | | | (4) | | | | | | | | |
| per GJ - continuing operations | 0.06 | | | 0.17 | | | (65) | | | | | | | | |
Average barrels of oil equivalent hedged (boe/d) (2) | 76,933 | | | 25,739 | | | 199 | | | | | | | | |
| | | | | | | | | | | | |
Total realized commodity derivative gains (losses) (2) | 4.5 | | | (7.4) | | | (161) | | | | | | | | |
| per boe - continuing operations | 0.25 | | | (0.70) | | | (136) | | | | | | | | |
| per boe - total average daily production | 0.25 | | | (0.59) | | | (142) | | | | | | | | |
(1)GJ/d is defined as gigajoules per day.
(2)The natural gas derivative gain for the three months ended March 31, 2024 and March 31, 2023 includes the realized derivative gains and losses on financial natural gas price differential contracts. The average natural gas volumes hedged and average barrels of oil equivalent hedged do not include the hedged volumes related to financial natural gas price differentials contracts.
The Company's realized derivative gain for crude oil was $2.2 million for the three months ended March 31, 2024, compared to a realized derivative loss of $9.8 million for the same period in 2023. The realized derivative gain was primarily attributable to the lower Cdn$ WTI benchmark price compared to the Company's average derivative crude oil price.
Crescent Point's realized derivative gain for natural gas was $2.3 million for the three months ended March 31, 2024, compared to $2.4 million for the same period in 2023. The realized gain in 2024 is primarily the result of the lower average AECO monthly index price compared to the Company's average derivative natural gas hedge price, partially offset by losses on the Company's natural gas differential contracts as a result of the narrower AECO to NYMEX differential.
Exhibit 4
(1)The results are presented on a continuing operations basis. Comparative period results have been revised to reflect current period presentation.
The following is a summary of the Company's unrealized commodity derivative gains (losses):
| | | | | | | | | | | | | | | | | | | | | | | | | | |
| Three months ended March 31 | | | |
| ($ millions) | 2024 | | 2023 | | % Change | | | | | | | |
| Crude oil | (193.8) | | | 28.0 | | | (792) | | | | | | | | |
| | | | | | | | | | | | |
| Natural gas | (24.0) | | | (7.4) | | | 224 | | | | | | | | |
| Total unrealized commodity derivative gains (losses) | (217.8) | | | 20.6 | | | (1,157) | | | | | | | | |
For the three months ended March 31, 2024, the Company recognized a total unrealized derivative loss of $217.8 million on its commodity contracts compared to an unrealized gain of $20.6 million for the same period in 2023. The unrealized crude oil derivative loss in 2024 was primarily attributable to the increase in the Cdn$ WTI forward benchmark prices at March 31, 2024, compared to December 31, 2023. The unrealized loss on natural gas derivative contracts for the three months ended March 31, 2024, was primarily due to the narrower forward AECO to NYMEX differential at March 31, 2024, compared to December 31, 2023.
| | | | | |
| CRESCENT POINT ENERGY CORP. | 6 |
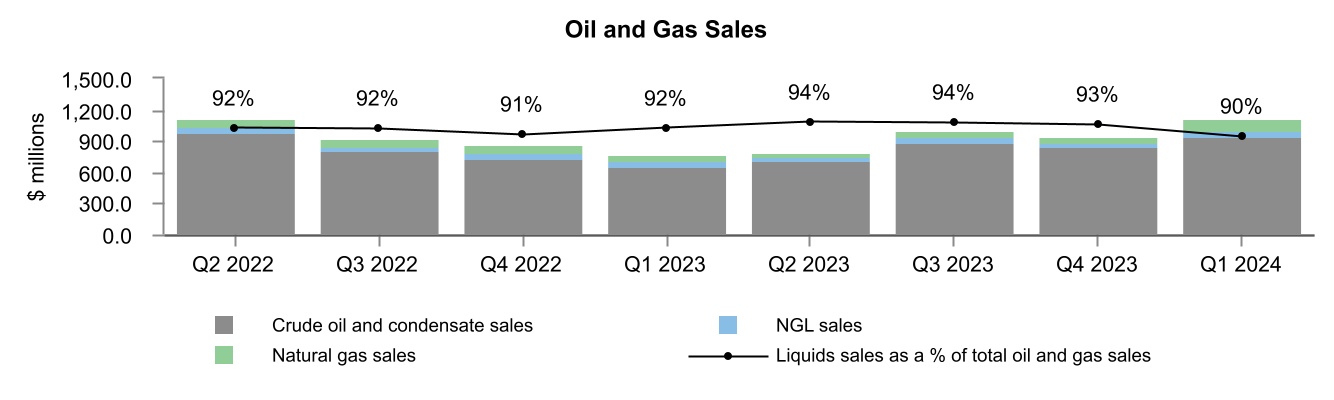
Oil and Gas Sales
| | | | | | | | | | | | | | | | | | | | | | | | | | |
| Three months ended March 31 | | | |
($ millions) (1) | 2024 | | 2023 | | % Change | | | | | | | |
| Crude oil and condensate sales | 932.7 | | | 652.0 | | | 43 | | | | | | | | |
| NGL sales | 64.9 | | | 50.8 | | | 28 | | | | | | | | |
| Natural gas sales | 110.3 | | | 59.2 | | | 86 | | | | | | | | |
| Total oil and gas sales | 1,107.9 | | | 762.0 | | | 45 | | | | | | | | |
(1)Oil and gas sales are reported before realized commodity derivatives.
Total oil and gas sales increased by 45 percent in the three months ended March 31, 2024, compared to the same period in 2023, due to higher production volumes, partially offset by lower average selling prices.
Exhibit 5
(1)The results are presented on a continuing operations basis. Comparative period results have been revised to reflect current period presentation.
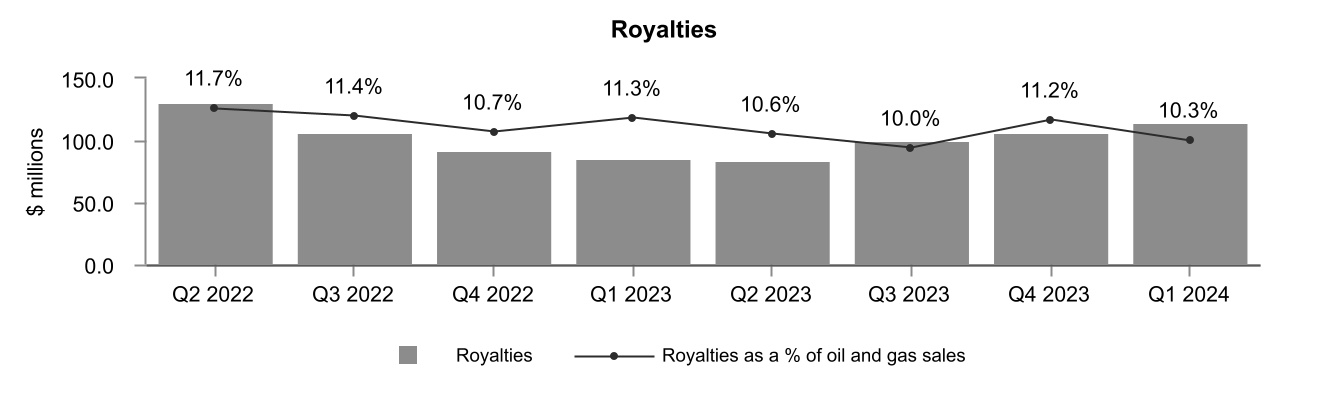
Royalties
| | | | | | | | | | | | | | | | | | | | | | | | | | |
| Three months ended March 31 | | | |
| ($ millions, except % and per boe amounts) | 2024 | | 2023 | | % Change | | | | | | | |
| Royalties | 113.9 | | | 86.0 | | | 32 | | | | | | | | |
| As a % of oil and gas sales | 10.3 | | | 11.3 | | | (1) | | | | | | | | |
| Per boe | 6.30 | | | 8.10 | | | (22) | | | | | | | | |
Royalties increased 32 percent in the three months ended March 31, 2024, compared to the same period in 2023, due to the increase in oil and gas sales, partially offset by a lower average royalty rate. Royalties as a percentage of oil and gas sales in the first quarter of 2024 decreased compared to the same period in 2023, primarily due to the addition of the lower royalty rate Alberta Montney assets.
Royalties per boe decreased 22 percent in the three months ended March 31, 2024, compared to the same period in 2023. This is primarily attributable to lower average realized prices and the lower average royalty rate described above.
Exhibit 6
(1)The results are presented on a continuing operations basis. Comparative period results have been revised to reflect current period presentation.
| | | | | |
| CRESCENT POINT ENERGY CORP. | 7 |
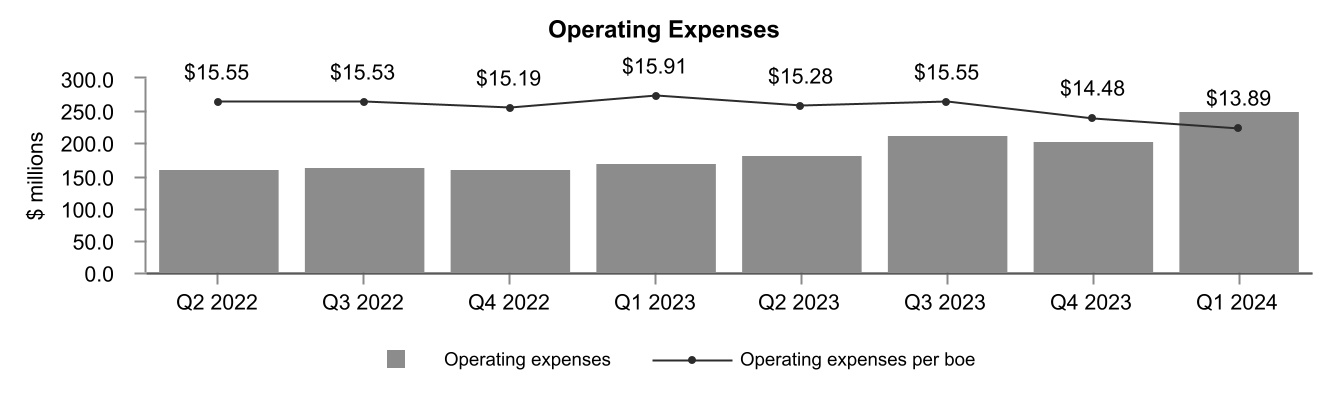
Operating Expenses
| | | | | | | | | | | | | | | | | | | | | | | | | | |
| Three months ended March 31 | | | |
| ($ millions, except per boe amounts) | 2024 | | 2023 | | % Change | | | | | | | |
| Operating expenses | 251.0 | | | 169.0 | | | 49 | | | | | | | | |
| Per boe | 13.89 | | | 15.91 | | | (13) | | | | | | | | |
Operating expenses increased 49 percent in the first quarter of 2024 compared to the first quarter of 2023. The increase was primarily due to the acquisitions of producing assets in the Alberta Montney in May and December 2023.
Operating expenses decreased 13 percent on a boe basis as the Alberta Montney assets have lower per boe operating costs.
Exhibit 7
(1)The results are presented on a continuing operations basis. Comparative period results have been revised to reflect current period presentation.
Transportation Expenses
| | | | | | | | | | | | | | | | | | | | | | | | | | |
| Three months ended March 31 | | | |
| ($ millions, except per boe amounts) | 2024 | | 2023 | | % Change | | | | | | | |
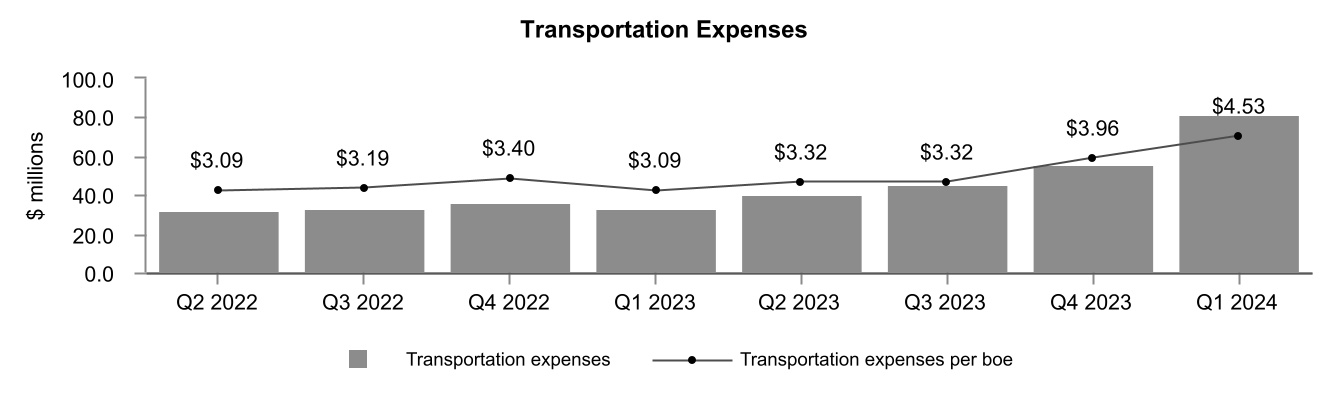
| Transportation expenses | 81.8 | | | 32.8 | | | 149 | | | | | | | | |
| Per boe | 4.53 | | | 3.09 | | | 47 | | | | | | | | |
Transportation expenses increased 149 percent in the three months ended March 31, 2024, compared to the same period in 2023, primarily due to higher production from acquired assets in the Alberta Montney and higher tariff rates. On a per boe basis, transportation expenses increased 47 percent in the first quarter of 2024 compared to the same period in 2023, primarily due to the higher tariff rates associated with the Alberta Montney assets and additional tariffs incurred to access favorable pricing in the U.S. Midwest natural gas market.
Exhibit 8
(1)The results are presented on a continuing operations basis. Comparative period results have been revised to reflect current period presentation.
| | | | | |
| CRESCENT POINT ENERGY CORP. | 8 |
Netback
| | | | | | | | | | | | | | | | | | | | | | | | | | |
| Three months ended March 31 | | | |
($/boe) (1) | 2024 | | 2023 | | % Change | | | | | | | |
| Oil and gas sales | 61.32 | | | 71.73 | | | (15) | | | | | | | | |
| Royalties | (6.30) | | | (8.10) | | | (22) | | | | | | | | |
| Operating expenses | (13.89) | | | (15.91) | | | (13) | | | | | | | | |
| Transportation expenses | (4.53) | | | (3.09) | | | 47 | | | | | | | | |
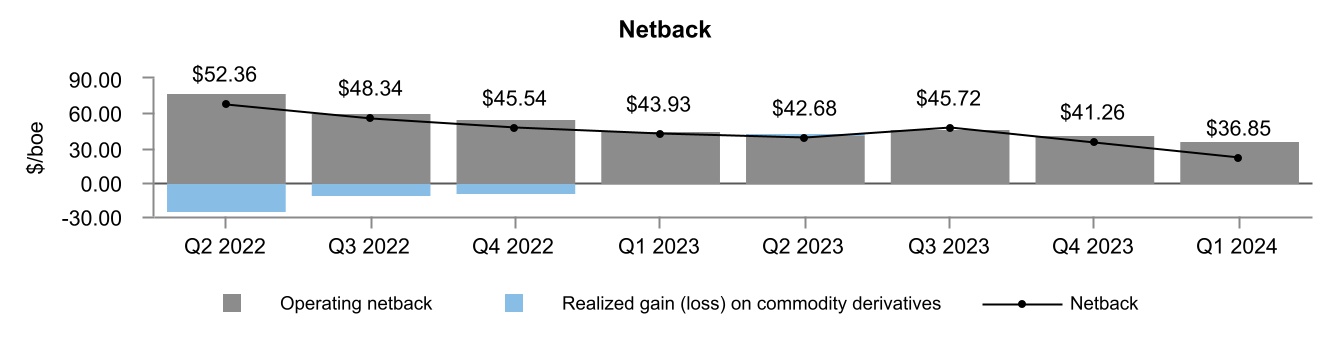
Operating netback (2) | 36.60 | | | 44.63 | | | (18) | | | | | | | | |
| Realized gain (loss) on commodity derivatives | 0.25 | | | (0.70) | | | (136) | | | | | | | | |
Netback (2) | 36.85 | | | 43.93 | | | (16) | | | | | | | | |
(1)The dominant production category for the Company's properties is crude oil and condensate. These categories include associated natural gas and NGL volumes, therefore, the total operating netback and netback have been presented.
(2)Specified financial measure that does not have any standardized meaning prescribed by IFRS and, therefore, may not be comparable with the calculation of similar measures presented by other entities. Refer to the Specified Financial Measures section in this MD&A for further information.
The Company's operating netback for the three months ended March 31, 2024, decreased to $36.60 per boe from $44.63 per boe in the same period in 2023. The decrease in the Company's operating netback was primarily due to the decrease in average selling price and the increase in transportation expenses, partially offset by lower operating expenses and royalties. The decrease in the Company's netback was a result of the decrease in the operating netback, partially offset by the realized gain on commodity derivatives in the first quarter of 2024 compared to a realized loss in the same period of 2023.
Exhibit 9
(1)The results are presented on a continuing operations basis. Comparative period results have been revised to reflect current period presentation.
General and Administrative Expenses
| | | | | | | | | | | | | | | | | | | | | | | | | | |
| Three months ended March 31 | | | |
| ($ millions, except per boe amounts) | 2024 | | 2023 | | % Change | | | | | | | |
| Gross general and administrative expenses | 44.2 | | | 37.3 | | | 18 | | | | | | | | |
| Overhead recoveries | (5.2) | | | (4.4) | | | 18 | | | | | | | | |
| Capitalized | (10.4) | | | (8.9) | | | 17 | | | | | | | | |
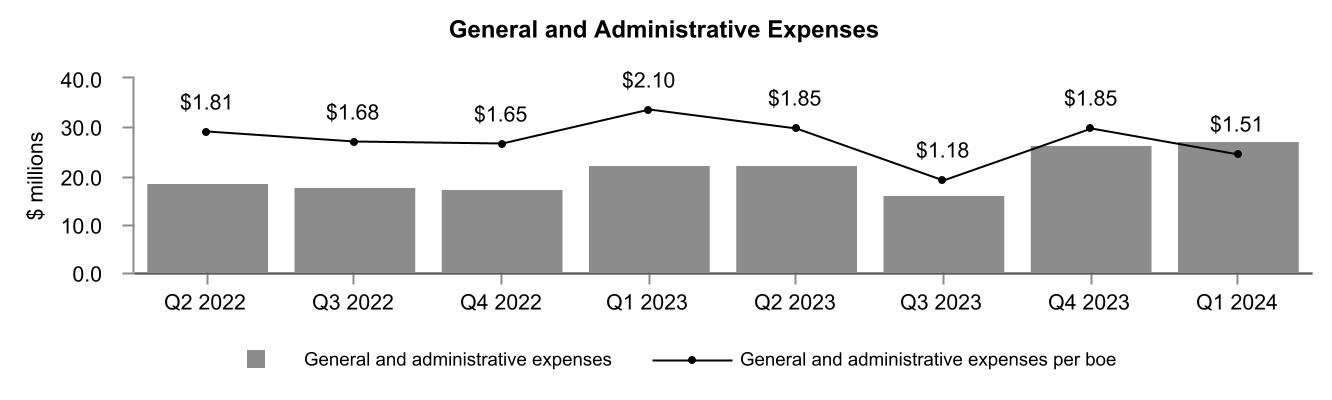
| Total general and administrative expenses | 28.6 | | | 24.0 | | | 19 | | | | | | | | |
| Transaction costs | (1.3) | | | (1.8) | | | (28) | | | | | | | | |
| General and administrative expenses | 27.3 | | | 22.2 | | | 23 | | | | | | | | |
| Per boe | 1.51 | | | 2.09 | | | (28) | | | | | | | | |
General and administrative ("G&A") expenses increased to $27.3 million in the three months ended March 31, 2024, compared to $22.2 million in the same period in 2023. The increase is primarily due to higher employee related costs, professional fees and information systems costs.
For the three months ended March 31, 2024, G&A expenses on a per boe basis decreased 28 percent compared to the same period in 2023, primarily due to higher production volumes and synergies achieved through the Company's acquisitions.
Transaction costs relate to the Company's acquisition and disposition transactions in Canada. Refer to the Capital Acquisitions and Dispositions section in this MD&A for further information.
| | | | | |
| CRESCENT POINT ENERGY CORP. | 9 |
Exhibit 10
(1)The results are presented on a continuing operations basis. Comparative period results have been revised to reflect current period presentation.
Interest Expense
| | | | | | | | | | | | | | | | | | | | | | | | | | |
| Three months ended March 31 | | | |
| ($ millions, except per boe amounts) | 2024 | | 2023 | | % Change | | | | | | | |
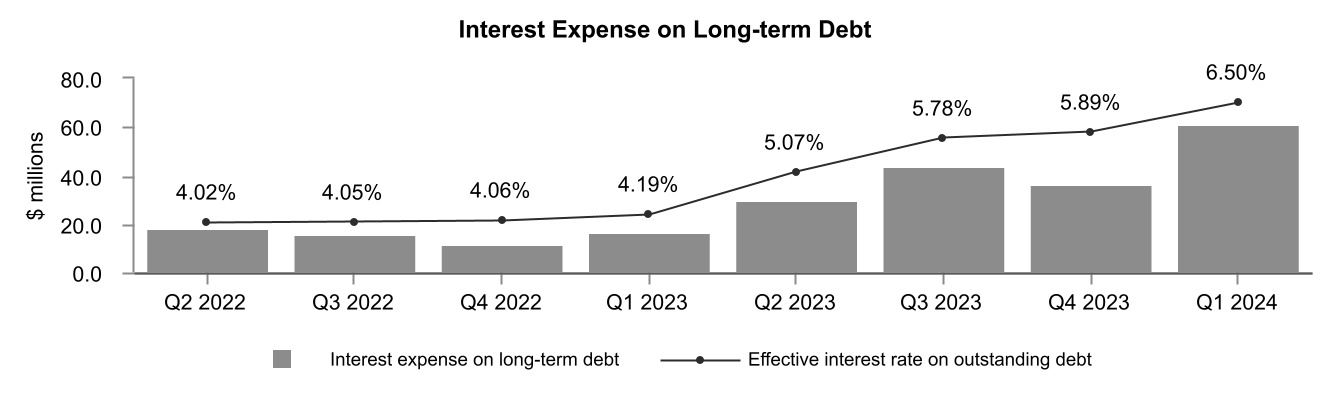
| Interest expense on long-term debt | 61.3 | | | 16.1 | | | 281 | | | | | | | | |
| Unrealized (gain) loss on interest derivative contracts | (0.5) | | | (0.1) | | | 400 | | | | | | | | |
| Interest expense | 60.8 | | | 16.0 | | | 280 | | | | | | | | |
| Per boe - continuing operations | 3.37 | | | 1.51 | | | 123 | | | | | | | | |
| Per boe - total average daily production | 3.37 | | | 1.28 | | | 163 | | | | | | | | |
Interest expense on long-term debt increased 281 percent in the first quarter of 2024 compared to the same period in 2023, due to the Company's higher average debt balance and higher effective interest rate. The Company's higher average debt balance in 2024 was due to the acquisitions in 2023. The Company's effective interest rate increased to 6.50 percent in 2024 compared to 4.19 percent in 2023 due to higher benchmark interest rates.
At March 31, 2024, approximately 25 percent of the Company's outstanding long-term debt had fixed interest rates.
Exhibit 11
Foreign Exchange Gain
| | | | | | | | | | | | | | | | | | | | | | | | | | |
| Three months ended March 31 | | | |
| ($ millions) | 2024 | | 2023 | | % Change | | | | | | | |
| Realized loss on CCS - principal | (2.4) | | | (0.3) | | | 700 | | | | | | | | |
| Translation of US dollar long-term debt | (65.8) | | | 0.9 | | | (7,411) | | | | | | | | |
| Unrealized gain on CCS - principal and foreign exchange swaps | 64.3 | | | 2.9 | | | 2,117 | | | | | | | | |
| Other | 5.7 | | | (0.5) | | | (1,240) | | | | | | | | |
| Foreign exchange gain | 1.8 | | | 3.0 | | | (40) | | | | | | | | |
| | | | | |
| CRESCENT POINT ENERGY CORP. | 10 |
The Company hedges its foreign exchange exposure using a combination of cross currency swaps ("CCS") and foreign exchange swaps. During the three months ended March 31, 2024, the Company realized a $2.4 million loss on CCS related to US dollar denominated Secured Overnight Financing Rate loan maturities due to the stronger Canadian dollar at maturity relative to the Company's average CCS foreign exchange rate.
The Company records foreign exchange gains or losses on the period end translation of US dollar long-term debt and related accrued interest. For the three months ended March 31, 2024, the Company recorded foreign exchange losses of $65.8 million, which were attributed to the weaker Canadian dollar at March 31, 2024 as compared to December 31, 2023.
For the three months ended March 31, 2024, Crescent Point recorded an unrealized derivative gain on CCS and foreign exchange swaps of $64.3 million due to the impact of the weaker forward Canadian dollar on the Company's CCS at March 31, 2024 as compared to December 31, 2023.
Share-based Compensation Expense
| | | | | | | | | | | | | | | | | | | | | | | | | | |
| Three months ended March 31 | | | |
| ($ millions, except per boe amounts) | 2024 | | 2023 | | % Change | | | | | | | |
| Share-based compensation costs | 20.3 | | | 17.5 | | | 16 | | | | | | | | |
| Realized gain on equity derivative contracts | (4.8) | | | (25.8) | | | (81) | | | | | | | | |
| Unrealized (gain) loss on equity derivative contracts | (0.1) | | | 27.5 | | | (100) | | | | | | | | |
| Capitalized | (3.2) | | | (1.7) | | | 88 | | | | | | | | |
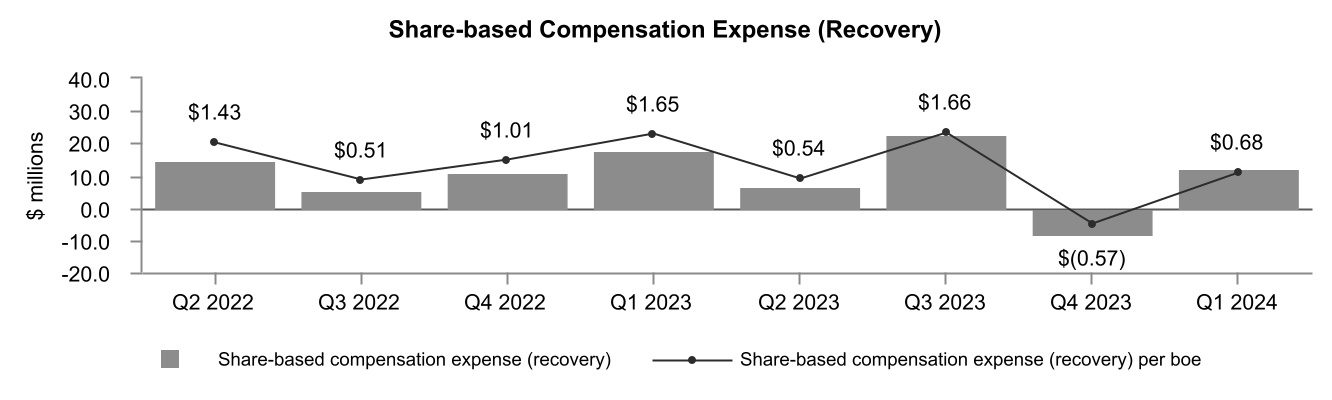
| Share-based compensation expense | 12.2 | | | 17.5 | | | (30) | | | | | | | | |
| Per boe | 0.68 | | | 1.65 | | | (59) | | | | | | | | |
During the three months ended March 31, 2024, the Company recorded share-based compensation ("SBC") costs of $20.3 million compared to $17.5 million in the same period of 2023. The higher SBC costs are primarily attributable to the higher share price at March 31, 2024 compared to December 31, 2023.
The Company recognized a realized gain of $4.8 million on the maturity of in-the-money equity derivative contracts during the first quarter of 2024. The realized gain is primarily due to the increase in the Company's share price compared to the hedge price at the time of grant.
The Company capitalized SBC costs of $3.2 million for the three months ended March 31, 2024, an increase of 88 percent from the same period in 2023. The increase was primarily due to the increase in total SBC costs mentioned above.
Exhibit 12
| | | | | |
| CRESCENT POINT ENERGY CORP. | 11 |
The following table summarizes the number of restricted shares, Employee Share Value Plan ("ESVP") awards, Performance Share Units ("PSUs"), Deferred Share Units ("DSUs") and stock options outstanding:
| | | | | | | | | | | | | | |
| March 31, 2024 | | December 31, 2023 | |
Restricted Share Bonus Plan (1) | 1,380,685 | | | 1,380,685 | | |
| Employee Share Value Plan | 2,759,631 | | | 2,660,066 | | |
Performance Share Unit Plan (2) | 2,844,523 | | | 1,623,248 | | |
| Deferred Share Unit Plan | 1,757,589 | | | 1,728,423 | | |
Stock Option Plan (3) | 3,203,260 | | | 3,224,260 | | |
(1)At March 31, 2024, the Company was authorized to issue up to 9,774,533 common shares (December 31, 2023 - 9,774,533 common shares).
(2)Based on underlying units before any effect of performance multipliers.
(3)At March 31, 2024, the weighted average exercise price is $4.74 per share (December 31, 2023 - $4.74 per share).
As of the date of this MD&A, the Company had 1,116,754 restricted shares, 3,058,279 ESVP awards, 2,844,523 PSUs, 1,810,036 DSUs and 2,749,270 stock options outstanding.
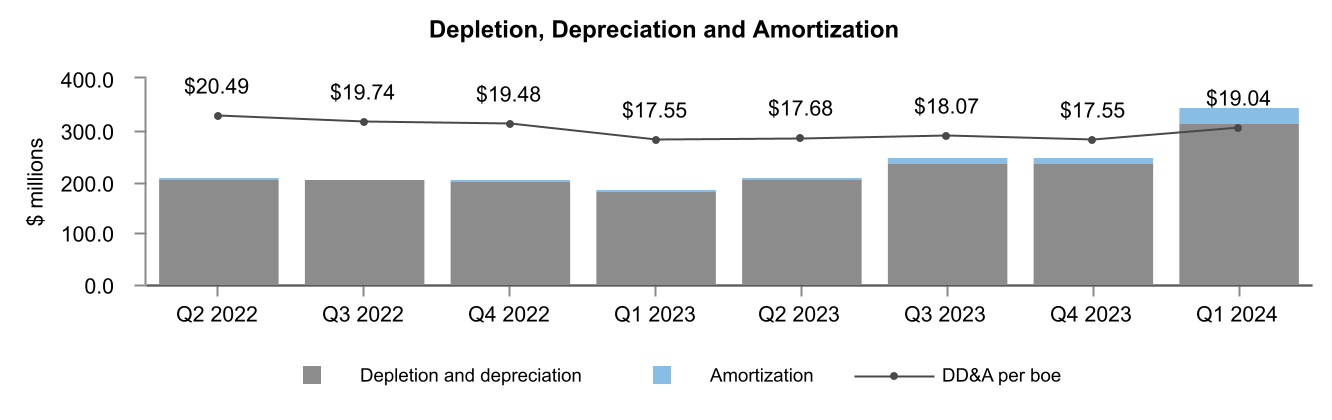
Depletion, Depreciation and Amortization
| | | | | | | | | | | | | | | | | | | | | | | | | | |
| Three months ended March 31 | | | |
| ($ millions, except per boe amounts) | 2024 | | 2023 | | % Change | | | | | | | |
| Depletion and depreciation | 314.5 | | | 183.8 | | | 71 | | | | | | | | |
| Amortization of exploration and evaluation undeveloped land | 29.6 | | | 2.6 | | | 1,038 | | | | | | | | |
| Depletion, depreciation and amortization | 344.1 | | | 186.4 | | | 85 | | | | | | | | |
| | | | | | | | | | | | |
| | | | | | | | | | | | |
| Per boe | 19.04 | | | 17.55 | | | 8 | | | | | | | | |
For the three months ended March 31, 2024, the Company's depletion, depreciation and amortization ("DD&A") rate increased to $19.04 per boe compared to $17.55 per boe in the same period in 2023. The increase in the DD&A rate per boe in 2024 was due to the increase in amortization of exploration and evaluation ("E&E") undeveloped land, primarily as a result of the acquisition of the Alberta Montney assets in May 2023 and December 2023.
DD&A expense increased 85 percent in the three months ended March 31, 2024, compared to the same period in 2023, primarily due to higher production volumes and an increased DD&A rate in 2024.
Exhibit 13
Impairment
| | | | | | | | | | | | | | | | | | | | | | | | | | |
| Three months ended March 31 | | | |
| ($ millions, except per boe amounts) | 2024 | | 2023 | | % Change | | | | | | | |
| | | | | | | | | | | | |
| | | | | | | | | | | | |
| | | | | | | | | | | | |
| | | | | | | | | | | | |
| Impairment | 512.3 | | | — | | | (100) | | | | | | | | |
| | | | | | | | | | | | |
| | | | | | | | | | | | |
| | | | | | | | | | | | |
| Per boe | 28.35 | | | — | | | (100) | | | | | | | | |
The Company recognized an impairment loss of $512.3 million in the first quarter of 2024. At March 31, 2024, the Company classified certain non-core assets in its Southeast Saskatchewan and Southwest Saskatchewan cash-generating units ("CGUs") as held for sale. Immediately prior to classifying the assets as held for sale and at the balance sheet date, the Company conducted a review of the assets' estimated recoverable amounts and recorded impairment losses of $486.8 million on Property, Plant & Equipment ("PP&E") and $25.5 million on goodwill. The recoverable amount was determined based on the assets' fair value less costs of disposal and based on expected consideration. See Note 8 – "Property, Plant and Equipment" in the unaudited consolidated financial statements for the period ended March 31, 2024, for further information.
| | | | | |
| CRESCENT POINT ENERGY CORP. | 12 |
Taxes
| | | | | | | | | | | | | | | | | | | | | | | | | | |
| Three months ended March 31 | | | |
| ($ millions) | 2024 | | 2023 | | % Change | | | | | | | |
| Current tax expense | — | | | — | | | — | | | | | | | | |
| Deferred tax expense (recovery) | (116.2) | | | 62.5 | | | (286) | | | | | | | | |
Current Tax Expense
In the first quarters of 2024 and 2023, the Company recorded current tax expense of nil. Refer to the Company's Annual Information Form ("AIF") for the year ended December 31, 2023 for information on the Company's expected tax horizon, which is available on SEDAR+ at www.sedarplus.ca. Additionally, our AIF forms part of our Form 40-F that is filed with the SEC and is available on EDGAR at www.sec.gov.
Deferred Tax Expense (Recovery)
In the three months ended March 31, 2024, the Company recorded a deferred tax recovery of $116.2 million compared to a deferred tax expense of $62.5 million in the same period of 2023. The deferred tax recovery in first quarter of 2024 reflects the pre-tax loss in the period.
Cash Flow from Operating Activities, Adjusted Funds Flow from Operations, Net Income (Loss) and Adjusted Net Earnings from Operations
| | | | | | | | | | | | | | | | | | | | | | | | | | |
| | | | |
| Three months ended March 31 | | | |
| ($ millions, except per share amounts) | 2024 | | 2023 | | % Change | | | | | | | |
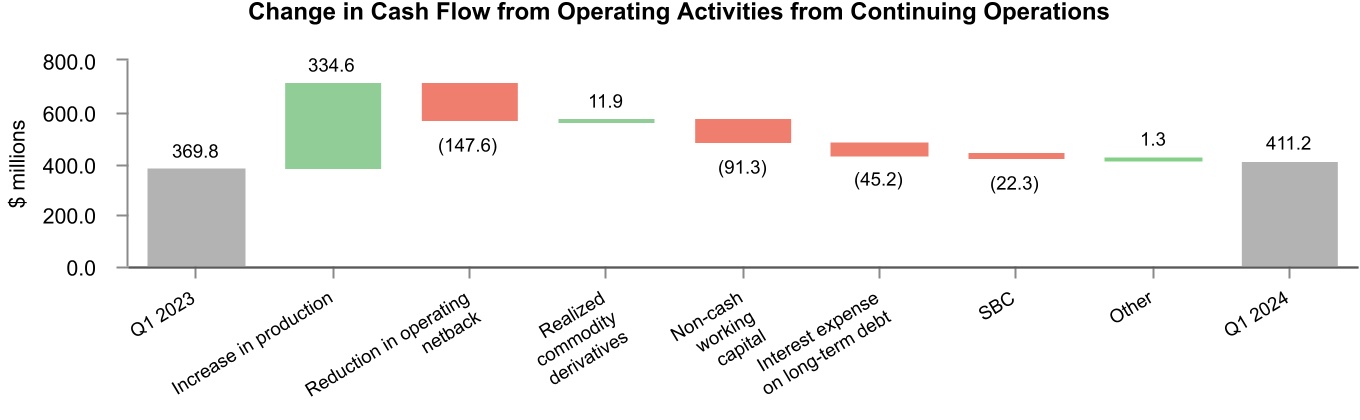
| Cash flow from operating activities from continuing operations | 411.2 | | | 369.8 | | | 11 | | | | | | | | |
| | | | | | | | | | | | |
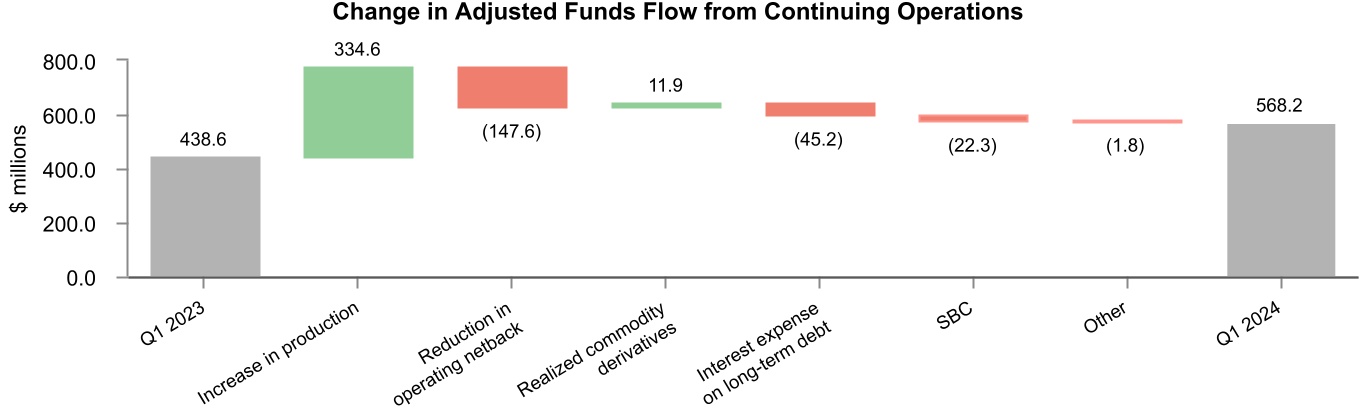
Adjusted funds flow from continuing operations (1) | 568.2 | | | 438.6 | | | 30 | | | | | | | | |
| | | | | | | | | | | | |
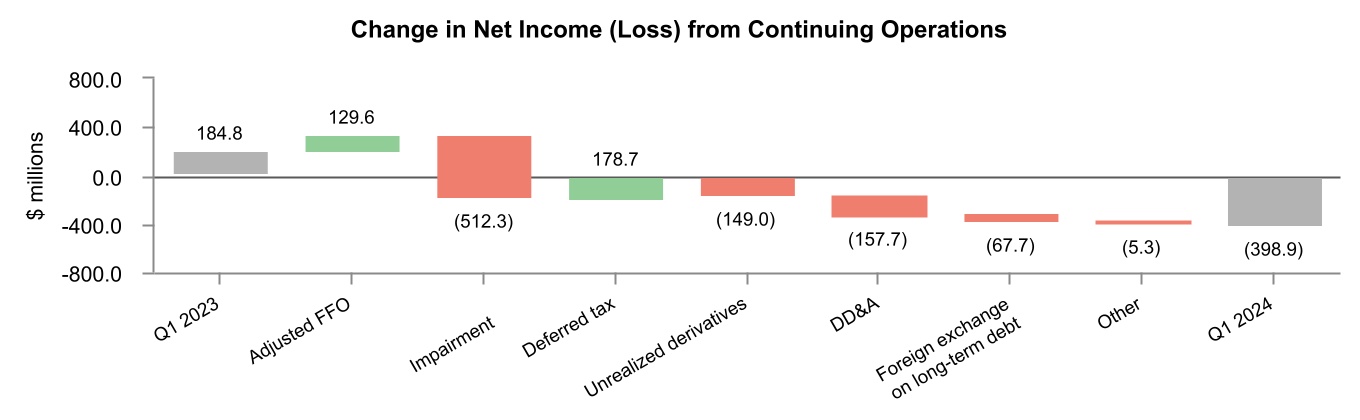
| Net income (loss) from continuing operations | (398.9) | | | 184.8 | | | (316) | | | | | | | | |
| Net income (loss) from continuing operations per share - diluted | (0.64) | | | 0.33 | | | (294) | | | | | | | | |
| | | | | | | | | | | | |
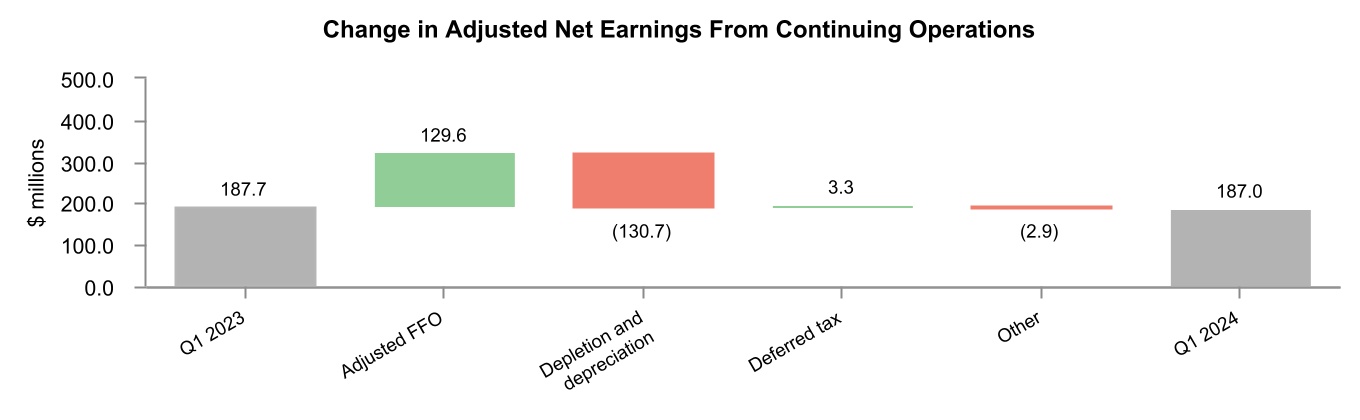
Adjusted net earnings from continuing operations (1) | 187.0 | | | 187.7 | | | — | | | | | | | | |
Adjusted net earnings from continuing operations per share - diluted (1) | 0.30 | | | 0.34 | | | (12) | | | | | | | | |
(1)Specified financial measure that does not have any standardized meaning prescribed by IFRS and, therefore, may not be comparable with the calculation of similar measures presented by other entities. Refer to the Specified Financial Measures section in this MD&A for further information.
Cash flow from operating activities from continuing operations increased from $369.8 million in first quarter of 2023 to $411.2 million in the first quarter 2024. The increase in cash flow from operating activities was primarily due to increased production, partially offset by the fluctuations in total operating netback, non-cash working capital and interest expense on long-term debt.
Exhibit 14
The Company's adjusted funds flow from continuing operations increased from $438.6 million in the three months ended March 31, 2023, to $568.2 million in three months ended March 31, 2024. The increase was primarily due to the higher production, partially offset by the decrease in total operating netback and increase in interest expense on long-term debt.
| | | | | |
| CRESCENT POINT ENERGY CORP. | 13 |
Exhibit 15
The Company reported a net loss from continuing operations of $398.9 million for the three months ended March 31, 2024 ($0.64 per fully diluted share) compared to net income from continuing operations of $184.8 million in the same period in 2023 ($0.33 per fully diluted share). The change in net income (loss) was primarily due to the impairment recorded in the first quarter of 2024.
Exhibit 16
The Company's adjusted net earnings from continuing operations was $187.0 million for the three months ended March 31, 2024 ($0.30 per fully diluted share) compared to $187.7 million in the same period of 2023 ($0.34 per fully diluted share). Adjusted net earnings remained relatively consistent between periods, as increased production drove higher adjusted funds flow, but this increase was largely offset by the lower operating netback and higher depletion and depreciation expense.
Exhibit 17
Excess Cash Flow
Excess cash flow decreased from $153.4 million in the first quarter of 2023 to $130.8 million in the same period in 2024, primarily as a result of higher capital expenditures, partially offset by the increase in adjusted funds flow from operations.
| | | | | |
| CRESCENT POINT ENERGY CORP. | 14 |
Discontinued Operations
| | | | | | | | | | | | | | | | | | | | | | | | | | |
| Three months ended March 31 | | | |
| ($ millions, except per share amounts) | 2024 | | 2023 | | % Change | | | | | | | |
| Cash flow from operating activities from discontinued operations | — | | | 103.6 | | | (100) | | | | | | | | |
| | | | | | | | | | | | |
Adjusted funds flow from discontinued operations (1) | — | | | 86.3 | | | (100) | | | | | | | | |
| | | | | | | | | | | | |
| Net income (loss) from discontinued operations | (12.8) | | | 31.9 | | | (140) | | | | | | | | |
| Net income (loss) from discontinued operations per share - diluted | (0.02) | | | 0.06 | | | (133) | | | | | | | | |
| | | | | | | | | | | | |
Adjusted net earnings from discontinued operations (1) | — | | | 31.2 | | | (100) | | | | | | | | |
Adjusted net earnings from discontinued operations per share - diluted (1) | — | | | 0.06 | | | (100) | | | | | | | | |
(1)Specified financial measure that does not have any standardized meaning prescribed by IFRS and, therefore, may not be comparable with the calculation of similar measures presented by other entities. Refer to the Specified Financial Measures section in this MD&A for further information.
The Company recognized a net loss from discontinued operations of $12.8 million for the three months ended March 31, 2024, compared to net income from discontinued operations of $31.9 million in the same period of 2023. The net loss in the first quarter of 2024 was a result of final closing adjustments related to the sale of the North Dakota assets.
Dividends Declared
| | | | | | | | | | | | | | | | | | | | | | | | | | |
| Three months ended March 31 | | | |
| ($ millions, except per share amounts) | 2024 | | 2023 | | % Change | | | | | | | |
| Dividends declared | 71.3 | | | 17.1 | | | 317 | | | | | | | | |
| Dividends declared per share | 0.115 | | | 0.032 | | | 259 | | | | | | | | |
| | | | | | | | | | | | |
| | | | | | | | | | | | |
In February 2024, Crescent Point declared a quarterly dividend of $0.115 per share to be paid on April 1, 2024, which was an increase of 15 percent from the prior dividend level.
Capital Expenditures
| | | | | | | | | | | | | | | | | | | | | | | | | | |
| Three months ended March 31 | | | |
| ($ millions) | 2024 | | 2023 | | % Change | | | | | | | |
Development capital expenditures (1) | 398.6 | | | 314.2 | | | 27 | | | | | | | | |
| Land expenditures | 7.7 | | | 1.3 | | | 492 | | | | | | | | |
Capitalized administration (2) | 13.6 | | | 11.4 | | | 19 | | | | | | | | |
| Corporate assets | 1.1 | | | 0.5 | | | 120 | | | | | | | | |
| | | | | | | | | | | | |
| Capital acquisitions | — | | | 372.0 | | | (100) | | | | | | | | |
Capital dispositions (3) | (105.8) | | | (2.6) | | | 3,969 | | | | | | | | |
Total (4) | 315.2 | | | 696.8 | | | (55) | | | | | | | | |
(1)Specified financial measures that does not have any standardized meaning prescribed by IFRS and, therefore may not be comparable with the calculation of similar measures presented by other entities. Refer to the Specified Financial Measures section in this MD&A for further information.
(2)Capitalized administration excludes capitalized equity-settled SBC.
(3)Includes dispositions recorded through assets held for sale.
(4)Includes both continuing and discontinued operations.
Capital Acquisitions and Dispositions
Major Property Dispositions
North Dakota disposition
In 2023, the Company completed the disposition of its North Dakota assets. In the quarter ended March 31, 2024, the Company incurred $12.8 million in final closing adjustments related to the disposition. Refer to the Discontinued Operations section in this MD&A for further information.
Southern Alberta disposition
On January 26, 2024, the Company completed the disposition of its Southern Alberta assets for total consideration of $38.1 million, after closing adjustments. Total consideration consisted of $13.1 million in cash and $25.0 million of deferred consideration receivable. These assets were recorded as assets held for sale at December 31, 2023.
Swan Hills disposition
On March 21, 2024, the Company completed the disposition of its Swan Hills assets in Northern Alberta for total consideration of $80.5 million, after closing adjustments. These assets were recorded as assets held for sale at December 31, 2023.
| | | | | |
| CRESCENT POINT ENERGY CORP. | 15 |
Assets Held for Sale
At March 31, 2024, the Company classified certain non-core assets in its Southeast Saskatchewan and Southwest Saskatchewan CGUs as held for sale. Upon classification, assets held for sale were recorded at their recoverable amount. The Company announced the disposition of these assets in May 2024. Refer to the Subsequent Events section in this MD&A for further information.
Development Capital Expenditures
| | | | | | | | | | | | | | | | | | | | | | | | | | |
| | | | |
| Three months ended March 31 | | | |
| ($ millions) | 2024 | | 2023 | | % Change | | | | | | | |
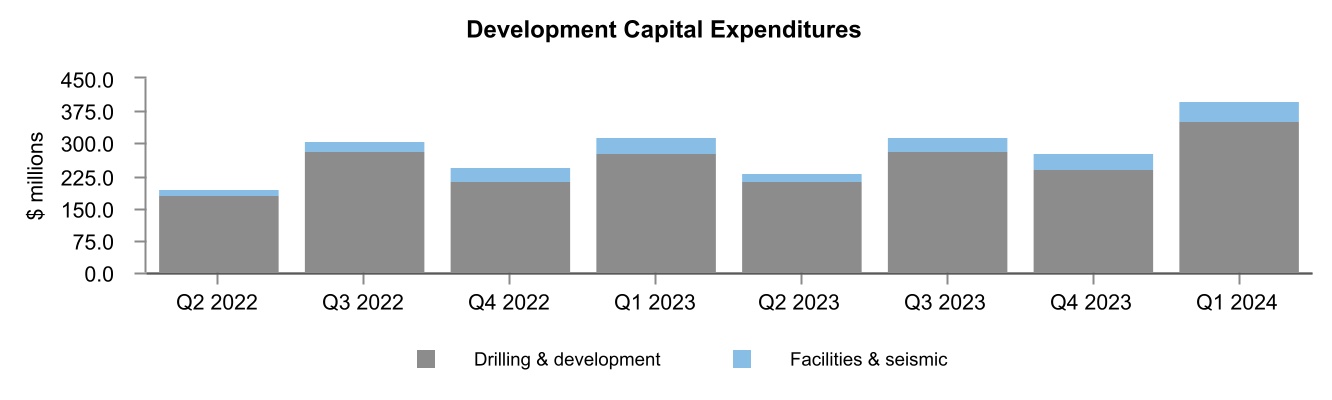
| Development capital expenditures from continuing operations | 398.6 | | | 185.0 | | | 115 | | | | | | | | |
| Development capital expenditures from discontinued operations | — | | | 129.2 | | | (100) | | | | | | | | |
| Development capital expenditures | 398.6 | | | 314.2 | | | 27 | | | | | | | | |
The Company's development capital expenditures for the three months ended March 31, 2024, were $398.6 million, compared to $314.2 million in the same period in 2023. The increase was primarily due to increased activity in the Alberta Montney. In the first quarter of 2024, 45 (38.8 net) total wells were drilled and $48.1 million was spent on facilities and seismic ($33.7 million in the three months ended March 31, 2023).
Refer to the Guidance section in this MD&A for Crescent Point's development capital expenditure guidance for 2024.
Exhibit 18
Lease Liability
At March 31, 2024, the Company had $135.9 million of lease liabilities for contracts related to office space, fleet vehicles, equipment and drilling rigs.
Decommissioning Liability
The decommissioning liability decreased by $142.9 million in the first quarter of 2024, from $738.8 million at December 31, 2023 to $595.9 million at March 31, 2024. The decrease primarily relates to liabilities disposed through capital dispositions and the Company's continued abandonment and reclamation program. The liability is based on estimated undiscounted cash flows before inflation to settle the obligation of $851.7 million.
Liquidity and Capital Resources
| | | | | | | | | | | | | | |
Capitalization Table ($ millions, except share, per share, ratio and percent amounts) | March 31, 2024 | | December 31, 2023 | |
Net debt (1) | 3,582.9 | | | 3,738.1 | | |
| Shares outstanding | 619,027,284 | | | 619,929,490 | | |
| Market price at end of period (per share) | 11.08 | | | 9.19 | | |
| Market capitalization | 6,858.8 | | | 5,697.2 | | |
Enterprise value (1) | 10,441.7 | | | 9,435.3 | | |
Net debt as a percentage of enterprise value (1) | 34 | | | 40 | | |
Adjusted funds flow from operations (1) (2) | 2,382.4 | | | 2,339.1 | | |
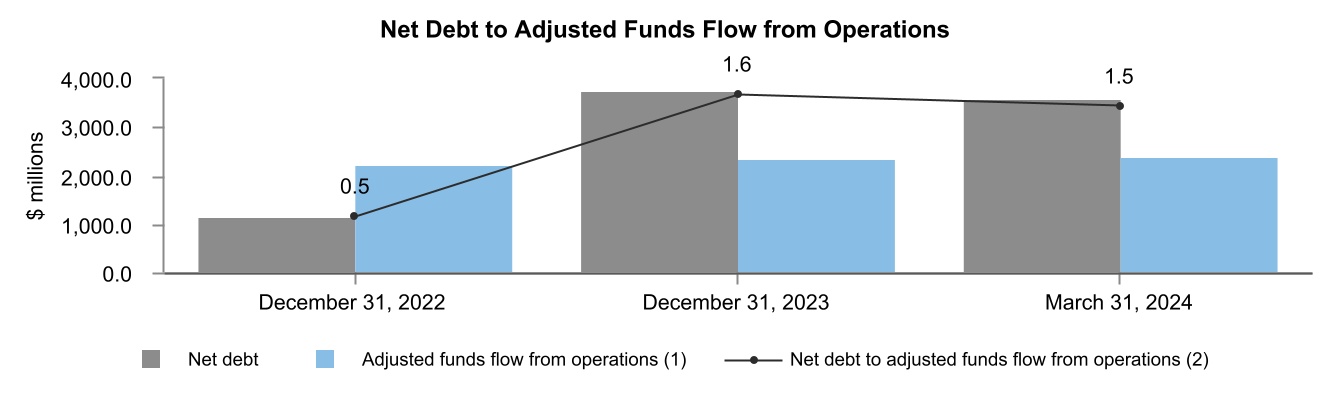
Net debt to adjusted funds flow from operations (1) (3) | 1.5 | | | 1.6 | | |
(1)Specified financial measure that does not have any standardized meaning prescribed by IFRS and, therefore, may not be comparable with the calculation of similar measures presented by other entities. Refer to the Specified Financial Measures section in this MD&A for further information.
(2)The sum of adjusted funds flow from operations for the trailing four quarters. Includes both continuing and discontinued operations.
(3)The net debt reflects the financing of acquisitions, however, the adjusted funds flow from operations only reflects adjusted funds flow from operations generated from the acquired properties since the closing date of the acquisitions.
| | | | | |
| CRESCENT POINT ENERGY CORP. | 16 |
At March 31, 2024, Crescent Point's enterprise value was $10.44 billion and the Company was capitalized with 66 percent equity compared to $9.44 billion and 60 percent at December 31, 2023, respectively. The Company's net debt to adjusted funds flow from operations ratio at March 31, 2024, decreased to 1.5 times from 1.6 times at December 31, 2023. The decrease was largely due to the reduction in net debt as a result of capital dispositions and excess cash flow generation in the first quarter of 2024.
Crescent Point's market capitalization increased to $6.86 billion at March 31, 2024, from $5.70 billion at December 31, 2023, primarily due to the increase in the Company's share price.
Exhibit 19
(1)The sum of adjusted funds flow from operations for the trailing four quarters.
(2)The net debt reflects the financing of acquisitions, however, the adjusted funds flow from operations only reflects adjusted funds flow from operations generated from the acquired properties since the closing date of the acquisitions.
At March 31, 2024, the Company had combined revolving bank credit facilities of $2.82 billion. This includes a $2.26 billion unsecured syndicated credit facility and a $100.0 million unsecured operating facility, both with a maturity date of November 26, 2026 and extendible annually. The Company also has an additional $400.0 million unsecured syndicated credit facility that matures on May 10, 2025. At March 31, 2024, the Company had available unused borrowing capacity on its revolving bank credit facilities of approximately $796.0 million, including cash of $21.8 million.
At March 31, 2024, the Company had an outstanding drawn balance of $718.7 million under its syndicated bank term loan. The maturity date of the term loan is November 26, 2026.
The Company has a $60.0 million unsecured demand letter of credit facility with one Canadian chartered bank. The Company had letters of credit in the amount of $39.7 million outstanding at March 31, 2024.
At March 31, 2024, the Company had senior guaranteed notes of US$589.5 million and Cdn$105.0 million outstanding. The notes are unsecured and rank pari passu with the Company's bank credit facilities and carry a bullet repayment on maturity. The senior guaranteed notes have financial covenants similar to those of the combined credit facilities described above.
Concurrent with the issuance of senior guaranteed notes with total principal of US$517.0 million, the Company entered into CCS to manage the Company's foreign exchange risk. CCS fixes the US dollar amount of the individual tranches of notes for purposes of interest and principal repayments at a notional amount of $606.9 million. At March 31, 2024, $316.4 million of notional principal was repayable within one year. See Note 21 - "Financial Instruments and Derivatives" in the unaudited consolidated financial statements for the period ended March 31, 2024, for additional information.
The Company is in compliance with all debt covenants at March 31, 2024, which are listed in the table below:
| | | | | | | | | | | | | | |
| Covenant Description | Maximum Ratio | | March 31, 2024 | |
Senior debt to adjusted EBITDA (1) (2) | 3.50 | | 1.20 | |
Total debt to adjusted EBITDA (1) (3) | 4.00 | | 1.20 | |
Senior debt to capital (2) (4) | 0.55 | | 0.36 | |
(1)Adjusted EBITDA is calculated as earnings before interest, taxes, depletion, depreciation, amortization, impairment and impairment reversals, adjusted for certain non-cash items. Adjusted EBITDA is calculated on a trailing twelve month basis adjusted for material acquisitions and dispositions.
(2)Senior debt is calculated as the sum of amounts drawn on the combined facilities, outstanding letters of credit and the principal amount of the senior guaranteed notes.
(3)Total debt is calculated as the sum of senior debt plus subordinated debt. Crescent Point does not have any subordinated debt.
(4)Capital is calculated as the sum of senior debt and shareholders' equity and excludes the effect of unrealized derivative gains or losses and the adoption of IFRS 16.
The Company's ongoing working capital requirements are expected to be financed through cash, adjusted funds flow from operations and its bank credit facilities.
| | | | | |
| CRESCENT POINT ENERGY CORP. | 17 |
Shareholders' Equity
At March 31, 2024, Crescent Point had 619.0 million common shares issued and outstanding compared to 619.9 million common shares at December 31, 2023. The decrease of 0.9 million is primarily due to shares purchased for cancellation under the Company's current Normal Course Issuer Bid ("NCIB").
As of the date of this MD&A, the Company had 617,967,453 common shares outstanding.
Normal Course Issuer Bid
On March 7, 2024, the Company announced the approval by the Toronto Stock Exchange of its notice to implement an NCIB. This NCIB allows the Company to purchase, for cancellation, up to 61,663,522 common shares, or 10 percent of the Company's public float, as at February 29, 2024. This NCIB commenced on March 11, 2024 and is due to expire on March 10, 2025. The Company's previous NCIB commenced on March 9, 2023 and expired on March 8, 2024.
In the first quarter of 2024, the Company purchased 0.9 million common shares for a total consideration of $10.0 million under its current NCIB. The total cost paid, including commissions and fees, was recognized directly as a reduction in shareholders' equity. Under the NCIB, all common shares purchased are cancelled.
Subsequent Events
Disposition of Non-core Saskatchewan Assets
On May 6, 2024, the Company announced the disposition of non-core Saskatchewan assets for $600.0 million, prior to closing adjustments.
Critical Accounting Estimates
There have been no changes in Crescent Point's critical accounting estimates in the three months ended March 31, 2024. Further information on the Company's critical accounting policies and estimates can be found in the notes to the annual consolidated financial statements and MD&A for the year ended December 31, 2023.
Changes in Accounting Policies
Presentation of Financial Statements
IAS 1 Presentation of Financial Statements was amended in January 2020 by the International Accounting Standards Board to clarify the presentation requirements of liabilities as either current or non-current within the statement of financial position. The Company adopted this amendment in 2024 and the adoption did not have an impact on the Company's consolidated financial statements.
Income Taxes
IAS 12 Income Taxes was amended in May 2023 by the International Accounting Standards Board to provide guidance on deferred taxes arising in jurisdictions implementing the Pillar Two model rules published by the Organisation for Economic Co-operation and Development. This amendment was effective immediately and has been adopted by the Company with no impact to the Company's interim consolidated financial statements.
| | | | | |
| CRESCENT POINT ENERGY CORP. | 18 |
Summary of Quarterly Results
| | | | | | | | | | | | | | | | | | | | | | | | | | | | | | | | | | | |
| 2024 | 2023 | 2022 | |
| ($ millions, except per share amounts) | Q1 | Q4 | Q3 | Q2 | Q1 | | Q4 | Q3 | Q2 | | | | |
| Oil and gas sales from continuing operations | 1,107.9 | | 946.7 | | 998.7 | | 791.6 | | 762.0 | | | 864.2 | | 930.3 | | 1,120.5 | | | | | |
| Total oil and gas sales | 1,107.9 | | 1,012.4 | | 1,236.3 | | 949.6 | | 913.6 | | | 1,016.6 | | 1,097.3 | | 1,286.5 | | | | | |
| | | | | | | | | | | | | |
| Average daily production from continuing operations | | | | | | | | | | | | | |
| Crude oil and condensate (bbls/d) | 113,607 | | 96,144 | | 92,824 | | 84,944 | | 78,191 | | | 78,051 | | 79,077 | | 79,767 | | | | | |
| NGLs (bbls/d) | 19,077 | | 16,023 | | 16,119 | | 14,360 | | 13,562 | | | 13,427 | | 13,070 | | 12,962 | | | | | |
| Natural gas (mcf/d) | 395,204 | | 248,306 | | 244,777 | | 192,964 | | 157,690 | | | 139,206 | | 131,377 | | 120,635 | | | | | |
| Production from continuing operations (boe/d) | 198,551 | | 153,551 | | 149,739 | | 131,465 | | 118,035 | | | 114,679 | | 114,043 | | 112,835 | | | | | |
| Total average daily production (boe/d) | 198,551 | | 162,269 | | 180,581 | | 155,031 | | 139,280 | | | 134,124 | | 133,019 | | 129,176 | | | | | |
| | | | | | | | | | | | | |
| Net income (loss) from continuing operations | (398.9) | | 302.6 | | 133.6 | | 178.4 | | 184.8 | | | (577.8) | | 415.1 | | 279.6 | | | | | |
| Net income (loss) per share from continuing operations - diluted | (0.64) | | 0.54 | | 0.25 | | 0.33 | | 0.33 | | | (1.04) | | 0.73 | | 0.49 | | | | | |
| | | | | | | | | | | | | |
| Net income (loss) | (411.7) | | 951.2 | | (809.9) | | 212.3 | | 216.7 | | | (498.1) | | 466.4 | | 331.5 | | | | | |
| Net income (loss) per share – diluted | (0.66) | | 1.70 | | (1.52) | | 0.39 | | 0.39 | | | (0.90) | | 0.82 | | 0.58 | | | | | |
| | | | | | | | | | | | | |
Adjusted net earnings from continuing operations (1) | 187.0 | | 210.0 | | 226.6 | | 171.6 | | 187.7 | | | 165.5 | | 195.7 | | 212.5 | | | | | |
Adjusted net earnings from continuing operations per share – diluted (1) | 0.30 | | 0.37 | | 0.42 | | 0.32 | | 0.34 | | | 0.30 | | 0.35 | | 0.37 | | | | | |
| | | | | | | | | | | | | |
Adjusted net earnings from operations (1) | 187.0 | | 192.8 | | 315.5 | | 205.4 | | 218.9 | | | 209.8 | | 242.9 | | 272.1 | | | | | |
Adjusted net earnings from operations per share – diluted (1) | 0.30 | | 0.34 | | 0.59 | | 0.38 | | 0.40 | | | 0.38 | | 0.43 | | 0.47 | | | | | |
| | | | | | | | | | | | | |
| Cash flow from operating activities from continuing operations | 411.2 | | 524.0 | | 537.1 | | 365.9 | | 369.8 | | | 507.5 | | 530.5 | | 435.5 | | | | | |
| Cash flow from operating activities | 411.2 | | 611.3 | | 648.9 | | 462.1 | | 473.4 | | | 589.5 | | 647.0 | | 529.6 | | | | | |
| | | | | | | | | | | | | |
Adjusted funds flow from continuing operations (1) | 568.2 | | 535.1 | | 548.6 | | 453.4 | | 438.6 | | | 430.9 | | 479.1 | | 497.2 | | | | | |
Adjusted funds flow from operations (1) | 568.2 | | 574.5 | | 687.1 | | 552.6 | | 524.9 | | | 522.8 | | 576.5 | | 599.1 | | | | | |
| | | | | | | | | | | | | |
Adjusted working capital surplus (deficiency) (1) | (82.0) | | (196.3) | | (45.7) | | (82.5) | | (79.9) | | | 95.1 | | 47.9 | | (40.9) | | | | | |
| Total assets | 12,035.5 | | 12,775.7 | | 10,371.0 | | 11,277.2 | | 9,759.6 | | | 9,486.4 | | 10,437.6 | | 10,279.4 | | | | | |
| Total liabilities | 5,659.6 | | 5,908.2 | | 4,660.6 | | 4,597.5 | | 3,113.8 | | | 2,993.0 | | 3,224.6 | | 3,501.3 | | | | | |
Net debt (1) | 3,582.9 | | 3,738.1 | | 2,876.2 | | 3,000.7 | | 1,436.3 | | | 1,154.7 | | 1,198.3 | | 1,467.9 | | | | | |
| | | | | | | | | | | | | |
| Weighted average shares – diluted (millions) | 622.6 | | 559.1 | | 536.9 | | 545.3 | | 552.7 | | | 559.2 | | 567.4 | | 575.9 | | | | | |
| | | | | | | | | | | | | |
| Total capital acquisitions | — | | 2,513.9 | | 1.1 | | 1,702.7 | | 372.0 | | | 1.3 | | 88.2 | | 0.3 | | | | | |
| Total capital dispositions | (105.8) | | (602.4) | | (0.2) | | (8.4) | | (2.6) | | | 1.2 | | (244.1) | | (37.8) | | | | | |
| Development capital expenditures from continuing operations | 398.6 | | 276.0 | | 260.4 | | 123.5 | | 185.0 | | | 160.5 | | 224.3 | | 140.8 | | | | | |
Development capital expenditures (1) | 398.6 | | 278.9 | | 315.5 | | 230.1 | | 314.2 | | | 246.4 | | 308.5 | | 196.9 | | | | | |
| | | | | | | | | | | | | |
| Dividends declared | 71.3 | | 68.3 | | 71.7 | | 54.8 | | 17.1 | | | 118.8 | | 44.9 | | 37.1 | | | | | |
| Dividends declared per share | 0.115 | | 0.120 | | 0.135 | | 0.100 | | 0.032 | | | 0.215 | | 0.080 | | 0.065 | | | | | |
(1)Specified financial measure that does not have any standardized meaning prescribed by IFRS and, therefore, may not be comparable with the calculation of similar measures presented by other entities. Refer to the Specified Financial Measures section in this MD&A for further information.
Over the past eight quarters, the Company's oil and gas sales have fluctuated due to volatility in the crude oil, condensate and natural gas benchmark prices, changes in production and fluctuations in corporate oil price differentials. The Company's production has fluctuated due to changes in its development capital spending levels, acquisitions and dispositions and natural declines.
Net income (loss) has fluctuated over the past eight quarters, primarily due to changes in PP&E impairment charges and reversals, changes in adjusted funds flow from operations, unrealized derivative gains and losses, which fluctuate with changes in forward market prices and foreign exchange rates, gains and losses on capital dispositions, and fluctuations in deferred tax expense.
| | | | | |
| CRESCENT POINT ENERGY CORP. | 19 |
Adjusted net earnings from operations has fluctuated over the past eight quarters, primarily due to changes in adjusted funds flow from operations, depletion and share-based compensation expense along with associated fluctuations in deferred tax expense.
Development capital expenditures have also fluctuated throughout this period due to the timing of acquisitions, dispositions and changes in the Company's development capital spending levels which vary based on a number of factors, including the prevailing commodity price environment.
| | | | | |
| CRESCENT POINT ENERGY CORP. | 20 |
Disclosure Controls and Procedures
Crescent Point is required to comply with Multilateral Instrument 52-109 Certification of Disclosure on Issuers' Annual and Interim Filings. The certificate requires that Crescent Point disclose in the interim MD&A any weaknesses or changes in Crescent Point's internal control over financial reporting that occurred during the period that have materially affected, or are reasonably likely to materially affect Crescent Point's internal controls over financial reporting. Crescent Point confirms that no such weaknesses or changes were identified in the Company's internal controls over financial reporting during the first quarter 2024.
Guidance
Crescent Point's guidance for 2024 is as follows:
| | | | | | | | | | | | | | |
| Prior (1) | | Revised | |
Total Annual Average Production (boe/d) (2) | 198,000 - 206,000 | | 191,000 - 199,000 | |
| | | | |
| Capital Expenditures | | | | |
Development capital expenditures ($ millions) (3) | $1,400 - $1,500 | | $1,400 - $1,500 | |
| Capitalized administration ($ millions) | $40 | | $40 | |
Total ($ millions) (4) | $1,440 - $1,540 | | $1,440 - $1,540 | |
| | | | |
| Other Information | | | | |
Reclamation activities ($ millions) (5) | $40 | | $40 | |
| Capital lease payments ($ millions) | $20 | | $20 | |
| Annual operating expenses ($/boe) | $12.75 - $13.75 | | $12.50 - $13.50 | |
| Royalties | 10.00% - 11.00% | | 10.00% - 11.00% | |
| | | | |
| | | | |
| | | | |
| | | | |
| | | | |
| | | | |
| | | | |
| | | | |
| | | | |
(1)Prior guidance first published in the Company's December 21, 2023 press release.
(2)Total annual average production (boe/d) is comprised of approximately 65% Oil, Condensate & NGLs and 35% Natural Gas.
(3)Specified financial measures that does not have any standardized meaning prescribed by IFRS and, therefore may not be comparable with the calculation of similar measures presented by other entities. Refer to the Specified Financial Measures section in this MD&A for further information.
(4)Land expenditures and net property acquisitions and dispositions are not included. Development capital expenditures spend is allocated on an approximate basis as follows: 90% drilling & development and 10% facilities & seismic.
(5)Reflects Crescent Point's portion of its expected total budget.
Return of Capital Outlook
| | | | | | | | | | | | | | |
| Base Dividend | | | | |
| | | | |
| Current quarterly base dividend per share | | | $0.115 | |
| Total Return of Capital | | | | |
% of excess cash flow (1) | | | 60% | |
(1)Total return of capital is based on a framework that targets to return to shareholders 60% of excess cash flow on an annual basis. Refer to the Specified Financial Measures section in this MD&A for further information on base dividends and excess cash flow.
Additional information relating to Crescent Point, including the Company's December 31, 2023 AIF, which along with other relevant documents are available on SEDAR+ at www.sedarplus.ca. Additionally, our AIF forms part of our Form 40-F that is filed with the SEC and is available on EDGAR at www.sec.gov.
| | | | | |
| CRESCENT POINT ENERGY CORP. | 21 |
Specified Financial Measures
Throughout this MD&A, the Company uses the terms “total operating netback”, "total operating netback from continuing operations", "total netback”, “total netback from continuing operations”, "operating netback", "netback", “adjusted funds flow from operations” (or "adjusted FFO"), “adjusted funds flow from continuing operations”, “adjusted funds flow from discontinued operations”, "excess cash flow", "base dividends", "adjusted working capital (surplus) deficiency", “net debt”, “enterprise value”, “net debt to adjusted funds flow from operations”, "net debt as a percentage of enterprise value", “adjusted net earnings from operations”, “adjusted net earnings from continuing operations”, “adjusted net earnings from continuing operations per share – diluted”, “adjusted net earnings from discontinued operations”, “adjusted net earnings from discontinued operations per share – diluted”, “adjusted net earnings from operations per share - diluted”, and "development capital expenditures". These terms do not have any standardized meaning as prescribed by IASB and, therefore, may not be comparable with the calculation of similar measures presented by other issuers.
Total operating netback and total netback are historical non-GAAP financial measures. Total operating netback is calculated as oil and gas sales, less royalties, operating and transportation expenses. Total netback is calculated as total operating netback plus realized commodity derivative gains and losses. Total operating netback and total netback are common metrics used in the oil and gas industry and are used to measure operating results to better analyze performance against prior periods on a comparable basis. The most directly comparable financial measure to total operating netback and total netback is oil and gas sales.
The following table reconciles oil and gas sales to total operating netback and total netback from continuing operations:
| | | | | | | | | | | | | | | | | | | | | | | | | | |
| | | | |
| Three months ended March 31 | | | |
| ($ millions) | 2024 | | 2023 | | % Change | | | | | | | |
| | | | | | | | | | | | |
| Oil and gas sales | 1,107.9 | | | 762.0 | | | 45 | | | | | | | | |
| Royalties | (113.9) | | | (86.0) | | | 32 | | | | | | | | |
| Operating expenses | (251.0) | | | (169.0) | | | 49 | | | | | | | | |
| Transportation expenses | (81.8) | | | (32.8) | | | 149 | | | | | | | | |
| Total operating netback from continuing operations | 661.2 | | | 474.2 | | | 39 | | | | | | | | |
| Realized gain (loss) on commodity derivatives | 4.5 | | | (7.4) | | | (161) | | | | | | | | |
| Total netback from continuing operations | 665.7 | | | 466.8 | | | 43 | | | | | | | | |
Operating netback and netback are non-GAAP ratios and are calculated as total operating netback and total netback, respectively, divided by total production. Operating netback and netback are common metrics used in the oil and gas industry and are used to measure operating results on a per boe basis.
Base dividends is a historical non-GAAP financial measure and is calculated as dividends declared less special dividends declared as part of the Company’s return of capital framework and adjusted for timing of the dividend record date. Base dividends are based on a framework that targets dividend sustainability at lower commodity prices, allows for flexibility in the capital allocation process and dividend growth over time, and assists in determining the additional return of capital to shareholders as part of the Company’s return of capital framework.
Adjusted funds flow from operations is a capital management measure and is calculated based on cash flow from operating activities before changes in non-cash working capital, transaction costs and decommissioning expenditures funded by the Company. Transaction costs are excluded as they vary based on the Company's acquisition and disposition activity and to ensure that this metric is more comparable between periods. Decommissioning expenditures are discretionary and are excluded as they may vary based on the stage of the Company's assets and operating areas. The most directly comparable financial measure to adjusted funds flow from operations is cash flow from operating activities. Adjusted funds flow from operations is a key measure that assesses the ability of the Company to finance dividends, potential share repurchases, operating activities, capital expenditures and debt repayments. Adjusted funds flow from operations as presented is not intended to represent cash flow from operating activities, net earnings or other measures of financial performance calculated in accordance with IFRS. See Note 16 – "Capital Management" in the unaudited consolidated financial statements for the period ended March 31, 2024, for additional information on the Company's capital management.
Excess cash flow is a historical non-GAAP financial measure and is defined as adjusted funds flow from operations less development capital and other expenditures, payments on lease liability, decommissioning expenditures funded by the Company, unrealized gains and losses on equity derivative contracts, transaction costs and other items (excluding net acquisitions and dispositions). The Company has separated transaction costs from "other items" due to the materiality of the amounts. The prior period presentation has been revised to reflect current period presentation. The most directly comparable financial measure to excess cash flow disclosed in the Company's financial statements is cash flow from operating activities. Excess cash flow is a key measure that assesses the ability of the Company to finance dividends, potential share repurchases, debt repayments and returns-based growth.
| | | | | |
| CRESCENT POINT ENERGY CORP. | 22 |
The following table reconciles cash flow from operating activities to adjusted funds flow from operations and excess cash flow:
| | | | | | | | | | | | | | | | | | | | | | | | | | |
| Three months ended March 31 | | | |
| ($ millions) | 2024 | | 2023 (1) | | % Change | | | | | | | |
| Cash flow from operating activities | 411.2 | | | 473.4 | | | (13) | | | | | | | | |
| Changes in non-cash working capital | 148.4 | | | 39.8 | | | 273 | | | | | | | | |
| Transaction costs | 1.3 | | | 1.8 | | | (28) | | | | | | | | |
Decommissioning expenditures (2) | 7.3 | | | 9.9 | | | (26) | | | | | | | | |
| Adjusted funds flow from operations | 568.2 | | | 524.9 | | | 8 | | | | | | | | |
| Development capital and other expenditures | (417.9) | | | (327.4) | | | 28 | | | | | | | | |
| Payments on lease liability | (8.6) | | | (5.3) | | | 62 | | | | | | | | |
| Decommissioning expenditures | (7.3) | | | (9.9) | | | (26) | | | | | | | | |
| Unrealized gain (loss) on equity derivative contracts | 0.1 | | | (27.5) | | | (100) | | | | | | | | |
| Transaction costs | (1.3) | | | (1.8) | | | (28) | | | | | | | | |
Other items (3) | (2.4) | | | 0.4 | | | (700) | | | | | | | | |
| Excess cash flow | 130.8 | | | 153.4 | | | (15) | | | | | | | | |
(1)Comparative period revised to reflect current period presentation.
(2)Excludes amounts received from government grant programs.
(3)Other items exclude net acquisitions and dispositions.
The following table reconciles cash flow from operating activities from discontinued operations to adjusted funds flow from discontinued operations:
| | | | | | | | | | | | | | | | | | | | | | | | | | |
| Three months ended March 31 | | | |
| ($ millions) | 2024 | | 2023 | | % Change | | | | | | | |
| Cash flow from operating activities from discontinued operations | — | | | 103.6 | | | (100) | | | | | | | | |
| Changes in non-cash working capital | — | | | (17.3) | | | (100) | | | | | | | | |
| | | | | | | | | | | | |
| | | | | | | | | | | | |
| Adjusted funds flow from discontinued operations | — | | | 86.3 | | | (100) | | | | | | | | |
The following tables reconcile cash flow from operating activities and adjusted funds flow from operations from continuing and discontinued operations:
| | | | | | | | | | | | | | | | | | | | | | | | | | |
| Three months ended March 31 | | | |
| ($ millions) | 2024 | | 2023 | | % Change | | | | | | | |
| | | | | | | | | | | | |
| Cash flow from operating activities from continuing operations | 411.2 | | | 369.8 | | | 11 | | | | | | | | |
| Cash flow from operating activities from discontinued operations | — | | | 103.6 | | | (100) | | | | | | | | |
| Cash flow from operating activities | 411.2 | | | 473.4 | | | (13) | | | | | | | | |
| | | | | | | | | | | | | | | | | | | | | | | | | | |
| Three months ended March 31 | | | |
| ($ millions) | 2024 | | 2023 | | % Change | | | | | | | |
| | | | | | | | | | | | |
| Adjusted funds flow from continuing operations | 568.2 | | | 438.6 | | | 30 | | | | | | | | |
| Adjusted funds flow from discontinued operations | — | | | 86.3 | | | (100) | | | | | | | | |
| Adjusted funds flow from operations | 568.2 | | | 524.9 | | | 8 | | | | | | | | |
Adjusted working capital (surplus) deficiency is a capital management measure and is calculated as accounts payable and accrued liabilities, dividends payable and long-term compensation liability net of equity derivative contracts, less cash, accounts receivable, prepaids and deposits and deferred consideration receivable. Deferred consideration receivable was incurred in 2023 and 2024 through capital dispositions and is included in "other current assets" and "other long-term assets" on the balance sheet. Adjusted working capital (surplus) deficiency is a component of net debt and is a measure of the Company's liquidity.
| | | | | |
| CRESCENT POINT ENERGY CORP. | 23 |
The following table reconciles adjusted working capital deficiency:
| | | | | | | | | | | | | | | | | | | | |
| ($ millions) | March 31, 2024 | | December 31, 2023 | | % Change | |
| Accounts payable and accrued liabilities | 593.6 | | | 634.9 | | | (7) | | |
| Dividends payable | 71.3 | | | 56.8 | | | 26 | | |
Long-term compensation liability (1) | 58.4 | | | 66.8 | | | (13) | | |
| Cash | (21.8) | | | (17.3) | | | 26 | | |
| Accounts receivable | (409.0) | | | (377.9) | | | 8 | | |
| Prepaids and deposits | (105.1) | | | (87.8) | | | 20 | | |
Deferred consideration receivable (2) | (105.4) | | | (79.2) | | | 33 | | |
| | | | | | |
| Adjusted working capital deficiency | 82.0 | | | 196.3 | | | (58) | | |
(1)Includes current portion of long-term compensation liability and is net of equity derivative contracts.
(2)Deferred consideration receivable is comprised of $90.2 million included in other current assets and $15.2 million included in other long-term assets (December 31, 2023 - $79.2 million in other current assets and nil in other long-term assets).
Net debt is a capital management measure and is calculated as long-term debt plus adjusted working capital (surplus) deficiency, excluding the unrealized foreign exchange on translation of hedged US dollar long-term debt. The most directly comparable financial measure to net debt disclosed in the Company's financial statements is long-term debt. Net debt is a key measure of the Company's liquidity.
The following table reconciles long-term debt to net debt:
| | | | | | | | | | | | | | | | | | | | |
| ($ millions) | March 31, 2024 | | December 31, 2023 | | % Change | |
Long-term debt (1) | 3,591.2 | | | 3,566.3 | | | 1 | | |
| Adjusted working capital deficiency | 82.0 | | | 196.3 | | | (58) | | |
| | | | | | |
| Unrealized foreign exchange on translation of hedged US dollar long-term debt | (90.3) | | | (24.5) | | | 269 | | |
| Net debt | 3,582.9 | | | 3,738.1 | | | (4) | | |
(1)Includes current portion of long-term debt.
Enterprise value is a supplementary financial measure and is calculated as market capitalization plus net debt. Enterprise value is used to assess the valuation of the Company. Refer to the Liquidity and Capital Resources section in this MD&A for further information.
Net debt to adjusted funds flow from operations is a capital management measure and is calculated as the period end net debt divided by the sum of adjusted funds flow from operations for the trailing four quarters. Net debt as a percentage of enterprise value is a supplementary financial measure and is calculated as net debt divided by enterprise value. The measures of net debt to adjusted funds flow from operations and net debt as a percentage of enterprise value are used to measure the Company's overall debt position and to measure the strength of the Company's balance sheet. Crescent Point monitors these measures and uses them as key measures in capital allocation decisions including capital spending levels, returns to shareholders including dividends and share repurchases, and financial considerations.
Adjusted net earnings from operations is a historical non-GAAP financial measure and is calculated based on net income (loss) before amortization of E&E undeveloped land, impairment or impairment reversals, unrealized derivative gains or losses, unrealized foreign exchange gain or loss on translation of hedged US dollar long-term debt, gains or losses on capital acquisitions and dispositions, cumulative foreign currency translation of discontinued foreign operations, and deferred tax related to these adjustments. Adjusted net earnings from operations is a key measure of financial performance that is more comparable between periods. The most directly comparable financial measure to adjusted net earnings from operations disclosed in the Company's financial statements is net income (loss).
The following table reconciles net income (loss) to adjusted net earnings from operations:
| | | | | | | | | | | | | | | | | | | | | | | | | | |
| Three months ended March 31 | | | |
| ($ millions) | 2024 | | 2023 | | % Change | | | | | | | |
| Net income (loss) | (411.7) | | | 216.7 | | | (290) | | | | | | | | |
| Amortization of E&E undeveloped land | 29.6 | | | 2.6 | | | 1,038 | | | | | | | | |
| Impairment | 512.3 | | | — | | | (100) | | | | | | | | |
| Unrealized derivative losses | 152.9 | | | 3.9 | | | 3,821 | | | | | | | | |
| Unrealized foreign exchange (gain) loss on translation of hedged US dollar long-term debt | 68.2 | | | (0.6) | | | (11,467) | | | | | | | | |
| | | | | | | | | | | | |
| | | | | | | | | | | | |
| Net (gain) loss on capital dispositions | 12.0 | | | (2.0) | | | (700) | | | | | | | | |
| | | | | | | | | | | | |
| Deferred tax adjustments | (176.3) | | | (1.7) | | | 10,271 | | | | | | | | |
| Adjusted net earnings from operations | 187.0 | | | 218.9 | | | (15) | | | | | | | | |
| | | | | |
| CRESCENT POINT ENERGY CORP. | 24 |
The following table reconciles net income (loss) from discontinued operations to adjusted net earnings from discontinued operations:
| | | | | | | | | | | | | | | | | | | | | | | | | | |
| Three months ended March 31 | | | |
| ($ millions) | 2024 | | 2023 | | % Change | | | | | | | |
| Net income (loss) from discontinued operations | (12.8) | | | 31.9 | | | (140) | | | | | | | | |
| | | | | | | | | | | | |
| | | | | | | | | | | | |
| | | | | | | | | | | | |
| | | | | | | | | | | | |
| Net loss on capital dispositions | 12.8 | | | — | | | 100 | | | | | | | | |
| | | | | | | | | | | | |
| Deferred tax adjustments | — | | | (0.7) | | | (100) | | | | | | | | |
| Adjusted net earnings from discontinued operations | — | | | 31.2 | | | (100) | | | | | | | | |
The following table reconciles adjusted net earnings from continuing and discontinued operations:
| | | | | | | | | | | | | | | | | | | | | | | | | | |
| Three months ended March 31 | | | |
| ($ millions) | 2024 | | 2023 | | % Change | | | | | | | |
| | | | | | | | | | | | |
| Adjusted net earnings from continuing operations | 187.0 | | | 187.7 | | | — | | | | | | | | |
| Adjusted net earnings from discontinued operations | — | | | 31.2 | | | (100) | | | | | | | | |
| Adjusted net earnings from operations | 187.0 | | | 218.9 | | | (15) | | | | | | | | |
Adjusted net earnings from operations per share - diluted is a non-GAAP ratio and is calculated as adjusted net earnings from operations divided by the number of weighted average diluted shares outstanding. Adjusted net earnings from operations presents a measure of financial performance that is more comparable between periods. Adjusted net earnings from operations as presented is not intended to represent net earnings or other measures of financial performance calculated in accordance with IFRS.
The following table reconciles development capital and other expenditures to development capital expenditures:
| | | | | | | | | | | | | | | | | | | | | | | | | | |
| | | Three months ended March 31 | |
| ($ millions) | | | | | | | 2024 | | 2023 | | % Change | |
| Development capital and other expenditures | | | | | | | 417.9 | | | 327.4 | | | 28 | | |
| Payments on drilling rig lease liabilities | | | | | | | 3.1 | | | — | | | 100 | | |
| Land expenditures | | | | | | | (7.7) | | | (1.3) | | | 492 | | |
Capitalized administration (1) | | | | | | | (13.6) | | | (11.4) | | | 19 | | |
| Corporate assets | | | | | | | (1.1) | | | (0.5) | | | 120 | | |
| Development capital expenditures | | | | | | | 398.6 | | | 314.2 | | | 27 | | |
(1)Capitalized administration excludes capitalized equity-settled SBC.
Development capital expenditures is a historical non-GAAP financial measure that presents total budgeted development capital spending under the Company's guidance. The most directly comparable financial measure disclosed in the Company's financial statements is development capital and other expenditures on the consolidated statements of cash flows. Development capital expenditures is calculated as development capital and other expenditures plus payments on drilling rig lease liabilities, and excludes land expenditures, capitalized administration and corporate assets. These drilling rig contracts are accounted for in accordance with IFRS 16 Leases.
Management believes the presentation of the specified financial measures above provide useful information to investors and shareholders as the measures provide increased transparency and the ability to better analyze performance against prior periods on a comparable basis.
| | | | | |
| CRESCENT POINT ENERGY CORP. | 25 |
Forward-Looking Information
Certain statements contained in this management's discussion and analysis constitute forward-looking statements and are based on Crescent Point's beliefs and assumptions based on information available at the time the assumption was made. By its nature, such forward-looking information involves known and unknown risks, uncertainties and other factors that may cause actual results or events to differ materially from those anticipated in such forward-looking statements. The Company believes the expectations reflected in those forward-looking statements are reasonable but no assurance can be given that these expectations will prove to be correct and such forward-looking statements should not be unduly relied upon. These statements are effective only as of the date of this MD&A. Crescent Point undertakes no obligation to update publicly or revise any forward-looking statements, whether as a result of new information, future events or otherwise, unless required to do so pursuant to applicable law. For additional information on the disposition of certain non-core Saskatchewan assets, refer to the press release dated May 6, 2024 available on SEDAR+ at www.sedarplus.ca.
Any “financial outlook” or “future oriented financial information” in this management’s discussion and analysis, as defined by applicable securities legislation, have been approved by management of Crescent Point. Such financial outlook or future oriented financial information is provided for the purpose of providing information about management’s current expectations and plans relating to the future. Readers are cautioned that reliance on such information may not be appropriate for other purposes.
Certain statements contained in this MD&A, including statements related to Crescent Point's capital expenditures, projected asset growth, view and outlook toward future commodity prices, drilling activity and statements that contain words such as "could", "should", "can", "anticipate", "expect", "believe", "will", "may", “projected”, “sustain”, “continues”, “strategy”, “potential”, “projects”, “grow”, “take advantage”, “estimate” and similar expressions and statements relating to matters that are not historical facts constitute "forward-looking information" within the meaning of applicable Canadian securities legislation. The material assumptions and factors in making these forward-looking statements are disclosed in this MD&A under the headings "Overview", "Commodity Derivatives", “Liquidity and Capital Resources” and “Guidance”.
In particular, forward-looking statements include:
| | | | | |
l Crescent Point's net debt reduction focus through excess cash flow generation and non-core asset dispositions; l Use of proceeds from Saskatchewan disposition; l Crescent Point's approach to proactively manage the risk exposure inherent in movements in the price of crude oil, propane, natural gas, the Company's share price, the US/Cdn dollar exchange rate and interest rates through the use of derivatives with investment-grade counterparties; l Crescent Point's use of derivatives to reduce the volatility of the selling price of its crude oil and natural gas production and how this provides a measure of stability to cash flow; l The extent and effectiveness of hedges; l Expectations of generating strong returns and excess cash flow to provide continued returns to shareholders;
| l Crescent Point's 2024 production and capital expenditures guidance, and other information forming part of the 2024 guidance; l Crescent Point's return of capital outlook including dividend expectations and additional return of capital target as a percentage of excess cash flow; l The Company's liquidity and financial flexibility; l The method by which the Company's ongoing working capital requirements are financed; l NCIB expectations; and l Estimated undiscounted and uninflated cash flows to settle decommissioning liability.
|
This information contains certain forward-looking estimates that involve substantial known and unknown risks and uncertainties, many of which are beyond Crescent Point's control. Such risks and uncertainties include, but are not limited to: financial risk of marketing reserves at an acceptable price given market conditions; volatility in market prices for oil and natural gas, decisions or actions of OPEC and non-OPEC countries in respect of supplies of oil and gas; delays in business operations or delivery of services due to pipeline restrictions, rail blockades, outbreaks, pandemics, and blowouts; the risk of carrying out operations with minimal environmental impact; industry conditions including changes in laws and regulations including the adoption of new environmental laws and regulations and changes in how they are interpreted and enforced; uncertainties associated with estimating oil and natural gas reserves; risks and uncertainties related to oil and gas interests and operations on Indigenous lands; economic risk of finding and producing reserves at a reasonable cost; uncertainties associated with partner plans and approvals; operational matters related to non-operated properties; increased competition for, among other things, capital, acquisitions of reserves and undeveloped lands; competition for and availability of qualified personnel or management; incorrect assessments of the value and likelihood of acquisitions and dispositions, and exploration and development programs; unexpected geological, technical, drilling, construction, processing and transportation problems; the impacts of drought, wildfires and severe weather events; availability of insurance; fluctuations in foreign exchange and interest rates; stock market volatility; general economic, market and business conditions, including uncertainty in the demand for oil and gas and economic activity in general; changes in interest rates and inflation; uncertainties associated with regulatory approvals; geopolitical conflicts, including the Russian invasion of Ukraine and conflict between Israel and Hamas; uncertainty of government policy changes; the impact of the implementation of the Canada-United States-Mexico Agreement; uncertainty regarding the benefits and costs of dispositions; failure to complete acquisitions and dispositions; uncertainties associated with credit facilities and counterparty credit risk; and changes in income tax laws, tax laws, crown royalty rates and incentive programs relating to the oil and gas industry; and other factors, many of which are outside the control of the Company.
Therefore, Crescent Point's actual results, performance or achievement could differ materially from those expressed in, or implied by, these forward-looking estimates and if such actual results, performance or achievements transpire or occur, or if any of them do so, there can be no certainty as to what benefits or detriments Crescent Point will derive therefrom.
| | | | | |
| CRESCENT POINT ENERGY CORP. | 26 |
Crude oil and condensate, and natural gas information is provided in accordance with the United States Financial Accounting Standards Board Topic 932 - "Extractive Activities - Oil and Gas" and where applicable, financial information is prepared in accordance with International Financial Reporting Standards ("IFRS").
The Company files its reserves information under National Instrument 51-101 - "Standards of Disclosure of Oil and Gas Activities" (NI 51-101), which prescribes the standards for the preparation and disclosure of reserves and related information for companies listed in Canada.
There are significant differences to the type of volumes disclosed and the basis from which the volumes are economically determined under the United States Securities and Exchange Commission (“SEC”) requirements and NI 51-101. The SEC requires disclosure of net reserves, after royalties, using 12-month average prices and current costs; whereas NI 51-101 requires Company gross reserves, before royalties, using forecast pricing and costs. Therefore the difference between the reported numbers under the two disclosure standards may be material.
Barrels of oil equivalent (“boe”) may be misleading, particularly if used in isolation. A boe conversion ratio of 6 mcf : 1 bbl is based on an energy equivalency conversion method primarily applicable at the burner tip and does not represent a value equivalency at the wellhead. Given that the value ratio based on the current price of crude oil and condensate as compared to natural gas is significantly different from the energy equivalency of oil, utilizing a conversion on a 6:1 basis may be misleading as an indication of value. Oil and gas metrics such as operating netback and netback do not have standardized meaning and as such may not be reliable, and should not be used to make comparisons.
NI 51-101 includes condensate within the natural gas liquids (NGLs) product type. The Company has disclosed condensate as combined with crude oil and separately from other natural gas liquids in this MD&A since the price of condensate as compared to other natural gas liquids is currently significantly higher and the Company believes that this crude oil and condensate presentation provides a more accurate description of its operations and results therefrom.
The Company’s aggregate production for the past eight quarters and the references to “natural gas”, “crude oil" and "condensate”, reported in this MD&A consist of the following product types, as defined in NI 51-101 and using a conversion ratio of 6 mcf : 1 bbl where applicable:
| | | | | | | | | | | | | | | | | | | | | | | | | | |
| 2024 | 2023 | 2022 |
| Q1 | Q4 | Q3 | Q2 | Q1 | Q4 | Q3 | Q2 |
| Light & Medium Crude Oil (bbl/d) | 11,434 | | 12,198 | | 12,405 | | 13,188 | | 12,879 | | 13,671 | | 12,347 | | 15,752 | |
| Heavy Crude Oil (bbl/d) | 3,620 | | 3,795 | | 3,617 | | 3,857 | | 4,010 | | 3,870 | | 4,102 | | 4,103 | |
| Tight Oil (bbl/d) | 72,849 | | 56,657 | | 54,605 | | 48,151 | | 39,464 | | 40,068 | | 42,030 | | 42,553 | |
| Total Crude Oil (bbl/d) | 87,903 | | 72,650 | | 70,627 | | 65,196 | | 56,353 | | 57,609 | | 58,479 | | 62,408 | |
| | | | | | | | |
| NGLs (bbl/d) | 44,780 | | 39,517 | | 38,316 | | 34,108 | | 35,401 | | 33,871 | | 33,668 | | 30,322 | |
| | | | | | | | |
| Shale Gas (mcf/d) | 388,432 | | 236,926 | | 232,235 | | 184,105 | | 147,458 | | 128,437 | | 121,070 | | 109,835 | |
| Conventional Natural Gas (mcf/d) | 6,773 | | 11,380 | | 12,542 | | 8,859 | | 10,233 | | 10,769 | | 10,307 | | 10,800 | |
| Total Natural Gas (mcf/d) | 395,205 | | 248,306 | | 244,777 | | 192,964 | | 157,691 | | 139,206 | | 131,377 | | 120,635 | |
| | | | | | | | |
| Total production from continuing operations (boe/d) | 198,551 | | 153,551 | | 149,739 | | 131,465 | | 118,036 | | 114,681 | | 114,043 | | 112,836 | |
| | | | | | | | | | | | | | | | | | | | | | | | | | |
| 2024 | 2023 | 2022 |
| Q1 | Q4 | Q3 | Q2 | Q1 | Q4 | Q3 | Q2 |
| Light & Medium Crude Oil (bbl/d) | 11,434 | | 12,198 | | 12,408 | | 13,190 | | 12,879 | | 13,671 | | 12,347 | | 15,752 | |
| Heavy Crude Oil (bbl/d) | 3,620 | | 3,795 | | 3,617 | | 3,857 | | 4,010 | | 3,870 | | 4,102 | | 4,103 | |
| Tight Oil (bbl/d) | 72,849 | | 62,512 | | 75,879 | | 63,812 | | 53,184 | | 52,095 | | 54,030 | | 53,521 | |
| Total Crude Oil (bbl/d) | 87,903 | | 78,505 | | 91,904 | | 80,859 | | 70,073 | | 69,636 | | 70,479 | | 73,376 | |
| | | | | | | | |
| NGLs (bbl/d) | 44,780 | | 41,373 | | 44,728 | | 39,399 | | 40,592 | | 38,893 | | 38,481 | | 34,013 | |
| | | | | | | | |
| Shale Gas (mcf/d) | 388,432 | | 242,965 | | 251,152 | | 199,781 | | 161,459 | | 142,803 | | 134,049 | | 119,924 | |
| Conventional Natural Gas (mcf/d) | 6,773 | | 11,380 | | 12,542 | | 8,859 | | 10,233 | | 10,769 | | 10,307 | | 10,800 | |
| Total Natural Gas (mcf/d) | 395,205 | | 254,345 | | 263,694 | | 208,640 | | 171,692 | | 153,572 | | 144,356 | | 130,724 | |
| | | | | | | | |
| Total average daily production (boe/d) | 198,551 | | 162,269 | | 180,581 | | 155,031 | | 139,280 | | 134,124 | | 133,019 | | 129,176 | |
| | | | | |
| CRESCENT POINT ENERGY CORP. | 27 |
| | | | | | | | |
Directors Barbara Munroe, Chair (6) James Craddock (2) (3) (5) John Dielwart (3) (4) Mike Jackson (1) (5) Jennifer Koury (2) (5) Francois Langlois (1) (3) (4) Myron Stadnyk (1) (2) (4) Mindy Wight (1) (2) Craig Bryksa (4) (1) Member of the Audit Committee of the Board of Directors (2) Member of the Human Resources and Compensation Committee of the Board of Directors (3) Member of the Reserves Committee of the Board of Directors (4) Member of the Environment, Safety and Sustainability Committee of the Board of Directors (5) Member of the Corporate Governance and Nominating Committee (6) Chair of the Board serves in an ex officio capacity on each Committee Officers Craig Bryksa President and Chief Executive Officer Ken Lamont Chief Financial Officer Ryan Gritzfeldt Chief Operating Officer Mark Eade Senior Vice President, General Counsel and Corporate Secretary Garret Holt Senior Vice President, Strategy and Planning Michael Politeski Senior Vice President, Finance and Treasurer Shelly Witwer Senior Vice President, Business Development Justin Foraie Vice President, Operations and Marketing Head Office Suite 2000, 585 - 8th Avenue S.W. Calgary, Alberta T2P 1G1 Tel: (403) 693-0020 Fax: (403) 693-0070 Toll Free: (888) 693-0020 Banker The Bank of Nova Scotia Calgary, Alberta | | Auditor PricewaterhouseCoopers LLP Calgary, Alberta Legal Counsel Norton Rose Fulbright Canada LLP Calgary, Alberta Evaluation Engineers McDaniel & Associates Consultants Ltd. Calgary, Alberta Registrar and Transfer Agent Investors are encouraged to contact Crescent Point's Registrar and Transfer Agent for information regarding their security holdings: Computershare Trust Company of Canada 600, 530 - 8th Avenue S.W. Calgary, Alberta T2P 3S8 Tel: (403) 267-6800 Stock Exchanges Toronto Stock Exchange - TSX New York Stock Exchange - NYSE Stock Symbol CPG Investor Contacts Sarfraz Somani Manager, Investor Relations (403) 693-0020 |
| | | | | |
| CRESCENT POINT ENERGY CORP. | 28 |