| REPORT TO SHAREHOLDERS |  | ||
| Second Quarter 2019 | |||
| MANAGEMENT'S DISCUSSION AND ANALYSIS | |||
| Table of Contents | |||
Basis of Presentation
The following Management's Discussion and Analysis ("MD&A") of the financial and operating results of Pembina Pipeline Corporation ("Pembina" or the "Company") is dated August 1, 2019, and is supplementary to, and should be read in conjunction with, Pembina's June 30, 2019 condensed consolidated interim financial statements ("Interim Financial Statements") as well as Pembina's consolidated annual financial statements ("Consolidated Financial Statements") and MD&A for the year ended December 31, 2018. All financial information has been prepared in accordance with IAS 34 Interim Financial Reporting and is expressed in Canadian dollars unless otherwise noted. Pembina adopted IFRS 16 Leases ("IFRS 16") effective January 1, 2019 using the modified retrospective approach; accordingly comparative information has not been restated. A description of Pembina's operating segments and additional information about Pembina is filed with Canadian and U.S. securities commissions, including quarterly and annual reports, annual information forms (filed with the U.S. Securities and Exchange Commission under Form 40-F), and management information circulars, can be found online at www.sedar.com, www.sec.gov and through Pembina's website at www.pembina.com.
Abbreviations
For a list of abbreviations that may be used in this MD&A, refer to the Abbreviations section of this MD&A.
Non-GAAP Financial Measures
Pembina has identified certain operating and financial performance measures that management believes provide meaningful information in assessing Pembina's underlying performance. Readers are cautioned that these measures do not have a standardized meaning prescribed by International Financial Reporting Standards ("IFRS") and therefore may not be comparable to similar measures presented by other entities. Refer to the Non-GAAP Measures section of this MD&A for a list and description, including reconciliations to the most directly comparable GAAP measure, of such non-GAAP measures.
Risk Factors and Forward-Looking Information
Management has identified the primary risk factors that could potentially have a material impact on the financial results and operations of Pembina. Such risk factors are presented in Pembina's MD&A and Annual Information Form ("AIF") for the year ended December 31, 2018. The Company’s financial and operational performance is potentially affected by a number of factors, including, but not limited to, the factors described within the Forward-Looking Statements & Information section of this MD&A. This MD&A contains forward-looking statements based on Pembina’s current expectations, estimates, projections and assumptions. This information is provided to assist readers in understanding the Company’s future plans and expectations and may not be appropriate for other purposes.
Pembina Pipeline Corporation Second Quarter 2019 1
1. ABOUT PEMBINA
Calgary-based Pembina Pipeline Corporation is a leading transportation and midstream service provider that has been serving North America's energy industry for 65 years. Pembina owns an integrated system of pipelines that transport various hydrocarbon liquids and natural gas products produced primarily in western Canada. The Company also owns gas gathering and processing facilities; an oil and natural gas liquids infrastructure and logistics business; is growing an export terminals business; and is currently constructing a petrochemical facility to convert propane into polypropylene. Pembina's integrated assets and commercial operations along the majority of the hydrocarbon value chain allow it to offer a full spectrum of midstream and marketing services to the energy sector. Pembina is committed to identifying additional opportunities to connect hydrocarbon production to new demand locations through the development of infrastructure that would extend Pembina's service offering even further along the hydrocarbon value chain. These new developments will contribute to ensuring that hydrocarbons produced in the Western Canadian Sedimentary Basin and the other basins where Pembina operates can reach the highest value markets throughout the world.
Purpose of Pembina:
To be the leader in delivering integrated infrastructure solutions connecting global markets;
| • | Customers choose us first for reliable and value-added services; |
| • | Investors receive sustainable industry-leading total returns; |
| • | Employees say we are the 'employer of choice' and value our safe, respectful, collaborative and fair work culture; and |
| • | Communities welcome us and recognize the net positive impact of our social and environmental commitment. |
2 Pembina Pipeline Corporation Second Quarter 2019
2. FINANCIAL & OPERATING OVERVIEW
Consolidated Financial Overview Three Months Ended June 30
Results of Operations
| ($ millions, except where noted) (unaudited) | 2019 | 2018 | Change | % Change | ||||
Revenue(3) | 1,808 | 1,743 | 65 | 4 | ||||
Net revenue(1) | 758 | 669 | 89 | 13 | ||||
| Gross profit | 629 | 511 | 118 | 23 | ||||
| Earnings | 664 | 246 | 418 | 170 | ||||
Earnings per common share – basic (dollars) | 1.23 | 0.43 | 0.80 | 186 | ||||
Earnings per common share – diluted (dollars) | 1.23 | 0.42 | 0.81 | 193 | ||||
| Cash flow from operating activities | 661 | 603 | 58 | 10 | ||||
Cash flow from operating activities per common share – basic (dollars)(1) | 1.29 | 1.20 | 0.09 | 8 | ||||
Adjusted cash flow from operating activities(1) | 550 | 558 | (8 | ) | (1 | ) | ||
Adjusted cash flow from operating activities per common share – basic (dollars)(1) | 1.08 | 1.11 | (0.03 | ) | (3 | ) | ||
| Capital expenditures | 434 | 255 | 179 | 70 | ||||
Adjusted EBITDA(1) | 765 | 700 | 65 | 9 | ||||
Total volume (mboe/d)(2) | 3,384 | 3,385 | (1 | ) | — | |||
Bridge Analysis of Earnings ($ millions)
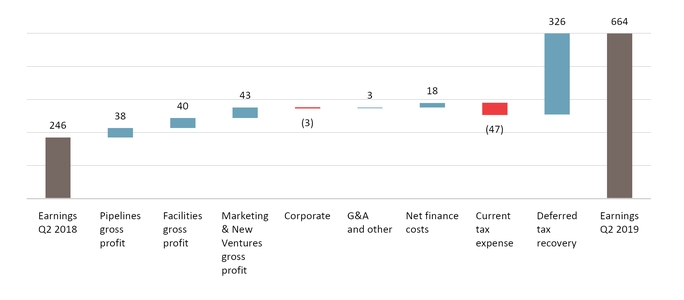
Results Overview
Earnings in the second quarter of 2019 were positively impacted by a deferred tax recovery related to the enactment of Bill 3 Job Creation Tax Cut (Alberta Corporate Tax Amendment) Act ("Bill 3"), which will reduce the Alberta tax rate from 12 percent to eight percent over a four year period. Gross profit from all three divisions increased following new assets placed into service, the recognition of variable revenue related to capital recoveries in the current period as well as deferred variable revenue from the prior period, higher terminalling revenue, combined with gains from commodity-related derivative contracts. Net finance costs decreased due to a loss related to the convertible debentures in the second quarter of 2018. An increase in current tax expense partially offset the significant deferred tax recovery.
Pembina Pipeline Corporation Second Quarter 2019 3
| Changes in Results for the Three Months Ended June 30 | ||
Revenue(3) | ▲ | $65 million increase, primarily driven by revenue associated with new Peace Phase IV and V assets, Redwater Co-generation and Burstall Ethane Storage all recently placed into service (see Projects and New Developments sections), increased terminalling revenue at Redwater for propane and butane, the recognition of variable revenue related to current and prior period capital recoveries ($22 million) and increased recovery of operating expenses. |
| Operating expenses | ▼ | $34 million increase due mainly to a $30 million recovery reclassification in the second quarter of 2018 related to the first quarter of 2018 which decreased operating expenses and increased cost of sales, combined with an increase in power costs ($6 million) as a result of higher consumption from new assets placed into service partially offset by savings associated with Redwater Co-generation, offset by lower repairs and maintenance ($3 million). |
| Share of profit from equity accounted investees | ● | Consistent with prior period. |
| Realized gain on commodity-related derivatives | ▲ | $10 million increase as derivatives moved to a gain position as contracts were settled during the period at prices that were higher than the contracted price, compared to losses that were realized during the second quarter of 2018. |
| Unrealized gain on commodity-related derivatives | ▲ | $61 million positive variance primarily due to decreases in the price of propane and butane which drove the associated derivative contracts into a gain position, compared to the loss position in the second quarter of 2018 when prices were higher. |
| General & administrative and other expense | ▲ | $12 million decrease mainly due to a decrease in long-term incentives. |
| Net finance costs | ▲ | $18 million decrease due to the loss on revaluation of the conversion feature of the convertible debentures recognized in the prior period and since matured, combined with the impact of foreign exchange gains and partially offset by the additional interest expense recognized on the adoption of IFRS 16 of $4 million. |
| Current tax expense | ▼ | $47 million increase is primarily due to the growth in earnings in the prior year that are recognized in taxable income in the current year. |
| Deferred tax recovery | ▲ | $326 million increase in deferred tax recovery primarily due to the enactment of Bill 3, which will reduce the Alberta tax rate from 12 percent to 8 percent over a four year period. |
| Earnings | ▲ | $418 million increase compared to the second quarter of 2018 driven by the items noted above. |
| Cash flow from operating activities | ▲ | $58 million increase, primarily driven by an increase in operating results after adjusting for non-cash items, $43 million change in non-cash working capital and the $12 million impact from the adoption of IFRS 16, partially offset by the $28 million decrease in distributions from equity accounted investees. |
Adjusted cash flow from operating activities(1) | ▼ | $8 million decrease largely due to the same items impacting cash flow from operating activities, discussed above, net of the $43 million change in non-cash working capital and $47 million increase in current tax expense. |
Adjusted EBITDA(1) | ▲ | $65 million increase primarily due to the contribution from new assets placed into service, combined with the recognition of variable revenue related to capital recoveries, increased terminalling and storage revenues and the $18 million impact from the adoption of IFRS 16. Included in adjusted EBITDA is $200 million (2018: $212 million) related to equity accounted investees. |
Total volume (mboe/d)(2) | ● | Consistent with prior period. Revenue volumes includes 316 mboe/d (2018: 311 mboe/d) related to equity accounted investees. |
| ▲ | Increase; | ▼ | Decrease; or | ● | No impact; | to earnings, adjusted EBITDA, cash flow from operations, adjusted cash flow from operating activities or total volumes. |
(1) | Refer to "Non-GAAP Measures". |
(2) | Total revenue volumes. Revenue volumes are physical volumes plus volumes recognized from take-or-pay commitments. Volumes are stated in mboe/d, with natural gas volumes converted to mboe/d from MMcf/d at a 6:1 ratio. |
(3) | Pembina corrected revenue and costs of goods sold in the Marketing & New Ventures Division in 2018. The adjustments reduce revenue and cost of goods sold for the three and six months ending June 30, 2018 ($202 million). There was no impact to earnings as a result of the adjustment. |
4 Pembina Pipeline Corporation Second Quarter 2019
Consolidated Financial Overview Six Months Ended June 30
Results of Operations
| ($ millions, except where noted) (unaudited) | 2019 | 2018 | Change | % Change | |||
Revenue(3) | 3,776 | 3,580 | 196 | 5 | |||
Net revenue(1) | 1,532 | 1,388 | 144 | 10 | |||
| Gross profit | 1,217 | 1,079 | 138 | 13 | |||
| Earnings | 977 | 576 | 401 | 70 | |||
Earnings per common share – basic (dollars) | 1.79 | 1.02 | 0.77 | 75 | |||
Earnings per common share – diluted (dollars) | 1.78 | 1.02 | 0.76 | 75 | |||
| Cash flow from operating activities | 1,269 | 1,101 | 168 | 15 | |||
Cash flow from operating activities per common share – basic (dollars)(1) | 2.49 | 2.19 | 0.30 | 14 | |||
Adjusted cash flow from operating activities(1) | 1,128 | 1,088 | 40 | 4 | |||
Adjusted cash flow from operating activities per common share – basic (dollars)(1) | 2.21 | 2.16 | 0.05 | 2 | |||
| Capital expenditures | 795 | 579 | 216 | 37 | |||
Adjusted EBITDA(1) | 1,538 | 1,388 | 150 | 11 | |||
Total volume (mboe/d)(2) | 3,394 | 3,333 | 61 | 2 | |||
Bridge Analysis of Earnings ($ millions)
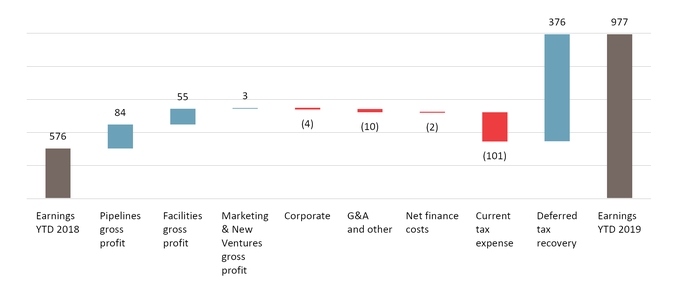
Results Overview
Earnings for the six months ended June 30, 2019 were positively impacted by the deferred tax recovery related to the enactment of Bill 3, noted above. Gross profit increased in both the Pipeline and Facilities divisions from new assets placed into service, the recognition of variable revenue related to capital recoveries in the current period as well as deferred variable revenue from the prior period, higher terminalling revenue, as well as additional customer commitments on existing assets. G&A and other expenses increased following the adoption of IFRS 16 which resulted in higher depreciation included in general and administrative expense and a corresponding reduction in rent expense, which was offset by increased salaries and wages.
Pembina Pipeline Corporation Second Quarter 2019 5
| Changes in Results for the Six Months Ended June 30 | ||
Revenue(3) | ▲ | $196 million increase, primarily driven by revenue associated with new assets recently placed into service (see Projects and New Developments sections), increased terminalling revenue, increased NGL sales volumes, a $33 million contract dispute settlement, the recognition of $22 million of variable revenue related to current and prior period capital recoveries and increased recovery of operating expenses. |
| Operating expenses | ▼ | $24 million increase largely due to increases in power costs, as a result of both increased power pool prices and higher consumption from new assets placed into service. |
| Share of profit from equity accounted investees | ▲ | $21 million increase primarily due to increased revenues from Veresen Midstream following the North Central Liquids Hub going into service in June 2018, combined with the impact of a $24 million finance gain reversal recorded in the first half of 2018, partially offset by lower margins at Aux Sable. |
| Realized gain on commodity-related derivatives | ▲ | $47 million increase due to the recognition of a gain for commodity-related derivatives that were settled during the period at prices that were higher than contracted, compared to the losses that were realized during the first quarter of 2018. |
| Unrealized loss on commodity-related derivatives | ▼ | $14 million negative variance primarily due to crude storage contracts which expired and were realized during the period. |
| General & administrative and other expense | ● | Consistent with prior period. |
| Net finance costs | ● | Consistent with prior period as $9 million in additional interest expense recognized on the adoption of IFRS 16 largely offset lower losses in fair value of non-commodity-related derivatives. |
| Current tax expense | ▼ | $101 million increase is primarily due to the growth in earnings in the prior year that are recognized in taxable income in the current year. |
| Deferred tax recovery | ▲ | $376 million increase in deferred tax recovery primarily due to the enactment of Bill 3, which will reduce the Alberta tax rate from 12 percent to 8 percent over a four year period. |
| Earnings | ▲ | $401 million increase compared to the first six months of 2018 driven by the items noted above. |
| Cash flow from operating activities | ▲ | $168 million increase, primarily driven by increase in operating results after adjusting for non-cash items, $114 million change in non-cash working capital, $16 million increase in distributions from equity accounted investees, combined with the $27 million impact from the adoption of IFRS 16, offset by $63 million increase in taxes paid. |
Adjusted cash flow from operating activities(1) | ▲ | $40 million increase largely due to the same items impacting cash flow from operating activities, discussed above, net of the $114 million change in non-cash working capital. |
Adjusted EBITDA(1) | ▲ | $150 million increase primarily due to the contribution from new assets placed into service, combined with the impact from the realized gain on commodity-related derivatives, the recognition of variable revenues related to capital recoveries, increased terminalling and storage revenues and $33 million impact from the adoption of IFRS 16. Included in adjusted EBITDA is $420 million (2018: $403 million) related to equity accounted investees. |
Total volume (mboe/d)(2) | ▲ | 61 mboe/d increase due to new assets placed into service, increased demand in the Montney and Duvernay, partially offset by lower take-or-pay commitments on the Nipisi and Mitsue systems. Revenue volumes includes 323 mboe/d (2018: 304 mboe/d) related to equity accounted investees. |
| ▲ | Increase; | ▼ | Decrease; or | ● | No impact; | to earnings, adjusted EBITDA, cash flow from operations, adjusted cash flow from operating activities or total volumes. |
(1) | Refer to "Non-GAAP Measures". |
(2) | Total revenue volumes. Revenue volumes are physical volumes plus volumes recognized from take-or-pay commitments. Volumes are stated in mboe/d, with natural gas volumes converted to mboe/d from MMcf/d at a 6:1 ratio. |
(3) | Pembina corrected revenue and costs of goods sold in the Marketing & New Ventures Division. The adjustments reduce revenue and cost of goods sold for the three and six months ending June 30, 2018 ($202 million). There was no impact to earnings as a result of the adjustment. |
6 Pembina Pipeline Corporation Second Quarter 2019
3. SEGMENT RESULTS
Business Overview
The Pipelines Division includes liquids and natural gas pipelines with a total capacity of approximately three million barrels of oil equivalent per day serving various markets and basins across North America. The Pipelines Division is comprised of Pembina's conventional, transmission and oil sands and heavy oil pipeline assets. The primary objectives of the Pipelines Division are to provide safe, responsible, reliable and cost-effective transportation services for customers; connect customer products to premium markets; pursue opportunities for increased throughput that enhances the return on invested capital; and follow a disciplined approach to operating expenses.
The Facilities Division includes infrastructure that provides Pembina's customers with natural gas, condensate and NGL services. Pembina's natural gas gathering and processing assets are strategically positioned in active, liquids-rich areas of the Western Canadian Sedimentary Basin and are integrated with the Company's other businesses. Pembina provides sweet and sour gas gathering, compression, condensate stabilization, and both shallow cut and deep cut gas processing services with a total capacity of approximately six billion cubic feet per day for its customers. Virtually all of the condensate and NGL extracted through these facilities is transported by Pembina's Pipelines Division. The Facilities Division includes approximately 356 thousand barrels per day of NGL fractionation, 14.3 million barrels of cavern storage, and associated terminalling facilities and the Company is currently constructing a LPG export facility on Canada's West Coast. These facilities are fully integrated with the Company’s other divisions, providing customers with the ability to access a comprehensive suite of services to enhance the value of their hydrocarbons.
The Marketing & New Ventures Division strives to maximize the value of hydrocarbon liquids and natural gas originating in the basins where the Company operates. Pembina seeks to create new markets, and further enhance existing markets, to support both the Company's and its customers' overall business interests. In particular, Pembina seeks to identify opportunities to connect hydrocarbon production to new demand locations through the development of infrastructure. Pembina strives to increase producer netbacks and product demand to improve the overall competitiveness of the basins where the Company operates. Within the Marketing & New Ventures Division, Pembina undertakes value-added commodity marketing activities including buying and selling products (natural gas, ethane, propane, butane, condensate and crude oil), commodity arbitrage, and optimizing storage opportunities. The marketing business enters into contracts for capacity on both Pembina's and third-party infrastructure, handles proprietary and customer volumes and aggregates production for onward sale. The Marketing & New Ventures Division currently includes an integrated propane dehydrogenation plant and polypropylene upgrading facility ("PDH/PP Facility"), being constructed by Pembina’s joint venture, Canada Kuwait Petrochemical Corporation ("CKPC"); and the proposed Jordan Cove LNG project.
Financial and Operational Overview by Division
| 3 Months Ended June 30 | 6 Months Ended June 30 | |||||||||||||||||||||||
| 2019 | 2018 | 2019 | 2018 | |||||||||||||||||||||
| ($ millions, except where noted)(unaudited) | Volumes(1) | Gross Profit | Adjusted EBITDA(2) | Volumes(1) | Gross Profit | Adjusted EBITDA(2) | Volumes(1) | Gross Profit | Adjusted EBITDA(2) | Volumes(1) | Gross Profit | Adjusted EBITDA(2) | ||||||||||||
| Pipelines Division | 2,518 | 360 | 472 | 2,536 | 322 | 435 | 2,513 | 700 | 929 | 2,479 | 616 | 837 | ||||||||||||
| Facilities Division | 866 | 167 | 236 | 849 | 127 | 212 | 881 | 325 | 468 | 854 | 270 | 429 | ||||||||||||
Marketing & New Ventures Division(3) | — | 100 | 97 | — | 57 | 97 | — | 193 | 218 | — | 190 | 202 | ||||||||||||
| Corporate | — | 2 | (40 | ) | — | 5 | (44 | ) | — | (1 | ) | (77 | ) | — | 3 | (80 | ) | |||||||
| Total | 3,384 | 629 | 765 | 3,385 | 511 | 700 | 3,394 | 1,217 | 1,538 | 3,333 | 1,079 | 1,388 | ||||||||||||
(1) | Pipelines and Facilities divisions are revenue volumes which are physical volumes plus volumes recognized from take-or-pay commitments. Volumes are stated in mboe/d, with natural gas volumes converted to mboe/d from MMcf/d at a 6:1 ratio. |
(2) | Refer to "Non-GAAP Measures". |
(3) | Marketed NGL volumes are excluded from volumes to avoid double counting. Refer to the "Marketing & New Ventures Division" section for further information. |
Pembina Pipeline Corporation Second Quarter 2019 7
Pipelines Division
Financial Overview Three Months Ended June 30
Results of Operations
| ($ millions, except where noted) (unaudited) | 2019 | 2018 | Change | % Change | ||||
Conventional Pipelines revenue(1) | 319 | 306 | 13 | 4 | ||||
Transmission Pipelines revenue(1) | 39 | 38 | 1 | 3 | ||||
Oil Sands Pipelines revenue(1) | 85 | 60 | 25 | 42 | ||||
Pipelines revenue(1) | 443 | 404 | 39 | 10 | ||||
Operating expenses(1) | 92 | 92 | — | — | ||||
| Share of profit from equity accounted investees | 67 | 65 | 2 | 3 | ||||
| Depreciation and amortization included in operations | 58 | 55 | 3 | 5 | ||||
| Gross profit | 360 | 322 | 38 | 12 | ||||
Adjusted EBITDA(2) | 472 | 435 | 37 | 9 | ||||
Volumes (mboe/d)(3) | 2,518 | 2,536 | (18 | ) | (1 | ) | ||
| Distributions from equity accounted investees | 100 | 104 | (4 | ) | (4 | ) | ||
| Change in Results | ||
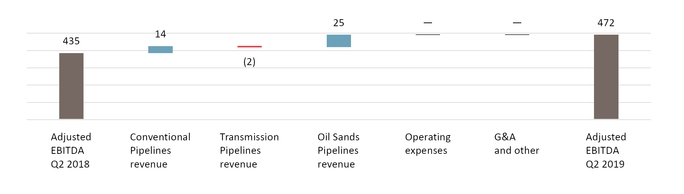
Conventional Pipelines revenue(1) | ▲ | Increase due to revenues associated with Phase IV and V assets placed into service in December 2018 and higher recovery of operating expenses due to increased power costs and geotechnical spending, partially offset by lower revenues from the Western system as a result of lower capital recoveries. |
Transmission Pipelines revenue(1) | ● | Consistent with prior period. |
Oil Sands Pipelines revenue(1) | ▲ | Increase primarily due to the recognition of $16 million of deferred variable revenue related to prior period capital recoveries, combined with $6 million in increased variable revenue related to 2019 capital recoveries and higher recovery of operating expenses due to increased power pool prices and integrity work. |
Operating expenses(1) | ● | Consistent with prior period, increase in power consumption from Phase IV and V being placed into service, combined with higher repairs and maintenance costs, were largely offset by savings associated with taking over operatorship of Alberta Ethane Gathering System ("AEGS"). |
| Share of profit from equity accounted investees | ● | Consistent with prior period. |
| Depreciation and amortization included in operations | ▼ | Increase in depreciation due to larger asset base as Pembina continued to expand its conventional pipeline system, placing Phase IV and V assets into service during December 2018. |
| Distributions from equity accounted investees | ▼ | $100 million consists of $69 million (2018: $74 million) from Alliance and $30 million (2018: $30 million) from Ruby. |
Volumes (mboe/d)(3) | ▼ | Decrease in revenue volumes driven by lower take-or-pay commitment on the Nipisi and Mitsue systems, combined with a third party refinery outage that impacted the Western system, partially offset by the conventional Phase IV and V assets placed into service in December 2018. Revenue volumes includes 141 mboe/d (2018: 146 mboe/d) related to Alliance and 89 mboe/d (2018: 89 mboe/d) related to Ruby. |
Adjusted EBITDA(2) | ▲ | $37 million increase primarily due to the increase in revenues for the oil sands and conventional pipelines assets, both explained above. Included in adjusted EBITDA is $81 million (2018: $85 million) related to Alliance and $48 million (2018: $44 million) related to Ruby. |
Bridge Analysis of Adjusted EBITDA(2) ($ millions)
(1) | Includes inter-division transactions. See note 12 of the Interim Financial Statements. |
(2) | Refer to "Non-GAAP Measures". |
(3) | Revenue volumes. Revenue volumes are physical volumes plus volumes recognized from take-or-pay commitments. Volumes are stated in mboe/d, with natural gas volumes converted to mboe/d from MMcf/d at a 6:1 ratio. |
8 Pembina Pipeline Corporation Second Quarter 2019
Financial Overview Six Months Ended June 30
Results of Operations
| ($ millions, except where noted) (unaudited) | 2019 | 2018 | Change | % Change | |||
Conventional Pipelines revenue(1) | 633 | 563 | 70 | 12 | |||
Transmission Pipelines revenue(1) | 79 | 74 | 5 | 7 | |||
Oil Sands Pipelines revenue(1) | 147 | 120 | 27 | 23 | |||
Total revenue(1) | 859 | 757 | 102 | 13 | |||
Operating expenses(1) | 190 | 177 | 13 | 7 | |||
| Share of profit from equity accounted investees | 146 | 140 | 6 | 4 | |||
| Depreciation and amortization included in operations | 115 | 104 | 11 | 11 | |||
| Gross profit | 700 | 616 | 84 | 14 | |||
Adjusted EBITDA(2) | 929 | 837 | 92 | 11 | |||
Volumes (mboe/d)(3) | 2,513 | 2,479 | 34 | 1 | |||
| Distributions from equity accounted investees | 211 | 194 | 17 | 9 | |||
| Change in Results | ||
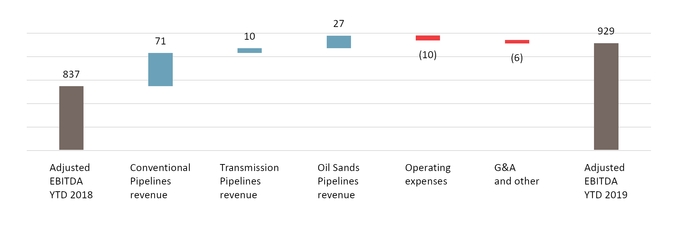
Conventional Pipelines revenue(1) | ▲ | Increase due to revenues associated with Phase IV and V assets placed into service in December 2018 and higher recovery of operating expenses due to increased power costs and geotechnical spending. |
Transmission Pipelines revenue(1) | ▲ | Increase due to higher average tolls on AEGS, combined with a favourable foreign exchange impact. |
Oil Sands Pipelines revenue(1) | ▲ | Increase primarily due to the recognition of $16 million of deferred variable revenue related to prior period capital recoveries, combined with $6 million in increased variable revenue related to 2019 capital recoveries and higher recovery of operating expenses due to increased power pool prices and integrity work. |
Operating expenses(1) | ▼ | Increase primarily due to increased power pool prices and increased power consumption from Phase IV and V being placed into service, combined with higher geotechnical spending for slope mitigation and increased labour costs. |
| Share of profit from equity accounted investees | ▲ | Increase due to higher revenue from Alliance and Ruby driven by favourable foreign exchange rates, combined with operating expense savings associated with transitioning to an owner-operator model for Alliance. |
| Depreciation and amortization included in operations | ▼ | Increase in depreciation due to larger asset base as Pembina placed Phase IV and V assets into service during December 2018. |
| Distributions from equity accounted investees | ▲ | $211 million consists of $150 million (2018: $135 million) from Alliance and $60 million (2018: $59 million) from Ruby. |
Volumes (mboe/d)(3) | ▲ | Increase primarily due to conventional Phase IV and V assets placed into service in December 2018, partially offset by lower take-or-pay commitment on the Nipisi and Mitsue systems and the force majeure impacting the Vantage system. Revenue volumes includes 145 mboe/d (2018: 144 mboe/d) related to Alliance and 89 mboe/d (2018: 89 mboe/d) related to Ruby. |
Adjusted EBITDA(2) | ▲ | $92 million increase primarily due to the increase in revenues for the Conventional and Oil Sands pipelines assets partially offset by the increase in operating expenses, explained above. Included in adjusted EBITDA is $176 million (2018: $175 million) related to Alliance and $101 million (2018: $91 million) related to Ruby. |
Bridge Analysis of Adjusted EBITDA(2) ($ millions)
(1) | Includes inter-division transactions. See note 12 of the condensed consolidated Interim Financial Statements. |
(2) | Refer to "Non-GAAP Measures". |
(3) | Revenue volumes. Revenue volumes are physical volumes plus volumes recognized from take-or-pay commitments. Volumes are stated in mboe/d, with natural gas volumes converted to mboe/d from MMcf/d at a 6:1 ratio. |
Pembina Pipeline Corporation Second Quarter 2019 9
Operational Overview
| 3 Months Ended June 30 | 6 Months Ended June 30 | |||||||||||||||||||||||
| 2019 | 2018 | 2019 | 2018 | |||||||||||||||||||||
| ($ millions, except where noted)(unaudited) | Volumes(1) | Gross Profit | Adjusted EBITDA(2) | Volumes(1) | Gross Profit | Adjusted EBITDA(2) | Volumes(1) | Gross Profit | Adjusted EBITDA(2) | Volumes(1) | Gross Profit | Adjusted EBITDA(2) | ||||||||||||
| Pipelines Division | ||||||||||||||||||||||||
| Conventional Pipelines | 895 | 217 | 252 | 900 | 210 | 241 | 888 | 425 | 492 | 833 | 378 | 440 | ||||||||||||
| Transmission Pipelines | 558 | 89 | 160 | 559 | 79 | 156 | 561 | 194 | 343 | 571 | 174 | 321 | ||||||||||||
| Oil Sands Pipelines | 1,065 | 54 | 60 | 1,077 | 33 | 38 | 1,065 | 81 | 94 | 1,075 | 64 | 76 | ||||||||||||
| Total | 2,518 | 360 | 472 | 2,536 | 322 | 435 | 2,513 | 700 | 929 | 2,479 | 616 | 837 | ||||||||||||
(1) | Revenue volumes. Revenue volumes are physical plus volumes recognized from take-or-pay commitments. Volumes are stated in mboe/d. |
(2) | Refer to "Non-GAAP Measures". |
Projects & New Developments
The Pipelines Division continues to focus on the execution of various system expansions. The projects in the following table were recently placed into service and impact the Pipelines Division results.
Significant Projects(1) | In-service Date |
| Phase V Peace Pipeline Expansion | December 2018 |
| Phase IV Peace Pipeline Expansion | December 2018 |
The Pipeline Division has continued to receive strong customer demand for its transportation services, resulting in a significant and on-going build-out of its pipeline system. Collectively, the Pipeline Division projects are trending on budget.
The following outlines the projects currently underway and new developments within the Pipelines Division:
| Phase VI Peace Pipeline Expansion | ||
Capital Budget: $280 million | In-service Date: In stages starting late 2019 through mid 2020 | Status: On time, trending over budget |
| This expansion includes upgrades at Gordondale, Alberta; a 16-inch pipeline from La Glace to Wapiti, Alberta and associated pump station and terminal upgrades; and a 20-inch pipeline from Kakwa to Lator, Alberta. Detailed engineering for one section is complete with construction underway. | ||
| Phase VII Peace Pipeline Expansion | ||
Capital Budget: $950 million | In-service Date(2): First half of 2021 | Status: On time, trending under budget |
| This expansion is expected to add approximately 240 mbpd of incremental capacity upstream of Fox Creek, accessing capacity available on the pipelines downstream of Fox Creek. Included in the expansion is a new 20-inch, approximately 220-kilometer pipeline in the La Glace-Valleyview-Fox Creek corridor, as well as six new pump stations or terminal upgrades, between La Glace and Edmonton, Alberta. Front End Engineering Design ("FEED") is progressing as planned with construction expected to begin in the fourth quarter of 2019. | ||
| Phase VIII Peace Pipeline Expansion | ||
Capital Budget: $500 million | In-service Date(2): In stages starting in 2020 through the first half of 2022 | Status: On time, trending on budget |
| This expansion will include new 10-inch and 16-inch pipelines in the Gordondale to La Glace corridor as well as six new pump stations or terminal upgrades located between Gordondale and Fox Creek, Alberta. Pre-FEED and FEED work is expected to be completed in the fourth quarter of 2019. | ||
| NEBC Montney Infrastructure | ||
Capital Budget: Not disclosed separately(3) | In-service Date: Third quarter 2019 | Status: On time, trending on budget |
| This infrastructure includes producer tie-in connections to Pembina's Birch Terminal as well as upgrades to the terminal including additional storage and pumps, along with minor site modifications. Construction on the new facilities and associated lateral is in advanced stages. | ||
| Wapiti Condensate Lateral | ||
Capital Budget: Not disclosed separately(3) | In-service Date: Fourth quarter 2019 | Status: On time, trending on budget |
| This is a 12-inch lateral, which will connect growing condensate volumes from a third-party owned facility in the Pipestone Montney region into Pembina's Peace Pipeline. All early works construction has been completed. | ||
(1) | For further details on the Company's significant assets, refer to the Pembina's AIF filed at www.sedar.com (filed with the U.S. Securities and Exchange Commission at www.sec.gov under Form 40-F) and on Pembina's website at www.pembina.com. |
(2) | Subject to environmental and regulatory approvals. See "Forward-Looking Statements". |
(3) | Combined capital budget is $120 million. |
10 Pembina Pipeline Corporation Second Quarter 2019
Facilities Division
Financial Overview Three Months Ended June 30
Results of Operations
| ($ millions, except where noted) (unaudited) | 2019 | 2018 | Change | % Change | ||||
Gas Services net revenue(1)(2)(3) | 140 | 136 | 4 | 3 | ||||
NGL Services net revenue(1)(2)(3) | 134 | 113 | 21 | 19 | ||||
Facilities net revenue(1)(2)(3) | 274 | 249 | 25 | 10 | ||||
Operating expenses(1) | 82 | 85 | (3 | ) | (4 | ) | ||
| Share of profit from equity accounted investees | 12 | 1 | 11 | 1,100 | ||||
| Depreciation and amortization included in operations | 37 | 38 | (1 | ) | (3 | ) | ||
| Gross profit | 167 | 127 | 40 | 31 | ||||
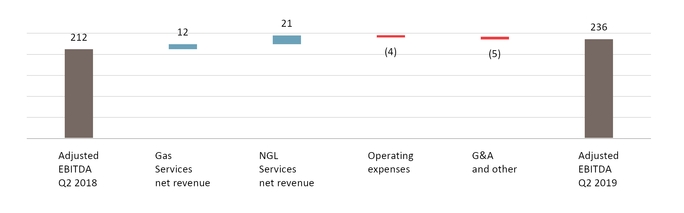
Adjusted EBITDA(3) | 236 | 212 | 24 | 11 | ||||
Volumes (mboe/d)(4) | 866 | 849 | 17 | 2 | ||||
| Distributions from equity accounted investees | 23 | 41 | (18 | ) | (44 | ) | ||
| Changes in Results | ||
Gas Services net revenue(1)(2)(3) | ▲ | Increase is largely attributable to increased operating expense recoveries as a result of higher power costs combined with additional volumes at the Saturn and Kakwa River plants. |
NGL Services net revenue(1)(2)(3) | ▲ | Increase primarily due to Redwater Co-generation and Burstall Ethane Storage going into service March 2019 and January 2019, respectively, combined with increased terminalling revenues at Redwater for propane and butane. |
Operating expenses(1) | ▲ | Decrease caused by reduction in power costs following Redwater Co-generation going into service in March 2019 and lower repairs and maintenance, partially offset by higher power consumption following Burstall Ethane Storage going into service. |
| Share of profit from equity accounted investees | ▲ | Increase is largely the result of increased volumes at Veresen Midstream due in part to the North Central Liquids Hub being placed into service in June 2018, combined with the impact of a $16 million finance gain reversal recorded during the second quarter of 2018. |
| Depreciation and amortization included in operations | ● | Consistent with prior period. |
| Distributions from equity accounted investees | ▼ | $23 million consists of $23 million (2018: $38 million) from Veresen Midstream and $nil (2018: $3 million) from Fort Corp. The decrease in Veresen Midstream distribution is primarily due to refinancing of the debt facility and associated amortization, combined with the conversion of Veresen Midstream Class B Units to Class A Units by Pembina’s joint venture partner, reducing Pembina’s distribution to its ownership percentage and eliminated further dilution of Pembina’s ownership in Veresen Midstream. |
Volumes (mboe/d)(4) | ▲ | Increased revenue volumes primarily due to additional volumes at Veresen Midstream due in part to the North Central Liquids Hub being placed into service in June 2018, increased demand in the Montney and Duvernay plays, combined with consistent volumes at Redwater. Revenue volumes includes 86 mboe/d (2018: 76 mboe/d) related to Veresen Midstream. |
Adjusted EBITDA(3) | ▲ | $24 million increase primarily due to strong NGL Services net revenues and other items, explained above. Included in adjusted EBITDA is $43 million (2018: $44 million) related to Veresen Midstream. |
Bridge Analysis of Adjusted EBITDA(3) ($ millions)
(1) | Includes inter-division transactions. See note 12 of the Interim Financial Statements. |
(2) | Revenue and cost of goods sold reported for all 2018 periods have been restated to reflect updated presentation for 2019, where the majority of cost of goods sold and corresponding revenues are reported in the Marketing & New Ventures Division. |
(3) | Refer to "Non-GAAP Measures". |
(4) | Revenue volumes. Revenue volumes are physical volumes plus volumes recognized from take-or-pay commitments. Volumes are stated in mboe/d, with natural gas volumes converted to mboe/d from MMcf/d at a 6:1 ratio. |
Pembina Pipeline Corporation Second Quarter 2019 11
Financial Overview Six Months Ended June 30
Results of Operations
| ($ millions, except where noted) (unaudited) | 2019 | 2018 | Change | % Change | ||||
Gas Services net revenue(1)(2)(3) | 285 | 274 | 11 | 4 | ||||
NGL Services net revenue(1)(2)(3) | 259 | 223 | 36 | 16 | ||||
Facilities net revenue(1)(2)(3) | 544 | 497 | 47 | 9 | ||||
Operating expenses(1) | 167 | 150 | 17 | 11 | ||||
| Share of profit from equity accounted investees | 24 | (4 | ) | 28 | (700 | ) | ||
| Depreciation and amortization included in operations | 76 | 73 | 3 | 4 | ||||
| Gross profit | 325 | 270 | 55 | 20 | ||||
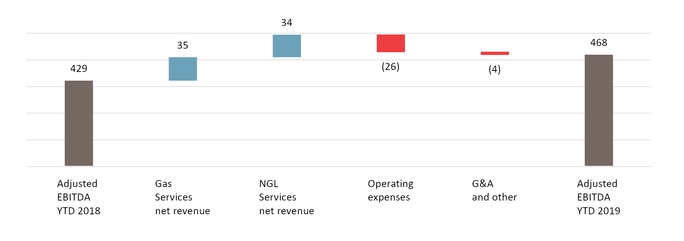
Adjusted EBITDA(3) | 468 | 429 | 39 | 9 | ||||
Volumes (mboe/d)(4) | 881 | 854 | 27 | 3 | ||||
| Distributions from equity accounted investees | 56 | 60 | (4 | ) | (7 | ) | ||
| Changes in Results | ||
Gas Services net revenue(1)(2)(3) | ▲ | Increase is largely attributable to additional demand in the Montney and Duvernay, combined with increased operating expense recoveries as a result of higher power pool prices and the turnaround at the Resthaven facility during the first quarter of 2019. |
NGL Services net revenue(1)(2)(3) | ▲ | Increase primarily due to increased terminalling revenues for propane and butane, combined with the contribution from Redwater Co-generation and Burstall Ethane Storage going into service March 2019 and January 2019, respectively, and higher volumes at Redwater on a year-to-date basis. |
Operating expenses(1) | ▼ | Increase caused by an increase in power pool prices and increased consumption from Burstall Ethane Storage being placed into service, the turnaround at the Resthaven facility and higher labour costs as a result of increased headcount. |
| Share of profit from equity accounted investees | ▲ | Increase mainly due to the contribution from Veresen Midstream following the North Central Liquids Hub going into service in June 2018, combined with the impact of a $24 million finance gain reversal recorded in the first half of 2018. |
| Depreciation and amortization included in operations | ● | Consistent with prior period. |
| Distributions from equity accounted investees | ▼ | $56 million consists of $53 million (2018: $55 million) from Veresen Midstream and $3 million (2018: $5 million) from Fort Corp. |
Volumes (mboe/d)(4) | ▲ | Increased primarily due to additional volumes at Veresen Midstream due in part to the North Central Liquids Hub being placed into service in June 2018, combined with higher volumes at the Saturn, Kakwa River and Cutbank gas plants as a result of increased customer demand and increased volumes at Redwater. Revenue volumes includes 89 mboe/d (2018: 71 mboe/d) related to Veresen Midstream. |
Adjusted EBITDA(3) | ▲ | $39 million increase primarily due to strong NGL and Gas Services revenues, explained above, combined with the North Central Liquids Hub going into service, partially offset by higher operating expenses. Included in adjusted EBITDA is $92 million (2018: $79 million) related to Veresen Midstream. |
Bridge Analysis of Adjusted EBITDA(3) ($ millions)
(1) | Includes inter-division transactions. See note 12 of the condensed consolidated Interim Financial Statements. |
(2) | Revenue and cost of goods sold reported for all 2018 periods have been restated to reflect updated presentation for 2019, where all cost of goods sold and corresponding revenues are reported in the Marketing & New Ventures Division. |
(3) | Refer to "Non-GAAP Measures". |
(4) | Revenue volumes. Revenue volumes are physical volumes plus volumes recognized from take-or-pay commitments. Volumes are stated in mboe/d, with natural gas volumes converted to mboe/d from MMcf/d at a 6:1 ratio. |
12 Pembina Pipeline Corporation Second Quarter 2019
Operational Overview
| 3 Months Ended June 30 | 6 Months Ended June 30 | |||||||||||||||||||||||
| 2019 | 2018 | 2019 | 2018 | |||||||||||||||||||||
| ($ millions, except where noted)(unaudited) | Volumes(1) | Gross Profit | Adjusted EBITDA(2) | Volumes(1) | Gross Profit | Adjusted EBITDA(2) | Volumes(1) | Gross Profit | Adjusted EBITDA(2) | Volumes(1) | Gross Profit | Adjusted EBITDA(2) | ||||||||||||
| Facilities Division | ||||||||||||||||||||||||
| Gas Services | 668 | 82 | 134 | 650 | 70 | 133 | 675 | 164 | 272 | 651 | 136 | 258 | ||||||||||||
| NGL Services | 198 | 85 | 102 | 199 | 57 | 79 | 206 | 161 | 196 | 203 | 134 | 171 | ||||||||||||
| Total | 866 | 167 | 236 | 849 | 127 | 212 | 881 | 325 | 468 | 854 | 270 | 429 | ||||||||||||
(1) | Revenue volumes. Revenue volumes are physical volumes plus volumes recognized from take-or-pay commitments. Volumes are stated in mboe/d, with natural gas volumes converted to mboe/d from MMcf/d at a 6:1 ratio. |
(2) | Refer to "Non-GAAP Measures". |
Projects & New Developments
The Facilities Division continues to build-out its natural gas and NGL processing and fractionation assets to service customer demand. The projects in the following table were recently placed into service and impact the Facilities Division results.
Significant Projects(1) | In-service Date |
| Redwater Co-generation | March 2019 |
| Burstall Ethane Storage | January 2019 |
| Rail Yard Expansion | December 2018 |
| Cavern Storage | Throughout 2018 |
Veresen Midstream(2) | |
| North Central Liquids Hub | June 2018 |
| Saturn Phase II Gas Plant | January 2018 |
As previously announced, during the quarter Pembina executed further agreements with Chevron Canada Limited to construct sour gas treating facilities at the Duvernay Complex (the "Duvernay Sour Treatment Facilities"). These facilities will include a 150 MMcf/d sour gas sweetening system with the potential for 300 MMcf/d of amine regeneration capability and one tonne of sulphur per day of acid gas incineration. These facilities have a capital budget of $65 million and an anticipated in-service date in the first quarter of 2020. The Duvernay Sour Treatment Facilities will have a 20-year contractual life and will be back-stopped by fixed-return arrangements.
As previously announced, in conjunction with the Duvernay Sour Treatment Facilities, additional modifications are required at the Duvernay II and Duvernay III projects to meet the new sour specifications. The capital budgets of Duvernay II and Duvernay III are $320 million and $175 million, respectively.
As previously announced, on April 4, 2019, Pembina elected to cause all of the Veresen Midstream Class B Units held by its joint venture partner to be converted to Class A Units. This election eliminated further dilution of Pembina's ownership in Veresen Midstream. Pembina's interest in Veresen Midstream subsequent to the conversion of Class B Units is 45 percent.
Collectively, the Facilities Division projects are trending on budget.
The following outlines the projects currently underway and new developments within the Facilities Division:
| Duvernay II | ||
Capital Budget: $320 million | In-service Date: Fourth quarter of 2019 | Status: On time, trending on budget |
| Duvernay II is the first tranche of infrastructure development under the 20-year infrastructure development and service agreement with Chevron Canada Limited and KUFPEC. This development includes 300 MMcf/d of raw gas separation and water removal infrastructure; a 100 MMcf/d sweet gas, shallow cut processing facility; 30 mbpd of condensate stabilization; and other associated infrastructure. Onsite mechanical construction has commenced and the majority of the long-lead equipment has been installed onsite. | ||
Pembina Pipeline Corporation Second Quarter 2019 13
| Duvernay III | ||
Capital Budget: $175 million | In-service Date(3): Mid to late 2020 | Status: On time, trending on budget |
| Duvernay III is the second tranche of infrastructure development under the 20-year infrastructure development and service agreement with Chevron Canada Limited and KUFPEC. This development includes a 100 MMcf/d sweet gas, shallow cut processing facility, 20 mbpd of condensate stabilization and other associated infrastructure. Detailed design is progressing and long-lead equipment has predominantly been ordered. | ||
| Duvernay Sour Treatment Facilities | ||
Capital Budget: $65 million | In-service Date: First quarter of 2020 | Status: On time, trending on budget |
| Sour gas treating facilities at the Duvernay Complex including 150 MMcf/d sour gas sweetening system with the potential for 300 MMcf/d of amine regeneration capability and one tonne of sulphur per day of acid gas incineration. Engineering for the project is progressing, onsite construction is expected to commence later this year. | ||
| Prince Rupert Terminal | ||
Capital Budget: $250 million | In-service Date(3): Second half of 2020 | Status: On time, trending over budget |
| The Prince Rupert LPG export terminal is located on Watson Island, British Columbia and is expected to have a permitted capacity of approximately 25 mbpd of LPG. The LPG supply will be sourced primarily from the Company's Redwater Complex. Rail yard track, plant foundations, and sphere construction has started. All sphere materials are now on site. | ||
| Hythe Developments | ||
Capital Budget(4): $185 million | In-service Date(3): Late 2020 | Status: On time, trending on budget |
| Pembina and its 45 percent owned joint venture, Veresen Midstream, will construct natural gas gathering and processing infrastructure in the Pipestone Montney region. The infrastructure consists of an expansion of up to 125 MMcf/d (56 MMcf/d net to Pembina) of sour gas processing at Veresen Midstream's existing Hythe facility and a new, approximately 60-kilometre, 12-inch sour gas pipeline, to be owned be Veresen Midstream and constructed by Pembina. In addition, various laterals will be owned and constructed by Pembina. All long-lead equipment has been ordered. | ||
| Empress Infrastructure | ||
Capital Budget: $120 million | In-service Date: Late 2020 | Status: On time, trending on budget |
| This expansion will add new fractionation and terminalling facilities, which is expected to add approximately 30 mbpd of propane-plus fractionation capacity to Pembina's Empress NGL Extraction Facility. Engineering for the project is complete and mechanical construction is underway. | ||
(1) | For further details on the Company's significant assets refer to the Pembina's AIF filed at www.sedar.com (filed with the U.S. Securities and Exchange Commission at www.sec.gov under Form 40-F) and on Pembina's website at www.pembina.com. |
(2) | Investment in equity accounted investee, which Pembina has a 45 percent interest in as of June 30, 2019. Results from Veresen Midstream impact share of profit from equity accounted investees and proportionally consolidated metrics. See note 5 to the Interim Financial Statements. |
(3) | Subject to environmental and regulatory approvals. See "Forward-Looking Statements". |
(4) | Net to Pembina. |
14 Pembina Pipeline Corporation Second Quarter 2019
Marketing & New Ventures Division
Financial Overview Three Months Ended June 30
Results of Operations
| ($ millions, except where noted) (unaudited) | 2019 | 2018 | Change | % Change | ||||
Marketing revenue(1)(2) | 1,210 | 1,208 | 2 | — | ||||
Cost of goods sold(1)(2) | 1,129 | 1,120 | 9 | 1 | ||||
Net revenue(1)(3) | 81 | 88 | (7 | ) | (8 | ) | ||
| Share of profit from equity accounted investees | 18 | 30 | (12 | ) | (40 | ) | ||
| Realized (gain) loss on commodity-related derivative financial instruments | (1 | ) | 9 | (10 | ) | (111 | ) | |
| Unrealized (gain) loss on commodity-related derivative financial instruments | (15 | ) | 46 | (61 | ) | (133 | ) | |
| Depreciation and amortization included in operations | 15 | 6 | 9 | 150 | ||||
| Gross profit | 100 | 57 | 43 | 75 | ||||
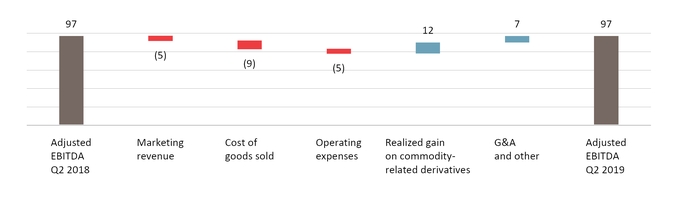
Adjusted EBITDA(3) | 97 | 97 | — | — | ||||
Volumes (mboe/d)(4) | 175 | 155 | 20 | 13 | ||||
| Distributions from equity accounted investees | 17 | 23 | (6 | ) | (26 | ) | ||
| Change in Results | ||
Marketing revenue(1)(2) | ● | Higher NGL marketed volumes were largely offset by lower pricing for propane and butane during the second quarter of 2019, combined with higher crude revenues, as a result of higher realized prices. |
Cost of goods sold(1)(2) | ▼ | Increase due to higher cost of crude driven by an increase in prices, largely offset by the decrease in propane and butane prices which reduced total cost of NGL purchases, combined with the $10 million impact of adopting IFRS 16 that reduced cost of goods sold and increased depreciation and finance costs. |
| Share of profit from equity accounted investees | ▼ | Decrease largely due to lower propane margins at Aux Sable resulting from a decrease in sales prices, combined with a narrower Chicago-AECO natural gas differential and a routine outage during June to complete regular maintenance. |
| Realized (gain) loss on commodity-related derivatives | ▲ | Increase due to the swing to a gain position for derivatives that were settled during the period at prices that were higher than the contracted price, compared to losses that were realized during the second quarter of 2018. |
| Unrealized (gain) loss on commodity-related derivatives | ▲ | Unrealized gain primarily due to a decrease in the price of propane and butane which drove the associated derivative contracts into a gain position, compared to the loss position in the second quarter of 2018 when prices were higher. |
| Depreciation and amortization included in operations | ▼ | Increase largely due to $9 million of additional depreciation on leased rail cars, which are recognized as a right-of-use asset and depreciated following the adoption of IFRS 16. |
| Distributions from equity accounted investees | ▼ | $17 million (2018: $23 million) from Aux Sable. |
Volumes (mboe/d)(4) | ▲ | Increased NGL sales volumes primarily driven by increased supply volumes at Redwater. Revenue volumes includes 29 mboe/d (2018: 37 mboe/d) related to Aux Sable. |
Adjusted EBITDA(3) | ● | Lower margins on propane and butane, explained above, were offset by the realized gain on commodity-related derivatives, combined with the $10 million impact of the adoption of IFRS 16 and lower general and administrative expenses in New Ventures. Included in adjusted EBITDA is $23 million (2018: $34 million) related to Aux Sable. |
Bridge Analysis of Adjusted EBITDA ($ millions)(3)
(1) | Includes inter-division transactions. See note 12 of the Interim Financial Statements. |
(2) | Revenue and cost of goods sold reported for all 2018 periods have been restated to reflect updated presentation for 2019, where the majority of cost of goods sold and corresponding revenues are reported in the Marketing & New Ventures Division. |
(3) | Refer to "Non-GAAP Measures". |
(4) | Marketed NGL volumes. Volumes are stated in mboe/d. |
Pembina Pipeline Corporation Second Quarter 2019 15
Financial Overview Six Months Ended June 30
Results of Operations
| ($ millions, except where noted) (unaudited) | 2019 | 2018 | Change | % Change | ||||
Marketing revenue(1)(2) | 2,606 | 2,540 | 66 | 3 | ||||
Cost of goods sold(1)(2) | 2,394 | 2,332 | 62 | 3 | ||||
Net revenue(1)(3) | 212 | 208 | 4 | 2 | ||||
| Share of profit from equity accounted investees | 23 | 36 | (13 | ) | (36 | ) | ||
| Realized (gain) loss on commodity-related derivative financial instruments | (20 | ) | 27 | (47 | ) | (174 | ) | |
| Unrealized loss on commodity-related derivative financial instruments | 30 | 16 | 14 | 88 | ||||
| Depreciation and amortization included in operations | 32 | 11 | 21 | 191 | ||||
| Gross profit | 193 | 190 | 3 | 2 | ||||
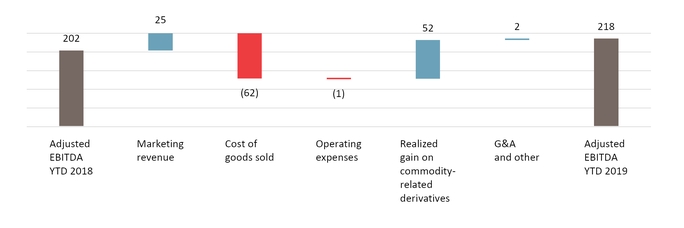
Adjusted EBITDA(3) | 218 | 202 | 16 | 8 | ||||
Volumes (mboe/d)(4) | 196 | 172 | 24 | 14 | ||||
| Distributions from equity accounted investees | 43 | 40 | 3 | 8 | ||||
| Change in Results | ||
Marketing revenue(1)(2) | ▲ | Increase primarily due to higher NGL sales volumes at Redwater and increased crude sales volumes, combined with a $33 million settlement payment from a contract dispute that was resolved during the first quarter of 2019, partially offset by lower NGL market prices. |
Cost of goods sold(1)(2) | ▼ | Increase due to the additional sales volumes noted in revenue above, partially offset by a $20 million adjustment on the adoption of IFRS 16 that reduced cost of goods sold and increased depreciation and finance costs. |
| Share of profit from equity accounted investees | ▼ | Decrease due to lower propane margins at Aux Sable resulting from lower sales prices during the second quarter of 2019, combined with an outage during June to complete regular maintenance. |
| Realized (gain) loss on commodity-related derivatives | ▲ | Increase due to the swing to a gain position for derivatives that were settled during period at prices that were higher than the contracted price, compared to the losses that were realized during the first six months of 2018. |
| Unrealized loss on commodity-related derivatives | ▼ | Increase in unrealized loss primarily due to crude storage contracts which expired and were realized during the period. |
| Depreciation and amortization included in operations | ▼ | Increase largely due to $18 million of depreciation on leased rail cars, which are recognized as a right-of-use asset and depreciated following the adoption of IFRS 16. |
| Distributions from equity accounted investees | ▲ | $43 million (2018: $40 million) from Aux Sable. |
Volumes (mboe/d)(4) | ▲ | Increased NGL sales volumes primarily driven by increased supply volumes at Redwater. Revenue volumes includes 34 mboe/d (2018: 41 mboe/d) related to Aux Sable. |
Adjusted EBITDA(3) | ▲ | $16 million increase primarily due to an increased realized gain on commodity-related derivatives, combined with the $20 million impact of the adoption of IFRS 16, partially offset by lower margins after adjusting for the $33 million settlement payment mentioned above. Included in adjusted EBITDA is $41 million (2018: $47 million) related to Aux Sable. |
Bridge Analysis of Adjusted EBITDA(3)(5)($ millions)
(1) | Includes inter-division transactions. See note 12 of the condensed consolidated Interim Financial Statements. |
(2) | Revenue and cost of goods sold reported for all 2018 periods have been restated to reflect updated presentation for 2019, where all cost of goods sold and corresponding revenues are reported in the Marketing & New Ventures Division. |
(3) | Refer to "Non-GAAP Measures". |
(4) | Marketed NGL volumes. Volumes are stated in mboe/d. |
(5) | Marketing revenue excludes the positive contract settlement of $33 million. |
16 Pembina Pipeline Corporation Second Quarter 2019
Operational Overview
| 3 Months Ended June 30 | 6 Months Ended June 30 | |||||||||||||||||||||||
| 2019 | 2018 | 2019 | 2018 | |||||||||||||||||||||
| ($ millions, except where noted)(unaudited) | Volumes(1) | Gross Profit | Adjusted EBITDA(2) | Volumes(1) | Gross Profit | Adjusted EBITDA(2) | Volumes(1) | Gross Profit | Adjusted EBITDA(2) | Volumes(1) | Gross Profit | Adjusted EBITDA(2) | ||||||||||||
| Marketing & New Ventures Division | ||||||||||||||||||||||||
| Marketing | 175 | 100 | 100 | 155 | 57 | 108 | 196 | 193 | 227 | 172 | 190 | 219 | ||||||||||||
New Ventures(3) | — | — | (3 | ) | — | — | (11 | ) | — | — | (9 | ) | — | — | (17 | ) | ||||||||
| Total | 175 | 100 | 97 | 155 | 57 | 97 | 196 | 193 | 218 | 172 | 190 | 202 | ||||||||||||
(1) | Marketed NGL volumes. Volumes are stated in mboe/d. |
(2) | Refer to "Non-GAAP Measures". |
(3) | All New Ventures projects have not yet commenced operations and therefore have no volumes or gross profit. |
Projects & New Developments
Subsequent to the quarter, effective July 15, 2019, Pembina assumed responsibility for operating the assets of Aux Sable.
The following outlines the projects currently underway and new developments within the Marketing & New Ventures Division:
| PDH/PP Facility | ||
Capital Budget(1): $2.5 billion | In-service Date(2): Mid-2023 | Status: On time, trending on budget |
| The PDH/PP Facility will be located adjacent to Pembina's Redwater fractionation complex and will convert approximately 23,000 bpd of locally supplied propane into polypropylene, a high value recyclable polymer used in a wide range of finished products including but not limited to automobiles, medical devices, food packaging and home electronic appliances, among others. The project is in the execution phase including obtaining engineering, procurement and construction bids. Long-lead equipment order placement is largely complete. An early works construction contract has been awarded and site-clearing is complete. | ||
| Jordan Cove LNG Project (proposed) | ||
| The proposed Jordan Cove LNG project is a world-scale LNG export facility which would transport North American natural gas to world markets. The project is made up of two parts: the LNG terminal, with a planned design capacity of 7.8 million tonnes per annum and the Pacific Connector Gas pipeline which would transport natural gas from Malin, Oregon to an LNG terminal in Coos County, Oregon. | ||
| Regulatory processes for Jordan Cove are progressing. On March 29, 2019 the FERC issued a Draft Environmental Impact Statement, which provides a constructive framework for the approval of Jordan Cove essentially as proposed, with reasonable conditions that work with the project development process and with only minor suggested changes. A final FERC decision is expected by January 2020. The Oregon State permit approval with respect to the Coastal Zone Management Act is progressing. In May, the Oregon Department of Environmental Quality ("DEQ") denied the Company’s 401 permit without prejudice based on procedural reasons. The DEQ has encouraged the Company to re-apply and Pembina continues to work on a path forward. Each of the permits are a critical component of the regulatory process and enable the commercial viability and critical investment to move forward. | ||
| The Company has signed voluntary easement agreements that constitute 82 percent of the privately owned portion of the proposed pipeline route, which will allow the pipeline to cross beneath these properties. | ||
| Commercial discussions with prospective customers are ongoing as regulatory permitting is progressed. | ||
| The Company intends to seek partners for both the pipeline and liquification facility thereby reducing its 100 percent ownership interest to a net ownership interest of between 40 and 60 percent with the intention to reduce the capital, operating, and other project risks. | ||
(1) | Net to Pembina. |
(2) | Subject to environmental and regulatory approvals. |
Pembina Pipeline Corporation Second Quarter 2019 17
4. LIQUIDITY & CAPITAL RESOURCES
Available Sources of Liquidity
| June 30, 2019 | ||||
| ($ millions) | (unaudited) | December 31, 2018 | ||
Working capital(1) | (450 | ) | (477 | ) |
Variable rate debt(2) | ||||
| Bank debt | 1,000 | 1,305 | ||
| Total variable rate debt outstanding (weighted average of 2.9% (2018: 3.2%)) | 1,000 | 1,305 | ||
Fixed rate debt(2) | ||||
| Senior unsecured notes | 540 | 540 | ||
| Senior unsecured medium-term notes | 6,300 | 5,700 | ||
| Total fixed rate debt outstanding (weighted average of 4.2% (2018: 4.2%)) | 6,840 | 6,240 | ||
Finance lease liability(3) | — | 19 | ||
| Total debt outstanding | 7,840 | 7,564 | ||
| Cash and unutilized debt facilities | 2,848 | 2,372 | ||
(1) | As at June 30, 2019, working capital includes $340 million (December 31, 2018: $480 million) associated with the current portion of loans and borrowings. |
(2) | Face value. |
(3) | Finance lease liabilities reported separately following the adoption of IFRS 16, see "Changes in Accounting Policies". |
Pembina anticipates its cash flow from operating activities, the majority of which is derived from fee-based contracts, will be more than sufficient to meet its short-term and long-term operating obligations and fund its dividends. In the short term, Pembina expects to source funds required for capital projects and contributions to investments in equity accounted investees from cash, its credit facilities and by accessing the capital markets, as required. Based on its successful access to financing in the capital markets over the past several years, Pembina believes it should continue to have access to additional funds as required. Refer to "Risk Factors – Additional Financing and Capital Resources" in Pembina's MD&A and note 24 to the Consolidated Financial Statements for the year ended December 31, 2018 for more information. Management remains satisfied that the leverage employed in Pembina's capital structure is sufficient and appropriate given the characteristics and operations of the underlying asset base.
Management may make adjustments to Pembina's capital structure as a result of changes in economic conditions or the risk characteristics of the underlying assets. To maintain or modify Pembina's capital structure in the future, Pembina may renegotiate new debt terms, repay existing debt, seek new borrowing, issue additional equity and/or repurchase shares.
Pembina's credit facilities consist of an unsecured $2.5 billion (December 31, 2018: $2.5 billion) revolving credit facility which includes a $750 million accordion feature and matures in May 2024, an unsecured $1.0 billion (December 31, 2018: $1.0 billion) non-revolving term loan which matures in March 2021, and an operating facility of $20 million (December 31, 2018: $20 million) due in May 2020 and is typically renewed on an annual basis. There are no repayments due over the term of these facilities. As at June 30, 2019, Pembina had $2.8 billion (December 31, 2018: $2.4 billion) of cash and unutilized debt facilities. At June 30, 2019, Pembina had loans and borrowings (excluding deferred financing costs) of $7.8 billion (December 31, 2018: $7.5 billion). Pembina also had an additional $68 million (December 31, 2018: $69 million) in letters of credit issued pursuant to separate credit facilities. Pembina is required to meet certain specific and customary affirmative and negative financial covenants under its senior unsecured notes, medium-term notes, revolving credit, non-revolving term and operating facilities, including a requirement to maintain certain financial ratios. Pembina is also subject to customary restrictions on its operations and activities under its notes and credit facilities, including restrictions on the granting of security, incurring indebtedness and the sale of its assets.
On July 11, 2019, the Pipeline Financial Requirements Regulations (“Regulations”) issued under the National Energy Board (“NEB”) Act came into effect. The Regulations set out the absolute liability limits required for operators of NEB-regulated pipelines to respond to an unintended or uncontrolled release of commodity from a pipeline. The newly enacted Regulations require operators to demonstrate that they have, and will maintain, the prescribed financial resources to fund their respective
18 Pembina Pipeline Corporation Second Quarter 2019
absolute liability or a greater amount as determined by the NEB, including a set portion (five percent) in readily available resources. Pembina has direct ownership in NEB-regulated assets with a total absolute liability of $450 million. Pembina filed its financial resources plan with the NEB verifying its ability to meet the $450 million liability using prescribed financial resources, including $22.5 million in readily available resources, and has maintained compliance with the requirements of the NEB Act.
Covenants
Pembina's financial covenants include the following:
| Debt Instrument | Financial Covenant(1) | Ratio | Ratio at June 30, 2019 |
| Senior unsecured medium-term notes | Funded Debt to Capitalization | Maximum 0.70 | 0.35 |
| Revolving unsecured credit facility and non-revolving term loan | Debt to Capital | Maximum 0.65 | 0.34 |
| EBITDA to senior interest coverage | Minimum 2.5:1.0 | 8.91 | |
(1) | Terms as defined in relevant agreements. |
In addition to the table above, Pembina has customary covenants on its other senior unsecured notes. Pembina was in compliance with all covenants under its notes and facilities as at June 30, 2019 (December 31, 2018: in compliance).
Pembina continues to actively monitor and reassess the creditworthiness of its counterparties. Financial assurances to mitigate and reduce risk may include guarantees, letters of credit and cash. Letters of credit totaling $108 million (December 31, 2018: $122 million) were held at June 30, 2019, primarily in respect of customer trade receivables.
Outstanding Share Data(1)
| Issued and outstanding (thousands of shares) | July 29, 2019 | |
| Common shares | 511,500 | |
| Stock options | 17,098 | |
| Stock options exercisable | 8,316 | |
| Class A, Series 1 Preferred shares | 10,000 | |
| Class A, Series 3 Preferred shares | 6,000 | |
| Class A, Series 5 Preferred shares | 10,000 | |
| Class A, Series 7 Preferred shares | 10,000 | |
| Class A, Series 9 Preferred shares | 9,000 | |
| Class A, Series 11 Preferred shares | 6,800 | |
| Class A, Series 13 Preferred shares | 10,000 | |
| Class A, Series 15 Preferred shares | 8,000 | |
| Class A, Series 17 Preferred shares | 6,000 | |
| Class A, Series 19 Preferred shares | 8,000 | |
| Class A, Series 21 Preferred shares | 16,000 | |
(1) | The Company's common shareholders and Class A preferred shareholders, by separate class votes, approved a special resolution to amend the Company's articles to increase the limit on the number of Class A preferred shares the Company is authorized to issue (the “Amendment”). The Company filed Articles of Amendment effecting the Amendment on June 25, 2019. A copy of the Company’s articles can be found online at www.sedar.com. |
Financing Activity
On April 3, 2019, Pembina closed an offering of $800 million of senior unsecured medium-term notes (the "Offering"). The Offering was conducted in two tranches consisting of $400 million in senior unsecured medium-term notes, series 12, having a fixed coupon of 3.62 percent per annum, paid semi-annually, and maturing on April 3, 2029 and $400 million in senior unsecured medium-term notes, series 13, having a fixed coupon of 4.54 percent per annum, paid semi-annually, and maturing on April 3, 2049.
On May 31, 2019, Pembina completed an extension on its $2.5 billion revolving credit facility, which now matures on May 31, 2024.
Pembina Pipeline Corporation Second Quarter 2019 19
On June 13, 2019, Pembina's $200 million senior unsecured medium term note 4A matured and was fully repaid.
Credit Ratings
The following information with respect to Pembina's credit ratings is provided as it relates to Pembina's financing costs and liquidity. Specifically, credit ratings affect Pembina's ability to obtain short-term and long-term financing and the cost of such financing. A reduction in the current ratings on Pembina's debt by its rating agencies, particularly a downgrade below investment-grade ratings, could adversely affect Pembina's cost of financing and its access to sources of liquidity and capital. In addition, changes in credit ratings may affect Pembina's ability, and the associated costs, to enter into normal course derivative or hedging transactions. Credit ratings are intended to provide investors with an independent measure of credit quality of any issues of securities. The credit ratings assigned by the rating agencies are not recommendations to purchase, hold or sell the securities, nor do the ratings comment on market price or suitability for a particular investor. Any rating may not remain in effect for a given period of time or may be revised or withdrawn entirely by a rating agency in the future if, in its judgment, circumstances so warrant.
Pembina targets strong 'BBB' credit ratings. DBRS rates Pembina's senior unsecured notes and senior unsecured medium-term notes 'BBB' and Class A Preferred Shares Pfd-3. S&P's long-term corporate credit rating on Pembina is 'BBB' and its rating of the Class A Preferred Shares is P-3 (High).
Contractual Obligations
Pembina had the following contractual obligations outstanding at June 30, 2019:
Contractual Obligations(1) | Payments Due By Period | |||||||||
| ($ millions) | Total | Less than 1 year | 1 – 3 years | 3 – 5 years | After 5 years | |||||
Leases(2) | 562 | 82 | 148 | 106 | 226 | |||||
Loans and borrowings(3) | 11,715 | 694 | 2,356 | 1,526 | 7,139 | |||||
Construction commitments(4) | 1,396 | 770 | 94 | 42 | 490 | |||||
Other(5) | 278 | 32 | 71 | 55 | 120 | |||||
| Total contractual obligations | 13,951 | 1,578 | 2,669 | 1,729 | 7,975 | |||||
(1) | Pembina enters into product purchase agreements and power purchase agreements to secure supply for future operations. Purchase prices of both NGL and power are dependent on current market prices. Volumes and prices for NGL and power contracts cannot be reasonably determined and therefore an amount has not been included in the contractual obligations schedule. Product purchase agreements range from one to 10 years and involve the purchase of NGL products from producers. Assuming product is available, Pembina has secured between 24 and 105 mbpd each year up to and including 2027. Power purchase agreements range from one to 25 years and involve the purchase of power from electrical service providers. The Company has secured up to 70 megawatts per day each year up to and including 2043. |
(2) | Includes rail, office space, land and vehicle leases. |
(3) | Excluding deferred financing costs. Including interest payments on senior unsecured notes. |
(4) | Excluding significant projects that are awaiting regulatory approval at June 30, 2019, projects which Pembina is not committed to construct, and projects that are executed by equity accounted investees. See "Selected Equity Accounted Investee Information" for details regarding the nature of Pembina’s commitments to fund equity accounted investees. |
(5) | Includes $81 million in commitments related to leases that have not yet commenced. |
Pembina is, subject to certain conditions, contractually committed to the construction and operation of Phase VI and Duvernay II as well as certain pipeline connections and laterals and other corporate infrastructure. See "Forward-Looking Statements & Information".
5. CAPITAL EXPENDITURES
| 3 Months Ended June 30 | 6 Months Ended June 30 | |||||||
| ($ millions)(unaudited) | 2019 | 2018 | 2019 | 2018 | ||||
| Pipelines Division | 234 | 119 | 426 | 385 | ||||
| Facilities Division | 148 | 101 | 260 | 139 | ||||
| Marketing & New Ventures Division | 47 | 33 | 102 | 53 | ||||
| Corporate/other projects | 5 | 2 | 7 | 2 | ||||
| Total capital | 434 | 255 | 795 | 579 | ||||
Contributions to equity accounted investees(1)(2) | 28 | — | 118 | 58 | ||||
(1) | Contributions for the three months ended June 30, 2019, include $27 million (2018: $nil) to CKPC and $1 million (2018: $nil) to Aux Sable. |
(2) | Contributions for the six months ended June 30, 2019, include $90 million (2018: $nil) to CKPC, $26 million (2018: $58 million) to Veresen Midstream and $2 million (2018: $nil) to Aux Sable. |
20 Pembina Pipeline Corporation Second Quarter 2019
For the three months ended June 30, 2019, capital expenditures were $434 million, compared to $255 million during the same three-month period of 2018. For the six months ended June 30, 2019, capital expenditures were $795 million, compared to $579 million during the same six month period of 2018. In both 2019 and 2018, the Pipelines Division's capital expenditures were primarily related to Pembina's ongoing pipeline expansion projects. In 2019, the Facilities Division's capital expenditures were largely related to construction on Duvernay II, Empress Infrastructure and the Prince Rupert Terminal. In 2018, the Facilities Division's capital expenditures were largely related to construction of Duvernay II, the Burstall Ethane Storage, Redwater Co-generation and the Prince Rupert Terminal. Capital expenditures in the Marketing & New Ventures Division in both 2019 and 2018 were primarily related to the Jordan Cove LNG project.
6. DIVIDENDS
Common Share Dividends
Common share dividends are payable if, as, and when declared by Pembina's Board of Directors. The amount and frequency of dividends declared and payable is at the discretion of the Board of Directors, which considers earnings, cash flow, capital requirements, the financial condition of Pembina and other relevant factors when making its dividend determination.
On May 2, 2019, Pembina's Board of Directors approved a five percent increase to its monthly common share dividend rate (from $0.19 per common share to $0.20 per common share), commencing with the dividend paid on June 14, 2019.
Preferred Share Dividends
The holders of Pembina's Class A Preferred Shares are entitled to receive fixed cumulative dividends. Dividends on the Series 1, 3, 5, 7, 9, 11, 13 and 21 preferred shares are payable quarterly on the first day of March, June, September and December, if, as and when declared by the Board of Directors of Pembina. Dividends on the Series 15, 17 and 19 preferred shares are payable on the last day of March, June, September and December in each year, if, as and when declared by the Board of Directors.
On January 30, 2019, Pembina announced that it did not intend to exercise its right to redeem the six million Cumulative Redeemable Rate Reset Class A Preferred Shares, Series 3 ("Series 3 Shares") shares outstanding on March 1, 2019. The annual dividend rate for the Series 3 Shares for the five-year period from and including March 1, 2019 to, but excluding, March 1, 2024 will be 4.478 percent.
On March 1, 2019, Pembina announced that it did not intend to exercise its right to redeem the six million Cumulative Redeemable Rate Reset Class A Preferred Shares, Series 17 ("Series 17 Shares") shares outstanding on March 31, 2019. The annual dividend rate for the Series 17 Shares for the five-year period from and including March 31, 2019 to, but excluding, March 31, 2024 will be 4.821 percent.
On May 2, 2019, Pembina announced that it did not intend to exercise its right to redeem the 10 million Cumulative Redeemable Rate Reset Class A Preferred Shares, Series 5 ("Series 5 Shares") shares outstanding on June 3, 2019. The annual dividend rate for the Series 5 Shares for the five-year period from and including June 1, 2019 to, but excluding, June 1, 2024 will be 4.573 percent.
Pembina Pipeline Corporation Second Quarter 2019 21
7. SELECTED QUARTERLY INFORMATION
Selected Quarterly Operating Information
| (mboe/d unless stated otherwise) | 2019 | 2018 | 2017(3)(4) | |||||||||||||
| Q2 | Q1 | Q4 | Q3 | Q2 | Q1 | Q4 | Q3 | |||||||||
Volumes(1)(2) | ||||||||||||||||
| Pipelines Division | ||||||||||||||||
| Conventional Pipelines | 895 | 880 | 897 | 946 | 900 | 766 | 796 | 715 | ||||||||
| Transmission Pipelines | 558 | 563 | 566 | 571 | 559 | 584 | 567 | 38 | ||||||||
| Oil Sands Pipelines | 1,065 | 1,064 | 1,066 | 1,076 | 1,077 | 1,074 | 1,087 | 1,087 | ||||||||
| Facilities Division | ||||||||||||||||
| Gas Services | 668 | 682 | 683 | 669 | 650 | 636 | 606 | 486 | ||||||||
| NGL Services | 198 | 214 | 241 | 203 | 199 | 206 | 194 | 188 | ||||||||
| Total | 3,384 | 3,403 | 3,453 | 3,465 | 3,385 | 3,266 | 3,250 | 2,514 | ||||||||
(1) | Pipelines and Facilities divisions are revenue volumes which are physical volumes plus volumes recognized from take-or-pay commitments. Volumes are stated in mboe/d, with natural gas volumes converted to mboe/d from MMcf/d at a 6:1 ratio. |
(2) | Includes Pembina's proportionate share of results from equity accounted investees. |
(3) | 2017 volumes have been restated for the Corporate Reorganization and to exclude compression volumes relating to Veresen Midstream. |
(4) | Average volumes for assets acquired in the Acquisition are calculated over the period following the Acquisition, rather than the full twelve months ended December 31, 2017. |
Deferred Take-or-pay Revenue
| ($ millions, except where noted) | 2019 | 2018 | ||||||||||
| Q2 | Q1 | Q4 | Q3 | Q2 | Q1 | |||||||
| Pipelines Division | ||||||||||||
| Opening balance | 19 | 7 | — | 26 | 35 | 8 | ||||||
| Revenue deferred (recognized), net for the quarter | 4 | 12 | 7 | (26 | ) | (9 | ) | 27 | ||||
| Ending take-or-pay contract liability balance | 23 | 19 | 7 | — | 26 | 35 | ||||||
| Facilities Division | ||||||||||||
| Opening balance | 1 | 2 | 3 | — | 3 | — | ||||||
| Revenue deferred (recognized), net for the quarter | (1 | ) | (1 | ) | (1 | ) | 3 | (3 | ) | 3 | ||
| Ending take-or-pay contract liability balance | — | 1 | 2 | 3 | — | 3 | ||||||
Quarterly Segmented Adjusted EBITDA(1)
($ millions)
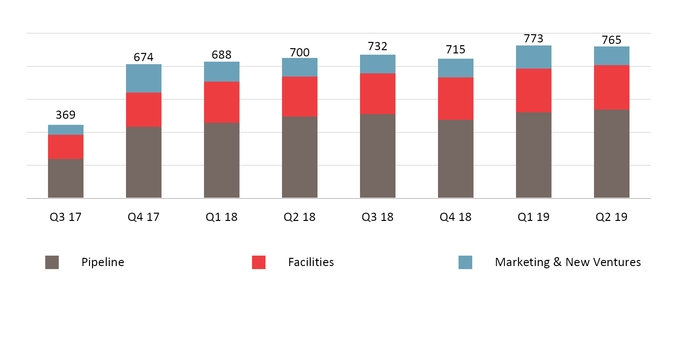
(1) Refer to "Non-GAAP Measures".
22 Pembina Pipeline Corporation Second Quarter 2019
Quarterly Financial Information
| ($ millions, except where noted) | 2019 | 2018 | 2017 | |||||||||||||
| Q2 | Q1 | Q4 | Q3 | Q2(2) | Q1 | Q4 | Q3(2) | |||||||||
| Revenue | 1,808 | 1,968 | 1,726 | 2,045 | 1,743 | 1,837 | 1,716 | 1,151 | ||||||||
Net revenue(1) | 758 | 774 | 706 | 742 | 669 | 719 | 709 | 536 | ||||||||
| Operating expenses | 134 | 140 | 165 | 136 | 100 | 150 | 130 | 112 | ||||||||
| Realized (gain) loss on commodity-related derivative financial instruments | (1 | ) | (19 | ) | (5 | ) | 29 | 9 | 18 | 42 | 17 | |||||
| Share of profit from equity accounted investees | 97 | 96 | 129 | 110 | 96 | 76 | 116 | — | ||||||||
| Gross profit | 629 | 588 | 663 | 585 | 511 | 568 | 555 | 274 | ||||||||
| Earnings | 664 | 313 | 368 | 334 | 246 | 330 | 445 | 111 | ||||||||
Earnings per common share – basic (dollars) | 1.23 | 0.55 | 0.66 | 0.60 | 0.43 | 0.59 | 0.83 | 0.23 | ||||||||
Earnings per common share – diluted (dollars) | 1.23 | 0.55 | 0.66 | 0.60 | 0.42 | 0.59 | 0.83 | 0.23 | ||||||||
| Cash flow from operating activities | 661 | 608 | 674 | 481 | 603 | 498 | 523 | 302 | ||||||||
Cash flow from operating activities per common share – basic (dollars)(1) | 1.29 | 1.20 | 1.33 | 0.95 | 1.20 | 0.99 | 1.04 | 0.75 | ||||||||
Adjusted cash flow from operating activities(1) | 550 | 578 | 543 | 523 | 558 | 530 | 499 | 314 | ||||||||
Adjusted cash flow from operating activities per common share – basic(1) (dollars) | 1.08 | 1.14 | 1.07 | 1.03 | 1.11 | 1.05 | 0.99 | 0.78 | ||||||||
Common shares outstanding (millions): | ||||||||||||||||
| Weighted average – basic | 511 | 509 | 507 | 506 | 504 | 503 | 502 | 403 | ||||||||
| Weighted average – diluted | 513 | 511 | 509 | 509 | 508 | 508 | 507 | 404 | ||||||||
| End of period | 511 | 510 | 508 | 506 | 504 | 503 | 503 | 403 | ||||||||
| Common share dividends declared | 302 | 290 | 289 | 288 | 282 | 272 | 272 | 205 | ||||||||
| Dividends per common share | 0.59 | 0.57 | 0.57 | 0.57 | 0.56 | 0.54 | 0.54 | 0.51 | ||||||||
| Preferred share dividends declared | 30 | 31 | 31 | 30 | 31 | 30 | 26 | 19 | ||||||||
| Capital expenditures | 434 | 361 | 356 | 291 | 255 | 324 | 314 | 341 | ||||||||
| Contributions to equity accounted investees | 28 | 90 | — | — | — | 58 | 6 | — | ||||||||
| Distributions from equity accounted investees | 140 | 170 | 158 | 170 | 168 | 126 | 148 | 3 | ||||||||
Adjusted EBITDA(1) | 765 | 773 | 715 | 732 | 700 | 688 | 674 | 369 | ||||||||
(1) | Refer to "Non-GAAP Measures". |
(2) | Pembina corrected revenue and costs of goods sold in the Marketing & New Ventures Division in 2018. The adjustments reduce revenue and cost of goods sold for the quarter ending June 30, 2018 ($202 million) and increase revenue and cost of goods sold for the quarter ending September 30, 2017 ($106 million). There was no impact to earnings as a result of the adjustments. |
During the periods in the table above, Pembina's results were impacted by the following factors and trends:
| • | The Acquisition on October 2, 2017; |
| • | Increased production in key operating areas and resource plays within the WCSB (Deep Basin, Montney and Duvernay) which has increased revenue and sales volumes on Pembina's existing assets in the Pipelines and Facilities divisions; |
| • | New large-scale growth projects across Pembina's business being placed into service; |
| • | Volatility in commodity market prices impacting margins within the marketing business, partially mitigated through Pembina's risk management program; |
| • | Lower Alberta tax rates following the enactment of Bill 3, in June 2019 and lower income tax rates on U.S. operations following the enactment of U.S. tax reform legislation in December 2017; |
| • | Higher net finance costs impacting earnings associated with debt related to financing acquisitions and growth projects; |
| • | Increased common and preferred shares outstanding and corresponding dividends due to the Acquisition; and |
| • | Adoption of IFRS 15 Revenue from Contracts with Customers on January 1, 2018; and adoption of IFRS 16 on January 1, 2019. See "Accounting Policies and Estimates". |
Pembina Pipeline Corporation Second Quarter 2019 23
8. SELECTED EQUITY ACCOUNTED INVESTEE INFORMATION
Loans and Borrowings of Equity Accounted Investees
Under equity accounting, the assets and liabilities of the investment are net into a single line item in the Consolidated Statement of Financial Position, Investments in Equity Accounted Investees. To assist readers' understanding and evaluate the capitalization of these investments, loans and borrowings associated with investments in equity accounted investees are presented below based on Pembina's proportionate ownership at June 30, 2019. In addition, certain of the equity accounted investees have borrowing arrangements with an amortization structure, thereby necessitating periodic repayments of principal. These repayments occur prior to distribution of residual cash flow to Pembina. The loans and borrowings and amortization schedules are presented below and classified by the division in which the results for the investment are reported. Please refer to 'Abbreviations' for a summary of Pembina’s investments in equity accounted investees and the division in which their results are reported.
($ millions)(unaudited)(1) | June 30, 2019 | December 31, 2018 | ||
| Pipelines Division | 1,141 | 1,250 | ||
| Facilities Division | 1,165 | 1,227 | ||
| Marketing & New Ventures Division | — | 1 | ||
| Total | 2,306 | 2,478 | ||
Amortization Schedule of Loans and Borrowings of Equity Accounted Investees
| 6 Months Ended | Remainder of | |||||||||||
($ millions)(unaudited)(1) | June 30, 2019 | 2019 | 2020 | 2021 | 2022 | 2023+ | ||||||
| Pipelines Division | 90 | 155 | 176 | 208 | 379 | 223 | ||||||
| Facilities Division | 45 | 18 | 36 | 36 | 1,075 | — | ||||||
| Marketing & New Ventures Division | 1 | — | — | — | — | — | ||||||
| Total | 136 | 173 | 212 | 244 | 1,454 | 223 | ||||||
(1) | Balances reflects Pembina's ownership percentage of the outstanding balance. |
Financing Activities for Equity Accounted Investees
On March 28, 2019, Ruby Pipeline, L.L.C., in which Pembina owns a 50 percent preferred interest, amended the maturity date of its 364-day term loan (the "Term Loan") to March 26, 2020. The Term Loan will continue to amortize at US$16 million per quarter (US$8 million per quarter net to Pembina), beginning March 2019, until a final bullet payment of US$78 million (US$39 million net to Pembina) is payable on the amended maturity date, unless otherwise extended.
Commitments to Equity Accounted Investees
Pembina has a remaining contractual commitment of US$64 million to provide equity contributions to CKPC based on budgeted amounts approved by the joint venture partners. In addition, Pembina is contractually committed to provide CKPC with funding to construct assets that will form part of CKPC's PDH/PP Facility, subject to certain conditions being met.
Pembina has a contractual commitment to advance US$55 million to Ruby by March 26, 2020.
Pembina has commitments to provide contributions to certain equity accounted investees based on annual budgets approved by the joint venture partners.
24 Pembina Pipeline Corporation Second Quarter 2019
9. OTHER
Related Party Transactions
Pembina enters into transactions with related parties in the normal course of business. These transactions primarily include advancing funds to equity accounted investees and providing management, administrative, operational and workforce related services to various affiliates. These services are provided under separate consulting services agreements with no profit or margin charged for the services delivered.
During the second quarter, Pembina advanced US$8 million to its equity accounted investment in Ruby Pipeline Holding Company L.L.C. and $22 million in funds to its equity accounted investee Fort Corp., to repay its outstanding bank facility. During the six months ended June 30, 2019, Pembina converted $58 million of advances to contributions in its equity accounted investment in CKPC and advanced US$16 million to its equity accounted investment in Ruby Pipeline Holding Company L.L.C.
For the three and six months ended June 30, 2019, Pembina had no other transactions with "related parties" (as defined in IAS 24 Related Party Disclosures) except those pertaining to contributions to Pembina's defined benefit pension plan and remuneration of key management personnel, including the Board of Directors, in the ordinary course of their employment or directorship agreements.
Disclosure Controls and Procedures ("DC&P") and Internal Controls over Financial Reporting ("ICFR")
Management's Report on Internal Control Over Financial Reporting
Pembina's management is responsible for establishing and maintaining disclosure controls and procedures and internal control over financial reporting, as those terms are defined in National Instrument 52-109 Certification of Disclosure in Issuers' Annual and Interim Filings. The objective of this instrument is to improve the quality, reliability and transparency of information that is filed or submitted under securities legislation.
The President and Chief Executive Officer ("CEO") and the Senior Vice President and Chief Financial Officer ("CFO") have designed, with the assistance of management, DC&P and ICFR to provide reasonable assurance that material information relating to Pembina's business is made known to them, is reported on a timely basis, financial reporting is reliable, and financial statements prepared for external purposes are in accordance with IFRS.
Changes in Internal Control Over Financial Reporting
There were no changes in the second quarter of 2019 that had or are likely to have a material impact on our internal controls over financial reporting.
Pembina Pipeline Corporation Second Quarter 2019 25
10. ACCOUNTING POLICIES AND ESTIMATES
Changes in Accounting Policies
New Standards Adopted in 2019
Except for the changes as described below, accounting policies as disclosed in Note 4 of the Consolidated Financial Statements have been applied to all periods consistently.
IFRS 16 Leases
The Company has adopted IFRS 16 effective January 1, 2019. IFRS 16 introduced a new lease definition that increases the focus on control of the underlying asset. In addition, IFRS 16 introduced a single, on balance sheet accounting model for lessees that has resulted in the Company recording right-of-use assets representing its right to use the underlying assets and lease liabilities representing its obligation to make lease payments. Lessor accounting has remained unchanged, except for changes in the classification of subleases.
IFRS 16 has been applied using the modified retrospective approach, under which the cumulative effect of initial application was recognized in equity at January 1, 2019 as further disclosed below. Accordingly, the comparative financial information has not been restated and continues to be reported under IAS 17 Leases and IFRIC 4 Determining whether an arrangement contains a lease. The details of the Company's accounting policies under IAS 17 and IFRIC 4, for the comparative period, were disclosed in the Consolidated Financial Statements.
On transition to IFRS 16, the Company elected to apply the practical expedient to grandfather the assessment of whether a contract entered into before the date of initial application was, or contained, a lease under IFRIC 4, rather than reassess based on the new definition of a lease under IFRS 16. Contracts previously identified as leases were recognized and measured in accordance with IFRS 16.
| a. | Accounting Policies |
The details of significant accounting policies under IFRS 16 and the nature of the changes to previous accounting policies under IAS 17 and IFRIC 4 are outlined in the condensed consolidated unaudited interim financial statements as at and for the three months ended March 31, 2019. There has not been a significant change from what has been previously disclosed.
| b. | Use of Estimates and Judgments |
The details of use of estimates and judgments impacted by IFRS 16 are outlined in the condensed consolidated unaudited interim financial statements as at and for the three months ended March 31, 2019. There has not been a significant change from what has been previously disclosed.
| c. | Transition |
| i. | Lessee |
At transition, lease liabilities for contracts previously identified as operating leases under IAS 17 were measured at the present value of the remaining lease payments, discounted at the Company's incremental borrowing rate as at January 1, 2019. For all leases, right-of-use assets were measured at an amount equal to the lease liability.
The Company applied the following practical expedients on transition:
| • | the Company applied a single discount rate to a portfolio of leases with similar characteristics rather than multiple discount rates to match the term of each lease; |
| • | the Company has relied on onerous lease contract assessments previously performed under IAS 37 Provisions, Contingent Liabilities and Contingent Assets as an alternative to an impairment review on right-of-use assets, resulting in an |
26 Pembina Pipeline Corporation Second Quarter 2019
adjustment of the right-of-use asset balance by the amount of the onerous lease contract provision outstanding immediately before the date of initial application; and
| • | the Company elected not to recognize right-of-use assets and corresponding lease liabilities for leases with terms of less than twelve months remaining. |
There has been no change to the accounting for contracts previously identified as finance leases under IAS 17. The carrying amount of the right-of-use asset and lease liability on transition were determined to be equal to the carrying amount of the lease asset and lease liability under IAS 17.
| ii. | Lessor |
Sub-lease contracts previously classified as operating leases are recognized as finance leases under IFRS 16.
| d. | Financial Statement Impacts |
On transition to IFRS 16, the Company recognized significant right-of-use assets and lease liabilities related to rail, buildings and land. Further disclosures related to leases are provided in financial statement note 6.
| i. | Consolidated Statement of Financial Position |
The impacts of adoption of IFRS 16 as at January 1, 2019 are as follows:
| As at December 31, 2018 | Adjustments | Opening value January 1, 2019 | ||||
| ($ millions) | ||||||
| Assets | ||||||
| Current assets | ||||||
Trade receivables and other(1) | 604 | 1 | 605 | |||
| Non-current assets | ||||||
Property, plant and equipment(2) | 14,730 | (18 | ) | 14,712 | ||
Right-of-use assets(3) | — | 427 | 427 | |||
Advances to related parties and other assets(1)(4) | 144 | 33 | 177 | |||
| Liabilities and Equity | ||||||
| Current liabilities | ||||||
Trade payables and other(4) | 870 | (7 | ) | 863 | ||
Loans and borrowings(5) | 480 | (8 | ) | 472 | ||
| Lease liabilities | — | 64 | 64 | |||
| Non-current liabilities | ||||||
Loans and borrowings(5) | 7,057 | (11 | ) | 7,046 | ||
| Lease liabilities | — | 416 | 416 | |||
| Deferred tax liabilities | 2,774 | 8 | 2,782 | |||
Other liabilities(4) | 239 | (41 | ) | 198 | ||
| Equity | ||||||
| Attributable to shareholders | 14,344 | 22 | 14,366 | |||
(1) | Includes lessor finance lease receivables. |
(2) | Finance lease assets previously recorded in property, plant and equipment were reclassified to right-of-use assets. |
(3) | Right-of-use assets are recorded at a value equal to the associated lease liability of $480 million, less $33 million for sublease arrangements, less onerous lease liability balance at December 31, 2018 of $20 million. |
(4) | Operating lease payments were previously recognized on a straight-line basis, with the difference between cash payments and expense (income) recorded to a deferred lease asset or deferred lease liability. These deferrals were derecognized on adoption of IFRS 16. In addition, $20 million of onerous lease liabilities were offset against right-of-use assets. |
(5) | Finance leases previously recorded in loans and borrowings were reclassified to lease liabilities. |
Pembina Pipeline Corporation Second Quarter 2019 27
| ii. | Reconciliation of Lease Liability |
| ($ millions) | ||
| Lease commitments, disclosed at December 31, 2018 | 796 | |
| Leases not yet commenced | (33 | ) |
| Non-lease components | (217 | ) |
| Renewal options reasonably certain to be exercised | 53 | |
| Total undiscounted lease payments | 599 | |
Discounting impact(1) | (119 | ) |
| Lease liabilities recognized as at January 1, 2019 | 480 | |
(1) | The Company discounted lease payments using the incremental credit-risk adjusted borrowing rate applicable to the contract. The weighted-average rate applied on transition for all lease liabilities was 4.01 percent. |
| iii. | Financial Impact on Three and Six Months Ended June 30, 2019 |
The nature of expenses related to identified lessee arrangements changed as IFRS 16 replaced straight-line operating lease expense with depreciation of right of use assets and interest expense relating to lease liabilities. For the second quarter the change resulted in an increase in earnings of $4 million and a $18 million increase to adjusted EBITDA. For the six months ended June 30, 2019 there was an increase in earnings of $5 million and a $33 million increases to adjusted EBITDA. In addition, cash flow from operating activities and adjusted cash flow from operating activities each increased $12 million and $27 million for the three and six months ended June 30, 2019 and cash flow from financing activities decreased by the same amount, as lease obligation repayments are now reported as financing activities on the Condensed Consolidated Interim Statement of Cash Flows. There was no net impact on cash flows.
New Standards and Interpretations Not Yet Adopted
Conceptual Framework
In March 2018, the International Accounting Standards Board issued a revised Conceptual Framework for Financial Reporting, effective for annual periods beginning on or after January 1, 2020, with early application permitted. The Conceptual Framework sets out the fundamental concepts of financial reporting and is applied to develop accounting policies when no IFRS Standard applies to a particular transaction. The revised Conceptual Framework includes: new concepts on measurement, presentation and disclosure, and derecognition; updated definitions of an asset and a liability and related recognition criteria; and clarifications in important areas, such as the roles of stewardship, prudence and measurement uncertainty in financial reporting. The Company intends to adopt the revised Conceptual Framework for Financial Reporting on its effective date. The Company is currently evaluating the impact that the revised conceptual framework will have on its earnings and financial position.
Critical Accounting Judgments and Estimates
Critical accounting judgments and estimates used in preparing the Interim Financial Statements are described in Pembina's Consolidated Financial Statements and MD&A for the year ending December 31, 2018. The preparation of consolidated financial statements in conformity with IFRS requires management to make both judgments and estimates that could materially affect the amounts recognized in the financial statements. By their nature, judgments and estimates may change in light of new facts and circumstances in the internal and external environment. Other than accounting estimates and judgments made in connection with the adoption of IFRS 16, there have been no material changes to Pembina's critical accounting estimates and judgments during the three and six months ended June 30, 2019.
11. NON-GAAP MEASURES
Throughout this MD&A, Pembina has used the following terms that are not defined by GAAP but are used by management to evaluate the performance of Pembina and its businesses. Since non-GAAP measures do not have a standardized meaning prescribed by IFRS and are therefore unlikely to be comparable to similar measures presented by other companies, securities
28 Pembina Pipeline Corporation Second Quarter 2019
regulations require that non-GAAP measures are clearly defined, qualified and reconciled to their nearest GAAP measure. These non-GAAP measures are calculated and disclosed on a consistent basis from period to period.
The intent of non-GAAP measures is to provide additional useful information with respect to Pembina's operational and financial performance to investors and analysts though the measures do not have any standardized meaning under IFRS. The measures should not, therefore, be considered in isolation or used in substitute for measures of performance prepared in accordance with IFRS. Other issuers may calculate these non-GAAP measures differently.
Investors should be cautioned that net revenue, adjusted EBITDA, adjusted EBITDA per common share, adjusted cash flow from operating activities, cash flow from operating activities per common share, and adjusted cash flow from operating activities per common share should not be construed as alternatives to revenue, earnings, cash flow from operating activities, gross profit or other measures of financial results determined in accordance with GAAP as indicators of Pembina's performance.
Non-GAAP Proportionate Consolidation of Investments in Equity Accounted Investees Results
In accordance with IFRS, Pembina's jointly controlled investments are accounted for using equity accounting. Under equity accounting, the assets and liabilities of the investment are presented net in a single line item in the Consolidated Statement of Financial Position, Investments in Equity Accounted Investees. Net earnings from investments in equity accounted investees are recognized in a single line item in the Consolidated Statement of Earnings and Comprehensive Income, Share of Profit from Equity Accounted Investees. Cash contributions and distributions from investments in equity accounted investees represent Pembina’s share paid and received in the period to and from the investments in equity accounted investees.
To assist in understanding and evaluating the performance of these investments, Pembina is supplementing the IFRS disclosure with non-GAAP proportionate consolidation of Pembina’s interest in the investments in equity accounted investees. Pembina's proportionate interest in equity accounted investees has been included in adjusted EBITDA.
Net Revenue
Net revenue is a non-GAAP financial measure which is defined as total revenue less cost of goods sold including product purchases. Management believes that net revenue provides investors with a single measure to indicate the margin on sales before non-product operating expenses that is comparable between periods. Management utilizes net revenue to compare consecutive results, in the Marketing & New Ventures Division and Facilities Division, to aggregate revenue generated by each of the Company's Divisions and to set comparable objectives.
| 3 Months Ended June 30 | Pipelines Division | Facilities Division | Marketing & New Ventures Division | Corporate & Inter-Division Eliminations | Total | |||||||||||||||
(unaudited)($ millions) | ||||||||||||||||||||
| 2019 | 2018 | 2019 | 2018 | 2019 | 2018 | 2019 | 2018 | 2019 | 2018 | |||||||||||
| Revenue | 443 | 404 | 275 | 250 | 1,210 | 1,208 | (120 | ) | (119 | ) | 1,808 | 1,743 | ||||||||
Cost of goods sold, including product purchases | — | — | 1 | 1 | 1,129 | 1,120 | (80 | ) | (47 | ) | 1,050 | 1,074 | ||||||||
| Net revenue | 443 | 404 | 274 | 249 | 81 | 88 | (40 | ) | (72 | ) | 758 | 669 | ||||||||
| 6 Months Ended June 30 | Pipelines Division | Facilities Division | Marketing & New Ventures Division | Corporate & Inter-Division Eliminations | Total | |||||||||||||||
| (unaudited)($ millions) | ||||||||||||||||||||
| 2019 | 2018 | 2019 | 2018 | 2019 | 2018 | 2019 | 2018 | 2019 | 2018 | |||||||||||
| Revenue | 859 | 757 | 546 | 501 | 2,606 | 2,540 | (235 | ) | (218 | ) | 3,776 | 3,580 | ||||||||
Cost of goods sold, including product purchases | — | — | 2 | 4 | 2,394 | 2,332 | (152 | ) | (144 | ) | 2,244 | 2,192 | ||||||||
| Net revenue | 859 | 757 | 544 | 497 | 212 | 208 | (83 | ) | (74 | ) | 1,532 | 1,388 | ||||||||
Adjusted Earnings Before Interest, Taxes, Depreciation and Amortization ("adjusted EBITDA")
Adjusted EBITDA is a non-GAAP measure and is calculated as earnings for the year before net finance costs, income taxes, depreciation and amortization (included in operations and general and administrative expense) and unrealized gains or losses
Pembina Pipeline Corporation Second Quarter 2019 29
on commodity-related derivative financial instruments. The exclusion of unrealized gains or losses on commodity-related derivative financial instruments eliminates the non-cash impact of such gains or losses.
Adjusted EBITDA also includes adjustments to earnings for losses (gains) on disposal of assets, transaction costs incurred in respect of acquisitions, impairment charges or reversals and write-downs in respect of goodwill, intangible assets and property, plant and equipment, certain non-cash provisions and other amounts not reflective of ongoing operations. The adjustments made to earnings are also made to share of profit from investments in equity accounted investees. In addition, Pembina's proportionate share of results from investments in equity accounted investees with a preferred interest is presented in adjusted EBITDA as a 50 percent common interest. These additional adjustments are made to exclude various non-cash and other items that are not reflective of ongoing operations. Management believes that adjusted EBITDA provides useful information to investors as it is an important indicator of an issuer's ability to generate liquidity through cash flow from operating activities and equity accounted investees. Adjusted EBITDA is also used by investors and analysts for assessing financial performance and for the purpose of valuing an issuer, including calculating financial and leverage ratios. Management utilizes adjusted EBITDA to set objectives and as a key performance indicator of the Company's success. Pembina presents adjusted EBITDA as management believes it is a measure frequently used by analysts, investors and other stakeholders in evaluating the Company’s financial performance.
| 3 Months Ended June 30 | Pipelines Division | Facilities Division | Marketing & New Ventures Division | Corporate & Inter-Division Eliminations | Total | |||||||||||||||
| (unaudited) | ||||||||||||||||||||
| ($ millions, except per share amounts) | 2019 | 2018 | 2019 | 2018 | 2019 | 2018 | 2019 | 2018 | 2019 | 2018 | ||||||||||
| Earnings before income tax | 349 | 313 | 162 | 121 | 88 | 31 | (125 | ) | (130 | ) | 474 | 335 | ||||||||
| Adjustments to share of profit from equity accounted investees and other | 62 | 65 | 36 | 47 | 5 | 4 | — | — | 103 | 116 | ||||||||||
| Net finance costs | 3 | 2 | 1 | 6 | 4 | 10 | 70 | 78 | 78 | 96 | ||||||||||
| Depreciation and amortization | 58 | 55 | 37 | 38 | 15 | 6 | 11 | 4 | 121 | 103 | ||||||||||
| Unrealized (gain) loss on commodity-related derivative financial instruments | — | — | — | — | (15 | ) | 46 | — | — | (15 | ) | 46 | ||||||||
| Transaction costs incurred in respect of acquisitions | — | — | — | — | — | — | — | 3 | — | 3 | ||||||||||
| Impairment charges (reversals) and write-downs in respect of goodwill, intangible assets and property, plant and equipment, and non-cash provisions | — | — | — | — | — | — | 4 | 1 | 4 | 1 | ||||||||||
| Adjusted EBITDA | 472 | 435 | 236 | 212 | 97 | 97 | (40 | ) | (44 | ) | 765 | 700 | ||||||||
Adjusted EBITDA per common share – basic (dollars) | 1.50 | 1.39 | ||||||||||||||||||
| 6 Months Ended June 30 | Pipelines Division | Facilities Division | Marketing & New Ventures Division | Corporate & Inter-Division Eliminations | Total | |||||||||||||||
| (unaudited) | ||||||||||||||||||||
| ($ millions, except per share amounts) | 2019 | 2018 | 2019 | 2018 | 2019 | 2018 | 2019 | 2018 | 2019 | 2018 | ||||||||||
| Earnings before income tax | 676 | 600 | 313 | 254 | 170 | 157 | (253 | ) | (231 | ) | 906 | 780 | ||||||||
| Adjustments to share of profit from equity accounted investees and other | 133 | 129 | 76 | 91 | 18 | 11 | — | — | 227 | 231 | ||||||||||
| Net finance costs | 5 | 4 | 3 | 11 | 1 | 7 | 148 | 133 | 157 | 155 | ||||||||||
| Depreciation and amortization | 115 | 104 | 76 | 73 | 32 | 11 | 23 | 12 | 246 | 200 | ||||||||||
| Unrealized loss on commodity-related derivative financial instruments | — | — | — | — | 30 | 16 | — | — | 30 | 16 | ||||||||||
| Contract dispute settlement | — | — | — | — | (33 | ) | — | — | — | (33 | ) | — | ||||||||
| Loss on disposal of assets | — | — | — | — | — | — | 1 | — | 1 | — | ||||||||||
| Transaction costs incurred in respect of acquisitions | — | — | — | — | — | — | — | 5 | — | 5 | ||||||||||
| Impairment charges (reversals) and write-downs in respect of goodwill, intangible assets and property, plant and equipment, and non-cash provisions | — | — | — | — | — | — | 4 | 1 | 4 | 1 | ||||||||||
| Adjusted EBITDA | 929 | 837 | 468 | 429 | 218 | 202 | (77 | ) | (80 | ) | 1,538 | 1,388 | ||||||||
Adjusted EBITDA per common share – basic (dollars) | 3.02 | 2.76 | ||||||||||||||||||
30 Pembina Pipeline Corporation Second Quarter 2019
Adjusted Cash Flow from Operating Activities, Cash Flow from Operating Activities per Common Share and Adjusted Cash Flow from Operating Activities per Common Share
Adjusted cash flow from operating activities is a non-GAAP measure which is defined as cash flow from operating activities adjusting for the change in non-cash operating working capital, adjusting for current tax and share-based payment expenses, and deducting preferred share dividends paid. Adjusted cash flow from operating activities deducts preferred share dividends paid because they are not attributable to common shareholders. The calculation has been modified to include current tax and share-based payment expense as it allows management to better assess the obligations discussed below. Management believes that adjusted cash flow from operating activities provides comparable information to investors for assessing financial performance during each reporting period. Management utilizes adjusted cash flow from operating activities to set objectives and as a key performance indicator of the Company's ability to meet interest obligations, dividend payments and other commitments. Per common share amounts are calculated by dividing cash flow from operating activities, or adjusted cash flow from operating activities, as applicable, by the weighted average number of common shares outstanding.
| 3 Months Ended June 30 | 6 Months Ended June 30 | |||||||
| ($ millions, except per share amounts)(unaudited) | 2019 | 2018 | 2019 | 2018 | ||||
| Cash flow from operating activities | 661 | 603 | 1,269 | 1,101 | ||||
Cash flow from operating activities per common share – basic (dollars) | 1.29 | 1.20 | 2.49 | 2.19 | ||||
| Add (deduct): | ||||||||
| Change in non-cash operating working capital | (40 | ) | 3 | (71 | ) | 43 | ||
| Current tax expense | (56 | ) | (9 | ) | (132 | ) | (31 | ) |
| Taxes paid, net of foreign exchange | 28 | 14 | 100 | 34 | ||||
| Accrued share-based payments | (12 | ) | (22 | ) | (33 | ) | (30 | ) |
| Share-based payments | — | — | 50 | 32 | ||||
| Preferred share dividends paid | (31 | ) | (31 | ) | (55 | ) | (61 | ) |
| Adjusted cash flow from operating activities | 550 | 558 | 1,128 | 1,088 | ||||
Adjusted cash flow from operating activities per common share – basic (dollars) | 1.08 | 1.11 | 2.21 | 2.16 | ||||
Pembina Pipeline Corporation Second Quarter 2019 31
12. ABBREVIATIONS
The following is a list of abbreviations that may be used in this MD&A:
| Measurement | Other | ||
| mbbls | thousands of barrels | B.C. | British Columbia |
| mbpd | thousands of barrels per day | GAAP | Canadian generally accepted accounting principles |
| mmbpd | millions of barrels per day | IFRS | International Financial Reporting Standards |
| mmbbls | millions of barrels | LNG | Liquified natural gas |
| mboe/d | thousands of barrels of oil equivalent per day | LPG | Liquified petroleum gas |
| mmboe/d | millions of barrels of oil equivalent per day | NGL | Natural gas liquids |
| MMcf/d | millions of cubic feet per day | U.S. | United States |
| bcf/d | billions of cubic feet per day | WCSB | Western Canadian Sedimentary Basin |
| km | kilometer | Deep cut | Ethane-plus capacity extraction gas processing capabilities |
| Shallow cut | Sweet gas processing with propane and/or condensate-plus extraction capabilities | ||
| Acquisition | Pembina's acquisition of Veresen Inc. and associated businesses on October 2, 2017 | ||
| Volumes | For the Pipelines and Facilities Divisions volumes are revenue volumes, defined as physical volumes plus volumes recognized from take-or-pay commitments. For the Marketing & New Ventures Division volumes are marketed NGL volumes. Volumes are stated in mboe/d, with natural gas volumes converted to mboe/d from MMcf/d at a 6:1 ratio. | ||
| Investments in Equity Accounted Investees | |
| Pipelines Division: | |
| Alliance | 50 percent interest in the Alliance Pipeline |
| Ruby | 50 percent convertible preferred interest in the Ruby Pipeline which entitles Pembina to a US$91 million distribution per year |
| Facilities Division: | |
| Veresen Midstream | 45 percent interest in Veresen Midstream, which owns assets in western Canada serving the Montney geological play in northwestern Alberta and northeastern B.C. including gas processing plants and gas gathering pipelines and compression |
| Fort Corp | 50 percent interest in Fort Saskatchewan Ethylene Storage Limited Partnership and Fort Saskatchewan Ethylene Corporation |
| Marketing & New Ventures Division: | |
| Aux Sable | An ownership interest in Aux Sable (approximately 42.7 percent in Aux Sable U.S. and 50 percent in Aux Sable Canada), which includes an NGL fractionation facility and gas processing capacity near Chicago, Illinois and other natural gas and NGL processing facilities, logistics and distribution assets in the U.S. and Canada, as well as transportation contracts on Alliance |
| CKPC | 50 percent interest in the propane dehydrogenation ("PDH") plant and polypropylene ("PP") upgrading facility ("PDH/PP Facility") |
Readers are referred to the AIF dated February 21, 2019 on www.sedar.com for additional descriptions.
32 Pembina Pipeline Corporation Second Quarter 2019
13. FORWARD-LOOKING STATEMENTS & INFORMATION
In the interest of providing Pembina's security holders and potential investors with information regarding Pembina, including management's assessment of the Company's future plans and operations, certain statements contained in this MD&A constitute forward-looking statements or information (collectively, "forward-looking statements"). Forward-looking statements are typically identified by words such as "anticipate", "continue", "estimate", "expect", "may", "will", "project", "should", "could", "would", "believe", "plan", "intend", "design", "target", "undertake", "view", "indicate", "maintain", "explore", "entail", "schedule", "objective", "strategy", "likely", "potential", "outlook", "aim", "purpose", "goal" and similar expressions suggesting future events or future performance.
By their nature, such forward-looking statements involve known and unknown risks, uncertainties and other factors that may cause actual results or events to differ materially from those anticipated in such forward-looking statements. Pembina believes the expectations reflected in those forward-looking statements are reasonable but no assurance can be given that these expectations will prove to be correct and such forward-looking statements included in this MD&A should not be unduly relied upon. These statements speak only as of the date of the MD&A.
In particular, this MD&A contains forward-looking statements pertaining to the following:
| • | the future levels and sustainability of cash dividends that Pembina intends to pay to its shareholders, the dividend payment date and the tax treatment thereof; |
| • | planning, construction, locations, capital expenditure estimates, schedules, regulatory and environmental applications and anticipated approvals, expected capacity, incremental volumes, in-service dates, rights, sources of product, activities, benefits and operations with respect to new construction of, or expansions on existing, pipelines, gas services facilities, fractionation facilities, terminalling, storage and hub facilities and other facilities or energy infrastructure, as well as the impact of the Company's new projects on its future financial performance; |
| • | anticipated synergies between assets under development, assets being acquired and existing assets of the Company; |
| • | pipeline, processing, fractionation and storage facility and system operations and throughput levels; |
| • | treatment under governmental regulatory regimes in Canada and the U.S. including taxes and tax regimes, environmental and greenhouse gas regulations and related abandonment and reclamation obligations, and Aboriginal, landowner and other stakeholder consultation requirements; |
| • | Pembina's estimates of and strategy for payment of future abandonment costs and decommissioning obligations, and deferred tax liability; |
| • | Pembina's strategy and the development and expected timing of new business initiatives and growth opportunities and the impact thereof; |
| • | increased throughput potential, processing capacity and fractionation capacity due to increased oil and gas industry activity and new connections and other initiatives on Pembina's pipelines and at Pembina's facilities; |
| • | expected future cash flows and the sufficiency thereof, financial strength, sources of and access to funds at attractive rates, future contractual obligations, future financing options, future renewal of credit facilities, availability of capital to fund growth plans, operating obligations and dividends and the use of proceeds from financings; |
| • | Pembina's expectations regarding involvement of partners on the Jordan Cove project; |
| • | current ratings targets on Pembina's debt and the likelihood of a downgrade below investment-grade ratings; |
| • | tolls and tariffs and processing, transportation, fractionation, storage and services commitments and contracts; |
| • | operating risks (including the amount of future liabilities related to pipelines spills and other environmental incidents) and related insurance coverage and inspection and integrity programs; |
| • | the adoption and impact of new accounting standards; |
| • | inventory and pricing in North American liquids market; |
| • | the impact of the current commodity price environment on Pembina; and |
| • | competitive conditions and Pembina's ability to position itself competitively in the industry. |
Various factors or assumptions are typically applied by Pembina in drawing conclusions or making the forecasts, projections, predictions or estimations set out in forward-looking statements based on information currently available to Pembina. These factors and assumptions include, but are not limited to:
| • | oil and gas industry exploration and development activity levels and the geographic region of such activity; |
| • | the success of Pembina's operations; |
| • | prevailing commodity prices, interest rates and exchange rates and the ability of Pembina to maintain current credit ratings; |
| • | the availability of capital to fund future capital requirements relating to existing assets and projects; |
| • | expectations regarding the Company's pension plan; |
| • | future operating costs including geotechnical and integrity costs being consistent with historical costs; |
| • | oil and gas industry compensation levels remaining consistent; |
| • | in respect of current developments, expansions, planned capital expenditures, completion dates and capacity expectations: that third parties will provide any necessary support; that any third-party projects relating to growth projects will be sanctioned and completed as expected; that any required commercial agreements can be reached; that all required regulatory and environmental approvals can be obtained on the necessary terms in a timely manner; that counterparties will comply with contracts in a timely manner; that there are no unforeseen events preventing the performance of contracts or the completion of the relevant facilities, and that there are no unforeseen material costs relating to the facilities which are not recoverable from customers; |
| • | in respect of the stability of Pembina's dividends: prevailing commodity prices, margins and exchange rates; that Pembina's future results of operations will be consistent with past performance and management expectations in relation thereto; the continued availability of capital at attractive prices to fund future capital requirements relating to existing assets and projects, including but not limited to future capital expenditures relating to expansion, upgrades and maintenance shutdowns; the success of growth projects; future operating costs; that counterparties to material agreements will continue to perform in a timely manner; that there are no unforeseen events preventing the performance of contracts; and that there are no unforeseen material construction or other costs related to current growth projects or current operations; |
| • | prevailing regulatory, tax and environmental laws and regulations and tax pool utilization; and |
| • | the amount of future liabilities relating to lawsuits and environmental incidents and the availability of coverage under Pembina's insurance policies (including in respect of Pembina's business interruption insurance policy). |
The actual results of Pembina could differ materially from those anticipated in these forward-looking statements as a result of the material risk factors set forth below:
| • | the regulatory environment and decisions and Aboriginal and landowner consultation requirements; |
| • | the impact of competitive entities and pricing; |
| • | labour and material shortages; |
| • | the failure to realize the anticipated benefits of the Acquisition following closing due to the factors set out herein, integration issues or otherwise; |
| • | reliance on key relationships, joint venture partners, and agreements and the outcome of stakeholder engagement; |
| • | the strength and operations of the oil and natural gas production industry and related commodity prices; |
| • | non-performance or default by counterparties to agreements which Pembina or one or more of its subsidiaries has entered into in respect of its business; |
| • | actions by joint venture partners or other partners which hold interests in certain of Pembina's assets; |
| • | actions by governmental or regulatory authorities including changes in tax laws and treatment, changes in royalty rates, climate change initiatives or policies or increased environmental regulation; |
| • | fluctuations in operating results; |
| • | adverse general economic and market conditions in Canada, North America and elsewhere, including changes, or prolonged weakness, as applicable, in interest rates, foreign currency exchange rates, commodity prices, supply/demand trends and overall industry activity levels; |
| • | constraints on, or the unavailability of adequate infrastructure; |
| • | changes in the political environment, in North America and elsewhere, and public opinion; |
| • | ability to access various sources of debt and equity capital; |
| • | changes in credit ratings; |
| • | technology and security risks; |
| • | natural catastrophe; and |
| • | the other factors discussed under "Risk Factors" in Pembina's MD&A and AIF for the year ended December 31, 2018, which are available at www.pembina.com and in Canada under Pembina's company profile on www.sedar.com and in the U.S. on the Company's profile at www.sec.gov. |
These factors should not be construed as exhaustive. Unless required by law, Pembina does not undertake any obligation to publicly update or revise any forward-looking statements, whether as a result of new information, future events or otherwise. Any forward-looking statements contained herein are expressly qualified by this cautionary statement.
Pembina Pipeline Corporation Second Quarter 2019 33
CONDENSED CONSOLIDATED INTERIM STATEMENTS OF FINANCIAL POSITION
(unaudited)
| ($ millions) | June 30, 2019 | December 31, 2018(1) | ||
Assets Current assets | ||||
| Cash and cash equivalents | 328 | 157 | ||
| Trade receivables and other | 534 | 604 | ||
| Inventory | 96 | 198 | ||
| Derivative financial instruments (Note 13) | 20 | 54 | ||
| 978 | 1,013 | |||
| Non-current assets | ||||
| Property, plant and equipment (Note 4) | 15,421 | 14,730 | ||
| Investments in equity accounted investees (Note 5) | 6,222 | 6,368 | ||
| Intangible assets and goodwill | 4,383 | 4,409 | ||
| Right-of-use assets (Note 6) | 409 | — | ||
| Advances to related parties and other assets | 157 | 144 | ||
| 26,592 | 25,651 | |||
| Total assets | 27,570 | 26,664 | ||
Liabilities and equity Current liabilities | ||||
| Trade payables and other | 865 | 870 | ||
| Loans and borrowings (Note 7) | 340 | 480 | ||
| Dividends payable | 109 | 97 | ||
| Lease liabilities | 65 | — | ||
| Contract liabilities (Note 10) | 43 | 37 | ||
| Derivative financial instruments (Note 13) | 6 | 6 | ||
| 1,428 | 1,490 | |||
| Non-current liabilities | ||||
| Loans and borrowings (Note 7) | 7,468 | 7,057 | ||
| Lease liabilities | 388 | — | ||
| Decommissioning provision (Note 8) | 689 | 569 | ||
| Contract liabilities (Note 10) | 119 | 131 | ||
| Deferred tax liabilities | 2,586 | 2,774 | ||
| Other liabilities | 183 | 239 | ||
| 11,433 | 10,770 | |||
| Total liabilities | 12,861 | 12,260 | ||
| Equity | ||||
| Attributable to shareholders | 14,649 | 14,344 | ||
| Attributable to non-controlling interest | 60 | 60 | ||
| Total equity | 14,709 | 14,404 | ||
| Total liabilities and equity | 27,570 | 26,664 | ||
| See accompanying notes to the condensed consolidated Interim Financial Statements | ||||
(1) | Pembina has applied IFRS 16 Leases at January 1, 2019 using the modified retrospective approach and has not restated comparative information. See Note 2. |
34 Pembina Pipeline Corporation Second Quarter 2019
CONDENSED CONSOLIDATED INTERIM STATEMENTS OF EARNINGS AND COMPREHENSIVE INCOME
(unaudited)
| 3 Months Ended June 30 | 6 Months Ended June 30 | |||||||
| ($ millions, except per share amounts) | 2019 | 2018(1)(2) | 2019 | 2018(1)(2) | ||||
| Revenue (Note 10) | 1,808 | 1,743 | 3,776 | 3,580 | ||||
| Cost of sales | 1,292 | 1,273 | 2,742 | 2,630 | ||||
| Loss (gain) on commodity-related derivative financial instruments | (16 | ) | 55 | 10 | 43 | |||
| Share of profit from equity accounted investees (Note 5) | 97 | 96 | 193 | 172 | ||||
| Gross profit | 629 | 511 | 1,217 | 1,079 | ||||
| General and administrative | 76 | 80 | 150 | 141 | ||||
| Other expense | 1 | — | 4 | 3 | ||||
| Results from operating activities | 552 | 431 | 1,063 | 935 | ||||
| Net finance costs (Note 11) | 78 | 96 | 157 | 155 | ||||
| Earnings before income tax | 474 | 335 | 906 | 780 | ||||
| Current tax expense | 56 | 9 | 132 | 31 | ||||
| Deferred tax (recovery) expense | (246 | ) | 80 | (203 | ) | 173 | ||
| Income tax (recovery) expense | (190 | ) | 89 | (71 | ) | 204 | ||
| Earnings attributable to shareholders | 664 | 246 | 977 | 576 | ||||
| Other comprehensive (loss) income | ||||||||
| Exchange (loss) gain on translation of foreign operations | (76 | ) | 80 | (161 | ) | 190 | ||
| Total comprehensive income attributable to shareholders | 588 | 326 | 816 | 766 | ||||
| Earnings attributable to common shareholders, net of preferred share dividends | 632 | 216 | 914 | 516 | ||||
Earnings per common share – basic (dollars) | 1.23 | 0.43 | 1.79 | 1.02 | ||||
Earnings per common share – diluted (dollars) | 1.23 | 0.42 | 1.78 | 1.02 | ||||
Weighted average number of common shares (millions) | ||||||||
| Basic | 511 | 504 | 510 | 504 | ||||
| Diluted | 513 | 508 | 512 | 508 | ||||
| See accompanying notes to the condensed consolidated Interim Financial Statements | ||||||||
(1) | Pembina has applied IFRS 16 Leases at January 1, 2019 using the modified retrospective approach and has not restated comparative information. See Note 2. |
(2) | Pembina corrected revenue and costs of goods sold in 2018. The adjustments reduce revenue and cost of goods sold for the three and six months ending June 30, 2018 ($202 million). There was no impact to earnings as a result of the adjustment. |
Pembina Pipeline Corporation Second Quarter 2019 35
CONDENSED CONSOLIDATED INTERIM STATEMENTS OF CHANGES IN EQUITY
(unaudited)
| Attributable to Shareholders of the Company | ||||||||||||||
| ($ millions) | Common share capital | Preferred share capital | Deficit | Accumulated other comprehensive (loss) income | Total | Non-controlling interest | Total Equity | |||||||
December 31, 2018(1) | 13,662 | 2,423 | (2,058 | ) | 317 | 14,344 | 60 | 14,404 | ||||||
| Impact of change in accounting policy (Note 2) | — | — | 22 | — | 22 | — | 22 | |||||||
| Opening value January 1, 2019 | 13,662 | 2,423 | (2,036 | ) | 317 | 14,366 | 60 | 14,426 | ||||||
| Total comprehensive income | ||||||||||||||
| Earnings | — | — | 977 | — | 977 | — | 977 | |||||||
| Other comprehensive income | ||||||||||||||
| Exchange loss on translation of foreign operations | — | — | — | (161 | ) | (161 | ) | — | (161 | ) | ||||
| Total comprehensive income | — | — | 977 | (161 | ) | 816 | — | 816 | ||||||
| Transactions with shareholders of the Company | ||||||||||||||
| Preferred shares issue costs (Note 9) | — | (2 | ) | — | — | (2 | ) | — | (2 | ) | ||||
| Share-based payment transactions (Note 9) | 122 | — | — | — | 122 | — | 122 | |||||||
| Dividends declared – common (Note 9) | — | — | (592 | ) | — | (592 | ) | — | (592 | ) | ||||
| Dividends declared – preferred (Note 9) | — | — | (61 | ) | — | (61 | ) | — | (61 | ) | ||||
| Total transactions with shareholders of the Company | 122 | (2 | ) | (653 | ) | — | (533 | ) | — | (533 | ) | |||
| June 30, 2019 | 13,784 | 2,421 | (1,712 | ) | 156 | 14,649 | 60 | 14,709 | ||||||
| December 31, 2017 | 13,447 | 2,424 | (2,083 | ) | (7 | ) | 13,781 | 60 | 13,841 | |||||
| Total comprehensive income | ||||||||||||||
| Earnings | — | — | 576 | — | 576 | — | 576 | |||||||
| Other comprehensive income | ||||||||||||||
| Exchange gain on translation of foreign operations | — | — | — | 190 | 190 | — | 190 | |||||||
| Total comprehensive income | — | — | 576 | 190 | 766 | — | 766 | |||||||
| Transactions with shareholders of the Company | ||||||||||||||
| Debenture conversions | 6 | — | — | — | 6 | — | 6 | |||||||
| Share-based payment transactions | 43 | — | — | — | 43 | — | 43 | |||||||
| Dividends declared – common | — | — | (554 | ) | — | (554 | ) | — | (554 | ) | ||||
| Dividends declared – preferred | — | — | (61 | ) | — | (61 | ) | — | (61 | ) | ||||
| Total transactions with shareholders of the Company | 49 | — | (615 | ) | — | (566 | ) | — | (566 | ) | ||||
| June 30, 2018 | 13,496 | 2,424 | (2,122 | ) | 183 | 13,981 | 60 | 14,041 | ||||||
| See accompanying notes to the condensed consolidated Interim Financial Statements | ||||||||||||||
(1) | Pembina has applied IFRS 16 Leases at January 1, 2019 using the modified retrospective approach and has not restated comparative information. See Note 2. |
36 Pembina Pipeline Corporation Second Quarter 2019
CONDENSED CONSOLIDATED INTERIM STATEMENTS OF CASH FLOWS
(unaudited)
| 3 Months Ended June 30 | 6 Months Ended June 30 | |||||||
| ($ millions) | 2019 | 2018(1) | 2019 | 2018(1) | ||||
| Cash provided by (used in) | ||||||||
| Operating activities | ||||||||
| Earnings | 664 | 246 | 977 | 576 | ||||
| Adjustments for: | ||||||||
| Share of profit from equity accounted investees | (97 | ) | (96 | ) | (193 | ) | (172 | ) |
| Distributions from equity accounted investees | 140 | 168 | 310 | 294 | ||||
| Depreciation and amortization | 121 | 103 | 246 | 200 | ||||
| Unrealized (gain) loss on commodity-related derivative financial instruments | (15 | ) | 46 | 30 | 16 | |||
| Net finance costs (Note 11) | 78 | 96 | 157 | 155 | ||||
| Net interest paid | (53 | ) | (59 | ) | (134 | ) | (124 | ) |
| Income tax expense | (190 | ) | 89 | (71 | ) | 204 | ||
| Taxes paid | (28 | ) | (16 | ) | (99 | ) | (36 | ) |
| Share-based compensation expense | 14 | 26 | 40 | 37 | ||||
| Share-based compensation payment | — | — | (50 | ) | (32 | ) | ||
| Net change in contract liabilities | (9 | ) | 1 | (6 | ) | 20 | ||
| Other | (4 | ) | 2 | (9 | ) | 6 | ||
| Change in non-cash operating working capital | 40 | (3 | ) | 71 | (43 | ) | ||
| Cash flow from operating activities | 661 | 603 | 1,269 | 1,101 | ||||
| Financing activities | ||||||||
| Bank borrowings and issuance of debt | — | 38 | 94 | 38 | ||||
| Repayment of loans and borrowings | (546 | ) | (334 | ) | (599 | ) | (816 | ) |
| Repayment of lease liability | (14 | ) | (2 | ) | (32 | ) | (4 | ) |
| Issuance of medium term notes (Note 7) | 800 | — | 800 | 700 | ||||
| Issue costs and financing fees | (6 | ) | — | (6 | ) | (7 | ) | |
| Exercise of stock options | 29 | 29 | 115 | 36 | ||||
| Dividends paid | (327 | ) | (307 | ) | (641 | ) | (609 | ) |
| Cash flow used in financing activities | (64 | ) | (576 | ) | (269 | ) | (662 | ) |
| Investing activities | ||||||||
| Capital expenditures | (434 | ) | (255 | ) | (795 | ) | (579 | ) |
| Contributions to equity accounted investees | (28 | ) | — | (61 | ) | (58 | ) | |
| Interest paid during construction | (9 | ) | (7 | ) | (17 | ) | (15 | ) |
| Recovery of assets or proceeds from sale | 6 | — | 6 | — | ||||
| Advances to related parties | (32 | ) | (20 | ) | (42 | ) | (40 | ) |
| Changes in non-cash investing working capital and other | 50 | (23 | ) | 77 | 13 | |||
| Cash flow used in investing activities | (447 | ) | (305 | ) | (832 | ) | (679 | ) |
| Change in cash and cash equivalents | 150 | (278 | ) | 168 | (240 | ) | ||
| Effect of movement in exchange rates on cash held | 6 | — | 3 | — | ||||
| Cash and cash equivalents, beginning of period | 172 | 359 | 157 | 321 | ||||
| Cash and cash equivalents, end of period | 328 | 81 | 328 | 81 | ||||
| See accompanying notes to the condensed consolidated Interim Financial Statements | ||||||||
(1) | Pembina has applied IFRS 16 Leases at January 1, 2019 using the modified retrospective approach and has not restated comparative information. See Note 2. |
Pembina Pipeline Corporation Second Quarter 2019 37
NOTES TO THE CONDENSED CONSOLIDATED UNAUDITED INTERIM FINANCIAL STATEMENTS
1. REPORTING ENTITY
Pembina Pipeline Corporation ("Pembina" or the "Company") is a Calgary-based, leading transportation and midstream service provider serving North America's energy industry. The condensed consolidated unaudited interim financial statements ("Interim Financial Statements") include the accounts of the Company, its subsidiary companies, partnerships and any investments in associates and joint arrangements as at and for the six months ended June 30, 2019. These Interim Financial Statements and the notes thereto have been prepared in accordance with IAS 34 Interim Financial Reporting and should be read in conjunction with the consolidated financial statements of the Company as at and for the year ended December 31, 2018 ("Consolidated Financial Statements"). The Interim Financial Statements were authorized for issue by Pembina's Board of Directors on August 1, 2019.
Pembina owns an integrated system of pipelines that transport various hydrocarbon liquids and natural gas products produced primarily in western Canada. The Company also owns gas gathering and processing facilities and an oil and natural gas liquids infrastructure, storage and logistics business. Pembina's integrated assets and commercial operations along the majority of the hydrocarbon value chain allow it to offer a full spectrum of midstream and marketing services to the energy sector.
2. CHANGES IN ACCOUNTING POLICIES
Except for the changes as described below, accounting policies as disclosed in Note 4 of the Consolidated Financial Statements have been applied to all periods consistently.
IFRS 16 Leases
The Company has adopted IFRS 16 effective January 1, 2019. IFRS 16 introduced a new lease definition that increases the focus on control of the underlying asset. In addition, IFRS 16 introduced a single, on balance sheet accounting model for lessees that has resulted in the Company recording right-of-use assets representing its right to use the underlying assets and lease liabilities representing its obligation to make lease payments. Lessor accounting has remained unchanged, except for changes in the classification of subleases.
IFRS 16 has been applied using the modified retrospective approach, under which the cumulative effect of initial application was recognized in equity at January 1, 2019 as further disclosed below. Accordingly, the comparative financial information has not been restated and continues to be reported under IAS 17 Leases and IFRIC 4 Determining whether an arrangement contains a lease. The details of the Company's accounting policies under IAS 17 and IFRIC 4, for the comparative period, were disclosed in the Consolidated Financial Statements.
On transition to IFRS 16, the Company elected to apply the practical expedient to grandfather the assessment of whether a contract entered into before the date of initial application was, or contained, a lease under IFRIC 4, rather than reassess based on the new definition of a lease under IFRS 16. Contracts previously identified as leases were recognized and measured in accordance with IFRS 16.
| a. | Accounting Policies |
The details of significant accounting policies under IFRS 16 and the nature of the changes to previous accounting policies under IAS 17 and IFRIC 4 are outlined in the condensed consolidated unaudited interim financial statements as at and for the three months ended March 31, 2019. There has not been a significant change from what has been previously disclosed.
38 Pembina Pipeline Corporation Second Quarter 2019
| b. | Use of Estimates and Judgments |
The details of use of estimates and judgments impacted by IFRS 16 are outlined in the condensed consolidated unaudited interim financial statements as at and for the three months ended March 31, 2019. There has not been a significant change from what has been previously disclosed.
| c. | Transition |
| i. | Lessee |
At transition, lease liabilities for contracts previously identified as operating leases under IAS 17 were measured at the present value of the remaining lease payments, discounted at the Company's incremental borrowing rate as at January 1, 2019. For all leases, right-of-use assets were measured at an amount equal to the lease liability.
The Company applied the following practical expedients on transition:
| • | the Company applied a single discount rate to a portfolio of leases with similar characteristics rather than multiple discount rates to match the term of each lease; |
| • | the Company has relied on onerous lease contract assessments previously performed under IAS 37 Provisions, Contingent Liabilities and Contingent Assets as an alternative to an impairment review on right-of-use assets, resulting in an adjustment of the right-of-use asset balance by the amount of the onerous lease contract provision outstanding immediately before the date of initial application; and |
| • | the Company elected not to recognize right-of-use assets and corresponding lease liabilities for leases with terms of less than twelve months remaining. |
There has been no change to the accounting for contracts previously identified as finance leases under IAS 17. The carrying amount of the right-of-use asset and lease liability on transition were determined to be equal to the carrying amount of the lease asset and lease liability under IAS 17.
| ii. | Lessor |
Sub-lease contracts previously classified as operating leases are recognized as finance leases under IFRS 16.
| d. | Financial Statement Impacts |
On transition to IFRS 16, the Company recognized significant right-of-use assets and lease liabilities related to rail, buildings and land. Further disclosures related to leases are provided in financial statement note 6.
Pembina Pipeline Corporation Second Quarter 2019 39
| i. | Consolidated Statement of Financial Position |
The impacts of adoption of IFRS 16 as at January 1, 2019 are as follows:
| As at December 31, 2018 | Adjustments | Opening value January 1, 2019 | ||||
| ($ millions) | ||||||
| Assets | ||||||
| Current assets | ||||||
Trade receivables and other(1) | 604 | 1 | 605 | |||
| Non-current assets | ||||||
Property, plant and equipment(2) | 14,730 | (18 | ) | 14,712 | ||
Right-of-use assets(3) | — | 427 | 427 | |||
Advances to related parties and other assets(1)(4) | 144 | 33 | 177 | |||
| Liabilities and Equity | ||||||
| Current liabilities | ||||||
Trade payables and other(4) | 870 | (7 | ) | 863 | ||
Loans and borrowings(5) | 480 | (8 | ) | 472 | ||
| Lease liabilities | — | 64 | 64 | |||
| Non-current liabilities | ||||||
Loans and borrowings(5) | 7,057 | (11 | ) | 7,046 | ||
| Lease liabilities | — | 416 | 416 | |||
| Deferred tax liabilities | 2,774 | 8 | 2,782 | |||
Other liabilities(4) | 239 | (41 | ) | 198 | ||
| Equity | ||||||
| Attributable to shareholders | 14,344 | 22 | 14,366 | |||
(1) | Includes lessor finance lease receivables. |
(2) | Finance lease assets previously recorded in property, plant and equipment were reclassified to right-of-use assets. |
(3) | Right-of-use assets are recorded at a value equal to the associated lease liability of $480 million, less $33 million for sublease arrangements, less onerous lease liability balance at December 31, 2018 of $20 million. |
(4) | Operating lease payments were previously recognized on a straight-line basis, with the difference between cash payments and expense (income) recorded to a deferred lease asset or deferred lease liability. These deferrals were derecognized on adoption of IFRS 16. In addition, $20 million of onerous lease liabilities were offset against right-of-use assets. |
(5) | Finance leases previously recorded in loans and borrowings were reclassified to lease liabilities. |
| ii. | Reconciliation of Lease Liability |
| ($ millions) | ||
| Lease commitments, disclosed at December 31, 2018 | 796 | |
| Leases not yet commenced | (33 | ) |
| Non-lease components | (217 | ) |
| Renewal options reasonably certain to be exercised | 53 | |
| Total undiscounted lease payments | 599 | |
Discounting impact(1) | (119 | ) |
| Lease liabilities recognized as at January 1, 2019 | 480 | |
(1) | The Company discounted lease payments using the incremental credit-risk adjusted borrowing rate applicable to the contract. The weighted-average rate applied on transition for all lease liabilities was 4.01 percent. |
40 Pembina Pipeline Corporation Second Quarter 2019
New Standards and Interpretations Not Yet Adopted
Conceptual Framework
In March 2018, the International Accounting Standards Board issued a revised Conceptual Framework for Financial Reporting, effective for annual periods beginning on or after January 1, 2020, with early application permitted. The Conceptual Framework sets out the fundamental concepts of financial reporting and is applied to develop accounting policies when no IFRS Standard applies to a particular transaction. The revised Conceptual Framework includes: new concepts on measurement, presentation and disclosure, and derecognition; updated definitions of an asset and a liability and related recognition criteria; and clarifications in important areas, such as the roles of stewardship, prudence and measurement uncertainty in financial reporting. The Company intends to adopt the revised Conceptual Framework for Financial Reporting on its effective date. The Company is currently evaluating the impact that the revised conceptual framework will have on its earnings and financial position.
3. DETERMINATION OF FAIR VALUES
A number of the Company's accounting policies and disclosures require the determination of fair value for both financial and non-financial assets and liabilities. Fair values have been determined for measurement and/or disclosure based on methods as set out in the Consolidated Financial Statements. These methods have been applied consistently to all periods presented in these Interim Financial Statements.
4. PROPERTY, PLANT AND EQUIPMENT
| ($ millions) | Land and Land Rights | Pipelines | Facilities and Equipment | Cavern Storage and Other | Assets Under Construction | Total | ||||||
| Cost | ||||||||||||
| Balance at December 31, 2018 | 340 | 7,164 | 7,159 | 1,478 | 939 | 17,080 | ||||||
| Reclassification on adoption of IFRS 16 (Note 2) | — | — | — | (44 | ) | — | (44 | ) | ||||
| Additions and transfers | 19 | 103 | 269 | 176 | 243 | 810 | ||||||
| Change in decommissioning provision | — | 15 | 89 | 5 | — | 109 | ||||||
| Disposals and other | (2 | ) | (13 | ) | (16 | ) | (7 | ) | (8 | ) | (46 | ) |
| Balance at June 30, 2019 | 357 | 7,269 | 7,501 | 1,608 | 1,174 | 17,909 | ||||||
| Depreciation | ||||||||||||
| Balance at December 31, 2018 | 12 | 1,221 | 867 | 250 | — | 2,350 | ||||||
| Reclassification on adoption of IFRS 16 (Note 2) | — | — | — | (27 | ) | — | (27 | ) | ||||
| Depreciation | 2 | 75 | 84 | 30 | — | 191 | ||||||
| Disposals and other | — | (8 | ) | (18 | ) | — | — | (26 | ) | |||
| Balance at June 30, 2019 | 14 | 1,288 | 933 | 253 | — | 2,488 | ||||||
| Carrying amounts | ||||||||||||
| Balance at December 31, 2018 | 328 | 5,943 | 6,292 | 1,228 | 939 | 14,730 | ||||||
| Balance at June 30, 2019 | 343 | 5,981 | 6,568 | 1,355 | 1,174 | 15,421 | ||||||
Pembina Pipeline Corporation Second Quarter 2019 41
5. INVESTMENTS IN EQUITY ACCOUNTED INVESTEES
| Ownership Interest | Share of Profit (Loss) from Equity Investments | Equity Investments | ||||||||||
| 6 Months Ended June 30 | ||||||||||||
| ($ millions) | June 30, 2019 | December 31, 2018 | 2019 | 2018 | June 30, 2019 | December 31, 2018 | ||||||
| Alliance | 50 | % | 50 | % | 86 | 82 | 2,675 | 2,799 | ||||
| Aux Sable | 42.7% - 50% | 42.7% - 50% | 23 | 36 | 442 | 480 | ||||||
Ruby Pipeline(1) | 50% (1) | 50% (1) | 60 | 57 | 1,581 | 1,648 | ||||||
| Veresen Midstream | 45 | % | 45.3 | % | 23 | (6 | ) | 1,320 | 1,324 | |||
| CKPC | 50 | % | 50 | % | — | 3 | 88 | — | ||||
| Other | 50% - 75% | 50% - 75% | 1 | — | 116 | 117 | ||||||
| 193 | 172 | 6,222 | 6,368 | |||||||||
(1) | Ownership interest in Ruby is presented as a 50 percent proportionate share with the benefit of a preferred distribution structure. Share of profit from equity accounted investees for Ruby is equal to the preferred interest distribution. |
6. LEASES
Lessee Leases
The Company enters into arrangements to secure access to assets necessary for operating the business. Leased (right-of-use) assets include rail, buildings, and land and other assets. Total cash outflows related to leases were $20 million and $41 million, respectively, for the three and six months ended June 30, 2019.
Right-of-use Assets
| ($ millions) | Rail | Buildings | Land & Other | Total | ||||
| Balance at January 1, 2019 (Note 2) | 221 | 127 | 79 | 427 | ||||
| Additions | 7 | — | 6 | 13 | ||||
| Amortization | (18 | ) | (8 | ) | (5 | ) | (31 | ) |
| Balance at June 30, 2019 | 210 | 119 | 80 | 409 | ||||
Lessor Leases
The Company has entered into contracts for the use of its assets that have resulted in lease treatment for accounting purposes. Assets under operating leases include pipelines, terminals and storage caverns. Assets under finance leases include office sub-leases.
Maturity of Lease Receivables
| As at June 30, 2019 | Operating Leases | Finance Leases | ||
| ($ millions) | ||||
| Less than one year | 90 | 6 | ||
| One to two years | 90 | 7 | ||
| Two to three years | 89 | 6 | ||
| Three to four years | 89 | 5 | ||
| Four to five years | 89 | 4 | ||
| More than five years | 954 | 14 | ||
| Total undiscounted lease payments | 1,401 | 42 | ||
| Unearned finance income | (5 | ) | ||
| Finance lease receivable | 37 | |||
Finance lease receivables are included in advances to related parties and other assets on the Condensed Consolidated Interim Statement of Financial Position.
42 Pembina Pipeline Corporation Second Quarter 2019
7. LOANS AND BORROWINGS
This note provides information about the contractual terms of the Company's interest-bearing loans and borrowings, which are measured at amortized cost.
Carrying Value, Terms and Conditions, and Debt Maturity Schedule
| Carrying value | ||||||||||
| ($ millions) | Authorized at June 30, 2019 | Nominal interest rate | Year of maturity | June 30, 2019 | December 31, 2018 | |||||
Senior unsecured credit facilities(1) | 3,520 | 2.69(2) | Various(1) | 996 | 1,305 | |||||
| Senior unsecured notes – series A | 73 | 5.565 | 2020 | 75 | 76 | |||||
| Senior unsecured notes – series C | 200 | 5.58 | 2021 | 199 | 199 | |||||
| Senior unsecured notes – series D | 267 | 5.91 | 2019 | 267 | 267 | |||||
| Senior unsecured medium-term notes series 1 | 250 | 4.89 | 2021 | 250 | 250 | |||||
| Senior unsecured medium-term notes series 2 | 450 | 3.77 | 2022 | 449 | 449 | |||||
| Senior unsecured medium-term notes series 3 | 450 | 4.75 | 2043 | 447 | 446 | |||||
| Senior unsecured medium-term notes series 4 | 600 | 4.81 | 2044 | 596 | 596 | |||||
| Senior unsecured medium-term notes series 5 | 450 | 3.54 | 2025 | 449 | 448 | |||||
| Senior unsecured medium-term notes series 6 | 500 | 4.24 | 2027 | 498 | 498 | |||||
| Senior unsecured medium-term notes series 7 | 500 | 3.71 | 2026 | 498 | 498 | |||||
| Senior unsecured medium-term notes series 8 | 650 | 2.99 | 2024 | 646 | 646 | |||||
| Senior unsecured medium-term notes series 9 | 550 | 4.74 | 2047 | 541 | 541 | |||||
| Senior unsecured medium-term notes series 10 | 400 | 4.02 | 2028 | 398 | 398 | |||||
| Senior unsecured medium-term notes series 11 | 300 | 4.75 | 2048 | 298 | 298 | |||||
| Senior unsecured medium-term notes series 12 | 400 | 3.62 | 2029 | 398 | — | |||||
| Senior unsecured medium-term notes series 13 | 400 | 4.54 | 2049 | 397 | — | |||||
| Senior unsecured medium-term notes 3A | 50 | 5.05 | 2022 | 50 | 50 | |||||
| Senior unsecured medium-term notes 4A | 200 | 3.06 | 2019 | — | 205 | |||||
| Senior unsecured medium-term notes 5A | 350 | 3.43 | 2021 | 356 | 353 | |||||
Finance lease liabilities and other(3) | — | — | 14 | |||||||
| Total interest bearing liabilities | 7,808 | 7,537 | ||||||||
| Less current portion | (340 | ) | (480 | ) | ||||||
| Total non-current | 7,468 | 7,057 | ||||||||
(1) | Pembina's unsecured credit facilities include a $2.5 billion revolving facility that matures May 2024, $1.0 billion non-revolving term loan facility that matures March 2021 and a $20 million operating facility that matures May 2020, which is typically renewed on an annual basis. |
(2) | The nominal interest rate is the weighted average of all drawn credit facilities based on the Company's credit rating at June 30, 2019. Borrowings under the credit facilities bear interest at prime, Bankers' Acceptance, or LIBOR rates, plus applicable margins. |
(3) | On adoption of IFRS 16 on January 1, 2019, finance leases previously reported in loans and borrowings were reclassified to lease liabilities. See Note 2. |
On April 3, 2019, Pembina closed an offering of $800 million of senior unsecured medium-term notes (the "Offering"). The Offering was conducted in two tranches consisting of $400 million in senior unsecured medium-term notes, series 12, having a fixed coupon of 3.62 percent per annum, paid semi-annually, and maturing on April 3, 2029 and $400 million in senior unsecured medium-term notes, series 13, having a fixed coupon of 4.54 percent per annum, paid semi-annually, and maturing on April 3, 2049.
On May 31, 2019, Pembina completed an extension on its $2.5 billion revolving credit facility, which now matures on May 31, 2024.
On June 13, 2019, Pembina's $200 million senior unsecured medium term note 4A matured and was fully repaid.
All facilities are governed by specific debt covenants which Pembina was in compliance with at June 30, 2019 (2018: in compliance).
Pembina Pipeline Corporation Second Quarter 2019 43
8. DECOMMISSIONING PROVISION
| ($ millions) | 2019 | |
| Balance at January 1 | 573 | |
| Unwinding of discount rate | 7 | |
| Change in rates | 93 | |
| Additions | 15 | |
| Change in estimates and other | 4 | |
| Total | 692 | |
| Less current portion (included in accrued liabilities) | (3 | ) |
| Balance at June 30 | 689 | |
The Company applied a 1.8 percent inflation rate per annum (2018: 1.8 percent) and a risk-free rate of 2.0 percent (2018: 2.3 percent) to calculate the present value of the decommissioning provision. Changes in the measurement of the decommissioning provision are added to, or deducted from, the cost of the related asset in property, plant and equipment. When a re-measurement of the decommissioning provision relates to a retired asset, the amount is recorded in earnings.
9. SHARE CAPITAL
Common share capital
| ($ millions, except as noted) | Number of common shares (millions) | Common share capital | ||
| Balance at December 31, 2018 | 508 | 13,662 | ||
| Share-based payment transactions | 3 | 122 | ||
| Balance at June 30, 2019 | 511 | 13,784 | ||
Preferred share capital
| ($ millions, except as noted) | Number of preferred shares (millions) | Preferred share capital | ||
| Balance at December 31, 2018 | 100 | 2,423 | ||
| Preferred Shares issued, net of issue costs | — | (2 | ) | |
| Balance at June 30, 2019 | 100 | 2,421 | ||
Dividends
The following dividends were declared by the Company:
| 6 Months Ended June 30 | ||||
| ($ millions) | 2019 | 2018 | ||
| Common shares | ||||
| Common shares $1.16 per share (2018: $1.10) | 592 | 554 | ||
| Preferred shares | ||||
| $0.607621 per Series 1 preferred share (2018: $0.531250) | 6 | 5 | ||
| $0.563708 per Series 3 preferred share (2018: $0.587500) | 3 | 4 | ||
| $0.610561 per Series 5 preferred share (2018: $0.625000) | 6 | 6 | ||
| $0.557337 per Series 7 preferred share (2018: $0.562500) | 6 | 6 | ||
| $0.588300 per Series 9 preferred share (2018: $0.593750) | 5 | 5 | ||
| $0.712153 per Series 11 preferred share (2018: $0.718750) | 5 | 5 | ||
| $0.712153 per Series 13 preferred share (2018: $0.718750) | 7 | 7 | ||
| $0.558000 per Series 15 preferred share (2018: $0.558000) | 4 | 4 | ||
| $0.613813 per Series 17 preferred share (2018: $0.625000) | 4 | 4 | ||
| $0.625000 per Series 19 preferred share (2018: $0.625000) | 5 | 5 | ||
| $0.606878 per Series 21 preferred share (2018: $0.588150) | 10 | 10 | ||
| 61 | 61 | |||
44 Pembina Pipeline Corporation Second Quarter 2019
On January 30, 2019, Pembina announced that it did not intend to exercise its right to redeem the six million Cumulative Redeemable Rate Reset Class A Preferred Shares, Series 3 outstanding on March 1, 2019.
On March 1, 2019, Pembina announced that it did not intend to exercise its right to redeem the six million Cumulative Redeemable Rate Reset Class A Preferred Shares, Series 17 outstanding on March 31, 2019.
On May 2, 2019, Pembina announced that it did not intend to exercise its right to redeem the ten million Cumulative Redeemable Rate Reset Class A Preferred Shares, Series 5 shares outstanding on June 3, 2019.
On May 2, 2019, Pembina's Board of Directors approved a five percent increase to its monthly common share dividend rate (from $0.19 per common share to $0.20 per common share), commencing with the dividend paid on June 14, 2019.
On July 10, 2019, Pembina announced that its Board of Directors had declared a dividend of $0.20 per qualifying common share ($2.40 annually) in the total amount of $102 million, payable on August 15, 2019 to shareholders of record on July 25, 2019. Pembina's Board of Directors also declared quarterly dividends for the Company's preferred shares as outlined in the following table:
| Series | Record date | Payable date | Per share amount | Dividend amount ($ millions) | |
| Series 1 | August 1, 2019 | September 3, 2019 | $0.306625 | 3 | |
| Series 3 | August 1, 2019 | September 3, 2019 | $0.279875 | 2 | |
| Series 5 | August 1, 2019 | September 3, 2019 | $0.285813 | 3 | |
| Series 7 | August 1, 2019 | September 3, 2019 | $0.281250 | 3 | |
| Series 9 | August 1, 2019 | September 3, 2019 | $0.296875 | 3 | |
| Series 11 | August 1, 2019 | September 3, 2019 | $0.359375 | 2 | |
| Series 13 | August 1, 2019 | September 3, 2019 | $0.359375 | 4 | |
| Series 15 | September 16, 2019 | September 30, 2019 | $0.279000 | 2 | |
| Series 17 | September 16, 2019 | September 30, 2019 | $0.301313 | 2 | |
| Series 19 | September 16, 2019 | September 30, 2019 | $0.312500 | 3 | |
| Series 21 | August 1, 2019 | September 3, 2019 | $0.306250 | 5 | |
10. REVENUE
Revenue has been disaggregated into categories to reflect how the nature, timing and uncertainty of revenue and cash flows are affected by economic factors.
| a. | Revenue disaggregation |
| 2019 | 2018 | |||||||||||||||
| 3 Months Ended June 30 | Pipelines Division | Facilities Division | Marketing & New Ventures Division | Total | Pipelines Division | Facilities Division | Marketing & New Ventures Division | Total | ||||||||
| ($ millions) | ||||||||||||||||
Take-or-pay(1) | 301 | 157 | — | 458 | 245 | 147 | — | 392 | ||||||||
Fee-for-service(1) | 92 | 24 | — | 116 | 107 | 10 | — | 117 | ||||||||
Product sales(2)(3)(5) | — | — | 1,210 | 1,210 | — | 5 | 1,208 | 1,213 | ||||||||
| Revenue from contracts with customers | 393 | 181 | 1,210 | 1,784 | 352 | 162 | 1,208 | 1,722 | ||||||||
Lease and other revenue(4) | 16 | 8 | — | 24 | 21 | — | — | 21 | ||||||||
| Total external revenue | 409 | 189 | 1,210 | 1,808 | 373 | 162 | 1,208 | 1,743 | ||||||||
(1) | Revenue recognized over time. |
(2) | Revenue recognized at a point in time. |
(3) | Revenue reported for 2018 periods have been recast to reflect updated presentation for 2019, where product sales are reported in the Marketing & New Ventures Division. |
(4) | Includes fixed operating lease income of $24 million for the three months ended June 30, 2019. |
(5) | Pembina corrected revenue and costs of goods sold in 2018. The adjustments reduce revenue and cost of goods sold for the three and six months ending June 30, 2018 ($202 million). There was no impact to earnings as a result of the adjustment. |
Pembina Pipeline Corporation Second Quarter 2019 45
| 2019 | 2018 | |||||||||||||||
| 6 Months Ended June 30 | Pipelines Division | Facilities Division | Marketing & New Ventures Division | Total | Pipelines Division | Facilities Division | Marketing & New Ventures Division | Total | ||||||||
| ($ millions) | ||||||||||||||||
Take-or-pay(1) | 574 | 318 | — | 892 | 450 | 310 | — | 760 | ||||||||
Fee-for-service(1) | 188 | 41 | — | 229 | 197 | 32 | — | 229 | ||||||||
Product sales(2)(3)(5) | — | 3 | 2,606 | 2,609 | — | 6 | 2,540 | 2,546 | ||||||||
| Revenue from contracts with customers | 762 | 362 | 2,606 | 3,730 | 647 | 348 | 2,540 | 3,535 | ||||||||
Lease and other revenue(4) | 31 | 15 | — | 46 | 45 | — | — | 45 | ||||||||
| Total external revenue | 793 | 377 | 2,606 | 3,776 | 692 | 348 | 2,540 | 3,580 | ||||||||
(1) | Revenue recognized over time. |
(2) | Revenue recognized at a point in time. |
(3) | Revenue reported for 2018 periods have been recast to reflect updated presentation for 2019, where product sales are reported in the Marketing & New Ventures Division. |
(4) | Includes fixed operating lease income of $46 million for the six months ended June 30, 2019. |
(5) | Pembina corrected revenue and costs of goods sold in 2018. The adjustments reduce revenue and cost of goods sold for the three and six months ending June 30, 2018 ($202 million). There was no impact to earnings as a result of the adjustment. |
| b. | Contract balances |
Significant changes in the contract liabilities balances during the period are as follows:
| 6 Months Ended June 30, 2019 | 12 Months Ended December 31, 2018 | |||||||||||
| ($ millions) | Take-or-pay | Other contract liabilities | Total contract liabilities | Take-or-pay | Other contract liabilities | Total contract liabilities | ||||||
| Opening balance | 9 | 159 | 168 | 8 | 149 | 157 | ||||||
| Additions (net in the period) | 15 | 17 | 32 | 5 | 33 | 38 | ||||||
Revenue recognized from contract liabilities(1) | (1 | ) | (37 | ) | (38 | ) | (4 | ) | (23 | ) | (27 | ) |
| Closing balance | 23 | 139 | 162 | 9 | 159 | 168 | ||||||
Less current portion(2) | (23 | ) | (20 | ) | (43 | ) | (9 | ) | (28 | ) | (37 | ) |
| Ending balance | — | 119 | 119 | — | 131 | 131 | ||||||
(1) | Recognition of revenue related to performance obligations satisfied in the current period that were included in the opening balance of contract liabilities. |
(2) | As at June 30, 2019, the balance includes $23 million of cash collected under take-or-pay contracts which will be recognized during the remainder of the year as the customer chooses to ship, process, or otherwise forego the associated service. |
Contract liabilities depict the Company's obligation to perform services in the future for which payment has been received from customers. Contract liabilities include up-front payments or non-cash consideration received from customers for future transportation, processing and storage services. Contract liabilities also include consideration received from customers for take-or-pay commitments where the customer has a make-up right to ship or process future volumes under a firm contract. These amounts are non-refundable should the customer not use its make-up rights.
The Company does not have any contract assets. In all instances where goods or services have been transferred to a customer in advance of the receipt of customer consideration, the Company's right to consideration is unconditional and has therefore been presented as a receivable.
46 Pembina Pipeline Corporation Second Quarter 2019
11. NET FINANCE COSTS
| 3 Months Ended June 30 | 6 Months Ended June 30 | |||||||
| ($ millions) | 2019 | 2018 | 2019 | 2018 | ||||
| Interest expense on financial liabilities measured at amortized cost: | ||||||||
| Loans and borrowings | 74 | 70 | 145 | 137 | ||||
| Convertible debentures | — | 2 | — | 4 | ||||
| Leases | 4 | — | 9 | — | ||||
| Unwinding of discount rate | 4 | 3 | 7 | 6 | ||||
| Finance lease income | (1 | ) | — | (1 | ) | — | ||
| Loss in fair value of non-commodity-related derivative financial instruments | — | 3 | 3 | 11 | ||||
| Loss on revaluation of conversion feature of convertible debentures | — | 17 | — | 2 | ||||
| Foreign exchange (gains) losses and other | (3 | ) | 1 | (6 | ) | (5 | ) | |
| Net finance costs | 78 | 96 | 157 | 155 | ||||
Pembina Pipeline Corporation Second Quarter 2019 47
12. OPERATING SEGMENTS
Pembina's operating segments are organized by three divisions: Pipelines, Facilities and Marketing & New Ventures.
| 3 Months Ended June 30, 2019 | Pipelines Division(1) | Facilities Division | Marketing & New Ventures Division(2) | Corporate & Inter-division Eliminations | Total | |||||
| ($ millions) | ||||||||||
| Revenue from external customers | 409 | 189 | 1,210 | — | 1,808 | |||||
| Inter-division revenue | 34 | 86 | — | (120 | ) | — | ||||
Total revenue(3) | 443 | 275 | 1,210 | (120 | ) | 1,808 | ||||
| Operating expenses | 92 | 82 | — | (40 | ) | 134 | ||||
| Cost of goods sold, including product purchases | — | 1 | 1,129 | (80 | ) | 1,050 | ||||
| Realized gain on commodity-related derivative financial instruments | — | — | (1 | ) | — | (1 | ) | |||
| Share of profit from equity accounted investees | 67 | 12 | 18 | — | 97 | |||||
| Depreciation and amortization included in operations | 58 | 37 | 15 | (2 | ) | 108 | ||||
| Unrealized gain on commodity-related derivative financial instruments | — | — | (15 | ) | — | (15 | ) | |||
| Gross profit | 360 | 167 | 100 | 2 | 629 | |||||
| Depreciation included in general and administrative | — | — | — | 13 | 13 | |||||
| Other general and administrative | 7 | 4 | 6 | 46 | 63 | |||||
| Other expense (income) | 1 | — | 2 | (2 | ) | 1 | ||||
| Reportable segment results from operating activities | 352 | 163 | 92 | (55 | ) | 552 | ||||
| Net finance costs | 3 | 1 | 4 | 70 | 78 | |||||
| Reportable segment earnings (loss) before tax | 349 | 162 | 88 | (125 | ) | 474 | ||||
| Capital expenditures | 234 | 148 | 47 | 5 | 434 | |||||
| Contributions to equity accounted investees | — | — | 28 | — | 28 | |||||
| 3 Months Ended June 30, 2018 | Pipelines Division(1) | Facilities Division(4) | Marketing & New Ventures Division(2)(4) | Corporate & Inter-division Eliminations | Total | |||||
| ($ millions) | ||||||||||
Revenue from external customers(5) | 373 | 162 | 1,208 | — | 1,743 | |||||
| Inter-division revenue | 31 | 88 | — | (119 | ) | — | ||||
Total revenue(3) | 404 | 250 | 1,208 | (119 | ) | 1,743 | ||||
| Operating expenses | 92 | 85 | — | (77 | ) | 100 | ||||
Cost of goods sold, including product purchases(5) | — | 1 | 1,120 | (47 | ) | 1,074 | ||||
| Realized loss on commodity-related derivative financial instruments | — | — | 9 | — | 9 | |||||
| Share of profit from equity accounted investees | 65 | 1 | 30 | — | 96 | |||||
| Depreciation and amortization included in operations | 55 | 38 | 6 | — | 99 | |||||
| Unrealized loss on commodity-related derivative financial instruments | — | — | 46 | — | 46 | |||||
| Gross profit | 322 | 127 | 57 | 5 | 511 | |||||
| Depreciation included in general and administrative | — | — | — | 4 | 4 | |||||
| Other general and administrative | 7 | 5 | 13 | 51 | 76 | |||||
| Other (income) expense | — | (5 | ) | 3 | 2 | — | ||||
| Reportable segment results from operating activities | 315 | 127 | 41 | (52 | ) | 431 | ||||
| Net finance costs | 2 | 6 | 10 | 78 | 96 | |||||
| Reportable segment earnings (loss) before tax | 313 | 121 | 31 | (130 | ) | 335 | ||||
| Capital expenditures | 119 | 101 | 33 | 2 | 255 | |||||
| Contributions to equity accounted investees | — | — | — | — | — | |||||
(1) | Pipelines Division transportation revenue includes $10 million (2018: $6 million) associated with U.S. pipeline sales. |
(2) | Marketing & New Ventures Division includes revenue of $95 million (2018: $54 million) associated with U.S. midstream sales. |
(3) | During both periods, one customer accounted for 10 percent or more of total revenues, with $207 million (2018: $185 million) reported throughout all segments. |
(4) | Revenue and cost of goods sold reported for all 2018 periods have been recast to reflect updated presentation for 2019, where all cost of goods sold and corresponding revenues are reported in the Marketing & New Ventures Division. |
(5) | Pembina corrected revenue and costs of goods sold in 2018. The adjustments reduce revenue and cost of goods sold for the three and six months ending June 30, 2018 ($202 million). There was no impact to earnings as a result of the adjustment. |
48 Pembina Pipeline Corporation Second Quarter 2019
| 6 Months Ended June 30, 2019 | Pipelines Division(1) | Facilities Division | Marketing & New Ventures Division(2) | Corporate & Inter-division Eliminations | Total | |||||
| ($ millions) | ||||||||||
| Revenue from external customers | 793 | 377 | 2,606 | — | 3,776 | |||||
| Inter-division revenue | 66 | 169 | — | (235 | ) | — | ||||
Total revenue(3) | 859 | 546 | 2,606 | (235 | ) | 3,776 | ||||
| Operating expenses | 190 | 167 | — | (83 | ) | 274 | ||||
| Cost of goods sold, including product purchases | — | 2 | 2,394 | (152 | ) | 2,244 | ||||
| Realized gain on commodity-related derivative financial instruments | — | — | (20 | ) | — | (20 | ) | |||
| Share of profit from equity accounted investees | 146 | 24 | 23 | — | 193 | |||||
| Depreciation and amortization included in operations | 115 | 76 | 32 | 1 | 224 | |||||
| Unrealized loss on commodity-related derivative financial instruments | — | — | 30 | — | 30 | |||||
| Gross profit | 700 | 325 | 193 | (1 | ) | 1,217 | ||||
| Depreciation included in general and administrative | — | — | — | 22 | 22 | |||||
| Other general and administrative | 17 | 9 | 19 | 83 | 128 | |||||
| Other expense | 2 | — | 3 | (1 | ) | 4 | ||||
| Reportable segment results from operating activities | 681 | 316 | 171 | (105 | ) | 1,063 | ||||
| Net finance costs | 5 | 3 | 1 | 148 | 157 | |||||
| Reportable segment earnings (loss) before tax | 676 | 313 | 170 | (253 | ) | 906 | ||||
| Capital expenditures | 426 | 260 | 102 | 7 | 795 | |||||
| Contributions to equity accounted investees | — | 26 | 92 | — | 118 | |||||
| 6 Months Ended June 30, 2018 | Pipelines Division(1) | Facilities Division(4) | Marketing & New Ventures Division(2)(4) | Corporate & Inter-division Eliminations | Total | |||||
| ($ millions) | ||||||||||
Revenue from external customers(5) | 692 | 348 | 2,540 | — | 3,580 | |||||
| Inter-division revenue | 65 | 153 | — | (218 | ) | — | ||||
Total revenue(3) | 757 | 501 | 2,540 | (218 | ) | 3,580 | ||||
| Operating expenses | 177 | 150 | — | (77 | ) | 250 | ||||
Cost of goods sold, including product purchases(5) | — | 4 | 2,332 | (144 | ) | 2,192 | ||||
| Realized loss on commodity-related derivative financial instruments | — | — | 27 | — | 27 | |||||
| Share of profit (loss) from equity accounted investees | 140 | (4 | ) | 36 | — | 172 | ||||
| Depreciation and amortization included in operations | 104 | 73 | 11 | — | 188 | |||||
| Unrealized loss on commodity-related derivative financial instruments | — | — | 16 | — | 16 | |||||
| Gross profit | 616 | 270 | 190 | 3 | 1,079 | |||||
| Depreciation included in general and administrative | — | — | — | 12 | 12 | |||||
| Other general and administrative | 12 | 10 | 23 | 84 | 129 | |||||
| Other (income) expense | — | (5 | ) | 3 | 5 | 3 | ||||
| Reportable segment results from operating activities | 604 | 265 | 164 | (98 | ) | 935 | ||||
| Net finance costs | 4 | 11 | 7 | 133 | 155 | |||||
| Reportable segment earnings (loss) before tax | 600 | 254 | 157 | (231 | ) | 780 | ||||
| Capital expenditures | 385 | 139 | 53 | 2 | 579 | |||||
| Contributions to equity accounted investees | — | 58 | — | — | 58 | |||||
(1) | Pipelines Division transportation revenue includes $22 million (2018: $12 million) associated with U.S. pipeline sales. |
(2) | Marketing & New Ventures Division includes revenue of $158 million (2018: $110 million) associated with U.S. midstream sales. |
(3) | During both periods, one customer accounted for 10 percent or more of total revenues, with $438 million (2018: $410 million) reported throughout all segments. |
(4) | Revenue and cost of goods sold reported for all 2018 periods have been recast to reflect updated presentation for 2019, where all cost of goods sold and corresponding revenues are reported in the Marketing & New Ventures Division. |
(5) | Pembina corrected revenue and costs of goods sold in 2018. The adjustments reduce revenue and cost of goods sold for the three and six months ending June 30, 2018 ($202 million). There was no impact to earnings as a result of the adjustment. |
Pembina Pipeline Corporation Second Quarter 2019 49
13. FINANCIAL INSTRUMENTS
Fair Values
The fair values of financial assets and liabilities, together with the carrying amounts shown in the condensed consolidated interim statements of financial position, are shown in the table below. Financial assets or liabilities that have carrying value that approximates fair value have been excluded.
| June 30, 2019 | December 31, 2018 | |||||||||||||||
| Carrying value | Fair Value(1) | Carrying value | Fair Value(1) | |||||||||||||
| ($ millions) | Level 1 | Level 2 | Level 3 | Level 1 | Level 2 | Level 3 | ||||||||||
| Financial assets carried at fair value | ||||||||||||||||
| Derivative financial instruments | 20 | — | 20 | — | 54 | — | 54 | — | ||||||||
Advances to related parties(2) | — | — | — | — | 58 | — | — | 58 | ||||||||
| 20 | — | 20 | — | 112 | — | 54 | 58 | |||||||||
| Financial assets carried at amortized cost | ||||||||||||||||
| Advances to related parties and other assets | 112 | — | 112 | — | 86 | — | 86 | — | ||||||||
| Financial liabilities carried at fair value | ||||||||||||||||
| Derivative financial instruments | 9 | — | 9 | — | 6 | — | 6 | — | ||||||||
| Financial liabilities carried at amortized cost | ||||||||||||||||
Loans and borrowings(3) | 7,808 | — | 8,344 | — | 7,537 | — | 7,588 | — | ||||||||
(1) | The basis for determining fair value is disclosed in note 3. |
(2) | Advances to related parties carried at fair value consisted of funds advanced by Pembina to a jointly controlled entity with an equity conversion option that was exercised during the first quarter of 2019. US$43 million of advances were converted to shares during the first quarter of 2019 and are included in the Investments in Equity Accounted Investees balance in the condensed consolidated interim statements of financial position at June 30, 2019. |
(3) | Carrying value of current and non-current balances. |
50 Pembina Pipeline Corporation Second Quarter 2019
14. COMMITMENTS, CONTINGENCIES AND GUARANTEES
Commitments
Pembina had the following contractual obligations outstanding at June 30, 2019:
| Contractual obligations | Payments due by period | |||||||||
| ($ millions) | Total | Less than 1 year | 1 – 3 years | 3 – 5 years | After 5 years | |||||
Leases(1) | 562 | 82 | 148 | 106 | 226 | |||||
Loans and borrowings(2) | 11,715 | 694 | 2,356 | 1,526 | 7,139 | |||||
Construction commitments(3) | 1,396 | 770 | 94 | 42 | 490 | |||||
Other(4) | 278 | 32 | 71 | 55 | 120 | |||||
| Total contractual obligations | 13,951 | 1,578 | 2,669 | 1,729 | 7,975 | |||||
(1) | Includes rail, office space, land and vehicles leases. |
(2) | Excluding deferred financing costs. Including interest payments on senior unsecured notes. |
(3) | Excluding significant projects that are awaiting regulatory approval at June 30, 2019, projects which Pembina is not committed to construct, and projects that are executed by equity accounted investees. |
(4) | Includes $81 million in commitments related to leases that have not yet commenced. |
Pembina enters into product purchase agreements and power purchase agreements to secure supply for future operations. Purchase prices of both NGL and power are dependent on current market prices. Volumes and prices for NGL and power contracts cannot be reasonably determined and therefore an amount has not been included in the contractual obligations schedule. Product purchase agreements range from one to 10 years and involve the purchase of NGL products from producers. Assuming product is available, Pembina has secured between 24 and 105 mbpd each year up to and including 2027. Power purchase agreements range from one to 25 years and involve the purchase of power from electrical service providers. The Company has secured up to 70 megawatts per day each year up to and including 2043.
Commitments to Equity Accounted Investees
Pembina has a remaining contractual commitment of US$64 million to provide equity contributions to CKPC based on budgeted amounts approved by the joint venture partners. In addition, Pembina is contractually committed to provide CKPC with funding to construct assets that will form part of CKPC's PDH/PP Facility, subject to certain conditions being met.
Pembina has a contractual commitment to advance US$55 million to Ruby by March 26, 2020.
Pembina has commitments to provide contributions to certain equity accounted investees based on annual budgets approved by the joint venture partners.
Contingencies
The Company, its subsidiaries and its investments in equity accounted investees are subject to various legal and regulatory proceedings and actions arising in the normal course of business. We represent our interests vigorously in all proceedings in which we are involved. Legal and administrative proceedings involving possible losses are inherently complex, and we apply significant judgment in estimating probable outcomes. While the outcome of such actions and proceedings cannot be predicted with certainty, management believes that the resolutions of such actions and proceedings will not have a material impact on the Company’s financial position or results of operations.
Guarantees
The Company has $68 million (2018: $69 million) in letters of credit issued to facilitate commercial transactions with third parties and to support regulatory requirements.
The Company has provided guarantees to various third parties in the normal course of conducting business. The guarantees include financial guarantees to counterparties for product purchases and sales, transportation services, utilities, engineering and construction services. The guarantees have not had and are not expected to have a material impact on the Company's financial position, earnings, liquidity or capital resources.
Pembina Pipeline Corporation Second Quarter 2019 51
 | |
HEAD OFFICE Pembina Pipeline Corporation Suite 4000, 585 - 8th Avenue SW Calgary, Alberta T2P 1G1 AUDITORS KPMG LLP Chartered Professional Accountants Calgary, Alberta TRUSTEE, REGISTRAR & TRANSFER AGENT Computershare Trust Company of Canada Suite 600, 530 - 8th Avenue SW Calgary, Alberta T2P 3S8 1.800.564.6253 STOCK EXCHANGE Pembina Pipeline Corporation Toronto Stock Exchange listing symbols for: COMMON SHARES PPL PREFERRED SHARES PPL.PR.A, PPL.PR.C, PPL.PR.E, PPL.PR.G, PPL.PR.I, PPL.PR.K, PPL.PR.M, PPL.PR.O, PPL.PR.Q, PPL.PR.S and PPL.PF.A. New York Stock Exchange listing symbol for: COMMON SHARES PBA INVESTOR INQUIRIES PHONE 403.231.3156 FAX 403.237.0254 TOLL FREE 1.855.880.7404 EMAIL investor-relations@pembina.com WEBSITE www.pembina.com | |