|
| | | |
| REPORT TO SHAREHOLDERS | | |
| Year ended December 31, 2019 | |
| | | | |
| MANAGEMENT'S DISCUSSION AND ANALYSIS | |
| | | | |
| | | | |
| Table of Contents | | | |
| | | | |
| |
| |
| |
| |
| |
| |
| |
| |
| |
| |
| |
| |
| |
| |
| | | | |
| | | | |
| | | | |
Basis of Presentation
The following Management's Discussion and Analysis ("MD&A") of the financial and operating results of Pembina Pipeline Corporation ("Pembina" or the "Company") is dated February 27, 2020, and is supplementary to, and should be read in conjunction with, Pembina's audited consolidated financial statements as at and for the year ended December 31, 2019 ("Consolidated Financial Statements"). The Consolidated Financial Statements have been prepared in accordance with International Financial Reporting Standards ("IFRS"), using the accounting policies described in Note 4 of the Consolidated Financial Statements. All dollar amounts contained in this MD&A are expressed in Canadian dollars unless otherwise noted. Additional information about Pembina filed with Canadian and U.S. securities commissions, including quarterly and annual reports, annual information forms (filed with the U.S. Securities and Exchange Commission (the "SEC") under Form 40-F) and management information circulars, can be found online at www.sedar.com, www.sec.gov and through Pembina's website at www.pembina.com.
Abbreviations
For a list of abbreviations that may be used in this MD&A, refer to the Abbreviations section of this MD&A.
Non-GAAP Financial Measures
Pembina has identified certain operating and financial performance measures that management believes provide meaningful information in assessing Pembina's underlying performance. Readers are cautioned that these measures do not have a standardized meaning prescribed by IFRS and therefore may not be comparable to similar measures presented by other entities. Refer to the "Non-GAAP Measures" section of this MD&A for a list and description, including reconciliations to the most directly comparable GAAP measure, of such non-GAAP measures.
Risk Factors and Forward-Looking Information
The Company’s financial and operational performance is potentially affected by a number of factors, including, but not limited to, the factors described within the "Risk Factors" and "Forward-Looking Statements & Information" sections of this MD&A. This MD&A contains forward-looking statements based on Pembina’s current expectations, estimates, projections and assumptions. This information is provided to assist readers in understanding the Company’s future plans and expectations and may not be appropriate for other purposes.
1 Pembina Pipeline Corporation 2019 Annual Report
1. ABOUT PEMBINA
Pembina is a leading transportation and midstream service provider that has been serving North America's energy industry for 65 years. Pembina owns an integrated system of pipelines that transport various hydrocarbon liquids and natural gas products produced primarily in western Canada. The Company also owns gas gathering and processing facilities; an oil and natural gas liquids infrastructure and logistics business; is growing an export terminals business; and is currently constructing a petrochemical facility to convert propane into polypropylene. Pembina's integrated assets and commercial operations along the majority of the hydrocarbon value chain allow it to offer a full spectrum of midstream and marketing services to the energy sector. Pembina is committed to identifying additional opportunities to connect hydrocarbon production to new demand locations through the development of infrastructure that would extend Pembina's service offering even further along the hydrocarbon value chain. These new developments will contribute to ensuring that hydrocarbons produced in the WCSB and the other basins where Pembina operates can reach the highest value markets throughout the world.
Purpose of Pembina:
To be the leader in delivering integrated infrastructure solutions connecting global markets;
| |
| • | Customers choose us first for reliable and value-added services; |
| |
| • | Investors receive sustainable industry-leading total returns; |
| |
| • | Employees say we are the 'employer of choice' and value our safe, respectful, collaborative and fair work culture; and |
| |
| • | Communities welcome us and recognize the net positive impact of our social and environmental commitment. |
Kinder Acquisition
On December 16, 2019, Pembina completed its acquisition of Kinder Morgan Canada Limited ("Kinder Morgan Canada") by way of a plan of arrangement pursuant to Section 193 of the Business Corporations Act (Alberta) and the U.S. portion of the Cochin Pipeline system from Kinder Morgan, Inc. (collectively the "Kinder Acquisition"). The total consideration paid in respect of the Kinder Acquisition was $4.25 billion including $2.0 billion in cash, net of cash received, $1.71 billion of common shares and $536 million of class A preferred shares.
Upon closing of the Kinder Acquisition, Pembina announced it would increase its monthly dividend by $0.01 per common share, commencing with the dividend paid on February 14, 2020.
Pembina Pipeline Corporation 2019 Annual Report 2
2. FINANCIAL & OPERATING OVERVIEW
Consolidated Financial Overview Three Months Ended December 31
Results of Operations |
| | | | | | | | |
| ($ millions, except where noted) | 2019 |
| 2018 |
| Change |
| % Change |
|
| Revenue | 1,754 |
| 1,726 |
| 28 |
| 2 |
|
Net revenue(1) | 837 |
| 706 |
| 131 |
| 19 |
|
| Gross profit | 603 |
| 663 |
| (60 | ) | (9 | ) |
| Earnings | 145 |
| 368 |
| (223 | ) | (61 | ) |
Earnings per common share – basic (dollars) | 0.21 |
| 0.66 |
| (0.45 | ) | (68 | ) |
Earnings per common share – diluted (dollars) | 0.21 |
| 0.66 |
| (0.45 | ) | (68 | ) |
| Cash flow from operating activities | 728 |
| 674 |
| 54 |
| 8 |
|
Cash flow from operating activities per common share – basic (dollars)(1) | 1.41 |
| 1.33 |
| 0.08 |
| 6 |
|
Adjusted cash flow from operating activities(1) | 576 |
| 543 |
| 33 |
| 6 |
|
Adjusted cash flow from operating activities per common share – basic (dollars)(1) | 1.11 |
| 1.07 |
| 0.04 |
| 4 |
|
| Capital expenditures | 429 |
| 356 |
| 73 |
| 21 |
|
Adjusted EBITDA(1) | 787 |
| 715 |
| 72 |
| 10 |
|
Total volume (mboe/d)(2) | 3,577 |
| 3,453 |
| 124 |
| 4 |
|
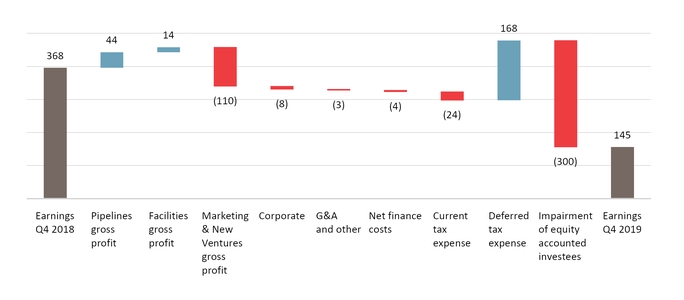
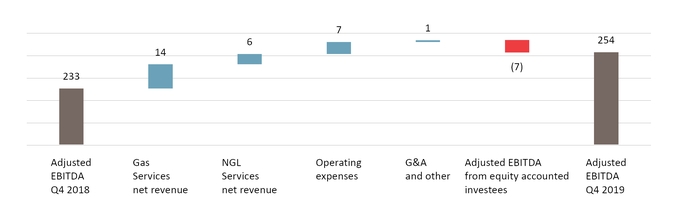
Bridge Analysis of Earnings ($ millions)
Results Overview
Earnings in the fourth quarter of 2019 were positively impacted by higher gross profit in both Pipelines and Facilities from new assets placed into service and additional assets from the Kinder Acquisition. Marketing & New Ventures benefited from higher margins on crude and the impact of IFRS 16, more than offset by unrealized losses on commodity-related derivatives due to contracts maturing in the period, and increasing forward prices for crude and NGL compared to contract positions. In addition, Pembina recorded an impairment charge of $300 million ($220 million net of tax) on its convertible preferred interest in Ruby. The impairment charge was the result of an assessment triggered by pending contract expirations in a business environment in the Rockies Basin that remains challenged. Deferred tax expense decreased due to the deferred tax recovery on the Ruby impairment and the prior year partnership earnings that are included in current tax expense in the current period.
3 Pembina Pipeline Corporation 2019 Annual Report
|
| | |
| Changes in Results for the Three Months Ended December 31 |
| Revenue | ▲ | $28 million increase, primarily driven by new assets placed into service (see the "Projects and New Developments" sections), higher deferred revenue recognized during the fourth quarter of 2019 and the contribution from new assets following the Kinder Acquisition, partially offset by lower marketing revenues due to lower NGL volumes and lower prices for propane and crude. |
| Operating expenses | ▼ | $12 million increase due to higher labour and power costs driven by growth in the business, costs associated with the reclamation of previous site contamination and the contribution from new assets following the Kinder Acquisition, partially offset by savings following Redwater Co-generation going into service in March 2019. |
| Share of profit from equity accounted investees | ▼ | $41 million decrease, largely due to lower propane margins at Aux Sable resulting from a decrease in sales prices, combined with a narrower Chicago-AECO natural gas differential resulting in lower interruptible volumes and tolls on Alliance. |
| Realized gain on commodity-related derivatives | ● | Consistent realized gains relating to the settlement of NGL based derivatives. |
| Unrealized loss (gain) on commodity-related derivatives | ▼ | $112 million negative variance primarily due to crude and NGL contracts maturing in the period, and an increase in the forward price of crude and NGL which drove the associated derivative contracts into a loss position. |
| General & administrative and other expense | ● | Consistent with prior period as higher corporate general & administrative and other expenses in 2019, due to growth in the business and acquisition costs, were largely offset by project write-downs taken during the fourth quarter of 2018. |
| Impairment of investment in equity accounted investee | ▼ | Pembina recognized an impairment charge of $300 million (pre-tax) on its convertible preferred interest in Ruby. The impairment charge was the result of an assessment triggered by pending contract expirations in a business environment in the Rockies Basin that remains challenged. |
| Net finance costs | ● | Consistent with prior period as additional interest expense associated with higher average debt levels, combined with higher interest expense recognized on the adoption of IFRS 16, was largely offset by higher foreign exchanges gains. |
| Current tax expense | ▼ | $24 million increase primarily due to the growth in prior year partnership earnings as a result of expansions that are recognized in taxable income in the current year. |
| Deferred tax expense | ▲ | $168 million decrease in deferred expense primarily due to the recovery on the impairment discussed above and growth in partnership earnings in the prior year that are recognized in taxable income in the current year. |
| Earnings | ▼ | $223 million decrease from the fourth quarter of 2018 driven by the items noted above. |
| Cash flow from operating activities | ▲ | $54 million increase, primarily driven by an increase in operating results after adjusting for non-cash items, $34 million change in non-cash working capital and the $13 million impact from the adoption of IFRS 16, partially offset by the $35 million decrease in distributions from equity accounted investees and $36 million increase in taxes paid. |
Adjusted cash flow from operating activities(1) | ▲ | $33 million increase largely due to the same items impacting cash flow from operating activities, discussed above, net of the $34 million change in non-cash working capital and $24 million increase in current tax expense, partially offset by the $36 million increase in taxes paid. |
Adjusted EBITDA(1) | ▲ | $72 million increase due to new assets placed into service in Pipelines and Facilities, the $18 million contribution from new assets following the Kinder Acquisition, higher margins on crude in Marketing & New Ventures and the $16 million impact from the adoption of IFRS 16, partially offset by lower propane margins decreasing the contribution from Aux Sable and the narrower Chicago-AECO natural gas differential impacting Alliance. Included in adjusted EBITDA is $196 million (2018: $233 million) related to equity accounted investees. |
Total volume (mboe/d)(2) | ▲ | 124 mboe/d increase due to the larger asset base and temporary interruptible volumes on the Ruby Pipeline, partially offset by lower supply volumes at the Redwater Complex, combined with decreased volumes at Veresen Midstream. Revenue volumes include 368 mboe/d (2018: 332 mboe/d) related to equity accounted investees. |
|
| | | | | | |
| ▲ | Increase; | ▼ | Decrease; or | ● | No impact; | to earnings, adjusted EBITDA, cash flow from operations, adjusted cash flow from operating activities or total volumes. |
| |
(1) | Refer to the "Non-GAAP Measures" section. |
| |
(2) | Total revenue volumes. See "Abbreviations" for definition. Marketed NGL volumes are excluded from volumes to avoid double counting. Refer to the "Marketing & New Ventures" section for further information. |
Pembina Pipeline Corporation 2019 Annual Report 4
Consolidated Financial Overview 12 Months Ended December 31
Results of Operations |
| | | | | | | | |
| ($ millions, except where noted) | 2019 |
| 2018 |
| Change |
| % Change |
|
| Revenue | 7,230 |
| 7,351 |
| (121 | ) | (2 | ) |
Net revenue(1) | 3,120 |
| 2,836 |
| 284 |
| 10 |
|
| Gross profit | 2,433 |
| 2,327 |
| 106 |
| 5 |
|
| Earnings | 1,492 |
| 1,278 |
| 214 |
| 17 |
|
Earnings per common share – basic (dollars) | 2.66 |
| 2.28 |
| 0.38 |
| 17 |
|
Earnings per common share – diluted (dollars) | 2.65 |
| 2.28 |
| 0.37 |
| 16 |
|
| Cash flow from operating activities | 2,532 |
| 2,256 |
| 276 |
| 12 |
|
Cash flow from operating activities per common share – basic (dollars)(1) | 4.94 |
| 4.47 |
| 0.47 |
| 11 |
|
Adjusted cash flow from operating activities(1) | 2,234 |
| 2,154 |
| 80 |
| 4 |
|
Adjusted cash flow from operating activities per common share – basic (dollars)(1) | 4.36 |
| 4.27 |
| 0.09 |
| 2 |
|
| Capital expenditures | 1,645 |
| 1,226 |
| 419 |
| 34 |
|
Adjusted EBITDA(1) | 3,061 |
| 2,835 |
| 226 |
| 8 |
|
Total volume (mboe/d)(2) | 3,451 |
| 3,398 |
| 53 |
| 2 |
|
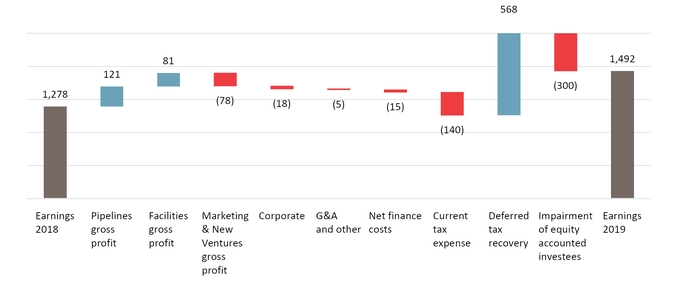
Bridge Analysis of Earnings ($ millions)
Results Overview
Earnings for the 12 months ended December 31, 2019 were positively impacted by higher gross profit in both Pipelines and Facilities from new assets placed into service. Facilities also benefited from higher propane and butane terminalling revenue. Marketing & New Ventures gross profit decreased largely due to lower share of profit in Aux Sable following a decrease in propane pricing and higher depreciation expense following the adoptions of IFRS 16. Higher current tax expense was offset by the deferred tax recovery, primarily due to the reduction in Alberta income tax rate from 12 percent to eight percent over a four-year period. Earnings were further impacted by the $300 million ($220 million net of tax) impairment charge on Pembina's convertible preferred interest in Ruby.
5 Pembina Pipeline Corporation 2019 Annual Report
|
| | |
| Changes in Results for the 12 Months Ended December 31 |
| Revenue | ▼ | $121 million decrease, primarily due to lower NGL and crude prices, partially offset by revenue associated with new assets placed into service (see the "Projects and New Developments" sections) and the contribution from new assets following the Kinder Acquisition, increased terminalling revenue, a $33 million arbitration award payment and increased recovery of operating expenses. |
| Operating expenses | ▼ | $51 million increase largely due to increases in power costs as a result of both increased power pool prices and higher consumption from new assets placed into service, combined with higher labour costs and repairs and maintenance due to the larger asset base. |
| Share of profit from equity accounted investees | ▼ | $41 million decrease largely due to lower propane margins at Aux Sable resulting from lower sales prices during 2019 and narrower Chicago-AECO natural gas differential impacting Alliance, partially offset by the impact of a $24 million finance gain reversal recorded in the first half of 2018. |
| Realized (gain) loss on commodity-related derivatives | ▲ | $84 million increase due to decreasing market prices creating a gain for NGL and crude-based derivatives settled during the period. |
| Unrealized loss (gain) on commodity-related derivatives | ▼ | $86 million increase in unrealized loss primarily due to crude and NGL contracts maturing in the period. |
| General & administrative and other expense | ● | Consistent with prior period as higher corporate general & administrative and other expenses in 2019, due to growth in the business and acquisition costs, were largely offset by project write-downs taken during 2018. |
| Impairment of investment in equity accounted investee | ▼ | Impairment charge of $300 million on Pembina's convertible preferred interest in Ruby, discussed above. |
| Net finance costs | ▼ | $15 million increase due to additional interest expense associated with higher average debt levels, combined with higher interest expense recognized on the adoption of IFRS 16, partially offset by higher foreign exchanges gains. |
| Current tax expense | ▼ | $140 million increase is primarily due to the growth in prior year partnership earnings, as a result of expansions that are recognized in taxable income in the current year, as well as higher earnings in the current year. |
| Deferred tax recovery | ▲ | $568 million decrease in deferred tax primarily due to the reduction in the Alberta tax rate from 12 percent to eight percent over a four-year period, the recovery on the impairment discussed above, and growth in the partnership earnings in the prior year that are recognized in taxable income in the current year. |
| Earnings | ▲ | $214 million increase compared to 2018, driven by the items noted above. |
| Cash flow from operating activities | ▲ | $276 million increase, primarily driven by an increase in operating results after adjusting for non-cash items, $189 million change in non-cash working capital, combined with the $56 million impact from the adoption of IFRS 16, partially offset by the $115 million increase in taxes paid and $47 million decrease in distributions from equity accounted investees. |
Adjusted cash flow from operating activities(1) | ▲ | $80 million increase largely due to the increase in cash flow from operating activities, combined with the $118 million increase in taxes paid, partially offset by the $140 million increase in current tax expense and the $189 million change in non-cash working capital. |
Adjusted EBITDA(1) | ▲ | $226 million increase primarily due to the contribution from new assets placed into service and the contribution from new assets following the Kinder Acquisition, combined with the impact from the realized gain on commodity-related derivatives, the recognition of variable revenues related to capital recoveries, increased terminalling and storage revenues and $61 million impact from the adoption of IFRS 16, partially offset by decreased NGL and crude market prices in Marketing & New Ventures. Included in adjusted EBITDA is $802 million (2018: $850 million) related to equity accounted investees. |
Total volume (mboe/d)(2) | ▲ | 53 mboe/d increase due to new assets placed into service, higher temporary interruptible volumes on the Ruby Pipeline, partially offset by lower supply volumes at the Redwater Complex. Revenue volumes include 332 mboe/d (2018: 313 mboe/d) related to equity accounted investees. |
|
| | | | | | |
| ▲ | Increase; | ▼ | Decrease; or | ● | No impact; | to earnings, adjusted EBITDA, cash flow from operations, adjusted cash flow from operating activities or total volumes. |
| |
(1) | Refer to the "Non-GAAP Measures" section. |
| |
(2) | Total revenue volumes. See "Abbreviations" for definition. Marketed NGL volumes are excluded from volumes to avoid double counting. Refer to the "Marketing & New Ventures" section for further information. |
Pembina Pipeline Corporation 2019 Annual Report 6
3. SEGMENT RESULTS
Business Overview
The Pipelines Division provides customers with pipeline transportation, terminalling, storage and rail services in key market hubs in Canada and the United States for crude oil, condensate, natural gas liquids and natural gas. The division manages pipeline transportation capacity of 3.1 mmboe/d(1), above ground storage of 11 mmbbls(1) and rail terminalling capacity of approximately 145 mboe/d(1) within its conventional, oil sands and heavy oil, and transmission assets. The conventional assets include strategically located pipelines and terminalling hubs that gather and transport light and medium crudes, condensate and natural gas liquids from western Alberta and northeast British Columbia to the Edmonton, Alberta area for further processing or transportation on downstream pipelines. The oil sands and heavy oil assets transport heavy and synthetic oil produced within Alberta to the Edmonton area and offer associated storage, terminalling and rail services. The transmission assets transport natural gas, ethane and condensate throughout Canada and the United States on long haul pipelines linking various key market hubs. In addition, the Pipelines Division assets provide linkages between Pembina's upstream and downstream assets across North America, enabling integrated customer service offerings. Together, these assets supply product from hydrocarbon producing regions to refineries, fractionators and market hubs in Alberta, British Columbia, Illinois and California, as well as other regions throughout North America.
The Facilities Division includes infrastructure that provides Pembina's customers with natural gas, condensate and NGL services. Pembina's operated natural gas gathering and processing assets are strategically positioned in active, liquids-rich areas of the WCSB and Williston Basin and are integrated with the Company's other businesses. Pembina provides sweet and sour gas gathering, compression, condensate stabilization, and both shallow cut and deep cut gas processing services with a total capacity of approximately six(2) bcf/d for its customers. Virtually all of the condensate and NGL extracted through Canadian-based facilities are transported by Pembina's Pipelines Division. In addition all NGL transported along the Alliance Pipeline are extracted through Pembina operated Channahon Facility at the terminus. The Facilities Division includes approximately 326 mbpd(2) of NGL fractionation, 21 mmbbls(1) of cavern storage and associated pipeline and rail terminalling facilities and the Company is currently constructing a liquefied propane export facility on Canada's West Coast. These facilities are fully integrated with the Company's other divisions, providing customers with the ability to access a comprehensive suite of services to enhance the value of their hydrocarbons. In addition, Pembina owns a bulk marine export terminal in Vancouver, British Columbia.
The Marketing & New Ventures Division strives to maximize the value of hydrocarbon liquids and natural gas originating in the basins where the Company operates. Pembina seeks to create new markets, and further enhance existing markets, to support both the Company's and its customers' overall business interests. In particular, Pembina seeks to identify opportunities to connect hydrocarbon production to new demand locations through the development of infrastructure. Pembina strives to increase producer netbacks and product demand to improve the overall competitiveness of the basins where the Company operates. Within the Marketing & New Ventures Division, Pembina undertakes value-added commodity marketing activities including buying and selling products (natural gas, ethane, propane, butane, condensate and crude oil), commodity arbitrage, and optimizing storage opportunities. The marketing business enters into contracts for capacity on both Pembina's and third-party infrastructure, handles proprietary and customer volumes and aggregates production for onward sale. The Marketing & New Ventures Division includes an integrated PDH/PP Facility being constructed by Pembina's joint venture, CKPC and the proposed Jordan Cove LNG project.
| |
(1) | Net capacity; excludes projects under development. |
| |
(2) | Net capacity. Includes Aux Sable capacity. The financial and operational results for Aux Sable are included in the Marketing & New Ventures Division; excludes projects under development. |
7 Pembina Pipeline Corporation 2019 Annual Report
Financial and Operational Overview by Division
|
| | | | | | | | | | | | | | | | | | | | | | | | |
| 3 Months Ended December 31 | 12 Months Ended December 31 |
| 2019 | 2018 | 2019 | 2018 |
| ($ millions, except where noted) | Volumes(1) |
| Gross Profit |
| Adjusted EBITDA(2) |
| Volumes(1) |
| Gross Profit |
| Adjusted EBITDA(2) |
| Volumes(1) |
| Gross Profit |
| Adjusted
EBITDA(2) |
| Volumes(1) |
| Gross Profit |
| Adjusted
EBITDA(2) |
|
| Pipelines | 2,667 |
| 345 |
| 467 |
| 2,529 |
| 301 |
| 417 |
| 2,566 |
| 1,376 |
| 1,854 |
| 2,521 |
| 1,255 |
| 1,703 |
|
| Facilities | 910 |
| 169 |
| 254 |
| 924 |
| 155 |
| 233 |
| 885 |
| 655 |
| 955 |
| 877 |
| 574 |
| 880 |
|
Marketing & New Ventures(3) | — |
| 93 |
| 120 |
| — |
| 203 |
| 109 |
| — |
| 406 |
| 423 |
| — |
| 484 |
| 409 |
|
| Corporate | — |
| (4 | ) | (54 | ) | — |
| 4 |
| (44 | ) | — |
| (4 | ) | (171 | ) | — |
| 14 |
| (157 | ) |
| Total | 3,577 |
| 603 |
| 787 |
| 3,453 |
| 663 |
| 715 |
| 3,451 |
| 2,433 |
| 3,061 |
| 3,398 |
| 2,327 |
| 2,835 |
|
| |
(1) | Pipelines and Facilities are revenue volumes which are physical volumes plus volumes recognized from take-or-pay commitments. Volumes are stated in mboe/d, with natural gas volumes converted to mboe/d from MMcf/d at a 6:1 ratio. |
| |
(2) | Refer to the "Non-GAAP Measures" section. |
| |
(3) | Marketed NGL volumes are excluded from volumes to avoid double counting. Refer to the "Marketing & New Ventures" section for further information. |
Pembina Pipeline Corporation 2019 Annual Report 8
Pipelines
Financial Overview Three Months Ended December 31
Results of Operations |
| | | | | | | | |
| ($ millions, except where noted) | 2019 |
| 2018 |
| Change |
| % Change |
|
Conventional revenue(1) | 354 |
| 303 |
| 51 |
| 17 |
|
Transmission revenue(1) | 60 |
| 34 |
| 26 |
| 76 |
|
Oil Sands revenue(1) | 73 |
| 66 |
| 7 |
| 11 |
|
Pipelines revenue(1) | 487 |
| 403 |
| 84 |
| 21 |
|
Operating expenses(1) | 137 |
| 120 |
| 17 |
| 14 |
|
| Share of profit from equity accounted investees | 61 |
| 74 |
| (13 | ) | (18 | ) |
| Depreciation and amortization included in operations | 66 |
| 56 |
| 10 |
| 18 |
|
| Gross profit | 345 |
| 301 |
| 44 |
| 15 |
|
Adjusted EBITDA(2) | 467 |
| 417 |
| 50 |
| 12 |
|
Volumes (mboe/d)(3) | 2,667 |
| 2,529 |
| 138 |
| 5 |
|
| Distributions from equity accounted investees | 80 |
| 88 |
| (8 | ) | (9 | ) |
|
| | |
| Change in Results | | |
Conventional revenue(1) | ▲ | Increase due to revenues associated with Phase IV and V assets placed into service in December 2018, a timing difference in the recognition of deferred revenue, which was primarily recognized in the fourth quarter of 2019 compared to the third quarter of 2018, and increased recovery of operating expenses. |
Transmission revenue(1) | ▲ | Increase largely due to the contribution from the Cochin Pipeline following the Kinder Acquisition, combined with higher average tolls following the recontracting of Alberta Ethane Gathering System and return to normal operations on the Vantage Pipeline following a year-long third-party force majeure. |
Oil Sands revenue(1) | ▲ | Increase primarily due to contribution from the Edmonton Terminals following the Kinder Acquisition. |
Operating expenses(1) | ▼ | Increase primarily due to higher labour driven by growth in the business, costs associated with the reclamation of previous site contamination and the contribution from new assets following the Kinder Acquisition. |
| Share of profit from equity accounted investees | ▼ | Decrease largely due to lower interruptible volumes and tolls on the Alliance Pipeline, driven by a narrower AECO-Chicago natural gas differential. |
| Depreciation and amortization included in operations | ▼ | Increase in depreciation due to larger asset base as Pembina continued to expand its conventional pipeline system, placing Phase IV and V assets into service in December 2018 and the newly acquired assets from the Kinder Acquisition. |
| Distributions from equity accounted investees | ▼ | $80 million consists of $50 million (2018: $56 million) from Alliance and $30 million (2018: $31 million) from Ruby. |
Volumes (mboe/d)(3) | ▲ | Increase in revenue volumes primarily due to increased volumes on the Peace Pipeline system, explained in revenue above and temporary interruptible volumes on the Ruby Pipeline, partially offset by lower volumes on the Alliance Pipeline due to a narrower AECO-Chicago natural gas differential. Revenue volumes include 134 mboe/d (2018: 146 mboe/d) related to Alliance and 146 mboe/d (2018: 89 mboe/d) related to Ruby. |
Adjusted EBITDA(2) | ▲ | $50 million increase primarily due to increase in revenues, partially offset by increased operating expenses and lower contribution from Alliance, explained above, combined with higher general & administrative and other expenses due to the larger asset base. Included in adjusted EBITDA is $76 million (2018: $88 million) related to Alliance and $52 million (2018: $52 million) related to Ruby. |
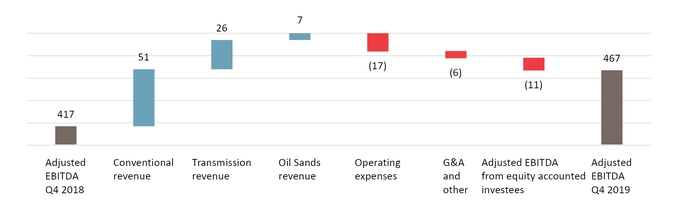
Bridge Analysis of Adjusted EBITDA(2) ($ millions)
| |
(1) | Includes inter-division transactions. See note 20 of the Consolidated Financial Statements. |
| |
(2) | Refer to the "Non-GAAP Measures" section. |
| |
(3) | Revenue volumes. See "Abbreviations" for definition. |
9 Pembina Pipeline Corporation 2019 Annual Report
Financial Overview 12 Months Ended December 31
Results of Operations |
| | | | | | | | |
| ($ millions, except where noted) | 2019 |
| 2018 |
| Change |
| % Change |
|
Conventional revenue(1) | 1,314 |
| 1,186 |
| 128 |
| 11 |
|
Transmission revenue(1) | 189 |
| 155 |
| 34 |
| 22 |
|
Oil Sands revenue(1) | 284 |
| 247 |
| 37 |
| 15 |
|
Total revenue(1) | 1,787 |
| 1,588 |
| 199 |
| 13 |
|
Operating expenses(1) | 436 |
| 396 |
| 40 |
| 10 |
|
| Share of profit from equity accounted investees | 270 |
| 279 |
| (9 | ) | (3 | ) |
| Depreciation and amortization included in operations | 245 |
| 216 |
| 29 |
| 13 |
|
| Gross profit | 1,376 |
| 1,255 |
| 121 |
| 10 |
|
Adjusted EBITDA(2) | 1,854 |
| 1,703 |
| 151 |
| 9 |
|
Volumes (mboe/d)(3) | 2,566 |
| 2,521 |
| 45 |
| 2 |
|
| Distributions from equity accounted investees | 390 |
| 380 |
| 10 |
| 3 |
|
|
| | |
| Change in Results | | |
Conventional revenue(1) | ▲ | Increase due to additional revenues associated with Phase IV and V assets and higher recovery of applicable operating expenses, driven by increases in repairs and maintenance, higher power pool prices and power consumption. |
Transmission revenue(1) | ▲ | Increase largely due to the contribution from the Cochin Pipeline following the Kinder Acquisition, higher average tolls on the Alberta Ethane Gathering System and the end of the year-long third-party force majeure combined with favourable foreign exchange rate impacts on the Vantage Pipeline. |
Oil Sands revenue(1) | ▲
| Increase primarily due to the recognition of $23 million of variable revenue related to year-to-date and prior year capital recoveries, the contribution from the Edmonton Terminals following the Kinder Acquisition and higher recovery of operating expenses due to increased power pool prices. |
Operating expenses(1) | ▼ | Increase primarily due to increased labour and power costs as a result of the larger asset base and higher power pool prices, combined with increased repairs and maintenance. |
| Share of profit from equity accounted investees | ▼ | Decrease largely due to lower interruptible volumes on the Alliance Pipeline during the fourth quarter, driven by narrower AECO-Chicago natural gas differential, partially offset by general & administrative expense savings associated with transitioning Alliance to an owner-operator model. |
| Depreciation and amortization included in operations | ▼ | Increase in depreciation due to larger asset base as Pembina placed Phase IV and V assets into service in December 2018 and the newly acquired assets from the Kinder Acquisition. |
| Distributions from equity accounted investees | ▲ | $390 million consists of $268 million (2018: $259 million) from Alliance and $121 million (2018: $120 million) from Ruby. |
Volumes (mboe/d)(3) | ▲ | Increase primarily due to conventional Phase IV and V assets placed into service in December 2018 combined with higher interruptible volumes on the Ruby Pipeline. Revenue volumes include 141 mboe/d (2018: 143 mboe/d) related to Alliance and 103 mboe/d (2018: 89 mboe/d) related to Ruby. |
Adjusted EBITDA(2) | ▲
| $151 million increase primarily due to the increase in revenues, partially offset by the increase in operating expenses, discussed above, combined with higher general & administrative and other expenses due to the larger asset base. Included in adjusted EBITDA is $328 million (2018: $342 million) related to Alliance and $202 million (2018: $191 million) related to Ruby. |
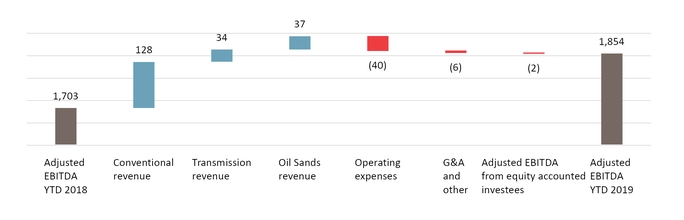
Bridge Analysis of Adjusted EBITDA(2) ($ millions)
| |
(1) | Includes inter-division transactions. See Note 20 of the Consolidated Financial Statements. |
| |
(2) | Refer to the "Non-GAAP Measures" section. |
| |
(3) | Revenue volumes. See "Abbreviations" for definition. |
Pembina Pipeline Corporation 2019 Annual Report 10
Operational Overview
|
| | | | | | | | | | | | | | | | | | | | | | | | |
| | 3 Months Ended December 31 | 12 Months Ended December 31 |
| | 2019 | 2018 | 2019 | 2018 |
| ($ millions, except where noted) | Volumes(1) |
| Gross Profit |
| Adjusted EBITDA(2) |
| Volumes(1) |
| Gross Profit |
| Adjusted EBITDA(2) | Volumes(1) |
| Gross Profit |
| Adjusted EBITDA(2) |
| Volumes(1) |
| Gross Profit |
| Adjusted EBITDA(2) |
|
| Pipelines | | | | | | | | | | | | |
| Conventional | 958 |
| 216 |
| 253 |
| 897 |
| 182 |
| 215 |
| 910 |
| 849 |
| 993 |
| 878 |
| 776 |
| 907 |
|
| Transmission | 646 |
| 96 |
| 173 |
| 566 |
| 86 |
| 162 |
| 591 |
| 384 |
| 684 |
| 570 |
| 352 |
| 643 |
|
| Oil Sands | 1,063 |
| 33 |
| 41 |
| 1,066 |
| 33 |
| 40 |
| 1,065 |
| 143 |
| 177 |
| 1,073 |
| 127 |
| 153 |
|
| Total | 2,667 |
| 345 |
| 467 |
| 2,529 |
| 301 |
| 417 |
| 2,566 |
| 1,376 |
| 1,854 |
| 2,521 |
| 1,255 |
| 1,703 |
|
| |
(1) | Revenue volumes. See "Abbreviations" for definition. |
| |
(2) | Refer to the "Non-GAAP Measures" section. |
Projects & New Developments(1)
Pipelines continues to focus on the execution of various system expansions. The projects in the following table were recently placed into service and impact Pipelines results. |
| |
| Significant Projects | In-service Date |
| Phase V Peace Pipeline Expansion | December 2018 |
| Phase IV Peace Pipeline Expansion | December 2018 |
As previously announced, during the quarter, Pembina approved the first stage of an additional expansion of the Peace Pipeline System ("Phase IX"), which will add additional capacity in the northwest Alberta to Gordondale corridor to accommodate increased activity in the Montney. This expansion has an estimated cost of approximately $100 million and is supported by 10-year contracts with predominantly investment grade counterparties under significant take-or-pay provisions. This portion of the Phase IX expansion allows Pembina to fully utilize approximately 100 mbpd of latent capacity that will be created on Peace Pipeline east of La Glace as a result of the Phase VII and VIII expansions. Once this expansion is completed, Pembina will have achieved segregated liquids transportation service for ethane-plus, propane-plus, crude and condensate across multiple pipeline systems between Gordondale and the Edmonton, Alberta area. Phase IX is anticipated to be placed into service in the fourth quarter of 2021, subject to regulatory and environmental approvals.
Pembina continues to evaluate the need for additional pump stations in the Fox Creek to Namao corridor to achieve Pembina's fully powered-up market delivery capacity of 1.3 mmbpd across the Peace and Northern systems. Engineering is currently underway and based on further commercial support, the scope of Phase IX may be revised in the future to include these projects. In addition, the elimination of batching and other hydraulic optimization initiatives, which Pembina refers to as Phase X, could create up to an incremental 100 mbpd of capacity with minimal capital spending.
Collectively, the projects in Pipelines are trending on budget. The following outlines the significant projects currently underway and new developments within Pipelines:
|
| | |
| Phase VI Peace Pipeline Expansion | | |
Capital Budget: $280 million | In-service Date: In stages starting first quarter of 2020 through mid-2020 | Status: Initial stage is delayed, trending over budget |
| This expansion includes upgrades at Gordondale; a 16-inch pipeline in the La Glace to Wapiti corridor and associated pump station and terminal upgrades; and a 20-inch pipeline in the Kakwa to Lator corridor. Commissioning of the first stage of the expansion is underway and construction of the second stage is ongoing. |
|
| | |
| Phase VII Peace Pipeline Expansion | | |
Capital Budget: $950 million | In-service Date: First half of 2021 | Status: On time, trending under budget |
| This expansion is expected to add approximately 240 mbpd of incremental capacity upstream of Fox Creek, accessing capacity available on the pipelines downstream of Fox Creek. Included in the expansion is a 20-inch, approximately 220-kilometer pipeline in the La Glace-Valleyview-Fox Creek corridor, as well as six new pump stations or terminal upgrades, between La Glace and Edmonton, Alberta. Pipeline construction commenced in January 2020. |
11 Pembina Pipeline Corporation 2019 Annual Report
|
| | |
| Phase VIII Peace Pipeline Expansion | | |
Capital Budget: $500 million | In-service Date(2): In stages starting in 2020 through the first half of 2022 | Status: On time, trending on budget |
| This expansion will include 10-inch and 16-inch pipelines in the Gordondale to La Glace corridor as well as six new pump stations or terminal upgrades located between Gordondale and Fox Creek. Engineering work is progressing as planned to support a construction start date in the second half of 2020. |
|
| | |
| Phase IX Peace Pipeline Expansion | | |
Capital Budget: $100 million | In-service Date(2): Fourth quarter of 2021 | Status: On time, trending on budget |
| This expansion currently will include 6-inch and 16-inch pipelines debottlenecking the corridor north of Gordondale as well as upgrades at one pump station. In addition, this expansion will see existing pipelines, which are currently batching, converted to single product lines. Engineering work is progressing as planned. |
|
| | |
| NEBC Montney Infrastructure | | |
Capital Budget: Not disclosed separately(3) | In-service Date: Complete and awaiting a third-party downstream connection | Status: On time, on budget |
| This infrastructure includes producer tie-in connections to Pembina's Birch Terminal as well as upgrades to the terminal including additional storage and pumps, along with minor site modifications. Construction on the new facilities and associated lateral is complete. |
|
| | |
| Wapiti Condensate Lateral | | |
Capital Budget: Not disclosed separately(3) | In-service Date: First quarter of 2020 | Status: Delayed, trending on budget |
| This is a 12-inch lateral, which will connect growing condensate volumes from a third-party owned facility in the Pipestone Montney region into Pembina's Peace Pipeline. Construction is complete and commissioning is underway. |
| |
(1) | For further details on Pembina's significant assets, including definitions, refer to Pembina's Annual Information Form for the year ended December 31, 2019 (the "AIF") filed at www.sedar.com (filed with the U.S. Securities and Exchange Commission at www.sec.gov under Form 40-F) and on Pembina's website at www.pembina.com. |
| |
(2) | Subject to environmental and regulatory approvals. See the "Forward-Looking Statements & Information" section. |
| |
(3) | Combined capital budget is $120 million. |
Pembina Pipeline Corporation 2019 Annual Report 12
Facilities
Financial Overview Three Months Ended December 31
Results of Operations
|
| | | | | | | | |
| ($ millions, except where noted) | 2019 |
| 2018 |
| Change |
| % Change |
|
Gas Services net revenue(1)(2)(3) | 152 |
| 138 |
| 14 |
| 10 |
|
NGL Services net revenue(1)(2)(3) | 133 |
| 127 |
| 6 |
| 5 |
|
Facilities net revenue(1)(2)(3) | 285 |
| 265 |
| 20 |
| 8 |
|
Operating expenses(1) | 80 |
| 87 |
| (7 | ) | (8 | ) |
| Share of profit from equity accounted investees | 14 |
| 16 |
| (2 | ) | (13 | ) |
| Depreciation and amortization included in operations | 50 |
| 39 |
| 11 |
| 28 |
|
| Gross profit | 169 |
| 155 |
| 14 |
| 9 |
|
Adjusted EBITDA(3) | 254 |
| 233 |
| 21 |
| 9 |
|
Volumes (mboe/d)(4) | 910 |
| 924 |
| (14 | ) | (2 | ) |
| Distributions from equity accounted investees | 21 |
| 39 |
| (18 | ) | (46 | ) |
|
| | |
| Changes in Results | | |
Gas Services net revenue(1)(2)(3) | ▲ | Increase is largely attributable to revenues associated with Duvernay II being placed into service in November 2019, combined with increased take-or-pay revenues at Kakwa River. |
NGL Services net revenue(1)(2)(3) | ▲ | Increase primarily due to Redwater Co-generation and Burstall Ethane Storage going into service in March 2019 and January 2019, respectively, combined with additional revenues from the Vancouver Wharves following the Kinder Acquisition, partially offset by lower supply volumes at the Redwater Complex. |
Operating expenses(1) | ▲ | Decrease largely due to a refund adjustment from a third-party, combined with a reduction in power costs following Redwater Co-generation going into service in March 2019, partially offset by higher labour costs as a result of Burstall Ethane Storage and Redwater Co-generation going into service. |
| Share of profit from equity accounted investees | ● | Consistent with prior period. |
| Depreciation and amortization included in operations | ▼ | Increase primarily due to Redwater Co-generation and Burstall Ethane Storage going into service in March 2019 and January 2019, respectively. |
| Distributions from equity accounted investees | ▼ | $21 million consists of $20 million (2018: $38 million) from Veresen Midstream and $1 million (2018: $1 million) from Fort Corp. The decrease in the Veresen Midstream distribution is primarily due to the conversion of Veresen Midstream Class B Units to Class A Units by Pembina's joint venture partner, reducing Pembina's distribution to its ownership percentage. |
Volumes (mboe/d)(4) | ▼ | Decrease in revenue volumes primarily due to lower supply volumes at the Redwater Complex, combined with decreased volumes from Veresen Midstream's Dawson facilities due to lower volumes, partially offset by additional volumes associated with Duvernay II being placed into service. Revenue volumes include 88 mboe/d (2018: 97 mboe/d) related to Veresen Midstream. |
Adjusted EBITDA(3) | ▲ | $21 million increase primarily due to higher net revenues and lower operating expenses, discussed above, partially offset by lower revenues from Veresen Midstream, due to lower volumes. Included in adjusted EBITDA is $48 million (2018: $54 million) related to Veresen Midstream. |
Bridge Analysis of Adjusted EBITDA(3) ($ millions)
| |
(1) | Includes inter-division transactions. See Note 20 of the Consolidated Financial Statements. |
| |
(2) | Revenue and cost of goods sold reported for all 2018 periods have been restated to reflect updated presentation for 2019, where the majority of cost of goods sold and corresponding revenues are reported in Marketing & New Ventures. |
| |
(3) | Refer to the "Non-GAAP Measures" section. |
| |
(4) | Revenue volumes. See "Abbreviations" for definition. |
13 Pembina Pipeline Corporation 2019 Annual Report
Financial Overview 12 Months Ended December 31
Results of Operations
|
| | | | | | | | |
| ($ millions, except where noted) | 2019 |
| 2018 |
| Change |
| % Change |
|
Gas Services net revenue(1)(2)(3) | 588 |
| 546 |
| 42 |
| 8 |
|
NGL Services net revenue(1)(2)(3) | 529 |
| 460 |
| 69 |
| 15 |
|
Facilities net revenue(1)(2)(3) | 1,117 |
| 1,006 |
| 111 |
| 11 |
|
Operating expenses(1) | 344 |
| 313 |
| 31 |
| 10 |
|
| Share of profit from equity accounted investees | 50 |
| 30 |
| 20 |
| 67 |
|
| Depreciation and amortization included in operations | 168 |
| 149 |
| 19 |
| 13 |
|
| Gross profit | 655 |
| 574 |
| 81 |
| 14 |
|
Adjusted EBITDA(3) | 955 |
| 880 |
| 75 |
| 9 |
|
Volumes (mboe/d)(4) | 885 |
| 877 |
| 8 |
| 1 |
|
| Distributions from equity accounted investees | 101 |
| 133 |
| (32 | ) | (24 | ) |
|
| | |
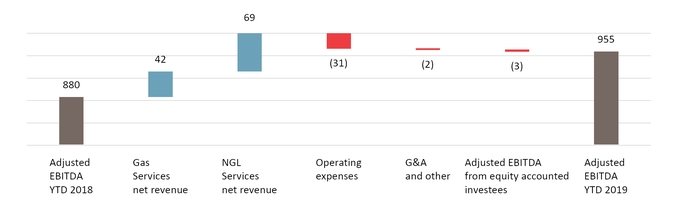
| Changes in Results | | |
Gas Services net revenue(1)(2)(3) | ▲
| Increase is largely attributable to higher operating expense recoveries as a result of higher power and repairs and maintenance costs, increased demand at the Saturn Complex and Cutbank Complex and Duvernay II being placed into service in November 2019. |
NGL Services net revenue(1)(2)(3) | ▲
| Increase primarily due to increased terminalling revenues for propane and butane, the contribution from Redwater Co-generation and Burstall Ethane Storage going into service March 2019 and January 2019, respectively. |
Operating expenses(1) | ▼
| Increase due to higher power consumption from Burstall Ethane Storage being placed into service, increased repairs and maintenance, higher power pool prices and increased labour costs as a result of a larger headcount associated with new assets placed into service, partially offset by a reduction in the Redwater Complex power costs following Redwater Co-generation going into service in March 2019. |
| Share of profit from equity accounted investees | ▲ | Increase mainly due to a $24 million finance gain reversal recorded in 2018, partially offset by a one-time revenue adjustment of $5 million related to Veresen Midstream's Dawson facilities. |
| Depreciation and amortization included in operations | ▼ | Increase primarily due to Redwater Co-generation and Burstall Ethane Storage going into service March 2019 and January 2019, respectively. |
| Distributions from equity accounted investees | ▼ | $101 million consists of $96 million (2018: $124 million) from Veresen Midstream and $5 million (2018: $9 million) from Fort Corp. The decrease in distributions from Veresen Midstream is due to the same reasons mentioned above. |
Volumes (mboe/d)(4) | ▲
| Increase primarily due to additional volumes from Veresen Midstream due to the North Central Liquids Hub being placed into service in June 2018 and higher volumes at the Saturn Complex and Cutbank Complex, partially offset by lower volumes at the Younger facility due to third-party outages and lower volumes at the Redwater Complex. Revenue volumes include 88 mboe/d (2018: 81 mboe/d) related to Veresen Midstream. |
Adjusted EBITDA(3) | ▲
| $75 million increase primarily due to strong NGL Services and Gas Services revenues, partially offset by higher operating expenses, discussed above. Included in adjusted EBITDA is $182 million (2018: $183 million) related to Veresen Midstream. |
Bridge Analysis of Adjusted EBITDA(3) ($ millions)
| |
(1) | Includes inter-division transactions. See Note 20 of the Consolidated Financial Statements. |
| |
(2) | Revenue and cost of goods sold reported for all 2018 periods have been restated to reflect updated presentation for 2019, where the majority of cost of goods sold and corresponding revenues are reported in Marketing & New Ventures. |
| |
(3) | Refer to the "Non-GAAP Measures" section. |
| |
(4) | Revenue volumes. See "Abbreviations" for definition. |
Pembina Pipeline Corporation 2019 Annual Report 14
Operational Overview
|
| | | | | | | | | | | | | | | | | | | | | | | | |
| | 3 Months Ended December 31 | 12 Months Ended December 31 |
| | 2019 | 2018 | 2019 | 2018 |
| ($ millions, except where noted) | Volumes(1) |
| Gross Profit |
| Adjusted EBITDA(2) |
| Volumes(1) |
| Gross Profit |
| Adjusted EBITDA(2) |
| Volumes(1) |
| Gross Profit |
| Adjusted EBITDA(2) |
| Volumes(1) |
| Gross Profit |
| Adjusted EBITDA(2) |
|
| Facilities | | | | | | | | | | | | |
| Gas Services | 690 |
| 90 |
| 146 |
| 683 |
| 83 |
| 142 |
| 678 |
| 337 |
| 551 |
| 664 |
| 301 |
| 537 |
|
| NGL Services | 220 |
| 79 |
| 108 |
| 241 |
| 72 |
| 91 |
| 207 |
| 318 |
| 404 |
| 213 |
| 273 |
| 343 |
|
| Total | 910 |
| 169 |
| 254 |
| 924 |
| 155 |
| 233 |
| 885 |
| 655 |
| 955 |
| 877 |
| 574 |
| 880 |
|
| |
(1) | Revenue volumes. See "Abbreviations" for definition. |
| |
(2) | Refer to the "Non-GAAP Measures" section. |
Projects & New Developments
Facilities continues to build-out its natural gas and NGL processing and fractionation assets to service customer demand. The projects in the following table were recently placed into service and impact Facilities results. |
| |
Significant Projects(1) | In-service Date |
| Duvernay II | November 2019 |
| Redwater Co-generation | March 2019 |
| Burstall Ethane Storage | January 2019 |
| Rail Yard Expansion | December 2018 |
| Cavern Storage | Throughout 2018 |
Veresen Midstream(2) | |
| North Central Liquids Hub | June 2018 |
| Saturn Phase II Gas Plant | January 2018 |
As previously announced, Pembina approved the development of a $120 million co-generation facility at the Empress NGL Extraction facility (the "Empress Co-generation Facility"). The Empress Co-generation Facility will reduce overall operating costs and greenhouse gas emissions by providing power and heat to the extraction and fractionation facilities and has an expected in-service date in mid-2022, subject to regulatory and environmental approval.
As previously announced, the anticipated startup of the Prince Rupert LPG Export Terminal has generated significant interest from our customers and offtakers and Pembina has decided to move forward with an expansion of the terminal (the "Prince Rupert Terminal Expansion"), which will increase propane export capacity to approximately 40 mbpd. The Prince Rupert Terminal Expansion is expected to cost approximately $175 million and has an anticipated in-service date in the first half of 2023, subject to regulatory and environmental approvals.
As previously announced, in conjunction with the Hythe Developments project, Veresen Midstream entered into a contract with NuVista Energy ("NuVista") whereby NuVista retained an option to have Veresen Midstream own and fund the Pipestone North compressor station in exchange for an annual capital fee. NuVista has elected to exercise their option. As planned, NuVista will build and operate the compressor station. Upon completion the compressor station will be transfered at cost to Pembina. As a result of NuVista’s election, the capital budget for the Hythe Developments project has increased from $185 million to $240 million, net to Pembina.
Collectively, the projects in Facilities are trending on budget.
15 Pembina Pipeline Corporation 2019 Annual Report
The following outlines the projects currently underway and new developments within Facilities:
|
| | |
| Duvernay III | | |
Capital Budget: $200 million | In-service Date: Mid to late 2020 | Status: On time, trending on budget |
| Duvernay III is the second tranche of infrastructure development under the 20-year infrastructure development and service agreement with Chevron Canada Limited and Kuwait Foreign Petroleum Exploration Company. This development includes a 100 MMcf/d sweet gas, shallow cut processing train, 20 mbpd of inlet condensate stabilization and other associated infrastructure. Detailed design is complete, long-lead equipment fabrication is nearing completion and piling has been completed on site. Based on the customers' request for additional infrastructure the capital cost of this project was increased from the original cost of $175 million. |
|
| | |
| Duvernay Sour Treatment Facilities | | |
Capital Budget: $65 million | In-service Date: First quarter of 2020 | Status: On time, trending on budget |
| Sour gas treating facilities at the Duvernay Complex including 150 MMcf/d sour gas sweetening system with 300 MMcf/d of amine regeneration capability and up to one tonne of sulphur per day of acid gas incineration. Construction was completed in mid-February and commissioning is currently progressing. |
|
| | |
| Prince Rupert Terminal | | |
Capital Budget: $250 million | In-service Date(3): Second half of 2020 | Status: On time, trending over budget |
| The Prince Rupert Terminal is located on Watson Island, British Columbia and is expected to have a permitted capacity of approximately 25 mbpd of propane. The propane supply will be sourced primarily from the Company's Redwater Complex. Facility mechanical construction continues with modules setting, equipment install and piping work well underway. On site sphere assembly is nearly complete and marine retrofit work on the wharf is progressing. |
|
| | |
| Prince Rupert Terminal Expansion | | |
Capital Budget: $175 million | In-service Date(3): First half of 2023 | Status: On time, trending on budget |
The Prince Rupert Terminal Expansion will increase propane export capacity to approximately 40 mbpd. Front End Engineering Design ("FEED") work has started. |
|
| | |
| Hythe Developments | | |
Capital Budget(4): $240 million | In-service Date: Late 2020 | Status: On time, trending on budget |
| Pembina and its 45 percent owned joint venture, Veresen Midstream, will construct natural gas gathering and processing infrastructure in the Pipestone Montney region. The infrastructure consists of an expansion of up to 125 MMcf/d (56 MMcf/d net to Pembina) of sour gas processing at Veresen Midstream's existing Hythe facility and a new, approximately 60 km, 12-inch sour gas pipeline, to be owned by Veresen Midstream and constructed by Pembina. In addition, Veresen Midstream will fund and own a compressor station, built and operated by NuVista and various laterals will be owned and constructed by Pembina. All long-lead equipment has been ordered and construction has commenced. |
|
| | |
| Empress Infrastructure | | |
Capital Budget: $120 million | In-service Date: Late 2020 | Status: On time, trending on budget |
| This expansion will add new fractionation and terminalling facilities, which are expected to add approximately 30 mbpd of propane-plus fractionation capacity to Pembina's Empress NGL Extraction Facility. Mechanical construction is progressing on the fractionation and rail sites. Electrical construction has commenced on both sites. Pipeline construction began in February and rail track construction is expected to commence in May 2020. |
|
| | |
| Empress Co-generation | | |
Capital Budget: $120 million | In-service Date(3): Mid-2022 | Status: On time, trending on budget |
| This project enables Pembina to be more efficient with its production, utilize heat recovery and provide a second source of power through the installation of a co-generation unit at the Empress NGL Extraction Facility. FEED work was completed in the fourth quarter of 2019 and detailed engineering started in January 2020. |
| |
(1) | For further details on Pembina's significant assets, including definitions, refer to Pembina's AIF filed at www.sedar.com (filed with the U.S. Securities and Exchange Commission at www.sec.gov under Form 40-F) and on Pembina's website at www.pembina.com. |
| |
(2) | Investment in equity accounted investee, which Pembina has a 45 percent interest in as of December 31, 2019. Results from Veresen Midstream impact share of profit from equity accounted investees and proportionally consolidated metrics. See Note 10 to the Consolidated Financial Statements. |
| |
(3) | Subject to environmental and regulatory approvals. See the "Forward-Looking Statements & Information" section. |
Pembina Pipeline Corporation 2019 Annual Report 16
Marketing & New Ventures
Financial Overview Three Months Ended December 31
Results of Operations
|
| | | | | | | | |
| ($ millions, except where noted) | 2019 |
| 2018 |
| Change |
| % Change |
|
Marketing revenue(1)(2) | 1,092 |
| 1,163 |
| (71 | ) | (6 | ) |
Cost of goods sold(1)(2) | 989 |
| 1,087 |
| (98 | ) | (9 | ) |
Net revenue(1)(3) | 103 |
| 76 |
| 27 |
| 36 |
|
| Share of profit from equity accounted investees | 13 |
| 39 |
| (26 | ) | (67 | ) |
| Realized gain on commodity-related derivative financial instruments | (8 | ) | (5 | ) | 3 |
| (60 | ) |
| Unrealized loss (gain) on commodity-related derivative financial instruments | 23 |
| (89 | ) | (112 | ) | 126 |
|
| Depreciation and amortization included in operations | 8 |
| 6 |
| 2 |
| 33 |
|
| Gross profit | 93 |
| 203 |
| (110 | ) | (54 | ) |
Adjusted EBITDA(3) | 120 |
| 109 |
| 11 |
| 10 |
|
Volumes (mboe/d)(4) | 190 |
| 201 |
| (11 | ) | (5 | ) |
| Distributions from equity accounted investees | 22 |
| 31 |
| (9 | ) | (29 | ) |
|
| | |
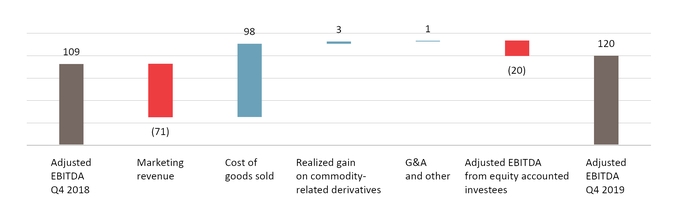
| Change in Results | | |
Marketing revenue(1)(2) | ▼ | Decrease due to lower marketed NGL volumes, combined with lower crude and NGL prices during the fourth quarter of 2019. |
Cost of goods sold(1)(2) | ▲ | Decrease due to lower crude and NGL prices, lower NGL sales and the $11 million impact of adopting IFRS 16 that reduced cost of goods sold and increased depreciation and finance costs. |
| Share of profit from equity accounted investees | ▼ | Decrease largely due to lower propane margins at Aux Sable resulting from a decrease in sales prices, combined with a narrower Chicago-AECO natural gas differential. |
| Realized gain on commodity-related derivatives | ● | Consistent realized gains relating to the settlement of NGL-based derivatives. |
| Unrealized loss (gain) on commodity-related derivatives | ▼ | Unrealized loss primarily due to an increase in the forward price of crude and NGL which drove the associated derivative contracts into a loss position. |
| Depreciation and amortization included in operations | ● | $9 million of additional depreciation was recognized on leased rail cars following the adoption of IFRS 16, offset by a decrease in amortization due to certain fully amortized intangibles. |
| Distributions from equity accounted investees | ▼ | Decrease of $9 million due to the lower margins at Aux Sable, discussed in share of profit from equity accounted investees above. |
Volumes (mboe/d)(4) | ▼ | NGL sales volumes decreased due to lower supply volumes from the Redwater Complex, combined with higher butane sales made in the fourth quarter of 2018, partially offset by increased volumes at Aux Sable. Revenue volumes includes 32 mboe/d (2018: 28 mboe/d) related to Aux Sable. |
Adjusted EBITDA(3) | ▲ | Increase due to higher margins on crude and the $11 million impact of the adoption of IFRS 16, partially offset by lower a contribution from Aux Sable and higher general & administrative and other expenses in New Ventures. Included in adjusted EBITDA is $18 million (2018: $34 million) related to Aux Sable. |
Bridge Analysis of Adjusted EBITDA(3) ($ millions)
| |
(1) | Includes inter-division transactions. See Note 20 of the Consolidated Financial Statements. |
| |
(2) | Revenue and cost of goods sold reported for all 2018 periods have been restated to reflect updated presentation for 2019, where the majority of cost of goods sold and corresponding revenues are reported in Marketing & New Ventures. |
| |
(3) | Refer to the "Non-GAAP Measures" section. |
| |
(4) | Marketed NGL volumes. See "Abbreviations" for definition. |
17 Pembina Pipeline Corporation 2019 Annual Report
Financial Overview 12 Months Ended December 31
Results of Operations
|
| | | | | | | | |
| ($ millions, except where noted) | 2019 |
| 2018 |
| Change |
| % Change |
|
Marketing revenue(1)(2) | 4,804 |
| 5,175 |
| (371 | ) | (7 | ) |
Cost of goods sold(1)(2) | 4,417 |
| 4,789 |
| (372 | ) | (8 | ) |
Net revenue(1)(3) | 387 |
| 386 |
| 1 |
| — |
|
| Share of profit from equity accounted investees | 50 |
| 102 |
| (52 | ) | (51 | ) |
| Realized (gain) loss on commodity-related derivative financial instruments | (33 | ) | 51 |
| 84 |
| 165 |
|
| Unrealized loss (gain) on commodity-related derivative financial instruments | 13 |
| (73 | ) | (86 | ) | 118 |
|
| Depreciation and amortization included in operations | 51 |
| 26 |
| 25 |
| 96 |
|
| Gross profit | 406 |
| 484 |
| (78 | ) | (16 | ) |
Adjusted EBITDA(3) | 423 |
| 409 |
| 14 |
| 3 |
|
Volumes (mboe/d)(4) | 189 |
| 175 |
| 14 |
| 8 |
|
| Distributions from equity accounted investees | 84 |
| 109 |
| (25 | ) | (23 | ) |
|
| | |
| Change in Results | | |
Marketing revenue(1)(2) | ▼ | Decrease primarily due to lower NGL and crude prices, partially offset by higher NGL sales volumes and a $33 million arbitration award payment that was resolved during the first quarter of 2019. |
Cost of goods sold(1)(2) | ▲
| Decrease largely due to lower crude and NGL market prices, discussed above, combined with a $41 million adjustment on the adoption of IFRS 16 that reduced cost of goods sold and increased depreciation and finance costs. |
| Share of profit from equity accounted investees | ▼ | Decrease due to lower propane margins at Aux Sable resulting from lower sales prices during 2019 and narrower Chicago-AECO natural gas differential, combined with an outage during June 2019 to complete regular maintenance at Aux Sable. |
| Realized (gain) loss on commodity-related derivatives | ▲ | Increase due to decreasing market prices creating a gain for NGL and crude-based derivatives settled during the period. |
| Unrealized loss (gain) on commodity-related derivatives | ▼ | Unrealized loss primarily due to crude and NGL contracts maturing in the period. |
| Depreciation and amortization included in operations | ▼ | Increase largely due to $36 million of depreciation on leased rail cars, which are recognized as a right-of-use asset and depreciated following the adoption of IFRS 16, partially offset by a decrease in amortization due to fully amortized intangibles. |
| Distributions from equity accounted investees | ▼ | Decrease of $25 million largely due to the lower margins at Aux Sable, discussed in share of profit from equity accounted investees above. |
Volumes (mboe/d)(4) | ▲ | Increased NGL sales volumes primarily driven by higher butane volumes, partially offset by lower ethane volumes at Aux Sable. Revenue volumes includes 33 mboe/d (2018: 35 mboe/d) related to Aux Sable. |
Adjusted EBITDA(3) | ▲ | Increase primarily due to higher realized gains on commodity-related derivatives, combined with the $41 million impact of the adoption of IFRS 16 and lower general & administrative and other expenses in New Ventures, offset by lower margins after adjusting for the $33 million arbitration award payment discussed above. Included in adjusted EBITDA is $74 million (2018: $114 million) related to Aux Sable. |
Bridge Analysis of Adjusted EBITDA(3)(5)($ millions)
| |
(1) | Includes inter-division transactions. See Note 20 of the Consolidated Financial Statements. |
| |
(2) | Revenue and cost of goods sold reported for all 2018 periods have been restated to reflect updated presentation for 2019, where all cost of goods sold and corresponding revenues are reported in Marketing & New Ventures. |
| |
(3) | Refer to the "Non-GAAP Measures" section. |
| |
(4) | Marketed NGL volumes. See "Abbreviations" for definition. |
| |
(5) | Marketing revenue excludes the positive arbitration award payment of $33 million. |
Pembina Pipeline Corporation 2019 Annual Report 18
Operational Overview
|
| | | | | | | | | | | | | | | | | | | | | | | | |
| | 3 Months Ended December 31 | 12 Months Ended December 31 |
| | 2019 | 2018 | 2019 | 2018 |
| ($ millions, except where noted)(unaudited) | Volumes(1) |
| Gross Profit |
| Adjusted EBITDA(2) |
| Volumes(1) |
| Gross Profit |
| Adjusted EBITDA(2) |
| Volumes(1) |
| Gross Profit |
| Adjusted EBITDA(2) |
| Volumes(1) |
| Gross Profit |
| Adjusted EBITDA(2) |
|
| Marketing & New Ventures | | | | | | | | | | | | |
| Marketing | 190 |
| 96 |
| 127 |
| 201 |
| 203 |
| 111 |
| 189 |
| 407 |
| 440 |
| 175 |
| 484 |
| 432 |
|
New Ventures(3) | — |
| (3 | ) | (7 | ) | — |
| — |
| (2 | ) | — |
| (1 | ) | (17 | ) | — |
| — |
| (23 | ) |
| Total | 190 |
| 93 |
| 120 |
| 201 |
| 203 |
| 109 |
| 189 |
| 406 |
| 423 |
| 175 |
| 484 |
| 409 |
|
| |
(1) | Marketed NGL volumes. Volumes are stated in mboe/d. |
| |
(2) | Refer to the "Non-GAAP Measures" section. |
| |
(3) | All New Ventures projects have not yet commenced operations and therefore have no volumes. |
Projects & New Developments
As previously announced, subsequent to the quarter, CKPC executed a lump sum engineering, procurement and construction ("EPC") contract related to the construction of the PDH plant within its integrated PDH/PP Facility. With this contract, CKPC has fixed approximately 60 percent of the cost of the PDH/PP Facility thus far. In conjunction with the execution of the lump sum contract, Pembina also revised its proportionate share of the capital cost of the PDH/PP Facility from $2.5 billion to $2.7 billion. Pembina now expects the PDH/PP Facility to be placed into commercial service in the second half of 2023.
Subsequent to the quarter, CKPC entered into a reimbursable engineering and procurement services contract with TR Canada E&C Inc. ("TR") for the PP plant. TR and its parent company, Técnicas Reunidas S.A., are well experienced in the design and engineering of PP and other petrochemical facilities. All major engineering and procurement contracts have now been awarded for the PDH/PP Facility.
Regulatory processes for the proposed Jordan Cove LNG Project are ongoing. Subsequent to the quarter, the U.S. Federal Energy Regulatory Commission delayed a decision originally expected on February 13, 2020. Pembina looks forward to obtaining a final decision. Pembina is focused on getting all the remaining permits required to proceed with this project. These permits are a critical component of the regulatory process and are necessary to enable the commercial viability of the project and allow this investment to move forward. The timing and ultimate approval of this project is uncertain and dependent upon receipt of these remaining approvals.
The following outlines the projects currently underway and new developments within Marketing & New Ventures: |
| | |
| PDH/PP Facility | |
Capital Budget(1): $2.7 billion | In-service Date: Second half of 2023 |
| The PDH/PP Facility will be located adjacent to Pembina's Redwater fractionation complex and will convert approximately 23,000 bpd of locally supplied propane into polypropylene, a high value recyclable polymer used in a wide range of finished products including but not limited to automobiles, medical devices, food packaging and home electronic appliances, among others. All long-lead equipment orders have been placed and early works site preparation continues to progress, with completion of that work targeted for the first half of 2020. All major engineering and procurement contracts have now been awarded for the PDH/PP Facility. |
|
| | |
| Jordan Cove LNG Project (proposed) | |
| The proposed Jordan Cove LNG project ("Jordan Cove") is a world-scale LNG export facility, which would transport North American natural gas to world markets. The project is made up of two parts: the LNG terminal, with a planned design capacity of 7.8 million tonnes per annum, and the Pacific Connector Gas pipeline which would transport natural gas from Malin, Oregon to an LNG terminal in Coos County, Oregon. |
| The carrying value of the project at December 31, 2019 is $352 million, including capitalized borrowing costs of $12 million. |
| In conjunction with a final investment decision, the Company intends to seek partners for both the Pacific Connector Gas Pipeline and LNG Terminal thereby reducing its 100 percent ownership interest to a net ownership interest of between 40 and 60 percent with the intention to reduce the capital, operating, and other project risks. |
19 Pembina Pipeline Corporation 2019 Annual Report
4. LIQUIDITY & CAPITAL RESOURCES
Available Sources of Liquidity
|
| | | | |
| As at December 31 | | |
| ($ millions) | 2019 |
| 2018 |
|
Working capital(1) | (470 | ) | (477 | ) |
Variable rate debt(2)(3) |
|
|
|
|
| Bank debt | 2,100 |
| 1,305 |
|
| Total variable rate debt outstanding (weighted average of 3.3% (2018: 3.2%)) | 2,100 |
| 1,305 |
|
Fixed rate debt(2) |
|
|
|
|
| Senior unsecured notes | 273 |
| 540 |
|
| Senior unsecured medium-term notes | 7,800 |
| 5,700 |
|
| Total fixed rate debt outstanding (weighted average of 4.0% (2018: 4.2%)) | 8,073 |
| 6,240 |
|
Finance lease liability(4) | — |
| 19 |
|
| Total debt outstanding | 10,173 |
| 7,564 |
|
| Cash and unutilized debt facilities | 1,040 |
| 2,372 |
|
| |
(1) | As at December 31, 2019, working capital includes $74 million (December 31, 2018: $480 million) associated with the current portion of loans and borrowings. |
| |
(3) | At December 31, 2019, US$454 million was drawn on the unsecured $2.5 billion revolving credit facility (December 31, 2018: nil). |
| |
(4) | Finance lease liabilities reported separately following the adoption of IFRS 16, see "Changes in Accounting Policies". |
Pembina anticipates its cash flow from operating activities, the majority of which is derived from fee-based contracts, will be more than sufficient to meet its short-term and long-term operating obligations, capital investment requirements and to fund its dividends. Pembina expects to source funds required for capital projects and contributions to investments in equity accounted investees from cash, its credit facilities and by accessing the capital markets, as required. Based on its successful access to financing in the capital markets over the past several years, Pembina expects to continue to have access to additional funds as required. Refer to "Risk Factors – Additional Financing and Capital Resources" below and Note 24 to the Consolidated Financial Statements for more information. Management remains satisfied that the leverage employed in Pembina's capital structure is sufficient and appropriate given the characteristics and operations of the underlying asset base.
Management may make adjustments to Pembina's capital structure as a result of changes in economic conditions or the risk characteristics of the underlying assets. To maintain or modify Pembina's capital structure in the future, Pembina may renegotiate new debt terms, repay existing debt, seek new borrowing, issue additional equity and/or repurchase shares.
As at December 31, 2019, Pembina's credit facilities consisted of an unsecured $2.5 billion (December 31, 2018: $2.5 billion) revolving credit facility, which includes a $750 million (December 31, 2018: $750 million) accordion feature and matures in May 2024, an unsecured $500 million (December 31, 2018: $1.0 billion) non-revolving term loan which matures in August 2022, and an operating facility of $20 million (December 31, 2018: $20 million) which is due in May 2020 and is typically renewed on an annual basis. There are no repayments due over the term of these facilities. On December 16, 2019, Pembina entered into an unsecured $500 million non-revolving term loan. On September 19, 2019, Pembina fully repaid an unsecured $1.0 billion (December 31, 2018: $1.0 billion) non-revolving term loan. As at December 31, 2019, Pembina had $1.0 billion (December 31, 2018: $2.4 billion) of cash and unutilized debt facilities. At December 31, 2019, Pembina had loans and borrowings (excluding deferred financing costs) of $10.2 billion (December 31, 2018: $7.5 billion). Pembina is required to meet certain specific and customary affirmative and negative financial covenants under its senior unsecured notes, medium-term notes, revolving credit facility, non-revolving term loan and operating facility, including a requirement to maintain certain financial ratios. Pembina is also subject to customary restrictions on its operations and activities under its notes and credit facilities, including restrictions on the granting of security, incurring indebtedness and the sale of its assets.
On January 10, 2020, Pembina closed an offering of $1.0 billion of senior unsecured medium-term notes. The fixed rate notes were used to partially repay the variable rate bank debt outstanding at December 31, 2019. See the "Financing Activity" section for further details of the notes issued.
Pembina Pipeline Corporation 2019 Annual Report 20
Covenants
Pembina's financial covenants include the following:
|
| | | | |
| Debt Instrument | Financial Covenant(1) | Ratio | Ratio at December 31, 2019 |
|
| Senior unsecured medium-term notes | Funded Debt to Capitalization | Maximum 0.70 | 0.38 |
|
| Revolving unsecured credit facility and non-revolving term loan | Debt to Capital | Maximum 0.65 | 0.37 |
|
| EBITDA to Senior Interest Coverage | Minimum 2.5:1.0 | 9.4 |
|
| |
(1) | Terms as defined in relevant agreements. |
In addition to the covenants discussed in the table above, Pembina has customary covenants on its other senior unsecured notes. Pembina was in compliance with all covenants under its notes and credit facilities as at December 31, 2019 (December 31, 2018: in compliance).
Pembina continues to actively monitor and reassess the creditworthiness of its counterparties. Financial assurances to mitigate and reduce risk may include guarantees, letters of credit and cash. Letters of credit totaling $90 million (December 31, 2018: $122 million) were held at December 31, 2019, primarily in respect of customer trade receivables.
Outstanding Share Data(1)
|
| | |
| Issued and outstanding (thousands) | February 24, 2020 |
|
| Common shares | 549,727 |
|
| Stock options | 16,536 |
|
| Stock options exercisable | 7,554 |
|
| Class A, Series 1 Preferred shares | 10,000 |
|
| Class A, Series 3 Preferred shares | 6,000 |
|
| Class A, Series 5 Preferred shares | 10,000 |
|
| Class A, Series 7 Preferred shares | 10,000 |
|
| Class A, Series 9 Preferred shares | 9,000 |
|
| Class A, Series 11 Preferred shares | 6,800 |
|
| Class A, Series 13 Preferred shares | 10,000 |
|
| Class A, Series 15 Preferred shares | 8,000 |
|
| Class A, Series 17 Preferred shares | 6,000 |
|
| Class A, Series 19 Preferred shares | 8,000 |
|
| Class A, Series 21 Preferred shares | 16,000 |
|
| Class A, Series 23 Preferred shares | 12,000 |
|
| Class A, Series 25 Preferred shares | 10,000 |
|
| |
(1) | Pembina's common shareholders and Class A preferred shareholders, by separate class votes, approved a special resolution to amend Pembina's articles to increase the limit on the number of Class A preferred shares Pembina is authorized to issue (the "Amendment"). Pembina filed Articles of Amendment effecting the Amendment on June 25, 2019. A copy of Pembina's articles can be found online at www.sedar.com. |
Financing Activity
On April 3, 2019, Pembina closed an offering of $800 million of senior unsecured medium-term notes. The offering was conducted in two tranches, consisting of $400 million in senior unsecured medium-term notes, series 12, having a fixed coupon of 3.62 percent per annum, paid semi-annually, and maturing on April 3, 2029 and $400 million in senior unsecured medium-term notes, series 13, having a fixed coupon of 4.54 percent per annum, paid semi-annually, and maturing on April 3, 2049.
On May 31, 2019, Pembina completed an extension on its unsecured $2.5 billion revolving credit facility, which now matures on May 31, 2024.
On June 13, 2019, Pembina's $200 million senior unsecured medium term note 4A matured and was fully repaid.
21 Pembina Pipeline Corporation 2019 Annual Report
On September 12, 2019, Pembina closed an offering of $1.5 billion of senior unsecured medium-term notes. The offering was conducted in three tranches, consisting of $600 million in senior unsecured medium-term notes, series 14, having a fixed coupon of 2.56 percent per annum, paid semi-annually, and maturing on June 1, 2023; $600 million in senior unsecured medium-term notes, series 15, having a fixed coupon of 3.31 percent per annum, paid semi-annually, and maturing on February 1, 2030; and $300 million issued through a re-opening of Pembina's senior unsecured medium-term notes, series 13, having a fixed coupon of 4.54 percent per annum, paid semi-annually, and maturing on April 3, 2049.
On September 19, 2019, Pembina fully-repaid its unsecured $1.0 billion non-revolving term loan.
On November 18, 2019, Pembina's $267 million senior unsecured note, series D, matured and was fully repaid.
On December 16, 2019, Pembina closed a $500 non-revolving term loan with certain existing lenders. The term loan has an initial term of three years and is pre-payable at Pembina's option. The other terms and conditions of the term loan, including financial covenants, are substantially similar to Pembina's $2.5 billion revolving credit facility.
On December 16, 2019, in connection with the Kinder Acquisition, the outstanding preferred shares of Kinder Morgan Canada were exchanged for Series 23 and 25 Class A preferred shares with similar terms and conditions as the shares previously issued by Kinder Morgan Canada. Dividends on the Series 23 and 25 Class A preferred shares will continue to be paid on the 15th day of February, May, August and November in each year, if, as and when declared by the Board of Directors.
Subsequent to year-end, on January 10, 2020, Pembina closed an offering of $1.0 billion of senior unsecured medium-term notes. The offering was conducted in three tranches, consisting of $250 million issued through a re-opening of Pembina's senior unsecured medium-term notes, series 10, having a fixed coupon of 4.02 percent per annum, paid semi-annually and maturing on March 27, 2028; $500 million issued through a re-opening of Pembina's senior unsecured medium-term notes, series 11, having a fixed coupon of 4.75 percent per annum, paid semi-annually and maturing on March 26, 2048; and $250 million issued through a re-opening of Pembina's senior unsecured medium-term notes, series 12, having a fixed coupon of 3.62 percent per annum, paid semi-annually and maturing on April 3, 2029.
Credit Ratings
The following information with respect to Pembina's credit ratings is provided as it relates to Pembina's financing costs and liquidity. Specifically, credit ratings affect Pembina's ability to obtain short-term and long-term financing and the cost of such financing. A reduction in the current ratings on Pembina's debt by its rating agencies, particularly a downgrade below investment-grade ratings, could adversely affect Pembina's cost of financing and its access to sources of liquidity and capital. In addition, changes in credit ratings and the associated costs may affect Pembina's ability to enter into normal course derivative or hedging transactions. Credit ratings are intended to provide investors with an independent measure of credit quality of any issues of securities. The credit ratings assigned by the rating agencies are not recommendations to purchase, hold or sell the securities, nor do the credit ratings comment on market price or suitability for a particular investor. Any credit rating may not remain in effect for a given period of time or may be revised or withdrawn entirely by a rating agency in the future if, in its judgment, circumstances so warrant.
Pembina targets strong 'BBB' credit ratings. DBRS Limited rates Pembina's senior unsecured notes and senior unsecured medium-term notes 'BBB' and Class A Preferred Shares Pfd-3. The long-term corporate credit rating from Standard & Poor's Rating Services, a division of the McGraw-Hill Companies, on Pembina is 'BBB' and its rating of the Class A Preferred Shares is P-3 (High).
Pembina Pipeline Corporation 2019 Annual Report 22
Contractual Obligations and Off-Balance Sheet Arrangements
Contractual Obligations
Pembina had the following contractual obligations outstanding at December 31, 2019: |
| | | | | | | | | | |
Contractual Obligations(1) | Payments Due By Period |
| ($ millions) | Total |
| Less than 1 year |
| 1 – 3 years |
| 3 – 5 years |
| After 5 years |
|
Leases(2) | 1,152 |
| 130 |
| 237 |
| 179 |
| 606 |
|
Loans and borrowings(3) | 14,565 |
| 477 |
| 2,379 |
| 3,337 |
| 8,372 |
|
Construction commitments(4) | 1,766 |
| 1,128 |
| 123 |
| 33 |
| 482 |
|
Other(5) | 659 |
| 109 |
| 158 |
| 93 |
| 299 |
|
| Total contractual obligations | 18,142 |
| 1,844 |
| 2,897 |
| 3,642 |
| 9,759 |
|
| |
(1) | Pembina enters into product purchase agreements and power purchase agreements to secure supply for future operations. Purchase prices of both NGL and power are dependent on current market prices. Volumes and prices for NGL and power contracts cannot be reasonably determined and therefore an amount has not been included in the contractual obligations schedule. Product purchase agreements range from one to 10 years and involve the purchase of NGL products from producers. Assuming product is available, Pembina has secured between 20 and 175 mbpd each year up to and including 2028. Power purchase agreements range from one to 25 years and involve the purchase of power from electrical service providers. The Company has secured up to 67 megawatts per day each year up to and including 2043. |
| |
(2) | Includes terminals, rail, office space, land and vehicle leases. |
| |
(3) | Excluding deferred financing costs. Including interest payments on senior unsecured notes. |
| |
(4) | Excluding significant projects that are awaiting regulatory approval at December 31, 2019, projects which Pembina is not committed to construct, and projects that are executed by equity accounted investees. See "Selected Equity Accounted Investee Information" for details regarding the nature of Pembina's commitments to fund equity accounted investees. |
| |
(5) | Includes $65 million in commitments related to leases that have not yet commenced. |
Pembina is, subject to certain conditions, contractually committed to the construction and operation of Phase VI, Phase VII, Duvernay III and Duvernay Sour Treatment Facilities, as well as certain pipeline connections and laterals and other corporate infrastructure. See "Forward-Looking Statements & Information".
Off-Balance Sheet Arrangements
Pembina does not believe it has any guarantees or off-balance sheet arrangements that have, or are reasonably likely to have, a current or future effect on Pembina's financial condition, results of operations, liquidity or capital expenditures.
Letters of Credit
Pembina has provided letters of credit to various third parties in the normal course of conducting business. The letters of credit include financial guarantees to counterparties for product purchases and sales, transportation services, utilities, engineering and construction services. The letters of credit have not had and are not expected to have a material impact on Pembina's financial position, earnings, liquidity or capital resources.
Pembina has $103 million (2018: $69 million) in letters of credit issued to facilitate commercial transactions with third parties and to support regulatory requirements.
23 Pembina Pipeline Corporation 2019 Annual Report
5. CAPITAL INVESTMENTS
|
| | | | | | | | |
| | 3 Months Ended December 31 | 12 Months Ended December 31 |
| ($ millions) | 2019 |
| 2018 |
| 2019 |
| 2018 |
|
| Pipelines | 254 |
| 187 |
| 892 |
| 711 |
|
| Facilities | 143 |
| 101 |
| 569 |
| 348 |
|
| Marketing & New Ventures | 22 |
| 46 |
| 157 |
| 134 |
|
| Corporate and other projects | 10 |
| 22 |
| 27 |
| 33 |
|
| Total capital | 429 |
| 356 |
| 1,645 |
| 1,226 |
|
Contributions to equity accounted investees(1)(2) | 120 |
| — |
| 263 |
| 58 |
|
| |
(1) | Contributions for the three months ended December 31, 2019, include $13 million (2018: nil) to Alliance, $23 million (2018: nil) to Veresen Midstream, $1 million (2018: nil) to Aux Sable and $83 million (2018: nil) to CKPC. |
| |
(2) | Contributions for the 12 months ended December 31, 2019, include $13 million (2018: nil) to Alliance, $73 million (2018: $56 million) to Veresen Midstream, $4 million (2018: $2 million) to Aux Sable and $173 million (2018: $nil) to CKPC. |
For the three months ended December 31, 2019, capital invested was $429 million, compared to $356 million during the corresponding three-month period of 2018. For the 12 months ended December 31, 2019, capital invested was $1.6 billion, compared to $1.2 billion during the corresponding period of 2018. In both 2019 and 2018, Pipelines capital investments were primarily related to Pembina's ongoing pipeline expansion projects. In 2019, Facilities capital investments were largely related to construction on Duvernay II, Empress Infrastructure and the Prince Rupert Terminal. In 2018, Facilities capital investments were largely related to construction of Duvernay II, Burstall Ethane Storage, Redwater Co-generation and the Prince Rupert Terminal. Capital investments in Marketing & New Ventures in both 2019 and 2018 were primarily related to the Jordan Cove LNG project.
Pembina Pipeline Corporation 2019 Annual Report 24
6. DIVIDENDS
Common Share Dividends
Common share dividends are payable if, as, and when declared by Pembina's Board of Directors. The amount and frequency of dividends declared and payable is at the discretion of the Board of Directors, which considers earnings, cash flow, capital requirements, the financial condition of Pembina and other relevant factors when making its dividend determination.
On May 2, 2019, Pembina's Board of Directors approved a five percent increase to its monthly common share dividend rate (from $0.19 per common share to $0.20 per common share), commencing with the dividend paid on June 14, 2019.
On December 16, 2019, upon closing of the Kinder Acquisition, Pembina's Board of Directors approved a $0.01 per common share increase to its monthly common share dividend rate (from $0.20 per common share to $0.21 per common share), commencing with the dividend paid on February 14, 2020.
Preferred Share Dividends
The holders of Pembina's Class A preferred shares are entitled to receive fixed cumulative dividends. Dividends on the Series 1, 3, 5, 7, 9, 11, 13 and 21 Class A preferred shares are payable quarterly on the first day of March, June, September and December, if, as and when declared by the Board of Directors of Pembina. Dividends on the Series 15, 17 and 19 Class A preferred shares are payable on the last day of March, June, September and December in each year, if, as and when declared by the Board of Directors. Dividends on the Series 23 and 25 Class A preferred shares are payable on the 15th day of February, May, August and November in each year, if, as and when declared by the Board of Directors.
On January 30, 2019, Pembina announced that it did not intend to exercise its right to redeem the six million Cumulative Redeemable Rate Reset Class A Preferred Shares, Series 3 ("Series 3 Shares") shares outstanding on March 1, 2019. The annual dividend rate for the Series 3 Shares for the five-year period from and including March 1, 2019 to, but excluding, March 1, 2024 is 4.478 percent.
On March 1, 2019, Pembina announced that it did not intend to exercise its right to redeem the six million Cumulative Redeemable Rate Reset Class A Preferred Shares, Series 17 ("Series 17 Shares") shares outstanding on March 31, 2019. The annual dividend rate for the Series 17 Shares for the five-year period from and including March 31, 2019 to, but excluding, March 31, 2024 is 4.821 percent.
On May 2, 2019, Pembina announced that it did not intend to exercise its right to redeem the 10 million Cumulative Redeemable Rate Reset Class A Preferred Shares, Series 5 ("Series 5 Shares") shares outstanding on June 3, 2019. The annual dividend rate for the Series 5 Shares for the five-year period from and including June 1, 2019 to, but excluding, June 1, 2024 is 4.573 percent.
On November 1, 2019, Pembina announced that it did not intend to exercise its right to redeem the 10 million Cumulative Redeemable Rate Reset Class A Preferred Shares, Series 7 ("Series 7 Shares") shares outstanding on December 2, 2019. The annual dividend rate for the Series 7 Shares for the five-year period from and including December 1, 2019 to, but excluding, December 1, 2024 is 4.38 percent.
25 Pembina Pipeline Corporation 2019 Annual Report
7. SELECTED QUARTERLY INFORMATION
Selected Quarterly Operating Information
|
| | | | | | | | | | | | | | | | |
| (mboe/d) | 2019 | 2018 |
| | Q4 |
| Q3 |
| Q2 |
| Q1 |
| Q4 |
| Q3 |
| Q2 |
| Q1 |
|
Volumes(1)(2) | | | | | | | | |
| Pipelines | | | | | | | | |
| Conventional Pipelines | 958 |
| 908 |
| 895 |
| 880 |
| 897 |
| 946 |
| 900 |
| 766 |
|
| Transmission Pipelines | 646 |
| 594 |
| 558 |
| 563 |
| 566 |
| 571 |
| 559 |
| 584 |
|
| Oil Sands Pipelines | 1,063 |
| 1,068 |
| 1,065 |
| 1,064 |
| 1,066 |
| 1,076 |
| 1,077 |
| 1,074 |
|
| Facilities | | | | | | | | |
| Gas Services | 690 |
| 672 |
| 668 |
| 682 |
| 683 |
| 669 |
| 650 |
| 636 |
|
| NGL Services | 220 |
| 194 |
| 198 |
| 214 |
| 241 |
| 203 |
| 199 |
| 206 |
|
| Total | 3,577 |
| 3,436 |
| 3,384 |
| 3,403 |
| 3,453 |
| 3,465 |
| 3,385 |
| 3,266 |
|
| |
(1) | Revenue volumes. See "Abbreviations" for definition. |
| |
(2) | Includes Pembina's proportionate share of results from equity accounted investees. |
Deferred Take-or-pay Revenue
|
| | | | | | | | | | | | | | | | |
| ($ millions) | 2019 | 2018 |
| | Q4 |
| Q3 |
| Q2 |
| Q1 |
| Q4 |
| Q3 |
| Q2 |
| Q1 |
|
| Pipelines | | | | | | | | |
| Opening balance | 17 |
| 23 |
| 19 |
| 7 |
| — |
| 26 |
| 35 |
| 8 |
|
| Revenue deferred | 31 |
| 27 |
| 27 |
| 36 |
| 34 |
| 33 |
| 35 |
| 32 |
|
| Revenue recognized | (40 | ) | (33 | ) | (23 | ) | (24 | ) | (27 | ) | (59 | ) | (44 | ) | (5 | ) |
| Ending take-or-pay contract liability balance | 8 |
| 17 |
| 23 |
| 19 |
| 7 |
| — |
| 26 |
| 35 |
|
| Facilities | | | | | | | | |
| Opening balance | — |
| — |
| 1 |
| 2 |
| 3 |
| — |
| 3 |
| — |
|
| Revenue deferred | — |
| — |
| 2 |
| — |
| — |
| 4 |
| 1 |
| 3 |
|
| Revenue recognized | — |
| — |
| (3 | ) | (1 | ) | (1 | ) | (1 | ) | (4 | ) | — |
|
| Ending take-or-pay contract liability balance | — |
| — |
| — |
| 1 |
| 2 |
| 3 |
| — |
| 3 |
|
Quarterly Segmented Adjusted EBITDA(1) ($ millions)
(1) Refer to "Non-GAAP Measures".
Pembina Pipeline Corporation 2019 Annual Report 26
Quarterly Financial Information |
| | | | | | | | | | | | | | | | |
| ($ millions, except where noted) | 2019 | 2018 |
| | Q4 |
| Q3 |
| Q2 |
| Q1 |
| Q4 |
| Q3 |
| Q2(2) |
| Q1 |
|
| Revenue | 1,754 |
| 1,700 |
| 1,808 |
| 1,968 |
| 1,726 |
| 2,045 |
| 1,743 |
| 1,837 |
|
Net revenue(1) | 837 |
| 751 |
| 758 |
| 774 |
| 706 |
| 742 |
| 669 |
| 719 |
|
| Operating expenses | 177 |
| 151 |
| 134 |
| 140 |
| 165 |
| 136 |
| 100 |
| 150 |
|
| Realized (gain) loss on commodity-related derivative financial instruments | (8 | ) | (5 | ) | (1 | ) | (19 | ) | (5 | ) | 29 |
| 9 |
| 18 |
|
| Share of profit from equity accounted investees | 88 |
| 89 |
| 97 |
| 96 |
| 129 |
| 110 |
| 96 |
| 76 |
|
| Gross profit | 603 |
| 613 |
| 629 |
| 588 |
| 663 |
| 585 |
| 511 |
| 568 |
|
| Earnings | 145 |
| 370 |
| 664 |
| 313 |
| 368 |
| 334 |
| 246 |
| 330 |
|
Earnings per common share – basic (dollars) | 0.21 |
| 0.66 |
| 1.23 |
| 0.55 |
| 0.66 |
| 0.60 |
| 0.43 |
| 0.59 |
|
Earnings per common share – diluted (dollars) | 0.21 |
| 0.66 |
| 1.23 |
| 0.55 |
| 0.66 |
| 0.60 |
| 0.42 |
| 0.59 |
|
| Cash flow from operating activities | 728 |
| 535 |
| 661 |
| 608 |
| 674 |
| 481 |
| 603 |
| 498 |
|
Cash flow from operating activities per common share – basic (dollars)(1) | 1.41 |
| 1.05 |
| 1.29 |
| 1.20 |
| 1.33 |
| 0.95 |
| 1.20 |
| 0.99 |
|
Adjusted cash flow from operating activities(1) | 576 |
| 530 |
| 550 |
| 578 |
| 543 |
| 523 |
| 558 |
| 530 |
|
Adjusted cash flow from operating activities per common share – basic (dollars)(1) | 1.11 |
| 1.04 |
| 1.08 |
| 1.14 |
| 1.07 |
| 1.03 |
| 1.11 |
| 1.05 |
|
Common shares outstanding (millions): | | | | | |
|
|
|
|
|
|
| Weighted average – basic | 518 |
| 512 |
| 511 |
| 509 |
| 507 |
| 506 |
| 504 |
| 503 |
|
| Weighted average – diluted | 519 |
| 513 |
| 513 |
| 511 |
| 509 |
| 509 |
| 508 |
| 508 |
|
| End of period | 548 |
| 512 |
| 511 |
| 510 |
| 508 |
| 506 |
| 504 |
| 503 |
|
| Common share dividends declared | 314 |
| 307 |
| 302 |
| 290 |
| 289 |
| 288 |
| 282 |
| 272 |
|
| Dividends per common share | 0.60 |
| 0.60 |
| 0.59 |
| 0.57 |
| 0.57 |
| 0.57 |
| 0.56 |
| 0.54 |
|
| Preferred share dividends declared | 34 |
| 31 |
| 30 |
| 31 |
| 31 |
| 30 |
| 31 |
| 30 |
|
| Capital expenditures | 429 |
| 421 |
| 434 |
| 361 |
| 356 |
| 291 |
| 255 |
| 324 |
|
| Contributions to equity accounted investees | 120 |
| 25 |
| 28 |
| 90 |
| — |
| — |
| — |
| 58 |
|
| Distributions from equity accounted investees | 123 |
| 142 |
| 140 |
| 170 |
| 158 |
| 170 |
| 168 |
| 126 |
|
Adjusted EBITDA(1) | 787 |
| 736 |
| 765 |
| 773 |
| 715 |
| 732 |
| 700 |
| 688 |
|
| |
(1) | Refer to the "Non-GAAP Measures" section. |
| |
(2) | Pembina corrected revenue and costs of goods sold in Marketing & New Ventures in 2018. The adjustments reduce revenue and cost of goods sold for the quarter ending June 30, 2018 ($202 million). There was no impact to earnings as a result of the adjustments. |
During the periods in the table above, Pembina's results were impacted by the following factors and trends:
| |
| • | The Kinder Acquisition on December 16, 2019; |
| |
| • | The narrowing of the Chicago-AECO natural gas differential; |
| |
| • | Increased production in key operating areas and resource plays within the WCSB (Deep Basin, Montney and Duvernay), which increased revenue and sales volumes on Pembina's existing assets in Pipelines and Facilities; |
| |
| • | New large-scale growth projects across Pembina's business being placed into service; |
| |
| • | Volatility in commodity market prices impacting margins within the marketing business, partially mitigated through Pembina's risk management program; |
| |
| • | Impairment of Pembina's convertible preferred interest in Ruby in the fourth quarter of 2019; |
| |
| • | Lower Alberta tax rates following the enactment of Bill 3 in June 2019; |
| |
| • | Higher net finance costs impacting earnings associated with debt related to financing acquisitions and growth projects; |
| |
| • | Increased common and preferred shares outstanding and corresponding dividends due to the Kinder Acquisition; and |
| |
| • | The adoption of IFRS 16 on January 1, 2019. See the "Accounting Policies & Estimates" section. |
27 Pembina Pipeline Corporation 2019 Annual Report
8. SELECTED EQUITY ACCOUNTED INVESTEE INFORMATION
Loans and Borrowings of Equity Accounted Investees
Under equity accounting, the assets and liabilities of the investment are net into a single line item in the consolidated statement of financial position, Investments in Equity Accounted Investees. To assist readers' understanding and to evaluate the capitalization of these investments, loans and borrowings associated with investments in equity accounted investees are presented below based on Pembina's proportionate ownership at December 31, 2019. In addition, certain of the equity accounted investees have borrowing arrangements with an amortization structure, thereby necessitating periodic repayments of principal. These repayments occur prior to distribution of residual cash flow to Pembina. The loans and borrowings and amortization schedules are presented below and classified by the division in which the results for the investment are reported. Please refer to "Abbreviations" for a summary of Pembina's investments in equity accounted investees and the division in which their results are reported.
|
| | | | |
| As at December 31 | | |
($ millions)(1) | 2019 |
| 2018 |
|
| Pipelines | 1,057 |
| 1,250 |
|
| Facilities | 1,150 |
| 1,227 |
|
| Marketing & New Ventures | — |
| 1 |
|
| Total | 2,207 |
| 2,478 |
|
Amortization Schedule of Loans and Borrowings of Equity Accounted Investees |
| | | | | | | | | | | | |
| | 12 Months Ended |
| | | | | |
($ millions)(1) | December 31, 2019 |
| 2020 |
| 2021 |
| 2022 |
| 2023 |
| 2024+ |
|
| Pipelines | 237 |
| 175 |
| 96 |
| 563 |
| 62 |
| 161 |
|
| Facilities | 105 |
| — |
| 12 |
| 36 |
| 36 |
| 1,066 |
|
| Marketing & New Ventures | 1 |
| — |
| — |
| — |
| — |
| — |
|
| Total | 343 |
| 175 |
| 108 |
| 599 |
| 98 |
| 1,227 |
|
| |
(1) | Balances reflect Pembina's ownership percentage of the outstanding balance face value. |
Financing Activities for Equity Accounted Investees
On March 28, 2019, Ruby Pipeline, L.L.C., in which Pembina owns a 50 percent preferred interest, amended the maturity date of its 364-day term loan to March 26, 2020. The term loan will continue to amortize at US$16 million per quarter (US$8 million per quarter net to Pembina), beginning March 2019, until a final bullet payment of US$78 million (US$39 million net to Pembina) is payable March 26, 2020, unless otherwise extended.
On September 26, 2019, Veresen Midstream, successfully amended and extended its senior secured credit facilities, which were originally scheduled to mature on April 20, 2022, to April 20, 2024. Under the terms of the amendment and extension reached with a syndicate of lenders, Veresen Midstream increased its borrowing capacity to $225 million under the revolving credit facility and to $2.6 billion of availability under the term facility. Amortization payments of the term facility are deferred twenty-four months, recommencing again on September 30, 2021. The funding will be used for on-going expansions.
On December 10, 2019, Alliance Pipeline Limited Partnership amended and extended its revolving credit facility. The maturity date was extended to December 12, 2022, and the supplemental commitments provision was exercised, increasing total borrowing capacity by $100 million to $300 million.
Subsequent to year-end, on February 27, 2020, Canada Kuwait Petrochemical Limited Partnership closed a syndicated senior secured credit agreement consisting of a US$1.7 billion amortizing term facility, and a US$150 million revolving facility, which have been guaranteed equally by the owners through the completion of construction on a several basis. The final maturity date of the term facility and revolving facility is February 27, 2027.
Pembina Pipeline Corporation 2019 Annual Report 28
Commitments to Equity Accounted Investees
Pembina is contractually committed to provide CKPC with funding to construct assets that will form part of CKPC's PDH/PP Facility, subject to certain conditions being met.
Pembina has a contractual commitment to advance US$39 million to Ruby by March 26, 2020.
Pembina has commitments to provide contributions to certain equity accounted investees based on annual budgets approved by the joint venture partners.
Ruby Impairment
In December 2019, Pembina recognized an impairment charge of $300 million ($220 million net of tax) on its convertible preferred interest in Ruby. The impairment charge was the result of an assessment triggered by upcoming contract expirations in a business environment in the Rockies Basin that remains challenged.
9. OTHER
Selected Annual Financial Information |
| | | | | | |
| ($ millions, except where noted) | 2019 |
| 2018 |
| 2017(1) |
|
| Revenue | 7,230 |
| 7,351 |
| 5,400 |
|
| Earnings | 1,492 |
| 1,278 |
| 883 |
|
Per common share - basic (dollars) | 2.66 |
| 2.28 |
| 1.87 |
|
Per common share - diluted (dollars) | 2.65 |
| 2.28 |
| 1.86 |
|
| Total assets | 33,153 |
| 26,664 |
| 25,566 |
|
Long-term financial liabilities(2) | 12,020 |
| 7,996 |
| 8,199 |
|
Common share dividends declared ($ per share) | 2.36 |
| 2.24 |
| 2.04 |
|
| Preferred share dividends declared | 126 |
| 122 |
| 83 |
|
| |
(1) | Financial results reported for 2017 period have been restated to reflect the adoption of IFRS 15. |
| |
(2) | Includes long-term loans and borrowings, long-term convertible debentures, which matured on December 31, 2018, long-term derivative financial instruments, contract liabilities, provisions and employee benefits, share-based payments, taxes payable and other liabilities. |
See the "Quarterly Financial Information" section for the factors impacting years ended December 31, 2019 and 2018. The year ended December 31, 2017 was largely impacted by Pembina's acquisition of Veresen Inc. on October 2, 2017.
Related Party Transactions
Pembina enters into transactions with related parties in the normal course of business. These transactions primarily include contracting capacity from and advancing funds to equity accounted investees, and providing management, administrative, operational and workforce related services to various affiliates on a cost recovery basis. These services are provided under separate consulting services agreements. For more information on these transactions, refer to Note 27 to the Consolidated Financial Statements.
Pension Liability
Pembina maintains defined contribution plans and defined benefit pension plans covering employees and retirees. The defined benefit plans include a funded registered plan for all qualified employees and an unfunded supplemental retirement plan for those employees affected by the Canada Revenue Agency maximum pension limits. At the end of 2019, the pension plans carried a net obligation of $35 million compared to a net obligation of $31 million at the end of 2018. At December 31, 2019, plan obligations amounted to $266 million (2018: $224 million) compared to plan assets of $231 million (2018: $193 million). In 2019, the pension plans' expense was $15 million (2018: $15 million). Pembina's contributions to the pension plans totaled $20 million in 2019 (2018: $19 million).
29 Pembina Pipeline Corporation 2019 Annual Report
Disclosure Controls and Procedures ("DC&P") and Internal Controls over Financial Reporting ("ICFR")
Disclosure Controls and Procedures
Pembina maintains disclosure controls and procedures designed to provide reasonable assurance that information required to be disclosed in Pembina's annual filings, interim filings and other reports is recorded, processed, summarized and reported accurately and in the appropriate time period.
As at December 31, 2019, an evaluation of the effectiveness of the design and operation of Pembina's disclosure controls and procedures, as defined in Rule 13a - 15(e) and 15d - 15(e) under the United States Securities Exchange Act of 1934, as amended (the "Exchange Act") and National Instrument 52-109 Certification of Disclosure in Issuer's Annual and Interim Filings ("NI 52-109"), was carried out by management, including the Chief Executive Officer ("CEO") and the Chief Financial Officer ("CFO"). Based on that evaluation, the CEO and CFO have concluded that the design and operation of Pembina's disclosure controls and procedures were effective as at December 31, 2019 to ensure that material information relating to Pembina is made known to the CEO and CFO by others.
It should be noted that while the CEO and CFO believe that Pembina's disclosure controls and procedures provide a reasonable level of assurance that they are effective, they do not expect that Pembina's disclosure controls and procedures will prevent all errors or fraud. A control system, no matter how well conceived or operated, can provide only reasonable, not absolute, assurance that the objectives of the control system are met.
Management’s Annual Report on Internal Control over Financial Reporting
Pembina maintains internal control over financial reporting which is designed to provide reasonable assurance regarding the reliability of financial reporting and the preparation of financial statements for external purposes in accordance with IFRS.
Management is responsible for establishing and maintaining adequate internal control over financial reporting, as defined in Rules 13a - 15(f) and 15d - 15(f) under the Exchange Act and under NI 52-109.
Management, including the CEO and the CFO, has conducted an evaluation of Pembina's internal control over financial reporting based on criteria established in Internal Control - Integrated Framework (2013) issued by the Committee of Sponsoring Organizations of the Treadway Commission (COSO). Based on management's assessment as at December 31, 2019, the CEO and CFO have concluded that Pembina's internal control over financial reporting is effective.
In accordance with the provisions of NI 52-109 and consistent with SEC guidance, the scope of the evaluation did not include internal controls over financial reporting of Kinder Morgan Canada Limited or controls associated with the U.S. portion of the Cochin Pipeline system, both of which Pembina acquired on December 16, 2019, and were excluded from management's evaluation of the effectiveness of Pembina's internal control over financial reporting as at December 31, 2019 due to the proximity of the Kinder Acquisition to year-end. Further details related to the Kinder Acquisition are disclosed in Note 6 to the Consolidated Financial Statements. The assets and revenue acquired in the Kinder Acquisition represented approximately 16 percent and nil percent, respectively, of Pembina's total assets and revenue as at December 31, 2019.
Due to its inherent limitations, internal control over financial reporting is not intended to provide absolute assurance that a misstatement of Pembina's financial statements would be prevented or detected. Further, the evaluation of the effectiveness of internal control over financial reporting was made as at a specific date, and continued effectiveness in future periods is subject to the risks that controls may become inadequate.
The effectiveness of internal control over financial reporting as at December 31, 2019 was audited by KPMG LLP, an independent registered public accounting firm, as stated in their Report of Independent Registered Public Accounting Firm, which is included in the Consolidated Financial Statements.
Pembina Pipeline Corporation 2019 Annual Report 30
Changes in Internal Control over Financial Reporting
Pembina's internal controls over financial reporting commencing December 16, 2019 include the systems, processes and controls associated with the Kinder Acquisition, as well as additional controls designed to result in complete and accurate consolidation of the financial information relating to the Kinder Acquisition. Other than the Kinder Acquisition, there has been no change in Pembina's internal control over financial reporting that occurred during the year ended December 31, 2019 that has materially affected, or are reasonably likely to materially affect, Pembina's internal control over financial reporting.
10. ACCOUNTING POLICIES & ESTIMATES
Changes in Accounting Policies
New Standards Adopted in 2019
Except for the changes described below, accounting policies as disclosed in Note 4 of the Consolidated Financial Statements have been applied to all periods consistently.
IFRS 16 Leases ("IFRS 16")
Pembina adopted IFRS 16 effective January 1, 2019. IFRS 16 introduced a new lease definition that increases the focus on control of the underlying asset. In addition, IFRS 16 introduced a single, on balance sheet accounting model for lessees that has resulted in Pembina recording right-of-use assets representing its right to use the underlying assets and lease liabilities representing its obligation to make lease payments. Lessor accounting has remained unchanged, except for changes in the classification of subleases.
IFRS 16 has been applied using the modified retrospective approach, under which the cumulative effect of initial application was recognized in equity at January 1, 2019 as further disclosed below. Accordingly, the comparative financial information has not been restated and continues to be reported under International Accounting Standard ("IAS") 17 Leases and International Financial Reporting Interpretations Committee Interpretation 4 Determining whether an arrangement contains a lease ("IFRIC 4"). The details of Pembina's accounting policies under IAS 17 and IFRIC 4, for the comparative period, are disclosed separately below.
On transition to IFRS 16, Pembina elected to apply the practical expedient to grandfather the assessment of whether a contract entered into before the date of initial application was, or contained, a lease under IFRIC 4, rather than reassess based on the new definition of a lease under IFRS 16. Contracts previously identified as leases were recognized and measured in accordance with IFRS 16.
| |
| a. | Accounting Policies Applicable from January 1, 2019 |
The details of significant accounting policies under IFRS 16 and the nature of the changes to previous accounting policies under IAS 17 are outlined below.
For all contracts entered into or amended on or after January 1, 2019, Pembina applies the definition of a lease under IFRS 16 to determine if a contract is, or contains, a lease. A specific asset is the subject of a lease if the contract conveys the right to control the use of that identified asset for a period of time in exchange for consideration. This determination is made at inception of a contract, and is reassessed when the terms and conditions of the contract are amended.
At inception or on reassessment of a contract that contains a lease component, Pembina allocates contract consideration to the lease and non-lease components on the basis of their relative stand-alone prices. The consideration allocated to the lease components is recognized in accordance with the policies for lessee and lessor leases, as described below. The consideration allocated to non-lease components is recognized in accordance with its nature.
31 Pembina Pipeline Corporation 2019 Annual Report
Leased assets are recognized as right-of-use assets, with corresponding lease liabilities recognized on the statement of financial position at the lease commencement date. Right-of-use assets include terminals, rail, buildings, storage tanks and land and other assets.
Right-of-use assets are initially recognized at cost, which comprises the initial amount of the lease liability adjusted for any lease payments made at or before the commencement date, plus any initial direct costs incurred and an estimate of costs to dismantle and remove the underlying asset and restore the site of an underlying asset to the condition required by the terms of the lease, less any lease incentives received. Right-of-use assets recognized as a result of business combination are initially measured in the same manner, plus an adjustment to reflect favourable or unfavourable lease terms compared to market terms. Right-of-use assets are subsequently measured at cost less any accumulated depreciation and accumulated impairment losses, adjusted for remeasurements of the lease liability. The right-of-use asset is depreciated over the lesser of the asset’s useful life and the lease term on a straight-line basis.
The lease liability is initially measured at the present value of the lease payments, discounted using the interest rate implicit in the lease if readily determinable, or at a rate Pembina would be required to pay to borrow over a similar term, with a similar security to obtain an asset of a similar value to the right-of-use asset. Lease payments in an optional renewal period are included in the lease liability if Pembina is reasonably certain to exercise such option. The lease liability is subsequently increased by interest expense on the lease liability and decreased by lease payments made. Interest expense is recorded in earnings at an amount that represents a constant periodic rate of interest on the remaining balance of the lease liability.
The lease liability is remeasured when there is a change in future lease payments arising from a change in an index or rate, a change in the estimated guaranteed residual value to be paid, or a change in the assessment of whether a purchase option, extension option or termination option is reasonably certain to be exercised. A corresponding adjustment is made to the right of use asset when a liability is remeasured, or the adjustment is recorded in earnings if the right of use asset has been reduced to zero.
Pembina has elected to apply the recognition exemptions for short-term and low value leases. Pembina recognizes lease payments associated with these leases as an expense on a straight-line basis over the lease term.
Lessor leases are classified as either operating leases or finance leases according to the substance of the contract. Leases transferring substantially all of the risks incidental to asset ownership are classified as finance leases, while all other leases are classified as operating leases. Subleases are classified as either operating or finance leases in reference to the right-of-use asset arising from the head lease. Under IAS 17, Pembina also classified lessor subleases as operating or finance leases based on an overall assessment of whether the lease transferred substantially all of the risks and rewards incidental to ownership of the underlying asset, considering certain indicators such as whether the lease was for the major part of the economic life of the asset.
Assets under finance lease are recognized in finance lease receivables at the value of the net investment in the lease. The net investment in the lease is measured at the net present value of the future amounts receivable, discounted using the interest rate implicit in the lease. Finance income is recognized over the lease term in a pattern reflecting a consistent rate of return on the finance lease receivable.
Lease payments from operating leases are recognized as income on either a straight-line basis or a systematic basis representative of the pattern in which benefit from the use of the underlying asset is received.
Pembina Pipeline Corporation 2019 Annual Report 32
| |
| b. | Accounting Policies Applicable Prior to January 1, 2019 |
The details of significant accounting policies under IAS 17 and IFRIC 4, under which comparative balances continue to be reported, are outlined below.
At inception of an arrangement, Pembina determines whether such an arrangement is or contains a lease. A specific asset is the subject of a lease if fulfilment of the arrangement is dependent on the use of that specified asset. An arrangement conveys the right to use the asset if the arrangement conveys to a lessee the right to control the use of the underlying asset.
At inception or upon reassessment of the arrangement, Pembina separates payments and other consideration required by such an arrangement into those for the lease and those for other elements on the basis of their relative fair values.
Leases which Pembina assumes substantially all the risks and rewards of ownership are classified as finance leases. The leased asset is initially recognized at an amount equal to the lower of its fair value and the present value of the minimum lease payments. Subsequent to initial recognition, the asset is accounted for in accordance with the accounting policy applicable to that asset.
Minimum lease payments made under finance leases are apportioned between the finance cost and the reduction of the outstanding liability. The finance cost is allocated to each period during the lease term so as to produce a constant periodic rate of interest on the remaining balance of the liability.
Other leases are operating leases and are not recognized in Pembina's consolidated statement of financial position.
Payments made under lessee operating leases are recognized in earnings on a straight-line basis over the term of the lease. Lease incentives received are deferred and recognized over the term of the lease.
Payments received under lessor operating leases are recognized in earnings in accordance with the benefit received by the customer.
At transition, lease liabilities for contracts previously identified as operating leases under IAS 17 were measured at the present value of the remaining lease payments, discounted at Pembina's incremental borrowing rate as at January 1, 2019. For all leases, right-of-use assets were measured at an amount equal to the lease liability. Pembina applied the following practical expedients on transition:
| |
| • | Pembina applied a single discount rate to a portfolio of leases with similar characteristics rather than multiple discount rates to match the term of each lease; |
| |
| • | Pembina has relied on onerous lease contract assessments previously performed under IAS 37 Provisions, Contingent Liabilities and Contingent Assets as an alternative to an impairment review on right-of-use assets, resulting in an adjustment of the right-of-use asset balance by the amount of the onerous lease contract provision outstanding immediately before the date of initial application; and |
| |
| • | Pembina elected not to recognize right-of-use assets and corresponding lease liabilities for leases with terms of less than 12 months remaining. |
There has been no change to the accounting for contracts previously identified as finance leases under IAS 17. The carrying amount of the right-of-use asset and lease liability on transition were determined to be equal to the carrying amount of the lease asset and lease liability under IAS 17.
Sub-lease contracts previously classified as operating leases are recognized as finance leases under IFRS 16.
33 Pembina Pipeline Corporation 2019 Annual Report
| |
| d. | Financial Statement Impacts |
On transition to IFRS 16, Pembina recognized significant right-of-use assets and lease liabilities related to rail, buildings and land. Further disclosures related to leases are provided in Note 13 to the Consolidated Financial Statements.
| |
| i. | Consolidated Statement of Financial Position |
The impacts of adoption of IFRS 16 as at January 1, 2019 are as follows:
|
| | | | | | |
| As at December 31, 2018 |
| Adjustments |
| Opening Value January 1, 2019 |
|
| ($ millions) |
| Assets |
|
|
|
| Current assets |
|
|
|
Trade receivables and other(1) | 604 |
| 1 |
| 605 |
|
| Non-current assets |
|
|
|
Property, plant and equipment(2) | 14,730 |
| (18 | ) | 14,712 |
|
Right-of-use assets(3) | — |
| 427 |
| 427 |
|
Advances to related parties and other assets(1)(4) | 144 |
| 33 |
| 177 |
|
| Liabilities and Equity |
|
|
|
| Current liabilities |
|
|
|
Trade payables and other(4) | 870 |
| (7 | ) | 863 |
|
Loans and borrowings(5) | 480 |
| (8 | ) | 472 |
|
| Lease liabilities | — |
| 64 |
| 64 |
|
| Non-current liabilities |
|
|
|
Loans and borrowings(5) | 7,057 |
| (11 | ) | 7,046 |
|
| Lease liabilities | — |
| 416 |
| 416 |
|
| Deferred tax liabilities | 2,774 |
| 8 |
| 2,782 |
|
Other liabilities(4) | 239 |
| (41 | ) | 198 |
|
| Equity |
|
|
|
| Attributable to shareholders | 14,344 |
| 22 |
| 14,366 |
|
| |
(1) | Includes lessor finance lease receivables. |
| |
(2) | Finance lease assets previously recorded in property, plant and equipment were reclassified to right-of-use assets. |
| |
(3) | Right-of-use assets are recorded at a value equal to the associated lease liability of $480 million, less $33 million for sublease arrangements, less onerous lease liability balance at December 31, 2018 of $20 million. |
| |
(4) | Operating lease payments were previously recognized on a straight-line basis, with the difference between cash payments and expense (income) recorded to a deferred lease asset or deferred lease liability. These deferrals were derecognized on adoption of IFRS 16. In addition, $20 million of onerous lease liabilities were offset against right-of-use assets. |
| |
(5) | Finance leases previously recorded in loans and borrowings were reclassified to lease liabilities. |
| |
| ii. | Reconciliation of Lease Liability |
|
| | |
| ($ millions) |
|
|
| Lease commitments, disclosed at December 31, 2018 | 796 |
|
| Leases not yet commenced | (33 | ) |
| Non-lease components | (217 | ) |
| Renewal options reasonably certain to be exercised | 53 |
|
| Total undiscounted lease payments | 599 |
|
Discounting impact(1) | (119 | ) |
| Lease liabilities recognized as at January 1, 2019 | 480 |
|
| |
(1) | Pembina discounted lease payments using the incremental credit-risk adjusted borrowing rate applicable to the contract. The weighted-average rate applied on transition for all lease liabilities was 4.01 percent. |
| |
| iii. | Financial Impact on three and 12 Months Ended December 31, 2019 |
The nature of expenses related to identified lessee arrangements changed as IFRS 16 replaced straight-line operating lease expense with depreciation of right of use assets and interest expense relating to lease liabilities. The change did not have a significant impact on earnings. For the three and 12 months ended December 31, 2019, adjusted EBITDA increased $16 million and $61 million. In addition, cash flow from operating activities and adjusted cash flow from operating activities each
Pembina Pipeline Corporation 2019 Annual Report 34
increased $13 million and $56 million for the three and 12 months ended December 31, 2019, respectively, and cash flow from financing activities decreased by the same amount, as lease obligation repayments are now reported as financing activities on Pembina's Consolidated Statement of Cash Flows. There was no net impact on cash flows.
New Standards and Interpretations Not Yet Adopted
A number of new standards are effective for annual periods beginning after January 1, 2020 and earlier application is permitted; however, Pembina has not early adopted the new or amended standards in preparing Pembina's consolidated financial statements.
The following amended standards and interpretations are not expected to have a significant impact on Pembina's consolidated financial statements, on adoption January 1, 2020.
| |
| • | Amendments to References to Conceptual Framework in IFRS Standards. |
| |
| • | Definition of a Business (Amendments to IFRS 3). |
| |
| • | Definition of Material (Amendments to IAS 1 and IAS 8). |
Critical Accounting Judgments and Estimates
The preparation of the consolidated financial statements in conformity with IFRS requires management to make judgments, estimates and assumptions that are based on the facts and circumstances and estimates at the date of the consolidated financial statements and affect the application of accounting policies and the reported amounts of assets, liabilities, income and expenses. Actual results may differ from these estimates.
Judgments, estimates and underlying assumptions are reviewed on an ongoing basis. Revisions to accounting estimates are recognized in the period in which the estimates are revised and in any future periods affected.
The following judgment and estimation uncertainties are those management considers material to the consolidated financial statements:
Judgments
(i) Business Combinations
Business combinations are accounted for using the acquisition method of accounting. The determination of fair value often requires management to make judgments about future possible events. The assumptions with respect to lease identification, classification and measurement, the fair value of property plant and equipment, intangible assets, decommissioning provisions and contract liabilities acquired, as well as the determination of deferred taxes, generally require the most judgment.
(ii) Depreciation and Amortization
Depreciation and amortization of property, plant and equipment and intangible assets are based on management's judgment of the most appropriate method to reflect the pattern of an asset's future economic benefit expected to be consumed by Pembina. Among other factors, these judgments are based on industry standards and historical experience.
(iii) Impairment
Assessment of impairment of non-financial assets is based on management’s judgment of whether or not there are sufficient internal or external factors that would indicate that an asset, investment, or cash generating unit ("CGU") is impaired. The determination of a CGU is based on management's judgment and is an assessment of the smallest group of assets that generate cash inflows independently of other assets. In addition, management applies judgment to assign goodwill acquired as part of a business combination to the CGU or group of CGUs that is expected to benefit from the synergies of the business combination for purposes of impairment testing. When an impairment test is performed, the carrying value of a CGU or group
35 Pembina Pipeline Corporation 2019 Annual Report
of CGUs is compared to its recoverable amount, defined as the greater of fair value less costs to sell and value in use. As such, the asset composition of a CGU or group of CGUs directly impacts both the carrying value and recoverability of the assets included therein.
(iv) Assessment of Joint Control Over Joint Arrangements
The determination of joint control requires judgment about the influence Pembina has over the financial and operating decisions of an arrangement and the extent of the benefits it obtains based on the facts and circumstances of the arrangement during the reporting period. Joint control exists when decisions about the relevant activities require the unanimous consent of the parties that control the arrangement collectively. Ownership percentage alone may not be a determinant of joint control.
(v) Pattern of Revenue Recognition
The pattern of revenue recognition is impacted by management's judgments as to the nature of Pembina's performance obligations, the amount of consideration allocated to performance obligations that are not sold on a stand-alone basis, the valuation of material rights and the timing of when those performance obligations have been satisfied.
(vi) Leases
Management applies judgment to determine whether a contract is, or contains, a lease from both a lessee and lessor perspective. This assessment is based on whether the contract conveys a right to control the use of an identified asset for a period of time in exchange for consideration. Key judgments include whether a contract identifies an asset (or portion of an asset), whether the lessee obtains substantially all the economic benefits of the asset over the contract term and whether the lessee has the right to direct the asset's use. Judgment is also applied in determining the rate used to discount the lease payments.
Estimates
(i) Business Combinations
Estimates of future cash flows, forecast prices, interest rates, discount rates, cost, market values and useful lives are made in determining the fair value of assets acquired and liabilities assumed. Changes in any of the assumptions or estimates used in determining the fair value of acquired assets and liabilities could impact the amounts assigned to assets, liabilities, intangible assets, goodwill and deferred taxes in the purchase price equation. Future earnings can be affected as a result of changes in future depreciation and amortization, asset or goodwill impairment.
(ii) Provisions and Contingencies
Management uses judgment in determining the likelihood of realization of contingent assets and liabilities to determine the outcome of contingencies. Provisions recognized are based on management's best estimate of the timing, scope and amount of expected future cash outflows to settle the obligation.
Based on the long-term nature of the decommissioning provision, the most significant uncertainties in estimating the provision are the determination of whether a present obligation exists, the discount and inflation rates used, the costs that will be incurred and the timing of when these costs will occur.
(iii) Deferred Taxes
The calculation of the deferred tax asset or liability is based on assumptions about the timing of many taxable events and the enacted or substantively enacted rates anticipated to be applicable to income in the years in which temporary differences are expected to be realized or reversed.
Pembina Pipeline Corporation 2019 Annual Report 36
(iv) Depreciation and Amortization
Estimated useful lives of property, plant and equipment and intangible assets are based on management's assumptions and estimates of the physical useful lives of the assets, the economic lives, which may be associated with the reserve lives and commodity type of the production area, in addition to the estimated residual value.
(v) Impairment of Non-Financial Assets
In determining the recoverable amount of a CGU, a group of CGUs or an individual asset, management uses its best estimates of future cash flows, and assesses discount rates to reflect management’s best estimate of a rate that reflects a current market assessment of the time value of money and the specific risks associated with the underlying assets and cash flows.
(vi) Impairment of Financial Assets
The measurement of financial assets carried at amortized cost includes management’s estimates regarding the expected credit losses that will be realized on these financial assets.
(vii) Revenue from Contracts with Customers
In estimating the contract value, management makes assessments as to whether variable consideration is constrained or not reasonably estimable, such that an amount or portion of an amount cannot be included in the estimate of the contract value. Management's estimates of the likelihood of a customer’s ability to use outstanding make-up rights may impact the timing of revenue recognition. In addition, in determining the amount of consideration to be allocated to performance obligations that are not sold on a stand-alone basis, management estimates the stand-alone selling price of each performance obligation under the contract, taking into consideration the location and volume of goods or services being provided, the market environment, and customer specific considerations.
(viii) Fair Value of Financial Instruments
For Level 2 valued financial instruments, management makes assumptions and estimates value based on observable inputs such as quoted forward prices, time value and volatility factors. For Level 3 valued financial instruments, management uses estimates of financial forecasts, expected cash flows and risk adjusted discount rates to measure fair value.
(ix) Employee Benefit Obligations
An actuarial valuation is prepared to measure Pembina's net employee benefit obligations using management’s best estimates with respect to longevity, discount and inflation rates, compensation increases, market returns on plan assets, retirement and termination rates.
(x) Leases
In measuring its lease liabilities, management makes assessments of the stand-alone selling prices of each lease and non-lease component for the purposes of allocating consideration to each component. Management applies its best estimate with respect to the likelihood of renewal, extension and termination option exercise in determining the lease term.
37 Pembina Pipeline Corporation 2019 Annual Report
11. RISK FACTORS
Pembina's value proposition is based on balancing economic benefit against risk. Where appropriate, Pembina will seek to reduce risk. Pembina continually works to mitigate the impact of risks to its business by identifying all significant risks so that they can be appropriately managed. To assist with identifying and managing risk, Pembina has implemented a comprehensive Risk Management Program. The risks that may affect the business and operation of Pembina and its operating subsidiaries are described at a high level within this MD&A and more fully within Pembina's AIF, an electronic copy of which is available at www.pembina.com or on Pembina's SEDAR profile at www.sedar.com and which is filed under Form 40-F on Pembina's EDGAR profile at www.sec.gov. Further, additional discussion about counterparty risk, market risk, liquidity risk and additional information on financial risk management can be found in Note 24 of the Consolidated Financial Statements.
Commodity Price Risk
Pembina's business is exposed to commodity price volatility and a substantial decline in the prices of these commodities could adversely affect its financial results.
Certain of the transportation contracts or tolling arrangements with respect to Pembina's pipeline assets do not include take-or-pay commitments from crude oil and gas producers and, as a result, Pembina is exposed to volume risk with respect to those assets. A decrease in volumes transported can directly and adversely affect Pembina's revenues and earnings. The demand for, and utilization of, Pembina's pipeline assets may be impacted by factors such as changing market fundamentals, capacity bottlenecks, operational incidents, regulatory restrictions, system maintenance, weather and increased competition. Market fundamentals, such as commodity prices and price differentials, natural gas and gasoline consumption, alternative energy sources and global supply disruptions outside of Pembina’s control can impact both the supply of and demand for the commodities transported on Pembina’s pipelines. See "Reserve Replacement, Throughput and Product Demand" below.
Pembina's Marketing business includes activities related to product storage, terminalling, and hub services. These activities expose Pembina to certain risks relating to fluctuations in commodity prices and, as a result, Pembina may experience volatility in revenue and impairments related to the book value of stored product with respect to these activities. Primarily, Pembina enters into contracts to purchase and sell crude oil, condensate, NGL and natural gas at floating market prices; as a result, the prices of products that are marketed by Pembina are subject to volatility as a result of factors such as seasonal demand changes, extreme weather conditions, market inventory levels, general economic conditions, changes in crude oil markets and other factors. Pembina manages its risk exposure by balancing purchases and sales to secure less volatile margins. Notwithstanding Pembina's management of price and quality risk, marketing margins for commodities can vary and have varied significantly from period to period in the past. This variability could have an adverse effect on the results of Pembina's Marketing business and its overall results of operations. To assist in reducing this inherent variability in its Marketing business, Pembina has invested, and will continue to invest, in assets that have a fee-based revenue component.
Pembina is also exposed to potential price declines and decreasing frac spreads between the time Pembina purchases NGL feedstock and sells NGL products. Frac spread is the difference between the sale prices of NGL products and the cost of NGL sourced from natural gas and acquired at prices related to natural gas prices. Frac spreads can change significantly from period to period depending on the relationship between NGL and natural gas prices (the "frac spread ratio"), absolute commodity prices, transport differentials and changes in the Canadian to U.S. dollar exchange rate. In addition to the frac spread ratio changes, there is also a differential between NGL product prices and crude oil prices which can change margins realized for midstream products. The amount of profit or loss made on the extraction portion of the business will generally increase or decrease with frac spreads. This exposure could result in variability of cash flow generated by the Marketing business, which could affect Pembina and the cash dividends that Pembina is able to distribute.
The Company utilizes financial derivative instruments as part of its overall risk management strategy to assist in managing the exposure to commodity price, interest rate, cost of power and foreign exchange risk. As an example of commodity price mitigation, the Company actively fixes a portion of its exposure to fractionation margins through the use of derivative financial
Pembina Pipeline Corporation 2019 Annual Report 38
instruments. Additionally, Pembina's Marketing business is also exposed to variability in quality, time and location differentials for various products, and financial instruments may be used to offset the Company’s exposures to these differentials. The Company does not trade financial instruments for speculative purposes. Commodity price fluctuations and volatility can also impact producer activity and throughput in Pembina's infrastructure, which is discussed in more detail below.
For more information with respect to Pembina's financial instruments and financial risk management program, see Note 24 to Pembina's Consolidated Financial Statements, which note is incorporated by reference herein.
Regulation and Legislation
Legislation in Alberta and British Columbia exists to ensure that producers have fair and reasonable opportunities to produce, process and market their reserves. The AER and BCOGC in Alberta and British Columbia, respectively, may declare the operator of a pipeline a common carrier of crude oil, NGLs or natural gas and, as such, must not discriminate between producers who seek access to the pipeline. Regulatory authorities that declare pipeline operators a common carrier may also establish conditions under which the carrier must accept and carry product, including the tariffs that may be charged. Producers and shippers may also apply to the appropriate regulatory authorities for a review of tariffs, and such tariffs may then be regulated if it is proven that the tariffs are not just and reasonable. The potential for direct regulation of tariffs, while considered remote by Pembina, could result in tariff levels that are less advantageous to Pembina and could impair the economic operation of such regulated pipeline systems.
The AER is the primary regulatory body that oversees Pembina's Alberta-issued energy permits, with some minor exceptions. Certain of Pembina's subsidiaries own pipelines in British Columbia, which are regulated by the BCOGC, and pipelines that cross provincial or international boundaries, which are regulated by the CER and/or the FERC. Certain of Pembina's operations and expansion projects are subject to additional regulations, and as Pembina's operations expand throughout Canada and North America, Pembina may be required to comply with the requirements of additional regulators and legislative bodies, including the Impact Assessment Agency of Canada ("Impact Assessment Agency"), the BCEAO, the Ontario Ministry of Natural Resources, the Saskatchewan Ministry of Economy and The Petroleum Branch of Manitoba Mineral Resources. In the U.S., tolls on pipelines are regulated by and reported to the FERC and pipeline operations are governed by the PHMSA, which sets standards for the design, construction, pressure testing, operation and maintenance, corrosion control, training and qualification of personnel, accident reporting and record keeping. The Office of Pipeline Safety, within the PHMSA, inspects and enforces the pipeline safety regulations across the U.S. All regulations and environmental compliance obligations are subject to change at the initiative of PHMSA. Pembina continually monitors existing and changing regulations in all jurisdictions in which it currently operates, or into which it may expand in the future, and the potential implications to its operations; however, Pembina cannot predict future regulatory changes, and any such compliance and regulatory changes in any one or multiple jurisdictions could have a material adverse impact on Pembina, its financial results and its shareholders.
Bill C-69, an Act to enact the Impact Assessment Act and the Canadian Energy Regulator Act, to amend the Navigation Protection Act and to make consequential amendments to other Acts came into force on August 28, 2019. Bill C-69 resulted in the NEB being replaced by the CER. It also constituted an overhaul of the federal environmental assessment regime in Canada under the Canadian Environmental Assessment Act (Canada) ("CEAA") which has been replaced with the Impact Assessment Act (Canada) ("IAA"). Similarly, the Canadian Environmental Assessment Agency has been replaced with the new Impact Assessment Agency as the authority responsible for conducting all federal impact assessments (formerly "environmental assessments") for certain designated projects under the IAA, unless referred to a review panel. The list of designated projects which will be subject to mandatory assessment under the IAA is similar to the list under the CEAA; however, the length of new pipelines for which an impact assessment is required has been increased from 40 km to 75 km. The proposed IAA also contains a broader project assessment process than under the CEAA and provides for enhanced consultation with groups that may be affected by proposed projects, while also expanding the scope of factors and considerations that need to be taken into account under the project assessment process. The CER continues to oversee approved federal, interprovincial and international energy projects in a manner similar to the former regime under the NEB, with new projects being referred to a review panel under the IAA. As new projects have yet to be subject to the new federal impact assessment regime. Pembina
39 Pembina Pipeline Corporation 2019 Annual Report
continues to actively monitor developments in this area. To the extent these changes lengthen the review timeline for projects, the new regime could materially impact the amount of time and capital resources required by Pembina to seek and obtain approval to construct and operate international or interprovincial pipelines or other projects designated pursuant to the IAA project list. The new regime could therefore materially and directly impact Pembina's business and financial results, and could indirectly affect Pembina’s business and financial results by impacting the financial condition and growth projects of its customers and, ultimately, production levels and throughput on Pembina's pipelines and in its facilities.
Pembina's business and financial condition may also be influenced by federal and foreign legislation affecting, in particular, foreign investment, through legislation such as the Competition Act (Canada), the Investment Canada Act (Canada) and their equivalents in foreign jurisdictions.
There can be no assurance that changes to income tax laws, regulatory and environmental laws or policies and government incentive programs relating to the pipeline or crude oil and natural gas industry will not adversely affect Pembina or the value of its securities.
Operational Risks
Operational risks include, but are not limited to: pipeline leaks; the breakdown or failure of equipment, pipelines and facilities, information systems or processes; the compromise of information and control systems; the performance of equipment at levels below those originally intended (whether due to misuse, unexpected degradation or design, construction or manufacturing defects); releases at truck terminals and hubs; releases associated with the loading and unloading of potentially harmful substances onto rail cars and trucks; adverse sea conditions (including storms and rising sea levels) and releases or spills from shipping vessels loaded at our marine terminal; failure to maintain adequate supplies of spare parts; operator error; labour disputes; disputes with interconnected facilities and carriers; operational disruptions or apportionment on third-party systems or refineries, which may prevent the full utilization of Pembina's facilities and pipelines; and catastrophic events, including, but not limited to, extreme weather events, including fires, floods and other natural disasters, explosions, train derailments, earthquakes, widespread epidemics or pandemic outbreaks, acts of civil protest or disobedience, terrorism or sabotage, and other similar events, many of which are beyond the control of Pembina and all of which could result in operational disruptions, damage to assets, related releases or other environmental issues, and delays in construction, labour and materials. Pembina may also be exposed from time to time to additional operational risks not stated in the immediately preceding sentence. In addition, the consequences of any operational incident (including as a result of adverse sea conditions) at our Vancouver Wharves Terminal or involving a vessel receiving products from our Vancouver Wharves Terminal, may be even more significant as a result of the complexities involved in addressing leaks and releases occurring in the ocean or along coastlines and/or the repair of marine terminals. Any leaks, releases or other incidents involving such vessels, or other similar operators along the West Coast, could result in significant harm to the environment, curtailment of, or disruptions of and/or delays in, offshore shipping activity in the affected areas, including our ability to effectively carry on operations at our Vancouver Wharves Terminal. The occurrence or continuance of any of the foregoing events could increase the cost of operating Pembina's assets or reduce revenue, thereby impacting earnings. Additionally, facilities and pipelines are reliant on electrical power for their operations. A failure or disruption within the local or regional electrical power supply or distribution or transmission systems could significantly affect ongoing operations. Further, a significant increase in the cost of power or fuel could have a materially negative effect on the level of profit realized in cases where the relevant contracts do not provide for recovery of such costs. In the long-term, constraints on natural resource development could be impacted by climate change initiatives or policies, resulting in additional operational costs, delays or restrictions.
Pembina is committed to preserving customer and shareholder value by proactively managing operational risk through safe and reliable operations. Senior managers are responsible for the supervision of operational risk by ensuring appropriate policies, procedures and systems are in place within their business units and internal controls are operating efficiently. Pembina also has an extensive program to manage pipeline system integrity, which includes the development and use of in-line inspection tools and various other leak detection technologies. Pembina's maintenance, excavation and repair programs
Pembina Pipeline Corporation 2019 Annual Report 40
are focused on risk mitigation and, as such, resources are directed to the areas of greatest benefit and infrastructure is replaced or repaired as required. Pembina carries insurance coverage with respect to some, but not all, casualty occurrences in amounts customary for similar business operations, which coverage may not be sufficient to compensate for all casualty occurrences. In addition, Pembina has a comprehensive Corporate Security Management Program designed to reduce security-related risks.
Completion and Timing of Expansion Projects
The successful completion of Pembina's growth and expansion projects is dependent on a number of factors outside of Pembina's control, including the impact of general economic, business and market conditions, availability of capital at attractive rates, receipt of regulatory approvals, reaching long-term commercial arrangements with customers in respect of certain portions of the expansions, construction schedules, commissioning difficulties or delays and costs that may change depending on supply, demand and/or inflation, labour, materials and equipment availability, contractor non-performance, acts of civil protest or disobedience, terrorism or sabotage, weather conditions, cost of engineering services, and change in governments that granted the requisite regulatory approvals. There is no certainty, nor can Pembina provide any assurance, that necessary regulatory approvals will be received on terms that maintain the expected return on investment associated with a specific project, or at all, or that satisfactory commercial arrangements with customers will be entered into on a timely basis, or at all, or that third parties will comply with contractual obligations in a timely manner. Factors such as special interest group opposition, Aboriginal, landowner and other stakeholder consultation requirements, civil protest or disobedience, changes in shipper support, and changes to the legislative or regulatory framework could all have an impact on meeting contractual and regulatory milestones. As a result, the cost estimates and completion dates for Pembina's major projects may change during different stages of the project. Early stage projects face additional challenges, including securing leases, easements, rights-of-way, permits and/or licenses from landowners or governmental authorities allowing access for such purposes, as well as Aboriginal consultation requirements. Accordingly, actual costs and construction schedules may vary from initial estimates and these differences can be significant, and certain projects may not proceed as planned, or at all. Further, there is a risk that maintenance will be required more often than currently planned or that significant maintenance capital projects could arise that were not previously anticipated.
Under most of Pembina's construction and operating agreements, the Company is obligated to construct the facilities and pipelines regardless of delays and cost increases and Pembina bears the risk for any cost overruns and future agreements entered into with customers with respect to expansions may contain similar conditions. While Pembina is not currently aware of any significant undisclosed cost overruns with respect to its current projects at the date hereof, any such cost overruns may adversely affect the economics of particular projects, as well as Pembina's business operations and financial results, and could reduce Pembina's expected return on investment which, in turn, could reduce the level of cash available for dividends and to service obligations under Pembina's debt securities and other debt obligations.
Possible Failure to Realize Anticipated Benefits of Corporate Strategy or the Kinder Acquisition
Pembina evaluates the value proposition for expansion projects, new acquisitions and divestitures on an ongoing basis. Planning and investment analysis is highly dependent on accurate forecasting assumptions and, to the extent that these assumptions do not materialize, financial performance may be lower or more volatile than expected. Volatility in the economy, change in cost estimates, failure to obtain regulatory approvals and permits, project scoping and risk assessment could result in a loss in profits for Pembina. As part of its ongoing strategy, Pembina may complete acquisitions of assets or other entities in the future. Achieving the benefits of completed and future acquisitions depends, in part, on successfully consolidating functions and integrating operations, procedures and personnel in a timely and efficient manner, as well as Pembina's ability to realize the anticipated growth opportunities and synergies from combining the acquired businesses and operations with those of Pembina. In particular, large scale acquisitions may involve significant pricing and integration risk. The integration of acquired businesses and entities requires the dedication of substantial management effort, time and resources, which may divert management's focus and resources from other strategic opportunities and from operational matters during this process. The integration process may also result in the loss of key employees and the disruption of ongoing business, customer and
41 Pembina Pipeline Corporation 2019 Annual Report
employee relationships, which may adversely affect Pembina's ability to achieve the anticipated benefits of any acquisitions. Acquisitions may also expose Pembina to additional risks, including risks relating to entry into markets or businesses in which Pembina has little or no direct prior experience, increased credit risks through the assumption of additional debt, costs and contingent liabilities and exposure to liabilities of the acquired business or assets.
See "General Risk Factors – Additional Financing and Capital Resources" below.
Pembina completed the Kinder Acquisition to acquire strategically located assets, including the Cochin pipeline system, the Edmonton storage and terminal business and Vancouver Wharves, a bulk storage and export/import business, that are highly integrated across Pembina's value chain, and provide further integration potential, while also enhancing Pembina's basin, currency and market diversification and strengthening Pembina's financial guardrails. Achieving the benefits of the Kinder Acquisition depends in part on successfully consolidating functions and integrating operations, procedures and personnel in a timely and efficient manner, as well as the ability of Pembina to realize the anticipated growth opportunities and synergies from combining the acquired businesses and operations of Kinder with those of Pembina. The integration of the assets from the Kinder Acquisition, including the Cochin Pipeline system, requires the dedication of substantial management effort, time and resources which may divert management’s focus and resources from other strategic opportunities and from operational matters during this process. The integration process may result in the loss of key employees and the disruption of ongoing business, customer and employee relationships that may adversely affect Pembina's ability to achieve the anticipated benefits of the Kinder Acquisition.
Joint Ownership and Third-Party Operators
Certain of Pembina's assets are jointly owned and are governed by partnership or shareholder agreements entered into with third-parties. As a result, certain decisions relating to these assets require the approval of a simple majority of the owners, while others require unanimous approval of the owners. In addition, certain of these assets are operated by unrelated third-party entities. The success of these assets is, to some extent, dependent on the effectiveness of the business relationship and decision-making among Pembina and the other joint owner(s) and the expertise and ability of any third-party operators to operate and maintain the assets. While Pembina believes that there are prudent governance and other contractual rights in place, there can be no assurance that Pembina will not encounter disputes with joint owners or that assets operated by third parties may not perform as expected. Such events could impact operations or cash flows of these assets or cause them to not operate as Pembina expects which, in turn, could have a negative impact on Pembina's business operations and financial results, and could reduce Pembina's expected return on investment, thereby reducing the level of cash available for dividends and to service obligations under Pembina's debt securities and other debt obligations.
Reserve Replacement, Throughput and Product Demand
Pembina's pipeline revenue is based on a variety of tolling arrangements, including fee-for-service, cost-of-service agreements and market‑based tolls. As a result, certain pipeline revenue is heavily dependent upon throughput levels of crude oil, condensate, NGL and natural gas. Future throughput on crude oil, NGL and natural gas pipelines and replacement of oil and gas reserves in the service areas will be dependent upon the activities of producers operating in those areas as they relate to exploiting their existing reserve bases and exploring for and developing additional reserves, and technological improvements leading to increased recovery rates. Similarly, the volumes of natural gas processed through Pembina's gas processing assets depends on the production of natural gas in the areas serviced by the gas processing business and associated pipelines. Without reserve additions, or expansion of the service areas, volumes on such pipelines and in such facilities would decline over time as reserves are depleted. As oil and gas reserves are depleted, production costs may increase relative to the value of the remaining reserves in place, causing producers to shut-in production or seek out lower cost alternatives for transportation. If, as a result, the level of tolls collected by Pembina decreases cash flow available for dividends to shareholders and to service obligations under Pembina's debt securities and Pembina's other debt obligations could be adversely affected.
Over the long-term, the ability and willingness of shippers to continue production will also depend, in part, on the level of demand and prices for crude oil, condensate, NGL and natural gas in the markets served by the crude oil, NGL and natural gas
Pembina Pipeline Corporation 2019 Annual Report 42
pipelines and gas processing and gathering infrastructure in which Pembina has an interest. Producers may shut-in production at lower product prices or higher production costs.
Global economic events may continue to have a substantial impact on the prices of crude oil, condensate, NGL and natural gas. Pembina cannot predict the impact of future supply/demand or economic conditions, fuel conservation measures, alternative fuel requirements, governmental regulation or technological advances in fuel efficiency and energy generation in the energy and petrochemical industries or future demand for and prices of natural gas, crude oil, condensate and NGLs. A lower commodity price environment will generally reduce drilling activity and, as a result, the demand for midstream infrastructure could decline. Producers in the areas serviced by Pembina may not be successful in exploring for and developing additional reserves or achieving technological improvements to increase recovery rates and lower production costs during periods of lower commodity prices, which may also reduce demand for midstream infrastructure.
Future prices of these hydrocarbons are determined by supply and demand factors, including weather and general economic conditions as well as economic, political and other conditions in other crude oil and natural gas regions, all of which are beyond Pembina's control. The rate and timing of production from proven natural gas reserves tied into gas plants is at the discretion of producers and is subject to regulatory constraints. Producers have no obligation to produce from their natural gas reserves, which means production volumes are at the discretion of producers. Lower production volumes may increase the competition for natural gas supply at gas processing plants, which could result in higher shrinkage premiums being paid to natural gas producers. In addition, lower production volumes may lead to less demand for pipelines and processing capacity.
Pembina's gas processing assets are connected to various third-party trunk line systems. Operational disruptions or apportionment on those third-party systems may prevent the full utilization of Pembina's gas processing assets, which may have an adverse effect on its business.
Competition
Pembina competes with other pipeline, midstream, marketing and gas processing, fractionation and handling/storage service providers in its service areas as well as other transporters of crude oil, NGL and natural gas. The introduction of competing transportation alternatives into Pembina's service areas could limit Pembina's ability to adjust tolls as it may deem necessary and result in the reduction of throughput in Pembina's pipelines. Additionally, potential pricing differentials on the components of NGLs may result in these components being transported by competing gas pipelines. Pembina is determined to meet, and believes that it is prepared for, these existing and potential competitive pressures. Pembina also competes with other businesses for growth and business opportunities, which could impact its ability to grow through acquisitions and could impact earnings and cash flow available to pay dividends and to service obligations under Pembina's debt securities and other debt obligations.
Reliance on Principal Customers
Pembina sells services and products to large customers within its area of operations and relies on several significant customers to purchase product for the Marketing business. If for any reason these parties were unable to perform their obligations under the various agreements with Pembina, the revenue and dividends of the Company and the operations of Pembina could be negatively impacted. See "General Risk Factors – Credit Risk" below.
Customer Contracts
Throughput on Pembina's pipelines is governed by transportation contracts or tolling arrangements with various crude oil and natural gas producers. Pembina is party to numerous contracts of varying durations in respect of its gas gathering, processing and fractionation facilities as well as terminalling and storage services. Any default by counterparties under such contracts or any expiration of such contracts or tolling arrangements without renewal or replacement may have an adverse effect on Pembina's business and results from operations. Further, some contracts associated with the services described above are comprised of a mixture of firm and non-firm commitments. The revenue that Pembina earns on non-firm or firm commitments without take-or-pay service is dependent on the volume of crude oil, condensate, NGL and natural gas
43 Pembina Pipeline Corporation 2019 Annual Report
produced by producers in the relevant geographic areas. Accordingly, lower production volumes in these areas, including for reasons such as low commodity prices, may have an adverse effect on Pembina's revenue.
Reputation
Reputational risk is the potential risk that market-or company-specific events, or other factors, could result in the deterioration of Pembina's reputation with key stakeholders. The potential for deterioration of Pembina's reputation exists in many business decisions, which may negatively impact Pembina's business and the value of its securities. Reputational risk cannot be managed in isolation from other forms of risk. Credit, market, operational, insurance, liquidity, regulatory and legal, and technology risks, among others, must all be managed effectively to safeguard Pembina's reputation. Pembina's reputation could also be impacted by the actions and activities of other companies operating in the energy industry, particularly other energy infrastructure providers, over which Pembina has no control. In particular, Pembina's reputation could be impacted by negative publicity related to pipeline incidents, expansion plans or new projects or due to opposition from civilians or organizations opposed to energy, oil sands and pipeline development and, particularly, with shipment of production from oil sands regions. Further, Pembina’s reputation could be negatively impacted by changing public attitudes towards climate change and the perceived causes thereof, over which the Company has no control. Negative impacts from a compromised reputation, whether caused by Pembina’s actions or otherwise, could include revenue loss, reduction in customer base, delays in obtaining regulatory approvals with respect to growth projects, reduced access to capital or decreased value of Pembina's securities.
Environmental Costs and Liabilities
Pembina’s operations, facilities and petroleum product shipments are subject to extensive national, regional and local environmental, health and safety laws and regulations governing, among other things, discharges to air, land and water, the handling and storage of petroleum products and hazardous materials, waste disposal, the protection of employee health, safety and the environment, and the investigation and remediation of contamination. Pembina's facilities may experience incidents, malfunctions or other unplanned events that may result in spills or emissions and/or result in personal injury, fines, penalties, other sanctions or property damage. Pembina may also incur liability for environmental contamination associated with past and present activities and properties.
Pembina's facilities and pipelines must maintain a number of environmental and other permits from various governmental authorities in order to operate, and these facilities are subject to inspection from time to time. Failure to maintain compliance with these requirements could result in operational interruptions, fines or penalties, or the need to install additional pollution control technology. Licenses and permits must be renewed from time to time and there is no guarantee that a license or permit will be renewed on the same or similar conditions as it was initially granted. There can be no assurance that Pembina will be able to obtain all licenses, permits, registrations, approvals and authorizations that may be required to conduct operations that it may wish to undertake. Further, if at any time regulatory authorities deem any of Pembina's pipelines or facilities unsafe or not in compliance with applicable laws, they may order such facilities to be shut down. Certain significant environmental legislative initiatives that may materially impact Pembina's business and financial results and conditions are outlined below.
In 2016, the Canadian federal government announced that its initial proposed pan-Canadian carbon tax would be $10 per tonne commencing in 2018 and would increase by $10 per tonne per year to $50 per tonne by 2022. As a regulatory backstop, the federal government has also implemented the Greenhouse Gas Pollution Pricing Act ("GGPPA"), which introduces a carbon pricing regime for those provinces that fail to impose adequate provincial measures. Constitutional challenges to the GGPPA launched by Saskatchewan and Ontario in 2019 were unsuccessful. Alberta and Manitoba have initiated similar challenges before their respective provincial courts. At a minimum, an appeal of the Saskatchewan Court of Appeal’s decision affirming the constitutionality of the GGPPA will be heard by the Supreme Court of Canada, and the results of that appeal could significantly impact how greenhouse gas ("GHG") emissions are regulated throughout Canada.
Pembina Pipeline Corporation 2019 Annual Report 44
In Alberta, the Climate Leadership Act and associated $30 per tonne carbon levy on all carbon-based heating and transportation fuels was repealed effective May 30, 2019. As a result, Alberta only partially satisfies federal requirements with respect to carbon pricing and will be subject to the federal carbon tax pursuant to the GGPPA as of January 1, 2020. The carbon price will be $20 per tonne on January 1, 2020 and raise to $30 per tonne on April 1, 2020. Pembina also continues to follow the changes to the federal regulatory framework for the reduction of methane from fugitive and vented gas emissions in the upstream oil and gas sector, many of which will come into effect as of January 1, 2020. Through active participation with industry associations and direct engagement with regulatory bodies, Pembina will continue to monitor and assess for material impacts to Pembina's business as regulations and policies continue to be developed.
Alberta’s output-based emission allocations for large facility emitters under the Carbon Competitiveness Incentive Regulation ("CCIR") continues to facilitate emissions reductions relative to facilities that emitted 100,000 tonnes of GHGs or more in 2003 or any subsequent year. Pembina has three natural gas processing facilities subject to the large emitter regulations under the CCIR. At present, the operational and financial impacts are minimal and are anticipated to not change substantially over the next few years. As more facilities expand and increase production, it is anticipated that additional facilities will become subject to the CCIR. The potential costs and benefits to Pembina of those facilities under the CCIR are continuing to be assessed.
The Government of Alberta, in its climate change legislation and guidelines, has legislated an overall cap on oil sands greenhouse gas emissions. The legislated emissions cap on oil sands operations has been set to a maximum of 100 megatonnes in any year. Oil sands operations currently emit approximately 70 megatonnes per year. This legislated cap may limit oil sands production growth in the future.
Similar policy reviews on climate change are underway in British Columbia, Saskatchewan, and Manitoba. On July 3, 2018, Ontario announced the revocation of its previously enacted cap and trade emissions program and released its replacement GHG regime on November 29, 2018; however, the provisions of the GGPPA apply to Ontario. As indicated above, Ontario unsuccessfully challenged the constitutionality of the GGPPA, but may appeal that issue to the Supreme Court of Canada.
While Pembina believes its current operations are in compliance with all applicable environmental, health and safety laws, there can be no assurance that substantial costs or liabilities will not be incurred as a result of non-compliance with such laws. Moreover, it is possible that other developments, such as changes in environmental, health and safety laws, regulations and enforcement policies thereunder, including with respect to climate change, claims for damages to persons or property resulting from Pembina's operations, and the discovery of pre-existing environmental liabilities in relation to Pembina's existing or future properties or operations, could result in significant costs and liabilities to Pembina. If Pembina is not able to recover the resulting costs or increased costs through insurance or increased tolls, cash flow available to pay dividends to Shareholders and to service obligations under Pembina's debt securities and Pembina's other debt obligations could be adversely affected.
Changes in environmental, health and safety regulations and legislation, including with respect to climate change, may also impact Pembina's customers and could result in crude oil and natural gas development and production becoming uneconomical, which would impact throughput and revenue on Pembina's systems and in its facilities.
See "Reserve Replacement, Throughput and Product Demand" above.
While Pembina maintains insurance for damage caused by seepage or pollution from its pipelines or facilities in an amount it considers prudent and in accordance with industry standards, certain provisions of such insurance may limit the availability thereof in respect of certain occurrences unless they are discovered within fixed time periods, which typically range from 72 hours to 30 days. Although Pembina believes it has adequate pipeline monitoring systems in place to monitor for a significant spill of product, if Pembina is unaware of a problem or is unable to locate the problem within the relevant time period, insurance coverage may lapse and not be available.
45 Pembina Pipeline Corporation 2019 Annual Report
Abandonment Costs
Pembina is responsible for compliance with all applicable laws and regulations regarding the dismantling, decommissioning, environmental, reclamation and remediation activities on abandonment of its pipeline systems and other assets at the end of their economic life, and these abandonment costs may be substantial. An accounting provision is made for the estimated cost of site restoration and is capitalized in the relevant asset category. A provision is recognized if, as a result of a past event, Pembina has a present legal or constructive obligation that can be estimated reliably, and it is probable that an outflow of economic benefits will be required to settle the obligation. Pembina's estimates of the costs of such abandonment or decommissioning could be materially different than the actual costs incurred. For more information with respect to Pembina's estimated net present value of decommissioning obligations, see Note 15 to the Consolidated Financial Statements, which note is incorporated by reference herein.
The proceeds from the disposition of certain assets, including in respect of certain pipeline systems and line fill, may be available to offset abandonment costs. Pembina may, in the future, determine it prudent or be required by applicable laws or regulations to establish and fund additional reclamation funds to provide for payment of future abandonment costs. Such reserves could decrease cash flow available for dividends to Shareholders and to service obligations under Pembina's debt securities and Pembina's other debt obligations.
To the best of its knowledge, Pembina has complied with CER requirements on its wholly-owned CER-regulated pipelines for abandonment funding and has completed the compliance-based filings that are required under the applicable CER rules and regulations regarding the abandonment of its pipeline systems and assets. Pembina also has ownership in CER-regulated pipelines including in respect of the Alliance Pipeline, the Tupper pipelines and the Kerrobert pipeline, which are operated by or with its joint venture partners. Pembina and the joint venture partner in each case are responsible for the abandonment funding and the submission of the CER-compliance based filings for those CER-regulated pipelines. Pembina will continue to monitor any regulatory changes prior to the next five-year review and will complete the annual reporting as required by the CER.
Operating and Capital Costs
The operating and capital costs of Pembina's assets may vary considerably from current and forecasted values and rates and represent significant components of the cost of providing service. In general, as equipment ages, costs associated with such equipment may increase over time. In addition, operating and capital costs may increase as a result of a number of factors beyond Pembina’s control, including general economic, business and market conditions and supply, demand and/or inflation in respect of required goods and/or services. Dividends may be reduced if significant increases in operating or capital costs are incurred and this may also impact the ability of Pembina to service obligations under its debt securities and other debt obligations.
Although certain operating costs are recaptured through the tolls charged on natural gas volumes processed and crude oil and NGL transported, respectively, to the extent such tolls escalate, producers may seek lower cost alternatives or stop production of their crude oil and/or natural gas.
Risks Relating to NGL by Rail
Pembina's operations include rail loading, offloading and terminalling facilities. Pembina relies on railroads and trucks to distribute its products for customers and to transport raw materials to its processing facilities. Costs for environmental damage, damage to property and/or personal injury in the event of a railway incident involving hydrocarbons have the potential to be significant. At this time, the Railway Safety Act (Canada), which governs the operation of railway equipment, does not contemplate regulatory enforcement proceedings against shippers, but consignors and shippers may be subject to regulatory proceedings under the Transportation of Dangerous Goods Act (Canada), which specifies the obligations of shippers to identify and classify dangerous goods, select appropriate equipment and prepare shipping documentation. While the Canada Transportation Act was amended in 2015 to preclude railway companies from shifting liability for third-party claims to
Pembina Pipeline Corporation 2019 Annual Report 46
shippers by tariff publication alone, major Canadian railways have adopted standard contract provisions designed to implement such a shift. Under various environmental statutes in both Canada and the U.S., Pembina could be held responsible for environmental damage caused by hydrocarbons loaded at its facilities or being carried on its leased rail cars. Pembina partially mitigates this risk by securing insurance coverage, but such insurance coverage may not be adequate in the event of an incident.
Railway incidents in Canada and the U.S. have prompted regulatory bodies to initiate reviews of transportation rules and publish various directives. Regulators in Canada and the U.S. have begun to phase-in more stringent engineering standards for tank cars used to move hydrocarbon products, which require all North American tank cars carrying crude oil or ethanol to be retrofitted and all tank cars carrying flammable liquids to be compliant in accordance with the required regulatory timelines. While most legislative changes apply directly to railway companies, costs associated with retrofitting locomotives and rail cars, implementing safety systems, increased inspection and reporting requirements may be indirectly passed on to Pembina through increased freight rates and car leasing costs. In addition, regulators in Canada and the U.S. have implemented changes that impose obligations directly on consignors and shippers, such as Pembina, relating to the certification of product, equipment procedures and emergency response procedures.
In the event that Pembina is ultimately held liable for any damages resulting from its activities relating to transporting NGLs by rail, for which insurance is not available, or increased costs or obligations are imposed on Pembina as a result of new regulations, this could have an impact on Pembina's business, operations and prospects and could impact earnings and cash flow available to pay dividends and to service obligations under Pembina's debt securities and other debt obligations.
Trade Disputes
Tariffs, retaliatory tariffs or other trade restrictions on products that we or our customers export could cause the prices of such products to increase, which could, in turn, reduce the demand for, or margins on, such products. Direct or unforeseen consequences of tariffs, retaliatory tariffs or other trade restrictions may also alter the competitive landscape of our or our customers' products in one or more jurisdictions. There can be no certainty with respect to how the domestic or foreign governments will act with respect to tariffs, international trade agreements and policies. A trade dispute or other governmental action related to tariffs or international trade agreements or policies has the potential to negatively impact ours and/or our customers' costs, demand for our or our customers' products, and/or the international economy or certain sectors thereof which may adversely impact our results from operations and financial condition.
Canada-United States-Mexico Agreement
On November 30, 2018, Canada, the U.S. and Mexico signed the trilateral Canada-United States-Mexico Agreement ("CUSMA"), which, once ratified, will replace the existing trilateral North American Free Trade Agreement ("NAFTA").
NAFTA imposes certain requirements on Canada with respect to exports of energy and basic petrochemicals, requiring that export measures be applied such that the proportion of total supply exported over a three-year period remains unchanged. This requirement does not appear in CUSMA and is, therefore, expected to permit Canada to expand its exports of crude oil and natural gas beyond the U.S. In addition, CUSMA includes a change to the crude oil and natural gas rules of origin, which should make it easier for Canadian exporters to qualify for duty-free treatment on shipments to the U.S. and Mexico. Canada must, however, notify the U.S. of its intention to enter into free trade talks with any "non-market economies" under CUSMA, which may include China or any other potential importers of Canadian oil and gas exports.
Although the agreement has been signed, CUSMA is still required to be ratified and implemented by legislators from each of the three countries according to their own domestic legislative processes before it takes effect and replaces NAFTA. The ratification and implementation process in each of Canada, the U.S. and Mexico is not yet complete.
If CUSMA is not ratified and implemented by all three countries, this may alter the terms of trade for energy and petrochemical resources in North America, which could impact Pembina's ability to sell and transport petroleum products within North America and could have an adverse impact on our results from operations and financial condition.
47 Pembina Pipeline Corporation 2019 Annual Report
Alberta Production Curtailment
On December 2, 2018, the Alberta provincial government announced mandatory reductions to crude oil and bitumen production in Alberta in an attempt to narrow the price differentials on these products compared to North American benchmark prices. The reductions have been applied at the operator level based upon each operator’s combined crude oil and bitumen production, with the first 20,000 barrels per day produced by each operator exempt from the curtailment program. The temporary production cut commenced in January 2019, with an initial reduction of 325,000 barrels per day, representing approximately 8.7 percent of the aggregate production of crude oil and bitumen in Alberta. This level of curtailment has consistently been reduced from February 2019 to December 2019. The production rate will continue to be reviewed monthly by the Alberta Minister of Energy and revised, as necessary. Effective November 8, 2019, new wells drilled for conventional oil will be exempt from the production limit and, effective December 2019, operators can apply, on a monthly basis, to increase oil production, provided that the additional production is moved by new rail capacity. Under the current regulations, the provincial government's authority to curtail crude oil and bitumen production in Alberta will end on December 31, 2020.
In addition to reduced production volumes, the Alberta provincial government's curtailment strategy may have other unintended consequences that impact the oil and gas industry in Alberta, including, but not limited to, reduced demand for diluent, a reduction in drilling projects, reduced capital spending on new projects, reduced volumes of refined products and market uncertainty. These effects may lead to a reduction in the volume of product transported on our pipelines or processed at our facilities, which could have an adverse impact on our results from operations and financial condition.
Risk Factors Relating to the Securities of Pembina
Dilution of Shareholders
Pembina is authorized to issue, among other classes of shares, an unlimited number of Common Shares for consideration on terms and conditions as established by the Board of Directors without the approval of shareholders in certain instances. Existing shareholders have no pre-emptive rights in connection with such further issuances. Any issuance of Common Shares may have a dilutive effect on existing shareholders.
Risk Factors Relating to the Activities of Pembina and the Ownership of Securities
The following is a list of certain risk factors relating to the activities of Pembina and the ownership of its securities:
| |
| • | the level of Pembina's indebtedness from time to time could impair Pembina's ability to obtain additional financing on a timely basis to take advantage of business opportunities that may arise, which may have an adverse effect on the value of Pembina's securities; |
| |
| • | the uncertainty of future dividend payments by Pembina and the level thereof, as Pembina's dividend policy and the funds available for the payment of dividends from time to time will be dependent upon, among other things, operating cash flow generated by Pembina and its subsidiaries, financial requirements for Pembina's operations, the execution of its growth strategy and the satisfaction of solvency tests imposed by the ABCA for the declaration and payment of dividends; |
| |
| • | Pembina may make future acquisitions or may enter into financings or other transactions involving the issuance of securities of Pembina which may be dilutive to the holders of Pembina’s securities; |
| |
| • | the inability of Pembina to manage growth effectively, and realize the anticipated growth opportunities from acquisitions and new projects, could have an adverse impact on Pembina's business, operations and prospects, which may also have an adverse effect on the value of Pembina's securities; and |
| |
| • | the market value of the Common Shares may deteriorate materially if Pembina is unable to meet its cash dividend targets or make cash dividends in the future. |
Pembina Pipeline Corporation 2019 Annual Report 48
Market Value of Common Shares and Other Securities
Pembina cannot predict at what price the Common Shares, Class A Preferred Shares or other securities issued by Pembina will trade in the future. Common Shares, Class A Preferred Shares and other securities of Pembina will not necessarily trade at values determined solely by reference to the underlying value of Pembina's assets. One of the factors that may influence the market price of the Common Shares and the Class A Preferred Shares is the annual dividend yield of such securities. An increase in interest rates may lead holders and/or purchasers of Common Shares or Class A Preferred Shares to demand a higher annual dividend yield, which could adversely affect the market price of the Common Shares or Class A Preferred Shares. In addition, the market price for Common Shares and the Class A Preferred Shares may be affected by announcements of new developments, changes in Pembina's operating results, failure to meet analysts' expectations, changes in credit ratings, changes in general market conditions, fluctuations in the market for equity or debt securities and other factors beyond the control of Pembina.
Shareholders are encouraged to obtain independent legal, tax and investment advice with respect to the holding of Common Shares or Class A Preferred Shares.
General Risk Factors
Additional Financing and Capital Resources
The timing and amount of Pembina's capital expenditures and contributions to Equity Accounted Investees, and the ability of Pembina to repay or refinance existing debt as it becomes due, directly affects the amount of cash available for Pembina to pay dividends. Future acquisitions, expansions of Pembina's assets, other capital expenditures and the repayment or refinancing of existing debt as it becomes due may be financed from sources such as cash generated from operations, the issuance of additional Common Shares, Class A Preferred Shares or other securities (including debt securities) of Pembina and borrowings. Dividends may be reduced, or even eliminated, at times when significant capital or other expenditures are made. There can be no assurance that sufficient capital will be available on terms acceptable to Pembina, or at all, to make additional investments, fund future expansions or make other required capital expenditures. During periods of weakness in the global economy, and in particular the commodity-related industry sectors, Pembina may experience restricted access to capital and increased borrowing costs. The ability of Pembina to raise capital depends on, among other factors, the overall state of capital markets, Pembina's credit rating, investor demand for investments in the energy industry and demand for Pembina's securities. To the extent that external sources of capital, including the issuance of additional Common Shares, Class A Preferred Shares or other securities or the availability of additional credit facilities, become limited or unavailable on favourable terms, or at all, due to credit market conditions or otherwise, the ability of Pembina to make the necessary capital investments to maintain or expand its operations, to repay outstanding debt or to invest in assets, as the case may be, may be impaired. To the extent Pembina is required to use operating cash flow to finance capital expenditures or acquisitions or to repay existing debt as it becomes due, the level of dividends payable may be reduced.
Counterparty Credit Risk
Counterparty credit risk represents the financial loss Pembina may experience if a counterparty to a financial instrument or commercial agreement failed to meet its contractual obligations to Pembina in accordance with the terms and conditions of such instruments or agreements with Pembina. Counterparty credit risk arises primarily from Pembina's short-term investments, trade and other receivables, advances to related parties and from counterparties to its derivative financial instruments.
Pembina continues to closely monitor and reassess the creditworthiness of its counterparties, including financial institutions. Pembina may reduce or mitigate its exposure to certain counterparties where it is deemed warranted and permitted under contractual terms. Pembina manages counterparty credit risk through established credit management techniques, including conducting comprehensive financial and other assessments on all new counterparties and regular reviews of existing counterparties to establish and monitor counterparties' creditworthiness, set exposure limits, monitor exposure to these
49 Pembina Pipeline Corporation 2019 Annual Report
limits and seek to obtain financial assurances where warranted and permitted under contractual terms. Pembina utilizes various sources of financial, credit and business information in assessing the creditworthiness of a counterparty, including external credit ratings, where available, and, in other cases, detailed financial statement analysis in order to generate an internal credit rating based on quantitative and qualitative factors. The establishment of counterparty exposure limits is governed by a Board-designated counterparty exposure limit matrix which represents the maximum dollar amounts of counterparty exposure by debt rating that can be approved for a particular counterparty.
Financial assurances from counterparties may include guarantees, letters of credit and cash. As at December 31, 2019, letters of credit totaling approximately $90 million (December 31, 2018: $122 million) were held primarily in respect of customer trade receivables.
Pembina has typically collected its receivables in full. At December 31, 2019, approximately 95 percent (December 31, 2018: 99 percent) of receivables were current. Pembina has a general lien and a continuing and first priority security interest in, and a secured charge on, all of a shipper's petroleum products in its custody. The risk of non-collection is considered to be low and no material impairment of trade and other receivables has been made as of the date hereof.
Pembina monitors and manages its concentration of counterparty credit risk on an ongoing basis. Pembina also evaluates counterparty risk from the perspective of future exposure with existing or new counterparties that support future capital expansion projects. Pembina believes these measures are prudent and allow for effective management of its counterparty credit risk but there is no certainty that they will protect Pembina against all material losses. As part of its ongoing operations, Pembina must balance its market and counterparty credit risks when making business decisions.
Debt Service
At the end of 2019, Pembina had exposure to floating interest rates on approximately $2.1 billion (2018: $1.3 billion) in debt. Floating rate debt exposure is, in part, managed through the use of derivative financial instruments.
Variations in interest rates and scheduled principal repayments, if required under the terms of Pembina's banking agreements could result in significant changes in the amounts required to be applied to debt service before payment of any dividends. Certain covenants in the Company's agreements with its lenders may also limit certain payments and dividends paid by Pembina.
Pembina and its subsidiaries are permitted to borrow funds to finance the purchase of pipelines and other energy infrastructure assets, to fund capital expenditures or other financial obligations or expenditures in respect of such assets and for working capital purposes. Amounts paid in respect of interest and principal on debt incurred in respect of those assets reduce the amount of cash flow available for dividends on Common Shares. Pembina is also required to meet certain financial covenants under the Credit Facilities and is subject to customary restrictions on its operations and activities, including restrictions on the granting of security, incurring indebtedness and the sale of its assets.
The lenders under Pembina's Credit Facilities have been provided with guarantees and subordination agreements. If Pembina becomes unable to pay its debt service charges or otherwise commits an event of default, payments to the lenders under its Credit Facilities will rank in priority to dividends.
Although Pembina believes its existing Credit Facilities are sufficient for its immediate liquidity requirements, there can be no assurance that the amount available thereunder will be adequate for the future financial obligations of Pembina or that additional funds will be able to be obtained on terms favourable to Pembina, or at all.
Credit Ratings
Rating agencies regularly evaluate Pembina and base their ratings of its long-term and short-term debt and Class A Preferred Shares on a number of factors. This includes Pembina's financial strength as well as factors not entirely within Pembina’s control, including conditions affecting the industry in which Pembina operates generally and the wider state of the economy.
Pembina Pipeline Corporation 2019 Annual Report 50
There can be no assurance that one or more of Pembina's credit ratings will not be downgraded. A credit rating downgrade could also limit Pembina’s access to debt and preferred share markets.
Pembina's borrowing costs and ability to raise funds are directly impacted by its credit ratings. Credit ratings may be important to suppliers or counterparties when they seek to engage in certain transactions with Pembina. A credit rating downgrade may impair Pembina's ability to enter into arrangements with suppliers or counterparties, engage in certain transactions, limit Pembina's access to private and public credit markets or increase the costs of borrowing under its existing Credit Facilities. A credit rating downgrade could also limit Pembina's access to debt and preferred share markets.
Reliance on Management and other Key Individuals
Pembina is dependent on senior management and directors of the Company in respect of the governance, administration and management of all matters relating to Pembina and its operations and administration. The loss of the services of key individuals could have a detrimental effect on Pembina. Further, the costs associated with retaining key individuals could adversely affect Pembina's business opportunities and financial results. There is no assurance that Pembina will continue to attract and retain all personnel necessary for the development and operation of its business.
Aboriginal Land Claims and Consultation Obligations
Aboriginal people have claimed title and rights to a considerable portion of the lands in western Canada. The successful assertion of Aboriginal title or other Aboriginal rights claims may have an adverse effect on western Canadian crude oil and natural gas production or oil sands development and may result in reduced demand for Pembina's assets and infrastructure that service those areas, which could have a material adverse effect on Pembina's business and operations.
In Canada, the federal and provincial governments (the "Crown") have a duty to consult and, where appropriate, accommodate Aboriginal people where the interests of the Aboriginal peoples may be affected by a Crown action or decision. Crown actions include the decision to issue a regulatory approval relating to activities that may impact the Aboriginal rights, interests or lands. The Crown may rely on steps undertaken by a regulatory agency to fulfill its duty to consult and accommodate in whole or in part. Therefore, the processes established by regulatory bodies, such as the AER, the BCOGC, the BCEAO and the CER, often include an assessment of Aboriginal rights claims and consultation obligations. While the Crown holds ultimate responsibility for ensuring consultation is adequate, this issue is often a major aspect of regulatory permitting processes. If a regulatory body, or the Crown itself, determines that the duty to consult has not been appropriately discharged relative to the issuance of regulatory approvals required by Pembina, the issuance of such approvals may be delayed or denied, thereby impacting Pembina's Canadian operations.
As described in "Regulation and Legislation" above, the introduction of the CER Act, IAA, and associated amendments to the Fisheries Act and the Navigation Protection Act took place on August 28, 2019. A number of the federal regulatory process amendments pertain to the participation of Aboriginal groups and the protection of Aboriginal and treaty rights. The new legislation generally codifies existing law and practice with respect to these matters. For example, decision makers are now expressly required to consider the effects (positive or negative) of a proposed project on constitutionally-protected Aboriginal rights, as well as Aboriginal peoples themselves, and ensure that consultation is undertaken during the planning phase of impact assessment processes. The new legislation also creates a larger role for Aboriginal governing bodies in the impact assessment process (enabling the delegation of certain aspects of the impact assessment process to such groups) and requires decision makers to consider Aboriginal traditional knowledge in certain cases.
On February 14, 2018, the federal government announced that it will develop, in consultation with Aboriginal people (First Nations, Inuit and Métis), a Recognition and Implementation of Rights Framework ("Rights Framework"). The contents of the Rights Framework will be determined based on information obtained from engagement activities led by the Minister of Crown-Indigenous Relations, which were undertaken between February and May 2018. The Canadian federal government initially intended to implement the Rights Framework and any associated legislation or policies before October 2019, but no
51 Pembina Pipeline Corporation 2019 Annual Report
such legislation has been proposed as of the date hereof. Pembina will continue to monitor and assess the impacts the Rights Framework may have on its business as legislation and/or policies continue to be developed.
In 2018, the British Columbia government enacted Bill 51 - 2018 Environmental Assessment Act (the "2018 EA Act") as part of its commitment to revitalize environmental assessment in the province and facilitate its commitment to implementing the United Nations Declaration on the Rights of Indigenous Peoples ("UNDRIP"). The 2018 EA Act came into force in late 2019. The 2018 EA Act is designed as a "consent-based" environmental assessment model and is intended to support reconciliation with Aboriginal peoples and the implementation of UNDRIP. The legislation requires the BCEAO to seek participating Aboriginal groups' consent with respect to, among other things, the decision to issue an environmental assessment certificate to a given project. While the 2018 EA Act does not strictly require consent in most cases, the legislation creates significant new participation opportunities for participating Aboriginal groups during the course of environmental assessments, which may increase the time required to obtain regulatory approvals and thereby impact Pembina's operations in British Columbia. Similar objectives are proposed pursuant to Bill 41, the Declaration of the Rights of Indigenous Peoples Act, introduced by the British Columbia government on October 24, 2019. The purpose of the legislation is to affirm the application of UNDRIP to all laws in British Columbia, but the practical effects of the legislation are yet to be determined as it will simply require the government to prepare and implement an action plan to do so, and annually report on its progress. Pembina continues to actively monitor the development of the regulations required to facilitate the implementation of the 2018 EA Act and the progress of Bill 41 through the British Columbia legislature.
Potential Conflicts of Interest
Shareholders and other security holders of Pembina are dependent on senior management and the directors of Pembina for the governance, administration and management of Pembina. Certain directors and officers of Pembina may be directors or officers of entities in competition to Pembina or may be directors or officers of certain entities in which Pembina holds an equity investment in. As such, certain directors or officers of Pembina may encounter conflicts of interest in the administration of their duties with respect to Pembina. Pembina mitigates this risk by requiring directors and officers to disclose the existence of potential conflicts in accordance with Pembina’s Code of Ethics and in accordance with the ABCA.
Litigation
In the course of their business, Pembina and its various subsidiaries and affiliates may be subject to lawsuits and other claims, including with respect to our growth or expansion projects. Defence and settlement costs associated with such lawsuits and claims may be substantial, even with respect to lawsuits and claims that have no merit. Due to the inherent uncertainty of the litigation process, the resolution of any particular legal or other proceeding may have a material adverse effect on the financial position or operating results of Pembina.
Foreign Exchange Risk
Pembina's cash flows, namely a portion of its commodity-related cash flows, certain cash flows from U.S.-based infrastructure assets, and distributions from U.S.-based investments in equity accounted investees, are subject to currency risk, arising from the denomination of specific cash flows in U.S. dollars. Additionally, a portion of Pembina's capital expenditures, and contributions or loans to Pembina’s U.S.-based investments in equity accounted investees, may be denominated in U.S. dollars. Pembina monitors, assesses, and responds to these foreign currency risks using an active risk management program, which may include the exchange of foreign currency for domestic currency at a fixed rate.
Cyber Security
Pembina's infrastructure, technologies and data are becoming increasingly integrated, which creates a risk that the failure of one system could lead to failure of other systems which may also have an impact on the Company's physical assets. There is also a risk of a cyber-attack targeting the industry is also increasing. A breach in the security or failure of Pembina's information technology could result in operational outages, delays, damage to assets or the environment, reputational harm,
Pembina Pipeline Corporation 2019 Annual Report 52
lost profits, lost data and other adverse outcomes. Pembina's security strategy focuses on information technology security risk management, which includes continuous monitoring, threat detection and an incident response protocol.
Health and Safety
The operation of Pembina's business is subject to hazards of gathering, processing, transporting, fractionating, storing and marketing hydrocarbon products. Such hazards include, but are not limited to: blowouts; fires; explosions; gaseous leaks, including sour natural gas; migration of harmful substances; oil spills; corrosion; and acts of vandalism and terrorism. These hazards may interrupt operations, impact Pembina's reputation, cause loss of life or personal injury, result in loss of or damage to equipment, property, information technology systems, related data and control systems or cause environmental damage that may include polluting water, land or air.
53 Pembina Pipeline Corporation 2019 Annual Report
12. NON-GAAP MEASURES
Throughout this MD&A, Pembina has used the following terms that are not defined by GAAP but are used by management to evaluate the performance of Pembina and its businesses. Since non-GAAP measures do not have a standardized meaning prescribed by IFRS and are therefore unlikely to be comparable to similar measures presented by other companies, applicable securities regulations suggest that non-GAAP measures be clearly defined, qualified and reconciled to the most directly comparable GAAP measure. These non-GAAP measures are calculated and disclosed on a consistent basis from period to period.
The intent of non-GAAP measures is to provide additional useful information with respect to Pembina's operational and financial performance to investors and analysts though the measures do not have any standardized meaning under IFRS. The measures should not, therefore, be considered in isolation or used in substitute for measures of performance prepared in accordance with IFRS. Other issuers may calculate these non-GAAP measures differently.
Investors should be cautioned that net revenue, adjusted EBITDA, adjusted EBITDA per common share, adjusted cash flow from operating activities, cash flow from operating activities per common share, and adjusted cash flow from operating activities per common share should not be construed as alternatives to revenue, earnings, cash flow from operating activities, gross profit or other measures of financial results determined in accordance with GAAP as indicators of Pembina's performance.
Non-GAAP Proportionate Consolidation of Investments in Equity Accounted Investees Results
In accordance with IFRS, Pembina's jointly controlled investments are accounted for using equity accounting. Under equity accounting, the assets and liabilities of the investment are presented net in a single line item in the Consolidated Statement of Financial Position, Investments in Equity Accounted Investees. Net earnings from investments in equity accounted investees are recognized in a single line item in the Consolidated Statement of Earnings and Comprehensive Income, Share of Profit from Equity Accounted Investees. Cash contributions and distributions from investments in equity accounted investees represent Pembina’s share paid and received in the period to and from the investments in equity accounted investees.
To assist in understanding and evaluating the performance of these investments, Pembina is supplementing the IFRS disclosure with non-GAAP proportionate consolidation of Pembina’s interest in the investments in equity accounted investees. Pembina's proportionate interest in equity accounted investees has been included in adjusted EBITDA.
Net Revenue
Net revenue is a non-GAAP financial measure which is defined as total revenue less cost of goods sold including product purchases. Management believes that net revenue provides investors with a single measure to indicate the margin on sales before non-product operating expenses that is comparable between periods. Management utilizes net revenue to compare consecutive results, in Marketing & New Ventures and Facilities, to aggregate revenue generated by each of the Company's divisions and to set comparable objectives.
|
| | | | | | | | | | | | | | | | | | | | |
| 3 Months Ended December 31 | Pipelines | Facilities | Marketing &
New Ventures | Corporate &
Inter-division
Eliminations | Total |
| ($ millions) |
| | 2019 |
| 2018 |
| 2019 |
| 2018 |
| 2019 |
| 2018 |
| 2019 |
| 2018 |
| 2019 |
| 2018 |
|
| Revenue | 487 |
| 403 |
| 287 |
| 267 |
| 1,092 |
| 1,163 |
| (112 | ) | (107 | ) | 1,754 |
| 1,726 |
|
Cost of goods sold, including product purchases | — |
| — |
| 2 |
| 2 |
| 989 |
| 1,087 |
| (74 | ) | (69 | ) | 917 |
| 1,020 |
|
| Net revenue | 487 |
| 403 |
| 285 |
| 265 |
| 103 |
| 76 |
| (38 | ) | (38 | ) | 837 |
| 706 |
|
Pembina Pipeline Corporation 2019 Annual Report 54
|
| | | | | | | | | | | | | | | | | | | | |
| 12 Months Ended December 31 | Pipelines | Facilities | Marketing &
New Ventures | Corporate &
Inter-division
Eliminations | Total |
| ($ millions) |
| | 2019 |
| 2018 |
| 2019 |
| 2018 |
| 2019 |
| 2018 |
| 2019 |
| 2018 |
| 2019 |
| 2018 |
|
| Revenue | 1,787 |
| 1,588 |
| 1,121 |
| 1,014 |
| 4,804 |
| 5,175 |
| (482 | ) | (426 | ) | 7,230 |
| 7,351 |
|
Cost of goods sold, including product purchases | — |
| — |
| 4 |
| 8 |
| 4,417 |
| 4,789 |
| (311 | ) | (282 | ) | 4,110 |
| 4,515 |
|
| Net revenue | 1,787 |
| 1,588 |
| 1,117 |
| 1,006 |
| 387 |
| 386 |
| (171 | ) | (144 | ) | 3,120 |
| 2,836 |
|
Adjusted Earnings Before Interest, Taxes, Depreciation and Amortization ("adjusted EBITDA")
Adjusted EBITDA is a non-GAAP measure and is calculated as earnings for the year before net finance costs, income taxes, depreciation and amortization (included in operations and general and administrative expense) and unrealized gains or losses on commodity-related derivative financial instruments. The exclusion of unrealized gains or losses on commodity-related derivative financial instruments eliminates the non-cash impact of such gains or losses.
Adjusted EBITDA also includes adjustments to earnings for losses (gains) on disposal of assets, transaction costs incurred in respect of acquisitions, impairment charges or reversals in respect of goodwill, intangible assets, investments in equity accounted investees and property, plant and equipment, certain non-cash provisions and other amounts not reflective of ongoing operations. The adjustments made to earnings are also made to share of profit from investments in equity accounted investees. In addition, Pembina's proportionate share of results from investments in equity accounted investees with a preferred interest is presented in adjusted EBITDA as a 50 percent common interest. These additional adjustments are made to exclude various non-cash and other items that are not reflective of ongoing operations. Management believes that adjusted EBITDA provides useful information to investors as it is an important indicator of an issuer's ability to generate liquidity through cash flow from operating activities and equity accounted investees. Adjusted EBITDA is also used by investors and analysts for assessing financial performance and for the purpose of valuing an issuer, including calculating financial and leverage ratios. Management utilizes adjusted EBITDA to set objectives and as a key performance indicator of the Company's success. Pembina presents adjusted EBITDA as management believes it is a measure frequently used by analysts, investors and other stakeholders in evaluating the Company’s financial performance.
|
| | | | | | | | | | | | | | | | | | | | |
| 3 Months Ended December 31 | Pipelines | Facilities | Marketing &
New Ventures | Corporate &
Inter-division
Eliminations | Total |
| ($ millions, except per share amounts) |
| | 2019 |
| 2018 |
| 2019 |
| 2018 |
| 2019 |
| 2018 |
| 2019 |
| 2018 |
| 2019 |
| 2018 |
|
| Earnings before income tax | 29 |
| 292 |
| 161 |
| 142 |
| 94 |
| 178 |
| (136 | ) | (97 | ) | 148 |
| 515 |
|
| Adjustments to share of profit from equity accounted investees and other | 69 |
| 67 |
| 37 |
| 42 |
| 2 |
| (4 | ) | — |
| — |
| 108 |
| 105 |
|
| Net finance costs | 2 |
| 3 |
| 6 |
| 2 |
| (8 | ) | 6 |
| 60 |
| 45 |
| 60 |
| 56 |
|
| Depreciation and amortization | 66 |
| 56 |
| 50 |
| 39 |
| 8 |
| 6 |
| 15 |
| 7 |
| 139 |
| 108 |
|
| Unrealized loss (gain) on commodity-related derivative financial instruments | — |
| — |
| — |
| — |
| 23 |
| (89 | ) | — |
| — |
| 23 |
| (89 | ) |
| (Gain) loss on disposal of assets | 1 |
| — |
| — |
| — |
| — |
| — |
| (2 | ) | — |
| (1 | ) | — |
|
| Transaction costs incurred in respect of acquisitions | — |
| — |
| — |
| — |
| — |
| — |
| 10 |
| 2 |
| 10 |
| 2 |
|
| Impairment charges (reversals) and non-cash provisions | 300 |
| (1 | ) | — |
| 8 |
| 1 |
| 12 |
| (1 | ) | (1 | ) | 300 |
| 18 |
|
| Adjusted EBITDA | 467 |
| 417 |
| 254 |
| 233 |
| 120 |
| 109 |
| (54 | ) | (44 | ) | 787 |
| 715 |
|
Adjusted EBITDA per common share – basic (dollars) |
|
|
|
|
|
|
|
|
|
|
|
|
|
|
|
| 1.52 |
| 1.41 |
|
55 Pembina Pipeline Corporation 2019 Annual Report
|
| | | | | | | | | | | | | | | | | | | | |
| 12 Months Ended December 31 | Pipelines | Facilities | Marketing &
New Ventures | Corporate &
Inter-division
Eliminations | Total |
| ($ millions, except per share amounts) |
| 2019 |
| 2018 |
| 2019 |
| 2018 |
| 2019 |
| 2018 |
| 2019 |
| 2018 |
| 2019 |
| 2018 |
|
| Earnings before income tax | 1,034 |
| 1,220 |
| 618 |
| 546 |
| 376 |
| 415 |
| (500 | ) | (439 | ) | 1,528 |
| 1,742 |
|
| Adjustments to share of profit from equity accounted investees and other | 265 |
| 258 |
| 146 |
| 169 |
| 21 |
| 12 |
| — |
| — |
| 432 |
| 439 |
|
| Net finance costs | 9 |
| 9 |
| 23 |
| 6 |
| (8 | ) | 16 |
| 270 |
| 248 |
| 294 |
| 279 |
|
| Depreciation and amortization | 245 |
| 216 |
| 168 |
| 149 |
| 51 |
| 26 |
| 47 |
| 26 |
| 511 |
| 417 |
|
| Unrealized loss (gain) on commodity-related derivative financial instruments | — |
| — |
| — |
| — |
| 13 |
| (73 | ) | — |
| — |
| 13 |
| (73 | ) |
| Arbitration award payment | — |
| — |
| — |
| — |
| (33 | ) | — |
| — |
| — |
| (33 | ) | — |
|
| Loss on disposal of assets | 1 |
| — |
| — |
| — |
| — |
| — |
| — |
| — |
| 1 |
| — |
|
| Transaction costs incurred in respect of acquisitions | — |
| — |
| — |
| — |
| — |
| — |
| 12 |
| 9 |
| 12 |
| 9 |
|
| Impairment charges (reversals) and non-cash provisions | 300 |
| — |
| — |
| 10 |
| 3 |
| 13 |
| — |
| (1 | ) | 303 |
| 22 |
|
| Adjusted EBITDA | 1,854 |
| 1,703 |
| 955 |
| 880 |
| 423 |
| 409 |
| (171 | ) | (157 | ) | 3,061 |
| 2,835 |
|
Adjusted EBITDA per common share – basic (dollars) |
|
|
|
|
|
|
|
|
|
|
|
|
|
|
|
| 5.97 |
| 5.62 |
|
Adjusted Cash Flow from Operating Activities, Cash Flow from Operating Activities per Common Share and Adjusted Cash Flow from Operating Activities per Common Share
Adjusted cash flow from operating activities is a non-GAAP measure which is defined as cash flow from operating activities adjusting for the change in non-cash operating working capital, adjusting for current tax and share-based payment expenses, and deducting preferred share dividends paid. Adjusted cash flow from operating activities deducts preferred share dividends paid because they are not attributable to common shareholders. The calculation has been modified to include current tax and share-based payment expense as it allows management to better assess the obligations discussed below. Management believes that adjusted cash flow from operating activities provides comparable information to investors for assessing financial performance during each reporting period. Management utilizes adjusted cash flow from operating activities to set objectives and as a key performance indicator of the Company's ability to meet interest obligations, dividend payments and other commitments. Per common share amounts are calculated by dividing cash flow from operating activities, or adjusted cash flow from operating activities, as applicable, by the weighted average number of common shares outstanding.
|
| | | | | | | | |
| | 3 Months Ended December 31 | 12 Months Ended December 31 |
| ($ millions, except per share amounts) | 2019 |
| 2018 |
| 2019 |
| 2018 |
|
| Cash flow from operating activities | 728 |
| 674 |
| 2,532 |
| 2,256 |
|
Cash flow from operating activities per common share – basic (dollars) | 1.41 |
| 1.33 |
| 4.94 |
| 4.47 |
|
| Add (deduct): | | | | |
| Change in non-cash operating working capital | (99 | ) | (65 | ) | (106 | ) | 83 |
|
| Current tax expense | (32 | ) | (8 | ) | (210 | ) | (70 | ) |
| Taxes paid, net of foreign exchange | 23 |
| (13 | ) | 141 |
| 23 |
|
| Accrued share-based payments | (13 | ) | (8 | ) | (50 | ) | (48 | ) |
| Share-based payments | — |
| — |
| 50 |
| 32 |
|
| Preferred share dividends paid | (31 | ) | (37 | ) | (123 | ) | (122 | ) |
| Adjusted cash flow from operating activities | 576 |
| 543 |
| 2,234 |
| 2,154 |
|
Adjusted cash flow from operating activities per common share – basic (dollars) | 1.11 |
| 1.07 |
| 4.36 |
| 4.27 |
|
Pembina Pipeline Corporation 2019 Annual Report 56
13. ABBREVIATIONS
The following is a list of abbreviations that may be used in this MD&A:
|
| |
| Other | |
| B.C. | British Columbia |
| GAAP | Canadian generally accepted accounting principles |
| IFRS | International Financial Reporting Standards |
| LNG | Liquified natural gas |
| LPG | Liquified petroleum gas |
| NGL | Natural gas liquids |
| U.S. | United States |
| WCSB | Western Canadian Sedimentary Basin |
| Deep cut | Ethane-plus capacity extraction gas processing capabilities |
| Shallow cut | Sweet gas processing with propane and/or condensate-plus extraction capabilities |
| Kinder Acquisition | Pembina's acquisition of Kinder Morgan Canada Limited and the U.S. portion of the Cochin Pipeline system on December 16, 2019 |
| Volumes | For Pipelines and Facilities volumes are revenue volumes, defined as physical volumes plus volumes recognized from take-or-pay commitments. For Marketing & New Ventures volumes are marketed NGL volumes. Volumes are stated in mboe/d, with natural gas volumes converted to mboe/d from MMcf/d at a 6:1 ratio. |
|
| | | |
| Measurement | | Regulators | |
| mbbls | thousands of barrels | AER | Alberta Energy Regulator |
| mbpd | thousands of barrels per day | BCEA | British Columbia Environmental Assessment Office |
| mmbpd | millions of barrels per day | BCOGC | British Columbia Oil and Gas Commission |
| mmbbls | millions of barrels | CER | Canadian Energy Regulator |
| mboe/d | thousands of barrels of oil equivalent per day | NEB | National Energy Board |
| mmboe/d | millions of barrels of oil equivalent per day | PHMSA | Pipeline and Hazardous Material Safety Administration |
| MMcf/d | millions of cubic feet per day | | |
| bcf/d | billions of cubic feet per day | | |
| km | kilometer | | |
|
| |
| Investments in Equity Accounted Investees | |
| Pipelines: | |
| Alliance | 50 percent interest in the Alliance Pipeline |
| Ruby | 50 percent convertible preferred interest in the Ruby Pipeline |
| Facilities: | |
| Veresen Midstream | 45 percent interest in Veresen Midstream, which owns assets in western Canada serving the Montney geological play in northwestern Alberta and northeastern B.C. including gas processing plants and gas gathering pipelines and compression |
| Fort Corp | 50 percent interest in Fort Saskatchewan Ethylene Storage Limited Partnership and Fort Saskatchewan Ethylene Corporation |
| Marketing & New Ventures: | |
| Aux Sable | An ownership interest in Aux Sable (approximately 42.7 percent in Aux Sable U.S. and 50 percent in Aux Sable Canada), which includes an NGL fractionation facility and gas processing capacity near Chicago, Illinois and other natural gas and NGL processing facilities, logistics and distribution assets in the U.S. and Canada, as well as transportation contracts on Alliance |
| CKPC | 50 percent interest in the propane dehydrogenation ("PDH") plant and polypropylene ("PP") upgrading facility ("PDH/PP Facility") |
Readers are referred to the AIF dated February 27, 2020 on www.sedar.com for additional descriptions.
57 Pembina Pipeline Corporation 2019 Annual Report
14. FORWARD-LOOKING STATEMENTS & INFORMATION
In the interest of providing Pembina's security holders and potential investors with information regarding Pembina, including management's assessment of the Company's future plans and operations, certain statements contained in this MD&A constitute forward-looking statements or forward-looking information (collectively, "forward-looking statements"). Forward-looking statements are typically identified by words such as "anticipate", "continue", "estimate", "expect", "may", "will", "project", "should", "could", "would", "believe", "plan", "intend", "design", "target", "undertake", "view", "indicate", "maintain", "explore", "entail", "schedule", "objective", "strategy", "likely", "potential", "outlook", "aim", "purpose", "goal" and similar expressions suggesting future events or future performance.
By their nature, such forward-looking statements involve known and unknown risks, uncertainties and other factors that may cause actual results or events to differ materially from those anticipated in such forward-looking statements. Pembina believes the expectations reflected in those forward-looking statements are reasonable but no assurance can be given that these expectations will prove to be correct and such forward-looking statements included in this MD&A should not be unduly relied upon. These forward-looking statements speak only as of the date of the MD&A.
In particular, this MD&A contains forward-looking statements pertaining to the following:
| |
| • | the Kinder Acquisition, including the strategic rationale and the anticipated benefits thereof; |
| |
| • | the future levels and sustainability of cash dividends that Pembina intends to pay to its shareholders, the dividend payment date and the tax treatment thereof; |
| |
| • | planning, construction, locations, capital expenditure estimates, schedules, regulatory and environmental applications and anticipated approvals, expected capacity, incremental volumes, in-service dates, rights, sources of product, activities, benefits and operations with respect to new construction of, or expansions on existing, pipelines, gas services facilities, fractionation facilities, terminalling, storage and hub facilities and other facilities or energy infrastructure, as well as the impact of Pembina's new projects on its future financial performance; |
| |
| • | anticipated synergies between assets under development, assets being acquired and existing assets of Pembina; |
| |
| • | pipeline, processing, fractionation and storage facility and system operations and throughput levels; |
| |
| • | treatment under governmental regulatory regimes in Canada and the U.S., including taxes and tax regimes, environmental and greenhouse gas regulations and related abandonment and reclamation obligations, and Aboriginal, landowner and other stakeholder consultation requirements; |
| |
| • | Pembina's estimates of and strategy for payment of future abandonment costs and decommissioning obligations, and deferred tax liability; |
| |
| • | Pembina's strategy and the development and expected timing of new business initiatives and growth opportunities and the impact thereof; |
| |
| • | increased throughput potential, processing capacity and fractionation capacity due to increased oil and gas industry activity and new connections and other initiatives on Pembina's pipelines and at Pembina's facilities; |
| |
| • | expected future cash flows and the sufficiency thereof, financial strength, sources of and access to funds at attractive rates, future contractual obligations, future financing options, future renewal of credit facilities, availability of capital to fund growth plans, operating obligations and dividends and the use of proceeds from financings; |
| |
| • | Pembina's expectations regarding involvement of partners on the Jordan Cove project; |
| |
| • | current ratings targets on Pembina's debt and the likelihood of a downgrade below investment-grade ratings; |
| |
| • | tolls and tariffs and processing, transportation, fractionation, storage and services commitments and contracts; |
| |
| • | operating risks (including the amount of future liabilities related to pipelines spills and other environmental incidents) and related insurance coverage and inspection and integrity programs; |
| |
| • | the adoption and impact of new accounting standards; |
| |
| • | inventory and pricing in North American liquids market; |
| |
| • | the impact of the current commodity price environment on Pembina; and |
| |
| • | competitive conditions and Pembina's ability to position itself competitively in the industry. |
Various factors or assumptions are typically applied by Pembina in drawing conclusions or making the forecasts, projections, predictions or estimations set out in forward-looking statements based on information currently available to Pembina. These factors and assumptions include, but are not limited to:
| |
| • | oil and gas industry exploration and development activity levels and the geographic region of such activity; |
| |
| • | the success of Pembina's operations; |
| |
| • | prevailing commodity prices, interest rates and exchange rates and the ability of Pembina to maintain current credit ratings; |
| |
| • | the availability of capital to fund future capital requirements relating to existing assets and projects; |
| |
| • | expectations regarding Pembina's pension plan; |
| |
| • | future operating costs including geotechnical and integrity costs being consistent with historical costs; |
| |
| • | oil and gas industry compensation levels remaining consistent; |
| |
| • | in respect of current developments, expansions, planned capital expenditures, completion dates and capacity expectations: that third parties will provide any necessary support; that any third-party projects relating to growth projects will be sanctioned and completed as expected; that any required commercial agreements can be reached; that all required regulatory and environmental approvals can be obtained on the necessary terms in a timely manner; that counterparties will comply with contracts in a timely manner; that there are no unforeseen events preventing the performance of contracts or the completion of the relevant facilities, and that there are no unforeseen material costs relating to the facilities which are not recoverable from customers; |
| |
| • | in respect of the stability of Pembina's dividends: prevailing commodity prices, margins and exchange rates; that Pembina's future results of operations will be consistent with past performance and management expectations in relation thereto; the continued availability of capital at attractive prices to fund future capital requirements relating to existing assets and projects, including but not limited to future capital expenditures relating to expansion, upgrades and maintenance shutdowns; the success of growth projects; future operating costs; that counterparties to material agreements will continue to perform in a timely manner; that there are no unforeseen events preventing the performance of contracts; and that there are no unforeseen material construction or other costs related to current growth projects or current operations; |
| |
| • | prevailing regulatory, tax and environmental laws and regulations and tax pool utilization; and |
| |
| • | the amount of future liabilities relating to lawsuits and environmental incidents and the availability of coverage under Pembina's insurance policies (including in respect of Pembina's business interruption insurance policy). |
The actual results of Pembina could differ materially from those anticipated in these forward-looking statements as a result of the material risk factors set forth below:
| |
| • | the failure to realize the anticipated benefits and synergies of the Kinder Acquisition following closing; |
| |
| • | the regulatory environment and decisions and Aboriginal and landowner consultation requirements; |
| |
| • | the impact of competitive entities and pricing; |
| |
| • | labour and material shortages; |
| |
| • | reliance on key relationships, joint venture partners, and agreements and the outcome of stakeholder engagement; |
| |
| • | the strength and operations of the oil and natural gas production industry and related commodity prices; |
| |
| • | non-performance or default by counterparties to agreements which Pembina or one or more of its subsidiaries has entered into in respect of its business; |
| |
| • | actions by joint venture partners or other partners which hold interests in certain of Pembina's assets; |
| |
| • | actions by governmental or regulatory authorities including changes in tax laws and treatment, changes in royalty rates, climate change initiatives or policies or increased environmental regulation; |
| |
| • | fluctuations in operating results; |
| |
| • | adverse general economic and market conditions in Canada, North America and elsewhere, including changes, or prolonged weakness, as applicable, in interest rates, foreign currency exchange rates, commodity prices, supply/demand trends and overall industry activity levels; |
| |
| • | constraints on, or the unavailability of adequate infrastructure; |
| |
| • | changes in the political environment, in North America and elsewhere, and public opinion; |
| |
| • | ability to access various sources of debt and equity capital; |
| |
| • | changes in credit ratings; |
| |
| • | technology and security risks; |
| |
| • | natural catastrophe; and |
| |
| • | the other factors discussed under "Risk Factors" herein and in Pembina's AIF for the year ended December 31, 2019, which are available at www.pembina.com and in Canada under Pembina's company profile on www.sedar.com and in the U.S. on the Company's profile at www.sec.gov. |
These factors should not be construed as exhaustive. Unless required by law, Pembina does not undertake any obligation to publicly update or revise any forward-looking statements, whether as a result of new information, future events or otherwise. Any forward-looking statements contained herein are expressly qualified by this cautionary statement.
Pembina Pipeline Corporation 2019 Annual Report 58
MANAGEMENT'S REPORT
The audited consolidated financial statements of Pembina Pipeline Corporation (the "Company" or "Pembina") are the responsibility of Pembina's management. The financial statements have been prepared in accordance with International Financial Reporting Standards as issued by the International Accounting Standards Board, using management's best estimates and judgments, where appropriate.
Management is responsible for the reliability and integrity of the financial statements, the notes to the financial statements and other financial information contained in this report. In the preparation of these financial statements, estimates are sometimes necessary because a precise determination of certain assets and liabilities is dependent on future events. Management believes such estimates have been based on careful judgments and have been properly reflected in the accompanying financial statements.
Management's Assessment of Internal Controls over Financial Reporting
Management is responsible for establishing and maintaining adequate internal control over financial reporting, as defined in Rule 13a - 15(e) and 15d - 15(e) under the United States Securities Exchange Act of 1934, as amended (the "Exchange Act") and National Instrument 52-109 Certification of Disclosure in Issuer's Annual and Interim Filings ("NI 52-109").
Management, including the Chief Executive Officer ("CEO") and the Chief Financial Officer ("CFO"), has conducted an evaluation of Pembina's internal control over financial reporting based on criteria established in Internal Control - Integrated Framework (2013) issued by the Committee of Sponsoring Organizations of the Treadway Commission (COSO). Based on management's assessment as at December 31, 2019, the CEO and CFO have concluded that Pembina's internal control over financial reporting is effective.
In accordance with the provisions of NI 52-109 and consistent with U.S. Securities and Exchange Commission (the "SEC") guidance, the scope of the evaluation did not include internal controls over financial reporting of Kinder Morgan Canada Limited or controls associated with the U.S. portion of the Cochin Pipeline system, both of which Pembina acquired on December 16, 2019 (collectively the "Kinder Acquisition") and were excluded from management's evaluation of the effectiveness of Pembina’s internal control over financial reporting as at December 31, 2019 due to the proximity of the Kinder Acquisition to year-end. Further details related to the Kinder Acquisition are disclosed in Note 6 to Pembina's consolidated financial statements for the year ended December 31, 2019. The assets and revenue acquired in the Kinder Acquisition represented approximately 16 percent and nil percent, respectively, of Pembina's total assets and revenue as at December 31, 2019.
Due to its inherent limitations, internal control over financial reporting is not intended to provide absolute assurance that a misstatement of Pembina's financial statements would be prevented or detected. Further, the evaluation of the effectiveness of internal control over financial reporting was made as at a specific date, and continued effectiveness in future periods is subject to the risks that controls may become inadequate.
The Board of Directors of Pembina (the "Board") is responsible for ensuring management fulfills its responsibilities for financial reporting and internal control. The Board is assisted in exercising its responsibilities through the Audit Committee, which consists of five non-management directors. The Audit Committee meets periodically with management and the internal and external auditors to satisfy itself that management's responsibilities are properly discharged, to review the financial statements and to recommend approval of the financial statements to the Board.
KPMG LLP, the independent auditors, have audited Pembina's consolidated financial statements and the effectiveness of internal control over financial reporting as of December 31, 2019 in accordance with the standards of the Public Company Accounting Oversight Board (United States). The independent auditors have full and unrestricted access to the Audit Committee to discuss their audit and their related findings.
59 Pembina Pipeline Corporation 2019 Annual Report
Changes in Internal Control over Financial Reporting
Pembina's internal controls over financial reporting commencing December 16, 2019 include the systems, processes and controls associated with the Kinder Acquisition, as well as additional controls designed to result in complete and accurate consolidation of the financial information relating to the Kinder Acquisition. Other than the Kinder Acquisition, there has been no change in Pembina's internal control over financial reporting that occurred during the year ended December 31, 2019 that has materially affected, or are reasonably likely to materially affect, Pembina's internal control over financial reporting.
|
| |
"M. H. Dilger" M. H. Dilger President and Chief Executive Officer | "J. Scott Burrows" J. Scott Burrows Senior Vice President and Chief Financial Officer |
February 27, 2020
Pembina Pipeline Corporation 2019 Annual Report 60
REPORT OF INDEPENDENT REGISTERED PUBLIC ACCOUNTING FIRM
To the Shareholders and Board of Directors of Pembina Pipeline Corporation
Opinion on the Consolidated Financial Statements
We have audited the accompanying consolidated statements of financial position of Pembina Pipeline Corporation and subsidiaries (the "Company") as of December 31, 2019 and 2018, the related consolidated statements of earnings and comprehensive income, changes in equity, and cash flows for each of the years then ended, and the related notes (collectively, the consolidated financial statements). In our opinion, the consolidated financial statements present fairly, in all material respects, the financial position of the Company as of December 31, 2019 and 2018, and the results of its operations and its cash flows for the years then ended, in conformity with International Financial Reporting Standards as issued by the International Accounting Standards Board.
We also have audited, in accordance with the standards of the Public Company Accounting Oversight Board (United States) (PCAOB), the Company's internal control over financial reporting as of December 31, 2019, based on criteria established in Internal Control - Integrated Framework (2013) issued by the Committee of Sponsoring Organizations of the Treadway Commission, and our report dated February 27, 2020 expressed an unqualified opinion on the effectiveness of the Company's internal control over financial reporting.
Basis for Opinion
These consolidated financial statements are the responsibility of the Company's management. Our responsibility is to express an opinion on these consolidated financial statements based on our audits. We are a public accounting firm registered with the PCAOB and are required to be independent with respect to the Company in accordance with the U.S. federal securities laws and the applicable rules and regulations of the Securities and Exchange Commission and the PCAOB.
We conducted our audits in accordance with the standards of the PCAOB. Those standards require that we plan and perform the audit to obtain reasonable assurance about whether the consolidated financial statements are free of material misstatement, whether due to error or fraud. Our audits included performing procedures to assess the risks of material misstatement of the consolidated financial statements, whether due to error or fraud, and performing procedures that respond to those risks. Such procedures included examining, on a test basis, evidence regarding the amounts and disclosures in the consolidated financial statements. Our audits also included evaluating the accounting principles used and significant estimates made by management, as well as evaluating the overall presentation of the consolidated financial statements. We believe that our audits provide a reasonable basis for our opinion.
Critical Audit Matters
The critical audit matters communicated below are matters arising from the current period audit of the consolidated financial statements that were communicated or required to be communicated to the audit committee and that: (1) relate to accounts or disclosures that are material to the consolidated financial statements and (2) involved our especially challenging, subjective, or complex judgments. The communication of critical audit matters does not alter in any way our opinion on the consolidated financial statements, taken as a whole, and we are not, by communicating the critical audit matters below, providing separate opinions on the critical audit matters or on the accounts or disclosures to which they relate.
Assessment of goodwill impairment
As discussed in Notes 4 and 9 to the consolidated financial statements, the Company performs goodwill impairment testing on an annual basis. The recoverable amount was determined using a fair value less costs of disposal approach which is based on a discounted cash flow model. For the purpose of the impairment test, goodwill has been allocated to the Company's operating segments which represents the lowest level within the Company at which the goodwill is monitored for management purposes. The goodwill balance as of December 31, 2019 was $4,684 million.
61 Pembina Pipeline Corporation 2019 Annual Report
We identified the assessment of goodwill impairment as a critical audit matter. A high degree of subjective auditor judgment was required to evaluate the significant revenue assumptions such as contract renewal volumes and rates, projected commodity pricing ("forecasted cash flow assumptions") and discount rates used in the discounted cash flow model. Minor changes to those assumptions significantly impacted the Company's assessment of the recoverable amount of the operating segments.
The primary procedures we performed to address this critical audit matter included the following. We tested certain internal controls over the Company's estimate of the recoverable amount of the operating segments, including controls related to forecasted cash flow assumptions and the discount rate used in the determination of the recoverable amount. We evaluated the Company's projected commodity pricing assumptions by comparing to publicly available forward price curves. We compared the Company's historical forecasted results, including contract renewal volumes and rates, to actual results to assess the Company's ability to accurately forecast. In addition, we involved a valuation professional with specialized skills and knowledge, who assisted in:
| |
| • | Evaluating the discount rates used in the valuation for each operating segment by comparing them against publicly available market data for comparable entities; and |
| |
| • | Developing an estimate of the recoverable amount of the operating segments by performing a sensitivity analysis over the estimate of the Company's forecasted cash flows and the discount rate, and compared the results of our estimate of fair value to the Company's estimate. |
Evaluation of the fair value measurement of the customer relationships intangible assets acquired in the Kinder Acquisition
As discussed in Note 6 to the consolidated financial statements, on December 16, 2019, the Company acquired all the issued and outstanding shares of Kinder Morgan Canada Limited by way of a plan of arrangement and the U.S. portion of the Cochin Pipeline system (collectively, the "Kinder Acquisition") for total consideration of $4,255 million. The acquisition date fair value for the customer relationships intangible assets recognized was $1,254 million.
We identified the evaluation of the fair value measurement of the customer relationships intangible assets acquired as a critical audit matter. There was a high degree of subjectivity in evaluating the Company's assumptions over forecasted revenue growth rates, contract renewal rates, and the discount rates. There was limited observable market information and the calculated fair value of such assets was sensitive to possible changes to these assumptions.
The primary procedures we performed to address this critical audit matter included the following. We tested certain internal controls over the Company's estimate of acquisition date fair values, including controls related to assumptions over forecasted revenue growth rates, contract renewal rates and the discount rates. We evaluated the Company's forecasted revenue growth rates from existing customers by comparing to the acquired assets' historical actual results, as well as by comparing contractual revenue details to signed contracts to assess the accuracy of the Company's forecast. In addition, we involved valuation professionals with specialized skills and knowledge, who assisted in:
| |
| • | Evaluating the contract renewal assumptions used by the Company as an input in the fair value of the intangible assets by examining existing contract terms and assessing future contract renewal expectations based on industry knowledge and experience from comparable market transactions; |
| |
| • | Evaluating the methodologies used by the Company to determine discount rates used in addition to comparing the discount rates to publicly available market data for comparable entities; and |
| |
| • | Assessing the methodologies used by the Company to determine the fair value of the customer relationships intangible assets and testing the accuracy of calculations of fair value. |
Pembina Pipeline Corporation 2019 Annual Report 62
Assessment of impairment of the Ruby investment
As discussed in Note 10 to the consolidated financial statements, the Company recognized an impairment charge on its convertible preferred share interest in Ruby of $300 million. At December 31, 2019, the Company's investment in Ruby, subsequent to the impairment charge, accounted for $1,273 million of the carrying value of its total equity investments of $5,954 million. The carrying amounts of the Company's non-financial assets, other than: inventory, assets arising from employee benefits and deferred tax assets, are reviewed at each reporting date to determine whether there is any indication of impairment. If any such indication exists, the asset's recoverable amount is estimated. The recoverable amount of the Ruby investment was determined to be $1,273 million using a value in use approach by discounting expected cash flows resulting from the Company's convertible preferred share interest.
We identified the assessment of impairment of the Ruby investment as a critical audit matter. A high degree of subjective auditor judgment was required to evaluate the Company's assumptions used to determine the recoverable amount, including future contracts, renewals, volumes, future financing within the investment, ability to utilize tax deductions ("forecasted cash flow assumptions"), and the discount rate. These assumptions were challenging to test as minor changes to those assumptions had a significant effect on the Company's assessment of the recoverable amount of the investment in Ruby.
The primary procedures we performed to address this critical audit matter included the following. We tested certain internal controls over the Company's estimate of recoverable amount, including controls related to forecasted cash flow assumptions and the discount rate used in the determination of the recoverable amount. We evaluated the Company's expected future contracts, renewals and volumes by comparing them to historical contracted volumes adjusted for market projections. We compared the Company's historical cash flow forecasts to actual results to assess the Company's ability to accurately forecast. We developed an estimate of the recoverable amount of the Ruby investment using the estimate of the forecasted cash flows and the discount rate evaluated by our valuation professional, and compared the results of our estimate of value in use to the Company's estimate. We involved a tax professional with specialized skills and knowledge who assisted in evaluating the projection of the utilization of available tax deductions. In addition, we involved a valuation professional with specialized skills and knowledge, who assisted in:
| |
| • | Evaluating the future financing alternatives against comparable market financing transactions for similar entities; and |
| |
| • | Evaluating the discount rate used in the valuation by comparing it against publicly available market data for comparable investments. |
Chartered Professional Accountants
We have served as the Company's auditor since 1997.
Calgary, Canada
February 27, 2020
63 Pembina Pipeline Corporation 2019 Annual Report
REPORT OF INDEPENDENT REGISTERED PUBLIC ACCOUNTING FIRM
To the Shareholders and Board of Directors of Pembina Pipeline Corporation
Opinion on Internal Control Over Financial Reporting
We have audited Pembina Pipeline Corporation’s (and subsidiaries') (the "Company") internal control over financial reporting as of December 31, 2019, based on criteria established in Internal Control - Integrated Framework (2013) issued by the Committee of Sponsoring Organizations of the Treadway Commission. In our opinion, the Company maintained, in all material respects, effective internal control over financial reporting as of December 31, 2019, based on criteria established in Internal Control - Integrated Framework (2013) issued by the Committee of Sponsoring Organizations of the Treadway Commission.
We also have audited, in accordance with the standards of the Public Company Accounting Oversight Board (United States) (PCAOB), the consolidated statements of financial position of the Company as of December 31, 2019 and 2018, the related consolidated statements of earnings and comprehensive income, changes in equity, and cash flows for the years then ended, and the related notes (collectively, the consolidated financial statements), and our report dated February 27, 2020 expressed an unqualified opinion on those consolidated financial statements.
The Company acquired Kinder Morgan Canada Limited and the U.S. portion of the Cochin Pipeline system (collectively, the "Kinder Acquisition"), on December 16, 2019, and management excluded from its assessment of the effectiveness of the Company's internal control over financial reporting as of December 31, 2019, Kinder Acquisition's internal control over financial reporting associated with approximately 16 percent of total assets and nil percent of total revenues included in the consolidated financial statements of the Company as of and for the year ended December 31, 2019. Our audit of internal control over financial reporting of the Company also excluded an evaluation of the internal control over financial reporting of the Kinder Acquisition.
Basis for Opinion
The Company's management is responsible for maintaining effective internal control over financial reporting and for its assessment of the effectiveness of internal control over financial reporting, included in the accompanying Management's Annual Report on Internal Control over Financial Reporting included in Management's Discussion and Analysis. Our responsibility is to express an opinion on the Company's internal control over financial reporting based on our audit. We are a public accounting firm registered with the PCAOB and are required to be independent with respect to the Company in accordance with the U.S. federal securities laws and the applicable rules and regulations of the Securities and Exchange Commission and the PCAOB.
We conducted our audit in accordance with the standards of the PCAOB. Those standards require that we plan and perform the audit to obtain reasonable assurance about whether effective internal control over financial reporting was maintained in all material respects. Our audit of internal control over financial reporting included obtaining an understanding of internal control over financial reporting, assessing the risk that a material weakness exists, and testing and evaluating the design and operating effectiveness of internal control based on the assessed risk. Our audit also included performing such other procedures as we considered necessary in the circumstances. We believe that our audit provides a reasonable basis for our opinion.
Pembina Pipeline Corporation 2019 Annual Report 64
Definition and Limitations of Internal Control Over Financial Reporting
A company's internal control over financial reporting is a process designed to provide reasonable assurance regarding the reliability of financial reporting and the preparation of financial statements for external purposes in accordance with generally accepted accounting principles. A company's internal control over financial reporting includes those policies and procedures that (1) pertain to the maintenance of records that, in reasonable detail, accurately and fairly reflect the transactions and dispositions of the assets of the company; (2) provide reasonable assurance that transactions are recorded as necessary to permit preparation of financial statements in accordance with generally accepted accounting principles, and that receipts and expenditures of the company are being made only in accordance with authorizations of management and directors of the company; and (3) provide reasonable assurance regarding prevention or timely detection of unauthorized acquisition, use, or disposition of the company's assets that could have a material effect on the financial statements.
Because of its inherent limitations, internal control over financial reporting may not prevent or detect misstatements. Also, projections of any evaluation of effectiveness to future periods are subject to the risk that controls may become inadequate because of changes in conditions, or that the degree of compliance with the policies or procedures may deteriorate.
Chartered Professional Accountants
Calgary, Canada
February 27, 2020
65 Pembina Pipeline Corporation 2019 Annual Report
CONSOLIDATED STATEMENTS OF FINANCIAL POSITION
|
| | | | |
| As at December 31 | | |
| ($ millions) | 2019 |
| 2018(1) |
|
Assets Current assets | | |
| Cash and cash equivalents | 129 |
| 157 |
|
| Trade receivables and other (Note 7) | 692 |
| 604 |
|
| Inventory | 126 |
| 198 |
|
| Derivative financial instruments (Note 24) | 40 |
| 54 |
|
| | 987 |
| 1,013 |
|
| Non-current assets | | |
| Property, plant and equipment (Note 8) | 18,775 |
| 14,730 |
|
| Investments in equity accounted investees (Note 10) | 5,954 |
| 6,368 |
|
| Intangible assets and goodwill (Note 9) | 6,429 |
| 4,409 |
|
| Right-of-use assets (Note 13) | 822 |
| — |
|
| Advances to related parties and other assets (Note 27) | 186 |
| 144 |
|
| | 32,166 |
| 25,651 |
|
| Total assets | 33,153 |
| 26,664 |
|
Liabilities and equity Current liabilities | | |
| Trade payables and other (Note 12) | 1,013 |
| 803 |
|
| Loans and borrowings (Note 14) | 74 |
| 480 |
|
| Dividends payable | 110 |
| 97 |
|
| Lease liabilities | 112 |
| — |
|
| Contract liabilities (Note 18) | 39 |
| 37 |
|
| Taxes payable | 103 |
| 67 |
|
| Derivative financial instruments (Note 24) | 6 |
| 6 |
|
| | 1,457 |
| 1,490 |
|
| Non-current liabilities | | |
| Loans and borrowings (Note 14) | 10,078 |
| 7,057 |
|
| Lease liabilities | 707 |
| — |
|
| Decommissioning provision (Note 15) | 864 |
| 569 |
|
| Contract liabilities (Note 18) | 192 |
| 131 |
|
| Deferred tax liabilities (Note 11) | 2,906 |
| 2,774 |
|
| Other liabilities | 179 |
| 239 |
|
| | 14,926 |
| 10,770 |
|
| Total liabilities | 16,383 |
| 12,260 |
|
| Equity | | |
| Attributable to shareholders | 16,710 |
| 14,344 |
|
| Attributable to non-controlling interest | 60 |
| 60 |
|
| Total equity | 16,770 |
| 14,404 |
|
| Total liabilities and equity | 33,153 |
| 26,664 |
|
(1) Pembina has applied IFRS 16 Leases at January 1, 2019 using the modified retrospective approach and has not restated comparative information. See Note 3. |
| See accompanying notes to the consolidated financial statements | | |
| | | |
| Approved on behalf of the Board of Directors: | | |
|
| | |
| | | |
"Gordon J. Kerr" Gordon J. Kerr Director | | "Randall J. Findlay" Randall J. Findlay Director |
Pembina Pipeline Corporation 2019 Annual Report 66
CONSOLIDATED STATEMENTS OF EARNINGS AND COMPREHENSIVE INCOME
|
| | | | |
| For the years ended December 31 | | |
| ($ millions, except per share amounts) | 2019 |
| 2018(1) |
|
| Revenue (Note 18) | 7,230 |
| 7,351 |
|
| Cost of sales | 5,187 |
| 5,457 |
|
| Gain on commodity-related derivative financial instruments | (20 | ) | (22 | ) |
| Share of profit from equity accounted investees (Note 10) | 370 |
| 411 |
|
| Gross profit | 2,433 |
| 2,327 |
|
| General and administrative | 296 |
| 279 |
|
| Other expense | 15 |
| 27 |
|
| Impairment of investment in equity accounted investees (Note 10) | 300 |
| — |
|
| Results from operating activities | 1,822 |
| 2,021 |
|
| Net finance costs (Note 19) | 294 |
| 279 |
|
| Earnings before income tax | 1,528 |
| 1,742 |
|
| Current tax expense (Note 11) | 210 |
| 70 |
|
| Deferred tax (recovery) expense (Note 11) | (174 | ) | 394 |
|
| Income tax expense | 36 |
| 464 |
|
| Earnings attributable to shareholders | 1,492 |
| 1,278 |
|
| Other comprehensive (loss) income | | |
| Exchange (loss) gain on translation of foreign operations | (213 | ) | 330 |
|
| Remeasurements of defined benefit liability, net of tax (Note 22) | (6 | ) | (6 | ) |
| Total comprehensive income attributable to shareholders | 1,273 |
| 1,602 |
|
Earnings attributable to common shareholders, net of preferred share dividends (Note 21) | 1,361 |
| 1,157 |
|
Earnings per common share – basic (dollars) (Note 21) | 2.66 |
| 2.28 |
|
Earnings per common share – diluted (dollars) (Note 21) | 2.65 |
| 2.28 |
|
Weighted average number of common shares (millions) | | |
Basic (Note 21) | 512 |
| 505 |
|
Diluted (Note 21) | 514 |
| 509 |
|
(1) Pembina has applied IFRS 16 Leases at January 1, 2019 using the modified retrospective approach and has not restated comparative information. See Note 3. |
| See accompanying notes to the consolidated financial statements |
67 Pembina Pipeline Corporation 2019 Annual Report
CONSOLIDATED STATEMENTS OF CHANGES IN EQUITY
|
| | | | | | | | | | | | | | |
| | Attributable to Shareholders of the Company | | |
| ($ millions) | Common Share Capital |
| Preferred Share Capital |
| Deficit |
| Accumulated Other Comprehensive (Loss) Income |
| Total |
| Non-Controlling Interest |
| Total Equity |
|
December 31, 2018(1) | 13,662 |
| 2,423 |
| (2,058 | ) | 317 |
| 14,344 |
| 60 |
| 14,404 |
|
| Impact of change in accounting policy (Note 3) | — |
| — |
| 22 |
| — |
| 22 |
| — |
| 22 |
|
| Opening Value January 1, 2019 | 13,662 |
| 2,423 |
| (2,036 | ) | 317 |
| 14,366 |
| 60 |
| 14,426 |
|
| Total comprehensive income | | | | | | | |
| Earnings | — |
| — |
| 1,492 |
| — |
| 1,492 |
| — |
| 1,492 |
|
| Other comprehensive income | | | | | | | |
| Exchange loss on translation of foreign operations | — |
| — |
| — |
| (213 | ) | (213 | ) |
|
| (213 | ) |
| Remeasurements of defined benefit liability, net of tax (Note 22) | — |
| — |
| — |
| (6 | ) | (6 | ) | — |
| (6 | ) |
| Total comprehensive income | — |
| — |
| 1,492 |
| (219 | ) | 1,273 |
| — |
| 1,273 |
|
| Transactions with shareholders of the Company | | | | | | | |
| Common shares issued, net of issue costs (Note 16) | 1,710 |
| — |
| — |
| — |
| 1,710 |
| — |
| 1,710 |
|
| Preferred shares issued, net of issue costs (Note 16) | — |
| 533 |
| — |
| — |
| 533 |
| — |
| 533 |
|
| Share-based payment transactions (Note 16) | 167 |
| — |
| — |
| — |
| 167 |
| — |
| 167 |
|
| Dividends declared – common (Note 16) | — |
| — |
| (1,213 | ) | — |
| (1,213 | ) | — |
| (1,213 | ) |
| Dividends declared – preferred (Note 16) | — |
| — |
| (126 | ) | — |
| (126 | ) | — |
| (126 | ) |
| Total transactions with shareholders of the Company | 1,877 |
| 533 |
| (1,339 | ) | — |
| 1,071 |
| — |
| 1,071 |
|
| December 31, 2019 | 15,539 |
| 2,956 |
| (1,883 | ) | 98 |
| 16,710 |
| 60 |
| 16,770 |
|
| | | | | | | | |
| December 31, 2017 | 13,447 |
| 2,424 |
| (2,083 | ) | (7 | ) | 13,781 |
| 60 |
| 13,841 |
|
| Total comprehensive income | | | | | | | |
| Earnings | — |
| — |
| 1,278 |
| — |
| 1,278 |
| — |
| 1,278 |
|
| Other comprehensive income | | | | | | | |
| Exchange gain on translation of foreign operations | — |
| — |
| — |
| 330 |
| 330 |
| — |
| 330 |
|
| Remeasurements of defined benefit liability, net of tax (Note 22) | — |
| — |
| — |
| (6 | ) | (6 | ) | — |
| (6 | ) |
| Total comprehensive income | — |
| — |
| 1,278 |
| 324 |
| 1,602 |
| — |
| 1,602 |
|
| Transactions with shareholders of the Company | | | | | | | |
| Preferred shares issue costs (Note 16) | — |
| (1 | ) | — |
| — |
| (1 | ) | — |
| (1 | ) |
| Debenture conversions (Note 16) | 140 |
| — |
| — |
| — |
| 140 |
| — |
| 140 |
|
| Share-based payment transactions (Note 16) | 75 |
| — |
| — |
| — |
| 75 |
| — |
| 75 |
|
| Dividends declared – common (Note 16) | — |
| — |
| (1,131 | ) | — |
| (1,131 | ) | — |
| (1,131 | ) |
| Dividends declared – preferred (Note 16) | — |
| — |
| (122 | ) | — |
| (122 | ) | — |
| (122 | ) |
| Total transactions with shareholders of the Company | 215 |
| (1 | ) | (1,253 | ) | — |
| (1,039 | ) | — |
| (1,039 | ) |
| December 31, 2018 | 13,662 |
| 2,423 |
| (2,058 | ) | 317 |
| 14,344 |
| 60 |
| 14,404 |
|
(1) Pembina has applied IFRS 16 Leases at January 1, 2019 using the modified retrospective approach and has not restated comparative information. See Note 3. | |
| See accompanying notes to the consolidated financial statements |
Pembina Pipeline Corporation 2019 Annual Report 68
CONSOLIDATED STATEMENTS OF CASH FLOWS
|
| | | | |
| For the years ended December 31 | | |
| ($ millions) | 2019 |
| 2018(1) |
|
| Cash provided by (used in) | | |
| Operating activities | | |
| Earnings | 1,492 |
| 1,278 |
|
| Adjustments for: | | |
| Share of profit from equity accounted investees (Note 10) | (370 | ) | (411 | ) |
| Distributions from equity accounted investees (Note 10) | 575 |
| 622 |
|
| Depreciation and amortization (Note 8 & 9) | 511 |
| 417 |
|
| Impairment of investment in equity accounted investees (Note 10) | 300 |
| — |
|
| Unrealized loss (gain) on commodity-related derivative financial instruments | 13 |
| (73 | ) |
| Net finance costs (Note 19) | 294 |
| 279 |
|
| Net interest paid (Note 19) | (269 | ) | (259 | ) |
| Income tax expense (Note 11) | 36 |
| 464 |
|
| Taxes paid | (141 | ) | (26 | ) |
| Share-based compensation expense (Note 23) | 66 |
| 63 |
|
| Share-based compensation payment | (50 | ) | (32 | ) |
| Loss on asset disposal | (1 | ) | 19 |
|
| Net change in contract liabilities | (30 | ) | 11 |
|
| Other | — |
| (13 | ) |
| Change in non-cash operating working capital | 106 |
| (83 | ) |
| Cash flow from operating activities | 2,532 |
| 2,256 |
|
| Financing activities | | |
| Bank borrowings and issuance of debt | 2,153 |
| 1,366 |
|
| Repayment of loans and borrowings | (1,866 | ) | (1,998 | ) |
| Repayment of lease liability | (68 | ) | — |
|
| Issuance of medium term notes (Note 14) | 2,318 |
| 700 |
|
| Issue costs and financing fees | (14 | ) | (8 | ) |
| Exercise of stock options | 151 |
| 61 |
|
| Dividends paid | (1,323 | ) | (1,247 | ) |
| Cash flow provided by (used in) financing activities | 1,351 |
| (1,126 | ) |
| Investing activities | | |
| Capital expenditures | (1,645 | ) | (1,226 | ) |
| Contributions to equity accounted investees (Note 10) | (206 | ) | (58 | ) |
| Acquisitions (Note 6) | (2,009 | ) | — |
|
| Interest paid during construction (Note 19) | (42 | ) | (35 | ) |
| Recovery of assets or proceeds from sale | 7 |
| 5 |
|
| Advances to related parties | (63 | ) | (84 | ) |
| Changes in non-cash investing working capital and other | 48 |
| 87 |
|
| Cash flow used in investing activities | (3,910 | ) | (1,311 | ) |
| Change in cash and cash equivalents | (27 | ) | (181 | ) |
| Effect of movement in exchange rates on cash held | (1 | ) | 17 |
|
| Cash and cash equivalents, beginning of period | 157 |
| 321 |
|
| Cash and cash equivalents, end of period | 129 |
| 157 |
|
(1) Pembina has applied IFRS 16 Leases at January 1, 2019 using the modified retrospective approach and has not restated comparative information. See Note 3. |
| See accompanying notes to the consolidated financial statements |
69 Pembina Pipeline Corporation 2019 Annual Report
NOTES TO THE CONSOLIDATED FINANCIAL STATEMENTS
1. REPORTING ENTITY
Pembina Pipeline Corporation ("Pembina" or the "Company") is a Calgary-based, leading transportation and midstream service provider serving North America's energy industry. The consolidated financial statements include the accounts of Pembina, its subsidiary companies, partnerships and any investments in associates and joint arrangements as at and for the year ended December 31, 2019.
Pembina owns an integrated system of pipelines that transport various hydrocarbon liquids and natural gas products produced primarily in western Canada. Pembina also owns gas gathering and processing facilities and an oil and natural gas liquids infrastructure, storage and logistics business; is growing an export terminals business; and is currently constructing a petrochemical facility to convert propane into polypropylene. Pembina's integrated assets and commercial operations along the majority of the hydrocarbon value chain allow it to offer a full spectrum of midstream and marketing services to the energy sector.
2. BASIS OF PREPARATION
a. Basis of Measurement and Statement of Compliance
The consolidated financial statements have been prepared on a historical cost basis with some exceptions, as detailed in the accounting policies set out below in accordance with International Financial Reporting Standards ("IFRS"), as issued by the International Accounting Standards Board ("IASB"). Except for the changes described in Note 3, these accounting policies have been applied consistently for all periods presented in these consolidated financial statements.
Certain insignificant comparative amounts have been reclassified to conform to the presentation adopted in the current year.
These consolidated financial statements were authorized for issue by Pembina's Board of Directors on February 27, 2020.
b. Functional and Presentation Currency
The consolidated financial statements are presented in Canadian dollars. All financial information presented in Canadian dollars has been disclosed in millions, except where noted. The assets and liabilities of subsidiaries, and investments in equity accounted investees, whose functional currencies are other than Canadian dollars are translated into Canadian dollars at the foreign exchange rate at the balance sheet date, while revenues and expenses of such subsidiaries are translated using average monthly foreign exchange rates, which approximate the foreign exchange rates on the dates of the transactions. Foreign exchange differences arising on translation of subsidiaries and investments in equity accounted investees with a functional currency other than the Canadian dollar are included in other comprehensive income.
c. Use of Estimates and Judgments
The preparation of the consolidated financial statements in conformity with IFRS requires management to make judgments, estimates and assumptions that are based on the facts and circumstances and estimates at the date of the consolidated financial statements and affect the application of accounting policies and the reported amounts of assets, liabilities, income and expenses. Actual results may differ from these estimates.
Judgments, estimates and underlying assumptions are reviewed on an ongoing basis. Revisions to accounting estimates are recognized in the period in which the estimates are revised and in any future periods affected.
Pembina Pipeline Corporation 2019 Annual Report 70
The following judgment and estimation uncertainties are those management considers material to the consolidated financial statements:
Judgments
(i) Business Combinations
Business combinations are accounted for using the acquisition method of accounting. The determination of fair value often requires management to make judgments about future possible events. The assumptions with respect to lease identification, classification and measurement, the fair value of property plant and equipment, intangible assets, decommissioning provisions and contract liabilities acquired, as well as the determination of deferred taxes, generally require the most judgment.
(ii) Depreciation and Amortization
Depreciation and amortization of property, plant and equipment and intangible assets are based on management's judgment of the most appropriate method to reflect the pattern of an asset's future economic benefit expected to be consumed by Pembina. Among other factors, these judgments are based on industry standards and historical experience.
(iii) Impairment
Assessment of impairment of non-financial assets is based on management’s judgment of whether or not there are sufficient internal or external factors that would indicate that an asset, investment, or cash generating unit ("CGU") is impaired. The determination of a CGU is based on management's judgment and is an assessment of the smallest group of assets that generate cash inflows independently of other assets. In addition, management applies judgment to assign goodwill acquired as part of a business combination to the CGU or group of CGUs that is expected to benefit from the synergies of the business combination for purposes of impairment testing. When an impairment test is performed, the carrying value of a CGU or group of CGUs is compared to its recoverable amount, defined as the greater of fair value less costs to sell and value in use. As such, the asset composition of a CGU or group of CGUs directly impacts both the carrying value and recoverability of the assets included therein.
(iv) Assessment of Joint Control Over Joint Arrangements
The determination of joint control requires judgment about the influence Pembina has over the financial and operating decisions of an arrangement and the extent of the benefits it obtains based on the facts and circumstances of the arrangement during the reporting period. Joint control exists when decisions about the relevant activities require the unanimous consent of the parties that control the arrangement collectively. Ownership percentage alone may not be a determinant of joint control.
(v) Pattern of Revenue Recognition
The pattern of revenue recognition is impacted by management's judgments as to the nature of Pembina's performance obligations, the amount of consideration allocated to performance obligations that are not sold on a stand-alone basis, the valuation of material rights and the timing of when those performance obligations have been satisfied.
(vi) Leases
Management applies judgment to determine whether a contract is, or contains, a lease from both a lessee and lessor perspective. This assessment is based on whether the contract conveys a right to control the use of an identified asset for a period of time in exchange for consideration. Key judgments include whether a contract identifies an asset (or portion of an asset), whether the lessee obtains substantially all the economic benefits of the asset over the contract term and whether the lessee has the right to direct the asset's use. Judgment is also applied in determining the rate used to discount the lease payments.
71 Pembina Pipeline Corporation 2019 Annual Report
Estimates
(i) Business Combinations
Estimates of future cash flows, forecast prices, interest rates, discount rates, cost, market values and useful lives are made in determining the fair value of assets acquired and liabilities assumed. Changes in any of the assumptions or estimates used in determining the fair value of acquired assets and liabilities could impact the amounts assigned to assets, liabilities, intangible assets, goodwill and deferred taxes in the purchase price equation. Future earnings can be affected as a result of changes in future depreciation and amortization, asset or goodwill impairment.
(ii) Provisions and Contingencies
Management uses judgment in determining the likelihood of realization of contingent assets and liabilities to determine the outcome of contingencies. Provisions recognized are based on management's best estimate of the timing, scope and amount of expected future cash outflows to settle the obligation.
Based on the long-term nature of the decommissioning provision, the most significant uncertainties in estimating the provision are the determination of whether a present obligation exists, the discount and inflation rates used, the costs that will be incurred and the timing of when these costs will occur.
(iii) Deferred Taxes
The calculation of the deferred tax asset or liability is based on assumptions about the timing of many taxable events and the enacted or substantively enacted rates anticipated to be applicable to income in the years in which temporary differences are expected to be realized or reversed.
(iv) Depreciation and Amortization
Estimated useful lives of property, plant and equipment and intangible assets are based on management's assumptions and estimates of the physical useful lives of the assets, the economic lives, which may be associated with the reserve lives and commodity type of the production area, in addition to the estimated residual value.
(v) Impairment of Non-Financial Assets
In determining the recoverable amount of a CGU, a group of CGUs or an individual asset, management uses its best estimates of future cash flows, and assesses discount rates to reflect management’s best estimate of a rate that reflects a current market assessment of the time value of money and the specific risks associated with the underlying assets and cash flows.
(vi) Impairment of Financial Assets
The measurement of financial assets carried at amortized cost includes management’s estimates regarding the expected credit losses that will be realized on these financial assets.
(vii) Revenue from Contracts with Customers
In estimating the contract value, management makes assessments as to whether variable consideration is constrained or not reasonably estimable, such that an amount or portion of an amount cannot be included in the estimate of the contract value. Management's estimates of the likelihood of a customer’s ability to use outstanding make-up rights may impact the timing of revenue recognition. In addition, in determining the amount of consideration to be allocated to performance obligations that are not sold on a stand-alone basis, management estimates the stand-alone selling price of each performance obligation under the contract, taking into consideration the location and volume of goods or services being provided, the market environment, and customer specific considerations.
Pembina Pipeline Corporation 2019 Annual Report 72
(viii) Fair Value of Financial Instruments
For Level 2 valued financial instruments, management makes assumptions and estimates value based on observable inputs such as quoted forward prices, time value and volatility factors. For Level 3 valued financial instruments, management uses estimates of financial forecasts, expected cash flows and risk adjusted discount rates to measure fair value.
(ix) Employee Benefit Obligations
An actuarial valuation is prepared to measure Pembina's net employee benefit obligations using management’s best estimates with respect to longevity, discount and inflation rates, compensation increases, market returns on plan assets, retirement and termination rates.
(x) Leases
In measuring its lease liabilities, management makes assessments of the stand-alone selling prices of each lease and non-lease component for the purposes of allocating consideration to each component. Management applies its best estimate with respect to the likelihood of renewal, extension and termination option exercise in determining the lease term.
3. CHANGES IN ACCOUNTING POLICIES
Except for the changes described below, accounting policies as disclosed in Note 4 of the Consolidated Financial Statements have been applied to all periods consistently.
IFRS 16 Leases ("IFRS 16")
Pembina adopted IFRS 16 effective January 1, 2019. IFRS 16 introduced a new lease definition that increases the focus on control of the underlying asset. In addition, IFRS 16 introduced a single, on balance sheet accounting model for lessees that has resulted in Pembina recording right-of-use assets representing its right to use the underlying assets and lease liabilities representing its obligation to make lease payments. Lessor accounting has remained unchanged, except for changes in the classification of subleases.
IFRS 16 has been applied using the modified retrospective approach, under which the cumulative effect of initial application was recognized in equity at January 1, 2019 as further disclosed below. Accordingly, the comparative financial information has not been restated and continues to be reported under International Accounting Standard ("IAS") 17 Leases and International Financial Reporting Interpretations Committee Interpretation 4 Determining whether an arrangement contains a lease ("IFRIC 4"). The details of Pembina's accounting policies under IAS 17 and IFRIC 4, for the comparative period, are disclosed separately below.
On transition to IFRS 16, Pembina elected to apply the practical expedient to grandfather the assessment of whether a contract entered into before the date of initial application was, or contained, a lease under IFRIC 4, rather than reassess based on the new definition of a lease under IFRS 16. Contracts previously identified as leases were recognized and measured in accordance with IFRS 16.
| |
| a. | Accounting Policies Applicable from January 1, 2019 |
The details of significant accounting policies under IFRS 16 and the nature of the changes to previous accounting policies under IAS 17 are outlined below.
For all contracts entered into or amended on or after January 1, 2019, Pembina applies the definition of a lease under IFRS 16 to determine if a contract is, or contains, a lease. A specific asset is the subject of a lease if the contract conveys the right to control the use of that identified asset for a period of time in exchange for consideration. This determination is made at inception of a contract, and is reassessed when the terms and conditions of the contract are amended.
73 Pembina Pipeline Corporation 2019 Annual Report
At inception or on reassessment of a contract that contains a lease component, Pembina allocates contract consideration to the lease and non-lease components on the basis of their relative stand-alone prices. The consideration allocated to the lease components is recognized in accordance with the policies for lessee and lessor leases, as described below. The consideration allocated to non-lease components is recognized in accordance with its nature.
Leased assets are recognized as right-of-use assets, with corresponding lease liabilities recognized on the statement of financial position at the lease commencement date. Right-of-use assets include terminals, rail, buildings, storage tanks and land and other assets.
Right-of-use assets are initially recognized at cost, which comprises the initial amount of the lease liability adjusted for any lease payments made at or before the commencement date, plus any initial direct costs incurred and an estimate of costs to dismantle and remove the underlying asset and restore the site of an underlying asset to the condition required by the terms of the lease, less any lease incentives received. Right-of-use assets recognized as a result of business combination are initially measured in the same manner, plus an adjustment to reflect favourable or unfavourable lease terms compared to market terms. Right-of-use assets are subsequently measured at cost less any accumulated depreciation and accumulated impairment losses, adjusted for remeasurements of the lease liability. The right-of-use asset is depreciated over the lesser of the asset’s useful life and the lease term on a straight-line basis.
The lease liability is initially measured at the present value of the lease payments, discounted using the interest rate implicit in the lease if readily determinable, or at a rate Pembina would be required to pay to borrow over a similar term, with a similar security to obtain an asset of a similar value to the right-of-use asset. Lease payments in an optional renewal period are included in the lease liability if Pembina is reasonably certain to exercise such option. The lease liability is subsequently increased by interest expense on the lease liability and decreased by lease payments made. Interest expense is recorded in earnings at an amount that represents a constant periodic rate of interest on the remaining balance of the lease liability.
The lease liability is remeasured when there is a change in future lease payments arising from a change in an index or rate, a change in the estimated guaranteed residual value to be paid, or a change in the assessment of whether a purchase option, extension option or termination option is reasonably certain to be exercised. A corresponding adjustment is made to the right of use asset when a liability is remeasured, or the adjustment is recorded in earnings if the right of use asset has been reduced to zero.
Pembina has elected to apply the recognition exemptions for short-term and low value leases. Pembina recognizes lease payments associated with these leases as an expense on a straight-line basis over the lease term.
Lessor leases are classified as either operating leases or finance leases according to the substance of the contract. Leases transferring substantially all of the risks incidental to asset ownership are classified as finance leases, while all other leases are classified as operating leases. Subleases are classified as either operating or finance leases in reference to the right-of-use asset arising from the head lease. Under IAS 17, Pembina also classified lessor subleases as operating or finance leases based on an overall assessment of whether the lease transferred substantially all of the risks and rewards incidental to ownership of the underlying asset, considering certain indicators such as whether the lease was for the major part of the economic life of the asset.
Assets under finance lease are recognized in finance lease receivables at the value of the net investment in the lease. The net investment in the lease is measured at the net present value of the future amounts receivable, discounted using the interest rate implicit in the lease. Finance income is recognized over the lease term in a pattern reflecting a consistent rate of return on the finance lease receivable.
Lease payments from operating leases are recognized as income on either a straight-line basis or a systematic basis representative of the pattern in which benefit from the use of the underlying asset is received.
Pembina Pipeline Corporation 2019 Annual Report 74
| |
| b. | Accounting Policies Applicable Prior to January 1, 2019 |
The details of significant accounting policies under IAS 17 and IFRIC 4, under which comparative balances continue to be reported, are outlined below.
At inception of an arrangement, Pembina determines whether such an arrangement is or contains a lease. A specific asset is the subject of a lease if fulfilment of the arrangement is dependent on the use of that specified asset. An arrangement conveys the right to use the asset if the arrangement conveys to a lessee the right to control the use of the underlying asset.
At inception or upon reassessment of the arrangement, Pembina separates payments and other consideration required by such an arrangement into those for the lease and those for other elements on the basis of their relative fair values.
Leases which Pembina assumes substantially all the risks and rewards of ownership are classified as finance leases. The leased asset is initially recognized at an amount equal to the lower of its fair value and the present value of the minimum lease payments. Subsequent to initial recognition, the asset is accounted for in accordance with the accounting policy applicable to that asset.
Minimum lease payments made under finance leases are apportioned between the finance cost and the reduction of the outstanding liability. The finance cost is allocated to each period during the lease term so as to produce a constant periodic rate of interest on the remaining balance of the liability.
Other leases are operating leases and are not recognized in Pembina's consolidated statement of financial position.
Payments made under lessee operating leases are recognized in earnings on a straight-line basis over the term of the lease. Lease incentives received are deferred and recognized over the term of the lease.
Payments received under lessor operating leases are recognized in earnings in accordance with the benefit received by the customer.
At transition, lease liabilities for contracts previously identified as operating leases under IAS 17 were measured at the present value of the remaining lease payments, discounted at Pembina's incremental borrowing rate as at January 1, 2019. For all leases, right-of-use assets were measured at an amount equal to the lease liability.
Pembina applied the following practical expedients on transition:
| |
| • | Pembina applied a single discount rate to a portfolio of leases with similar characteristics rather than multiple discount rates to match the term of each lease; |
| |
| • | Pembina has relied on onerous lease contract assessments previously performed under IAS 37 Provisions, Contingent Liabilities and Contingent Assets as an alternative to an impairment review on right-of-use assets, resulting in an adjustment of the right-of-use asset balance by the amount of the onerous lease contract provision outstanding immediately before the date of initial application; and |
| |
| • | Pembina elected not to recognize right-of-use assets and corresponding lease liabilities for leases with terms of less than 12 months remaining. |
There has been no change to the accounting for contracts previously identified as finance leases under IAS 17. The carrying amount of the right-of-use asset and lease liability on transition were determined to be equal to the carrying amount of the lease asset and lease liability under IAS 17.
Sub-lease contracts previously classified as operating leases are recognized as finance leases under IFRS 16.
75 Pembina Pipeline Corporation 2019 Annual Report
| |
| d. | Financial Statement Impacts |
On transition to IFRS 16, Pembina recognized significant right-of-use assets and lease liabilities related to rail, buildings and land. Further disclosures related to leases are provided in Note 13 to the Consolidated Financial Statements.
| |
| i. | Consolidated Statement of Financial Position |
The impacts of adoption of IFRS 16 as at January 1, 2019 are as follows:
|
| | | | | | |
| As at December 31, 2018 |
| Adjustments |
| Opening Value January 1, 2019 |
|
| ($ millions) |
| Assets |
|
|
|
| Current assets |
|
|
|
Trade receivables and other(1) | 604 |
| 1 |
| 605 |
|
| Non-current assets |
|
|
|
Property, plant and equipment(2) | 14,730 |
| (18 | ) | 14,712 |
|
Right-of-use assets(3) | — |
| 427 |
| 427 |
|
Advances to related parties and other assets(1)(4) | 144 |
| 33 |
| 177 |
|
| Liabilities and Equity |
|
|
|
| Current liabilities |
|
|
|
Trade payables and other(4) | 870 |
| (7 | ) | 863 |
|
Loans and borrowings(5) | 480 |
| (8 | ) | 472 |
|
| Lease liabilities | — |
| 64 |
| 64 |
|
| Non-current liabilities |
|
|
|
Loans and borrowings(5) | 7,057 |
| (11 | ) | 7,046 |
|
| Lease liabilities | — |
| 416 |
| 416 |
|
| Deferred tax liabilities | 2,774 |
| 8 |
| 2,782 |
|
Other liabilities(4) | 239 |
| (41 | ) | 198 |
|
| Equity |
|
|
|
| Attributable to shareholders | 14,344 |
| 22 |
| 14,366 |
|
| |
(1) | Includes lessor finance lease receivables. |
| |
(2) | Finance lease assets previously recorded in property, plant and equipment were reclassified to right-of-use assets. |
| |
(3) | Right-of-use assets are recorded at a value equal to the associated lease liability of $480 million, less $33 million for sublease arrangements, less onerous lease liability balance at December 31, 2018 of $20 million. |
| |
(4) | Operating lease payments were previously recognized on a straight-line basis, with the difference between cash payments and expense (income) recorded to a deferred lease asset or deferred lease liability. These deferrals were derecognized on adoption of IFRS 16. In addition, $20 million of onerous lease liabilities were offset against right-of-use assets. |
| |
(5) | Finance leases previously recorded in loans and borrowings were reclassified to lease liabilities. |
| |
| ii. | Reconciliation of Lease Liability |
|
| | |
| ($ millions) |
|
|
| Lease commitments, disclosed at December 31, 2018 | 796 |
|
| Leases not yet commenced | (33 | ) |
| Non-lease components | (217 | ) |
| Renewal options reasonably certain to be exercised | 53 |
|
| Total undiscounted lease payments | 599 |
|
Discounting impact(1) | (119 | ) |
| Lease liabilities recognized as at January 1, 2019 | 480 |
|
| |
(1) | Pembina discounted lease payments using the incremental credit-risk adjusted borrowing rate applicable to the contract. The weighted-average rate applied on transition for all lease liabilities was 4.01 percent. |
Pembina Pipeline Corporation 2019 Annual Report 76
4. SIGNIFICANT ACCOUNTING POLICIES
The accounting policies as set out below have been applied consistently to all periods presented in these consolidated financial statements.
a. Basis of Consolidation
i) Business Combinations
Pembina measures goodwill as the fair value of the consideration transferred including the recognized amount of any non-controlling interest in the acquiree, less the fair value of the identifiable assets acquired and liabilities assumed, all measured as of the acquisition date. When the excess is negative, a bargain purchase gain is recognized immediately in earnings.
Pembina elects on a transaction-by-transaction basis whether to measure non-controlling interest at its fair value, or at its proportionate share of the recognized amount of the identifiable net assets, at the acquisition date.
Non-controlling interests represent equity interests in subsidiaries owned by outside parties. The share of net assets of subsidiaries attributable to non-controlling interests is presented as a separate component of equity. Their share of net income and other comprehensive income is also recognized in this separate component of equity. Changes in Pembina's ownership interest in subsidiaries that do not result in a loss of control are accounted for as equity transactions. Adjustments to non-controlling interests are based on a proportionate amount of the net assets of the subsidiary. No adjustments are made to goodwill and no gain or loss is recognized in earnings.
Transaction costs, other than those associated with the issue of debt or equity securities, that Pembina incurs in connection with a business combination are expensed as incurred.
ii) Subsidiaries
Subsidiaries are entities, including unincorporated entities such as partnerships, controlled by Pembina. The financial results of subsidiaries are included in the consolidated financial statements from the date that control commences until the date that control ceases. The accounting policies of subsidiaries are aligned with the policies adopted by Pembina.
iii) Joint Arrangements
Joint arrangements represent activities where Pembina has joint control established by a contractual agreement. Joint control requires unanimous consent for the relevant financial and operational decisions. A joint arrangement is either a joint operation, whereby the parties have rights to the assets and obligations for the liabilities, or a joint venture, whereby the parties have rights to the net assets.
For a joint operation, the consolidated financial statements include Pembina's proportionate share of the assets, liabilities, revenues, expenses and cash flows of the arrangement with items of a similar nature on a line-by-line basis, from the date that joint control commences until the date that joint control ceases.
Joint ventures are accounted for using the equity method of accounting and are initially recognized at cost, or fair value if acquired as part of a business combination. Joint ventures are adjusted thereafter for the post-acquisition change in the Company's share of the equity accounted investment's net assets. Pembina's consolidated financial statements include its share of the equity accounted investment's profit or loss and other comprehensive income, or income equal to preferred distributions for certain preferred share interests in equity accounted investees, until the date that joint control ceases. When Pembina's share of losses exceeds its interest in an equity accounted investee, the carrying amount of that interest, including any long-term investments, is reduced to nil, and the recognition of further losses is discontinued except to the extent that Pembina has an obligation or has made payments on behalf of the investee. Distributions from investments in equity accounted investees are recognized when received.
77 Pembina Pipeline Corporation 2019 Annual Report
Acquisition of an incremental ownership in a joint arrangement where Pembina maintains joint control is recorded at cost or fair value if acquired as part of a business combination. Where Pembina has a partial disposal, including a deemed disposal, of a joint arrangement and maintains joint control, the resulting gains or losses are recorded in earnings at the time of disposal.
iv) Transactions Eliminated on Consolidation
Balances and transactions, and any revenue and expenses arising from intersegment transactions, are eliminated in preparing the consolidated financial statements. Gains arising from transactions with investments in equity accounted investees are eliminated against the investment to the extent of Pembina's interest in the investee. Losses are eliminated in the same way as unrealized gains, but only to the extent that there is no evidence of impairment.
v) Foreign Currency
Transactions in foreign currencies are translated to Pembina's functional currency at exchange rates at the dates of the transactions. Monetary assets and liabilities denominated in foreign currencies at the reporting date are retranslated to Pembina's functional currency at the exchange rate at that date, with exchange differences recognized in earnings.
Non-monetary assets and liabilities denominated in foreign currencies that are measured at fair value are retranslated to the functional currency at the exchange rate at the date that the fair value was determined. Non-monetary items that are measured in terms of historical cost in a foreign currency are translated using the exchange rate at the date of the transaction.
Gains and losses arising from translation of foreign subsidiaries or investments in equity accounted investees with a functional currency other than Pembina's Canadian dollar reporting currency are reflected in other comprehensive income. Asset and liability accounts are translated at the period-end exchange rates while revenues, expenses, gains and losses are translated at the exchange rates in effect at the time of the transaction.
b. Cash and Cash Equivalents
Cash and cash equivalents comprise cash balances, call deposits and short-term investments with original maturities of ninety days or less, and are used by Pembina in the management of its short-term commitments.
c. Inventories
Inventories are measured at the lower of cost and net realizable value and consist primarily of crude oil, NGL and spare parts. The cost of inventories is determined using the weighted average costing method and includes direct purchase costs and when applicable, costs of production, extraction, fractionation, and transportation. Net realizable value is the estimated selling price in the ordinary course of business less the estimated selling costs. All changes in the value of inventories are reflected in earnings.
d. Financial Instruments
Financial assets and liabilities are offset and the net amount presented in the consolidated statement of financial position when, and only when, Pembina has a legal right to offset the amounts and intends either to settle on a net basis or to realize the asset and settle the liability simultaneously.
i) Non-Derivative Financial Assets
Pembina initially recognizes loans, receivables, advances to related parties and deposits on the date that they are originated. All other financial assets are recognized on the trade date at which Pembina becomes a party to the contractual provisions of the instrument.
Pembina Pipeline Corporation 2019 Annual Report 78
Pembina derecognizes a financial asset when the contractual rights to the cash flows from the asset expire, or it transfers the rights to receive the contractual cash flows on the financial asset in a transaction in which substantially all the risks and rewards of ownership of the financial asset are transferred. Any interest in transferred financial assets that is created or retained by Pembina is recognized as a separate asset or liability. On derecognition, the difference between the carrying amount of the financial asset and the consideration received is recognized in earnings.
Pembina classifies non-derivative financial assets into the following categories:
Financial Assets at Amortized Cost
A financial asset is classified in this category if the asset is held within a business model whose objective is to collect contractual cash flows on specified dates that are solely payments of principal and interest. At initial recognition, financial assets at amortized cost are recognized at fair value plus directly attributable transaction costs. Subsequent to initial recognition, these financial assets are recorded at amortized cost using the effective interest method less any impairment loss allowances.
Financial Assets at Fair Value Through Other Comprehensive Income
A financial asset is classified in this category if the asset is held within a business model whose objective is met by both collecting contractual cash flows and selling financial assets. Pembina did not have any financial assets classified as fair value through other comprehensive income during the years covered in these financial statements.
Financial Assets at Fair Value Through Earnings
A financial asset is classified in this category if it is not classified as a financial asset at amortized cost or a financial asset at fair value through other comprehensive income, or it is an equity instrument designated as such on initial recognition. At initial recognition, and subsequently, these financial assets are recognized at fair value.
ii) Non-Derivative Financial Liabilities
Pembina initially recognizes financial liabilities on the trade date at which Pembina becomes a party to the contractual provisions of the instrument.
Non-derivative financial liabilities are recognized initially at fair value plus any directly attributable transaction costs. Subsequent to initial recognition these financial liabilities are measured at amortized cost using the effective interest method.
Pembina derecognizes a financial liability when its contractual obligations are discharged, cancelled or expire. On derecognition, the difference between the carrying value of the liability and the consideration paid, including any non-cash assets transferred or liabilities assumed, is recognized in earnings.
Pembina records a modification or exchange of an existing liability as a derecognition of the financial liability if the terms are substantially different, resulting in a difference of more than 10 percent when comparing the present value of the remaining cash flows of the existing liability to the present value of the discounted cash flows under the new terms using the original effective interest rate.
If a modification to an existing liability causes a revision to the estimated payments of the liability but is not treated as a derecognition, Pembina adjusts the gross carrying amount of the liability to the present value of the estimated contractual cash flows using the instrument’s original effective interest rate, with the difference recorded in earnings.
Pembina's non-derivative financial liabilities are comprised of the following: bank overdrafts, trade payables and accrued liabilities, taxes payable, dividends payable, loans and borrowings including finance lease obligations and other liabilities.
Bank overdrafts that are repayable on demand and form an integral part of Pembina's cash management are included as a component of cash and cash equivalents for the purpose of the consolidated statements of cash flows.
79 Pembina Pipeline Corporation 2019 Annual Report
iii) Common Share Capital
Common shares are classified as equity. Incremental costs directly attributable to the issue of common shares and share options are recognized as a deduction from equity, net of any tax effects.
iv) Preferred Share Capital
Preferred shares are classified as equity because they bear discretionary dividends and do not contain any obligations to deliver cash or other financial assets. Discretionary dividends are recognized as equity distributions on approval by Pembina's Board of Directors. Incremental costs directly attributable to the issue of preferred shares are recognized as a deduction from equity, net of any tax effects.
v) Derivative Financial Instruments
Pembina holds derivative financial instruments to manage its interest rate, commodity, power costs and foreign exchange risk exposures. Embedded derivatives are separated from the host contract and accounted for separately if the economic characteristics and risks of the host contract and the embedded derivative meet the definition of a derivative, and the combined instrument is not measured at fair value through earnings. Derivatives are recognized initially at fair value with attributable transaction costs recognized in earnings as incurred. Subsequent to initial recognition, derivatives are measured at fair value and changes in non-commodity-related derivatives are recognized immediately in earnings as part of net finance costs and changes in commodity-related derivatives are recognized immediately in earnings.
e. Property, Plant and Equipment
i) Recognition and Measurement
Items of property, plant and equipment are measured initially at cost, unless they are acquired as part of a business combination in which case they are initially measured at fair value. Thereafter, property, plant and equipment are recorded net of accumulated depreciation and accumulated impairment losses.
Cost includes expenditures that are directly attributable to the acquisition of the asset. The cost of self-constructed assets includes the cost of materials and direct labour, any other costs directly attributable to bringing the assets to a working condition for their intended use, estimated decommissioning provisions and borrowing costs on qualifying assets.
Cost may also include any gain or loss realized on foreign currency transactions directly attributable to the purchase or construction of property, plant and equipment. Purchased software that is integral to the functionality of the related equipment is capitalized as part of that equipment.
When parts of an item of property, plant and equipment have different useful lives, they are accounted for as separate components of property, plant and equipment.
The gain or loss on disposal of an item of property, plant and equipment is determined by comparing the proceeds from disposal with the carrying amount of property, plant and equipment, and is recognized in earnings.
ii) Subsequent Costs
The cost of replacing a part of an item of property, plant and equipment is recognized in the carrying amount of the item if it is probable that the future economic benefits embodied within the part will flow to Pembina, and its cost can be measured reliably. The carrying amount of the replaced part is derecognized and recorded as depreciation expense. The cost of maintenance and repair expenses of the property, plant and equipment are recognized in earnings as incurred.
Pembina Pipeline Corporation 2019 Annual Report 80
iii) Depreciation
Depreciation is based on the cost of an asset less its residual value. Significant components of individual assets are assessed and if a component has a useful life that is different from the remainder of the asset, that component is depreciated separately. Land and linefill are not depreciated.
Depreciation is recognized in earnings over an asset's useful life on a straight line or declining balance basis, which most closely reflects the expected pattern of consumption of the future economic benefits embodied in the asset. An asset's useful life is determined as the lower of its physical life and economic life. Depreciation commences once an asset is available for use.
Depreciation methods, useful lives and residual values are reviewed annually and adjusted if appropriate.
f. Intangible Assets
i) Goodwill
Goodwill that arises upon acquisitions is included in intangible assets and goodwill. See Note 4(a)(i) for the policy on measurement of goodwill at initial recognition.
Subsequent Measurement
Goodwill is measured at cost less accumulated impairment losses.
In respect of investments in equity accounted investees, goodwill is included in the carrying amount of the investment, and an impairment loss on such an investment is allocated to the investment and not to any asset, including goodwill, that forms the carrying amount of the investment in equity accounted investee.
ii) Other Intangible Assets
Other intangible assets acquired individually by Pembina are initially recognized and measured at cost, unless they are acquired as part of a business combination in which case they are initially measured at fair value. Thereafter, intangible assets with finite useful lives are recorded net of accumulated amortization and accumulated impairment losses.
iii) Subsequent Expenditures
Subsequent expenditures are capitalized only when they increase the future economic benefits embodied in the specific asset to which they relate. All other expenditures are recognized in earnings as incurred.
iv) Amortization
Amortization is based on the cost of an asset less its residual value.
Amortization is recognized in earnings over the estimated useful lives of intangible assets, other than goodwill, from the date that they are available for use.
Amortization methods, useful lives and residual values are reviewed annually and adjusted if appropriate.
g. Leases
Accounting policies related to leases are disclosed in Note 3 Changes in Accounting Policies.
81 Pembina Pipeline Corporation 2019 Annual Report
h. Impairment
i) Non-Derivative Financial Assets
Impairment of financial assets carried at amortized cost is assessed using the lifetime expected credit loss of the financial asset at initial recognition and throughout the life of the financial asset, except where credit risk has not increased significantly since initial recognition, in which case impairment is assessed at the 12 month expected credit loss of the financial asset at the reporting date.
In determining the impairment loss allowance for trade receivables, Pembina uses historical trends of the probability of default, timing of recoveries and the amount of loss incurred, adjusted for management's judgment as to whether current economic and credit conditions are such that the actual losses are likely to be greater or less than suggested by historical trends.
Impairment losses are recognized in earnings and reflected as a reduction in the related financial asset.
ii) Non-Financial Assets
The carrying amounts of Pembina's non-financial assets, other than: inventory, assets arising from employee benefits and deferred tax assets, are reviewed at each reporting date to determine whether there is any indication of impairment. If any such indication exists, the asset's recoverable amount is estimated.
For goodwill and intangible assets that have indefinite useful lives or that are not yet available for use, the recoverable amount is estimated annually in connection with the annual goodwill impairment test. An impairment loss is recognized if the carrying amount of an asset or its related CGU exceeds its estimated recoverable amount.
The recoverable amount of an asset or CGU is the greater of its value in use and its fair value less costs to sell. In assessing the recoverable amount, the estimated future cash flows are discounted to their present value using a pre-tax discount rate that reflects current market assessments of the time value of money and the risks specific to the asset, CGU or group of CGUs. For the purpose of impairment testing, assets that cannot be tested individually are grouped together into CGUs, the smallest group of assets that generates cash inflows from continuing use that are largely independent of the cash inflows of other assets. CGUs may incorporate integrated assets from multiple operating segments. For the purpose of goodwill impairment testing, CGUs are aggregated so that the level at which impairment testing is performed reflects the lowest level at which goodwill is monitored for internal purposes. Goodwill acquired in a business combination is allocated to CGUs or groups of CGUs that are expected to benefit from the synergies of the combination.
Pembina's corporate assets do not generate separate cash inflows and are utilized by more than one CGU. Corporate assets are allocated to CGUs on a reasonable and consistent basis and tested for impairment as part of the testing of the CGU to which the corporate asset is allocated. If there is an indication that a corporate asset may be impaired, then the recoverable amount is determined for the CGU to which the corporate asset has been allocated.
Impairment losses are recognized in earnings. Impairment losses recognized in respect of a CGU (group of CGUs) are allocated first to reduce the carrying amount of any goodwill allocated to the CGU (group of CGUs), and then to reduce the carrying amounts of the other assets in the CGU (group of CGUs) on a pro rata basis.
An impairment loss in respect of goodwill is not reversed. In respect of other assets, impairment losses recognized in prior periods are assessed at each reporting date for any indications that the loss has decreased or no longer exists. An impairment loss is reversed if there has been a change in the estimates used to determine the recoverable amount. An impairment loss is reversed only to the extent that the asset's carrying amount does not exceed the carrying amount that would have been determined, net of depreciation or amortization, if no impairment loss had been recognized.
Pembina Pipeline Corporation 2019 Annual Report 82
Goodwill that forms part of the carrying amount of an investment in an equity accounted investee is not recognized separately, and therefore is not tested for impairment separately. Instead, the entire amount of the investment is tested for impairment as a single asset when there is objective evidence that the equity accounted investee may be impaired, unless the equity accounted investee does not generate cash flows that are largely independent of those from other assets of the entity in which case it is combined in a CGU with the related assets.
i. Employee Benefits
i) Defined Contribution Plans
A defined contribution plan is a post-employment benefit plan under which an entity pays fixed contributions into a separate entity and will have no legal or constructive obligation to pay further amounts. Obligations for contributions to defined contribution pension plans are recognized as an employee benefit expense in earnings in the periods during which services are rendered by employees. Prepaid contributions are recognized as an asset to the extent that a cash refund or a reduction in future payments is available. Contributions to a defined contribution plan due more than 12 months after the end of the period in which the employees render the service are discounted to their present value.
ii) Defined Benefit Pension Plans
A defined benefit pension plan is a post-employment benefit plan other than a defined contribution plan. Pembina's net obligation in respect of defined benefit pension plans is calculated separately for each plan by estimating the amount of future benefit that employees have earned in return for their service in the current and prior periods, discounted to determine its present value, less the fair value of any plan assets. The discount rate used to determine the present value is established by referencing market yields on high-quality corporate bonds on the measurement date with cash flows that match the timing and amount of expected benefits.
The calculation is performed, at a minimum, every three years by a qualified actuary using the actuarial cost method. When the calculation results in a benefit to Pembina, the recognized asset is limited to the present value of economic benefits available in the form of future expenses payable from the plan, any future refunds from the plan or reductions in future contributions to the plan. To calculate the present value of economic benefits, consideration is given to any minimum funding requirements that apply to any plan in Pembina. An economic benefit is available to Pembina if it is realizable during the life of the plan or on settlement of the plan liabilities.
When the benefits of a plan are improved, the portion of the increased benefit relating to past service by employees is recognized in earnings immediately.
Pembina recognizes all actuarial gains and losses arising from defined benefit plans in other comprehensive income and expenses related to defined benefit plans in earnings.
Pembina recognizes gains or losses on the curtailment or settlement of a defined benefit plan when the curtailment or settlement occurs. The gain or loss on curtailment comprises any resulting change in the fair value of plan assets, change in the present value of defined benefit obligation and any related actuarial gains or losses and past service cost that had not previously been recognized.
iii) Short-Term Employee Benefits
Short-term employee benefit obligations are measured on an undiscounted basis and are expensed as the related service is provided.
A liability is recognized for the amount expected to be paid if Pembina has a present legal or constructive obligation to pay this amount as a result of past service provided by the employee, and the obligation can be estimated reliably.
83 Pembina Pipeline Corporation 2019 Annual Report
iv) Share-Based Payment Transactions
For equity settled share-based payment plans, the fair value of the share-based payment at grant date is recognized as an expense, with a corresponding increase in equity, over the period that the employees unconditionally become entitled to the awards. The amount recognized as an expense is adjusted to reflect the number of awards for which the related service and non-market vesting conditions are expected to be met, such that the amount ultimately recognized as an expense is based on the number of awards that meet the related service conditions at the vesting date.
For cash settled share-based payment plans, the fair value of the amount payable to employees is recognized as an expense with a corresponding increase in liabilities, over the period that the employees unconditionally become entitled to payment. The liability is remeasured at each reporting date and at settlement date. Any changes in the fair value of the liability are recognized as an expense in earnings.
j. Provisions
A provision is recognized if, as a result of a past event, Pembina has a present legal or constructive obligation that can be estimated reliably, and it is probable that an outflow of economic benefits will be required to settle the obligation. Provisions are determined by discounting the expected future cash flows at a pre-tax rate that reflects current market assessments of the time value of money and the risks specific to the liability. Provisions are remeasured at each reporting date based on the best estimate of the settlement amount. The unwinding of the discount rate is recognized as accretion in finance costs.
i) Decommissioning Provision
Pembina's activities give rise to certain dismantling, decommissioning, environmental reclamation and remediation obligations at the end of an asset's economic life. A provision is made for the estimated cost of site restoration and capitalized in the relevant asset category.
Decommissioning obligations are measured at the present value, based on a risk-free rate, of management's best estimate of what is reasonably expected to be incurred to settle the obligation at the end of an asset's economic life. Subsequent to the initial measurement, the obligation is adjusted at the end of each period to reflect the passage of time, changes in the risk-free rate and changes in the estimated future cash flows underlying the obligation. The increase in the provision due to the passage of time is recognized as accretion in finance costs whereas increases or decreases due to changes in the estimated future cash flows or risk-free rate are added to or deducted from the cost of the related asset.
Decommissioning obligations assumed in a business combination are initially recorded at fair value and remeasured using a risk-free rate subsequent to acquisition. This remeasurement is added to or deducted from the cost of the related asset.
k. Revenue
i) Take-or-Pay
Pembina provides transportation, gas processing, fractionation, terminalling, and storage services under take-or-pay contracts. In a take-or-pay contract, Pembina is entitled to a minimum fee for the firm service promised to a customer over the contract period, regardless of actual volumes transported, processed, terminalled, or stored. This minimum fee can be represented as a set fee for an annual minimum volume, or an annual minimum revenue requirement. In addition, these contracts may include variable consideration for operating costs that are flow through to the customer.
Pembina Pipeline Corporation 2019 Annual Report 84
Pembina satisfies its performance obligations and recognizes revenue for services under take-or-pay commitments when volumes are transported, processed, terminalled, or stored. Make-up rights may arise when a customer does not fulfill their minimum volume commitment in a certain period, but is allowed to use the delivery of future volumes to meet this commitment. These make-up rights are subject to expiry and have varying conditions associated with them. When contract terms allow a customer to exercise their make-up rights using firm volume commitments, revenue is not recognized until these make-up rights are used, expire, or management determines that it is remote that they will be utilized. If Pembina bills a customer for unused service in an earlier period and the customer utilizes available make-up rights, Pembina records a refund liability for the amount to be returned to the customer through an annual adjustment process. For contracts where no make-up rights exist, revenue is recognized to take-or-pay levels once Pembina has an enforceable right to payment for the take-or-pay volumes. Make-up rights generally expire within a contract year, and the majority of the related contract years follow the calendar year.
When customers are transporting, processing, terminalling, or storing volumes below their take-or-pay commitments early in a contract year, and the customer has the right to exercise make up rights against future firm volume commitments, there will be a change to the timing of revenue recognition. Where Pembina has a right to invoice to take-or-pay levels throughout the contract year, revenue is deferred and a contract liability is recorded for the volumes invoiced that were not utilized by the customer. Once the customer has used its make-up rights or it is determined to be remote that a customer will use them, the previously deferred revenue is recognized. In these instances, there will be a deferral of revenue in early quarters of the year, with subsequent recognition occurring in later quarters although there is no impact on cash flows.
For certain arrangements where the customer does not have make-up rights, where the make-up rights have been determined to be insignificant, and for cost of service agreements, revenue is recognized using the practical expedient to recognize revenue in an amount equal to Pembina's right to invoice. For these arrangements, the consideration Pembina is entitled to invoice in each period is representative of the value provided to the customer.
When up-front payments or non-cash consideration is received in exchange for future services to be performed, revenue is deferred as a contract liability and recognized over the period the performance obligation is expected to be satisfied. Non-cash consideration is measured at the fair value of the non-cash consideration received.
ii) Fee-for-Service
Fee-for-service revenue includes firm contracted revenue that is not subject to take-or-pay commitments and interruptible revenue. Pembina satisfies its performance obligations for transportation, gas processing, fractionation, terminalling, and storage as volumes of product are transported, processed, or stored. Revenue is based on a contracted fee and consideration is variable with respect to volumes. Payment is due in the month following Pembina's provision of service.
iii) Product Sales
Pembina satisfies its performance obligation on product sales at the time legal title to the product is transferred to the customer. Certain commodity buy/sell arrangements where control of the product has not transferred to Pembina are recognized on a net basis in revenue.
For product sales, revenue is recognized using the practical expedient to recognize revenue in an amount equal to Pembina's right to invoice as the consideration Pembina is entitled to invoice in each period is representative of the value provided to the customer.
85 Pembina Pipeline Corporation 2019 Annual Report
l. Finance Income and Finance Costs
Finance income comprises interest income on funds deposited and invested, finance lease receivables, gains on non-commodity-related derivatives measured at fair value through earnings and foreign exchange gains. Interest income is recognized as it accrues in earnings, using the effective interest rate method.
Finance costs comprise interest expense on loans and borrowings and lease liabilities, accretion on provisions, losses on disposal of available for sale financial assets, losses on non-commodity-related derivatives, impairment losses recognized on financial assets (other than trade and other receivables) and foreign exchange losses.
Borrowing costs that are not directly attributable to the acquisition or construction of a qualifying asset are recognized in earnings using the effective interest rate method.
m. Income Tax
Income tax expense comprises current and deferred tax. Current and deferred taxes are recognized in earnings except to the extent that they relate to a business combination, or items are recognized directly in equity or in other comprehensive income.
Current tax is the expected tax payable or receivable on the taxable income or loss for the period, using tax rates enacted or substantively enacted at the reporting date, and any adjustment to tax payable in respect of previous years.
Deferred tax is recognized in respect of temporary differences between the carrying amounts of assets and liabilities for financial reporting purposes and the amounts used for taxation purposes. Deferred tax is not recognized for:
| |
| • | temporary differences on the initial recognition of assets or liabilities in a transaction that is not a business combination and that affects neither accounting nor taxable earnings; |
| |
| • | temporary differences relating to investments in subsidiaries and joint arrangements to the extent that it is probable that they will not reverse in the foreseeable future; and |
| |
| • | taxable temporary differences arising on the initial recognition of goodwill. |
The measurement of deferred tax reflects the tax consequences that would follow the manner in which Pembina expects, at the end of the reporting period, to recover or settle the carrying amount of its assets and liabilities.
Deferred tax is measured at the tax rates that are expected to be applied to temporary differences when they reverse, based on the laws that have been enacted or substantively enacted by the reporting date.
Deferred tax assets and liabilities are offset if there is a legally enforceable right to offset, and they relate to income taxes levied by the same tax authority on the same taxable entity, or on different tax entities, but they intend to settle current tax liabilities and assets on a net basis or their tax assets and liabilities will be realized simultaneously.
A deferred tax asset is recognized for unused tax losses, tax credits and deductible temporary differences, to the extent that it is probable that future taxable profits will be available against which they can be utilized. Deferred tax assets are reviewed at each reporting date and are reduced to the extent that it is no longer probable that the related tax benefit will be realized.
In determining the amount of current and deferred tax, Pembina takes into account income tax exposures and whether additional taxes and interest may be due. This assessment relies on estimates and assumptions and may involve a series of judgments about future events. New information may become available that causes Pembina to change its judgment regarding the adequacy of existing tax liabilities, such changes to tax liabilities will impact tax expense in the period that such a determination is made.
Pembina Pipeline Corporation 2019 Annual Report 86
n. Earnings Per Common Share
Pembina presents basic and diluted earnings per common share ("EPS") data for its common shares. Basic EPS is calculated by dividing the earnings attributable to common shareholders of Pembina by the weighted average number of common shares outstanding during the period. To calculate earnings attributable to common shareholders, earnings are adjusted for accumulated preferred dividends. Diluted EPS is determined by adjusting the earnings attributable to common shareholders and the weighted average number of common shares outstanding, for the effects of all potentially dilutive common shares, which comprise share options granted to employees. Only outstanding share options that will have a dilutive effect are included in fully diluted calculations.
The dilutive effect of share options is determined whereby outstanding share options at the end of the period are assumed to have been converted at the beginning of the period or at the time issued if issued during the year. Amounts charged to earnings relating to the outstanding share options are added back to earnings for the diluted calculations. The shares issued upon conversion are included in the denominator of per share basic calculations for the date of issue.
o. Segment Reporting
An operating segment is a component of Pembina that engages in business activities from which it may earn revenues and incur expenses, including revenues and expenses that relate to transactions with any of the Company's other components. All operating segments' operating results are reviewed regularly by Pembina's Chief Executive Officer ("CEO"), Chief Financial Officer ("CFO") and other Senior Vice Presidents ("SVPs") to make decisions about resources to be allocated to the segment and assess its performance, and for which discrete financial information is available.
Segment results that are reported to the CEO, CFO and other SVPs include items directly attributable to a segment as well as those that can be allocated on a reasonable basis.
p. New Standards and Interpretations Not Yet Adopted
A number of new standards are effective for annual periods beginning after January 1, 2020 and earlier application is permitted; however, Pembina has not early adopted the new or amended standards in preparing Pembina's consolidated financial statements.
The following amended standards and interpretations are not expected to have a significant impact on Pembina's consolidated financial statements, on adoption January 1, 2020.
| |
| • | Amendments to References to Conceptual Framework in IFRS Standards. |
| |
| • | Definition of a Business (Amendments to IFRS 3). |
| |
| • | Definition of Material (Amendments to IAS 1 and IAS 8). |
5. DETERMINATION OF FAIR VALUES
A number of Pembina's accounting policies and disclosures require the determination of fair value, for both financial and non-financial assets and liabilities. Fair values have been determined for measurement and/or disclosure purposes based on the following methods. When applicable, further information about the assumptions made in determining fair values is disclosed in the notes specific to that asset or liability.
i) Property, Plant and Equipment
The fair value of property, plant and equipment recognized as a result of a business combination or transferred from a customer is based on market values when available, income approach and depreciated replacement cost when appropriate. Depreciated replacement cost reflects adjustments for physical deterioration as well as functional and economic obsolescence.
87 Pembina Pipeline Corporation 2019 Annual Report
ii) Intangible Assets
The fair value of intangible assets acquired in a business combination is determined by an active market value or using the multi-period excess earnings method, whereby the subject asset is valued after deducting a fair return on all other assets that are part of creating the related cash flows.
The fair value of other intangible assets is based on the discounted cash flows expected to be derived from the use and eventual sale of the assets.
iii) Derivatives
Fair value of derivatives are estimated by reference to independent monthly forward prices, interest rate yield curves, and currency rates at the reporting dates.
Fair values reflect the credit risk of the instrument and include adjustments to take account of the credit risk of the company, entity and counterparty when appropriate.
iv) Non-Derivative Financial Assets and Liabilities
The fair value of non-derivative financial assets and liabilities is determined on initial recognition, on a recurring basis, or for disclosure purposes. Fair values of financial assets at amortized cost are calculated based on the present value of estimated future principal and interest cash flows, discounted at the market rate of interest at the reporting date. Fair values of financial assets held at fair value are calculated using a probability-weighted income approach based on current market expectations for future cash flows. For other financial liabilities where market rates are not readily available, a risk adjusted market rate is used which incorporates the nature of the instrument as well as the risk associated with the underlying cash payments.
v) Decommissioning Provision
The fair value of decommissioning obligations assumed as part of a business combination are measured as the present value of management's best estimate of what is reasonably expected to be incurred to settle the obligation at the end of an asset's economic life. The obligation is discounted using a risk adjusted rate corresponding to the underlying assets to which the obligation relates.
vi) Share-Based Compensation Transactions
The fair value of employee share options is measured using the Black-Scholes formula on grant date. Measurement inputs include share price on measurement date, exercise price of the instrument, expected volatility (based on weighted average historic volatility adjusted for changes expected due to publicly available information), weighted average expected life of the instruments (based on historical experience and general option holder behaviour), expected dividends, expected forfeitures and the risk-free interest rate (based on government bonds). Service and non-market performance conditions attached to the transactions are not taken into account in determining fair value.
The fair value of the long-term share unit award incentive plan and associated distribution units are measured based on the volume-weighted average price for 20 days ending at the reporting date of Pembina's shares.
Pembina Pipeline Corporation 2019 Annual Report 88
6. ACQUISITION
On December 16, 2019, Pembina acquired all the issued and outstanding shares of Kinder Morgan Canada Limited ("Kinder Morgan Canada") by way of a plan of arrangement and the U.S. portion of the Cochin Pipeline system (collectively the "Kinder Acquisition") for total consideration of $4.3 billion comprised of $2.0 billion in cash and $2.3 billion of share consideration including, 35.7 million common shares of Pembina at $47.87 per share, 12 million series 23 preferred shares at $24.43 per share and 10 million series 25 preferred shares at $24.33 per share. The common shares were valued using Pembina's market price on the Toronto Stock Exchange immediately prior to the acquisition closing on December 16, 2019 and the preferred shares were valued using Kinder Morgan Canada's equivalent preferred share value on the same date. In accordance with the plan of arrangement, Kinder Morgan Canada was amalgamated with Pembina and the outstanding Kinder Morgan Canada preferred shares were exchanged for Pembina preferred shares with the same terms and conditions. Kinder Morgan Canada owns a significant crude oil storage and terminalling business located in the core of the Edmonton area crude oil complex, the Canadian portion of the Cochin Pipeline system and a 125-acre bulk marine terminal facility in the Port of Vancouver, Canada. Following the acquisition Pembina owns the entire Cochin Pipeline, which is a cross-border pipeline system that connects Pembina's Channahon, Bakken and Edmonton area assets and is connected to markets in Mont Belvieu, Conway and Edmonton.
The acquisition was accounted for as a business combination using the acquisition method where the acquired tangible and intangible assets and assumed liabilities were recorded at their estimated fair values at the date of acquisition, with the exception of right-of-use assets, deferred tax liabilities, and lease liabilities, which are measured in accordance with Pembina's accounting policies.
The purchase price equation, subject to finalization, is based on assessed fair values and is as follows:
|
| | |
| ($ millions) | December 16, 2019 |
|
| Purchase Price Consideration | |
| Common shares | 1,710 |
|
| Cash (net of cash acquired) | 2,009 |
|
| Preferred shares | 536 |
|
| | 4,255 |
|
| | |
| Current assets | 68 |
|
| Property, plant and equipment | 2,660 |
|
| Intangible assets | 1,254 |
|
| Right-of-use assets | 348 |
|
| Goodwill | 809 |
|
| Other assets | 9 |
|
| Current liabilities | (124 | ) |
| Deferred tax liabilities | (281 | ) |
| Decommissioning provision | (74 | ) |
| Lease liability | (348 | ) |
| Other liabilities | (66 | ) |
| | 4,255 |
|
Pembina engaged an independent valuator to assist with determining the fair value of certain tangible and intangible assets within the purchase price equation. Tangible assets of $2.7 billion were valued primarily using a cost approach. Intangible assets of $1.3 billion are entirely attributable to the acquisition date fair value of customer relationships, which was determined using a discounted cash flow model based on significant assumptions including forecasted revenue growth rates, contract renewal rates, and the discount rate.
The primary drivers that generated goodwill were synergies and business opportunities from the integration of Pembina and Kinder Morgan Canada. A portion of goodwill in the amount of $180 million is expected to be deductible from taxable income
89 Pembina Pipeline Corporation 2019 Annual Report
for tax purposes. Pembina recognized $12 million in acquisition-related expenses in 2019. All acquisition-related expenses were expensed as incurred and included in other expenses in the Consolidated Statement of Earnings and Comprehensive Income.
Revenue generated by the acquisition for the period from the acquisition date of December 16, 2019 to December 31, 2019 was $27 million. Net earnings for the same period were $11 million. If the acquisition had occurred on January 1, 2019, management estimates that consolidated revenue would have increased an additional $579 million and consolidated net earnings for the year would have increased an additional $65 million. In determining these amounts, management assumed that the fair value adjustments that arose on the date of acquisition would have been the same if the acquisition had occurred on January 1, 2019.
Given the acquisition closed on December 16, 2019, the purchase price allocation is not final as Pembina is continuing to obtain and verify information required to determine the fair value of certain assets and liabilities and the amount of deferred income taxes arising on their recognition, including: identification and classification of leases, contingencies, decommissioning provisions and other potential provisions.
7. TRADE RECEIVABLES AND OTHER |
| | | | |
| As at December 31 | | |
| ($ millions) | 2019 |
| 2018 |
|
| Trade receivables from customers | 575 |
| 501 |
|
| Other receivables | 92 |
| 88 |
|
| Prepayments | 25 |
| 16 |
|
| Impairment loss allowance | — |
| (1 | ) |
| Total trade receivables and other | 692 |
| 604 |
|
Pembina Pipeline Corporation 2019 Annual Report 90
8. PROPERTY, PLANT AND EQUIPMENT |
| | | | | | | | | | | | |
| ($ millions) | Land and Land Rights |
| Pipelines |
| Facilities and Equipment |
| Cavern Storage and Other |
| Assets Under Construction |
| Total |
|
| Cost | | | | | | |
| Balance at December 31, 2017 | 329 |
| 6,650 |
| 6,715 |
| 1,223 |
| 659 |
| 15,576 |
|
| Additions and transfers | 12 |
| 531 |
| 469 |
| 231 |
| 291 |
| 1,534 |
|
| Change in decommissioning provision | — |
| (10 | ) | 5 |
| 19 |
| — |
| 14 |
|
| Disposals and other | (1 | ) | (7 | ) | (30 | ) | 5 |
| (11 | ) | (44 | ) |
| Balance at December 31, 2018 | 340 |
| 7,164 |
| 7,159 |
| 1,478 |
| 939 |
| 17,080 |
|
| Reclassification on adoption of IFRS 16 (Note 3) | — |
| — |
| — |
| (44 | ) | — |
| (44 | ) |
| Additions and transfers | 32 |
| 215 |
| 691 |
| 203 |
| 534 |
| 1,675 |
|
| Acquisition (Note 6) | 86 |
| 1,434 |
| 798 |
| 314 |
| 28 |
| 2,660 |
|
| Change in decommissioning provision | — |
| 10 |
| 143 |
| 5 |
| — |
| 158 |
|
| Foreign exchange adjustments | (2 | ) | (17 | ) | (4 | ) | — |
| (11 | ) | (34 | ) |
| Disposals and other | — |
| (3 | ) | (31 | ) | (12 | ) | 3 |
| (43 | ) |
| Balance at December 31, 2019 | 456 |
| 8,803 |
| 8,756 |
| 1,944 |
| 1,493 |
| 21,452 |
|
| | | | | | | |
| Depreciation | | | | | | |
| Balance at December 31, 2017 | 9 |
| 1,096 |
| 721 |
| 204 |
| — |
| 2,030 |
|
| Depreciation | 3 |
| 142 |
| 164 |
| 55 |
| — |
| 364 |
|
| Disposals and other | — |
| (17 | ) | (18 | ) | (9 | ) | — |
| (44 | ) |
| Balance at December 31, 2018 | 12 |
| 1,221 |
| 867 |
| 250 |
| — |
| 2,350 |
|
| Reclassification on adoption of IFRS 16 (Note 3) | — |
| — |
| — |
| (26 | ) | — |
| (26 | ) |
| Depreciation | 4 |
| 155 |
| 174 |
| 59 |
| — |
| 392 |
|
| Disposals and other | — |
| (13 | ) | (26 | ) | — |
| — |
| (39 | ) |
| Balance at December 31, 2019 | 16 |
| 1,363 |
| 1,015 |
| 283 |
| — |
| 2,677 |
|
| | | | | | | |
| Carrying amounts | | | | | | |
| Balance at December 31, 2018 | 328 |
| 5,943 |
| 6,292 |
| 1,228 |
| 939 |
| 14,730 |
|
| Balance at December 31, 2019 | 440 |
| 7,440 |
| 7,741 |
| 1,661 |
| 1,493 |
| 18,775 |
|
Property, Plant and Equipment Under Construction
Costs of assets under construction at December 31, 2019 totaled $1.5 billion (2018: $939 million) including capitalized borrowing costs.
For the year ended December 31, 2019, included in additions and transfers are capitalized borrowing costs related to the construction of new pipelines or facilities amounting to $42 million (2018: $35 million), with capitalization rates ranging from 3.91 percent to 4.05 percent (2018: 3.86 percent to 4.01 percent).
Depreciation
Pipeline assets are depreciated using the straight line method over three to 75 years with the majority of assets depreciated over 40 years. Facilities and equipment are depreciated using the straight line method over three to 75 years with the majority of assets depreciated over 40 years. Cavern storage and other assets are depreciated using the straight line method over three to 40 years with the majority of assets depreciated over 40 years. These rates are established to depreciate remaining net book value over the shorter of their useful lives or economic lives.
91 Pembina Pipeline Corporation 2019 Annual Report
9. INTANGIBLE ASSETS AND GOODWILL |
| | | | | | | | | | | | |
| | | Intangible Assets | |
| ($ millions) | Goodwill |
| Purchase and Sale Contracts and Other |
| Customer Relationships |
| Purchase Option |
| Total |
| Total Goodwill & Intangible Assets |
|
| Cost | | | | | | |
| Balance at December 31, 2017 | 3,871 |
| 216 |
| 638 |
| 277 |
| 1,131 |
| 5,002 |
|
| Additions and other | 7 |
| 11 |
| 1 |
| — |
| 12 |
| 19 |
|
| Transfers | — |
| — |
| — |
| (277 | ) | (277 | ) | (277 | ) |
| Balance at December 31, 2018 | 3,878 |
| 227 |
| 639 |
| — |
| 866 |
| 4,744 |
|
| Additions and other | — |
| 13 |
| — |
| — |
| 13 |
| 13 |
|
| Acquisition (Note 6) | 809 |
| — |
| 1,254 |
| — |
| 1,254 |
| 2,063 |
|
| Foreign exchange adjustments | (3 | ) | — |
| (12 | ) | — |
| (12 | ) | (15 | ) |
| Balance at December 31, 2019 | 4,684 |
| 240 |
| 1,881 |
| — |
| 2,121 |
| 6,805 |
|
| | | | | | | |
| Amortization | | | | | | |
| Balance at December 31, 2017 | — |
| 145 |
| 143 |
| — |
| 288 |
| 288 |
|
| Amortization | — |
| 19 |
| 28 |
| — |
| 47 |
| 47 |
|
| Balance at December 31, 2018 | — |
| 164 |
| 171 |
| — |
| 335 |
| 335 |
|
| Amortization | — |
| 10 |
| 31 |
| — |
| 41 |
| 41 |
|
| Balance at December 31, 2019 | — |
| 174 |
| 202 |
| — |
| 376 |
| 376 |
|
| | | | | | | |
| Carrying amounts | | | | | | |
| Balance at December 31, 2018 | 3,878 |
| 63 |
| 468 |
| — |
| 531 |
| 4,409 |
|
| Balance at December 31, 2019 | 4,684 |
| 66 |
| 1,679 |
| — |
| 1,745 |
| 6,429 |
|
Intangible assets with a finite useful life are amortized using the straight line method over 7 to 40 years.
The purchase option attributable to Facilities of $277 million to assume an additional interest in the Younger Facilities was reclassified to property, plant and equipment on exercise of the option effective April 1, 2018.
The aggregate carrying amount of intangible assets and goodwill allocated to each operating segment is as follows: |
| | | | | | | | | | | | |
As at December 31 ($ millions) | 2019 | 2018 |
| Goodwill |
| Intangible Assets |
| Total |
| Goodwill |
| Intangible Assets |
| Total |
|
| Pipelines | 2,703 |
| 1,505 |
| 4,208 |
| 1,897 |
| 278 |
| 2,175 |
|
| Facilities | 541 |
| 97 |
| 638 |
| 541 |
| 102 |
| 643 |
|
| Marketing & New Ventures | 1,440 |
| 112 |
| 1,552 |
| 1,440 |
| 131 |
| 1,571 |
|
| Corporate | — |
| 31 |
| 31 |
| — |
| 20 |
| 20 |
|
| | 4,684 |
| 1,745 |
| 6,429 |
| 3,878 |
| 531 |
| 4,409 |
|
Goodwill Impairment Testing
For the purpose of impairment testing, goodwill is allocated to Pembina’s operating segments which represent the lowest level within Pembina at which goodwill is monitored for management purposes. Consistent with prior year, impairment testing for goodwill was performed as at September 30, 2019 other than goodwill acquired in the Acquisition (Note 6) on December 16, 2019 which was supported by the acquisition valuation.
Pembina Pipeline Corporation 2019 Annual Report 92
The recoverable amount was determined using the fair value less costs of disposal approach by discounting each operating segment’s expected future cash flows. The key assumptions that influence the calculation of the recoverable amounts include:
| |
| • | Cash flows for the first five years are projected based on past experience, actual operating results and the business plan approved by management. Cash flows for Pipelines and Facilities incorporate assumptions regarding contract renewal volumes and rates, which are based on market expectations. In addition, revenue and cost of product projections for Marketing & New Ventures incorporate assumptions regarding volumes and commodity pricing, which are sensitive to changes in the commodity price environment. |
| |
| • | Cash flows for the remaining years of the useful lives of the assets within each operating segment are extrapolated for periods up to 75 years (2018: 75 years) using a constant medium-term inflation rate, except where contracted, long-term cash flows indicate that no inflation should be applied or a specific reduction in cash flows was more appropriate. |
| |
| • | Pre-tax discount rates were applied in determining the recoverable amount of operating segments. Discount rates were estimated based on past experience, the risk free rate and average cost of debt, targeted debt to equity ratio, in addition to estimates of the specific operating segment's equity risk premium, size premium, projection risk and betas. |
For each operating segment, key assumptions and discount rate sensitivity are presented below:
|
| | | |
| | Operating Segments |
| 2019 | Pipelines | Facilities | Marketing & New Ventures |
| (Percent) |
| Pre-tax discount rate | 6.80 | 6.48 | 10.57 |
| Adjusted inflation rate | 1.16 | 1.62 | 1.80 |
| Incremental increase in discount rate that would result in carrying value equal to recoverable amount |
|
|
|
| Increase in pre-tax discount rate | 4.14 | 4.85 | 7.65 |
The level of the fair value hierarchy within which the fair value measurement is categorized in accordance with IFRS 13 Fair Value Measurement is Level 3 with inputs which are unobservable inputs for the associated assets within each operating segment.
10. INVESTMENTS IN EQUITY ACCOUNTED INVESTEES
|
| | | | | | | | | | | | |
| | Ownership Interest at December 31 | Share of Profit (Loss) from Equity Investments | Investment in Equity Accounted Investees at December 31 |
| 12 Months Ended December 31 |
| ($ millions) | 2019 |
| 2018 |
| 2019 |
| 2018 |
| 2019 |
| 2018 |
|
| Alliance | 50 | % | 50 | % | 149 |
| 160 |
| 2,620 |
| 2,799 |
|
| Aux Sable | 42.7% - 50% |
| 42.7% - 50% |
| 51 |
| 102 |
| 426 |
| 480 |
|
Ruby(1) | - |
| - |
| 120 |
| 118 |
| 1,273 |
| 1,648 |
|
| Veresen Midstream | 45 | % | 45.3 | % | 48 |
| 26 |
| 1,348 |
| 1,324 |
|
| CKPC | 50 | % | 50 | % | (1 | ) | — |
| 171 |
| — |
|
| Other | 50% - 75% |
| 50% - 75% |
| 3 |
| 5 |
| 116 |
| 117 |
|
| | | | 370 |
| 411 |
| 5,954 |
| 6,368 |
|
| |
(1) | Pembina owns a 50 percent convertible preferred interest in Ruby. |
Investments in equity accounted investees include the unamortized excess of the purchase price over the underlying net book value of the investee's assets and liabilities at the purchase date, which is comprised of $98 million (2018: $98 million) Goodwill, $2.9 billion (2018: $3.0 billion) in property, plant and equipment and intangibles and $42 million in long-term debt (2018: $52 million).
Pembina has US$2.3 billion in Investments in Equity Accounted Investees that is held by entities whose functional currency is the US dollar. The resulting foreign exchange loss for the year ended December 31, 2019 of $169 million (2018: $295 million gain) has been included in Other Comprehensive Income.
93 Pembina Pipeline Corporation 2019 Annual Report
Ruby Impairment
In December 2019, Pembina recognized an impairment charge of $300 million ($220 million net of tax) on its convertible preferred interest in Ruby. The impairment charge was the result of an assessment triggered by upcoming contract expirations in a business environment in the Rockies Basin that remains challenged. The recoverable amount of Ruby was was estimated to be $1.3 billion, calculated using a value in use approach by discounting expected cash flows resulting from Pembina's convertible preferred share interest. Key assumptions that influenced the calculation of the recoverable amount include incremental future contracts (including volumes associated with the Jordan Cove LNG Project being approved and placed in to service), renewals and volumes, future financing within the investment, Pembina's ability to utilize available tax deductions, and the discount rate. Pembina applied a discount rate of 8 percent in calculating the recoverable amount, which was determined using comparable preferred share yields adjusted for the specific risk profile of the investment. If the discount rate used to calculate the impairment was higher by 50 basis points, it would have resulted in an increase to the impairment charge of $80 million ($60 million net of tax). If the discount rate used to calculate the impairment was lower by 50 basis points, it would have resulted in a decrease to the impairment charge of $90 million ($65 million net of tax).
Distributions
Distributions received from equity investments for the year ended December 31, 2019 were $575 million (2018: $622 million) and are included in Operating Activities in the Consolidated Statement of Cash Flows. Distributions from Alliance and Veresen Midstream are subject to satisfying certain financing conditions including a minimum debt service coverage ratio requirement.
Contributions
Contributions made to investments in equity accounted investees for the year ended December 31, 2019 were $206 million (2018: $58 million) and are included in investing activities in the Consolidated Statement of Cash Flows. Contributions were largely related to funding CKPC and expansions at Veresen Midstream.
Summarized Financial Information
Summarized combined financial information of equity accounted investees (presented at 100 percent) is as follows: |
| | | | | | | |
| For the years ended December 31 | | | | |
| ($ millions) | | | 2019 |
| 2018 |
|
| Net Income and Comprehensive Income | | | | |
| Revenue | | | 3,114 |
| 3,605 |
|
| Cost of sales | | | (1,178 | ) | (1,566 | ) |
| General and administrative expense | | | (204 | ) | (171 | ) |
| Depreciation and amortization | | | (486 | ) | (511 | ) |
| Finance costs and other | | | (286 | ) | (308 | ) |
| Net Income and Comprehensive Income |
|
| 960 |
| 1,049 |
|
| Net income and Comprehensive Income attributable to Pembina | 370 |
| 411 |
|
|
| | | | | | | | | |
| As at December 31 | | | | |
| ($ millions) | | | 2019 | | 2018 |
|
| Balance Sheet | | | | |
| Current assets | | | 797 | | 838 |
|
| Non-current assets | | | 11,379 | | 11,667 |
|
| Current liabilities | | | 802 | | 908 |
|
| Non-current liabilities | | | 4,985 | | 5,262 |
|
Pembina Pipeline Corporation 2019 Annual Report 94
Financing Activities
On March 28, 2019, Ruby Pipeline, L.L.C., in which Pembina owns a 50 percent preferred interest, amended the maturity date of its 364-day term loan to March 26, 2020. The term loan will continue to amortize at US$16 million per quarter (US$8 million per quarter net to Pembina), beginning March 2019, until a final bullet payment of US$78 million (US$39 million net to Pembina) is payable March 26, 2020, unless otherwise extended.
On September 26, 2019, Veresen Midstream, successfully amended and extended its senior secured credit facilities, which were originally scheduled to mature on April 20, 2022, to April 20, 2024. Under the terms of the amendment and extension reached with a syndicate of lenders, Veresen Midstream increased its borrowing capacity to $225 million under the revolving credit facility and to $2.6 billion of availability under the term facility. Amortization payments of the term facility are deferred twenty-four months, recommencing again on September 30, 2021.
On December 10, 2019, Alliance Pipeline Limited Partnership amended and extended its revolving credit facility. The maturity date was extended to December 12, 2022, and the supplemental commitments provision was exercised, increasing total borrowing capacity by $100 million to $300 million.
Subsequent to year-end, on February 27, 2020, Canada Kuwait Petrochemical Limited Partnership closed a syndicated senior secured credit agreement consisting of a US$1.7 billion amortizing term facility, and a US$150 million revolving facility, which have been guaranteed equally by the owners through the completion of construction on a several basis. The final maturity date of the term facility and revolving facility is February 27, 2027.
95 Pembina Pipeline Corporation 2019 Annual Report
11. INCOME TAXES
The movements of the components of the deferred tax assets and deferred tax liabilities are as follows: |
| | | | | | | | | | | | | | |
| ($ millions) | Balance at December 31, 2018 |
| Recognized in Earnings |
| Recognized in Other Comprehensive Income |
| Acquisition |
| Equity |
| Other |
| Balance at December 31, 2019 |
|
| Deferred income tax assets | | | | | | | |
| Derivative financial instruments | (18 | ) | 5 |
| — |
| — |
| — |
| — |
| (13 | ) |
| Employee benefits | 9 |
| (1 | ) | 1 |
| — |
| — |
| — |
| 9 |
|
| Share-based payments | 26 |
| (2 | ) | — |
| — |
| — |
| — |
| 24 |
|
| Provisions | 156 |
| 29 |
| — |
| 20 |
| — |
| — |
| 205 |
|
| Benefit of loss carryforwards | 153 |
| 256 |
| — |
| 13 |
| — |
| (22 | ) | 400 |
|
| Other deductible temporary differences | 68 |
| (39 | ) | — |
| 2 |
| (3 | ) | — |
| 28 |
|
| | | | | | | | |
| Deferred income tax liabilities | | | | | | | |
| Property, plant and equipment | 1,660 |
| 301 |
| — |
| 136 |
| — |
| 8 |
| 2,105 |
|
| Intangible assets | 118 |
| (14 | ) | — |
| 180 |
| — |
| — |
| 284 |
|
| Investments in equity accounted investees | 1,262 |
| (155 | ) | — |
| — |
| — |
| — |
| 1,107 |
|
| Taxable limited partnership income deferral | 122 |
| (46 | ) | — |
| — |
| — |
| — |
| 76 |
|
| Other taxable temporary differences | 6 |
| (12 | ) | — |
| — |
| — |
| (7 | ) | (13 | ) |
| Total deferred tax liabilities | 2,774 |
| (174 | ) | (1 | ) | 281 |
| 3 |
| 23 |
| 2,906 |
|
|
| | | | | | | | | | | | | | |
| ($ millions) | Balance at December 31, 2017 |
| Recognized in Earnings |
| Recognized in Other Comprehensive Income |
| Acquisition |
| Equity |
| Other |
| Balance at December 31, 2018 |
|
| Deferred income tax assets | | | | | | | |
| Derivative financial instruments | 11 |
| (29 | ) | — |
| — |
| — |
| — |
| (18 | ) |
| Employee benefits | 7 |
| — |
| 2 |
| — |
| — |
| — |
| 9 |
|
| Share-based payments | 21 |
| 5 |
| — |
| — |
| — |
| — |
| 26 |
|
| Provisions | 153 |
| 3 |
| — |
| — |
| — |
| — |
| 156 |
|
| Benefit of loss carryforwards | 180 |
| (33 | ) | — |
| (7 | ) | — |
| 13 |
| 153 |
|
| Other deductible temporary differences | 56 |
| 16 |
| — |
| — |
| (4 | ) | — |
| 68 |
|
| | | | | | | | |
| Deferred income tax liabilities | | | | | | | |
| Property, plant and equipment | 1,361 |
| 299 |
| — |
| — |
| — |
| — |
| 1,660 |
|
| Intangible assets | 198 |
| (80 | ) | — |
| — |
| — |
| — |
| 118 |
|
| Investments in equity accounted investees | 1,173 |
| 89 |
| — |
| — |
| — |
| — |
| 1,262 |
|
| Taxable limited partnership income deferral | 56 |
| 66 |
| — |
| — |
| — |
| — |
| 122 |
|
| Other taxable temporary differences | 16 |
| (18 | ) | — |
| — |
| — |
| 8 |
| 6 |
|
| Total deferred tax liabilities | 2,376 |
| 394 |
| (2 | ) | 7 |
| 4 |
| (5 | ) | 2,774 |
|
Pembina's consolidated statutory tax rate for the year ended December 31, 2019 was 26.7 percent (2018: 27.0 percent).
Pembina Pipeline Corporation 2019 Annual Report 96
Reconciliation of Effective Tax Rate |
| | | | |
| For the years ended December 31 | | |
| ($ millions, except as noted) | 2019 |
| 2018 |
|
| Earnings before income tax | 1,528 |
| 1,742 |
|
| Statutory tax rate | 26.7 | % | 27.0 | % |
| Income tax at statutory rate | 408 |
| 470 |
|
| Tax rate changes and foreign rate differential | (359 | ) | (16 | ) |
| Changes in estimate and other | (16 | ) | 9 |
|
| Permanent items | 3 |
| 1 |
|
| Income tax expense | 36 |
| 464 |
|
In the second quarter of 2019, the enactment of Bill 3 Job Creation Tax Cut Act ("Alberta Corporate Tax Amendment") reduced the corporate income tax rate from 12 percent to eight percent over a four-year period which resulted in a deferred income tax recovery of $305 million.
Income Tax Expense |
| | | | |
For the years ended December 31 | | |
| ($ millions) | 2019 |
| 2018 |
|
| Current tax expense | 210 |
| 70 |
|
| Deferred tax expense |
|
|
|
|
| Origination and reversal of temporary differences | 393 |
| 368 |
|
| Tax rate changes on deferred tax balances | (345 | ) | (1 | ) |
| (Increase) decrease in tax loss carry forward | (222 | ) | 27 |
|
| Total deferred tax (recovery) expense | (174 | ) | 394 |
|
| Total income tax expense | 36 |
| 464 |
|
Deferred Tax Items Recovered Directly in Equity |
| | | | |
| For the years ended December 31 | | |
| ($ millions) | 2019 |
| 2018 |
|
| Share issue costs | (3 | ) | (4 | ) |
| Other comprehensive income (loss) | 1 |
| 2 |
|
| Deferred tax items recovered directly in equity | (2 | ) | (2 | ) |
Pembina has temporary differences associated with its investments in subsidiaries. At December 31, 2019, Pembina has not recorded a deferred tax asset or liability for these temporary differences (2018: nil) as Pembina controls the timing of the reversal and it is not probable that the temporary differences will reverse in the foreseeable future.
At December 31, 2019, Pembina had US$1.1 billion (2018: US$221 million) of U.S. tax losses that will expire after 2030 and $67 million (2018: $349 million) of Canadian tax losses that will expire after 2037. Pembina has determined that it is probable that future taxable profits will be sufficient to utilize these losses.
12. TRADE PAYABLES AND OTHER |
| | | | |
| As at December 31 | | |
| ($ millions) | 2019 |
| 2018 |
|
| Trade payables | 717 |
| 519 |
|
| Other payables & accrued liabilities | 296 |
| 284 |
|
| Total trade payables and other | 1,013 |
| 803 |
|
97 Pembina Pipeline Corporation 2019 Annual Report
13. LEASES
Lessee Leases
Pembina enters into arrangements to secure access to assets necessary for operating the business. Leased (right-of-use) assets include terminals, rail, buildings, land and other assets. Total cash outflows related to leases were $83 million for the 12 months ended December 31, 2019.
Right-of-Use Assets
|
| | | | | | | | | | |
| ($ millions) | Terminals |
| Rail |
| Buildings |
| Land & Other |
| Total |
|
| Balance at January 1, 2019 (Note 3) | — |
| 221 |
| 127 |
| 79 |
| 427 |
|
| Additions | — |
| 54 |
| 1 |
| 58 |
| 113 |
|
| Acquisition (Note 6) | 317 |
| — |
| 7 |
| 24 |
| 348 |
|
| Amortization | — |
| (37 | ) | (17 | ) | (12 | ) | (66 | ) |
| Balance at December 31, 2019 | 317 |
| 238 |
| 118 |
| 149 |
| 822 |
|
Included in additions is $45 million related to the remeasurement of the decommissioning provision for the restoration of leased land assets to the condition required by the terms of the underlying lease subsequent to the Kinder Acquisition.
Lessor Leases
Pembina has entered into contracts for the use of its assets that have resulted in lease treatment for accounting purposes. Assets under operating leases include pipelines, terminals and storage caverns. The carrying value of property, plant and equipment under operating leases at December 31, 2019 is $664 million (2018: $679 million). Assets under finance leases include office sub-leases.
Pembina is continuing to obtain and verify information required to determine the identification and classification of lessor leases acquired on December 16, 2019 as part of the Kinder Acquisition. Lessor lease identification could materially impact the classification of acquired assets in the final purchase price allocation, the classification and carrying value of acquired assets at the reporting date, and the following disclosures. Based on information available at the reporting date, Pembina estimates the total undiscounted lessor operating lease payments related to assets acquired as part of the Kinder Acquisition to be approximately $175 million and the carrying value of property, plant and equipment under operating leases at December 31, 2019 to be $58 million.
Maturity of Lease Receivables
|
| | | | |
| As at December 31, 2019 | Operating Leases (1) |
| Finance Leases |
|
| ($ millions) |
| Less than one year | 90 |
| 6 |
|
| One to two years | 89 |
| 7 |
|
| Two to three years | 89 |
| 6 |
|
| Three to four years | 89 |
| 4 |
|
| Four to five years | 89 |
| 4 |
|
| More than five years | 910 |
| 12 |
|
| Total undiscounted lease payments | 1,356 |
| 39 |
|
| Unearned finance income |
| (4 | ) |
| Finance lease receivable |
| 35 |
|
| |
(1) | Excludes the total undiscounted lessor operating lease payments of $175 million related to assets acquired as part of the Kinder Acquisition as noted above. |
Finance lease receivables are included in advances to related parties and other assets on the Consolidated Statement of Financial Position.
Pembina Pipeline Corporation 2019 Annual Report 98
14. LOANS AND BORROWINGS
This note provides information about the contractual terms of Pembina's interest-bearing loans and borrowings, which are measured at amortized cost.
Carrying Value, Terms and Conditions, and Debt Maturity Schedule |
| | | | | | | | | | |
| | | | | Carrying Value |
| ($ millions) | Authorized at December 31, 2019 |
| Nominal interest Rate |
| Year of Maturity |
| December 31, 2019 |
| December 31, 2018 |
|
Senior unsecured credit facilities(1)(4) | 3,020 |
| 3.25(2) |
| Various(1) |
| 2,097 |
| 1,305 |
|
| Senior unsecured notes – series A | 73 |
| 5.57 |
| 2020 |
| 74 |
| 76 |
|
| Senior unsecured notes – series C | 200 |
| 5.58 |
| 2021 |
| 199 |
| 199 |
|
| Senior unsecured notes – series D | — |
| 5.91 |
| 2019 |
| — |
| 267 |
|
| Senior unsecured medium-term notes series 1 | 250 |
| 4.89 |
| 2021 |
| 250 |
| 250 |
|
| Senior unsecured medium-term notes series 2 | 450 |
| 3.77 |
| 2022 |
| 449 |
| 449 |
|
| Senior unsecured medium-term notes series 3 | 450 |
| 4.75 |
| 2043 |
| 446 |
| 446 |
|
| Senior unsecured medium-term notes series 4 | 600 |
| 4.81 |
| 2044 |
| 596 |
| 596 |
|
| Senior unsecured medium-term notes series 5 | 450 |
| 3.54 |
| 2025 |
| 449 |
| 448 |
|
| Senior unsecured medium-term notes series 6 | 500 |
| 4.24 |
| 2027 |
| 498 |
| 498 |
|
| Senior unsecured medium-term notes series 7 | 500 |
| 3.71 |
| 2026 |
| 498 |
| 498 |
|
| Senior unsecured medium-term notes series 8 | 650 |
| 2.99 |
| 2024 |
| 646 |
| 646 |
|
| Senior unsecured medium-term notes series 9 | 550 |
| 4.74 |
| 2047 |
| 542 |
| 541 |
|
| Senior unsecured medium-term notes series 10 | 400 |
| 4.02 |
| 2028 |
| 398 |
| 398 |
|
| Senior unsecured medium-term notes series 11 | 300 |
| 4.75 |
| 2048 |
| 298 |
| 298 |
|
| Senior unsecured medium-term notes series 12 | 400 |
| 3.62 |
| 2029 |
| 398 |
| — |
|
| Senior unsecured medium-term notes series 13 | 700 |
| 4.54 |
| 2049 |
| 714 |
| — |
|
| Senior unsecured medium-term notes series 14 | 600 |
| 2.56 |
| 2023 |
| 598 |
| — |
|
| Senior unsecured medium-term notes series 15 | 600 |
| 3.31 |
| 2030 |
| 597 |
| — |
|
| Senior unsecured medium-term notes 3A | 50 |
| 5.05 |
| 2022 |
| 52 |
| 50 |
|
| Senior unsecured medium-term notes 4A | — |
| 3.06 |
| 2019 |
| — |
| 205 |
|
| Senior unsecured medium-term notes 5A | 350 |
| 3.43 |
| 2021 |
| 353 |
| 353 |
|
Finance lease liabilities and other(3) | — |
| | | — |
| 14 |
|
| Total interest bearing liabilities | | | | 10,152 |
| 7,537 |
|
| Less current portion | | | | (74 | ) | (480 | ) |
| Total non-current | | | | 10,078 |
| 7,057 |
|
| |
(1) | Pembina's unsecured credit facilities include a $2.5 billion revolving facility that matures May 2024, a $500 million non-revolving term loan that matures August 2022 and a $20 million operating facility that matures May 2020, which is typically renewed on an annual basis. |
| |
(2) | The nominal interest rate is the weighted average of all drawn credit facilities based on Pembina's credit rating at December 31, 2019. Borrowings under the credit facilities bear interest at prime, Bankers' Acceptance, or LIBOR rates, plus applicable margins. |
| |
(3) | On adoption of IFRS 16 on January 1, 2019, finance leases previously reported in loans and borrowings were reclassified to lease liabilities. See Note 3. |
| |
(4) | At December 31, 2019, US$454 million was drawn on the $2.5 billion revolving credit facility (2018: $nil). |
On April 3, 2019, Pembina closed an offering of $800 million of senior unsecured medium-term notes. The offering was conducted in two tranches, consisting of $400 million in senior unsecured medium-term notes, series 12, having a fixed coupon of 3.62 percent per annum, paid semi-annually, and maturing on April 3, 2029 and $400 million in senior unsecured medium-term notes, series 13, having a fixed coupon of 4.54 percent per annum, paid semi-annually, and maturing on April 3, 2049.
On May 31, 2019, Pembina completed an extension on its unsecured $2.5 billion revolving credit facility, which now matures on May 31, 2024.
On June 13, 2019, Pembina's $200 million senior unsecured medium term note 4A matured and was fully repaid.
99 Pembina Pipeline Corporation 2019 Annual Report
On September 12, 2019, Pembina closed an offering of $1.5 billion of senior unsecured medium-term notes. The offering was conducted in three tranches, consisting of $600 million in senior unsecured medium-term notes, series 14, having a fixed coupon of 2.56 percent per annum, paid semi-annually, and maturing on June 1, 2023; $600 million in senior unsecured medium-term notes, series 15, having a fixed coupon of 3.31 percent per annum, paid semi-annually, and maturing on February 1, 2030; and $300 million issued through a re-opening of Pembina's senior unsecured medium-term notes, series 13, having a fixed coupon of 4.54 percent per annum, paid semi-annually, and maturing on April 3, 2049.
On September 19, 2019, Pembina fully-repaid its unsecured $1.0 billion non-revolving term loan.
On November 18, 2019, Pembina's $267 million senior unsecured note, series D, matured and was fully repaid.
On December 16, 2019, Pembina closed a $500 non-revolving term loan with certain existing lenders. The term loan has an initial term of three years and is pre-payable at Pembina's option. The other terms and conditions of the term loan, including financial covenants, are substantially similar to Pembina's $2.5 billion revolving credit facility.
Subsequent to year-end, on January 10, 2020, Pembina closed an offering of $1.0 billion of senior unsecured medium-term notes. The offering was conducted in three tranches, consisting of $250 million issued through a re-opening of Pembina's senior unsecured medium-term notes, series 10, having a fixed coupon of 4.02 percent per annum, paid semi-annually and maturing on March 27, 2028; $500 million issued through a re-opening of Pembina's senior unsecured medium-term notes, series 11, having a fixed coupon of 4.75 percent per annum, paid semi-annually and maturing on March 26, 2048; and $250 million issued through a re-opening of Pembina's senior unsecured medium-term notes, series 12, having a fixed coupon of 3.62 percent per annum, paid semi-annually and maturing on April 3, 2029.
All facilities are governed by specific debt covenants which Pembina was in compliance with at December 31, 2019 (2018: in compliance).
For more information about Pembina's exposure to interest rate, foreign currency and liquidity risk, see Note 24 Financial Instruments.
15. DECOMMISSIONING PROVISION |
| | | | |
| ($ millions) | 2019 |
| 2018 |
|
| Balance at January 1 | 573 |
| 551 |
|
| Unwinding of discount rate | 14 |
| 12 |
|
| Change in rates | 191 |
| — |
|
| Acquisition (Note 6) | 74 |
| — |
|
| Additions | 28 |
| 18 |
|
| Change in cost estimates and other | (13 | ) | (8 | ) |
| Total | 867 |
| 573 |
|
| Less current portion (included in accrued liabilities) | (3 | ) | (4 | ) |
| Balance at December 31 | 864 |
| 569 |
|
The decommissioning provision reflects the discounted cash flows expected to be incurred to decommission Pembina's pipeline systems, gas processing and fractionation plants, storage and terminalling hubs, including estimated environmental reclamation and remediation costs.
Changes in the measurement of the decommissioning provision are added to, or deducted from, the cost of the related property, plant and equipment or right of use asset. When a re-measurement of the decommissioning provision relates to a retired asset, the amount is recorded in earnings.
The undiscounted cash flows at the time of decommissioning are calculated using an estimated timing of economic outflows ranging from one to 83 years, with the majority estimated at 50 years. The estimated economic lives of the underlying assets form the basis for determining the timing of economic outflows.
Pembina Pipeline Corporation 2019 Annual Report 100
At December 31, 2018, Pembina used a 1.8 percent inflation rate per annum and a risk-free nominal rate of 2.3 percent to calculate the present value of the decommissioning provision.
In the third quarter of 2019, due to forces influencing global capital markets, long-term risk free nominal rates in Canada declined below target inflation rates, implying a negative real rate of return. Pembina determined that applying these rates to current cost estimates would not provide an accurate measurement of the decommissioning liability as observable stand-alone risk free real rates of return continue to be positive. To provide a more accurate measurement of the liability, Pembina applied a risk-free real return rate of 0.3 percent to estimate the present value of the decommissioning provision at September 30, 2019, resulting in a change in estimate. The risk-free real return rate represents an observable, market based risk-free rate of return after adjusting for inflation.
In the fourth quarter of 2019, Pembina continued to apply a risk free real return rate of 0.3 percent to estimate the present value of the decommissioning provision at December 31, 2019. The change in rates of $191 million includes $135 million resulting from the recalculation of the Kinder Acquisition decommissioning provision using the real risk free rate of 0.3 percent compared to the risk adjusted rate at the acquisition date in the purchase price equation.
16. SHARE CAPITAL
Pembina is authorized to issue an unlimited number of common shares, without par value, 254,850,850 Class A preferred shares, issuable in series and an unlimited number of Class B preferred shares. The holders of the common shares are entitled to receive notice of, attend and vote at any meeting of the shareholders of Pembina, receive dividends declared and share in the remaining property of Pembina upon distribution of the assets of Pembina among its shareholders for the purpose of winding-up its affairs.
Common Share Capital |
| | | | |
| ($ millions, except as noted) | Number of Common Shares (millions) |
| Common Share Capital |
|
| Balance at December 31, 2017 | 503 |
| 13,447 |
|
| Debenture conversions | 3 |
| 140 |
|
| Share-based payment transactions | 2 |
| 75 |
|
| Balance at December 31, 2018 | 508 |
| 13,662 |
|
| Issued on Acquisition, net of issue costs (Note 6) | 36 |
| 1,710 |
|
| Share-based payment transactions | 4 |
| 167 |
|
| Balance at December 31, 2019 | 548 |
| 15,539 |
|
Preferred Share Capital |
| | | | |
| ($ millions, except as noted) | Number of Preferred Shares (millions) |
| Preferred Share Capital |
|
| Balance at December 31, 2017 | 100 |
| 2,424 |
|
| Part VI.1 tax | — |
| (1 | ) |
| Balance at December 31, 2018 | 100 |
| 2,423 |
|
| Class A, Series 23 Preferred shares issued on Acquisition, net of issue costs (Note 6) | 12 |
| 293 |
|
| Class A, Series 25 Preferred shares issued on Acquisition, net of issue costs (Note 6) | 10 |
| 243 |
|
| Part VI.1 tax | — |
| (3 | ) |
| Balance at December 31, 2019 | 122 |
| 2,956 |
|
On December 1, 2018, none of the 10 million Cumulative Redeemable Rate Reset Class A Preferred Series 1 shares outstanding were converted into Cumulative Redeemable Floating Rate Class A Preferred Series 2 shares.
On March 1, 2019, none of the six million Cumulative Redeemable Rate Reset Class A Preferred Series 3 shares outstanding were converted into Cumulative Redeemable Floating Rate Class A Preferred Series 4 shares.
101 Pembina Pipeline Corporation 2019 Annual Report
On March 31, 2019, none of the six million Cumulative Redeemable Rate Reset Class A Preferred Series 17 shares outstanding were converted into Cumulative Redeemable Floating Rate Class A Preferred Series 18 shares.
On June 3, 2019, none of the 10 million Cumulative Redeemable Rate Reset Class A Preferred Series 5 shares outstanding were converted into Cumulative Redeemable Floating Rate Class A Preferred Series 6 shares.
On December 2, 2019, none of the 10 million Cumulative Redeemable Rate Reset Class A Preferred Series 7 shares outstanding were converted into Cumulative Redeemable Floating Rate Class A Preferred Series 8 shares.
On December 16, 2019, in connection with the Kinder Acquisition, the outstanding preferred shares of Kinder Morgan Canada were exchanged for Series 23 and 25 Class A preferred shares with similar terms and conditions as the shares previously issued by Kinder Morgan Canada. Dividends on the Series 23 and 25 Class A preferred shares will continue to be paid on the 15th February, May, August and November in each year, if, as and when declared by the Board of Directors.
Dividends
The following dividends were declared by Pembina: |
| | | | |
| For the years ended December 31 | | |
| ($ millions) | 2019 |
| 2018 |
|
| Common shares | | |
| Common shares $2.36 per qualifying share (2018: $2.24) | 1,213 |
| 1,131 |
|
| Preferred shares |
|
|
|
|
| $1.23 per Series 1 preferred share (2018: $1.06) | 12 |
| 11 |
|
| $1.13 per Series 3 preferred share (2018: $1.18) | 7 |
| 7 |
|
| $1.19 per Series 5 preferred share (2018: $1.25) | 12 |
| 12 |
|
| $1.12 per Series 7 preferred share (2018: $1.13) | 11 |
| 11 |
|
| $1.19 per Series 9 preferred share (2018: $1.19) | 11 |
| 11 |
|
| $1.44 per Series 11 preferred share (2018: $1.44) | 10 |
| 10 |
|
| $1.44 per Series 13 preferred share (2018: $1.44) | 14 |
| 14 |
|
| $1.12 per Series 15 preferred share (2018: $1.12) | 9 |
| 9 |
|
| $1.22 per Series 17 preferred share (2018: $1.25) | 7 |
| 8 |
|
| $1.25 per Series 19 preferred share (2018: $1.25) | 10 |
| 10 |
|
| $1.23 per Series 21 preferred share (2018: $1.20) | 20 |
| 19 |
|
| $0.16 per Series 23 preferred share (2018: nil) | 2 |
| — |
|
| $0.16 per Series 25 preferred share (2018: nil) | 1 |
| — |
|
| 126 |
| 122 |
|
On May 2, 2019, Pembina's Board of Directors approved a five percent increase to its monthly common share dividend rate (from $0.19 per common share to $0.20 per common share), commencing with the dividend paid on June 14, 2019.
On December 16, 2019, upon closing of the Kinder Acquisition, Pembina's Board of Directors approved a $0.01 per common share increase to its monthly common share dividend rate (from $0.20 per common share to $0.21 per common share), commencing with the dividend paid on February 14, 2020.
Pembina Pipeline Corporation 2019 Annual Report 102
On January 9, 2020, Pembina announced that its Board of Directors had declared a dividend of $0.21 per qualifying common share ($2.52 annually) in the total amount of $115 million, payable on February 14, 2020 to shareholders of record on January 24, 2019. Pembina's Board of Directors also declared quarterly dividends for Pembina's preferred shares as outlined in the following table: |
| | | | | |
| Series | Record Date | Payable Date | Per Share Amount | Dividend Amount ($ millions) |
|
| Series 1 | February 3, 2020 | March 2, 2020 | $0.306625 | 3 |
|
| Series 3 | February 3, 2020 | March 2, 2020 | $0.279875 | 2 |
|
| Series 5 | February 3, 2020 | March 2, 2020 | $0.285813 | 3 |
|
| Series 7 | February 3, 2020 | March 2, 2020 | $0.273750 | 3 |
|
| Series 9 | February 3, 2020 | March 2, 2020 | $0.296875 | 3 |
|
| Series 11 | February 3, 2020 | March 2, 2020 | $0.359375 | 2 |
|
| Series 13 | February 3, 2020 | March 2, 2020 | $0.359375 | 4 |
|
| Series 15 | March 16, 2020 | March 31, 2020 | $0.279000 | 2 |
|
| Series 17 | March 16, 2020 | March 31, 2020 | $0.301313 | 2 |
|
| Series 19 | March 16, 2020 | March 31, 2020 | $0.312500 | 3 |
|
| Series 21 | February 3, 2020 | March 2, 2020 | $0.306250 | 5 |
|
| Series 23 | January 31, 2020 | February 18, 2020 | $0.328125 | 4 |
|
| Series 25 | January 31, 2020 | February 18, 2020 | $0.325000 | 3 |
|
On February 5, 2020, Pembina announced that its Board of Directors had declared a dividend of $0.21 per common share ($2.52 annually) in the total amount of $115 million, payable on March 13, 2020 to shareholders of record on February 25, 2020.
17. PERSONNEL EXPENSES |
| | | | |
| For the years ended December 31 | | |
| ($ millions) | 2019 |
| 2018 |
|
| Salaries and wages | 304 |
| 254 |
|
| Share-based compensation expense (Note 23) | 66 |
| 63 |
|
| Short-term incentive plan | 64 |
| 59 |
|
| Pension plan expense | 25 |
| 23 |
|
| Health, savings plan and other benefits | 30 |
| 21 |
|
| | 489 |
| 420 |
|
18. REVENUE
Revenue has been disaggregated into categories to reflect how the nature, timing and uncertainty of revenue and cash flows are affected by economic factors.
|
| | | | | | | | | | | | | | | | |
| | 2019 | 2018 |
| For the years ended December 31 | Pipelines |
| Facilities |
| Marketing & New Ventures |
| Total |
| Pipelines |
| Facilities |
| Marketing & New Ventures |
| Total |
|
| ($ millions) |
Take-or-pay(1) | 1,200 |
| 625 |
| — |
| 1,825 |
| 979 |
| 582 |
| — |
| 1,561 |
|
Fee-for-service(1) | 387 |
| 117 |
| — |
| 504 |
| 424 |
| 103 |
| — |
| 527 |
|
Product sales(2)(3) | — |
| 5 |
| 4,804 |
| 4,809 |
| — |
| 10 |
| 5,175 |
| 5,185 |
|
| Revenue from contracts with customers | 1,587 |
| 747 |
| 4,804 |
| 7,138 |
| 1,403 |
| 695 |
| 5,175 |
| 7,273 |
|
Lease and other revenue(4) | 63 |
| 29 |
| — |
| 92 |
| 61 |
| 17 |
| — |
| 78 |
|
| Total external revenue | 1,650 |
| 776 |
| 4,804 |
| 7,230 |
| 1,464 |
| 712 |
| 5,175 |
| 7,351 |
|
| |
(1) | Revenue recognized over time. |
| |
(2) | Revenue recognized at a point in time. |
| |
(3) | Revenue reported for 2018 periods have been recast to reflect updated presentation for 2019, where product sales are reported in Marketing & New Ventures. |
| |
(4) | Includes fixed operating lease income of $92 million (2018: $78) for the 12 months ended December 31, 2019. |
103 Pembina Pipeline Corporation 2019 Annual Report
Significant changes in the contract liabilities balances during the period are as follows: |
| | | | | | | | | | | | |
| | 2019 | 2018 |
For the years ended December 31 ($ millions) | Take-or-Pay |
| Other Contract Liabilities |
| Total Contract Liabilities |
| Take-or-Pay |
| Other Contract Liabilities |
| Total Contract Liabilities |
|
| Opening balance | 9 |
| 159 |
| 168 |
| 8 |
| 149 |
| 157 |
|
| Additions (net in the period) | 4 |
| 35 |
| 39 |
| 5 |
| 33 |
| 38 |
|
| Acquisition (Note 6) | — |
| 77 |
| 77 |
| — |
| — |
| — |
|
Revenue recognized from contract liabilities(1) | (5 | ) | (48 | ) | (53 | ) | (4 | ) | (23 | ) | (27 | ) |
| Closing balance | 8 |
| 223 |
| 231 |
| 9 |
| 159 |
| 168 |
|
Less current portion(2) | (8 | ) | (31 | ) | (39 | ) | (9 | ) | (28 | ) | (37 | ) |
| Ending balance | — |
| 192 |
| 192 |
| — |
| 131 |
| 131 |
|
| |
(1) | Recognition of revenue related to performance obligations satisfied in the current period that were included in the opening balance of contract liabilities. |
| |
(2) | As at December 31, 2019, the balance includes $8 million of cash collected under take-or-pay contracts which will be recognized within one year as the customer chooses to ship, process, or otherwise forego the associated service. |
Contract liabilities depict Pembina's obligation to perform services in the future for which payment has been received from customers. Contract liabilities include up-front payments or non-cash consideration received from customers for future transportation, processing and storage services. Contract liabilities also include consideration received from customers for take-or-pay commitments where the customer has a make-up right to ship or process future volumes under a firm contract. These amounts are non-refundable should the customer not use its make-up rights.
Pembina does not have any contract assets. In all instances where goods or services have been transferred to a customer in advance of the receipt of customer consideration, Pembina's right to consideration is unconditional and has therefore been presented as a receivable.
| |
| c. | Revenue Allocated to Remaining Performance Obligations |
Pembina expects to recognize revenue in future periods that includes current unsatisfied remaining performance obligations totaling $9.3 billion (2018: $10.3 billion). Over the next five years, this remaining performance obligation will be recognized annually ranging from $1.1 billion (2018: $1.1 billion) declining to $983 million (2018: $964 million). Subsequently, up to 2039 (2018: 2039), Pembina will recognize from $977 million (2018: $1.0 billion) to $13 million (2018: $8 million) per year.
In preparing the above figures, Pembina has taken the practical expedient to exclude contracts that are being accounted for using the practical expedient to recognize revenue in an amount equal to Pembina's right to invoice, as well as the practical expedient to exclude contracts that have original expected durations of one year or less.
Variable consideration relating to flow through costs are not included in the amounts presented. These flow through costs do not impact net income or cash flow, and due to the long-term nature of the contracts there is significant uncertainty in estimating these amounts. In addition, Pembina excludes contracted revenue amounts for assets not yet in-service unless both board of directors approval and regulatory approval for the asset has been obtained.
Pembina Pipeline Corporation 2019 Annual Report 104
19. NET FINANCE COSTS |
| | | | |
| For the years ended December 31 | | |
| ($ millions) | 2019 |
| 2018 |
|
| Interest expense on financial liabilities measured at amortized cost: | | |
| Loans and borrowings | 291 |
| 268 |
|
| Convertible debentures | — |
| 6 |
|
| Leases | 17 |
| — |
|
| Unwinding of discount rate | 13 |
| 12 |
|
| Finance lease income | (1 | ) | — |
|
| Loss in fair value of non-commodity-related derivative financial instruments | (4 | ) | (4 | ) |
| Foreign exchange gains and other | (22 | ) | (3 | ) |
| Net finance costs | 294 |
| 279 |
|
Net interest paid of $311 million (2018: $294 million) includes interest paid during construction and capitalized of $42 million (2018: $35 million).
20. OPERATING SEGMENTS
Pembina determines its reportable segments based on the nature of operations and includes three operating segments: Pipelines, Facilities and Marketing & New Ventures.
The Pipelines segment includes conventional, oil sands and transmission pipeline systems, crude oil storage and terminalling business and related infrastructure serving various markets and basins across North America.
The Facilities segment includes processing and fractionation facilities and related infrastructure that provide Pembina's customers with natural gas and NGL services that are highly integrated with Pembina's other businesses and a bulk marine terminal in the Port of Vancouver, Canada.
The Marketing & New Ventures segment undertakes value-added commodity marketing activities including buying and selling products and optimizing storage opportunities, by contracting capacity on Pembina's and various third-party pipelines and utilizing Pembina's rail fleet and rail logistics capabilities. Marketing activities also include identifying commercial opportunities to further develop other Pembina assets. Pembina's Marketing business also includes results from Aux Sable's NGL extraction facility near Chicago, Illinois and other natural gas and NGL processing facilities, logistics and distribution assets in the United States and Canada.
The financial results of the operating segments are included below. Performance is measured based on results from operating activities, net of depreciation and amortization, as included in the internal management reports that are reviewed by Pembina's Chief Executive Officer, Chief Financial Officer and other Senior Vice Presidents. These results are used to measure performance as management believes that such information is the most relevant in evaluating results of certain segments relative to other entities that operate within these industries. Intersegment transactions are recorded at market value and eliminated under corporate and intersegment eliminations.
105 Pembina Pipeline Corporation 2019 Annual Report
|
| | | | | | | | | | |
| For the year ended December 31, 2019 | Pipelines |
| Facilities |
| Marketing & New Ventures |
| Corporate & Inter-Division Eliminations |
| Total |
|
| ($ millions) |
| Revenue from external customers | 1,650 |
| 776 |
| 4,804 |
| — |
| 7,230 |
|
| Inter-division revenue | 137 |
| 345 |
| — |
| (482 | ) | — |
|
Total revenue(1)(2) | 1,787 |
| 1,121 |
| 4,804 |
| (482 | ) | 7,230 |
|
| Operating expenses | 436 |
| 344 |
| — |
| (178 | ) | 602 |
|
| Cost of goods sold, including product purchases | — |
| 4 |
| 4,417 |
| (311 | ) | 4,110 |
|
| Realized gain on commodity-related derivative financial instruments | — |
| — |
| (33 | ) | — |
| (33 | ) |
| Share of profit from equity accounted investees | 270 |
| 50 |
| 50 |
| — |
| 370 |
|
| Depreciation and amortization included in operations | 245 |
| 168 |
| 51 |
| 11 |
| 475 |
|
| Unrealized loss on commodity-related derivative financial instruments | — |
| — |
| 13 |
| — |
| 13 |
|
| Gross profit | 1,376 |
| 655 |
| 406 |
| (4 | ) | 2,433 |
|
| Depreciation included in general and administrative | — |
| — |
| — |
| 36 |
| 36 |
|
| Other general and administrative | 30 |
| 14 |
| 35 |
| 181 |
| 260 |
|
| Other expense | 3 |
| — |
| 3 |
| 9 |
| 15 |
|
| Impairment of investment in equity accounted investees | 300 |
| — |
| — |
| — |
| 300 |
|
| Reportable segment results from operating activities | 1,043 |
| 641 |
| 368 |
| (230 | ) | 1,822 |
|
| Net finance costs (income) | 9 |
| 23 |
| (8 | ) | 270 |
| 294 |
|
| Reportable segment earnings (loss) before tax | 1,034 |
| 618 |
| 376 |
| (500 | ) | 1,528 |
|
| Capital expenditures | 892 |
| 569 |
| 157 |
| 27 |
| 1,645 |
|
| Contributions to equity accounted investees | 13 |
| 73 |
| 177 |
| — |
| 263 |
|
|
| | | | | | | | | | |
| For the year ended December 31, 2018 | Pipelines |
| Facilities(3) |
| Marketing & New Ventures(3) |
| Corporate & Inter-Division Eliminations |
| Total |
|
| ($ millions) |
| Revenue from external customers | 1,464 |
| 712 |
| 5,175 |
| — |
| 7,351 |
|
| Inter-division revenue | 124 |
| 302 |
| — |
| (426 | ) | — |
|
Total revenue(1)(2) | 1,588 |
| 1,014 |
| 5,175 |
| (426 | ) | 7,351 |
|
| Operating expenses | 396 |
| 313 |
| — |
| (158 | ) | 551 |
|
| Cost of goods sold, including product purchases | — |
| 8 |
| 4,789 |
| (282 | ) | 4,515 |
|
| Realized loss on commodity-related derivative financial instruments | — |
| — |
| 51 |
| — |
| 51 |
|
| Share of profit from equity accounted investees | 279 |
| 30 |
| 102 |
| — |
| 411 |
|
| Depreciation and amortization included in operations | 216 |
| 149 |
| 26 |
| — |
| 391 |
|
| Unrealized gain on commodity-related derivative financial instruments | — |
| — |
| (73 | ) | — |
| (73 | ) |
| Gross profit | 1,255 |
| 574 |
| 484 |
| 14 |
| 2,327 |
|
| Depreciation included in general and administrative | — |
| — |
| — |
| 26 |
| 26 |
|
| Other general and administrative | 26 |
| 17 |
| 41 |
| 169 |
| 253 |
|
| Other expense | — |
| 5 |
| 12 |
| 10 |
| 27 |
|
| Reportable segment results from operating activities | 1,229 |
| 552 |
| 431 |
| (191 | ) | 2,021 |
|
| Net finance costs | 9 |
| 6 |
| 16 |
| 248 |
| 279 |
|
| Reportable segment earnings (loss) before tax | 1,220 |
| 546 |
| 415 |
| (439 | ) | 1,742 |
|
| Capital expenditures | 711 |
| 348 |
| 134 |
| 33 |
| 1,226 |
|
| Contributions to equity accounted investees | — |
| 56 |
| 2 |
| — |
| 58 |
|
| |
(1) | Total revenue includes $215 million (2018: $265 million) associated with U.S. revenues. |
| |
(2) | During both periods, one customer accounted for 10 percent or more of total revenues, with $718 million (2018: $792 million) reported throughout all segments. |
| |
(3) | Revenue and cost of goods sold reported for all 2018 periods have been recast to reflect updated presentation for 2019, where the majority of cost of goods sold and corresponding revenues are reported in Marketing & New Ventures. |
Pembina Pipeline Corporation 2019 Annual Report 106
Geographical Information
Non-Current Assets |
| | | | |
| For the years ended December 31 | | |
| ($ millions) | 2019 |
| 2018 |
|
| Canada | 26,596 |
| 20,936 |
|
| United States | 5,569 |
| 4,715 |
|
Total non-current assets(1) | 32,165 |
| 25,651 |
|
| |
(1) | Excludes deferred income tax assets. |
21. EARNINGS PER COMMON SHARE
Basic Earnings Per Common Share
The calculation of basic earnings per common share at December 31, 2019 was based on the earnings attributable to common shareholders of $1.4 billion (2018: $1.2 billion) and a weighted average number of common shares outstanding of 512 million (2018: 505 million).
Diluted Earnings Per common Share
The calculation of diluted earnings per common share at December 31, 2019 was based on earnings attributable to common shareholders of $1.4 billion (2018: $1.2 billion), and weighted average number of common shares outstanding after adjustment for the effects of all dilutive potential common shares of 514 million (2018: 509 million).
Earnings Attributable to Common Shareholders |
| | | | |
| For the years ended December 31 | | |
| ($ millions) | 2019 |
| 2018 |
|
| Earnings | 1,492 |
| 1,278 |
|
| Dividends on preferred shares | (123 | ) | (122 | ) |
| Cumulative dividends on preferred shares, not yet declared | (8 | ) | (3 | ) |
| Basic earnings attributable to common shareholders | 1,361 |
| 1,153 |
|
| Effect of after-tax interest on debentures to earnings | — |
| 4 |
|
| Diluted earnings attributable to common shareholders | 1,361 |
| 1,157 |
|
Weighted Average Number of Common Shares |
| | | | |
| (In millions of shares, except as noted) | 2019 |
| 2018 |
|
| Issued common shares at January 1 | 508 |
| 503 |
|
| Effect of shares issued on Acquisition | 1 |
| — |
|
| Effect of shares issued on exercise of options | 3 |
| 1 |
|
| Effect of conversion of convertible debentures | — |
| 1 |
|
| Basic weighted average number of common shares at December 31 | 512 |
| 505 |
|
| | | |
| Dilutive effect of debentures converted | — |
| 2 |
|
| Dilutive effect of share options on issue | 2 |
| 2 |
|
| Diluted weighted average number of common shares at December 31 | 514 |
| 509 |
|
| | | |
| Basic earnings per common share (dollars) | 2.66 |
| 2.28 |
|
| Diluted earnings per common share (dollars) | 2.65 |
| 2.28 |
|
The average market value of Pembina's shares for purposes of calculating the dilutive effect of share options was based on quoted market prices for the period during which the options were outstanding.
107 Pembina Pipeline Corporation 2019 Annual Report
22. PENSION PLAN |
| | | | |
| As at December 31 | | |
($ millions) | 2019 |
| 2018 |
|
| Registered defined benefit net obligation | 19 |
| 19 |
|
| Supplemental defined benefit net obligation | 16 |
| 12 |
|
| Net employee benefit obligations | 35 |
| 31 |
|
Pembina maintains defined contribution plans and non-contributory defined benefit pension plans covering its employees. On April 1, 2018, Pembina exercised its option to assume an additional interest in the Younger extraction and fractionation facilities ("Younger Facilities"). Accordingly, Pembina also assumed the Bargaining Unit Pension Plan for Employees at the Younger Plant ("Younger Plan") with the net obligation of $6 million. Pembina contributes five to 10 percent of an employee's earnings to the defined contribution plan until the employee's age plus years of service equals 50, at which time they become eligible for the defined benefit plans. Pembina recognized $11 million in expense for the defined contribution plan during the year (2018: $8 million). The defined benefit plans include a funded registered plan for all eligible employees and an unfunded supplemental retirement plan for those employees affected by the Canada Revenue Agency maximum pension limits. The defined benefit plans are administered by separate pension funds that are legally separated from Pembina. Benefits under the plans are based on the length of service and the annual average best three years of earnings during the last 10 years of service of the employee. Benefits paid out of the plans are not indexed. Pembina measures its accrued benefit obligations and the fair value of plan assets for accounting purposes as at December 31 of each year. The most recent actuarial valuation was at December 31, 2018. The defined benefit plans expose Pembina to actuarial risks such as longevity risk, interest rate risk, and market (investment) risk.
Defined Benefit Obligations |
| | | | | | | | |
As at December 31 ($ millions) | 2019 | 2018 |
Registered Plans |
| Supplemental Plan |
| Registered Plan |
| Supplemental Plan |
|
| Present value of unfunded obligations | — |
| 16 |
| — |
| 12 |
|
| Present value of funded obligations | 250 |
| — |
| 212 |
| — |
|
| Total present value of obligations | 250 |
| 16 |
| 212 |
| 12 |
|
| Fair value of plan assets | 231 |
| — |
| 193 |
| — |
|
| Recognized liability for defined benefit obligations | (19 | ) | (16 | ) | (19 | ) | (12 | ) |
Pembina funds the defined benefit obligation plans in accordance with government regulations by contributing to trust funds administered by an independent trustee. The funds are invested primarily in equities and bonds. Defined benefit plan contributions totalled $20 million for the year ended December 31, 2019 (2018: $19 million).
Pembina has determined that, in accordance with the terms and conditions of the defined benefit plans, and in accordance with statutory requirements of the plans, the present value of refunds or reductions in future contributions is not lower than the balance of the total fair value of the plan assets less the total present value of obligations. As such, no decrease in the defined benefit asset is necessary at December 31, 2019 (2018: nil).
Registered Defined Benefit Pension Plan Assets Comprise |
| | |
| As at December 31 | | |
| (Percent) | 2019 | 2018 |
| Equity securities | 62 | 61 |
| Debt | 38 | 39 |
| | 100 | 100 |
Pembina Pipeline Corporation 2019 Annual Report 108
Movement in the Present Value of the Defined Benefit Pension Obligation |
| | | | | | | | |
| | 2019 | 2018 |
| ($ millions) | Registered Plans |
| Supplemental Plan |
| Registered Plan |
| Supplemental Plan |
|
| Defined benefits obligations at January 1 | 212 |
| 12 |
| 192 |
| 11 |
|
| Benefits paid by the plan | (12 | ) | — |
| (12 | ) | — |
|
| Current service costs | 15 |
| 1 |
| 14 |
| 1 |
|
| Interest expense | 8 |
| — |
| 7 |
| — |
|
| Transfer from Younger | — |
| — |
| 16 |
| — |
|
| Actuarial losses (gains) in other comprehensive income | 27 |
| 3 |
| (5 | ) | — |
|
| Defined benefit obligations at December 31 | 250 |
| 16 |
| 212 |
| 12 |
|
Movement in the Present Value of Registered Defined Benefit Pension Plan Assets |
| | | | |
| ($ millions) | 2019 |
| 2018 |
|
| Fair value of plan assets at January 1 | 193 |
| 182 |
|
| Contributions paid into the plan | 20 |
| 19 |
|
| Benefits paid by the plan | (12 | ) | (12 | ) |
| Return on plan assets | 22 |
| (13 | ) |
| Transfer from Younger | — |
| 10 |
|
| Interest income | 8 |
| 7 |
|
| Fair value of registered plan assets at December 31 | 231 |
| 193 |
|
Expense Recognition in Earnings |
| | | | |
For the years ended December 31 | | |
| ($ millions) | 2019 |
| 2018 |
|
| Registered Plan | | |
| Current service costs | 15 |
| 14 |
|
| Interest on obligation | 8 |
| 8 |
|
| Expected return on plan assets | (8 | ) | (7 | ) |
| | 15 |
| 15 |
|
The expense is recognized in the following line items in the consolidated statement of comprehensive income: |
| | | | |
For the years ended December 31 | | |
| ($ millions) | 2019 |
| 2018 |
|
| Registered Plan | | |
| Operating expenses | 7 |
| 8 |
|
| General and administrative expense | 8 |
| 7 |
|
| | 15 |
| 15 |
|
Expense recognized for the Supplemental Plan was less than $2 million for each of the years ended December 31, 2019 and 2018.
109 Pembina Pipeline Corporation 2019 Annual Report
Actuarial Gains and Losses Recognized in Other Comprehensive Income |
| | | | | | | | | | | | |
| | 2019 | 2018 |
| ($ millions) | Registered Plans |
| Supplemental Plan |
| Total |
| Registered Plan |
| Supplemental Plan |
| Total |
|
| Balance at January 1 | (28 | ) | (1 | ) | (29 | ) | (22 | ) | (1 | ) | (23 | ) |
| Remeasurements: |
|
|
|
| — |
|
|
|
|
|
|
|
| Financial assumptions | (21 | ) | (1 | ) | (22 | ) | 3 |
| — |
| 3 |
|
| Experience adjustments | — |
| — |
| — |
| — |
| — |
| — |
|
| Return on plan assets excluding interest income | 16 |
| — |
| 16 |
| (9 | ) | — |
| (9 | ) |
| Recognized loss during the period after tax | (5 | ) | (1 | ) | (6 | ) | (6 | ) | — |
| (6 | ) |
| Balance at December 31 | (33 | ) | (2 | ) | (35 | ) | (28 | ) | (1 | ) | (29 | ) |
Principal actuarial assumptions used: |
| | | | |
| As at December 31 | | |
| (weighted average percent) | 2019 |
| 2018 |
|
| Discount rate | 3.1 | % | 3.8 | % |
| Future pension earning increases | 4.0 | % | 4.0 | % |
Assumptions regarding future mortality are based on published statistics and mortality tables. The current longevities underlying the values of the liabilities in the defined plans are as follows: |
| | |
| As at December 31 | | |
| (years) | 2019 | 2018 |
| Longevity at age 65 for current pensioners |
|
|
| Males | 21.8 | 21.7 |
| Females | 24.2 | 24.1 |
| Longevity at age 65 for current member aged 45 |
|
|
| Males | 22.8 | 22.8 |
| Females | 25.1 | 25.1 |
The calculation of the defined benefit obligation is sensitive to the discount rate, compensation increases, retirements and termination rates as set out above. An increase or decrease of the estimated discount rate of 3.1 percent by 100 basis points at December 31, 2019 is considered reasonably possible in the next financial year but would not have a material impact on the obligation.
Pembina expects to contribute $21 million to the defined benefit plans in 2020.
23. SHARE-BASED PAYMENTS
At December 31, 2019, Pembina has the following share-based payment arrangements:
Share Option Plan (Equity Settled)
Pembina has a share option plan under which employees are eligible to receive options to purchase shares in Pembina.
Long-Term Share Unit Award Incentive Plan (Cash-Settled)
In 2005, Pembina established a long-term share unit award incentive plan. Under the share-based compensation plan, awards of restricted ("RSU") and performance ("PSU") share units are made to officers, non-officers and directors. The plan results in participants receiving cash compensation based on the value of the underlying notional shares granted under the plan. Payments are based on a trading value of Pembina's common shares plus notional dividends and performance of Pembina.
Pembina Pipeline Corporation 2019 Annual Report 110
In 2015, Pembina also established a deferred share units ("DSU") plan. Under the DSU plan, directors are required to take at least 50 percent of total director compensation as DSUs. A DSU is a notional share that has the same value as one Pembina common share. Its value changes with Pembina's share price. DSUs do not have voting rights but they accrue dividends as additional DSUs, at the same rate as dividends paid on Pembina's common shares. DSUs are paid out when a director retires from the board and are redeemed for cash using the weighted average of trading price of common shares on the Toronto Stock Exchange ("TSX") for the last five trading days before the redemption date, multiplied by the number of DSUs the director holds. As of January 1, 2018 directors no longer receive meeting fees, but their base retainer and committee retainer has been increased.
Terms and Conditions of Share Option Plan and Share Unit Award Incentive Plan
The terms and conditions relating to the grants of the share option program and the long-term share unit award incentive plans are listed in the tables below: |
| | | |
Grant Date Share Options Granted to Employees (thousands of options, except as noted) | Number of Options |
| Contractual Life of Options |
| March 6, 2018 | 1,993 |
| 7 |
| May 14, 2018 | 310 |
| 7 |
| July 10, 2018 | 424 |
| 7 |
| August 15, 2018 | 961 |
| 7 |
| October 10, 2018 | 94 |
| 7 |
| November 13, 2018 | 939 |
| 7 |
| December 31, 2018 | 34 |
| 7 |
| March 5, 2019 | 2,409 |
| 7 |
| April 8, 2019 | 367 |
| 7 |
| July 9, 2019 | 249 |
| 7 |
| August 14, 2019 | 1,162 |
| 7 |
| October 8, 2019 | 97 |
| 7 |
| November 12, 2019 | 1,145 |
| 7 |
One-third vest on the first anniversary of the grant date, one-third vest on the second anniversary of the grant date and one-third vest on the third anniversary of the grant date.
Long-Term Share Unit Award Incentive Plan(1) |
| | | | | | | | |
Grant date RSUs, PSUs and DSUs to Officers, Non-Officers(2) and Directors (thousands of units, except as noted) | PSUs (3) |
| RSUs (3) |
| DSUs |
| Total |
|
| January 1, 2018 | 404 |
| 395 |
| 44 |
| 843 |
|
| January 1, 2019 | 475 |
| 460 |
| 36 |
| 971 |
|
| |
(1) | Distribution Units are granted in addition to RSU and PSU grants based on notional accrued dividends from RSU and PSU granted but not paid. |
| |
(2) | Non-Officers defined as senior selected positions within Pembina. |
| |
(3) | Contractual life of 3 years. |
PSUs vest on the third anniversary of the grant date. RSUs vest one-third on the first anniversary of the grant date, one-third on the second anniversary of the grant date and one-third on the third anniversary of the grant date. Actual units awarded are based on the trading value of the shares and performance of Pembina.
111 Pembina Pipeline Corporation 2019 Annual Report
Disclosure of Share Option Plan
The number and weighted average exercise prices of share options as follows: |
| | | |
| (thousands of options, except as noted) | Number of Options |
| Weighted Average Exercise Price (dollars) |
| Outstanding at December 31, 2017 | 15,677 |
| $40.94 |
| Granted | 4,755 |
| $43.86 |
| Exercised | (1,729 | ) | $35.34 |
| Forfeited | (523 | ) | $41.56 |
| Expired | (252 | ) | $49.20 |
| Outstanding at December 31, 2018 | 17,928 |
| $42.12 |
| Granted | 5,470 |
| $48.27 |
| Exercised | (3,979 | ) | $37.95 |
| Forfeited | (655 | ) | $45.29 |
| Expired | (180 | ) | $48.98 |
| Outstanding at December 31, 2019 | 18,584 |
| $44.65 |
As of December 31, 2019, the following options are outstanding: |
| | | | | |
(thousands of options, except as noted) Exercise Price (dollars) | Number Outstanding at December 31, 2019 |
| Options Exercisable |
| Weighted Average Remaining Life |
| $29.60 – $41.38 | 3,466 |
| 3,426 |
| 3.1 |
| $41.39 – $43.21 | 3,524 |
| 1,618 |
| 4.7 |
| $43.22 – $46.00 | 3,491 |
| 2,170 |
| 4.2 |
| $46.01 – $48.59 | 4,350 |
| 279 |
| 6.2 |
| $48.60 – $52.01 | 3,753 |
| 2,057 |
| 3.9 |
| Total | 18,584 |
| 9,550 |
| 4.5 |
Options are exercised regularly throughout the year. Therefore, the weighted average share price during the year of $48.87 (2018: $44.97) is representative of the weighted average share price at the date of exercise.
Expected volatility is estimated by considering historic average share price volatility. The weighted average inputs used in the measurement of the fair values at grant date of share options are the following:
Share Options Granted |
| | | | |
For the years ended December 31 | | |
| (dollars, except as noted) | 2019 |
| 2018 |
|
| Weighted average |
|
|
| Fair value at grant date | 4.12 |
| 3.86 |
|
Expected volatility (percent) | 18.7 |
| 20.3 |
|
Expected option life (years) | 3.67 |
| 3.67 |
|
| Expected annual dividends per option | 2.36 |
| 2.24 |
|
Expected forfeitures (percent) | 6.6 |
| 6.7 |
|
Risk-free interest rate (based on government bonds)(percent) | 1.6 |
| 2.1 |
|
Disclosure of Long-Term Share Unit Award Incentive Plan
The long-term share unit award incentive plans was valued using the volume weighted average price for 20 days ending December 31, 2019 of $47.52 (2018: $42.89). Actual payment may differ from amount valued based on market price and company performance.
Pembina Pipeline Corporation 2019 Annual Report 112
Employee Expenses |
| | | | |
| For the years ended December 31 | | |
| ($ millions) | 2019 |
| 2018 |
|
| Share option plan, equity settled | 16 |
| 14 |
|
| Long-term share unit award incentive plan | 50 |
| 49 |
|
| Share-based compensation expense | 66 |
| 63 |
|
| |
|
|
|
|
| Total carrying amount of liabilities for cash settled arrangements | 95 |
| 96 |
|
| Total intrinsic value of liability for vested benefits | 57 |
| 57 |
|
24. FINANCIAL INSTRUMENTS
Financial Risk Management
Pembina has exposure to counterparty credit risk, liquidity risk and market risk. Pembina recognizes that effective management of these risks is a critical success factor in managing organization and shareholder value.
Risk management strategies, policies and limits ensure risks and exposures are aligned to Pembina's business strategy and risk tolerance. Pembina's Board of Directors is responsible for providing risk management oversight at Pembina and oversees how management monitors compliance with Pembina's risk management policies and procedures and reviews the adequacy of this risk framework in relation to the risks faced by Pembina. Internal audit personnel assist the Board of Directors in its oversight role by monitoring and evaluating the effectiveness of the organization's risk management system.
Counterparty Credit Risk
Counterparty credit risk represents the financial loss Pembina may experience if a counterparty to a financial instrument or commercial agreement failed to meet its contractual obligations to Pembina in accordance with the terms and conditions of the financial instruments or agreements with Pembina. Counterparty credit risk arises primarily from Pembina's cash and cash equivalents, trade and other receivables, advances to related parties and from counterparties to its derivative financial instruments. The carrying amount of Pembina's cash and cash equivalents, trade and other receivables, advances to related parties and derivative financial instruments represents the maximum counterparty credit exposure, without taking into account security held.
Pembina manages counterparty credit risk through established credit management techniques, including conducting comprehensive financial and other assessments for all new counterparties and regular reviews of existing counterparties to establish and monitor a counterparty's creditworthiness, setting exposure limits, monitoring exposures against these limits and obtaining financial assurances where warranted. Pembina utilizes various sources of financial, credit and business information in assessing the creditworthiness of a counterparty including external credit ratings, where available, and in other cases, detailed financial statement analysis in order to generate an internal credit rating based on quantitative and qualitative factors. The establishment of counterparty exposure limits is governed by a Board of Directors designated counterparty exposure limit matrix which represents the maximum dollar amounts of counterparty exposure by debt rating that can be approved for a counterparty. Pembina continues to closely monitor and reassess the creditworthiness of its counterparties, which has resulted in Pembina reducing or mitigating its exposure to certain counterparties where it was deemed warranted and permitted under contractual terms.
Financial assurances from counterparties may include guarantees, letters of credit and cash. At December 31, 2019 letters of credit totaling $90 million (2018: $122 million) were held primarily in respect of customer trade receivables.
Pembina typically has collected its trade receivables in full and at December 31, 2019, 95 percent were current (2018: 99 percent). Management defines current as outstanding accounts receivable under 30 days past due. Pembina has a general lien and a continuing and first priority security interest in, and a secured charge on, all of a shipper's petroleum products in its custody.
113 Pembina Pipeline Corporation 2019 Annual Report
At December 31, the aging of trade and other receivables was as follows: |
| | | | |
| Past Due | 2019 |
| 2018 |
|
| 31-60 days past due | 1 |
| 2 |
|
| Greater than 61 days | 7 |
| — |
|
| | 8 |
| 2 |
|
Pembina uses a loss allowance matrix to measure lifetime expected credit losses at initial recognition and throughout the life of the receivable. The loss allowance matrix is determined based on Pembina’s historical default rates over the expected life of trade receivables, adjusted for forward-looking estimates. Management believes the unimpaired amounts that are past due by greater than 30 days are fully collectible based on historical default rates of customers and management’s assessment of counterparty credit risk through established credit management techniques as discussed above.
Advances to related parties held at amortized cost consists of funds advanced by Pembina to a jointly controlled entity. Expected credit losses are measured using a probability-weighted estimate of credit losses, measured as the present value of all expected cash shortfalls, discounted at the effective interest rate of the financial asset, using reasonable and supportable information about past events, current conditions and forecasts of future economic conditions. Management considers the risk of default relating to the advances to be low due to their priority ranking against other interests.
For 2019, Pembina recognized no impairment loss allowance (2018: $1 million). Pembina recognized less than $1 million in impairment losses on financial assets during 2019 (2018: $1 million).
Pembina monitors and manages its concentration of counterparty credit risk on an ongoing basis. Pembina believes these measures minimize its counterparty credit risk but there is no certainty that they will protect it against all material losses. As part of its ongoing operations, Pembina must balance its market and counterparty credit risks when making business decisions.
Liquidity Risk
Liquidity risk is the risk Pembina will not be able to meet its financial obligations as they come due. The following are the contractual maturities of financial liabilities, including estimated interest payments. |
| | | | | | | | | | | | |
| | Outstanding Balances Due by Period |
| December 31, 2019 | Carrying Amount |
| Expected Cash Flows |
| Less Than 1 Year |
| 1 - 3 Years |
| 3 - 5 Years |
| More Than 5 Years |
|
| ($ millions) |
| Trade payables and accrued liabilities | 1,013 |
| 1,013 |
| 1,013 |
| — |
| — |
| — |
|
| Loans and borrowings | 10,152 |
| 14,565 |
| 477 |
| 2,379 |
| 3,337 |
| 8,372 |
|
| Dividends payable | 110 |
| 110 |
| 110 |
| — |
| — |
| — |
|
| Derivative financial liabilities | 9 |
| 9 |
| 9 |
| — |
| — |
| — |
|
| Lease liabilities | 819 |
| 1,152 |
| 130 |
| 237 |
| 179 |
| 606 |
|
Pembina manages its liquidity risk by forecasting cash flows over a 12 month rolling time period to identify financing requirements. These financing requirements are then addressed through a combination of credit facilities and through access to capital markets, if required.
Pembina Pipeline Corporation 2019 Annual Report 114
Market Risk
Pembina's results are subject to movements in commodity prices, foreign exchange and interest rates. A formal Risk Management Program including policies and procedures has been designed to mitigate these risks.
Certain of the transportation contracts or tolling arrangements with respect to Pembina's pipeline assets do not include take-or-pay commitments from crude oil and gas producers and, as a result, Pembina is exposed to throughput risk with respect to those assets. A decrease in volumes transported can directly and adversely affect Pembina’s revenues and earnings. The demand for, and utilization of, Pembina's pipeline assets may be impacted by factors such as changing market fundamentals, capacity bottlenecks, operational incidents, regulatory restrictions, system maintenance, weather and increased competition. Market fundamentals, such as commodity prices and price differentials, natural gas and gasoline consumption, alternative energy sources and global supply disruptions outside of Pembina’s control can impact both the supply of and demand for the commodities transported on Pembina’s pipelines.
Pembina's Marketing business includes activities related to product storage, terminalling, and hub services. These activities expose Pembina to certain risks relating to fluctuations in commodity prices and, as a result, Pembina may experience volatility in revenue and impairments related to the book value of stored product with respect to these activities. Primarily, Pembina enters into contracts to purchase and sell crude oil, condensate, NGL and natural gas at floating market prices; as a result, the prices of products that are marketed by Pembina are subject to volatility as a result of factors such as seasonal demand changes, extreme weather conditions, market inventory levels, general economic conditions, changes in crude oil markets and other factors. Pembina manages its risk exposure by balancing purchases and sales to secure less volatile margins. Notwithstanding Pembina's management of price and quality risk, marketing margins for commodities can vary and have varied significantly from period to period in the past. This variability could have an adverse effect on the results of Pembina's Marketing business and its overall results of operations. To assist in reducing this inherent variability in its Marketing business, Pembina has invested, and will continue to invest, in assets that have a fee-based revenue component.
Pembina is also exposed to potential price declines and decreasing frac spreads between the time Pembina purchases NGL feedstock and sells NGL products. Frac spread is the difference between the sale prices of NGL products and the cost of NGL sourced from natural gas and acquired at prices related to natural gas prices. Frac spreads can change significantly from period to period depending on the relationship between NGL and natural gas prices (the "frac spread ratio"), absolute commodity prices and changes in the Canadian to U.S. dollar exchange rate. In addition to the frac spread ratio changes, there is also a differential between NGL product prices and crude oil prices which can change margins realized for midstream products. The amount of profit or loss made on the extraction portion of the business will generally increase or decrease with frac spreads. This exposure could result in variability of cash flow generated by the Marketing business, which could affect Pembina and the cash dividends that Pembina is able to distribute.
Pembina utilizes financial derivative instruments as part of its overall risk management strategy to assist in managing the exposure to commodity price, interest rate, cost of power and foreign exchange risk. As an example of commodity price mitigation, Pembina actively fixes a portion of its exposure to fractionation margins through the use of derivative financial instruments. Additionally, Pembina's Marketing business is also exposed to variability in quality, time and location differentials for various products, and financial instruments may be used to offset Pembina's exposures to these differentials. Pembina does not trade financial instruments for speculative purposes.
115 Pembina Pipeline Corporation 2019 Annual Report
Certain of Pembina's cash flows, namely a portion of its commodity-related cash flows, certain cash flows from U.S.-based infrastructure assets and distributions from U.S.-based investments in equity accounted investees, are subject to currency risk, arising from the denomination of specific cash flows in U.S. dollars. Additionally, a portion of Pembina's capital expenditures and contributions or loans to Pembina’s U.S.-based investments in equity accounted investees, may be denominated in U.S. dollars. Pembina monitors, assesses and responds to these foreign currency risks using an active risk management program, which may include the exchange of foreign currency for domestic currency at a fixed rate.
Interest bearing financial liabilities include Pembina's debt and lease liabilities. Pembina has a floating interest rate debt which subjects Pembina to interest rate risk.
At the reporting date, the interest rate profile of Pembina's interest-bearing financial instruments was: |
| | | | |
| As at December 31 | | |
| ($ millions) | 2019 |
| 2018 |
|
| Carrying amounts of financial liability | | |
Fixed rate instruments (1) | 8,874 |
| 6,232 |
|
Variable rate instruments(2) | 2,097 |
| 1,305 |
|
| | 10,971 |
| 7,537 |
|
| |
(1) | Includes lease liabilities following the adoption of IFRS 16, see "Changes in Accounting Policies" |
| |
(2) | At December 31, 2019, Pembina held no positions in financial derivative contracts to fix interest rates (December 31, 2018: nil). |
Cash Flow Sensitivity Analysis for Variable Rate Instruments
A change of 100 basis points in interest rates at the reporting date would have (increased) decreased earnings by the amounts shown below. This analysis assumes that all other variables remain constant. |
| | |
| As at December 31 | | |
| ($ millions) | 2019 | 2018 |
| | ± 100 bp | ± 100 bp |
| Earnings sensitivity (net) | ±9 | ±13 |
Fair Values
The fair values of financial assets and liabilities, together with the carrying amounts shown in the consolidated statements of financial position, are shown in the table below. Certain non-derivative financial instruments measured at amortized cost including cash and cash equivalents, trade receivables and other, finance lease receivables, advances to related parties and trade payables and other have been excluded because they have carrying amounts that approximate their fair value due to the nature of the item or the short time to maturity. These instruments would be classified in Level 2 of the fair value hierarchy. |
| | | | | | | | | | | | | | | | |
| | 2019 | 2018 |
| As at December 31 | Carrying
Value |
| Fair Value(1) | Carrying Value |
| Fair Value(1) |
| ($ millions) | Level 1 |
| Level 2 |
| Level 3 |
| Level 1 |
| Level 2 |
| Level 3 |
|
| Financial assets carried at fair value | | | | | | | | |
| Derivative financial instruments | 48 |
| — |
| 48 |
| — |
| 54 |
| — |
| 54 |
| — |
|
Advances to related parties(2) | — |
| — |
| — |
| — |
| 58 |
| — |
| — |
| 58 |
|
| | 48 |
| — |
| 48 |
| — |
| 112 |
| — |
| 54 |
| 58 |
|
| Financial liabilities carried at fair value |
|
|
|
|
|
| | | | | |
| Derivative financial instruments | 9 |
| — |
| 9 |
| — |
| 6 |
| — |
| 6 |
| — |
|
| Financial liabilities carried at amortized cost | | | | | | | | |
Loans and borrowings(3) | 10,152 |
| — |
| 10,729 |
| — |
| 7,537 |
| — |
| 7,588 |
| — |
|
| |
(1) | The basis for determining fair value is disclosed in note 5. |
| |
(2) | Advances to related parties carried at fair value consisted of funds advanced by Pembina to a jointly controlled entity with an equity conversion option that was exercised during the first quarter of 2019. US$43 million of advances were converted to shares during the first quarter of 2019 and are included in the Investments in Equity Accounted Investees balance in the condensed consolidated interim statements of financial position at December 31, 2019. |
| |
(3) | Carrying value of current and non-current balances. |
Pembina Pipeline Corporation 2019 Annual Report 116
Interest Rates Used for Determining Fair Value
The interest rates used to discount estimated cash flows, when applicable, are based on the government yield curve at the reporting date plus an adequate credit spread, and were as follows: |
| | |
| As at December 31 | | |
| (percent) | 2019 | 2018 |
| Derivatives | 2.0 - 2.5 | 2.2 - 2.3 |
| Loans and borrowings | 2.3 - 4.0 | 2.6 - 5.6 |
Fair value of power derivatives are based on market rates reflecting forward curves.
Fair Value Hierarchy
The fair value of financial instruments carried at fair value is classified according to the following hierarchy based on the amount of observable inputs used to value the instruments.
Level 1: Unadjusted quoted prices are available in active markets for identical assets or liabilities as the reporting date. Pembina does not use Level 1 inputs for any of its fair value measurements.
Level 2: Inputs other than quoted prices included within Level 1 that are observable for the asset or liability, either directly (i.e. as prices) or indirectly (i.e. derived from prices). Level 2 valuations are based on inputs, including quoted forward prices for commodities, time value and volatility factors, which can be substantially observed or corroborated in the marketplace. Instruments in this category include non-exchange traded derivatives such as over-the-counter physical forwards and options, including those that have prices similar to quoted market prices. Pembina obtains quoted market prices for its inputs from information sources including banks, Bloomberg Terminals and Natural Gas Exchange. The majority of Pembina's significant financial instruments carried at fair value are valued using Level 2 inputs.
Level 3: Inputs for the asset or liability that are not based on observable market data (unobservable inputs). Level 3 valuations use unobservable inputs, such as a financial forecast developed using the entity’s own data for expected cash flows and risk adjusted discount rates, to measure fair value to the extent that relevant observable inputs are not available. The unobservable inputs reflect the assumptions that market participants would use when pricing the asset or liability, including assumptions about risk. In developing unobservable inputs, the entity’s own data is used and adjusted for reasonably available information that would be used by other market participants.
Advances to related parties carried at fair value consist of funds advances by Pembina to a jointly controlled entity with an equity conversion option. Fair value is measured on a recurring basis using a valuation model that considers the present value of management's best estimate of future cash flows expected to result from the asset under development in the jointly controlled entity, discounted using a risk-adjusted discount rate.
The following table is a summary of the net derivative financial instruments, which is consistent with the gross balances: |
| | | | | | | | | | | | | | | | | | | | |
| | 2019 | 2018 |
As at December 31 ($ millions) | Current Asset |
| Non-Current Asset |
| Current Liability |
| Non-Current Liability |
| Total |
| Current Asset |
| Non-Current Asset |
| Current Liability |
| Non-Current Liability |
| Total |
|
| Commodity, power, storage and rail financial instruments | 34 |
| 5 |
| (6 | ) | (3 | ) | 30 |
| 44 |
| — |
| (2 | ) | — |
| 42 |
|
| Foreign exchange | 6 |
| 3 |
| — |
| — |
| 9 |
| 10 |
| — |
| (4 | ) | — |
| 6 |
|
| Net derivative financial instruments | 40 |
| 8 |
| (6 | ) | (3 | ) | 39 |
| 54 |
| — |
| (6 | ) | — |
| 48 |
|
117 Pembina Pipeline Corporation 2019 Annual Report
Sensitivity Analysis
The following table shows the impact on earnings if the underlying risk variables of the derivative financial instruments changed by a specified amount, with other variables held constant. |
| | | | | |
| As at December 31, 2019 | | | |
($ millions)(1) | | + Change |
| - Change |
|
| Frac spread related | | | |
| Natural gas | (AECO +/- $0.25 per GJ) | 9 |
| (9 | ) |
| NGL (includes propane, butane and condensate) | (Belvieu/Conway +/- U.S. $0.10 per gal) | (43 | ) | 43 |
|
| Foreign exchange (US$ vs. C$) | (FX rate +/- $0.10) | (46 | ) | 46 |
|
| Product margin | | | |
| Crude oil | (WTI +/- $2.50 per bbl) | (2 | ) | 2 |
|
| NGL (includes propane, butane and condensate) | (Belvieu/Conway +/- U.S. $0.10 per gal) | N/A |
| N/A |
|
| |
(1) | As at December 31, 2019, there were no outstanding financial derivative contracts related to power and interest rates. |
25. CAPITAL MANAGEMENT
Pembina's objective when managing capital is to ensure a stable stream of dividends to shareholders that is sustainable over the long-term. Pembina manages its capital structure based on requirements arising from significant capital development activities, the risk characteristics of its underlying asset base and changes in economic conditions. Pembina manages its capital structure and short-term financing requirements using non-GAAP measures, including the ratios of debt to adjusted EBITDA, debt to total enterprise value, adjusted cash flow to debt and debt to equity. The metrics are used to measure Pembina's financial leverage and measure the strength of Pembina's balance sheet. Pembina remains satisfied that the leverage currently employed in its capital structure is sufficient and appropriate given the characteristics and operations of the underlying asset base. Pembina, upon approval from its Board of Directors, will balance its overall capital structure through new equity or debt issuances, as required.
Pembina maintains a conservative capital structure that allows it to finance its day-to-day cash requirements through its operations, without requiring external sources of capital. Pembina funds its operating commitments, short-term capital spending as well as its dividends to shareholders through this cash flow, while new borrowing and equity issuances are primarily reserved for the support of specific significant development activities. The capital structure of Pembina consists of shareholder's equity, comprised of common and preferred equity, plus long-term debt. Long-term debt is comprised of bank credit facilities, unsecured notes and finance lease obligations.
Pembina is subject to certain financial covenants in its credit facility agreements and is in compliance with all financial covenants as of December 31, 2019.
Note 16 of these financial statements shows the change in share capital for the year ended December 31, 2019.
26. GROUP ENTITIES
Significant Subsidiaries |
| | |
| As at December 31 | Ownership Interest |
| (percentages) | 2019 | 2018 |
| Pembina Gas Services Limited Partnership | 100 | 100 |
| Pembina Holding Canada L.P. | 100 | 100 |
| Pembina Infrastructure and Logistics L.P. | 100 | 100 |
| Pembina Midstream Limited Partnership | 100 | 100 |
| Pembina Oil Sands Pipeline L.P. | 100 | 100 |
| Pembina Pipeline | 100 | 100 |
| Pembina Empress NGL Partnership | 100 | 100 |
| Ruby Blocker LLC | 100 | 100 |
| Pembina Cochin LLC | 100 | — |
Pembina Pipeline Corporation 2019 Annual Report 118
27. RELATED PARTIES
Pembina enters into transactions with related parties in the normal course of business and on terms equivalent to those that prevail in arm's length transactions, unless otherwise noted. Pembina contracts capacity from its equity accounted investee Alliance, advances funds to support operations and provides services, on a cost recovery basis, to investments in equity accounted investees. A summary of the significant related party transactions are as follows:
Equity Accounted Investees |
| | | | |
| ($ millions) | 2019 |
| 2018 |
|
| For the years ended December 31: | | |
| Services provided | 82 |
| 42 |
|
| Services received | 2 |
| — |
|
| Interest income | 10 |
| 6 |
|
| As at December 31: | | |
Advances to related parties(1) | 131 |
| 135 |
|
| Trade receivables and other | 17 |
| 12 |
|
| |
(1) | During the year ended December 31, 2019, Pembina converted $58 million in advances to Canada Kuwait Petrochemical Corporation into equity contributions, and advanced US$31 million (2018: US$31 million) to Ruby Pipeline, L.L.C. and $17 million (2018: nil), net of repayments, to Fort Saskatchewan Ethylene Storage Limited Partnership. |
Key Management Personnel and Director Compensation
Key management consists of Pembina's directors and certain key officers.
Compensation
In addition to short-term employee benefits, including salaries, director fees and short-term incentives, Pembina also provides key management personnel with share-based compensation, contributes to post employment pension plans and provides car allowances, parking and business club memberships.
Key management personnel compensation comprised: |
| | | | |
| For the years ended December 31 | | |
| ($ millions) | 2019 |
| 2018 |
|
| Short-term employee benefits | 10 |
| 10 |
|
| Share-based compensation and other | 13 |
| 13 |
|
| Total compensation of key management | 23 |
| 23 |
|
Transactions
Key management personnel and directors of Pembina control less than one percent of the voting common shares of Pembina (consistent with the prior year). Certain directors and key management personnel also hold Pembina preferred shares. Dividend payments received for the common and preferred shares held are commensurate with other non-related holders of those instruments.
Certain officers are subject to employment agreements in the event of termination without just cause or change of control.
Post-Employment Benefit Plans
Pembina has significant influence over the pension plans for the benefit of their respective employees. No balance payable is outstanding at December 31, 2019 (December 31, 2018: nil).
|
| | | | | |
| ($ millions) | | Transaction Value Year Ended December 31 |
| Post-employment benefit plan | Transaction | 2019 |
| 2018 |
|
| Defined benefit plan | Funding | 20 |
| 19 |
|
119 Pembina Pipeline Corporation 2019 Annual Report
28. COMMITMENTS AND CONTINGENCIES
Commitments
Pembina had the following contractual obligations outstanding at December 31, 2019: |
| | | | | | | | | | |
| Contractual Obligations | Payments Due by Period |
| ($ millions) | Total |
| Less than 1 Year |
| 1 – 3 Years |
| 3 – 5 Years |
| After 5 Years |
|
Leases(1) | 1,152 |
| 130 |
| 237 |
| 179 |
| 606 |
|
Loans and borrowings(2) | 14,565 |
| 477 |
| 2,379 |
| 3,337 |
| 8,372 |
|
Construction commitments(3) | 1,766 |
| 1,128 |
| 123 |
| 33 |
| 482 |
|
Other(4) | 659 |
| 109 |
| 158 |
| 93 |
| 299 |
|
| Total contractual obligations | 18,142 |
| 1,844 |
| 2,897 |
| 3,642 |
| 9,759 |
|
| |
(1) | Includes terminals, rail, office space, land and vehicle leases. |
| |
(2) | Excluding deferred financing costs. Including interest payments on senior unsecured notes. |
| |
(3) | Excluding significant projects that are awaiting regulatory approval at December 31, 2019, projects which Pembina is not committed to construct, and projects that are executed by equity accounted investees. |
| |
(4) | Includes $65 million in commitments related to leases that have not yet commenced. |
Pembina enters into product purchase agreements and power purchase agreements to secure supply for future operations. Purchase prices of both NGL and power are dependent on current market prices. Volumes and prices for NGL and power contracts cannot be reasonably determined and therefore an amount has not been included in the contractual obligations schedule. Product purchase agreements range from one to 10 years and involve the purchase of NGL products from producers. Assuming product is available, Pembina has secured between 20 and 175 mbpd each year up to and including 2028. Power purchase agreements range from one to 25 years and involve the purchase of power from electrical service providers. Pembina has secured up to 67 megawatts per day each year up to and including 2043.
Commitments to Equity Accounted Investees
Pembina is contractually committed to provide CKPC with funding to construct assets that will form part of CKPC's PDH/PP Facility, subject to certain conditions being met.
Pembina has a contractual commitment to advance US$39 million to Ruby by March 26, 2020.
Pembina has commitments to provide contributions to certain equity accounted investees based on annual budgets approved by the joint venture partners.
Contingencies
Pembina, its subsidiaries and its investments in equity accounted investees are subject to various legal and regulatory proceedings and actions arising in the normal course of business. We represent our interests vigorously in all proceedings in which we are involved. Legal and administrative proceedings involving possible losses are inherently complex, and we apply significant judgment in estimating probable outcomes. While the outcome of such actions and proceedings cannot be predicted with certainty, management believes that the resolutions of such actions and proceedings will not have a material impact on Pembina's financial position or results of operations.
Letters of Credit
Pembina has provided guarantees to various third parties in the normal course of conducting business. The guarantees include financial guarantees to counterparties for product purchases and sales, transportation services, utilities, engineering and construction services. The guarantees have not had and are not expected to have a material impact on Pembina's financial position, earnings, liquidity or capital resources.
Pembina has $103 million (2018: $69 million) in letters of credit issued to facilitate commercial transactions with third parties and to support regulatory requirements.
Pembina Pipeline Corporation 2019 Annual Report 120
29. SUBSEQUENT EVENTS
On January 7, 2020, Pembina and Petrochemical Industries Company K.S.C. of Kuwait, announced their equally-owned joint venture entity, Canada Kuwait Petrochemical Limited Partnership ("CKPC"), executed a lump sum engineering, procurement and construction ("EPC") contract related to the construction of the propane dehydrogenation ("PDH") facility within its integrated PDH and polypropylene ("PP") upgrading facility ("PDH/PP Facility"). Pembina’s proportionate share of the capital cost of the PDH/PP Facility, including the 100 percent directly-owned supporting facilities, is estimated at $2.7 billion and going into commercial service in the second half of 2023.
121 Pembina Pipeline Corporation 2019 Annual Report
|
| |
| | |
HEAD OFFICE Pembina Pipeline Corporation Suite 4000, 585 - 8th Avenue SW Calgary, Alberta T2P 1G1 AUDITORS KPMG LLP Chartered Professional Accountants Calgary, Alberta TRUSTEE, REGISTRAR & TRANSFER AGENT Computershare Trust Company of Canada Suite 600, 530 - 8th Avenue SW Calgary, Alberta T2P 3S8 1.800.564.6253 STOCK EXCHANGE Pembina Pipeline Corporation Toronto Stock Exchange listing symbols for: COMMON SHARES PPL PREFERRED SHARES PPL.PR.A, PPL.PR.C, PPL.PR.E, PPL.PR.G, PPL.PR.I, PPL.PR.K, PPL.PR.M, PPL.PR.O, PPL.PR.Q, PPL.PR.S, PPL.PF.A, PPL.PF.C and PPL.PF.E New York Stock Exchange listing symbol for: COMMON SHARES PBA INVESTOR INQUIRIES PHONE 403.231.3156 FAX 403.237.0254 TOLL FREE 1.855.880.7404 EMAIL investor-relations@pembina.com WEBSITE www.pembina.com |
Pembina Pipeline Corporation 2019 Annual Report 122