| REPORT TO SHAREHOLDERS |  | ||
| First Quarter 2020 | |||
| MANAGEMENT'S DISCUSSION AND ANALYSIS | |||
| Table of Contents | |||
1 Pembina Pipeline Corporation First Quarter 2020
Basis of Presentation
The following Management's Discussion and Analysis ("MD&A") of the financial and operating results of Pembina Pipeline Corporation ("Pembina" or the "Company") is dated May 7, 2020, and is supplementary to, and should be read in conjunction with, Pembina's unaudited condensed consolidated interim financial statements for the three months ended March 31, 2020 ("Interim Financial Statements") as well as Pembina's consolidated annual financial statements ("Consolidated Financial Statements") and MD&A for the year ended December 31, 2019. All financial information has been prepared in accordance with IAS 34 Interim Financial Reporting and is expressed in Canadian dollars unless otherwise noted. A description of Pembina's operating segments and additional information about Pembina is filed with Canadian and U.S. securities commissions, including quarterly and annual reports, annual information forms (filed with the U.S. Securities and Exchange Commission under Form 40-F), and management information circulars, which can be found online at www.sedar.com, www.sec.gov and through Pembina's website at www.pembina.com.
Abbreviations
For a list of abbreviations that may be used in this MD&A, refer to the "Abbreviations" section of this MD&A.
Non-GAAP Financial Measures
Pembina has identified certain operating and financial performance measures that management believes provide meaningful information in assessing Pembina's underlying performance. Readers are cautioned that these measures do not have a standardized meaning prescribed by International Financial Reporting Standards ("IFRS") and therefore may not be comparable to similar measures presented by other entities. Refer to the "Non-GAAP Measures" section of this MD&A for a list and description, including reconciliations to the most directly comparable GAAP measure, of such non-GAAP measures.
Risk Factors and Forward-Looking Information
Management has identified the primary risk factors that could potentially have a material impact on the financial results and operations of Pembina. Such risk factors are presented in Pembina's MD&A and Annual Information Form ("AIF") for the year ended December 31, 2019 and have been updated in this MD&A as necessary. The Company's financial and operational performance is potentially affected by a number of factors, including, but not limited to, the factors described within the "Forward-Looking Statements & Information" section of this MD&A. This MD&A contains forward-looking statements based on Pembina's current expectations, estimates, projections and assumptions. This information is provided to assist readers in understanding the Company's future plans and expectations and may not be appropriate for other purposes.
Pembina Pipeline Corporation First Quarter 2020 2
1. ABOUT PEMBINA
Pembina is a leading transportation and midstream service provider that has been serving North America's energy industry for 65 years. Pembina owns an integrated system of pipelines that transport various hydrocarbon liquids and natural gas products produced primarily in western Canada. The Company also owns gas gathering and processing facilities; an oil and natural gas liquids infrastructure and logistics business; is growing an export terminals business; and is currently developing a petrochemical facility to convert propane into polypropylene. Pembina's integrated assets and commercial operations along the majority of the hydrocarbon value chain allow it to offer a full spectrum of midstream and marketing services to the energy sector. Pembina is committed to identifying additional opportunities to connect hydrocarbon production to new demand locations through the development of infrastructure that would extend Pembina's service offering even further along the hydrocarbon value chain. These new developments will contribute to ensuring that hydrocarbons produced in the WCSB and the other basins where Pembina operates can reach the highest value markets throughout the world.
Purpose of Pembina:
To be the leader in delivering integrated infrastructure solutions connecting global markets;
| • | Customers choose us first for reliable and value-added services; |
| • | Investors receive sustainable industry-leading total returns; |
| • | Employees say we are the 'employer of choice' and value our safe, respectful, collaborative and fair work culture; and |
| • | Communities welcome us and recognize the net positive impact of our social and environmental commitment. |
Impact of COVID-19 Pandemic and Recent Decline in Global Energy Prices
During March 2020, the World Health Organization declared the recent global outbreak of novel coronavirus ("COVID-19") a global pandemic. On March 18, 2020, in response to the COVID-19 pandemic and the significant decline in global energy prices, Pembina announced it was taking action to protect its stakeholders. Pembina's action plan is focused on the health and safety of its employees and communities and ensuring a decisive response for customers and investors including a $900 million to $1.1 billion reduction to the Company's 2020 capital spending plans.
Pembina's greatest assets are its people and the relationships with its customers, investors and the communities in which it has a presence. Pembina will continue to keep its employees and stakeholders top of mind and supported while navigating through these events. Pembina will adjust its response as needed and will continue to base decisions on recommendations from public health experts, ongoing evaluation of global energy prices and the impact on Pembina's and customers' businesses.
The impacts of these events have been assessed throughout this document and where material, additional disclosure has been provided to indicate the potential impacts that such events may have on Pembina and its results of operations.
Pembina's news release dated March 18, 2020 can be found online at www.sedar.com and through Pembina's website at www.pembina.com.
3 Pembina Pipeline Corporation First Quarter 2020
2. FINANCIAL & OPERATING OVERVIEW
Consolidated Financial Overview Three Months Ended March 31
Results of Operations
| ($ millions, except where noted) | 2020 | 2019 | Change | % Change | ||||
| Revenue | 1,671 | 1,968 | (297 | ) | (15 | ) | ||
Net revenue(1) | 865 | 774 | 91 | 12 | ||||
| Gross profit | 728 | 588 | 140 | 24 | ||||
| Earnings | 314 | 313 | 1 | — | ||||
Earnings per common share – basic (dollars) | 0.50 | 0.55 | (0.05 | ) | (9 | ) | ||
Earnings per common share – diluted (dollars) | 0.50 | 0.55 | (0.05 | ) | (9 | ) | ||
| Cash flow from operating activities | 410 | 608 | (198 | ) | (33 | ) | ||
Cash flow from operating activities per common share – basic (dollars)(1) | 0.75 | 1.20 | (0.45 | ) | (38 | ) | ||
Adjusted cash flow from operating activities(1) | 576 | 578 | (2 | ) | — | |||
Adjusted cash flow from operating activities per common share – basic (dollars)(1) | 1.05 | 1.14 | (0.09 | ) | (8 | ) | ||
| Capital expenditures | 483 | 361 | 122 | 34 | ||||
Adjusted EBITDA(1) | 830 | 773 | 57 | 7 | ||||
Total volume (mboe/d)(2) | 3,508 | 3,403 | 105 | 3 | ||||
Bridge Analysis of Earnings ($ millions)
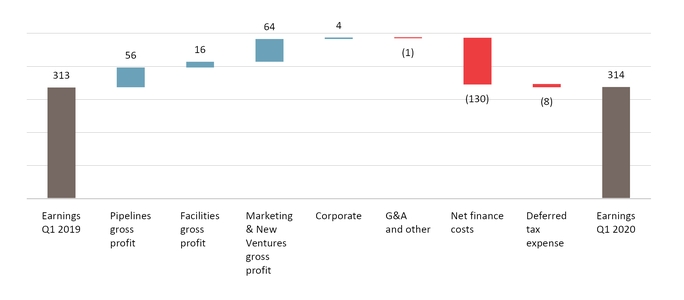
Results Overview
Pembina's highly contracted business model continued to show its strength and stability during the first quarter. Earnings in the first quarter of 2020 were positively impacted by higher gross profit in both Pipelines and Facilities from additional assets following the Kinder Acquisition, combined with consistent performance from Pembina's other assets. Marketing & New Ventures was impacted by lower margins on crude oil and NGL sales during the quarter, offset by higher unrealized gains on commodity-related derivatives due to decreasing forward prices for crude oil and NGL compared to contract positions. Net finance costs increased during the first quarter of 2020, however the increase was primarily attributable to unrealized foreign exchange losses associated with the decrease in the value of the Canadian dollar relative to the U.S. dollar.
Pembina Pipeline Corporation First Quarter 2020 4
| Changes in Results for the Three Months Ended March 31 | ||
| Revenue | ▼ | $297 million decrease, due to the sharp decline in crude and NGL prices during the first quarter of 2020, primarily as a result of the COVID-19 pandemic, the resulting virtual shutdown of the global economy and actions of certain Organization of Petroleum Exporting Countries ("OPEC") and allied countries in March 2020 to temporarily increase the supply of crude oil impacting sales in the marketing business, partially offset by revenue from the Cochin Pipeline, Edmonton Terminals and Vancouver Wharves acquired in the Kinder Acquisition, combined with consistent performance from Pembina's other assets. |
| Cost of goods sold | ▲ | $388 million decrease, due to lower crude oil and NGL prices and lower NGL sales volumes during the first quarter of 2020. |
| Operating expenses | ▼ | $39 million increase, largely due to higher labour, power costs and property taxes driven by growth in Pembina's business, partially offset by a lower power pool price during the first quarter of 2020. |
| Share of profit from equity accounted investees | ▼ | $13 million decrease, largely due to the narrower AECO-Chicago natural gas price differential and NGL prices, resulting in lower interruptible volumes on the Alliance Pipeline and lower contribution from Aux Sable. |
| Realized gain on commodity-related derivatives | ● | Consistent realized gains relating to the settlement of NGL and crude oil-based derivatives. |
| Unrealized (gain) loss on commodity-related derivatives | ▲ | $154 million positive variance primarily due to the sharp decrease in the forward price of crude oil and NGL, which drove the associated derivative contracts into a gain position. |
| General & administrative and other expense | ● | Consistent with prior period, as the decline in global equity markets impacted Pembina's share price resulting in lower incentive expenses in the first quarter of 2020, which were largely offset by project write-downs taken and acquisition related costs. |
| Net finance costs | ▼ | $130 million increase, primarily driven by a $107 million increase in foreign exchange losses on U.S. dollar debt and non-commodity related derivative financial instruments following the decrease in the value of the Canadian dollar relative to the U.S. dollar during the first quarter of 2020, and $16 million in additional interest expense associated with higher average debt levels. |
| Current tax expense | ● | Consistent with the prior period, as taxable income generated from the Kinder Acquisition was offset by decreased taxable income from other Pembina entities. |
| Deferred tax expense | ▼ | $8 million increase, due to unrealized foreign exchange gains and higher tax depreciation claims in 2020, partially offset by the utilization of non-capital losses in 2019. |
| Earnings | ● | Consistent with the prior period, due to the items noted above. |
| Cash flow from operating activities | ▼ | $198 million decrease, primarily driven by the $115 million increase in taxes paid as the final payment of 2019 taxes was made, $72 million change in non-cash working capital and $47 million decrease in distributions from equity accounted investees, partially offset by an increase in operating results after adjusting for non-cash items. |
Adjusted cash flow from operating activities(1) | ● | Consistent with the prior period, largely due to the same items impacting cash flow from operating activities, discussed above, net of the increase in taxes paid, change in non-cash working capital, combined with the $34 million decrease in accrued share based payment expense as a result of Pembina's lower share price reducing long-term incentives. |
Adjusted EBITDA(1) | ▲ | $57 million increase due to the $100 million contribution from new assets following the Kinder Acquisition, combined with increased volumes on the Peace Pipeline system, partially offset by lower margins on crude oil and NGL sales in the marketing business as a result of the sharp decline in commodity prices during the first quarter of 2020, and lower contribution from Alliance due to the narrower AECO-Chicago natural gas price differential. Included in adjusted EBITDA is $179 million (2019: $220 million) related to equity accounted investees. |
Total volume (mboe/d)(2) | ▲ | 105 mboe/d increase due to the larger asset base and increased volumes on the Peace Pipeline system, partially offset by lower interruptible volumes on the Alliance Pipeline due to a narrower AECO-Chicago natural gas price differential and lower supply volumes at the Redwater Complex. Revenue volumes include 343 mboe/d (2019: 368 mboe/d) related to equity accounted investees. |
| ▲ | Increase; | ▼ | Decrease; or | ● | No impact; | to earnings, adjusted EBITDA, cash flow from operations, adjusted cash flow from operating activities or total volumes. |
(1) | Refer to the "Non-GAAP Measures" section. |
(2) | Total revenue volumes. See the "Abbreviations" section for definition. Marketed NGL volumes are excluded from volumes to avoid double counting. Refer to the "Marketing & New Ventures" section for further information. |
5 Pembina Pipeline Corporation First Quarter 2020
3. SEGMENT RESULTS
Business Overview
The Pipelines Division provides customers with pipeline transportation, terminalling, storage and rail services in key market hubs in Canada and the United States for crude oil, condensate, natural gas liquids and natural gas. The division manages pipeline transportation capacity of approximately 3.1 mmboe/d(1), above ground storage of approximately 11 mmbbls(1) and rail terminalling capacity of approximately 145 mboe/d(1) within its conventional, oil sands and heavy oil, and transmission assets. The conventional assets include strategically located pipelines and terminalling hubs that gather and transport light and medium crudes, condensate and natural gas liquids from western Alberta and northeast British Columbia to the Edmonton, Alberta area for further processing or transportation on downstream pipelines. The oil sands and heavy oil assets transport heavy and synthetic oil produced within Alberta to the Edmonton area and offer associated storage, terminalling and rail services. The transmission assets transport natural gas, ethane and condensate throughout Canada and the United States on long haul pipelines linking various key market hubs. In addition, the Pipelines Division assets provide linkages between Pembina's upstream and downstream assets across North America, enabling integrated customer service offerings. Together, these assets supply product from hydrocarbon producing regions to refineries, fractionators and market hubs in Alberta, British Columbia, Illinois and California, as well as other regions throughout North America.
The Facilities Division includes infrastructure that provides Pembina's customers with natural gas, condensate and NGL services. Pembina's operated natural gas gathering and processing assets are strategically positioned in active, liquids-rich areas of the WCSB and Williston Basin and are integrated with the Company's other businesses. Pembina provides sweet and sour gas gathering, compression, condensate stabilization, and both shallow cut and deep cut gas processing services with a total capacity of approximately 6(2) bcf/d for its customers. Virtually all of the condensate and NGL extracted through Canadian-based facilities are transported by Pembina's Pipelines Division. In addition, all NGL transported along the Alliance Pipeline are extracted through the Pembina operated Channahon Facility at the terminus. The Facilities Division includes approximately 326 mbpd(2) of NGL fractionation, 21 mmbbls(1) of cavern storage and associated pipeline and rail terminalling facilities and the Company is currently constructing a liquefied propane export facility on Canada's West Coast. These facilities are fully integrated with the Company's other divisions, providing customers with the ability to access a comprehensive suite of services to enhance the value of their hydrocarbons.
The Marketing & New Ventures Division strives to maximize the value of hydrocarbon liquids and natural gas originating in the basins where the Company operates. Pembina seeks to create new markets, and further enhance existing markets, to support both the Company's and its customers' overall business interests. In particular, Pembina seeks to identify opportunities to connect hydrocarbon production to new demand locations through the development of infrastructure. Pembina strives to increase producer netbacks and product demand to improve the overall competitiveness of the basins where the Company operates. Within the Marketing & New Ventures Division, Pembina undertakes value-added commodity marketing activities including buying and selling products (natural gas, ethane, propane, butane, condensate and crude oil), commodity arbitrage, and optimizing storage opportunities. The marketing business enters into contracts for capacity on both Pembina's and third-party infrastructure, handles proprietary and customer volumes and aggregates production for onward sale. The Marketing & New Ventures Division includes an integrated PDH/PP Facility being developed by Pembina's joint venture, CKPC and the proposed Jordan Cove LNG project.
(1) | Net capacity; excludes projects under development. |
(2) | Net capacity. Includes Aux Sable capacity. The financial and operational results for Aux Sable are included in the Marketing & New Ventures Division; excludes projects under development. |
Pembina Pipeline Corporation First Quarter 2020 6
Financial and Operational Overview by Division
| 3 Months Ended March 31 | ||||||||||||
| 2020 | 2019 | |||||||||||
| ($ millions, except where noted) | Volumes(1) | Gross Profit | Adjusted EBITDA(2) | Volumes(1) | Gross Profit | Adjusted EBITDA(2) | ||||||
| Pipelines | 2,629 | 396 | 550 | 2,507 | 340 | 457 | ||||||
| Facilities | 879 | 174 | 256 | 896 | 158 | 232 | ||||||
Marketing & New Ventures(3) | — | 157 | 55 | — | 93 | 121 | ||||||
| Corporate | — | 1 | (31 | ) | — | (3 | ) | (37 | ) | |||
| Total | 3,508 | 728 | 830 | 3,403 | 588 | 773 | ||||||
(1) | Pipelines and Facilities are revenue volumes which are physical volumes plus volumes recognized from take-or-pay commitments. Volumes are stated in mboe/d, with natural gas volumes converted to mboe/d from MMcf/d at a 6:1 ratio. |
(2) | Refer to the "Non-GAAP Measures" section. |
(3) | Marketed NGL volumes are excluded from volumes to avoid double counting. Refer to the "Marketing & New Ventures" section for further information. |
7 Pembina Pipeline Corporation First Quarter 2020
Pipelines
Financial Overview Three Months Ended March 31
Results of Operations
| ($ millions, except where noted) | 2020 | 2019 | Change | % Change | ||||
Conventional revenue(1) | 325 | 314 | 11 | 4 | ||||
Transmission revenue(1) | 118 | 40 | 78 | 195 | ||||
Oil Sands revenue(1) | 120 | 62 | 58 | 94 | ||||
Pipelines revenue(1) | 563 | 416 | 147 | 35 | ||||
Operating expenses(1) | 126 | 98 | 28 | 29 | ||||
| Share of profit from equity accounted investees | 58 | 79 | (21 | ) | (27 | ) | ||
| Depreciation and amortization included in operations | 99 | 57 | 42 | 74 | ||||
| Gross profit | 396 | 340 | 56 | 16 | ||||
Adjusted EBITDA(2) | 550 | 457 | 93 | 20 | ||||
Volumes (mboe/d)(3) | 2,629 | 2,507 | 122 | 5 | ||||
| Distributions from equity accounted investees | 88 | 111 | (23 | ) | (21 | ) | ||
| Change in Results | ||
Conventional revenue(1) | ▲ | Increase primarily due to increased volumes and contractual commitments for service on the Peace Pipeline system, as customers added additional connections in the liquids rich areas of the WCSB. |
Transmission revenue(1) | ▲ | Increase largely due to the contribution from the Cochin Pipeline following the Kinder Acquisition, combined with the return to normal operations on the Vantage Pipeline following a year-long third-party force majeure. |
Oil Sands revenue(1) | ▲ | Increase primarily due to contribution from the Edmonton Terminals following the Kinder Acquisition. |
Operating expenses(1) | ▼ | Increase primarily due to the additional operating expenses associated with the Cochin Pipeline ($15 million) and Edmonton Terminals ($11 million) following the Kinder Acquisition. |
| Share of profit from equity accounted investees | ▼ | Decrease largely due to lower interruptible volumes on the Alliance Pipeline, driven by a narrower AECO-Chicago natural gas price differential. |
| Depreciation and amortization included in operations | ▼ | Increase in depreciation due to the larger asset base, as a result of the assets acquired in the Kinder Acquisition. |
| Distributions from equity accounted investees | ▼ | $88 million consists of $56 million (2019: $81 million) from Alliance and $32 million (2019: $30 million) from Ruby. The decrease in distributions from Alliance is largely due to the same factors impacting share of profit from equity accounted investees noted above. |
Volumes (mboe/d)(3) | ▲ | Increase primarily due to the contribution from the Cochin Pipeline following the Kinder Acquisition, combined with increased volumes on the Peace Pipeline system, partially offset by lower volumes on the Alliance Pipeline due to a narrower AECO-Chicago natural gas price differential. Revenue volumes include 129 mboe/d (2019: 149 mboe/d) related to Alliance and 87 mboe/d (2019: 89 mboe/d) related to Ruby. |
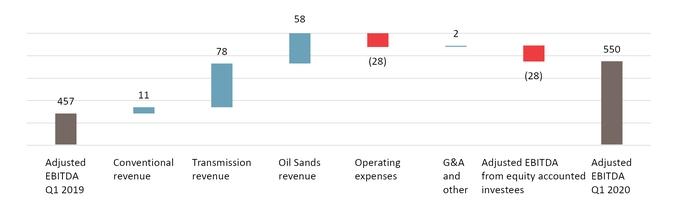
Adjusted EBITDA(2) | ▲ | $93 million increase due to the increase in revenues associated with the Cochin Pipeline and Edmonton Terminals following the Kinder Acquisition, combined with increased volumes on the Peace Pipeline system, partially offset by increased operating expenses associated with the larger asset base and lower contribution from Alliance due to the narrower AECO-Chicago natural gas price differential. Included in adjusted EBITDA is $71 million (2019: $95 million) related to Alliance and $49 million (2019: $53 million) related to Ruby. |
Bridge Analysis of Adjusted EBITDA(2) ($ millions)
(1) | Includes inter-division transactions. See Note 12 of the Interim Financial Statements. |
(2) | Refer to the "Non-GAAP Measures" section. |
(3) | Revenue volumes. See the "Abbreviations" section for definition. |
Pembina Pipeline Corporation First Quarter 2020 8
Operational Overview
| 3 Months Ended March 31 | ||||||||||||
| 2020 | 2019 | |||||||||||
| ($ millions, except where noted) | Volumes(1) | Gross Profit | Adjusted EBITDA(2) | Volumes(1) | Gross Profit | Adjusted EBITDA(2) | ||||||
| Pipelines | ||||||||||||
| Conventional | 902 | 214 | 258 | 880 | 208 | 240 | ||||||
| Transmission | 668 | 124 | 215 | 563 | 105 | 183 | ||||||
| Oil Sands | 1,059 | 58 | 77 | 1,064 | 27 | 34 | ||||||
| Total | 2,629 | 396 | 550 | 2,507 | 340 | 457 | ||||||
(1) | Revenue volumes. See the "Abbreviations" section for definition. |
(2) | Refer to the "Non-GAAP Measures" section. |
Projects & New Developments(1)
Pipelines continues to focus on the execution of various system expansions. The projects in the following table were recently placed into service and impact Pipelines results.
| Significant Projects | In-service Date |
| Wapiti Condensate Lateral | March 2020 |
| NEBC Montney Infrastructure | February 2020 |
The following outlines the projects and new developments within Pipelines:
| Phase VI Peace Pipeline Expansion | ||
Capital Budget: $280 million | In-service Date: In stages starting first quarter of 2020 through mid-2020 | Status: Initial stage complete, trending over budget |
| This expansion includes upgrades at Gordondale; a 16-inch pipeline in the La Glace to Wapiti corridor and associated pump station and terminal upgrades; and a 20-inch pipeline in the Kakwa to Lator corridor. The La Glace to Wapiti pipeline segment was placed into service in Q1 2020. The Kakwa to Lator segment is under construction and is expected to be in service in Q2 2020. | ||
As previously announced, in response to the COVID-19 pandemic, the resulting virtual shutdown of the global economy and the recent significant decline in global energy prices, Pembina made the decision to defer some of its previously announced expansion projects:
| Phase VII Peace Pipeline Expansion | Status: Deferred | ||
| This expansion is expected to add approximately 240 mbpd of incremental capacity upstream of Fox Creek, accessing capacity available on the pipelines downstream of Fox Creek. Included in the expansion is a 20-inch, approximately 220-kilometer pipeline in the La Glace-Valleyview-Fox Creek corridor, as well as six new pump stations or terminal upgrades, between La Glace and Edmonton, Alberta. | |||
| The carrying value of the project at March 31, 2020 is $274 million. | |||
| Phase VIII Peace Pipeline Expansion | Status: Deferred | ||
| This expansion will include 10-inch and 16-inch pipelines in the Gordondale to La Glace corridor as well as six new pump stations or terminal upgrades located between Gordondale and Fox Creek. | |||
| The carrying value of the project at March 31, 2020 is $29 million. | |||
| Phase IX Peace Pipeline Expansion | Status: Deferred | ||
| This expansion currently will include 6-inch and 16-inch pipelines debottlenecking the corridor north of Gordondale as well as upgrades at one pump station. In addition, this expansion will see existing pipelines, which are currently batching, converted to single product lines. | |||
| The carrying value of the project at March 31, 2020 is $3 million. | |||
(1) | For further details on Pembina's significant assets, including definitions, refer to Pembina's AIF for the year ended December 31, 2019 filed at www.sedar.com (filed with the U.S. Securities and Exchange Commission at www.sec.gov under Form 40-F) and on Pembina's website at www.pembina.com. |
9 Pembina Pipeline Corporation First Quarter 2020
Facilities
Financial Overview Three Months Ended March 31
Results of Operations
| ($ millions, except where noted) | 2020 | 2019 | Change | % Change | ||||
Gas Services net revenue(1)(2) | 143 | 145 | (2 | ) | (1 | ) | ||
NGL Services net revenue(1)(2) | 159 | 125 | 34 | 27 | ||||
Facilities net revenue(1)(2) | 302 | 270 | 32 | 12 | ||||
Operating expenses(1) | 96 | 85 | 11 | 13 | ||||
| Share of profit from equity accounted investees | 16 | 12 | 4 | 33 | ||||
| Unrealized gain on commodity-related derivative financial instruments | (5 | ) | — | (5 | ) | 100 | ||
| Depreciation and amortization included in operations | 53 | 39 | 14 | 36 | ||||
| Gross profit | 174 | 158 | 16 | 10 | ||||
Adjusted EBITDA(2) | 256 | 232 | 24 | 10 | ||||
Volumes (mboe/d)(3) | 879 | 896 | (17 | ) | (2 | ) | ||
| Distributions from equity accounted investees | 24 | 33 | (9 | ) | (27 | ) | ||
| Changes in Results | ||
Gas Services net revenue(1)(2) | ● | Consistent with the prior period as increased revenue associated with Duvernay II being placed into service, was largely offset by lower revenues at the Cutbank Complex, noted below. |
NGL Services net revenue(1)(2) | ▲ | Increase primarily due to additional revenues from the Vancouver Wharves following the Kinder Acquisition, combined with the Redwater Co-generation Facility going into service in March 2019. |
Operating expenses(1) | ▼ | Increase largely due to the addition of the Vancouver Wharves following the Kinder Acquisition, combined with the Redwater Co-generation Facility going into service in March 2019, partially offset by lower power costs due to a lower average power pool price and milder weather during the first quarter of 2020. |
| Share of profit from equity accounted investees | ● | Consistent with the prior period. |
| Depreciation and amortization included in operations | ▼ | Increase in depreciation due to the larger asset base as a result of the assets acquired in the Kinder Acquisition and Duvernay II going into service. |
| Distributions from equity accounted investees | ▼ | $24 million consists of $23 million (2019: $30 million) from Veresen Midstream and $1 million (2019: $3 million) from Fort Corp. The decrease in the Veresen Midstream distribution is primarily due to the conversion of Veresen Midstream Class B Units to Class A Units by Pembina's joint venture partner, in the second quarter of 2019, reducing Pembina's distribution to its ownership percentage. |
Volumes (mboe/d)(3) | ▼ | Decrease due to lower supply volumes at the Redwater Complex due to current market conditions, combined with decreased volumes at the Cutbank Complex, partially offset by additional volumes associated with Duvernay II going into service. Revenue volumes include 85 mboe/d (2019: 91 mboe/d) related to Veresen Midstream. |
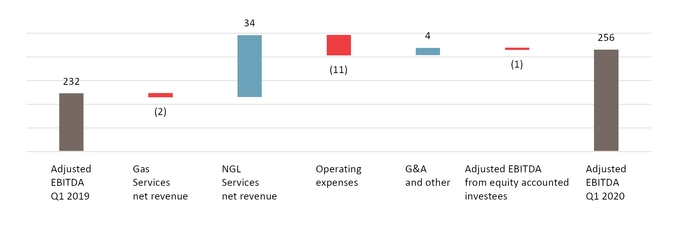
Adjusted EBITDA(2) | ▲ | $24 million increase primarily due to additional revenue from the Vancouver Wharves and the Redwater Co-generation Facility, combined with lower power costs in Gas Services, partially offset by higher operating expenses related to the Vancouver Wharves. Included in adjusted EBITDA is $46 million (2019: $49 million) related to Veresen Midstream. |
Bridge Analysis of Adjusted EBITDA(2) ($ millions)
(1) | Includes inter-division transactions. See Note 12 of the Interim Financial Statements. |
(2) | Refer to the "Non-GAAP Measures" section. |
(3) | Revenue volumes. See the "Abbreviations" section for definition. |
Pembina Pipeline Corporation First Quarter 2020 10
Operational Overview
| 3 Months Ended March 31 | ||||||||||||
| 2020 | 2019 | |||||||||||
| ($ millions, except where noted) | Volumes(1) | Gross Profit | Adjusted EBITDA(2) | Volumes(1) | Gross Profit | Adjusted EBITDA(2) | ||||||
| Facilities | ||||||||||||
| Gas Services | 678 | 90 | 142 | 682 | 82 | 138 | ||||||
| NGL Services | 201 | 84 | 114 | 214 | 76 | 94 | ||||||
| Total | 879 | 174 | 256 | 896 | 158 | 232 | ||||||
(1) | Revenue volumes. See the "Abbreviations" section for definition. |
(2) | Refer to the "Non-GAAP Measures" section. |
Projects & New Developments(1)
Facilities continues to build-out its natural gas and NGL processing and fractionation assets to service customer demand. The projects in the following table were recently placed into service and impact Facilities results.
| Significant Projects | In-service Date |
| Duvernay Sour Treatment Facilities | March 2020 |
| Duvernay II | November 2019 |
| Redwater Co-generation Facility | March 2019 |
| Burstall Ethane Storage | January 2019 |
Collectively, the projects in Facilities are trending on budget.
The following outlines the projects and new developments within Facilities:
| Duvernay III | ||
Capital Budget: $200 million | In-service Date: Fourth quarter 2020 | Status: On time, trending on budget |
| Duvernay III is the second tranche of infrastructure development under the 20-year infrastructure development and service agreement with Chevron Canada Limited and Kuwait Foreign Petroleum Exploration Company. This development includes a 100 MMcf/d sweet gas, shallow cut processing train, 20 mbpd of inlet condensate stabilization and other associated infrastructure. A majority of the packaged equipment and pipe racks have been fabricated and set in place. A mechanical contractor has mobilized and has commenced fabrication of interconnecting pipe. | ||
| Prince Rupert Terminal | ||
Capital Budget: $250 million | In-service Date(2): First quarter of 2021 | Status: Delayed, trending over budget |
| The Prince Rupert Terminal is located on Watson Island, British Columbia and is expected to have a permitted capacity of approximately 25 mbpd of propane. The propane supply will be sourced primarily from the Company's Redwater Complex. Facility piping work, on site sphere assembly, and marine retrofit work continued until early March. As a result of COVID-19, Pembina has temporarily halted all site construction activities, resulting in a delay to the in-service date now expected to be in the first quarter of 2021. Pembina is currently working on a remobilization plan, with the sphere constructor currently scheduled to be back on site in May. The plans for remobilization of other contractors are currently being developed. | ||
| Hythe Developments | ||
Capital Budget(3): $240 million | In-service Date: Late 2020 | Status: On time, trending on budget |
| Pembina and its 45 percent owned joint venture, Veresen Midstream, will construct natural gas gathering and processing infrastructure in the Pipestone Montney region. The infrastructure consists of an expansion of up to 125 MMcf/d (56 MMcf/d net to Pembina) of sour gas processing at Veresen Midstream's existing Hythe Facility and a new, approximately 60 km, 12-inch sour gas pipeline, to be owned by Veresen Midstream and constructed by Pembina. In addition, Veresen Midstream will fund and own a compressor station, built and operated by NuVista Energy Ltd. Pembina will own and construct various other laterals. Construction is underway. | ||
| Empress Infrastructure | ||
Capital Budget: $120 million | In-service Date: Late 2020 | Status: On time, trending on budget |
| This expansion will add new fractionation and terminalling facilities, which are expected to add approximately 30 mbpd of propane-plus fractionation capacity to Pembina's Empress NGL Extraction Facility. Pipeline construction is complete. Mechanical and electrical construction is progressing on the fractionation and rail sites. The rail track construction is expected to commence in May 2020. | ||
11 Pembina Pipeline Corporation First Quarter 2020
As previously announced, in response to the COVID-19 pandemic, the resulting virtual shutdown of the global economy and the recent significant decline in global energy prices, Pembina made the decision to defer some of its previously announced expansion projects:
| Prince Rupert Terminal Expansion | Status: Deferred | ||
The Prince Rupert Terminal Expansion will increase propane export capacity to approximately 40 mbpd. | |||
| The carrying value of the project at March 31, 2020 is $2 million. | |||
| Empress Co-generation Facility | Status: Deferred | ||
| This project will enable Pembina to be more efficient with its production, utilize heat recovery and provide a second source of power through the installation of a co-generation unit at the Empress NGL Extraction Facility. | |||
| The carrying value of the project at March 31, 2020 is $8 million. | |||
(1) | For further details on Pembina's significant assets, including definitions, refer to Pembina's AIF filed at www.sedar.com (filed with the U.S. Securities and Exchange Commission at www.sec.gov under Form 40-F) and on Pembina's website at www.pembina.com. |
(2) | Subject to environmental and regulatory approvals. See the "Forward-Looking Statements & Information" section. |
(3) | Net to Pembina. |
Pembina Pipeline Corporation First Quarter 2020 12
Marketing & New Ventures
Financial Overview Three Months Ended March 31
Results of Operations
| ($ millions, except where noted) | 2020 | 2019 | Change | % Change | ||||
Marketing revenue(1) | 923 | 1,396 | (473 | ) | (34 | ) | ||
Cost of goods sold(1) | 883 | 1,265 | (382 | ) | (30 | ) | ||
Net revenue(1)(2) | 40 | 131 | (91 | ) | (69 | ) | ||
| Share of profit from equity accounted investees | 9 | 5 | 4 | 80 | ||||
| Realized gain on commodity-related derivative financial instruments | (17 | ) | (19 | ) | (2 | ) | 11 | |
| Unrealized (gain) loss on commodity-related derivative financial instruments | (104 | ) | 45 | 149 | 331 | |||
| Depreciation and amortization included in operations | 13 | 17 | (4 | ) | (24 | ) | ||
| Gross profit | 157 | 93 | 64 | 69 | ||||
Adjusted EBITDA(2) | 55 | 121 | (66 | ) | (55 | ) | ||
Volumes (mboe/d)(3) | 195 | 216 | (21 | ) | (10 | ) | ||
| Distributions from equity accounted investees | 11 | 26 | (15 | ) | (58 | ) | ||
| Change in Results | ||
Marketing revenue(1) | ▼ | Decrease due to the sharp decline in crude oil and NGL prices during the first quarter of 2020, primarily as a result of the COVID-19 pandemic, the resulting virtual shutdown of the global economy and actions of certain OPEC and allied countries in March 2020 to temporarily increase the supply of crude oil, combined with lower marketed NGL volumes and a $33 million arbitration award payment received during the first quarter of 2019. |
Cost of goods sold(1) | ▲ | Decrease due to lower crude oil and NGL prices and lower NGL volumes during the first quarter of 2020. |
| Share of profit from equity accounted investees | ▲ | Increase largely due to foreign exchange gains on U.S. cash and cash equivalents held in CKPC to be used in construction of the PDH/PP Facility. |
| Realized gain on commodity-related derivatives | ● | Consistent realized gains relating to the settlement of NGL and crude oil-based derivatives. |
| Unrealized (gain) loss on commodity-related derivatives | ▲ | Unrealized gain primarily due to the sharp decrease in the forward price of crude oil and NGL which drove the associated derivative contracts into a gain position. |
| Depreciation and amortization included in operations | ▲ | Decrease in amortization due to certain fully amortized intangibles. |
| Distributions from equity accounted investees | ▼ | Decrease of $15 million due to the lower margins at Aux Sable as a result of a narrower AECO-Chicago natural gas price differential and lower NGL prices. |
Volumes (mboe/d)(3) | ▼ | Decreased due to lower supply volumes from the Redwater Complex, partially offset by increased volumes at Aux Sable. Revenue volumes includes 42 mboe/d (2018: 39 mboe/d) related to Aux Sable. |
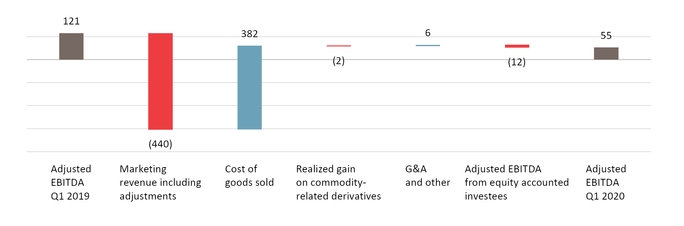
Adjusted EBITDA(2) | ▼ | Decrease largely due to lower margins on crude oil and NGL sales as a result of the sharp decline in commodity prices during the first quarter of 2020, combined with a lower contribution from Aux Sable due to the narrower AECO-Chicago natural gas price differential and NGL prices. Included in adjusted EBITDA is $9 million (2019: $18 million) related to Aux Sable. |
Bridge Analysis of Adjusted EBITDA(2)(4) ($ millions)
(1) | Includes inter-division transactions. See Note 12 of the Interim Financial Statements. |
(2) | Refer to the "Non-GAAP Measures" section. |
(3) | Marketed NGL volumes. See the "Abbreviations" section for definition. |
(4) | Marketing revenue excludes positive arbitration award payment of $33 million. |
13 Pembina Pipeline Corporation First Quarter 2020
Operational Overview
| 3 Months Ended March 31 | ||||||||||||
| 2020 | 2019 | |||||||||||
| ($ millions, except where noted)(unaudited) | Volumes(1) | Gross Profit | Adjusted EBITDA(2) | Volumes(1) | Gross Profit | Adjusted EBITDA(2) | ||||||
| Marketing & New Ventures | ||||||||||||
| Marketing | 195 | 152 | 61 | 216 | 93 | 127 | ||||||
New Ventures(3) | — | 5 | (6 | ) | — | — | (6 | ) | ||||
| Total | 195 | 157 | 55 | 216 | 93 | 121 | ||||||
(1) | Marketed NGL volumes. Volumes are stated in mboe/d. |
(2) | Refer to the "Non-GAAP Measures" section. |
(3) | All New Ventures projects have not yet commenced operations and therefore have no volumes. |
Projects & New Developments(1)
The following outlines the projects and new developments within Marketing & New Ventures:
During the quarter, Pembina announced the receipt of a certificate of approval from the U.S. Federal Energy Regulatory Commission ("FERC") for Pembina’s proposed Jordan Cove liquefied natural gas terminal and Pacific Connector Gas Pipeline (together known as "Jordan Cove"). Jordan Cove is the first ever U.S. West Coast natural gas export facility to be approved by FERC. This federal approval is a significant milestone for the project and for Pembina. The Company remains focused on completing the regulatory process, receiving the remaining permits required to proceed and enabling the commercial viability of the project.
The timing and ultimate approval of this project is uncertain and dependent upon receipt of these remaining approvals.
| Jordan Cove LNG Project (proposed) | ||
| The proposed Jordan Cove LNG project is a world-scale LNG export facility, which would transport North American natural gas to world markets. The project is made up of two parts: the LNG terminal, with a planned design capacity of 7.8 million tonnes per annum, and the Pacific Connector Gas pipeline which would transport natural gas from Malin,Oregon to an LNG terminal in Coos County, Oregon. | ||
| The carrying value of the project at March 31, 2020 is $377 million, including capitalized borrowing costs of $14 million. | ||
| In conjunction with a final investment decision, the Company intends to seek partners for both the Pacific Connector Gas Pipeline and LNG Terminal thereby reducing its 100 percent ownership interest to a net ownership interest of between 40 and 60 percent with the intention to reduce the capital, operating and other project risks. | ||
As previously announced, in response to the execution risks and unknown capital cost impacts associated with the COVID-19 pandemic, the resulting virtual shutdown of the global economy and the recent significant decline in global energy prices, Pembina made the decision to defer investment in its integrated PDH/PP project being developed through its joint venture entity CKPC.
| PDH/PP Facility | Status: Deferred | ||
| The PDH/PP Facility will be located adjacent to Pembina's Redwater fractionation complex and will convert approximately 23,000 bpd of locally supplied propane into polypropylene, a high value recyclable polymer used in a wide range of finished products including but not limited to automobiles, medical devices, food packaging and home electronic appliances, among others. | |||
| The carrying value of investment in CKPC at March 31, 2020 is $331 million. | |||
(1) | For further details on Pembina's significant assets, including definitions, refer to Pembina's AIF for the year ended December 31, 2019 filed at www.sedar.com (filed with the U.S. Securities and Exchange Commission at www.sec.gov under Form 40-F) and on Pembina's website at www.pembina.com. |
Pembina Pipeline Corporation First Quarter 2020 14
4. LIQUIDITY & CAPITAL RESOURCES
Available Sources of Liquidity
| ($ millions) | March 31, 2020 | December 31, 2019 | ||
Working capital(1)(4) | (601 | ) | (455 | ) |
Variable rate debt(2)(3) | ||||
| Bank debt | 1,544 | 2,100 | ||
| Total variable rate debt outstanding (weighted average interest rate of 2.4% (2019: 3.3%)) | 1,544 | 2,100 | ||
Fixed rate debt(2) | ||||
| Senior unsecured notes | 273 | 273 | ||
| Senior unsecured medium-term notes | 8,800 | 7,800 | ||
| Total fixed rate debt outstanding (weighted average interest rate of 4.0% (2019: 4.0%)) | 9,073 | 8,073 | ||
| Total debt outstanding | 10,617 | 10,173 | ||
| Cash and unutilized debt facilities | 1,607 | 1,040 | ||
(1) | As at March 31, 2020, working capital includes $323 million (December 31, 2019: $74 million) associated with the current portion of loans and borrowings. |
(2) | Face value. |
(3) | At March 31, 2020, includes U.S. $420 million (December 31, 2019: US$454 million). |
(4) | The December 31, 2019 balance has been recast. See Note 3 to the Interim Financial Statements. |
Pembina currently anticipates its cash flow from operating activities, the majority of which is derived from fee-based contracts, will be more than sufficient to meet its short-term and long-term operating obligations, capital investment requirements and to fund its dividends. Pembina expects to source funds required for capital projects and contributions to investments in equity accounted investees from cash, its credit facilities and by accessing the capital markets, as required. Based on its successful access to financing in the capital markets over the past several years, Pembina expects to continue to have access to additional funds as required. However, depending on the duration and severity of the COVID-19 pandemic, the resulting virtual shutdown of the global economy and the recent significant decline in global commodity prices, Pembina's ability to access financing in the capital markets could be impacted. Refer to "Risk Factors – Impact of COVID-19 Pandemic and Recent Decline in Global Energy Prices and Demand for Petroleum Products" below and "Risk Factors – Additional Financing and Capital Resources" in Pembina's MD&A and Note 24 to the Consolidated Financial Statements for the year ended December 31, 2019 for more information. Management continues to monitor the situation and remains satisfied that the leverage employed in Pembina's capital structure is sufficient and appropriate given the characteristics and operations of the underlying asset base.
Management may make adjustments to Pembina's capital structure as a result of changes in economic conditions or the risk characteristics of the underlying assets. To maintain or modify Pembina's capital structure in the future, Pembina may renegotiate new debt terms, repay existing debt, seek new borrowing, issue additional equity and/or repurchase shares.
As at March 31, 2020, Pembina's credit facilities consisted of: an unsecured $2.5 billion (December 31, 2019: $2.5 billion) revolving credit facility, which includes a $750 million (December 31, 2019: $750 million) accordion feature and matures in May 2024; an unsecured $500 million (December 31, 2019: $500 million) non-revolving term loan, which matures in August 2022; and an operating facility of $20 million (December 31, 2019: $20 million) which is due in May 2020 and is typically renewed on an annual basis. There are no repayments due over the term of these facilities. As at March 31, 2020, Pembina had $1.6 billion (December 31, 2019: $1.0 billion) of cash and unutilized debt facilities. At March 31, 2020, Pembina had loans and borrowings (excluding deferred financing costs) of $10.6 billion (December 31, 2019: $10.2 billion). Pembina is required to meet certain specific and customary affirmative and negative financial covenants under its senior unsecured notes, medium-term notes, revolving credit facility, non-revolving term loan and operating facility, including a requirement to maintain certain financial ratios. Pembina is also subject to customary restrictions on its operations and activities under its notes and credit facilities, including restrictions on the granting of security, incurring indebtedness and the sale of its assets.
15 Pembina Pipeline Corporation First Quarter 2020
On January 10, 2020, Pembina closed an offering of $1.0 billion of senior unsecured medium-term notes. The fixed rate medium-term notes were used to partially repay the variable rate bank debt outstanding at December 31, 2019. See the "Financing Activity" section below for further details of the medium-term notes issued.
On April 3, 2020, Pembina entered into an unsecured $800 million revolving credit facility with certain existing lenders, which provides additional liquidity and flexibility in Pembina’s capital structure in the current market conditions. As it was closed subsequent to the end of the first quarter, this facility is not reflected in the table on the preceding page. See the "Financing Activity" section for further details of the revolving credit facility.
On May 7, 2020, Pembina entered into an unsecured U.S. $250 million non-revolving term loan, which provides additional liquidity and flexibility in Pembina's capital structure in the current market conditions. As it was closed subsequent to the end of the first quarter, this term loan is not reflected in the table on the preceding page. See the "Financing Activity" section for further details of the term loan.
Covenants
Pembina's financial covenants include the following:
| Debt Instrument | Financial Covenant(1) | Ratio | Ratio at March 31, 2020 | |
| Senior unsecured medium-term notes | Funded Debt to Capitalization | Maximum 0.70 | 0.38 | |
| Revolving unsecured credit facility and non-revolving term loan | Debt to Capital | Maximum 0.65 | 0.38 | |
| EBITDA to Senior Interest Coverage | Minimum 2.5:1.0 | 8.5 | ||
(1) | Terms as defined in relevant agreements. |
In addition to the covenants discussed in the table above, Pembina has customary covenants on its other senior unsecured notes. Pembina was in compliance with all covenants under its note indentures and credit agreements as at March 31, 2020 (December 31, 2019: in compliance).
Pembina continues to actively monitor and reassess the creditworthiness of its counterparties. The recent decrease in global energy prices increases Pembina's counterparty risk as it has the potential to negatively impact Pembina's customers and related parties financial position and their access to credit, capital markets and other sources of liquidity. The majority of Pembina's credit exposure is to investment grade or split-investment grade entities. Pembina assesses all counterparties during the on-boarding process and actively monitors credit limits and exposure across the business. Financial assurances to mitigate and reduce risk may include guarantees, letters of credit and cash. Letters of credit totaling $116 million (December 31, 2019: $90 million) were held at March 31, 2020, primarily in respect of customer trade receivables.
Pembina Pipeline Corporation First Quarter 2020 16
Outstanding Share Data
Issued and outstanding (thousands) | May 1, 2020 | |
| Common shares | 549,784 | |
| Stock options | 19,791 | |
| Stock options exercisable | 9,403 | |
| Class A, Series 1 Preferred shares | 10,000 | |
| Class A, Series 3 Preferred shares | 6,000 | |
| Class A, Series 5 Preferred shares | 10,000 | |
| Class A, Series 7 Preferred shares | 10,000 | |
| Class A, Series 9 Preferred shares | 9,000 | |
| Class A, Series 11 Preferred shares | 6,800 | |
| Class A, Series 13 Preferred shares | 10,000 | |
| Class A, Series 15 Preferred shares | 8,000 | |
| Class A, Series 17 Preferred shares | 6,000 | |
| Class A, Series 19 Preferred shares | 8,000 | |
| Class A, Series 21 Preferred shares | 16,000 | |
| Class A, Series 23 Preferred shares | 12,000 | |
| Class A, Series 25 Preferred shares | 10,000 | |
Financing Activity
On January 10, 2020, Pembina closed an offering of $1.0 billion of senior unsecured medium-term notes. The offering was conducted in three tranches, consisting of $250 million issued through a re-opening of Pembina's senior unsecured medium-term notes, series 10, having a fixed coupon of 4.02 percent per annum, payable semi-annually and maturing on March 27, 2028; $500 million issued through a re-opening of Pembina's senior unsecured medium-term notes, series 11, having a fixed coupon of 4.75 percent per annum, payable semi-annually and maturing on March 26, 2048; and $250 million issued through a re-opening of Pembina's senior unsecured medium-term notes, series 12, having a fixed coupon of 3.62 percent per annum, payable semi-annually and maturing on April 3, 2029.
On April 3, 2020, Pembina entered into an unsecured $800 million revolving credit facility with certain existing lenders which provides additional liquidity and flexibility in Pembina’s capital structure in the current market conditions. The credit facility has an initial term of two years. The other terms and conditions of the credit facility, including financial covenants, are substantially similar to Pembina's unsecured $2.5 billion revolving credit facility.
On May 7, 2020, Pembina entered into an unsecured U.S. $250 million non-revolving term loan with a global bank, which provides additional liquidity and flexibility in Pembina's capital structure in the current market conditions. The term loan has an initial term of five years. The other terms and conditions of the credit facility, including financial covenants, are substantially similar to Pembina's unsecured $2.5 billion revolving credit facility.
Credit Ratings
The following information with respect to Pembina's credit ratings is provided as it relates to Pembina's financing costs and liquidity. Specifically, credit ratings affect Pembina's ability to obtain short-term and long-term financing and the cost of such financing. A reduction in the current ratings on Pembina's debt by its rating agencies, particularly a downgrade below investment-grade ratings, could adversely affect Pembina's cost of financing and its access to sources of liquidity and capital. In addition, changes in credit ratings and the associated costs may affect Pembina's ability to enter into normal course derivative or hedging transactions. Credit ratings are intended to provide investors with an independent measure of credit quality of any issues of securities. The credit ratings assigned by the rating agencies are not recommendations to purchase, hold or sell the securities, nor do the credit ratings comment on market price or suitability for a particular investor. Any credit rating may not remain in effect for a given period of time or may be revised or withdrawn entirely by a rating agency in the future if, in its judgment, circumstances so warrant.
17 Pembina Pipeline Corporation First Quarter 2020
Pembina targets strong 'BBB' credit ratings. DBRS Limited ("DBRS") rates Pembina's senior unsecured notes and senior unsecured medium-term notes 'BBB' and Class A Preferred Shares Pfd-3. The long-term corporate credit rating from Standard & Poor's Rating Services ("S&P"), a division of the McGraw-Hill Companies, on Pembina is 'BBB' and its rating of the Class A Preferred Shares is P-3 (High). DBRS and S&P recently affirmed Pembina's credit rating.
Contractual Obligations and Off-Balance Sheet Arrangements
Contractual Obligations
Pembina had the following contractual obligations outstanding at March 31, 2020:
Contractual Obligations(1) | Payments Due By Period | |||||||||
| ($ millions) | Total | Less than 1 year | 1 – 3 years | 3 – 5 years | After 5 years | |||||
Leases(2) | 1,146 | 133 | 238 | 181 | 594 | |||||
Loans and borrowings(3) | 15,750 | 764 | 2,202 | 3,304 | 9,480 | |||||
Construction commitments(4) | 1,504 | 489 | 448 | 91 | 476 | |||||
Other(5) | 616 | 106 | 145 | 88 | 277 | |||||
| Total contractual obligations | 19,016 | 1,492 | 3,033 | 3,664 | 10,827 | |||||
(1) | Pembina enters into product purchase agreements and power purchase agreements to secure supply for future operations. Purchase prices of both NGL and power are dependent on current market prices. Volumes and prices for NGL and power contracts cannot be reasonably determined and therefore an amount has not been included in the contractual obligations schedule. Product purchase agreements range from one to 10 years and involve the purchase of NGL products from producers. Assuming product is available, Pembina has secured between 20 and 175 mbpd of NGL each year up to and including 2028. Power purchase agreements range from one to 25 years and involve the purchase of power from electrical service providers. Pembina has secured up to 71 megawatts per day each year up to and including 2043. |
(2) | Includes terminals, rail, office space, land and vehicle leases. |
(3) | Excluding deferred financing costs. Including interest payments on senior unsecured notes. |
(4) | Excluding significant projects that are awaiting regulatory approval at March 31, 2020, projects which Pembina is not committed to construct, and projects that are executed by equity accounted investees. |
(5) | Includes $46 million in commitments related to leases that have not yet commenced. |
Pembina is, subject to certain conditions, contractually committed to the construction and operation of the Peace Pipeline Phase VI and Phase VII expansions, Duvernay III, as well as certain pipeline connections and laterals and other corporate infrastructure. See the "Forward-Looking Statements & Information" section.
Off-Balance Sheet Arrangements
Pembina does not believe it has any off-balance sheet arrangements that have, or are reasonably likely to have, a current or future effect on Pembina's financial condition, results of operations, liquidity or capital expenditures.
Letters of Credit
Pembina has provided letters of credit to various third parties in the normal course of conducting business. The letters of credit include financial guarantees to counterparties for product purchases and sales, transportation services, utilities, engineering and construction services. The letters of credit have not had and are not expected to have a material impact on Pembina's financial position, earnings, liquidity or capital resources. Pembina has $104 million (2019: $103 million) in letters of credit issued to facilitate commercial transactions with third parties and to support regulatory requirements.
Pembina Pipeline Corporation First Quarter 2020 18
5. CAPITAL INVESTMENTS
| 3 Months Ended March 31 | ||||
| ($ millions) | 2020 | 2019 | ||
| Pipelines | 328 | 192 | ||
| Facilities | 136 | 112 | ||
| Marketing & New Ventures | 15 | 55 | ||
| Corporate and other projects | 4 | 2 | ||
| Total capital invested | 483 | 361 | ||
Contributions to equity accounted investees(1) | 194 | 90 | ||
(1) | Contributions for the three months ended March 31, 2020, include $41 million (2019: $26 million) to Veresen Midstream, $1 million (2019: $1 million) to Aux Sable and $152 million (2019: $63 million) to CKPC. |
Capital Invested
In both 2020 and 2019, Pipelines capital investments were primarily related to Pembina's ongoing pipeline expansion projects. In 2020, Facilities capital investments were largely related to construction on Duvernay III, Empress Expansion and the Prince Rupert Terminal. In 2019, Facilities capital investments were largely related to construction of Duvernay II, Empress Infrastructure and the Prince Rupert Terminal. Capital investments in Marketing & New Ventures in both 2020 and 2019 were primarily related to the Jordan Cove LNG project.
Contributions to Equity Accounted Investees
Contributions made to CKPC during 2020 and 2019 were to progress the development of the PDH/PP Facility, combined with a parental guarantee on CKPC's revolving facility provided by Pembina during the first quarter of 2020, discussed further in the "Related Party Transactions" section below. Contributions to CKPC increased in 2020 following the execution of a lump sum engineering, procurement and construction contract related to the construction of the PDH Facility, prior to Pembina's March 18, 2020 announcement that it had deferred capital spending on the PDH/PP Facility. As a result of Pembina's decision to defer investment in CKPC, Pembina has deferred future contributions to CKPC.
Contributions made to Veresen Midstream during both 2020 and 2019 were largely related to construction of the Hythe Developments.
6. DIVIDENDS
Common Share Dividends
Common share dividends are payable if, as, and when declared by Pembina's Board of Directors. The amount and frequency of dividends declared and payable is at the discretion of Pembina's Board of Directors, which considers earnings, cash flow, capital requirements, the financial condition of Pembina and other relevant factors when making its dividend determination.
Preferred Share Dividends
The holders of Pembina's Class A preferred shares are entitled to receive fixed cumulative dividends. Dividends on the Series 1, 3, 5, 7, 9, 11, 13 and 21 Class A preferred shares are payable quarterly on the first day of March, June, September and December, if, as and when declared by the Board of Directors of Pembina. Dividends on the Series 15, 17 and 19 Class A preferred shares are payable on the last day of March, June, September and December in each year, if, as and when declared by the Board of Directorsof Pembina. Dividends on the Series 23 and 25 Class A preferred shares are payable on the 15th day of February, May, August and November in each year, if, as and when declared by the Board of Directors of Pembina.
19 Pembina Pipeline Corporation First Quarter 2020
7. SELECTED QUARTERLY INFORMATION
Selected Quarterly Operating Information
| (mboe/d) | 2020 | 2019 | 2018 | |||||||||||||
| Q1 | Q4 | Q3 | Q2 | Q1 | Q4 | Q3 | Q2 | |||||||||
Volumes(1)(2) | ||||||||||||||||
| Pipelines | ||||||||||||||||
| Conventional Pipelines | 902 | 958 | 908 | 895 | 880 | 897 | 946 | 900 | ||||||||
| Transmission Pipelines | 668 | 646 | 594 | 558 | 563 | 566 | 571 | 559 | ||||||||
| Oil Sands Pipelines | 1,059 | 1,063 | 1,068 | 1,065 | 1,064 | 1,066 | 1,076 | 1,077 | ||||||||
| Facilities | ||||||||||||||||
| Gas Services | 678 | 690 | 672 | 668 | 682 | 683 | 669 | 650 | ||||||||
| NGL Services | 201 | 220 | 194 | 198 | 214 | 241 | 203 | 199 | ||||||||
| Total | 3,508 | 3,577 | 3,436 | 3,384 | 3,403 | 3,453 | 3,465 | 3,385 | ||||||||
(1) | Revenue volumes. See the "Abbreviations" section for definition. |
(2) | Includes Pembina's proportionate share of results from equity accounted investees. |
Deferred Take-or-pay Revenue
| ($ millions) | 2020 | 2019 | 2018 | |||||||||||||
| Q1 | Q4 | Q3 | Q2 | Q1 | Q4 | Q3 | Q2 | |||||||||
| Pipelines | ||||||||||||||||
| Opening balance | 8 | 17 | 23 | 19 | 7 | — | 26 | 35 | ||||||||
| Revenue deferred | 40 | 31 | 27 | 27 | 36 | 34 | 33 | 35 | ||||||||
| Revenue recognized | (26 | ) | (40 | ) | (33 | ) | (23 | ) | (24 | ) | (27 | ) | (59 | ) | (44 | ) |
| Ending take-or-pay contract liability balance | 22 | 8 | 17 | 23 | 19 | 7 | — | 26 | ||||||||
| Facilities | ||||||||||||||||
| Opening balance | — | — | — | 1 | 2 | 3 | — | 3 | ||||||||
| Revenue deferred | 1 | — | — | 2 | — | — | 4 | 1 | ||||||||
| Revenue recognized | — | — | — | (3 | ) | (1 | ) | (1 | ) | (1 | ) | (4 | ) | |||
| Ending take-or-pay contract liability balance | 1 | — | — | — | 1 | 2 | 3 | — | ||||||||
Quarterly Segmented Adjusted EBITDA(1) ($ millions)
(1) Refer to the "Non-GAAP Measures" section.
Pembina Pipeline Corporation First Quarter 2020 20
Quarterly Financial Information
| ($ millions, except where noted) | 2020 | 2019 | 2018 | |||||||||||||
| Q1 | Q4 | Q3 | Q2 | Q1 | Q4 | Q3(2) | Q2 | |||||||||
| Revenue | 1,671 | 1,754 | 1,700 | 1,808 | 1,968 | 1,726 | 2,045 | 1,743 | ||||||||
Net revenue(1) | 865 | 837 | 751 | 758 | 774 | 706 | 742 | 669 | ||||||||
| Operating expenses | 179 | 177 | 151 | 134 | 140 | 165 | 136 | 100 | ||||||||
| Realized (gain) loss on commodity-related derivative financial instruments | (17 | ) | (8 | ) | (5 | ) | (1 | ) | (19 | ) | (5 | ) | 29 | 9 | ||
| Share of profit from equity accounted investees | 83 | 88 | 89 | 97 | 96 | 129 | 110 | 96 | ||||||||
| Gross profit | 728 | 603 | 613 | 629 | 588 | 663 | 585 | 511 | ||||||||
| Earnings | 314 | 145 | 370 | 664 | 313 | 368 | 334 | 246 | ||||||||
Earnings per common share – basic (dollars) | 0.50 | 0.21 | 0.66 | 1.23 | 0.55 | 0.66 | 0.60 | 0.43 | ||||||||
Earnings per common share – diluted (dollars) | 0.50 | 0.21 | 0.66 | 1.23 | 0.55 | 0.66 | 0.60 | 0.42 | ||||||||
| Cash flow from operating activities | 410 | 728 | 535 | 661 | 608 | 674 | 481 | 603 | ||||||||
Cash flow from operating activities per common share – basic (dollars)(1) | 0.75 | 1.41 | 1.05 | 1.29 | 1.20 | 1.33 | 0.95 | 1.20 | ||||||||
Adjusted cash flow from operating activities(1) | 576 | 576 | 530 | 550 | 578 | 543 | 523 | 558 | ||||||||
Adjusted cash flow from operating activities per common share – basic (dollars)(1) | 1.05 | 1.11 | 1.04 | 1.08 | 1.14 | 1.07 | 1.03 | 1.11 | ||||||||
Common shares outstanding (millions): | ||||||||||||||||
| Weighted average – basic | 549 | 518 | 512 | 511 | 509 | 507 | 506 | 504 | ||||||||
| Weighted average – diluted | 549 | 519 | 513 | 513 | 511 | 509 | 509 | 508 | ||||||||
| End of period | 550 | 548 | 512 | 511 | 510 | 508 | 506 | 504 | ||||||||
| Common share dividends declared | 346 | 314 | 307 | 302 | 290 | 289 | 288 | 282 | ||||||||
| Dividends per common share | 0.63 | 0.60 | 0.60 | 0.59 | 0.57 | 0.57 | 0.57 | 0.56 | ||||||||
| Preferred share dividends declared | 38 | 34 | 31 | 30 | 31 | 31 | 30 | 31 | ||||||||
| Capital expenditures | 483 | 429 | 421 | 434 | 361 | 356 | 291 | 255 | ||||||||
| Contributions to equity accounted investees | 194 | 120 | 25 | 28 | 90 | — | — | — | ||||||||
| Distributions from equity accounted investees | 123 | 123 | 142 | 140 | 170 | 158 | 170 | 168 | ||||||||
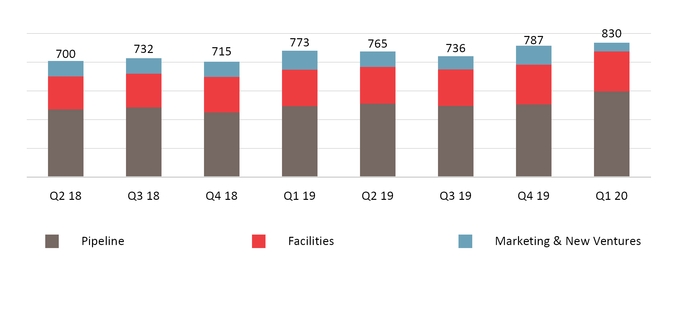
Adjusted EBITDA(1) | 830 | 787 | 736 | 765 | 773 | 715 | 732 | 700 | ||||||||
(1) | Refer to the "Non-GAAP Measures" section. |
(2) | Pembina corrected revenue and costs of goods sold in Marketing & New Ventures in 2018. The adjustments reduce revenue and cost of goods sold for the quarter ending June 30, 2018 ($202 million). There was no impact to earnings as a result of the adjustments. |
During the periods in the table above, Pembina's results were impacted by the following factors and trends:
| • | The Kinder Acquisition on December 16, 2019; |
| • | The COVID-19 pandemic combined with the significant decline in global energy prices resulting in a reduction in capital spending budgets by Pembina's customers; |
| • | The narrowing of the AECO-Chicago natural gas price differential; |
| • | Increased production in key operating areas and resource plays within the WCSB (Deep Basin, Montney and Duvernay), which increased revenue and sales volumes on Pembina's existing assets in Pipelines and Facilities; |
| • | New large-scale growth projects across Pembina's business being placed into service; |
| • | Volatility in commodity market prices impacting margins within the marketing business, partially mitigated through Pembina's risk management program; |
| • | Impairment of Pembina's convertible preferred interest in Ruby in the fourth quarter of 2019; |
| • | Lower Alberta tax rates following the enactment of Bill 3 in June 2019; |
| • | Higher net finance costs impacting earnings associated with debt related to financing acquisitions, growth projects and volatility in foreign exchange rates; |
| • | Increased common and preferred shares outstanding and corresponding dividends due to the Kinder Acquisition; and |
| • | The adoption of IFRS 16 on January 1, 2019. |
21 Pembina Pipeline Corporation First Quarter 2020
8. SELECTED EQUITY ACCOUNTED INVESTEE INFORMATION
Loans and Borrowings of Equity Accounted Investees
Under equity accounting, the assets and liabilities of an investment are net into a single line item in the consolidated statement of financial position "Investments in Equity Accounted Investees". To assist readers' understanding and to evaluate the capitalization of Pembina's investments, loans and borrowings associated with investments in equity accounted investees are presented below based on Pembina's proportionate ownership at March 31, 2020. In addition, certain of the equity accounted investees have borrowing arrangements with an amortization structure, thereby necessitating periodic repayments of principal. These repayments occur prior to distribution of residual cash flow to Pembina. The loans and borrowings and amortization schedules are presented below and classified by the division in which the results for the investment are reported. Please refer to the "Abbreviations" section for a summary of Pembina's investments in equity accounted investees and the division in which their results are reported.
($ millions)(1) | March 31, 2020 | December 31, 2019 | ||
| Pipelines | 1,109 | 1,057 | ||
| Facilities | 1,150 | 1,150 | ||
| Marketing & New Ventures | 18 | — | ||
| Total | 2,277 | 2,207 | ||
Amortization Schedule of Loans and Borrowings of Equity Accounted Investees
| 3 Months Ended | Remainder of | |||||||||||
($ millions)(1) | March 31, 2020 | 2020 | 2021 | 2022 | 2023 | 2024+ | ||||||
| Pipelines | 12 | 174 | 100 | 606 | 64 | 165 | ||||||
| Facilities | — | — | 12 | 36 | 36 | 1,066 | ||||||
| Marketing & New Ventures | — | — | — | — | — | 18 | ||||||
| Total | 12 | 174 | 112 | 642 | 100 | 1,249 | ||||||
(1) | Balances reflect Pembina's ownership percentage of the outstanding balance face value. |
Financing Activities for Equity Accounted Investees
Prior to Pembina's deferral, on February 27, 2020, CKPC closed a syndicated senior secured US$1.7 billion amortizing term facility and a US$150 million revolving facility both of which have been guaranteed equally by the owners of CKPC through the completion of construction on a several basis. The final maturity date of the term facility and revolving facility is February 27, 2027. The parental guarantee results in the recognition of a financial guarantee liability of U.S. $17 million on Pembina's balance sheet, with an offsetting amount recorded as an equity contribution to the investment in CKPC.
On April 27, 2020, Ruby fully repaid its 364-day term loan. Concurrent to repayment, Ruby issued a new 364-day term loan. The term loan will amortize at U.S. $16 million per quarter (U.S. $8 million per quarter net to Pembina), beginning June 2020, until a final payment of U.S. $16 million (U.S. $8 million net to Pembina) is payable March 31, 2021.
Commitments to Equity Accounted Investees
Pembina is contractually committed to provide CKPC with funding to construct assets that will form part of CKPC's PDH/PP Facility, subject to certain conditions being met. Following Pembina's decision to defer investment in CKPC, Pembina has deferred future contributions to CKPC.
Pembina has a contractual commitment to advance U.S. $31 million to Ruby by March 31, 2021.
Pembina has commitments to provide contributions to certain equity accounted investees based on annual budgets approved by the joint venture partners.
Pembina Pipeline Corporation First Quarter 2020 22
Credit Risk for Equity Accounted Investees
At March 31, 2020, letters of credit totaling $88 million (December 31, 2019: $84 million) were held by Pembina's various equity accounted investees, primarily in respect of customer trade receivables.
9. OTHER
Impairment Assessment
In response to the COVID-19 pandemic, the significant decline in global energy prices, and the resulting volatility in Pembina's stock price, Pembina performed a detailed assessment to determine if any indicators of impairment existed at March 31, 2020. The assessment resulted in no identified indicator of impairment requiring an assessment of recoverable amounts of any of Pembina's cash generating units. Pembina will continue to evaluate the situation related to the COVID-19 pandemic and global energy prices and update the impairment assessment as required.
Related Party Transactions
Pembina enters into transactions with related parties in the normal course of business and on terms equivalent to those that prevail in arm's length transactions. Pembina contracts capacity from Alliance its equity accounted investee and advances funds to support operations and provides services to investments in equity accounted investees.
During the first quarter of 2020, Pembina provided a parental guarantee to CKPC on its project financing arrangement, valued at U.S. $17 million. The parental guarantee is treated as a financial guarantee for accounting purposes, which results in liability recognition on Pembina's balance sheet, with an offsetting amount recorded as an equity contribution to the investment in CKPC. Pembina also advanced U.S. $8 million to Ruby Pipeline L.L.C. to fund the repayment of its outstanding bank facility in the first quarter of 2020.
Pembina had no other transactions with "related parties" (as defined in IAS 24 Related Party Disclosures) during the first quarter of 2020 except those pertaining to contributions to Pembina's defined benefit pension plan and remuneration of key management personnel and the Board of Directors of Pembina, in the ordinary course of their employment or directorship agreements.
U.S. Tax Regulations
The Internal Revenue Service published certain final regulations relating to U.S. Tax Reform on April 9, 2020. Pembina is assessing the impact of the final regulations but does not expect there to be a material impact on the company.
Disclosure Controls and Procedures ("DC&P") and Internal Control over Financial Reporting ("ICFR")
Management's Report on Internal Control Over Financial Reporting
Pembina's management is responsible for establishing and maintaining disclosure controls and procedures and internal control over financial reporting, as those terms are defined in National Instrument 52-109 Certification of Disclosure in Issuers' Annual and Interim Filings. The objective of this instrument is to improve the quality, reliability and transparency of information that is filed or submitted under securities legislation.
The President and Chief Executive Officer and the Senior Vice President and Chief Financial Officer have designed, with the assistance of management, DC&P and ICFR to provide reasonable assurance that material information relating to Pembina's business is made known to them, is reported on a timely basis, that financial reporting is reliable, and that financial statements prepared for external purposes are in accordance with IFRS.
Changes in Internal Control Over Financial Reporting
There were no changes in the first quarter of 2020 that had or are likely to have a material impact on our ICFR.
23 Pembina Pipeline Corporation First Quarter 2020
10. ACCOUNTING POLICIES & ESTIMATES
Changes in Accounting Policies
The accounting policies used in preparing the Interim Financial Statements are described in Pembina's Consolidated Financial Statements for the year ending December 31, 2019. There were no new accounting standards adopted in the first quarter of 2020 that are expected to have a material impact on Pembina's financial statements.
Critical Accounting Judgments & Estimates
Critical accounting judgments and estimates used in preparing the Interim Financial Statements are described in Pembina's Consolidated Financial Statements and MD&A for the year ending December 31, 2019. The preparation of consolidated financial statements in conformity with IFRS requires management to make both judgments and estimates that could materially affect the amounts recognized in the financial statements. By their nature, judgments and estimates may change in light of new facts and circumstances in the internal and external environment. There have been no material changes to Pembina's critical accounting estimates and judgments during the three months ended March 31, 2020, except for the general impact of significant uncertainties created by the COVID-19 pandemic, as discussed below.
Impact of the COVID-19 Pandemic and Recent Decline in Global Energy Prices
Following the World Health Organization declaring the COVID-19 outbreak to be a pandemic, many governments have taken steps to contain the spread of the virus, resulting in a virtual shutdown of the global economy, which have led to a significant disruption of business operations and a significant increase in economic uncertainty. This uncertainty has created volatility in asset prices, currency exchange rates and a marked decline in long-term interest rates. In addition, the resulting decrease in demand for crude oil, combined with the actions of certain OPEC and allied countries in March 2020 to temporarily increase the supply of crude oil has resulted in a significant decline global energy prices. Management applied judgment and will continue to assess the situation in determining the impact of the significant uncertainties created by these events and conditions on the carrying amounts of assets and liabilities in the Interim Financial Statements.
Pembina Pipeline Corporation First Quarter 2020 24
11. RISK FACTORS
Management has identified the primary risk factors that could potentially have a material impact on the financial results and operations of Pembina. With the exception of the risks noted below, there have been no material changes to the risk factors presented in Pembina's MD&A and AIF for the year ended December 31, 2019. Pembina's MD&A and AIF are available at www.sedar.com, www.sec.gov and through Pembina's website at www.pembina.com.
Impact of the COVID-19 Pandemic and Recent Decline in Global Energy Prices
COVID-19 Related Impacts
Pembina's business and operations could be materially adversely affected by the recent global outbreak of COVID-19. The ongoing COVID-19 crisis, and actions taken and that may be taken by governmental authorities in response has resulted in volatility in financial and commodity markets; an overall slowdown in the global economy; disruptions to global supply chains; labour shortages; reductions in trade volumes; temporary operational restrictions and restrictions on gatherings of individuals, as well as shelter in place declarations and quarantine orders; business closures and travel bans; political and economic instability; and civil unrest.
The risks to Pembina of the ongoing COVID-19 pandemic include risks to the health and safety of Pembina's employees; a slowdown or temporary suspension of operations in certain geographic locations in which Pembina operates; delays in the completion, or deferral, of Pembina's growth and expansion projects; and supply chain disruptions, all or any of which could materially adversely impact Pembina's business operations and financial results. Pembina has already deferred certain growth projects as outlined elsewhere in this MD&A as a result of the COVID-19 pandemic and decreased global commodity prices (as discussed in further detail below). The full extent and impact of the COVID-19 pandemic is unknown at this time and the degree to which it may impact Pembina's business operations and financial results will depend on future developments, which are highly uncertain and cannot be predicted with any degree of confidence, including: the duration, severity and geographic spread of the COVID-19 virus; further actions that may be taken by governmental authorities, including in respect of travel restrictions and business disruptions; the effectiveness of actions taken to contain the virus and treat the disease; and how quickly and to what extent normal economic and operating conditions can resume.
Impact of Recent Decline in Global Energy Prices and Demand for Petroleum Products
Recent market events and conditions, including global excess crude oil supply as a result of actions taken by OPEC and allied non-OPEC oil and gas exporting countries in March 2020 to temporarily increase production levels, combined with the sharp decrease in global demand due to the COVID-19 pandemic, have caused significant weakness and extreme volatility in commodity prices. The corresponding reductions in industry capital and operating budgets, as well as the shutting in of certain producing assets by oil and gas producers due to decreased prices and the potential for storage constraints in certain geographic areas, including those in which Pembina operates. As a result, the price of crude oil and other petroleum products, including NGL, has deteriorated significantly and certain crude oil delivery contracts have recently traded at negative levels with storage levels increasing and nearing capacity in certain areas. Notwithstanding recent agreements among OPEC and non-OPEC countries to reduce production levels, commodity prices are expected to remain under pressure and be volatile over the near to medium term, which could negatively impact the demand for, and utilization of, Pembina's pipeline and facility assets, as well as increase the volatility of revenues of, and adversely effect, the results of Pembina's marketing business. A significant portion of the service agreements in the Pipelines and Facilities Divisions are under take-or-pay or cost-of-service style frameworks, partially mitigating throughput volume risk for Pembina.
25 Pembina Pipeline Corporation First Quarter 2020
Increased Counterparty and Credit Risk
The recent decrease in global commodity prices has increased Pembina's counterparty risk, as it negatively impacts Pembina's oil and gas producer customers' financial position and their access to credit, capital markets and other sources of liquidity. The majority of Pembina's credit exposure is to investment grade or split-investment grade entities, however Pembina has increased its monitoring of, and communication with, those counterparties experiencing greater financial challenges. In the event that the impacts of the COVID-19 pandemic and the decreased commodity price environment on Pembina's counterparties worsen or last for a significant duration, the risk that such counterparties default on their obligations to Pembina increases. Such defaults could have an adverse impact on Pembina's business, financial condition and results of operations.
Impact on General Risks
Depending on the duration and severity of the COVID-19 pandemic and the recent severe decline in commodity prices, such events may also have the effect of heightening many of the other risks described in Pembina's other disclosure documents, including Pembina's MD&A and AIF for the year ended December 31, 2019, such as risks relating to the successful completion of Pembina's growth and expansion projects, including the expected return on investment thereof; Pembina's ability to maintain its credit ratings; restricted access to capital and increased borrowing costs; Pembina's ability to pay dividends and service obligations under its debt securities and other debt obligations; and otherwise complying with the covenants contained in the agreements that govern Pembina's existing indebtedness.
12. NON-GAAP MEASURES
Throughout this MD&A, Pembina has used the following terms that are not defined by GAAP but are used by management to evaluate the performance of Pembina and its businesses. Since non-GAAP measures do not have a standardized meaning prescribed by IFRS and are therefore unlikely to be comparable to similar measures presented by other companies, applicable securities regulations suggest that non-GAAP measures be clearly defined, qualified and reconciled to the most directly comparable GAAP measure. These non-GAAP measures are calculated and disclosed on a consistent basis from period to period.
The intent of non-GAAP measures is to provide additional useful information with respect to Pembina's operational and financial performance to investors and analysts, though the measures do not have any standardized meaning under IFRS. The measures should not, therefore, be considered in isolation or used in substitute for measures of performance prepared in accordance with IFRS. Other issuers may calculate these non-GAAP measures differently.
Investors should be cautioned that net revenue, adjusted EBITDA, adjusted EBITDA per common share, adjusted cash flow from operating activities, cash flow from operating activities per common share, and adjusted cash flow from operating activities per common share should not be construed as alternatives to revenue, earnings, cash flow from operating activities, gross profit or other measures of financial results determined in accordance with GAAP as indicators of Pembina's performance.
Non-GAAP Proportionate Consolidation of Investments in Equity Accounted Investees Results
In accordance with IFRS, Pembina's jointly controlled investments are accounted for using equity accounting. Under equity accounting, the assets and liabilities of the investment are presented net in a single line item in the Consolidated Statement of Financial Position, "Investments in Equity Accounted Investees". Net earnings from investments in equity accounted investees are recognized in a single line item in the Consolidated Statement of Earnings and Comprehensive Income "Share of Profit from Equity Accounted Investees". Cash contributions and distributions from investments in equity accounted investees represent Pembina’s share paid and received in the period to and from the investments in equity accounted investees.
Pembina Pipeline Corporation First Quarter 2020 26
To assist in understanding and evaluating the performance of these investments, Pembina is supplementing the IFRS disclosure with non-GAAP proportionate consolidation of Pembina's interest in the investments in equity accounted investees. Pembina's proportionate interest in equity accounted investees has been included in adjusted EBITDA.
Net Revenue
Net revenue is a non-GAAP financial measure which is defined as total revenue less cost of goods sold including product purchases. Management believes that net revenue provides investors with a single measure to indicate the margin on sales before non-product operating expenses that is comparable between periods. Management utilizes net revenue to compare consecutive results, in Marketing & New Ventures and Facilities, to aggregate revenue generated by each of the Company's divisions and to set comparable objectives.
| 3 Months Ended March 31 | Pipelines | Facilities | Marketing & New Ventures | Corporate & Inter-division Eliminations | Total | |||||||||||||||
| ($ millions) | ||||||||||||||||||||
| 2020 | 2019 | 2020 | 2019 | 2020 | 2019 | 2020 | 2019 | 2020 | 2019 | |||||||||||
| Revenue | 563 | 416 | 304 | 271 | 923 | 1,396 | (119 | ) | (115 | ) | 1,671 | 1,968 | ||||||||
Cost of goods sold, including product purchases | — | — | 2 | 1 | 883 | 1,265 | (79 | ) | (72 | ) | 806 | 1,194 | ||||||||
| Net revenue | 563 | 416 | 302 | 270 | 40 | 131 | (40 | ) | (43 | ) | 865 | 774 | ||||||||
27 Pembina Pipeline Corporation First Quarter 2020
Adjusted Earnings Before Interest, Taxes, Depreciation and Amortization ("adjusted EBITDA")
Adjusted EBITDA is a non-GAAP measure and is calculated as earnings for the year before net finance costs, income taxes, depreciation and amortization (included in operations and general and administrative expense) and unrealized gains or losses on commodity-related derivative financial instruments. The exclusion of unrealized gains or losses on commodity-related derivative financial instruments eliminates the non-cash impact of such gains or losses.
Adjusted EBITDA also includes adjustments to earnings for losses (gains) on disposal of assets, transaction costs incurred in respect of acquisitions, impairment charges or reversals in respect of goodwill, intangible assets, investments in equity accounted investees and property, plant and equipment, certain non-cash provisions and other amounts not reflective of ongoing operations. The adjustments made to earnings are also made to share of profit from investments in equity accounted investees. In addition, Pembina's proportionate share of results from investments in equity accounted investees with a preferred interest is presented in adjusted EBITDA as a 50 percent common interest. These additional adjustments are made to exclude various non-cash and other items that are not reflective of ongoing operations.
Management believes that adjusted EBITDA provides useful information to investors as it is an important indicator of an issuer's ability to generate liquidity through cash flow from operating activities and equity accounted investees. Management also believes that adjusted EBITDA provides an indicator of operating income generated from capital invested, which includes operational finance income from lessor lease arrangements. Adjusted EBITDA is also used by investors and analysts for assessing financial performance and for the purpose of valuing an issuer, including calculating financial and leverage ratios. Management utilizes adjusted EBITDA to set objectives and as a key performance indicator of the Company's success. Pembina presents adjusted EBITDA as management believes it is a measure frequently used by analysts, investors and other stakeholders in evaluating the Company's financial performance.
| 3 Months Ended March 31 | Pipelines | Facilities | Marketing & New Ventures | Corporate & Inter-division Eliminations | Total | |||||||||||||||
| ($ millions, except per share amounts) | ||||||||||||||||||||
| 2020 | 2019 | 2020 | 2019 | 2020 | 2019 | 2020 | 2019 | 2020 | 2019 | |||||||||||
| Earnings before income tax | 380 | 327 | 166 | 151 | 116 | 82 | (221 | ) | (128 | ) | 441 | 432 | ||||||||
| Adjustments to share of profit from equity accounted investees and other | 64 | 71 | 35 | 40 | (3 | ) | 13 | — | — | 96 | 124 | |||||||||
| Net finance costs | 7 | 2 | 7 | 2 | 21 | (3 | ) | 174 | 78 | 209 | 79 | |||||||||
| Depreciation and amortization | 99 | 57 | 53 | 39 | 13 | 17 | 12 | 12 | 177 | 125 | ||||||||||
| Unrealized (gain) loss on commodity-related derivative financial instruments | — | — | (5 | ) | — | (104 | ) | 45 | — | — | (109 | ) | 45 | |||||||
| Arbitration award payment | — | — | — | — | — | (33 | ) | — | — | — | (33 | ) | ||||||||
| (Gain) loss on disposal of assets | — | — | — | — | — | — | (1 | ) | 1 | (1 | ) | 1 | ||||||||
| Transaction costs incurred in respect of acquisitions | — | — | — | — | — | — | 5 | — | 5 | — | ||||||||||
| Impairment charges and non-cash provisions | — | — | — | — | 12 | — | — | — | 12 | — | ||||||||||
| Adjusted EBITDA | 550 | 457 | 256 | 232 | 55 | 121 | (31 | ) | (37 | ) | 830 | 773 | ||||||||
Adjusted EBITDA per common share – basic (dollars) | 1.51 | 1.52 | ||||||||||||||||||
Pembina Pipeline Corporation First Quarter 2020 28
Adjusted Cash Flow from Operating Activities, Cash Flow from Operating Activities per Common Share and Adjusted Cash Flow from Operating Activities per Common Share
Adjusted cash flow from operating activities is a non-GAAP measure which is defined as cash flow from operating activities adjusting for the change in non-cash operating working capital, adjusting for current tax and share-based payment expenses, and deducting preferred share dividends paid. Adjusted cash flow from operating activities deducts preferred share dividends paid because they are not attributable to common shareholders. The calculation has been modified to include current tax and share-based payment expense as it allows management to better assess the obligations discussed below. Management believes that adjusted cash flow from operating activities provides comparable information to investors for assessing financial performance during each reporting period. Management utilizes adjusted cash flow from operating activities to set objectives and as a key performance indicator of the Company's ability to meet interest obligations, dividend payments and other commitments. Per common share amounts are calculated by dividing cash flow from operating activities, or adjusted cash flow from operating activities, as applicable, by the weighted average number of common shares outstanding.
| 3 Months Ended March 31 | ||||
| ($ millions, except per share amounts) | 2020 | 2019 | ||
| Cash flow from operating activities | 410 | 608 | ||
Cash flow from operating activities per common share – basic (dollars) | 0.75 | 1.20 | ||
| Add (deduct): | ||||
| Change in non-cash operating working capital | 41 | (31 | ) | |
| Current tax expense | (76 | ) | (76 | ) |
| Taxes paid, net of foreign exchange | 182 | 72 | ||
| Accrued share-based payments | 13 | (21 | ) | |
| Share-based payments | 44 | 50 | ||
| Preferred share dividends paid | (38 | ) | (24 | ) |
| Adjusted cash flow from operating activities | 576 | 578 | ||
Adjusted cash flow from operating activities per common share – basic (dollars) | 1.05 | 1.14 | ||
29 Pembina Pipeline Corporation First Quarter 2020
13. ABBREVIATIONS
The following is a list of abbreviations that may be used in this MD&A:
| Other | |
| B.C. | British Columbia |
| GAAP | Canadian generally accepted accounting principles |
| IFRS | International Financial Reporting Standards |
| LNG | Liquified natural gas |
| LPG | Liquified petroleum gas |
| NGL | Natural gas liquids |
| U.S. | United States |
| WCSB | Western Canadian Sedimentary Basin |
| Deep cut | Ethane-plus capacity extraction gas processing capabilities |
| Shallow cut | Sweet gas processing with propane and/or condensate-plus extraction capabilities |
| Kinder Acquisition | Pembina's acquisition of Kinder Morgan Canada Limited and the U.S. portion of the Cochin Pipeline system on December 16, 2019 |
| Volumes | For Pipelines and Facilities volumes are revenue volumes, defined as physical volumes plus volumes recognized from take-or-pay commitments. For Marketing & New Ventures volumes are marketed NGL volumes. Volumes are stated in mboe/d, with natural gas volumes converted to mboe/d from MMcf/d at a 6:1 ratio. |
| Measurement | |
| mbbls | thousands of barrels |
| mbpd | thousands of barrels per day |
| mmbpd | millions of barrels per day |
| mmbbls | millions of barrels |
| mboe/d | thousands of barrels of oil equivalent per day |
| mmboe/d | millions of barrels of oil equivalent per day |
| MMcf/d | millions of cubic feet per day |
| bcf/d | billions of cubic feet per day |
| km | kilometer |
| Investments in Equity Accounted Investees | |
| Pipelines: | |
| Alliance | 50 percent interest in the Alliance Pipeline |
| Ruby | 50 percent convertible preferred interest in the Ruby Pipeline |
| Facilities: | |
| Veresen Midstream | 45 percent interest in Veresen Midstream Limited Partnership, which owns assets in western Canada serving the Montney geological play in northwestern Alberta and northeastern B.C. including gas processing plants and gas gathering pipelines and compression |
| Fort Corp | 50 percent interest in Fort Saskatchewan Ethylene Storage Limited Partnership and Fort Saskatchewan Ethylene Corporation |
| Marketing & New Ventures: | |
| Aux Sable | An ownership interest in Aux Sable (approximately 42.7 percent in Aux Sable U.S. and 50 percent in Aux Sable Canada), which includes an NGL fractionation facility and gas processing capacity near Chicago, Illinois and other natural gas and NGL processing facilities, logistics and distribution assets in the U.S. and Canada, as well as transportation contracts on Alliance |
| CKPC | 50 percent interest in the propane dehydrogenation ("PDH") plant and polypropylene ("PP") upgrading facility ("PDH/PP Facility") |
Readers are referred to the AIF dated February 27, 2020 on www.sedar.com for additional descriptions.
Pembina Pipeline Corporation First Quarter 2020 30
14. FORWARD-LOOKING STATEMENTS & INFORMATION
In the interest of providing Pembina's security holders and potential investors with information regarding Pembina, including management's assessment of the Company's future plans and operations, certain statements contained in this MD&A constitute forward-looking statements or forward-looking information (collectively, "forward-looking statements"). Forward-looking statements are typically identified by words such as "anticipate", "continue", "estimate", "expect", "may", "will", "project", "should", "could", "would", "believe", "plan", "intend", "design", "target", "undertake", "view", "indicate", "maintain", "explore", "entail", "schedule", "objective", "strategy", "likely", "potential", "outlook", "aim", "purpose", "goal" and similar expressions suggesting future events or future performance.
By their nature, such forward-looking statements involve known and unknown risks, uncertainties and other factors that may cause actual results or events to differ materially from those anticipated in such forward-looking statements. Pembina believes the expectations reflected in those forward-looking statements are reasonable but no assurance can be given that these expectations will prove to be correct and such forward-looking statements included in this MD&A should not be unduly relied upon. These forward-looking statements speak only as of the date of the MD&A.
In particular, this MD&A contains forward-looking statements pertaining to the following:
| • | the future levels and sustainability of cash dividends that Pembina intends to pay to its shareholders, the dividend payment date; |
| • | planning, construction, locations, capital expenditure estimates, schedules, regulatory and environmental applications and anticipated approvals, expected capacity, incremental volumes, in-service dates, rights, sources of product, activities, benefits and operations with respect to new construction of, or expansions on existing, pipelines, gas services facilities, fractionation facilities, terminalling, storage and hub facilities and other facilities or energy infrastructure, as well as the impact of Pembina's new projects on its future financial performance; |
| • | anticipated synergies between assets under development, assets being acquired and existing assets of Pembina; |
| • | pipeline, processing, fractionation and storage facility and system operations and throughput levels; |
| • | treatment under governmental regulatory regimes in Canada and the U.S., including taxes and tax regimes, environmental and greenhouse gas regulations and related abandonment and reclamation obligations, and Aboriginal, landowner and other stakeholder consultation requirements; |
| • | Pembina's strategy and the development and expected timing of new business initiatives and growth opportunities and the impact thereof; |
| • | increased throughput potential, processing capacity and fractionation capacity due to increased oil and gas industry activity and new connections and other initiatives on Pembina's pipelines and at Pembina's facilities; |
| • | expected future cash flows and the sufficiency thereof, financial strength, sources of and access to funds at attractive rates, future contractual obligations, future financing options, future renewal of credit facilities, availability of capital to fund growth plans, operating obligations and dividends and the use of proceeds from financings; |
| • | Pembina's expectations regarding involvement of partners on Jordan Cove; |
| • | current ratings targets on Pembina's debt and the likelihood of a downgrade below investment-grade ratings; |
| • | tolls and tariffs and processing, transportation, fractionation, storage and services commitments and contracts; |
| • | operating risks (including the amount of future liabilities related to pipelines spills and other environmental incidents) and related insurance coverage and inspection and integrity programs; |
| • | the expected demand for, and prices and inventory levels of, crude oil and other petroleum products, including NGL; |
| • | the impact of the current commodity price environment on Pembina; and |
| • | competitive conditions and Pembina's ability to position itself competitively in the industry. |
Various factors or assumptions are typically applied by Pembina in drawing conclusions or making the forecasts, projections, predictions or estimations set out in forward-looking statements based on information currently available to Pembina. These factors and assumptions include, but are not limited to:
| • | oil and gas industry exploration and development activity levels and the geographic region of such activity; |
| • | the success of Pembina's operations; |
| • | prevailing commodity prices, interest rates and exchange rates and the ability of Pembina to maintain current credit ratings; |
| • | the availability of capital to fund future capital requirements relating to existing assets and projects; |
| • | expectations regarding Pembina's pension plan; |
| • | future operating costs including geotechnical and integrity costs being consistent with historical costs; |
| • | oil and gas industry compensation levels remaining consistent; |
| • | in respect of current developments, expansions, planned capital expenditures, completion dates and capacity expectations: that third parties will provide any necessary support; that any third-party projects relating to growth projects will be sanctioned and completed as expected; that any required commercial agreements can be reached; that all required regulatory and environmental approvals can be |
obtained on the necessary terms in a timely manner; that counterparties will comply with contracts in a timely manner; that there are no unforeseen events preventing the performance of contracts or the completion of the relevant facilities, and that there are no unforeseen material costs relating to the facilities which are not recoverable from customers;
| • | in respect of the stability of Pembina's dividends: prevailing commodity prices, margins and exchange rates; that Pembina's future results of operations will be consistent with past performance and management expectations in relation thereto; the continued availability of capital at attractive prices to fund future capital requirements relating to existing assets and projects, including but not limited to future capital expenditures relating to expansion, upgrades and maintenance shutdowns; the success of growth projects; future operating costs; that counterparties to material agreements will continue to perform in a timely manner; that there are no unforeseen events preventing the performance of contracts; and that there are no unforeseen material construction or other costs related to current growth projects or current operations; |
| • | prevailing regulatory, tax and environmental laws and regulations and tax pool utilization; and |
| • | the amount of future liabilities relating to lawsuits and environmental incidents and the availability of coverage under Pembina's insurance policies (including in respect of Pembina's business interruption insurance policy). |
The actual results of Pembina could differ materially from those anticipated in these forward-looking statements as a result of the material risk factors set forth below:
| • | the failure to realize the anticipated benefits and synergies of the Kinder Acquisition following closing; |
| • | the regulatory environment and decisions and Aboriginal and landowner consultation requirements; |
| • | the impact of competitive entities and pricing; |
| • | labour and material shortages; |
| • | reliance on key relationships, joint venture partners, and agreements and the outcome of stakeholder engagement; |
| • | the strength and operations of the oil and natural gas production industry and related commodity prices; |
| • | non-performance or default by counterparties to agreements which Pembina or one or more of its subsidiaries has entered into in respect of its business; |
| • | actions by joint venture partners or other partners which hold interests in certain of Pembina's assets; |
| • | actions by governmental or regulatory authorities including changes in tax laws and treatment, changes in royalty rates, climate change initiatives or policies or increased environmental regulation; |
| • | fluctuations in operating results; |
| • | adverse general economic and market conditions in Canada, North America and elsewhere, including changes, or prolonged weakness, as applicable, in interest rates, foreign currency exchange rates, commodity prices, supply/demand trends and overall industry activity levels; |
| • | risks relating to the current and potential adverse impacts of the COVID-19 pandemic and continued depressed commodity prices; |
| • | constraints on, or the unavailability of adequate infrastructure; |
| • | changes in the political environment, in North America and elsewhere, and public opinion; |
| • | ability to access various sources of debt and equity capital; |
| • | changes in credit ratings; |
| • | technology and security risks; |
| • | natural catastrophe; and |
| • | the other factors discussed under "Risk Factors" herein and in Pembina's MD&A and AIF for the year ended December 31, 2019, which are available at www.sedar.com, www.sec.gov and through Pembina's website at www.pembina.com. |
These factors should not be construed as exhaustive. Unless required by law, Pembina does not undertake any obligation to publicly update or revise any forward-looking statements, whether as a result of new information, future events or otherwise. Any forward-looking statements contained herein are expressly qualified by this cautionary statement.
31 Pembina Pipeline Corporation First Quarter 2020
CONDENSED CONSOLIDATED INTERIM STATEMENTS OF FINANCIAL POSITION
(unaudited)
| ($ millions) | March 31, 2020 | December 31, 2019(1) | ||
Assets Current assets | ||||
| Cash and cash equivalents | 132 | 129 | ||
| Trade receivables and other | 533 | 707 | ||
| Inventory | 146 | 126 | ||
| Derivative financial instruments (Note 13) | 113 | 40 | ||
| 924 | 1,002 | |||
| Non-current assets | ||||
| Property, plant and equipment (Note 4) | 19,247 | 18,737 | ||
| Investments in equity accounted investees (Note 5) | 6,356 | 5,954 | ||
| Intangible assets and goodwill | 6,503 | 6,446 | ||
| Right-of-use assets (Note 6) | 716 | 730 | ||
| Finance lease receivable (Note 6) | 143 | 144 | ||
| Advances to related parties and other assets | 221 | 156 | ||
| 33,186 | 32,167 | |||
| Total assets | 34,110 | 33,169 | ||
Liabilities and equity Current liabilities | ||||
| Trade payables and other | 893 | 1,013 | ||
| Loans and borrowings (Note 7) | 323 | 74 | ||
| Dividends payable | 115 | 110 | ||
| Lease liabilities | 95 | 112 | ||
| Contract liabilities (Note 10) | 66 | 39 | ||
| Taxes payable | 1 | 103 | ||
| Derivative financial instruments (Note 13) | 32 | 6 | ||
| 1,525 | 1,457 | |||
| Non-current liabilities | ||||
| Loans and borrowings (Note 7) | 10,339 | 10,078 | ||
| Lease liabilities | 726 | 707 | ||
| Decommissioning provision (Note 8) | 865 | 864 | ||
| Contract liabilities (Note 10) | 244 | 192 | ||
| Deferred tax liabilities | 2,981 | 2,922 | ||
| Other liabilities | 166 | 179 | ||
| 15,321 | 14,942 | |||
| Total liabilities | 16,846 | 16,399 | ||
| Equity | ||||
| Attributable to shareholders | 17,204 | 16,710 | ||
| Attributable to non-controlling interest | 60 | 60 | ||
| Total equity | 17,264 | 16,770 | ||
| Total liabilities and equity | 34,110 | 33,169 | ||
(1) Pembina has recast certain comparative information to reflect changes to the Purchase Price Allocation originally presented December 31, 2019. See Note 3. | ||||
| See accompanying notes to the consolidated financial statements | ||||
Pembina Pipeline Corporation First Quarter 2020 32
CONDENSED CONSOLIDATED INTERIM STATEMENTS OF EARNINGS AND COMPREHENSIVE INCOME
(unaudited)
| 3 Months Ended March 31 | ||||
| ($ millions, except per share amounts) | 2020 | 2019 | ||
| Revenue (Note 10) | 1,671 | 1,968 | ||
| Cost of sales | 1,152 | 1,450 | ||
| (Gain) loss on commodity-related derivative financial instruments | (126 | ) | 26 | |
| Share of profit from equity accounted investees (Note 5) | 83 | 96 | ||
| Gross profit | 728 | 588 | ||
| General and administrative | 61 | 74 | ||
| Other expense | 17 | 3 | ||
| Results from operating activities | 650 | 511 | ||
| Net finance costs (Note 11) | 209 | 79 | ||
| Earnings before income tax | 441 | 432 | ||
| Current tax expense | 76 | 76 | ||
| Deferred tax expense | 51 | 43 | ||
| Income tax expense | 127 | 119 | ||
| Earnings attributable to shareholders | 314 | 313 | ||
| Other comprehensive (loss) income | ||||
| Exchange gain (loss) on translation of foreign operations | 465 | (85 | ) | |
| Remeasurements of defined benefit liability, net of tax | 14 | — | ||
| Total comprehensive income attributable to shareholders | 793 | 228 | ||
| Earnings attributable to common shareholders, net of preferred share dividends | 275 | 282 | ||
Earnings per common share – basic (dollars) | 0.50 | 0.55 | ||
Earnings per common share – diluted (dollars) | 0.50 | 0.55 | ||
Weighted average number of common shares (millions) | ||||
| Basic | 549 | 509 | ||
| Diluted | 549 | 511 | ||
| See accompanying notes to the consolidated financial statements | ||||
33 Pembina Pipeline Corporation First Quarter 2020
CONDENSED CONSOLIDATED INTERIM STATEMENTS OF CHANGES IN EQUITY
(unaudited)
| Attributable to Shareholders of the Company | ||||||||||||||
| ($ millions) | Common Share Capital | Preferred Share Capital | Deficit | Accumulated Other Comprehensive Income (Loss) | Total | Non-Controlling Interest | Total Equity | |||||||
| December 31, 2019 | 15,539 | 2,956 | (1,883 | ) | 98 | 16,710 | 60 | 16,770 | ||||||
| Total comprehensive income | ||||||||||||||
| Earnings | — | — | 314 | — | 314 | — | 314 | |||||||
| Other comprehensive income | ||||||||||||||
| Exchange loss on translation of foreign operations | — | — | — | 465 | 465 | 465 | ||||||||
| Remeasurements of defined benefit liability, net of tax | — | — | — | 14 | 14 | — | 14 | |||||||
| Total comprehensive income | — | — | 314 | 479 | 793 | — | 793 | |||||||
| Transactions with shareholders of the Company | ||||||||||||||
| Part VI.1 tax on preferred shares (Note 9) | — | (2 | ) | — | — | (2 | ) | — | (2 | ) | ||||
| Share-based payment transactions (Note 9) | 87 | — | — | — | 87 | — | 87 | |||||||
| Dividends declared – common (Note 9) | — | — | (346 | ) | — | (346 | ) | — | (346 | ) | ||||
| Dividends declared – preferred (Note 9) | — | — | (38 | ) | — | (38 | ) | — | (38 | ) | ||||
| Total transactions with shareholders of the Company | 87 | (2 | ) | (384 | ) | — | (299 | ) | — | (299 | ) | |||
| March 31, 2020 | 15,626 | 2,954 | (1,953 | ) | 577 | 17,204 | 60 | 17,264 | ||||||
| December 31, 2018 | 13,662 | 2,423 | (2,058 | ) | 317 | 14,344 | 60 | 14,404 | ||||||
| Impact of change in accounting policy | — | — | 22 | — | 22 | — | 22 | |||||||
| Opening Value January 1, 2019 | 13,662 | 2,423 | (2,036 | ) | 317 | 14,366 | 60 | 14,426 | ||||||
| Total comprehensive income | ||||||||||||||
| Earnings | — | — | 313 | — | 313 | — | 313 | |||||||
| Other comprehensive income | ||||||||||||||
| Exchange gain on translation of foreign operations | — | — | — | (85 | ) | (85 | ) | — | (85 | ) | ||||
| Total comprehensive income | — | — | 313 | (85 | ) | 228 | — | 228 | ||||||
| Transactions with shareholders of the Company | ||||||||||||||
| Part VI.1 tax on preferred shares | — | (1 | ) | — | — | (1 | ) | — | (1 | ) | ||||
| Share-based payment transactions | 89 | — | — | — | 89 | — | 89 | |||||||
| Dividends declared – common | — | — | (290 | ) | — | (290 | ) | — | (290 | ) | ||||
| Dividends declared – preferred | — | — | (31 | ) | — | (31 | ) | — | (31 | ) | ||||
| Total transactions with shareholders of the Company | 89 | (1 | ) | (321 | ) | — | (233 | ) | — | (233 | ) | |||
| March 31, 2019 | 13,751 | 2,422 | (2,044 | ) | 232 | 14,361 | 60 | 14,421 | ||||||
| See accompanying notes to the consolidated financial statements | ||||||||||||||
Pembina Pipeline Corporation First Quarter 2020 34
CONDENSED CONSOLIDATED INTERIM STATEMENTS OF CASH FLOWS
(unaudited)
| 3 Months Ended March 31 | ||||
| ($ millions) | 2020 | 2019 | ||
| Cash provided by (used in) | ||||
| Operating activities | ||||
| Earnings | 314 | 313 | ||
| Adjustments for: | ||||
| Share of profit from equity accounted investees | (83 | ) | (96 | ) |
| Distributions from equity accounted investees | 123 | 170 | ||
| Depreciation and amortization | 177 | 125 | ||
| Unrealized (gain) loss on commodity-related derivative financial instruments | (109 | ) | 45 | |
| Net finance costs (Note 11) | 209 | 79 | ||
| Net interest paid | (99 | ) | (81 | ) |
| Income tax expense | 127 | 119 | ||
| Taxes paid | (186 | ) | (71 | ) |
| Share-based compensation (recovery) expense | (5 | ) | 26 | |
| Share-based compensation payment | (44 | ) | (50 | ) |
| Net change in contract liabilities | 17 | 3 | ||
| Other | 10 | (5 | ) | |
| Change in non-cash operating working capital | (41 | ) | 31 | |
| Cash flow from operating activities | 410 | 608 | ||
| Financing activities | ||||
| Bank borrowings and issuance of debt (Note 7) | 510 | 94 | ||
| Repayment of loans and borrowings | (1,115 | ) | (53 | ) |
| Repayment of lease liability | (26 | ) | (18 | ) |
| Issuance of medium term notes (Note 7) | 1,073 | — | ||
| Issue costs and financing fees | (4 | ) | — | |
| Exercise of stock options | 82 | 86 | ||
| Dividends paid | (378 | ) | (314 | ) |
| Cash flow provided by (used in) financing activities | 142 | (205 | ) | |
| Investing activities | ||||
| Capital expenditures | (483 | ) | (361 | ) |
| Contributions to equity accounted investees | (172 | ) | (33 | ) |
| Receipt of finance lease payments | 14 | — | ||
| Interest paid during construction | (14 | ) | (8 | ) |
| Recovery of assets or proceeds from sale | 2 | — | ||
| Advances to related parties | (11 | ) | (10 | ) |
| Changes in non-cash investing working capital and other | 108 | 27 | ||
| Cash flow used in investing activities | (556 | ) | (385 | ) |
| Change in cash and cash equivalents | (4 | ) | 18 | |
| Effect of movement in exchange rates on cash held | 7 | (3 | ) | |
| Cash and cash equivalents, beginning of period | 129 | 157 | ||
| Cash and cash equivalents, end of period | 132 | 172 | ||
| See accompanying notes to the consolidated financial statements | ||||
35 Pembina Pipeline Corporation First Quarter 2020
NOTES TO THE CONDENSED CONSOLIDATED UNAUDITED INTERIM FINANCIAL STATEMENTS
1. REPORTING ENTITY
Pembina Pipeline Corporation ("Pembina" or the "Company") is a Calgary-based, leading transportation and midstream service provider serving North America's energy industry. The condensed consolidated unaudited interim financial statements ("Interim Financial Statements") include the accounts of the Company, its subsidiary companies, partnerships and any investments in associates and joint arrangements as at and for the three months ended March 31, 2020. These Interim Financial Statements and the notes thereto have been prepared in accordance with International Financial Reporting Standards ("IFRS") as issued by the International Accounting Standards Board ("IASB") applicable to the preparation of interim financial statements, including International Accounting Standard 34, Interim Financial Reporting ("IAS 34"). These Interim Financial Statements have been prepared following the same accounting policies and methods of computation as the annual consolidated financial statements of the Company as at and for the year ended December 31, 2019 ("Consolidated Financial Statements") and should be read in conjunction with those Consolidated Financial Statements. The Interim Financial Statements were authorized for issue by Pembina's Board of Directors on May 7, 2020.
Pembina owns an integrated system of pipelines that transport various hydrocarbon liquids and natural gas products produced primarily in western Canada. The Company also owns gas gathering and processing facilities and an oil and natural gas liquids infrastructure, storage and logistics business. Pembina's integrated assets and commercial operations along the majority of the hydrocarbon value chain allow it to offer a full spectrum of midstream and marketing services to the energy sector.
Use of Estimates and Judgments
Management is required to make estimates and assumptions and use judgment in the application of accounting policies that could have a significant impact on the financial results. Actual results may differ from estimates and those differences may be material. By their nature, judgments and estimates may change in light of new facts and circumstances in the internal and external environment. There have been no material changes to Pembina's critical accounting estimates and judgments during the three months ended March 31, 2020, except for the additional judgment applied by management in determining the impact on the Interim Financial Statements of significant uncertainties arising from the global outbreak of novel coronavirus ("COVID-19") described below.
Impact of the COVID-19 Pandemic and Recent Decline in Global Energy Prices
In March 2020, the World Health Organization declared the COVID-19 outbreak a pandemic. Many governments have taken steps to contain the spread of the virus, resulting in a virtual shutdown of the global economy, which has led to significant disruption of business operations and a significant increase in economic uncertainty, with more volatile asset prices and currency exchange rates, and a marked decline in long-term interest rates. In addition, the resulting decrease in demand for crude oil, combined with the actions of certain Organization of Petroleum Exporting Countries and allied countries in March 2020 to temporarily increase the supply of crude oil has resulted in a significant decline global energy prices. Management applied judgment in determining the impact of the significant uncertainties created by these events and conditions on the carrying amounts of assets and liabilities in the Interim Financial Statements.
2. DETERMINATION OF FAIR VALUES
A number of the Company's accounting policies and disclosures require the determination of fair value for both financial and non-financial assets and liabilities. Fair values have been determined for measurement and/or disclosure based on methods as set out in the Consolidated Financial Statements. These methods have been applied consistently to all periods presented in these Interim Financial Statements.
Pembina Pipeline Corporation First Quarter 2020 36
Impact of the COVID-19 Pandemic
Measuring fair values using significant unobservable inputs has become more challenging in the current environment, where events and conditions related to the COVID-19 pandemic are driving significant disruption of business operations and a significant increase in economic uncertainty. Management applied its judgment in determining the impact of the significant uncertainties created by these events and conditions on the assessed fair values of assets and liabilities in these Interim Financial Statements.
3. ACQUISITION
On December 16, 2019, Pembina acquired all the issued and outstanding shares of Kinder Morgan Canada Limited ("Kinder Morgan Canada") by way of a plan of arrangement and the U.S. portion of the Cochin Pipeline system (collectively the "Kinder Acquisition") for total consideration of $4.3 billion.
The purchase price equation, subject to finalization, is based on assessed fair values and is as follows:
| As at December 16, 2019 | ||||||
| ($ millions) | Previously Reported | Adjustments | Recast | |||
| Purchase Price Consideration | ||||||
| Common shares | 1,710 | — | 1,710 | |||
| Cash (net of cash acquired) | 2,009 | — | 2,009 | |||
| Preferred shares | 536 | — | 536 | |||
| 4,255 | — | 4,255 | ||||
| Current assets | 68 | 15 | 83 | |||
| Property, plant and equipment | 2,660 | (38 | ) | 2,622 | ||
| Intangible assets | 1,254 | — | 1,254 | |||
| Right-of-use assets | 348 | (92 | ) | 256 | ||
| Finance lease receivable | — | 115 | 115 | |||
| Goodwill | 809 | 16 | 825 | |||
| Other assets | 9 | — | 9 | |||
| Current liabilities | (124 | ) | — | (124 | ) | |
| Deferred tax liabilities | (281 | ) | (16 | ) | (297 | ) |
| Decommissioning provision | (74 | ) | — | (74 | ) | |
| Lease liability | (348 | ) | — | (348 | ) | |
| Other liabilities | (66 | ) | — | (66 | ) | |
| 4,255 | — | 4,255 | ||||
For more information, see Note 6 of the Consolidated Financial Statements for the year ended December 31, 2019. During the three months ended March 31, 2020, Pembina adjusted the purchase price equation to reflect updated assumptions for the identification and classification of leases, which resulted in the recognition of finance lease receivables of $130 million, and reductions in the property, plant and equipment of $38 million and in the right-of-use assets of $92 million. Pembina also adjusted the allocation of fair value between Canadian and U.S. legal entities, resulting in a $16 million increase in the deferred tax liability and a corresponding increase in goodwill of $16 million. The purchase price allocation is not final as Pembina is continuing to obtain and verify information required to determine the fair value of certain assets and liabilities including the identification and classification of leases and the amount of deferred income taxes arising on their recognition.
37 Pembina Pipeline Corporation First Quarter 2020
4. PROPERTY, PLANT AND EQUIPMENT
| ($ millions) | Land and Land Rights | Pipelines | Facilities and Equipment | Cavern Storage and Other | Assets Under Construction | Total | ||||||
| Cost | ||||||||||||
Balance at December 31, 2019(1) | 455 | 8,767 | 8,763 | 1,936 | 1,493 | 21,414 | ||||||
| Additions and transfers | — | 229 | 143 | 14 | 139 | 525 | ||||||
| Change in decommissioning provision | — | (1 | ) | (5 | ) | — | — | (6 | ) | |||
| Foreign exchange adjustments | 8 | 77 | 29 | — | 25 | 139 | ||||||
| Disposals and other | — | (2 | ) | (6 | ) | (7 | ) | (13 | ) | (28 | ) | |
| Balance at March 31, 2020 | 463 | 9,070 | 8,924 | 1,943 | 1,644 | 22,044 | ||||||
| Depreciation | ||||||||||||
| Balance at December 31, 2019 | 16 | 1,363 | 1,015 | 283 | — | 2,677 | ||||||
| Depreciation | 1 | 52 | 47 | 22 | — | 122 | ||||||
| Disposals and other | — | — | (2 | ) | — | — | (2 | ) | ||||
| Balance at March 31, 2020 | 17 | 1,415 | 1,060 | 305 | — | 2,797 | ||||||
| Carrying amounts | ||||||||||||
| Balance at December 31, 2019 | 439 | 7,404 | 7,748 | 1,653 | 1,493 | 18,737 | ||||||
| Balance at March 31, 2020 | 446 | 7,655 | 7,864 | 1,638 | 1,644 | 19,247 | ||||||
| Assets subject to operating leases | ||||||||||||
| December 31, 2019 | — | 477 | 259 | 62 | — | 798 | ||||||
| March 31, 2020 | — | 475 | 264 | 63 | — | 802 | ||||||
(1) | The December 31, 2019 balance has been recast. See Note 3. |
5. INVESTMENTS IN EQUITY ACCOUNTED INVESTEES
| Ownership Interest | Share of Profit from Equity Investments | Equity Investments | ||||||||||
| 3 Months Ended March 31 | ||||||||||||
| ($ millions) | March 31, 2020 | December 31, 2019 | 2020 | 2019 | March 31, 2020 | December 31, 2019 | ||||||
| Alliance | 50 | % | 50 | % | 28 | 50 | 2,704 | 2,620 | ||||
| Aux Sable | 42.7% - 50% | 42.7% - 50% | 4 | 4 | 450 | 426 | ||||||
Ruby(1) | - | - | 31 | 29 | 1,377 | 1,273 | ||||||
| Veresen Midstream | 45 | % | 45 | % | 13 | 12 | 1,379 | 1,348 | ||||
| CKPC | 50 | % | 50 | % | 5 | 1 | 331 | 171 | ||||
| Other | 50% - 75% | 50% - 75% | 2 | — | 115 | 116 | ||||||
| 83 | 96 | 6,356 | 5,954 | |||||||||
(1) | Pembina owns a 50 percent convertible preferred interest in Ruby. |
Pembina has U.S. $2.3 billion in Investments in Equity Accounted Investees that is held by entities whose functional currency is the U.S. dollar. The resulting foreign exchange gain for the three months ended March 31, 2020 of $248 million (2019: $77 million loss) has been included in Other Comprehensive Income.
Financing Activities
Prior to Pembina's deferral, on February 27, 2020, CKPC closed a syndicated senior secured U.S. $1.7 billion amortizing term facility and a U.S. $150 million revolving facility both of which have been guaranteed equally by the owners of CKPC through the completion of construction on a several basis. The final maturity date of the term facility and revolving facility is February 27, 2027. The parental guarantee results in the recognition of a financial guarantee liability of U.S. $17 million on Pembina's balance sheet, with an offsetting amount recorded as an equity contribution to the investment in CKPC.
Pembina Pipeline Corporation First Quarter 2020 38
On April 27, 2020, Ruby fully repaid its 364-day term loan. Concurrent to repayment, Ruby issued a new 364-day term loan. The term loan will amortize at U.S. $16 million per quarter (U.S. $8 million per quarter net to Pembina), beginning June 2020, until a final payment of U.S. $16 million (U.S. $8 million net to Pembina) is payable March 31, 2021.
6. LEASES
Lessee Leases
Pembina enters into arrangements to secure access to assets necessary for operating the business. Leased (right-of-use) assets include terminals, rail, buildings, land and other assets. Total cash outflows related to leases were $31 million for the three months ended March 31, 2020.
Right-of-Use Assets
| ($ millions) | Terminals | Rail | Buildings | Land & Other | Total | |||||
Balance at December 31, 2019(1) | 225 | 238 | 118 | 149 | 730 | |||||
| Additions | — | — | 8 | — | 8 | |||||
| Amortization | (3 | ) | (10 | ) | (5 | ) | (4 | ) | (22 | ) |
| Balance at March 31, 2020 | 222 | 228 | 121 | 145 | 716 | |||||
(1) | The December 31, 2019 balance of Terminals Right-of-Use Assets has been recast. See Note 3 Acquisition and further discussion below. |
Lessor Leases
Pembina has entered into contracts for the use of its assets that have resulted in lease treatment for accounting purposes. Assets under operating leases include pipelines, terminals and storage tanks and caverns. See Note 4 for carrying value of property, plant and equipment under operating leases. Assets under finance leases include office sub-leases and terminal assets.
As disclosed in Note 3, Pembina is continuing to obtain and verify information required to determine the identification and classification of lessor leases acquired on December 16, 2019 as part of the Kinder Acquisition. Finance lease conclusions completed during the quarter resulted in the recognition of an additional $130 million in finance lease receivables, of which $92 million related to lessee leases recognized at the acquisition date, resulting in the December 31, 2019 right-of-use asset balance being recast, for leased terminal assets, from $822 million to $730 million. Lessor lease identification could continue to materially impact the classification of acquired assets in the final purchase price allocation, the classification and carrying value of acquired assets at the reporting date, disclosures related to future lessor operating lease payments, and disclosures related to the carrying value of property, plant and equipment and right-of-use assets under operating leases.
Maturity of Lease Receivables
| As at March 31, 2020 | Operating Leases(1) | Finance Leases | ||
| ($ millions) | ||||
| Less than one year | 145 | 24 | ||
| One to two years | 130 | 20 | ||
| Two to three years | 129 | 18 | ||
| Three to four years | 122 | 18 | ||
| Four to five years | 103 | 18 | ||
| More than five years | 988 | 191 | ||
| Total undiscounted lease receipts | 1,617 | 289 | ||
| Unearned finance income | (136 | ) | ||
| Finance lease receivable | 153 | |||
Less current portion(2) | (10 | ) | ||
| Total non-current | 143 | |||
(1) | Includes undiscounted lessor operating lease payments of $144 million related to contracts for which lease identification and classification has not been finalized. |
(2) | Included in trade receivables and other on the Condensed Consolidated Interim Statement of Financial Position. |
39 Pembina Pipeline Corporation First Quarter 2020
Expected credit losses on lease receivables are determined using a probability-weighted estimate of credit losses, measured as the present value of all expected cash shortfalls, discounted at the interest rates implicit in the leases, using reasonable and supportable information about past events, current conditions and forecasts of future economic conditions. Pembina considers the risk of default relating to lease receivables low based on Pembina's assessment of individual counterparty credit risk through established credit management techniques as disclosed in the Consolidated Financial Statements.
7. LOANS AND BORROWINGS
This note provides information about the contractual terms of Pembina's interest-bearing loans and borrowings, which are measured at amortized cost.
Carrying Value, Terms and Conditions, and Debt Maturity Schedule
| Carrying Value | ||||||||||
| ($ millions) | Authorized at March 31, 2020 | Nominal interest Rate | Year of Maturity | March 31, 2020 | December 31, 2019 | |||||
Senior unsecured credit facilities(1)(3) | 3,020 | 2.44(2) | Various(1) | 1,541 | 2,097 | |||||
| Senior unsecured notes – series A | 73 | 5.57 | 2020 | 74 | 74 | |||||
| Senior unsecured notes – series C | 200 | 5.58 | 2021 | 199 | 199 | |||||
| Senior unsecured medium-term notes series 1 | 250 | 4.89 | 2021 | 250 | 250 | |||||
| Senior unsecured medium-term notes series 2 | 450 | 3.77 | 2022 | 449 | 449 | |||||
| Senior unsecured medium-term notes series 3 | 450 | 4.75 | 2043 | 446 | 446 | |||||
| Senior unsecured medium-term notes series 4 | 600 | 4.81 | 2044 | 596 | 596 | |||||
| Senior unsecured medium-term notes series 5 | 450 | 3.54 | 2025 | 449 | 449 | |||||
| Senior unsecured medium-term notes series 6 | 500 | 4.24 | 2027 | 498 | 498 | |||||
| Senior unsecured medium-term notes series 7 | 500 | 3.71 | 2026 | 498 | 498 | |||||
| Senior unsecured medium-term notes series 8 | 650 | 2.99 | 2024 | 646 | 646 | |||||
| Senior unsecured medium-term notes series 9 | 550 | 4.74 | 2047 | 542 | 542 | |||||
| Senior unsecured medium-term notes series 10 | 650 | 4.02 | 2028 | 662 | 398 | |||||
| Senior unsecured medium-term notes series 11 | 800 | 4.75 | 2048 | 844 | 298 | |||||
| Senior unsecured medium-term notes series 12 | 650 | 3.62 | 2029 | 654 | 398 | |||||
| Senior unsecured medium-term notes series 13 | 700 | 4.54 | 2049 | 714 | 714 | |||||
| Senior unsecured medium-term notes series 14 | 600 | 2.56 | 2023 | 598 | 598 | |||||
| Senior unsecured medium-term notes series 15 | 600 | 3.31 | 2030 | 597 | 597 | |||||
| Senior unsecured medium-term notes 3A | 50 | 5.05 | 2022 | 52 | 52 | |||||
| Senior unsecured medium-term notes 5A | 350 | 3.43 | 2021 | 353 | 353 | |||||
| Total interest bearing liabilities | 10,662 | 10,152 | ||||||||
| Less current portion | (323 | ) | (74 | ) | ||||||
| Total non-current | 10,339 | 10,078 | ||||||||
(1) | Pembina's unsecured credit facilities include a $2.5 billion revolving facility that matures May 2024, a $500 million non-revolving term loan that matures August 2022 and a $20 million operating facility that matures May 2020, which is typically renewed on an annual basis. |
(2) | The nominal interest rate is the weighted average of all drawn credit facilities based on Pembina's credit rating at March 31, 2020. Borrowings under the credit facilities bear interest at prime, Bankers' Acceptance, or LIBOR rates, plus applicable margins. |
(3) | At March 31, 2020, includes U.S. $420 million (December 31, 2019: US$454 million). |
On January 10, 2020, Pembina closed an offering of $1.0 billion of senior unsecured medium-term notes. The offering was conducted in three tranches, consisting of $250 million issued through a re-opening of Pembina's senior unsecured medium-term notes, series 10, having a fixed coupon of 4.02 percent per annum, payable semi-annually and maturing on March 27, 2028; $500 million issued through a re-opening of Pembina's senior unsecured medium-term notes, series 11, having a fixed coupon of 4.75 percent per annum, payable semi-annually and maturing on March 26, 2048; and $250 million issued through a re-opening of Pembina's senior unsecured medium-term notes, series 12, having a fixed coupon of 3.62 percent per annum, payable semi-annually and maturing on April 3, 2029.
Pembina Pipeline Corporation First Quarter 2020 40
On April 3, 2020, Pembina entered into an unsecured $800 million revolving credit facility with certain existing lenders which provides additional liquidity and flexibility in Pembina’s capital structure in the current market conditions. The credit facility has an initial term of two years. The other terms and conditions of the credit facility, including financial covenants, are substantially similar to Pembina's unsecured $2.5 billion revolving credit facility.
On May 7, 2020, Pembina entered into an unsecured U.S. $250 million non-revolving term loan with a global bank, which provides additional liquidity and flexibility in Pembina's capital structure in the current market conditions. The term loan has an initial term of five years. The other terms and conditions of the credit facility, including financial covenants, are substantially similar to Pembina's unsecured $2.5 billion revolving credit facility.
All facilities are governed by specific debt covenants which Pembina was in compliance with at March 31, 2020 (December 31, 2019: in compliance).
8. DECOMMISSIONING PROVISION
| ($ millions) | 2020 | |
| Balance at January 1 | 867 | |
| Unwinding of discount rate | 4 | |
| Additions | 3 | |
| Change in cost estimates and other | (7 | ) |
| Total | 867 | |
Less current portion(1) | (2 | ) |
| Balance at March 31 | 865 | |
(1) | Included in trade payables and other on the Condensed Consolidated Interim Statement of Financial Position. |
Pembina applied a risk-free real return rate of 0.3 percent (December 31, 2019: 0.3 percent) to estimate the present value of the decommissioning provision. Changes in the measurement of the decommissioning provision are added to, or deducted from, the cost of the related property, plant and equipment or right of use asset. When a re-measurement of the decommissioning provision relates to a retired asset, the amount is recorded in earnings.
9. SHARE CAPITAL
Common Share Capital
| ($ millions, except as noted) | Number of Common Shares (millions) | Common Share Capital | ||
| Balance at December 31, 2019 | 548 | 15,539 | ||
| Share-based payment transactions | 2 | 87 | ||
| Balance at March 31, 2020 | 550 | 15,626 | ||
Preferred Share Capital
| ($ millions, except as noted) | Number of Preferred Shares (millions) | Preferred Share Capital | ||
| Balance at December 31, 2019 | 122 | 2,956 | ||
| Part VI.1 tax | — | (2 | ) | |
| Balance at March 31, 2020 | 122 | 2,954 | ||
41 Pembina Pipeline Corporation First Quarter 2020
Dividends
The following dividends were declared by Pembina:
| 3 Months Ended March 31 | ||||
| ($ millions) | 2020 | 2019 | ||
| Common shares | ||||
| $0.63 per common share (2019: $0.57) | 346 | 290 | ||
| Preferred shares | ||||
| $0.31 per Series 1 preferred share (2019: $0.31) | 3 | 3 | ||
| $0.28 per Series 3 preferred share (2019: $0.29) | 2 | 2 | ||
| $0.28 per Series 5 preferred share (2019: $0.31) | 3 | 3 | ||
| $0.27 per Series 7 preferred share (2019: $0.28) | 3 | 3 | ||
| $0.30 per Series 9 preferred share (2019: $0.30) | 2 | 2 | ||
| $0.36 per Series 11 preferred share (2019: $0.36) | 2 | 2 | ||
| $0.36 per Series 13 preferred share (2019: $0.36) | 4 | 4 | ||
| $0.28 per Series 15 preferred share (2019: $0.28) | 2 | 2 | ||
| $0.30 per Series 17 preferred share (2019: $0.31) | 2 | 2 | ||
| $0.31 per Series 19 preferred share (2019: $0.31) | 3 | 3 | ||
| $0.31 per Series 21 preferred share (2019: $0.31) | 5 | 5 | ||
| $0.33 per Series 23 preferred share (2019: nil) | 4 | — | ||
| $0.33 per Series 25 preferred share (2019: nil) | 3 | — | ||
| 38 | 31 | |||
On April 6, 2020, Pembina announced that its Board of Directors had declared a dividend of $0.21 per common share ($2.52 annually) in the total amount of $115 million, payable on May 15, 2020 to shareholders of record on April 24, 2020. Pembina's Board of Directors also declared quarterly dividends for Pembina's preferred shares as outlined in the following table:
| Series | Record Date | Payable Date | Per Share Amount | Dividend Amount ($ millions) | |
| Series 1 | May 1, 2020 | June 1, 2020 | $0.306625 | 3 | |
| Series 3 | May 1, 2020 | June 1, 2020 | $0.279875 | 2 | |
| Series 5 | May 1, 2020 | June 1, 2020 | $0.285813 | 3 | |
| Series 7 | May 1, 2020 | June 1, 2020 | $0.273750 | 3 | |
| Series 9 | May 1, 2020 | June 1, 2020 | $0.296875 | 3 | |
| Series 11 | May 1, 2020 | June 1, 2020 | $0.359375 | 2 | |
| Series 13 | May 1, 2020 | June 1, 2020 | $0.359375 | 4 | |
| Series 15 | June 15, 2020 | June 30, 2020 | $0.279000 | 2 | |
| Series 17 | June 15, 2020 | June 30, 2020 | $0.301313 | 2 | |
| Series 19 | June 15, 2020 | June 30, 2020 | $0.312500 | 3 | |
| Series 21 | May 1, 2020 | June 1, 2020 | $0.306250 | 5 | |
| Series 23 | April 30, 2020 | May 15, 2020 | $0.328125 | 4 | |
| Series 25 | April 30, 2020 | May 15, 2020 | $0.325000 | 3 | |
Pembina Pipeline Corporation First Quarter 2020 42
10. REVENUE
Revenue has been disaggregated into categories to reflect how the nature, timing and uncertainty of revenue and cash flows are affected by economic factors.
| a. | Revenue Disaggregation |
| 2020 | 2019 | |||||||||||||||
| 3 Months Ended March 31 | Pipelines | Facilities | Marketing & New Ventures | Total | Pipelines | Facilities | Marketing & New Ventures | Total | ||||||||
| ($ millions) | ||||||||||||||||
Take-or-pay(1) | 388 | 182 | — | 570 | 273 | 161 | — | 434 | ||||||||
Fee-for-service(1) | 99 | 30 | — | 129 | 96 | 17 | — | 113 | ||||||||
Product sales(2) | — | — | 923 | 923 | — | 3 | 1,396 | 1,399 | ||||||||
| Revenue from contracts with customers | 487 | 212 | 923 | 1,622 | 369 | 181 | 1,396 | 1,946 | ||||||||
| Operational finance lease income | 4 | — | — | 4 | — | — | — | — | ||||||||
Other revenue(3) | 37 | 8 | — | 45 | 15 | 7 | — | 22 | ||||||||
| Total external revenue | 528 | 220 | 923 | 1,671 | 384 | 188 | 1,396 | 1,968 | ||||||||
(1) | Revenue recognized over time. |
(2) | Revenue recognized at a point in time. |
(3) | Includes fixed operating lease income of $45 million for the three months ended March 31, 2020. |
| b. | Contract Liabilities |
Significant changes in the contract liabilities balances during the period are as follows:
| 3 Months Ended March 31, 2020 | 12 Months Ended December 31, 2019 | |||||||||||
| ($ millions) | Take-or-Pay | Other Contract Liabilities | Total Contract Liabilities | Take-or-Pay | Other Contract Liabilities | Total Contract Liabilities | ||||||
| Opening balance | 8 | 223 | 231 | 9 | 159 | 168 | ||||||
| Additions (net in the period) | 18 | 78 | 96 | 4 | 35 | 39 | ||||||
| Acquisition (Note 3) | — | — | — | — | 77 | 77 | ||||||
Revenue recognized from contract liabilities(1) | (3 | ) | (14 | ) | (17 | ) | (5 | ) | (48 | ) | (53 | ) |
| Closing balance | 23 | 287 | 310 | 8 | 223 | 231 | ||||||
Less current portion(2) | (23 | ) | (43 | ) | (66 | ) | (8 | ) | (31 | ) | (39 | ) |
| Ending balance | — | 244 | 244 | — | 192 | 192 | ||||||
(1) | Recognition of revenue related to performance obligations satisfied in the current period that were included in the opening balance of contract liabilities. |
(2) | As at March 31, 2020, the balance includes $23 million of cash collected under take-or-pay contracts which will be recognized within one year as the customer chooses to ship, process, or otherwise forego the associated service. |
Contract liabilities depict Pembina's obligation to perform services in the future for which payment has been received from customers. Contract liabilities include up-front payments or non-cash consideration received from customers for future transportation, processing and storage services. Contract liabilities also include consideration received from customers for take-or-pay commitments where the customer has a make-up right to ship or process future volumes under a firm contract. These amounts are non-refundable should the customer not use its make-up rights.
Pembina does not have any contract assets. In all instances where goods or services have been transferred to a customer in advance of the receipt of customer consideration, Pembina's right to consideration is unconditional and has therefore been presented as a receivable.
43 Pembina Pipeline Corporation First Quarter 2020
11. NET FINANCE COSTS
| 3 Months Ended March 31 | ||||
| ($ millions) | 2020 | 2019 | ||
| Interest expense on financial liabilities measured at amortized cost: | ||||
| Loans and borrowings | 87 | 71 | ||
| Leases | 10 | 5 | ||
| Unwinding of discount rate | 5 | 3 | ||
| Loss in fair value of non-commodity-related derivative financial instruments | 46 | 3 | ||
| Foreign exchange losses (gains) and other | 61 | (3 | ) | |
Net finance costs(1) | 209 | 79 | ||
(1) | Excludes operational finance lease income from lessor lease arrangements which is included in revenue as this income is generated from physical assets in the normal course of operations. |
Pembina Pipeline Corporation First Quarter 2020 44
12. OPERATING SEGMENTS
Pembina's operating segments are organized by three divisions: Pipelines, Facilities and Marketing & New Ventures.
| 3 Months Ended March 31, 2020 | Pipelines(1) | Facilities | Marketing & New Ventures(2) | Corporate & Inter-division Eliminations | Total | |||||
| ($ millions) | ||||||||||
| Revenue from external customers | 528 | 220 | 923 | — | 1,671 | |||||
| Inter-division revenue | 35 | 84 | — | (119 | ) | — | ||||
Total revenue(3) | 563 | 304 | 923 | (119 | ) | 1,671 | ||||
| Operating expenses | 126 | 96 | — | (43 | ) | 179 | ||||
| Cost of goods sold, including product purchases | — | 2 | 883 | (79 | ) | 806 | ||||
| Realized gain on commodity-related derivative financial instruments | — | — | (17 | ) | — | (17 | ) | |||
| Share of profit from equity accounted investees | 58 | 16 | 9 | — | 83 | |||||
| Depreciation and amortization included in operations | 99 | 53 | 13 | 2 | 167 | |||||
| Unrealized gain on commodity-related derivative financial instruments | — | (5 | ) | (104 | ) | — | (109 | ) | ||
| Gross profit | 396 | 174 | 157 | 1 | 728 | |||||
| Depreciation included in general and administrative | — | — | — | 10 | 10 | |||||
| Other general and administrative | 9 | 1 | 8 | 33 | 51 | |||||
| Other expense | — | — | 12 | 5 | 17 | |||||
| Reportable segment results from operating activities | 387 | 173 | 137 | (47 | ) | 650 | ||||
| Net finance costs | 7 | 7 | 21 | 174 | 209 | |||||
| Reportable segment earnings (loss) before tax | 380 | 166 | 116 | (221 | ) | 441 | ||||
| Capital expenditures | 328 | 136 | 15 | 4 | 483 | |||||
| Contributions to equity accounted investees | — | 41 | 153 | — | 194 | |||||
| 3 Months Ended March 31, 2019 | Pipelines(1) | Facilities | Marketing & New Ventures(2) | Corporate & Inter-division Eliminations | Total | |||||
| ($ millions) | ||||||||||
| Revenue from external customers | 384 | 188 | 1,396 | — | 1,968 | |||||
| Inter-division revenue | 32 | 83 | — | (115 | ) | — | ||||
Total revenue(3) | 416 | 271 | 1,396 | (115 | ) | 1,968 | ||||
| Operating expenses | 98 | 85 | — | (43 | ) | 140 | ||||
| Cost of goods sold, including product purchases | — | 1 | 1,265 | (72 | ) | 1,194 | ||||
| Realized gain on commodity-related derivative financial instruments | — | — | (19 | ) | — | (19 | ) | |||
| Share of profit from equity accounted investees | 79 | 12 | 5 | — | 96 | |||||
| Depreciation and amortization included in operations | 57 | 39 | 17 | 3 | 116 | |||||
| Unrealized loss on commodity-related derivative financial instruments | — | — | 45 | — | 45 | |||||
| Gross profit | 340 | 158 | 93 | (3 | ) | 588 | ||||
| Depreciation included in general and administrative | — | — | — | 9 | 9 | |||||
| Other general and administrative | 10 | 5 | 13 | 37 | 65 | |||||
| Other expense | 1 | — | 1 | 1 | 3 | |||||
| Reportable segment results from operating activities | 329 | 153 | 79 | (50 | ) | 511 | ||||
| Net finance costs (income) | 2 | 2 | (3 | ) | 78 | 79 | ||||
| Reportable segment earnings (loss) before tax | 327 | 151 | 82 | (128 | ) | 432 | ||||
| Capital expenditures | 192 | 112 | 55 | 2 | 361 | |||||
| Contributions to equity accounted investees | — | 26 | 64 | — | 90 | |||||
(1) | Pipelines transportation revenue includes $59 million (2019: $5 million) associated with U.S. pipeline revenue. |
(2) | Marketing & New Ventures includes revenue of $50 million (2019: $63 million) associated with U.S. midstream sales. |
(3) | During the first quarter of 2020, no one customer accounted for 10 percent or more of total revenues reported throughout all segments. During the first quarter of 2019: one customer accounted for 10 percent or more of total revenues, with $207 million reported throughout all segments. |
45 Pembina Pipeline Corporation First Quarter 2020
13. FINANCIAL INSTRUMENTS
Fair Values
The fair values of financial assets and liabilities, together with the carrying amounts shown in the consolidated statements of financial position, are shown in the table below. Certain non-derivative financial instruments measured at amortized cost including cash and cash equivalents, trade receivables and other, finance lease receivables, advances to related parties and trade payables and other have been excluded because they have carrying amounts that approximate their fair value due to the nature of the item or the short time to maturity. These instruments would be classified in Level 2 of the fair value hierarchy. A financial guarantee included in other liabilities has a carrying amount that approximates fair value at the reporting date due to the nature of the underlying development project and is classified in Level 3 of the fair value hierarchy.
| March 31, 2020 | December 31, 2019 | |||||||||||||||
| Carrying Value | Fair Value(1) | Carrying Value | Fair Value(1) | |||||||||||||
| ($ millions) | Level 1 | Level 2 | Level 3 | Level 1 | Level 2 | Level 3 | ||||||||||
| Financial assets carried at fair value | ||||||||||||||||
| Derivative financial instruments | 167 | — | 167 | — | 48 | — | 48 | — | ||||||||
| Financial liabilities carried at fair value | ||||||||||||||||
| Derivative financial instruments | 41 | — | 41 | — | 9 | — | 9 | — | ||||||||
| Financial liabilities carried at amortized cost | ||||||||||||||||
Loans and borrowings(2) | 10,662 | — | 9,974 | — | 10,152 | — | 10,729 | — | ||||||||
(1) | The basis for determining fair value is disclosed in Note 2. |
(2) | Carrying value of current and non-current balances. |
14. COMMITMENTS AND CONTINGENCIES
Commitments
Pembina had the following contractual obligations outstanding at March 31, 2020:
| Contractual Obligations | Payments Due by Period | |||||||||
| ($ millions) | Total | Less than 1 Year | 1 – 3 Years | 3 – 5 Years | After 5 Years | |||||
Leases(1) | 1,146 | 133 | 238 | 181 | 594 | |||||
Loans and borrowings(2) | 15,750 | 764 | 2,202 | 3,304 | 9,480 | |||||
Construction commitments(3) | 1,504 | 489 | 448 | 91 | 476 | |||||
Other(4) | 616 | 106 | 145 | 88 | 277 | |||||
| Total contractual obligations | 19,016 | 1,492 | 3,033 | 3,664 | 10,827 | |||||
(1) | Includes terminals, rail, office space, land and vehicle leases. |
(2) | Excluding deferred financing costs. Including interest payments on senior unsecured notes. |
(3) | Excluding significant projects that are awaiting regulatory approval at March 31, 2020, projects which Pembina is not committed to construct, and projects that are executed by equity accounted investees. |
(4) | Includes $46 million in commitments related to leases that have not yet commenced. |
Pembina enters into product purchase agreements and power purchase agreements to secure supply for future operations. Purchase prices of both NGL and power are dependent on current market prices. Volumes and prices for NGL and power contracts cannot be reasonably determined and therefore an amount has not been included in the contractual obligations schedule. Product purchase agreements range from one to 10 years and involve the purchase of NGL products from producers. Assuming product is available, Pembina has secured between 20 and 175 mbpd of NGL each year up to and including 2028. Power purchase agreements range from one to 25 years and involve the purchase of power from electrical service providers. Pembina has secured up to 71 megawatts per day each year up to and including 2043.
Pembina Pipeline Corporation First Quarter 2020 46
Commitments to Equity Accounted Investees
Pembina is contractually committed to provide CKPC with funding to construct assets that will form part of CKPC's PDH/PP Facility, subject to certain conditions being met. Following Pembina's decision to defer investment in CKPC, Pembina has deferred future contributions to CKPC.
Pembina has a contractual commitment to advance U.S. $31 million to Ruby by March 31, 2021.
Pembina has commitments to provide contributions to certain equity accounted investees based on annual budgets approved by the joint venture partners.
Contingencies
Pembina, its subsidiaries and its investments in equity accounted investees are subject to various legal and regulatory proceedings and actions arising in the normal course of business. We represent our interests vigorously in all proceedings in which we are involved. Legal and administrative proceedings involving possible losses are inherently complex, and we apply significant judgment in estimating probable outcomes. While the outcome of such actions and proceedings cannot be predicted with certainty, management believes that the resolutions of such actions and proceedings will not have a material impact on Pembina's financial position or results of operations.
Letters of Credit
Pembina has provided letters of credit to various third parties in the normal course of conducting business. The letters of credit include financial guarantees to counterparties for product purchases and sales, transportation services, utilities, engineering and construction services. The letters of credit have not had and are not expected to have a material impact on Pembina's financial position, earnings, liquidity or capital resources.
At March 31, 2020 Pembina had $104 million (December 31, 2019: $103 million) in letters of credit issued to facilitate commercial transactions with third parties and to support regulatory requirements.
47 Pembina Pipeline Corporation First Quarter 2020
HEAD OFFICE Pembina Pipeline Corporation Suite 4000, 585 - 8th Avenue SW Calgary, Alberta T2P 1G1 AUDITORS KPMG LLP Chartered Professional Accountants Calgary, Alberta TRUSTEE, REGISTRAR & TRANSFER AGENT Computershare Trust Company of Canada Suite 600, 530 - 8th Avenue SW Calgary, Alberta T2P 3S8 1.800.564.6253 STOCK EXCHANGE Pembina Pipeline Corporation Toronto Stock Exchange listing symbols for: COMMON SHARES PPL PREFERRED SHARES PPL.PR.A, PPL.PR.C, PPL.PR.E, PPL.PR.G, PPL.PR.I, PPL.PR.K, PPL.PR.M, PPL.PR.O, PPL.PR.Q, PPL.PR.S, PPL.PF.A, PPL.PF.C and PPL.PF.E New York Stock Exchange listing symbol for: COMMON SHARES PBA INVESTOR INQUIRIES PHONE 403.231.3156 FAX 403.237.0254 TOLL FREE 1.855.880.7404 EMAIL investor-relations@pembina.com WEBSITE www.pembina.com | |
Pembina Pipeline Corporation First Quarter 2020 48