Exhibit 99.1
KBS Fashion Group Limited
Condensed Consolidated Financial Statements
June 30, 2018 and 2017
(Stated in US dollars)
| CONTENTS | | PAGES | |
| | | | |
| CONDENSED CONSOLIDATED STATEMENTS OF COMPREHENSIVE LOSS | | 2 | |
| | | | |
| CONDENSED CONSOLIDATED STATEMENTS OF FINANCIAL POSITION | | 3 | |
| | | | |
| CONDENSED CONSOLIDATED STATEMENTS OF CHANGES IN EQUITY | | 4 | |
| | | | |
| CONDENSED CONSOLIDATED STATEMENTS OF CASH FLOWS | | 5-6 | |
| | | | |
| NOTES TO THE CONDENSED CONSOLIDATED FINANCIAL STATEMENTS | | 7-32 | |
KBS Fashion Group Limited
Condensed Consolidated Statements of Comprehensive Loss
For the six months ended June 30, 2018 and 2017
(Stated in U.S. Dollars)
| | | | | Unaudited | |
| | | | | For the six months ended, | |
| | | Notes | | 2018 | | | 2017 | |
| Revenue | | 7 | | | 8,352,070 | | | | 9,579,568 | |
| Cost of sales | | | | | (6,232,435 | ) | | | (7,503,626 | ) |
| Gross profit | | | | | 2,119,635 | | | | 2,075,942 | |
| | | | | | | | | | | |
| Other income | | | | | 66,876 | | | | 403,463 | |
| Other gains and (losses) | | 8 | | | 13,819 | | | | (3,846,439 | ) |
| Distribution and selling expenses | | | | | (1,406,499 | ) | | | (1,629,197 | ) |
| Administrative expenses | | | | | (3,354,952 | ) | | | (2,169,787 | ) |
| Loss from operations | | | | | (2,561,121 | ) | | | (5,166,018 | ) |
| | | | | | | | | | | |
| Finance costs | | 9 | | | (51,185 | ) | | | (47,342 | ) |
| | | | | | | | | | | |
| Loss before tax | | | | | (2,612,306 | ) | | | (5,213,360 | ) |
| | | | | | | | | | | |
| Income tax income | | 10 | | | 256,512 | | | | 1,244,281 | |
| | | | | | | | | | | |
| Loss for the year | | 11 | | | (2,355,794 | ) | | | (3,969,079 | ) |
| Other comprehensive (loss)/ income | | | | | | | | | | |
| -currency translation differences | | | | | (913,840 | ) | | | 1,257,618 | |
| Total comprehensive loss for the period | | | | | (3,269,634 | ) | | | (2,711,461 | ) |
| | | | | | | | | | | |
| (Loss) /earnings per share of common stock attributable to the Company | | | | | | | | | | |
| -Basic | | 12 | | | (1.07 | ) | | | (2.24 | ) |
| -Diluted | | 12 | | | (1.07 | ) | | | (2.24 | ) |
| Weighted average shares outstanding: | | | | | | | | | | |
| -Basic | | 12 | | | 2,206,741 | | | | 1,771,132 | |
| -Diluted | | 12 | | | 2,206,741 | | | | 1,771,132 | |
The accompanying notes are an integral part of these condensed consolidated financial statements.
KBS Fashion Group Limited
Condensed Consolidated Statements of Financial Position
As at June 30, 2018 and December 31, 2017
(Stated in U.S. Dollars)
| | | | | Unaudited | | | Audited | |
| | | Notes | | As at
June 30,
2018 | | | As at
December 31,
2017 | |
| Non-current assets | | | | | | | | | | |
| Property, plant and equipment-net | | 13 | | | 26,733,098 | | | | 27,824,523 | |
| Prepayments and premiums under operating leases | | 14 | | | 2,516,645 | | | | 2,568,199 | |
| Prepayment for construction of new plant | | 15 | | | - | | | | - | |
| Prepayment for acquisition of land use right | | 16 | | | - | | | | - | |
| Land use rights | | 17 | | | 633,285 | | | | 648,652 | |
| Deferred tax assets | | | | | 10,048,882 | | | | 9,924,944 | |
| | | | | | 39,931,910 | | | | 40,966,318 | |
| Current assets | | | | | | | | | | |
| Inventories | | 18 | | | 2,882,333 | | | | 1,806,212 | |
| Trade receivables | | 19 | | | 11,794,590 | | | | 10,501,543 | |
| Other receivables and prepayments | | 19 | | | 452,368 | | | | 1,901,268 | |
| Prepayments and premiums under operating leases | | 14 | | | 87,850 | | | | 83,907 | |
| Cash and cash equivalents | | 20 | | | 24,123,110 | | | | 26,050,456 | |
| | | | | | 39,340,251 | | | | 40,343,386 | |
| Total assets | | | | | 79,272,161 | | | | 81,309,704 | |
| Current liabilities | | | | | | | | | | |
| Short term bank loans | | 23 | | | 1,586,918 | | | | 1,606,930 | |
| Trade and other payables | | 21 | | | 5,187,624 | | | | 5,451,830 | |
| Related parties payables | | 22 | | | 425,638 | | | | 154,137 | |
| Income tax payable | | | | | - | | | | - | |
| Deposits received | | | | | - | | | | 69,612 | |
| | | | | | 7,200,180 | | | | 7,282,509 | |
| Non-current liability | | | | | | | | | | |
| Warrant liabilities | | 24 | | | - | | | | - | |
| | | | | | - | | | | - | |
| Total liabilities | | | | | 7,200,180 | | | | 7,282,509 | |
| Equity | | | | | | | | | | |
| Share capital | | 25 | | | 227 | | | | 198 | |
| Share premium | | 25 | | | 8,000,561 | | | | 6,686,169 | |
| Revaluation reserve | | 26 | | | 184,272 | | | | 184,272 | |
| Statutory surplus reserve | | 26 | | | 6,084,836 | | | | 6,084,836 | |
| Retained profits | | 26 | | | 61,791,017 | | | | 64,146,811 | |
| Foreign currency translation reserve | | 26 | | | (3,988,932 | ) | | | (3,075,091 | ) |
| | | | | | 72,071,981 | | | | 74,027,195 | |
| Total liabilities and equity | | | | | 79,272,161 | | | | 81,309,704 | |
The accompanying notes are an integral part of these condensed consolidated financial statements.
KBS Fashion Group Limited
Condensed Consolidated Statements of Changes in Equity
For the six months ended June 30, 2018 and the year ended December 31, 2017
(Stated in U.S. Dollars)
| | | Unaudited | |
| | | | | | | | | | | | | | | | | | Foreign | | | | |
| | | | | | | | | | | | Statutory | | | | | | currency | | | | |
| | | Share | | | Share | | | Revaluation | | | surplus | | | Retained | | | translation | | | | |
| | | capital | | | premium | | | reserve | | | reserve | | | profits | | | reserve | | | Total | |
| | | (Note 25) | | | (Note 25) | | | (Note 26) | | | (Note 26) | | | (Note 26) | | | (Note 26) | | | | |
| | | | | | | | | | | | | | | | | | | | | | |
| Balance at January 1, 2016 | | | 177 | | | | 6,056,240 | | | | 184,272 | | | | 6,084,836 | | | | 78,962,407 | | | | (7,885,806 | ) | | | 83,402,126 | |
| Shares issued for stock based compensation | | | 21 | | | | 629,929 | | | | - | | | | - | | | | - | | | | - | | | | 629,950 | |
| Loss for the year | | | - | | | | - | | | | - | | | | - | | | | (14,815,596 | ) | | | - | | | | (14,815,596 | ) |
| Other comprehensive income for the year | | | - | | | | - | | | | - | | | | - | | | | - | | | | 4,810,715 | | | | 4,810,715 | |
| Balance at December 31, 2017 | | | 198 | | | | 6,686,169 | | | | 184,272 | | | | 6,084,836 | | | | 64,146,811 | | | | (3,075,091 | ) | | | 74,027,195 | |
| Shares issued for stock based compensation | | | 29 | | | | 1,314,392 | | | | - | | | | - | | | | - | | | | - | | | | 1,314,421 | |
| Loss for the period | | | - | | | | - | | | | - | | | | - | | | | (2,355,794 | ) | | | - | | | | (2,355,794 | ) |
| Other comprehensive loss for the year | | | - | | | | - | | | | - | | | | - | | | | - | | | | (913,841 | ) | | | (913,841 | ) |
| Balance at June 30, 2018 | | | 227 | | | | 8,000,561 | | | | 184,272 | | | | 6,084,836 | | | | 61,791,017 | | | | (3,988,932 | ) | | | 72,071,981 | |
The accompanying notes are an integral part of these condensed consolidated financial statements.
KBS Fashion Group Limited
Condensed Consolidated Statements of Cash Flows
For the six months ended June 30, 2018 and 2017
(Stated in U.S. Dollars)
| | | Unaudited | |
| | | For the six months ended
June 30, | |
| | | 2018 | | | 2017 | |
| OPERATING ACTIVITIES | | | | | | |
| Loss for the year | | | (2,355,794 | ) | | | (3,969,079 | ) |
| Adjustments for: | | | | | | | | |
| Share-based payment | | | 1,314,420 | | | | - | |
| Finance cost | | | 51,185 | | | | (47,342 | ) |
| Interest income | | | (39,111 | ) | | | (42,538 | ) |
| Depreciation of property, plant and equipment | | | 792,939 | | | | 740,257 | |
| Amortization of prepaid lease payments and trademark | | | 7,554 | | | | 7,030 | |
| Amortization of subsidies prepaid to distributors | | | - | | | | 432,787 | |
| Amortization of prepayments and premiums under operating leases | | | 27,432 | | | | 51,761 | |
| Reversal of inventory obsolescence | | | (28,617 | ) | | | (2,045 | ) |
| Bad debt provision of trade receivables | | | - | | | | (3,831,436 | ) |
| Gain on disposal of property, plant and equipment | | | - | | | | (2,463 | ) |
| Operating cash flows before movements in working capital | | | (229,992 | ) | | | (6,663,068 | ) |
| | | | | | | | | |
| (Increase)/ decrease in trade and other receivables | | | (1,475,446 | ) | | | 4,731,162 | |
| Increase in inventories | | | (1,109,827 | ) | | | (958,547 | ) |
| (Decrease)/ Increase in trade and other payables | | | (292,811 | ) | | | 57,122 | |
| Prepayments and premiums paid under operating leases | | | 1,464,732 | | | | 4,102,502 | |
| Related parties payables | | | 108,523 | | | | (1,126,397 | ) |
| CASH (USED IN)/ GENERATED FROM OPERATING ACTIVITIES | | | (1,534,821 | ) | | | 142,774 | |
| Deferred income tax | | | (256,512 | ) | | | (1,244,281 | ) |
| Income tax paid | | | - | | | | (805,076 | ) |
| NET CASH USED IN OPERATING ACTIVITIES | | | (1,791,333 | ) | | | (1,906,583 | ) |
| | | | | | | | | |
| INVESTING ACTIVITIES | | | | | | | | |
| Interest received | | | 39,111 | | | | 42,538 | |
| Purchase of property, plant and equipment | | | (21,022 | ) | | | (2,230 | ) |
| NET CASH FROM INVESTING ACTIVITIES | | | 18,089 | | | | 40,308 | |
The accompanying notes are an integral part of these condensed consolidated financial statements.
KBS Fashion Group Limited
Condensed Consolidated Statements of Cash Flows
For the six months ended June 30, 2018 and 2017
(Stated in U.S. Dollars)
| | | | | | | |
| FINANCING ACTIVITIES | | | | | | |
| Interest paid | | | (51,185 | ) | | | (47,342 | ) |
| New bank loans raised | | | 1,644,448 | | | | - | |
| Repayment of borrowings | | | (1,644,448 | ) | | | - | |
| Advance from related party | | | 271,837 | | | | - | |
| NET CASH FROM FINANCING ACTIVITIES | | | 220,652 | | | | (47,342 | ) |
| | | | | | | | | |
| NET DECREASE IN CASH AND CASH EQUIVALENTS | | | (1,552,592 | ) | | | (1,913,617 | ) |
| Effects of currency translation | | | (374,754 | ) | | | 669,532 | |
| CASH AND CASH EQUIVALENTS AT BEGINNING OF YEAR | | | 26,050,456 | | | | 24,576,341 | |
| CASH AND CASH EQUIVALENTS AT END OF YEAR | | | 24,123,110 | | | | 23,332,257 | |
The accompanying notes are an integral part of these condensed consolidated financial statements.
KBS Fashion Group Limited
Notes to Financial Statements
On January 26, 2012, Aquasition Investments Corp (“Company”) was organized as a blank check company pursuant to the laws of the Republic of the Marshall Islands for the purpose of acquiring through a merger, capital stock exchange, asset acquisition, stock purchase, or similar acquisition transaction, one or more operating businesses or assets.
On March 24, 2014, the Company entered into a Share Exchange Agreement and Plan of Liquidation (the “Agreement”) among KBS International Holdings, Inc. (“KBS”), a Nevada corporation, Hongri International Holdings Ltd (“Hongri”), a company organized under the laws of the British Virgin Islands, and Cheung So Wa and Chan Sun Keung, the principal shareholders of KBS.
On August 1, 2014, the share exchange was completed. In order to align with the brand and operations of the entities acquired pursuant to the Agreement, the Company changed its name from Aquasition Investments Corp to KBS Fashion Group Limited.
The Company’s units which are comprised of one share of common stock and one warrant are traded on the NASDAQ Capital Markets. The Company’s trading symbol is KBSF.
The acquisition was accounted for as a reverse merger and recapitalization where the Company, the legal acquirer is the accounting ulfill, and KBS, the legal ulfill, was the accounting acquirer.
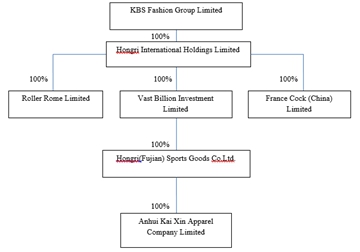
Description of Subsidiaries:
Hongri International Holdings Limited (the “Hongri”), formerly known as Wah Ying International Investment Inc., was incorporated in the British Virgin Islands (the “BVI”) on July 8, 2008 as a limited liability company with authorized share capital of $50,000, divided into 50,000 common shares with $1 par value. Up through December 31, 2010, 10,000 common shares had been issued at par. On January 27, 2011, the Company issued an additional 10,000 common shares for cash consideration at $77 per share. The principal activity of the Company is investment holding. Hongri a directly wholly owned subsidiary of the Company.
France Cock (China) Limited (“France Cock”) was incorporated in Hong Kong on September 21, 2005 as a limited liability company with authorized capital of HK$10,000, divided into 10,000 common shares with par value of HK$1. The capital has been fully paid up. The principal activity of France Cock is the holding of intellectual property rights such as trademarks. France Cock owns the Company’s trademarks, including “KBS” and “Kabiniao”. France Cock is a directly wholly owned subsidiary of Hongri.
KBS Fashion Group Limited
Notes to Financial Statements
Roller Rome Limited (“Roller Rome”) was incorporated in the BVI on March 28, 2006 as a limited liability company with authorized share capital of $50,000, divided into 50,000 common shares with par value of $1. The principal activity of Roller Rome is the provision of design and development services for sports apparel. Roller Rome is a directly wholly owned subsidiary of Hongri.
Vast Billion Investment Limited (“Vast Billion”) was incorporated in Hong Kong on November 25, 2010 as a limited liability company with authorized share capital of HK$10,000 divided into 10,000 ordinary shares with HK$1par value. One ordinary share has been issued at par. Vast Billion is an investment holding company, and is a directly wholly owned subsidiary of Hongri.
Hongri (Fujian) Sports Goods Co. Ltd. (“Hongri Fujian”) was established in the People’s Republic of China (the “PRC”) on November 17, 2005 with a registered and paid up capital of RMB 5,000,000. On March 24, 2011, Hongri Fujian increased registered capital from RMB 70,000,000 to RMB75,000,000. As of September 30, 2011, the paid up capital was RMB 39,551,860. Hongri Fujian is engaged in the design, manufacture, marketing, and sale of apparel in the PRC. Hongri Fujian is a directly wholly owned subsidiary of Vast Billion.
Anhui Kai Xin Apparel Company Limited (“Anhui Kai Xin”) was established in the PRC on March 16, 2011 with a registered and paid up capital of RMB 1,000,000. Anhui Kai Xin is a wholly owned subsidiary of Hongri Fujian. Anhui Kai Xin provides contracting manufacturing services for companies in the sports apparel business.
| 2. | GROUP ORGANIZATION AND BASIS OF PRESENTATION OF CONSOLIDATED FINANCIAL STATEMENTS |
The Group structure as at the reporting date is as follows:
KBS Fashion Group Limited
Notes to Financial Statements
These interim financial statements have been prepared in accordance with IAS 34 Interim Financial Reporting and should be read in conjunction with the Company’s last annual consolidated financial statements as at and for the year ended December 31, 2017 (‘last annual financial statements’). They do not include all of the information required for a complete set of IFRS financial statements. However, selected explanatory notes are included to explain events and transactions that are significant to an understanding of the changes in the Company’s financial position and performance since the last annual financial statements.
This is the first set of the Company’s financial statements where IFRS 15 and IFRS 9 have been applied. Changes to significant accounting policies are described in Note 4.
| 4. | CHANGES IN SIGNIFICANT ACCOUNTING POLICIES |
Except as described below, the accounting policies applied in these interim financial statements are the same as those applied in the Company’s consolidated financial statements as at and for the year ended December 31, 2017 (the policy for recognizing and measuring income taxes in the interim period is described in Note 10).
The changes in accounting policies are also expected to be reflected in the Company’s consolidated financial statements as at and for the year ending December 31, 2018.
The Company has initially adopted IFRS 15 Revenue from Contracts with Customers and IFRS 9 Financial Instruments from January 1, 2018. Several other new standards are effective from January 1, 2018 but they do not have a material effect on the Company’s financial statements.
IFRS 9 sets out requirements for recognizing and measuring financial assets, financial liabilities and some contracts to buy or sell non-financial items. This standard replaces IAS 39 Financial Instruments: Recognition and Measurement.
(a) Classification and measurement
IFRS 9 largely retains the existing requirements in IAS 39 for the classification and measurement of financial liabilities. However, it eliminates the previous IAS 39 categories for financial assets of held to maturity, loans and receivables and available for sale.
KBS Fashion Group Limited
Notes to Financial Statements
The adoption of IFRS 9 has not had a significant effect on the Company’s accounting policies related to financial liabilities and derivative financial instruments. The impact of IFRS 9 on the classification and measurement of financial assets is set out below.
Under IFRS 9, on initial recognition, a financial asset is classified as measured at: amortized cost; FVOCI – debt investment; FVOCI – equity investment; or FVTPL. The classification of financial assets under IFRS 9 is generally based on the business model in which a financial asset is managed and its contractual cash flow characteristics. Derivatives embedded in contracts where the host is a financial asset in the scope of the standard are never separated. Instead, the hybrid financial instrument as a whole is assessed for classification.
A financial asset is measured at amortized cost if it meets both of the following conditions and is not designated as at FVTPL:
| – | it is held within a business model whose objective is to hold assets to collect contractual cashflows; and |
| – | its contractual terms give rise on specified dates to cash flows that are solely payments of principal and interest on the principal amount outstanding. |
A debt investment is measured at FVOCI if it meets both of the following conditions and is not designated as at FVTPL:
| – | it is held within a business model whose objective is achieved by both collecting contractual cash flows and selling financial assets; and |
| – | its contractual terms give rise on specified dates to cash flows that are solely payments of principal and interest on the principal amount outstanding. |
On initial recognition of an equity investment that is not held for trading, the Company may irrevocably elect to present subsequent changes in the investment’s fair value in OCI. This election is made on an investment-by-investment basis.
All financial assets not classified as measured at amortized cost or FVOCI as described above are measured at FVTPL. This includes all derivative financial assets. On initial recognition, the Company may irrevocably designate a financial asset that otherwise meets the requirements to be measured at amortized cost or at FVOCI as at FVTPL if doing so eliminates or significantly reduces an accounting mismatch that would otherwise arise.
A financial asset (unless it is a trade receivable without a significant financing component that is initially measured at the transaction price) is initially measured at fair value plus, for an item not at FVTPL, transaction costs that are directly attributable to its acquisition.
KBS Fashion Group Limited
Notes to Financial Statements
The following accounting policies apply to the subsequent measurement of financial assets.
| | Financial assets at FVTPL | These assets are subsequently measured at fair value. Net gains and losses, including any interest or dividend income, are recognized in profit or loss. |
| | Financial assets at amortized cost | These assets are subsequently measured at amortized cost using the effective interest method. The amortized cost is reduced by impairment losses. Interest income, foreign exchange gains and losses and impairment are recognized in profit or loss. Any gain or loss on derecognition is recognized in profit or loss. |
| | Debt investments at FVOCI | These assets are subsequently measured at fair value. Interest income calculated using the effective interest method, foreign exchange gains and losses and impairment are recognized in profit or loss. Other net gains and losses are recognized in OCI. On derecognition, gains and losses accumulated in OCI are reclassified to profit or loss |
| | Equity investments at FVOCI | These assets are subsequently measured at fair value. Dividends are recognized as income in profit or loss unless the dividend clearly represents a recovery of part of the cost of the investment. Other net gains and losses are recognized in OCI and are never reclassified to profit or loss. |
There was no financial asset that requires reclassification and remeasurement as of January 1, 2018.
(b) Impairment
The adoption of IFRS 9 has fundamentally changed the Company’s accounting for impairment losses for financial assets by replacing IAS 39’s incurred loss approach with a forward-looking expected credit loss(“ECL”) approach.
IFRS 9 requires the Company to record an allowance for ECLs for all loans and other debt financial assets not held at fair value through profit or loss (“FVPL”).
KBS Fashion Group Limited
Notes to Financial Statements
ECLs are based on the difference between the contractual cash flows due in accordance with the contract and all the cash flows that the Group expects to receive. The shortfall is then discounted at an approximation to the asset’s original effective interest rate.
The adoption of the ECL requirements of IFRS 9 does not have a significant financial effect on the condensed consolidated interim financial statements.
IFRS 15 supersedes IAS 11 Construction Contracts and IAS 18 Revenue and related Interpretations, and it applies to all revenue arising from contracts with customers, unless those contracts are in the scope of other standards. The new standard establishes a five-step model to account for revenue arising from contracts with customers. Under IFRS 15, revenue is recognized at an amount that reflects the consideration to which an entity expects to be entitled in exchange for transferring goods or services to a customer.
The standard requires entities to exercise judgement, taking into consideration all of the relevant facts and circumstances when applying each step of the model to contracts with their customers. The standard also specifies the accounting for the incremental costs of obtaining a contract and the costs directly related to fulfilling contract. The adoption of this standard does not have a significant financial effect on the condensed consolidated
interim financial statements of the Company.
| 5. | SIGNIFICANT ACCOUNTING JUDGEMENTS AND ESTIMATES |
In preparing these interim financial statements, management has made judgements and estimates that affect the application of accounting policies and the reported amounts of assets and liabilities, income and expense. Actual results may differ from these estimates.
The significant judgements made by management in applying the Group’s accounting policies and the key sources of estimation uncertainty were the same as those described in the last annual financial statements.
KBS Fashion Group Limited
Notes to Financial Statements
Management currently identifies the Group’s three sales models as operating segments, which are wholesale, retail and contract manufacturing. The segment presentation is in accordance with management’s expectation of future business developments. These operating segments are monitored and strategic decisions are made on the basis of segmental gross margins.
| By business | | Wholesale | | | Retail | | | Subcontracting | | | Consolidated | |
| | | For the six months ended June 30, | | | For the six months ended June 30, | | | For the six months ended June 30, | | | For the six months ended June 30, | |
| | | 2018 | | | 2017 | | | 2018 | | | 2017 | | | 2018 | | | 2017 | | | 2018 | | | 2017 | |
| Sales to external customers | | | 6,961,772 | | | | 8,334,042 | | | | 283,499 | | | | 346,051 | | | | 1,106,799 | | | | 899,475 | | | | 8,352,070 | | | | 9,579,568 | |
| Segment revenue | | | 6,961,772 | | | | 8,334,042 | | | | 283,499 | | | | 346,051 | | | | 1,106,799 | | | | 899,475 | | | | 8,352,070 | | | | 9,579,568 | |
| Segment gross margins/(loss) | | | 1,618,547 | | | | 1,628,544 | | | | 120,885 | | | | 181,986 | | | | 380,203 | | | | 265,413 | | | | 2,119,635 | | | | 2,075,942 | |
| Reconciling items | | | | | | | | | | | | | | | | | | | | | | | | | | | (4,731,941 | ) | | | (7,289,302 | ) |
| Profit/(loss) before tax | | | | | | | | | | | | | | | | | | | | | | | | | | | (2,612,306 | ) | | | (5,213,360 | ) |
| Income tax income/(expense) | | | | | | | | | | | | | | | | | | | | | | | | | | | 256,512 | | | | 1,244,281 | |
| Profit/(loss) for the year | | | | | | | | | | | | | | | | | | | | | | | | | | | (2,355,794 | ) | | | (3,969,079 | ) |
KBS Fashion Group Limited
Notes to Financial Statements
| | | As of June 30, 2018 | |
| | | Wholesale and Retail | | | Subcontracting | | | Unallocated | | | Consolidated | |
| Current assets | | | 32,760,141 | | | | 6,557,774 | | | | 22,337 | | | | 39,340,252 | |
| Non-current assets | | | 8,946,222 | | | | 30,985,688 | | | | - | | | | 39,931,910 | |
| Total assets | | | 41,706,363 | | | | 37,543,462 | | | | 22,337 | | | | 79,272,162 | |
| | | | | | | | | | | | | | | | | |
| Current liabilities | | | 3,339,868 | | | | 2,023,803 | | | | 1,836,508 | | | | 7,200,179 | |
| Total liabilities | | | 3,339,868 | | | | 2,023,803 | | | | 1,836,508 | | | | 7,200,179 | |
| | | As of December 31, 2017 | |
| | | Wholesale and Retail | | | Subcontracting | | | Unallocated | | | Consolidated | |
| Current assets | | | 34,036,883 | | | | 6,284,118 | | | | 22,384 | | | | 40,343,385 | |
| Non-current assets | | | 8,987,857 | | | | 31,978,462 | | | | - | | | | 40,966,319 | |
| Total assets | | | 43,024,740 | | | | 38,262,580 | | | | 22,384 | | | | 81,309,704 | |
| | | | | | | | | | | | | | | | | |
| Current liabilities | | | 3,722,277 | | | | 1,995,164 | | | | 1,565,068 | | | | 7,282,509 | |
| Total liabilities | | | 3,722,277 | | | | 1,995,164 | | | | 1,565,068 | | | | 7,282,509 | |
Geographical information
The Group’s operations are located in the PRC and all of the Group’s revenue is derived from sales to customers in the PRC. Hence, no analysis by geographical area of operations is provided.
KBS Fashion Group Limited
Notes to Financial Statements
Information about major customers
There was no concentration in major customers for the six months ended June 30, 2018 and 2017.
Information about major suppliers
Major suppliers that make up 10% or more of purchases are as below:
| | | | For the six months ended
June 30, | |
| | | | 2018 | | | 2017 | |
| | Supplier A | | | 2,008,270 | | | | 2,946,004 | |
| | Supplier B | | | 2,271,651 | | | | 2,343,887 | |
| | Supplier C | | | 1,324,115 | | | | - | |
| | Other suppliers | | | 993,517 | | | | 8,067,003 | |
| | | | | 6,597,553 | | | | 13,356,894 | |
| | | | For the six months ended
June 30, | |
| | | | 2018 | | | 2017 | |
| | Apparel | | | | | | |
| | -Wholesale | | | 6,961,772 | | | | 8,334,042 | |
| | -Retail | | | 283,499 | | | | 346,051 | |
| | Subtotal | | | 7,245,271 | | | | 8,680,093 | |
| | Subcontracting | | | 1,106,799 | | | | 899,475 | |
| | | | | 8,352,070 | | | | 9,579,568 | |
Revenue is denominated only in USD.
| 8. | OTHER GAINS AND (LOSSES) |
| | | | For the six months ended
June 30, | |
| | | | 2018 | | | 2017 | |
| | Gain on disposals of property, plant and equipment | | | - | | | | 2,463 | |
| | Foreign exchange (loss)/ gain | | | (702 | ) | | | 100 | |
| | Provision / reversal of inventory obsolescence | | | 28,616 | | | | - | |
| | Bad debt provision/ (reversal) of trade receivables | | | - | | | | (3,831,436 | ) |
| | Impairment of prepayments in land purchase and related construction | | | - | | | | - | |
| | Others | | | (14,095 | ) | | | (17,566 | ) |
| | | | | 13,819 | | | | (3,846,439 | ) |
KBS Fashion Group Limited
Notes to Financial Statements
| | | | For the six months ended
June 30 | |
| | | | 2018 | | | 2017 | |
| | Interest expenses on bank borrowings | | | | | | |
| | wholly repayable within one year | | | 51,185 | | | | 47,342 | |
Bank borrowings interests are charged at a rate of 6.09% per annum for the bank loan that was fully repaid in 2017.
Bank borrowings interests are charged at a rate of 6.09% per annum for the current bank loan.
Income tax expense is recognized at an amount determined by multiplying the profit (loss) before tax for the interim reporting period by management’s best estimate of the weighted-average annual income tax rate expected for the full financial year, adjusted for the tax effect of certain items recognized in full in the interim period. As such, the effective tax rate in the interim financial statements may differ from management’s estimate of the effective tax rate for the annual financial statements.
Due to continuous operating loss, the effective tax rate for the for the six months ended June 30, 2018 and 2017 were (9)% and (23)%, respectively.
| | | | For the six months ended
June 30, | |
| | | | 2018 | | | 2017 | |
| | PRC enterprises income tax: | | | | | | | | |
| | Current tax | | | - | | | | | |
| | Deferred tax | | | 256,512 | | | | 1,244,281 | |
| | | | | 256,512 | | | | 1,244,281 | |
Hongri Fujian and Anhui Kai Xin subject to the applicable enterprise income tax rate of 25%. As of June 30, 2018 and December 31, 2017, the Company had no unrecognized tax benefits.
France Cock and Vast Billion were incorporated in Hong Kong and subject to Hong Kong profits tax at a tax rate of 16.5%. No provision for Hong Kong profits tax has been made as France Cock and Vast Billion has no taxable income during the reporting period.
Hongri International Holding Limited and Roller Rome were incorporated in the BVI and, under the current laws of the BVI, are not subject to income taxes.
KBS Fashion Group Limited
Notes to Financial Statements
KBS Fashion Group Limited was incorporated in the Marshall Island, and, under the current laws of the Marshall Island, is not subject to income taxes.
Loss for the year has been arrived at after charging:
| | | | For the six months ended | |
| | | | 2018 | | | 2017 | |
| | Cost of inventories recognized as expenses | | | 6,211,233 | | | | 7,466,903 | |
| | Taxes and surcharges | | | 21,202 | | | | 36,723 | |
| | | | | 6,232,435 | | | | 7,503,626 | |
| | | | | | | | | | |
| | Depreciation of property, plant and equipment | | | 792,939 | | | | 740,257 | |
| | Amortization of land use rights | | | 7,554 | | | | 7,030 | |
| | Amortization of subsidies prepaid to distributors | | | - | | | | 432,787 | |
| | Amortization of prepayments and premiums under operating leases | | | 27,432 | | | | 51,761 | |
| | Provision (Reversal) of inventory obsolescence | | | (28,616 | ) | | | (2,045 | ) |
| | Provision of bad debt allowance | | | 1,314,420 | | | | (3,831,436 | ) |
| | | | | 2,113,729 | | | | (2,601,646 | ) |
| 12. | EARNINGS/ (LOSS) PER SHARE |
| | | | For the six months ended | |
| | | | 2018 | | | 2017 | |
| | Basic (Loss)/Earnings Per Share Numerator | | | | | | |
| | Profit for the year attributable to owners of the Company | | $ | (2,355,794 | ) | | $ | (3,969,079 | ) |
| | | | | | | | | | |
| | Diluted (Loss)/Earnings Per Share Numerator | | | | | | | | |
| | Profit for the year attributable to owners of the Company | | $ | (2,355,794 | ) | | $ | (3,969,079 | ) |
| | | | | | | | | | |
| | Basic (Loss)/Earnings Per Share Denominator# | | | | | | | | |
| | Original shares: | | | 1,986,299 | | | | 1,767,821 | |
| | Additions from actual events: | | | | | | | | |
| | - Issuance of common stock, weighted | | | 220,442 | | | | 3,311 | |
| | Basic weighted average shares outstanding | | | 2,206,741 | | | | 1,771,132 | |
| | | | | | | | | | |
| | Diluted (Loss)/Earnings Per Share Denominator# | | | | | | | | |
| | Basic weighted average shares outstanding | | | 2,206,741 | | | | 1,771,132 | |
| | Dilutive shares: Potential additions from dilutive events: | | | | | | | | |
| | - Exercise of investor warrants* | | | - | | | | - | |
| | Diluted Weighted Average Shares Outstanding: | | | 2,206,741 | | | | 1,771,132 | |
| | | | | | | | | | |
| | (Loss)/Earnings Per Share# | | | | | | | | |
| | - Basic | | $ | (1.07 | ) | | $ | (2.24 | ) |
| | - Diluted | | $ | (1.07 | ) | | $ | (2.24 | ) |
| | Weighted Average Shares Outstanding# | | | | | | | | |
| | - Basic | | | 2,206,741 | | | | 1,771,132 | |
| | - Diluted | | | 2,206,741 | | | | 1,771,132 | |
| * | There were no potential dilutive additions to diluted weighted shares outstanding |
KBS Fashion Group Limited
Notes to Financial Statements
| 13. | PROPERTIES. PLANT AND EQUIPMENT |
| | | Plant | | | Machinery | | | Office equipment | | | Motor
vehicles | | | Furniture and fixtures | | | Leasehold improvements
-factories and offices | | | Leasehold improvements
-shops | | | Total | |
| | | | | | | | | | |
| COST | | | | | | | | | | | | | | | | | | | | | | | | | | | | | | | | |
| At January 1, 2017 | | | 28,531,542 | | | | 859,166 | | | | 134,701 | | | | 122,328 | | | | 145,973 | | | | 843,767 | | | | 253,154 | | | | 30,890,631 | |
| Additions | | | 965,792 | | | | 15,893 | | | | - | | | | - | | | | - | | | | - | | | | - | | | | 981,685 | |
| Disposals | | | - | | | | - | | | | (12,490 | ) | | | (43,215 | ) | | | (1,836 | ) | | | - | | | | - | | | | (57,541 | ) |
| Translation adjustment | | | 1,758,824 | | | | 52,963 | | | | 8,304 | | | | 7,541 | | | | 8,999 | | | | 52,014 | | | | 15,606 | | | | 1,904,251 | |
| At December 31, 2017 | | | 31,256,158 | | | | 928,022 | | | | 130,515 | | | | 86,654 | | | | 153,136 | | | | 895,781 | | | | 268,760 | | | | 33,719,026 | |
| Additions | | | - | | �� | | - | | | | 11,974 | | | | - | | | | 8,312 | | | | - | | | | - | | | | 20,286 | |
| Disposals | | | - | | | | - | | | | - | | | | - | | | | - | | | | - | | | | - | | | | - | |
| Translation adjustment | | | (389,249 | ) | | | (11,557 | ) | | | (1,625 | ) | | | (1,079 | ) | | | (1,907 | ) | | | (11,156 | ) | | | (3,347 | ) | | | (419,920 | ) |
| At June 30, 2018 | | | 30,866,909 | | | | 916,465 | | | | 140,864 | | | | 85,575 | | | | 159,541 | | | | 884,625 | | | | 265,413 | | | | 33,319,392 | |
| | | | | | | | | | | | | | | | | | | | | | | | | | | | | | | | | |
| DEPRECIATION | | | | | | | | | | | | | | | | | | | | | | | | | | | | | | | | |
| At January 1, 2017 | | | (2,406,532 | ) | | | (700,123 | ) | | | (89,920 | ) | | | (109,891 | ) | | | (136,626 | ) | | | (435,636 | ) | | | (253,154 | ) | | | (4,131,882 | ) |
| Provided for the year | | | (1,377,553 | ) | | | (48,120 | ) | | | (14,495 | ) | | | (174 | ) | | | (3,202 | ) | | | (114,762 | ) | | | - | | | | (1,558,306 | ) |
| Eliminated upon disposal of assets | | | - | | | | - | | | | 10,071 | | | | 38,893 | | | | 1,432 | | | | - | | | | - | | | | 50,396 | |
| Translation adjustment | | | (148,350 | ) | | | (43,159 | ) | | | (5,543 | ) | | | (6,774 | ) | | | (8,422 | ) | | | (26,855 | ) | | | (15,606 | ) | | | (254,709 | ) |
| At December 31, 2017 | | | (3,932,435 | ) | | | (791,402 | ) | | | (99,887 | ) | | | (77,946 | ) | | | (146,818 | ) | | | (577,253 | ) | | | (268,760 | ) | | | (5,894,501 | ) |
| Provided for the year | | | (694,505 | ) | | | (7,817 | ) | | | (4,852 | ) | | | (43 | ) | | | (1,315 | ) | | | (56,667 | ) | | | - | | | | (765,199 | ) |
| Eliminated upon disposal of assets | | | - | | | | - | | | | - | | | | - | | | | - | | | | - | | | | - | | | | - | |
| Translation adjustment | | | 48,973 | | | | 9,856 | | | | 1,244 | | | | 971 | | | | 1,828 | | | | 7,189 | | | | 3,347 | | | | 73,407 | |
| At June 30, 2018 | | | (4,577,967 | ) | | | (789,363 | ) | | | (103,495 | ) | | | (77,018 | ) | | | (146,305 | ) | | | (626,731 | ) | | | (265,413 | ) | | | (6,586,292 | ) |
| | | | | | | | | | | | | | | | | | | | | | | | | | | | | | | | | |
| CARRYING AMOUNT | | | | | | | | | | | | | | | | | | | | | | | | | | | | | | | | |
| At December 31, 2017 | | | 27,323,723 | | | | 136,620 | | | | 30,628 | | | | 8,708 | | | | 6,318 | | | | 318,528 | | | | - | | | | 27,824,524 | |
| At June 30, 2018 | | | 26,288,942 | | | | 127,102 | | | | 37,369 | | | | 8,557 | | | | 13,236 | | | | 257,894 | | | | - | | | | 26,733,098 | |
KBS Fashion Group Limited
Notes to Financial Statements
Net exchange differences from translating the financial statements from functional currency to presentation currency were $(346,514) and $1,649,540 as at June 30, 2018 and December 31, 2017, respectively.
Depreciation expense for the six months ended June 30, 2018 and 2017 were $792,939, and $740,257, respectively. There was no impairment loss charged for the periods presented.
Depreciation is provided on straight-line basis for all property, plant and equipment over their estimated useful lives of the assets as follows:
| | | | Useful life | | Residual Value | |
| | Plant | | 20 years | | | 10 | % |
| | Machinery | | 5 years | | | 10 | % |
| | Office equipment | | 5 years | | | 10 | % |
| | Motor vehicles | | 5 years | | | 10 | % |
| | Furniture and fixtures | | 5 years | | | 10 | % |
| | Leasehold improvements-factories and offices | | Shorter of estimated useful life of 5 years or lease term | | | 10 | % |
| | Leasehold improvements-shops | | Shorter of estimated useful life of 5 years or lease term | | | Nil | |
| | Distributor shops’ furniture and fixtures | | 1.5 years | | | Nil | |
| | | | | | | | |
Plant includes buildings owned by Anhui Kaixin built on the following land:
| | Location | | Description | | | Gross area (m2) | |
| | Jinxi Town, Longshan Road, Taihu City, Anhui Province, the PRC | | | Dormitory | | | | 8,573 | |
| | Jinxi Town, Longshan Road, Taihu City, Anhui Province, the PRC | | | Factory | | | | 22,292 | |
The buildings were pledged as security for the outstanding bank loans as set forth in note 31.
The gross carrying amount of the fully depreciated property, plant and equipment that is still in use is $38,367 and $38,851as at June 30, 2018 and December 31, 2017, respectively.
KBS Fashion Group Limited
Notes to Financial Statements
In 2012, the Company performed a revaluation of certain equipment. The revaluation was performed by an independent appraiser on November 10, 2012 and, as a result of the revaluation, the Company recognized a revaluation surplus in the amount of 184,272. The amount is classified as revaluation reserve. Since the surplus has not been realized, the amount recognized is not available for distribution. There was no movement in the revaluation reserve during 2017 and 2016. The carrying amount that would have been recognized had the assets been carried under the cost model is as follows:
| | | | As at
June 30,
2018 | | | As at
December 31,
2017 | |
| | Machinery | | | 79,700 | | | | 95,826 | |
| | Motor Vehicles | | | 34 | | | | 35 | |
| | Office Equipment | | | 2,628 | | | | 2,661 | |
| | Furniture and fixtures | | | 729 | | | | 739 | |
| | | | | 83,091 | | | | 99,261 | |
| 14. | PREPAYMENTS AND PREMIUMS UNDER OPERATING LEASES |
| | | | Amount | |
| | At January 1, 2017 | | | 2,570,682 | |
| | additions for the year | | | 30,672 | |
| | charge for the year | | | (105,340 | ) |
| | translation adjustment | | | 156,092 | |
| | At December 31, 2017 | | | 2,652,106 | |
| | additions for the year | | | 20,422 | |
| | charge for the year | | | (54,677 | ) |
| | translation adjustment | | | (13,356 | ) |
| | At June 30, 2018 | | | 2,604,495 | |
Analyzed for reporting purposes as:
| | | | As at
June 30,
2018 | | | As at December 31,
2017 | |
| | Current asset | | | 87,850 | | | | 83,907 | |
| | Non-current asset | | | 2,516,645 | | | | 2,568,199 | |
| | | | | 2,604,495 | | | | 2,652,106 | |
| 15. | PREPAYMENT FOR CONSTRUCTION OF NEW PLANT |
On November 20, 2010, Hongri Fujian entered into an agreement with a third party, Anqing Zhongfang Construction and Installation Co., Ltd., for the construction of the new plant in Anhui at a consideration of $17,826,251. In 2012, Kaixin Anhui made a prepayment of $6,363,853 for the second phase of the project. In 2013, Kaixin Anhui made another prepayment of $9,747,897 for the second phase of the project. The amount of $16,401,778 was recognized in Construction in progress.
KBS Fashion Group Limited
Notes to Financial Statements
In 2014, Kaixin Anhui made another prepayment of $15,525,413 for the second and third phase of the project, and an amount of $6,537,016 was recognized in construction in progress.
In 2015, an amount of $110,041 was recognized in construction in progress, which was subsequently recognized as fixed asset along with the completion of the second phase of the project. The total amount transferred to fixed assets from construction in progress amounted to $22,960,220.
The third phase of the project is related to the construction of a building. The construction site is located on a piece of land whose land use right was to be acquired by the Company. Due to reasons as set forth in note 23, the anticipated completion date of the project is expected to be delayed and, in the worst case, may be terminated. Accordingly, management provided a provision of impairment loss against the carrying value of such prepayment. The detail of estimation of such provision is explained in note 6.
As at June 30, 2018, the carrying amount of the prepayment for construction of new plant is as follows:
| | | | As at
June 30,
2018 | |
| | Prepaid in 2015 | | | 8,469,878 | |
| | Recognized as construction in progress | | | (110,041 | ) |
| | | | | 8,359,837 | |
| | Impairment loss in 2015: | | | (1,199,314 | ) |
| | | | | 7,160,523 | |
| | Impairment loss in 2016: | | | (6,989,200 | ) |
| | Translation adjustment: | | | (171,323 | ) |
| | | | | - | |
| 16. | PREPAYMENT FOR ACQUISITION OF LAND USE RIGHT |
On September 2, 2010, Hongri Fujian entered into an agreement with a third party, Taihu Weiqi Sports Apparel Co., Ltd., to acquire a land use right in relation to the development of factories in Anhui Kaixin for a total consideration of $6,340,456. As of December 31, 2015, the transaction has not been completed yet due to disputes between the original owner of the land and the government regarding the compensation for vacating the premises. In relation to this dispute, the Company expected that the project would be delayed or, in the worst case, be terminated. Accordingly, the Company provided a provision of impairment loss against the carrying value for such prepayment. The detail estimation of such provision is explained in note 6.
KBS Fashion Group Limited
Notes to Financial Statements
As at June 30, 2018, the carrying amount of the prepayment for acquisition of land use right is as follows:
| | | | As at
June 30,
2018 | |
| | Prepaid in 2010 | | | 6,039,930 | |
| | Impairment loss: | | | (1,265,867 | ) |
| | | | | 4,774,063 | |
| | Impairment loss in 2016: | | | (4,659,838 | ) |
| | Translation adjustment: | | | (114,225 | ) |
| | | | | - | |
| | | | Amount | |
| | COST | | | |
| | At January 1, 2017 | | | 691,618 | |
| | additions for the year | | | - | |
| | translation adjustment | | | 42,635 | |
| | At December 31, 2017 | | | 734,253 | |
| | additions for the year | | | - | |
| | translation adjustment | | | (9,144 | ) |
| | At June 30, 2018 | | | 725,109 | |
| | | | | | |
| | AMORTIZATION | | | | |
| | At January 1, 2017 | | | (66,724 | ) |
| | charge for the year | | | (14,307 | ) |
| | translation adjustment | | | (4,570 | ) |
| | At December 31, 2017 | | | (85,601 | ) |
| | charge for the year | | | (7,554 | ) |
| | translation adjustment | | | 1,331 | |
| | At June 30, 2018 | | | (91,824 | ) |
| | | | | | |
| | CARRYING AMOUNTS | | | | |
| | At December 31, 2017 | | | 648,652 | |
| | At June 30, 2018 | | | 633,285 | |
The amounts represent the prepayment of rentals for land use right (industrial use) situated in the PRC. The land use rights have the term of 50 years.
All the land use rights mentioned above were owned by Anhui Kaixin.
KBS Fashion Group Limited
Notes to Financial Statements
The land use right is comprised of the following:
| | Location | | Expiry date of
tenure | | Land area (m2) | |
| | Longshan Road, Economic development District, Taihu County | | 2062-05-23 | | 2,440 | |
| | Longshan Road, Economic development District, Taihu County | | 2061-11-06 | | 7,405 | |
| | | | As at
June 30,
2018 | | | As at
December 31,
2017 | |
| | Raw materials | | | 527,955 | | | | 1,186,467 | |
| | Work in process | | | 2,851 | | | | - | |
| | Finished goods | | | 2,429,212 | | | | 726,372 | |
| | Provision for obsolete inventories | | | (77,685 | ) | | | (106,627 | ) |
| | | | | 2,882,333 | | | | 1,806,212 | |
| 19. | TRADE RECEIVABLES, OTHER RECEIVABLES AND PREPAYMENTS |
| | | | As at
June 30,
2018 | | | As at
December 31,
2017 | |
| | Trade receivables | | | 13,136,918 | | | | 11,860,798 | |
| | Bad debt provision for trade receivables | | | (1,342,328 | ) | | | (1,359,255 | ) |
| | | | | 11,794,590 | | | | 10,501,543 | |
| | | | As at
June 30,
2018 | | | As at
December 31,
2017 | |
| | Other receivables | | | 2,814 | | | | 2,849 | |
| | Prepayments | | | 449,554 | | | | 1,898,419 | |
| | | | | 452,368 | | | | 1,901,268 | |
KBS Fashion Group Limited
Notes to Financial Statements
The fair value of trade and other receivables have not been disclosed as, due to their short duration, management considers the carrying amounts recognized in the consolidated statements of financial position to be reasonable approximation of their fair values.
Prepayments include advances to suppliers and prepaid income tax.
Before accepting any new customer, the Group assesses the potential customer’s credit quality and defined credit limits by customer. Limits attributed to customers are reviewed once a year. The aging analysis of trade receivables is as follows:
| | | | As at
June 30,
2018 | | | As at
December 31,
2017 | |
| | Current | | | 974,560 | | | | 1,791,936 | |
| | Past due for less than 4 months | | | 3,300,008 | | | | 2,721,633 | |
| | Past due for more than 4 months | | | 8,862,350 | | | | 7,347,229 | |
| | | | | 13,136,918 | | | | 11,860,798 | |
The Group allows an average credit period of 90 -120 days to its trade customers. For the overdue trade receivable, the Company did not further provide provisions during the six months ended June 30, 2018 and 2017, respectively. The provision for doubtful debts is recorded using a provision account unless the Group is satisfied that recovery is remote, in which case the unrecovered loss is written off against trade receivables and the provision for doubtful debts directly. The Group does not hold any collateral over these balances.
The movement in the provision for doubtful debts during the year is as follows:
| | | | As at
June 30,
2018 | | | As at
December 31,
2017 | |
| | As at January 1 | | | 1,359,255 | | | | 1,280,330 | |
| | Provision provided in the year | | | - | | | | - | |
| | Translation adjustment | | | (16,927 | ) | | | 78,925 | |
| | As at end of period | | | 1,342,328 | | | | 1,359,255 | |
Among the amounts of trade receivables, $1,908,783 and $1,723,364of output VAT was included as of June 30, 2018 and December 31, 2017, respectively.
| 20. | CASH AND CASH EQUIVALENTS |
| | | | As at
June 30,
2018 | | | As at
December 31,
2017 | |
| | Cash on hand | | | 29,952 | | | | 16,413 | |
| | Bank deposits | | | 24,093,158 | | | | 26,034,043 | |
| | | | | 24,123,110 | | | | 26,050,456 | |
| | | | As at
June 30,
2018 | | | As at
December 31,
2017 | |
| | Renminbi | | | 24,113,273 | | | | 26,040,572 | |
| | Hong Kong Dollars | | | 8,871 | | | | 8,914 | |
| | United States Dollars | | | 966 | | | | 970 | |
| | | | | 24,123,110 | | | | 26,050,456 | |
Cash and cash equivalents comprise cash held by the Group and short-term deposits with an original maturity of three months or less. Bank deposits as at June 30, 2018 carry interest at market rates which ranged from 0.35% to 0.50% (2017: 0.35%-0.50%) per annum. Majority of our cash is deposited with financial institution in the PRC. Remittance of funds out of the PRC is subject to the exchange restrictions imposed by the PRC government.
KBS Fashion Group Limited
Notes to Financial Statements
| 21. | TRADE AND OTHER PAYABLES |
| | | | As at
June 30,
2018 | | | As at
December 31,
2017 | |
| | Trade payables | | | 77,269 | | | | 104,258 | |
| | Employee benefits payable | | | 210,918 | | | | 226,210 | |
| | Other payables | | | 1,706,817 | | | | 1,648,060 | |
| | Subtotal financial liabilities | | | 1,995,004 | | | | 1,978,528 | |
| | Advances from customers | | | 69,079 | | | | - | |
| | Other taxes payable | | | 3,123,541 | | | | 3,473,302 | |
| | | | | 5,187,624 | | | | 5,451,830 | |
The fair value of trade and other payables have not been disclosed as, due to their short duration, management considers the carrying amounts recognized in the consolidated statements of financial position to be reasonable approximation of their fair values.
Trade payables comprise amounts outstanding for trade purchase. The average credit period is 30 days from the time when the services are rendered by or goods received from suppliers. The aging analysis of trade payables is as follows:
| | | | As at
June 30,
2018 | | | As at
December 31,
2017 | |
| | | | | | | | |
| | Current | | | 19,456 | | | | 23,587 | |
| | Past due for less than 4 months | | | 29,257 | | | | 57,637 | |
| | Past due for over 4 months | | | 28,556 | | | | 23,034 | |
| | | | | 77,269 | | | | 104,258 | |
The Company was granted a credit term of 30 days. The balances past due were mainly for the Company’s high bargaining power.
| 22. | RELATED PARTIES PAYABLE |
| (1) | Nature of relationship with related parties |
| | Name | | Relationship with the Group |
| | Yan, Keyan | | Chairman, Director, and CEO |
| | Chen, Bizhen | | Wife of Yan, Keyan |
| | KBS International | | Ex-shareholder of Hongri |
| | Shishi City Lingxiu Hongri Knitwear Factory | | Company owned by Chen, Bizhen |
| (2) | Significant balances between the Group and the above related parties: |
KBS Fashion Group Limited
Notes to Financial Statements
| | Name | | Nature | | | As at
June 30,
2018 | | | As at
December 31,
2017 | |
| | | | | | | | | | | |
| | Yan, Keyan | | | Borrowing of funds | | | | 425,638 | | | | 154,137 | |
| | | | | | | | | 425,638 | | | | 154,137 | |
Related parties payables were unsecured, non-interest bearing and repayment on demand.
During 2017 and 2018, Mr. Yan provided personal guarantees for the loans as set forth in Note 23.
*The Company entered into a lease arrangement for office space with this related party in 2010. The breakdown of the commitment to the lease is disclosed in note 28.
| | | | As at
June 30,
2018 | | | As at
December 31,
2017 | |
| | Secured bank borrowings | | | 1,586,918 | | | | 1,606,930 | |
| | Carrying amount repayable within 1 year | | | 1,586,918 | | | | 1,606,930 | |
The borrowings are fixed-rate and denominated in RMB.
| Bank loans | | Amount USD | | | Period | | Interest rate | | | Mortgage | | Personal guarantee |
| #1 | | | 453,405 | | | | 4/6/2017 | | | | 4/5/2018* | | | 6.09 | % | | Land use right and buildings | | Yan, Keyan/
Chen, Bizhen |
| #2 | | | 1,133,513 | | | | 3/21/2018 | | | | 3/21/2019 | | | 6.09 | % | | Land use right and buildings | | Yan, Keyan/
Chen, Bizhen |
| | | | 1,586,918 | | | | | | | | | | | | | | | | |
As of June 30, 2018, Loan#1 is in default. The Company negotiated with the financial institution and extended the deadline to repay the loan. In September 2018, the loan was fully repaid.
KBS Fashion Group Limited
Notes to Financial Statements
On November 1, 2012, the Company sold 5,000,000 Units at an offering price of $10.00 per Unit generating gross proceeds of $50,000,000 in the Public Offering. Each Unit consisted of one share of common stock of the Company and one warrant to purchase one share of common stock of the Company (“Redeemable Warrants”). Each Redeemable Warrant entitled the holder to purchase one share of common stock at a price of $11.50 which would commence on the later of either the completion of an initial Acquisition Transaction or October 24, 2013, and would expire five years from the completion date of an initial Acquisition Transaction, provided that there is an effective registration statement covering the shares of common stock underlying the Redeemable Warrants. The Company is entitled to redeem the Redeemable Warrants at a price of $0.01 per Redeemable Warrant upon providing 30 days’ notice, subject to the last sale price of the common stock was at a minimum of $17.50 per share for any 20 trading days within a 30-trading day period (“30-Day Trading Period”) that ended on the third day prior to the date on which notice of redemption is given, provided that there is a current registration statement in effect with respect to the shares of common stock underlying such Redeemable Warrants commencing ten days prior to the 30-Day Trading Period and continuing each day thereafter until the date of redemption. The Company is required to use its best efforts to maintain the effectiveness of the registration statement covering the Redeemable Warrants. However, there are no contractual penalties for failure to deliver securities if a registration statement is not effective at the time of exercise. Additionally, in the event that a registration statement is not effective at the time of exercise, the holder of such Redeemable Warrant shall not be entitled to exercise such Redeemable Warrant for cash and in no event (whether in the case of a registration statement not being effective or otherwise) will the Company be required to net cash settle the Redeemable Warrant exercise.
Simultaneously with the consummation of the Public Offering, the Company consummated a Private Placement for the sale of 337,750 Placement Units to its Founders at a price of $10.00 per share, generating total proceeds of $3,377,500. The Placement Units are identical to the Units sold in the Public Offering except that the warrants included in the Placement Units (i) were not redeemable by the Company and (ii) may be exercised for cash, or on a cashless basis, so long as they are held by the initial purchaser or any of its permitted transferees. Additionally, the Placement Units have been placed in escrow and the purchasers have agreed not to transfer, assign or sell any of the Placement Units, including the underlying securities (except to certain permitted transferees) until 30 days following the completion of an initial Acquisition Transaction. The securities held in the escrow account will only be released prior to the end of the escrow period if following the initial Acquisition Transaction, the Company consummates a subsequent transaction that results in all stockholders having a right to exchange their shares for cash or other consideration.
The Company granted the underwriter in the Public Offering a 45-day option to purchase up to an additional 750,000 Units solely to cover over-allotments, if any. On November 7, 2012, the underwriters exercised a portion of their option and the Company sold an additional 550,000 Units at a price of $10.00 per Unit generating gross proceeds of $5,500,000. In addition, the Company sold an additional 30,250 Private Placement Units generating gross proceeds of $302,500.
KBS Fashion Group Limited
Notes to Financial Statements
The table below provides a reconciliation of the beginning and ending balances for the liabilities measured using fair significant unobservable inputs:
| | Balance – January 26, 2012 (inception) | | - | |
| | Correction of an error | | | 3,200,223 | |
| | Issuance of warrants as part of Units on November 7, 2012 | | | 322,884 | |
| | Change in fair value | | | (45,225 | ) |
| | Balance – December 31, 2012 | | | 3,477,882 | |
| | Change in fair value | | | (45,442 | ) |
| | Balance – December 31, 2013 | | | 3,432,440 | |
| | Change in fair value | | | (3,417,053 | ) |
| | Balance – December 31, 2014 | | | 15,387 | |
| | Change in fair value | | | (11,978 | ) |
| | Balance – December 31, 2015 | | | 3,409 | |
| | Change in fair value | | | (3,409 | ) |
| | Balance – December 31, 2016 | | | - | |
| | Change in fair value | | | - | |
| | Balance – December 31, 2017 | | | - | |
| | Change in fair value | | | - | |
| | Balance – June 30, 2018 | | | - | |
The fair value of warrants was determined using a binomial-lattice model. This model requires the input of highly subjective assumptions, including price volatility of the underlying stock. Changes in the subjective input assumptions can materially affect the estimate of fair value of the warrants and the Company’s results of operations could be impacted. This model is dependent upon several variables such as the instrument’s expected term, expected strike price, expected risk-free interest rate over the expected instrument term, the expected dividend yield rate over the expected instrument term, and the expected volatility of the Company’s stock price over the expected term. The expected term represents the period of time that the instruments granted are expected to be outstanding. The expected strike price is based upon a weighted average probability analysis of the strike price changes expected during the term as a result of the down round protection. The risk-free rates are based on U.S. Treasury securities with similar maturities as the expected terms of the options at the date of valuation. Expected dividend yield is based on historical trends. The Company measures volatility using the volatility rates of market index.
KBS Fashion Group Limited
Notes to Financial Statements
The inputs to the model were as follows:
| | | | June 30,
2018 | | | December 31,
2017 | |
| | Stock price | | $ | 4.87 | | | $ | 4.14 | |
| | Dividend yield | | | N/A | | | | N/A | |
| | Risk-free rate | | | 2.11 | % | | | 1.89 | % |
| | Expected term (in years) | | | 1.08 | | | | 1.58 | |
| | Expected volatility | | | 11.86 | % | | | 22.3 | % |
The quoted price of the warrants on the over-the-counter-markets (“OTC”) were $0.001 and $0.001 as at June 30, 2018 and December 31, 2017, respectively.
At June 30, 2018, there were 393,385 unexpired warrants outstanding.
| 25. | SHARE CAPITAL AND SHARE PREMIUM |
The details of the Group’s share capital are as follows:
| | | | Number of shares | | | Share capital | | | Share premium | |
| | Shares outstanding as December 31, 2017 | | | 1,986,299 | | | $ | 198 | | | $ | 6,686,170 | |
| | Issuance of shares | | | 285,000 | | | | 29 | | | | 1,314,135 | |
| | Shares outstanding as June 30, 2018 | | | 2,271,299 | | | | 227 | | | | 8,000,305 | |
| | | | Number of shares | | | Share capital | | | Share premium | |
| | Authorized Common shares of US$0.0001 as at December 31, 2018 | | | 150,000,000 | | | $ | 15,000 | | | $ | - | |
| | Issue and fully paid common shares of US$0.0001 as at December 31, 2017 | | | 1,986,299 | | | $ | 198 | | | $ | 6,686,170 | |
| | Issue and fully paid common shares of US$0.0001 as at June 30, 2018 | | | 2,271,299 | | | $ | 227 | | | $ | 8,000,305 | |
Preferred Stock
The Company is authorized to issue 5,000,000 preferred shares with a par value of $0.0001 per share with such designation, rights and preferences as may be determined by the Company’s board of directors. No preferred shares are currently issued or outstanding.
Common Stock
The Company is authorized to issue 150,000,000 shares of common stock with a par value of $0.0001 per share.
On March 29, 2016, the Company granted 1,100,000 of common stock to its executive officers and directors as compensation of their past services. The shares were vested immediately. The fair value of the award was calculated on the date of grant using the quoted price of the Company’s common stock. Total expense recognized in connection with this share-based payment amounted to $429,000.
KBS Fashion Group Limited
Notes to Financial Statements
On January 20, 2017, the Company granted and issued 57,600 shares to its employees.
On February 6, 2017, the 1-15 reverse stock split took effect and, as a result, the number of issued and outstanding shares of the Company’s Common Stock is reduced from 26,517,329 shares to approximately 1,767,821 shares. The accompanying financial statements have been retroactively adjusted to reflect the effects of the reverse stock split that occurred after the date of the most recent financial statements.
On July 10, 2017, the Company granted, and subsequently issued, 215,000 shares to its directors. The shares are for services rendered in 2017. The shares are vested immediately upon granting.
On February 10, 2018, the Company granted, and subsequently issued, 285,000 shares to its directors. The shares are for services rendered in 2018. The shares are vested immediately upon granting.
Statutory surplus reserve
As stipulated by the relevant laws and regulations applicable to China’s foreign investment enterprises, the Company’s PRC subsidiaries are required to maintain a statutory surplus reserve which is non-distributable. Appropriations to such reserve are made out of net profit after tax of the statutory financial statements of the PRC subsidiaries at the amounts determined by their respective boards of directors annually up to 50% of authorized capital, but must not be less than 10% of the net profit after tax.
The statutory surplus reserve can be used for making up losses of the group entities in Mainland China, if any. The statutory surplus reserve may also be used to increase capital or to meet unexpected or future losses. The statutory surplus reserve is non-distributable other than upon liquidation.
The statutory surplus reserve of the Group amounts to $6,084,836 and $6,084,836 at June 30, 2018 and December 31, 2017, respectively. The statutory surplus reserve of the Group is related to Hongri Fujian and Anhui Kaixin.
Revaluation reserve
Revaluation reserve is comprised of the surplus or deficit arising from the revaluation of the Company’s fixed assets.
KBS Fashion Group Limited
Notes to Financial Statements
Retained profits
The retained profits comprise the cumulative net gains and losses recognized in the Company’s income statement.
Foreign currency translation reserve (other comprehensive income)
Foreign currency translation reserve represents the foreign currency translation difference arising from the translation of the financial statements of companies within the Group from their functional currency to the Group’s presentation currency.
| 27. | FAIR VALUE MEASUREMENTS |
The fair value of financial assets and financial liabilities is determined in accordance with generally accepted pricing models based on discounted cash flow analysis.
The following table presents the fair value of the Group’s financial instruments measured at the end of the reporting period on a recurring basis, categorized into the three-level fair value hierarchy as defined in IFRS 13, Fair Value Measurement. The level into which a fair value measurement is classified is determined with reference to the observability and significance of the inputs used in the valuation technique as follows:
| - | Level 1 valuations: Fair value measured using only Level 1 inputs i.e. unadjusted quoted prices in active markets for identical assets or liabilities at the measurement date. |
| - | Level 2 valuations: Fair value measured using Level 2 inputs i.e. observable inputs which fail to meet Level 1, and not using significant unobservable inputs. Unobservable inputs are inputs for which market data are not available. |
| - | Level 3 valuations: Fair value measured using significant unobservable inputs. |
| | | | June 30,
2018
Level 2 | | | December 31,
2017
Level 2 | |
| | Recurring far value measurements Liabilities: | | | | | | | | |
| | Warrant liabilities | | | - | | | | - | |
| | | | | - | | | | - | |
During the six months ended June 30, 2018 and the year ended December 31, 2017, there were no transfers between Level 1 and Level 2, or transfers into or out of Level 3. The Group’s policy is to recognize transfers between levels of fair value hierarchy as at the end of the reporting period in which they occur.
Valuation techniques and inputs used in Level 2 fair value measurements
The fair value of financial assets in Level 2 is determined by the model as disclosed in note 24.
The directors of the Company consider that the carrying amounts of financial assets and financial liabilities recorded at amortized cost approximate their fair values.
| 28. | COMMITMENTS AND CONTINGENCIES |
| (1) | The Company had the following capital commitments in respect of the construction of plant and equipment which were contracted but not provided for in the financial statements: |
| | | | As at
June 30,
2018 | | | As at
December 31,
2017 | |
| | Contracted and authorized, in RMB | | | 439,850,378 | | | | 439,850,378 | |
| | Contracted and authorized, in USD | | | 66,476,797 | | | | 67,315,108 | |
KBS Fashion Group Limited
Notes to Financial Statements
| (2) | As at December 31, 2017, the Company had lease commitments as follows: |
| | | | As at December 31, | |
| | | | As at
June 30,
2018 | | | As at
December 31,
2017 | |
| | Within 1 year | | | 87,850 | | | | 108,695 | |
| | 2-5 years | | | 228,259 | | | | 231,138 | |
| | Thereafter | | | 2,269,913 | | | | 2,337,061 | |
| | | | | 2,586,022 | | | | 2,676,894 | |
The amount of $87,850 as of June 30, 2018 represents leases of two offices, four units of staff quarters, and one warehouse. There is no contingent rent payable for all of the leases. All leases are within one year except for one of the offices, which is leased by a related party as disclosed in note 30. The commitment pertains to this particular lease is as follows:
| | | | As at December 31, | |
| | | | As at
June 30,
2018 | | | As at
December 31,
2017 | |
| | Within 1 year | | | 76,086 | | | | 77,046 | |
| | 2-5 years | | | 228,259 | | | | 231,138 | |
| | Thereafter | | | 2,269,913 | | | | 2,337,061 | |
| | | | | 2,574,259 | | | | 2,645,245 | |
The Company has prepaid this lease in the full amount. The lease commenced on January 1, 2009 and will expire on April 22, 2052. The lease does not specify the terms of renewal, purchase options, or escalation clauses. The Company may not sublease the office to a third party.
| 29. | EVENTS AFTER THE BALANCE SHEET |
The Company has evaluated subsequent events through the issuance of the condensed consolidated financial statements and no subsequent events were identified that required adjustment to the disclosure in the condensed consolidated financial statements.
* * * * *