UNITED STATES
SECURITIES AND EXCHANGE COMMISSION
Washington, D.C. 20549
FORM N-CSR
CERTIFIED SHAREHOLDER REPORT OF REGISTERED
MANAGEMENT INVESTMENT COMPANIES
Investment Company Act file number 811-22954
HIMCO VARIABLE INSURANCE TRUST
(Exact name of registrant as specified in charter)
One Hartford Plaza, Hartford, Connecticut 06155
(Address of principal executive offices) (Zip code)
Brenda J. Page
Hartford Investment Management Company
One Hartford Plaza
Hartford, Connecticut 06155
(Name and address of agent for service)
Registrant’s telephone number, including area code: (860) 297-6444
Date of fiscal year end: December 31
Date of reporting period: December 31, 2014
Form N-CSR is to be used by management investment companies to file reports with the Commission not later than 10 days after the transmission to stockholders of any report that is required to be transmitted to stockholders under Rule 30e-1 under the Investment Company Act of 1940 (17 CFR 270.30e-1). The Commission may use the information provided on Form N-CSR in its regulatory, disclosure review, inspection, and policymaking roles.
A registrant is required to disclose the information specified by Form N-CSR, and the Commission will make this information public. A registrant is not required to respond to the collection of information contained in Form N-CSR unless the Form displays a currently valid Office of Management and Budget (“OMB”) control number. Please direct comments concerning the accuracy of the information collection burden estimate and any suggestions for reducing the burden to Secretary, Securities and Exchange Commission, 450 Fifth Street, NW, Washington, DC 20549-0609. The OMB has reviewed this collection of information under the clearance requirements of 44 U.S.C. § 3507.
Item 1. Reports to Stockholders.

A MESSAGE FROM THE PRESIDENT
Dear Shareholders:
Thank you for investing in the HIMCO Variable Insurance Trust (HVIT) funds.
Market Review
U.S. equity and bond markets continued to perform well in 2014. U.S. equities (as represented by the S&P 500 Index1) rose 13.69% for the year, while U.S. bonds (as
represented by the Barclays U.S. Aggregate Bond Index2) rose 5.97%. International markets did not fare as well.
The S&P 500 Index ended the year slightly below its all-time high reached on December 29, 2014. Solid corporate earnings and encouraging U.S. macroeconomic data overcame geopolitical tensions and reduced prospects for growth outside the U.S. The U.S. unemployment rate fell during the year to 5.6%, the lowest level since June 2008. On average nearly 250,000 new jobs were created every month in 2014, 50,000 more per month than in 2013. In the third quarter of 2014, gross domestic product, the most recognized measure of economic growth, rose 5%. The price of a barrel of oil fell nearly 50% during the second half of the year, driving down gasoline prices and providing a lift to consumer spending.
U.S. bond prices benefited from continued low interest rates (bond prices move in the opposite direction of interest rates). Many market participants expected rates to increase as the economy improved and the U.S. Federal Reserve ended quantitative easing. However, sub-par growth in the eurozone and Japan, combined with diminished growth in China, have helped dampen interest rates. Central bankers outside the U.S. are engaging in quantitative easing programs to help stimulate growth, but these moves may also further lower local interest rates and thus increase demand for higher yielding U.S. Treasuries. Weaker growth in the rest of the world may also slow U.S. growth. These outcomes could help keep U.S. interest rates lower for longer.
Looking ahead to 2015, we expect the pace of U.S. growth relative to other economies, along with the actions of central bankers around the world, to be themes of keen interest to investors.
Preparation for whatever markets may deliver is no easy task, and that is why you should consider regular reviews with your financial advisor.
Thank you again for investing with the HIMCO Variable Insurance Trust funds.

Matthew J. Poznar,
President, HVIT
| 1 | The S&P 500 Index is a market capitalization-weighted price index composed of 500 widely held common stocks. |
| 2 | The Barclays U.S. Aggregate Bond Index is an unmanaged index and is composed of securities from the Barclays Government/Credit Bond Index, Mortgage-Backed Securities Index, Asset-Backed Securities Index and Commercial Mortgage-Backed Securities Index. |
HIMCO VIT Index Fund
Table of Contents
This report is prepared for the general information of variable annuity and variable life contract owners and qualified retirement plan participants. It is not an offer of contracts or of qualified retirement plans. It should not be used in connection with any offer, except in conjunction with the appropriate product prospectus which contains all pertinent information including the applicable sales, administrative and other charges.
The views expressed in the Fund’s Manager Discussion under “Why did the Fund perform this way?” and “What is the outlook?” are views of the Fund’s adviser and portfolio management team through the end of the period and are subject to change based on market and other conditions. The Fund’s Manager Discussion is for informational purposes only and does not represent an offer, recommendation or solicitation to buy, hold or sell any security. The specific securities identified and described, if any, do not represent all of the securities purchased or sold and you should not assume that investments in the securities identified and discussed will be profitable.
HIMCO VIT Index Fund inception 05/01/1987
| | |
(Effective October 20, 2014, Hartford Index HLS Fund (the “Predecessor Fund”) was reorganized into HIMCO VIT Index Fund (the “Fund”).) (The Fund is advised by Hartford Investment Management Company (“Hartford Investment Management”)) | | Investment objective – The Fund seeks to provide investment results which approximate the price and yield performance of publicly traded common stocks in the aggregate. |
Performance information for periods prior to October 20, 2014 is that of the Predecessor Fund. Hartford Funds Management Company, LLC served as the investment manager to the Predecessor Fund and Hartford Investment Management, the Fund’s adviser, served as sub-adviser to the Predecessor Fund. The Predecessor Fund had the same investment objective and strategies as the Fund.
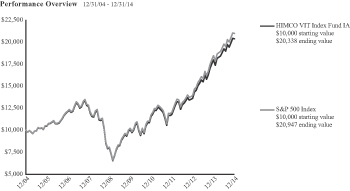
The chart above represents the hypothetical growth of a $10,000 investment in Class IA. Growth results in classes other than Class IA will vary from what is seen above due to differences in the expenses charged to those share classes.
Average Annual Total Returns (as of 12/31/14)
| | | | | | | | | | | | |
| | | 1 Year | | | 5 Years | | | 10 Years | |
HIMCO VIT Index Class IA | | | 13.33% | | | | 15.10% | | | | 7.36% | |
HIMCO VIT Index Class IB | | | 13.01% | | | | 14.81% | | | | 7.10% | |
S&P 500 Index | | | 13.69% | | | | 15.45% | | | | 7.67% | |
PERFORMANCE DATA QUOTED REPRESENTS PAST PERFORMANCE AND DOES NOT GUARANTEE FUTURE RESULTS. The investment return and principal value of the investment will fluctuate so that investors’ shares, when redeemed, may be worth more or less than their original cost. Current performance may be lower or higher than the performance data quoted.
Total returns presented above were calculated using the Fund’s net asset value available to shareholders for sale or redemption of Fund shares on December 31, 2014, which may exclude investment transactions as of this date. All share class returns assume the reinvestment of all distributions at net asset value and the deduction of all fund expenses.
S&P 500 Index is a market capitalization-weighted price index composed of 500 widely held common stocks.
The index is unmanaged, and its results include reinvested dividends and/or distributions, but do not reflect the effect of sales charges, commissions, expenses or taxes.
You cannot invest directly in an index.
| | | | | | | | |
| Operating Expenses* | | Net | | | Gross | |
HIMCO VIT Index Class IA | | | 0.33% | | | | 0.35% | |
HIMCO VIT Index Class IB | | | 0.58% | | | | 0.60% | |
| * | As shown in the Fund’s current prospectus dated October 20, 2014. Actual expenses may be higher or lower. Please see the accompanying Financial Highlights for expense ratios for the year ended December 31, 2014. |
Gross expenses are the Fund’s total annual operating expenses shown in the Fund’s most recent prospectus. Net expenses are the Fund’s total annual operating expenses shown in the Fund’s most recent prospectus and reflect contractual expense reimbursements in instances when these
reductions reduce the Fund’s gross expenses. Contractual reimbursements remain in effect until April 30, 2016, and shall renew automatically for one-year terms unless the adviser provides written notice of termination prior to the start of the next term or upon approval of the Board of Trustees of the Fund.
The chart and table do not reflect the deductions of taxes, sales charges or other fees which may be applied at the variable life insurance, variable annuity or qualified retirement plan product level. Any such additional sales charges or other fees or expenses would lower the contract’s or plan’s performance.
The S&P 500 Index is a product of S&P Dow Jones Indices LLC (“SPDJI”), and has been licensed for use by HIMCO Variable Insurance Trust. Standard & Poor’s® and S&P® are registered trademarks of Standard & Poor’s Financial Services LLC (“S&P”); Dow Jones® is a registered trademark of Dow Jones Trademark Holdings LLC (“Dow Jones”); and these trademarks have been licensed for use by SPDJI and sublicensed for certain purposes by HIMCO Variable Insurance Trust. The Fund is not sponsored, endorsed, sold or promoted by SPDJI, Dow Jones, S&P, their respective affiliates, and none of such parties make any representation regarding the advisability of investing in such product(s) nor do they have any liability for any errors, omissions, or interruptions of the S&P 500 Index.
All investments are subject to risk including the possible loss of principal. The primary risks of investing in the Fund are described below. For more detailed information on the risks associated with an investment in the Fund, please see the prospectus.
Market, Selection and Strategy Risk: The Fund’s share price may fluctuate due to market risk and/or security selections that may underperform the market or relevant benchmarks. If the investment strategy does not perform as expected, the Fund could underperform its peers or lose money. There is no guarantee the Fund will achieve its stated objective.
Passive Management Risk: The Fund is not actively managed, and will generally remain fully invested even when stock prices are falling.
Index Tracking Risk: The Fund’s performance may not match or correlate to that of its index, which may cause the Fund’s performance to be lower than expected.
Manager Discussion
December 31, 2014 (Unaudited)
Portfolio Manager
Paul Bukowski, CFA
Executive Vice President and Head of Quantitative Equities
Edward Caputo, CFA
Senior Vice President
How did the Fund perform?
The Class IA shares of the HIMCO VIT Index Fund (the “Fund”) returned 13.33% for the 12-month period ending December 31, 2014. The Fund performed very closely to its benchmark, the S&P 500 Index, which returned 13.69%.1
Why did the Fund perform this way?
By design, the Fund is managed to mimic the performance of the S&P 500 Index and is expected to perform in line with the index. However, we do not purchase the stock of our parent, The Hartford Financial Services Group, Inc. (HIG). This exposure to HIG is reallocated across the life/health, property/casualty and multi-line insurance industries. The performance of the Fund tends to marginally differ from the benchmark, primarily due to trading in futures contracts, index events, minimal cash exposure, and lack of exposure to HIG.
Nine of the 10 sectors (as defined by GICS) within the index had positive returns for the year 2014. Utilities and health care led the way, gaining 28.9% and 25.3%, respectively, as investors looked for yield and turned defensive. The only sector that produced negative return was energy, which lost 7.8%.
On a stock level, the leading constituents in the S&P 500 Index for 2014 were Southwest Airlines Co., which rallied 126.3%, followed by Electronic Arts Inc., which gained 104.9%. Edwards Lifesciences Corp. rounded out the top three, finishing up 93.7%. Laggards for the period included the energy sector’s Transocean Ltd., which fell 59.9%, and Denbury Resources Inc., which dropped 49.6%.
What is the outlook?
The Fund will continue to invest in the S&P 500 Index with a focus on risk control and efficient trading. Performance of the Fund is expected to be similar to that of the index.
Turning the calendar to 2015, we believe that fundamentals are still positive as balance sheets hold ample cash positions and earnings growth is driven by moderate sales. Valuations appear to be neutral, with levels above long-term averages but consistent with the current rate environment and business/growth cycle. We expect volatility to trend higher in 2015 as
pending rate hikes, the conclusion of Quantitative Easing III at the end of October 2014, and softness in European economies increase market uncertainty. Our 2015 year-end price target for the S&P 500 Index is 2080, which represents a low single-digit price return for the year, largely driven by earnings/revenue growth.
Possible risks to our outlook include commodity volatility, heightened geopolitical tensions, the potential for surprises in rate guidance, global monetary policy and unexpected weakness in economic indicators.
Diversification by Sector
as of December 31, 2014
| | | | |
| Sector | | Percentage of
Net Assets | |
Equity Securities | | | | |
Consumer Discretionary | | | 12.1 | % |
Consumer Staples | | | 9.8 | |
Energy | | | 8.4 | |
Financials | | | 16.6 | |
Health Care | | | 14.1 | |
Industrials | | | 10.4 | |
Information Technology | | | 19.5 | |
Materials | | | 3.2 | |
Telecommunication Services | | | 2.3 | |
Utilities | | | 3.2 | |
| | | | |
Total | | | 99.6 | % |
| | | | |
Short-Term Investments | | | 0.5 | |
Other assets and liabilities | | | (0.1 | ) |
| | | | |
Total | | | 100.0 | % |
| | | | |
A sector may be comprised of several industries. For Fund compliance purposes, the Fund may not use the same classification system and these sector classifications are used for reporting ease.
Schedule of Investments
December 31, 2014
| | | | | | | | |
Shares or Principal Amount | | Market Value(1) | |
| COMMON STOCKS - 99.6% | |
| | | | Automobiles & Components - 1.1% | |
| | 15,176 | | | BorgWarner, Inc. | | $ | 833,921 | |
| | 19,850 | | | Delphi Automotive plc | | | 1,443,492 | |
| | 258,395 | | | Ford Motor Co. | | | 4,005,122 | |
| | 90,650 | | | General Motors Co. | | | 3,164,592 | |
| | 18,449 | | | Goodyear Tire & Rubber Co. (The) | | | 527,088 | |
| | 14,389 | | | Harley-Davidson, Inc. | | | 948,379 | |
| | 44,762 | | | Johnson Controls, Inc. | | | 2,163,795 | |
| | | | | | | | |
| | | | | | | 13,086,389 | |
| | | | | | | | |
| | | | Banks - 6.1% | |
| | 705,808 | | | Bank of America Corp. | | | 12,626,905 | |
| | 48,167 | | | BB&T Corp. | | | 1,873,215 | |
| | 203,397 | | | Citigroup, Inc. | | | 11,005,812 | |
| | 12,014 | | | Comerica, Inc. | | | 562,736 | |
| | 54,972 | | | Fifth Third Bancorp | | | 1,120,054 | |
| | 31,586 | | | Hudson City Bancorp, Inc. | | | 319,650 | |
| | 54,040 | | | Huntington Bancshares, Inc. | | | 568,501 | |
| | 250,859 | | | JPMorgan Chase & Co. | | | 15,698,756 | |
| | 57,925 | | | KeyCorp | | | 805,158 | |
| | 8,786 | | | M&T Bank Corp. | | | 1,103,697 | |
| | 19,754 | | | People’s United Financial, Inc. | | | 299,866 | |
| | 35,329 | | | PNC Financial Services Group, Inc. (The) | | | 3,223,065 | |
| | 92,263 | | | Regions Financial Corp. | | | 974,297 | |
| | 34,885 | | | SunTrust Banks, Inc. | | | 1,461,681 | |
| | 120,014 | | | US Bancorp | | | 5,394,629 | |
| | 316,635 | | | Wells Fargo & Co. | | | 17,357,931 | |
| | 13,498 | | | Zions BanCorp. | | | 384,828 | |
| | | | | | | | |
| | | | | | | 74,780,781 | |
| | | | | | | | |
| | | | Capital Goods - 7.5% | |
| | 43,003 | | | 3M Co. | | | 7,066,253 | |
| | 6,450 | | | Allegion plc | | | 357,717 | |
| | 16,400 | | | AMETEK, Inc. | | | 863,132 | |
| | 44,455 | | | Boeing Co. (The) | | | 5,778,261 | |
| | 40,687 | | | Caterpillar, Inc. | | | 3,724,081 | |
| | 11,451 | | | Cummins, Inc. | | | 1,650,891 | |
| | 41,038 | | | Danaher Corp. | | | 3,517,367 | |
| | 23,998 | | | Deere & Co. | | | 2,123,103 | |
| | 11,030 | | | Dover Corp. | | | 791,072 | |
| | 31,862 | | | Eaton Corp. plc | | | 2,165,342 | |
| | 46,549 | | | Emerson Electric Co. | | | 2,873,470 | |
| | 18,282 | | | Fastenal Co. | | | 869,492 | |
| | 9,119 | | | Flowserve Corp. | | | 545,590 | |
| | 10,546 | | | Fluor Corp. | | | 639,404 | |
| | 21,147 | | | General Dynamics Corp. | | | 2,910,250 | |
| | 673,776 | | | General Electric Co. | | | 17,026,319 | |
| | 52,580 | | | Honeywell International, Inc. | | | 5,253,794 | |
| | 24,090 | | | Illinois Tool Works, Inc. | | | 2,281,323 | |
| | 17,802 | | | Ingersoll-Rand plc | | | 1,128,469 | |
| | 8,665 | | | Jacobs Engineering Group, Inc.(2) | | | 387,239 | |
| | 6,660 | | | Joy Global, Inc. | | | 309,823 | |
| | 5,668 | | | L-3 Communications Holdings, Inc. | | | 715,358 | |
| | 18,043 | | | Lockheed Martin Corp. | | | 3,474,540 | |
| | 23,940 | | | Masco Corp. | | | 603,288 | |
| | 13,607 | | | Northrop Grumman Corp. | | | 2,005,536 | |
| | 23,725 | | | PACCAR, Inc. | | | 1,613,537 | |
| | 7,066 | | | Pall Corp. | | | 715,150 | |
| | 10,034 | | | Parker-Hannifin Corp. | | | 1,293,884 | |
| | 12,466 | | | Pentair plc | | | 827,992 | |
| | 9,599 | | | Precision Castparts Corp. | | | 2,312,207 | |
| | 14,606 | | | Quanta Services, Inc.(2) | | | 414,664 | |
| | | | | | | | |
Shares or Principal Amount | | Market Value(1) | |
| COMMON STOCKS - 99.6% - (continued) | |
| | | | Capital Goods - 7.5% - (continued) | |
| | 20,662 | | | Raytheon Co. | | $ | 2,235,009 | |
| | 9,120 | | | Rockwell Automation, Inc. | | | 1,014,144 | |
| | 8,834 | | | Rockwell Collins, Inc. | | | 746,296 | |
| | 6,632 | | | Roper Industries, Inc. | | | 1,036,913 | |
| | 3,860 | | | Snap-on, Inc. | | | 527,816 | |
| | 10,525 | | | Stanley Black & Decker, Inc. | | | 1,011,242 | |
| | 18,527 | | | Textron, Inc. | | | 780,172 | |
| | 6,700 | | | United Rentals, Inc.(2) | | | 683,467 | |
| | 56,866 | | | United Technologies Corp. | | | 6,539,590 | |
| | 4,065 | | | WW Grainger, Inc. | | | 1,036,128 | |
| | 12,159 | | | Xylem, Inc. | | | 462,893 | |
| | | | | | | | |
| | | | | | | 92,312,218 | |
| | | | | | | | |
| | | | Commercial & Professional Services - 0.7% | |
| | 11,714 | | | ADT Corp. (The) | | | 424,398 | |
| | 6,424 | | | Cintas Corp. | | | 503,899 | |
| | 2,402 | | | Dun & Bradstreet Corp. (The) | | | 290,546 | |
| | 8,030 | | | Equifax, Inc. | | | 649,386 | |
| | 12,624 | | | Iron Mountain, Inc., REIT | | | 488,044 | |
| | 21,600 | | | Nielsen N.V. | | | 966,168 | |
| | 13,585 | | | Pitney Bowes, Inc. | | | 331,066 | |
| | 16,766 | | | Republic Services, Inc. | | | 674,831 | |
| | 9,092 | | | Robert Half International, Inc. | | | 530,791 | |
| | 5,591 | | | Stericycle, Inc.(2) | | | 732,868 | |
| | 28,028 | | | Tyco International plc | | | 1,229,308 | |
| | 28,436 | | | Waste Management, Inc. | | | 1,459,336 | |
| | | | | | | | |
| | | | | | | 8,280,641 | |
| | | | | | | | |
| | | | Consumer Durables & Apparel - 1.4% | |
| | 18,447 | | | Coach, Inc. | | | 692,869 | |
| | 22,377 | | | DR Horton, Inc. | | | 565,914 | |
| | 3,000 | | | Fossil Group, Inc.(2) | | | 332,220 | |
| | 8,050 | | | Garmin Ltd. | | | 425,282 | |
| | 4,609 | | | Harman International Industries, Inc. | | | 491,826 | |
| | 7,537 | | | Hasbro, Inc. | | | 414,460 | |
| | 9,156 | | | Leggett & Platt, Inc. | | | 390,137 | |
| | 11,983 | | | Lennar Corp., Class A | | | 536,958 | |
| | 22,742 | | | Mattel, Inc. | | | 703,751 | |
| | 13,800 | | | Michael Kors Holdings Ltd.(2) | | | 1,036,380 | |
| | 4,200 | | | Mohawk Industries, Inc.(2) | | | 652,512 | |
| | 18,069 | | | Newell Rubbermaid, Inc. | | | 688,248 | |
| | 46,848 | | | NIKE, Inc., Class B | | | 4,504,435 | |
| | 22,499 | | | PulteGroup, Inc. | | | 482,829 | |
| | 5,500 | | | PVH Corp. | | | 704,935 | |
| | 4,086 | | | Ralph Lauren Corp. | | | 756,564 | |
| | 11,200 | | | Under Armour, Inc., Class A(2) | | | 760,480 | |
| | 23,176 | | | VF Corp. | | | 1,735,882 | |
| | 5,213 | | | Whirlpool Corp. | | | 1,009,967 | |
| | | | | | | | |
| | | | | | | 16,885,649 | |
| | | | | | | | |
| | | | Consumer Services - 1.7% | |
| | 30,280 | | | Carnival Corp. | | | 1,372,592 | |
| | 2,111 | | | Chipotle Mexican Grill, Inc.(2) | | | 1,445,001 | |
| | 8,900 | | | Darden Restaurants, Inc. | | | 521,807 | |
| | 18,468 | | | H&R Block, Inc. | | | 622,002 | |
| | 14,292 | | | Marriott International, Inc., Class A | | | 1,115,205 | |
| | 65,275 | | | McDonald’s Corp. | | | 6,116,267 | |
| | 11,200 | | | Royal Caribbean Cruises Ltd. | | | 923,216 | |
| | 50,183 | | | Starbucks Corp. | | | 4,117,515 | |
| | 11,965 | | | Starwood Hotels & Resorts Worldwide, Inc. | | | 970,003 | |
| | 8,291 | | | Wyndham Worldwide Corp. | | | 711,036 | |
The accompanying notes are an integral part of these financial statements.
Schedule of Investments – (continued)
December 31, 2014
| | | | | | | | |
Shares or Principal Amount | | Market Value(1) | |
| COMMON STOCKS - 99.6% - (continued) | |
| | | | Consumer Services - 1.7% - (continued) | |
| | 5,427 | | | Wynn Resorts Ltd. | | $ | 807,321 | |
| | 29,371 | | | Yum! Brands, Inc. | | | 2,139,677 | |
| | | | | | | | |
| | | | 20,861,642 | |
| | | | | | | | |
| | | | Diversified Financials - 5.3% | |
| | 3,700 | | | Affiliated Managers Group, Inc.(2) | | | 785,288 | |
| | 59,726 | | | American Express Co. | | | 5,556,907 | |
| | 12,390 | | | Ameriprise Financial, Inc. | | | 1,638,577 | |
| | 75,590 | | | Bank of New York Mellon Corp. (The) | | | 3,066,686 | |
| | 122,249 | | | Berkshire Hathaway, Inc., Class B(2) | | | 18,355,687 | |
| | 8,568 | | | BlackRock, Inc. | | | 3,063,574 | |
| | 37,290 | | | Capital One Financial Corp. | | | 3,078,289 | |
| | 77,183 | | | Charles Schwab Corp. (The) | | | 2,330,155 | |
| | 21,140 | | | CME Group, Inc. | | | 1,874,061 | |
| | 30,469 | | | Discover Financial Services | | | 1,995,415 | |
| | 19,252 | | | E*TRADE Financial Corp.(2) | | | 466,957 | |
| | 26,318 | | | Franklin Resources, Inc. | | | 1,457,228 | |
| | 27,204 | | | Goldman Sachs Group, Inc. (The) | | | 5,272,951 | |
| | 7,565 | | | Intercontinental Exchange, Inc. | | | 1,658,929 | |
| | 28,823 | | | Invesco Ltd. | | | 1,139,085 | |
| | 6,729 | | | Legg Mason, Inc. | | | 359,127 | |
| | 21,178 | | | Leucadia National Corp. | | | 474,811 | |
| | 18,241 | | | McGraw Hill Financial, Inc. | | | 1,623,084 | |
| | 12,364 | | | Moody’s Corp. | | | 1,184,595 | |
| | 102,496 | | | Morgan Stanley | | | 3,976,845 | |
| | 7,829 | | | NASDAQ OMX Group, Inc. (The) | | | 375,479 | |
| | 27,400 | | | Navient Corp. | | | 592,114 | |
| | 14,767 | | | Northern Trust Corp. | | | 995,296 | |
| | 28,068 | | | State Street Corp. | | | 2,203,338 | |
| | 17,358 | | | T Rowe Price Group, Inc. | | | 1,490,358 | |
| | | | | | | | |
| | | | 65,014,836 | |
| | | | | | | | |
| | | | Energy - 8.4% | |
| | 33,967 | | | Anadarko Petroleum Corp. | | | 2,802,277 | |
| | 25,308 | | | Apache Corp. | | | 1,586,052 | |
| | 29,031 | | | Baker Hughes, Inc. | | | 1,627,768 | |
| | 27,518 | | | Cabot Oil & Gas Corp. | | | 814,808 | |
| | 13,238 | | | Cameron International Corp.(2) | | | 661,238 | |
| | 34,936 | | | Chesapeake Energy Corp. | | | 683,698 | |
| | 126,813 | | | Chevron Corp. | | | 14,225,882 | |
| | 5,900 | | | Cimarex Energy Co. | | | 625,400 | |
| | 82,620 | | | ConocoPhillips | | | 5,705,737 | |
| | 15,425 | | | CONSOL Energy, Inc. | | | 521,519 | |
| | 23,993 | | | Denbury Resources, Inc. | | | 195,063 | |
| | 25,813 | | | Devon Energy Corp. | | | 1,580,014 | |
| | 4,528 | | | Diamond Offshore Drilling, Inc. | | | 166,223 | |
| | 15,750 | | | Ensco plc, Class A | | | 471,713 | |
| | 36,756 | | | EOG Resources, Inc. | | | 3,384,125 | |
| | 10,141 | | | EQT Corp. | | | 767,674 | |
| | 283,930 | | | Exxon Mobil Corp. | | | 26,249,328 | |
| | 15,603 | | | FMC Technologies, Inc.(2) | | | 730,845 | |
| | 56,957 | | | Halliburton Co. | | | 2,240,119 | |
| | 7,288 | | | Helmerich & Payne, Inc. | | | 491,357 | |
| | 17,096 | | | Hess Corp. | | | 1,262,027 | |
| | 113,971 | | | Kinder Morgan, Inc. | | | 4,822,113 | |
| | 45,367 | | | Marathon Oil Corp. | | | 1,283,432 | |
| | 18,783 | | | Marathon Petroleum Corp. | | | 1,695,354 | |
| | 11,172 | | | Murphy Oil Corp. | | | 564,409 | |
| | 19,526 | | | Nabors Industries Ltd. | | | 253,447 | |
| | 28,833 | | | National Oilwell Varco, Inc. | | | 1,889,426 | |
| | 9,329 | | | Newfield Exploration Co.(2) | | | 253,002 | |
| | | | | | | | |
Shares or Principal Amount | | Market Value(1) | |
| COMMON STOCKS - 99.6% - (continued) | |
| | | | Energy - 8.4% - (continued) | |
| | 17,058 | | | Noble Corp. plc | | $ | 282,651 | |
| | 24,120 | | | Noble Energy, Inc. | | | 1,144,012 | |
| | 52,026 | | | Occidental Petroleum Corp. | | | 4,193,816 | |
| | 13,984 | | | ONEOK, Inc. | | | 696,263 | |
| | 37,110 | | | Phillips 66 | | | 2,660,787 | |
| | 9,987 | | | Pioneer Natural Resources Co. | | | 1,486,565 | |
| | 11,217 | | | QEP Resources, Inc. | | | 226,808 | |
| | 11,162 | | | Range Resources Corp. | | | 596,609 | |
| | 86,312 | | | Schlumberger Ltd. | | | 7,371,908 | |
| | 23,569 | | | Southwestern Energy Co.(2) | | | 643,198 | |
| | 44,872 | | | Spectra Energy Corp. | | | 1,628,854 | |
| | 8,420 | | | Tesoro Corp. | | | 626,027 | |
| | 23,044 | | | Transocean Ltd. | | | 422,397 | |
| | 35,004 | | | Valero Energy Corp. | | | 1,732,698 | |
| | 45,157 | | | Williams Cos., Inc. (The) | | | 2,029,356 | |
| | | | | | | | |
| | | | 103,295,999 | |
| | | | | | | | |
| | | | Food & Staples Retailing - 2.5% | |
| | 29,282 | | | Costco Wholesale Corp. | | | 4,150,723 | |
| | 76,902 | | | CVS Health Corp. | | | 7,406,432 | |
| | 32,964 | | | Kroger Co. (The) | | | 2,116,618 | |
| | 15,313 | | | Safeway, Inc. | | | 537,793 | |
| | 39,143 | | | Sysco Corp. | | | 1,553,586 | |
| | 105,861 | | | Wal-Mart Stores, Inc. | | | 9,091,343 | |
| | 58,296 | | | Walgreens Boot Allliance, Inc. | | | 4,442,155 | |
| | 24,072 | | | Whole Foods Market, Inc. | | | 1,213,710 | |
| | | | | | | | |
| | | | 30,512,360 | |
| | | | | | | | |
| | | | Food, Beverage & Tobacco - 5.2% | |
| | 132,648 | | | Altria Group, Inc. | | | 6,535,567 | |
| | 43,213 | | | Archer-Daniels-Midland Co. | | | 2,247,076 | |
| | 10,433 | | | Brown-Forman Corp., Class B | | | 916,435 | |
| | 11,895 | | | Campbell Soup Co. | | | 523,380 | |
| | 264,344 | | | Coca-Cola Co. (The) | | | 11,160,604 | |
| | 14,852 | | | Coca-Cola Enterprises, Inc. | | | 656,755 | |
| | 28,434 | | | ConAgra Foods, Inc. | | | 1,031,586 | |
| | 11,253 | | | Constellation Brands, Inc., Class A(2) | | | 1,104,707 | |
| | 13,062 | | | Dr Pepper Snapple Group, Inc. | | | 936,284 | |
| | 40,387 | | | General Mills, Inc. | | | 2,153,839 | |
| | 9,876 | | | Hershey Co. (The) | | | 1,026,413 | |
| | 8,999 | | | Hormel Foods Corp. | | | 468,848 | |
| | 6,759 | | | JM Smucker Co. (The) | | | 682,524 | |
| | 16,752 | | | Kellogg Co. | | | 1,096,251 | |
| | 8,200 | | | Keurig Green Mountain, Inc. | | | 1,085,639 | |
| | 39,443 | | | Kraft Foods Group, Inc. | | | 2,471,498 | |
| | 24,050 | | | Lorillard, Inc. | | | 1,513,707 | |
| | 8,521 | | | McCormick & Co., Inc. | | | 633,110 | |
| | 13,506 | | | Mead Johnson Nutrition Co. | | | 1,357,893 | |
| | 10,683 | | | Molson Coors Brewing Co., Class B | | | 796,097 | |
| | 112,730 | | | Mondelez International, Inc., Class A | | | 4,094,917 | |
| | 9,700 | | | Monster Beverage Corp.(2) | | | 1,050,995 | |
| | 100,409 | | | PepsiCo, Inc. | | | 9,494,675 | |
| | 104,226 | | | Philip Morris International, Inc. | | | 8,489,208 | |
| | 20,620 | | | Reynolds American, Inc. | | | 1,325,247 | |
| | 19,583 | | | Tyson Foods, Inc., Class A | | | 785,082 | |
| | | | | | | | |
| | | | 63,638,337 | |
| | | | | | | | |
| | | | Health Care Equipment & Services - 4.6% | |
| | 100,995 | | | Abbott Laboratories | | | 4,546,795 | |
| | 23,638 | | | Aetna, Inc. | | | 2,099,764 | |
| | 13,858 | | | AmerisourceBergen Corp. | | | 1,249,437 | |
| | 18,155 | | | Anthem, Inc. | | | 2,281,539 | |
The accompanying notes are an integral part of these financial statements.
Schedule of Investments – (continued)
December 31, 2014
| | | | | | | | |
Shares or Principal Amount | | Market Value(1) | |
| COMMON STOCKS - 99.6% - (continued) | |
| | | | Health Care Equipment & Services - 4.6% - (continued) | |
| | 36,325 | | | Baxter International, Inc. | | $ | 2,662,259 | |
| | 12,898 | | | Becton Dickinson and Co. | | | 1,794,886 | |
| | 89,018 | | | Boston Scientific Corp.(2) | | | 1,179,489 | |
| | 22,177 | | | Cardinal Health, Inc. | | | 1,790,349 | |
| | 13,647 | | | CareFusion Corp.(2) | | | 809,813 | |
| | 20,362 | | | Cerner Corp.(2) | | | 1,316,607 | |
| | 17,498 | | | Cigna Corp. | | | 1,800,719 | |
| | 30,369 | | | Covidien plc | | | 3,106,141 | |
| | 5,012 | | | CR Bard, Inc. | | | 835,099 | |
| | 11,436 | | | DaVita HealthCare Partners, Inc.(2) | | | 866,163 | |
| | 9,385 | | | DENTSPLY International, Inc. | | | 499,939 | |
| | 7,209 | | | Edwards Lifesciences Corp.(2) | | | 918,282 | |
| | 49,225 | | | Express Scripts Holding Co.(2) | | | 4,167,881 | |
| | 10,297 | | | Humana, Inc. | | | 1,478,958 | |
| | 2,453 | | | Intuitive Surgical, Inc.(2) | | | 1,297,490 | |
| | 5,596 | | | Laboratory Corp. of America Holdings(2) | | | 603,808 | |
| | 15,573 | | | McKesson Corp. | | | 3,232,643 | |
| | 66,107 | | | Medtronic, Inc. | | | 4,772,925 | |
| | 5,605 | | | Patterson Cos., Inc. | | | 269,601 | |
| | 9,669 | | | Quest Diagnostics, Inc. | | | 648,403 | |
| | 19,187 | | | St Jude Medical, Inc. | | | 1,247,731 | |
| | 20,086 | | | Stryker Corp. | | | 1,894,712 | |
| | 6,613 | | | Tenet Healthcare Corp.(2) | | | 335,081 | |
| | 64,413 | | | UnitedHealth Group, Inc. | | | 6,511,510 | |
| | 6,100 | | | Universal Health Services, Inc., Class B | | | 678,686 | |
| | 6,552 | | | Varian Medical Systems, Inc.(2) | | | 566,814 | |
| | 11,345 | | | Zimmer Holdings, Inc. | | | 1,286,750 | |
| | | | | | | | |
| | | | | | | 56,750,274 | |
| | | | | | | | |
| | | | Household & Personal Products - 2.1% | |
| | 29,168 | | | Avon Products, Inc. | | | 273,888 | |
| | 8,586 | | | Clorox Co. (The) | | | 894,747 | |
| | 57,374 | | | Colgate-Palmolive Co. | | | 3,969,707 | |
| | 14,926 | | | Estee Lauder Cos., Inc. (The), Class A | | | 1,137,361 | |
| | 24,943 | | | Kimberly-Clark Corp. | | | 2,881,914 | |
| | 181,187 | | | Procter & Gamble Co. (The) | | | 16,504,324 | |
| | | | | | | | |
| | | | | | | 25,661,941 | |
| | | | | | | | |
| | | | Insurance - 2.8% | |
| | 22,906 | | | ACE Ltd. | | | 2,631,441 | |
| | 31,290 | | | Aflac, Inc. | | | 1,911,506 | |
| | 29,109 | | | Allstate Corp. (The) | | | 2,044,907 | |
| | 95,366 | | | American International Group, Inc. | | | 5,341,450 | |
| | 19,694 | | | Aon plc | | | 1,867,582 | |
| | 5,468 | | | Assurant, Inc. | | | 374,175 | |
| | 16,398 | | | Chubb Corp. (The) | | | 1,696,701 | |
| | 11,068 | | | Cincinnati Financial Corp. | | | 573,654 | |
| | 34,567 | | | Genworth Financial, Inc., Class A(2) | | | 293,820 | |
| | 18,280 | | | Lincoln National Corp. | | | 1,054,208 | |
| | 21,624 | | | Loews Corp. | | | 908,641 | |
| | 37,356 | | | Marsh & McLennan Cos., Inc. | | | 2,138,257 | |
| | 77,545 | | | MetLife, Inc. | | | 4,194,409 | |
| | 19,580 | | | Principal Financial Group, Inc. | | | 1,016,985 | |
| | 38,296 | | | Progressive Corp. (The) | | | 1,033,609 | |
| | 31,382 | | | Prudential Financial, Inc. | | | 2,838,816 | |
| | 9,596 | | | Torchmark Corp. | | | 519,815 | |
| | 22,855 | | | Travelers Cos., Inc. (The) | | | 2,419,202 | |
| | 18,396 | | | Unum Group | | | 641,653 | |
| | 19,151 | | | XL Group plc | | | 658,220 | |
| | | | | | | | |
| | | | | | | 34,159,051 | |
| | | | | | | | |
| | | | | | | | |
Shares or Principal Amount | | Market Value(1) | |
| COMMON STOCKS - 99.6% - (continued) | |
| | | | Materials - 3.2% | |
| | 12,941 | | | Air Products & Chemicals, Inc. | | $ | 1,866,480 | |
| | 4,371 | | | Airgas, Inc. | | | 503,452 | |
| | 79,220 | | | Alcoa, Inc. | | | 1,250,884 | |
| | 7,349 | | | Allegheny Technologies, Inc. | | | 255,525 | |
| | 6,096 | | | Avery Dennison Corp. | | | 316,260 | |
| | 9,075 | | | Ball Corp. | | | 618,643 | |
| | 3,307 | | | CF Industries Holdings, Inc. | | | 901,290 | |
| | 74,379 | | | Dow Chemical Co. (The) | | | 3,392,426 | |
| | 9,914 | | | Eastman Chemical Co. | | | 752,076 | |
| | 18,039 | | | Ecolab, Inc. | | | 1,885,436 | |
| | 60,793 | | | EI du Pont de Nemours & Co. | | | 4,495,034 | |
| | 8,848 | | | FMC Corp. | | | 504,601 | |
| | 69,833 | | | Freeport-McMoRan, Inc. | | | 1,631,299 | |
| | 5,370 | | | International Flavors & Fragrances, Inc. | | | 544,303 | |
| | 28,467 | | | International Paper Co. | | | 1,525,262 | |
| | 27,900 | | | LyondellBasell Industries N.V., Class A | | | 2,214,981 | |
| | 4,100 | | | Martin Marietta Materials, Inc. | | | 452,312 | |
| | 11,117 | | | MeadWestvaco Corp. | | | 493,484 | |
| | 32,442 | | | Monsanto Co. | | | 3,875,846 | |
| | 21,161 | | | Mosaic Co. (The) | | | 966,000 | |
| | 33,668 | | | Newmont Mining Corp. | | | 636,325 | |
| | 21,359 | | | Nucor Corp. | | | 1,047,659 | |
| | 11,168 | | | Owens-Illinois, Inc.(2) | | | 301,424 | |
| | 9,183 | | | PPG Industries, Inc. | | | 2,122,650 | |
| | 19,439 | | | Praxair, Inc. | | | 2,518,517 | |
| | 14,229 | | | Sealed Air Corp. | | | 603,736 | |
| | 5,412 | | | Sherwin-Williams Co. (The) | | | 1,423,573 | |
| | 7,958 | | | Sigma-Aldrich Corp. | | | 1,092,395 | |
| | 8,772 | | | Vulcan Materials Co. | | | 576,584 | |
| | | | | | | | |
| | | | | | | 38,768,457 | |
| | | | | | | | |
| | | | Media - 3.5% | |
| | 14,812 | | | Cablevision Systems Corp., Class A | | | 305,720 | |
| | 32,000 | | | CBS Corp., Class B | | | 1,770,880 | |
| | 172,833 | | | Comcast Corp., Class A | | | 10,026,042 | |
| | 33,695 | | | DIRECTV(2) | | | 2,921,356 | |
| | 9,971 | | | Discovery Communications, Inc., Class A(2) | | | 343,501 | |
| | 18,271 | | | Discovery Communications, Inc., Class C(2) | | | 616,098 | |
| | 15,252 | | | Gannett Co., Inc. | | | 486,996 | |
| | 27,957 | | | Interpublic Group of Cos., Inc. (The) | | | 580,667 | |
| | 33,285 | | | News Corp., Class A(2) | | | 522,242 | |
| | 16,649 | | | Omnicom Group, Inc. | | | 1,289,798 | |
| | 6,704 | | | Scripps Networks Interactive, Inc., Class A | | | 504,610 | |
| | 18,787 | | | Time Warner Cable, Inc. | | | 2,856,751 | |
| | 56,241 | | | Time Warner, Inc. | | | 4,804,106 | |
| | 124,441 | | | Twenty-First Century Fox, Inc., Class A | | | 4,779,157 | |
| | 24,783 | | | Viacom, Inc., Class B | | | 1,864,921 | |
| | 104,719 | | | Walt Disney Co. (The) | | | 9,863,483 | |
| | | | | | | | |
| | | | | | | 43,536,328 | |
| | | | | | | | |
| | | | Pharmaceuticals, Biotechnology & Life Sciences - 9.5% | |
| | 106,945 | | | AbbVie, Inc. | | | 6,998,481 | |
| | 17,825 | | | Actavis plc(2) | | | 4,588,333 | |
| | 22,334 | | | Agilent Technologies, Inc. | | | 914,354 | |
| | 13,300 | | | Alexion Pharmaceuticals, Inc.(2) | | | 2,460,899 | |
| | 19,981 | | | Allergan, Inc. | | | 4,247,761 | |
| | 51,014 | | | Amgen, Inc. | | | 8,126,020 | |
| | 15,859 | | | Biogen Idec, Inc.(2) | | | 5,383,338 | |
The accompanying notes are an integral part of these financial statements.
Schedule of Investments – (continued)
December 31, 2014
| | | | | | | | |
Shares or Principal Amount | | Market Value(1) | |
| COMMON STOCKS - 99.6% - (continued) | |
| | | | Pharmaceuticals, Biotechnology & Life Sciences - 9.5% -
(continued) | |
| | 111,238 | | | Bristol-Myers Squibb Co. | | $ | 6,566,379 | |
| | 53,604 | | | Celgene Corp.(2) | | | 5,996,143 | |
| | 65,718 | | | Eli Lilly & Co. | | | 4,533,885 | |
| | 101,172 | | | Gilead Sciences, Inc.(2) | | | 9,536,473 | |
| | 11,354 | | | Hospira, Inc.(2) | | | 695,433 | |
| | 187,747 | | | Johnson & Johnson | | | 19,632,704 | |
| | 7,800 | | | Mallinckrodt plc(2) | | | 772,434 | |
| | 191,227 | | | Merck & Co., Inc. | | | 10,859,781 | |
| | 25,147 | | | Mylan, Inc.(2) | | | 1,417,536 | |
| | 7,511 | | | PerkinElmer, Inc. | | | 328,456 | |
| | 9,383 | | | Perrigo Co. plc | | | 1,568,462 | |
| | 422,538 | | | Pfizer, Inc. | | | 13,162,059 | |
| | 4,950 | | | Regeneron Pharmaceuticals, Inc.(2) | | | 2,030,737 | |
| | 26,795 | | | Thermo Fisher Scientific, Inc. | | | 3,357,146 | |
| | 16,100 | | | Vertex Pharmaceuticals, Inc.(2) | | | 1,912,680 | |
| | 5,547 | | | Waters Corp.(2) | | | 625,258 | |
| | 33,650 | | | Zoetis, Inc. | | | 1,447,959 | |
| | | | | | | | |
| | | | | | | 117,162,711 | |
| | | | | | | | |
| | | | Real Estate - 2.4% | |
| | 26,572 | | | American Tower Corp., REIT | | | 2,626,642 | |
| | 9,794 | | | Apartment Investment & Management Co., Class A, REIT | | | 363,847 | |
| | 8,875 | | | AvalonBay Communities, Inc., REIT | | | 1,450,086 | |
| | 10,198 | | | Boston Properties, Inc., REIT | | | 1,312,381 | |
| | 18,815 | | | CBRE Group, Inc., Class A(2) | | | 644,414 | |
| | 22,350 | | | Crown Castle International Corp., REIT | | | 1,758,945 | |
| | 24,289 | | | Equity Residential, REIT | | | 1,744,922 | |
| | 4,300 | | | Essex Property Trust, Inc., REIT | | | 888,380 | |
| | 42,000 | | | General Growth Properties, Inc., REIT | | | 1,181,460 | |
| | 30,799 | | | HCP, Inc., REIT | | | 1,356,080 | |
| | 21,977 | | | Health Care REIT, Inc., REIT | | | 1,663,000 | |
| | 50,981 | | | Host Hotels & Resorts, Inc., REIT | | | 1,211,818 | |
| | 27,527 | | | Kimco Realty Corp., REIT | | | 692,029 | |
| | 9,450 | | | Macerich Co. (The), REIT | | | 788,224 | |
| | 11,768 | | | Plum Creek Timber Co., Inc., REIT | | | 503,553 | |
| | 33,443 | | | Prologis, Inc., REIT | | | 1,439,052 | |
| | 9,720 | | | Public Storage, REIT | | | 1,796,742 | |
| | 20,890 | | | Simon Property Group, Inc., REIT | | | 3,804,278 | |
| | 19,726 | | | Ventas, Inc., REIT | | | 1,414,354 | |
| | 11,759 | | | Vornado Realty Trust, REIT | | | 1,384,152 | |
| | 35,219 | | | Weyerhaeuser Co., REIT | | | 1,264,010 | |
| | | | | | | | |
| | | | | | | 29,288,369 | |
| | | | | | | | |
| | | | Retailing - 4.4% | | | |
| | 25,503 | | | Amazon.com, Inc.(2) | | | 7,914,856 | |
| | 5,019 | | | AutoNation, Inc.(2) | | | 303,198 | |
| | 2,161 | | | AutoZone, Inc.(2) | | | 1,337,897 | |
| | 12,395 | | | Bed Bath & Beyond, Inc.(2) | | | 944,127 | |
| | 19,540 | | | Best Buy Co., Inc. | | | 761,669 | |
| | 14,440 | | | CarMax, Inc.(2) | | | 961,415 | |
| | 20,350 | | | Dollar General Corp.(2) | | | 1,438,745 | |
| | 13,702 | | | Dollar Tree, Inc.(2) | | | 964,347 | |
| | 6,625 | | | Expedia, Inc. | | | 565,510 | |
| | 6,359 | | | Family Dollar Stores, Inc. | | | 503,696 | |
| | 7,335 | | | GameStop Corp., Class A | | | 247,923 | |
| | 17,884 | | | Gap, Inc. (The) | | | 753,095 | |
| | 10,190 | | | Genuine Parts Co. | | | 1,085,948 | |
| | 88,411 | | | Home Depot, Inc. (The) | | | 9,280,503 | |
| | 13,530 | | | Kohl’s Corp. | | | 825,871 | |
| | | | | | | | |
Shares or Principal Amount | | Market Value(1) | |
| COMMON STOCKS - 99.6% - (continued) | |
| | | | Retailing - 4.4% - (continued) | | | |
| | 16,459 | | | L Brands, Inc. | | $ | 1,424,526 | |
| | 65,264 | | | Lowe’s Cos., Inc. | | | 4,490,163 | |
| | 23,112 | | | Macy’s, Inc. | | | 1,519,614 | |
| | 4,037 | | | Netflix, Inc.(2) | | | 1,379,080 | |
| | 9,390 | | | Nordstrom, Inc. | | | 745,472 | |
| | 6,750 | | | O’Reilly Automotive, Inc.(2) | | | 1,300,185 | |
| | 6,600 | | | PetSmart, Inc. | | | 536,547 | |
| | 3,509 | | | Priceline Group, Inc. (The)(2) | | | 4,000,997 | |
| | 14,046 | | | Ross Stores, Inc. | | | 1,323,976 | |
| | 42,946 | | | Staples, Inc. | | | 778,182 | |
| | 42,699 | | | Target Corp. | | | 3,241,281 | |
| | 7,543 | | | Tiffany & Co. | | | 806,045 | |
| | 46,161 | | | TJX Cos., Inc. (The) | | | 3,165,721 | |
| | 9,100 | | | Tractor Supply Co. | | | 717,262 | |
| | 7,525 | | | TripAdvisor, Inc.(2) | | | 561,817 | |
| | 6,659 | | | Urban Outfitters, Inc.(2) | | | 233,931 | |
| | | | | | | | |
| | | | | | | 54,113,599 | |
| | | | | | | | |
| | | | Semiconductors & Semiconductor Equipment - 2.4% | |
| | 20,330 | | | Altera Corp. | | | 750,990 | |
| | 20,796 | | | Analog Devices, Inc. | | | 1,154,594 | |
| | 81,823 | | | Applied Materials, Inc. | | | 2,039,029 | |
| | 17,000 | | | Avago Technologies Ltd. | | | 1,710,030 | |
| | 36,183 | | | Broadcom Corp., Class A | | | 1,567,809 | |
| | 5,078 | | | First Solar, Inc.(2) | | | 226,453 | |
| | 324,362 | | | Intel Corp. | | | 11,771,097 | |
| | 11,046 | | | KLA-Tencor Corp. | | | 776,755 | |
| | 10,675 | | | Lam Research Corp. | | | 846,955 | |
| | 15,897 | | | Linear Technology Corp. | | | 724,903 | |
| | 13,408 | | | Microchip Technology, Inc. | | | 604,835 | |
| | 72,107 | | | Micron Technology, Inc.(2) | | | 2,524,466 | |
| | 34,634 | | | NVIDIA Corp. | | | 694,412 | |
| | 70,912 | | | Texas Instruments, Inc. | | | 3,791,310 | |
| | 17,679 | | | Xilinx, Inc. | | | 765,324 | |
| | | | | | | | |
| | | | | | | 29,948,962 | |
| | | | | | | | |
| | | | Software & Services - 10.3% | |
| | 42,109 | | | Accenture plc, Class A | | | 3,760,755 | |
| | 31,797 | | | Adobe Systems, Inc.(2) | | | 2,311,642 | |
| | 11,931 | | | Akamai Technologies, Inc.(2) | | | 751,176 | |
| | 4,300 | | | Alliance Data Systems Corp.(2) | | | 1,230,015 | |
| | 15,275 | | | Autodesk, Inc.(2) | | | 917,416 | |
| | 32,318 | | | Automatic Data Processing, Inc. | | | 2,694,352 | |
| | 21,515 | | | CA, Inc. | | | 655,132 | |
| | 10,701 | | | Citrix Systems, Inc.(2) | | | 682,724 | |
| | 40,834 | | | Cognizant Technology Solutions Corp., Class A(2) | | | 2,150,318 | |
| | 9,355 | | | Computer Sciences Corp. | | | 589,833 | |
| | 75,811 | | | eBay, Inc.(2) | | | 4,254,513 | |
| | 20,821 | | | Electronic Arts, Inc.(2) | | | 978,899 | |
| | 140,200 | | | Facebook, Inc., Class A(2) | | | 10,938,404 | |
| | 18,974 | | | Fidelity National Information Services, Inc. | | | 1,180,183 | |
| | 16,326 | | | Fiserv, Inc.(2) | | | 1,158,656 | |
| | 19,058 | | | Google, Inc., Class A(2) | | | 10,113,318 | |
| | 19,158 | | | Google, Inc., Class C(2) | | | 10,084,771 | |
| | 61,679 | | | International Business Machines Corp. | | | 9,895,779 | |
| | 19,125 | | | Intuit, Inc. | | | 1,763,134 | |
| | 65,730 | | | MasterCard, Inc., Class A | | | 5,663,297 | |
| | 552,731 | | | Microsoft Corp. | | | 25,674,355 | |
| | 217,059 | | | Oracle Corp. | | | 9,761,143 | |
The accompanying notes are an integral part of these financial statements.
Schedule of Investments – (continued)
December 31, 2014
| | | | | | | | |
Shares or Principal Amount | | Market Value(1) | |
| COMMON STOCKS - 99.6% - (continued) | |
| | | | Software & Services - 10.3% - (continued) | |
| | 21,772 | | | Paychex, Inc. | | $ | 1,005,213 | |
| | 12,551 | | | Red Hat, Inc.(2) | | | 867,776 | |
| | 39,328 | | | salesforce.com, Inc.(2) | | | 2,332,544 | |
| | 46,256 | | | Symantec Corp. | | | 1,186,698 | |
| | 10,268 | | | Teradata Corp.(2) | | | 448,506 | |
| | 10,940 | | | Total System Services, Inc. | | | 371,522 | |
| | 7,326 | | | VeriSign, Inc.(2) | | | 417,582 | |
| | 32,738 | | | Visa, Inc., Class A | | | 8,583,904 | |
| | 34,911 | | | Western Union Co. (The) | | | 625,256 | |
| | 72,128 | | | Xerox Corp. | | | 999,694 | |
| | 59,215 | | | Yahoo!, Inc.(2) | | | 2,990,950 | |
| | | | | | | | |
| | | | | | | 127,039,460 | |
| | | | | | | | |
| | | | Technology Hardware & Equipment - 6.8% | |
| | 20,650 | | | Amphenol Corp., Class A | | | 1,111,177 | |
| | 393,247 | | | Apple, Inc. | | | 43,406,604 | |
| | 343,067 | | | Cisco Systems, Inc. | | | 9,542,409 | |
| | 86,037 | | | Corning, Inc. | | | 1,972,828 | |
| | 136,464 | | | EMC Corp. | | | 4,058,439 | |
| | 4,963 | | | F5 Networks, Inc.(2) | | | 647,498 | |
| | 9,326 | | | FLIR Systems, Inc. | | | 301,323 | |
| | 7,002 | | | Harris Corp. | | | 502,884 | |
| | 125,206 | | | Hewlett-Packard Co. | | | 5,024,517 | |
| | 25,829 | | | Juniper Networks, Inc. | | | 576,503 | |
| | 14,069 | | | Motorola Solutions, Inc. | | | 943,749 | |
| | 20,811 | | | NetApp, Inc. | | | 862,616 | |
| | 111,518 | | | QUALCOMM, Inc. | | | 8,289,133 | |
| | 14,845 | | | SanDisk Corp. | | | 1,454,513 | |
| | 21,950 | | | Seagate Technology plc | | | 1,459,675 | |
| | 27,218 | | | TE Connectivity Ltd. | | | 1,721,538 | |
| | 14,696 | | | Western Digital Corp. | | | 1,626,847 | |
| | | | | | | | |
| | | | | | | 83,502,253 | |
| | | | | | | | |
| | | | Telecommunication Services - 2.3% | |
| | 347,886 | | | AT&T, Inc. | | | 11,685,491 | |
| | 38,319 | | | CenturyLink, Inc. | | | 1,516,666 | |
| | 67,413 | | | Frontier Communications Corp. | | | 449,645 | |
| | 18,700 | | | Level 3 Communications, Inc.(2) | | | 923,406 | |
| | 278,286 | | | Verizon Communications, Inc. | | | 13,018,219 | |
| | 40,673 | | | Windstream Holdings, Inc. | | | 335,145 | |
| | | | | | | | |
| | | | | | | 27,928,572 | |
| | | | | | | | |
| | | | Transportation - 2.2% | |
| | 9,718 | | | CH Robinson Worldwide, Inc. | | | 727,781 | |
| | 66,779 | | | CSX Corp. | | | 2,419,403 | |
| | 56,250 | | | Delta Air Lines, Inc. | | | 2,766,937 | |
| | 12,884 | | | Expeditors International of Washington, Inc. | | | 574,755 | |
| | 17,644 | | | FedEx Corp. | | | 3,064,057 | |
| | 7,350 | | | Kansas City Southern | | | 896,921 | |
| | 20,778 | | | Norfolk Southern Corp. | | | 2,277,477 | |
| | 3,603 | | | Ryder System, Inc. | | | 334,539 | |
| | 45,623 | | | Southwest Airlines Co. | | | 1,930,765 | |
| | 59,680 | | | Union Pacific Corp. | | | 7,109,678 | |
| | 46,788 | | | United Parcel Service, Inc., Class B | | | 5,201,422 | |
| | | | | | | | |
| | | | | | | 27,303,735 | |
| | | | | | | | |
| | | | Utilities - 3.2% | |
| | 44,294 | | | AES Corp. | | | 609,928 | |
| | 7,923 | | | AGL Resources, Inc. | | | 431,883 | |
| | 16,188 | | | Ameren Corp. | | | 746,752 | |
| | 32,805 | | | American Electric Power Co., Inc. | | | 1,991,920 | |
| | | | | | | | |
Shares or Principal Amount | | Market Value(1) | |
| COMMON STOCKS - 99.6% - (continued) | |
| | | | Utilities - 3.2% - (continued) | |
| | 28,625 | | | CenterPoint Energy, Inc. | | $ | 670,684 | |
| | 18,273 | | | CMS Energy Corp. | | | 634,987 | |
| | 19,518 | | | Consolidated Edison, Inc. | | | 1,288,383 | |
| | 39,138 | | | Dominion Resources, Inc. | | | 3,009,712 | |
| | 11,810 | | | DTE Energy Co. | | | 1,020,030 | |
| | 47,482 | | | Duke Energy Corp. | | | 3,966,646 | |
| | 21,872 | | | Edison International | | | 1,432,179 | |
| | 12,145 | | | Entergy Corp. | | | 1,062,445 | |
| | 57,664 | | | Exelon Corp. | | | 2,138,181 | |
| | 28,269 | | | FirstEnergy Corp. | | | 1,102,208 | |
| | 5,320 | | | Integrys Energy Group, Inc. | | | 414,162 | |
| | 29,326 | | | NextEra Energy, Inc. | | | 3,117,061 | |
| | 21,141 | | | NiSource, Inc. | | | 896,801 | |
| | 21,117 | | | Northeast Utilities | | | 1,130,182 | |
| | 22,775 | | | NRG Energy, Inc. | | | 613,786 | |
| | 16,761 | | | Pepco Holdings, Inc. | | | 451,374 | |
| | 31,806 | | | PG&E Corp. | | | 1,693,351 | |
| | 7,331 | | | Pinnacle West Capital Corp. | | | 500,781 | |
| | 44,566 | | | PPL Corp. | | | 1,619,083 | |
| | 33,974 | | | Public Service Enterprise Group, Inc. | | | 1,406,863 | |
| | 9,416 | | | SCANA Corp. | | | 568,726 | |
| | 15,460 | | | Sempra Energy | | | 1,721,626 | |
| | 60,321 | | | Southern Co. (The) | | | 2,962,364 | |
| | 15,469 | | | TECO Energy, Inc. | | | 316,960 | |
| | 15,032 | | | Wisconsin Energy Corp. | | | 792,788 | |
| | 33,783 | | | Xcel Energy, Inc. | | | 1,213,485 | |
| | | | | | | | |
| | | | | | | 39,525,331 | |
| | | | | | | | |
| | |
| | | | Total Common Stocks
(cost $682,643,668) | | $ | 1,223,357,895 | |
| | | | | | | | |
| | |
| | | | Total Long-Term Investments
(cost $682,643,668) | | $ | 1,223,357,895 | |
| | | | | | | | |
|
| SHORT-TERM INVESTMENTS - 0.5% | |
| | | | Repurchase Agreements - 0.4% | | | |
| | | | RBC Capital Markets LLC TriParty Repurchase Agreement (maturing on 01/02/2015 in the amount of $5,151,011, collateralized by U.S. Treasury Note 0.63%, 2021, value of $5,239,209) | | | | |
| $ | 5,151,000 | | | 0.04%, 12/31/2014 | | $ | 5,151,000 | |
| | | | | | | | |
| | |
| | | | U.S. Treasury Bills - 0.1% | | | |
| | 650,000 | | | 0.06%, 05/07/2015(3)(4) | | $ | 649,898 | |
| | | | | | | | |
| | |
| | | | Total Short-Term Investments
(cost $5,800,875) | | $ | 5,800,898 | |
| | | | | | | | |
| | | | | | | | | | |
| | | |
| | Total Investments
(cost $688,444,543)(5) | | | 100.1 | % | | $ | 1,229,158,793 | |
| | Other Assets and Liabilities | | | (0.1 | )% | | | (923,572 | ) |
| | | | | | | | | | |
| | Net Assets | | | 100.0 | % | | $ | 1,228,235,221 | |
| | | | | | | | | | |
The accompanying notes are an integral part of these financial statements.
Schedule of Investments – (continued)
December 31, 2014
| Note: | Percentage of investments as shown is the ratio of the total market value to total net assets. |
| | Equity industry classifications used in this report are the Global Industry Classification Standard, which was developed by and is the exclusive property and service mark of MSCI, Inc. and Standard & Poor’s. |
| | For Fund compliance purposes, the Fund may not use the same classification system shown in this report as these classifications are used for reporting ease. |
| (1) | See Significant Accounting Policies of accompanying Notes to Financial Statements regarding valuation of securities. |
| (3) | The interest rate disclosed for these securities represents the effective yield on the date of the acquisition. |
| (4) | This security, or a portion of this security, is pledged as initial margin deposit and collateral for daily variation margin loss on open futures contracts held at December 31, 2014. |
| (5) | At December 31, 2014, the cost of securities for federal income tax purposes was $725,412,493, and the aggregate gross unrealized appreciation and depreciation based on that cost were: |
| | | | |
Unrealized Appreciation | | $ | 526,763,734 | |
Unrealized Depreciation | | | (23,017,434 | ) |
| | | | |
Net Unrealized Appreciation | | $ | 503,746,300 | |
| | | | |
Futures Contracts Outstanding at December 31, 2014
| | | | | | | | | | | | | | | | | | | | |
Description | | Number of
Contracts | | | Expiration
Date | | | Notional Amount | | | Market Value | | | Unrealized
Appreciation/
(Depreciation) | |
Long position contracts: | | | | | | | | | | | | | | | | | | | | |
S&P 500 Futures | | | 65 | | | | 03/20/2015 | | | $ | 6,621,628 | | | $ | 6,670,300 | | | $ | 48,672 | |
| | |
| GLOSSARY: (abbreviations used in preceding Schedule of Investments) |
|
| Index Abbreviations: |
S&P | | Standard & Poors |
|
| Other Abbreviations: |
REIT | | Real Estate Investment Trust |
The accompanying notes are an integral part of these financial statements.
Schedule of Investments – (concluded)
December 31, 2014
Investment Valuation Hierarchy Level Summary at December 31, 2014
| | | | | | | | | | | | | | | | |
Description | | Total | | | Level 1 | | | Level 2 | | | Level 3 | |
Assets:1 | | | | | | | | | | | | | | | | |
Common Stocks2 | | $ | 1,223,357,895 | | | $ | 1,223,357,895 | | | $ | — | | | $ | — | |
Short-Term Investments | | | 5,800,898 | | | | — | | | | 5,800,898 | | | | — | |
| | | | | | | | | | | | | | | | |
Total | | $ | 1,229,158,793 | | | $ | 1,223,357,895 | | | $ | 5,800,898 | | | $ | — | |
| | | | | | | | | | | | | | | | |
Futures3 | | $ | 48,672 | | | $ | 48,672 | | | $ | — | | | $ | — | |
| | | | | | | | | | | | | | | | |
Total | | $ | 48,672 | | | $ | 48,672 | | | $ | — | | | $ | — | |
| | | | | | | | | | | | | | | | |
| 1 | For the year ended December 31, 2014, there were no transfers between any levels. |
| 2 | Refer to the Schedule of Investments for further industry breakout. |
| 3 | Derivative instruments are valued at the unrealized appreciation/depreciation on the investments. |
| Note: | For purposes of reporting transfers between different hierarchy levels, both transfers in and out of each level, as applicable, are shown as if they occurred at the beginning of the period. |
The accompanying notes are an integral part of these financial statements.
Statement of Assets and Liabilities
December 31, 2014
| | | | |
Assets: | | | | |
Investments in securities, at market value (cost $688,444,543) | | $ | 1,229,158,793 | |
Cash | | | 812 | |
Receivables: | | | | |
Fund shares sold | | | 66,885 | |
Dividends and interest | | | 1,634,699 | |
Other assets | | | 5,723 | |
| | | | |
Total assets | | | 1,230,866,912 | |
| | | | |
Liabilities: | | | | |
Payables: | | | | |
Fund shares redeemed | | | 2,016,465 | |
Investment management fees | | | 314,612 | |
Variation margin on financial derivative instruments | | | 79,244 | |
Distribution fees | | | 99,984 | |
Accrued expenses | | | 121,386 | |
| | | | |
Total liabilities | | | 2,631,691 | |
| | | | |
Net assets | | $ | 1,228,235,221 | |
| | | | |
Summary of Net Assets: | | | | |
Capital stock and paid-in-capital | | $ | 706,519,456 | |
Undistributed net investment income | | | 4,598,751 | |
Accumulated net realized loss | | | (23,645,908 | ) |
Unrealized appreciation of investments | | | 540,762,922 | |
| | | | |
Net assets | | $ | 1,228,235,221 | |
| | | | |
Class IA: Net asset value per share | | $ | 41.11 | |
| | | | |
Shares Outstanding | | | 18,507,704 | |
| | | | |
Net Assets | | $ | 760,767,812 | |
| | | | |
Class IB: Net asset value per share | | $ | 40.86 | |
| | | | |
Shares Outstanding | | | 11,439,729 | |
| | | | |
Net Assets | | $ | 467,467,409 | |
| | | | |
The accompanying notes are an integral part of these financial statements.
Statement of Operations
For the Year Ended December 31, 2014
| | | | |
Investment Income: | | | | |
Dividends | | $ | 24,533,056 | |
Interest | | | 3,422 | |
Less: Foreign tax withheld | | | (2,819 | ) |
Other Income | | | 118,992 | |
| | | �� | |
Total investment income, net | | | 24,652,651 | |
| | | | |
Expenses: | | | | |
Investment management fees | | | 3,581,933 | |
Transfer agent fees | | | 5,430 | |
Distribution fees - Class IB | | | 1,098,350 | |
Custodian fees | | | 3,969 | |
Accounting service fees | | | 112,949 | |
Trustee fees | | | 40,394 | |
Audit fees | | | 41,380 | |
Printing fees | | | 81,184 | |
Legal fees | | | 37,871 | |
Insurance fees | | | 16,710 | |
Other expenses | | | 29,371 | |
| | | | |
Total expenses (before waivers) | | | 5,049,541 | |
| | | | |
Total waivers | | | (38,555 | ) |
| | | | |
Total expenses | | | 5,010,986 | |
| | | | |
Net Investment Income | | | 19,641,665 | |
| | | | |
Net Realized Gain on Investments and Other Financial Instruments: | | | | |
Net realized gain on investments | | | 44,399,883 | |
Net realized gain on futures | | | 1,444,101 | |
| | | | |
Net Realized Gain on Investments and Other Financial Instruments | | | 45,843,984 | |
| | | | |
Net Changes in Unrealized Appreciation of Investments and Other Financial Instruments: | | | | |
Net unrealized appreciation of investments | | | 83,807,361 | |
Net unrealized depreciation of futures | | | (243,976 | ) |
| | | | |
Net Changes in Unrealized Appreciation of Investments and Other Financial Instruments | | | 83,563,385 | |
| | | | |
Net Realized and Unrealized Gain on Investments and Other Financial Instruments | | | 129,407,369 | |
| | | | |
Net Increase in Net Assets Resulting from Operations | | $ | 149,049,034 | |
| | | | |
The accompanying notes are an integral part of these financial statements.
Statement of Changes in Net Assets
| | | | | | | | |
| | | For the
Year Ended
December 31,
2014 | | | For the
Year Ended
December 31,
2013(1) | |
Operations: | | | | | | | | |
Net investment income | | $ | 19,641,665 | | | $ | 18,832,003 | |
Net realized gain on investments and other financial instruments | | | 45,843,984 | | | | 28,993,576 | |
Net unrealized appreciation of investments and other financial instruments | | | 83,563,385 | | | | 254,915,353 | |
| | | | | | | | |
Net Increase in Net Assets Resulting from Operations | | | 149,049,034 | | | | 302,740,932 | |
| | | | | | | | |
Distributions to Shareholders: | | | | | | | | |
From net investment income | | | | | | | | |
Class IA | | | (10,493,733 | ) | | | (12,237,589 | ) |
Class IB | | | (5,612,447 | ) | | | (5,813,586 | ) |
| | | | | | | | |
Total distributions from net investment income | | | (16,106,180 | ) | | | (18,051,175 | ) |
| | | | | | | | |
From net realized gain on investments | | | | | | | | |
Class IA | | | (32,453,081 | ) | | | — | |
Class IB | | | (19,873,215 | ) | | | — | |
| | | | | | | | |
Total distributions from net realized gain on investments | | | (52,326,296 | ) | | | — | |
| | | | | | | | |
Total distributions | | | (68,432,476 | ) | | | (18,051,175 | ) |
| | | | | | | | |
Capital Share Transactions: | | | | | | | | |
Class IA | | | | | | | | |
Sold | | | 28,800,028 | | | | 45,697,338 | |
Issued on reinvestment of distributions | | | 42,946,814 | | | | 12,237,589 | |
Redeemed | | | (126,111,461 | ) | | | (176,784,689 | ) |
| | | | | | | | |
Total capital share transactions | | | (54,364,619 | ) | | | (118,849,762 | ) |
| | | | | | | | |
Class IB | | | | | | | | |
Sold | | | 59,747,881 | | | | 102,183,899 | |
Issued on reinvestment of distributions | | | 25,485,662 | | | | 5,813,586 | |
Redeemed | | | (60,237,522 | ) | | | (95,764,784 | ) |
| | | | | | | | |
Total capital share transactions | | | 24,996,021 | | | | 12,232,701 | |
| | | | | | | | |
Net decrease from capital share transactions | | | (29,368,598 | ) | | | (106,617,061 | ) |
| | | | | | | | |
Net Increase in Net Assets | | | 51,247,960 | | | | 178,072,696 | |
| | | | | | | | |
Net Assets: | | | | | | | | |
Beginning of period | | | 1,176,987,261 | | | | 998,914,565 | |
| | | | | | | | |
End of period | | $ | 1,228,235,221 | | | $ | 1,176,987,261 | |
| | | | | | | | |
Undistributed net investment income | | $ | 4,598,751 | | | $ | 1,323,641 | |
| | | | | | | | |
Shares: | | | | | | | | |
Class IA | | | | | | | | |
Sold | | | 718,762 | | | | 1,353,264 | |
Issued on reinvestment of distributions | | | 1,121,090 | | | | 323,585 | |
Redeemed | | | (3,150,411 | ) | | | (5,158,205 | ) |
| | | | | | | | |
Total share activity | | | (1,310,559 | ) | | | (3,481,356 | ) |
| | | | | | | | |
Class IB | | | | | | | | |
Sold | | | 1,512,641 | | | | 3,032,803 | |
Issued on reinvestment of distributions | | | 668,764 | | | | 154,529 | |
Redeemed | | | (1,514,157 | ) | | | (2,804,770 | ) |
| | | | | | | | |
Total share activity | | | 667,248 | | | | 382,562 | |
| | | | | | | | |
| (1) | See Note 10 in the accompanying Notes to Financial Statements. |
The accompanying notes are an integral part of these financial statements.
Notes to Financial Statements
December 31, 2014
HIMCO Variable Insurance Trust (“the Trust”) is an open-end registered management investment company. The Trust is organized under the laws of the State of Delaware and is registered with the Securities and Exchange Commission (“SEC”) under the Investment Company Act of 1940, as amended (“1940 Act”).
HIMCO VIT Index Fund (the “Fund”) serves as an underlying investment option for certain variable annuity and variable life insurance separate accounts of Hartford Life Insurance Company (“HLIC”) and its affiliates and certain qualified retirement plans. The Fund may also serve as an underlying investment option for certain variable annuity and variable life separate accounts of other insurance companies. Owners of variable annuity contracts and policyholders of variable life insurance contracts may choose the funds permitted in the variable insurance contract prospectus. In addition, participants in certain qualified retirement plans may choose the Fund if permitted by their plans.
The Fund is a series of the Trust. The Fund is a diversified open-end management investment company and applies specialized accounting and reporting under Accounting Standards Codification Topic 946, Financial Services – Investment Companies. The Fund is authorized to issue an unlimited number of shares with a par value of 0.001 each.
The Fund is divided into Class IA and Class IB shares. Each class is offered at the per share net asset value (“NAV”) without a sales charge and is subject to the same expenses, except that the Class IB shares are subject to distribution and service fees charged pursuant to a Distribution Plan adopted in accordance with Rule 12b-1 under the 1940 Act.
Effective October 20, 2014, Hartford Index HLS Fund (the “Predecessor Fund”) was reorganized into the HIMCO VIT Index Fund. The Fund is advised by Hartford Investment Management Company (“Hartford Investment Management”). See Note 9.
| 2. | Significant Accounting Policies: |
The following is a summary of significant accounting policies of the Fund in the preparation of its financial statements, which are in accordance with United States Generally Accepted Accounting Principles (“U.S. GAAP”). The preparation of financial statements in accordance with U.S. GAAP may require management to make estimates and assumptions that affect the reported amounts of assets and liabilities and disclosure of contingent assets and liabilities at the date of the financial statements and the reported amounts of increases and decreases in net assets from operations during the reporting period. Actual results could differ from those estimates.
| | a) | Determination of Net Asset Value – The NAV of each class of the Fund’s shares is determined as of the close of regular trading (normally 4:00 p.m. Eastern Time) (the “NYSE Close”) on each day that the New York Stock Exchange (the “Exchange”) is open (“Valuation Date”). Information that becomes known to the Fund after the NAV has been calculated on a particular day will not generally be used to retroactively adjust the NAV determined earlier that day. |
| | b) | Investment Valuation and Fair Value Measurements – For purposes of calculating the NAV, portfolio investments and other assets held by the Fund’s portfolio for which market prices are readily available are valued at market value. Market value is generally determined on the basis of last reported sales prices or official close price. If no sales are reported, market value is based on bid ask/prices, and dealer, broker or market maker-quotations. Last sale prices, official closing prices and bid and ask prices are supplied by one or more independent pricing services. If market prices are not readily available or are deemed unreliable, the Fund will use the fair value of the investment as determined in good faith under policies and procedures established by and under the supervision of the Trust’s Board of Trustees (“Board of Trustees”). |
Short-term investments maturing in 60 days or less are generally valued at amortized cost, if their original term to maturity was 60 days or less, or by amortizing their value on the 61st day prior to maturity, if the original term to maturity exceeded 60 days, which approximates fair value.
Exchange traded equity securities are normally valued at the last reported sale price on the exchange or market on which the security is primarily traded and generally has the highest volume of trading activity (the “Primary Market”) at the Valuation Date. If the security did not trade on the Primary Market, it may be valued at the last reported sales price on another exchange or market where it trades at the Valuation Date. The value of an equity security not traded on any exchange but traded on an over-the-counter (“OTC”) market shall be valued at the last reported sales price or official closing price on the exchange or market on which the security is traded as of the Valuation Date.
Notes to Financial Statements – (continued)
December 31, 2014
Exchange traded options, futures and options on futures are valued at the settlement price on last trade price determined by the relevant exchange as of the NYSE Close. If a last trade price is not available, the value will be the mean of the bid and ask prices as of the NYSE Close. If a mean of the bid and ask prices cannot be calculated for the day, the value will be the bid price as of the NYSE Close. In the case of OTC options and such instruments that do not trade on an exchange, values may be supplied by a pricing service using a formula or other objective method that may take into consideration the style, direction, expiration, strike price, notional value and volatility or other special adjustments.
Financial instruments for which prices are not available from an independent pricing service may be valued using market quotations obtained from one or more dealers that make markets in the respective financial instrument in accordance with procedures established by the Board of Trustees.
U.S. GAAP defines fair value as the price that a fund would receive to sell an asset or pay to transfer a liability in an orderly transaction between market participants. The U.S. GAAP fair value measurement standards require disclosure of a fair value hierarchy for each major category of assets and liabilities. Various inputs are used in determining the fair value of the Fund’s investments. These inputs are summarized into three broad hierarchy levels. This hierarchy is based on whether the valuation inputs are observable or unobservable. These levels are:
| | • | | Level 1 – Quoted prices in active markets for identical investments. Level 1 may include exchange traded instruments, such as domestic equities, some foreign equities, options, futures, mutual funds, exchange traded funds, rights and warrants. |
| | • | | Level 2 – Observable inputs other than Level 1 prices, such as quoted prices for similar investments; quoted prices in markets that are not active; or other inputs that are observable or can be corroborated by observable market data. Level 2 may include debt investments that are traded less frequently than exchange traded instruments and which are valued using independent pricing services; foreign equities, which are principally traded on certain foreign markets and are adjusted daily pursuant to a fair value pricing service in order to reflect an adjustment for the factors occurring after the close of certain foreign markets but before the NYSE Close; senior floating rate interests, which are valued using an aggregate of dealer bids; short-term investments, which are valued at amortized cost; and swaps, which are valued based upon the terms of each swap contract. |
| | • | | Level 3 – Significant unobservable inputs that are supported by limited or no market activity. Level 3 may include financial instruments whose values are determined using indicative market quotes or require significant management judgment or estimation. These unobservable valuation inputs may include estimates for current yields, maturity/duration, prepayment speed, and indicative market quotes for comparable investments along with other assumptions relating to credit quality, collateral value, complexity of the investment structure, general market conditions and liquidity. This category may include investments where trading has been halted or there are certain restrictions on trading. While these investments are priced using unobservable inputs, the valuation of these investments reflects the best available data and management believes the prices are a reasonable representation of exit price. |
The Board of Trustees has adopted procedures for determining the value of portfolio securities. These procedures define how investments are to be valued, including the formation and activities of a Valuation Committee. The Valuation Committee has the overall responsibility for implementing the procedures adopted by the Board of Trustees, including, the responsibility for determining the fair value of the Fund’s investments. The Valuation Committee is also responsible for determining in good faith the fair value of investments when the value cannot be obtained from primary pricing services or alternative sources or if the valuation of an investment as provided by the primary pricing service or alternative source is believed not to reflect the investment’s fair value as of the Valuation Date.
The Valuation Committee is comprised of the Trust’s Chief Executive Officer, Chief Financial Officer, Chief Administrative Officer, and Chief Legal officer, or their designees. In addition, the Trust’s Chief Compliance Officer (“CCO”) shall designate a member of the compliance group to attend Valuation Committee meetings as a non-voting resource, to monitor for and provide guidance with respect to compliance with these procedures and to keep the Trust’s CCO regularly informed of pricing and Valuation Committee proceedings. Two members of the Valuation Committee or their designees, representing different departments, shall constitute a quorum for purposes of permitting the Committee
Notes to Financial Statements – (continued)
December 31, 2014
to take action. The Valuation Committee will consider all relevant factors in determining an investment’s fair value, and may seek the advice of the Fund’s adviser, knowledgeable brokers, and legal counsel in making such determination.
At each quarterly meeting of the Board of Trustees, the Valuation Committee provides a written report which include details of all fair-valued investments, including the reason for the fair valuation, and an indication, when possible, of the accuracy of the valuation by disclosing the next available reliable public price quotation or the disposition price of such investments (the “look-back” review). The Board of Trustees then must consider for ratification all of the fair value determinations made during the previous quarter.
Valuation levels are not necessarily indicative of the risk associated with investing in such investments. Individual investments within any of the above mentioned asset classes may be assigned a different hierarchical level than those presented above, as individual circumstances dictate.
For additional information, refer to the Investment Valuation Hierarchy Level Summary which follows the Schedule of Investments.
| | c) | Investment Transactions and Investment Income – Investment transactions are recorded as of the trade date (the date the order to buy or sell is executed) for financial reporting purposes. Investments purchased or sold on a when-issued or delayed-delivery basis may be settled a month or more after the trade date. Realized gains and losses are determined on the basis of identified cost. |
Dividend income from domestic securities is accrued on the ex-dividend date. Interest income, including amortization of premium, accretion of discounts and additional principal received in-kind in lieu of cash, is accrued on a daily basis.
| | d) | Fund Share Valuation and Dividend Distributions to Shareholders – Orders for the Fund’s shares are executed in accordance with the investment instructions of the contract holders and plan participants. The NAV of the Fund’s shares is determined as of the close of business on each business day of the Exchange. The NAV is determined separately for each class of shares of the Fund by dividing the Fund’s net assets attributable to that class by the number of shares of the class outstanding. Each class of shares offered by the Fund has equal rights as to assets and voting privileges (except that shareholders of a class have exclusive voting rights regarding any matter relating solely to that class of shares). Income and non-class specific expenses are allocated daily to each class on the basis of the relative net assets of the class. Realized and unrealized gains and losses are allocated daily based on the relative net assets of each class of shares of the Fund. |
Orders for the purchase of the Fund’s shares received prior to the close of the Exchange on any day the Exchange is open for business are priced at the NAV determined as of the close of the Exchange. Orders received after the close of the Exchange, or on a day on which the Exchange and/or the Fund is not open for business, are priced at the next determined NAV.
Dividends are declared pursuant to a policy adopted by the Trust’s Board of Trustees based upon the investment performance of the Fund. The policy of the Fund is to pay dividends from net investment income and realized gains, if any, at least once a year.
Distributions from net investment income, realized capital gains and capital are determined in accordance with federal income tax regulations, which may differ from U.S. GAAP with respect to character and timing. These differences may include, but are not limited to, losses deferred due to wash sale adjustments, foreign currency gains and losses, adjustments related to Passive Foreign Investment Companies (“PFICs”), Real Estate Investment Trusts (“REITs”), Regulated Investment Companies (“RICs”), certain derivatives and partnerships. Permanent book and federal income tax basis differences relating to shareholder distributions will result in reclassifications to certain of the Fund’s capital accounts (see Federal Income Taxes: Reclassification of Capital Accounts note).
| 3. | Securities and Other Investments: |
| | a) | Repurchase Agreements – A repurchase agreement is an agreement by which a counterparty agrees to sell an investment and agrees to repurchase the investment sold from the buyer at a mutually agreed upon time and price. During the period |
Notes to Financial Statements – (continued)
December 31, 2014
| | of the repurchase agreement, the counterparty will deposit cash and or securities in a third party custodial account to serve as collateral. At the time the Fund enters into a repurchase agreement, the value of the underlying collateral, including accrued interest, will be equal to or exceed the value of the repurchase agreement. Repurchase agreements expose the Fund to counterparty risk – that is, the risk that the counterparty will not fulfill its obligations. To minimize counterparty risk, the investments that serve to collateralize the repurchase agreement are held by the Fund’s custodian in book entry or physical form in the custodial account of the Fund or in a third party custodial account. Repurchase agreements are valued at cost plus accrued interest, which approximates fair value. Repurchase agreements have master netting arrangements which allow the Fund to offset amounts owed to a counterparty with amounts owed by the counterparty, including any collateral. Upon an event of default under a master repurchase agreement, the non-defaulting party may close out all transactions traded under such agreement and net amounts owed under each transaction to one net amount payable by one party to the other. Absent an event of default, the master repurchase agreement does not result in an offset of reported amounts of assets and liabilities in the Statement of Assets and Liabilities across transactions between the Fund and the applicable counterparty. The Fund, as shown on the Schedule of Investments, had one outstanding repurchase agreement and related collateral as of December 31, 2014. |
| | b) | Investments Purchased on a When-Issued or Delayed-Delivery Basis – Delivery and payment for investments that have been purchased by the Fund on a forward commitment, or when-issued or delayed-delivery basis, take place beyond the customary settlement period. The Fund may dispose of or renegotiate a delayed-delivery transaction after it is entered into, and may sell delayed-delivery investments before they are delivered, which may result in a realized gain or loss. During this period, such investments are subject to market fluctuations, and the Fund identifies investments segregated in its records with a value at least equal to the amount of the commitment. The Fund did not hold when-issued or delayed-delivery investments as of December 31, 2014. |
| 4. | Financial Derivative Instruments: |
The following disclosures contain information on how and why the Fund uses derivative instruments, the credit-risk-related contingent features in certain derivative instruments, and how derivative instruments affect the Fund’s financial position and results of operations. The location and fair value amounts of these instruments on the Statement of Assets and Liabilities and the realized gains and losses and changes in unrealized gains and losses on the Statement of Operations, each categorized by type of derivative contract, are included in the following Additional Derivative Instrument Information footnote. The derivative instruments outstanding as of year-end are disclosed in the notes to the Schedule of Investments, if applicable. The amounts of realized gains and losses and changes in unrealized gains and losses on derivative instruments during the year are disclosed in the Statement of Operations.
| | a) | Futures Contracts – The Fund may enter into futures contracts. A futures contract is an agreement between two parties to buy or sell an asset at a set price on a future date. The Fund uses futures contracts to manage or obtain exposure to the investment markets, commodities, or movements in interest rates and currency values. The primary risks associated with the use of futures contracts are the imperfect correlation between the change in market value of the investments held by the Fund and the prices of futures contracts and the possibility of an illiquid market. Upon entering into a futures contract, the Fund is required to deposit with a futures commission merchant (“FCM”) an amount of cash or U.S. Government or Agency Obligations in accordance with the initial margin requirements of the broker or exchange. Futures contracts are marked to market daily at the most recent settlement price reported by an exchange on which, over time, they are traded most extensively, and an appropriate payable or receivable for the change in value (“variation margin”) is recorded by the Fund. Gains or losses are recognized but not considered realized until the contracts expire or are closed. Futures contracts involve, to varying degrees, risk of loss in excess of the variation margin disclosed on the Statement of Assets and Liabilities; however, the Fund seeks to reduce this risk through the use of an FCM. The Fund, as shown on the Schedule of Investments, had outstanding futures contracts as of December 31, 2014. |
Notes to Financial Statements – (continued)
December 31, 2014
| | Additional | Derivative Instrument Information: |
Fair Value of Derivative Instruments on the Statement of Assets and Liabilities as of December 31, 2014:
| | | | | | | | | | | | | | | | | | | | | | | | | | | | |
| | | Risk Exposure Category | |
| | | Interest Rate
Contracts | | | Foreign
Exchange
Contracts | | | Credit
Contracts | | | Equity
Contracts | | | Commodity
Contracts | | | Other
Contracts | | | Total | |
Liabilities: | | | | | | | | | | | | | | | | | | | | | | | | | | | | |
Variation margin payable(1) | | $ | — | | | $ | — | | | $ | — | | | $ | 79,244 | | | $ | — | | | $ | — | | | $ | 79,244 | |
| | | | | | | | | | | | | | | | | | | | | | | | | | | | |
Total | | $ | — | | | $ | — | | | $ | — | | | $ | 79,244 | | | $ | — | | | $ | — | | | $ | 79,244 | |
| | | | | | | | | | | | | | | | | | | | | | | | | | | | |
| | (1) | Only current day’s variation margin is reported within the Statement of Assets and Liabilities. The variation margin is included in the open futures net cumulative appreciation of $48,672 as reported in the Schedule of Investments. |
The volume of derivatives that is presented in the Schedule of Investments is consistent with the derivative activity during the year ended December 31, 2014.
The Effect of Derivative Instruments on the Statement of Operations for the year ended December 31, 2014:
| | | | | | | | | | | | | | | | | | | | | | | | | | | | |
| | | Risk Exposure Category | |
| | | Interest Rate
Contracts | | | Foreign
Exchange
Contracts | | | Credit
Contracts | | | Equity
Contracts | | | Commodity
Contracts | | | Other
Contracts | | | Total | |
Realized Gain on Derivatives Recognized as a Result of Operations: | | | | | | | | | | | | | |
Net realized gain on futures | | $ | — | | | $ | — | | | $ | — | | | $ | 1,444,101 | | | $ | — | | | $ | — | | | $ | 1,444,101 | |
| | | | | | | | | | | | | | | | | | | | | | | | | | | | |
Total | | $ | — | | | $ | — | | | $ | — | | | $ | 1,444,101 | | | $ | — | | | $ | — | | | $ | 1,444,101 | |
| | | | | | | | | | | | | | | | | | | | | | | | | | | | |
| | |
Net Change in Unrealized Appreciation (Depreciation) on Derivatives Recognized as a Result of Operations: | | | | | | | | | |
Net change in unrealized appreciation of futures | | $ | — | | | $ | — | | | $ | — | | | $ | (243,976 | ) | | $ | — | | | $ | — | | | $ | (243,976 | ) |
| | | | | | | | | | | | | | | | | | | | | | | | | | | | |
Total | | $ | — | | | $ | — | | | $ | — | | | $ | (243,976 | ) | | $ | — | | | $ | — | | | $ | (243,976 | ) |
| | | | | | | | | | | | | | | | | | | | | | | | | | | | |
The derivatives held by the Fund as of December 31, 2014 are not subject to a master netting arrangement; therefore, no balance sheet offsetting disclosure is presented.
The market values of equity securities, such as common stocks and preferred stocks, or equity related investments, such as futures and options, may decline due to general market conditions which are not specifically related to a particular company, such as real or perceived adverse economic conditions, changes in the general outlook for corporate earnings, changes in interest or currency rates or adverse investor sentiment generally. The market value of equity securities may also decline due to factors which affect a particular industry or industries, such as labor shortages or increased production costs and competitive conditions within an industry. Equity securities and equity related investments generally have greater market price volatility than fixed income securities.
The Fund may be exposed to counterparty risk, or the risk that an institution or other entity with which the Fund has unsettled or open transactions will default.
| | a) | Federal Income Taxes – For federal income tax purposes, the Fund intends to continue to qualify as a regulated investment company (“RIC”) under Subchapter M of the Internal Revenue Code (“IRC”) by distributing substantially all of its taxable net investment income and net realized capital gains to its shareholders and otherwise complying with the requirements of the IRC. The Fund has distributed substantially all of its income and capital gains in prior years, if applicable, and intends to distribute substantially all of its income and capital gains prior to the next fiscal year-end. Accordingly, no provision for federal income or excise taxes has been made in the accompanying financial statements. Distributions from short-term capital gains are treated as ordinary income distributions for federal income tax purposes. |
Notes to Financial Statements – (continued)
December 31, 2014
| | b) | Net Investment Income (Loss), Net Realized Gains (Losses) and Distributions – Net investment income (loss) and net realized gains (losses) may differ for financial statement and tax purposes primarily because of losses deferred due to wash sale adjustments, adjustments related to REITs, certain derivatives and corporate actions. The character of distributions made during the year from net investment income or net realized gains may differ from their ultimate characterization for federal income tax purposes. Also, due to the timing of dividend distributions, the fiscal year in which amounts are distributed may differ from the year that the income or realized gains (losses) were recorded by the Fund. |
| | c) | Distributions and Components of Distributable Earnings – The tax character of distributions paid by the Fund for the periods indicated is as follows (as adjusted for dividends payable, if applicable): |
| | | | | | | | |
| | | For the Year Ended
December 31, 2014 | | | For the Year Ended
December 31, 2013 | |
Ordinary Income | | $ | 16,474,848 | | | $ | 18,051,175 | |
Long-Term Capital Gains(1) | | | 51,957,628 | | | | — | |
| | (1) | The Fund designate these distributions as long-term capital dividends per IRC code Sec. 852(b) (3) (C). |
As of December 31, 2014, the Fund’s components of distributable earnings (deficit) on a tax basis were as follows:
| | | | |
| | | Amount | |
Undistributed Ordinary Income | | $ | 4,942,017 | |
Undistributed Long-Term Capital Gain | | | 13,027,448 | |
Unrealized Appreciation (Depreciation)(1) | | | 503,746,300 | |
| | | | |
Total Accumulated Earnings (Deficit) | | $ | 521,715,765 | |
| | | | |
| | (1) | Differences between book-basis and tax-basis unrealized appreciation (depreciation) may be attributable to the losses deferred due to wash sale adjustments, and adjustments related to REITs, certain derivatives and corporate actions. |
| | d) | Reclassification of Capital Accounts – The Fund may record reclassifications in its capital accounts. These reclassifications have no impact on the total net assets of the Fund. The reclassifications are a result of permanent differences between U.S. GAAP and tax accounting for such items as REITs and corporate actions. Adjustments are made to reflect the impact these items have on current and future distributions to shareholders. Therefore, the source of the Fund’s distributions may be shown in the accompanying Statement of Changes in Net Assets as from undistributed net investment income, from accumulated net realized gains on investments or from capital depending on the type of book and tax differences that exist. For the year ended December 31, 2014, the Fund recorded reclassifications to increase (decrease) the accounts listed below: |
| | | | |
| | | Amount | |
Paid In Capital | | $ | (2 | ) |
Undistributed Net Investment Income | | | (260,376 | ) |
Accumulated Net Realized Loss | | | 260,378 | |
| | e) | Capital Loss Carryforward – On December 22, 2010, the Regulated Investment Company Modernization Act of 2010 (the “Act”) was enacted, which made changes to the capital loss carryforward rules. The changes are effective for taxable years beginning after the date of enactment. Under the Act, funds are permitted to carry forward capital losses for an unlimited period. However, any losses incurred during those future taxable years will be required to be utilized prior to the losses incurred in pre-enactment taxable years, which carry an expiration date. As a result of this ordering rule, pre-enactment capital loss carryforwards may be more likely to expire unused. Additionally, capital loss carryforwards retain their character as either short-term or long-term capital losses rather than being considered all short-term as permitted under prior regulation. |
Notes to Financial Statements – (continued)
December 31, 2014
The Fund had no capital loss carryforward for U.S. federal income tax purposes as of December 31, 2014.
| | f) | Accounting for Uncertainty in Income Taxes – The Fund has adopted financial reporting rules that require the Fund to analyze all open tax years, as defined by the statute of limitations, for all major jurisdictions. Generally, tax authorities can examine all tax returns filed for the last three years. The Fund does not have an examination in progress. |
The Fund has reviewed all open tax years and major jurisdictions and concluded that these financial reporting rules had no effect on the Fund’s financial position or results of operations. There is no tax liability resulting from unrecognized tax benefits relating to uncertain income tax positions taken or expected to be taken on the tax return for the fiscal year ended. The Fund is also not aware of any tax positions for which it is reasonably possible that the total amounts of unrecognized tax benefits will significantly change in the next twelve months.
| | a) | Investment Management Agreement – Prior to October 20, 2014, Hartford Funds Management Company, LLC (“HFMC”), an indirect wholly owned subsidiary of The Hartford Financial Services Group, Inc. (“The Hartford”) served as the Fund’s investment manager pursuant to an Investment Management Agreement with Hartford Series Fund, Inc. (“HSF”) HFMC contracted with Hartford Investment Management Company (“Hartford Investment Management”) under a sub-advisory agreement for the provision of day-to-day investment management services to the Fund in accordance with the Fund’s investment objective and policies. The Fund paid a fee to the investment manager, a portion of which was used to compensate Hartford Investment Management. As a result of the Reorganization, effective October 20, 2014, Hartford Investment Management serves as the Fund’s investment manager pursuant to an Investment Management Agreement with the Trust. Hartford Investment Management is a wholly owned subsidiary of The Hartford. The investment manager provides day-to-day investment management services to the Fund and has overall investment supervisory responsibility for the Fund. In addition, the investment manager provides administrative personnel, services, equipment, facilities and office space for operation of the Fund. |
The schedule below reflects the rates of compensation paid to the investment manager for investment management services rendered as of December 31, 2014; the rates are accrued daily and paid monthly.
| | | | |
Average Daily Net Assets | | Annual Fee | |
On first $2 billion | | | 0.3000% | |
On next $3 billion | | | 0.2000% | |
On next $5 billion | | | 0.1800% | |
Over $10 billion | | | 0.1700% | |
The above schedule did not change following the Reorganization. Hartford Investment Management has contractually agreed to reimburse expenses (exclusive of taxes, interest expense, brokerage commission, acquired fund fees and expenses and extraordinary expenses) to the extent necessary to maintain total annual expenses of the Fund as follows; 0.33% for Class IA and 0.58% for Class IB. This contractual arrangement will remain in effect until April 30, 2016 and shall renew automatically for one-year terms, unless Hartford Investment Management provides written notice of termination prior to the start of the next term or upon approval by the Board of Trustees of the Fund.
| | b) | Accounting Services Agreement – Prior to October 20, 2014 pursuant to the Fund Accounting Agreement between HFMC and HSF, on behalf of the Fund, HFMC provided accounting services to the Fund and received monthly compensation based on the Fund’s average daily net assets at the rates set forth below. The Fund’s accounting services fees were accrued daily and paid monthly. |
| | | | |
Average Daily Net Assets | | Annual Fee | |
All Assets | | | 0.010% | |
Effective October 20, 2014, State Street Bank and Trust Company provides the Fund with accounting services pursuant to a fund accounting agreement by and between the Trust, on behalf of the Fund, and State Street Bank and Trust Company. The amount paid for accounting services can be found in the Statement of Operations. These fees are accrued daily and paid monthly.
Notes to Financial Statements – (continued)
December 31, 2014
| | c) | Operating Expenses – Allocable expenses incurred by the Trust are allocated to the Fund and allocated to classes within the Fund in proportion to the average daily net assets of the Fund and each class, except where allocation of certain expenses is more fairly made directly to the Fund or to specific classes within the Fund. |
| | d) | Distribution Plan for Class IB shares – Prior to October 20, 2014, Hartford Funds Distributors, LLC (“HFD”), an indirect, wholly owned, subsidiary of The Hartford, was the principal underwriter and distributor of the Fund. Effective October 20, 2014, HIMCO Distribution Services Company (“HDSC”), a wholly owned subsidiary of The Hartford, is the principal underwriter and distributor of the Fund. The Trust, on behalf of the Fund, has adopted a Distribution Plan pursuant to Rule 12b-1 of the 1940 Act for Class IB shares for services rendered and expenses borne in connection with activities primarily intended to result in the sale of the Class IB shares. |
The Distribution Plan provides that the Fund may pay annually up to 0.25% of the average daily net assets of the Fund attributable to its Class IB shares for activities primarily intended to result in the sale of Class IB shares. The Board of Trustees has the authority to suspend or reduce these payments at any point in time. Under the terms of the Distribution Plan and the principal underwriting agreement, the Fund is authorized to make payments monthly to the distributor that may be used to pay or reimburse entities providing distribution and shareholder servicing with respect to the Class IB shares for such entities’ fees or expenses incurred or paid in that regard. The distribution fee paid during the period can be found on the Statement of Operations. These fees are accrued daily and paid monthly or at such other intervals as the Board of Trustees may determine.
| | e) | Other Related Party Transactions – Prior to October 20, 2014, Hartford Administrative Services Company (“HASCO”), an indirect wholly owned subsidiary of The Hartford, provided transfer agent services to the Fund. HASCO was compensated on a per account basis for providing such services. Effective October 20, 2014, State Street Bank and Trust Company provides transfer agent services to the Fund. The transfer agent is reimbursed for out-of-pocket expenses and other costs associated with the services it provides to the Fund, including costs invoiced by sub-contractors. Hartford Investment Management and its affiliates may pay, out of their own assets, compensation to third-party administrators for recordkeeping and other administrative services. The amount paid for transfer agent services can be found in the Statement of Operations. These fees are accrued daily and paid monthly. |
| | f) | Trustee Fees – The Board of Trustees is responsible for oversight of the Fund. The Board of Trustees elects officers who are responsible for the day to day operations of the Fund. The Board of Trustees oversees the investment manager and the other principal service providers of the Fund. The Board of Trustees currently holds four regularly scheduled meetings throughout each year. In addition, the Board of Trustees may hold special meetings at other times either in person or by telephone. The Trustee fees paid during the period can be found in the Statement of Operations. |
| 8. | Investment Transactions: |
For the year ended December 31, 2014, the aggregate cost of purchases and sales of investment securities (excluding short-term investments) were as follows:
| | | | |
| | | Amount | |
Cost of Purchases Excluding U.S. Government Obligations | | $ | 40,487,976 | |
Sales Proceeds Excluding U.S. Government Obligations | | | 112,687,954 | |
Reorganization of Hartford Index HLS Fund (the “Index Fund”) into the Fund: At a meeting held on May 6, 2014, the Board of Directors of the Index Fund approved on behalf of the Index Fund, the reorganization of the Index Fund, with and into the HIMCO VIT Index Fund (the “Fund”). The Fund is a newly organized series of the Trust.
Under the terms of the Agreement and Plan of Reorganization, the assets and liabilities of the Index Fund were acquired by the Fund immediately before the opening of business on October 20, 2014. The Fund acquired the assets and liabilities of the Index Fund in exchange for shares in the Fund, which were distributed pro rata by the Index Fund to shareholders, in complete liquidation of the Index Fund.
Notes to Financial Statements – (continued)
December 31, 2014
This merger was accomplished by tax free exchange as detailed below:
| | | | | | | | | | | | | | | | | | | | |
| | | Net assets of Index
Fund on
October 17, 2014* | | | Net assets of
Fund
immediately
before merger | | | Net assets of
Fund
immediately
after merger | | | Index Fund
shares exchanged | | | Fund shares
issued to the
Index Fund’s
shareholders | |
Class IA | | $ | 712,657,995 | | | $ | — | | | $ | 712,657,995 | | | $ | 18,988,078 | | | $ | 18,988,078 | |
Class IB | | | 436,595,132 | | | | — | | | | 436,595,132 | | | | 11,695,541 | | | | 11,695,541 | |
| | | | | | | | | | | | | | | | | | | | |
Total | | $ | 1,149,253,127 | | | $ | — | | | $ | 1,149,253,127 | | | $ | 30,683,619 | | | $ | 30,683,619 | |
| | | | | | | | | | | | | | | | | | | | |
| | * | Final day of operations prior to merger. |
Assuming the acquisition had been completed on January 1, 2014, the beginning of the annual reporting period of the Fund, the Fund’s pro forma results of operations for the year ended December 31, 2014, are as follows:
| | | | | | | | | | | | |
| | | Net Investment
Income | | | Net Realized and
Unrealized gain
on investments | | | Net increase in
net assets
resulting from
operations | |
The Fund | | $ | 19,641,665 | | | $ | 129,407,369 | | | $ | 149,049,034 | |
Because the combined investment portfolio has been managed as a singled integrated portfolio since the Reorganization was completed, it is not practicable to separate the amounts of revenue and earnings of the Index Fund that have been included in the Statement of Operations since October 20, 2014.
| 10. | Appointment of Independent Registered Public Accounting Firm: |
In connection with an Agreement and Plan of Reorganization (the “Reorganization Plan”), the Board of Trustees of the Fund, with the approval and recommendation of the Audit Committee, appointed Deloitte & Touche LLP to serve as the Fund’s independent registered public accounting firm for the fiscal year ending December 31, 2014. Prior to the Reorganization, Ernst & Young LLP served as the Index Fund’s independent registered public accounting firm, whereby Ernst & Young LLP completed the audit of the Index Fund’s financial statements for the fiscal year ended December 31, 2013.
| 11. | Shareholder Meeting Results: |
A special meeting of Shareholders of the Fund was held on September 15, 2014 (“Shareholder Meeting”). The proposal was to approve the Reorganization Plan providing for the acquisition of all of the assets and liabilities of the Index Fund by the Fund, a series of the Trust, solely in exchange for shares of the Fund, followed by the distribution on a pro rata basis of the Fund’s shares to current shareholders of the Index Fund and the complete liquidation of the Index Fund. The final results of the Shareholder Meeting are reported below:
| | | | | | | | |
For | | Against | | | Abstain | |
16,692,681 | | | 981,332 | | | | 1,788,404 | |
| 12. | Pending Legal Proceedings: |
On June 2, 2011, a complaint was filed against Hartford Investment Management Company in the United States District Court of Connecticut (Deutsche Bank Trust Company Americas v. Aetna, Inc., ING Investment Trust Co., Milan E. Chilla, Hartford Investment Management Co., and UBS AG (D. Conn.)). In a similar action, plaintiffs filed a complaint listing The Hartford Index HLS Fund, which was merged into HIMCO VIT Index Fund in October, 2014, as members of the defendant class (The Official Committee of Unsecured Creditors of Tribune Company v. Fitzsimons, et al. (Bankr. D. Del.)). The complaints relate to the bankruptcy of the Tribune Company, which was a public company that repurchased its shares in a leveraged buyout in 2007, but entered bankruptcy a year later. The plaintiffs in each case allege that the repurchase of shares acted as a fraudulent transfer. The plaintiffs in each case seek to recover from each class member the amount of consideration received in the buyout. The Hartford Index HLS Fund held 23,987 shares and received $815,558 in the buyout. The Hartford Index HLS Fund is listed as a member of the defendant class in an exhibit to the Complaint. Each action was transferred to
Notes to Financial Statements – (concluded)
December 31, 2014
the United States District Court for the Southern District of New York. In September 2013, the court dismissed the Deutsche Bank Trust Company Americas action. Plaintiffs appealed and the appeals court has not yet rendered a decision. Defendants filed a motion to dismiss The Official Committee of Unsecured Creditors of Tribune Company action, but the court has not yet issued a decision. The Hartford intends to vigorously defend these actions.
| 13. | Recent Accounting Pronouncement: |
In June 2014, the Financial Accounting Standards Board (FASB) issued Accounting Standards Update (ASU) No. 2014-11, Transfers and Servicing (Topic 860): Repurchase-to-Maturity Transactions, Repurchase Financings, and Disclosures, modifying Accounting Standards Codification Topic 860. The amended guidance changes the accounting for repurchase-to-maturity transactions and repurchase financing arrangements. The guidance also requires new disclosures for certain transfers accounted for as sales and collateral supporting transactions that are accounted for as secured borrowings. ASU 2014-11 is effective for annual and interim periods beginning after December 15, 2014, except for the disclosures related to secured borrowings, which are effective for annual periods beginning after December 15, 2014, and for interim periods beginning after March 15, 2015. The adoption of ASU 2014-11 is not expected to have a material impact on the Fund’s results of operations or financial position, but may impact the Fund’s disclosures.
Under the Trust’s organizational documents, the Trust shall indemnify its officers and trustees to the full extent required or permitted under Delaware Statutory Trust Act and the federal securities laws. In addition, the Trust, on behalf of the Fund, may enter into contracts that contain a variety of indemnifications. The Trust’s maximum exposure under these arrangements is unknown. However, as of the date of these financial statements the Trust has not had prior claims or losses pursuant to these contracts and expects the risk of loss to be remote.
Management has evaluated the need for disclosures and/or adjustments resulting from subsequent events through the date the Financials Statements were issued. Based on this evaluation, no disclosures other than that noted above were required to the Financial Statements as of December 31, 2014.
Financial Highlights
| | | | | | | | | | | | | | | | | | | | | | | | | | | | | | | | | | | | | | | | | | | | | | | | | | | | |
| | | — Selected Per-Share Data(1) — | | | — Ratios and Supplemental Data — | |
Class | | Net Asset
Value at,
Beginning
of Period | | | Net
Investment
Income
(Loss) | | | Net
Realized
and
Unrealized
Gain (Loss)
on
Investments | | | Total from
Investment
Operations | | | Dividends
from Net
Investment
Income | | | Distributions
from
Realized
Gain
on
Investments | | | Total
Dividends
and
Distributions | | | Net
Asset
Value
End of
Period | | | Total
Return(2) | | | Net
Assets at
End of
Period
(000s) | | | Ratio of
Expenses
to
Average
Net
Assets
Before
Waivers(3) | | | Ratio of
Expenses
to
Average
Net
Assets
After
Waivers(3) | | | Ratio of
Net
Investment
Income
(Loss) to
Average
Net Assets | |
| HIMCO VIT Index Fund | | | | | | | | | | | | | | | | | | | | | | | | | | | | | | | | | |
For the Year Ended December 31, 2014 | | | | | | | | | | | | | | | | | | | | | | | | | | | | | | | | | | | | | |
IA | | $ | 38.54 | | | $ | 0.69 | | | $ | 4.23 | | | $ | 4.92 | | | $ | (0.58 | ) | | $ | (1.77 | ) | | $ | (2.35 | ) | | $ | 41.11 | | | | 13.33 | % | | $ | 760,768 | | | | 0.33 | % | | | 0.33 | % | | | 1.74 | % |
IB | | | 38.35 | | | | 0.59 | | | | 4.19 | | | | 4.78 | | | | (0.50 | ) | | | (1.77 | ) | | | (2.27 | ) | | | 40.86 | | | | 13.01 | | | | 467,467 | | | | 0.58 | | | | 0.58 | | | | 1.49 | |
| | | | | | | | | |
For the Year Ended December 31, 2013(4) | | | | | | | | | | | | | | | | | | | | | | | | | | | | | | | | | | | | | |
IA | | $ | 29.69 | | | $ | 0.62 | | | $ | 8.85 | | | $ | 9.47 | | | $ | (0.62 | ) | | $ | — | | | $ | (0.62 | ) | | $ | 38.54 | | | | 31.95 | % | | $ | 763,868 | | | | 0.33 | % | | | 0.33 | % | | | 1.79 | % |
IB | | | 29.56 | | | | 0.53 | | | | 8.80 | | | | 9.33 | | | | (0.54 | ) | | | — | | | | (0.54 | ) | | | 38.35 | | | | 31.61 | | | | 413,119 | | | | 0.58 | | | | 0.58 | | | | 1.54 | |
| | | | | | | | | |
For the Year Ended December 31, 2012(4)(5) | | | | | | | | | | | | | | | | | | | | | | | | | | | | | | | | | | | | | |
IA | | $ | 26.20 | | | $ | 0.61 | | | $ | 3.48 | | | $ | 4.09 | | | $ | (0.60 | ) | | $ | — | | | $ | (0.60 | ) | | $ | 29.69 | | | | 15.63 | % | | $ | 691,786 | | | | 0.33 | % | | | 0.33 | % | | | 1.98 | % |
IB | | | 26.09 | | | | 0.49 | | | | 3.51 | | | | 4.00 | | | | (0.53 | ) | | | — | | | | (0.53 | ) | | | 29.56 | | | | 15.34 | | | | 307,129 | | | | 0.58 | | | | 0.58 | | | | 1.75 | |
| | | | | | | | | |
For the Year Ended December 31, 2011(4)(5) | | | | | | | | | | | | | | | | | | | | | | | | | | | | | | | | | | | | | |
IA | | $ | 26.20 | | | $ | 0.52 | | | $ | (0.05 | ) | | $ | 0.47 | | | $ | (0.47 | ) | | $ | — | | | $ | (0.47 | ) | | $ | 26.20 | | | | 1.81 | % | | $ | 673,275 | | | | 0.33 | % | | | 0.33 | % | | | 1.74 | % |
IB | | | 26.08 | | | | 0.39 | | | | 0.03 | | | | 0.42 | | | | (0.41 | ) | | | — | | | | (0.41 | ) | | | 26.09 | | | | 1.60 | | | | 232,459 | | | | 0.58 | | | | 0.58 | | | | 1.51 | |
| | | | | | | | | |
For the Year Ended December 31, 2010(4)(5) | | | | | | | | | | | | | | | | | | | | | | | | | | | | | | | | | | | | | |
IA | | $ | 23.22 | | | $ | 0.44 | | | $ | 2.97 | | | $ | 3.41 | | | $ | (0.43 | ) | | $ | — | | | $ | (0.43 | ) | | $ | 26.20 | | | | 14.73 | % | | $ | 809,629 | | | | 0.34 | % | | | 0.34 | % | | | 1.73 | % |
IB | | | 23.12 | | | | 0.34 | | | | 2.99 | | | | 3.33 | | | | (0.37 | ) | | | — | | | | (0.37 | ) | | | 26.08 | | | | 14.45 | | | | 209,260 | | | | 0.59 | | | | 0.59 | | | | 1.48 | |
| (1) | Information presented relates to a share outstanding throughout the indicated period. Net investment income (loss) per share amounts are calculated based on average shares outstanding unless otherwise noted. |
| (2) | The figures do not include sales charges or other fees which may be applied at the variable life insurance, variable annuity or qualified retirement plan product level. Any such additional sales charges or other fees would lower the Fund’s performance. |
| (3) | Adjustments include waivers and reimbursements, if applicable. |
| (4) | See Note 10 in the accompanying Notes to Financial Statements. |
| (5) | Net investment income (loss) per share amounts have been calculated using the SEC method. |
| | | | |
| | | Portfolio Turnover
Rate for
All Share Classes | |
For the year ended December 31, 2014 | | | 3 | % |
For the year ended December 31, 2013(1) | | | 3 | |
For the year ended December 31, 2012(1) | | | 7 | |
For the year ended December 31, 2011(1) | | | 3 | |
For the year ended December 31, 2010(1) | | | 4 | |
| (1) | See Note 10 in the accompanying Notes to Financial Statements. |
|
| Report of Independent Registered Public Accounting Firm |
To the Board of Trustees of HIMCO Variable Insurance Trust and the Shareholders of
HIMCO VIT Index Fund (formerly Hartford Index HLS Fund)
We have audited the accompanying statement of assets and liabilities, including the schedule of investments, of HIMCO VIT Index Fund (formerly Hartford Index HLS Fund) (the “Fund”), a series of the HIMCO Variable Insurance Trust, as of December 31, 2014, and the related statement of operations, statement of changes in net assets, and the financial highlights for the year then ended. These financial statements and financial highlights are the responsibility of the Fund’s management. Our responsibility is to express an opinion on these financial statements and financial highlights based on our audit. The statement of changes in net assets of the Fund for the year ended December 31, 2013 and the financial highlights for each of the four years in the period then ended were audited by other auditors whose report, dated February 17, 2014, expressed an unqualified opinion on that statement and financial highlights.
We conducted our audit in accordance with the standards of the Public Company Accounting Oversight Board (United States). Those standards require that we plan and perform the audit to obtain reasonable assurance about whether the financial statements and financial highlights are free of material misstatement. The Fund is not required to have, nor were we engaged to perform, an audit of its internal control over financial reporting. Our audit included consideration of internal control over financial reporting as a basis for designing audit procedures that are appropriate in the circumstances, but not for the purpose of expressing an opinion on the effectiveness of the Fund’s internal control over financial reporting. Accordingly, we express no such opinion. An audit also includes examining, on a test basis, evidence supporting the amounts and disclosures in the financial statements, assessing the accounting principles used and significant estimates made by management, as well as evaluating the overall financial statement presentation. Our procedures included confirmation of securities owned as of December 31, 2014, by correspondence with the custodians and brokers; when replies were not received from brokers, we performed other auditing procedures. We believe that our audit provides a reasonable basis for our opinion.
In our opinion, the financial statements and financial highlights referred to above present fairly, in all material respects, the financial position of HIMCO VIT Index Fund (formerly Hartford Index HLS Fund), a series of the HIMCO Variable Insurance Trust, as of December 31, 2014, the results of its operations, the changes in its net assets, and the financial highlights for the year then ended, in conformity with accounting principles generally accepted in the United States of America.
Deloitte & Touche LLP
Boston, Massachusetts
February 17, 2015
Trustees and Officers (Unaudited)
The Board of Trustees and officers of the Trust, their business addresses, principal occupations for at least the past five years and years of birth are listed in the tables below. The Trust’s Board of Trustees (i) provides broad supervision over the affairs of the Trust and the Fund and (ii) elects officers who are responsible for the day-to-day operations of the Fund and the execution of policies formulated by the Board of Trustees. The first table below provides information about those trustees who are deemed not to be “interested persons” of the Trust, as that term is defined in the 1940 Act (i.e., “non-interested trustees”), while the second table below provides information about the Trust’s “interested” trustees and the Trust’s officers.
Non-Interested Trustees
| | | | | | | | | | |
| Birth and Address | | Position Held
with the Trust | | Term of Office*
and Length of
Time Served | | Principal Occupation(s)
During Past 5 Years | | Number of
Portfolios
in Fund
Complex
Overseen
by Trustee | | Other Directorships for
Public Companies and Other
Registered Investment
Companies Held By Trustee |
PAUL BRAVERMAN** (1949) c/o Hartford Investment Management Company One Hartford Plaza Hartford, CT 06155 | | Trustee | | Since 2014 | | Mr. Braverman is a private investor. He was a Partner and Chief Financial Officer of Wellington Management Company, LLP until 2007. He currently serves as a board member at Aesir Capital Management and Claren Road Asset Management, investment advisory firms, MPAM USS Credit Fund, a Cayman private fund, and the New England Conservatory. | | 13 | | Mr. Braverman currently serves as Director of Courier Corporation and as an Independent Trustee of GMO Trust (December 2008 to present) (54 funds overseen). |
| | | | | |
MARK OSTERHELD (1955) c/o Hartford Investment Management Company One Hartford Plaza Hartford, CT 06155 | | Trustee | | Since 2014 | | Mr. Osterheld is a private investor. Mr. Osterheld was Vice President of Treasury Oversight at Fidelity Investments until 2013. | | 13 | | None. |
| | | | | |
VANESSA WILSON (1959) c/o Hartford Investment Management Company One Hartford Plaza Hartford, CT 06155 | | Trustee | | Since 2014 | | Ms. Wilson is Chief Financial Officer and Managing Director of Golden Seeds LLC, a venture capital firm. Ms. Wilson worked for Deutsche Bank Securities until 2007, where she was a Managing Director and an equity research analyst. | | 13 | | Ms. Wilson currently serves as Director of Protective Life Corporation. |
| * | Term of Office: Each trustee may serve until his or her successor is elected and qualifies. |
| ** | “Interested person”, as defined in the 1940 Act, of the Trust for a portion of 2014 because of the person’s beneficial equity ownership of The Hartford Financial Services Group, Inc., an affiliate of Hartford Investment Management. |
Trustees and Officers (Unaudited) – (continued)
Officers and Interested Trustees
| | | | | | | | | | |
Name, Year of Birth
and Address | | Position held
with the Trust | | Term of Office*
and Length of
Time Served | | Principal Occupation(s)
During Past 5 Years | | Number of
Portfolios
in Fund
Complex
Overseen
by Trustee | | Other Directorships
Held by Trustee |
BRION JOHNSON** (1960) c/o Hartford Investment Management Company One Hartford Plaza Hartford, CT 06155 | | Trustee and Chairman of the Board | | Since 2014 | | Mr. Johnson serves as President of Hartford Investment Management and Talcott Resolution a segment of The Hartford. From 2011 to 2012, Mr. Johnson served as a Managing Director, Chief Financial Officer and Head of Strategy and Development for Hartford Investment Management. Prior to joining Hartford Investment Management, Mr. Johnson served as Managing Member of Shoreline Arts and Publishing, LLC, a publishing and marketing business. From 2001 to 2008, Mr. Johnson was Executive Vice President and Head of Portfolio Management of PPM America, an affiliate of Prudential, plc. | | 13 | | None. |
| | | | | |
HUGH WHELAN** (1960) c/o Hartford Investment Management Company One Hartford Plaza Hartford, CT 06155 | | Trustee | | Since 2014 | | Mr. Whelan is a private investor. Mr. Whelan was the Head of Quantitative Equities and Interim President of Hartford Investment Management until 2012. Prior to joining Hartford Investment Management, Mr. Whelan was the Head of Quantitative Equities at ING Investment Management from 2001 to 2005. | | 13 | | None. |
| | | | | |
PETER SANNIZZARO (1966) c/o Hartford Investment Management Company One Hartford Plaza Hartford, CT 06155 | | Treasurer | | Since 2014 | | Mr. Sannizzaro currently serves as Senior Vice President and Chief Financial Officer Hartford Life Insurance Company (“Hartford Life”) and Hartford Investment Management. From 2011 to 2014, Mr. Sannizzaro served as Senior Vice President of Hartford Life and Chief Financial Officer to various divisions within Hartford Life. From 2008 to 2011, Mr. Sannizzaro served as a Vice President of Finance Executive Management at Hartford Life. | | N/A | | N/A |
| | | | | |
ROBERT LEWTON (1971) c/o Hartford Investment Management Company One Hartford Plaza Hartford, CT 06155 | | Chief Compliance Officer | | Since 2014 | | Mr. Lewton currently serves as Chief Compliance Officer of Hartford Investment Management Company. Prior to 2010, he served as Senior Counsel in the Investment Law Group at Hartford Investment Management Company. | | N/A | | N/A |
| * | Term of Office: Each officer and Trustee may serve until his or her successor is elected and qualifies. |
| ** | “Interested person”, as defined in the 1940 Act, of the Trust because of the person’s affiliation with, or equity ownership of, Hartford Investment Management or affiliated companies. |
Trustees and Officers (Unaudited) – (concluded)
| | | | | | | | | | |
Name, Year of Birth
and Address | | Position held
with the Trust | | Term of Office*
and Length of
Time Served | | Principal Occupation(s)
During Past 5 Years | | Number of
Portfolios
in Fund
Complex
Overseen
by Trustee | | Other Directorships
Held by Trustee |
BRENDA PAGE (1965) c/o Hartford Investment Management Company One Hartford Plaza Hartford, CT 06155 | | Secretary | | Since 2014 | | Ms. Page currently serves as Vice President and Assistant General Counsel of The Hartford and Director of the Investment Law Group of Hartford Investment Management. | | N/A | | N/A |
| | | | | |
MATTHEW POZNAR (1959) c/o Hartford Investment Management Company One Hartford Plaza Hartford, CT 06155 | | President | | Since 2014 | | Mr. Poznar currently serves as an Executive Vice President in the General Account Portfolio Management Group of Hartford Investment Management. | | N/A | | N/A |
HOW TO OBTAIN A COPY OF THE FUND’S PROXY VOTING POLICIES AND VOTING RECORDS (UNAUDITED)
A description of the policies and procedures that the Fund uses to determine how to vote proxies relating to portfolio securities and information about how the Fund voted proxies relating to portfolio securities during the most recent twelve-month period ended June 30 are available (1) without charge, upon request, by calling 888-843-7824 and (2) on the SEC’s website at http://www.sec.gov.
QUARTERLY PORTFOLIO HOLDINGS INFORMATION (UNAUDITED)
The Fund files a complete schedule of portfolio holdings with the SEC for the first and third quarters of each fiscal year on Form N-Q. The Fund’s Forms N-Q are available (1) without charge, upon request, by calling 888-843-7824 and (2) on the SEC’s website at http://www.sec.gov. The Form N-Q may be reviewed and copied at the SEC’s Public Reference Room in Washington, DC. Information on the operation of the PublicReference Room may be obtained by calling 1-800-SEC-0330.
| * | Term of Office: Each officer and Trustee may serve until his or her successor is elected and qualifies. |
Expense Example (Unaudited)
Your Fund’s Expenses
As a shareholder of a Fund, you incur two types of costs: (1) transaction costs and (2) ongoing costs, including investment management fees, distribution and/or service (12b-1) fees, if any, and other fund expenses. This example is intended to help you understand your ongoing costs (in dollars) of investing in a Fund and to compare these costs with the ongoing costs of investing in other mutual funds. The example is based on an investment of $1,000 invested at the beginning of the period and held for the entire period of July 1, 2014 through December 31, 2014.
Actual Expenses
The first set of rows of the table below provides information about actual account values and actual expenses. You may use the information in this row, together with the amount you invested, to estimate the expenses that you paid over the period. Simply divide your account value by $1,000 (for example, an $8,600 account value divided by $1,000 = 8.6), then multiply the result by the number in the line under the heading entitled “Expenses Paid During Period” to estimate the expenses you paid on your account during this period.
Hypothetical Example for Comparison Purposes
The second set of rows of the table below provides information about hypothetical account values and hypothetical expenses based on a Fund’s actual expense ratio and an assumed rate of return of 5% per year before expenses, which is not the Fund’s actual return. The hypothetical account values and expenses may not be used to estimate the actual ending account balance or expenses you paid for the period. You may use this information to compare the ongoing costs of investing in a Fund and other funds. To do so, compare this 5% hypothetical example with the 5% hypothetical examples that appear in the shareholder reports of the other funds.
Please note that the expenses shown in the table are meant to highlight your ongoing costs only and do not reflect any transactional costs, such as sales charges (loads) or fees which may be applied at the variable life insurance, variable annuity, or qualified retirement plan product level. Therefore, the second set of rows of the table is useful in comparing ongoing costs only, and will not help you determine the relative total costs of owning different funds. In addition, if these transactional costs were included, your costs would be higher.
| | | | | | | | | | | | | | | | |
| | | Beginning
Account Value
7/1/14 | | | Ending
Account Value
12/31/14 | | | Expenses Paid
During Period*
7/1/14 - 12/31/14 | | | Annualized
Expense Ratio | |
Actual | | | | | | | | | | | | | | | | |
Class IA | | $ | 1,000 | | | $ | 1,059.40 | | | $ | 1.71 | | | | 0.33 | % |
Class IB | | $ | 1,000 | | | $ | 1,057.80 | | | $ | 2.96 | | | | 0.57 | % |
Hypothetical | | | | | | | | | | | | | | | | |
Class IA | | $ | 1,000 | | | $ | 1,023.54 | | | $ | 1.68 | | | | 0.33 | % |
Class IB | | $ | 1,000 | | | $ | 1,022.33 | | | $ | 2.91 | | | | 0.57 | % |
| * | Expenses are equal to the class’s annualized expense ratio listed in the table above, multiplied by the average account value over the period, multiplied by 184, the number of days in the most recent fiscal half-year, divided by 365, to reflect the one-half year period. |
Approval of New Investment Management Agreement (Unaudited)
Section 15(c) of the Investment Company Act of 1940, as amended (the “1940 Act”), requires that each mutual fund’s board of trustees, including a majority of those trustees who are not “interested persons” of the mutual fund, as defined in the 1940 Act (the “Independent Trustees”), initially approve, and annually review and consider the continuation of, the mutual fund’s investment advisory agreement. At its meeting held on April 30, 2014, the Board of Trustees (the “Board”) of HIMCO Variable Insurance Trust (“HVIT”), including each of the Independent Trustees, unanimously voted to approve an investment management agreement for the Fund with Hartford Investment Management Company (“HIMCO” or the “Adviser”) (the “Agreement”).
Prior to approving the Agreement, the Board requested, received and reviewed written responses from the Adviser to questions posed to the Adviser on behalf of the Trustees and supporting materials relating to those questions and responses.
The Board noted that shareholders of the Hartford Index HLS Fund (the “HLS Fund”), a series of Hartford Series Fund, Inc. (“HSF”), would be asked to approve the reorganization of the HLS Fund into the Fund (the “Reorganization”), with the closing of the Reorganization expected to occur in October 2014.
In determining whether to approve the Agreement for the Fund, the members of the Board reviewed and evaluated information and factors they believed to be relevant and appropriate in light of the information that the Board deemed necessary and appropriate through the exercise of its reasonable business judgment. While individual members of the Board may have weighed certain factors differently, the Board’s determination to approve the Agreement was based on a comprehensive consideration of all information provided to the Board with respect to the approval of the Agreement. A more detailed discussion of the factors the Board considered with respect to its approval of the Agreement is provided below.
Nature, Extent and Quality of Services to be Provided by the Adviser
The Board requested and considered information concerning the nature, extent and quality of the services to be provided to the Fund by the Adviser. In this regard, the Board considered HIMCO’s responsibilities under the Agreement including, among other things, managing the Fund’s assets, assuring compliance with the Fund’s investment objective and limitations, and coordinating services for the Fund among service providers. The Board also discussed the services provided by HIMCO as sub-adviser to the HLS Fund and the benefits to be derived from continuity of investment management services following the Reorganization. The Board considered the Adviser’s organizational structure, systems and personnel as well as the Adviser’s reputation and overall financial strength. Based on these considerations, the Board concluded that it was satisfied with the nature, extent and quality of the services to be provided to the Fund by HIMCO.
Performance of the Fund
The Board considered that the Fund is newly formed and did not have a prior performance record. The Board received presentations from HIMCO regarding the portfolio management team and the investment strategy to be employed in the management of the Fund’s assets. The Board noted that HIMCO served as investment sub-adviser to the HLS Fund and would manage the Fund pursuant to a substantially similar investment objective and strategy. The Board also reviewed the performance track record of the HLS Fund. Based on these considerations, the Board concluded that it was satisfied that HIMCO has the capability of providing satisfactory investment performance for the Fund.
Comparison of Fees and Expenses
The Board requested and reviewed information from HIMCO relating to the proposed management fee and total operating expenses of the Fund. In this regard, the Board reviewed comparisons of the Fund’s proposed management fee and anticipated expense ratio to the management fees and expense ratios of a comparable group of funds previously selected by Lipper, Inc. to assist the board of directors of HSF (the “HSF Board”) in reviewing the HLS Fund’s fees and expenses. The Board noted that the Fund’s management fee schedule and total operating expenses would be consistent with those previously reviewed and approved by the HSF Board and that the Fund would experience the same expense ratio as the HLS Fund through April 30, 2016 due to an expense cap. Based on these considerations, the Board concluded that the Fund’s proposed fees and total operating expenses, in conjunction with the information about quality of services, profitability, economies of scale, and other matters discussed, were reasonable in light of the services to be provided.
Approval of New Investment Management Agreement (Unaudited) – (concluded)
Economies of Scale
The Board discussed HIMCO’s expectations for growth in assets under management and the extent to which economies of scale would be realized over time. The Board considered that since the Fund had not yet commenced operations, material economies of scale may not be achieved in the near term. The Board noted that shareholders of the Fund would benefit from the expense limitation arrangement proposed for the Fund. The Board also considered how any benefits from economies of scale would be realized by the various parties. Based on these considerations, the Board concluded that it was satisfied with the extent to which economies of scale could be expected to be shared for the benefit of the Fund’s future shareholders.
Profitability of the Adviser
The Board considered the level of profits that could be expected to accrue to HMCO with respect to the Fund, including HIMCO’s estimated costs to provide investment management and related services. The Board noted that HIMCO’s actual profitability with respect to the Fund would depend on growth in assets under management. Based on these considerations, the Board concluded that the profits anticipated to be realized by HIMCO and its affiliates from their relationships with the Fund would not be excessive.
Other Benefits
The Board considered other benefits to the Adviser and its affiliates from their relationships with the Fund. The Board also considered that HDSC, an affiliate of HIMCO, will serve as principal underwriter of the Fund. As principal underwriter, HDSC would receive 12b-1 fees from the Fund.
* * * *
Based upon its review of these various factors, among others, the Board concluded that it is in the best interests of the Fund and its shareholders for the Board to approve the Agreement. In reaching this decision, the Board did not assign relative weights to the factors discussed above or deem any one or group of them to be controlling in and of themselves. In connection with their deliberations, the Independent Trustees met separately in executive session with legal counsel to review the relevant materials and consider their responsibilities under relevant laws and regulations.
THIS PRIVACY POLICY IS NOT PART OF THIS REPORT
Privacy Policy and Practices of The Hartford Financial Services Group, Inc. and its Affiliates
(herein called “we, our and us”)
This Privacy Policy applies to our United States Operations
We value your trust. We are committed to the responsible: a) management;
b) use; and
c) protection;
of Personal Information.
This notice describes how we collect, disclose, and protect Personal Information.
We collect Personal Information to:
a) service your Transactions with us; and
b) support our business functions.
We may obtain Personal Information from:
a) You;
b) your Transactions with us; and
c) third parties such as a consumer-reporting agency.
Based on the type of product or service You apply for or get from us, Personal Information such as:
a) your name;
b) your address;
c) your income;
d) your payment; or
e) your credit history;
may be gathered from sources such as applications, Transactions, and consumer reports.
To serve You and service our business, we may share certain Personal Information. We will share Personal Information, only as allowed by law, with affiliates such as:
a) our insurance companies;
b) our employee agents;
c) our brokerage firms; and
d) our administrators.
As allowed by law, we may share Personal Financial Information with our affiliates to:
a) market our products; or
b) market our services;
to You without providing You with an option to prevent these disclosures.
We may also share Personal Information, only as allowed by law, with unaffiliated third parties including:
a) independent agents;
b) brokerage firms;
c) insurance companies;
d) administrators; and
e) service providers;
who help us serve You and service our business.
When allowed by law, we may share certain Personal Financial Information with other unaffiliated third parties who assist us by performing services or functions such as:
a) taking surveys;
b) marketing our products or services; or
c) offering financial products or services under a joint agreement between us and one or more financial institutions.
We, and third parties we partner with, may track some of the pages You visit through the use of:
a) cookies;
b) pixel tagging; or
c) other technologies;
and currently do not process or comply with any web browser’s “do not track” signal or other similar mechanism that indicates a request to disable online tracking of individual users who visit our websites or use our services.
We will not sell or share your Personal Financial Information with anyone for purposes unrelated to our business functions without offering You the opportunity to:
a) “opt-out;” or
b) “opt-in;”
as required by law.
We only disclose Personal Health Information with:
a) your proper written authorization; or
b) as otherwise allowed or required by law.
Our employees have access to Personal Information in the course of doing their jobs, such as:
a) underwriting policies;
b) paying claims;
c) developing new products; or
d) advising customers of our products and services.
We use manual and electronic security procedures to maintain:
a) the confidentiality; and
b) the integrity of;
Personal Information that we have. We use these procedures to guard against unauthorized access.
Some techniques we use to protect Personal Information include:
a) secured files;
b) user authentication;
c) encryption;
d) firewall technology; and
e) the use of detection software.
We are responsible for and must:
a) identify information to be protected;
b) provide an adequate level of protection for that data;
c) grant access to protected data only to those people who must use it in the performance of their job-related duties.
Employees who violate our Privacy Policy will be subject to discipline, which may include ending their employment with us.
At the start of our business relationship, we will give You a copy of our current Privacy Policy.
We will also give You a copy of our current Privacy Policy once a year if You maintain a continuing business relationship with us.
We will continue to follow our Privacy Policy regarding Personal Information even when a business relationship no longer exists between us.
As used in this Privacy Notice:
Application means your request for our product or service.
Personal Financial Information means financial information such as:
a) credit history;
b) income;
c) financial benefits; or
d) policy or claim information.
Personal Health Information means health information such as:
a) your medical records; or
b) information about your illness, disability or injury.
Personal Information means information that identifies You personally and is not otherwise available to the public. It includes:
a) Personal Financial Information; and
b) Personal Health Information.
Transaction means your business dealings with us, such as:
a) your Application;
b) your request for us to pay a claim; and
c) your request for us to take an action on your account.
You means an individual who has given us Personal Information in conjunction with:
a) asking about;
b) applying for; or
c) obtaining;
a financial product or service from us if the product or service is used mainly for personal, family, or household purposes.
This Privacy Policy is being provided on behalf of the following affiliates of The Hartford Financial Services Group, Inc.: 1stAGChoice, Inc.; Access CoverageCorp, Inc.; Access CoverageCorp Technologies, Inc.; American Maturity Life Insurance Company; Archway 60 R, LLC; Business Management Group, Inc.; DMS R, LLC; First State Insurance Company; Fountain Investors I LLC; Fountain Investors II LLC; Fountain Investors III LLC; Fountain Investors IV LLC; FTC Resolution Company LLC; Hart Re Group L.L.C.; Hartford Accident and Indemnity Company; Hartford Administrative Services Company; Hartford Casualty General Agency, Inc.; Hartford Casualty Insurance Company; Hartford Financial Services, LLC; Hartford Fire General Agency, Inc.; Hartford Fire Insurance Company; Hartford Funds Distributors, LLC; Hartford Funds Management Company, LLC; Hartford Funds Management Group, Inc.; Hartford Holdings, Inc.; Hartford HLS Series Fund II, Inc.; Hartford Insurance Company of Illinois; Hartford Insurance Company of the Midwest; Hartford Insurance Company of the Southeast; Hartford Integrated Technologies, Inc.; Hartford International Life Reassurance Corporation; Hartford Investment Management Company; Hartford Life and Accident Insurance Company; Hartford Life and Annuity Insurance Company; Hartford Life Insurance Company; Hartford Life, Inc.; Hartford Life International Holding Company; Hartford Life Private Placement, LLC; Hartford Lloyd’s Corporation; Hartford Lloyd’s Insurance Company; Hartford of Texas General Agency, Inc.; Hartford Residual Market, L.C.C.; Hartford Securities Distribution Company, Inc.; Hartford Series Fund, Inc.; Hartford Specialty Insurance Services of Texas, LLC; Hartford Strategic Investments, LLC; Hartford Underwriters General Agency, Inc.; Hartford Underwriters Insurance Company; Hartford-Comprehensive Employee Benefit Service Company; HDC R, LLC .; Heritage Holdings, Inc.; HIMCO Distribution Services Company; HIMCO Variable Insurance Trust; HLA LLC; HL Investment Advisors, LLC; Horizon Management Group, LLC; HRA Brokerage Services, Inc.; Lanidex Class B, LLC; New England Insurance Company; New England Reinsurance Corporation; Nutmeg Insurance Agency, Inc.; Nutmeg Insurance Company; Pacific Insurance Company, Limited; Planco, LLC; Property and Casualty Insurance Company of Hartford; Revere R, LLC; RVR R, LLC; Sentinel Insurance Company, Ltd.; Sunstone R, LLC; Symphony R, LLC; The Evergreen Group Incorporated; The Hartford Alternative Strategies Fund; The Hartford Mutual Funds, Inc.; The Hartford Mutual Funds II, Inc.; Trumbull Flood Management, L.L.C.; Trumbull Insurance Company; Twin City Fire Insurance Company.
HPP Revised February 2015

A MESSAGE FROM THE PRESIDENT
Dear Shareholders:
Thank you for investing in the HIMCO Variable Insurance Trust (HVIT) funds.
Market Review
U.S. equity and bond markets continued to perform well in 2014. U.S. equities (as represented by the S&P 500 Index1) rose 13.69% for the year, while U.S. bonds (as
represented by the Barclays U.S. Aggregate Bond Index2) rose 5.97%. International markets did not fare as well.
The S&P 500 Index ended the year slightly below its all-time high reached on December 29, 2014. Solid corporate earnings and encouraging U.S. macroeconomic data overcame geopolitical tensions and reduced prospects for growth outside the U.S. The U.S. unemployment rate fell during the year to 5.6%, the lowest level since June 2008. On average nearly 250,000 new jobs were created every month in 2014, 50,000 more per month than in 2013. In the third quarter of 2014, gross domestic product, the most recognized measure of economic growth, rose 5%. The price of a barrel of oil fell nearly 50% during the second half of the year, driving down gasoline prices and providing a lift to consumer spending.
U.S. bond prices benefited from continued low interest rates (bond prices move in the opposite direction of interest rates). Many market participants expected rates to increase as the economy improved and the U.S. Federal Reserve ended quantitative easing. However, sub-par growth in the eurozone and Japan, combined with diminished growth in China, have helped dampen interest rates. Central bankers outside the U.S. are engaging in quantitative easing programs to help stimulate growth, but these moves may also further lower local interest rates and thus increase demand for higher yielding U.S. Treasuries. Weaker growth in the rest of the world may also slow U.S. growth. These outcomes could help keep U.S. interest rates lower for longer.
Looking ahead to 2015, we expect the pace of U.S. growth relative to other economies, along with the actions of central bankers around the world, to be themes of keen interest to investors.
Preparation for whatever markets may deliver is no easy task, and that is why you should consider regular reviews with your financial advisor.
Thank you again for investing with the HIMCO Variable Insurance Trust funds.

Matthew J. Poznar,
President, HVIT
| 1 | The S&P 500 Index is a market capitalization-weighted price index composed of 500 widely held common stocks. |
| 2 | The Barclays U.S. Aggregate Bond Index is an unmanaged index and is composed of securities from the Barclays Government/Credit Bond Index, Mortgage-Backed Securities Index, Asset-Backed Securities Index and Commercial Mortgage-Backed Securities Index. |
HIMCO VIT Portfolio Diversifier Fund
Table of Contents
This report is prepared for the general information of variable annuity and variable life contract owners and qualified retirement plan participants. It is not an offer of contracts or of qualified retirement plans. It should not be used in connection with any offer, except in conjunction with the appropriate product prospectus which contains all pertinent information including the applicable sales, administrative and other charges.
The views expressed in the Fund’s Manager Discussion under “Why did the Fund perform this way?” and “What is the outlook?” are views of the Fund’s adviser and portfolio management team through the end of the period and are subject to change based on market and other conditions. The Fund’s Manager Discussion is for informational purposes only and does not represent an offer, recommendation or solicitation to buy, hold or sell any security. The specific securities identified and described, if any, do not represent all of the securities purchased or sold and you should not assume that investments in the securities identified and discussed will be profitable.
HIMCO VIT Portfolio Diversifier Fund
| | |
(Effective October 20, 2014, Hartford Portfolio Diversifier HLS Fund (the “Predecessor Fund”) was reorganized into HIMCO VIT Portfolio Diversifier Fund (the “Fund”).) (The Fund is advised by Hartford Investment Management Company (“Hartford Investment Management”)) | | Investment objective – The Fund seeks to produce investment performance that mitigates against significant declines in the aggregate value of investment allocations to equity mutual funds under certain variable annuity contracts, while also preserving the potential for modest appreciation in the Fund’s net asset value when markets are appreciating. |
Performance information for periods prior to October 20, 2014 is that of the Predecessor Fund. Hartford Funds Management Company, LLC served as the investment manager to the Predecessor Fund and Hartford Investment Management, the Fund’s adviser, served as sub-adviser to the Predecessor Fund. The Predecessor Fund had the same investment objective and strategies as the Fund.
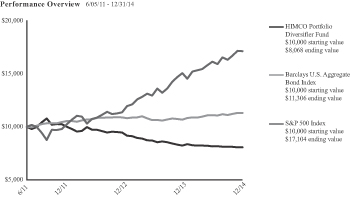
The chart above represents the hypothetical growth of a $10,000 investment in Class IB.
Average Annual Total Returns (as of 12/31/14)
| | | | | | | | |
| | | 1 Year | | | Since
Inception* | |
HIMCO VIT Portfolio Diversifer IB | | | -2.03% | | | | -5.83% | |
Barclays U.S. Aggregate Bond Index | | | 5.97% | | | | 3.50% | |
S&P 500 Index | | | 13.69% | | | | 16.21% | |
PERFORMANCE DATA QUOTED REPRESENTS PAST PERFORMANCE AND DOES NOT GUARANTEE FUTURE RESULTS. The investment return and principal value of the investment will fluctuate so that investors’ shares, when redeemed, may be worth more or less than their original cost. Current performance may be lower or higher than the performance data quoted.
Total returns presented above were calculated using the Fund’s net asset value available to shareholders for sale or redemption of Fund shares on December 31, 2014, which may exclude investment transactions as of this date. All share class returns assume the reinvestment of all distributions at net asset value and the deduction of all fund expenses.
Barclays U.S. Aggregate Bond Index is an unmanaged index and is composed of securities from the Barclays Government/Credit Bond Index, Mortgage-Backed Securities Index, Asset-Backed Securities Index and Commercial Mortgage-Backed Securities Index.
S&P 500 Index is a market capitalization-weighted price index composed of 500 widely held common stocks.
The indices are unmanaged, and their results include reinvested dividends and/or distributions, but do not reflect the effect of sales charges, commissions, expenses or taxes.
You cannot invest directly in an index.
As shown in the Fund’s current prospectus dated October 20, 2014, the net total annual operating expense ratio for Class IB shares was 0.85% and the gross total annual operating expense ratio for Class IB shares was 0.94%. Actual expenses may be higher. Please see the accompanying Financial Highlights for expense ratios for the year ended December 31, 2014.
Gross expenses are the Fund’s total annual operating expenses shown in the Fund’s most recent prospectus. Net expenses are the Fund’s total annual operating expenses shown in the Fund’s most recent prospectus and reflect contractual expense reimbursements in instances when these reductions reduce the Fund’s gross expenses. Contractual reimbursements remain in effect until April 30, 2016, and shall renew automatically for one-year terms unless Hartford Investment Management Company provides written notice of termination prior to the start of the next term or upon approval of the Board of Trustees of the Fund.
The chart and table do not reflect the deductions of taxes, sales charges or other fees which may be applied at the variable life insurance, variable annuity or qualified retirement plan product level. Any such additional sales charges or other fees or expenses would lower the contract’s or plan’s performance.
All investments are subject to risk including the possible loss of principal. The primary risks of investing in the Fund are described below. For more detailed information on the risks associated with an investment in the Fund, please see the prospectus.
The S&P 500 Index is a product of S&P Dow Jones Indices LLC (“SPDJI”), and has been licensed for use by HIMCO Variable Insurance Trust. Standard & Poor’s® and S&P® are registered trademarks of Standard & Poor’s Financial Services LLC (“S&P”); Dow Jones® is a registered trademark of Dow Jones Trademark Holdings LLC (“Dow Jones”); and these trademarks have been licensed for use by SPDJI and sublicensed for certain purposes by HIMCO Variable Insurance Trust. The Fund is not sponsored, endorsed, sold or promoted by SPDJI, Dow Jones, S&P, their respective affiliates, and none of such parties make any representation regarding the advisability of investing in such product(s) nor do they have any liability for any errors, omissions, or interruptions of the S&P 500 Index.
Market and Selection Risk: The Fund’s share price may fluctuate due to market risk and/or security selections that may underperform compared to the market or relevant benchmarks.
Derivatives Risk: Investments in derivatives can be volatile. Potential risks include currency risk, leverage risk (the risk that small market movements may result in large changes in the value of an investment), liquidity risk, index risk, pricing risk, and counterparty risk (the risk that the counterparty may be unwilling or unable to honor its obligations).
Fixed Income Risk: The Fund is subject to interest rate risk (the risk that the value of an investment decreases when interest rates rise) and credit risk (the risk that the issuing company of a security is unable to pay interest and principal when due) and call risk (the risk that an investment may be redeemed early). These risks also apply to the Fund’s investments in U.S. government securities, which may not be guaranteed by the U.S. government.
Fund Strategy Risk: The Fund is available solely to holders of variable annuity contracts issued by Hartford Life and its affiliates and by Forethought Life Insurance Company (“Forethought”) who have elected a guaranteed benefit rider subject to an allocation requiring investment in the Fund (a “Rider”). The Fund is designed to replicate the Portfolio Diversifier Index (the “Index”), which is designed to produce investment performance that may mitigate against significant declines in the values of the equity mutual funds (the “Allocated Funds”) held by Rider holders. Hartford Life and its affiliates and Forethought have financial obligations to holders of the Riders arising from guarantee obligations under the Riders. To the extent that the Fund’s strategy is successful, Hartford Life and its affiliates and Forethought will benefit from a reduction of the risk arising from their guarantee obligations under the Riders, and they will have less risk to hedge under the Riders than would be the case if holders did not allocate to the Fund.
As a holder of a Rider, you also will have exposure to changes in the values of the Allocated Funds, although your particular exposure will differ from the aggregated exposure that the Index is designed to address, depending on your allocations and investment activity, among other factors. Although the Fund may have the effect of mitigating declines in your contract value under a Rider in the event of a significant decline in equity market valuations, the strategy followed by the Fund, if successful, will also generally result in your contract value increasing to a lesser degree than the equity markets, or decreasing, when the values of equity investments are stable or rising. This may deprive you of some or all of the benefit of increases in equity market values under your contract and could also result in a decrease in the value of your variable annuity contract. Depending on future market conditions, you might benefit more from selecting alternative allocations under a guaranteed benefit rider (if available) or alternate investments. In addition, there is no guarantee that the Fund’s strategy will have its intended effect, and it may not work as effectively as is intended. Depending on your particular allocation to the Allocated Funds under a Rider, the Fund’s strategy may be more or less effective in mitigating potential losses under your variable annuity contract than may be the case for others who elect a Rider and allocate contract value differently among the Allocated Funds. In particular, the Fund’s investment strategy is not as likely to be as effective with respect to allocations that have relatively lower anticipated correlation to the investment performance of the S&P 500 Index.
Hartford Life’s and Forethought’s financial interest in reducing the volatility of overall contract value invested under the Riders, in light of their obligations under the Riders, may be deemed to present a potential conflict of interest with respect to the interests of the holders of the Riders, in that Hartford Life’s and Forethought’s interest may at times conflict with the Fund’s goal of preserving the potential for modest appreciation in the Fund’s net asset value when markets are appreciating. Hartford Investment Management and HIMCO Variable Insurance Trust, on behalf of the Fund have developed procedures designed to address this potential conflict by (i) specifying the processes for developing and communicating the data used to calculate the Index, calculating the Index and managing the Fund to replicate the performance of the Index and (ii) monitoring for compliance with the specified processes.
Index and Information Risk: The data used by Hartford Investment Management to calculate the Index may not always be current. To the extent the data, and in particular the market-related data, is outdated or inaccurate, the sleeve consisting of (i) a basket of derivatives that generally will increase in value if the S&P 500 Index decreases significantly in value and will generally decrease in value when the S&P 500 Index remains level or increases in value; and (ii) holdings of Treasury securities and other cash
investments (the “Derivative Sleeve”) may fail to hedge or may hedge less effectively against equity market declines. In addition, when the values of investments are increasing, the Fund’s value could increase to a lesser extent, or decrease to a greater extent, than would be the case if the data used to calculate the Index were current.
In addition, the Index is intended to hedge against the aggregate allocations of holders of the Riders to the Allocated Funds and not the allocation of any individual contract owner. The Derivative Sleeve may not be successful in providing an effective hedge, and the hedge, even if effective, will benefit some Rider holders more than others, depending upon the allocations to funds selected by the holders. In particular, contract owners whose allocations have a relatively higher anticipated correlation to the investment performance of the S&P 500 Index will benefit to a greater extent from the hedge during periods of equity market declines.
|
| HIMCO VIT Portfolio Diversifier Fund |
Manager Discussion
December 31, 2014 (Unaudited)
Portfolio Manager
Paul Bukowski, CFA
Executive Vice President and Head of Quantitative Equities
How did the Fund perform?
The Class IB Shares of the HIMCO VIT Portfolio Diversifier Fund (the “Fund”) returned -2.03% for the 12-month period ending December 31, 2014, compared to the returns of the Barclays U.S. Aggregate Bond Index, which returned 5.97%,1 and the S&P 500 Index, which returned 13.69%, for the same period.2
Why did the Fund perform this way?
The Fund performed in line with expectations, which is performance generally “contra” to that of the equity markets, as measured by the S&P 500 Index. The Fund generally invests in securities which increase in value as the S&P 500 Index declines (protection), and securities which are expected to approximate the performance of the Barclays U.S. Aggregate Bond and S&P 500 Indices.
As a result, the Fund decreased in value as the S&P 500 posted strong performance, appreciating more than 13% during 2014. The Fund’s protection securities, short S&P 500 Index futures and a modest short and long-term S&P 500 Index put position declined in value providing a headwind (i.e. negative impact) to performance. The fixed income sleeve provided a tailwind to Fund performance as it increased nearly 6% for the year.
What is your outlook?
Turning the calendar to 2015, we believe that equity market fundamentals are still positive as balance sheets hold ample cash positions and earnings growth is driven by moderate sales. Valuations appear to be neutral, with levels above long-term averages but consistent with the current rate environment and business/growth cycle. We expect volatility to trend higher in 2015 as pending rate hikes, the conclusion of Quantitative Easing III at the end of October 2014, and softness in European economies increase market uncertainty. Our 2015 year-end price target for the S&P 500 Index is 2080, which represents a low single-digit price return for the year, largely driven by earnings/revenue growth.
Possible risks to our outlook include commodity volatility, heightened geopolitical tensions, the potential for surprises in rate guidance, global monetary policy and unexpected weakness in economic indicators.
| 2. | Source: Bloomberg L.P. |
Diversification by Security Type
as of December 31, 2014
| | | | |
| Category | | Percentage of
Net Assets | |
Equity Securities | | | | |
Common Stocks | | | 23.8 | % |
Exchange-Traded Funds | | | 0.1 | |
| | | | |
Total | | | 23.9 | % |
| | | | |
Fixed Income Securities | | | | |
Asset & Commercial Mortgage Backed Securities | | | 0.7 | % |
Corporate Bonds | | | 11.9 | |
Foreign Government Obligations | | | 1.3 | |
Municipal Bonds | | | 0.3 | |
U.S. Government Agencies | | | 14.1 | |
U.S. Government Securities | | | 16.9 | |
| | | | |
Total | | | 45.2 | % |
| | | | |
Put Options Purchased | | | 0.4 | % |
Short-Term Investments | | | 30.2 | |
Other assets and liabilities | | | 0.3 | |
| | | | |
Total | | | 100.0 | % |
| | | | |
Credit Exposure
as of December 31, 2014
| | | | |
| Credit Rating* | | Percentage of
Net Assets | |
AAA/Aaa | | | 19.9 | % |
AA/Aa | | | 15.6 | |
A | | | 5.8 | |
BBB/Baa | | | 3.8 | |
Not Rated | | | 0.1 | |
Non-Debt Securities and Other Short-Term Instruments | | | 54.5 | |
Other assets and liabilities | | | 0.3 | |
| | | | |
Total | | | 100.0 | % |
| | | | |
| * | Credit exposure is the long-term credit ratings for the Fund’s holdings, as of the date noted, as provided by Standard and Poor’s (S&P) or Moody’s Investors Service and typically range from AAA/Aaa (highest) to C/D (lowest). Presentation of S&P and Moody’s credit ratings in this report have been selected for informational purposes for shareholders, as well as the Fund’s consideration of industry practice. If Moody’s and S&P assign different ratings, the lower rating is used Fixed income securities that are not rated by either agency are listed as “Not Rated.” Ratings do not apply to the Fund itself or to Fund shares. Ratings may change. |
|
| HIMCO VIT Portfolio Diversifier Fund |
Schedule of Investments
December 31, 2014
| | | | | | | | |
Shares or Principal Amount | | Market Value(1) | |
| COMMON STOCKS - 23.8% | |
| | | | Automobiles & Components - 0.2% | | | |
| | 1,239 | | | BorgWarner, Inc. | | $ | 68,083 | |
| | 1,609 | | | Delphi Automotive plc | | | 117,007 | |
| | 20,908 | | | Ford Motor Co. | | | 324,074 | |
| | 7,343 | | | General Motors Co. | | | 256,344 | |
| | 1,500 | | | Goodyear Tire & Rubber Co. (The) | | | 42,855 | |
| | 1,164 | | | Harley-Davidson, Inc. | | | 76,719 | |
| | 3,624 | | | Johnson Controls, Inc. | | | 175,184 | |
| | | | | | | | |
| | | | | | | 1,060,266 | |
| | | | | | | | |
| | | | Banks - 1.5% | | | |
| | 57,229 | | | Bank of America Corp. | | | 1,023,827 | |
| | 3,915 | | | BB&T Corp. | | | 152,254 | |
| | 16,479 | | | Citigroup, Inc. | | | 891,679 | |
| | 994 | | | Comerica, Inc. | | | 46,559 | |
| | 4,480 | | | Fifth Third Bancorp | | | 91,280 | |
| | 2,629 | | | Hudson City Bancorp, Inc. | | | 26,605 | |
| | 4,536 | | | Huntington Bancshares, Inc. | | | 47,719 | |
| | 20,333 | | | JPMorgan Chase & Co. | | | 1,272,439 | |
| | 4,769 | | | KeyCorp | | | 66,289 | |
| | 721 | | | M&T Bank Corp. | | | 90,572 | |
| | 1,703 | | | People’s United Financial, Inc. | | | 25,852 | |
| | 2,863 | | | PNC Financial Services Group, Inc. (The) | | | 261,191 | |
| | 7,588 | | | Regions Financial Corp. | | | 80,129 | |
| | 2,844 | | | SunTrust Banks, Inc. | | | 119,164 | |
| | 9,725 | | | US Bancorp | | | 437,139 | |
| | 25,671 | | | Wells Fargo & Co. | | | 1,407,284 | |
| | 1,131 | | | Zions BanCorp. | | | 32,245 | |
| | | | | | | | |
| | | | | | | 6,072,227 | |
| | | | | | | | |
| | | | Capital Goods - 1.8% | | | |
| | 3,485 | | | 3M Co. | | | 572,655 | |
| | 521 | | | Allegion plc | | | 28,895 | |
| | 1,334 | | | AMETEK, Inc. | | | 70,208 | |
| | 3,604 | | | Boeing Co. (The) | | | 468,448 | |
| | 3,291 | | | Caterpillar, Inc. | | | 301,225 | |
| | 927 | | | Cummins, Inc. | | | 133,646 | |
| | 3,317 | | | Danaher Corp. | | | 284,300 | |
| | 1,945 | | | Deere & Co. | | | 172,074 | |
| | 903 | | | Dover Corp. | | | 64,763 | |
| | 2,583 | | | Eaton Corp. plc | | | 175,541 | |
| | 3,766 | | | Emerson Electric Co. | | | 232,475 | |
| | 1,487 | | | Fastenal Co. | | | 70,722 | |
| | 747 | | | Flowserve Corp. | | | 44,693 | |
| | 858 | | | Fluor Corp. | | | 52,021 | |
| | 1,717 | | | General Dynamics Corp. | | | 236,294 | |
| | 54,557 | | | General Electric Co. | | | 1,378,655 | |
| | 4,251 | | | Honeywell International, Inc. | | | 424,760 | |
| | 1,956 | | | Illinois Tool Works, Inc. | | | 185,233 | |
| | 1,450 | | | Ingersoll-Rand plc | | | 91,916 | |
| | 717 | | | Jacobs Engineering Group, Inc.(2) | | | 32,043 | |
| | 545 | | | Joy Global, Inc. | | | 25,353 | |
| | 469 | | | L-3 Communications Holdings, Inc. | | | 59,193 | |
| | 1,460 | | | Lockheed Martin Corp. | | | 281,152 | |
| | 1,936 | | | Masco Corp. | | | 48,787 | |
| | 1,102 | | | Northrop Grumman Corp. | | | 162,424 | |
| | 1,929 | | | PACCAR, Inc. | | | 131,191 | |
| | 583 | | | Pall Corp. | | | 59,005 | |
| | 813 | | | Parker-Hannifin Corp. | | | 104,836 | |
| | 1,016 | | | Pentair plc | | | 67,483 | |
| | 774 | | | Precision Castparts Corp. | | | 186,441 | |
| | 1,197 | | | Quanta Services, Inc.(2) | | | 33,983 | |
| | | | | | | | |
Shares or Principal Amount | | Market Value(1) | |
| COMMON STOCKS - 23.8% - (continued) | |
| | | | Capital Goods - 1.8% - (continued) | | | |
| | 1,679 | | | Raytheon Co. | | $ | 181,617 | |
| | 741 | | | Rockwell Automation, Inc. | | | 82,399 | |
| | 726 | | | Rockwell Collins, Inc. | | | 61,333 | |
| | 541 | | | Roper Industries, Inc. | | | 84,585 | |
| | 320 | | | Snap-on, Inc. | | | 43,757 | |
| | 856 | | | Stanley Black & Decker, Inc. | | | 82,245 | |
| | 1,506 | | | Textron, Inc. | | | 63,418 | |
| | 547 | | | United Rentals, Inc.(2) | | | 55,799 | |
| | 4,604 | | | United Technologies Corp. | | | 529,460 | |
| | 329 | | | WW Grainger, Inc. | | | 83,859 | |
| | 991 | | | Xylem, Inc. | | | 37,727 | |
| | | | | | | | |
| | | | | | | 7,486,614 | |
| | | | | | | | |
| | | | Commercial & Professional Services - 0.2% | |
| | 957 | | | ADT Corp. (The) | | | 34,672 | |
| | 536 | | | Cintas Corp. | | | 42,044 | |
| | 196 | | | Dun & Bradstreet Corp. (The) | | | 23,708 | |
| | 657 | | | Equifax, Inc. | | | 53,132 | |
| | 1,027 | | | Iron Mountain, Inc., REIT | | | 39,704 | |
| | 1,751 | | | Nielsen N.V. | | | 78,322 | |
| | 1,108 | | | Pitney Bowes, Inc. | | | 27,002 | |
| | 1,368 | | | Republic Services, Inc. | | | 55,062 | |
| | 749 | | | Robert Half International, Inc. | | | 43,727 | |
| | 460 | | | Stericycle, Inc.(2) | | | 60,297 | |
| | 2,284 | | | Tyco International plc | | | 100,176 | |
| | 2,304 | | | Waste Management, Inc. | | | 118,241 | |
| | | | | | | | |
| | | | | | | 676,087 | |
| | | | | | | | |
| | | | Consumer Durables & Apparel - 0.3% | |
| | 1,509 | | | Coach, Inc. | | | 56,678 | |
| | 1,822 | | | DR Horton, Inc. | | | 46,078 | |
| | 248 | | | Fossil Group, Inc.(2) | | | 27,464 | |
| | 667 | | | Garmin Ltd. | | | 35,238 | |
| | 376 | | | Harman International Industries, Inc. | | | 40,123 | |
| | 623 | | | Hasbro, Inc. | | | 34,259 | |
| | 758 | | | Leggett & Platt, Inc. | | | 32,298 | |
| | 976 | | | Lennar Corp., Class A | | | 43,735 | |
| | 1,861 | | | Mattel, Inc. | | | 57,589 | |
| | 1,121 | | | Michael Kors Holdings Ltd.(2) | | | 84,187 | |
| | 338 | | | Mohawk Industries, Inc.(2) | | | 52,512 | |
| | 1,480 | | | Newell Rubbermaid, Inc. | | | 56,373 | |
| | 3,795 | | | NIKE, Inc., Class B | | | 364,889 | |
| | 1,837 | | | PulteGroup, Inc. | | | 39,422 | |
| | 448 | | | PVH Corp. | | | 57,420 | |
| | 331 | | | Ralph Lauren Corp. | | | 61,288 | |
| | 909 | | | Under Armour, Inc., Class A(2) | | | 61,721 | |
| | 1,872 | | | VF Corp. | | | 140,213 | |
| | 425 | | | Whirlpool Corp. | | | 82,339 | |
| | | | | | | | |
| | | | | | | 1,373,826 | |
| | | | | | | | |
| | | | Consumer Services - 0.4% | | | |
| | 2,448 | | | Carnival Corp. | | | 110,968 | |
| | 169 | | | Chipotle Mexican Grill, Inc.(2) | | | 115,682 | |
| | 725 | | | Darden Restaurants, Inc. | | | 42,507 | |
| | 1,506 | | | H&R Block, Inc. | | | 50,722 | |
| | 1,159 | | | Marriott International, Inc., Class A | | | 90,437 | |
| | 5,281 | | | McDonald’s Corp. | | | 494,830 | |
| | 911 | | | Royal Caribbean Cruises Ltd. | | | 75,094 | |
| | 4,066 | | | Starbucks Corp. | | | 333,615 | |
| | 977 | | | Starwood Hotels & Resorts Worldwide, Inc. | | | 79,205 | |
| | 671 | | | Wyndham Worldwide Corp. | | | 57,545 | |
The accompanying notes are an integral part of these financial statements.
|
| HIMCO VIT Portfolio Diversifier Fund |
Schedule of Investments – (continued)
December 31, 2014
| | | | | | | | |
Shares or Principal Amount | | Market Value(1) | |
| COMMON STOCKS - 23.8% - (continued) | |
| | | | Consumer Services - 0.4% - (continued) | | | |
| | 442 | | | Wynn Resorts Ltd. | | $ | 65,752 | |
| | 2,376 | | | Yum! Brands, Inc. | | | 173,091 | |
| | | | | | | | |
| | | | | | | 1,689,448 | |
| | | | | | | | |
| | | | Diversified Financials - 1.3% | | | |
| | 305 | | | Affiliated Managers Group, Inc.(2) | | | 64,733 | |
| | 4,832 | | | American Express Co. | | | 449,569 | |
| | 1,007 | | | Ameriprise Financial, Inc. | | | 133,176 | |
| | 6,133 | | | Bank of New York Mellon Corp. (The) | | | 248,816 | |
| | 9,920 | | | Berkshire Hathaway, Inc., Class B(2) | | | 1,489,488 | |
| | 693 | | | BlackRock, Inc. | | | 247,789 | |
| | 3,026 | | | Capital One Financial Corp. | | | 249,796 | |
| | 6,258 | | | Charles Schwab Corp. (The) | | | 188,929 | |
| | 1,726 | | | CME Group, Inc. | | | 153,010 | |
| | 2,470 | | | Discover Financial Services | | | 161,760 | |
| | 1,578 | | | E*TRADE Financial Corp.(2) | | | 38,274 | |
| | 2,131 | | | Franklin Resources, Inc. | | | 117,994 | |
| | 2,203 | | | Goldman Sachs Group, Inc. (The) | | | 427,008 | |
| | 613 | | | Intercontinental Exchange, Inc. | | | 134,425 | |
| | 2,357 | | | Invesco Ltd. | | | 93,149 | |
| | 560 | | | Legg Mason, Inc. | | | 29,887 | |
| | 1,721 | | | Leucadia National Corp. | | | 38,585 | |
| | 1,480 | | | McGraw Hill Financial, Inc. | | | 131,691 | |
| | 999 | | | Moody’s Corp. | | | 95,714 | |
| | 8,289 | | | Morgan Stanley | | | 321,613 | |
| | 656 | | | NASDAQ OMX Group, Inc. (The) | | | 31,462 | |
| | 2,230 | | | Navient Corp. | | | 48,190 | |
| | 1,213 | | | Northern Trust Corp. | | | 81,756 | |
| | 2,278 | | | State Street Corp. | | | 178,823 | |
| | 1,420 | | | T Rowe Price Group, Inc. | | | 121,921 | |
| | | | | | | | |
| | | | | | | 5,277,558 | |
| | | | | | | | |
| | | | Energy - 2.0% | | | |
| | 2,756 | | | Anadarko Petroleum Corp. | | | 227,370 | |
| | 2,053 | | | Apache Corp. | | | 128,661 | |
| | 2,351 | | | Baker Hughes, Inc. | | | 131,821 | |
| | 2,236 | | | Cabot Oil & Gas Corp. | | | 66,208 | |
| | 1,075 | | | Cameron International Corp.(2) | | | 53,696 | |
| | 2,834 | | | Chesapeake Energy Corp. | | | 55,461 | |
| | 10,281 | | | Chevron Corp. | | | 1,153,323 | |
| | 478 | | | Cimarex Energy Co. | | | 50,668 | |
| | 6,693 | | | ConocoPhillips | | | 462,219 | |
| | 1,259 | | | CONSOL Energy, Inc. | | | 42,567 | |
| | 1,959 | | | Denbury Resources, Inc. | | | 15,927 | |
| | 2,092 | | | Devon Energy Corp. | | | 128,051 | |
| | 371 | | | Diamond Offshore Drilling, Inc. | | | 13,619 | |
| | 1,286 | | | Ensco plc, Class A | | | 38,516 | |
| | 2,983 | | | EOG Resources, Inc. | | | 274,645 | |
| | 821 | | | EQT Corp. | | | 62,150 | |
| | 23,032 | | | Exxon Mobil Corp. | | | 2,129,308 | |
| | 1,268 | | | FMC Technologies, Inc.(2) | | | 59,393 | |
| | 4,614 | | | Halliburton Co. | | | 181,469 | |
| | 597 | | | Helmerich & Payne, Inc. | | | 40,250 | |
| | 1,391 | | | Hess Corp. | | | 102,684 | |
| | 9,249 | | | Kinder Morgan, Inc. | | | 391,325 | |
| | 3,685 | | | Marathon Oil Corp. | | | 104,249 | |
| | 1,528 | | | Marathon Petroleum Corp. | | | 137,917 | |
| | 911 | | | Murphy Oil Corp. | | | 46,024 | |
| | 1,569 | | | Nabors Industries Ltd. | | | 20,366 | |
| | 2,342 | | | National Oilwell Varco, Inc. | | | 153,471 | |
| | 759 | | | Newfield Exploration Co.(2) | | | 20,584 | |
| | | | | | | | |
Shares or Principal Amount | | Market Value(1) | |
| COMMON STOCKS - 23.8% - (continued) | |
| | | | Energy - 2.0% - (continued) | | | |
| | 1,396 | | | Noble Corp. plc | | $ | 23,132 | |
| | 1,962 | | | Noble Energy, Inc. | | | 93,058 | |
| | 4,220 | | | Occidental Petroleum Corp. | | | 340,174 | |
| | 1,132 | | | ONEOK, Inc. | | | 56,362 | |
| | 3,013 | | | Phillips 66 | | | 216,032 | |
| | 811 | | | Pioneer Natural Resources Co. | | | 120,717 | |
| | 912 | | | QEP Resources, Inc. | | | 18,441 | |
| | 910 | | | Range Resources Corp. | | | 48,639 | |
| | 6,992 | | | Schlumberger Ltd. | | | 597,187 | |
| | 1,925 | | | Southwestern Energy Co.(2) | | | 52,533 | |
| | 3,638 | | | Spectra Energy Corp. | | | 132,059 | |
| | 691 | | | Tesoro Corp. | | | 51,376 | |
| | 1,868 | | | Transocean Ltd. | | | 34,240 | |
| | 2,843 | | | Valero Energy Corp. | | | 140,728 | |
| | 3,669 | | | Williams Cos., Inc. (The) | | | 164,885 | |
| | | | | | | | |
| | | | | | | 8,381,505 | |
| | | | | | | | |
| | | | Food & Staples Retailing - 0.6% | | | |
| | 2,384 | | | Costco Wholesale Corp. | | | 337,932 | |
| | 6,237 | | | CVS Health Corp. | | | 600,685 | |
| | 2,679 | | | Kroger Co. (The) | | | 172,019 | |
| | 1,262 | | | Safeway, Inc. | | | 44,321 | |
| | 3,211 | | | Sysco Corp. | | | 127,445 | |
| | 8,584 | | | Wal-Mart Stores, Inc. | | | 737,194 | |
| | 4,736 | | | Walgreens Boot Allliance, Inc. | | | 360,883 | |
| | 1,966 | | | Whole Foods Market, Inc. | | | 99,126 | |
| | | | | | | | |
| | | | | | | 2,479,605 | |
| | | | | | | | |
| | | | Food, Beverage & Tobacco - 1.2% | | | |
| | 10,741 | | | Altria Group, Inc. | | | 529,209 | |
| | 3,504 | | | Archer-Daniels-Midland Co. | | | 182,208 | |
| | 850 | | | Brown-Forman Corp., Class B | | | 74,664 | |
| | 972 | | | Campbell Soup Co. | | | 42,768 | |
| | 21,433 | | | Coca-Cola Co. (The) | | | 904,901 | |
| | 1,217 | | | Coca-Cola Enterprises, Inc. | | | 53,816 | |
| | 2,312 | | | ConAgra Foods, Inc. | | | 83,879 | |
| | 913 | | | Constellation Brands, Inc., Class A(2) | | | 89,629 | |
| | 1,067 | | | Dr Pepper Snapple Group, Inc. | | | 76,483 | |
| | 3,275 | | | General Mills, Inc. | | | 174,656 | |
| | 804 | | | Hershey Co. (The) | | | 83,560 | |
| | 734 | | | Hormel Foods Corp. | | | 38,241 | |
| | 555 | | | JM Smucker Co. (The) | | | 56,044 | |
| | 1,365 | | | Kellogg Co. | | | 89,326 | |
| | 663 | | | Keurig Green Mountain, Inc. | | | 87,778 | |
| | 3,202 | | | Kraft Foods Group, Inc. | | | 200,637 | |
| | 1,957 | | | Lorillard, Inc. | | | 123,174 | |
| | 703 | | | McCormick & Co., Inc. | | | 52,233 | |
| | 1,100 | | | Mead Johnson Nutrition Co. | | | 110,594 | |
| | 877 | | | Molson Coors Brewing Co., Class B | | | 65,354 | |
| | 9,135 | | | Mondelez International, Inc., Class A | | | 331,829 | |
| | 787 | | | Monster Beverage Corp.(2) | | | 85,271 | |
| | 8,130 | | | PepsiCo, Inc. | | | 768,773 | |
| | 8,437 | | | Philip Morris International, Inc. | | | 687,194 | |
| | 1,675 | | | Reynolds American, Inc. | | | 107,652 | |
| | 1,605 | | | Tyson Foods, Inc., Class A | | | 64,344 | |
| | | | | | | | |
| | | | | | | 5,164,217 | |
| | | | | | | | |
| | | | Health Care Equipment & Services - 1.1% | |
| | 8,184 | | | Abbott Laboratories | | | 368,444 | |
| | 1,917 | | | Aetna, Inc. | | | 170,287 | |
| | 1,134 | | | AmerisourceBergen Corp. | | | 102,241 | |
| | 1,472 | | | Anthem, Inc. | | | 184,986 | |
The accompanying notes are an integral part of these financial statements.
|
| HIMCO VIT Portfolio Diversifier Fund |
Schedule of Investments – (continued)
December 31, 2014
| | | | | | | | |
Shares or Principal Amount | | Market Value(1) | |
| COMMON STOCKS - 23.8% - (continued) | |
| | | | Health Care Equipment & Services - 1.1% - (continued) | |
| | 2,942 | | | Baxter International, Inc. | | $ | 215,619 | |
| | 1,045 | | | Becton Dickinson and Co. | | | 145,422 | |
| | 7,245 | | | Boston Scientific Corp.(2) | | | 95,996 | |
| | 1,802 | | | Cardinal Health, Inc. | | | 145,476 | |
| | 1,116 | | | CareFusion Corp.(2) | | | 66,223 | |
| | 1,655 | | | Cerner Corp.(2) | | | 107,012 | |
| | 1,425 | | | Cigna Corp. | | | 146,647 | |
| | 2,466 | | | Covidien plc | | | 252,223 | |
| | 408 | | | CR Bard, Inc. | | | 67,981 | |
| | 932 | | | DaVita HealthCare Partners, Inc.(2) | | | 70,590 | |
| | 775 | | | DENTSPLY International, Inc. | | | 41,284 | |
| | 584 | | | Edwards Lifesciences Corp.(2) | | | 74,390 | |
| | 3,989 | | | Express Scripts Holding Co.(2) | | | 337,749 | |
| | 837 | | | Humana, Inc. | | | 120,218 | |
| | 198 | | | Intuitive Surgical, Inc.(2) | | | 104,730 | |
| | 462 | | | Laboratory Corp. of America Holdings(2) | | | 49,850 | |
| | 1,260 | | | McKesson Corp. | | | 261,551 | |
| | 5,356 | | | Medtronic, Inc. | | | 386,703 | |
| | 472 | | | Patterson Cos., Inc. | | | 22,703 | |
| | 791 | | | Quest Diagnostics, Inc. | | | 53,044 | |
| | 1,560 | | | St Jude Medical, Inc. | | | 101,447 | |
| | 1,623 | | | Stryker Corp. | | | 153,098 | |
| | 537 | | | Tenet Healthcare Corp.(2) | | | 27,210 | |
| | 5,219 | | | UnitedHealth Group, Inc. | | | 527,589 | |
| | 500 | | | Universal Health Services, Inc., Class B | | | 55,630 | |
| | 544 | | | Varian Medical Systems, Inc.(2) | | | 47,061 | |
| | 924 | | | Zimmer Holdings, Inc. | | | 104,800 | |
| | | | | | | | |
| | | | | | | 4,608,204 | |
| | | | | | | | |
| | | | Household & Personal Products - 0.5% | | | |
| | 2,389 | | | Avon Products, Inc. | | | 22,433 | |
| | 708 | | | Clorox Co. (The) | | | 73,781 | |
| | 4,647 | | | Colgate-Palmolive Co. | | | 321,526 | |
| | 1,226 | | | Estee Lauder Cos., Inc. (The), Class A | | | 93,421 | |
| | 2,024 | | | Kimberly-Clark Corp. | | | 233,853 | |
| | 14,695 | | | Procter & Gamble Co. (The) | | | 1,338,567 | |
| | | | | | | | |
| | | | | | | 2,083,581 | |
| | | | | | | | |
| | | | Insurance - 0.7% | | | |
| | 1,852 | | | ACE Ltd. | | | 212,758 | |
| | 2,541 | | | Aflac, Inc. | | | 155,230 | |
| | 2,360 | | | Allstate Corp. (The) | | | 165,790 | |
| | 7,713 | | | American International Group, Inc. | | | 432,005 | |
| | 1,594 | | | Aon plc | | | 151,159 | |
| | 461 | | | Assurant, Inc. | | | 31,546 | |
| | 1,332 | | | Chubb Corp. (The) | | | 137,822 | |
| | 923 | | | Cincinnati Financial Corp. | | | 47,839 | |
| | 2,802 | | | Genworth Financial, Inc., Class A(2) | | | 23,817 | |
| | 1,485 | | | Lincoln National Corp. | | | 85,640 | |
| | 1,734 | | | Loews Corp. | | | 72,863 | |
| | 3,027 | | | Marsh & McLennan Cos., Inc. | | | 173,265 | |
| | 6,266 | | | MetLife, Inc. | | | 338,928 | |
| | 1,592 | | | Principal Financial Group, Inc. | | | 82,688 | |
| | 3,118 | | | Progressive Corp. (The) | | | 84,155 | |
| | 2,539 | | | Prudential Financial, Inc. | | | 229,678 | |
| | 797 | | | Torchmark Corp. | | | 43,174 | |
| | 1,858 | | | Travelers Cos., Inc. (The) | | | 196,669 | |
| | 1,506 | | | Unum Group | | | 52,529 | |
| | 1,588 | | | XL Group plc | | | 54,580 | |
| | | | | | | | |
| | | | | | | 2,772,135 | |
| | | | | | | | |
| | | | | | | | |
Shares or Principal Amount | | Market Value(1) | |
| COMMON STOCKS - 23.8% - (continued) | |
| | | | Materials - 0.8% | | | |
| | 1,049 | | | Air Products & Chemicals, Inc. | | $ | 151,297 | |
| | 366 | | | Airgas, Inc. | | | 42,156 | |
| | 6,468 | | | Alcoa, Inc. | | | 102,130 | |
| | 599 | | | Allegheny Technologies, Inc. | | | 20,827 | |
| | 508 | | | Avery Dennison Corp. | | | 26,355 | |
| | 748 | | | Ball Corp. | | | 50,991 | |
| | 273 | | | CF Industries Holdings, Inc. | | | 74,403 | |
| | 6,034 | | | Dow Chemical Co. (The) | | | 275,211 | |
| | 815 | | | Eastman Chemical Co. | | | 61,826 | |
| | 1,463 | | | Ecolab, Inc. | | | 152,913 | |
| | 4,930 | | | EI du Pont de Nemours & Co. | | | 364,524 | |
| | 731 | | | FMC Corp. | | | 41,689 | |
| | 5,666 | | | Freeport-McMoRan, Inc. | | | 132,358 | |
| | 446 | | | International Flavors & Fragrances, Inc. | | | 45,207 | |
| | 2,312 | | | International Paper Co. | | | 123,877 | |
| | 2,268 | | | LyondellBasell Industries N.V., Class A | | | 180,056 | |
| | 341 | | | Martin Marietta Materials, Inc. | | | 37,619 | |
| | 922 | | | MeadWestvaco Corp. | | | 40,928 | |
| | 2,632 | | | Monsanto Co. | | | 314,445 | |
| | 1,727 | | | Mosaic Co. (The) | | | 78,837 | |
| | 2,681 | | | Newmont Mining Corp. | | | 50,671 | |
| | 1,730 | | | Nucor Corp. | | | 84,856 | |
| | 910 | | | Owens-Illinois, Inc.(2) | | | 24,561 | |
| | 748 | | | PPG Industries, Inc. | | | 172,900 | |
| | 1,578 | | | Praxair, Inc. | | | 204,446 | |
| | 1,157 | | | Sealed Air Corp. | | | 49,091 | |
| | 444 | | | Sherwin-Williams Co. (The) | | | 116,790 | |
| | 652 | | | Sigma-Aldrich Corp. | | | 89,500 | |
| | 720 | | | Vulcan Materials Co. | | | 47,326 | |
| | | | | | | | |
| | | | | | | 3,157,790 | |
| | | | | | | | |
| | | | Media - 0.8% | | | |
| | 1,211 | | | Cablevision Systems Corp., Class A | | | 24,995 | |
| | 2,600 | | | CBS Corp., Class B | | | 143,884 | |
| | 14,016 | | | Comcast Corp., Class A | | | 813,068 | |
| | 2,730 | | | DIRECTV(2) | | | 236,691 | |
| | 859 | | | Discovery Communications, Inc., Class A(2) | | | 29,593 | |
| | 1,435 | | | Discovery Communications, Inc., Class C(2) | | | 48,388 | |
| | 1,244 | | | Gannett Co., Inc. | | | 39,721 | |
| | 2,316 | | | Interpublic Group of Cos., Inc. (The) | | | 48,103 | |
| | 2,744 | | | News Corp., Class A(2) | | | 43,053 | |
| | 1,353 | | | Omnicom Group, Inc. | | | 104,817 | |
| | 553 | | | Scripps Networks Interactive, Inc., Class A | | | 41,624 | |
| | 1,524 | | | Time Warner Cable, Inc. | | | 231,740 | |
| | 4,561 | | | Time Warner, Inc. | | | 389,601 | |
| | 10,088 | | | Twenty-First Century Fox, Inc., Class A | | | 387,430 | |
| | 2,012 | | | Viacom, Inc., Class B | | | 151,403 | |
| | 8,485 | | | Walt Disney Co. (The) | | | 799,202 | |
| | | | | | | | |
| | | | | | | 3,533,313 | |
| | | | | | | | |
| | | | Pharmaceuticals, Biotechnology & Life Sciences - 2.3% | |
| | 8,671 | | | AbbVie, Inc. | | | 567,430 | |
| | 1,443 | | | Actavis plc(2) | | | 371,443 | |
| | 1,820 | | | Agilent Technologies, Inc. | | | 74,511 | |
| | 1,079 | | | Alexion Pharmaceuticals, Inc.(2) | | | 199,647 | |
| | 1,622 | | | Allergan, Inc. | | | 344,821 | |
| | 4,140 | | | Amgen, Inc. | | | 659,461 | |
| | 1,285 | | | Biogen Idec, Inc.(2) | | | 436,193 | |
| | 9,025 | | | Bristol-Myers Squibb Co. | | | 532,746 | |
| | 4,347 | | | Celgene Corp.(2) | | | 486,255 | |
| | 5,334 | | | Eli Lilly & Co. | | | 367,993 | |
The accompanying notes are an integral part of these financial statements.
|
| HIMCO VIT Portfolio Diversifier Fund |
Schedule of Investments – (continued)
December 31, 2014
| | | | | | | | |
Shares or Principal Amount | | Market Value(1) | |
| COMMON STOCKS - 23.8% - (continued) | |
| | | | Pharmaceuticals, Biotechnology & Life
Sciences - 2.3% - (continued) | |
| | 8,215 | | | Gilead Sciences, Inc.(2) | | $ | 774,346 | |
| | 926 | | | Hospira, Inc.(2) | | | 56,717 | |
| | 15,229 | | | Johnson & Johnson | | | 1,592,496 | |
| | 637 | | | Mallinckrodt plc(2) | | | 63,082 | |
| | 15,509 | | | Merck & Co., Inc. | | | 880,756 | |
| | 2,043 | | | Mylan, Inc.(2) | | | 115,164 | |
| | 620 | | | PerkinElmer, Inc. | | | 27,113 | |
| | 766 | | | Perrigo Co. plc | | | 128,044 | |
| | 34,279 | | | Pfizer, Inc. | | | 1,067,791 | |
| | 404 | | | Regeneron Pharmaceuticals, Inc.(2) | | | 165,741 | |
| | 2,176 | | | Thermo Fisher Scientific, Inc. | | | 272,631 | |
| | 1,310 | | | Vertex Pharmaceuticals, Inc.(2) | | | 155,628 | |
| | 455 | | | Waters Corp.(2) | | | 51,288 | |
| | 2,729 | | | Zoetis, Inc. | | | 117,429 | |
| | | | | | | | |
| | | | | | | 9,508,726 | |
| | | | | | | | |
| | | | Real Estate - 0.6% | | | |
| | 2,145 | | | American Tower Corp., REIT | | | 212,033 | |
| | 805 | | | Apartment Investment & Management Co., Class A, REIT | | | 29,906 | |
| | 722 | | | AvalonBay Communities, Inc., REIT | | | 117,968 | |
| | 828 | | | Boston Properties, Inc., REIT | | | 106,555 | |
| | 1,537 | | | CBRE Group, Inc., Class A(2) | | | 52,642 | |
| | 1,806 | | | Crown Castle International Corp., REIT | | | 142,132 | |
| | 1,978 | | | Equity Residential, REIT | | | 142,100 | |
| | 351 | | | Essex Property Trust, Inc., REIT | | | 72,517 | |
| | 3,389 | | | General Growth Properties, Inc., REIT | | | 95,333 | |
| | 2,499 | | | HCP, Inc., REIT | | | 110,031 | |
| | 1,790 | | | Health Care REIT, Inc., REIT | | | 135,449 | |
| | 4,147 | | | Host Hotels & Resorts, Inc., REIT | | | 98,574 | |
| | 2,267 | | | Kimco Realty Corp., REIT | | | 56,992 | |
| | 772 | | | Macerich Co. (The), REIT | | | 64,393 | |
| | 962 | | | Plum Creek Timber Co., Inc., REIT | | | 41,164 | |
| | 2,699 | | | Prologis, Inc., REIT | | | 116,138 | |
| | 788 | | | Public Storage, REIT | | | 145,662 | |
| | 1,685 | | | Simon Property Group, Inc., REIT | | | 306,855 | |
| | 1,603 | | | Ventas, Inc., REIT | | | 114,935 | |
| | 952 | | | Vornado Realty Trust, REIT | | | 112,060 | |
| | 2,879 | | | Weyerhaeuser Co., REIT | | | 103,327 | |
| | | | | | | | |
| | | | | | | 2,376,766 | |
| | | | | | | | |
| | | | Retailing - 1.0% | | | |
| | 2,065 | | | Amazon.com, Inc.(2) | | | 640,873 | |
| | 407 | | | AutoNation, Inc.(2) | | | 24,587 | |
| | 173 | | | AutoZone, Inc.(2) | | | 107,106 | |
| | 1,014 | | | Bed Bath & Beyond, Inc.(2) | | | 77,236 | |
| | 1,591 | | | Best Buy Co., Inc. | | | 62,017 | |
| | 1,172 | | | CarMax, Inc.(2) | | | 78,032 | |
| | 1,651 | | | Dollar General Corp.(2) | | | 116,726 | |
| | 1,122 | | | Dollar Tree, Inc.(2) | | | 78,966 | |
| | 541 | | | Expedia, Inc. | | | 46,180 | |
| | 524 | | | Family Dollar Stores, Inc. | | | 41,506 | |
| | 601 | | | GameStop Corp., Class A | | | 20,314 | |
| | 1,455 | | | Gap, Inc. (The) | | | 61,270 | |
| | 832 | | | Genuine Parts Co. | | | 88,666 | |
| | 7,164 | | | Home Depot, Inc. (The) | | | 752,005 | |
| | 1,101 | | | Kohl’s Corp. | | | 67,205 | |
| | 1,334 | | | L Brands, Inc. | | | 115,458 | |
| | 5,288 | | | Lowe’s Cos., Inc. | | | 363,814 | |
| | 1,881 | | | Macy’s, Inc. | | | 123,676 | |
| | | | | | | | |
Shares or Principal Amount | | Market Value(1) | |
| COMMON STOCKS - 23.8% - (continued) | |
| | | | Retailing - 1.0% - (continued) | | | |
| | 329 | | | Netflix, Inc.(2) | | $ | 112,390 | |
| | 766 | | | Nordstrom, Inc. | | | 60,813 | |
| | 553 | | | O’Reilly Automotive, Inc.(2) | | | 106,519 | |
| | 544 | | | PetSmart, Inc. | | | 44,224 | |
| | 285 | | | Priceline Group, Inc. (The)(2) | | | 324,960 | |
| | 1,145 | | | Ross Stores, Inc. | | | 107,928 | |
| | 3,511 | | | Staples, Inc. | | | 63,619 | |
| | 3,462 | | | Target Corp. | | | 262,800 | |
| | 614 | | | Tiffany & Co. | | | 65,612 | |
| | 3,744 | | | TJX Cos., Inc. (The) | | | 256,763 | |
| | 743 | | | Tractor Supply Co. | | | 58,563 | |
| | 609 | | | TripAdvisor, Inc.(2) | | | 45,468 | |
| | 552 | | | Urban Outfitters, Inc.(2) | | | 19,392 | |
| | | | | | | | |
| | | | | | | 4,394,688 | |
| | | | | | | | |
| | | | Semiconductors & Semiconductor Equipment - 0.6% | |
| | 1,656 | | | Altera Corp. | | | 61,173 | |
| | 1,690 | | | Analog Devices, Inc. | | | 93,829 | |
| | 6,635 | | | Applied Materials, Inc. | | | 165,344 | |
| | 1,377 | | | Avago Technologies Ltd. | | | 138,512 | |
| | 2,937 | | | Broadcom Corp., Class A | | | 127,260 | |
| | 415 | | | First Solar, Inc.(2) | | | 18,507 | |
| | 26,306 | | | Intel Corp. | | | 954,645 | |
| | 901 | | | KLA-Tencor Corp. | | | 63,358 | |
| | 871 | | | Lam Research Corp. | | | 69,105 | |
| | 1,300 | | | Linear Technology Corp. | | | 59,280 | |
| | 1,092 | | | Microchip Technology, Inc. | | | 49,260 | |
| | 5,854 | | | Micron Technology, Inc.(2) | | | 204,949 | |
| | 2,821 | | | NVIDIA Corp. | | | 56,561 | |
| | 5,739 | | | Texas Instruments, Inc. | | | 306,836 | |
| | 1,442 | | | Xilinx, Inc. | | | 62,424 | |
| | | | | | | | |
| | | | | | | 2,431,043 | |
| | | | | | | | |
| | | | Software & Services - 2.5% | | | |
| | 3,408 | | | Accenture plc, Class A | | | 304,368 | |
| | 2,580 | | | Adobe Systems, Inc.(2) | | | 187,566 | |
| | 972 | | | Akamai Technologies, Inc.(2) | | | 61,197 | |
| | 347 | | | Alliance Data Systems Corp.(2) | | | 99,259 | |
| | 1,248 | | | Autodesk, Inc.(2) | | | 74,955 | |
| | 2,623 | | | Automatic Data Processing, Inc. | | | 218,680 | |
| | 1,767 | | | CA, Inc. | | | 53,805 | |
| | 882 | | | Citrix Systems, Inc.(2) | | | 56,272 | |
| | 3,316 | | | Cognizant Technology Solutions Corp., Class A(2) | | | 174,621 | |
| | 769 | | | Computer Sciences Corp. | | | 48,485 | |
| | 6,147 | | | eBay, Inc.(2) | | | 344,970 | |
| | 1,700 | | | Electronic Arts, Inc.(2) | | | 79,925 | |
| | 11,379 | | | Facebook, Inc., Class A(2) | | | 887,790 | |
| | 1,538 | | | Fidelity National Information Services, Inc. | | | 95,664 | |
| | 1,328 | | | Fiserv, Inc.(2) | | | 94,248 | |
| | 1,555 | | | Google, Inc., Class A(2) | | | 825,176 | |
| | 1,546 | | | Google, Inc., Class C(2) | | | 813,814 | |
| | 5,004 | | | International Business Machines Corp. | | | 802,842 | |
| | 1,556 | | | Intuit, Inc. | | | 143,448 | |
| | 5,327 | | | MasterCard, Inc., Class A | | | 458,974 | |
| | 44,863 | | | Microsoft Corp. | | | 2,083,886 | |
| | 17,589 | | | Oracle Corp. | | | 790,977 | |
| | 1,785 | | | Paychex, Inc. | | | 82,413 | |
| | 1,025 | | | Red Hat, Inc.(2) | | | 70,869 | |
| | 3,192 | | | salesforce.com, Inc.(2) | | | 189,318 | |
| | 3,771 | | | Symantec Corp. | | | 96,745 | |
The accompanying notes are an integral part of these financial statements.
|
| HIMCO VIT Portfolio Diversifier Fund |
Schedule of Investments – (continued)
December 31, 2014
| | | | | | | | |
Shares or Principal Amount | | Market Value(1) | |
| COMMON STOCKS - 23.8% - (continued) | |
| | | | Software & Services - 2.5% - (continued) | | | |
| | 838 | | | Teradata Corp.(2) | | $ | 36,604 | |
| | 900 | | | Total System Services, Inc. | | | 30,564 | |
| | 592 | | | VeriSign, Inc.(2) | | | 33,744 | |
| | 2,657 | | | Visa, Inc., Class A | | | 696,665 | |
| | 2,850 | | | Western Union Co. (The) | | | 51,044 | |
| | 5,877 | | | Xerox Corp. | | | 81,455 | |
| | 4,807 | | | Yahoo!, Inc.(2) | | | 242,802 | |
| | | | | | | | |
| | | | | | | 10,313,145 | |
| | | | | | | | |
| | | | Technology Hardware & Equipment - 1.6% | |
| | 1,677 | | | Amphenol Corp., Class A | | | 90,239 | |
| | 31,924 | | | Apple, Inc. | | | 3,523,771 | |
| | 27,807 | | | Cisco Systems, Inc. | | | 773,452 | |
| | 6,974 | | | Corning, Inc. | | | 159,914 | |
| | 11,067 | | | EMC Corp. | | | 329,133 | |
| | 405 | | | F5 Networks, Inc.(2) | | | 52,838 | |
| | 768 | | | FLIR Systems, Inc. | | | 24,814 | |
| | 566 | | | Harris Corp. | | | 40,650 | |
| | 10,159 | | | Hewlett-Packard Co. | | | 407,681 | |
| | 2,103 | | | Juniper Networks, Inc. | | | 46,939 | |
| | 1,147 | | | Motorola Solutions, Inc. | | | 76,941 | |
| | 1,704 | | | NetApp, Inc. | | | 70,631 | |
| | 9,040 | | | QUALCOMM, Inc. | | | 671,943 | |
| | 1,206 | | | SanDisk Corp. | | | 118,164 | |
| | 1,786 | | | Seagate Technology plc | | | 118,769 | |
| | 2,209 | | | TE Connectivity Ltd. | | | 139,719 | |
| | 1,193 | | | Western Digital Corp. | | | 132,065 | |
| | | | | | | | |
| | | | | | | 6,777,663 | |
| | | | | | | | |
| | | | Telecommunication Services - 0.5% | | | |
| | 28,197 | | | AT&T, Inc. | | | 947,137 | |
| | 3,112 | | | CenturyLink, Inc. | | | 123,173 | |
| | 5,507 | | | Frontier Communications Corp. | | | 36,732 | |
| | 1,519 | | | Level 3 Communications, Inc.(2) | | | 75,008 | |
| | 22,559 | | | Verizon Communications, Inc. | | | 1,055,310 | |
| | 3,327 | | | Windstream Holdings, Inc. | | | 27,414 | |
| | | | | | | | |
| | | | | | | 2,264,774 | |
| | | | | | | | |
| | | | Transportation - 0.5% | | | |
| | 805 | | | CH Robinson Worldwide, Inc. | | | 60,286 | |
| | 5,426 | | | CSX Corp. | | | 196,584 | |
| | 4,563 | | | Delta Air Lines, Inc. | | | 224,454 | |
| | 1,062 | | | Expeditors International of Washington, Inc. | | | 47,376 | |
| | 1,434 | | | FedEx Corp. | | | 249,028 | |
| | 603 | | | Kansas City Southern | | | 73,584 | |
| | 1,685 | | | Norfolk Southern Corp. | | | 184,693 | |
| | 294 | | | Ryder System, Inc. | | | 27,298 | |
| | 3,696 | | | Southwest Airlines Co. | | | 156,415 | |
| | 4,836 | | | Union Pacific Corp. | | | 576,113 | |
| | 3,785 | | | United Parcel Service, Inc., Class B | | | 420,778 | |
| | | | | | | | |
| | | | | | | 2,216,609 | |
| | | | | | | | |
| | | | Utilities - 0.8% | | | |
| | 3,574 | | | AES Corp. | | | 49,214 | |
| | 657 | | | AGL Resources, Inc. | | | 35,813 | |
| | 1,323 | | | Ameren Corp. | | | 61,030 | |
| | 2,661 | | | American Electric Power Co., Inc. | | | 161,576 | |
| | 2,346 | | | CenterPoint Energy, Inc. | | | 54,967 | |
| | 1,502 | | | CMS Energy Corp. | | | 52,195 | |
| | 1,598 | | | Consolidated Edison, Inc. | | | 105,484 | |
| | 3,169 | | | Dominion Resources, Inc. | | | 243,696 | |
| | 966 | | | DTE Energy Co. | | | 83,433 | |
| | | | | | | | |
Shares or Principal Amount | | Market Value(1) | |
| COMMON STOCKS - 23.8% - (continued) | |
| | | | Utilities - 0.8% - (continued) | | | |
| | 3,839 | | | Duke Energy Corp. | | $ | 320,710 | |
| | 1,778 | | | Edison International | | | 116,423 | |
| | 991 | | | Entergy Corp. | | | 86,693 | |
| | 4,684 | | | Exelon Corp. | | | 173,683 | |
| | 2,296 | | | FirstEnergy Corp. | | | 89,521 | |
| | 439 | | | Integrys Energy Group, Inc. | | | 34,176 | |
| | 2,367 | | | NextEra Energy, Inc. | | | 251,588 | |
| | 1,728 | | | NiSource, Inc. | | | 73,302 | |
| | 1,724 | | | Northeast Utilities | | | 92,268 | |
| | 1,850 | | | NRG Energy, Inc. | | | 49,858 | |
| | 1,375 | | | Pepco Holdings, Inc. | | | 37,029 | |
| | 2,589 | | | PG&E Corp. | | | 137,838 | |
| | 610 | | | Pinnacle West Capital Corp. | | | 41,669 | |
| | 3,619 | | | PPL Corp. | | | 131,478 | |
| | 2,768 | | | Public Service Enterprise Group, Inc. | | | 114,623 | |
| | 779 | | | SCANA Corp. | | | 47,052 | |
| | 1,254 | | | Sempra Energy | | | 139,645 | |
| | 4,886 | | | Southern Co. (The) | | | 239,951 | |
| | 1,301 | | | TECO Energy, Inc. | | | 26,658 | |
| | 1,234 | | | Wisconsin Energy Corp. | | | 65,081 | |
| | 2,753 | | | Xcel Energy, Inc. | | | 98,888 | |
| | | | | | | | |
| | | | | | | 3,215,542 | |
| | | | | | | | |
| | |
| | | | Total Common Stocks
(cost $74,692,689) | | | 99,315,332 | |
| | | | | | | | |
|
| EXCHANGE-TRADED FUND - 0.1% | |
| | | | Diversified Financial Services - 0.1% | | | |
| | 1,165 | | | Vanguard S&P 500 ETF
(cost $220,433) | | | 219,544 | |
| | | | | | | | |
| | |
| | | | Total Exchange-Traded Funds
(cost $220,433) | | | 219,544 | |
| | | | | | | | |
|
ASSET & COMMERCIAL MORTGAGE BACKED
SECURITIES - 0.7% | |
| $ | 379 | | | Ally Automotive Receivables Trust, Series 2012-1, Class A3, ABS 0.93%, 02/16/2016 | | | 379 | |
| | | | Banc of America Commercial Mortgage Trust | | | | |
| | | | Series 2006-2, Class A4 | | | | |
| | 15,000 | | | 5.73%, 05/10/2045(3) | | | 15,618 | |
| | | | Series 2006-3, Class A4 | | | | |
| | 23,333 | | | 5.89%, 07/10/2044(3) | | | 24,558 | |
| | | | Series 2006-4, Class AM | | | | |
| | 60,000 | | | 5.68%, 07/10/2046 | | | 63,906 | |
| | | | Series 2006-5, Class A4 | | | | |
| | 25,000 | | | 5.41%, 09/10/2047 | | | 26,153 | |
| | | | Series 2007-1, Class A4 | | | | |
| | 23,610 | | | 5.45%, 01/15/2049 | | | 25,303 | |
| | | | Series 2007-3, Class A4 | | | | |
| | 30,000 | | | 5.55%, 06/10/2049(3) | | | 32,181 | |
| | | | Series 2007-4, Class A4 | | | | |
| | 7,776 | | | 5.75%, 02/10/2051(3) | | | 8,476 | |
| | | | Series 2007-5, Class A4 | | | | |
| | 20,000 | | | 5.49%, 02/10/2051 | | | 21,346 | |
| | | | Bear Stearns Commercial Mortgage Securities Trust | | | | |
| | | | Series 2005-PW10, Class A4 | | | | |
| | 48,970 | | | 5.41%, 12/11/2040(3) | | | 50,270 | |
| | | | Series 2006-PW14, Class A4 | | | | |
| | 60,000 | | | 5.20%, 12/11/2038 | | | 63,584 | |
The accompanying notes are an integral part of these financial statements.
|
| HIMCO VIT Portfolio Diversifier Fund |
Schedule of Investments – (continued)
December 31, 2014
| | | | | | | | |
Shares or Principal Amount | | Market Value(1) | |
ASSET & COMMERCIAL MORTGAGE BACKED
SECURITIES - 0.7% - (continued) | |
| | | | Bear Stearns Commercial Mortgage Securities Trust - (continued) | | | | |
| | | | Series 2007-PW15, Class A4 | | | | |
| $ | 21,703 | | | 5.33%, 02/11/2044 | | $ | 23,188 | |
| | | | Series 2007-PW16, Class A4 | | | | |
| | 60,000 | | | 5.71%, 06/11/2040(3) | | | 64,716 | |
| | | | Series 2007-PW18, Class A4 | | | | |
| | 25,000 | | | 5.70%, 06/11/2050 | | | 27,174 | |
| | | | Chase Issuance Trust | | | | |
| | | | Series 2012-A3, Class A3 | | | | |
| | 150,000 | | | 0.79%, 06/15/2017 | | | 150,199 | |
| | | | Series 2013-A1, Class A1 | | | | |
| | 100,000 | | | 1.30%, 02/18/2020 | | | 99,102 | |
| | | | Citibank Credit Card Issuance Trust | | | | |
| | | | Series 2005-A2, Class A2 | | | | |
| | 110,000 | | | 4.85%, 03/10/2017 | | | 110,925 | |
| | | | Series 2007-A8, Class A8, | | | | |
| | 100,000 | | | 5.65%, 09/20/2019 | | | 110,918 | |
| | | | Citigroup Commercial Mortgage Trust | | | | |
| | | | Series 2007-C6, Class A4 | | | | |
| | 35,000 | | | 5.71%, 12/10/2049(3) | | | 37,953 | |
| | | | Series 2008-C7, Class A4 | | | | |
| | 18,534 | | | 6.14%, 12/10/2049(3) | | | 20,302 | |
| | | | Citigroup/Deutsche Bank Commercial Mortgage Trust | | | | |
| | | | Series 2005-CD1, Class A4 | | | | |
| | 32,757 | | | 5.23%, 07/15/2044(3) | | | 33,286 | |
| | | | Series 2006-CD3, Class A5 | | | | |
| | 22,200 | | | 5.62%, 10/15/2048 | | | 23,333 | |
| | | | Series 2007-CD4, Class A4 | | | | |
| | 25,000 | | | 5.32%, 12/11/2049 | | | 26,469 | |
| | | | Series 2007-CD5, Class A4 | | | | |
| | 26,528 | | | 5.89%, 11/15/2044(3) | | | 28,896 | |
| | | | Cobalt CMBS Commercial Mortgage Trust | | | | |
| | | | Series 2006-C1, Class A4 | | | | |
| | 35,998 | | | 5.22%, 08/15/2048 | | | 37,935 | |
| | | | Series 2007-C2, Class A3 | | | | |
| | 23,697 | | | 5.48%, 04/15/2047(3) | | | 25,360 | |
| | | | Series 2007-C3, Class A4 | | | | |
| | 22,195 | | | 5.77%, 05/15/2046(3) | | | 24,083 | |
| | | | Commercial Mortgage Pass-Through Certificates | | | | |
| | | | Series 2006-C7, Class A4 | | | | |
| | 23,203 | | | 5.76%, 06/10/2046(3) | | | 24,320 | |
| | | | Series 2006-C8, Class A4 | | | | |
| | 19,455 | | | 5.31%, 12/10/2046 | | | 20,609 | |
| | | | Series 2007-C9, Class A4 | | | | |
| | 15,000 | | | 5.80%, 12/10/2049(3) | | | 16,384 | |
| | | | Series 2012-CR2, Class A4 | | | | |
| | 30,000 | | | 3.15%, 08/15/2045 | | | 30,733 | |
| | | | Commercial Mortgage Trust | | | | |
| | | | Series 2005-GG5, Class A5 | | | | |
| | 40,000 | | | 5.22%, 04/10/2037(3) | | | 40,433 | |
| | | | Series 2006-GG7, Class A4 | | | | |
| | 48,152 | | | 5.82%, 07/10/2038(3) | | | 50,333 | |
| | | | Series 2007-GG11, Class A4 | | | | |
| | 25,000 | | | 5.74%, 12/10/2049 | | | 27,076 | |
| | | | Series 2007-GG9, Class A4 | | | | |
| | 35,000 | | | 5.44%, 03/10/2039 | | | 37,334 | |
| | | | Series 2013-LC6, Class A4 | | | | |
| | 15,000 | | | 2.94%, 01/10/2046 | | | 15,073 | |
| | | | | | | | |
Shares or Principal Amount | | Market Value(1) | |
ASSET & COMMERCIAL MORTGAGE BACKED
SECURITIES - 0.7% - (continued) | |
| | | | Credit Suisse Commercial Mortgage Trust | | | | |
| | | | Series 2006-C1, Class A4 | | | | |
| $ | 50,000 | | | 5.47%, 02/15/2039(3) | | $ | 51,441 | |
| | | | Series 2006-C4, Class A3 | | | | |
| | 24,870 | | | 5.47%, 09/15/2039 | | | 26,177 | |
| | | | Series 2007-C3, Class A4 | | | | |
| | 23,337 | | | 5.70%, 06/15/2039(3) | | | 24,927 | |
| | | | Credit Suisse First Boston Mortgage Securities Corp., Series 2005-C5, Class A4 | | | | |
| | 54,672 | | | 5.10%, 08/15/2038(3) | | | 55,398 | |
| | | | Ford Credit Automotive Owner Trust, Series 2013-A, Class A4, ABS | | | | |
| | 100,000 | | | 0.78%, 05/15/2018 | | | 99,795 | |
| | | | GE Commercial Mortgage Corp., Series 2007-C1, Class A4 | | | | |
| | 30,000 | | | 5.54%, 12/10/2049 | | | 31,880 | |
| | | | GS Mortgage Securities Corp. II | | | | |
| | | | Series 2005-GG4, Class A4A | | | | |
| | 18,530 | | | 4.75%, 07/10/2039 | | | 18,548 | |
| | | | Series 2013-GC10, Class A5 | | | | |
| | 10,000 | | | 2.94%, 02/10/2046 | | | 9,997 | |
| | | | GS Mortgage Securities Trust | | | | |
| | | | Series 2006-GG8, Class A4 | | | | |
| | 24,585 | | | 5.56%, 11/10/2039 | | | 26,027 | |
| | | | Series 2007-GG10, Class A4 | | | | |
| | 40,627 | | | 5.80%, 08/10/2045(3) | | | 43,982 | |
| | | | Series 2012-GC6, Class A3 | | | | |
| | 20,000 | | | 3.48%, 01/10/2045 | | | 20,895 | |
| | | | Series 2012-GCJ7, Class A4 | | | | |
| | 50,000 | | | 3.38%, 05/10/2045 | | | 51,922 | |
| | | | Series 2013-GC12, Class A4 | | | | |
| | 40,000 | | | 3.14%, 06/10/2046 | | | 40,480 | |
| | | | Honda Automotive Receivables Owner Trust, Series 2012-1, Class A3 | | | | |
| | 11,739 | | | 0.77%, 01/15/2016 | | | 11,744 | |
| | | | JP Morgan Chase Commercial Mortgage Securities Trust | | | | |
| | | | Series 2005-LDP5, Class A4 | | | | |
| | 22,915 | | | 5.24%, 12/15/2044(3) | | | 23,299 | |
| | | | Series 2006-CB14, Class A4 | | | | |
| | 17,336 | | | 5.48%, 12/12/2044(3) | | | 17,725 | |
| | | | Series 2006-LDP7, Class A4 | | | | |
| | 100,000 | | | 5.87%, 04/15/2045(3) | | | 104,417 | |
| | | | Series 2006-LDP9, Class A3 | | | | |
| | 24,593 | | | 5.34%, 05/15/2047 | | | 26,118 | |
| | | | Series 2007-CB18, Class A4 | | | | |
| | 33,713 | | | 5.44%, 06/12/2047 | | | 35,846 | |
| | | | Series 2007-CB20, Class A4 | | | | |
| | 38,000 | | | 5.79%, 02/12/2051(3) | | | 41,179 | |
| | | | Series 2007-LD11, Class A4 | | | | |
| | 25,000 | | | 5.79%, 06/15/2049(3) | | | 26,839 | |
| | | | Series 2007-LDPX, Class A3 | | | | |
| | 18,832 | | | 5.42%, 01/15/2049 | | | 20,104 | |
| | | | Series 2011-C5, Class A3 | | | | |
| | 10,000 | | | 4.17%, 08/15/2046 | | | 10,803 | |
| | | | LB-UBS Commercial Mortgage Trust | | | | |
| | | | Series 2006-C4, Class A4 | | | | |
| | 9,584 | | | 5.83%, 06/15/2038(3) | | | 10,067 | |
| | | | Series 2006-C6, Class A4 | | | | |
| | 25,000 | | | 5.37%, 09/15/2039 | | | 26,428 | |
The accompanying notes are an integral part of these financial statements.
|
| HIMCO VIT Portfolio Diversifier Fund |
Schedule of Investments – (continued)
December 31, 2014
| | | | | | | | |
Shares or Principal Amount | | Market Value(1) | |
ASSET & COMMERCIAL MORTGAGE BACKED
SECURITIES - 0.7% - (continued) | |
| | | | LB-UBS Commercial Mortgage
Trust - (continued) | | | | |
| | | | Series 2007-C1, Class A4 | | | | |
| $ | 58,280 | | | 5.42%, 02/15/2040 | | $ | 62,409 | |
| | | | Series 2007-C7, Class A3 | | | | |
| | 15,031 | | | 5.87%, 09/15/2045(3) | | | 16,514 | |
| | | | ML-CFC Commercial Mortgage Trust | | | | |
| | | | Series 2006-2, Class A4 | | | | |
| | 33,841 | | | 5.87%, 06/12/2046(3) | | | 35,512 | |
| | | | Series 2006-4, Class A3 | | | | |
| | 23,636 | | | 5.17%, 12/12/2049 | | | 25,019 | |
| | | | Series 2007-5, Class A4 | | | | |
| | 23,915 | | | 5.38%, 08/12/2048 | | | 25,405 | |
| | | | Series 2007-9, Class A4 | | | | |
| | 40,000 | | | 5.70%, 09/12/2049 | | | 43,259 | |
| | | | Morgan Stanley Capital I Trust | | | | |
| | | | Series 2005-HQ6, Class A4A | | | | |
| | 74,780 | | | 4.99%, 08/13/2042 | | | 74,959 | |
| | | | Series 2006-IQ11, Class A4 | | | | |
| | 32,868 | | | 5.66%, 10/15/2042(3) | | | 33,764 | |
| | | | Series 2006-IQ12, Class A4 | | | | |
| | 46,833 | | | 5.33%, 12/15/2043 | | | 49,450 | |
| | | | Series 2007-IQ14, Class A4 | | | | |
| | 25,000 | | | 5.69%, 04/15/2049(3) | | | 26,918 | |
| | | | Series 2007-IQ16, Class A4 | | | | |
| | 24,812 | | | 5.81%, 12/12/2049 | | | 26,975 | |
| | | | Wachovia Bank Commercial Mortgage Trust | | | | |
| | | | Series 2005-C22, Class A4 | | | | |
| | 22,569 | | | 5.27%, 12/15/2044(3) | | | 23,051 | |
| | | | Series 2006-C23, Class A4 | | | | |
| | 19,577 | | | 5.42%, 01/15/2045(3) | | | 20,082 | |
| | | | Series 2006-C28, Class A4 | | | | |
| | 35,102 | | | 5.57%, 10/15/2048 | | | 37,097 | |
| | | | Series 2006-C29, Class A4 | | | | |
| | 24,332 | | | 5.31%, 11/15/2048 | | | 25,785 | |
| | | | Series 2007-C30, Class A5 | | | | |
| | 25,000 | | | 5.34%, 12/15/2043 | | | 26,678 | |
| | | | Series 2007-C31, Class A4 | | | | |
| | 25,000 | | | 5.51%, 04/15/2047 | | | 26,331 | |
| | | | Series 2007-C32, Class A3 | | | | |
| | 25,000 | | | 5.72%, 06/15/2049(3) | | | 26,835 | |
| | | | Series 2007-C34, Class A3 | | | | |
| | 25,000 | | | 5.68%, 05/15/2046 | | | 27,025 | |
| | | | WF-RBS Commercial Mortgage Trust, Series 2012-C10, Class A3 | | | | |
| | 40,000 | | | 2.88%, 12/15/2045 | | | 40,014 | |
| | | | | | | | |
| | |
| | | | Total Asset & Commercial Mortgage Backed Securities
(cost $2,993,871) | | | 2,967,028 | |
| | | | | | | | |
|
| CORPORATE BONDS - 11.9% | |
| | | | Advertising - 0.0% | | | |
| | | | Omnicom Group, Inc. | | | | |
| | 110,000 | | | 3.63%, 05/01/2022 | | | 112,925 | |
| | | | | | | | |
| | | | Aerospace/Defense - 0.2% | | | |
| | | | Boeing Co. (The) | | | | |
| | 200,000 | | | 4.88%, 02/15/2020 | | | 225,456 | |
| | | | | | | | |
Shares or Principal Amount | | Market Value(1) | |
| CORPORATE BONDS - 11.9% - (continued) | |
| | | | Aerospace/Defense - 0.2% - (continued) | | | |
| | | | General Dynamics Corp. | | | | |
| $ | 15,000 | | | 3.88%, 07/15/2021 | | $ | 16,108 | |
| | | | Lockheed Martin Corp. | | | | |
| | 140,000 | | | 4.25%, 11/15/2019 | | | 152,605 | |
| | 15,000 | | | 4.85%, 09/15/2041 | | | 16,748 | |
| | | | Northrop Grumman Corp. | | | | |
| | 40,000 | | | 4.75%, 06/01/2043 | | | 44,658 | |
| | 20,000 | | | 5.05%, 08/01/2019 | | | 22,198 | |
| | | | Raytheon Co. | | | | |
| | 95,000 | | | 3.13%, 10/15/2020 | | | 98,116 | |
| | | | United Technologies Corp. | | | | |
| | 170,000 | | | 4.50%, 04/15/2020 - 06/01/2042 | | | 186,417 | |
| | 115,000 | | | 6.13%, 02/01/2019 | | | 133,517 | |
| | | | | | | | |
| | | | | | | 895,823 | |
| | | | | | | | |
| | | | Agriculture - 0.1% | | | |
| | | | Altria Group, Inc. | | | | |
| | 270,000 | | | 4.75%, 05/05/2021 | | | 298,626 | |
| | 6,000 | | | 9.70%, 11/10/2018 | | | 7,619 | |
| | | | Archer-Daniels-Midland Co. | | | | |
| | 33,000 | | | 4.02%, 04/16/2043 | | | 33,112 | |
| | | | Philip Morris International, Inc. | | | | |
| | 240,000 | | | 4.50% 03/26/2020 - 03/20/2042 | | | 260,271 | |
| | | | | | | | |
| | | | | | | 599,628 | |
| | | | | | | | |
| | | | Auto Manufacturers - 0.1% | | | |
| | | | Daimler Finance North America LLC | | | | |
| | 18,000 | | | 8.50%, 01/18/2031 | | | 27,531 | |
| | | | Ford Motor Co. | | | | |
| | 130,000 | | | 7.45%, 07/16/2031 | | | 176,487 | |
| | | | Toyota Motor Credit Corp. | | | | |
| | | | MTN | | | | |
| | 70,000 | | | 2.00%, 10/24/2018 | | | 70,676 | |
| | 140,000 | | | 3.40%, 09/15/2021 | | | 147,247 | |
| | | | | | | | |
| | | | | | | 421,941 | |
| | | | | | | | |
| | | | Auto Parts&Equipment - 0.0% | | | |
| | | | Johnson Controls, Inc. | | | | |
| | 100,000 | | | 5.00%, 03/30/2020 | | | 109,746 | |
| | | | | | | | |
| | | | Beverages - 0.3% | | | |
| | | | Anheuser-Busch InBev Worldwide, Inc. | | | | |
| | 95,000 | | | 3.75%, 07/15/2042 | | | 89,311 | |
| | 325,000 | | | 5.38%, 01/15/2020 | | | 368,107 | |
| | | | Coca-Cola Co. (The) | | | | |
| | 240,000 | | | 1.65%, 03/14/2018 | | | 241,518 | |
| | 100,000 | | | 3.15%, 11/15/2020 | | | 104,544 | |
| | | | Diageo Capital plc | | | | |
| | 50,000 | | | 3.88%, 04/29/2043 | | | 49,232 | |
| | 75,000 | | | 5.50%, 09/30/2016 | | | 80,715 | |
| | | | Dr Pepper Snapple Group, Inc. | | | | |
| | 40,000 | | | 2.90%, 01/15/2016 | | | 40,806 | |
| | | | PepsiCo, Inc. | | | | |
| | 180,000 | | | 3.13%, 11/01/2020 | | | 186,290 | |
| | 65,000 | | | 5.50%, 01/15/2040 | | | 78,287 | |
| | | | | | | | |
| | | | | | | 1,238,810 | |
| | | | | | | | |
| | | | Biotechnology - 0.1% | | | |
| | | | Amgen, Inc. | | | | |
| | 195,000 | | | 3.88%, 11/15/2021 | | | 206,020 | |
| | 87,000 | | | 5.75%, 03/15/2040 | | | 104,089 | |
The accompanying notes are an integral part of these financial statements.
|
| HIMCO VIT Portfolio Diversifier Fund |
Schedule of Investments – (continued)
December 31, 2014
| | | | | | | | |
Shares or Principal Amount | | Market Value(1) | |
| CORPORATE BONDS - 11.9% - (continued) | |
| | | | Biotechnology - 0.1% - (continued) | |
| | | | Celgene Corp. | | | | |
| $ | 85,000 | | | 3.25%, 08/15/2022 | | $ | 85,547 | |
| | | | Gilead Sciences, Inc. | | | | |
| | 110,000 | | | 3.70%, 04/01/2024 | | | 115,371 | |
| | 20,000 | | | 4.40%, 12/01/2021 | | | 22,053 | |
| | 45,000 | | | 4.80%, 04/01/2044 | | | 49,917 | |
| | | | | | | | |
| | | | | | | 582,997 | |
| | | | | | | | |
| | | | Chemicals - 0.3% | | | |
| | | | CF Industries, Inc. | | | | |
| | 50,000 | | | 4.95%, 06/01/2043 | | | 49,842 | |
| | | | Dow Chemical Co. (The) | | | | |
| | 200,000 | | | 4.13%, 11/15/2021 | | | 211,321 | |
| | 25,000 | | | 4.38%, 11/15/2042 | | | 24,214 | |
| | 90,000 | | | 8.55%, 05/15/2019 | | | 111,892 | |
| | | | Eastman Chemical Co. | | | | |
| | 90,000 | | | 3.80%, 03/15/2025 | | | 91,618 | |
| | | | Ecolab, Inc. | | | | |
| | 95,000 | | | 4.35%, 12/08/2021 | | | 103,511 | |
| | | | EI du Pont de Nemours & Co. | | | | |
| | 160,000 | | | 3.63%, 01/15/2021 | | | 169,606 | |
| | 20,000 | | | 5.60%, 12/15/2036 | | | 24,328 | |
| | | | LYB International Finance BV | | | | |
| | 50,000 | | | 4.00%, 07/15/2023 | | | 51,147 | |
| | 30,000 | | | 4.88%, 03/15/2044 | | | 30,863 | |
| | | | Monsanto Co. | | | | |
| | 80,000 | | | 4.40%, 07/15/2044 | | | 83,004 | |
| | | | Potash Corp. of Saskatchewan, Inc. | | | | |
| | 35,000 | | | 6.50%, 05/15/2019 | | | 40,850 | |
| | | | PPG Industries, Inc. | | | | |
| | 20,000 | | | 3.60%, 11/15/2020 | | | 20,812 | |
| | | | Praxair, Inc. | | | | |
| | 55,000 | | | 2.45%, 02/15/2022 | | | 54,014 | |
| | | | | | | | |
| | | | | | | 1,067,022 | |
| | | | | | | | |
| | | | Commercial Banks - 2.4% | | | |
| | | | Bank of America Corp. | | | | |
| | 160,000 | | | 3.30%, 01/11/2023 | | | 160,012 | |
| | 445,000 | | | 5.00%, 05/13/2021 | | | 496,555 | |
| | 560,000 | | | 5.65%, 05/01/2018 | | | 622,145 | |
| | 50,000 | | | 5.88%, 02/07/2042 | | | 62,568 | |
| | | | Bank of Montreal | | | | |
| | 150,000 | | | 1.45%, 04/09/2018 | | | 148,150 | |
| | | | Bank of New York Mellon Corp. (The) | | | | |
| | 135,000 | | | 2.30%, 07/28/2016 | | | 137,952 | |
| | 50,000 | | | 3.55%, 09/23/2021 | | | 52,273 | |
| | | | Bank of Nova Scotia | | | | |
| | 95,000 | | | 4.38%, 01/13/2021 | | | 105,746 | |
| | | | Barclays Bank plc | | | | |
| | 250,000 | | | 5.00%, 09/22/2016 | | | 266,399 | |
| | | | BB&T Corp. | | | | |
| | 80,000 | | | 3.20%, 03/15/2016 | | | 81,842 | |
| | 130,000 | | | 5.25%, 11/01/2019 | | | 144,820 | |
| | | | Capital One Financial Corp. | | | | |
| | 140,000 | | | 4.75%, 07/15/2021 | | | 154,299 | |
| | 110,000 | | | 6.15%, 09/01/2016 | | | 118,210 | |
| | | | Citigroup, Inc. | | | | |
| | 40,000 | | | 3.38%, 03/01/2023 | | | 40,358 | |
| | 100,000 | | | 4.45%, 01/10/2017 | | | 105,708 | |
| | 498,000 | | | 5.38%, 08/09/2020 | | | 566,004 | |
| | 165,000 | | | 6.63%, 06/15/2032 | | | 205,554 | |
| | | | | | | | |
Shares or Principal Amount | | Market Value(1) | |
| CORPORATE BONDS - 11.9% - (continued) | |
| | | | Commercial Banks - 2.4% - (continued) | |
| | | | Cooperatieve Centrale Raiffeisen-Boerenleenbank BA | | | | |
| $ | 245,000 | | | 4.50%, 01/11/2021 | | $ | 269,488 | |
| | 25,000 | | | 5.25%, 05/24/2041 | | | 29,900 | |
| | | | Credit Suisse | | | | |
| | 260,000 | | | 5.30%, 08/13/2019 | | | 291,645 | |
| | | | Deutsche Bank AG | | | | |
| | 110,000 | | | 3.25%, 01/11/2016 | | | 112,386 | |
| | 70,000 | | | 3.70%, 05/30/2024 | | | 71,034 | |
| | | | Fifth Third Bancorp | | | | |
| | 100,000 | | | 3.50%, 03/15/2022 | | | 102,508 | |
| | 35,000 | | | 3.63%, 01/25/2016 | | | 35,863 | |
| | | | Goldman Sachs Group, Inc. (The) | | | | |
| | 400,000 | | | 3.85%, 07/08/2024 | | | 410,239 | |
| | 184,000 | | | 6.25%, 02/01/2041 | | | 232,602 | |
| | | | HSBC Holdings plc | | | | |
| | 660,000 | | | 5.10%, 04/05/2021 | | | 746,063 | |
| | | | JPMorgan Chase & Co. | | | | |
| | 785,000 | | | 4.95%, 03/25/2020 | | | 867,193 | |
| | 60,000 | | | 5.50%, 10/15/2040 | | | 71,827 | |
| | 80,000 | | | 6.00%, 01/15/2018 | | | 89,507 | |
| | 275,000 | | | 6.30%, 04/23/2019 | | | 319,433 | |
| | | | Morgan Stanley | | | | |
| | 200,000 | | | 5.45%, 01/09/2017 | | | 214,743 | |
| | 590,000 | | | 5.50%, 07/28/2021 | | | 669,580 | |
| | | | PNC Funding Corp. | | | | |
| | 70,000 | | | 2.70%, 09/19/2016 | | | 71,887 | |
| | 70,000 | | | 3.30%, 03/08/2022 | | | 71,989 | |
| | 150,000 | | | 5.13%, 02/08/2020 | | | 168,550 | |
| | | | Royal Bank of Canada | | | | |
| | 185,000 | | | 2.30%, 07/20/2016 | | | 188,800 | |
| | | | Royal Bank of Scotland plc (The) | | | | |
| | 35,000 | | | 6.13%, 01/11/2021 | | | 41,243 | |
| | | | State Street Corp. | | | | |
| | 80,000 | | | 4.38%, 03/07/2021 | | | 87,524 | |
| | | | UBS AG | | | | |
| | 150,000 | | | 5.75%, 04/25/2018 | | | 168,741 | |
| | 100,000 | | | 5.88%, 07/15/2016 | | | 106,987 | |
| | | | US Bancorp | | | | |
| | 50,000 | | | 4.13%, 05/24/2021 | | | 54,661 | |
| | | | Wells Fargo & Co. | | | | |
| | 330,000 | | | 2.10%, 05/08/2017 | | | 335,593 | |
| | 70,000 | | | 3.50%, 03/08/2022 | | | 73,075 | |
| | 270,000 | | | 4.60%, 04/01/2021 | | | 300,418 | |
| | 130,000 | | | 5.61%, 01/15/2044 | | | 153,038 | |
| | | | | | | | |
| | | | | | | 9,825,112 | |
| | | | | | | | |
| | | | Commercial Services - 0.0% | | | |
| | | | Princeton University | | | | |
| | 75,000 | | | 4.95%, 03/01/2019 | | | 83,982 | |
| | | | | | | | |
| | | | Construction Materials - 0.0% | | | |
| | | | CRH America, Inc. | | | | |
| | 60,000 | | | 6.00%, 09/30/2016 | | | 64,579 | |
| | | | | | | | |
| | | | Diversified Financial Services - 0.5% | | | |
| | | | American Express Co. | | | | |
| | 208,000 | | | 2.65%, 12/02/2022 | | | 204,003 | |
| | | | BlackRock, Inc. | | | | |
| | 105,000 | | | 5.00%, 12/10/2019 | | | 118,711 | |
| | | | Ford Motor Credit Co. LLC | | | | |
| | 270,000 | | | 6.63%, 08/15/2017 | | | 300,984 | |
The accompanying notes are an integral part of these financial statements.
|
| HIMCO VIT Portfolio Diversifier Fund |
Schedule of Investments – (continued)
December 31, 2014
| | | | | | | | |
Shares or Principal Amount | | Market Value(1) | |
| CORPORATE BONDS - 11.9% - (continued) | |
| | | | Diversified Financial
Services - 0.5% - (continued) | | | |
| | | | General Electric Capital Corp. | | | | |
| $ | 395,000 | | | 4.38%, 09/16/2020 | | $ | 432,618 | |
| | 525,000 | | | 5.30%, 02/11/2021 | | | 599,543 | |
| | 35,000 | | | 5.88%, 01/14/2038 | | | 44,288 | |
| | | | HSBC Finance Corp. | | | | |
| | 130,000 | | | 6.68%, 01/15/2021 | | | 154,239 | |
| | | | National Rural Utilities Cooperative Finance Corp. | | | | |
| | 110,000 | | | 3.05%, 02/15/2022 | | | 111,024 | |
| | 30,000 | | | 5.45%, 04/10/2017 | | | 32,775 | |
| | | | | | | | |
| | | | | | | 1,998,185 | |
| | | | | | | | |
| | | | Electric - 0.7% | | | |
| | | | Alabama Power Co. | | | | |
| | 40,000 | | | 6.00%, 03/01/2039 | | | 52,719 | |
| | | | Berkshire Hathaway Energy Co. | | | | |
| | 140,000 | | | 6.13%, 04/01/2036 | | | 175,887 | |
| | | | CenterPoint Energy Houston Electric LLC | | | | |
| | 15,000 | | | 3.55%, 08/01/2042 | | | 14,448 | |
| | | | CMS Energy Corp. | | | | |
| | 60,000 | | | 5.05%, 03/15/2022 | | | 67,267 | |
| | | | Consolidated Edison Co. of New York, Inc. | | | | |
| | 55,000 | | | 3.95%, 03/01/2043 | | | 54,854 | |
| | 25,000 | | | 5.50%, 12/01/2039 | | | 30,008 | |
| | 40,000 | | | 6.65%, 04/01/2019 | | | 47,083 | |
| | | | Dominion Resources, Inc. | | | | |
| | 395,000 | | | 4.45%, 03/15/2021 | | | 427,969 | |
| | | | Duke Energy Carolinas LLC | | | | |
| | 25,000 | | | 4.00%, 09/30/2042 | | | 25,654 | |
| | 105,000 | | | 5.30%, 02/15/2040 | | | 130,032 | |
| | | | Exelon Generation Co. LLC | | | | |
| | 145,000 | | | 4.00%, 10/01/2020 | | | 151,294 | |
| | 85,000 | | | 6.25%, 10/01/2039 | | | 102,091 | |
| | | | Florida Power & Light Co. | | | | |
| | 105,000 | | | 5.69%, 03/01/2040 | | | 136,844 | |
| | | | Georgia Power Co. | | | | |
| | 100,000 | | | 2.85%, 05/15/2022 | | | 100,568 | |
| | 50,000 | | | 4.75%, 09/01/2040 | | | 55,588 | |
| | | | Indiana Michigan Power Co. | | | | |
| | 25,000 | | | 6.05%, 03/15/2037 | | | 31,470 | |
| | | | Kentucky Utilities Co. | | | | |
| | 70,000 | | | 5.13%, 11/01/2040 | | | 83,930 | |
| | | | Nevada Power Co., Series R | | | | |
| | 55,000 | | | 6.75%, 07/01/2037 | | | 77,854 | |
| | | | Northern States Power Co. | | | | |
| | 95,000 | | | 3.40%, 08/15/2042 | | | 90,007 | |
| | | | Ohio Power Co., Series M | | | | |
| | 155,000 | | | 5.38%, 10/01/2021 | | | 179,301 | |
| | | | Oncor Electric Delivery Co. LLC | | | | |
| | 95,000 | | | 7.00%, 09/01/2022 | | | 120,332 | |
| | | | Pacific Gas & Electric Co. | | | | |
| | 140,000 | | | 6.05%, 03/01/2034 | | | 178,235 | |
| | | | Progress Energy, Inc. | | | | |
| | 210,000 | | | 4.40%, 01/15/2021 | | | 228,887 | |
| | | | PSEG Power LLC | | | | |
| | 25,000 | | | 5.13%, 04/15/2020 | | | 27,773 | |
| | | | Public Service Electric & Gas Co. | | | | |
| | 75,000 | | | 3.95%, 05/01/2042 | | | 77,605 | |
| | | | San Diego Gas & Electric Co. | | | | |
| | 32,000 | | | 4.50%, 08/15/2040 | | | 35,614 | |
| | | | | | | | |
Shares or Principal Amount | | Market Value(1) | |
| CORPORATE BONDS - 11.9% - (continued) | |
| | | | Electric - 0.7% - (continued) | | | |
| | | | South Carolina Electric & Gas Co. | | | | |
| $ | 40,000 | | | 6.05%, 01/15/2038 | | $ | 52,044 | |
| | | | Southern California Edison Co. | | | | |
| | 105,000 | | | 4.50%, 09/01/2040 | | | 114,872 | |
| | | | Xcel Energy, Inc. | | | | |
| | 65,000 | | | 4.70%, 05/15/2020 | | | 72,126 | |
| | | | | | | | |
| | | | | | | 2,942,356 | |
| | | | | | | | |
| | | | Electrical Compo&Equip - 0.0% | | | |
| | | | Emerson Electric Co. | | | | |
| | 70,000 | | | 4.88%, 10/15/2019 | | | 77,820 | |
| | | | | | | | |
| | | | Electronics - 0.1% | | | |
| | | | Honeywell International, Inc. | | | | |
| | 160,000 | | | 4.25%, 03/01/2021 | | | 179,275 | |
| | | | Koninklijke Philips N.V. | | | | |
| | 38,000 | | | 6.88%, 03/11/2038 | | | 51,608 | |
| | | | Thermo Fisher Scientific, Inc. | | | | |
| | 155,000 | | | 2.25%, 08/15/2016 | | | 157,416 | |
| | 100,000 | | | 4.15%, 02/01/2024 | | | 105,459 | |
| | | | | | | | |
| | | | | | | 493,758 | |
| | | | | | | | |
| | | | Environmental Control - 0.1% | |
| | | | Republic Services, Inc. | | | | |
| | 95,000 | | | 5.00%, 03/01/2020 | | | 105,032 | |
| | | | Waste Management, Inc. | | | | |
| | 105,000 | | | 4.75%, 06/30/2020 | | | 115,092 | |
| | 25,000 | | | 6.13%, 11/30/2039 | | | 32,361 | |
| | | | | | | | |
| | | | | | | 252,485 | |
| | | | | | | | |
| | | | Food - 0.2% | |
| | | | ConAgra Foods, Inc. | | | | |
| | 14,000 | | | 4.65%, 01/25/2043 | | | 14,611 | |
| | 94,000 | | | 7.00%, 04/15/2019 | | | 109,493 | |
| | | | General Mills, Inc. | | | | |
| | 80,000 | | | 5.65%, 02/15/2019 | | | 90,820 | |
| | | | Kellogg Co. | | | | |
| | 45,000 | | | 4.00%, 12/15/2020 | | | 48,164 | |
| | | | Kraft Foods Group, Inc. | | | | |
| | 75,000 | | | 5.00%, 06/04/2042 | | | 82,560 | |
| | 73,000 | | | 5.38%, 02/10/2020 | | | 82,849 | |
| | | | Kroger Co. (The) | | | | |
| | 70,000 | | | 6.80%, 12/15/2018 | | | 81,643 | |
| | 40,000 | | | 7.50%, 04/01/2031 | | | 54,019 | |
| | | | Mondelez International, Inc. | | | | |
| | 200,000 | | | 4.00%, 02/01/2024 | | | 209,253 | |
| | | | Tyson Foods, Inc. | | | | |
| | 50,000 | | | 3.95%, 08/15/2024 | | | 51,686 | |
| | | | Unilever Capital Corp. | | | | |
| | 50,000 | | | 5.90%, 11/15/2032 | | | 68,374 | |
| | | | | | | | |
| | | | | | | 893,472 | |
| | | | | | | | |
| | | | Forest Products&Paper - 0.0% | |
| | | | Georgia-Pacific LLC | | | | |
| | 40,000 | | | 7.75%, 11/15/2029 | | | 56,323 | |
| | | | International Paper Co. | | | | |
| | 110,000 | | | 7.50%, 08/15/2021 | | | 137,122 | |
| | | | | | | | |
| | | | | | | 193,445 | |
| | | | | | | | |
| | | | Gas - 0.0% | |
| | | | Atmos Energy Corp. | | | | |
| | 8,000 | | | 5.50%, 06/15/2041 | | | 9,849 | |
The accompanying notes are an integral part of these financial statements.
|
| HIMCO VIT Portfolio Diversifier Fund |
Schedule of Investments – (continued)
December 31, 2014
| | | | | | | | |
Shares or Principal Amount | | Market Value(1) | |
| CORPORATE BONDS - 11.9% - (continued) | |
| | | | Gas - 0.0% - (continued) | |
| | | | Sempra Energy | | | | |
| $ | 65,000 | | | 6.00%, 10/15/2039 | | $ | 80,301 | |
| | 35,000 | | | 6.50%, 06/01/2016 | | | 37,585 | |
| | | | | | | | |
| | | | | | | 127,735 | |
| | | | | | | | |
| | | | Healthcare-Products - 0.2% | |
| | | | Baxter International, Inc. | | | | |
| | 130,000 | | | 2.40%, 08/15/2022 | | | 123,925 | |
| | 30,000 | | | 4.50%, 08/15/2019 | | | 32,877 | |
| | | | Boston Scientific Corp. | | | | |
| | 70,000 | | | 6.00%, 01/15/2020 | | | 78,889 | |
| | | | Covidien International Finance S.A. | | | | |
| | 45,000 | | | 3.20%, 06/15/2022 | | | 45,404 | |
| | 25,000 | | | 6.00%, 10/15/2017 | | | 27,977 | |
| | | | Medtronic, Inc. | | | | |
| | 320,000 | | | 3.50%, 03/15/2025(4) | | | 327,350 | |
| | 15,000 | | | 4.00%, 04/01/2043 | | | 14,302 | |
| | 120,000 | | | 4.45%, 03/15/2020 | | | 131,659 | |
| | | | | | | | |
| | | | | | | 782,383 | |
| | | | | | | | |
| | | | Healthcare-Services - 0.1% | |
| | | | Aetna, Inc. | | | | |
| | 165,000 | | | 3.95%, 09/01/2020 | | | 174,227 | |
| | | | Cigna Corp. | | | | |
| | 100,000 | | | 4.00%, 02/15/2022 | | | 105,372 | |
| | 10,000 | | | 5.38%, 02/15/2042 | | | 11,826 | |
| | | | Quest Diagnostics, Inc. | | | | |
| | 40,000 | | | 4.70%, 04/01/2021 | | | 43,310 | |
| | | | UnitedHealth Group, Inc. | | | | |
| | 125,000 | | | 6.88%, 02/15/2038 | | | 175,406 | |
| | | | WellPoint, Inc. | | | | |
| | 65,000 | | | 4.65%, 01/15/2043 | | | 67,649 | |
| | | | | | | | |
| | | | | | | 577,790 | |
| | | | | | | | |
| | | | Household Products - 0.1% | |
| | | | Colgate-Palmolive Co. | | | | |
| | 90,000 | | | 2.30%, 05/03/2022 | | | 88,481 | |
| | | | Procter & Gamble Co. (The) | | | | |
| | 115,000 | | | 4.70%, 02/15/2019 | | | 128,054 | |
| | 20,000 | | | 5.55%, 03/05/2037 | | | 25,864 | |
| | | | | | | | |
| | | | | | | 242,399 | |
| | | | | | | | |
| | | | Household Products/Wares - 0.0% | |
| | | | Kimberly-Clark Corp. | | | | |
| | 12,000 | | | 5.30%, 03/01/2041 | | | 14,839 | |
| | 90,000 | | | 6.13%, 08/01/2017 | | | 100,692 | |
| | | | | | | | |
| | | | | | | 115,531 | |
| | | | | | | | |
| | | | Insurance - 0.5% | |
| | | | ACE INA Holdings, Inc. | | | | |
| | 115,000 | | | 2.70%, 03/13/2023 | | | 111,662 | |
| | | | Allstate Corp. (The) | | | | |
| | 75,000 | | | 5.55%, 05/09/2035 | | | 92,945 | |
| | | | American International Group, Inc. | | | | |
| | 90,000 | | | 4.50%, 07/16/2044 | | | 95,086 | |
| | 136,000 | | | 6.40%, 12/15/2020 | | | 162,176 | |
| | | | Aon Corp. | | | | |
| | 20,000 | | | 5.00%, 09/30/2020 | | | 22,332 | |
| | | | Berkshire Hathaway Finance Corp. | | | | |
| | 225,000 | | | 5.40%, 05/15/2018 | | | 251,758 | |
| | | | Berkshire Hathaway, Inc. | | | | |
| | 75,000 | | | 4.50%, 02/11/2043 | | | 82,021 | |
| | | | | | | | |
Shares or Principal Amount | | Market Value(1) | |
| CORPORATE BONDS - 11.9% - (continued) | |
| | | | Insurance - 0.5% - (continued) | |
| | | | Chubb Corp. (The) | | | | |
| $ | 90,000 | | | 5.75%, 05/15/2018 | | $ | 101,680 | |
| | | | Lincoln National Corp. | | | | |
| | 60,000 | | | 4.00%, 09/01/2023 | | | 62,249 | |
| | 60,000 | | | 4.85%, 06/24/2021 | | | 66,095 | |
| | | | Marsh & McLennan Cos., Inc. | | | | |
| | 35,000 | | | 4.80%, 07/15/2021 | | | 38,900 | |
| | | | MetLife, Inc. | | | | |
| | 90,000 | | | 5.70%, 06/15/2035 | | | 112,157 | |
| | 120,000 | | | 7.72%, 02/15/2019 | | | 145,413 | |
| | | | Principal Financial Group, Inc. | | | | |
| | 70,000 | | | 3.30%, 09/15/2022 | | | 69,979 | |
| | | | Prudential Financial, Inc. | | | | |
| | 205,000 | | | 5.38%, 06/21/2020 | | | 231,367 | |
| | 45,000 | | | 5.80%, 11/16/2041 | | | 54,499 | |
| | | | Travelers Cos., Inc. (The) | | | | |
| | 140,000 | | | 3.90%, 11/01/2020 | | | 150,389 | |
| | 30,000 | | | 4.60%, 08/01/2043 | | | 33,678 | |
| | | | | | | | |
| | | | | | | 1,884,386 | |
| | | | | | | | |
| | | | Internet - 0.0% | |
| | | | Google, Inc. | | | | |
| | 65,000 | | | 2.13%, 05/19/2016 | | | 66,397 | |
| | | | | | | | |
| | | | Iron/Steel - 0.1% | |
| | | | Vale Overseas Ltd. | | | | |
| | 190,000 | | | 6.25%, 01/23/2017 | | | 202,656 | |
| | 90,000 | | | 6.88%, 11/10/2039 | | | 95,855 | |
| | | | | | | | |
| | | | | | | 298,511 | |
| | | | | | | | |
| | | | IT Services - 0.2% | |
| | | | Apple, Inc. | | | | |
| | 360,000 | | | 2.40%, 05/03/2023 | | | 349,919 | |
| | | | EMC Corp. | | | | |
| | 110,000 | | | 2.65%, 06/01/2020 | | | 109,471 | |
| | | | Hewlett-Packard Co. | | | | |
| | 45,000 | | | 4.30%, 06/01/2021 | | | 47,381 | |
| | 250,000 | | | 5.50%, 03/01/2018 | | | 275,926 | |
| | | | International Business Machines Corp. | | | | |
| | 115,000 | | | 5.60%, 11/30/2039 | | | 138,894 | |
| | 100,000 | | | 5.70%, 09/14/2017 | | | 111,443 | |
| | | | | | | | |
| | | | | | | 1,033,034 | |
| | | | | | | | |
| | | | Machinery-Constr&Mining - 0.1% | |
| | | | Caterpillar, Inc. | | | | |
| | 50,000 | | | 3.80%, 08/15/2042 | | | 49,137 | |
| | 185,000 | | | 3.90%, 05/27/2021 | | | 200,335 | |
| | | | Joy Global, Inc. | | | | |
| | 10,000 | | | 5.13%, 10/15/2021 | | | 10,925 | |
| | | | | | | | |
| | | | | | | 260,397 | |
| | | | | | | | |
| | | | Machinery-Diversified - 0.1% | |
| | | | Deere & Co. | | | | |
| | 30,000 | | | 3.90%, 06/09/2042 | | | 30,322 | |
| | | | John Deere Capital Corp. | | | | |
| | 105,000 | | | 1.85%, 09/15/2016 | | | 106,747 | |
| | 165,000 | | | 2.80%, 09/18/2017 | | | 171,461 | |
| | | | | | | | |
| | | | | | | 308,530 | |
| | | | | | | | |
| | | | Media - 0.6% | |
| | | | 21st Century Fox America, Inc. | | | | |
| | 95,000 | | | 4.50%, 02/15/2021 | | | 103,986 | |
| | 131,000 | | | 6.40%, 12/15/2035 | | | 170,976 | |
The accompanying notes are an integral part of these financial statements.
|
| HIMCO VIT Portfolio Diversifier Fund |
Schedule of Investments – (continued)
December 31, 2014
| | | | | | | | |
Shares or Principal Amount | | Market Value(1) | |
| CORPORATE BONDS - 11.9% - (continued) | |
| | | | Media - 0.6% - (continued) | |
| | | | CBS Corp. | | | | |
| $ | 90,000 | | | 3.70%, 08/15/2024 | | $ | 89,753 | |
| | | | Comcast Corp. | | | | |
| | 90,000 | | | 4.65%, 07/15/2042 | | | 98,506 | |
| | 305,000 | | | 5.15%, 03/01/2020 | | | 345,419 | |
| | 55,000 | | | 7.05%, 03/15/2033 | | | 76,525 | |
| | | | DIRECTV Holdings LLC / DIRECTV Financing Co., Inc. | | | | |
| | 30,000 | | | 3.50%, 03/01/2016 | | | 30,782 | |
| | 145,000 | | | 5.00%, 03/01/2021 | | | 158,122 | |
| | 50,000 | | | 5.15%, 03/15/2042 | | | 51,668 | |
| | | | Discovery Communications LLC | |
| | 50,000 | | | 4.88%, 04/01/2043 | | | 51,551 | |
| | 20,000 | | | 5.05%, 06/01/2020 | | | 21,972 | |
| | | | NBCUniversal Media LLC | | | | |
| | 125,000 | | | 4.38%, 04/01/2021 | | | 137,475 | |
| | | | Time Warner Cable, Inc. | |
| | 345,000 | | | 4.00%, 09/01/2021 | | | 367,181 | |
| | 65,000 | | | 6.75%, 07/01/2018 | | | 74,547 | |
| | | | Time Warner, Inc. | |
| | 130,000 | | | 4.88%, 03/15/2020 | | | 143,043 | |
| | 160,000 | | | 6.50%, 11/15/2036 | | | 203,548 | |
| | | | Viacom, Inc. | | | | |
| | 113,000 | | | 4.38%, 03/15/2043 | | | 104,051 | |
| | | | Walt Disney Co. (The) | |
| | 35,000 | | | 4.13%, 12/01/2041 | | | 36,932 | |
| | 50,000 | | | 5.63%, 09/15/2016 | | | 54,048 | |
| | | | | | | | |
| | | | | | | 2,320,085 | |
| | | | | | | | |
| | | | Mining - 0.2% | |
| | | | Barrick Gold Corp. | |
| | 25,000 | | | 5.25%, 04/01/2042 | | | 23,109 | |
| | 110,000 | | | 6.95%, 04/01/2019 | | | 125,258 | |
| | | | BHP Billiton Finance USA Ltd. | |
| | 80,000 | | | 3.85%, 09/30/2023 | | | 84,220 | |
| | 15,000 | | | 4.13%, 02/24/2042 | | | 14,662 | |
| | 110,000 | | | 6.50%, 04/01/2019 | | | 129,290 | |
| | | | Freeport-McMoRan, Inc. | | | | |
| | 170,000 | | | 3.88%, 03/15/2023 | | | 160,282 | |
| | | | Newmont Mining Corp. | | | | |
| | 38,000 | | | 6.25%, 10/01/2039 | | | 38,545 | |
| | | | Rio Tinto Finance USA Ltd. | |
| | 145,000 | | | 3.75%, 09/20/2021 | | | 149,031 | |
| | 170,000 | | | 6.50%, 07/15/2018 | | | 194,625 | |
| | | | Southern Copper Corp. | | | | |
| | 55,000 | | | 6.75%, 04/16/2040 | | | 57,695 | |
| | | | Teck Resources Ltd. | |
| | 40,000 | | | 4.50%, 01/15/2021 | | | 39,125 | |
| | 30,000 | | | 5.40%, 02/01/2043 | | | 25,356 | |
| | | | | | | | |
| | | | | | | 1,041,198 | |
| | | | | | | | |
| | | | Miscellaneous Manufacturer - 0.1% | |
| | | | 3M Co. | |
| | 75,000 | | | 1.38%, 09/29/2016 | | | 75,839 | |
| | 25,000 | | | 5.70%, 03/15/2037 | | | 32,452 | |
| | | | Eaton Corp. | | | | |
| | 115,000 | | | 2.75%, 11/02/2022 | | | 112,976 | |
| | | | General Electric Co. | |
| | 87,000 | | | 4.13%, 10/09/2042 | | | 90,063 | |
| | 120,000 | | | 5.25%, 12/06/2017 | | | 133,118 | |
| | | | | | | | |
Shares or Principal Amount | | Market Value(1) | |
| CORPORATE BONDS - 11.9% - (continued) | |
| | | | Miscellaneous Manufacturer - 0.1% - (continued) | |
| | | | Illinois Tool Works, Inc. | | | | |
| $ | 15,000 | | | 3.90%, 09/01/2042 | | $ | 15,111 | |
| | | | | | | | |
| | | | | | | 459,559 | |
| | | | | | | | |
| | | | Multi-National - 0.7% | |
| | | | Asian Development Bank | |
| | 100,000 | | | 1.75%, 09/11/2018 | | | 100,879 | |
| | 265,000 | | | 2.50%, 03/15/2016 | | | 271,387 | |
| | | | European Bank for Reconstruction & Development | | | | |
| | 285,000 | | | 2.50%, 03/15/2016 | | | 292,049 | |
| | | | European Investment Bank | |
| | 695,000 | | | 1.25%, 10/14/2016 | | | 701,602 | |
| | 490,000 | | | 2.88%, 09/15/2020 | | | 515,093 | |
| | | | Inter-American Development Bank | | | | |
| | 480,000 | | | 3.88%, 02/14/2020 | | | 528,684 | |
| | | | International Bank for Reconstruction & Development | | | | |
| | 277,000 | | | 7.63%, 01/19/2023 | | | 387,009 | |
| | | | | | | | |
| | | | | | | 2,796,703 | |
| | | | | | | | |
| | | | Office/Business Equip - 0.0% | |
| | | | Xerox Corp. | | | | |
| | 20,000 | | | 6.35%, 05/15/2018 | | | 22,614 | |
| | | | | | | | |
| | | | Oil & Gas - 1.0% | |
| | | | Anadarko Petroleum Corp. | |
| | 40,000 | | | 5.95%, 09/15/2016 | | | 42,775 | |
| | 30,000 | | | 6.20%, 03/15/2040 | | | 35,144 | |
| | | | Apache Corp. | | | | |
| | 100,000 | | | 5.10%, 09/01/2040 | | | 97,953 | |
| | | | BP Capital Markets plc | |
| | 160,000 | | | 2.25%, 11/01/2016 | | | 163,088 | |
| | 190,000 | | | 3.25%, 05/06/2022 | | | 186,777 | |
| | | | Canadian Natural Resources Ltd. | |
| | 60,000 | | | 5.70%, 05/15/2017 | | | 65,043 | |
| | 40,000 | | | 6.50%, 02/15/2037 | | | 45,831 | |
| | | | Cenovus Energy, Inc. | |
| | 15,000 | | | 4.45%, 09/15/2042 | | | 12,972 | |
| | 25,000 | | | 5.70%, 10/15/2019 | | | 27,541 | |
| | | | Chevron Corp. | |
| | 35,000 | | | 2.36%, 12/05/2022 | | | 33,940 | |
| | 150,000 | | | 2.43%, 06/24/2020 | | | 150,725 | |
| | | | ConocoPhillips | | | | |
| | 128,000 | | | 6.50%, 02/01/2039 | | | 170,067 | |
| | | | Continental Resources, Inc. | | | | |
| | 60,000 | | | 4.90%, 06/01/2044 | | | 52,000 | |
| | | | Devon Financing Corp. LLC | | | | |
| | 65,000 | | | 7.88%, 09/30/2031 | | | 88,669 | |
| | | | Encana Corp. | | | | |
| | 50,000 | | | 6.50%, 02/01/2038 | | | 53,453 | |
| | | | Ensco plc | | | | |
| | 50,000 | | | 4.70%, 03/15/2021 | | | 50,226 | |
| | | | Hess Corp. | | | | |
| | 53,000 | | | 5.60%, 02/15/2041 | | | 56,833 | |
| | | | Kerr-McGee Corp. | | | | |
| | 100,000 | | | 6.95%, 07/01/2024 | | | 122,222 | |
| | | | Marathon Oil Corp. | | | | |
| | 15,000 | | | 6.60%, 10/01/2037 | | | 17,667 | |
| | | | Marathon Petroleum Corp. | | | | |
| | 15,000 | | | 5.13%, 03/01/2021 | | | 16,396 | |
| | | | Nexen Energy ULC | | | | |
| | 50,000 | | | 7.50%, 07/30/2039 | | | 69,392 | |
The accompanying notes are an integral part of these financial statements.
|
| HIMCO VIT Portfolio Diversifier Fund |
Schedule of Investments – (continued)
December 31, 2014
| | | | | | | | |
Shares or Principal Amount | | Market Value(1) | |
| CORPORATE BONDS - 11.9% - (continued) | |
| | | | Oil & Gas - 1.0% - (continued) | |
| | | | Noble Energy, Inc. | | | | |
| $ | 20,000 | | | 6.00%, 03/01/2041 | | $ | 21,981 | |
| | | | Noble Holding International Ltd. | | | | |
| | 45,000 | | | 3.95%, 03/15/2022 | | | 39,422 | |
| | | | Occidental Petroleum Corp. | | | | |
| | 40,000 | | | 4.10%, 02/01/2021 | | | 42,450 | |
| | | | Petrobras International Finance Co. SA | | | | |
| | 595,000 | | | 5.38%, 01/27/2021 | | | 551,309 | |
| | | | Petroleos Mexicanos | |
| | 185,000 | | | 5.75%, 03/01/2018 | | | 199,800 | |
| | 195,000 | | | 6.50%, 06/02/2041 | | | 223,762 | |
| | | | Phillips 66 | |
| | 85,000 | | | 4.30%, 04/01/2022 | | | 89,734 | |
| | 45,000 | | | 4.88%, 11/15/2044 | | | 46,060 | |
| | | | Shell International Finance BV | |
| | 85,000 | | | 3.63%, 08/21/2042 | | | 80,851 | |
| | 170,000 | | | 4.30%, 09/22/2019 | | | 186,568 | |
| | | | Statoil ASA | |
| | 35,000 | | | 5.10%, 08/17/2040 | | | 40,482 | |
| | 255,000 | | | 5.25%, 04/15/2019 | | | 286,677 | |
| | | | Suncor Energy, Inc. | | | | |
| | 80,000 | | | 6.50%, 06/15/2038 | | | 98,420 | |
| | | | Talisman Energy, Inc. | | | | |
| | 25,000 | | | 7.75%, 06/01/2019 | | | 28,797 | |
| | | | Total Capital International S.A. | | | | |
| | 145,000 | | | 1.50%, 02/17/2017 | | | 145,963 | |
| | | | Total Capital S.A. | | | | |
| | 95,000 | | | 4.25%, 12/15/2021 | | | 103,745 | |
| | | | Transocean, Inc. | | | | |
| | 185,000 | | | 6.50%, 11/15/2020 | | | 174,449 | |
| | | | Valero Energy Corp. | | | | |
| | 200,000 | | | 6.13%, 02/01/2020 | | | 226,822 | |
| | | | | | | | |
| | | | | | | 4,146,006 | |
| | | | | | | | |
| | | | Oil & Gas Services - 0.1% | |
| | | | Baker Hughes, Inc. | | | | |
| | 46,000 | | | 5.13%, 09/15/2040 | | | 50,457 | |
| | | | National Oilwell Varco, Inc. | |
| | 50,000 | | | 2.60%, 12/01/2022 | | | 47,002 | |
| | 15,000 | | | 3.95%, 12/01/2042 | | | 13,818 | |
| | | | Weatherford International Ltd. | |
| | 110,000 | | | 5.13%, 09/15/2020 | | | 108,070 | |
| | 30,000 | | | 6.75%, 09/15/2040 | | | 27,945 | |
| | | | | | | | |
| | | | | | | 247,292 | |
| | | | | | | | |
| | | | Pharmaceuticals - 0.5% | |
| | | | AbbVie, Inc. | | | | |
| | 215,000 | | | 2.90%, 11/06/2022 | | | 211,673 | |
| | | | Actavis Funding SCS | | | | |
| | 110,000 | | | 3.85%, 06/15/2024 | | | 110,562 | |
| | | | AstraZeneca plc | |
| | 60,000 | | | 5.90%, 09/15/2017 | | | 67,275 | |
| | 35,000 | | | 6.45%, 09/15/2037 | | | 47,163 | |
| | | | Bristol-Myers Squibb Co. | | | | |
| | 25,000 | | | 3.25%, 08/01/2042 | | | 21,902 | |
| | | | Eli Lilly & Co. | | | | |
| | 20,000 | | | 5.20%, 03/15/2017 | | | 21,747 | |
| | | | Express Scripts Holding Co. | | | | |
| | 205,000 | | | 4.75%, 11/15/2021 | | | 226,228 | |
| | | | GlaxoSmithKline Capital, Inc. | |
| | 40,000 | | | 2.80%, 03/18/2023 | | | 39,496 | |
| | | | | | | | |
Shares or Principal Amount | | Market Value(1) | |
| CORPORATE BONDS - 11.9% - (continued) | |
| | | | Pharmaceuticals - 0.5% - (continued) | |
| | | | GlaxoSmithKline Capital, Inc. | |
| $ | 80,000 | | | 5.65%, 05/15/2018 | | $ | 90,122 | |
| | 47,000 | | | 6.38%, 05/15/2038 | | | 62,580 | |
| | | | Johnson & Johnson | |
| | 75,000 | | | 2.15%, 05/15/2016 | | | 76,538 | |
| | 75,000 | | | 5.95%, 08/15/2037 | | | 101,740 | |
| | | | McKesson Corp. | |
| | 70,000 | | | 3.80%, 03/15/2024 | | | 71,910 | |
| | 50,000 | | | 4.75%, 03/01/2021 | | | 55,284 | |
| | | | Merck & Co., Inc. | |
| | 65,000 | | | 3.60%, 09/15/2042 | | | 62,723 | |
| | 135,000 | | | 3.88%, 01/15/2021 | | | 146,077 | |
| | | | Novartis Capital Corp. | | | | |
| | 195,000 | | | 2.40%, 09/21/2022 | | | 191,957 | |
| | | | Novartis Securities Investment Ltd. | | | | |
| | 35,000 | | | 5.13%, 02/10/2019 | | | 39,299 | |
| | | | Pfizer, Inc. | | | | |
| | 320,000 | | | 6.20%, 03/15/2019 | | | 372,284 | |
| | | | Sanofi | | | | |
| | 20,000 | | | 4.00%, 03/29/2021 | | | 21,730 | |
| | | | Teva Pharmaceutical Finance IV BV | | | | |
| | 60,000 | | | 3.65%, 11/10/2021 | | | 61,483 | |
| | | | Wyeth LLC | | | | |
| | 55,000 | | | 5.95%, 04/01/2037 | | | 70,546 | |
| | | | | | | | |
| | | | | | | 2,170,319 | |
| | | | | | | | |
| | | | Pipelines - 0.4% | |
| | | | El Paso Pipeline Partners Operating Co. LLC | | | | |
| | 35,000 | | | 4.70%, 11/01/2042 | | | 31,605 | |
| | | | Energy Transfer Partners L.P. | |
| | 90,000 | | | 6.50%, 02/01/2042 | | | 103,451 | |
| | 64,000 | | | 9.00%, 04/15/2019 | | | 78,549 | |
| | | | Enterprise Products Operating LLC | |
| | 100,000 | | | 4.45%, 02/15/2043 | | | 98,801 | |
| | 20,000 | | | 4.85%, 03/15/2044 | | | 20,854 | |
| | 140,000 | | | 5.20%, 09/01/2020 | | | 154,404 | |
| | | | Kinder Morgan Energy Partners L.P. | | | | |
| | 227,000 | | | 6.38%, 03/01/2041 | | | 252,811 | |
| | | | ONEOK Partners L.P. | | | | |
| | 65,000 | | | 6.65%, 10/01/2036 | | | 74,807 | |
| | | | Plains All American Pipeline L.P. / PAA Finance Corp. | | | | |
| | 65,000 | | | 6.65%, 01/15/2037 | | | 80,772 | |
| | | | Southern Natural Gas Co. LLC | | | | |
| | 60,000 | | | 5.90%, 04/01/2017(4) | | | 64,514 | |
| | | | TransCanada PipeLines Ltd. | |
| | 125,000 | | | 3.75%, 10/16/2023 | | | 125,145 | |
| | 105,000 | | | 3.80%, 10/01/2020 | | | 107,963 | |
| | 90,000 | | | 7.13%, 01/15/2019 | | | 104,593 | |
| | | | Transcontinental Gas Pipe Line Co. LLC | | | | |
| | 20,000 | | | 4.45%, 08/01/2042 | | | 18,716 | |
| | | | Williams Partners L.P. | |
| | 125,000 | | | 4.13%, 11/15/2020 | | | 128,062 | |
| | 40,000 | | | 6.30%, 04/15/2040 | | | 44,747 | |
| | | | | | | | |
| | | | | | | 1,489,794 | |
| | | | | | | | |
| | | | Real Estate Investment Trusts - 0.2% | |
| | | | Boston Properties L.P. | | | | |
| | 100,000 | | | 5.88%, 10/15/2019 | | | 114,543 | |
| | | | ERP Operating L.P. | | | | |
| | 70,000 | | | 5.75%, 06/15/2017 | | | 77,056 | |
| | | | HCP, Inc. | | | | |
| | 160,000 | | | 6.70%, 01/30/2018 | | | 182,213 | |
The accompanying notes are an integral part of these financial statements.
|
| HIMCO VIT Portfolio Diversifier Fund |
Schedule of Investments – (continued)
December 31, 2014
| | | | | | | | |
Shares or Principal Amount | | Market Value(1) | |
| CORPORATE BONDS - 11.9% - (continued) | |
| | | | Real Estate Investment Trusts - 0.2% - (continued) | |
| | | | Health Care REIT, Inc. | |
| $ | 40,000 | | | 3.75%, 03/15/2023 | | $ | 40,345 | |
| | 55,000 | | | 5.25%, 01/15/2022 | | | 61,115 | |
| | | | Simon Property Group L.P. | | | | |
| | 220,000 | | | 5.65%, 02/01/2020 | | | 252,529 | |
| | | | Weyerhaeuser Co. | | | | |
| | 40,000 | | | 7.38%, 03/15/2032 | | | 53,254 | |
| | | | | | | | |
| | | | | | | 781,055 | |
| | | | | | | | |
| | | | Retail - 0.4% | |
| | | | CVS Health Corp. | | | | |
| | 140,000 | | | 4.00%, 12/05/2023 | | | 148,158 | |
| | | | Home Depot, Inc. (The) | |
| | 240,000 | | | 2.70%, 04/01/2023 | | | 237,824 | |
| | 60,000 | | | 5.88%, 12/16/2036 | | | 78,360 | |
| | | | Lowe’s Cos., Inc. | | | | |
| | 70,000 | | | 6.65%, 09/15/2037 | | | 97,314 | |
| | | | Macy’s Retail Holdings, Inc. | |
| | 120,000 | | | 3.88%, 01/15/2022 | | | 124,724 | |
| | 128,000 | | | 5.90%, 12/01/2016 | | | 138,883 | |
| | | | McDonald’s Corp. | |
| | 49,000 | | | 3.70%, 02/15/2042 | | | 46,771 | |
| | 80,000 | | | 5.35%, 03/01/2018 | | | 88,903 | |
| | | | Target Corp. | | | | |
| | 270,000 | | | 2.30%, 06/26/2019 | | | 273,321 | |
| | | | Wal-Mart Stores, Inc. | |
| | 50,000 | | | 3.25%, 10/25/2020 | | | 52,300 | |
| | 150,000 | | | 4.25%, 04/15/2021 | | | 165,622 | |
| | 198,000 | | | 5.63%, 04/15/2041 | | | 252,840 | |
| | | | Walgreen Co. | | | | |
| | 30,000 | | | 3.10%, 09/15/2022 | | | 29,637 | |
| | | | Walgreens Boots Alliance, Inc. | | | | |
| | 80,000 | | | 4.80%, 11/18/2044 | | | 84,350 | |
| | | | Yum! Brands, Inc. | | | | |
| | 7,000 | | | 6.88%, 11/15/2037 | | | 9,042 | |
| | | | | | | | |
| | | | | | | 1,828,049 | |
| | | | | | | | |
| | | | Semiconductors - 0.1% | |
| | | | Intel Corp. | |
| | 90,000 | | | 2.70%, 12/15/2022 | | | 89,465 | |
| | 100,000 | | | 3.30%, 10/01/2021 | | | 104,863 | |
| | | | Texas Instruments, Inc. | | | | |
| | 80,000 | | | 1.65%, 08/03/2019 | | | 78,106 | |
| | | | | | | | |
| | | | | | | 272,434 | |
| | | | | | | | |
| | | | Software - 0.1% | |
| | | | Microsoft Corp. | | | | |
| | 115,000 | | | 5.20%, 06/01/2039 | | | 136,861 | |
| | | | Oracle Corp. | |
| | 150,000 | | | 2.80%, 07/08/2021 | | | 151,866 | |
| | 110,000 | | | 5.38%, 07/15/2040 | | | 131,957 | |
| | 120,000 | | | 5.75%, 04/15/2018 | | | 135,656 | |
| | | | | | | | |
| | | | | | | 556,340 | |
| | | | | | | | |
| | | | Telecommunications - 0.8% | |
| | | | America Movil S.A.B. de C.V. | |
| | 110,000 | | | 5.63%, 11/15/2017 | | | 120,770 | |
| | 95,000 | | | 6.13%, 11/15/2037 | | | 114,110 | |
| | | | AT&T Mobility LLC | | | | |
| | 25,000 | | | 7.13%, 12/15/2031 | | | 33,415 | |
| | | | AT&T, Inc. | |
| | 310,000 | | | 2.63%, 12/01/2022 | | | 295,254 | |
| | | | | | | | |
Shares or Principal Amount | | Market Value(1) | |
| CORPORATE BONDS - 11.9% - (continued) | |
| | | | Telecommunications - 0.8% - (continued) | |
| | | | AT&T, Inc. - (continued) | |
| $ | 119,000 | | | 4.35%, 06/15/2045 | | $ | 112,188 | |
| | 73,000 | | | 5.35%, 09/01/2040 | | | 79,046 | |
| | 120,000 | | | 5.80%, 02/15/2019 | | | 136,301 | |
| | | | British Telecommunications plc | | | | |
| | 43,000 | | | 9.63%, 12/15/2030 | | | 67,512 | |
| | | | Cisco Systems, Inc. | |
| | 320,000 | | | 4.45%, 01/15/2020 | | | 352,294 | |
| | 40,000 | | | 5.50%, 02/22/2016 | | | 42,201 | |
| | | | Deutsche Telekom International Finance BV | | | | |
| | 57,000 | | | 8.75%, 06/15/2030 | | | 84,198 | |
| | | | Orange S.A. | | | | |
| | 105,000 | | | 5.38% 07/08/2019 - 01/13/2042 | | | 118,237 | |
| | | | Qwest Corp. | | | | |
| | 60,000 | | | 6.88%, 09/15/2033 | | | 60,184 | |
| | | | Rogers Communications, Inc. | |
| | 30,000 | | | 4.50%, 03/15/2043 | | | 30,163 | |
| | 50,000 | | | 6.80%, 08/15/2018 | | | 57,707 | |
| | | | Telefonica Emisiones SAU | | | | |
| | 180,000 | | | 5.46%, 02/16/2021 | | | 200,699 | |
| | | | Verizon Communications, Inc. | |
| | 260,000 | | | 2.63%, 02/21/2020(4) | | | 257,027 | |
| | 161,000 | | | 5.01%, 08/21/2054(4) | | | 166,562 | |
| | 310,000 | | | 5.15%, 09/15/2023 | | | 342,312 | |
| | 95,000 | | | 6.00%, 04/01/2041 | | | 111,970 | |
| | 70,000 | | | 6.35%, 04/01/2019 | | | 81,113 | |
| | 112,000 | | | 6.55%, 09/15/2043 | | | 143,489 | |
| | | | Vodafone Group plc | |
| | 195,000 | | | 5.45%, 06/10/2019 | | | 219,305 | |
| | 20,000 | | | 6.15%, 02/27/2037 | | | 24,133 | |
| | | | | | | | |
| | | | | | | 3,250,190 | |
| | | | | | | | |
| | | | Transportation - 0.2% | |
| | | | Burlington Northern Santa Fe LLC | |
| | 47,000 | | | 4.38%, 09/01/2042 | | | 48,280 | |
| | 45,000 | | | 4.45%, 03/15/2043 | | | 47,014 | |
| | 170,000 | | | 4.70%, 10/01/2019 | | | 187,923 | |
| | | | Canadian National Railway Co. | | | | |
| | 40,000 | | | 2.85%, 12/15/2021 | | | 40,928 | |
| | | | Canadian Pacific Railway Co. | |
| | 60,000 | | | 4.45%, 03/15/2023 | | | 65,846 | |
| | 8,000 | | | 7.13%, 10/15/2031 | | | 11,002 | |
| | | | CSX Corp. | |
| | 85,000 | | | 3.70%, 10/30/2020 | | | 89,702 | |
| | 105,000 | | | 4.25%, 06/01/2021 | | | 114,033 | |
| | | | Norfolk Southern Corp. | | | | |
| | 75,000 | | | 4.84%, 10/01/2041 | | | 83,199 | |
| | | | Union Pacific Corp. | |
| | 60,000 | | | 4.00%, 02/01/2021 | | | 65,804 | |
| | 34,000 | | | 4.82%, 02/01/2044 | | | 38,818 | |
| | | | United Parcel Service, Inc. | | | | |
| | 110,000 | | | 3.13%, 01/15/2021 | | | 114,739 | |
| | | | | | | | |
| | | | | | | 907,288 | |
| | | | | | | | |
| | |
| | | | Total Corporate Bonds
(cost $49,200,735) | | | 49,840,105 | |
| | | | | | | | |
|
| FOREIGN GOVERNMENT OBLIGATIONS - 1.3% | |
| | | | Austria - 0.0% | |
| | | | Oesterreichische Kontrollbank AG | | | | |
| | 95,000 | | | 4.88%, 02/16/2016 | | | 99,450 | |
| | | | | | | | |
The accompanying notes are an integral part of these financial statements.
|
| HIMCO VIT Portfolio Diversifier Fund |
Schedule of Investments – (continued)
December 31, 2014
| | | | | | | | |
Shares or Principal Amount | | Market Value(1) | |
| FOREIGN GOVERNMENT OBLIGATIONS - 1.3% - (continued) | |
| | | | Brazil - 0.1% | |
| | | | Brazilian Government International Bond | |
| $ | 225,000 | | | 5.88%, 01/15/2019 | | $ | 250,875 | |
| | 187,000 | | | 7.13%, 01/20/2037 | | | 237,022 | |
| | | | | | | | |
| | | | | | | 487,897 | |
| | | | | | | | |
| | | | Canada - 0.4% | |
| | | | Canada Government International Bond | | | | |
| | 135,000 | | | 0.88%, 02/14/2017 | | | 135,111 | |
| | | | Hydro-Quebec | |
| | 150,000 | | | 1.38%, 06/19/2017 | | | 150,797 | |
| | 70,000 | | | 8.40%, 01/15/2022 | | | 94,181 | |
| | | | Province of British Columbia | |
| | 60,000 | | | 2.10%, 05/18/2016 | | | 61,256 | |
| | 105,000 | | | 2.65%, 09/22/2021 | | | 108,183 | |
| | | | Province of Manitoba | | | | |
| | 85,000 | | | 2.10%, 09/06/2022 | | | 83,298 | |
| | | | Province of Nova Scotia | | | | |
| | 35,000 | | | 5.13%, 01/26/2017 | | | 37,999 | |
| | | | Province of Ontario | | | | |
| | 415,000 | | | 4.40%, 04/14/2020 | | | 461,837 | |
| | | | Province of Quebec | |
| | 140,000 | | | 3.50%, 07/29/2020 | | | 149,815 | |
| | 60,000 | | | 5.13%, 11/14/2016 | | | 64,735 | |
| | 50,000 | | | 7.50%, 09/15/2029 | | | 73,895 | |
| | | | | | | | |
| | | | | | | 1,421,107 | |
| | | | | | | | |
| | | | Colombia - 0.1% | |
| | | | Colombia Government International Bond | | | | |
| | 161,000 | | | 8.13%, 05/21/2024 | | | 213,727 | |
| | | | | | | | |
| | | | Germany - 0.3% | |
| | | | KFW | |
| | 165,000 | | | 1.25%, 02/15/2017 | | | 166,343 | |
| | 265,000 | | | 2.63%, 01/25/2022 | | | 273,986 | |
| | 561,000 | | | 4.00%, 01/27/2020 | | | 618,945 | |
| | | | Landwirtschaftliche Rentenbank | | | | |
| | 180,000 | | | 2.50%, 02/15/2016 | | | 184,057 | |
| | | | | | | | |
| | | | | | | 1,243,331 | |
| | | | | | | | |
| | | | Italy - 0.0% | |
| | | | Italy Government International Bond | | | | |
| | 45,000 | | | 5.38%, 06/15/2033 | | | 53,682 | |
| | | | | | | | |
| | | | Mexico - 0.1% | |
| | | | Mexico Government International Bond | |
| | 220,000 | | | 5.13%, 01/15/2020 | | | 242,550 | |
| | 232,000 | | | 6.05%, 01/11/2040 | | | 283,736 | |
| | | | | | | | |
| | | | | | | 526,286 | |
| | | | | | | | |
| | | | Panama - 0.0% | |
| | | | Panama Government International Bond | | | | |
| | 50,000 | | | 6.70%, 01/26/2036 | | | 64,625 | |
| | | | | | | | |
| | | | Peru - 0.0% | |
| | | | Peruvian Government International Bond | | | | |
| | 75,000 | | | 5.63%, 11/18/2050 | | | 88,313 | |
| | | | | | | | |
| | | | Philippines - 0.1% | |
| | | | Philippine Government International Bond | |
| | 220,000 | | | 4.00%, 01/15/2021 | | | 238,700 | |
| | 100,000 | | | 6.38%, 10/23/2034 | | | 134,000 | |
| | | | | | | | |
| | | | | | | 372,700 | |
| | | | | | | | |
| | | | Poland - 0.0% | |
| | | | Poland Government International Bond | | | | |
| | 140,000 | | | 5.00%, 03/23/2022 | | | 156,828 | |
| | | | | | | | |
| | | | | | | | |
Shares or Principal Amount | | Market Value(1) | |
| FOREIGN GOVERNMENT OBLIGATIONS - 1.3% - (continued) | |
| | | | South Africa - 0.1% | |
| | | | South Africa Government International Bond | | | | |
| $ | 200,000 | | | 6.88%, 05/27/2019 | | $ | 228,500 | |
| | | | | | | | |
| | | | Turkey - 0.1% | |
| | | | Turkey Government International Bond | |
| | 110,000 | | | 6.75%, 05/30/2040 | | | 135,850 | |
| | 310,000 | | | 7.38%, 02/05/2025 | | | 385,758 | |
| | | | | | | | |
| | | | | | | 521,608 | |
| | | | | | | | |
| | |
| | | | Total Foreign Government Obligations
(cost $5,434,684) | | | 5,478,054 | |
| | | | | | | | |
| |
| MUNICIPAL BONDS - 0.3% | | | |
| | | | Airport Revenues - 0.0% | |
| | | | Cnty. of Clark Department of Aviation | | | | |
| | 5,000 | | | 6.82%, 07/01/2045 | | | 7,333 | |
| | | | | | | | |
| | | | General Obligations - 0.2% | |
| | | | California State GO, | |
| | 55,000 | | | 7.55%, 04/01/2039 | | | 84,875 | |
| | 105,000 | | | 7.60%, 11/01/2040 | | | 163,835 | |
| | | | Connecticut State, GO | | | | |
| | 45,000 | | | 5.85%, 03/15/2032 | | | 56,778 | |
| | | | llinois State, GO | | | | |
| | 195,000 | | | 5.10%, 06/01/2033 | | | 193,574 | |
| | | | Massachusetts State, GO | | | | |
| | 15,000 | | | 5.46%, 12/01/2039 | | | 18,880 | |
| | | | Mississippi State, GO | | | | |
| | 25,000 | | | 5.25%, 11/01/2034 | | | 30,179 | |
| | | | New York, NY, GO | | | | |
| | 15,000 | | | 5.85%, 06/01/2040 | | | 19,412 | |
| | | | Texas State, GO | | | | |
| | 30,000 | | | 5.52%, 04/01/2039 | | | 39,653 | |
| | | | | | | | |
| | | | | | | 607,186 | |
| | | | | | | | |
| | | | Higher Education (Univ., Dorms, etc.) - 0.0% | |
| | | | Univ. of California Build America Bonds Rev., | | | | |
| | 50,000 | | | 5.77%, 05/15/2043 | | | 64,266 | |
| | | | Univ. of Texas System | | | | |
| | 25,000 | | | 4.79%, 08/15/2046 | | | 29,685 | |
| | | | | | | | |
| | | | | | | 93,951 | |
| | | | | | | | |
| | | | Miscellaneous - 0.0% | |
| | | | New Jersey State Econ DA Lease Rev. | | | | |
| | 15,000 | | | 7.43%, 02/15/2029 | | | 19,118 | |
| | | | | | | | |
| | | | Tax Allocation - 0.0% | |
| | | | New York State Dormitory Auth. | | | | |
| | 20,000 | | | 5.60%, 03/15/2040 | | | 25,405 | |
| | | | | | | | |
| | | | Transportation - 0.1% | |
| | | | Bay Area Toll Auth. | | | | |
| | 30,000 | | | 6.26%, 04/01/2049 | | | 42,276 | |
| | | | Metropolitan Transportation Auth. | |
| | 20,000 | | | 5.87%, 11/15/2039 | | | 24,911 | |
| | 25,000 | | | 6.55%, 11/15/2031 | | | 32,628 | |
| | 15,000 | | | 6.65%, 11/15/2039 | | | 20,346 | |
| | | | New Jersey State Turnpike Auth. | |
| | 45,000 | | | 7.10%, 01/01/2041 | | | 65,265 | |
| | 15,000 | | | 7.41%, 01/01/2040 | | | 22,541 | |
| | | | Port Auth. of New York & New Jersey | | | | |
| | 50,000 | | | 4.93%, 10/01/2051 | | | 56,569 | |
| | | | | | | | |
| | | | | | | 264,536 | |
| | | | | | | | |
The accompanying notes are an integral part of these financial statements.
|
| HIMCO VIT Portfolio Diversifier Fund |
Schedule of Investments – (continued)
December 31, 2014
| | | | | | | | |
Shares or Principal Amount | | Market Value(1) | |
| MUNICIPAL BONDS - 0.3% - (continued) | | | |
| | | | Utilities - Electric - 0.0% | |
| | | | American Municipal Power Inc | | | | |
| $ | 45,000 | | | 6.05%, 02/15/2043 | | $ | 58,596 | |
| | | | Municipal Electric Auth. of Georgia | | | | |
| | 40,000 | | | 6.64%, 04/01/2057 | | | 53,029 | |
| | | | | | | | |
| | | | | | | 111,625 | |
| | | | | | | | |
| | | | Utilities - Water and Sewer - 0.0% | |
| | | | New York City Water & Sewer System | | | | |
| | 45,000 | | | 5.88%, 06/15/2044 | | | 60,768 | |
| | | | | | | | |
| | |
| | | | Total Municipal Bonds
(cost $1,095,275) | | | 1,189,922 | |
| | | | | | | | |
| |
| U.S. GOVERNMENT AGENCIES - 14.1% | | | |
| | | | FHLMC - 4.1% | |
| | 270,000 | | | 2.38%, 01/13/2022 | | | 272,779 | |
| | 1,487,378 | | | 2.50%, 05/27/2016 - 12/01/2042 | | | 1,513,934 | |
| | 3,157,983 | | | 3.50%, 04/01/2026 - 12/01/2043 | | | 3,307,360 | |
| | 680,000 | | | 3.75%, 03/27/2019 | | | 740,081 | |
| | 2,399,771 | | | 4.00%, 06/01/2024 - 07/01/2044 | | | 2,563,639 | |
| | 1,641,584 | | | 4.50%, 03/01/2015 - 09/01/2041 | | | 1,782,856 | |
| | 360,000 | | | 5.13%, 10/18/2016 | | | 388,137 | |
| | 370,000 | | | 5.25%, 04/18/2016 | | | 392,753 | |
| | 100,000 | | | 6.25%, 07/15/2032 | | | 146,163 | |
| | 3,019,974 | | | 3.00%, 12/01/2025 - 05/01/2043 | | | 3,086,937 | |
| | 1,212,125 | | | 5.00%, 05/01/2023 - 08/01/2041 | | | 1,346,209 | |
| | 552,503 | | | 5.50%, 05/01/2036 - 08/01/2038 | | | 618,886 | |
| | 105,768 | | | 6.00%, 06/01/2036 - 10/01/2037 | | | 119,738 | |
| | 730,000 | | | 3.50%, 01/01/2045(5) | | | 759,029 | |
| | | | FNMA - 6.4% | |
| | 690,000 | | | 0.88%, 08/28/2017 | | | 687,590 | |
| | 830,000 | | | 1.25%, 01/30/2017 | | | 837,441 | |
| | 500,000 | | | 1.63%, 11/27/2018 | | | 502,407 | |
| | 5,072,597 | | | 3.00%, 12/01/2025 - 11/01/2043 | | | 5,188,181 | |
| | 5,170,330 | | | 3.50%, 09/01/2025 - 01/01/2045 | | | 5,418,728 | |
| | 4,929,625 | | | 4.00%, 05/01/2020 - 12/01/2044 | | | 5,269,396 | |
| | 130,000 | | | 5.63%, 07/15/2037 | | | 182,980 | |
| | 53,000 | | | 6.63%, 11/15/2030 | | | 78,697 | |
| | 1,660,979 | | | 2.50%, 03/01/2027 - 01/01/2043 | | | 1,688,362 | |
| | 2,817,567 | | | 4.50%, 05/01/2025 - 01/01/2044 | | | 3,062,453 | |
| | 1,864,873 | | | 5.00%, 02/01/2022 - 01/01/2041 | | | 2,061,757 | |
| | 1,021,282 | | | 5.50%, 10/01/2035 - 05/01/2040 | | | 1,144,529 | |
| | 274,324 | | | 6.00%, 04/01/2036 - 07/01/2037 | | | 311,554 | |
| | 62,691 | | | 6.50%, 06/01/2039 | | | 71,480 | |
| | 360,000 | | | 3.50%, 01/01/2045(5) | | | 375,272 | |
| | 600,000 | | | 4.00%, 01/01/2045(5) | | | 640,352 | |
| | | | GNMA - 3.6% | |
| | 2,095,249 | | | 4.50%, 05/15/2039 - 10/20/2043 | | | 2,303,190 | |
| | 139,288 | | | 2.50%, 10/15/2027 - 01/15/2043 | | | 139,279 | |
| | 2,873,626 | | | 3.00%, 04/15/2027 - 12/20/2043 | | | 2,949,036 | |
| | 3,457,108 | | | 3.50%, 09/15/2025 - 07/20/2044 | | | 3,634,273 | |
| | 3,292,116 | | | 4.00%, 08/15/2026 - 11/20/2044 | | | 3,536,565 | |
| | 1,040,259 | | | 5.00%, 11/20/2035 - 12/20/2041 | | | 1,156,152 | |
| | 199,152 | | | 5.50%, 05/20/2038 - 08/20/2041 | | | 223,486 | |
| | 162,432 | | | 6.00%, 02/15/2036 - 08/20/2041 | | | 183,528 | |
| | | | | | | | |
| | |
| | | | Total U.S. Government Agencies
(cost $58,036,193) | | | 58,685,189 | |
| | | | | | | | |
| | | | | | | | |
Shares or Principal Amount | | Market Value(1) | |
| U.S. GOVERNMENT SECURITIES - 16.9% | | | |
| | | | Other Direct Federal Obligations - 0.4% | |
| | | | Tennessee Valley Authority - 0.1% | |
| $ | 213,000 | | | 6.75%, 11/01/2025 | | $ | 289,093 | |
| | | | FFCB - 0.0% | |
| | 40,000 | | | 4.88%, 01/17/2017 | | | 43,284 | |
| | | | FHLB - 0.3% | | | |
| | 60,000 | | | 5.50%, 07/15/2036 | | | 82,286 | |
| | 620,000 | | | 5.00%, 11/17/2017 | | | 689,123 | |
| | 540,000 | | | 4.75%, 12/16/2016 | | | 584,711 | |
| | | | | | | | |
| | | | | | | 1,688,497 | |
| | | | | | | | |
| | | | U.S. Treasury Securities - 16.5% | |
| | | | U.S. Treasury Notes - 13.9% | |
| | 215,000 | | | 3.13%, 05/15/2021 | | | 230,722 | |
| | 7,485,000 | | | 2.75%, 11/15/2023 - 02/15/2024 | | | 7,877,221 | |
| | 345,000 | | | 2.13%, 08/15/2021 | | | 349,070 | |
| | 3,878,000 | | | 1.88%, 09/30/2017 | | | 3,968,586 | |
| | 7,564,000 | | | 1.75%, 05/31/2016 - 05/15/2022 | | | 7,559,728 | |
| | 5,870,000 | | | 1.63%, 06/30/2019 | | | 5,884,675 | |
| | 1,200,000 | | | 1.25%, 11/30/2018 | | | 1,191,563 | |
| | 12,812,000 | | | 1.00%, 08/31/2016 | | | 12,908,090 | |
| | 4,735,000 | | | 0.88%, 11/30/2016 | | | 4,755,716 | |
| | 13,070,000 | | | 0.63%, 05/31/2017 - 04/30/2018 | | | 12,919,380 | |
| | 400,000 | | | 0.50%, 07/31/2017 | | | 395,469 | |
| | | | U.S. Treasury Bonds - 2.6% | |
| | 1,910,000 | | | 5.38%, 02/15/2031 | | | 2,662,211 | |
| | 728,000 | | | 4.25%, 11/15/2040 | | | 942,419 | |
| | 305,000 | | | 3.75%, 08/15/2041 | | | 367,596 | |
| | 6,496,000 | | | 3.13%, 11/15/2041 - 02/15/2043 | | | 6,990,915 | |
| | | | | | | | |
| | | | | | | 69,003,361 | |
| | | | | | | | |
| | |
| | | | Total U.S. Government Securities
(cost $69,764,001) | | | 70,691,858 | |
| | | | | | | | |
| | |
| | | | Total Long-Term Investments - Excluding Purchased Options
(cost $261,437,881) | | | 288,387,032 | |
| | | | | | | | |
| |
| SHORT-TERM INVESTMENTS - 30.2% | | | |
| | | | Other Direct Federal Obligations - 7.7% | |
| | | | FHLB | | | |
| | 32,000,000 | | | 0.01% 02/20/2015 - 04/15/2015(6) | | | 31,993,777 | |
| | | | | | | | |
| | | | Repurchase Agreements - 1.6% | |
| | | | RBC Capital Markets LLC TriParty Repurchase Agreement (maturing on 01/02/2015 in the amount of $6,641,015, collateralized by U.S. Treasury Note 0.125% - 0.625%, 2018 - 2021, value of $6,760,118) | | | | |
| | 6,641,000 | | | 0.04%, 12/31/2014 | | | 6,641,000 | |
| | | | | | | | |
| | | | U.S. Government Agencies - 15.6% | |
| | | | FHLMC - 8.4% | |
| | 10,000,000 | | | 0.06%, 03/19/2015(6) | | | 9,999,370 | |
| | 25,000,000 | | | 0.12%, 05/19/2015(6) | | | 24,991,350 | |
| | | | FNMA - 7.2% | |
| | 15,000,000 | | | 0.07%, 01/20/2011(6) | | | 14,999,481 | |
| | 5,000,000 | | | 0.10%, 04/27/2015(6) | | | 4,998,610 | |
| | 10,000,000 | | | 0.11%, 04/27/2015(6) | | | 9,997,220 | |
| | | | | | | | |
| | | | | | | 64,986,031 | |
| | | | | | | | |
The accompanying notes are an integral part of these financial statements.
|
| HIMCO VIT Portfolio Diversifier Fund |
Schedule of Investments – (continued)
December 31, 2014
| | | | | | | | | | |
Shares or Principal Amount | | | | Market Value(1) | |
| SHORT-TERM INVESTMENTS - 30.2% - (continued) | |
| | | | U.S. Treasury Bills - 5.3% | |
| $ | 250,000 | | | 0.03%, 01/15/2015(6) | | | | $ | 249,998 | |
| | 12,000,000 | | | 0.05%, 01/08/2015(6) | | | | | 11,999,882 | |
| | 10,000,000 | | | 0.06%, 05/07/2015(6)(7) | | | | | 9,998,440 | |
| | | | | | | | | | |
| | | | | | | | | 22,248,320 | |
| | | | | | | | | | |
| | |
| | | | Total Short-Term Investments
(cost $125,864,891) | | | 125,869,128 | |
| | | | | | | | | | |
| | | | | | | | | | |
| | | |
| | Total Investments Excluding Purchased Options
(cost $387,302,772) | | | 99.3 | % | | $ | 414,256,160 | |
| | | | | | | | | | |
| | | |
| | Total Purchased Options
(cost $20,461,748) | | | 0.4 | % | | | 1,636,393 | |
| | | | | | | | | | |
| | | |
| | Total Investments
(cost $407,764,520)(8) | | | 99.7 | % | | $ | 415,892,553 | |
| | | | | | | | | | |
| | Other Assets and Liabilities | | | 0.3 | % | | | 1,114,151 | |
| | | | | | | | | | |
| | Total Net Assets | | | 100.0 | % | | $ | 417,006,704 | |
| | | | | | | | | | |
| Note: | Percentage of investments as shown is the ratio of the total market value to total net assets. |
| | Equity industry classifications used in this report are the Global Industry Classification Standard, which was developed by and is the exclusive property and service mark of MSCI, Inc. and Standard & Poor’s. |
| | For Fund compliance purposes, the Fund may not use the same classification system shown in this report as these classifications are used for reporting ease. |
| (1) | See Significant Accounting Policies of accompanying Notes to Financial Statements regarding valuation of securities. |
| (2) | Non-income producing. |
| (3) | Variable rate securities; the rate reported is the coupon rate in effect at December 31, 2014. |
| (4) | Securities issued within terms of a private placement memorandum, exempt from registration under Rule 144A under the Securities Act of 1933, as amended, and may be sold only to qualified institutional buyers. Unless otherwise indicated, these holdings are determined to be liquid. At December 31, 2014, the aggregate value of these securities was $815,453, which represents 0.2% of total net assets. |
| (5) | This security, or a portion of this security, was purchased on a when-issued, delayed-delivery or delayed-draw basis. The cost of these securities was $1,772,717 at December 31, 2014. |
| (6) | The interest rate disclosed for these securities represents the effective yield on the date of the acquisition. |
| (7) | This security, or a portion of this security, is pledged as initial margin deposit and collateral for daily variation margin loss on open futures contracts held at December 31, 2014. |
| (8) | At December 31, 2014, the cost of securities for federal income tax purposes was $408,252,516, and the aggregate gross unrealized appreciation and depreciation based on that cost were: |
| | | | |
Unrealized Appreciation | | $ | 27,819,017 | |
Unrealized Depreciation | | | (20,178,980 | ) |
| | | | |
Net Unrealized Appreciation | | $ | 7,640,037 | |
| | | | |
Futures Contracts Outstanding at December 31, 2014
| | | | | | | | | | | | | | | | | | | | |
Description | | Number of
Contracts | | | Expiration
Date | | | Notional
Amount | | | Market Value | | | Unrealized
Appreciation/
(Depreciation) | |
Short position contracts: | | | | | | | | | | | | | | | | | | | | |
S&P 500 (E-Mini) | | | (1,677 | ) | | | 03/20/2015 | | | $ | (169,326,589) | | | $ | (172,093,740) | | | $ | (2,767,151) | |
The accompanying notes are an integral part of these financial statements.
|
| HIMCO VIT Portfolio Diversifier Fund |
Schedule of Investments – (continued)
December 31, 2014
OTC Option Contracts Outstanding at December 31, 2014
| | | | | | | | | | | | | | | | | | | | | | | | | | | | |
Description | | Counterparty | | Risk
Exposure
Category | | Exercise
Price/FX
Rate/Rate | | | Expiration
Date | | | Number of
Contracts | | | Market
Value | | | Premiums
Received/Paid by
Fund(1) | | | Unrealized
Appreciation/
(Depreciation) | |
Purchased option contracts: | | | | | | | | | | | | | | | | | | | | | | | | | | |
Put option contracts | | | | | | | | | | | | | | | | | | | | | | | | | | | | |
S&P 500 Index Option | | JPM | | EQ | | | 1,170 USD | | | | 06/06/16 | | | | 20,282 | | | $ | 341,261 | | | $ | 4,391,459 | | | $ | (4,050,198 | ) |
S&P 500 Index Option | | BOA | | EQ | | | 1,170 USD | | | | 06/06/16 | | | | 20,282 | | | | 341,261 | | | | 4,267,536 | | | | (3,926,275 | ) |
S&P 500 Index Option | | BCLY | | EQ | | | 1,170 USD | | | | 06/06/16 | | | | 20,282 | | | | 341,261 | | | | 4,370,365 | | | | (4,029,104 | ) |
S&P 500 Index Option | | CSI | | EQ | | | 1,170 USD | | | | 06/06/16 | | | | 8,811 | | | | 148,252 | | | | 208,644 | | | | (60,392 | ) |
S&P 500 Index Option | | BCLY | | EQ | | | 1,170 USD | | | | 06/06/16 | | | | 5,678 | | | | 95,537 | | | | 1,564,686 | | | | (1,469,150 | ) |
S&P 500 Index Option | | JPM | | EQ | | | 1,170 USD | | | | 06/06/16 | | | | 5,577 | | | | 93,837 | | | | 1,625,417 | | | | (1,531,579 | ) |
S&P 500 Index Option | | BCLY | | EQ | | | 1,170 USD | | | | 06/06/16 | | | | 4,271 | | | | 71,863 | | | | 1,124,554 | | | | (1,052,691 | ) |
S&P 500 Index Option | | JPM | | EQ | | | 1,170 USD | | | | 06/06/16 | | | | 3,377 | | | | 56,821 | | | | 810,683 | | | | (753,862 | ) |
S&P 500 Index Option | | CSI | | EQ | | | 1,170 USD | | | | 06/06/16 | | | | 3,348 | | | | 56,333 | | | | 857,858 | | | | (801,525 | ) |
S&P 500 Index Option | | BCLY | | EQ | | | 1,170 USD | | | | 06/06/16 | | | | 2,733 | | | | 45,985 | | | | 561,167 | | | | (515,182 | ) |
S&P 500 Index Option | | JPM | | EQ | | | 1,170 USD | | | | 06/06/16 | | | | 2,614 | | | | 43,982 | | | | 679,379 | | | | (635,396 | ) |
| | | | | | | | | | | | | | | | | | | | | | | | | | | | |
Total put option contracts | | | | | | | | | | | | | 97,255 | | | $ | 1,636,393 | | | $ | 20,461,748 | | | $ | (18,825,354 | ) |
| | | | | | | | | | | | | | | | | | | | | | | | | | | | |
Total purchased option contracts | | | | | | | | | | | 97,255 | | | $ | 1,636,393 | | | $ | 20,461,748 | | | $ | (18,825,354 | ) |
| | | | | | | | | | | | | | | | | | | | | | | | | | | | |
Written option contracts: | | | | | | | | | | | | | | | | | | | | | | | | | | |
Put option contracts | | | | | | | | | | | | | | | | | | | | | | | | | | | | |
S&P 500 Index Option | | JPM | | EQ | | | 910 USD | | | | 06/06/16 | | | | (2,614 | ) | | $ | (16,004 | ) | | $ | (403,725 | ) | | $ | 387,721 | |
S&P 500 Index Option | | BCLY | | EQ | | | 910 USD | | | | 06/06/16 | | | | (2,733 | ) | | | (16,732 | ) | | | (310,605 | ) | | | 293,873 | |
S&P 500 Index Option | | CSI | | EQ | | | 910 USD | | | | 06/06/16 | | | | (3,348 | ) | | | (20,498 | ) | | | (509,030 | ) | | | 488,532 | |
S&P 500 Index Option | | JPM | | EQ | | | 910 USD | | | | 06/06/16 | | | | (3,377 | ) | | | (20,676 | ) | | | (464,338 | ) | | | 443,662 | |
S&P 500 Index Option | | BCLY | | EQ | | | 910 USD | | | | 06/06/16 | | | | (4,271 | ) | | | (26,149 | ) | | | (681,639 | ) | | | 655,490 | |
S&P 500 Index Option | | JPM | | EQ | | | 910 USD | | | | 06/06/16 | | | | (5,577 | ) | | | (34,145 | ) | | | (974,302 | ) | | | 940,157 | |
S&P 500 Index Option | | BCLY | | EQ | | | 910 USD | | | | 06/06/16 | | | | (5,678 | ) | | | (34,763 | ) | | | (948,907 | ) | | | 914,144 | |
S&P 500 Index Option | | CSI | | EQ | | | 910 USD | | | | 06/06/16 | | | | (8,811 | ) | | | (53,944 | ) | | | (71,369 | ) | | | 17,425 | |
S&P 500 Index Option | | BCLY | | EQ | | | 910 USD | | | | 06/06/16 | | | | (20,282 | ) | | | (124,174 | ) | | | (2,515,374 | ) | | | 2,391,200 | |
S&P 500 Index Option | | JPM | | EQ | | | 910 USD | | | | 06/06/16 | | | | (20,282 | ) | | | (124,174 | ) | | | (2,456,759 | ) | | | 2,332,585 | |
S&P 500 Index Option | | BOA | | EQ | | | 910 USD | | | | 06/06/16 | | | | (20,282 | ) | | | (124,174 | ) | | | (2,564,252 | ) | | | 2,440,078 | |
| | | | | | | | | | | | | | | | | | | | | | | | | | | | |
Total put option contracts | | | | | | | | | | | | | (97,255 | ) | | $ | (595,433 | ) | | $ | (11,900,300 | ) | | $ | 11,304,867 | |
| | | | | | | | | | | | | | | | | | | | | | | | | | | | |
Total written option contracts | | | | | | | | | | | (97,255 | ) | | $ | (595,433 | ) | | $ | (11,900,300 | ) | | $ | 11,304,867 | |
| | | | | | | | | | | | | | | | | | | | | | | | | | | | |
| (1) | For purchased options, premiums are paid by the Fund, for written options, premiums are received. |
The broker deposited securities valued at $1,431,971 with the custodian to serve as collateral for the options purchased by the Fund. The collateral is maintained in a segregated account at the custodian on behalf of the Fund. Since the broker retains legal title to the securities, the securities are not considered assets of the Fund and are not included in the Statement of Assets and Liabilities.
| | |
| GLOSSARY: (abbreviations used in preceding Schedule of Investments) |
| | |
|
| Index Abbreviations: |
S&P | | Standard & Poors |
|
| Other Abbreviations: |
EQ | | Equity |
ETF | | Exchange Traded Fund |
FFCB | | Federal Farm Credit Bank |
FHLB | | Federal Home Loan Bank |
FHLMC | | Federal Home Loan Mortgage Corp. |
FNMA | | Federal National Mortgage Association |
GNMA | | Government National Mortgage Association |
REIT | | Real Estate Investment Trust |
| | |
|
| Municipal Abbreviations: |
DA | | Development Authority |
GO | | General Obligation |
|
| Counterparty Abbreviations: |
BOA | | Banc of America Securities LLC |
BCLY | | Barclays |
CSI | | Credit Suisse International |
JPM | | JP Morgan Chase & Co. |
The accompanying notes are an integral part of these financial statements.
|
| HIMCO VIT Portfolio Diversifier Fund |
Schedule of Investments – (concluded)
December 31, 2014
Investment Valuation Hierarchy Level Summary at December 31, 2014
| | | | | | | | | | | | | | | | |
Description | | Total | | | Level 11 | | | Level 21 | | | Level 3 | |
| | | | | | | | | | | | | |
Assets: | | | | | | | | | | | | | | | | |
Common Stocks2 | | $ | 99,315,332 | | | $ | 99,315,332 | | | $ | — | | | $ | — | |
Exchange-Traded Funds | | | 219,544 | | | | 219,544 | | | | — | | | | — | |
Asset & Commercial Mortgage Backed Securities | | | 2,967,028 | | | | — | | | | 2,967,028 | | | | — | |
Corporate Bonds | | | 49,840,105 | | | | — | | | | 49,840,105 | | | | — | |
Foreign Government Obligations | | | 5,478,054 | | | | — | | | | 5,478,054 | | | | — | |
Municipal Bonds | | | 1,189,922 | | | | — | | | | 1,189,922 | | | | — | |
U.S. Government Agencies | | | 58,685,189 | | | | — | | | | 58,685,189 | | | | — | |
U.S. Government Securities | | | 70,691,858 | | | | — | | | | 70,691,858 | | | | — | |
Put Options Purchased | | | 1,636,393 | | | | — | | | | — | | | | 1,636,393 | |
Short-Term Investments | | | 125,869,128 | | | | — | | | | 125,869,128 | | | | — | |
| | | | | | | | | | | | | | | | |
Total | | $ | 415,892,553 | | | $ | 99,534,876 | | | $ | 314,721,284 | | | $ | 1,636,393 | |
| | | | | | | | | | | | | | | | |
Liabilities: | | | | | | | | | | | | | | | | |
Put Options Written | | $ | (595,433 | ) | | $ | — | | | $ | — | | | $ | (595,433 | ) |
| | | | | | | | | | | | | | | | |
Total | | $ | (595,433 | ) | | $ | — | | | $ | — | | | $ | (595,433 | ) |
| | | | | | | | | | | | | | | | |
Futures3 | | | (2,767,151 | ) | | | (2,767,151 | ) | | | — | | | | — | |
| | | | | | | | | | | | | | | | |
Total | | $ | (2,767,151 | ) | | $ | (2,767,151 | ) | | $ | — | | | $ | — | |
| | | | | | | | | | | | | | | | |
| 1 | For the year ended December 31, 2014, investments valued at $ 978,281 were transferred from Level 1 to Level 2. In addition, purchased options valued at $3,740,117 and written options valued at $1,474,857 were transferred from Level 2 to Level 3. Investments are transferred between Levels for a variety of reasons including, but not limited to: |
| | 1) | Foreign equities for which a fair value price is more representative of exit value than the local market close (transfer into Level 2). Foreign equities for which the local market close is more representative of exit value (transfer into Level 1). |
| | 2) | U.S. Treasury securities that no longer represent the most recent issue (transfer into Level 2). |
| | 3) | Equity investments with no observable trading but a bid or close price is used (transfer into Level 2). Equity investments using observable quoted prices in an active market (transfer into Level 1). |
| | 4) | Purchased and written options are non-exchange traded options priced using one or more unobservable inputs (transfer into Level 3). Level 3 investments held by the Fund at the beginning of the period in relation to net assets applicable to common shares were not significant and accordingly, a reconciliation of Level 3 assets for the year ended December 31, 2014 is not presented. None of the unobservable inputs for Level 3 assets, individually or collectively, had a material impact on the Fund. |
| 2 | Refer to the Schedule of Investments for further industry breakout. |
| 3 | Derivative instruments (excluding purchased and written options, if applicable) are valued at the unrealized appreciation/depreciation on the investments. |
| Note: | For purposes of reporting transfers between different hierarchy levels, both transfers in and out of each level, as applicable, are shown as if they occurred at the beginning of the period. |
| | Level 3 investments held by the Fund at the beginning and/or end of the period in relation to net assets were not significant and accordingly, a reconciliation of Level 3 assets for the year ended December 31, 2014 is not presented. |
| | None of the unobservable inputs for Level 3 assets, individually or collectively, had a material impact on the Fund. |
The accompanying notes are an integral part of these financial statements.
|
| HIMCO VIT Portfolio Diversifier Fund |
Statement of Assets and Liabilities
December 31, 2014
| | | | |
Assets: | | | | |
Investments in securities, at market value (cost $407,764,520) | | $ | 415,892,553 | |
Cash | | | 4,949,532 | |
Receivables: | | | | |
Investment securities sold | | | 221,379 | |
Fund shares sold | | | 40,340 | |
Dividends and interest | | | 1,292,339 | |
Variation margin on financial derivative instruments | | | 2,037,488 | |
Other assets | | | 22,943 | |
| | | | |
Total assets | | | 424,456,574 | |
| | | | |
Liabilities: | | | | |
Payables: | | | | |
Investment securities purchased | | | 6,489,232 | |
Fund shares redeemed | | | 3,227 | |
Investment management fees | | | 213,250 | |
Distribution fees | | | 88,854 | |
Accrued expenses | | | 59,874 | |
Written options (proceeds $11,900,300) | | | 595,433 | |
| | | | |
Total liabilities | | | 7,449,870 | |
| | | | |
Net assets | | $ | 417,006,704 | |
| | | | |
Summary of Net Assets: | | | | |
Capital stock and paid-in-capital | | $ | 494,380,941 | |
Undistributed net investment income | | | 17,943 | |
Accumulated net realized loss | | | (94,057,931 | ) |
Unrealized appreciation of investments | | | 16,665,751 | |
| | | | |
Net assets | | $ | 417,006,704 | |
| | | | |
Class IB: Net asset value per share | | $ | 7.91 | |
| | | | |
Shares Outstanding | | | 52,691,435 | |
| | | | |
Net Assets | | $ | 417,006,704 | |
| | | | |
The accompanying notes are an integral part of these financial statements.
|
| HIMCO VIT Portfolio Diversifier Fund |
Statement of Operations
For the Year Ended December 31, 2014
| | | | |
Investment Income: | | | | |
Dividends | | $ | 2,035,568 | |
Interest | | | 4,205,083 | |
Less: Foreign tax withheld | | | (230 | ) |
| | | | |
Total investment income, net | | | 6,240,421 | |
| | | | |
Expenses: | | | | |
Investment management fees | | | 2,596,014 | |
Transfer agent fees | | | 2,489 | |
Distribution fees - Class IB | | | 1,082,505 | |
Custodian fees | | | 8,178 | |
Accounting service fees | | | 69,698 | |
Trustee fees | | | 22,053 | |
Audit fees | | | 33,955 | |
Printing fees | | | 35,136 | |
Legal fees | | | 20,038 | |
Insurance fees | | | 8,437 | |
Other expenses | | | 8,724 | |
| | | | |
Total expenses (before waivers) | | | 3,887,227 | |
| | | | |
Total waivers | | | (208,676 | ) |
| | | | |
Total expenses, net | | | 3,678,551 | |
| | | | |
Net Investment Income | | | 2,561,870 | |
| | | | |
Net Realized Gain on Investments and Other Financial Instruments: | | | | |
Net realized gain on investments | | | 7,186,869 | |
Net realized loss on purchased options | | | (2,178,480 | ) |
Net realized gain on written options | | | 1,347,827 | |
Net realized loss on futures contracts | | | (32,405,763 | ) |
| | | | |
Net Realized Loss on Investments and Other Financial Instruments | | | (26,049,547 | ) |
| | | | |
Net Changes in Unrealized Appreciation of Investments and Other Financial Instruments: | | | | |
Net unrealized appreciation of investments | | | 10,197,465 | |
Net realized appreciation of purchased options | | | 26,387 | |
Net unrealized appreciation of futures contracts | | | 4,945,697 | |
Net realized depreciation of written options | | | (438,198 | ) |
| | | | |
Net Changes in Unrealized Appreciation of Investments and Other Financial Instruments | | | 14,731,351 | |
| | | | |
Net Realized and Unrealized Loss on Investments and Other Financial Instruments | | | (11,318,196 | ) |
| | | | |
Net Decrease in Net Assets Resulting from Operations | | $ | (8,756,326 | ) |
| | | | |
The accompanying notes are an integral part of these financial statements.
|
| HIMCO VIT Portfolio Diversifier Fund |
Statement of Changes in Net Assets
| | | | | | | | |
| | | For the
Year Ended
December 31,
2014
| | | For the
Year Ended
December 31,
2013(1) | |
Operations: | | | | | | | | |
Net investment income | | $ | 2,561,870 | | | $ | 1,143,435 | |
Net realized loss on investments and other financial instruments | | | (26,049,547 | ) | | | (50,544,010 | ) |
Net unrealized appreciation (depreciation) of investments and other financial instruments | | | 14,731,351 | | | | (1,529,129 | ) |
| | | | | | | | |
Net Decrease in Net Assets Resulting from Operations | | | (8,756,326 | ) | | | (50,929,704 | ) |
| | | | | | | | |
Distributions to Shareholders: | | | | | | | | |
From net investment income | | | | | | | | |
Class IB | | | (3,009,019 | ) | | | (1,833,124 | ) |
| | | | | | | | |
Total distributions | | | (3,009,019 | ) | | | (1,833,124 | ) |
| | | | | | | | |
Capital Share Transactions: | | | | | | | | |
Class IB | | | | | | | | |
Sold | | | 46,047,693 | | | | 220,553,392 | |
Issued on reinvestment of distributions | | | 3,009,019 | | | | 1,833,124 | |
Redeemed | | | (63,405,813 | ) | | | (22,264,334 | ) |
| | | | | | | | |
Total capital share transactions | | | (14,349,101 | ) | | | 200,122,182 | |
| | | | | | | | |
Net increase (decrease) from capital share transactions | | | (14,349,101 | ) | | | 200,122,182 | |
| | | | | | | | |
Net Increase (Decrease) in Net Assets | | | (26,114,446 | ) | | | 147,359,354 | |
| | | | | | | | |
Net Assets: | | | | | | | | |
Beginning of period | | | 443,121,150 | | | | 295,761,796 | |
| | | | | | | | |
End of period | | $ | 417,006,704 | | | $ | 443,121,150 | |
| | | | | | | | |
Undistributed net investment income | | $ | 17,943 | | | $ | 8,760 | |
| | | | | | | | |
Shares: | | | | | | | | |
Class IB | | | | | | | | |
Sold | | | 5,717,832 | | | | 25,309,769 | |
Issued on reinvestment of distributions | | | 370,611 | | | | 224,098 | |
Redeemed | | | (7,868,265 | ) | | | (2,593,857 | ) |
| | | | | | | | |
Total share activity | | | (1,779,822 | ) | | | 22,940,010 | |
| | | | | | | | |
| (1) | See Note 11 in the accompanying Notes to Financial Statements. |
The accompanying notes are an integral part of these financial statements.
|
| HIMCO VIT Portfolio Diversifier Fund |
Notes to Financial Statements
December 31, 2014
HIMCO Variable Insurance Trust (the “Trust”) is an open-end registered management investment company. The Trust is organized under the laws of the State of Delaware and is registered with the Securities and Exchange Commission (“SEC”) under the Investment Company Act of 1940, as amended (“1940 Act”).
HIMCO VIT Portfolio Diversifier Fund (the “Fund”) serves as an underlying investment option for certain variable annuity separate accounts of Hartford Life Insurance Company (“HLIC”) and its affiliates and Forethought Life Insurance Company (“Forethought”). The Fund’s shares are available only to separate accounts of HLIC and its affiliates and Forethought who have elected a guaranteed benefit rider subject to an allocation requiring investment in the Fund.
The Fund is a series of the Trust. The Fund is a diversified open-end management investment company and applies specialized accounting and reporting under Accounting Standards Codification Topic 946, Financial Services – Investment Companies. The Fund is authorized to issue an unlimited number of shares with a par value of $0.001 each.
Class IB shares of the Fund are offered at the per share net asset value (“NAV”) without a sales charge and are subject to distribution and service fees charged pursuant to a Distribution Plan adopted in accordance with Rule 12b-1 under the 1940 Act.
Effective October 20, 2014, Hartford Portfolio Diversifier HLS Fund (the “Predecessor Fund”) was reorganized into the HIMCO VIT Portfolio Diversifier Fund. The Fund is advised by Hartford Investment Management Company (“Hartford Investment Management”). See Note 10.
| 2. | Significant Accounting Policies: |
The following is a summary of significant accounting policies of the Fund in the preparation of its financial statements, which are in accordance with United States Generally Accepted Accounting Principles (“U.S. GAAP”). The preparation of financial statements in accordance with U.S. GAAP may require management to make estimates and assumptions that affect the reported amounts of assets and liabilities and disclosure of contingent assets and liabilities at the date of the financial statements and the reported amounts of increases and decreases in net assets from operations during the reporting period. Actual results could differ from those estimates.
| | a) | Determination of Net Asset Value – The NAV of each class of the Fund’s shares is determined as of the close of regular trading (normally 4:00 p.m. Eastern Time) (the “NYSE Close”) on each day that the New York Stock Exchange (the “Exchange”) is open (“Valuation Date”). Information that becomes known to the Fund after the NAV has been calculated on a particular day will not generally be used to retroactively adjust the NAV determined earlier that day. |
| | b) | Investment Valuation and Fair Value Measurements – For purposes of calculating the NAV, portfolio investments and other assets held by the Fund’s portfolio for which market prices are readily available are valued at market value. Market value is generally determined on the basis of last reported sales prices or official close price. If no sales are reported, market value is based on bid/ask prices, and dealer, broker or market maker-quotations. Last sale prices, official closing prices and bid and ask prices are supplied by one or more independent pricing services. If market prices are not readily available or are deemed unreliable, the Fund will use the fair value of the investment as determined in good faith under policies and procedures established by and under the supervision of the Trust’s Board of Trustees (“Board of Trustees”). |
Fixed income investments (other than short-term obligations), non-exchange traded derivatives and centrally cleared swaps held by the Fund are normally valued on the basis of quotes obtained from independent pricing services or brokers and dealers in accordance with procedures established by the Board of Trustees. Prices obtained from independent pricing services use information provided by market makers or estimates of market values through accepted market modeling, trading and pricing conventions. Inputs to the models may include, but are not limited to, prepayment speeds, pricing spread, yield, trade information, dealer quotes, market color, cash flow models and the investment’s terms and conditions. Generally, the Fund may use fair valuation in regard to fixed income investments when the Fund holds defaulted or distressed investments or investments in a company in which a reorganization is pending. Short-term investments maturing in 60 days or less are generally valued at amortized cost, if their original term to maturity was 60 days or less, or by amortizing their value on the 61st day prior to maturity, if the original term to maturity exceeded 60 days, which approximates fair value.
|
| HIMCO VIT Portfolio Diversifier Fund |
Notes to Financial Statements – (continued)
December 31, 2014
Exchange traded equity securities are normally valued at the last reported sale price on the exchange or market on which the security is primarily traded and generally has the highest volume of trading activity (the “Primary Market”) at the Valuation Date. If the security did not trade on the Primary Market, it may be valued at the last reported sales price on another exchange or market where it trades at the Valuation Date. The value of an equity security not traded on any exchange but traded on an over-the-counter (“OTC”) market shall be valued at the last reported sales price or official closing price on the exchange or market on which the security is traded as of the Valuation Date.
Exchange traded options, futures and options on futures are valued at the settlement price on last trade price determined by the relevant exchange as of the NYSE Close. If a last trade price is not available, the value will be the mean of the bid and ask prices as of the NYSE Close. If a mean of the bid and ask prices cannot be calculated for the day, the value will be the bid price as of the NYSE Close. In the case of OTC options and such instruments that do not trade on an exchange, values may be supplied by a pricing service using a formula or other objective method that may take into consideration the style, direction, expiration, strike price, notional value and volatility or other special adjustments.
Investments in open-end mutual funds are valued at the respective NAV of each open-end mutual fund on the Valuation Date.
Financial instruments for which prices are not available from an independent pricing service may be valued using market quotations obtained from one or more dealers that make markets in the respective financial instrument in accordance with procedures established by the Board of Trustees.
U.S. GAAP defines fair value as the price that a fund would receive to sell an asset or pay to transfer a liability in an orderly transaction between market participants. The U.S. GAAP fair value measurement standards require disclosure of a fair value hierarchy for each major category of assets and liabilities. Various inputs are used in determining the fair value of the Fund’s investments. These inputs are summarized into three broad hierarchy levels. This hierarchy is based on whether the valuation inputs are observable or unobservable. These levels are:
| | • | | Level 1 – Quoted prices in active markets for identical investments. Level 1 may include exchange traded instruments, such as domestic equities, some foreign equities, options, futures, mutual funds, exchange traded funds, rights and warrants. |
| | • | | Level 2 – Observable inputs other than Level 1 prices, such as quoted prices for similar investments; quoted prices in markets that are not active; or other inputs that are observable or can be corroborated by observable market data. Level 2 may include debt investments that are traded less frequently than exchange traded instruments and which are valued using independent pricing services; foreign equities, which are principally traded on certain foreign markets and are adjusted daily pursuant to a fair value pricing service in order to reflect an adjustment for the factors occurring after the close of certain foreign markets but before the NYSE Close; senior floating rate interests, which are valued using an aggregate of dealer bids; short-term investments, which are valued at amortized cost; and swaps, which are valued based upon the terms of each swap contract. |
| | • | | Level 3 – Significant unobservable inputs that are supported by limited or no market activity. Level 3 may include financial instruments whose values are determined using indicative market quotes or require significant management judgment or estimation. These unobservable valuation inputs may include estimates for current yields, maturity/duration, prepayment speed, and indicative market quotes for comparable investments along with other assumptions relating to credit quality, collateral value, complexity of the investment structure, general market conditions and liquidity. This category may include investments where trading has been halted or there are certain restrictions on trading. While these investments are priced using unobservable inputs, the valuation of these investments reflects the best available data and management believes the prices are a reasonable representation of exit price. |
The Board of Trustees has adopted procedures for determining the value of portfolio securities. These procedures define how investments are to be valued, including the formation and activities of a Valuation Committee. The Valuation Committee has the overall responsibility for implementing the procedures adopted by the Board of Trustees, including, the responsibility for determining the fair value of the Fund’s investments. The Valuation Committee is also responsible for determining in good faith the fair value of investments when the value cannot be obtained from primary pricing services or alternative sources or if the valuation of an investment as provided by the primary pricing service or alternative source is believed not to reflect the investment’s fair value as of the Valuation Date.
|
| HIMCO VIT Portfolio Diversifier Fund |
Notes to Financial Statements – (continued)
December 31, 2014
The Valuation Committee is comprised of the Trust’s Chief Executive Officer, Chief Financial Officer, Chief Administrative Officer, and Chief Legal officer, or their designees. In addition, the Trust’s Chief Compliance Officer (“CCO”) shall designate a member of the compliance group to attend Valuation Committee meetings as a non-voting resource, to monitor for and provide guidance with respect to compliance with these procedures and to keep the Trust’s CCO regularly informed of pricing and Valuation Committee proceedings. Two members of the Valuation Committee or their designees, representing different departments, shall constitute a quorum for purposes of permitting the Committee to take action. The Valuation Committee will consider all relevant factors in determining an investment’s fair value, and may seek the advice of the Fund’s adviser, knowledgeable brokers, and legal counsel in making such determination.
At each quarterly meeting of the Board of Trustees, the Valuation Committee provides a written report which include details of all fair-valued investments, including the reason for the fair valuation, and an indication, when possible, of the accuracy of the valuation by disclosing the next available reliable public price quotation or the disposition price of such investments (the “look-back” review). The Board of Trustees then must consider for ratification all of the fair value determinations made during the previous quarter.
Valuation levels are not necessarily indicative of the risk associated with investing in such investments. Individual investments within any of the above mentioned asset classes may be assigned a different hierarchical level than those presented above, as individual circumstances dictate.
For additional information, refer to the Investment Valuation Hierarchy Level Summary which follows the Schedule of Investments.
| | c) | Investment Transactions and Investment Income – Investment transactions are recorded as of the trade date (the date the order to buy or sell is executed) for financial reporting purposes. Investments purchased or sold on a when-issued or delayed-delivery basis may be settled a month or more after the trade date. Realized gains and losses are determined on the basis of identified cost. |
Dividend income from domestic securities is accrued on the ex-dividend date. Interest income, including amortization of premium, accretion of discounts and additional principal received in-kind in lieu of cash, is accrued on a daily basis. Paydown gains and losses on mortgage related and other asset backed securities are included in interest income in the Statement of Operations, as applicable.
| | d) | Joint Trading Account – The Fund may invest cash balances into a joint trading account that may be invested in one or more repurchase agreements. |
| | e) | Fund Share Valuation and Dividend Distributions to Shareholders – Orders for the Fund’s shares are executed in accordance with the investment instructions of the contract holders and plan participants. The NAV of the Fund’s shares is determined as of the close of business on each business day of the Exchange. The NAV is determined separately for each class of shares of the Fund by dividing the Fund’s net assets attributable to that class by the number of shares of the class outstanding. Each class of shares offered by the Fund has equal rights as to assets and voting privileges (except that shareholders of a class have exclusive voting rights regarding any matter relating solely to that class of shares). Income and non-class specific expenses are allocated daily to each class on the basis of the relative net assets of the class. Realized and unrealized gains and losses are allocated daily based on the relative net assets of each class of shares of the Fund. |
Orders for the purchase of the Fund’s shares received prior to the close of the Exchange on any day the Exchange is open for business are priced at the NAV determined as of the close of the Exchange. Orders received after the close of the Exchange, or on a day on which the Exchange and/or the Fund is not open for business, are priced at the next determined NAV.
Dividends are declared pursuant to a policy adopted by the Trust’s Board of Trustees based upon the investment performance of the Fund. The policy of the Fund is to pay dividends from net investment income and realized gains, if any, at least once a year.
Distributions from net investment income, realized capital gains and capital are determined in accordance with federal income tax regulations, which may differ from U.S. GAAP with respect to character and timing. These differences may
|
| HIMCO VIT Portfolio Diversifier Fund |
Notes to Financial Statements – (continued)
December 31, 2014
include, but are not limited to, losses deferred due to wash sale adjustments, foreign currency gains and losses, adjustments related to Passive Foreign Investment Companies (“PFICs”), Real Estate Investment Trusts (“REITs”), Regulated Investment Companies (“RICs”), certain derivatives and partnerships. Permanent book and federal income tax basis differences relating to shareholder distributions will result in reclassifications to certain of the Fund’s capital accounts (see Federal Income Taxes: Reclassification of Capital Accounts note).
| 3. | Securities and Other Investments: |
| | a) | Repurchase Agreements – A repurchase agreement is an agreement by which a counterparty agrees to sell an investment and agrees to repurchase the investment sold from the buyer at a mutually agreed upon time and price. During the period of the repurchase agreement, the counterparty will deposit cash and or securities in a third party custodial account to serve as collateral. At the time the Fund enters into a repurchase agreement, the value of the underlying collateral, including accrued interest, will be equal to or exceed the value of the repurchase agreement. Repurchase agreements expose the Fund to counterparty risk—that is, the risk that the counterparty will not fulfill its obligations. To minimize counterparty risk, the investments that serve to collateralize the repurchase agreement are held by the Fund’s custodian in book entry or physical form in the custodial account of the Fund or in a third party custodial account. Repurchase agreements are valued at cost plus accrued interest, which approximates fair value. Repurchase agreements have master netting arrangements which allow the Fund to offset amounts owed to a counterparty with amounts owed by the counterparty, including any collateral. Upon an event of default under a master repurchase agreement, the non-defaulting party may close out all transactions traded under such agreement and net amounts owed under each transaction to one net amount payable by one party to the other. Absent an event of default, the master repurchase agreement does not result in an offset of reported amounts of assets and liabilities in the Statement of Assets and Liabilities across transactions between the Fund and the applicable counterparty. The Fund, as shown on the Schedule of Investments, had one outstanding repurchase agreement and related collateral as of December 31, 2014. |
| | b) | Illiquid and Restricted Investments – The Fund is permitted to invest up to 15% of its net assets in illiquid investments. Illiquid investments are those that may not be sold or disposed of in the ordinary course of business within seven days, at approximately the price used to determine the Fund’s NAV. The Fund may not be able to sell illiquid investments when its sub-adviser considers it desirable to do so or may have to sell such investments at a price that is lower than the price that could be obtained if the investments were more liquid. A sale of illiquid investments may require more time and may result in higher dealer discounts and other selling expenses than does the sale of those that are liquid. Illiquid investments also may be more difficult to value due to the unavailability of reliable market quotations for such investments, and an investment in them may have an adverse impact on the Fund’s NAV. The Fund may also purchase certain restricted investments that can only be resold to certain qualified investors and may be determined to be liquid pursuant to policies and guidelines established by the Trust’s Board of Trustees. The Fund had no illiquid and/or restricted investments as of December 31, 2014. |
| | c) | Investments Purchased on a When-Issued or Delayed-Delivery Basis – Delivery and payment for investments that have been purchased by the Fund on a forward commitment, or when-issued or delayed-delivery basis, take place beyond the customary settlement period. The Fund may dispose of or renegotiate a delayed-delivery transaction after it is entered into, and may sell delayed-delivery investments before they are delivered, which may result in a realized gain or loss. During this period, such investments are subject to market fluctuations, and the Fund identifies investments segregated in its records with a value at least equal to the amount of the commitment. The Fund, as shown on the Schedule of Investments, had when-issued or delayed-delivery investments as of December 31, 2014. |
| | d) | Mortgage Related and Other Asset Backed Securities – The Fund may invest in mortgage related and other asset backed securities. These securities include mortgage pass-through securities, collateralized mortgage obligations, commercial mortgage backed securities, stripped mortgage backed securities, asset backed securities, collateralized debt obligations and other securities that directly or indirectly represent a participation in, or are secured by and payable from, mortgage loans on real property. Mortgage related securities are created from pools of residential or commercial mortgage loans, including mortgage loans made by savings and loan institutions, mortgage bankers, commercial banks and others. Asset backed securities are created from many types of assets, including auto loans, credit card receivables, home equity loans, and student loans. These securities provide a monthly payment that consists of both interest and principal payments. Interest payments may be determined by fixed or adjustable rates. The rate of pre-payments on underlying mortgages |
|
| HIMCO VIT Portfolio Diversifier Fund |
Notes to Financial Statements – (continued)
December 31, 2014
| | will affect the price and volatility of a mortgage related security, and may have the effect of shortening or extending the effective duration of the security relative to what was anticipated at the time of purchase. The timely payment of principal and interest of certain mortgage related securities is guaranteed by the full faith and credit of the United States Government. Mortgage related and other asset backed securities created and guaranteed by non-governmental issuers, including government-sponsored corporations, may be supported by various forms of insurance or guarantees, but there can be no assurance that the private insurers or guarantors can meet their obligations under the insurance policies or guarantee arrangements. The Fund, as shown on the Schedule of Investments, had mortgage related and other asset backed securities as of December 31, 2014. |
| 4. | Financial Derivative Instruments: |
The following disclosures contain information on how and why the Fund uses derivative instruments, the credit-risk-related contingent features in certain derivative instruments, and how derivative instruments affect the Fund’s financial position and results of operations. The location and fair value amounts of these instruments on the Statement of Assets and Liabilities and the realized gains and losses and changes in unrealized gains and losses on the Statement of Operations, each categorized by type of derivative contract, are included in the following Additional Derivative Instrument Information footnote. The derivative instruments outstanding as of year-end are disclosed in the notes to the Schedule of Investments, if applicable. The amounts of realized gains and losses and changes in unrealized gains and losses on derivative instruments during the year are disclosed in the Statement of Operations.
| | a) | Futures Contracts – The Fund may enter into futures contracts. A futures contract is an agreement between two parties to buy or sell an asset at a set price on a future date. The Fund uses futures contracts to manage or obtain exposure to the investment markets, commodities, or movements in interest rates and currency values. The primary risks associated with the use of futures contracts are the imperfect correlation between the change in market value of the investments held by the Fund and the prices of futures contracts and the possibility of an illiquid market. Upon entering into a futures contract, the Fund is required to deposit with a futures commission merchant (“FCM”) an amount of cash or U.S. Government or Agency Obligations in accordance with the initial margin requirements of the broker or exchange. Futures contracts are marked to market daily at the most recent settlement price reported by an exchange on which, over time, they are traded most extensively, and an appropriate payable or receivable for the change in value (“variation margin”) is recorded by the Fund. Gains or losses are recognized but not considered realized until the contracts expire or are closed. Futures contracts involve, to varying degrees, risk of loss in excess of the variation margin disclosed on the Statement of Assets and Liabilities; however, the Fund seeks to reduce this risk through the use of an FCM. The Fund, as shown on the Schedule of Investments, had outstanding futures contracts as of December 31, 2014. |
| | b) | Options Contracts – An option contract is a contract sold by one party to another party that offers the buyer the right, but not the obligation, to buy (call) or sell (put) an investment or other financial asset at an agreed-upon price during a specific period of time or on a specific date. The Fund may write (sell) covered call and put options on futures, swaps (“swaptions”), securities or commodities. “Covered” means that so long as the Fund is obligated as the writer of an option, it will own either the underlying investments or currency or an option to purchase the same underlying investments or currency having an expiration date of the covered option and an exercise price equal to or less than the exercise price of the covered option, or will pledge cash or other liquid investments having a value equal to or greater than the fluctuating market value of the option investment or currency. Writing put options increases the Fund’s exposure to the underlying instrument. Writing call options decreases the Fund’s exposure to the underlying instrument. Premiums received from writing options that expire are treated as realized gains. Premiums received from writing options that are exercised or closed are added to the proceeds or offset amounts paid on the underlying futures, swap, investment or currency transaction to determine the realized gain or loss. The Fund as a writer of an option has no control over whether the underlying instrument may be sold (call) or purchased (put) and as a result bears the market risk of an unfavorable change in the price of the instrument underlying the written option. There is the risk the Fund may not be able to enter into a closing transaction because of an illiquid market. The Fund may also purchase put and call options. Purchasing call options increases the Fund’s exposure to the underlying instrument. Purchasing put options decreases the Fund’s exposure to the underlying instrument. The Fund pays a premium, which is included on the Fund’s Statement of Assets and Liabilities as an investment and is subsequently marked to market to reflect the current value of the option. Premiums paid for purchasing options that expire are treated as realized losses. Certain options may be |
|
| HIMCO VIT Portfolio Diversifier Fund |
Notes to Financial Statements – (continued)
December 31, 2014
| | purchased with premiums to be determined on a future date. The premiums for these options are based upon implied volatility parameters at specified terms. The risk associated with purchasing put and call options is generally limited to the premium paid. Premiums paid for purchasing options that are exercised or closed are added to the amounts paid or offset against the proceeds on the underlying investment transaction to determine the realized gain or loss. Entering into over-the-counter options also exposes the Fund to counterparty risk. Counterparty risk is the possibility that the counterparty to the agreements may default on its obligation to perform or disagree as to the meaning of the contractual terms in the agreements. The Fund, as shown on the Schedule of Investments, had outstanding purchased options and written options contracts as of December 31, 2014. Transactions involving written options contracts during the year ended December 31, 2014, are summarized below: |
| | | | | | | | |
| | | Options Contract Activity During the
Year Ended December 31, 2014 | |
| Put Options Written During the Year | | Number of Contracts | | | Premium Amounts | |
Beginning of the year | | | 97,255 | | | $ | 13,217,922 | |
Written | | | 8,811 | | | | 71,369 | |
Expired | | | — | | | | — | |
Closed | | | (8,811 | ) | | | (1,388,991 | ) |
Exercised | | | — | | | | — | |
| | | | | | | | |
End of year | | | 97,255 | | | $ | 11,900,300 | |
| | | | | | | | |
| | Additional | Derivative Instrument Information: |
Fair Value of Derivative Instruments on the Statement of Assets and Liabilities as of December 31, 2014:
| | | | | | | | | | | | | | | | | | | | | | | | | | | | |
| | | Risk Exposure Category | |
| | | Interest Rate
Contracts | | | Foreign
Exchange
Contracts | | | Credit
Contracts | | | Equity
Contracts | | | Commodity
Contracts | | | Other
Contracts | | | Total | |
Investments in securities, at value (purchased options), market value | | $ | — | | | $ | — | | | $ | — | | | $ | 1,636,393 | | | $ | — | | | $ | — | | | $ | 1,636,393 | |
Variation margin receivable(1) | | | — | | | | — | | | | — | | | | 2,037,488 | | | | — | | | | — | | | | 2,037,488 | |
| | | | | | | | | | | | | | | | | | | | | | | | | | | | |
Total | | $ | — | | | $ | — | | | $ | — | | | $ | 3,673,881 | | | $ | — | | | $ | — | | | $ | 3,673,881 | |
| | | | | | | | | | | | | | | | | | | | | | | | | | | | |
Liabilities: | | | | | | | | | | | | | | | | | | | | | | | | | | | | |
Written options, market value | | $ | — | | | $ | — | | | $ | — | | | $ | 595,433 | | | $ | — | | | $ | — | | | $ | 595,433 | |
| | | | | | | | | | | | | | | | | | | | | | | | | | | | |
Total | | $ | — | | | $ | — | | | $ | — | | | $ | 595,433 | | | $ | — | | | $ | — | | | $ | 595,433 | |
| | | | | | | | | | | | | | | | | | | | | | | | | | | | |
| | (1) | Only current day’s variation margin is reported within the Statement of Assets and Liabilities. The variation margin is included in the open futures net cumulative depreciation of $2,767,151 as reported in the Schedule of Investments. |
The volume of derivatives that is presented in the Schedule of Investments is consistent with the derivative activity during the year ended December 31, 2014.
|
| HIMCO VIT Portfolio Diversifier Fund |
Notes to Financial Statements – (continued)
December 31, 2014
The Effect of Derivative Instruments on the Statement of Operations for the year ended December 31, 2014:
| | | | | | | | | | | | | | | | | | | | | | | | | | | | |
| | | Risk Exposure Category | |
| | | Interest Rate
Contracts | | | Foreign
Exchange
Contracts | | | Credit
Contracts | | | Equity
Contracts | | | Commodity
Contracts | | | Other
Contracts | | | Total | |
| | | | | | | | | | | | | | | | | | | | | | | | | |
Realized Gain on Derivatives Recognized as a Result of Operations: | | | | | | | | | | | | | |
Net realized loss on purchased options | | $ | — | | | $ | — | | | $ | — | | | $ | (2,178,480 | ) | | $ | — | | | $ | — | | | $ | (2,178,480 | ) |
Net realized gain on futures | | | — | | | | — | | | | — | | | | (32,405,763 | ) | | | — | | | | — | | | | (32,405,763 | ) |
Net realized gain on written options | | | — | | | | — | | | | — | | | | 1,347,827 | | | | — | | | | — | | | | 1,347,827 | |
| | | | | | | | | | | | | | | | | | | | | | | | | | | | |
Total | | $ | — | | | $ | — | | | $ | — | | | $ | (33,236,416 | ) | | $ | — | | | $ | — | | | $ | (33,236,416 | ) |
| | | | | | | | | | | | | | | | | | | | | | | | | | | | |
|
Net Change in Unrealized Appreciation (Depreciation) on Derivatives Recognized as a Result of Operations: | |
Net change in unrealized appreciation of investments in purchased options | | $ | — | | | $ | — | | | $ | — | | | $ | 26,387 | | | $ | — | | | $ | — | | | $ | 26,387 | |
Net change in unrealized appreciation of futures | | | — | | | | — | | | | — | | | | 4,945,697 | | | | — | | | | — | | | | 4,945,697 | |
Net change in unrealized depreciation of written options | | | — | | | | — | | | | — | | | | (438,198 | ) | | | — | | | | — | | | | (438,198 | ) |
| | | | | | | | | | | | | | | | | | | | | | | | | | | | |
Total | | $ | — | | | $ | — | | | $ | — | | | $ | 4,533,886 | | | $ | — | | | $ | — | | | $ | 4,533,886 | |
| | | | | | | | | | | | | | | | | | | | | | | | | | | | |
| | c) | Balance Sheet Offsetting Information – Set forth below are tables which disclose both gross information and net information about instruments and transactions eligible for offset in the financial statements, and instruments and transactions that are subject to a master netting arrangement, as well as amounts related to margin, reflected as financial collateral (including cash collateral), held at clearing brokers, counterparties and the Fund’s custodian. The master netting arrangements allow the clearing brokers to net any collateral held in or on behalf of the Fund, or liabilities or payment obligations of the clearing brokers to the Fund, against any liabilities or payment obligations of the Fund to the clearing brokers. The Fund is required to deposit financial collateral (including cash collateral) at the FCM custodian on behalf of clearing brokers and counterparties to continually meet the original and maintenance requirements established by the clearing brokers and counterparties. Certain master netting arrangements may not be enforceable in a bankruptcy. |
Offsetting of Financial Assets and Derivative Assets as of December 31, 2014:
| | | | | | | | | | | | | | | | | | | | |
| | | Gross Amounts*
of Assets
Presented in
Statement of
Assets and
Liabilities | | | Financial
Instruments with
Allowable Netting | | | Non-cash
Collateral
Received | | | Cash Collateral
Received | | | Net Amount (not
less than $0) | |
| | | | | | | | | | | | | | | | | |
Description | | | | | | | | | | | | | | | | | | | | |
Purchased options contracts at market value | | $ | 1,636,393 | | | $ | (595,433 | ) | | $ | (1,040,960 | ) | | $ | — | | | $ | — | |
| | | | | | | | | | | | | | | | | | | | |
Total subject to a master netting or similar arrangement | | $ | 1,636,393 | | | $ | (595,433 | ) | | $ | (1,040,960 | ) | | $ | — | | | $ | — | |
| | | | | | | | | | | | | | | | | | | | |
Offsetting of Financial Liabilities and Derivative Liabilities as of December 31, 2014:
| | | | | | | | | | | | | | | | | | | | |
| | | Gross Amounts*
of Liabilities
Presented in
Statement of
Assets and
Liabilities | | | Financial
Instruments with
Allowable Netting | | | Non-cash
Collateral
Pledged | | | Cash Collateral
Pledged | | | Net Amount (not
less than $0) | |
| | | | | | | | | | | | | | | | | |
Description | | | | | | | | | | | | | | | | | | | | |
Written options at market value | | $ | 595,433 | | | $ | (595,433 | ) | | $ | — | | | $ | — | | | $ | — | |
| | | | | | | | | | | | | | | | | | | | |
Total subject to a master netting or similar arrangement | | $ | 595,433 | | | $ | (595,433 | ) | | $ | — | | | $ | — | | | $ | — | |
| | | | | | | | | | | | | | | | | | | | |
| | (*) | Gross amounts presented as no amounts are netted within the Statement of Assets and Liabilities. |
|
| HIMCO VIT Portfolio Diversifier Fund |
Notes to Financial Statements – (continued)
December 31, 2014
Certain derivatives held by the Fund, as of December 31, 2014, are not subject to a master netting arrangement and are excluded from the table above.
Credit risk depends largely on the perceived financial health of bond issuers. In general, the credit rating is inversely related to the credit risk of the issuer. Higher rated bonds generally are deemed to have less credit risk, while lower or unrated bonds are deemed to have higher risk of default. The share price, yield and total return of a fund that holds securities with higher credit risk may be more volatile than those of a fund that holds bonds with lower credit risk. Similar to credit risk, the Fund may be exposed to counterparty risk, or the risk that an institution or other entity with which the Fund has unsettled or open transactions will default.
The Fund’s investments expose the Fund to various risks including, but not limited to, interest rate, prepayment, extension and equity risks. Interest rate risk is the risk that fixed income securities will decline in value because of changes in interest rates. As nominal interest rates rise, the values of certain fixed income securities held by the Fund are likely to decrease. A nominal interest rate can be described as the sum of a real interest rate and an expected inflation rate. Fixed income securities with longer durations tend to be more sensitive to changes in interest rates, usually making them more volatile than securities with shorter durations. Duration is useful primarily as a measure of the sensitivity of a fixed income security’s market price to interest rate (i.e., yield) movements. Rising interest rates may cause prepayments to occur at a slower than expected rate, thereby effectively lengthening the maturity of the security and making the security more sensitive to interest rate changes. Prepayment and extension risk are major risks of mortgage backed securities and certain asset backed securities. For certain asset backed securities, the actual maturity may be less than the stated maturity shown in the Schedule of Investments, if applicable. As a result, the timing of income recognition relating to these securities may vary based upon the actual maturity.
The market values of equity securities, such as common stocks and preferred stocks, or equity related investments, such as futures and options, may decline due to general market conditions which are not specifically related to a particular company, such as real or perceived adverse economic conditions, changes in the general outlook for corporate earnings, changes in interest or currency rates or adverse investor sentiment generally. The market value of equity securities may also decline due to factors which affect a particular industry or industries, such as labor shortages or increased production costs and competitive conditions within an industry. Equity securities and equity related investments generally have greater market price volatility than fixed income securities.
| | a) | Federal Income Taxes – For federal income tax purposes, the Fund intends to continue to qualify as a regulated investment company (“RIC”) under Subchapter M of the Internal Revenue Code (“IRC”) by distributing substantially all of its taxable net investment income and net realized capital gains to its shareholders and otherwise complying with the requirements of the IRC. The Fund has distributed substantially all of its income and capital gains in prior years, if applicable, and intends to distribute substantially all of its income and capital gains prior to the next fiscal year-end. Accordingly, no provision for federal income or excise taxes has been made in the accompanying financial statements. Distributions from short-term capital gains are treated as ordinary income distributions for federal income tax purposes. |
| | b) | Net Investment Income (Loss), Net Realized Gains (Losses) and Distributions – Net investment income (loss) and net realized gains (losses) may differ for financial statement and tax purposes primarily because of losses deferred due to wash sale adjustments, paydown gain/loss, adjustments related to certain corporate actions, REITs, RICs and certain derivatives. The character of distributions made during the year from net investment income or net realized gains may differ from their ultimate characterization for federal income tax purposes. Also, due to the timing of dividend distributions, the fiscal year in which amounts are distributed may differ from the year that the income or realized gains (losses) were recorded by the Fund. |
| | c) | Distributions and Components of Distributable Earnings – The tax character of distributions paid by the Fund for the periods indicated is as follows (as adjusted for dividends payable, if applicable): |
| | | | | | | | |
| | | For the Year Ended
December 31, 2014 | | | For the Year Ended
December 31, 2013 | |
Ordinary Income | | $ | 3,009,019 | | | $ | 1,833,124 | |
|
| HIMCO VIT Portfolio Diversifier Fund |
Notes to Financial Statements – (continued)
December 31, 2014
As of December 31, 2014, the Fund’s components of distributable earnings (deficit) on a tax basis were as follows:
| | | | |
| | | Amount | |
Undistributed Ordinary Income | | $ | 17,943 | |
Undistributed Long-Term Capital Gain | | | — | |
Accumulated Capital and Other Losses | | | (78,133,613 | ) |
Unrealized Appreciation (Depreciation)(1) | | | 741,433 | |
| | | | |
Total Accumulated Earnings (Deficit) | | $ | (77,374,237 | ) |
| | | | |
| | (1) | Differences between book-basis and tax-basis unrealized appreciation (depreciation) may be attributable to the losses deferred due to wash sale adjustments, and adjustments related to REITs, RICs, certain derivatives and corporate actions. |
| | d) | Reclassification of Capital Accounts – The Fund may record reclassifications in its capital accounts. These reclassifications have no impact on the total net assets of the Fund. The reclassifications are a result of permanent differences between U.S. GAAP and tax accounting for such items as paydown gain/loss. Adjustments are made to reflect the impact these items have on current and future distributions to shareholders. Therefore, the source of the Fund’s distributions may be shown in the accompanying Statement of Changes in Net Assets as from undistributed net investment income, from accumulated net realized gains on investments or from capital depending on the type of book and tax differences that exist. For the year ended December 31, 2014, the Fund recorded reclassifications to increase (decrease) the accounts listed below: |
| | | | |
| | | Amount | |
Paid In Capital | | $ | (9,989 | ) |
Undistributed Net Investment Income | | | 456,332 | |
Accumulated Net Realized Loss | | | (446,343 | ) |
| | e) | Capital Loss Carryforward – On December 22, 2010, the Regulated Investment Company Modernization Act of 2010 (the “Act”) was enacted, which made changes to the capital loss carryforward rules. The changes are effective for taxable years beginning after the date of enactment. Under the Act, funds are permitted to carry forward capital losses for an unlimited period. However, any losses incurred during those future taxable years will be required to be utilized prior to the losses incurred in pre-enactment taxable years, which carry an expiration date. As a result of this ordering rule, pre-enactment capital loss carryforwards may be more likely to expire unused. Additionally, capital loss carryforwards retain their character as either short-term or long-term capital losses rather than being considered all short-term as permitted under prior regulation. |
At December 31, 2014 (tax-year-end), the Fund had capital loss carryforwards for U.S. federal income tax purposes as follows:
Capital loss carryforwards with no expiration:
| | | | |
| | | Amount | |
Short-Term Capital Loss Carryforward | | $ | 36,834,214 | |
Long-Term Capital Loss Carryforward | | | 41,299,399 | |
| | | | |
Total | | $ | 78,133,613 | |
| | | | |
| | f) | Accounting for Uncertainty in Income Taxes – The Fund has adopted financial reporting rules that require the Fund to analyze all open tax years, as defined by the statute of limitations, for all major jurisdictions. Generally, tax authorities can examine all tax returns filed for the last three years. The Fund does not have an examination in progress. |
The Fund has reviewed all open tax years and major jurisdictions and concluded that these financial reporting rules had no effect on the Fund’s financial position or results of operations. There is no tax liability resulting from unrecognized tax benefits relating to uncertain income tax positions taken or expected to be taken on the tax return for the fiscal year ended. The Fund is also not aware of any tax positions for which it is reasonably possible that the total amounts of unrecognized tax benefits will significantly change in the next twelve months.
|
| HIMCO VIT Portfolio Diversifier Fund |
Notes to Financial Statements – (continued)
December 31, 2014
| | a) | Investment Management Agreement – Prior to October 20, 2014, Hartford Funds Management Company, LLC (“HFMC”), an indirect wholly owned subsidiary of The Hartford Financial Services Group, Inc. (“The Hartford”) served as the Fund’s investment manager pursuant to an Investment Management Agreement with Hartford Series Fund, Inc. HFMC contracted with Hartford Investment Management Company (“Hartford Investment Management”) under a sub-advisory agreement for the provision of day-to-day investment management services to the Fund in accordance with the Fund’s investment objective and policies. The Fund paid a fee to the investment manager, a portion of which was used to compensate Hartford Investment Management. As a result of the Reorganization, effective October 20, 2014, Hartford Investment Management serves as the Fund’s investment manager pursuant to an Investment Management Agreement with the Trust. Hartford Investment Management is a wholly owned subsidiary of The Hartford. The investment manager provides day-to-day investment management services to the Fund and has overall investment supervisory responsibility for the Fund. In addition, the investment manager provides administrative personnel, services, equipment, facilities and office space for operation of the Fund. |
The schedule below reflects the rates of compensation paid to HFMC for investment management services rendered as of December 31, 2014; the rates are accrued daily and paid monthly.
| | | | |
Average Daily Net Assets | | Annual Fee | |
On first $500 million | | | 0.60% | |
On next $500 million | | | 0.55% | |
On next $4 billion | | | 0.50% | |
On next $5 billion | | | 0.48% | |
Over $10 billion | | | 0.47% | |
The above schedule did not change following the Reorganization. Prior to October 20, 2014, HFMC had contractually agreed to reimburse expenses (exclusive of taxes, interest expense, brokerage commissions, acquired fund fees and expenses and extraordinary expenses) to the extent necessary to maintain total annual operating expenses for the Class IB shares of the Fund at the annual rate of 0.85% of the Fund’s average daily net assets. This contractual arrangement would have remained in effect until April 30, 2014, and would have renewed automatically for one-year terms unless HFMC provided written notice of termination prior to the start date of the next term or upon approval of the Board of Directors of the Company.
Effective October 20, 2014, Hartford Investment Management has contractually agreed to reimburse expenses (exclusive of taxes, interest expense, brokerage commissions, acquired fund fees and expenses and extraordinary expenses) to the extent necessary to maintain total annual operating expenses for the Class IB shares of the HIMCO VIT Portfolio Diversifier Fund at the annual rate of 0.85% of average daily net assets. This contractual arrangement will remain in effect until April 30, 2016 and shall renew automatically for one-year terms, unless Hartford Investment Management provides written notice of termination prior to the start of the next term or upon approval by the Board of Trustees of the Fund.
| | b) | Accounting Services Agreement – Prior to October 20, 2014, pursuant to the Fund Accounting Agreement between HFMC and the Hartford Series Fund, Inc., on behalf of the Fund, HFMC provided accounting services to the Fund and received monthly compensation based on the Fund’s average daily net assets at the rates set forth below. The Fund’s accounting services fees were accrued daily and paid monthly. |
| | | | |
Average Daily Net Assets | | Annual Fee | |
On first $5 billion | | | 0.018% | |
On next $5 billion | | | 0.014% | |
Over $10 billion | | | 0.010% | |
Effective October 20, 2014, State Street Bank and Trust Company provides the Fund with accounting services pursuant to a fund accounting agreement by and between the Trust, on behalf of the Fund, and State Street Bank and Trust Company. The amount paid for accounting services can be found in the Statement of Operations. These fees are accrued daily and paid monthly.
|
| HIMCO VIT Portfolio Diversifier Fund |
Notes to Financial Statements – (continued)
December 31, 2014
| | c) | Operating Expenses – Allocable expenses incurred by the Trust are allocated to the Fund in proportion to the average daily net assets of the Fund, except where allocation of certain expenses is more fairly made directly to the Fund. |
| | d) | Distribution Plan for Class IB shares – Prior to October 20, 2014, Hartford Funds Distributors, LLC (“HFD”), an indirect, wholly owned, subsidiary of The Hartford, was the principal underwriter and distributor of the Fund. Effective October 20, 2014, HIMCO Distribution Services Company (“HDSC”), a wholly owned subsidiary of The Hartford, is the principal underwriter and distributor of the Fund. The Trust, on behalf of the Fund, has adopted a Distribution Plan pursuant to Rule 12b-1 of the 1940 Act for Class IB shares for services rendered and expenses borne in connection with activities primarily intended to result in the sale of the Class IB shares. |
The Distribution Plan provides that the Fund may pay annually up to 0.25% of the average daily net assets of the Fund attributable to its Class IB shares for activities primarily intended to result in the sale of Class IB shares. The Board of Trustees has the authority to suspend or reduce these payments at any point in time. Under the terms of the Distribution Plan and the principal underwriting agreement, the Fund is authorized to make payments monthly to the distributor that may be used to pay or reimburse entities providing distribution and shareholder servicing with respect to the Class IB shares for such entities’ fees or expenses incurred or paid in that regard. The distribution fee paid during the period can be found on the Statement of Operations. These fees are accrued daily and paid monthly or at such other intervals as the Board of Trustees may determine.
| | e) | Other Related Party Transactions – Prior to October 20, 2014, Hartford Administrative Services Company (“HASCO”), an indirect wholly owned subsidiary of The Hartford, provided transfer agent services to the Fund. HASCO was compensated on a per account basis for providing such services. Effective October 20, 2014, State Street Bank and Trust Company provides transfer agent services to the Fund. The transfer agent is reimbursed for out-of-pocket expenses and other costs associated with the services it provides to the Fund, including costs invoiced by sub-contractors. Hartford Investment Management and its affiliates may pay, out of their own assets, compensation to third-party administrators for recordkeeping and other administrative services. The amount paid for transfer agent services can be found in the Statement of Operations. These fees are accrued daily and paid monthly. |
| | f) | Trustee Fees – The Board of Trustees is responsible for oversight of the Fund. The Board of Trustees elects officers who are responsible for the day to day operations of the Fund. The Board of Trustees oversees the investment manager and the other principal service providers of the Fund. The Board of Trustees currently holds four regularly scheduled meetings throughout each year. In addition, the Board of Trustees may hold special meetings at other times either in person or by telephone. The Trustee fees paid during the period can be found in the Statement of Operations. |
As of December 31, 2014, affiliates of The Hartford had ownership of shares as a result of the seed money invested in the Fund as follows:
| | | | |
| | | Percentage
of Class | |
Class IB | | | 7.6% | |
| 9. | Investment Transactions: |
For the year ended December 31, 2014, the aggregate cost of purchases and proceeds from sales of investment securities (excluding short-term investments) were as follows:
| | | | |
| | | Amount | |
Cost of Purchases Excluding U.S. Government Obligations | | $ | 54,835,057 | |
Sales Proceeds Excluding U.S. Government Obligations | | | 62,428,393 | |
Cost of Purchases for U.S. Government Obligations | | | 38,883,394 | |
Sales Proceeds for U.S. Government Obligations | | | 43,368,033 | |
|
| HIMCO VIT Portfolio Diversifier Fund |
Notes to Financial Statements – (continued)
December 31, 2014
Reorganization of Hartford Portfolio Diversifier HLS Fund (the “PDF Fund”) into the Fund: At a meeting held on May 6, 2014, the Board of Directors of the PDF Fund approved on behalf of the PDF Fund, the reorganization of the PDF Fund, with and into the HIMCO VIT Portfolio Diversifier Fund (the “Fund”). The Fund is a newly organized series of the Trust.
Under the terms of the Agreement and Plan of Reorganization, the assets and liabilities of the PDF Fund were acquired by the Fund immediately before the opening of business on October 20, 2014. The Fund acquired the assets and liabilities of the PDF Fund in exchange for shares in the Fund, which were distributed pro rata by the PDF Fund to shareholders, in complete liquidation of the PDF Fund.
This merger was accomplished by tax free exchange as detailed below:
| | | | | | | | | | | | | | | | | | | | |
| | | Net assets of PDF
Fund on
October 17, 2014* | | | Net assets of
Fund
immediately
before merger | | | Net assets of
Fund
immediately
after merger | | | PDF Fund shares
exchanged | | | Fund
shares issued to the
PDF Fund’s
shareholders | |
| | | | | | | | | | | | | | | | | |
Class IB | | $ | 435,629,177 | | | $ | — | | | $ | 435,629,177 | | | | 53,740,506 | | | | 53,740,506 | |
| | | | | | | | | | | | | | | | | | | | |
| | * | Final day of operations prior to the merger. |
Assuming the acquisition had been completed on January 1, 2014, the beginning of the annual reporting period of the Fund, the Fund’s pro forma results of operations for the year ended December 31, 2014, are as follows:
| | | | | | | | | | | | | | | | |
| | | | | | | Net Investment
Income | | | Net Realized and
Unrealized gain
on investments | | | Net decrease in
net assets
resulting from
operations | |
The Fund | | | | | | $ | 2,561,870 | | | $ | 14,731,351 | | | $ | (8,756,326 | ) |
Because the combined investment portfolio has been managed as a singled integrated portfolio since the Reorganization was completed, it is not practicable to separate the amounts of revenue and earnings of the PDF Fund that have been included in the Statement of Operations since October 20, 2014.
| 11. | Appointment of Independent Registered Public Accounting Firm: |
In connection with an Agreement and Plan of Reorganization (the “Reorganization Plan”), the Board of Trustees of the Fund, with the approval and recommendation of the Audit Committee, appointed Deloitte & Touche LLP to serve as the Fund’s independent registered public accounting firm for the fiscal year ending December 31, 2014. Prior to the Reorganization, Ernst & Young LLP served as the PDF Fund’s independent registered public accounting firm, whereby Ernst & Young LLP completed the audit of the PDF Fund’s financial statements for the fiscal year ended December 31, 2013.
| 12. | Shareholder Meeting Results: |
A special meeting of Shareholders of the Fund was held on September 15, 2014 (“Shareholder Meeting”). The proposal was to approve the Reorganization Plan providing for the acquisition of all of the assets and liabilities of the PDF Fund by the Fund, a series of the Trust, solely in exchange for shares of the Fund, followed by the distribution on a pro rata basis of the Fund’s shares to current shareholders of the PDF Fund and the complete liquidation of the PDF Fund. The final results of the Shareholder Meeting are reported below:
| | | | | | |
For | | Against | | Abstain | | |
40,447,720 | | 1,996,716 | | 6,326,115 | |
| 13. | Recent Accounting Pronouncement: |
In June 2014, the Financial Accounting Standards Board (FASB) issued Accounting Standards Update (ASU) No. 2014-11, Transfers and Servicing (Topic 860): Repurchase-to-Maturity Transactions, Repurchase Financings, and Disclosures, modifying Accounting Standards Codification Topic 860. The amended guidance changes the accounting for repurchase-to-maturity transactions and repurchase financing arrangements. The guidance also requires new disclosures for certain transfers
|
| HIMCO VIT Portfolio Diversifier Fund |
Notes to Financial Statements – (concluded)
December 31, 2014
accounted for as sales and collateral supporting transactions that are accounted for as secured borrowings. ASU 2014-11 is effective for annual and interim periods beginning after December 15, 2014, except for the disclosures related to secured borrowings, which are effective for annual periods beginning after December 15, 2014, and for interim periods beginning after March 15, 2015. The adoption of ASU 2014-11 is not expected to have a material impact on the Fund’s results of operations or financial position, but may impact the Fund’s disclosures.
Under the Trust’s organizational documents, the Trust shall indemnify its officers and trustees to the full extent required or permitted under Delaware Statutory Trust Act and the federal securities laws. In addition, the Trust, on behalf of the Fund, may enter into contracts that contain a variety of indemnifications. The Trust’s maximum exposure under these arrangements is unknown. However, as of the date of these financial statements the Trust has not had prior claims or losses pursuant to these contracts and expects the risk of loss to be remote.
Management has evaluated the need for disclosures and/or adjustments resulting from subsequent events through the date the Financials Statements were issued. Based on this evaluation, no disclosures other than that noted above were required to the Financial Statements as of December 31, 2014.
|
| HIMCO VIT Portfolio Diversifier Fund |
Financial Highlights
| | | | | | | | | | | | | | | | | | | | | | | | | | | | | | | | | | | | | | | | | | | | | | | | | | | | |
| | | — Selected Per-Share Data(1) — | | | — Ratios and Supplemental Data — | |
Class | | Net Asset
Value at,
Beginning
of Period | | | Net
Investment
Income
(Loss) | | | Net
Realized
and
Unrealized
Gain (Loss)
on
Investments | | | Total from
Investment
Operations | | | Dividends
from Net
Investment
Income | | | Distributions
from
Realized
Gain
on
Investments | | | Total
Dividends
and
Distributions | | | Net
Asset
Value
End of
Period | | | Total
Return(2) | | | Net
Assets at
End of
Period
(000s) | | | Ratio of
Expenses
to
Average
Net
Assets
Before
Waivers(3) | | | Ratio of
Expenses
to
Average
Net
Assets
After
Waivers(3) | | | Ratio of
Net
Investment
Income
(Loss) to
Average
Net Assets | |
| HIMCO VIT Portfolio Diversifier Fund | | | | | | | | | | | | | | | | | | | | | | | | | | | | | | | | | | | | | | | | | |
For the Year Ended December 31, 2014 | | | | | | | | | | | | | | | | | | | | | | | | | | | | | | | | | | | | | | | | | |
IB | | $ | 8.13 | | | $ | 0.05 | | | $ | (0.21 | ) | | $ | (0.16 | ) | | $ | (0.06 | ) | | $ | — | | | $ | (0.06 | ) | | $ | 7.91 | | | | (2.03 | )% | | $ | 417,007 | | | | 0.90 | % | | | 0.85 | % | | | 0.59 | % |
| | | | | | | | | | |
For the Year Ended December 31, 2013(4) | | | | | | | | | | | | | | | | | | | | | | | | | | | | | | | | | | | | | | | | | |
IB | | $ | 9.38 | | | $ | 0.03 | | | $ | (1.25 | ) | | $ | (1.22 | ) | | $ | (0.03 | ) | | $ | — | | | $ | (0.03 | ) | | $ | 8.13 | | | | (12.96 | )% | | $ | 443,121 | | | | 0.89 | % | | | 0.85 | % | | | 0.29 | % |
| | | | | | | | | |
For the Year Ended December 31, 2012(4)(5) | | | | | | | | | | | | | | | | | | | | | | | | | | | | | | | | | | | | | |
IB | | $ | 10.18 | | | $ | 0.02 | | | $ | (0.79 | ) | | $ | (0.77 | ) | | $ | (0.03 | ) | | $ | — | | | $ | (0.03 | ) | | $ | 9.38 | | | | (7.58 | )% | | $ | 295,762 | | | | 0.91 | % | | | 0.85 | % | | | 0.27 | % |
| | | | | | | | | |
For the Year Ended December 31, 2011(4)(6) | | | | | | | | | | | | | | | | | | | | | | | | | | | | | | | | | | | | | |
IB | | $ | 10.00 | | | $ | 0.04 | | | $ | 0.19 | | | $ | 0.23 | | | $ | (0.03 | ) | | $ | (0.02 | ) | | $ | (0.05 | ) | | $ | 10.18 | | | | 2.38 | (7)% | | $ | 106,581 | | | | 0.93 | (8)% | | | 0.85 | (8)% | | | 0.58 | (8)% |
| (1) | Information presented relates to a share outstanding throughout the indicated period. Net investment income (loss) per share amounts are calculated based on average shares outstanding unless otherwise noted. |
| (2) | The figures do not include sales charges or other fees which may be applied at the variable life insurance, variable annuity or qualified retirement plan product level. Any such additional sales charges or other fees would lower the Fund’s performance. |
| (3) | Adjustments include waivers and reimbursements, if applicable. |
| (4) | See Note 11 in the accompanying Notes to Financial Statements. |
| (5) | Net investment income (loss) per share amounts have been calculated using the SEC method. |
| (6) | Commenced operations on June 6, 2011. |
| | | | |
| | | Portfolio Turnover
Rate for
All Share Classes | |
For the year ended December 31, 2014 | | | 33 | % |
For the year ended December 31, 2013(1) | | | 31 | |
For the year ended December 31, 2012(1) | | | 61 | |
From June 6, 2011 (commencement of operations) through December 31, 2011(1) | | | 43 | |
| (1) | See Note 11 in the accompanying Notes to Financial Statements. |
|
| Report of Independent Registered Public Accounting Firm |
To the Board of Trustees of HIMCO Variable Insurance Trust and the Shareholders of HIMCO VIT Portfolio Diversifier Fund (formerly Hartford Portfolio Diversifier HLS Fund)
We have audited the accompanying statement of assets and liabilities, including the schedule of investments, of HIMCO VIT Portfolio Diversifier Fund (formerly Hartford Portfolio Diversifier HLS Fund) (the “Fund”), a series of the HIMCO Variable Insurance Trust, as of December 31, 2014, and the related statement of operations, statement of changes in net assets, and the financial highlights for the year then ended. These financial statements and financial highlights are the responsibility of the Fund’s management. Our responsibility is to express an opinion on these financial statements and financial highlights based on our audit. The statement of changes in net assets of the Fund for the year ended December 31, 2013 and the financial highlights for each of the two years in the period then ended and for the period from June 6, 2011 (commencement of operations) to December 31, 2011 were audited by other auditors whose report, dated February 17, 2014, expressed an unqualified opinion on that statement and financial highlights.
We conducted our audit in accordance with the standards of the Public Company Accounting Oversight Board (United States). Those standards require that we plan and perform the audit to obtain reasonable assurance about whether the financial statements and financial highlights are free of material misstatement. The Fund is not required to have, nor were we engaged to perform, an audit of its internal control over financial reporting. Our audit included consideration of internal control over financial reporting as a basis for designing audit procedures that are appropriate in the circumstances, but not for the purpose of expressing an opinion on the effectiveness of the Fund’s internal control over financial reporting. Accordingly, we express no such opinion. An audit also includes examining, on a test basis, evidence supporting the amounts and disclosures in the financial statements, assessing the accounting principles used and significant estimates made by management, as well as evaluating the overall financial statement presentation. Our procedures included confirmation of securities owned as of December 31, 2014, by correspondence with the custodians and brokers; when replies were not received from brokers, we performed other auditing procedures. We believe that our audit provides a reasonable basis for our opinion.
In our opinion, the financial statements and financial highlights referred to above present fairly, in all material respects, the financial position of HIMCO VIT Portfolio Diversifier Fund (formerly Hartford Portfolio Diversifier HLS Fund), a series of the HIMCO Variable Insurance Trust, as of December 31, 2014, the results of its operations, the changes in its net assets, and the financial highlights for the year then ended, in conformity with accounting principles generally accepted in the United States of America.
Deloitte & Touche LLP
Boston, Massachusetts
February 17, 2015
|
| HIMCO VIT Portfolio Diversifier Fund |
Trustee and Officers (Unaudited)
The Board of Trustees and officers of the Trust, their business addresses, principal occupations for at least the past five years and years of birth are listed in the tables below. The Trust’s Board of Trustees (i) provides broad supervision over the affairs of the Trust the Fund and (ii) elects officers who are responsible for the day-to-day operations of the Fund and the execution of policies formulated by the Board of Trustees. The first table below provides information about those trustees who are deemed not to be “interested persons” of the Trust, as that term is defined in the 1940 Act (i.e., “non-interested trustees”), while the second table below provides information about the Trust’s “interested” trustees and the Trust’s officers.
Non-Interested Trustees
| | | | | | | | | | |
| Birth and Address | | Position Held
with the Trust | | Term of Office*
and Length of
Time Served | | Principal Occupation(s)
During Past 5 Years | | Number of
Portfolios
in Fund
Complex
Overseen
by Trustee | | Other Directorships for
Public Companies and Other
Registered Investment
Companies Held by Trustee |
PAUL BRAVERMAN** (1949) c/o Hartford Investment Management Company One Hartford Plaza Hartford, CT 06155 | | Trustee | | Since 2014 | | Mr. Braverman is a private investor. He was a Partner and Chief Financial Officer of Wellington Management Company, LLP until 2007. He currently serves as a board member at Aesir Capital Management and Claren Road Asset Management, investment advisory firms, MPAM USS Credit Fund, a Cayman private fund, and the New England Conservatory. | | 13 | | Mr. Braverman currently serves as Director of Courier Corporation and as an Independent Trustee of GMO Trust (December 2008 to present) (54 funds overseen). |
| | | | | |
MARK OSTERHELD (1955) c/o Hartford Investment Management Company One Hartford Plaza Hartford, CT 06155 | | Trustee | | Since 2014 | | Mr. Osterheld is a private investor. Mr. Osterheld was Vice President of Treasury Oversight at Fidelity Investments until 2013. | | 13 | | None. |
| | | | | |
VANESSA WILSON (1959) c/o Hartford Investment Management Company One Hartford Plaza Hartford, CT 06155 | | Trustee | | Since 2014 | | Ms. Wilson is Chief Financial Officer and Managing Director of Golden Seeds LLC, a venture capital firm. Ms. Wilson worked for Deutsche Bank Securities until 2007, where she was a Managing Director and an equity research analyst. | | 13 | | Ms. Wilson currently serves as Director of Protective Life Corporation. |
| * | Term of Office: Each trustee may serve until his or her successor is elected and qualifies. |
| ** | “Interested person”, as defined in the 1940 Act, of the Trust for a portion of 2014 because of the person’s beneficial equity ownership of The Hartford Financial Services Group, Inc., an affiliate of Hartford Investment Management. |
|
| HIMCO VIT Portfolio Diversifier Fund |
Trustee and Officers (Unaudited) – (continued)
Officers and Interested Trustees
| | | | | | | | | | |
Name, Year of Birth
and Address | | Position Held
with the Trust | | Term of Office*
and Length of
Time Served | | Principal Occupation(s)
During Past 5 Years | | Number of
Portfolios
in Fund
Complex
Overseen
by Trustee | | Other Directorships
Held by Trustee |
BRION JOHNSON** (1960) c/o Hartford Investment Management Company One Hartford Plaza Hartford, CT 06155 | | Trustee and Chairman of the Board | | Since 2014 | | Mr. Johnson serves as President of Hartford Investment Management and Talcott Resolution a segment of The Hartford. From 2011 to 2012, Mr. Johnson served as a Managing Director, Chief Financial Officer and Head of Strategy and Development for Hartford Investment Management. Prior to joining Hartford Investment Management, Mr. Johnson served as Managing Member of Shoreline Arts and Publishing, LLC, a publishing and marketing business. From 2001 to 2008, Mr. Johnson was Executive Vice President and Head of Portfolio Management of PPM America, an affiliate of Prudential, plc. | | 13 | | None. |
| | | | | |
HUGH WHELAN** (1960) c/o Hartford Investment Management Company One Hartford Plaza Hartford, CT 06155 | | Trustee | | Since 2014 | | Mr. Whelan is a private investor. Mr. Whelan was the Head of Quantitative Equities and Interim President of Hartford Investment Management until 2012. Prior to joining Hartford Investment Management, Mr. Whelan was the Head of Quantitative Equities at ING Investment Management from 2001 to 2005. | | 13 | | None. |
| | | | | |
PETER SANNIZZARO (1966) c/o Hartford Investment Management Company One Hartford Plaza Hartford, CT 06155 | | Treasurer | | Since 2014 | | Mr. Sannizzaro currently serves as Senior Vice President and Chief Financial Officer Hartford Life Insurance Company (“Hartford Life”) and Hartford Investment Management. From 2011 to 2014, Mr. Sannizzaro served as Senior Vice President of Hartford Life and Chief Financial Officer to various divisions within Hartford Life. From 2008 to 2011, Mr. Sannizzaro served as a Vice President of Finance Executive Management at Hartford Life. | | N/A | | N/A |
| | | | | |
ROBERT LEWTON (1971) c/o Hartford Investment Management Company One Hartford Plaza Hartford, CT 06155 | | Chief Compliance Officer | | Since 2014 | | Mr. Lewton currently serves as Chief Compliance Officer of Hartford Investment Management Company. Prior to 2010, he served as Senior Counsel in the Investment Law Group at Hartford Investment Management Company. | | N/A | | N/A |
| | | | | |
BRENDA PAGE (1965) c/o Hartford Investment Management Company One Hartford Plaza Hartford, CT 06155 | | Secretary | | Since 2014 | | Ms. Page currently serves as Vice President and Assistant General Counsel of The Hartford and Director of the Investment Law Group of Hartford Investment Management. | | N/A | | N/A |
| * | Term of Office: Each officer and Trustee may serve until his or her successor is elected and qualifies. |
| ** | “Interested person”, as defined in the 1940 Act, of the Trust because of the person’s affiliation with, or equity ownership of, Hartford Investment Management or affiliated companies. |
|
| HIMCO VIT Portfolio Diversifier Fund |
Trustee and Officers (Unaudited) – (concluded)
| | | | | | | | | | |
Name, Year of Birth
and Address | | Position Held
with the Trust | | Term of Office*
and Length of
Time Served | | Principal Occupation(s)
During Past 5 Years | | Number of
Portfolios
in Fund
Complex
Overseen
by Trustee | | Other Directorships
Held by Trustee |
MATTHEW POZNAR (1959) c/o Hartford Investment Management Company One Hartford Plaza Hartford, CT 06155 | | President | | Since 2014 | | Mr. Poznar currently serves as an Executive Vice President in the General Account Portfolio Management Group of Hartford Investment Management. | | N/A | | N/A |
HOW TO OBTAIN A COPY OF THE FUND’S PROXY VOTING POLICIES AND VOTING RECORDS (UNAUDITED)
A description of the policies and procedures that the Fund uses to determine how to vote proxies relating to portfolio securities and information about how the Fund voted proxies relating to portfolio securities during the most recent twelve-month period ended June 30 are available (1) without charge, upon request, by calling 888-843-7824 and (2) on the SEC’s website at http://www.sec.gov.
QUARTERLY PORTFOLIO HOLDINGS INFORMATION (UNAUDITED)
The Fund files a complete schedule of portfolio holdings with the SEC for the first and third quarters of each fiscal year on Form N-Q. The Fund’s Forms N-Q are available (1) without charge, upon request, by calling 888-843-7824 and (2) on the SEC’s website at http://www.sec.gov. The Form N-Q may be reviewed and copied at the SEC’s Public Reference Room in Washington, DC. Information on the operation of the Public Reference Room may be obtained by calling 1-800-SEC-0330.
| * | Term of Office: Each officer and Trustee may serve until his or her successor is elected and qualifies. |
|
| HIMCO VIT Portfolio Diversifier Fund |
Expense Example (Unaudited)
Your Fund’s Expenses
As a shareholder of a Fund, you incur two types of costs: (1) transaction costs and (2) ongoing costs, including investment management fees, distribution and/or service (12b-1) fees, if any, and other fund expenses. This example is intended to help you understand your ongoing costs (in dollars) of investing in a Fund and to compare these costs with the ongoing costs of investing in other mutual funds. The example is based on an investment of $1,000 invested at the beginning of the period and held for the entire period of July 1, 2014 through December 31, 2014.
Actual Expenses
The first set of rows of the table below provides information about actual account values and actual expenses. You may use the information in this row, together with the amount you invested, to estimate the expenses that you paid over the period. Simply divide your account value by $1,000 (for example, an $8,600 account value divided by $1,000 = 8.6), then multiply the result by the number in the line under the heading entitled “Expenses Paid During Period” to estimate the expenses you paid on your account during this period.
Hypothetical Example for Comparison Purposes
The second set of rows of the table below provides information about hypothetical account values and hypothetical expenses based on a Fund’s actual expense ratio and an assumed rate of return of 5% per year before expenses, which is not the Fund’s actual return. The hypothetical account values and expenses may not be used to estimate the actual ending account balance or expenses you paid for the period. You may use this information to compare the ongoing costs of investing in a Fund and other funds. To do so, compare this 5% hypothetical example with the 5% hypothetical examples that appear in the shareholder reports of the other funds.
Please note that the expenses shown in the table are meant to highlight your ongoing costs only and do not reflect any transactional costs, such as sales charges (loads) or fees which may be applied at the variable life insurance, variable annuity, or qualified retirement plan product level. Therefore, the second set of rows of the table is useful in comparing ongoing costs only, and will not help you determine the relative total costs of owning different funds. In addition, if these transactional costs were included, your costs would be higher.
| | | | | | | | | | | | | | | | |
| | | Beginning
Account Value
7/1/14 | | | Ending
Account Value
12/31/14 | | | Expenses Paid
During Period
7/1/14 - 12/31/14 | | | Annualized
Expense Ratio | |
Actual | | | | | | | | | | | | | | | | |
Class IB | | $ | 1,000 | | | $ | 988.20 | | | $ | 4.21 | | | | 0.84 | % |
Hypothetical | | | | | | | | | | | | | | | | |
Class IB | | $ | 1,000 | | | $ | 1,020.97 | | | $ | 4.28 | | | | 0.84 | % |
| * | Expenses are equal to the class’s annualized expense ratio listed in the table above, multiplied by the average account value over the period, multiplied by 184, the number of days in the most recent fiscal half-year, divided by 365, to reflect the one-half year period. |
|
| HIMCO VIT Portfolio Diversifier Fund |
Approval of New Investment Management Agreement (Unaudited)
Section 15(c) of the Investment Company Act of 1940, as amended (the “1940 Act”), requires that each mutual fund’s board of trustees, including a majority of those trustees who are not “interested persons” of the mutual fund, as defined in the 1940 Act (the “Independent Trustees”), initially approve, and annually review and consider the continuation of, the mutual fund’s investment advisory agreement. At its meeting held on April 30, 2014, the Board of Trustees (the “Board”) of HIMCO Variable Insurance Trust (“HVIT”), including each of the Independent Trustees, unanimously voted to approve an investment management agreement for the Fund with Hartford Investment Management Company (“HIMCO” or the “Adviser”) (the “Agreement”).
Prior to approving the Agreement, the Board requested, received and reviewed written responses from the Adviser to questions posed to the Adviser on behalf of the Trustees and supporting materials relating to those questions and responses.
The Board noted that shareholders of the Hartford Portfolio Diversifier HLS Fund (the “HLS Fund”), a series of Hartford Series Fund, Inc. (“HSF”), would be asked to approve the reorganization of the HLS Fund into the Fund (the “Reorganization”), with the closing of the Reorganization expected to occur in October 2014.
In determining whether to approve the Agreement for the Fund, the members of the Board reviewed and evaluated information and factors they believed to be relevant and appropriate in light of the information that the Board deemed necessary and appropriate through the exercise of its reasonable business judgment. While individual members of the Board may have weighed certain factors differently, the Board’s determination to approve the Agreement was based on a comprehensive consideration of all information provided to the Board with respect to the approval of the Agreement. A more detailed discussion of the factors the Board considered with respect to its approval of the Agreement is provided below.
Nature, Extent and Quality of Services to be Provided by the Adviser
The Board requested and considered information concerning the nature, extent and quality of the services to be provided to the Fund by the Adviser. In this regard, the Board considered HIMCO’s responsibilities under the Agreement including, among other things, managing the Fund’s assets, assuring compliance with the Fund’s investment objective and limitations, and coordinating services for the Fund among service providers. The Board also discussed the services provided by HIMCO as sub-adviser to the HLS Fund and the benefits to be derived from continuity of investment management services following the Reorganization. The Board considered the Adviser’s organizational structure, systems and personnel as well as the Adviser’s reputation and overall financial strength. Based on these considerations, the Board concluded that it was satisfied with the nature, extent and quality of the services to be provided to the Fund by HIMCO.
Performance of the Fund
The Board considered that the Fund is newly formed and did not have a prior performance record. The Board received presentations from HIMCO regarding the portfolio management team and the investment strategy to be employed in the management of the Fund’s assets. The Board noted that HIMCO served as investment sub-adviser to the HLS Fund and would manage the Fund pursuant to a substantially similar investment objective and strategy. The Board also reviewed the performance track record of the HLS Fund. Based on these considerations, the Board concluded that it was satisfied that HIMCO has the capability of providing satisfactory investment performance for the Fund.
Comparison of Fees and Expenses
The Board requested and reviewed information from HIMCO relating to the proposed management fee and total operating expenses of the Fund. In this regard, the Board reviewed comparisons of the Fund’s proposed management fee and anticipated expense ratio to the management fees and expense ratios of a comparable group of funds previously selected by Lipper, Inc. to assist the board of directors of HSF (the “HSF Board”) in reviewing the HLS Fund’s fees and expenses. The Board noted that the Fund’s management fee schedule and total operating expenses would be consistent with those previously reviewed and approved by the HSF Board and that the Fund would experience the same expense ratio as the HLS Fund through April 30, 2016 due to an expense cap. Based on these considerations, the Board concluded that the Fund’s proposed fees and total operating expenses, in conjunction with the information about quality of services, profitability, economies of scale, and other matters discussed, were reasonable in light of the services to be provided.
|
| HIMCO VIT Portfolio Diversifier Fund |
Approval of New Investment Management Agreement (Unaudited) – (concluded)
Economies of Scale
The Board discussed HIMCO’s expectations for growth in assets under management and the extent to which economies of scale would be realized over time. The Board considered that since the Fund had not yet commenced operations, material economies of scale may not be achieved in the near term. The Board noted that shareholders of the Fund would benefit from the expense limitation arrangement proposed for the Fund. The Board also considered how any benefits from economies of scale would be realized by the various parties. Based on these considerations, the Board concluded that it was satisfied with the extent to which economies of scale could be expected to be shared for the benefit of the Fund’s future shareholders.
Profitability of the Adviser
The Board considered the level of profits that could be expected to accrue to HMCO with respect to the Fund, including HIMCO’s estimated costs to provide investment management and related services. The Board noted that HIMCO’s actual profitability with respect to the Fund would depend on growth in assets under management. Based on these considerations, the Board concluded that the profits anticipated to be realized by HIMCO and its affiliates from their relationships with the Fund would not be excessive.
Other Benefits
The Board considered other benefits to the Adviser and its affiliates from their relationships with the Fund. The Board also considered that HDSC, an affiliate of HIMCO, will serve as principal underwriter of the Fund. As principal underwriter, HDSC would receive 12b-1 fees from the Fund.
* * * *
Based upon its review of these various factors, among others, the Board concluded that it is in the best interests of the Fund and its shareholders for the Board to approve the Agreement. In reaching this decision, the Board did not assign relative weights to the factors discussed above or deem any one or group of them to be controlling in and of themselves. In connection with their deliberations, the Independent Trustees met separately in executive session with legal counsel to review the relevant materials and consider their responsibilities under relevant laws and regulations.
THIS PRIVACY POLICY IS NOT PART OF THIS REPORT
Privacy Policy and Practices of The Hartford Financial Services Group, Inc. and its Affiliates
(herein called “we, our and us”)
This Privacy Policy applies to our United States Operations
We value your trust. We are committed to the responsible:
a) management;
b) use; and
c) protection;
of Personal Information.
This notice describes how we collect, disclose, and protect Personal Information.
We collect Personal Information to:
a) service your Transactions with us; and
b) support our business functions.
We may obtain Personal Information from:
a) You;
b) your Transactions with us; and
c) third parties such as a consumer-reporting agency.
Based on the type of product or service You apply for or get from us, Personal Information such as:
a) your name;
b) your address;
c) your income;
d) your payment; or
e) your credit history;
may be gathered from sources such as applications, Transactions, and consumer reports.
To serve You and service our business, we may share certain Personal Information. We will share Personal Information, only as allowed by law, with affiliates such as:
a) our insurance companies;
b) our employee agents;
c) our brokerage firms; and
d) our administrators.
As allowed by law, we may share Personal Financial Information with our affiliates to:
a) market our products; or
b) market our services;
to You without providing You with an option to prevent these disclosures.
We may also share Personal Information, only as allowed by law, with unaffiliated third parties including:
a) independent agents;
b) brokerage firms;
c) insurance companies;
d) administrators; and
e) service providers;
who help us serve You and service our business.
When allowed by law, we may share certain Personal Financial Information with other unaffiliated third parties who assist us by performing services or functions such as:
a) taking surveys;
b) marketing our products or services; or
c) offering financial products or services under a joint agreement between us and one or more financial institutions.
We, and third parties we partner with, may track some of the pages You visit through the use of:
a) cookies;
b) pixel tagging; or
c) other technologies;
and currently do not process or comply with any web browser’s “do not track” signal or other similar mechanism that indicates a request to disable online tracking of individual users who visit our websites or use our services.
We will not sell or share your Personal Financial Information with anyone for purposes unrelated to our business functions without offering You the opportunity to:
a) “opt-out;” or
b) “opt-in;”
as required by law.
We only disclose Personal Health Information with:
a) your proper written authorization; or
b) as otherwise allowed or required by law.
Our employees have access to Personal Information in the course of doing their jobs, such as:
a) underwriting policies;
b) paying claims;
c) developing new products; or
d) advising customers of our products and services.
We use manual and electronic security procedures to maintain:
a) the confidentiality; and
b) the integrity of;
Personal Information that we have. We use these procedures to guard against unauthorized access.
Some techniques we use to protect Personal Information include:
a) secured files;
b) user authentication;
c) encryption;
d) firewall technology; and
e) the use of detection software.
We are responsible for and must:
a) identify information to be protected;
b) provide an adequate level of protection for that data;
c) grant access to protected data only to those people who must use it in the performance of their job-related duties.
Employees who violate our Privacy Policy will be subject to discipline, which may include ending their employment with us.
At the start of our business relationship, we will give You a copy of our current Privacy Policy.
We will also give You a copy of our current Privacy Policy once a year if You maintain a continuing business relationship with us.
We will continue to follow our Privacy Policy regarding Personal Information even when a business relationship no longer exists between us.
As used in this Privacy Notice:
Application means your request for our product or service.
Personal Financial Information means financial information such as:
a) credit history;
b) income;
c) financial benefits; or
d) policy or claim information.
Personal Health Information means health information such as:
a) your medical records; or
b) information about your illness, disability or injury.
Personal Information means information that identifies You personally and is not otherwise available to the public. It includes:
a) Personal Financial Information; and
b) Personal Health Information .
Transaction means your business dealings with us, such as:
a) your Application;
b) your request for us to pay a claim; and
c) your request for us to take an action on your account.
You means an individual who has given us Personal Information in conjunction with:
a) asking about;
b) applying for; or
c) obtaining;
a financial product or service from us if the product or service is used mainly for personal, family, or household purposes.
This Privacy Policy is being provided on behalf of the following affiliates of The Hartford Financial Services Group, Inc.: 1stAGChoice, Inc.; Access CoverageCorp, Inc.; Access CoverageCorp Technologies, Inc.; American Maturity Life Insurance Company; Archway 60 R, LLC; Business Management Group, Inc.; DMS R, LLC; First State Insurance Company; Fountain Investors I LLC; Fountain Investors II LLC; Fountain Investors III LLC; Fountain Investors IV LLC; FTC Resolution Company LLC; Hart Re Group L.L.C.; Hartford Accident and Indemnity Company; Hartford Administrative Services Company; Hartford Casualty General Agency, Inc.; Hartford Casualty Insurance Company; Hartford Financial Services, LLC; Hartford Fire General Agency, Inc.; Hartford Fire Insurance Company; Hartford Funds Distributors, LLC; Hartford Funds Management Company, LLC; Hartford Funds Management Group, Inc.; Hartford Holdings, Inc.; Hartford HLS Series Fund II, Inc.; Hartford Insurance Company of Illinois; Hartford Insurance Company of the Midwest; Hartford Insurance Company of the Southeast; Hartford Integrated Technologies, Inc.; Hartford International Life Reassurance Corporation; Hartford Investment Management Company; Hartford Life and Accident Insurance Company; Hartford Life and Annuity Insurance Company; Hartford Life Insurance Company; Hartford Life, Inc.; Hartford Life International Holding Company; Hartford Life Private Placement, LLC; Hartford Lloyd’s Corporation; Hartford Lloyd’s Insurance Company; Hartford of Texas General Agency, Inc.; Hartford Residual Market, L.C.C.; Hartford Securities Distribution Company, Inc.; Hartford Series Fund, Inc.; Hartford Specialty Insurance Services of Texas, LLC; Hartford Strategic Investments, LLC; Hartford Underwriters General Agency, Inc.; Hartford Underwriters Insurance Company; Hartford-Comprehensive Employee Benefit Service Company; HDC R, LLC .; Heritage Holdings, Inc.; HIMCO Distribution Services Company; HIMCO Variable Insurance Trust; HLA LLC; HL Investment Advisors, LLC; Horizon Management Group, LLC; HRA Brokerage Services, Inc.; Lanidex Class B, LLC; New England Insurance Company; New England Reinsurance Corporation; Nutmeg Insurance Agency, Inc.; Nutmeg Insurance Company; Pacific Insurance Company, Limited; Planco, LLC; Property and Casualty Insurance Company of Hartford; Revere R, LLC; RVR R, LLC; Sentinel Insurance Company, Ltd.; Sunstone R, LLC; Symphony R, LLC; The Evergreen Group Incorporated; The Hartford Alternative Strategies Fund; The Hartford Mutual Funds, Inc.; The Hartford Mutual Funds II, Inc.; Trumbull Flood Management, L.L.C.; Trumbull Insurance Company; Twin City Fire Insurance Company.
HPP Revised February 2015

A MESSAGE FROM THE PRESIDENT
Dear Shareholders:
Thank you for investing in the HIMCO Variable Insurance Trust (HVIT) funds.
Market Review
U.S. equity and bond markets continued to perform well in 2014. U.S. equities (as represented by the S&P 500 Index1) rose 13.69% for the year, while U.S. bonds (as
represented by the Barclays U.S. Aggregate Bond Index2) rose 5.97%. International markets did not fare as well.
The S&P 500 Index ended the year slightly below its all-time high reached on December 29, 2014. Solid corporate earnings and encouraging U.S. macroeconomic data overcame geopolitical tensions and reduced prospects for growth outside the U.S. The U.S. unemployment rate fell during the year to 5.6%, the lowest level since June 2008. On average nearly 250,000 new jobs were created every month in 2014, 50,000 more per month than in 2013. In the third quarter of 2014, gross domestic product, the most recognized measure of economic growth, rose 5%. The price of a barrel of oil fell nearly 50% during the second half of the year, driving down gasoline prices and providing a lift to consumer spending.
U.S. bond prices benefited from continued low interest rates (bond prices move in the opposite direction of interest rates). Many market participants expected rates to increase as the economy improved and the U.S. Federal Reserve ended quantitative easing. However, sub-par growth in the eurozone and Japan, combined with diminished growth in China, have helped dampen interest rates. Central bankers outside the U.S. are engaging in quantitative easing programs to help stimulate growth, but these moves may also further lower local interest rates and thus increase demand for higher yielding U.S. Treasuries. Weaker growth in the rest of the world may also slow U.S. growth. These outcomes could help keep U.S. interest rates lower for longer.
Looking ahead to 2015, we expect the pace of U.S. growth relative to other economies, along with the actions of central bankers around the world, to be themes of keen interest to investors.
Preparation for whatever markets may deliver is no easy task, and that is why you should consider regular reviews with your financial advisor.
Thank you again for investing with the HIMCO Variable Insurance Trust funds.

Matthew J. Poznar,
President, HVIT
| 1 | The S&P 500 Index is a market capitalization-weighted price index composed of 500 widely held common stocks. |
| 2 | The Barclays U.S. Aggregate Bond Index is an unmanaged index and is composed of securities from the Barclays Government/Credit Bond Index, Mortgage-Backed Securities Index, Asset-Backed Securities Index and Commercial Mortgage-Backed Securities Index. |
HIMCO Variable Insurance Trust
Table of Contents
This report is prepared for the general information of variable annuity contract owners and is not an offer of contracts. It should not be used in connection with any offer, except in conjunction which the appropriate product prospectus which contains all pertinent product information including the applicable sales, administrative and other charges.
HIMCO VIT American Funds Asset Allocation Fund
| | |
(Effective October 20, 2014, American Funds Asset Allocation HLS Fund (the “Predecessor Fund”) was reorganized into HIMCO VIT American Funds Asset Allocation Fund (the “Fund”).) (The Fund is advised by Hartford Investment Management Company (“Hartford Investment Management”)) | | Investment Goal: Seeks high total return (including income and capital gains) consistent with preservation of capital over the long term. |
Performance information for periods prior to October 20, 2014 is that of the Predecessor Fund. Hartford Funds Management Company, LLC served as the investment manager to the Predecessor Fund and Hartford Investment Management, the Fund’s adviser, served as sub-adviser to the Predecessor Fund. The Predecessor Fund had the same investment objective and strategies as the Fund.
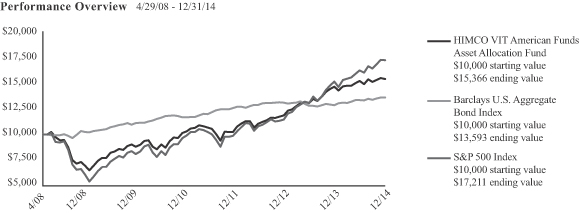
The chart above represents the hypothetical growth of a $10,000 investment in Class IB.
Average Annual Total Returns (as of 12/31/14)
| | | | | | | | | | | | |
| | | 1 Year | | | 5 Years | | | Since
Inception* | |
HIMCO VIT American Funds Asset Allocation Fund IB | | | 5.05% | | | | 11.20% | | | | 6.65% | |
Barclays U.S. Aggregate Bond Index | | | 5.97% | | | | 4.45% | | | | 4.76% | |
S&P 500 Index | | | 13.69% | | | | 15.45% | | | | 8.41% | |
PERFORMANCE DATA QUOTED REPRESENTS PAST PERFORMANCE AND DOES NOT GUARANTEE FUTURE RESULTS. The investment return and principal value of the investment will fluctuate so that investors’ shares, when redeemed, may be worth more or less than their original cost. Current performance may be lower or higher than the performance data quoted.
Total returns presented above were calculated using the Fund’s net asset value available to shareholders for sale or redemption of Fund shares on December 31, 2014, which may exclude investment transactions as of this date. All share class returns assume the reinvestment of all distributions at net asset value and the deduction of all fund expenses.
Barclays U.S. Aggregate Bond Index represents the U.S. investment-grade fixed-rate bond market.
S&P 500 Index is a market capitalization-weighted price index composed of 500 widely held common stocks.
The indices are unmanaged, and their results include reinvested dividends and/or distributions, but do not reflect the effect of sales charges, commissions, expenses or taxes.
You cannot invest directly in an index.
As shown in the Fund’s current prospectus dated October 20, 2014, the net total annual operating expense ratio for Class IB shares was 0.86% and the gross total annual operating expense ratio for Class IB shares was 1.30%. Actual expenses may be higher. Please see the accompanying Financial Highlights for expense ratios for the year ended December 31, 2014.
Net operating expenses are the expenses paid to own the Fund. If the net operating expenses shown are lower than the gross operating expenses, then the net operating expenses reflect contractual fee waivers and expense reimbursements that may not be renewed. Contractual waivers or reimbursements remain in effect for as long as the Fund is a part of a master-feeder fund structure unless terminated or changed by the Fund or its Board of Trustees if the fund structure changes. For more information about the fee arrangement and expiration dates, please see the expense table in the prospectus.
Gross operating expenses shown are before management fee waivers or expense caps. Performance information may reflect historical or current expense waivers or reimbursements, without which, performance would have been lower. For more information on fee waivers and/or expense reimbursements, please see the expense table in the prospectus.
The chart and table do not reflect the deductions of taxes, sales charges or other fees which may be applied at the variable life insurance, variable annuity or qualified retirement plan product level. Any such additional sales charges or other fees or expenses would lower the contract’s or plan’s performance.
All investments are subject to risk including the possible loss of principal. For a discussion of the Fund’s risks, please see the Main Risks section of this report. For more detailed information on the risks associated with an investment in the Fund, please see the prospectus.
The S&P 500 Index is a product of S&P Dow Jones Indices LLC (“SPDJI”), and has been licensed for use by HIMCO Variable Insurance Trust. Standard & Poor’s® and S&P® are registered trademarks of Standard & Poor’s Financial Services LLC (“S&P”); Dow Jones® is a registered trademark of Dow Jones Trademark Holdings LLC (“Dow Jones”); and these trademarks have been licensed for use by SPDJI and sublicensed for certain purposes by HIMCO Variable Insurance Trust. The Fund is not sponsored, endorsed, sold or promoted by SPDJI, Dow Jones, S&P, their respective affiliates, and none of such parties make any representation regarding the advisability of investing in such product(s) nor do they have any liability for any errors, omissions, or interruptions of the S&P 500 Index.
How did the Fund perform?
The Class IB shares of the HIMCO VIT American Funds Asset Allocation Fund returned 5.05% for the year ended December 31, 2014, versus the returns of 13.69% for the S&P 500 Index and 5.97% for the Barclays U.S. Aggregate Bond Index. The Fund underperformed the 6.05% average return of the Variable Products-Underlying Funds Lipper Mixed-Asset Target Allocation Growth Funds peer group, a group of funds with investment strategies similar to those of the Fund.
The performance of the HIMCO VIT American Funds Asset Allocation Fund is directly related to the performance of the American Funds Insurance Series – Asset Allocation Fund Class 1, in which the Fund invests. The financial statements of the American Funds Insurance Series – Asset Allocation Fund Class 1, including the Summary Investment Portfolio, are provided separately and should be read in conjunction with the HIMCO VIT American Funds Asset Allocation Fund’s financial statements.
HIMCO VIT American Funds Blue Chip Income and Growth Fund
| | |
(Effective October 20, 2014, American Funds Blue Chip Income and Growth HLS Fund (the “Predecessor Fund”) was reorganized into HIMCO VIT American Funds Blue Chip Income and Growth Fund (the “Fund”).) (The Fund is advised by Hartford Investment Management) | | Investment Goal: Seeks to produce income exceeding the average yield on U.S. stocks generally and to provide an opportunity for growth of principal consistent with sound common stock investing. |
Performance information for periods prior to October 20, 2014 is that of the Predecessor Fund. Hartford Funds Management Company, LLC served as the investment manager to the Predecessor Fund and Hartford Investment Management, the Fund’s adviser, served as sub-adviser to the Predecessor Fund. The Predecessor Fund had the same investment objective and strategies as the Fund.
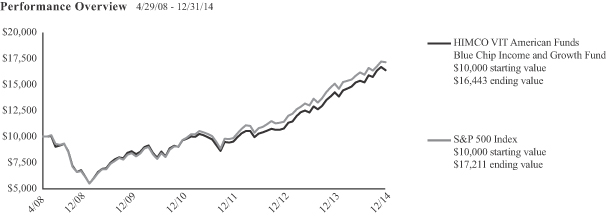
The chart above represents the hypothetical growth of a $10,000 investment in Class IB.
Average Annual Total Returns (as of 12/31/14)
| | | | | | | | | | | | |
| | | 1 Year | | | 5 Years | | | Since
Inception* | |
HIMCO VIT American Funds Blue Chip Income and Growth Fund IB | | | 15.02% | | | | 13.88% | | | | 7.74% | |
S&P 500 Index | | | 13.69% | | | | 15.45% | | | | 8.41% | |
PERFORMANCE DATA QUOTED REPRESENTS PAST PERFORMANCE AND DOES NOT GUARANTEE FUTURE RESULTS. The investment return and principal value of the investment will fluctuate so that investors’ shares, when redeemed, may be worth more or less than their original cost. Current performance may be lower or higher than the performance data quoted.
Total returns presented above were calculated using the Fund’s net asset value available to shareholders for sale or redemption of Fund shares on December 31, 2014, which may exclude investment transactions as of this date. All share class returns assume the reinvestment of all distributions at net asset value and the deduction of all fund expenses.
S&P 500 Index is a market capitalization-weighted price index composed of 500 widely held common stocks.
The index is unmanaged, and its results included reinvested dividends and/or distributions, but do not reflect the effect of sales charges, commissions, expenses or taxes.
You cannot invest directly in an index.
As shown in the Fund’s current prospectus dated October 20, 2014, the net total annual operating expense ratio for Class IB shares was 0.99% and the gross total annual operating expense ratio for Class IB shares was 1.53%. Actual expenses may be higher. Please see the accompanying Financial Highlights for expense ratios for the year ended December 31, 2014.
Net operating expenses are the expenses paid to own the Fund. If the net operating expenses shown are lower than the gross operating expenses, then the net operating expenses reflect contractual fee waivers and expense reimbursements that may not be renewed. Contractual waivers or reimbursements remain in effect for as long as the Fund is a part of a master-feeder fund structure unless terminated or changed by the Fund or its Board of Trustees if the fund structure changes. For more information about the fee arrangement and expiration dates, please see the expense table in the prospectus.
Gross operating expenses shown are before management fee waivers or expense caps. Performance information may reflect historical or current expense waivers or reimbursements, without which, performance would have been lower. For more information on fee waivers and/or expense reimbursements, please see the expense table in the prospectus.
The chart and table do not reflect the deductions of taxes, sales charges or other fees which may be applied at the variable life insurance, variable annuity or qualified retirement plan product level. Any such additional sales charges or other fees or expenses would lower the contract’s or plan’s performance.
All investments are subject to risk including the possible loss of principal. For a discussion of the Fund’s risks, please see the Main Risks section of this report. For more detailed information on the risks associated with an investment in the Fund, please see the prospectus.
The S&P 500 Index is a product of S&P Dow Jones Indices LLC (“SPDJI”), and has been licensed for use by HIMCO Variable Insurance Trust. Standard & Poor’s® and S&P® are registered trademarks of Standard & Poor’s Financial Services LLC (“S&P”); Dow Jones® is a registered trademark of Dow Jones Trademark Holdings LLC (“Dow Jones”); and these trademarks have been licensed for use by SPDJI and sublicensed for certain purposes by HIMCO Variable Insurance Trust. The Fund is not sponsored, endorsed, sold or promoted by SPDJI, Dow Jones, S&P, their respective affiliates, and none of such parties make any representation regarding the advisability of investing in such product(s) nor do they have any liability for any errors, omissions, or interruptions of the S&P 500 Index.
How did the Fund perform?
The Class IB shares of the HIMCO VIT American Funds Blue Chip Income and Growth Fund returned 15.02% for the year ended December 31, 2014, versus the return of 13.69% for the S&P 500 Index. The Fund outperformed the 11.51% average return of the Variable Products-Underlying Funds Lipper Large-Cap Core Funds peer group, a group of funds with investment strategies similar to those of the Fund.
The performance of the HIMCO VIT American Funds Blue Chip Income and Growth Fund is directly related to the performance of the American Funds Insurance Series – Blue Chip Income and Growth Fund Class 1, in which the Fund invests. The financial statements of the American Funds Insurance Series – Blue Chip Income and Growth Fund Class 1, including the Summary Investment Portfolio, are provided separately and should be read in conjunction with the HIMCO VIT American Funds Blue Chip Income and Growth Fund’s financial statements.
HIMCO VIT American Funds Bond Fund
| | |
(Effective October 20, 2014, American Funds Bond HLS Fund (the “Predecessor Fund”) was reorganized into HIMCO VIT American Funds Bond Fund (the “Fund”).) (The Fund is advised by Hartford Investment Management) | | Investment Goal: Seeks as high a level of current income as is consistent with the preservation of capital. |
Performance information for periods prior to October 20, 2014 is that of the Predecessor Fund. Hartford Funds Management Company, LLC served as the investment manager to the Predecessor Fund and Hartford Investment Management, the Fund’s adviser, served as sub-adviser to the Predecessor Fund. The Predecessor Fund had the same investment objective and strategies as the Fund.
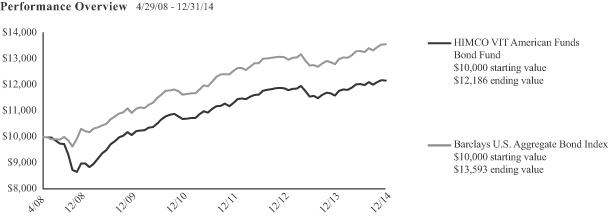
The chart above represents the hypothetical growth of a $10,000 investment in Class IB.
Average Annual Total Returns (as of 12/31/14)
| | | | | | | | | | | | |
| | | 1 Year | | | 5 Years | | | Since
Inception* | |
HIMCO VIT American Funds Bond Fund IB | | | 4.98% | | | | 3.87% | | | | 3.01% | |
Barclays U.S. Aggregate Bond Index | | | 5.97% | | | | 4.45% | | | | 4.76% | |
PERFORMANCE DATA QUOTED REPRESENTS PAST PERFORMANCE AND DOES NOT GUARANTEE FUTURE RESULTS. The investment return and principal value of the investment will fluctuate so that investors’ shares, when redeemed, may be worth more or less than their original cost. Current performance may be lower or higher than the performance data quoted.
Total returns presented above were calculated using the Fund’s net asset value available to shareholders for sale or redemption of Fund shares on December 31, 2014, which may exclude investment transactions as of this date. All share class returns assume the reinvestment of all distributions at net asset value and the deduction of all fund expenses.
Barclays U.S. Aggregate Bond Index represents the U.S. investment-grade fixed-rate bond market.
The index is unmanaged, and its results included reinvested dividends and/or distributions, but do not reflect the effect of sales charges, commissions, expenses or taxes.
You cannot invest directly in an index.
As shown in the Fund’s current prospectus dated October 20, 2014, the net total annual operating expense ratio for Class IB shares was 0.93% and the gross total annual operating expense ratio for Class IB shares was 1.21%. Actual expenses may be higher. Please see the accompanying Financial Highlights for expense ratios for the year ended December 31, 2014.
Net operating expenses are the expenses paid to own the Fund. If the net operating expenses shown are lower than the gross operating expenses, then the net operating expenses reflect contractual fee waivers and expense reimbursements that may not be renewed. Contractual waivers or reimbursements remain in effect for as long as the Fund is a part of a master-feeder fund structure unless terminated or changed by the Fund or its Board of Trustees if the fund structure changes. For more information about the fee arrangement and expiration dates, please see the expense table in the prospectus.
Gross operating expenses shown are before management fee waivers or expense caps. Performance information may reflect historical or current expense waivers or reimbursements, without which, performance would have been lower. For more information on fee waivers and/or expense reimbursements, please see the expense table in the prospectus.
The chart and table do not reflect the deductions of taxes, sales charges or other fees which may be applied at the variable life insurance, variable annuity or qualified retirement plan product level. Any such additional sales charges or other fees or expenses would lower the contract’s or plan’s performance.
All investments are subject to risk including the possible loss of principal. For a discussion of the Fund’s risks, please see the Main Risks section of this report. For more detailed information on the risks associated with an investment in the Fund, please see the prospectus.
How did the Fund perform?
The Class IB shares of the HIMCO VIT American Funds Bond Fund returned 4.98% for the year ended December 31, 2014, versus the return of 5.97% for the Barclays U.S. Aggregate Bond Index. The Fund underperformed the 5.28% average return of the Variable Products-Underlying Funds Lipper Core Bond Funds peer group, a group of funds with investment strategies similar to those of the Fund.
The performance of the HIMCO VIT American Funds Bond Fund is directly related to the performance of the American Funds Insurance Series – Bond Fund Class 1, in which the Fund invests. The financial statements of the American Funds Insurance Series – Bond Fund Class 1, including the Summary Investment Portfolio, are provided separately and should be read in conjunction with the HIMCO VIT American Funds Bond Fund’s financial statements.
HIMCO VIT American Funds Global Bond Fund
| | |
(Effective October 20, 2014, American Funds Global Bond HLS Fund (the “Predecessor Fund”) was reorganized into HIMCO VIT American Funds Global Bond Fund (the “Fund”).) (The Fund is advised by Hartford Investment Management) | | Investment Goal: Seeks to provide you, over the long-term, with a high level of total return consistent with prudent investment management. |
Performance information for periods prior to October 20, 2014 is that of the Predecessor Fund. Hartford Funds Management Company, LLC served as the investment manager to the Predecessor Fund and Hartford Investment Management, the Fund’s adviser, served as sub-adviser to the Predecessor Fund. The Predecessor Fund had the same investment objective and strategies as the Fund.
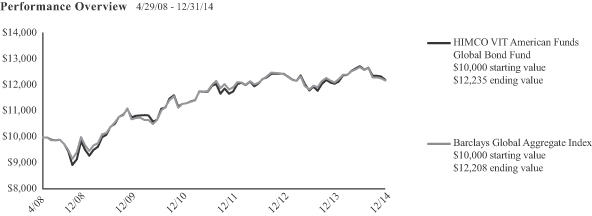
The chart above represents the hypothetical growth of a $10,000 investment in Class IB.
Average Annual Total Returns (as of 12/31/14)
| | | | | | | | | | | | |
| | | 1 Year | | | 5 Years | | | Since
Inception* | |
HIMCO VIT American Funds Global Bond Fund IB | | | 1.17% | | | | 2.57% | | | | 3.07% | |
Barclays Global Aggregate Index | | | 0.59% | | | | 2.65% | | | | 3.07% | |
PERFORMANCE DATA QUOTED REPRESENTS PAST PERFORMANCE AND DOES NOT GUARANTEE FUTURE RESULTS. The investment return and principal value of the investment will fluctuate so that investors’ shares, when redeemed, may be worth more or less than their original cost. Current performance may be lower or higher than the performance data quoted.
Total returns presented above were calculated using the Fund’s net asset value available to shareholders for sale or redemption of Fund shares on December 31, 2014, which may exclude investment transactions as of this date. All share class returns assume the reinvestment of all distributions at net asset value and the deduction of all fund expenses.
Barclays Global Aggregate Index represents the global investment-grade fixed-income markets.
The index is unmanaged, and its results included reinvested dividends and/or distributions, but do not reflect the effect of sales charges, commissions, expenses or taxes.
You cannot invest directly in an index.
As shown in the Fund’s current prospectus dated October 20, 2014, the net total annual operating expense ratio for Class IB shares was 1.15% and the gross total annual operating expense ratio for Class IB shares was 1.73%. Actual expenses may be higher. Please see the accompanying Financial Highlights for expense ratios for the year ended December 31, 2014.
Net operating expenses are the expenses paid to own the Fund. If the net operating expenses shown are lower than the gross operating expenses, then the net operating expenses reflect contractual fee waivers and expense reimbursements that may not be renewed. Contractual waivers or reimbursements remain in effect for as long as the Fund is a part of a master-feeder fund structure unless terminated or changed by the Fund or its Board of Trustees if the fund structure changes. For more information about the fee arrangement and expiration dates, please see the expense table in the prospectus.
Gross operating expenses shown are before management fee waivers or expense caps. Performance information may reflect historical or current expense waivers or reimbursements, without which, performance would have been lower. For more information on fee waivers and/or expense reimbursements, please see the expense table in the prospectus.
The chart and table do not reflect the deductions of taxes, sales charges or other fees which may be applied at the variable life insurance, variable annuity or qualified retirement plan product level. Any such additional sales charges or other fees or expenses would lower the contract’s or plan’s performance.
All investments are subject to risk including the possible loss of principal. For a discussion of the Fund’s risks, please see the Main Risks section of this report. For more detailed information on the risks associated with an investment in the Fund, please see the prospectus.
How did the Fund perform?
The Class IB shares of the HIMCO VIT American Funds Global Bond Fund returned 1.17% for the year ended December 31, 2014, versus the return of 0.59% for the Barclays Global Aggregate Index. The Fund underperformed the 1.54% average return of the Variable Products-Underlying Funds Lipper Global Income Funds peer group, a group of funds with investment strategies similar to those of the Fund.
The performance of the HIMCO VIT American Funds Global Bond Fund is directly related to the performance of the American Funds Insurance Series – Global Bond Fund Class 1, in which the Fund invests. The financial statements of the American Funds Insurance Series – Global Bond Fund Class 1, including the Summary Investment Portfolio, are provided separately and should be read in conjunction with the HIMCO VIT American Funds Global Bond Fund’s financial statements.
HIMCO VIT American Funds Global Growth and Income Fund
| | |
(Effective October 20, 2014, American Funds Global Growth and Income HLS Fund (the “Predecessor Fund”) was reorganized into HIMCO VIT American Funds Global Growth and Income Fund (the “Fund”).) (The Fund is advised by Hartford Investment Management) | | Investment Goal: Seeks long-term growth of capital while providing current income. |
Performance information for periods prior to October 20, 2014 is that of the Predecessor Fund. Hartford Funds Management Company, LLC served as the investment manager to the Predecessor Fund and Hartford Investment Management, the Fund’s adviser, served as sub-adviser to the Predecessor Fund. The Predecessor Fund had the same investment objective and strategies as the Fund.
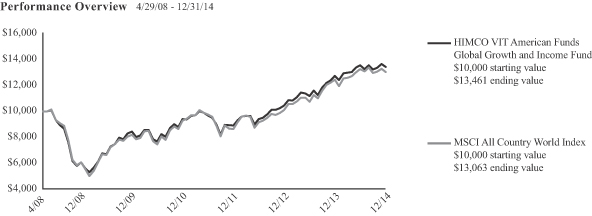
The chart above represents the hypothetical growth of a $10,000 investment in Class IB.
Average Annual Total Returns (as of 12/31/14)
| | | | | | | | | | | | |
| | | 1 Year | | | 5 Years | | | Since
Inception* | |
HIMCO VIT American Funds Global Growth and Income Fund IB | | | 5.36% | | | | 9.78% | | | | 4.55% | |
MSCI All Country World Index | | | 4.71% | | | | 9.74% | | | | 4.10% | |
PERFORMANCE DATA QUOTED REPRESENTS PAST PERFORMANCE AND DOES NOT GUARANTEE FUTURE RESULTS. The investment return and principal value of the investment will fluctuate so that investors’ shares, when redeemed, may be worth more or less than their original cost. Current performance may be lower or higher than the performance data quoted.
Total returns presented above were calculated using the Fund’s net asset value available to shareholders for sale or redemption of Fund shares on December 31, 2014, which may exclude investment transactions as of this date. All share class returns assume the reinvestment of all distributions at net asset value and the deduction of all fund expenses.
MSCI All Country World Index is a free float-adjusted market capitalization weighted index that is designed to measure equity market results in the global developed and emerging markets, consisting of more than 40 developed and emerging market country indices.
The index is unmanaged, and its results include reinvested dividends and/or distributions, but do not reflect the effect of sales charges, commissions, expenses or taxes.
You cannot invest directly in an index.
As shown in the Fund’s current prospectus dated October 20, 2014, the net total annual operating expense ratio for Class IB shares was 1.18% and the gross total annual operating expense ratio for Class IB shares was 1.77%. Actual expenses may be higher. Please see the accompanying Financial Highlights for expense ratios for the year ended December 31, 2014.
Net operating expenses are the expenses paid to own the Fund. If the net operating expenses shown are lower than the gross operating expenses, then the net operating expenses reflect contractual fee waivers and expense reimbursements that may not be renewed. Contractual waivers or reimbursements remain in effect for as long as the Fund is a part of a master-feeder fund structure unless terminated or changed by the Fund or its Board of Trustees if the fund structure changes. For more information about the fee arrangement and expiration dates, please see the expense table in the prospectus.
Gross operating expenses shown are before management fee waivers or expense caps. Performance information may reflect historical or current expense waivers or reimbursements, without which, performance would have been lower. For more information on fee waivers and/or expense reimbursements, please see the expense table in the prospectus.
The chart and table do not reflect the deductions of taxes, sales charges or other fees which may be applied at the variable life insurance, variable annuity or qualified retirement plan product level. Any such additional sales charges or other fees or expenses would lower the contract’s or plan’s performance.
All investments are subject to risk including the possible loss of principal. For a discussion of the Fund’s risks, please see the Main Risks section of this report. For more detailed information on the risks associated with an investment in the Fund, please see the prospectus.
How did the Fund perform?
The Class IB shares of the HIMCO VIT American Funds Global Growth and Income Fund returned 5.36% for the year ended December 31, 2014, versus the return of 4.71% for the MSCI All Country World Index. The Fund outperformed the 2.52% average return of the Variable Products- Underlying Funds Lipper Global Multi-Cap Growth Funds peer group, a group of funds with investment strategies similar to those of the Fund.
The performance of the HIMCO VIT American Funds Global Growth and Income Fund is directly related to the performance of the American Funds Insurance Series – Global Growth and Income Fund Class 1, in which the Fund invests. The financial statements of the American Funds Insurance Series – Global Growth and Income Fund Class 1, including the Summary Investment Portfolio, are provided separately and should be read in conjunction with the HIMCO VIT American Funds Global Growth and Income Fund’s financial statements.
HIMCO VIT American Funds Global Growth Fund
| | |
(Effective October 20, 2014, American Funds Global Growth HLS Fund (the “Predecessor Fund”) was reorganized into HIMCO VIT American Funds Global Growth Fund (the “Fund”).) (The Fund is advised by Hartford Investment Management) | | Investment Goal: Seeks long-term growth of capital. |
Performance information for periods prior to October 20, 2014 is that of the Predecessor Fund. Hartford Funds Management Company, LLC served as the investment manager to the Predecessor Fund and Hartford Investment Management, the Fund’s adviser, served as sub-adviser to the Predecessor Fund. The Predecessor Fund had the same investment objective and strategies as the Fund.
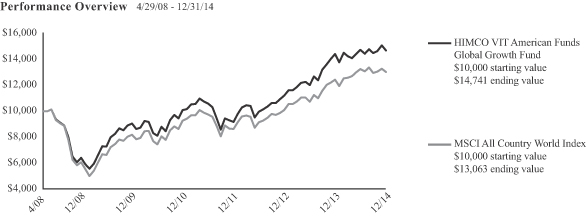
The chart above represents the hypothetical growth of a $10,000 investment in Class IB.
Average Annual Total Returns (as of 12/31/14)
| | | | | | | | | | | | |
| | | 1 Year | | | 5 Years | | | Since
Inception* | |
HIMCO VIT American Funds Global Growth Fund IB | | | 1.97% | | | | 10.18% | | | | 5.99% | |
MSCI All Country World Index | | | 4.71% | | | | 9.74% | | | | 4.10% | |
PERFORMANCE DATA QUOTED REPRESENTS PAST PERFORMANCE AND DOES NOT GUARANTEE FUTURE RESULTS. The investment return and principal value of the investment will fluctuate so that investors’ shares, when redeemed, may be worth more or less than their original cost. Current performance may be lower or higher than the performance data quoted.
Total returns presented above were calculated using the Fund’s net asset value available to shareholders for sale or redemption of Fund shares on December 31, 2014, which may exclude investment transactions as of this date. All share class returns assume the reinvestment of all distributions at net asset value and the deduction of all fund expenses.
MSCI All Country World Index is a free float-adjusted market capitalization weighted index that is designed to measure equity market results in the global developed and emerging markets, consisting of more than 40 developed and emerging market country indices.
The index is unmanaged, and its results include reinvested dividends and/or distributions, but do not reflect the effect of sales charges, commissions, expenses or taxes.
You cannot invest directly in an index.
As shown in the Fund’s current prospectus dated October 20, 2014, the net total annual operating expense ratio for Class IB shares was 1.14% and the gross total annual operating expense ratio for Class IB shares was 1.94%. Actual expenses may be higher. Please see the accompanying Financial Highlights for expense ratios for the year ended December 31, 2014.
Net operating expenses are the expenses paid to own the Fund. If the net operating expenses shown are lower than the gross operating expenses, then the net operating expenses reflect contractual fee waivers and expense reimbursements that may not be renewed. Contractual waivers or reimbursements remain in effect for as long as the Fund is a part of a master-feeder fund structure unless terminated or changed by the Fund or its Board of Trustees if the fund structure changes. For more information about the fee arrangement and expiration dates, please see the expense table in the prospectus.
Gross operating expenses shown are before management fee waivers or expense caps. Performance information may reflect historical or current expense waivers or reimbursements, without which, performance would have been lower. For more information on fee waivers and/or expense reimbursements, please see the expense table in the prospectus.
The chart and table do not reflect the deductions of taxes, sales charges or other fees which may be applied at the variable life insurance, variable annuity or qualified retirement plan product level. Any such additional sales charges or other fees or expenses would lower the contract’s or plan’s performance.
All investments are subject to risk including the possible loss of principal. For a discussion of the Fund’s risks, please see the Main Risks section of this report. For more detailed information on the risks associated with an investment in the Fund, please see the prospectus.
How did the Fund perform?
The Class IB shares of the HIMCO VIT American Funds Global Growth Fund returned 1.97% for the year ended December 31, 2014, versus the return of 4.71% for the MSCI All Country World Index. The Fund underperformed the 4.34% average return of the Variable Products-Underlying Funds Lipper Global Multi-Cap Core Funds peer group, a group of funds with investment strategies similar to those of the Fund.
The performance of the HIMCO VIT American Funds Global Growth Fund is directly related to the performance of the American Funds Insurance Series –Global Growth Fund Class 1, in which the Fund invests. The financial statements of the American Funds Insurance Series – Global Growth Fund Class 1, including the Summary Investment Portfolio, are provided separately and should be read in conjunction with the HIMCO VIT American Funds Global Growth Fund’s financial statements.
HIMCO VIT American Funds Global Small Capitalization Fund
| | |
(Effective October 20, 2014, American Funds Global Small Capitalization HLS Fund (the “Predecessor Fund”) was reorganized into HIMCO VIT American Funds Global Small Capitalization Fund (the “Fund”).) (The Fund is advised by Hartford Investment Management) | | Investment Goal: Seeks long-term growth of capital. |
Performance information for periods prior to October 20, 2014 is that of the Predecessor Fund. Hartford Funds Management Company, LLC served as the investment manager to the Predecessor Fund and Hartford Investment Management, the Fund’s adviser, served as sub-adviser to the Predecessor Fund. The Predecessor Fund had the same investment objective and strategies as the Fund.
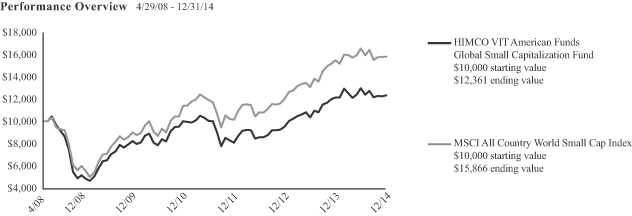
The chart above represents the hypothetical growth of a $10,000 investment in Class IB.
Average Annual Total Returns (as of 12/31/14)
| | | | | | | | | | | | |
| | | 1 Year | | | 5 Years | | | Since
Inception* | |
HIMCO VIT American Funds Global Small Capitalization Fund IB | | | 1.75% | | | | 8.57% | | | | 3.23% | |
MSCI All Country World Small Cap Index | | | 2.20% | | | | 12.06% | | | | 7.16% | |
PERFORMANCE DATA QUOTED REPRESENTS PAST PERFORMANCE AND DOES NOT GUARANTEE FUTURE RESULTS. The investment return and principal value of the investment will fluctuate so that investors’ shares, when redeemed, may be worth more or less than their original cost. Current performance may be lower or higher than the performance data quoted.
Total returns presented above were calculated using the Fund’s net asset value available to shareholders for sale or redemption of Fund shares on December 31, 2014, which may exclude investment transactions as of this date. All share class returns assume the reinvestment of all distributions at net asset value and the deduction of all fund expenses.
MSCI All Country World Small Cap Index is a free float-adjusted market capitalization-weighted index that is designed to measure equity market performance of smaller capitalization companies in both developed and emerging markets.
The index is unmanaged, and its results include reinvested dividends and/or distributions, but do not reflect the effect of sales charges, commissions, expenses or taxes.
You cannot invest directly in an index.
As shown in the Fund’s current prospectus dated October 20, 2014, the net total annual operating expense ratio for Class IB shares was 1.32% and the gross total annual operating expense ratio for Class IB shares was 1.87%. Actual expenses may be higher. Please see the accompanying Financial Highlights for expense ratios for the year ended December 31, 2014.
Net operating expenses are the expenses paid to own the Fund. If the net operating expenses shown are lower than the gross operating expenses, then the net operating expenses reflect contractual fee waivers and expense reimbursements that may not be renewed. Contractual waivers or reimbursements remain in effect for as long as the Fund is a part of a master-feeder fund structure unless terminated or changed by the Fund or its Board of Trustees if the fund structure changes. For more information about the fee arrangement and expiration dates, please see the expense table in the prospectus.
Gross operating expenses shown are before management fee waivers or expense caps. Performance information may reflect historical or current expense waivers or reimbursements, without which, performance would have been lower. For more information on fee waivers and/or expense reimbursements, please see the expense table in the prospectus.
The chart and table do not reflect the deductions of taxes, sales charges or other fees which may be applied at the variable life insurance, variable annuity or qualified retirement plan product level. Any such additional sales charges or other fees or expenses would lower the contract’s or plan’s performance.
All investments are subject to risk including the possible loss of principal. For a discussion of the Fund’s risks, please see the Main Risks section of this report. For more detailed information on the risks associated with an investment in the Fund, please see the prospectus.
How did the Fund perform?
The Class IB shares of the HIMCO VIT American Funds Global Small Capitalization Fund returned 1.75% for the year ended December 31, 2014, versus the return of 2.20% for the MSCI All Country World Small Cap Index. The Fund outperformed the 0.61% average return of the Variable Products-Underlying Funds Lipper Global Small/Mid-Cap Funds peer group, a group of funds with investment strategies similar to those of the Fund.
The performance of the HIMCO VIT American Funds Global Small Capitalization Fund is directly related to the performance of the American Funds Insurance Series – Global Small Capitalization Fund Class 1, in which the Fund invests. The financial statements of the American Funds Insurance Series – Global Small Capitalization Fund Class 1, including the Summary Investment Portfolio, are provided separately and should be read in conjunction with the HIMCO VIT American Funds Global Small Capitalization Fund’s financial statements.
HIMCO VIT American Funds Growth Fund
| | |
(Effective October 20, 2014, American Funds Growth HLS Fund (the “Predecessor Fund”) was reorganized into HIMCO VIT American Funds Growth Fund (the “Fund”).) (The Fund is advised by Hartford Investment Management) | | Investment Goal: Seeks growth of capital. |
Performance information for periods prior to October 20, 2014 is that of the Predecessor Fund. Hartford Funds Management Company, LLC served as the investment manager to the Predecessor Fund and Hartford Investment Management, the Fund’s adviser, served as sub-adviser to the Predecessor Fund. The Predecessor Fund had the same investment objective and strategies as the Fund.
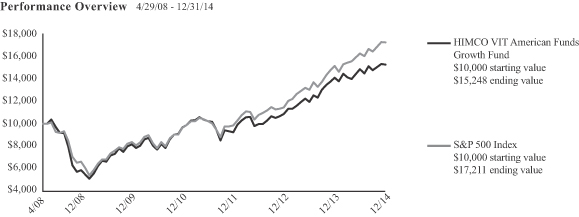
The chart above represents the hypothetical growth of a $10,000 investment in Class IB.
Average Annual Total Returns (as of 12/31/14)
| | | | | | | | | | | | |
| | | 1 Year | | | 5 Years | | | Since
Inception* | |
HIMCO VIT American Funds Growth Fund IB | | | 8.21% | | | | 13.27% | | | | 6.52% | |
S&P 500 Index | | | 13.69% | | | | 15.45% | | | | 8.41% | |
PERFORMANCE DATA QUOTED REPRESENTS PAST PERFORMANCE AND DOES NOT GUARANTEE FUTURE RESULTS. The investment return and principal value of the investment will fluctuate so that investors’ shares, when redeemed, may be worth more or less than their original cost. Current performance may be lower or higher than the performance data quoted.
Total returns presented above were calculated using the Fund’s net asset value available to shareholders for sale or redemption of Fund shares on December 31, 2014, which may exclude investment transactions as of this date. All share class returns assume the reinvestment of all distributions at net asset value and the deduction of all fund expenses.
S&P 500 Index is a market capitalization-weighted price index composed of 500 widely held common stocks.
The index is unmanaged, and its results included reinvested dividends and/or distributions, but do not reflect the effect of sales charges, commissions, expenses or taxes.
You cannot invest directly in an index.
As shown in the Fund’s current prospectus dated October 20, 2014, the net total annual operating expense ratio for Class IB shares was 0.89% and the gross total annual operating expense ratio for Class IB shares was 1.42%. Actual expenses may be higher. Please see the accompanying Financial Highlights for expense ratios for the year ended December 31, 2014.
Net operating expenses are the expenses paid to own the Fund. If the net operating expenses shown are lower than the gross operating expenses, then
the net operating expenses reflect contractual fee waivers and expense reimbursements that may not be renewed. Contractual waivers or reimbursements remain in effect for as long as the Fund is a part of a master-feeder fund structure unless terminated or changed by the Fund or its Board of Trustees if the fund structure changes. For more information about the fee arrangement and expiration dates, please see the expense table in the prospectus.
Gross operating expenses shown are before management fee waivers or expense caps. Performance information may reflect historical or current expense waivers or reimbursements, without which, performance would have been lower. For more information on fee waivers and/or expense reimbursements, please see the expense table in the prospectus.
The chart and table do not reflect the deductions of taxes, sales charges or other fees which may be applied at the variable life insurance, variable annuity or qualified retirement plan product level. Any such additional sales charges or other fees or expenses would lower the contract’s or plan’s performance.
All investments are subject to risk including the possible loss of principal. For a discussion of the Fund’s risks, please see the Main Risks section of this report. For more detailed information on the risks associated with an investment in the Fund, please see the prospectus.
The S&P 500 Index is a product of S&P Dow Jones Indices LLC (“SPDJI”), and has been licensed for use by HIMCO Variable Insurance Trust. Standard & Poor’s® and S&P® are registered trademarks of Standard & Poor’s Financial Services LLC (“S&P”); Dow Jones® is a registered trademark of Dow Jones Trademark Holdings LLC (“Dow Jones”); and these trademarks have been licensed for use by SPDJI and sublicensed for certain purposes by HIMCO Variable Insurance Trust. The Fund is not sponsored, endorsed, sold or promoted by SPDJI, Dow Jones, S&P, their respective affiliates, and none of such parties make any representation regarding the advisability of investing in such product(s) nor do they have any liability for any errors, omissions, or interruptions of the S&P 500 Index.
How did the Fund perform?
The Class IB shares of the HIMCO VIT American Funds Growth Fund returned 8.21% for the year ended December 31, 2014, versus the return of 13.69% for the S&P 500 Index. The Fund underperformed the 10.04% average return of the Variable Products-Underlying Funds Lipper Large-Cap Growth Funds peer group, a group of funds with investment strategies similar to those of the Fund.
The performance of the HIMCO VIT American Funds Growth Fund is directly related to the performance of the American Funds Insurance Series – Growth Fund Class 1, in which the Fund invests. The financial statements of the American Funds Insurance Series – Growth Fund Class 1, including the Summary Investment Portfolio, are provided separately and should be read in conjunction with the HIMCO VIT American Funds Growth Fund’s financial statements.
HIMCO VIT American Funds Growth-Income Fund
| | |
(Effective October 20, 2014, American Funds Growth-Income HLS Fund (the “Predecessor Fund”) was reorganized into HIMCO VIT American Funds Growth-Income Fund (the “Fund”).) (The Fund is advised by Hartford Investment Management) | | Investment Goal: Seeks long – term growth of capital and income. |
Performance information for periods prior to October 20, 2014 is that of the Predecessor Fund. Hartford Funds Management Company, LLC served as the investment manager to the Predecessor Fund and Hartford Investment Management, the Fund’s adviser, served as sub-adviser to the Predecessor Fund. The Predecessor Fund had the same investment objective and strategies as the Fund.
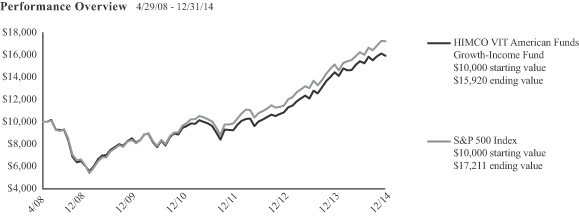
The chart above represents the hypothetical growth of a $10,000 investment in Class IB.
Average Annual Total Returns (as of 12/31/14)
| | | | | | | | | | | | |
| | | 1 Year | | | 5 Years | | | Since
Inception* | |
HIMCO VIT American Funds Growth – Income Fund IB | | | 10.30% | | | | 13.35% | | | | 7.22% | |
S&P 500 Index | | | 13.69% | | | | 15.45% | | | | 8.41% | |
PERFORMANCE DATA QUOTED REPRESENTS PAST PERFORMANCE AND DOES NOT GUARANTEE FUTURE RESULTS. The investment return and principal value of the investment will fluctuate so that investors’ shares, when redeemed, may be worth more or less than their original cost. Current performance may be lower or higher than the performance data quoted.
Total returns presented above were calculated using the Fund’s net asset value available to shareholders for sale or redemption of Fund shares on December 31, 2014, which may exclude investment transactions as of this date. All share class returns assume the reinvestment of all distributions at net asset value and the deduction of all fund expenses.
S&P 500 Index is a market capitalization-weighted price index composed of 500 widely held common stocks.
The index is unmanaged, and its results include reinvested dividends and/or distributions, but do not reflect the effect of sales charges, commissions, expenses or taxes.
You cannot invest directly in an index.
As shown in the Fund’s current prospectus dated October 20, 2014, the net total annual operating expense ratio for Class IB shares was 0.83% and the gross total annual operating expense ratio for Class IB shares was 1.32%. Actual expenses may be higher. Please see the accompanying Financial Highlights for expense ratios for the year ended December 31, 2014.
Net operating expenses are the expenses paid to own the Fund. If the net operating expenses shown are lower than the gross operating expenses, then the net operating expenses reflect contractual fee waivers and expense reimbursements that may not be renewed. Contractual waivers or reimbursements remain in effect for as long as the Fund is a part of a master-feeder fund structure unless terminated or changed by the Fund or its Board of Trustees if the fund structure changes. For more information about the fee arrangement and expiration dates, please see the expense table in the prospectus.
Gross operating expenses shown are before management fee waivers or expense caps. Performance information may reflect historical or current expense waivers or reimbursements, without which, performance would have been lower. For more information on fee waivers and/or expense reimbursements, please see the expense table in the prospectus.
The chart and table do not reflect the deductions of taxes, sales charges or other fees which may be applied at the variable life insurance, variable annuity or qualified retirement plan product level. Any such additional sales charges or other fees or expenses would lower the contract’s or plan’s performance.
All investments are subject to risk including the possible loss of principal. For a discussion of the Fund’s risks, please see the Main Risks section of this report. For more detailed information on the risks associated with an investment in the Fund, please see the prospectus.
The S&P 500 Index is a product of S&P Dow Jones Indices LLC (“SPDJI”), and has been licensed for use by HIMCO Variable Insurance Trust. Standard & Poor’s® and S&P® are registered trademarks of Standard & Poor’s Financial Services LLC (“S&P”); Dow Jones® is a registered trademark of Dow Jones Trademark Holdings LLC (“Dow Jones”); and these trademarks have been licensed for use by SPDJI and sublicensed for certain purposes by HIMCO Variable Insurance Trust. The Fund is not sponsored, endorsed, sold or promoted by SPDJI, Dow Jones, S&P, their respective affiliates, and none of such parties make any representation regarding the advisability of investing in such product(s) nor do they have any liability for any errors, omissions, or interruptions of the S&P 500 Index.
How did the Fund perform?
The Class IB shares of the HIMCO VIT American Funds Growth-Income Fund returned 10.30% for the year ended December 31, 2014, versus the return of 13.69% for the S&P 500 Index. The Fund underperformed the 11.51% average return of the Variable Products-Underlying Funds Lipper Large-Cap Core Funds peer group, a group of funds with investment strategies similar to those of the Fund.
The performance of the HIMCO VIT American Funds Growth-Income Fund is directly related to the performance of the American Funds Insurance Series –Growth-Income Fund Class 1, in which the Fund invests. The financial statements of the American Funds Insurance Series – Growth-Income Fund Class 1, including the Summary Investment Portfolio, are provided separately and should be read in conjunction with the HIMCO VIT American Funds Growth-Income Fund’s financial statements.
HIMCO VIT American Funds International Fund
| | |
(Effective October 20, 2014, American Funds International HLS Fund (the “Predecessor Fund”) was reorganized into HIMCO VIT American Funds International Fund (the “Fund”).) (The Fund is advised by Hartford Investment Management) | | Investment Goal: Seeks long – term growth of capital. |
Performance information for periods prior to October 20, 2014 is that of the Predecessor Fund. Hartford Funds Management Company, LLC served as the investment manager to the Predecessor Fund and Hartford Investment Management, the Fund’s adviser, served as sub-adviser to the Predecessor Fund. The Predecessor Fund had the same investment objective and strategies as the Fund.
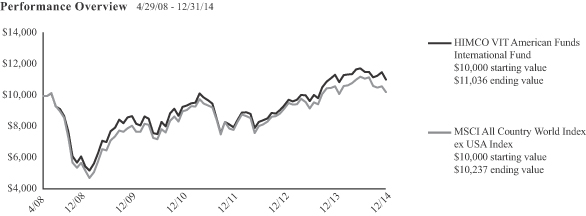
The chart above represents the hypothetical growth of a $10,000 investment in Class IB.
Average Annual Total Returns (as of 12/31/14)
| | | | | | | | | | | | |
| | | 1 Year | | | 5 Years | | | Since
Inception* | |
HIMCO VIT American Funds International Fund IB | | | -2.88% | | | | 4.89% | | | | 1.49% | |
MSCI All Country World Index ex USA Index | | | -3.43% | | | | 4.89% | | | | 0.41% | |
PERFORMANCE DATA QUOTED REPRESENTS PAST PERFORMANCE AND DOES NOT GUARANTEE FUTURE RESULTS. The investment return and principal value of the investment will fluctuate so that investors’ shares, when redeemed, may be worth more or less than their original cost. Current performance may be lower or higher than the performance data quoted.
Total returns presented above were calculated using the Fund’s net asset value available to shareholders for sale or redemption of Fund shares on December 31, 2014, which may exclude investment transactions as of this date. All share class returns assume the reinvestment of all distributions at net asset value and the deduction of all fund expenses.
MSCI All Country World ex USA Index is a broad-based, unmanaged, market capitalization weighted, total return index that measures the performance of both developed and emerging stock markets, excluding the U.S. The index is calculated to exclude companies and share classes which cannot be freely purchased by foreigners.
The index is unmanaged, and its results included reinvested dividends and/or distributions, but do not reflect the effect of sales charges, commissions, expenses or taxes.
You cannot invest directly in an index.
As shown in the Fund’s current prospectus dated October 20, 2014, the net total annual operating expense ratio for Class IB shares was 1.09% and the gross total annual operating expense ratio for Class IB shares was 1.69%. Actual expenses may be higher. Please see the accompanying Financial Highlights for expense ratios for the year ended December 31, 2014.
Net operating expenses are the expenses paid to own the Fund. If the net operating expenses shown are lower than the gross operating expenses, then the net operating expenses reflect contractual fee waivers and expense reimbursements that may not be renewed. Contractual waivers or reimbursements remain in effect for as long as the Fund is a part of a master-feeder fund structure unless terminated or changed by the Fund or its Board of Trustees if the fund structure changes. For more information about the fee arrangement and expiration dates, please see the expense table in the prospectus.
Gross operating expenses shown are before management fee waivers or expense caps. Performance information may reflect historical or current expense waivers or reimbursements, without which, performance would have been lower. For more information on fee waivers and/or expense reimbursements, please see the expense table in the prospectus.
The chart and table do not reflect the deductions of taxes, sales charges or other fees which may be applied at the variable life insurance, variable annuity or qualified retirement plan product level. Any such additional sales charges or other fees or expenses would lower the contract’s or plan’s performance.
All investments are subject to risk including the possible loss of principal. For a discussion of the Fund’s risks, please see the Main Risks section of this report. For more detailed information on the risks associated with an investment in the Fund, please see the prospectus.
How did the Fund perform?
The Class IB shares of the HIMCO VIT American Funds International Fund returned -2.88% for the year ended December 31, 2014, versus the return of -3.43% for the MSCI All Country World ex USA Index. The Fund outperformed the -5.02% average return of the Variable Products- Underlying Funds Lipper International Multi-Cap Core Funds peer group, a group of funds with investment strategies similar to those of the Fund.
The performance of the HIMCO VIT American Funds International Fund is directly related to the performance of the American Funds Insurance Series – International Fund Class 1, in which the Fund invests. The financial statements of the American Funds Insurance Series – International Fund Class 1, including the Summary Investment Portfolio, are provided separately and should be read in conjunction with the HIMCO VIT American Funds International Fund’s financial statements.
HIMCO VIT American Funds New World Fund
| | |
(Effective October 20, 2014, American Funds New World HLS Fund (the “Predecessor Fund”) was reorganized into HIMCO VIT American Funds New World Fund (the “Fund”).) (The Fund is advised by Hartford Investment Management) | | Investment Goal: Seeks long – term capital appreciation. |
Performance information for periods prior to October 20, 2014 is that of the Predecessor Fund. Hartford Funds Management Company, LLC served as the investment manager to the Predecessor Fund and Hartford Investment Management, the Fund’s adviser, served as sub-adviser to the Predecessor Fund. The Predecessor Fund had the same investment objective and strategies as the Fund.
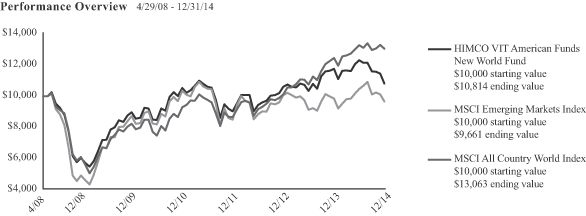
The chart above represents the hypothetical growth of a $10,000 investment in Class IB.
Average Annual Total Returns (as of 12/31/14)
| | | | | | | | | | | | |
| | | 1 Year | | | 5 Years | | | Since
Inception* | |
HIMCO VIT American Funds New World Fund IB | | | -8.17% | | | | 3.85% | | | | 1.18% | |
MSCI All Country World Index | | | 4.71% | | | | 9.74% | | | | 4.10% | |
MSCI Emerging Market Index | | | -1.82% | | | | 2.11% | | | | -0.37% | |
PERFORMANCE DATA QUOTED REPRESENTS PAST PERFORMANCE AND DOES NOT GUARANTEE FUTURE RESULTS. The investment return and principal value of the investment will fluctuate so that investors’ shares, when redeemed, may be worth more or less than their original cost. Current performance may be lower or higher than the performance data quoted.
Total returns presented above were calculated using the Fund’s net asset value available to shareholders for sale or redemption of Fund shares on December 31, 2014, which may exclude investment transactions as of this date. All share class returns assume the reinvestment of all distributions at net asset value and the deduction of all fund expenses.
MSCI All Country World Index is a free float-adjusted market capitalization weighted index that is designed to measure the equity market performance of developed and emerging markets. The MSCI All Country World Index consists of 44 country indices comprising 23 developed and 21 emerging market country indices.
MSCI Emerging Markets Index is a free float-adjusted market capitalization index that is designed to measure equity market performance of emerging markets. The MSCI Emerging Markets Index consists of the following 21 emerging market country indices: Brazil, Chile, China, Colombia, Czech Republic, Egypt, Greece, Hungary, India, Indonesia, Korea, Malaysia, Mexico, Peru, Philippines, Poland, Russia, South Africa, Taiwan, Thailand, and Turkey.
The indices are unmanaged, and their results include reinvested dividends and/or distributions, but do not reflect the effect of sales charges, commissions, expenses or taxes.
You cannot invest directly in an index.
As shown in the Fund’s current prospectus dated October 20, 2014, the net total annual operating expense ratio for Class IB shares was 1.36% and the gross total annual operating expense ratio for Class IB shares was 2.23%. Actual expenses may be higher. Please see the accompanying Financial Highlights for expense ratios for the year ended December 31, 2014.
Net operating expenses are the expenses paid to own the Fund. If the net operating expenses shown are lower than the gross operating expenses, then the net operating expenses reflect contractual fee waivers and expense reimbursements that may not be renewed. Contractual waivers or reimbursements remain in effect for as long as the Fund is a part of a master-feeder fund structure unless terminated or changed by the Fund or its Board of Trustees if the fund structure changes. For more information about the fee arrangement and expiration dates, please see the expense table in the prospectus.
Gross operating expenses shown are before management fee waivers or expense caps. Performance information may reflect historical or current expense waivers or reimbursements, without which, performance would have been lower. For more information on fee waivers and/or expense reimbursements, please see the expense table in the prospectus.
The chart and table do not reflect the deductions of taxes, sales charges or other fees which may be applied at the variable life insurance, variable annuity or qualified retirement plan product level. Any such additional sales charges or other fees or expenses would lower the contract’s or plan’s performance.
All investments are subject to risk including the possible loss of principal. For a discussion of the Fund’s risks, please see the Main Risks section of this report. For more detailed information on the risks associated with an investment in the Fund, please see the prospectus.
How did the Fund perform?
The Class IB shares of the HIMCO VIT American Funds New World Fund returned -8.17% for the year ended December 31, 2014, versus the returns of 4.71% for the MSCI All Country World Index and -1.82% for the MSCI Emerging Markets Index. The Fund underperformed the -4.78% average return of the Variable Products-Underlying Funds Lipper Emerging Markets Funds peer group, a group of funds with investment strategies similar to those of the Fund.
The performance of the HIMCO VIT American Funds New World Fund is directly related to the performance of the American Funds Insurance Series – New World Fund Class 1, in which the Fund invests. The financial statements of the American Funds Insurance Series – New World Fund Class 1, including the Summary Investment Portfolio, are provided separately and should be read in conjunction with the HIMCO VIT American Funds New World Fund’s financial statements.
|
| HIMCO VIT American Funds Asset Allocation Fund |
Schedule of Investments
December 31, 2014
|
| HIMCO VIT American Funds Blue Chip Income and Growth Fund |
Schedule of Investments
December 31, 2014
| | | | | | | | | | | | |
Shares | | | | | Market Value(1) | |
| INVESTMENT COMPANIES - 100.1% | |
| | 2,469,501 | | | American Funds Insurance Series - Asset Allocation Fund Class 1 | | | | | | $ | 54,897,003 | |
| | | | | | | | | | | | |
| | | |
| | | | Total Investment Companies
(cost $46,726,790) | | | | | | $ | 54,897,003 | |
| | | | | | | | | | | | |
| | | |
| | | | Total Investments
(cost $46,726,790)(2) | | | 100.1 | % | | $ | 54,897,003 | |
| | | | Other Assets and Liabilties | | | (0.1 | )% | | | (41,728 | ) |
| | | | | | | | | | | | |
| | | | Total Net Assets | | | 100.0 | % | | $ | 54,855,275 | |
| | | | | | | | | | | | |
| Note: | Percentage of investments as shown is the ratio of the total market value to total net assets. |
| (1) | See Significant Accounting Policies of accompanying Notes to Financial Statements regarding valuation of securities. |
| (2) | At December 31, 2014, the cost of securities for federal income tax purposes was $46,799,363, and the aggregate gross unrealized appreciation and depreciation based on that cost were: |
| | | | |
Unrealized Appreciation | | $ | 8,097,640 | |
Unrealized Depreciation | | | — | |
| | | | |
Net Unrealized Appreciation | | $ | 8,097,640 | |
| | | | |
At December 31, 2014, the investment valuation hierarchy levels were:
| | | | |
Assets: | | | | |
Investments in Securities - Level 1 | | $ | 54,897,003 | |
| | | | |
Total | | $ | 54,897,003 | |
| | | | |
| | | | | | | | | | | | |
Shares | | | | | Market Value(1) | |
| INVESTMENT COMPANIES - 100.1% | |
| | 3,239,354 | | | American Funds Insurance Series - Blue Chip Income and Growth Fund Class 1 | | | | | | $ | 47,586,113 | |
| | | | | | | | | | | | |
| | | |
| | | | Total Investment Companies
(cost $34,209,325) | | | | | | $ | 47,586,113 | |
| | | | | | | | | | | | |
| | | |
| | | | Total Investments
(cost $34,209,325)(2) | | | 100.1 | % | | $ | 47,586,113 | |
| | | | Other Assets and Liabilities | | | (0.1 | )% | | | (36,437 | ) |
| | | | | | | | | | | | |
| | | | Total Net Assets | | | 100.0 | % | | $ | 47,549,676 | |
| | | | | | | | | | | | |
| Note: | Percentage of investments as shown is the ratio of the total market value to total net assets. |
| (1) | See Significant Accounting Policies of accompanying Notes to Financial Statements regarding valuation of securities. |
| (2) | At December 31, 2014, the cost of securities for federal income tax purposes was $34,416,610, and the aggregate gross unrealized appreciation and depreciation based on that cost were: |
| | | | |
Unrealized Appreciation | | $ | 13,169,503 | |
Unrealized Depreciation | | | — | |
| | | | |
Net Unrealized Appreciation | | $ | 13,169,503 | |
| | | | |
At December 31, 2014, the investment valuation hierarchy levels were:
| | | | |
Assets: | | | | |
Investments in Securities - Level 1 | | $ | 47,586,113 | |
| | | | |
Total | | $ | 47,586,113 | |
| | | | |
The accompanying notes are an integral part of these financial statements.
|
| HIMCO VIT American Funds Bond Fund |
Schedule of Investments
December 31, 2014
|
| HIMCO VIT American Funds Global Bond Fund |
Schedule of Investments
December 31, 2014
| | | | | | | | | | | | |
Shares | | | | | Market Value(1) | |
| INVESTMENT COMPANIES - 100.1% | |
| | 17,075,072 | | | American Funds Insurance Series - Bond Fund Class 1 | | | | | | $ | 189,191,796 | |
| | | | | | | | | | | | |
| | | |
| | | | Total Investment Companies
(cost $186,899,445) | | | | | | $ | 189,191,796 | |
| | | | | | | | | | | | |
| | | |
| | | | Total Investments
(cost $186,899,445)(2) | | | 100.1 | % | | $ | 189,191,796 | |
| | | | Other Assets and Liabilities | | | (0.1 | )% | | | (115,471 | ) |
| | | | | | | | | | | | |
| | | | Total Net Assets | | | 100.0 | % | | $ | 189,076,325 | |
| | | | | | | | | | | | |
| Note: | Percentage of investments as shown is the ratio of the total market value to total net assets. |
| (1) | See Significant Accounting Policies of accompanying Notes to Financial Statements regarding valuation of securities. |
| (2) | At December 31, 2014, the cost of securities for federal income tax purposes was $187,423,046, and the aggregate gross unrealized appreciation and depreciation based on that cost were: |
| | | | |
Unrealized Appreciation | | $ | 1,768,750 | |
Unrealized Depreciation | | | — | |
| | | | |
Net Unrealized Appreciation | | $ | 1,768,750 | |
| | | | |
At December 31, 2014, the investment valuation hierarchy levels were:
| | | | |
Assets: | | | | |
Investments in Securities - Level 1 | | $ | 189,191,796 | |
| | | | |
Total | | $ | 189,191,796 | |
| | | | |
| | | | | | | | | | | | |
Shares | | | | | Market Value(1) | |
| INVESTMENT COMPANIES - 100.1% | |
| | 1,279,619 | | | American Funds Insurance Series - Global Bond Fund Class 1 | | | | | | $ | 15,061,118 | |
| | | | | | | | | | | | |
| | | |
| | | | Total Investment Companies
(cost $15,679,134) | | | | | | $ | 15,061,118 | |
| | | | | | | | | | | | |
| | | |
| | | | Total Investments
(cost $15,679,134)(2) | | | 100.1 | % | | $ | 15,061,118 | |
| | | | Other Assets and Liabilities | | | (0.1 | )% | | | (18,956 | ) |
| | | | | | | | | | | | |
| | | | Total Net Assets | | | 100.0 | % | | $ | 15,042,162 | |
| | | | | | | | | | | | |
| Note: | Percentage of investments as shown is the ratio of the total market value to total net assets. |
| (1) | See Significant Accounting Policies of accompanying Notes to Financial Statements regarding valuation of securities. |
| (2) | At December 31, 2014, the cost of securities for federal income tax purposes was $15,706,879, and the aggregate gross unrealized appreciation and depreciation based on that cost were: |
| | | | |
Unrealized Appreciation | | $ | — | |
Unrealized Depreciation | | | (645,761 | ) |
| | | | |
Net Unrealized Appreciation | | $ | (645,761 | ) |
| | | | |
At December 31, 2014, the investment valuation hierarchy levels were:
| | | | |
Assets: | | | | |
Investments in Securities - Level 1 | | $ | 15,061,118 | |
| | | | |
Total | | $ | 15,061,118 | |
| | | | |
The accompanying notes are an integral part of these financial statements.
|
| HIMCO VIT American Funds Global Growth and Income Fund |
Schedule of Investments
December 31, 2014
|
| HIMCO VIT American Funds Global Growth Fund |
Schedule of Investments
December 31, 2014
| | | | | | | | | | | | |
Shares | | | | | Market Value(1) | |
| INVESTMENT COMPANIES - 100.1% | |
| | 3,770,422 | | | American Funds Insurance Series - Global Growth and Income Fund Class 1 | | | | | | $ | 48,185,999 | |
| | | | | | | | | | | | |
| | | |
| | | | Total Investment Companies
(cost $34,653,531) | | | | | | $ | 48,185,999 | |
| | | | | | | | | | | | |
| | | |
| | | | Total Investments
(cost $34,653,531)(2) | | | 100.1 | % | | $ | 48,185,999 | |
| | | | Other Assets and Liabilities | | | (0.1 | )% | | | (39,189 | ) |
| | | | | | | | | | | | |
| | | | Total Net Assets | | | 100.0 | % | | $ | 48,146,810 | |
| | | | | | | | | | | | |
| Note: | Percentage of investments as shown is the ratio of the total market value to total net assets. |
| (1) | See Significant Accounting Policies of accompanying Notes to Financial Statements regarding valuation of securities. |
| (2) | At December 31, 2014, the cost of securities for federal income tax purposes was $36,284,709, and the aggregate gross unrealized appreciation and depreciation based on that cost were: |
| | | | |
Unrealized Appreciation | | $ | 11,901,290 | |
Unrealized Depreciation | | | — | |
| | | | |
Net Unrealized Appreciation | | $ | 11,901,290 | |
| | | | |
At December 31, 2014, the investment valuation hierarchy levels were:
| | | | |
Assets: | | | | |
Investments in Securities - Level 1 | | $ | 48,185,999 | |
| | | | |
Total | | $ | 48,185,999 | |
| | | | |
| | | | | | | | | | | | |
Shares | | | | | Market Value(1) | |
| INVESTMENT COMPANIES - 100.1% | |
| | 754,223 | | | American Funds Insurance Series - Global Growth Fund Class 1 | | | | | | $ | 20,726,037 | |
| | | | | | | | | | | | |
| | | |
| | | | Total Investment Companies
(cost $16,602,385) | | | | | | $ | 20,726,037 | |
| | | | | | | | | | | | |
| | | |
| | | | Total Investments
(cost $16,602,385)(2) | | | 100.1 | % | | $ | 20,726,037 | |
| | | | Other Assets and Liabilities | | | (0.1 | )% | | | (22,144 | ) |
| | | | | | | | | | | | |
| | | | Total Net Assets | | | 100.0 | % | | $ | 20,703,893 | |
| | | | | | | | | | | | |
| Note: | Percentage of investments as shown is the ratio of the total market value to total net assets. |
| (1) | See Significant Accounting Policies of accompanying Notes to Financial Statements regarding valuation of securities. |
| (2) | At December 31, 2014, the cost of securities for federal income tax purposes was $17,392,348, and the aggregate gross unrealized appreciation and depreciation based on that cost were: |
| | | | |
Unrealized Appreciation | | $ | 3,333,689 | |
Unrealized Depreciation | | | — | |
| | | | |
Net Unrealized Appreciation | | $ | 3,333,689 | |
| | | | |
At December 31, 2014, the investment valuation hierarchy levels were:
| | | | |
Assets: | | | | |
Investments in Securities - Level 1 | | $ | 20,726,037 | |
| | | | |
Total | | $ | 20,726,037 | |
| | | | |
The accompanying notes are an integral part of these financial statements.
|
| HIMCO VIT American Funds Global Small Capitalization Fund |
Schedule of Investments
December 31, 2014
|
| HIMCO VIT American Funds Growth Fund |
Schedule of Investments
December 31, 2014
| | | | | | | | | | | | |
Shares | | | | | Market Value(1) | |
| INVESTMENT COMPANIES - 100.1% | |
| | 1,936,323 | | | American Funds Insurance Series - Global Small Capitalization Fund Class 1 | | | | | | $ | 50,518,672 | |
| | | | | | | | | | | | |
| | | |
| | | | Total Investment Companies
(cost $37,920,498) | | | | | | $ | 50,518,672 | |
| | | | | | | | | | | | |
| | | |
| | | | Total Investments
(cost $37,920,498)(2) | | | 100.1 | % | | $ | 50,518,672 | |
| | | | Other Assets and Liabilities | | | (0.1 | )% | | | (40,863 | ) |
| | | | | | | | | | | | |
| | | | Total Net Assets | | | 100.0 | % | | $ | 50,477,809 | |
| | | | | | | | | | | | |
| Note: | Percentage of investments as shown is the ratio of the total market value to total net assets. |
| (1) | See Significant Accounting Policies of accompanying Notes to Financial Statements regarding valuation of securities. |
| (2) | At December 31, 2014, the cost of securities for federal income tax purposes was $38,593,624, and the aggregate gross unrealized appreciation and depreciation based on that cost were: |
| | | | |
Unrealized Appreciation | | $ | 11,925,048 | |
Unrealized Depreciation | | | — | |
| | | | |
Net Unrealized Appreciation | | $ | 11,925,048 | |
| | | | |
At December 31, 2014, the investment valuation hierarchy levels were:
| | | | |
Assets: | | | | |
Investments in Securities - Level 1 | | $ | 50,518,672 | |
| | | | |
Total | | $ | 50,518,672 | |
| | | | |
| | | | | | | | | | | | |
Shares | | | | | Market Value(1) | |
| INVESTMENT COMPANIES - 100.1% | |
| | 3,735,922 | | | American Funds Insurance Series - Growth Fund Class 1 | | | | | | $ | 299,434,111 | |
| | | | | | | | | | | | |
| | | |
| | | | Total Investment Companies (cost $176,280,402) | | | | | | $ | 299,434,111 | |
| | | | | | | | | | | | |
| | | |
| | | | Total Investments
(cost $176,280,402)(2) | | | 100.1 | % | | $ | 299,434,111 | |
| | | | Other Assets and Liabilities | | | (0.1 | )% | | | (179,871 | ) |
| | | | | | | | | | | | |
| | | | Total Net Assets | | | 100.0 | % | | $ | 299,254,240 | |
| | | | | | | | | | | | |
| Note: | Percentage of investments as shown is the ratio of the total market value to total net assets. |
| (1) | See Significant Accounting Policies of accompanying Notes to Financial Statements regarding valuation of securities. |
| (2) | At December 31, 2014, the cost of securities for federal income tax purposes was $185,424,873, and the aggregate gross unrealized appreciation and depreciation based on that cost were: |
| | | | |
Unrealized Appreciation | | $ | 114,009,238 | |
Unrealized Depreciation | | | — | |
| | | | |
Net Unrealized Appreciation | | $ | 114,009,238 | |
| | | | |
At December 31, 2014, the investment valuation hierarchy levels were:
| | | | |
Assets: | | | | |
Investments in Securities - Level 1 | | $ | 299,434,111 | |
| | | | |
Total | | $ | 299,434,111 | |
| | | | |
The accompanying notes are an integral part of these financial statements.
|
| HIMCO VIT American Funds Growth-Income Fund |
Schedule of Investments
December 31, 2014
|
| HIMCO VIT American Fund International Fund |
Schedule of Investments
December 31, 2014
| | | | | | | | | | | | |
Shares | | | | | Market Value(1) | |
| INVESTMENT COMPANIES - 100.1% | |
| | 3,258,975 | | | American Funds Insurance Series - Growth-Income Fund Class 1 | | | | | | $ | 171,943,543 | |
| | | | | | | | | | | | |
| | | |
| | | | Total Investment Companies
(cost $106,990,628) | | | | | | $ | 171,943,543 | |
| | | | | | | | | | | | |
| | | |
| | | | Total Investments
(cost $106,990,628)(2) | | | 100.1 | % | | $ | 171,943,543 | |
| | | | Other Assets and Liabilities | | | (0.1 | )% | | | (111,405 | ) |
| | | | | | | | | | | | |
| | | | Total Net Assets | | | 100.0 | % | | $ | 171,832,138 | |
| | | | | | | | | | | | |
| Note: | Percentage of investments as shown is the ratio of the total market value to total net assets. |
| (1) | See Significant Accounting Policies of accompanying Notes to Financial Statements regarding valuation of securities. |
| (2) | At December 31, 2014, the cost of securities for federal income tax purposes was $110,860,896, and the aggregate gross unrealized appreciation and depreciation based on that cost were: |
| | | | |
Unrealized Appreciation | | $ | 61,082,647 | |
Unrealized Depreciation | | | — | |
| | | | |
Net Unrealized Appreciation | | $ | 61,082,647 | |
| | | | |
At December 31, 2014, the investment valuation hierarchy levels were:
| | | | |
Assets: | | | | |
Investments in Securities - Level 1 | | $ | 171,943,543 | |
| | | | |
Total | | $ | 171,943,543 | |
| | | | |
| | | | | | | | | | | | |
Shares | | | | | Market Value(1) | |
| INVESTMENT COMPANIES - 100.1% | |
| | 8,867,176 | | | American Funds Insurance Series - International Fund - Class 1 | | | | | | $ | 180,447,037 | |
| | | | | | | | | | | | |
| | | |
| | | | Total Investment Companies
(cost $148,609,250) | | | | | | $ | 180,447,037 | |
| | | | | | | | | | | | |
| | | |
| | | | Total Investments
(cost $148,609,250)(2) | | | 100.1 | % | | $ | 180,447,037 | |
| | | | Other Assets and Liabilities | | | (0.1 | )% | | | (108,473 | ) |
| | | | | | | | | | | | |
| | | | Total Net Assets | | | 100.0 | % | | $ | 180,338,564 | |
| | | | | | | | | | | | |
| Note: | Percentage of investments as shown is the ratio of the total market value to total net assets. |
| (1) | See Significant Accounting Policies of accompanying Notes to Financial Statements regarding valuation of securities. |
| (2) | At December 31, 2014, the cost of securities for federal income tax purposes was $153,506,352, and the aggregate gross unrealized appreciation and depreciation based on that cost were: |
| | | | |
Unrealized Appreciation | | $ | 26,940,685 | |
Unrealized Depreciation | | | — | |
| | | | |
Net Unrealized Appreciation | | $ | 26,940,685 | |
| | | | |
At December 31, 2014, the investment valuation hierarchy levels were:
| | | | |
Assets: | | | | |
Investments in Securities - Level 1 | | $ | 180,447,037 | |
| | | | |
Total | | $ | 180,447,037 | |
| | | | |
The accompanying notes are an integral part of these financial statements.
|
HIMCO VIT American Funds New World Fund |
Schedule of Investments
December 31, 2014
| | | | | | | | | | | | |
Shares | | | | | Market Value(1) | |
| INVESTMENT COMPANIES - 100.1% | |
| | 1,311,113 | | | American Funds Insurance Series - New World Fund Class 1 | | | | | | $ | 27,166,271 | |
| | | | | | | | | | | | |
| | | |
| | | | Total Investment Companies
(cost $28,924,722) | | | | | | $ | 27,166,271 | |
| | | | | | | | | | | | |
| | | |
| | | | Total Investments
(cost $28,924,722)(2) | | | 100.1 | % | | $ | 27,166,271 | |
| | | | Other Assets and Liabilities | | | (0.1 | )% | | | (27,833 | ) |
| | | | | | | | | | | | |
| | | | Total Net Assets | | | 100.0 | % | | $ | 27,138,438 | |
| | | | | | | | | | | | |
| Note: | Percentage of investments as shown is the ratio of the total market value to total net assets. |
| (1) | See Significant Accounting Policies of accompanying Notes to Financial Statements regarding valuation of securities. |
| (2) | At December 31, 2014, the cost of securities for federal income tax purposes was $29,326,615, and the aggregate gross unrealized appreciation and depreciation based on that cost were: |
| | | | |
Unrealized Appreciation | | $ | — | |
Unrealized Depreciation | | | (2,160,344 | ) |
| | | | |
Net Unrealized Appreciation | | $ | (2,160,344 | ) |
| | | | |
At December 31, 2014, the investment valuation hierarchy levels were:
| | | | |
Assets: | | | | |
Investments in Securities - Level 1 | | $ | 27,166,271 | |
| | | | |
Total | | $ | 27,166,271 | |
| | | | |
The accompanying notes are an integral part of these financial statements.
[This page is intentionally left blank]
|
| HIMCO Variable Insurance Trust |
Statements of Assets and Liabilities
December 31, 2014
| | | | | | | | | | | | |
| | | HIMCO VIT
American
Funds Asset
Allocation
Fund | | | HIMCO VIT
American
Funds Blue
Chip Income
and Growth
Fund | | | HIMCO VIT
American
Funds Bond
Fund | |
Assets: | | | | | | | | | | | | |
Investments in underlying fund, at market value | | $ | 54,897,003 | | | $ | 47,586,113 | | | $ | 189,191,796 | |
Receivables: | | | | | | | | | | | | |
Investment securities sold | | | 2,603 | | | | 5,958 | | | | 35,054 | |
Fund shares sold | | | — | | | | — | | | | — | |
Other assets | | | 6,314 | | | | 5,218 | | | | 13,877 | |
| | | | | | | | | | | | |
Total assets | | | 54,905,920 | | | | 47,597,289 | | | | 189,240,727 | |
| | | | | | | | | | | | |
Liabilities: | | | | | | | | | | | | |
Payables: | | | | | | | | | | | | |
Investment securities purchased | | | — | | | | — | | | | — | |
Fund shares redeemed | | | 2,603 | | | | 5,958 | | | | 35,054 | |
Investment management fees | | | 11,774 | | | | 10,253 | | | | 40,254 | |
Distribution fees | | | 11,774 | | | | 10,252 | | | | 40,254 | |
Accrued expenses | | | 24,494 | | | | 21,150 | | | | 48,840 | |
| | | | | | | | | | | | |
Total liabilities | | | 50,645 | | | | 47,613 | | | | 164,402 | |
| | | | | | | | | | | | |
Net assets | | $ | 54,855,275 | | | $ | 47,549,676 | | | $ | 189,076,325 | |
| | | | | | | | | | | | |
Summary of Net Assets: | | | | | | | | | | | | |
Capital stock and paid-in-capital | | $ | 45,277,924 | | | $ | 32,407,572 | | | $ | 183,800,795 | |
Undistributed net investment income | | | 721,369 | | | | 1,263,853 | | | | 3,092,390 | |
Accumulated net realized gain (loss) | | | 685,769 | | | | 501,463 | | | | (109,211 | ) |
Unrealized appreciation (depreciation) | | | 8,170,213 | | | | 13,376,788 | | | | 2,292,351 | |
| | | | | | | | | | | | |
Net assets | | $ | 54,855,275 | | | $ | 47,549,676 | | | $ | 189,076,325 | |
| | | | | | | | | | | | |
Class IB: Net asset value per share | | $ | 9.12 | | | $ | 11.25 | | | $ | 9.60 | |
| | | | | | | | | | | | |
Shares Outstanding | | | 6,013,938 | | | | 4,226,622 | | | | 19,696,786 | |
| | | | | | | | | | | | |
Net Assets | | $ | 54,855,275 | | | $ | 47,549,676 | | | $ | 189,076,325 | |
| | | | | | | | | | | | |
Cost of investments in underlying fund | | $ | 46,726,790 | | | $ | 34,209,325 | | | $ | 186,899,445 | |
| | | | | | | | | | | | |
The accompanying notes are an integral part of these financial statements.
|
| HIMCO Variable Insurance Trust |
Statements of Assets and Liabilities – (concluded)
December 31, 2014
| | | | | | | | | | | | | | | | | | | | | | | | | | | | | | |
HIMCO VIT
American
Funds Global
Bond Fund | | | HIMCO VIT
American
Funds Global
Growth and
Income Fund | | | HIMCO VIT
American
Funds Global
Growth Fund | | | HIMCO VIT
American
Funds Global
Small
Capitalization
Fund | | | HIMCO VIT
American
Funds Growth
Fund | | | HIMCO VIT
American
Funds Growth-
Income Fund | | | HIMCO VIT
American
Funds
International
Fund | | | HIMCO VIT
American
Funds New
World Fund | |
| | | | | | | | | | | | | | | | | | | | | | | | | | | | | | |
| $ | 15,061,118 | | | $ | 48,185,999 | | | $ | 20,726,037 | | | $ | 50,518,672 | | | $ | 299,434,111 | | | $ | 171,943,543 | | | $ | 180,447,037 | | | $ | 27,166,271 | |
| | | | | | | | | | | | | | | | | | | | | | | | | | | | | | |
| | 894 | | | | 5,227 | | | | 3,897 | | | | 8,550 | | | | 83,489 | | | | 23,054 | | | | 83,643 | | | | — | |
| | — | | | | — | | | | — | | | | — | | | | — | | | | — | | | | — | | | | 8,261 | |
| | 5,741 | | | | 6,020 | | | | 5,566 | | | | 6,379 | | | | 17,142 | | | | 11,158 | | | | 13,023 | | | | 6,144 | |
| | | | | | | | | | | | | | | | | | | | | | | | | | | | | | |
| | 15,067,753 | | | | 48,197,246 | | | | 20,735,500 | | | | 50,533,601 | | | | 299,534,742 | | | | 171,977,755 | | | | 180,543,703 | | | | 27,180,676 | |
| | | | | | | | | | | | | | | | | | | | | | | | | | | | | | |
| | | | | | | | | | | | | | | | | | | | | | | | | | | | | | |
| | | | | | | | | | | | | | | | | | | | | | | | | | | | | | |
| | — | | | | — | | | | — | | | | — | | | | — | | | | — | | | | — | | | | 8,261 | |
| | 894 | | | | 5,227 | | | | 3,897 | | | | 8,550 | | | | 83,489 | | | | 23,054 | | | | 83,643 | | | | — | |
| | 3,224 | | | | 10,319 | | | | 4,461 | | | | 10,685 | | | | 64,273 | | | | 37,043 | | | | 38,939 | | | | 5,866 | |
| | 3,224 | | | | 10,319 | | | | 4,461 | | | | 10,685 | | | | 64,273 | | | | 37,043 | | | | 38,940 | | | | 5,866 | |
| | 18,249 | | | | 24,571 | | | | 18,788 | | | | 25,872 | | | | 68,467 | | | | 48,477 | | | | 43,617 | | | | 22,245 | |
| | | | | | | | | | | | | | | | | | | | | | | | | | | | | | |
| | 25,591 | | | | 50,436 | | | | 31,607 | | | | 55,792 | | | | 280,502 | | | | 145,617 | | | | 205,139 | | | | 42,238 | |
| | | | | | | | | | | | | | | | | | | | | | | | | | | | | | |
| $ | 15,042,162 | | | $ | 48,146,810 | | | $ | 20,703,893 | | | $ | 50,477,809 | | | $ | 299,254,240 | | | $ | 171,832,138 | | | $ | 180,338,564 | | | $ | 27,138,438 | |
| | | | | | | | | | | | | | | | | | | | | | | | | | | | | | |
| | | | | | | | | | | | | | | | | | | | | | | | | | | | | | |
| $ | 15,517,694 | | | $ | 34,075,041 | | | $ | 17,036,341 | | | $ | 38,007,969 | | | $ | 176,308,185 | | | $ | 105,131,077 | | | $ | 150,229,244 | | | $ | 29,029,242 | |
| | 168,860 | | | | 1,501,496 | | | | 165,242 | | | | — | | | | 2,530,693 | | | | 1,666,336 | | | | 2,004,060 | | | | 261,449 | |
| | (26,376 | ) | | | (962,195 | ) | | | (621,342 | ) | | | (128,334 | ) | | | (2,738,347 | ) | | | 81,810 | | | | (3,732,527 | ) | | | (393,802 | ) |
| | (618,016 | ) | | | 13,532,468 | | | | 4,123,652 | | | | 12,598,174 | | | | 123,153,709 | | | | 64,952,915 | | | | 31,837,787 | | | | (1,758,451 | ) |
| | | | | | | | | | | | | | | | | | | | | | | | | | | | | | |
| $ | 15,042,162 | | | $ | 48,146,810 | | | $ | 20,703,893 | | | $ | 50,477,809 | | | $ | 299,254,240 | | | $ | 171,832,138 | | | $ | 180,338,564 | | | $ | 27,138,438 | |
| | | | | | | | | | | | | | | | | | | | | | | | | | | | | | |
| $ | 8.98 | | | $ | 7.01 | | | $ | 7.35 | | | $ | 7.64 | | | $ | 9.53 | | | $ | 10.09 | | | $ | 7.85 | | | $ | 5.65 | |
| | | | | | | | | | | | | | | | | | | | | | | | | | | | | | |
| | 1,675,988 | | | | 6,867,078 | | | | 2,818,731 | | | | 6,605,522 | | | | 31,413,078 | | | | 17,032,298 | | | | 22,984,692 | | | | 4,805,999 | |
| | | | | | | | | | | | | | | | | | | | | | | | | | | | | | |
| $ | 15,042,162 | | | $ | 48,146,810 | | | $ | 20,703,893 | | | $ | 50,477,809 | | | $ | 299,254,240 | | | $ | 171,832,138 | | | $ | 180,338,564 | | | $ | 27,138,438 | |
| | | | | | | | | | | | | | | | | | | | | | | | | | | | | | |
| $ | 15,679,134 | | | $ | 34,653,531 | | | $ | 16,602,385 | | | $ | 37,920,498 | | | $ | 176,280,402 | | | $ | 106,990,628 | | | $ | 148,609,250 | | | $ | 28,924,722 | |
| | | | | | | | | | | | | | | | | | | | | | | | | | | | | | |
The accompanying notes are an integral part of these financial statements.
|
| HIMCO Variable Insurance Trust |
Statements of Operations
For the Year Ended December 31, 2014
| | | | | | | | | | | | |
| | | HIMCO VIT
American
Funds Asset
Allocation
Fund | | | HIMCO VIT
American
Funds Blue
Chip Income
and Growth
Fund | | | HIMCO VIT
American
Funds Bond
Fund | |
Investment Income: | | | | | | | | | | | | |
Dividends from underlying fund | | $ | 953,966 | | | $ | 1,516,283 | | | $ | 4,268,657 | |
| | | | | | | | | | | | |
Total investment income | | | 953,966 | | | | 1,516,283 | | | | 4,268,657 | |
| | | | | | | | | | | | |
Expenses: | | | | | | | | | | | | |
Investment management fees | | | 376,877 | | | | 334,744 | | | | 1,092,021 | |
Transfer agent fees | | | 2,348 | | | | 2,315 | | | | 2,692 | |
Distribution fees - Class IB | | | 144,952 | | | | 111,581 | | | | 546,011 | |
Custodian fees | | | 40 | | | | 40 | | | | 40 | |
Accounting service fees | | | 7,092 | | | | 5,529 | | | | 27,514 | |
Trustee fees | | | 4,141 | | | | 3,169 | | | | 12,838 | |
Audit fees | | | 22,023 | | | | 21,311 | | | | 27,762 | |
Printing fees | | | 6,726 | | | | 5,883 | | | | 32,872 | |
Legal fees | | | 3,271 | | | | 2,371 | | | | 12,281 | |
Insurance fees | | | 1,368 | | | | 973 | | | | 4,882 | |
Other expenses | | | 2,517 | | | | 2,125 | | | | 5,229 | |
| | | | | | | | | | | | |
Total expenses (before waivers) | | | 571,355 | | | | 490,041 | | | | 1,764,142 | |
| | | | | | | | | | | | |
Total waivers | | | (249,642 | ) | | | (237,642 | ) | | | (587,941 | ) |
| | | | | | | | | | | | |
Total expenses, net | | | 321,713 | | | | 252,399 | | | | 1,176,201 | |
| | | | | | | | | | | | |
Net Investment Income (Loss) | | | 632,253 | | | | 1,263,884 | | | | 3,092,456 | |
| | | | | | | | | | | | |
Net Realized Gain on Investments: | | | | | | | | | | | | |
Capital gain distribution received from underlying fund | | | 2,826,365 | | | | — | | | | 83,695 | |
Net realized gain on investments in underlying fund | | | 4,059,520 | | | | 3,331,376 | | | | 4,124,305 | |
| | | | | | | | | | | | |
Net Realized Gain on Investments | | | 6,885,885 | | | | 3,331,376 | | | | 4,208,000 | |
| | | | | | | | | | | | |
Net Changes in Unrealized Appreciation (Depreciation) of Investments: | | | | | | | | | | | | |
Net unrealized appreciation (depreciation) of investments in underlying fund | | | (4,696,512 | ) | | | 1,717,171 | | | | 3,844,308 | |
| | | | | | | | | | | | |
Net Realized and Unrealized Gain (Loss) on Investments | | | 2,189,373 | | | | 5,048,547 | | | | 8,052,308 | |
| | | | | | | | | | | | |
Net Increase (Decrease) in Net Assets Resulting from Operations | | $ | 2,821,626 | | | $ | 6,312,431 | | | $ | 11,144,764 | |
| | | | | | | | | | | | |
The accompanying notes are an integral part of these financial statements.
|
| HIMCO Variable Insurance Trust |
Statements of Operations – (concluded)
For the Year Ended December 31, 2014
| | | | | | | | | | | | | | | | | | | | | | | | | | | | | | |
HIMCO VIT
American
Funds Global
Bond Fund | | | HIMCO VIT
American
Funds Global
Growth and
Income Fund | | | HIMCO VIT
American
Funds Global
Growth Fund | | | HIMCO VIT
American
Funds Global
Small
Capitalization
Fund | | | HIMCO VIT
American
Funds Growth
Fund | | | HIMCO VIT
American
Funds Growth-
Income Fund | | | HIMCO VIT
American
Funds
International
Fund | | | HIMCO VIT
American
Funds New
World Fund | |
| | | | | | | | | | | | | | | | | | | | | | | | | | | | | | |
| $ | 274,820 | | | $ | 1,825,040 | | | $ | 298,371 | | | $ | 172,122 | | | $ | 4,500,821 | | | $ | 2,659,840 | | | $ | 3,123,183 | | | $ | 373,184 | |
| | | | | | | | | | | | | | | | | | | | | | | | | | | | | | |
| | 274,820 | | | | 1,825,040 | | | | 298,371 | | | | 172,122 | | | | 4,500,821 | | | | 2,659,840 | | | | 3,123,183 | | | | 373,184 | |
| | | | | | | | | | | | | | | | | | | | | | | | | | | | | | |
| | | | | | | | | | | | | | | | | | | | | | | | | | | | | | |
| | 125,867 | | | | 404,593 | | | | 221,137 | | | | 450,144 | | | | 2,425,221 | | | | 1,292,029 | | | | 1,740,463 | | | | 347,563 | |
| | 2,267 | | | | 2,333 | | | | 2,280 | | | | 2,361 | | | | 2,894 | | | | 2,606 | | | | 2,664 | | | | 2,299 | |
| | 41,955 | | | | 126,435 | | | | 55,284 | | | | 140,669 | | | | 808,407 | | | | 461,437 | | | | 511,900 | | | | 78,991 | |
| | 40 | | | | 40 | | | | 40 | | | | 40 | | | | 40 | | | | 40 | | | | 40 | | | | 40 | |
| | 3,414 | | | | 6,167 | | | | 3,833 | | | | 7,158 | | | | 40,038 | | | | 22,720 | | | | 25,475 | | | | 4,624 | |
| | 1,700 | | | | 3,723 | | | | 1,916 | | | | 3,901 | | | | 19,205 | | | | 11,327 | | | | 12,632 | | | | 2,848 | |
| | 20,444 | | | | 21,529 | | | | 20,751 | | | | 21,988 | | | | 31,382 | | | | 26,577 | | | | 27,394 | | | | 21,037 | |
| | 5,325 | | | | 9,189 | | | | 4,411 | | | | 13,315 | | | | 52,417 | | | | 22,516 | | | | 45,179 | | | | 9,506 | |
| | 1,163 | | | | 3,066 | | | | 1,322 | | | | 3,094 | | | | 17,859 | | | | 10,072 | | | | 11,373 | | | | 1,972 | |
| | 460 | | | | 1,251 | | | | 535 | | | | 1,301 | | | | 7,536 | | | | 4,239 | | | | 4,805 | | | | 798 | |
| | 1,918 | | | | 2,633 | | | | 1,844 | | | | 2,338 | | | | 7,701 | | | | 4,983 | | | | 5,562 | | | | 2,200 | |
| | | | | | | | | | | | | | | | | | | | | | | | | | | | | | |
| | 204,553 | | | | 580,959 | | | | 313,353 | | | | 646,309 | | | | 3,412,700 | | | | 1,858,546 | | | | 2,387,487 | | | | 471,878 | |
| | | | | | | | | | | | | | | | | | | | | | | | | | | | | | |
| | (98,655 | ) | | | (295,063 | ) | | | (180,313 | ) | | | (327,212 | ) | | | (1,671,769 | ) | | | (865,137 | ) | | | (1,268,429 | ) | | | (284,801 | ) |
| | | | | | | | | | | | | | | | | | | | | | | | | | | | | | |
| | 105,898 | | | | 285,896 | | | | 133,040 | | | | 319,097 | | | | 1,740,931 | | | | 993,409 | | | | 1,119,058 | | | | 187,077 | |
| | | | | | | | | | | | | | | | | | | | | | | | | | | | | | |
| | 168,922 | | | | 1,539,144 | | | | 165,331 | | | | (146,975 | ) | | | 2,759,890 | | | | 1,666,431 | | | | 2,004,125 | | | | 186,107 | |
| | | | | | | | | | | | | | | | | | | | | | | | | | | | | | |
| | | | | | | | | | | | | | | | | | | | | | | | | | | | | | |
| | 149,548 | | | | — | | | | 2,200,402 | | | | 257,065 | | | | 16,428,023 | | | | 9,216,955 | | | | — | | | | 3,173,842 | |
| | (17,876 | ) | | | 5,114,693 | | | | 2,199,081 | | | | 6,582,280 | | | | 49,931,309 | | | | 26,985,710 | | | | 22,638,076 | | | | 1,035,914 | |
| | | | | | | | | | | | | | | | | | | | | | | | | | | | | | |
| | 131,672 | | | | 5,114,693 | | | | 4,399,483 | | | | 6,839,345 | | | | 66,359,332 | | | | 36,202,665 | | | | 22,638,076 | | | | 4,209,756 | |
| | | | | | | | | | | | | | | | | | | | | | | | | | | | | | |
| | | | | | | | | | | | | | | | | | | | | | | | | | | | | | |
| | (78,535 | ) | | | (3,898,028 | ) | | | (4,171,415 | ) | | | (5,342,231 | ) | | | (43,287,851 | ) | | | (19,435,530 | ) | | | (29,240,127 | ) | | | (6,774,057 | ) |
| | | | | | | | | | | | | | | | | | | | | | | | | | | | | | |
| | 53,137 | | | | 1,216,665 | | | | 228,068 | | | | 1,497,114 | | | | 23,071,481 | | | | 16,767,135 | | | | (6,602,051 | ) | | | (2,564,301 | ) |
| | | | | | | | | | | | | | | | | | | | | | | | | | | | | | |
| $ | 222,059 | | | $ | 2,755,809 | | | $ | 393,399 | | | $ | 1,350,139 | | | $ | 25,831,371 | | | $ | 18,433,566 | | | $ | (4,597,926 | ) | | $ | (2,378,194 | ) |
| | | | | | | | | | | | | | | | | | | | | | | | | | | | | | |
The accompanying notes are an integral part of these financial statements.
|
| HIMCO Variable Insurance Trust |
Statements of Changes in Net Assets
| | | | | | | | | | | | | | | | |
| | | HIMCO VIT American Funds
Asset Allocation Fund | | | HIMCO VIT American Funds Blue
Chip Income and Growth Fund | |
| | | For the
Year Ended
December 31,
2014 | | | For the
Year Ended
December 31,
2013(1) | | | For the
Year Ended
December 31,
2014 | | | For the
Year Ended
December 31,
2013(1) | |
Operations: | | | | | | | | | | | | | | | | |
Net investment income (loss) | | $ | 632,253 | | | $ | 672,429 | | | $ | 1,263,884 | | | $ | 648,481 | |
Net realized gain (loss) on investments | | | 6,885,885 | | | | 13,870,986 | | | | 3,331,376 | | | | 7,073,827 | |
Net unrealized appreciation (depreciation) of investments | | | (4,696,512 | ) | | | (131,605 | ) | | | 1,717,171 | | | | 4,335,305 | |
| | | | | | | | | | | | | | | | |
Net Increase (Decrease) in Net Assets Resulting from Operations | | | 2,821,626 | | | | 14,411,810 | | | | 6,312,431 | | | | 12,057,613 | |
| | | | | | | | | | | | | | | | |
Distributions to Shareholders: | | | | | | | | | | | | | | | | |
From net investment income | | | | | | | | | | | | | | | | |
Class IB | | | (816,074 | ) | | | (1,041,999 | ) | | | (648,000 | ) | | | (628,500 | ) |
From net realized gain on investments | | | | | | | | | | | | | | | | |
Class IB | | | (18,006,855 | ) | | | (4,502,907 | ) | | | (8,904,361 | ) | | | (2,801,967 | ) |
| | | | | | | | | | | | | | | | |
Total distributions | | | (18,822,929 | ) | | | (5,544,906 | ) | | | (9,552,361 | ) | | | (3,430,467 | ) |
| | | | | | | | | | | | | | | | |
Capital Share Transactions: | | | | | | | | | | | | | | | | |
Class IB | | | | | | | | | | | | | | | | |
Sold | | | 2,884,746 | | | | 24,495,222 | | | | 5,879,703 | | | | 12,318,588 | |
Issued on reinvestment of distributions | | | 18,822,929 | | | | 5,544,906 | | | | 9,552,361 | | | | 3,430,467 | |
Redeemed | | | (13,811,821 | ) | | | (40,562,210 | ) | | | (8,144,947 | ) | | | (20,793,621 | ) |
| | | | | | | | | | | | | | | | |
Net increase (decrease) from capital share transactions | | | 7,895,854 | | | | (10,522,082 | ) | | | 7,287,117 | | | | (5,044,566 | ) |
| | | | | | | | | | | | | | | | |
Net Increase (Decrease) in Net Assets | | | (8,105,449 | ) | | | (1,655,178 | ) | | | 4,047,187 | | | | 3,582,580 | |
| | | | | | | | | | | | | | | | |
Net Assets: | | | | | | | | | | | | | | | | |
Beginning of period | | | 62,960,724 | | | | 64,615,902 | | | | 43,502,489 | | | | 39,919,909 | |
| | | | | | | | | | | | | | | | |
End of period | | $ | 54,855,275 | | | $ | 62,960,724 | | | $ | 47,549,676 | | | $ | 43,502,489 | |
| | | | | | | | | | | | | | | | |
Undistributed net investment income | | $ | 721,369 | | | $ | 671,983 | | | $ | 1,263,853 | | | $ | 647,969 | |
| | | | | | | | | | | | | | | | |
Shares: | | | | | | | | | | | | | | | | |
Class IB | | | | | | | | | | | | | | | | |
Sold | | | 265,555 | | | | 2,033,985 | | | | 501,131 | | | | 1,089,965 | |
Issued on reinvestment of distributions | | | 1,953,028 | | | | 474,333 | | | | 856,493 | | | | 306,572 | |
Redeemed | | | (1,190,621 | ) | | | (3,374,721 | ) | | | (665,616 | ) | | | (1,810,723 | ) |
| | | | | | | | | | | | | | | | |
Total share activity | | | 1,027,962 | | | | (866,403 | ) | | | 692,008 | | | | (414,186 | ) |
| | | | | | | | | | | | | | | | |
| (1) | See Note 8 in the accompanying Notes to Financial Statements. |
The accompanying notes are an integral part of these financial statements.
|
| HIMCO Variable Insurance Trust |
Statements of Changes in Net Assets – (continued)
| | | | | | | | | | | | | | | | | | | | | | | | | | | | | | |
HIMCO VIT American Funds
Bond Fund | | | HIMCO VIT American Funds
Global Bond Fund | | | HIMCO VIT American Funds
Global Growth and Income Fund | | | HIMCO VIT American Funds
Global Growth Fund | |
For the
Year Ended
December 31,
2014 | | | For the
Year Ended
December 31,
2013(1) | | | For the
Year Ended
December 31,
2014 | | | For the
Year Ended
December 31,
2013(1) | | | For the
Year Ended
December 31,
2014 | | | For the
Year Ended
December 31,
2013(1) | | | For the
Year Ended
December 31,
2014 | | | For the
Year Ended
December 31,
2013(1) | |
| | | | | | | | | | | | | | | | | | | | | | | | | | | | | | |
| $ | 3,092,456 | | | $ | 3,495,897 | | | $ | 168,922 | | | $ | (168,358 | ) | | $ | 1,539,144 | | | $ | 1,526,673 | | | $ | 165,331 | | | $ | 196,302 | |
| | 4,208,000 | | | | 5,711,614 | | | | 131,672 | | | | 1,462,650 | | | | 5,114,693 | | | | 16,033,109 | | | | 4,399,483 | | | | 6,424,856 | |
| | 3,844,308 | | | | (13,611,293 | ) | | | (78,535 | ) | | | (2,614,042 | ) | | | (3,898,028 | ) | | | (4,585,252 | ) | | | (4,171,415 | ) | | | 199,134 | |
| | | | | | | | | | | | | | | | | | | | | | | | | | | | | | |
| | 11,144,764 | | | | (4,403,782 | ) | | | 222,059 | | | | (1,319,750 | ) | | | 2,755,809 | | | | 12,974,530 | | | | 393,399 | | | | 6,820,292 | |
| | | | | | | | | | | | | | | | | | | | | | | | | | | | | | |
| | | | | | | | | | | | | | | | | | | | | | | | | | | | | | |
| | | | | | | | | | | | | | | | | | | | | | | | | | | | | | |
| | (3,495,510 | ) | | | (4,313,997 | ) | | | (13,100 | ) | | | (888,000 | ) | | | (1,563,826 | ) | | | (1,597,699 | ) | | | (196,001 | ) | | | (147,499 | ) |
| | | | | | | | | | | | | | | | | | | | | | | | | | | | | | |
| | (9,191,724 | ) | | | (5,996,163 | ) | | | (1,386,993 | ) | | | (1,720,101 | ) | | | (20,215,503 | ) | | | (986,231 | ) | | | (9,854,542 | ) | | | (1,739,285 | ) |
| | | | | | | | | | | | | | | | | | | | | | | | | | | | | | |
| | (12,687,234 | ) | | | (10,310,160 | ) | | | (1,400,093 | ) | | | (2,608,101 | ) | | | (21,779,329 | ) | | | (2,583,930 | ) | | | (10,050,543 | ) | | | (1,886,784 | ) |
| | | | | | | | | | | | | | | | | | | | | | | | | | | | | | |
| | | | | | | | | | | | | | | | | | | | | | | | | | | | | | |
| | | | | | | | | | | | | | | | | | | | | | | | | | | | | | |
| | 9,721,114 | | | | 90,232,061 | | | | 1,622,326 | | | | 4,223,185 | | | | 2,443,083 | | | | 4,966,235 | | | | 871,697 | | | | 4,044,992 | |
| | 12,687,234 | | | | 10,310,160 | | | | 1,400,093 | | | | 2,608,101 | | | | 21,779,329 | | | | 2,583,930 | | | | 10,050,543 | | | | 1,886,784 | |
| | (68,635,194 | ) | | | (47,990,602 | ) | | | (3,809,123 | ) | | | (24,089,863 | ) | | | (9,763,893 | ) | | | (40,156,010 | ) | | | (5,070,483 | ) | | | (15,411,349 | ) |
| | | | | | | | | | | | | | | | | | | | | | | | | | | | | | |
| | (46,226,846 | ) | | | 52,551,619 | | | | (786,704 | ) | | | (17,258,577 | ) | | | 14,458,519 | | | | (32,605,845 | ) | | | 5,851,757 | | | | (9,479,573 | ) |
| | | | | | | | | | | | | | | | | | | | | | | | | | | | | | |
| | (47,769,316 | ) | | | 37,837,677 | | | | (1,964,738 | ) | | | (21,186,428 | ) | | | (4,565,001 | ) | | | (22,215,245 | ) | | | (3,805,387 | ) | | | (4,546,065 | ) |
| | | | | | | | | | | | | | | | | | | | | | | | | | | | | | |
| | | | | | | | | | | | | | | | | | | | | | | | | | | | | | |
| | 236,845,641 | | | | 199,007,964 | | | | 17,006,900 | | | | 38,193,328 | | | | 52,711,811 | | | | 74,927,056 | | | | 24,509,280 | | | | 29,055,345 | |
| | | | | | | | | | | | | | | | | | | | | | | | | | | | | | |
| $ | 189,076,325 | | | $ | 236,845,641 | | | $ | 15,042,162 | | | $ | 17,006,900 | | | $ | 48,146,810 | | | $ | 52,711,811 | | | $ | 20,703,893 | | | $ | 24,509,280 | |
| | | | | | | | | | | | | | | | | | | | | | | | | | | | | | |
| $ | 3,092,390 | | | $ | 3,495,443 | | | $ | 168,860 | | | $ | 13,037 | | | $ | 1,501,496 | | | $ | 1,526,673 | | | $ | 165,242 | | | $ | 195,910 | |
| | | | | | | | | | | | | | | | | | | | | | | | | | | | | | |
| | | | | | | | | | | | | | | | | | | | | | | | | | | | | | |
| | | | | | | | | | | | | | | | | | | | | | | | | | | | | | |
| | 988,024 | | | | 9,049,924 | | | | 165,953 | | | | 408,652 | | | | 265,265 | | | | 481,325 | | | | 82,724 | | | | 356,246 | |
| | 1,309,485 | | | | 1,063,204 | | | | 148,896 | | | | 273,128 | | | | 2,881,423 | | | | 251,651 | | | | 1,237,857 | | | | 168,366 | |
| | (6,904,392 | ) | | | (4,729,877 | ) | | | (398,631 | ) | | | (2,361,605 | ) | | | (970,334 | ) | | | (3,865,137 | ) | | | (453,223 | ) | | | (1,352,556 | ) |
| | | | | | | | | | | | | | | | | | | | | | | | | | | | | | |
| | (4,606,883 | ) | | | 5,383,251 | | | | (83,782 | ) | | | (1,679,825 | ) | | | 2,176,354 | | | | (3,132,161 | ) | | | 867,358 | | | | (827,944 | ) |
| | | | | | | | | | | | | | | | | | | | | | | | | | | | | | |
The accompanying notes are an integral part of these financial statements.
|
| HIMCO Variable Insurance Trust |
Statements of Changes in Net Assets – (continued)
| | | | | | | | | | | | | | | | |
| | | HIMCO VIT American Funds
Global Small Capitalization Fund | | | HIMCO VIT American Funds
Growth Fund | |
| | | For the
Year Ended
December 31,
2014 | | | For the
Year Ended
December 31,
2013(1) | | | For the
Year Ended
December 31,
2014 | | | For the
Year Ended
December 31,
2013(1) | |
Operations: | | | | | | | | | | | | | | | | |
Net investment income (loss) | | $ | (146,975 | ) | | $ | 171,889 | | | $ | 2,759,890 | | | $ | 2,087,556 | |
Net realized gain (loss) on investments | | | 6,839,345 | | | | 6,455,196 | | | | 66,359,332 | | | | 42,711,056 | |
Net unrealized appreciation (depreciation) of investments | | | (5,342,231 | ) | | | 7,589,580 | | | | (43,287,851 | ) | | | 45,996,317 | |
| | | | | | | | | | | | | | | | |
Net Increase (Decrease) in Net Assets Resulting from Operations | | | 1,350,139 | | | | 14,216,665 | | | | 25,831,371 | | | | 90,794,929 | |
| | | | | | | | | | | | | | | | |
Distributions to Shareholders: | | | | | | | | | | | | | | | | |
From net investment income | | | | | | | | | | | | | | | | |
Class IB | | | (171,501 | ) | | | (560,199 | ) | | | (2,316,304 | ) | | | (1,685,303 | ) |
From net realized gain on investments | | | | | | | | | | | | | | | | |
Class IB | | | (11,021,642 | ) | | | (5,593,486 | ) | | | (102,664,035 | ) | | | (10,748,912 | ) |
| | | | | | | | | | | | | | | | |
Total distributions | | | (11,193,143 | ) | | | (6,153,685 | ) | | | (104,980,339 | ) | | | (12,434,215 | ) |
| | | | | | | | | | | | | | | | |
Capital Share Transactions: | | | | | | | | | | | | | | | | |
Class IB | | | | | | | | | | | | | | | | |
Sold | | | 2,742,125 | | | | 11,979,117 | | | | 6,018,642 | | | | 31,234,751 | |
Issued on reinvestment of distributions | | | 11,193,143 | | | | 6,153,685 | | | | 104,980,340 | | | | 12,434,215 | |
Redeemed | | | (14,838,445 | ) | | | (18,853,090 | ) | | | (83,613,855 | ) | | | (104,900,293 | ) |
| | | | | | | | | | | | | | | | |
Net increase (decrease) from capital share transactions | | | (903,177 | ) | | | (720,288 | ) | | | 27,385,127 | | | | (61,231,327 | ) |
| | | | | | | | | | | | | | | | |
Net Increase (Decrease) in Net Assets | | | (10,746,181 | ) | | | 7,342,692 | | | | (51,763,841 | ) | | | 17,129,387 | |
| | | | | | | | | | | | | | | | |
Net Assets: | | | | | | | | | | | | | | | | |
Beginning of period | | | 61,223,990 | | | | 53,881,298 | | | | 351,018,081 | | | | 333,888,694 | |
| | | | | | | | | | | | | | | | |
End of period | | $ | 50,477,809 | | | $ | 61,223,990 | | | $ | 299,254,240 | | | $ | 351,018,081 | |
| | | | | | | | | | | | | | | | |
Undistributed net investment income | | $ | — | | | $ | 171,478 | | | $ | 2,530,693 | | | $ | 2,087,109 | |
| | | | | | | | | | | | | | | | |
Shares: | | | | | | | | | | | | | | | | |
Class IB | | | | | | | | | | | | | | | | |
Sold | | | 316,359 | | | | 1,336,020 | | | | 484,196 | | | | 2,713,269 | |
Issued on reinvestment of distributions | | | 1,403,908 | | | | 707,620 | | | | 10,706,784 | | | | 1,059,957 | |
Redeemed | | | (1,580,214 | ) | | | (2,081,233 | ) | | | (6,602,148 | ) | | | (8,885,837 | ) |
| | | | | | | | | | | | | | | | |
Total share activity | | | 140,053 | | | | (37,593 | ) | | | 4,588,832 | | | | (5,112,611 | ) |
| | | | | | | | | | | | | | | | |
| (1) | See Note 8 in the accompanying Notes to Financial Statements. |
The accompanying notes are an integral part of these financial statements.
|
| HIMCO Variable Insurance Trust |
Statements of Changes in Net Assets – (concluded)
| | | | | | | | | | | | | | | | | | | | | | |
HIMCO VIT American Funds
Growth-Income Fund | | | HIMCO VIT American Funds
International Fund | | | HIMCO VIT American Funds
New World Fund | |
For the
Year Ended
December 31,
2014 | | | For the
Year Ended
December 31,
2013(1) | | | For the
Year Ended
December 31,
2014 | | | For the
Year Ended
December 31,
2013(1) | | | For the
Year Ended
December 31,
2014 | | | For the
Year Ended
December 31,
2013(1) | |
| | | | | | | | | | | | | | | | | | | | | | |
| $ | 1,666,431 | | | $ | 1,909,427 | | | $ | 2,004,125 | | | $ | 2,227,606 | | | $ | 186,107 | | | $ | 330,656 | |
| | 36,202,665 | | | | 23,133,476 | | | | 22,638,076 | | | | 19,587,002 | | | | 4,209,756 | | | | 8,062,704 | |
| | (19,435,530 | ) | | | 30,844,000 | | | | (29,240,127 | ) | | | 21,768,002 | | | | (6,774,057 | ) | | | (4,485,844 | ) |
| | | | | | | | | | | | | | | | | | | | | | |
| | 18,433,566 | | | | 55,886,903 | | | | (4,597,926 | ) | | | 43,582,610 | | | | (2,378,194 | ) | | | 3,907,516 | |
| | | | | | | | | | | | | | | | | | | | | | |
| | | | | | | | | | | | | | | | | | | | | | |
| | | | | | | | | | | | | | | | | | | | | | |
| | (1,909,005 | ) | | | (2,338,496 | ) | | | (2,227,209 | ) | | | (2,543,190 | ) | | | (330,200 | ) | | | (325,002 | ) |
| | | | | | | | | | | | | | | | | | | | | | |
| | (55,384,012 | ) | | | (2,360,720 | ) | | | (39,928,767 | ) | | | (4,232,320 | ) | | | (10,565,456 | ) | | | (4,906,810 | ) |
| | | | | | | | | | | | | | | | | | | | | | |
| | (57,293,017 | ) | | | (4,699,216 | ) | | | (42,155,976 | ) | | | (6,775,510 | ) | | | (10,895,656 | ) | | | (5,231,812 | ) |
| | | | | | | | | | | | | | | | | | | | | | |
| | | | | | | | | | | | | | | | | | | | | | |
| | | | | | | | | | | | | | | | | | | | | | |
| | 4,470,366 | | | | 27,350,554 | | | | 8,912,899 | | | | 19,705,190 | | | | 1,860,635 | | | | 5,405,956 | |
| | 57,293,014 | | | | 4,699,217 | | | | 42,155,976 | | | | 6,775,510 | | | | 10,895,656 | | | | 5,231,812 | |
| | (48,760,606 | ) | | | (68,769,147 | ) | | | (50,375,912 | ) | | | (62,186,357 | ) | | | (6,648,171 | ) | | | (26,706,305 | ) |
| | | | | | | | | | | | | | | | | | | | | | |
| | 13,002,774 | | | | (36,719,376 | ) | | | 692,963 | | | | (35,705,657 | ) | | | 6,108,120 | | | | (16,068,537 | ) |
| | | | | | | | | | | | | | | | | | | | | | |
| | (25,856,677 | ) | | | 14,468,311 | | | | (46,060,939 | ) | | | 1,101,443 | | | | (7,165,730 | ) | | | (17,392,833 | ) |
| | | | | | | | | | | | | | | | | | | | | | |
| | | | | | | | | | | | | | | | | | | | | | |
| | 197,688,815 | | | | 183,220,504 | | | | 226,399,503 | | | | 225,298,060 | | | | 34,304,168 | | | | 51,697,001 | |
| | | | | | | | | | | | | | | | | | | | | | |
| $ | 171,832,138 | | | $ | 197,688,815 | | | $ | 180,338,564 | | | $ | 226,399,503 | | | $ | 27,138,438 | | | $ | 34,304,168 | |
| | | | | | | | | | | | | | | | | | | | | | |
| $ | 1,666,336 | | | $ | 1,908,909 | | | $ | 2,004,060 | | | $ | 2,227,144 | | | $ | 261,449 | | | $ | 330,191 | |
| | | | | | | | | | | | | | | | | | | | | | |
| | | | | | | | | | | | | | | | | | | | | | |
| | | | | | | | | | | | | | | | | | | | | | |
| | 365,836 | | | | 2,387,145 | | | | 1,003,124 | | | | 2,147,221 | | | | 246,820 | | | | 591,330 | |
| | 5,493,715 | | | | 397,214 | | | | 5,022,345 | | | | 733,265 | | | | 1,619,438 | | | | 610,260 | |
| | (3,739,816 | ) | | | (5,833,405 | ) | | | (5,082,970 | ) | | | (6,641,181 | ) | | | (802,674 | ) | | | (2,923,022 | ) |
| | | | | | | | | | | | | | | | | | | | | | |
| | 2,119,735 | | | | (3,049,046 | ) | | | 942,499 | | | | (3,760,695 | ) | | | 1,063,584 | | | | (1,721,432 | ) |
| | | | | | | | | | | | | | | | | | | | | | |
The accompanying notes are an integral part of these financial statements.
|
| HIMCO Variable Insurance Trust |
Notes to Financial Statements
December 31, 2014
HIMCO Variable Insurance Trust (the “Trust”) is an open-end management investment company. The Trust is organized under the laws of the State of Delaware and is registered with the Securities and Exchange Commission (“SEC”) under the Investment Company Act of 1940, as amended (“1940 Act”).
The financial statements and the accompanying notes relate to the following funds: HIMCO VIT American Funds Asset Allocation Fund, HIMCO VIT American Funds Blue Chip Income and Growth Fund, HIMCO VIT American Funds Bond Fund, HIMCO VIT American Funds Global Bond Fund, HIMCO VIT American Funds Global Growth and Income Fund, HIMCO VIT American Funds Global Growth Fund, HIMCO VIT American Funds Global Small Capitalization Fund, HIMCO VIT American Funds Growth Fund, HIMCO VIT American Funds Growth-Income Fund, HIMCO VIT American Funds International Fund and HIMCO VIT American Funds New World Fund, (each a “Fund” or together the “Funds”).
The Funds are each a series of the Trust. Each Fund is organized as a diversified open-end management investment company, except for HIMCO VIT American Funds Global Bond Fund, which is non-diversified. Each Fund is authorized to issue an unlimited number of shares with a par value of $0.001 each. The Funds are investment companies and applies specialized accounting and reporting under Accounting Standards codification topic 946, Financial Services – Investment Companies. The Funds serve as underlying investment options for certain variable annuity and variable life insurance separate accounts of Hartford Life Insurance Company (“HLIC”) and its affiliates.
Each Fund operates in the manner of a fund of funds, investing in shares of underlying mutual funds (the “Underlying Funds”). Each Underlying Fund is offered by American Funds Insurance Series, and is a registered open-end investment company. The Funds and their related Underlying Funds are listed below:
| | |
Fund | | Underlying Fund |
HIMCO VIT American Funds Asset Allocation Fund | | Asset Allocation Fund Class 1 |
HIMCO VIT American Funds Blue Chip Income and Growth Fund | | Blue Chip Income and Growth Fund Class 1 |
HIMCO VIT American Funds Bond Fund | | Bond Fund Class 1 |
HIMCO VIT American Funds Global Bond Fund | | Global Bond Fund Class 1 |
HIMCO VIT American Funds Global Growth and Income Fund | | Global Growth and Income Fund Class 1 |
HIMCO VIT American Funds Global Growth Fund | | Global Growth Fund Class 1 |
HIMCO VIT American Funds Global Small Capitalization Fund | | Global Small Capitalization Fund Class 1 |
HIMCO VIT American Funds Growth Fund | | Growth Fund Class 1 |
HIMCO VIT American Funds Growth-Income Fund | | Growth-Income Fund Class 1 |
HIMCO VIT American Funds International Fund | | International Fund Class 1 |
HIMCO VIT American Funds New World Fund | | New World Fund Class 1 |
The financial statements of the Underlying Funds, including the Summary Investment Portfolios, are provided separately and should be read in conjunction with the Funds’ financial statements.
Class IB shares of the Funds are offered at the per share net asset value (“NAV”) without a sales charge and are subject to distribution fees charged pursuant to a Distribution and Service Plan. The Distribution and Service Plan has been adopted in accordance with Rule 12b-1 under the 1940 Act.
Effective October 20, 2014, each Predecessor Fund was reorganized into a corresponding, newly-formed series of the Trust listed below. Each Fund is advised by Hartford Investment Management Company (“Hartford Investment Management”). See Note 7.
| | |
Fund Name Prior to October 20, 2014 | | Fund Name Effective October 20, 2014 |
American Funds Asset Allocation HLS Fund | | HIMCO VIT American Funds Asset Allocation Fund |
American Funds Blue Chip Income and Growth HLS Fund | | HIMCO VIT American Funds Blue Chip Income and Growth Fund |
American Funds Bond HLS Fund | | HIMCO VIT American Funds Bond Fund |
American Funds Global Bond HLS Fund | | HIMCO VIT American Funds Global Bond Fund |
American Funds Global Growth and Income HLS Fund | | HIMCO VIT American Funds Global Growth and Income Fund |
|
| HIMCO Variable Insurance Trust |
Notes to Financial Statements – (continued)
December 31, 2014
| | |
Fund Name Prior to October 20, 2014 | | Fund Name Effective October 20, 2014 |
American Funds Global Growth HLS Fund | | HIMCO VIT American Funds Global Growth Fund |
American Funds Global Small Capitalization HLS Fund | | HIMCO VIT American Funds Global Small Capitalization Fund |
American Funds Growth HLS Fund | | HIMCO VIT American Funds Growth Fund |
American Funds Growth-Income HLS Fund | | HIMCO VIT American Funds Growth-Income Fund |
American Funds International HLS Fund | | HIMCO VIT American Funds International Fund |
American Funds New World HLS Fund | | HIMCO VIT American Funds New World Fund |
| 2. | Significant Accounting Policies: |
The following is a summary of significant accounting policies of the Funds in the preparation of its financial statements, which are in accordance with United States Generally Accepted Accounting Principles (“U.S. GAAP”). The preparation of financial statements in accordance with U.S. GAAP may require management to make estimates and assumptions that affect the reported amounts of assets and liabilities and disclosure of contingent assets and liabilities at the date of the financial statements and the reported amounts of increases and decreases in net assets from operations during the reporting period. Actual results could differ from those estimates.
| | a) | Determination of Net Asset Value – The NAV of the Funds’ shares is determined as of the close of regular trading (normally 4:00 p.m. Eastern Time) (the “NYSE Close”) on each day that the New York Stock Exchange (the “Exchange”) is open (“Valuation Date”). Information that becomes known to the Funds after the NAV has been calculated on a particular day will not generally be used to retroactively adjust the NAV determined earlier that day. |
| | b) | Investment Valuation – Investments in the Underlying Funds are valued at the respective NAV of each Underlying Fund as determined as of the NYSE Close on the Valuation Date. The Prospectuses and Statements of Additional Information for the Underlying Funds explain the valuation methods used for the Underlying Funds, including the circumstances under which the Underlying Funds may use fair value pricing and the effects of doing so. Such Prospectuses and Statements of Additional Information are available on the SEC EDGAR database on its internet site at http://www.sec.gov. |
U.S. GAAP defines fair value as the price that a fund would receive to sell an asset or pay to transfer a liability in an orderly transaction between market participants. The U.S. GAAP fair value measurement standards require disclosure of a fair value hierarchy for each major category of assets and liabilities. Various inputs are used in determining the fair value of the Fund’s investments. These inputs are summarized into three broad hierarchy levels. This hierarchy is based on whether the valuation inputs are observable or unobservable. These levels are:
| | • | | Level 1 – Quoted prices in active markets for identical investments. |
| | • | | Level 2 – Observable inputs other than Level 1 prices, such as quoted prices for similar investments; quoted prices in markets that are not active; or other inputs that are observable or can be corroborated by observable market data. |
| | • | | Level 3 – Significant unobservable inputs that are supported by limited or no market activity. Level 3 may include financial instruments whose values are determined using indicative market quotes or require significant management judgment or estimation. |
Valuation levels are not necessarily indicative of the risk associated with investing in such investments. Individual investments within any of the above mentioned asset classes may be assigned a different hierarchical level than those presented above, as individual circumstances dictate.
For additional information, refer to the Investment Valuation Hierarchy Level Summary which is included in the Schedule of Investments for each Fund.
For purposes of reporting transfers between different hierarchy levels, both transfers in and out of each level, as applicable, are shown as if they occurred at the beginning of the period. During the year ended December 31, 2014, there were no transfers between different hierarchy levels.
| | c) | Investment Transactions and Investment Income – Investment transactions are recorded as of the trade date (the date the order to buy or sell is executed) for financial reporting purposes. Realized gains and losses are determined on the basis of identified cost. |
|
| HIMCO Variable Insurance Trust |
Notes to Financial Statements – (continued)
December 31, 2014
Income and capital gain distributions from the Underlying Funds are accrued on the ex-dividend date.
| | d) | Fund Share Valuation and Dividend Distributions to Shareholders – Orders for the Funds’ shares are executed in accordance with the investment instructions of the contract holders. The NAV of each Fund’s shares is determined as of the close of business on each business day of the Exchange. The NAV is determined for each Fund by dividing the Fund’s net assets by the number of shares outstanding. Orders for the purchase of a Fund’s shares received by an insurance company prior to the close of the Exchange on any day on which the Exchange is open for business are priced at the NAV determined as of the close of the Exchange. Orders received by an insurance company after the close of the Exchange, or on a day on which the Exchange and/or the Fund is not open for business, are priced at the next determined NAV. |
Dividends are declared pursuant to a policy adopted by the Trust’s Board of Trustees based upon the investment performance of the Funds. The policy of all the Funds is to pay dividends from net investment income and realized capital gains, if any, at least once a year.
Distributions from net investment income, realized capital gains and capital are determined in accordance with federal income tax regulations, which may differ from U.S. GAAP with respect to character and timing. These differences may include, but are not limited to, losses deferred due to wash sale adjustments and short-term capital gain adjustments. Permanent book and federal income tax basis differences relating to shareholder distributions will result in reclassifications to certain of the Funds’ capital accounts (see Federal Income Taxes: Reclassification of Capital Accounts note).
The Funds are exposed to the risks of the Underlying Funds in direct proportion to the amount of assets each Fund allocates to each Underlying Fund. The market values of the Underlying Funds may decline due to general market conditions which are not specifically related to a particular fund, such as real or perceived adverse economic conditions or adverse investor sentiment generally.
| | a) | Federal Income Taxes – For federal income tax purposes, the Funds intend to continue to qualify as Regulated Investment Companies (“RIC”) under Subchapter M of the Internal Revenue Code (“IRC”) by distributing substantially all of their taxable net investment income and net realized capital gains to their shareholders and otherwise complying with the requirements of the IRC. The Funds have distributed substantially all of their income and capital gains in the prior year and each Fund intends to distribute substantially all of its income and gains prior to the next fiscal year end. Accordingly, no provision for federal income or excise taxes has been made in the accompanying financial statements. Distributions from short-term capital gains are treated as ordinary income distributions for federal income tax purposes. |
| | b) | Net Investment Income (Loss), Net Realized Gains (Losses) and Distributions – Net investment income (loss) and net realized gains (losses) may differ for financial statement and tax purposes primarily because of losses deferred due to wash sale adjustments and short-term capital gain distribution adjustments. The character of distributions made during the year from net investment income or net realized gains may differ from their ultimate characterization for federal income tax purposes. Also, due to the timing of dividend distributions, the fiscal year in which amounts are distributed may differ from the year that the net investment income (loss) or net realized gains (losses) were recorded by a Fund. |
|
| HIMCO Variable Insurance Trust |
Notes to Financial Statements – (continued)
December 31, 2014
| | c) | Distributions and Components of Distributable Earnings – The tax character of distributions paid by the Funds for the periods indicated is as follows (as adjusted for dividends payable, if applicable): |
| | | | | | | | | | | | | | | | |
| | | For the Year Ended
December 31, 2014 | | | For the Year Ended
December 31, 2013 | |
| | | Ordinary
Income | | | Long-
Term
Capital
Gains(1) | | | Ordinary
Income | | | Long-
Term
Capital
Gains(1) | |
HIMCO VIT American Funds Asset Allocation Fund | | $ | 816,074 | | | $ | 18,006,855 | | | $ | 1,041,999 | | | $ | 4,502,907 | |
HIMCO VIT American Funds Blue Chip Income and Growth Fund | | | 648,000 | | | | 8,904,361 | | | | 628,500 | | | | 2,801,967 | |
HIMCO VIT American Funds Bond Fund | | | 3,495,510 | | | | 9,191,724 | | | | 4,313,997 | | | | 5,996,163 | |
HIMCO VIT American Funds Global Bond Fund | | | 13,100 | | | | 1,386,993 | | | | 888,000 | | | | 1,720,101 | |
HIMCO VIT American Funds Global Growth and Income Fund | | | 1,563,826 | | | | 20,215,503 | | | | 1,597,700 | | | | 986,231 | |
HIMCO VIT American Funds Global Growth Fund | | | 196,001 | | | | 9,854,542 | | | | 147,499 | | | | 1,739,285 | |
HIMCO VIT American Funds Global Small Capitalization Fund | | | 171,479 | | | | 11,021,664 | | | | 560,199 | | | | 5,593,486 | |
HIMCO VIT American Funds Growth Fund | | | 2,316,304 | | | | 102,664,035 | | | | 1,685,303 | | | | 10,748,912 | |
HIMCO VIT American Funds Growth-Income Fund | | | 1,909,005 | | | | 55,384,012 | | | | 2,338,496 | | | | 2,360,720 | |
HIMCO VIT American Funds International Fund | | | 2,227,209 | | | | 39,928,767 | | | | 2,543,190 | | | | 4,232,320 | |
HIMCO VIT American Funds New World Fund | | | 330,200 | | | | 10,565,456 | | | | 325,002 | | | | 4,906,810 | |
| | (1) | The Funds designate these distributions as long-term capital dividends per IRC code Sec. 852(b) (3) (C). |
As of December 31, 2014, the components of distributable earnings (deficit) on a tax basis were as follows:
| | | | | | | | | | | | | | | | |
| | | Undistributed
Ordinary
Income | | | Undistributed
Long-Term
Capital Gain | | | Unrealized
Appreciation
(Depreciation)(1) | | | Total
Accumulated
Earnings
(Deficit) | |
HIMCO VIT American Funds Asset Allocation Fund | | $ | 721,369 | | | $ | 758,342 | | | $ | 8,097,640 | | | $ | 9,577,351 | |
HIMCO VIT American Funds Blue Chip Income and Growth Fund | | | 1,263,853 | | | | 708,748 | | | | 13,169,503 | | | | 15,142,104 | |
HIMCO VIT American Funds Bond Fund | | | 3,092,390 | | | | 414,390 | | | | 1,768,750 | | | | 5,275,530 | |
HIMCO VIT American Funds Global Bond Fund | | | 168,860 | | | | 1,369 | | | | (645,761 | ) | | | (475,532 | ) |
HIMCO VIT American Funds Global Growth and Income Fund | | | 1,501,496 | | | | 668,983 | | | | 11,901,290 | | | | 14,071,769 | |
HIMCO VIT American Funds Global Growth Fund | | | 165,242 | | | | 168,621 | | | | 3,333,689 | | | | 3,667,552 | |
HIMCO VIT American Funds Global Small Capitalization Fund | | | — | | | | 544,792 | | | | 11,925,048 | | | | 12,469,840 | |
HIMCO VIT American Funds Growth Fund | | | 2,530,693 | | | | 6,406,124 | | | | 114,009,238 | | | | 122,946,055 | |
HIMCO VIT American Funds Growth-Income Fund | | | 1,666,336 | | | | 3,952,078 | | | | 61,082,647 | | | | 66,701,061 | |
HIMCO VIT American Funds International Fund | | | 2,004,060 | | | | 1,164,575 | | | | 26,940,685 | | | | 30,109,320 | |
HIMCO VIT American Funds New World Fund | | | 261,449 | | | | 8,091 | | | | (2,160,344 | ) | | | (1,890,804 | ) |
| | (1) | The differences between book-basis and tax-basis unrealized appreciation (depreciation) are attributable primarily to the tax deferral of wash sale losses. |
|
| HIMCO Variable Insurance Trust |
Notes to Financial Statements – (continued)
December 31, 2014
| | d) | Reclassification of Capital Accounts – The Funds may record reclassifications in their capital accounts. These reclassifications have no impact on the total net assets of the Funds. The reclassifications are a result of permanent differences between U.S. GAAP and tax accounting for items such as net operating losses that reduce distribution requirements. Adjustments are made to reflect the impact these items have on current and future distributions to shareholders. Therefore, the source of a Fund’s distributable income may be shown in the accompanying Statements of Assets and Liabilities as from net investment income, from net realized gains on investments or from capital depending on the type of book and tax differences that exist. For the year ended December 31, 2014, the Funds recorded the following reclassifications to increase (decrease) the accounts listed below. |
| | | | | | | | | | | | |
| | | Paid in
Capital | | | Undistributed
Net Investment
Income (Loss) | | | Accumulated
Net Realized
Gain (Loss) | |
HIMCO VIT American Funds Asset Allocation Fund | | $ | — | | | $ | 233,207 | | | $ | (233,207 | ) |
HIMCO VIT American Funds Blue Chip Income and Growth Fund | | | 1 | | | | — | | | | (1 | ) |
HIMCO VIT American Funds Bond Fund | | | (2 | ) | | | 1 | | | | 1 | |
HIMCO VIT American Funds Global Bond Fund | | | (1 | ) | | | 1 | | | | — | |
HIMCO VIT American Funds Global Growth and Income Fund | | | 2 | | | | (2 | ) | | | — | |
HIMCO VIT American Funds Global Growth Fund | | | (1 | ) | | | 2 | | | | (1 | ) |
HIMCO VIT American Funds Global Small Capitalization Fund | | | (146,975 | ) | | | 146,998 | | | | (23 | ) |
HIMCO VIT American Funds Growth Fund | | | 2 | | | | (2 | ) | | | — | |
HIMCO VIT American Funds Growth-Income Fund | | | — | | | | 1 | | | | (1 | ) |
HIMCO VIT American Funds International Fund | | | 1 | | | | — | | | | (1 | ) |
HIMCO VIT American Funds New World Fund | | | (2 | ) | | | 75,351 | | | | (75,349 | ) |
| | e) | Capital Loss Carryforward – On December 22, 2010, the Regulated Investment Company Modernization Act of 2010 (the “Act”) was enacted, which made changes to the capital loss carryforward rules. The changes are effective for taxable years beginning after the date of enactment. Under the Act, funds are permitted to carry forward capital losses for an unlimited period. Additionally, capital loss carryforwards retain their character as either short-term or long-term capital losses rather than being considered all short-term as permitted under prior regulation. |
The Funds had no capital loss carryforward for U.S. federal income tax purposes as of December 31, 2014.
| | f) | Accounting for Uncertainty in Income Taxes – The Funds have adopted financial reporting rules that require the Funds to analyze all open tax years, as defined by the Statute of Limitations, for all major jurisdictions. Generally, tax authorities can examine all tax returns filed for the last three years. The Funds do not have an examination in progress. |
The Funds have reviewed all open tax years and major jurisdictions and concluded that these financial reporting rules have no effect on the Funds’ financial positions or results of operations. There is no tax liability resulting from unrecognized tax benefits relating to uncertain income tax positions taken or expected to be taken on the tax returns for the fiscal year-end December 31, 2014. The Funds are also not aware of any tax positions for which it is reasonably possible that the total amounts of unrecognized tax benefits will significantly change in the next twelve months.
| | a) | Investment Management Agreement – Prior to October 20, 2014, Hartford Funds Management Company, LLC (“HFMC”), an indirect wholly owned subsidiary of The Hartford Financial Services Group, Inc. (“The Hartford”), served as investment manager to the Funds pursuant to an Investment Management Agreement with the Hartford Series Fund, Inc. (“HSF”). As a result of the Reorganization, effective October 20, 2014, Hartford Investment Management serves as the Funds investment manager pursuant to an Investment Management Agreement with the Trust. The investment manager provides day-to-day investment management services to the Funds and has overall investment supervisory responsibility for each Fund. In addition, the investment manager provides administrative personnel, services, equipment, facilities and office space for operation of the Funds. |
|
| HIMCO Variable Insurance Trust |
Notes to Financial Statements – (continued)
December 31, 2014
Prior to October 20, 2014, the schedule below reflects the compensation as a percentage of each Fund’s average daily net assets paid to Hartford Funds Management Company, LLC (“HFMC”) for investment management services rendered during the period from January 1, 2014 through October 19, 2014. The rates were accrued daily and paid monthly:
| | | | |
Fund | | Annual Rate* | |
American Funds Asset Allocation HLS Fund | | | 0.65 | % |
American Funds Blue Chip Income and Growth HLS Fund | | | 0.75 | % |
American Funds Bond HLS Fund | | | 0.50 | % |
American Funds Global Bond HLS Fund | | | 0.75 | % |
American Funds Global Growth and Income HLS Fund | | | 0.80 | % |
American Funds Global Growth HLS Fund | | | 1.00 | % |
American Funds Global Small Capitalization HLS Fund | | | 0.80 | % |
American Funds Growth HLS Fund | | | 0.75 | % |
American Funds Growth-Income HLS Fund | | | 0.70 | % |
American Funds International HLS Fund | | | 0.85 | % |
American Funds New World HLS Fund | | | 1.10 | % |
| | * | HFMC had entered into an agreement under which it waived a portion of its investment management fee with respect to each Fund for as long as that Fund was invested in its corresponding Underlying Fund. The net investment management fee under the agreement with HFMC, after giving effect to the waiver, was 0.25% of the average daily net assets for each Fund. |
The schedule below reflects the rates of compensation as a percentage of each Fund’s average daily net assets paid to the Hartford Investment Management for investment management services rendered during the period from October 20, 2014 through December 31, 2014. The rates are accrued daily and paid monthly:
| | | | | | | | |
Fund | | Annual
Rate | | | Annual
Waiver
Rate* | |
HIMCO VIT American Funds Asset Allocation Fund | | | 0.65 | % | | | 0.44 | % |
HIMCO VIT American Funds Blue Chip Income and Growth Fund | | | 0.75 | % | | | 0.54 | % |
HIMCO VIT American Funds Bond Fund | | | 0.50 | % | | | 0.28 | % |
HIMCO VIT American Funds Global Bond Fund | | | 0.75 | % | | | 0.58 | % |
HIMCO VIT American Funds Global Growth and Income Fund | | | 0.80 | % | | | 0.59 | % |
HIMCO VIT American Funds Global Growth Fund | | | 1.00 | % | | | 0.80 | % |
HIMCO VIT American Funds Global Small Capitalization Fund | | | 0.80 | % | | | 0.55 | % |
HIMCO VIT American Funds Growth Fund | | | 0.75 | % | | | 0.53 | % |
HIMCO VIT American Funds Growth-Income Fund | | | 0.70 | % | | | 0.49 | % |
HIMCO VIT American Funds International Fund | | | 0.85 | % | | | 0.60 | % |
HIMCO VIT American Funds New World Fund | | | 1.10 | % | | | 0.87 | % |
| | * | Hartford Investment Management has contractually agreed with the Trust, on behalf of the Funds, to waive a portion of its management fee for as long as the Funds are part of a master-feeder structure. The Trust’s Board of Trustees may change or eliminate this waiver if the fund structure changes. Additionally, Hartford Investment Management has contractually agreed to reimburse expenses to the extent necessary to maintain total annual operating expenses on each fund. This contractual arrangement will remain in effect until April 30, 2016. |
| | b) | Accounting Services Agreement – Prior to October 20, 2014, pursuant to the Fund Accounting Agreement between HFMC and HSF, on behalf of the Funds, HFMC provided accounting services to the Funds and received monthly compensation of 0.01% of each Fund’s average daily net assets. These fees were accrued daily and paid monthly. Effective October 20, 2014, State Street Bank and Trust Company provides the Funds with accounting services pursuant to a fund accounting agreement by and between the Trust, on behalf of the Funds, and State Street Bank and Trust Company. The amount paid for accounting services can be found in the Statements of Operations. These fees are accrued daily and paid monthly. |
| | c) | Operating Expenses – Allocable expenses incurred by the Trust are allocated to each Fund in proportion to the average daily net assets of each Fund, except where allocation of certain expenses is more fairly made directly to the Fund. |
|
| HIMCO Variable Insurance Trust |
Notes to Financial Statements – (continued)
December 31, 2014
| | d) | Distribution Plan for Class IB shares – Prior to October 20, 2014, Hartford Funds Distributors, LLC (“HFD”), an indirect wholly owned subsidiary of The Hartford, served as the Funds’ principal underwriter and distributor. Effective October 20, 2014, HIMCO Distribution Services Company (“HDSC”), a wholly owned subsidiary of The Hartford, serves as the Fund’s principal underwriter and distributor. The Trust, on behalf of the Funds, has adopted a Distribution Plan pursuant to Rule 12b-1 of the 1940 Act to compensate the distributor from assets attributable to the Class IB shares for services rendered and expenses borne in connection with activities primarily intended to result in the sale of the Class IB shares, subject to the review and approval of the Trust’s Board of Trustees. |
The Distribution Plan provides that each Fund may pay annually up to 0.25% of the average daily net assets of each Fund attributable to its Class IB shares for activities primarily intended to result in the sale of Class IB shares. The Board has the authority to suspend or reduce these payments at any point in time. Under the terms of the Distribution Plan and the principal underwriting agreement, each Fund is authorized to make payments monthly to the distributor that may be used to pay or compensate entities providing distribution and shareholder servicing with respect to the Class IB shares for such entities’ fees or expenses incurred or paid in that regard. These fees are accrued daily and paid monthly or at such other intervals as the Board of Trustees may determine.
| | e) | Other Related Party Transactions – Prior to October 20, 2014, Hartford Administrative Services Company (“HASCO”), an indirect wholly owned subsidiary of The Hartford, provided transfer agent services to the Funds. HASCO was compensated on a per account basis for providing such services. Effective October 20, 2014, State Street Bank and Trust Company provides transfer agent services to the Funds. The transfer agent is reimbursed for out-of-pocket expenses and other costs associated with the services it provides to the Funds, including costs invoiced by sub-contractors. Hartford Investment Management and its affiliates may pay, out of their own assets, compensation to third-party administrators for recordkeeping and other administrative services. The amount paid for transfer agent services can be found in the Statements of Operations. These fees are accrued daily and paid monthly. |
| | f) | Trustee Fees – The Board of Trustees is responsible for oversight of the Funds. The Board of Trustees elects officers who are responsible for the day to day operations of the Funds. The Board of Trustees oversees the investment manager and the other principal service providers of the Funds. The Board of Trustees currently holds four regularly scheduled meetings throughout each year. In addition, the Board of Trustees may hold special meetings at other times either in person or by telephone. The Trustee fees paid during the period can be found in the Statements of Operations. |
| 6. | Investment Transactions: |
For the year ended December 31, 2014, aggregate cost of purchases and sales of investments in Underlying Funds (excluding short-term investments) were as follows:
| | | | | | | | |
| | | Cost of Purchases
Excluding U.S.
Government
Obligations | | | Sales Proceeds
Excluding U.S.
Government
Obligations | |
HIMCO VIT American Funds Asset Allocation Fund | | $ | 6,304,795 | | | $ | 13,751,730 | |
HIMCO VIT American Funds Blue Chip Income and Growth Fund | | | 6,901,948 | | | | 7,885,260 | |
HIMCO VIT American Funds Bond Fund | | | 13,428,094 | | | | 69,099,927 | |
HIMCO VIT American Funds Global Bond Fund | | | 1,934,703 | | | | 3,797,723 | |
HIMCO VIT American Funds Global Growth and Income Fund | | | 3,791,066 | | | | 9,553,146 | |
HIMCO VIT American Funds Global Growth Fund | | | 3,288,332 | | | | 5,114,085 | |
HIMCO VIT American Funds Global Small Capitalization Fund | | | 2,761,304 | | | | 14,729,395 | |
HIMCO VIT American Funds Growth Fund | | | 26,116,622 | | | | 84,410,034 | |
HIMCO VIT American Funds Growth-Income Fund | | | 14,686,238 | | | | 48,022,999 | |
HIMCO VIT American Funds International Fund | | | 11,324,605 | | | | 50,723,372 | |
HIMCO VIT American Funds New World Fund | | | 5,143,396 | | | | 6,560,235 | |
|
| HIMCO Variable Insurance Trust |
Notes to Financial Statements – (continued)
December 31, 2014
Reorganization of the American Funds HLS Funds (the “American Funds HLS Funds”) into the Funds: At a meeting held on May 6, 2014, the Board of Directors of the American Funds HLS Funds approved on behalf of each American Funds HLS Fund, the reorganization of the American Funds HLS Funds as noted below. The Funds are a newly organized series of the Trust.
| | |
Fund Name Prior to October 20, 2014
(“American Funds HLS”) | | Fund Name Effective October 20, 2014
(“the Funds”) |
American Funds Asset Allocation HLS Fund | | HIMCO VIT American Funds Asset Allocation Fund |
American Funds Blue Chip Income and Growth HLS Fund | | HIMCO VIT American Funds Blue Chip Income and Growth Fund |
American Funds Bond HLS Fund | | HIMCO VIT American Funds Bond Fund |
American Funds Global Bond HLS Fund | | HIMCO VIT American Funds Global Bond Fund |
American Funds Global Growth and Income HLS Fund | | HIMCO VIT American Funds Global Growth and Income Fund |
American Funds Global Growth HLS Fund | | HIMCO VIT American Funds Global Growth Fund |
American Funds Global Small Capitalization HLS Fund | | HIMCO VIT American Funds Global Small Capitalization Fund |
American Funds Growth HLS Fund | | HIMCO VIT American Funds Growth Fund |
American Funds Growth-Income HLS Fund | | HIMCO VIT American Funds Growth-Income Fund |
American Funds International HLS Fund | | HIMCO VIT American Funds International Fund |
American Funds New World HLS Fund | | HIMCO VIT American Funds New World Fund |
Under the terms of the Agreement and Plan of Reorganization, the assets and liabilities of the American Funds HLS Funds were acquired by the Funds immediately before the opening of business on October 20, 2014. The Funds acquired the assets and liabilities of the American Funds HLS Funds in exchange for shares in the Funds, which were distributed pro rata by the American Funds HLS Funds to shareholders, in complete liquidation of the American Funds HLS Funds.
This merger was accomplished by tax free exchange as detailed below:
| | | | | | | | | | | | | | | | | | | | |
| | | Net assets of
American Funds
HLS Fund on
October 17, 2014* | | | Net assets of
Fund
Immediately
Before Merger | | | Net assets of
Fund
Immediately
After Merger | | | American Funds
HLS Fund
Shares Exchanged | | | Fund Shares
Issued to the
American Funds
HLS Fund’s
Shareholders | |
HIMCO VIT American Funds Asset Allocation Fund | | $ | 54,279,829 | | | $ | — | | | $ | 54,279,829 | | | | 6,261,997 | | | | 6,261,997 | |
HIMCO VIT American Funds Blue Chip Income & Growth Fund | | | 44,436,717 | | | | — | | | | 44,436,717 | | | | 4,259,160 | | | | 4,259,160 | |
HIMCO VIT American Funds Bond Fund | | | 194,032,472 | | | | — | | | | 194,032,472 | | | | 20,232,938 | | | | 20,232,938 | |
HIMCO VIT American Funds Global Bond Fund | | | 15,758,200 | | | | — | | | | 15,758,200 | | | | 1,709,482 | | | | 1,709,482 | |
HIMCO VIT American Funds Global Growth And Income Fund | | | 45,769,615 | | | | — | | | | 45,769,615 | | | | 6,960,288 | | | | 6,960,288 | |
HIMCO VIT American Funds Global Growth Fund | | | 19,640,786 | | | | — | | | | 19,640,786 | | | | 2,859,879 | | | | 2,859,879 | |
HIMCO VIT American Funds Global Small Capitalization Fund | | | 48,502,349 | | | | — | | | | 48,502,349 | | | | 6,763,641 | | | | 6,763,641 | |
HIMCO VIT American Funds Growth Fund | | | 283,707,458 | | | | — | | | | 283,707,458 | | | | 32,358,163 | | | | 32,358,163 | |
HIMCO VIT American Funds Growth-Income Fund | | | 164,648,939 | | | | — | | | | 164,648,939 | | | | 17,575,722 | | | | 17,575,722 | |
|
| HIMCO Variable Insurance Trust |
Notes to Financial Statements – (continued)
December 31, 2014
| | | | | | | | | | | | | | | | | | | | |
| | | Net assets of
American Funds
HLS Fund on
October 17, 2014* | | | Net assets of
Fund
Immediately
Before Merger | | | Net assets of
Fund
Immediately
After Merger | | | American Funds
HLS Fund
Shares Exchanged | | | Fund Shares
Issued to the
American Funds
HLS Fund’s
Shareholders | |
HIMCO VIT American Funds International Fund | | $ | 179,339,367 | | | $ | — | | | $ | 179,339,367 | | | $ | 23,534,856 | | | $ | 23,534,856 | |
HIMCO VIT American Funds New World Fund | | | 28,133,153 | | | | — | | | | 28,133,153 | | | | 4,855,909 | | | | 4,855,909 | |
| | * | Final day of operations immediately prior to the merger. |
Assuming the acquisition had been completed on January 1, 2014, the beginning of the annual reporting period of the Funds, the Funds’ pro forma results of operations for the year ended December 31, 2014, are as follows:
| | | | | | | | | | | | |
| | | Net Investment
Income (loss) | | | Net Realized and
Unrealized Gain
(loss) on
Investments | | | Net Increase
(Decrease) in Net
Assets Resulting
from Operations | |
HIMCO VIT American Funds Asset Allocation Fund | | | 632,253 | | | | 2,189,373 | | | | 2,821,626 | |
HIMCO VIT American Funds Blue Chip Income & Growth Fund | | | 1,263,884 | | | | 5,048,547 | | | | 6,312,431 | |
HIMCO VIT American Funds Bond Fund | | | 3,092,456 | | | | 8,052,308 | | | | 11,144,764 | |
HIMCO VIT American Funds Global Bond Fund | | | 168,922 | | | | 53,137 | | | | 222,059 | |
HIMCO VIT American Funds Global Growth And Income Fund | | | 1,539,144 | | | | 1,216,665 | | | | 2,755,809 | |
HIMCO VIT American Funds Global Growth Fund | | | 165,331 | | | | 228,068 | | | | 393,399 | |
HIMCO VIT American Funds Global Small Capitalization Fund | | | (146,975 | ) | | | 1,497,114 | | | | 1,350,139 | |
HIMCO VIT American Funds Growth Fund | | | 2,759,890 | | | | 23,071,481 | | | | 25,831,371 | |
HIMCO VIT American Funds Growth-Income Fund | | | 1,666,431 | | | | 16,767,135 | | | | 18,433,566 | |
HIMCO VIT American Funds International Fund | | | 2,004,125 | | | | (6,602,051 | ) | | | (4,597,926 | ) |
HIMCO VIT American Funds New World Fund | | | 186,107 | | | | (2,564,301 | ) | | | (2,378,194 | ) |
Because the combined investment portfolios for each American Funds HLS Fund/Fund has been managed as a single integrated portfolio since the reorganizations were completed, it is not practicable to separate the amounts of revenue and earnings for each American Funds HLS Fund that have been included in the Statements of Operations since October 20, 2014.
| 8. | Appointment of Independent Registered Public Accounting Firm: |
In connection with an Agreement and Plan of Reorganization (the “Reorganization Plan”), the Board of Trustees of the Funds, with the approval and recommendation of the Audit Committee, appointed Deloitte & Touche LLP to serve as the Funds’ independent registered public accounting firm for the fiscal year ending December 31, 2014. Prior to the Reorganization, Ernst & Young LLP served as the American Funds HLS Funds’ independent registered public accounting firm, whereby Ernst & Young LLP completed the audit of the American Funds HLS Funds’ financial statements for the fiscal year ended December 31, 2013.
| 9. | Shareholder Meeting Results: |
A special meeting of Shareholders of the Funds was held on September 15, 2014 (“Shareholder Meeting”). The proposal was to approve the Reorganization Plan providing for the acquisition of all of the assets and liabilities of the American Funds HLS Funds by the corresponding Fund, each a series of the Trust, solely in exchange for shares of the Funds, followed by the
|
| HIMCO Variable Insurance Trust |
Notes to Financial Statements – (concluded)
December 31, 2014
distribution on a pro rata basis of the Fund’s shares to current shareholders of the American Funds HLS Funds and the complete liquidation of the American Funds HLS Funds. The final results of the Shareholder Meeting are reported below:
| | | | | | | | | | | | |
| | | For | | | Against | | | Abstain | |
HIMCO VIT American Funds Asset Allocation Fund | | | 3,974,262 | | | | 228,730 | | | | 305,795 | |
HIMCO VIT American Funds Blue Chip Income & Growth Fund | | | 3,077,972 | | | | 126,745 | | | | 193,316 | |
HIMCO VIT American Funds Bond Fund | | | 20,387,294 | | | | 678,838 | | | | 1,343,587 | |
HIMCO VIT American Funds Global Bond Fund | | | 1,495,066 | | | | 1,555 | | | | 230,448 | |
HIMCO VIT American Funds Global Growth And Income Fund | | | 4,074,399 | | | | 87,977 | | | | 250,904 | |
HIMCO VIT American Funds Global Growth Fund | | | 1,647,625 | | | | 37,213 | | | | 101,765 | |
HIMCO VIT American Funds Global Small Capitalization Fund | | | 5,235,657 | | | | 221,628 | | | | 501,181 | |
HIMCO VIT American Funds Growth Fund | | | 22,056,944 | | | | 858,970 | | | | 1,990,916 | |
HIMCO VIT American Funds Growth-Income Fund | | | 12,257,624 | | | | 287,828 | | | | 1,134,573 | |
HIMCO VIT American Funds International Fund | | | 17,957,534 | | | | 752,699 | | | | 1,675,278 | |
HIMCO VIT American Funds New World Fund | | | 3,196,840 | | | | 96,097 | | | | 210,590 | |
10. Recent Accounting Pronouncement:
In June 2014, the Financial Accounting Standards Board (FASB) issued Accounting Standards Update (ASU) No. 2014-11, Transfers and Servicing (Topic 860): Repurchase-to-Maturity Transactions, Repurchase Financings, and Disclosures, modifying Accounting Standards Codification Topic 860. The amended guidance changes the accounting for repurchase-to-maturity transactions and repurchase financing arrangements. The guidance also requires new disclosures for certain transfers accounted for as sales and collateral supporting transactions that are accounted for as secured borrowings. ASU 2014-11 is effective for annual and interim periods beginning after December 15, 2014, except for the disclosures related to secured borrowings, which are effective for annual periods beginning after December 15, 2014, and for interim periods beginning after March 15, 2015. The adoption of ASU 2014-11 is not expected to have a material impact on the Fund’s results of operations or financial position, but may impact the Fund’s disclosures.
Under the Trust’s organizational documents, the Trust shall indemnify its officers and trustees to the full extent required or permitted under Delaware Statutory Trust Act and the federal securities laws. In addition, the Trust, on behalf of the Funds, may enter into contracts that contain a variety of indemnifications. The Trust’s maximum exposure under these arrangements is unknown. However, as of the date of these financial statements the Trust has not had prior claims or losses pursuant to these contracts and expects the risk of loss to be remote.
Management has evaluated the need for disclosures and/or adjustments resulting from subsequent events through the date the Financials Statements were issued. Based on this evaluation, no disclosures other than that noted above were required to the Financial Statements as of December 31, 2014.
|
| HIMCO Variable Insurance Trust |
Financial Highlights
| | | | | | | | | | | | | | | | | | | | | | | | | | | | | | | | | | | | | | | | | | | | | | | | | | | | |
| | | — Selected Per-Share Data(1)— | | | — Ratios and Supplemental Data — | |
Class | | Net Asset
Value at,
Beginning
of Period | | | Net
Investment
Income
(Loss) | | | Net
Realized
and
Unrealized
Gain (Loss)
on
Investments | | | Total from
Investment
Operations | | | Dividends
from Net
Investment
Income | | | Distributions
from
Realized
Gain on
Investments | | | Total
Dividends
and
Distributions | | | Net
Asset
Value
End of
Period | | | Total
Return(2) | | | Net
Assets
at
End of
Period
(000s) | | | Ratio of
Expenses
to
Average
Net
Assets
Before
Waivers(3) | | | Ratio of
Expenses
to
Average
Net
Assets
After
Waivers(3) | | | Ratio of
Net
Investment
Income
(Loss) to
Average
Net
Assets(3) | |
| HIMCO VIT American Funds Asset Allocation Fund | | | | | | | | | | | | | | | | | | | | | | | | | | | | | | | | | | | | | |
For the Year Ended December 31, 2014 | | | | | | | | | | | | | | | | | | | | | | | | | | | | | | | | | | | | | |
IB | | $ | 12.63 | | | $ | 0.12 | | | $ | 0.44 | | | $ | 0.56 | | | $ | (0.18 | ) | | $ | (3.89 | ) | | $ | (4.07 | ) | | $ | 9.12 | | | | 5.05 | % | | $ | 54,855 | | | | 0.99 | % | | | 0.55 | % | | | 1.09 | % |
For the Year Ended December 31, 2013(4) | | | | | | | | | | | | | | | | | | | | | | | | | | | | | | | | | | | | | |
IB | | $ | 11.04 | | | $ | 0.12 | | | $ | 2.39 | | | $ | 2.51 | | | $ | (0.17 | ) | | $ | (0.75 | ) | | $ | (0.92 | ) | | $ | 12.63 | | | | 23.40 | % | | $ | 62,961 | | | | 0.95 | % | | | 0.55 | % | | | 0.97 | % |
For the Year Ended December 31, 2012(4)(5) | | | | | | | | | | | | | | | | | | | | | | | | | | | | | | | | | | | | | |
IB | | $ | 9.70 | | | $ | 0.19 | | | $ | 1.34 | | | $ | 1.53 | | | $ | (0.17 | ) | | $ | (0.02 | ) | | $ | (0.19 | ) | | $ | 11.04 | | | | 15.80 | % | | $ | 64,616 | | | | 0.95 | % | | | 0.55 | % | | | 1.56 | % |
For the Year Ended December 31, 2011(4)(5) | | | | | | | | | | | | | | | | | | | | | | | | | | | | | | | | | | | | | |
IB | | $ | 9.74 | | | $ | 0.14 | | | $ | (0.05 | ) | | $ | 0.09 | | | $ | (0.13 | ) | | $ | — | | | $ | (0.13 | ) | | $ | 9.70 | | | | 1.02 | % | | $ | 64,356 | | | | 0.95 | % | | | 0.55 | % | | | 1.61 | % |
For the Year Ended December 31, 2010(4)(5) | | | | | | | | | | | | | | | | | | | | | | | | | | | | | | | | | | | | | |
IB | | $ | 8.85 | | | $ | 0.14 | | | $ | 0.91 | | | $ | 1.05 | | | $ | (0.16 | ) | | $ | — | | | $ | (0.16 | ) | | $ | 9.74 | | | | 12.13 | % | | $ | 58,326 | | | | 0.95 | % | | | 0.55 | % | | | 1.73 | % |
| | | | | | | | |
| HIMCO VIT American Funds Blue Chip Income and Growth Fund | | | | | | | | | | | | | | | | | | | | | | | | | | | | | | | | | |
For the Year Ended December 31, 2014 | | | | | | | | | | | | | | | | | | | | | | | | | | | | | | | | | | | | | |
IB | | $ | 12.31 | | | $ | 0.34 | | | $ | 1.38 | | | $ | 1.72 | | | $ | (0.20 | ) | | $ | (2.58 | ) | | $ | (2.78 | ) | | $ | 11.25 | | | | 15.02 | % | | $ | 47,550 | | | | 1.10 | % | | | 0.57 | % | | | 2.83 | % |
For the Year Ended December 31, 2013(4) | | | | | | | | | | | | | | | | | | | | | | | | | | | | | | | | | | | | | |
IB | | $ | 10.11 | | | $ | 0.17 | | | $ | 3.02 | | | $ | 3.19 | | | $ | (0.18 | ) | | $ | (0.81 | ) | | $ | (0.99 | ) | | $ | 12.31 | | | | 32.55 | % | | $ | 43,502 | | | | 1.07 | % | | | 0.57 | % | | | 1.51 | % |
For the Year Ended December 31, 2012(4)(5) | | | | | | | | | | | | | | | | | | | | | | | | | | | | | | | | | | | | | |
IB | | $ | 9.07 | | | $ | 0.15 | | | $ | 1.07 | | | $ | 1.22 | | | $ | (0.12 | ) | | $ | (0.06 | ) | | $ | (0.18 | ) | | $ | 10.11 | | | �� | 13.53 | % | | $ | 39,920 | | | | 1.07 | % | | | 0.57 | % | | | 1.67 | % |
For the Year Ended December 31, 2011(4)(5) | | | | | | | | | | | | | | | | | | | | | | | | | | | | | | | | | | | | | |
IB | | $ | 9.18 | | | $ | 0.13 | | | $ | (0.24 | ) | | $ | (0.11 | ) | | $ | — | | | $ | — | | | $ | — | | | $ | 9.07 | | | | (1.19 | )% | | $ | 32,425 | | | | 1.07 | % | | | 0.57 | % | | | 1.44 | % |
For the Year Ended December 31, 2010(4)(5) | | | | | | | | | | | | | | | | | | | | | | | | | | | | | | | | | | | | | |
IB | | $ | 8.44 | | | $ | 0.12 | | | $ | 0.86 | | | $ | 0.98 | | | $ | (0.24 | ) | | $ | — | | | $ | (0.24 | ) | | $ | 9.18 | | | | 11.98 | % | | $ | 34,030 | | | | 1.07 | % | | | 0.57 | % | | | 1.48 | % |
| | | | | | | | | |
| HIMCO VIT American Funds Bond Fund | | | | | | | | | | | | | | | | | | | | | | | | | | | | | | | | | | | | | |
For the Year Ended December 31, 2014 | | | | | | | | | | | | | | | | | | | | | | | | | | | | | | | | | | | | | |
IB | | $ | 9.75 | | | $ | 0.14 | | | $ | 0.34 | | | $ | 0.48 | | | $ | (0.17 | ) | | $ | (0.46 | ) | | $ | (0.63 | ) | | $ | 9.60 | | | | 4.98 | % | | $ | 189,076 | | | | 0.81 | % | | | 0.54 | % | | | 1.42 | % |
For the Year Ended December 31, 2013(4) | | | | | | | | | | | | | | | | | | | | | | | | | | | | | | | | | | | | | |
IB | | $ | 10.52 | | | $ | 0.17 | | | $ | (0.42 | ) | | $ | (0.25 | ) | | $ | (0.22 | ) | | $ | (0.30 | ) | | $ | (0.52 | ) | | $ | 9.75 | | | | (2.37 | )% | | $ | 236,846 | | | | 0.79 | % | | | 0.54 | % | | | 1.67 | % |
For the Year Ended December 31, 2012(4)(5) | | | | | | | | | | | | | | | | | | | | | | | | | | | | | | | | | | | | | |
IB | | $ | 10.52 | | | $ | 0.23 | | | $ | 0.29 | | | $ | 0.52 | | | $ | (0.29 | ) | | $ | (0.23 | ) | | $ | (0.52 | ) | | $ | 10.52 | | | | 5.01 | % | | $ | 199,008 | | | | 0.79 | % | | | 0.54 | % | | | 2.13 | % |
For the Year Ended December 31, 2011(4)(5) | | | | | | | | | | | | | | | | | | | | | | | | | | | | | | | | | | | | | |
IB | | $ | 10.21 | | | $ | 0.29 | | | $ | 0.30 | | | $ | 0.59 | | | $ | (0.28 | ) | | $ | — | | | $ | (0.28 | ) | | $ | 10.52 | | | | 5.84 | % | | $ | 198,203 | | | | 0.79 | % | | | 0.54 | % | | | 2.57 | % |
For the Year Ended December 31, 2010(4)(5) | | | | | | | | | | | | | | | | | | | | | | | | | | | | | | | | | | | | | |
IB | | $ | 9.84 | | | $ | 0.26 | | | $ | 0.35 | | | $ | 0.61 | | | $ | (0.24 | ) | | $ | — | | | $ | (0.24 | ) | | $ | 10.21 | | | | 6.15 | % | | $ | 206,360 | | | | 0.80 | % | | | 0.55 | % | | | 2.75 | % |
| | | | | | | | | |
| HIMCO VIT American Funds Global Bond Fund | | | | | | | | | | | | | | | | | | | | | | | | | | | | | | | | | | | | | |
For the Year Ended December 31, 2014 | | | | | | | | | | | | | | | | | | | | | | | | | | | | | | | | | | | | | |
IB | | $ | 9.66 | | | $ | 0.10 | | | $ | 0.05 | | | $ | 0.15 | | | $ | (0.01 | ) | | $ | (0.82 | ) | | $ | (0.83 | ) | | $ | 8.98 | | | | 1.17 | % | | $ | 15,042 | | | | 1.22 | % | | | 0.63 | % | | | 1.01 | % |
For the Year Ended December 31, 2013(4) | | | | | | | | | | | | | | | | | | | | | | | | | | | | | | | | | | | | | |
IB | | $ | 11.10 | | | $ | (0.06 | ) | | $ | (0.29 | ) | | $ | (0.35 | ) | | $ | (0.37 | ) | | $ | (0.72 | ) | | $ | (1.09 | ) | | $ | 9.66 | | | | (3.03 | )% | | $ | 17,007 | | | | 1.09 | % | | | 0.59 | % | | | (0.59 | )% |
For the Year Ended December 31, 2012(4)(5) | | | | | | | | | | | | | | | | | | | | | | | | | | | | | | | | | | | | | |
IB | | $ | 11.02 | | | $ | 0.24 | | | $ | 0.38 | | | $ | 0.62 | | | $ | (0.31 | ) | | $ | (0.23 | ) | | $ | (0.54 | ) | | $ | 11.10 | | | | 5.83 | % | | $ | 38,193 | | | | 1.07 | % | | | 0.57 | % | | | 1.69 | % |
For the Year Ended December 31, 2011(4)(5) | | | | | | | | | | | | | | | | | | | | | | | | | | | | | | | | | | | | | |
IB | | $ | 10.86 | | | $ | 0.23 | | | $ | 0.24 | | | $ | 0.47 | | | $ | (0.23 | ) | | $ | (0.08 | ) | | $ | (0.31 | ) | | $ | 11.02 | | | | 4.28 | % | | $ | 44,352 | | | | 1.06 | % | | | 0.56 | % | | | 2.56 | % |
For the Year Ended December 31, 2010(4)(5) | | | | | | | | | | | | | | | | | | | | | | | | | | | | | | | | | | | | | |
IB | | $ | 10.47 | | | $ | 0.27 | | | $ | 0.24 | | | $ | 0.51 | | | $ | (0.11 | ) | | $ | (0.01 | ) | | $ | (0.12 | ) | | $ | 10.86 | | | | 4.85 | % | | $ | 38,654 | | | | 1.07 | % | | | 0.57 | % | | | 2.49 | % |
See Portfolio Turnover information at the conclusion of Financial Highlights
|
| HIMCO Variable Insurance Trust |
Financial Highlights – (continued)
| | | | | | | | | | | | | | | | | | | | | | | | | | | | | | | | | | | | | | | | | | | | | | | | | | | | |
| | | — Selected Per-Share Data(1)— | | | — Ratios and Supplemental Data — | |
Class | | Net Asset
Value at,
Beginning
of Period | | | Net
Investment
Income
(Loss) | | | Net
Realized
and
Unrealized
Gain (Loss)
on
Investments | | | Total from
Investment
Operations | | | Dividends
from Net
Investment
Income | | | Distributions
from
Realized
Gain on
Investments | | | Total
Dividends
and
Distributions | | | Net
Asset
Value
End of
Period | | | Total
Return(2) | | | Net
Assets
at
End of
Period
(000s) | | | Ratio of
Expenses
to
Average
Net
Assets
Before
Waivers(3) | | | Ratio of
Expenses
to
Average
Net
Assets
After
Waivers(3) | | | Ratio of
Net
Investment
Income
(Loss) to
Average
Net
Assets(3) | |
| HIMCO VIT American Funds Global Growth and Income Fund | | | | | | | | | | | | | | | | | | | | | | | | | | | | | | | | | |
For the Year Ended December 31, 2014 | | | | | | | | | | | | | | | | | | | | | | | | | | | | | | | | | | | | | |
IB | | $ | 11.24 | | | $ | 0.29 | | | $ | 0.32 | | | $ | 0.61 | | | $ | (0.37 | ) | | $ | (4.47 | ) | | $ | (4.84 | ) | | $ | 7.01 | | | | 5.36 | % | | $ | 48,147 | | | | 1.15 | % | | | 0.57 | % | | | 3.04 | % |
For the Year Ended December 31, 2013(4) | | | | | | | | | | | | | | | | | | | | | | | | | | | | | | | | | | | | | |
IB | | $ | 9.58 | | | $ | 0.24 | | | $ | 1.84 | | | $ | 2.08 | | | $ | (0.26 | ) | | $ | (0.16 | ) | | $ | (0.42 | ) | | $ | 11.24 | | | | 22.16 | % | | $ | 52,712 | | | | 1.11 | % | | | 0.56 | % | | | 2.28 | % |
For the Year Ended December 31, 2012(4)(5) | | | | | | | | | | | | | | | | | | | | | | | | | | | | | | | | | | | | | |
IB | | $ | 8.38 | | | $ | 0.23 | | | $ | 1.20 | | | $ | 1.43 | | | $ | (0.23 | ) | | $ | — | | | $ | (0.23 | ) | | $ | 9.58 | | | | 17.30 | % | | $ | 74,927 | | | | 1.10 | % | | | 0.55 | % | | | 2.05 | % |
For the Year Ended December 31, 2011(4)(5) | | | | | | | | | | | | | | | | | | | | | | | | | | | | | | | | | | | | | |
IB | | $ | 9.06 | | | $ | 0.22 | | | $ | (0.70 | ) | | $ | (0.48 | ) | | $ | (0.20 | ) | | $ | — | | | $ | (0.20 | ) | | $ | 8.38 | | | | (5.19 | )% | | $ | 78,639 | | | | 1.09 | % | | | 0.54 | % | | | 2.30 | % |
For the Year Ended December 31, 2010(4)(5) | | | | | | | | | | | | | | | | | | | | | | | | | | | | | | | | | | | | | |
IB | | $ | 8.30 | | | $ | 0.20 | | | $ | 0.72 | | | $ | 0.92 | | | $ | (0.16 | ) | | $ | — | | | $ | (0.16 | ) | | $ | 9.06 | | | | 11.41 | % | | $ | 91,254 | | | | 1.10 | % | | | 0.55 | % | | | 2.25 | % |
| | | | | | | | | |
| HIMCO VIT American Funds Global Growth Fund | | | | | | | | | | | | | | | | | | | | | | | | | | | | | | | | | | | | | |
For the Year Ended December 31, 2014 | | | | | | | | | | | | | | | | | | | | | | | | | | | | | | | | | | | | | |
IB | | $ | 12.56 | | | $ | 0.08 | | | $ | 0.07 | | | $ | 0.15 | | | $ | (0.12 | ) | | $ | (5.24 | ) | | $ | (5.36 | ) | | $ | 7.35 | | | | 1.97 | % | | $ | 20,704 | | | | 1.42 | % | | | 0.60 | % | | | 0.75 | % |
For the Year Ended December 31, 2013(4) | | | | | | | | | | | | | | | | | | | | | | | | | | | | | | | | | | | | | |
IB | | $ | 10.45 | | | $ | 0.08 | | | $ | 2.83 | | | $ | 2.91 | | | $ | (0.06 | ) | | $ | (0.74 | ) | | $ | (0.80 | ) | | $ | 12.56 | | | | 28.77 | % | | $ | 24,509 | | | | 1.34 | % | | | 0.59 | % | | | 0.71 | % |
For the Year Ended December 31, 2012(4)(5) | | | | | | | | | | | | | | | | | | | | | | | | | | | | | | | | | | | | | |
IB | | $ | 8.74 | | | $ | 0.06 | | | $ | 1.86 | | | $ | 1.92 | | | $ | (0.10 | ) | | $ | (0.11 | ) | | $ | (0.21 | ) | | $ | 10.45 | | | | 22.19 | % | | $ | 29,055 | | | | 1.33 | % | | | 0.58 | % | | | 0.48 | % |
For the Year Ended December 31, 2011(4)(5) | | | | | | | | | | | | | | | | | | | | | | | | | | | | | | | | | | | | | |
IB | | $ | 9.74 | | | $ | 0.10 | | | $ | (0.99 | ) | | $ | (0.89 | ) | | $ | (0.11 | ) | | $ | — | | | $ | (0.11 | ) | | $ | 8.74 | | | | (9.18 | )% | | $ | 29,319 | | | | 1.32 | % | | | 0.57 | % | | | 0.95 | % |
For the Year Ended December 31, 2010(4)(5) | | | | | | | | | | | | | | | | | | | | | | | | | | | | | | | | | | | | | |
IB | | $ | 8.83 | | | $ | 0.10 | | | $ | 0.89 | | | $ | 0.99 | | | $ | (0.08 | ) | | $ | — | | | $ | (0.08 | ) | | $ | 9.74 | | | | 11.41 | % | | $ | 34,245 | | | | 1.32 | % | | | 0.57 | % | | | 1.17 | % |
| | | | | | | | |
| HIMCO VIT American Funds Global Small Capitalization Fund | | | | | | | | | | | | | | | | | | | | | | | | | | | | | | | | | |
For the Year Ended December 31, 2014 | | | | | | | | | | | | | | | | | | | | | | | | | | | | | | | | | | | | | |
IB | | $ | 9.47 | | �� | $ | (0.02 | ) | | $ | 0.16 | | | $ | 0.14 | | | $ | (0.03 | ) | | $ | (1.94 | ) | | $ | (1.97 | ) | | $ | 7.64 | | | | 1.75 | % | | $ | 50,478 | | | | 1.15 | % | | | 0.57 | % | | | (0.26 | )% |
For the Year Ended December 31, 2013(4) | | | | | | | | | | | | | | | | | | | | | | | | | | | | | | | | | | | | | |
IB | | $ | 8.29 | | | $ | 0.03 | | | $ | 2.18 | | | $ | 2.21 | | | $ | (0.09 | ) | | $ | (0.94 | ) | | $ | (1.03 | ) | | $ | 9.47 | | | | 27.89 | % | | $ | 61,224 | | | | 1.13 | % | | | 0.58 | % | | | 0.30 | % |
For the Year Ended December 31, 2012(4)(5) | | | | | | | | | | | | | | | | | | | | | | | | | | | | | | | | | | | | | |
IB | | $ | 7.83 | | | $ | 0.10 | | | $ | 1.23 | | | $ | 1.33 | | | $ | (0.10 | ) | | $ | (0.77 | ) | | $ | (0.87 | ) | | $ | 8.29 | | | | 17.85 | % | | $ | 53,881 | | | | 1.11 | % | | | 0.56 | % | | | 0.99 | % |
For the Year Ended December 31, 2011(4)(5) | | | | | | | | | | | | | | | | | | | | | | | | | | | | | | | | | | | | | |
IB | | $ | 9.92 | | | $ | 0.10 | | | $ | (2.01 | ) | | $ | (1.91 | ) | | $ | (0.13 | ) | | $ | (0.05 | ) | | $ | (0.18 | ) | | $ | 7.83 | | | | (19.40 | )% | | $ | 55,658 | | | | 1.11 | % | | | 0.56 | % | | | 0.98 | % |
For the Year Ended December 31, 2010(4)(5) | | | | | | | | | | | | | | | | | | | | | | | | | | | | | | | | | | | | | |
IB | | $ | 8.13 | | | $ | 0.11 | | | $ | 1.68 | | | $ | 1.79 | | | $ | — | | | $ | — | | | $ | — | | | $ | 9.92 | | | | 22.06 | % | | $ | 74,999 | | | | 1.12 | % | | | 0.57 | % | | | 1.35 | % |
| | | | | | | | | |
| HIMCO VIT American Funds Growth Fund | | | | | | | | | | | | | | | | | | | | | | | | | | | | | | | | | | | | | |
For the Year Ended December 31, 2014 | | | | | | | | | | | | | | | | | | | | | | | | | | | | | | | | | | | | | |
IB | | $ | 13.09 | | | $ | 0.10 | | | $ | 0.70 | | | $ | 0.80 | | | $ | (0.10 | ) | | $ | (4.26 | ) | | $ | (4.36 | ) | | $ | 9.53 | | | | 8.21 | % | | $ | 299,254 | | | | 1.06 | % | | | 0.54 | % | | | 0.85 | % |
For the Year Ended December 31, 2013(4) | | | | | | | | | | | | | | | | | | | | | | | | | | | | | | | | | | | | | |
IB | | $ | 10.45 | | | $ | 0.07 | | | $ | 3.00 | | | $ | 3.07 | | | $ | (0.06 | ) | | $ | (0.37 | ) | | $ | (0.43 | ) | | $ | 13.09 | | | | 29.78 | % | | $ | 351,018 | | | | 1.04 | % | | | 0.54 | % | | | 0.60 | % |
For the Year Ended December 31, 2012(4)(5) | | | | | | | | | | | | | | | | | | | | | | | | | | | | | | | | | | | | | |
IB | | $ | 8.95 | | | $ | 0.05 | | | $ | 1.51 | | | $ | 1.56 | | | $ | (0.03 | ) | | $ | (0.03 | ) | | $ | (0.06 | ) | | $ | 10.45 | | | | 17.56 | % | | $ | 333,889 | | | | 1.04 | % | | | 0.54 | % | | | 0.50 | % |
For the Year Ended December 31, 2011(4)(5) | | | | | | | | | | | | | | | | | | | | | | | | | | | | | | | | | | | | | |
IB | | $ | 9.38 | | | $ | 0.03 | | | $ | (0.46 | ) | | $ | (0.43 | ) | | $ | — | | | $ | — | | | $ | — | | | $ | 8.95 | | | | (4.57 | )% | | $ | 317,968 | | | | 1.04 | % | | | 0.54 | % | | | 0.33 | % |
For the Year Ended December 31, 2010(4)(5) | | | | | | | | | | | | | | | | | | | | | | | | | | | | | | | | | | | | | |
IB | | $ | 7.96 | | | $ | 0.04 | | | $ | 1.42 | | | $ | 1.46 | | | $ | (0.04 | ) | | $ | — | | | $ | (0.04 | ) | | $ | 9.38 | | | | 18.36 | % | | $ | 356,162 | | | | 1.05 | % | | | 0.55 | % | | | 0.43 | % |
See Portfolio Turnover information at the conclusion of Financial Highlights
|
| HIMCO Variable Insurance Trust |
Financial Highlights – (continued)
| | | | | | | | | | | | | | | | | | | | | | | | | | | | | | | | | | | | | | | | | | | | | | | | | | | | |
| | | — Selected Per-Share Data(1)— | | | — Ratios and Supplemental Data — | |
Class | | Net Asset
Value at,
Beginning
of Period | | | Net
Investment
Income
(Loss) | | | Net
Realized
and
Unrealized
Gain (Loss)
on
Investments | | | Total from
Investment
Operations | | | Dividends
from Net
Investment
Income | | | Distributions
from
Realized
Gain on
Investments | | | Total
Dividends
and
Distributions | | | Net
Asset
Value
End of
Period | | | Total
Return(2) | | | Net
Assets
at
End of
Period
(000s) | | | Ratio of
Expenses
to
Average
Net
Assets
Before
Waivers(3) | | | Ratio of
Expenses
to
Average
Net
Assets
After
Waivers(3) | | | Ratio of
Net
Investment
Income
(Loss) to
Average
Net
Assets(3) | |
| HIMCO VIT American Funds Growth-Income Fund | | | | | | | | | | | | | | | | | | | | | | | | | | | | | | | | | | | | | |
For the Year Ended December 31, 2014 | | | | | | | | | | | | | | | | | | | | | | | | | | | | | | | | | | | | | |
IB | | $ | 13.26 | | | $ | 0.11 | | | $ | 1.03 | | | $ | 1.14 | | | $ | (0.15 | ) | | $ | (4.16 | ) | | $ | (4.31 | ) | | $ | 10.09 | | | | 10.30 | % | | $ | 171,832 | | | | 1.01 | % | | | 0.54 | % | | | 0.90 | % |
For the Year Ended December 31, 2013(4) | | | | | | | | | | | | | | | | | | | | | | | | | | | | | | | | | | | | | |
IB | | $ | 10.20 | | | $ | 0.11 | | | $ | 3.23 | | | $ | 3.34 | | | $ | (0.14 | ) | | $ | (0.14 | ) | | $ | (0.28 | ) | | $ | 13.26 | | | | 33.14 | % | | $ | 197,689 | | | | 0.99 | % | | | 0.54 | % | | | 0.97 | % |
For the Year Ended December 31, 2012(4)(5) | | | | | | | | | | | | | | | | | | | | | | | | | | | | | | | | | | | | | |
IB | | $ | 8.81 | | | $ | 0.13 | | | $ | 1.38 | | | $ | 1.51 | | | $ | (0.12 | ) | | $ | — | | | $ | (0.12 | ) | | $ | 10.20 | | | | 17.16 | % | | $ | 183,220 | | | | 0.99 | % | | | 0.54 | % | | | 1.29 | % |
For the Year Ended December 31, 2011(4)(5) | | | | | | | | | | | | | | | | | | | | | | | | | | | | | | | | | | | | | |
IB | | $ | 9.00 | | | $ | 0.12 | | | $ | (0.31 | ) | | $ | (0.19 | ) | | $ | — | | | $ | — | | | $ | — | | | $ | 8.81 | | | | (2.12 | )% | | $ | 170,059 | | | | 0.98 | % | | | 0.53 | % | | | 1.26 | % |
For the Year Ended December 31, 2010(4)(5) | | | | | | | | | | | | | | | | | | | | | | | | | | | | | | | | | | | | | |
IB | | $ | 8.20 | | | $ | 0.10 | | | $ | 0.81 | | | $ | 0.91 | | | $ | (0.11 | ) | | $ | — | | | $ | (0.11 | ) | | $ | 9.00 | | | | 11.11 | % | | $ | 185,836 | | | | 0.99 | % | | | 0.54 | % | | | 1.19 | % |
| | | | | | | | | |
| HIMCO VIT American Funds International Fund | | | | | | | | | | | | | | | | | | | | | | | | | | | | | | | | | | | | | |
For the Year Ended December 31, 2014 | | | | | | | | | | | | | | | | | | | | | | | | | | | | | | | | | | | | | |
IB | | $ | 10.27 | | | $ | 0.09 | | | $ | (0.36 | ) | | $ | (0.27 | ) | | $ | (0.12 | ) | | $ | (2.03 | ) | | $ | (2.15 | ) | | $ | 7.85 | | | | (2.88 | )% | | $ | 180,339 | | | | 1.17 | % | | | 0.55 | % | | | 0.98 | % |
For the Year Ended December 31, 2013(4) | | | | | | | | | | | | | | | | | | | | | | | | | | | | | | | | | | | | | |
IB | | $ | 8.73 | | | $ | 0.09 | | | $ | 1.74 | | | $ | 1.83 | | | $ | (0.11 | ) | | $ | (0.18 | ) | | $ | (0.29 | ) | | $ | 10.27 | | | | 21.23 | % | | $ | 226,400 | | | | 1.15 | % | | | 0.55 | % | | | 0.99 | % |
For the Year Ended December 31, 2012(4)(5) | | | | | | | | | | | | | | | | | | | | | | | | | | | | | | | | | | | | | |
IB | | $ | 7.54 | | | $ | 0.10 | | | $ | 1.22 | | | $ | 1.32 | | | $ | (0.13 | ) | | $ | — | | | $ | (0.13 | ) | | $ | 8.73 | | | | 17.58 | % | | $ | 225,298 | | | | 1.14 | % | | | 0.54 | % | | | 1.15 | % |
For the Year Ended December 31, 2011(4)(5) | | | | | | | | | | | | | | | | | | | | | | | | | | | | | | | | | | | | | |
IB | | $ | 8.96 | | | $ | 0.13 | | | $ | (1.40 | ) | | $ | (1.27 | ) | | $ | (0.15 | ) | | $ | — | | | $ | (0.15 | ) | | $ | 7.54 | | | | (14.23 | )% | | $ | 208,399 | | | | 1.14 | % | | | 0.54 | % | | | 1.52 | % |
For the Year Ended December 31, 2010(4)(5) | | | | | | | | | | | | | | | | | | | | | | | | | | | | | | | | | | | | | |
IB | | $ | 8.50 | | | $ | 0.13 | | | $ | 0.44 | | | $ | 0.57 | | | $ | (0.08 | ) | | $ | (0.03 | ) | | $ | (0.11 | ) | | $ | 8.96 | | | | 6.92 | % | | $ | 235,702 | | | | 1.16 | % | | | 0.56 | % | | | 1.78 | % |
| | | | | | | | | |
| HIMCO VIT American Funds New World Fund | | | | | | | | | | | | | | | | | | | | | | | | | | | | | | | | | | | | | |
For the Year Ended December 31, 2014 | | | | | | | | | | | | | | | | | | | | | | | | | | | | | | | | | | | | | |
IB | | $ | 9.17 | | | $ | 0.05 | | | $ | (0.54 | ) | | $ | (0.49 | ) | | $ | (0.10 | ) | | $ | (2.93 | ) | | $ | (3.03 | ) | | $ | 5.65 | | | | (8.17 | )% | | $ | 27,138 | | | | 1.49 | % | | | 0.59 | % | | | 0.59 | % |
For the Year Ended December 31, 2013(4) | | | | | | | | | | | | | | | | | | | | | | | | | | | | | | | | | | | | | |
IB | | $ | 9.46 | | | $ | 0.07 | | | $ | 0.89 | | | $ | 0.96 | | | $ | (0.08 | ) | | $ | (1.17 | ) | | $ | (1.25 | ) | | $ | 9.17 | | | | 11.06 | % | | $ | 34,304 | | | | 1.43 | % | | | 0.58 | % | | | 0.77 | % |
For the Year Ended December 31, 2012(4)(5) | | | | | | | | | | | | | | | | | | | | | | | | | | | | | | | | | | | | | |
IB | | $ | 8.66 | | | $ | 0.07 | | | $ | 1.38 | | | $ | 1.45 | | | $ | (0.15 | ) | | $ | (0.50 | ) | | $ | (0.65 | ) | | $ | 9.46 | | | | 17.47 | % | | $ | 51,697 | | | | 1.41 | % | | | 0.56 | % | | | 0.61 | % |
For the Year Ended December 31, 2011(4)(5) | | | | | | | | | | | | | | | | | | | | | | | | | | | | | | | | | | | | | |
IB | | $ | 10.24 | | | $ | 0.15 | | | $ | (1.60 | ) | | $ | (1.45 | ) | | $ | (0.13 | ) | | $ | — | | | $ | (0.13 | ) | | $ | 8.66 | | | | (14.23 | )% | | $ | 52,569 | | | | 1.41 | % | | | 0.56 | % | | | 1.33 | % |
For the Year Ended December 31, 2010(4)(5) | | | | | | | | | | | | | | | | | | | | | | | | | | | | | | | | | | | | | |
IB | | $ | 8.80 | | | $ | 0.11 | | | $ | 1.42 | | | $ | 1.53 | | | $ | (0.09 | ) | | $ | — | | | $ | (0.09 | ) | | $ | 10.24 | | | | 17.54 | % | | $ | 72,257 | | | | 1.42 | % | | | 0.57 | % | | | 1.30 | % |
| (1) | Information presented relates to a share outstanding throughout the indicated period. Net investment income (loss) per share amounts are calculated based on average shares outstanding unless otherwise noted. |
| (2) | The figures do not include sales charges or other fees which may be applied at the variable life insurance, variable annuity or qualified retirement plan product level. Any such additional sales charges or other fees would lower the Fund’s performance. |
| (3) | Ratios do not include expenses of the Underlying Funds. |
| (4) | See Note 8 in the accompanying Notes to Financial Statements. |
| (5) | Net investment income (loss) per share amounts have been calculated using the SEC method. |
See Portfolio Turnover information at the conclusion of Financial Highlights
|
| HIMCO Variable Insurance Trust |
Financial Highlights – (concluded)
| | | | | | | | | | | | | | | | | | | | |
| | | Portfolio Turnover Rate
For the Year Ended | |
| | | December 31, 2014 | | | December 31, 2013(1) | | | December 31, 2012(1) | | | December 31, 2011(1) | | | December 31, 2010(1) | |
HIMCO VIT American Funds Asset Allocation Fund | | | 11 | % | | | 29 | % | | | 14 | % | | | 9 | % | | | 11 | % |
HIMCO VIT American Funds Blue Chip Income and Growth Fund | | | 15 | | | | 16 | | | | 23 | | | | 14 | | | | 11 | |
HIMCO VIT American Funds Bond Fund | | | 6 | | | | 15 | | | | 15 | | | | 15 | | | | 13 | |
HIMCO VIT American Funds Global Bond Fund | | | 12 | | | | 10 | | | | 8 | | | | 16 | | | | 17 | |
HIMCO VIT American Funds Global Growth and Income Fund | | | 7 | | | | 4 | | | | 5 | | | | 5 | | | | 8 | |
HIMCO VIT American Funds Global Growth Fund | | | 15 | | | | 7 | | | | 4 | | | | 11 | | | | 11 | |
HIMCO VIT American Funds Global Small Capitalization Fund | | | 5 | | | | 11 | | | | 4 | | | | 11 | | | | 16 | |
HIMCO VIT American Funds Growth Fund | | | 8 | | | | 3 | | | | 4 | | | | 5 | | | | 7 | |
HIMCO VIT American Funds Growth-Income Fund | | | 8 | | | | 6 | | | | 9 | | | | 5 | | | | 8 | |
HIMCO VIT American Funds International Fund | | | 6 | | | | 4 | | | | 7 | | | | 9 | | | | 7 | |
HIMCO VIT American Funds New World Fund | | | 16 | | | | 6 | | | | 8 | | | | 9 | | | | 12 | |
| (1) | See Note 8 in the accompanying Notes to Financial Statements. |
|
| Report of Independent Registered Public Accounting Firm |
To the Board of Trustees of HIMCO Variable Insurance Trust and the Shareholders of HIMCO VIT American Funds Asset Allocation Fund (formerly American Funds Asset Allocation HLS Fund), HIMCO VIT American Funds Blue Chip Income and Growth Fund (formerly American Funds Blue Chip Income and Growth HLS Fund), HIMCO VIT American Funds Bond Fund (formerly American Funds Bond HLS Fund), HIMCO VIT American Funds Global Bond Fund (formerly American Funds Global Bond HLS Fund), HIMCO VIT American Funds Global Growth and Income Fund (formerly American Funds Global Growth and Income HLS Fund), HIMCO VIT American Funds Global Growth Fund (formerly American Funds Global Growth HLS Fund), HIMCO VIT American Funds Global Small Capitalization Fund (formerly American Funds Global Small Capitalization HLS Fund), HIMCO VIT American Funds Growth Fund (formerly American Funds Growth HLS Fund), HIMCO VIT American Funds Growth-Income Fund (formerly American Funds Growth-Income HLS Fund), HIMCO VIT American Funds International Fund (formerly American Funds International HLS Fund) and HIMCO VIT American Funds New World Fund (formerly American Funds New World HLS Fund)
We have audited the accompanying statements of assets and liabilities, including the schedules of investments, of HIMCO VIT American Funds Asset Allocation Fund (formerly American Funds Asset Allocation HLS Fund), HIMCO VIT American Funds Blue Chip Income and Growth Fund (formerly American Funds Blue Chip Income and Growth HLS Fund), HIMCO VIT American Funds Bond Fund (formerly American Funds Bond HLS Fund), HIMCO VIT American Funds Global Bond Fund (formerly American Funds Global Bond HLS Fund), HIMCO VIT American Funds Global Growth and Income Fund (formerly American Funds Global Growth and Income HLS Fund), HIMCO VIT American Funds Global Growth Fund (formerly American Funds Global Growth HLS Fund), HIMCO VIT American Funds Global Small Capitalization Fund (formerly American Funds Global Small Capitalization HLS Fund), HIMCO VIT American Funds Growth Fund (formerly American Funds Growth HLS Fund), HIMCO VIT American Funds Growth-Income Fund (formerly American Funds Growth-Income HLS Fund), HIMCO VIT American Funds International Fund (formerly American Funds International HLS Fund) and HIMCO VIT American Funds New World Fund (formerly American Funds New World HLS Fund) (collectively the “Funds”), each a series of the HIMCO Variable Insurance Trust, as of December 31, 2014, and the related statements of operations, statements of changes in net assets, and the financial highlights for the year then ended. These financial statements and financial highlights are the responsibility of the Funds’ management. Our responsibility is to express an opinion on these financial statements and financial highlights based on our audits. The statements of changes in net assets of the Funds for the year ended December 31, 2013 and the financial highlights for each of the four years in the period then ended were audited by other auditors whose report, dated February 17, 2014, expressed an unqualified opinion on those statements and financial highlights.
We conducted our audits in accordance with the standards of the Public Company Accounting Oversight Board (United States). Those standards require that we plan and perform the audits to obtain reasonable assurance about whether the financial statements and financial highlights are free of material misstatement. The Funds are not required to have, nor were we engaged to perform, an audit of its internal control over financial reporting. Our audits included consideration of internal control over financial reporting as a basis for designing audit procedures that are appropriate in the circumstances, but not for the purpose of expressing an opinion on the effectiveness of the Funds’ internal control over financial reporting. Accordingly, we express no such opinion. An audit also includes examining, on a test basis, evidence supporting the amounts and disclosures in the financial statements, assessing the accounting principles used and significant estimates made by management, as well as evaluating the overall financial statement presentation. Our procedures included confirmation of securities owned as of December 31, 2014, by correspondence with the transfer agent and brokers; when replies were not received from brokers, we performed other auditing procedures. We believe that our audits provide a reasonable basis for our opinion.
In our opinion, the financial statements and financial highlights referred to above present fairly, in all material respects, the financial position of HIMCO VIT American Funds Asset Allocation Fund (formerly American Funds Asset Allocation HLS Fund), HIMCO VIT American Funds Blue Chip Income and Growth Fund (formerly American Funds Blue Chip Income and Growth HLS Fund), HIMCO VIT American Funds Bond Fund (formerly American Funds Bond HLS Fund), HIMCO VIT American Funds Global Bond Fund (formerly American Funds Global Bond HLS Fund), HIMCO VIT American Funds Global Growth and Income Fund (formerly American Funds Global Growth and Income HLS Fund), HIMCO VIT American Funds Global Growth Fund (formerly American Funds Global Growth HLS Fund), HIMCO VIT American Funds Global Small Capitalization Fund (formerly American Funds Global Small Capitalization HLS Fund), HIMCO VIT American Funds Growth Fund (formerly American Funds Growth HLS Fund), HIMCO VIT American Funds Growth-Income Fund (formerly American Funds Growth-Income HLS Fund), HIMCO VIT American Funds International Fund (formerly American Funds International HLS Fund) and HIMCO VIT American Funds New World Fund (formerly American Funds New World HLS Fund), as of December 31, 2014, the results of their operations, the changes in their net assets, and the financial highlights for the year then ended, in conformity with accounting principles generally accepted in the United States of America.
Deloitte & Touche LLP
Boston, Massachusetts
February 17, 2015
|
| HIMCO Variable Insurance Trust |
Trustees and Officers (Unaudited)
The Board of Trustees and officers of the Trust, their business addresses, principal occupations for at least the past five years and years of birth are listed in the tables below. The Trust’s Board of Trustees (i) provides broad supervision over the affairs of the Trust and the Fund and (ii) elects officers who are responsible for the day-to-day operations of the Fund and the execution of policies formulated by the Board of Trustees. The first table below provides information about those trustees who are deemed not to be “interested persons” of the Trust, as that term is defined in the 1940 Act (i.e., “non-interested trustees”), while the second table below provides information about the Trust’s “interested” trustees and the Trust’s officers.
Non-Interested Trustees
| | | | | | | | | | |
| Birth and Address | | Position Held
with the Trust | | Term of Office*
and Length of
Time Served | | Principal Occupation(s)
During Past 5 Years | | Number of
Portfolios
in Fund
Complex
Overseen
by Trustee | | Other Directorships for
Public Companies and Other
Registered Investment
Companies Held by Trustee |
PAUL BRAVERMAN** (1949) c/o Hartford Investment Management Company One Hartford Plaza Hartford, CT 06155 | | Trustee | | Since 2014 | | Mr. Braverman is a private investor. He was a Partner and Chief Financial Officer of Wellington Management Company, LLP until 2007. He currently serves as a board member at Aesir Capital Management and Claren Road Asset Management, investment advisory firms, MPAM USS Credit Fund, a Cayman private fund, and the New England Conservatory. | | 13 | | Mr. Braverman currently serves as Director of Courier Corporation and as an Independent Trustee of GMO Trust (December 2008 to present) (54 funds overseen). |
| | | | | |
MARK OSTERHELD (1955) c/o Hartford Investment Management Company One Hartford Plaza Hartford, CT 06155 | | Trustee | | Since 2014 | | Mr. Osterheld is a private investor. Mr. Osterheld was Vice President of Treasury Oversight at Fidelity Investments until 2013. | | 13 | | None. |
| | | | | |
VANESSA WILSON (1959) c/o Hartford Investment Management Company One Hartford Plaza Hartford, CT 06155 | | Trustee | | Since 2014 | | Ms. Wilson is Chief Financial Officer and Managing Director of Golden Seeds LLC, a venture capital firm. Ms. Wilson worked for Deutsche Bank Securities until 2007, where she was a Managing Director and an equity research analyst. | | 13 | | Ms. Wilson currently serves as Director of Protective Life Corporation. |
| * | Term of Office: Each trustee may serve until his or her successor is elected and qualifies. |
| ** | “Interested person”, as defined in the 1940 Act, of the Trust for a portion of 2014 because of the person’s beneficial equity ownership of The Hartford Financial Services Group, Inc., an affiliate of Hartford Investment Management. |
|
| HIMCO Variable Insurance Trust |
Trustees and Officers (Unaudited) – (continued)
Officers and Interested Trustees
| | | | | | | | | | |
Name, Year of Birth
And Address | | Position Held
with the Trust | | Term of Office*
and Length Of
Time Served | | Principal Occupation(s)
During Past 5 Years | | Number of
Portfolios
in Fund
Complex
Overseen
by Trustee | | Other Directorships
Held by Trustee |
BRION JOHNSON** (1960) c/o Hartford Investment Management Company One Hartford Plaza Hartford, CT 06155 | | Trustee and Chairman of the Board | | Since 2014 | | Mr. Johnson serves as President of Hartford Investment Management and Talcott Resolution a segment of The Hartford. From 2011 to 2012, Mr. Johnson served as a Managing Director, Chief Financial Officer and Head of Strategy and Development for Hartford Investment Management. Prior to joining Hartford Investment Management, Mr. Johnson served as Managing Member of Shoreline Arts and Publishing, LLC, a publishing and marketing business. From 2001 to 2008, Mr. Johnson was Executive Vice President and Head of Portfolio Management of PPM America, an affiliate of Prudential, plc. | | 13 | | None. |
| | | | | |
HUGH WHELAN** (1960) c/o Hartford Investment Management Company One Hartford Plaza Hartford, CT 06155 | | Trustee | | Since 2014 | | Mr. Whelan is a private investor. Mr. Whelan was the Head of Quantitative Equities and Interim President of Hartford Investment Management until 2012. Prior to joining Hartford Investment Management, Mr. Whelan was the Head of Quantitative Equities at ING Investment Management from 2001 to 2005. | | 13 | | None. |
| | | | | |
PETER SANNIZZARO (1966) c/o Hartford Investment Management Company One Hartford Plaza Hartford, CT 06155 | | Treasurer | | Since 2014 | | Mr. Sannizzaro currently serves as Senior Vice President and Chief Financial Officer Hartford Life Insurance Company (“Hartford Life”) and Hartford Investment Management. From 2011 to 2014, Mr. Sannizzaro served as Senior Vice President of Hartford Life and Chief Financial Officer to various divisions within Hartford Life. From 2008 to 2011, Mr. Sannizzaro served as a Vice President of Finance Executive Management at Hartford Life. | | N/A | | N/A |
| | | | | |
ROBERT LEWTON (1971) c/o Hartford Investment Management Company One Hartford Plaza Hartford, CT 06155 | | Chief Compliance Officer | | Since 2014 | | Mr. Lewton currently serves as Chief Compliance Officer of Hartford Investment Management Company. Prior to 2010, he served as Senior Counsel in the Investment Law Group at Hartford Investment Management Company. | | N/A | | N/A |
| * | Term of Office: Each trustee may serve until his or her successor is elected and qualifies. |
| ** | “Interested person”, as defined in the 1940 Act, of the Trust because of the person’s affiliation with, or equity ownership of, Hartford Investment Management or affiliated companies. |
|
| HIMCO Variable Insurance Trust |
Trustees and Officers (Unaudited) – (concluded)
| | | | | | | | | | |
Name, Year of Birth
And Address | | Position Held
with the Trust | | Term of Office*
and Length Of
Time Served | | Principal Occupation(s)
During Past 5 Years | | Number of
Portfolios
in Fund
Complex
Overseen
by Trustee | | Other Directorships
Held by Trustee |
BRENDA PAGE (1965) c/o Hartford Investment Management Company One Hartford Plaza Hartford, CT 06155 | | Secretary | | Since 2014 | | Ms. Page currently serves as Vice President and Assistant General Counsel of The Hartford and Director of the Investment Law Group of Hartford Investment Management. | | N/A | | N/A |
| | | | | |
MATTHEW POZNAR (1959) c/o Hartford Investment Management Company One Hartford Plaza Hartford, CT 06155 | | President | | Since 2014 | | Mr. Poznar currently serves as an Executive Vice President in the General Account Portfolio Management Group of Hartford Investment Management. | | N/A | | N/A |
HOW TO OBTAIN A COPY OF THE FUNDS’ PROXY VOTING POLICIES AND VOTING RECORDS (UNAUDITED)
A description of the policies and procedures that the Funds use to determine how to vote proxies relating to portfolio securities and information about how the Funds voted proxies relating to portfolio securities during the most recent twelve-month period ended June 30 are available (1) without charge, upon request, by calling 888-843-7824 and (2) on the SEC’s website at http://www.sec.gov.
QUARTERLY PORTFOLIO HOLDINGS INFORMATION (UNAUDITED)
The Funds file a complete schedule of portfolio holdings with the SEC for the first and third quarters of each fiscal year on Form N-Q. The Funds’ Forms N-Q are available (1) without charge, upon request, by calling 888-843-7824 and (2) on the SEC’s website at http://www.sec.gov. The Form N-Q may be reviewed and copied at the SEC’s Public Reference Room in Washington, DC. Information on the operation of the Public Reference Room may be obtained by calling 1-800-SEC-0330.
| * | Term of Office: Each officer and Trustee may serve until his or her successor is elected and qualifies. |
|
| HIMCO Variable Insurance Trust |
Expense Example (Unaudited)
Your Fund’s Expenses
As a shareholder of a Fund, you incur two types of costs: (1) transaction costs and (2) ongoing costs, including investment management fees, distribution and/or service (12b-1) fees, if any, and other fund expenses. This example is intended to help you understand your ongoing costs (in dollars) of investing in a Fund and to compare these costs with the ongoing costs of investing in other mutual funds. The example is based on an investment of $1,000 invested at the beginning of the period and held for the entire period of July 1, 2014 through December 31, 2014.
Actual Expenses
The first set of rows of the table below provides information about actual account values and actual expenses. You may use the information in this row, together with the amount you invested, to estimate the expenses that you paid over the period. Simply divide your account value by $1,000 (for example, an $8,600 account value divided by $1,000 = 8.6), then multiply the result by the number in the line under the heading entitled “Expenses Paid During Period” to estimate the expenses you paid on your account during this period.
Hypothetical Example for Comparison Purposes
The second set of rows of the table below provides information about hypothetical account values and hypothetical expenses based on a Fund’s actual expense ratio and an assumed rate of return of 5% per year before expenses, which is not the Fund’s actual return. The hypothetical account values and expenses may not be used to estimate the actual ending account balance or expenses you paid for the period. You may use this information to compare the ongoing costs of investing in a Fund and other funds. To do so, compare this 5% hypothetical example with the 5% hypothetical examples that appear in the shareholder reports of the other funds.
Please note that the expenses shown in the table are meant to highlight your ongoing costs only and do not reflect any transactional costs, such as sales charges (loads) or fees which may be applied at the variable life insurance, variable annuity, or qualified retirement plan product level. Therefore, the second set of rows of the table is useful in comparing ongoing costs only, and will not help you determine the relative total costs of owning different funds. In addition, if these transactional costs were included, your costs would be higher.
| | | | | | | | | | | | | | | | |
| Fund Name | | Beginning
Account Value
7/1/14 | | | Ending
Account Value
12/31/14 | | | Expenses Paid
During Period
7/1/14 - 12/31/14(1) | | | Annualized
Expense Ratio | |
HIMCO VIT American Funds Asset Allocation Fund | | | | | | | | | |
Actual | | | | | | | | | | | | | | | | |
Class IB | | $ | 1,000.00 | | | $ | 1,012.00 | | | $ | 2.79 | | | | 0.55 | % |
Hypothetical | | | | | | | | | | | | | | | | |
Class IB | | $ | 1,000.00 | | | $ | 1,022.43 | | | $ | 2.80 | | | | 0.55 | % |
HIMCO VIT American Funds Blue Chip Income and Growth Fund | | | | | | | | | |
Actual | | | | | | | | | | | | | | | | |
Class IB | | $ | 1,000.00 | | | $ | 1,067.00 | | | $ | 2.92 | | | | 0.56 | % |
Hypothetical | | | | | | | | | | | | | | | | |
Class IB | | $ | 1,000.00 | | | $ | 1,022.38 | | | $ | 2.85 | | | | 0.56 | % |
HIMCO VIT American Funds Bond Fund | | | | | | | | | |
Actual | | | | | | | | | | | | | | | | |
Class IB | | $ | 1,000.00 | | | $ | 1,011.40 | | | $ | 2.74 | | | | 0.54 | % |
Hypothetical | | | | | | | | | | | | | | | | |
Class IB | | $ | 1,000.00 | | | $ | 1,022.48 | | | $ | 2.75 | | | | 0.54 | % |
HIMCO VIT American Funds Global Bond Fund | | | | | | | | | |
Actual | | | | | | | | | | | | | | | | |
Class IB | | $ | 1,000.00 | | | $ | 958.20 | | | $ | 3.01 | | | | 0.61 | % |
Hypothetical | | | | | | | | | | | | | | | | |
Class IB | | $ | 1,000.00 | | | $ | 1,022.13 | | | $ | 3.11 | | | | 0.61 | % |
|
| HIMCO Variable Insurance Trust |
Expense Example (Unaudited) – (concluded)
| | | | | | | | | | | | | | | | |
| Fund Name | | Beginning
Account Value
7/1/14 | | | Ending
Account Value
12/31/14 | | | Expenses Paid
During Period
7/1/14 - 12/31/14(1) | | | Annualized
Expense Ratio | |
HIMCO VIT American Funds Global Growth and Income Fund | | | | | | | | | |
Actual | | | | | | | | | | | | | | | | |
Class IB | | $ | 1,000.00 | | | $ | 991.00 | | | $ | 2.81 | | | | 0.56 | % |
Hypothetical | | | | | | | | | | | | | | | | |
Class IB | | $ | 1,000.00 | | | $ | 1,022.38 | | | $ | 2.85 | | | | 0.56 | % |
HIMCO VIT American Funds Global Growth Fund | | | | | | | | | |
Actual | | | | | | | | | | | | | | | | |
Class IB | | $ | 1,000.00 | | | $ | 996.70 | | | $ | 3.02 | | | | 0.60 | % |
Hypothetical | | | | | | | | | | | | | | | | |
Class IB | | $ | 1,000.00 | | | $ | 1,022.18 | | | $ | 3.06 | | | | 0.60 | % |
HIMCO VIT American Funds Global Small Capitalization Fund | | | | | | | | | |
Actual | | | | | | | | | | | | | | | | |
Class IB | | $ | 1,000.00 | | | $ | 952.10 | | | $ | 2.80 | | | | 0.57 | % |
Hypothetical | | | | | | | | | | | | | | | | |
Class IB | | $ | 1,000.00 | | | $ | 1,022.33 | | | $ | 2.91 | | | | 0.57 | % |
HIMCO VIT American Funds Growth Fund | | | | | | | | | |
Actual | | | | | | | | | | | | | | | | |
Class IB | | $ | 1,000.00 | | | $ | 1,027.20 | | | $ | 2.76 | | | | 0.54 | % |
Hypothetical | | | | | | | | | | | | | | | | |
Class IB | | $ | 1,000.00 | | | $ | 1,022.48 | | | $ | 2.75 | | | | 0.54 | % |
HIMCO VIT American Funds Growth-Income Fund | | | | | | | | | |
Actual | | | | | | | | | | | | | | | | |
Class IB | | $ | 1,000.00 | | | $ | 1,032.90 | | | $ | 2.77 | | | | 0.54 | % |
Hypothetical | | | | | | | | | | | | | | | | |
Class IB | | $ | 1,000.00 | | | $ | 1,022.48 | | | $ | 2.75 | | | | 0.54 | % |
HIMCO VIT American Funds International Fund | | | | | | | | | |
Actual | | | | | | | | | | | | | | | | |
Class IB | | $ | 1,000.00 | | | $ | 937.40 | | | $ | 2.64 | | | | 0.54 | % |
Hypothetical | | | | | | | | | | | | | | | | |
Class IB | | $ | 1,000.00 | | | $ | 1,022.48 | | | $ | 2.75 | | | | 0.54 | % |
HIMCO VIT American Funds New World Fund | | | | | | | | | |
Actual | | | | | | | | | | | | | | | | |
Class IB | | $ | 1,000.00 | | | $ | 877.20 | | | $ | 2.74 | | | | 0.58 | % |
Hypothetical | | | | | | | | | | | | | | | | |
Class IB | | $ | 1,000.00 | | | $ | 1,022.28 | | | $ | 2.96 | | | | 0.58 | % |
| (1) | Expenses are equal to the class’s annualized expense ratio listed in the table above, multiplied by the average account value over the period, multiplied by 184, the number of days in the most recent fiscal half-year, divided by 365, to reflect the one-half year period. |
Approval of New Investment Management Agreement (Unaudited)
Section 15(c) of the Investment Company Act of 1940, as amended (the “1940 Act”), requires that each mutual fund’s board of trustees, including a majority of those trustees who are not “interested persons” of the mutual fund, as defined in the 1940 Act (the “Independent Trustees”), initially approve, and annually review and consider the continuation of, the mutual fund’s investment advisory agreement. At its meeting held on April 30, 2014, the Board of Trustees (the “Board”) of HIMCO Variable Insurance Trust (“HVIT”), including each of the Independent Trustees, unanimously voted to approve an investment management agreement for the Funds with Hartford Investment Management Company (“HIMCO” or the “Adviser”) (the “Agreement”). Each Fund invests all of its assets directly in a corresponding portfolio of the American Funds Insurance Series (each a “Master Fund,” and collectively, the “Master Funds”) that is advised by Capital Research and Management Company (“CRMC”).
Prior to approving the Agreement, the Board requested, received and reviewed written responses from the Adviser to questions posed to the Adviser on behalf of the Trustees and supporting materials relating to those questions and responses.
The Board noted that shareholders of each American Funds HLS Fund, each a series of Hartford Series Fund, Inc. (“HSF”), would be asked to approve the reorganization of the American Funds HLS Fund into the corresponding series of HVIT (each, a “Reorganization” and collectively, the “Reorganizations”), with the closing of the Reorganizations expected to occur in October 2014.
In determining whether to approve the Agreement for each Fund, the members of the Board reviewed and evaluated information and factors they believed to be relevant and appropriate in light of the information that the Board deemed necessary and appropriate through the exercise of its reasonable business judgment. While individual members of the Board may have weighed certain factors differently, the Board’s determination to approve the Agreement was based on a comprehensive consideration of all information provided to the Board with respect to the approval of the Agreement. A more detailed discussion of the factors the Board considered with respect to its approval of the Agreement is provided below.
Nature, Extent and Quality of Services to be Provided by the Adviser
The Board requested and considered information concerning the nature, extent and quality of the services to be provided to each Fund by the Adviser. The Board considered, among other things, the terms of the Agreement and the range of services to be provided by HIMCO. In this regard, the Board considered that because of the master-feeder structure, the portfolio management services provided by HIMCO to each Fund would be limited to selecting one of the Master Funds, investing a Fund’s assets in that Master Fund, and monitoring the Master Fund’s performance as an investment for each Fund. The Board considered the Adviser’s organizational structure, systems and personnel as well as the Adviser’s reputation and overall financial strength. The Board also considered the possibility that at some point in the future, HIMCO may recommend the withdrawal of one or more of the Funds from the master-feeder structure and the management of the Funds’ assets directly or through a sub-adviser. Based on these considerations, the Board concluded that it was satisfied with the nature, extent and quality of the services to be provided to the Funds by HIMCO.
Performance of the Funds
The Board considered that the Funds are newly formed and did not have a prior performance record but noted that the performance of each Fund would be based on the performance of the Fund’s corresponding Master Fund. The Board also reviewed the performance track record of each American Funds HLS Fund.
Based on these considerations, the Board concluded that the Funds have the capability of providing satisfactory investment performance.
Comparison of Fees and Expenses
The Board requested and reviewed information from HIMCO relating to the proposed management fee and total operating expenses of each Fund. In this regard, the Board reviewed comparisons of the Funds’ proposed management fees and anticipated expense ratios to the management fees and expense ratios of a comparable group of funds previously selected by Lipper, Inc. to assist the board of directors of HSF (the “HSF Board”) in reviewing American Funds HLS Funds’ fees and expenses. The Board noted that the Funds’ respective management fee schedules and total operating expenses would be consistent with those previously reviewed and approved by the HSF Board and that the Funds would experience the same expense ratio as the corresponding American Funds HLS Fund through April 30, 2016 due to an expense cap. The Board also noted that each Fund and its shareholders would bear the fees and expenses of the Fund and the Master Fund in which it invests, with the result that
Approval of New Investment Management Agreements (Unaudited) – (concluded)
each Fund’s expenses would generally be higher than those of other mutual funds that invest directly in securities. The Board considered that each Master Fund may have other shareholders, each of whom will pay their proportionate share of the Master Fund’s expenses. Based on these considerations, the Board concluded that each Fund’s proposed fees and total operating expenses, in conjunction with the information about quality of services, profitability, economies of scale, and other matters discussed, were reasonable in light of the services to be provided.
Economies of Scale
The Board discussed HIMCO’s expectations for growth in assets under management and the extent to which economies of scale would be realized over time. The Board considered that since the Funds had not yet commenced operations, material economies of scale may not be achieved in the near term but noted that the management fee schedule for each Master Fund includes breakpoints that are designed to reduce the management fee rates as the Master Fund’s average daily net assets increase. The Board noted that shareholders of each Fund would benefit from the expense limitation arrangements proposed for the Funds. The Board also considered how any benefits from economies of scale would be realized by the various parties. Based on these considerations, the Board concluded that it was satisfied with the extent to which economies of scale could be expected to be shared for the benefit of the Funds’ future shareholders.
Profitability of the Adviser
The Board considered the level of profits that could be expected to accrue to HMCO with respect to each Fund, including HIMCO’s estimated costs to provide investment management and related services. The Board noted that HIMCO’s actual profitability with respect to each Fund would depend on growth in assets under management. The Board considered that HIMCO offers a contractual management fee waiver on each of the Funds for as long as each Fund remains invested in a Master Fund. Under the waiver, HIMCO retains a net contractual management fee of 0.25% of each Fund’s average daily net assets in order to compensate it for the administrative services and certain advisory services that HIMCO provides each under the Agreement. Based on these considerations, the Board concluded that the profits anticipated to be realized by HIMCO and its affiliates from their relationships with each Fund would not be excessive.
Other Benefits
The Board considered other benefits to the Adviser and its affiliates from their relationships with the Funds. The Board also considered that HDSC, an affiliate of HIMCO, will serve as principal underwriter of the Funds. As principal underwriter, HDSC would receive 12b-1 fees from each Fund.
* * * *
Based upon its review of these various factors, among others, the Board concluded that it is in the best interests of each Fund and its shareholders for the Board to approve the Agreement. In reaching this decision, the Board did not assign relative weights to the factors discussed above or deem any one or group of them to be controlling in and of themselves. In connection with their deliberations, the Independent Trustees met separately in executive session with legal counsel to review the relevant materials and consider their responsibilities under relevant laws and regulations.
Main Risks (Unaudited)
The main risks of investing in the Funds are described below. Each Fund is exposed to these risks through its investment in the corresponding Underlying Fund.
HIMCO VIT American Funds Asset Allocation Fund 1,2,3,4,6,7,8,9,10,11,12
HIMCO VIT American Funds Blue Chip Income and Growth Fund 4,6,7,9,11,12
HIMCO VIT American Funds Bond Fund 2,3,6,8,9,10,11,12,13,16,17,18
HIMCO VIT American Funds Global Bond Fund 2,3,5,6,8,9,10,11,12,14
HIMCO VIT American Funds Global Growth and Income Fund 4,5,6,7,9,11,12
HIMCO VIT American Funds Global Growth Fund 5,6,7,9,11,12
HIMCO VIT American Funds Global Small Capitalization Fund 5,6,7,9,11,12,15
HIMCO VIT American Funds Growth Fund 6,7,9,11,12
HIMCO VIT American Funds Growth-Income Fund 4,6,7,9,11,12
HIMCO VIT American Funds International Fund 5,6,7,9,11,12
HIMCO VIT American Funds New World Fund 2,3,5,6,7,8,9,10,11,12,15
| 1. | Asset Allocation Risk – The risk that if the strategy of the Master Fund’s investment adviser for allocating assets among different asset classes does not work as intended, the Fund may not achieve its objective or may underperform other funds with similar investment strategies. |
| 2. | Call Risk – Call risk is the risk that an issuer, especially during a period of falling interest rates, may redeem a security by repaying it early, which may reduce the Fund’s income if the proceeds are reinvested at lower interest rates. |
| 3. | Credit Risk – Credit risk is the risk that the issuer of a security or other instrument will not be able to make principal and interest payments then due. Changes in an issuer’s credit rating or the market’s perception of an issuer’s creditworthiness may also affect the value of the Fund’s investment in that issuer. The degree of credit risk depends on both the financial condition of the issuer and the terms of the obligation. |
| 4. | Dividend Paying Security Investment Risk – Securities that pay high dividends as a group can fall out of favor with the market, causing the Fund during such periods to underperform funds that do not focus on dividends. The Fund’s focus on dividend paying investments may cause the Fund’s share price and total return to fluctuate more than the share price and total return of funds that do not focus their investments on dividend paying securities. In addition, income provided by the Fund may be affected by changes in the dividend policies of the companies in which the Fund invests and the capital resources available for such payments at such companies. |
| 5. | Emerging Markets Risk – The risks related to investing in foreign securities are generally greater with respect to securities of companies that conduct their principal business activities in emerging markets or whose securities are traded principally on exchanges in emerging markets. The risks of investing in emerging markets include risks of illiquidity, increased price volatility, smaller market capitalizations, less government regulation, less extensive and less frequent accounting, financial and other reporting requirements, risk of loss resulting from problems in share registration and custody and substantial economic and political disruptions. |
| 6. | Foreign Investments Risk – Investments in foreign securities may be riskier than investments in U.S. securities. Differences between the U.S. and foreign regulatory regimes and securities markets, including the less stringent investor protection and disclosure standards of some foreign markets, as well as political and economic developments in foreign countries and regions, may affect the value of the Fund’s investments in foreign securities. Changes in currency exchange rates may also adversely affect the Fund’s foreign investments. |
| 7. | Growth Orientation Risk – The price of a growth company’s stock may decrease, or it may not increase to the level that the Master Fund’s investment adviser had anticipated. In addition, growth stocks may be more volatile than other stocks because they are more sensitive to investors’ perceptions of the issuing company’s growth potential. Also, the growth investing style may over time go in and out of favor. At times when the investing style used by the Master Fund is out of favor, the Master Fund may underperform other equity funds that use different investing styles. |
| 8. | Interest Rate Risk – The risk that your investment may go down in value when interest rates rise, because when interest rates rise, the prices of bonds and fixed rate loans fall. Generally, the longer the maturity of a bond or fixed rate loan, the |
Main Risks (Unaudited) – (continued)
| | more sensitive it is to this risk. Falling interest rates also create the potential for a decline in the Fund’s income. These risks are greater during periods of rising inflation. Volatility in interest rates and in fixed income markets may increase the risk that the Fund’s investment in fixed income securities will go down in value. |
| 9. | Investment Strategy Risk – The investment strategy of the Master Fund’s investment adviser will influence performance significantly. If the investment strategy of the Master Fund’s investment adviser does not perform as expected, the Fund could underperform its peers or lose money. There is no guarantee that the Master Fund’s investment objective will be achieved. |
| 10. | Junk Bond Risk – Investments rated below investment grade (also referred to as “junk bonds”) are considered to be speculative and are subject to heightened credit risk, which may make the Fund more sensitive to adverse developments in the U.S. and abroad. Lower rated debt securities generally involve greater risk of default or price changes due to changes in the issuer’s creditworthiness than higher rated debt securities. The market prices of these securities may fluctuate more than higher quality securities and may decline significantly in periods of general economic difficulty. There may be little trading in the secondary market for particular debt securities, which may make them more difficult to value or sell. |
| 11. | Master-Feeder Structure Risk – Because it invests in the Master Fund, the Fund is also subject to risks related to the master-feeder structure. Other “feeder” funds may also invest in an Master Fund. As shareholders of a Master Fund, feeder funds, including the Fund, vote on matters pertaining to their respective Master Fund. Feeder funds with a greater pro rata ownership in an Master Fund could have effective voting control of the operations of the Master Fund. Also, a large-scale redemption by another feeder fund may increase the proportionate share of the costs of an Master Fund borne by the remaining feeder fund shareholders, including the applicable fund. |
| 12. | Market Risk – Market risk is the risk that one or more markets in which the Fund invests will go down in value, including the possibility that the markets will go down sharply and unpredictably. Securities may decline in value due to the activities and financial prospects of individual companies or to general market and economic movements and trends. |
| 13. | Mortgage- and Asset-Backed Securities Risk – Mortgage- and asset-backed securities represent interests in “pools” of mortgages or other assets, including consumer loans or receivables held in trust. Mortgage-backed securities are subject to credit risk, interest rate risk,“prepayment risk” (the risk that borrowers will repay a loan more quickly in periods of falling interest rates) and “extension risk” (the risk that borrowers will repay a loan more slowly in periods of rising interest rates). If the Fund invests in mortgage-backed or asset-backed securities that are subordinated to other interests in the same mortgage pool, the Fund may only receive payments after the pool’s obligations to other investors have been satisfied. An unexpectedly high rate of defaults on the mortgages held by a mortgage pool may limit substantially the pool’s ability to make payments of principal or interest to the Fund, reducing the values of those securities or in some cases rendering them worthless. The risk of such defaults is generally higher in the case of mortgage pools that include so-called “subprime” mortgages. |
| 14. | Non-Diversification Risk – The Master Fund is non-diversified, which means it is permitted to invest more of its assets in fewer issuers than a “diversified” fund. Thus, the Fund may be more exposed to the risks associated with and developments affecting an individual issuer than a fund that invests more widely. The Fund may also be subject to greater market fluctuation and price volatility than a more broadly diversified Fund. |
| 15. | Small Cap Stock Risk – Small capitalization stocks may be more risky than stocks of larger companies. Historically, small market capitalization stocks and stocks of recently organized companies are subject to increased price volatility due to: |
| | • | | less certain growth prospects |
| | • | | lower degree of liquidity in the markets for such stocks |
| | • | | thin trading that could result in the stocks being sold at a discount or in small lots over an extended period of time |
| | • | | limited product lines, markets or financial resources |
| | • | | dependence on a few key management personnel |
| | • | | increased susceptibility to losses and bankruptcy increased transaction costs |
| 16. | U.S. Government Securities Risk – Treasury obligations may differ in their interest rates, maturities, times of issuance and other characteristics. Obligations of U.S. Government agencies and authorities are supported by varying degrees of credit but |
Main Risks (Unaudited) – (concluded)
| | generally are not backed by the full faith and credit of the U.S. Government. No assurance can be given that the U.S. Government will provide financial support to its agencies and authorities if it is not obligated by law to do so. In addition, the value of U.S. Government securities may be affected by changes in the credit rating of the U.S. Government. U.S. Government securities are also subject to default risk, that is the risk that the U.S. Treasury will be unable to meet its payment obligations. |
| 17. | Dollar Rolls Risk – Dollar rolls involve the risk that the market value of the securities that the Fund is committed to buy may decline below the price of the securities the Fund has sold. These transactions may involve leverage. |
| 18. | To Be Announced (TBA) Securities Risk – TBA securities involve the risk that the security the Fund buys will lose value prior to its delivery. There also is the risk that the security will not be issued or that the other party to the transaction will not meet its obligation. If this occurs, the Fund loses both the investment opportunity for the assets it set aside to pay for the security and any gain in the security’s price. |
THIS PRIVACY POLICY IS NOT PART OF THIS REPORT
Privacy Policy and Practices of The Hartford Financial Services Group, Inc. and its Affiliates
(herein called “we, our and us”)
This Privacy Policy applies to our United States Operations
We value your trust. We are committed to the responsible:
a) management;
b) use; and
c) protection;
of Personal Information.
This notice describes how we collect, disclose, and protect
Personal Information.
We collect Personal Information to:
a) service your Transactions with us; and
b) support our business functions.
We may obtain Personal Information from:
a) You;
b) your Transactions with us; and
c) third parties such as a consumer-reporting agency.
Based on the type of product or service You apply for or
get from us, Personal Information such as:
a) your name;
b) your address;
c) your income;
d) your payment; or
e) your credit history;
may be gathered from sources such as applications,
Transactions, and consumer reports.
To serve You and service our business, we may share
certain Personal Information. We will share Personal
Information, only as allowed by law, with affiliates
such as:
a) our insurance companies;
b) our employee agents;
c) our brokerage firms; and
d) our administrators.
As allowed by law, we may share Personal Financial
Information with our affiliates to:
a) market our products; or
b) market our services;
to You without providing You with an option to prevent
these disclosures.
We may also share Personal Information, only as allowed
by law, with unaffiliated third parties including:
a) independent agents;
b) brokerage firms;
c) insurance companies;
d) administrators; and
e) service providers;
who help us serve You and service our business.
When allowed by law, we may share certain Personal
Financial Information with other unaffiliated third parties
who assist us by performing services or functions such as:
a) taking surveys;
b) marketing our products or services; or
c) offering financial products or services under a joint agreement between us and one or more financial institutions.
We, and third parties we partner with, may track some of the pages You visit through the use of:
a) cookies;
b) pixel tagging; or
c) other technologies;
and currently do not process or comply with any web browser’s “do not track” signal or other similar mechanism that indicates a request to disable online tracking of individual users who visit our websites or use our services.
We will not sell or share your Personal Financial Information with anyone for purposes unrelated to our business functions without offering You the opportunity to:
a) “opt-out;” or
b) “opt-in;”
as required by law.
We only disclose Personal Health Information with:
a) your proper written authorization; or
b) as otherwise allowed or required by law.
Our employees have access to Personal Information in the course of doing their jobs, such as:
a) underwriting policies;
b) paying claims;
c) developing new products; or
d) advising customers of our products and services.
We use manual and electronic security procedures to maintain:
a) the confidentiality; and
b) the integrity of;
Personal Information that we have. We use these procedures to guard against unauthorized access.
Some techniques we use to protect Personal Information include:
a) secured files;
b) user authentication;
c) encryption;
d) firewall technology; and
e) the use of detection software.
We are responsible for and must:
a) identify information to be protected;
b) provide an adequate level of protection for that data;
c) grant access to protected data only to those people who must use it in the performance of their job-related duties.
Employees who violate our Privacy Policy will be subject to discipline, which may include ending their employment with us.
At the start of our business relationship, we will give You a copy of our current Privacy Policy.
We will also give You a copy of our current Privacy Policy once a year if You maintain a continuing business relationship with us.
We will continue to follow our Privacy Policy regarding Personal Information even when a business relationship no longer exists between us.
As used in this Privacy Notice:
Application means your request for our product or service.
Personal Financial Information means financial information such as:
a) credit history;
b) income;
c) financial benefits; or
d) policy or claim information.
Personal Health Information means health information such as:
a) your medical records; or
b) information about your illness, disability or injury.
Personal Information means information that identifies You personally and is not otherwise available to the public. It includes:
a) Personal Financial Information; and
b) Personal Health Information .
Transaction means your business dealings with us, such as:
a) your Application;
b) your request for us to pay a claim; and
c) your request for us to take an action on your account.
You means an individual who has given us Personal Information in conjunction with:
a) asking about;
b) applying for; or
c) obtaining;
a financial product or service from us if the product or service is used mainly for personal, family, or household purposes.
This Privacy Policy is being provided on behalf of the following affiliates of The Hartford Financial Services Group, Inc.: 1stAGChoice, Inc.; Access CoverageCorp, Inc.; Access CoverageCorp Technologies, Inc.; American Maturity Life Insurance Company; Archway 60 R, LLC; Business Management Group, Inc.; DMS R, LLC; First State Insurance Company; Fountain Investors I LLC; Fountain Investors II LLC; Fountain Investors III LLC; Fountain Investors IV LLC; FTC Resolution Company LLC; Hart Re Group L.L.C.; Hartford Accident and Indemnity Company; Hartford Administrative Services Company; Hartford Casualty General Agency, Inc.; Hartford Casualty Insurance Company; Hartford Financial Services, LLC; Hartford Fire General Agency, Inc.; Hartford Fire Insurance Company; Hartford Funds Distributors, LLC; Hartford Funds Management Company, LLC; Hartford Funds Management Group, Inc.; Hartford Holdings, Inc.; Hartford HLS Series Fund II, Inc.; Hartford Insurance Company of Illinois; Hartford Insurance Company of the Midwest; Hartford Insurance Company of the Southeast; Hartford Integrated Technologies, Inc.; Hartford International Life Reassurance Corporation; Hartford Investment Management Company; Hartford Life and Accident Insurance Company; Hartford Life and Annuity Insurance Company; Hartford Life Insurance Company; Hartford Life, Inc.; Hartford Life International Holding Company; Hartford Life Private Placement, LLC; Hartford Lloyd’s Corporation; Hartford Lloyd’s Insurance Company; Hartford of Texas General Agency, Inc.; Hartford Residual Market, L.C.C.; Hartford Securities Distribution Company, Inc.; Hartford Series Fund, Inc.; Hartford Specialty Insurance Services of Texas, LLC; Hartford Strategic Investments, LLC; Hartford Underwriters General Agency, Inc.; Hartford Underwriters Insurance Company; Hartford-Comprehensive Employee Benefit Service Company; HDC R, LLC .; Heritage Holdings, Inc.; HIMCO Distribution Services Company; HIMCO Variable Insurance Trust; HLA LLC; HL Investment Advisors, LLC; Horizon Management Group, LLC; HRA Brokerage Services, Inc.; Lanidex Class B, LLC; New England Insurance Company; New England Reinsurance Corporation; Nutmeg Insurance Agency, Inc.; Nutmeg Insurance Company; Pacific Insurance Company, Limited; Planco, LLC; Property and Casualty Insurance Company of Hartford; Revere R, LLC; RVR R, LLC; Sentinel Insurance Company, Ltd.; Sunstone R, LLC; Symphony R, LLC; The Evergreen Group Incorporated; The Hartford Alternative Strategies Fund; The Hartford Mutual Funds, Inc.; The Hartford Mutual Funds II, Inc.; Trumbull Flood Management, L.L.C.; Trumbull Insurance Company; Twin City Fire Insurance Company.
HPP Revised February 2015

Item 2. Code of Ethics.
As of the end of the period covered by this report, the registrant has adopted a code of ethics that applies to the registrant’s principal executive officer and principal financial officer. A copy of the code of ethics is filed herewith and is available, without charge, upon request, by calling 860-297-6700. There have been no amendments, during the period covered by this report, to a provision of the code of ethics that applies to the registrant’s principal executive officer or principal financial officer. The registrant has not granted any waivers, including an implicit waiver, from a provision of the code of ethics that applies to the registrant’s principal executive officer or principal financial officer
Item 3. Audit Committee Financial Expert.
The Board of Trustees of the registrant has designated Mark Osterheld as the audit committee financial expert for the registrant. Mr. Osterheld qualifies as “independent” pursuant to paragraph (a)(2) of Item 3 to Form N-CSR.
Item 4. Principal Accountant Fees and Services.
| (a) | Audit Fees: The registrant commenced operations on October 20, 2014 following the reorganization of certain series of Hartford Series Fund, Inc. (“HSF”) into corresponding shell series of HIMCO Variable Insurance Trust (“HVIT”), a newly-organized open-end investment management company (each, a “Reorganization”). The aggregate fees billed for professional services rendered by the principal accountant for the audit of the registrant’s annual financial statements or services that are normally provided by the accountant in connection with statutory and regulatory filings or engagements for the period ending December 31, 2014 are expected to total approximately $230,000. |
| (b) | Audit-Related Fees: Deloitte & Touche LLP (“D&T”), the registrant’s principal accountant, did not bill any fees to the registrant in the last two fiscal years for assurance and related services by the principal accountant that are reasonably related to the performance of the audit of the registrant’s financial statements and are not reported under paragraph (a) of this Item. |
| (c) | Tax Fees: As of the date of this report, the aggregate fees invoiced by the principal accountant for professional services rendered for tax compliance, tax advice, and tax planning were $0. However, total Tax Fees for the period ending December 31, 2014 are not yet available. Registrant expects that such fees will total approximately $30,000. |
| (d) | All Other Fees: The registrant’s principal accountant did not provide any services to the registrant, other than the services reported in paragraphs (a) through (c) of this Item. |
| (e) | (1) The Pre-Approval Policies and Procedures (the “Policy”) adopted by the Audit Committee of the registrant sets forth the procedures pursuant to which services provided by the independent registered public accounting firm (the “Independent Auditor”) for the registrant may be pre-approved. The following are some main provisions from the Policy: |
| | - | The Audit Committee must pre-approve all audit services and non-audit services that the Independent Auditor provides to the registrant. |
| | - | The Audit Committee must pre-approve any engagement of the Independent Auditor to provide non-audit services to any service affiliate (which is defined to include any entity controlling, controlled by, or under common control with the investment adviser that provides ongoing services to the registrant) during the period of the Independent Auditor’s engagement to provide audit services to the registrant, if the non-audit services to the service affiliate directly impact the registrant’s operations and financial reporting. |
| | - | The Audit Committee shall pre-approve certain non-audit services to the registrant and its service affiliates pursuant to procedures set forth in the Policy. |
The Independent Auditor may not provide specified prohibited non-audit services set forth in the Policy to the registrant, the registrant’s investment adviser, the service affiliates or any other member of the investment company complex.
(2) Not applicable
| (g) | The aggregate non-audit fees billed by the registrant’s accountant for services rendered to the registrant, and rendered to the registrant’s investment adviser (not including any sub-adviser whose role is primarily portfolio management and is subcontracted with or overseen by another investment adviser), and any entity controlling, controlled by, or under common control with the adviser for the fiscal years ending December 31, 2013 and December 31, 2014 were approximately $2,015,000 and $2,252,000, respectively. |
| (h) | The registrant’s audit committee of the board of trustees has considered whether the provision of non-audit services that were rendered to the registrant’s investment adviser and service affiliates is compatible with maintaining the principal accountant’s independence. |
Item 5. Audit Committee of Listed Registrants
Not applicable
Item 6. Investments.
| (a) | The Schedule of Investments in securities of unaffiliated issuers as of the close of the reporting period is included as part of the annual report filed under Item 1 of this form. |
Item 7. Disclosure of Proxy Voting Policies and Procedures for Closed-End Management Investment Companies.
Not applicable
Item 8. Portfolio Managers of Closed-End Management Investment Companies.
Not applicable
Item 9. Purchases of Equity Securities by Closed-End Management Investment Company and Affiliated Purchasers.
Not applicable
Item 10. Submission of Matters to a Vote of Security Holders.
Not applicable
Item 11. Controls and Procedures.
| (a) | The registrant’s principal executive and principal financial officers, or persons performing similar functions, have concluded that the registrant’s disclosure controls and procedures (as defined in Rule 30a-3(c) under the Investment Company Act of 1940, as amended (the “1940 Act”) (17 CFR 270.30a-3(c))) are generally effective to provide reasonable assurance, as of a date within 90 days of the filing date of the report that includes the disclosure required by this paragraph, based on their evaluation of these controls and procedures required by Rule 30a-3(b) under the 1940 Act (17 CFR 270.30a-3(b)) and Rules 13a-15(b) or 15d-15(b) under the Securities Exchange Act of 1934, as amended (17 CFR 240.13a-15(b) or 240.15d-15(b)). |
| (b) | The registrant did not experience a change in internal control over financial reporting. |
Item 12. Exhibits.
| | (2) (i) A separate certification for each principal executive officer and principal financial officer of the registrant as required by Rule 30a-2(a) under the Investment Company Act of 1940 (17 CFR 270.30a-2(a)) |
| | (ii) The certification required by Section 906 of the Sarbanes-Oxley Act of 2002 |
SIGNATURES
Pursuant to the requirements of the Securities Exchange Act of 1934 and the Investment Company Act of 1940, the registrant has duly caused this report to be signed on its behalf by the undersigned, thereunto duly authorized.
| | |
| HIMCO Variable Insurance Trust |
| |
| By: | | /s/ Matthew Poznar |
| | Matthew Poznar |
| | President |
| | February 27, 2015 |
Pursuant to the requirements of the Securities Exchange Act of 1934 and the Investment Company Act of 1940, this report has been signed below by the following persons on behalf of the registrant and in the capacities and on the dates indicated.
| | |
| HIMCO Variable Insurance Trust |
| |
| By: | | /s/ Matthew Poznar |
| | Matthew Poznar |
| | President |
| | February 27, 2015 |
| | |
| |
| By: | | /s/ Peter Sannizzaro |
| | Peter Sannizzaro |
| | Treasurer |
| | February 27, 2015 |