UNITED STATES
SECURITIES AND EXCHANGE COMMISSION
Washington, D.C. 20549
FORM N-CSR
CERTIFIED SHAREHOLDER REPORT OF REGISTERED
MANAGEMENT INVESTMENT COMPANIES
Investment Company Act file number 811-22954
HIMCO VARIABLE INSURANCE TRUST
(Exact name of registrant as specified in charter)
One Hartford Plaza, Hartford, Connecticut 06155
(Address of principal executive offices) (Zip code)
Brenda J. Page
Hartford Investment Management Company
One Hartford Plaza
Hartford, Connecticut 06155
(Name and address of agent for service)
Registrant’s telephone number, including area code: (860) 297-6444
Date of fiscal year end: December 31
Date of reporting period: June 30, 2017
Form N-CSR is to be used by management investment companies to file reports with the Commission not later than 10 days after the transmission to stockholders of any report that is required to be transmitted to stockholders under Rule 30e-1 under the Investment Company Act of 1940 (17 CFR 270.30e-1). The Commission may use the information provided on Form N-CSR in its regulatory, disclosure review, inspection, and policymaking roles.
A registrant is required to disclose the information specified by Form N-CSR, and the Commission will make this information public. A registrant is not required to respond to the collection of information contained in Form N-CSR unless the Form displays a currently valid Office of Management and Budget (“OMB”) control number. Please direct comments concerning the accuracy of the information collection burden estimate and any suggestions for reducing the burden to Secretary, Securities and Exchange Commission, 450 Fifth Street, NW, Washington, DC 20549-0609. The OMB has reviewed this collection of information under the clearance requirements of 44 U.S.C. § 3507.
Item 1. Reports to Stockholders.

HIMCO VIT Index Fund
This report is prepared for the general information of contract owners and qualified retirement plan participants. It is not an offer to buy or sell an annuity contract or qualified retirement plan, fund or any security. It should not be used in connection with any offer, except in conjunction with the appropriate product prospectus (which contains all pertinent product information including the applicable sales, administrative and other charges) and the current prospectus and/or summary prospectus of the Fund available for investment thereunder.
| HIMCO VIT Index Fund |
June 30, 2017 (Unaudited)
Shares or Principal Amount | Market Value(1) | |||||||
| COMMON STOCKS - 99.1% | ||||||||
| Automobiles & Components - 0.7% | ||||||||
| 10,467 | BorgWarner, Inc. | $ | 443,382 | |||||
| 14,056 | Delphi Automotive plc | 1,232,008 | ||||||
| 205,214 | Ford Motor Co. | 2,296,345 | ||||||
| 72,053 | General Motors Co. | 2,516,811 | ||||||
| 13,211 | Goodyear Tire & Rubber Co. (The) | 461,857 | ||||||
| 9,184 | Harley-Davidson, Inc. | 496,120 | ||||||
|
| |||||||
| 7,446,523 | ||||||||
|
| |||||||
| Banks - 6.4% | ||||||||
| 522,168 | Bank of America Corp. | 12,667,796 | ||||||
| 42,572 | BB&T Corp. | 1,933,195 | ||||||
| 144,461 | Citigroup, Inc. | 9,661,552 | ||||||
| 26,578 | Citizens Financial Group, Inc. | 948,303 | ||||||
| 9,284 | Comerica, Inc. | 679,960 | ||||||
| 39,366 | Fifth Third Bancorp | 1,021,941 | ||||||
| 57,040 | Huntington Bancshares, Inc. | 771,181 | ||||||
| 186,413 | JPMorgan Chase & Co. | 17,038,148 | ||||||
| 57,512 | KeyCorp | 1,077,775 | ||||||
| 8,073 | M&T Bank Corp. | 1,307,422 | ||||||
| 18,068 | People’s United Financial, Inc. | 319,081 | ||||||
| 25,390 | PNC Financial Services Group, Inc. (The) | 3,170,449 | ||||||
| 63,071 | Regions Financial Corp. | 923,360 | ||||||
| 25,368 | SunTrust Banks, Inc. | 1,438,873 | ||||||
| 83,120 | US Bancorp | 4,315,590 | ||||||
| 235,985 | Wells Fargo & Co. | 13,075,929 | ||||||
| 10,632 | Zions Bancorp | 466,851 | ||||||
|
| |||||||
| 70,817,406 | ||||||||
|
| |||||||
| Capital Goods - 7.3% | ||||||||
| 31,355 | 3M Co. | 6,527,797 | ||||||
| 2,314 | Acuity Brands, Inc. | 470,390 | ||||||
| 4,999 | Allegion plc | 405,519 | ||||||
| 12,074 | AMETEK, Inc. | 731,322 | ||||||
| 23,127 | Arconic, Inc. | 523,827 | ||||||
| 29,453 | Boeing Co. (The) | 5,824,331 | ||||||
| 30,913 | Caterpillar, Inc. | 3,321,911 | ||||||
| 8,108 | Cummins, Inc. | 1,315,280 | ||||||
| 15,440 | Deere & Co. | 1,908,230 | ||||||
| 8,168 | Dover Corp. | 655,237 | ||||||
| 23,469 | Eaton Corp. plc | 1,826,592 | ||||||
| 33,815 | Emerson Electric Co. | 2,016,050 | ||||||
| 15,177 | Fastenal Co. | 660,655 | ||||||
| 6,853 | Flowserve Corp. | 318,185 | ||||||
| 7,334 | Fluor Corp. | 335,751 | ||||||
| 15,821 | Fortive Corp. | 1,002,260 | ||||||
| 8,072 | Fortune Brands Home & Security, Inc. | 526,617 | ||||||
| 14,879 | General Dynamics Corp. | 2,947,530 | ||||||
| 456,939 | General Electric Co. | 12,341,922 | ||||||
| 39,999 | Honeywell International, Inc. | 5,331,467 | ||||||
| 16,313 | Illinois Tool Works, Inc. | 2,336,837 | ||||||
| 13,433 | Ingersoll-Rand plc | 1,227,642 | ||||||
| 6,319 | Jacobs Engineering Group, Inc. | 343,690 | ||||||
| 49,222 | Johnson Controls International plc | 2,134,266 | ||||||
| 4,086 | L3 Technologies, Inc. | 682,689 | ||||||
| 13,061 | Lockheed Martin Corp. | 3,625,864 | ||||||
| 16,787 | Masco Corp. | 641,431 | ||||||
| 9,160 | Northrop Grumman Corp. | 2,351,464 | ||||||
| 18,431 | PACCAR, Inc. | 1,217,183 | ||||||
| 6,988 | Parker-Hannifin Corp. | 1,116,822 | ||||||
| 8,797 | Pentair plc | 585,352 | ||||||
| 7,771 | Quanta Services, Inc.(2) | 255,821 | ||||||
| 15,272 | Raytheon Co. | 2,466,123 | ||||||
Shares or Principal Amount | Market Value(1) | |||||||
| COMMON STOCKS - 99.1% - (continued) | ||||||||
| Capital Goods - 7.3% - (continued) | ||||||||
| 6,760 | Rockwell Automation, Inc. | $ | 1,094,850 | |||||
| 8,520 | Rockwell Collins, Inc. | 895,282 | ||||||
| 5,354 | Roper Technologies, Inc. | 1,239,612 | ||||||
| 3,041 | Snap-on, Inc. | 480,478 | ||||||
| 8,026 | Stanley Black & Decker, Inc. | 1,129,499 | ||||||
| 14,045 | Textron, Inc. | 661,519 | ||||||
| 2,566 | TransDigm Group, Inc. | 689,920 | ||||||
| 4,434 | United Rentals, Inc.(2) | 499,756 | ||||||
| 39,097 | United Technologies Corp. | 4,774,135 | ||||||
| 2,819 | WW Grainger, Inc. | 508,914 | ||||||
| 9,430 | Xylem, Inc. | 522,705 | ||||||
|
| |||||||
| 80,472,727 | ||||||||
|
| |||||||
| Commercial & Professional Services - 0.6% | ||||||||
| 4,531 | Cintas Corp. | 571,087 | ||||||
| 6,307 | Equifax, Inc. | 866,708 | ||||||
| 16,652 | IHS Markit Ltd.(2) | 733,354 | ||||||
| 17,623 | Nielsen Holdings plc | 681,305 | ||||||
| 12,062 | Republic Services, Inc. | 768,712 | ||||||
| 6,673 | Robert Half International, Inc. | 319,837 | ||||||
| 4,474 | Stericycle, Inc.(2) | 341,456 | ||||||
| 8,068 | Verisk Analytics, Inc.(2) | 680,697 | ||||||
| 21,326 | Waste Management, Inc. | 1,564,262 | ||||||
|
| |||||||
| 6,527,418 | ||||||||
|
| |||||||
| Consumer Durables & Apparel - 1.3% | ||||||||
| 14,751 | Coach, Inc. | 698,312 | ||||||
| 17,933 | DR Horton, Inc. | 619,944 | ||||||
| 6,020 | Garmin Ltd. | 307,201 | ||||||
| 19,107 | Hanesbrands, Inc. | 442,518 | ||||||
| 5,903 | Hasbro, Inc. | 658,244 | ||||||
| 6,942 | Leggett & Platt, Inc. | 364,663 | ||||||
| 10,661 | Lennar Corp., Class A | 568,445 | ||||||
| 17,974 | Mattel, Inc. | 386,980 | ||||||
| 8,177 | Michael Kors Holdings Ltd.(2) | 296,416 | ||||||
| 3,315 | Mohawk Industries, Inc.(2) | 801,202 | ||||||
| 25,348 | Newell Brands, Inc. | 1,359,160 | ||||||
| 69,533 | NIKE, Inc., Class B | 4,102,447 | ||||||
| 14,899 | PulteGroup, Inc. | 365,472 | ||||||
| 4,093 | PVH Corp. | 468,649 | ||||||
| 2,892 | Ralph Lauren Corp. | 213,430 | ||||||
| 9,690 | Under Armour, Inc., Class A(2) | 210,854 | ||||||
| 9,672 | Under Armour, Inc., Class C(2) | 194,988 | ||||||
| 16,809 | VF Corp. | 968,198 | ||||||
| 3,881 | Whirlpool Corp. | 743,677 | ||||||
|
| |||||||
| 13,770,800 | ||||||||
|
| |||||||
| Consumer Services - 1.8% | ||||||||
| 21,961 | Carnival Corp. | 1,439,983 | ||||||
| 1,504 | Chipotle Mexican Grill, Inc.(2) | 625,814 | ||||||
| 6,524 | Darden Restaurants, Inc. | 590,031 | ||||||
| 10,870 | H&R Block, Inc. | 335,992 | ||||||
| 10,751 | Hilton Worldwide Holdings, Inc. | 664,949 | ||||||
| 16,302 | Marriott International, Inc., Class A | 1,635,254 | ||||||
| 42,766 | McDonald’s Corp. | 6,550,040 | ||||||
| 8,802 | Royal Caribbean Cruises Ltd. | 961,442 | ||||||
| 75,981 | Starbucks Corp. | 4,430,452 | ||||||
| 5,475 | Wyndham Worldwide Corp. | 549,745 | ||||||
| 4,189 | Wynn Resorts Ltd. | 561,829 | ||||||
| 17,358 | Yum! Brands, Inc. | 1,280,326 | ||||||
|
| |||||||
| 19,625,857 | ||||||||
|
| |||||||
The accompanying Notes are an integral part of these financial statements.
| 2 |
|
| HIMCO VIT Index Fund |
Schedule of Investments – (continued)
June 30, 2017 (Unaudited)
Shares or Principal Amount | Market Value(1) | |||||||
| COMMON STOCKS - 99.1% - (continued) | ||||||||
| Diversified Financials - 5.2% | ||||||||
| 2,970 | Affiliated Managers Group, Inc. | $ | 492,604 | |||||
| 39,393 | American Express Co. | 3,318,466 | ||||||
| 7,999 | Ameriprise Financial, Inc. | 1,018,193 | ||||||
| 54,562 | Bank of New York Mellon Corp. (The) | 2,783,753 | ||||||
| 99,665 | Berkshire Hathaway, Inc., Class B(2) | 16,880,261 | ||||||
| 6,361 | BlackRock, Inc. | 2,686,950 | ||||||
| 25,341 | Capital One Financial Corp. | 2,093,673 | ||||||
| 4,821 | CBOE Holdings, Inc. | 440,639 | ||||||
| 63,844 | Charles Schwab Corp. (The) | 2,742,738 | ||||||
| 17,828 | CME Group, Inc. | 2,232,779 | ||||||
| 19,948 | Discover Financial Services | 1,240,566 | ||||||
| 14,412 | E*TRADE Financial Corp.(2) | 548,088 | ||||||
| 17,966 | Franklin Resources, Inc. | 804,697 | ||||||
| 19,208 | Goldman Sachs Group, Inc. (The) | 4,262,255 | ||||||
| 31,065 | Intercontinental Exchange, Inc. | 2,047,805 | ||||||
| 21,347 | Invesco Ltd. | 751,201 | ||||||
| 16,991 | Leucadia National Corp. | 444,485 | ||||||
| 8,733 | Moody’s Corp. | 1,062,632 | ||||||
| 74,734 | Morgan Stanley | 3,330,147 | ||||||
| 5,980 | NASDAQ, Inc. | 427,510 | ||||||
| 14,951 | Navient Corp. | 248,934 | ||||||
| 11,323 | Northern Trust Corp. | 1,100,709 | ||||||
| 6,725 | Raymond James Financial, Inc. | 539,480 | ||||||
| 13,527 | S&P Global, Inc. | 1,974,807 | ||||||
| 18,556 | State Street Corp. | 1,665,030 | ||||||
| 40,414 | Synchrony Financial | 1,205,146 | ||||||
| 12,659 | T Rowe Price Group, Inc. | 939,424 | ||||||
|
| |||||||
| 57,282,972 | ||||||||
|
| |||||||
| Energy - 6.0% | ||||||||
| 29,401 | Anadarko Petroleum Corp. | 1,333,041 | ||||||
| 19,958 | Apache Corp. | 956,587 | ||||||
| 22,325 | Baker Hughes, Inc. | 1,216,936 | ||||||
| 24,426 | Cabot Oil & Gas Corp. | 612,604 | ||||||
| 40,022 | Chesapeake Energy Corp.(2) | 198,909 | ||||||
| 99,406 | Chevron Corp. | 10,371,028 | ||||||
| 4,990 | Cimarex Energy Co. | 469,110 | ||||||
| 7,774 | Concho Resources, Inc.(2) | 944,774 | ||||||
| 64,910 | ConocoPhillips | 2,853,444 | ||||||
| 27,583 | Devon Energy Corp. | 881,829 | ||||||
| 30,289 | EOG Resources, Inc. | 2,741,760 | ||||||
| 9,094 | EQT Corp. | 532,817 | ||||||
| 222,326 | Exxon Mobil Corp. | 17,948,378 | ||||||
| 45,536 | Halliburton Co. | 1,944,843 | ||||||
| 5,696 | Helmerich & Payne, Inc. | 309,521 | ||||||
| 14,179 | Hess Corp. | 622,033 | ||||||
| 100,736 | Kinder Morgan, Inc. | 1,930,102 | ||||||
| 44,598 | Marathon Oil Corp. | 528,486 | ||||||
| 27,218 | Marathon Petroleum Corp. | 1,424,318 | ||||||
| 8,510 | Murphy Oil Corp. | 218,111 | ||||||
| 19,940 | National Oilwell Varco, Inc. | 656,824 | ||||||
| 10,452 | Newfield Exploration Co.(2) | 297,464 | ||||||
| 23,883 | Noble Energy, Inc. | 675,889 | ||||||
| 40,117 | Occidental Petroleum Corp. | 2,401,805 | ||||||
| 19,925 | ONEOK, Inc. | 1,039,288 | ||||||
| 23,017 | Phillips 66 | 1,903,276 | ||||||
| 8,925 | Pioneer Natural Resources Co. | 1,424,252 | ||||||
| 9,873 | Range Resources Corp. | 228,757 | ||||||
| 72,905 | Schlumberger Ltd. | 4,800,065 | ||||||
| 24,482 | TechnipFMC plc(2) | 665,910 | ||||||
| 7,930 | Tesoro Corp. | 742,248 | ||||||
Shares or Principal Amount | Market Value(1) | |||||||
| COMMON STOCKS - 99.1% - (continued) | ||||||||
| Energy - 6.0% - (continued) | ||||||||
| 20,518 | Transocean Ltd.(2) | $ | 168,863 | |||||
| 23,466 | Valero Energy Corp. | 1,583,016 | ||||||
| 43,354 | Williams Cos., Inc. (The) | 1,312,759 | ||||||
|
| |||||||
| 65,939,047 | ||||||||
|
| |||||||
| Food & Staples Retailing - 1.9% | ||||||||
| 23,013 | Costco Wholesale Corp. | 3,680,469 | ||||||
| 53,455 | CVS Health Corp. | 4,300,989 | ||||||
| 47,884 | Kroger Co. (The) | 1,116,655 | ||||||
| 25,835 | Sysco Corp. | 1,300,276 | ||||||
| 77,502 | Wal-Mart Stores, Inc. | 5,865,351 | ||||||
| 44,806 | Walgreens Boots Allliance, Inc. | 3,508,758 | ||||||
| 16,767 | Whole Foods Market, Inc. | 706,058 | ||||||
|
| |||||||
| 20,478,556 | ||||||||
|
| |||||||
| Food, Beverage & Tobacco - 5.2% | ||||||||
| 101,352 | Altria Group, Inc. | 7,547,683 | ||||||
| 29,942 | Archer-Daniels-Midland Co. | 1,239,000 | ||||||
| 9,281 | Brown-Forman Corp., Class B | 451,057 | ||||||
| 10,061 | Campbell Soup Co. | 524,681 | ||||||
| 201,760 | Coca-Cola Co. (The) | 9,048,936 | ||||||
| 21,209 | Conagra Brands, Inc. | 758,434 | ||||||
| 8,996 | Constellation Brands, Inc., Class A | 1,742,795 | ||||||
| 9,645 | Dr Pepper Snapple Group, Inc. | 878,756 | ||||||
| 30,229 | General Mills, Inc. | 1,674,687 | ||||||
| 7,345 | Hershey Co. (The) | 788,633 | ||||||
| 14,153 | Hormel Foods Corp. | 482,759 | ||||||
| 6,109 | JM Smucker Co. (The) | 722,878 | ||||||
| 13,233 | Kellogg Co. | 919,164 | ||||||
| 31,305 | Kraft Heinz Co. (The) | 2,680,960 | ||||||
| 5,941 | McCormick & Co., Inc. | 579,307 | ||||||
| 9,689 | Molson Coors Brewing Co., Class B | 836,548 | ||||||
| 79,610 | Mondelez International, Inc., Class A | 3,438,356 | ||||||
| 21,153 | Monster Beverage Corp.(2) | 1,050,881 | ||||||
| 74,952 | PepsiCo, Inc. | 8,656,206 | ||||||
| 81,492 | Philip Morris International, Inc. | 9,571,235 | ||||||
| 43,418 | Reynolds American, Inc. | 2,823,907 | ||||||
| 15,121 | Tyson Foods, Inc., Class A | 947,028 | ||||||
|
| |||||||
| 57,363,891 | ||||||||
|
| |||||||
| Health Care Equipment & Services - 5.7% | ||||||||
| 91,048 | Abbott Laboratories | 4,425,843 | ||||||
| 17,404 | Aetna, Inc. | 2,642,449 | ||||||
| 3,962 | Align Technology, Inc.(2) | 594,775 | ||||||
| 8,707 | AmerisourceBergen Corp. | 823,073 | ||||||
| 13,904 | Anthem, Inc. | 2,615,760 | ||||||
| 25,592 | Baxter International, Inc. | 1,549,340 | ||||||
| 11,929 | Becton Dickinson and Co. | 2,327,467 | ||||||
| 71,851 | Boston Scientific Corp.(2) | 1,991,710 | ||||||
| 16,574 | Cardinal Health, Inc. | 1,291,446 | ||||||
| 9,039 | Centene Corp.(2) | 722,035 | ||||||
| 15,426 | Cerner Corp.(2) | 1,025,366 | ||||||
| 13,433 | Cigna Corp. | 2,248,550 | ||||||
| 2,563 | Cooper Cos., Inc. (The) | 613,633 | ||||||
| 3,800 | CR Bard, Inc. | 1,201,218 | ||||||
| 32,050 | Danaher Corp. | 2,704,700 | ||||||
| 8,168 | DaVita, Inc.(2) | 528,960 | ||||||
| 12,028 | DENTSPLY SIRONA, Inc. | 779,896 | ||||||
| 11,008 | Edwards Lifesciences Corp.(2) | 1,301,586 | ||||||
| 6,163 | Envision Healthcare Corp.(2) | 386,235 | ||||||
| 31,142 | Express Scripts Holding Co.(2) | 1,988,105 | ||||||
| 15,016 | HCA Healthcare, Inc.(2) | 1,309,395 | ||||||
The accompanying Notes are an integral part of these financial statements.
| 3 |
|
| HIMCO VIT Index Fund |
Schedule of Investments – (continued)
June 30, 2017 (Unaudited)
Shares or Principal Amount | Market Value(1) | |||||||
| COMMON STOCKS - 99.1% - (continued) | ||||||||
| Health Care Equipment & Services - 5.7% - (continued) | ||||||||
| 4,162 | Henry Schein, Inc.(2) | $ | 761,729 | |||||
| 14,692 | Hologic, Inc.(2) | 666,723 | ||||||
| 7,572 | Humana, Inc. | 1,821,975 | ||||||
| 4,624 | IDEXX Laboratories, Inc.(2) | 746,406 | ||||||
| 1,933 | Intuitive Surgical, Inc.(2) | 1,808,070 | ||||||
| 5,368 | Laboratory Corp. of America Holdings(2) | 827,424 | ||||||
| 11,066 | McKesson Corp. | 1,820,800 | ||||||
| 71,824 | Medtronic plc | 6,374,380 | ||||||
| 4,281 | Patterson Cos., Inc. | 200,993 | ||||||
| 7,179 | Quest Diagnostics, Inc. | 798,018 | ||||||
| 16,277 | Stryker Corp. | 2,258,922 | ||||||
| 50,563 | UnitedHealth Group, Inc. | 9,375,391 | ||||||
| 4,691 | Universal Health Services, Inc., Class B | 572,677 | ||||||
| 4,823 | Varian Medical Systems, Inc.(2) | 497,685 | ||||||
| 10,558 | Zimmer Biomet Holdings, Inc. | 1,355,647 | ||||||
|
| |||||||
| 62,958,382 | ||||||||
|
| |||||||
| Household & Personal Products - 1.9% | ||||||||
| 13,078 | Church & Dwight Co., Inc. | 678,487 | ||||||
| 6,758 | Clorox Co. (The) | 900,436 | ||||||
| 46,346 | Colgate-Palmolive Co. | 3,435,629 | ||||||
| 24,714 | Coty, Inc., Class A | 463,635 | ||||||
| 11,746 | Estee Lauder Cos., Inc. (The), Class A | 1,127,381 | ||||||
| 18,623 | Kimberly-Clark Corp. | 2,404,415 | ||||||
| 134,196 | Procter & Gamble Co. (The) | 11,695,181 | ||||||
|
| |||||||
| 20,705,164 | ||||||||
|
| |||||||
| Insurance - 2.8% | ||||||||
| 20,822 | Aflac, Inc. | 1,617,453 | ||||||
| 19,126 | Allstate Corp. (The) | 1,691,503 | ||||||
| 46,146 | American International Group, Inc. | 2,885,048 | ||||||
| 13,751 | Aon plc | 1,828,196 | ||||||
| 9,417 | Arthur J Gallagher & Co. | 539,123 | ||||||
| 2,875 | Assurant, Inc. | 298,109 | ||||||
| 24,499 | Chubb Ltd. | 3,561,665 | ||||||
| 7,863 | Cincinnati Financial Corp. | 569,674 | ||||||
| 2,155 | Everest Re Group Ltd. | 548,641 | ||||||
| 19,275 | Hartford Financial Services Group, Inc. (The)(3) | 1,013,287 | ||||||
| 11,768 | Lincoln National Corp. | 795,281 | ||||||
| 14,487 | Loews Corp. | 678,137 | ||||||
| 27,039 | Marsh & McLennan Cos., Inc. | 2,107,960 | ||||||
| 56,690 | MetLife, Inc. | 3,114,549 | ||||||
| 14,064 | Principal Financial Group, Inc. | 901,081 | ||||||
| 30,479 | Progressive Corp. (The) | 1,343,819 | ||||||
| 22,509 | Prudential Financial, Inc. | 2,434,123 | ||||||
| 5,708 | Torchmark Corp. | 436,662 | ||||||
| 14,661 | Travelers Cos., Inc. (The) | 1,855,056 | ||||||
| 11,974 | Unum Group | 558,348 | ||||||
| 6,668 | Willis Towers Watson PLC | 969,927 | ||||||
| 13,718 | XL Group Ltd. | 600,848 | ||||||
|
| |||||||
| 30,348,490 | ||||||||
|
| |||||||
| Materials - 2.8% | ||||||||
| 11,424 | Air Products & Chemicals, Inc. | 1,634,317 | ||||||
| 5,811 | Albemarle Corp. | 613,293 | ||||||
| 4,647 | Avery Dennison Corp. | 410,655 | ||||||
| 18,370 | Ball Corp. | 775,398 | ||||||
| 12,232 | CF Industries Holdings, Inc. | 342,007 | ||||||
| 58,974 | Dow Chemical Co. (The) | 3,719,490 | ||||||
| 7,651 | Eastman Chemical Co. | 642,608 | ||||||
Shares or Principal Amount | Market Value(1) | |||||||
| COMMON STOCKS - 99.1% - (continued) | ||||||||
| Materials - 2.8% - (continued) | ||||||||
| 13,697 | Ecolab, Inc. | $ | 1,818,277 | |||||
| 45,492 | EI du Pont de Nemours & Co. | 3,671,659 | ||||||
| 7,031 | FMC Corp. | 513,615 | ||||||
| 69,840 | Freeport-McMoRan, Inc.(2) | 838,778 | ||||||
| 4,144 | International Flavors & Fragrances, Inc. | 559,440 | ||||||
| 21,664 | International Paper Co. | 1,226,399 | ||||||
| 17,331 | LyondellBasell Industries N.V., Class A | 1,462,563 | ||||||
| 3,286 | Martin Marietta Materials, Inc. | 731,398 | ||||||
| 23,024 | Monsanto Co. | 2,725,121 | ||||||
| 18,418 | Mosaic Co. (The) | 420,483 | ||||||
| 27,978 | Newmont Mining Corp. | 906,207 | ||||||
| 16,740 | Nucor Corp. | 968,744 | ||||||
| 13,442 | PPG Industries, Inc. | 1,478,082 | ||||||
| 14,999 | Praxair, Inc. | 1,988,117 | ||||||
| 10,274 | Sealed Air Corp. | 459,864 | ||||||
| 4,251 | Sherwin-Williams Co. (The) | 1,491,931 | ||||||
| 6,934 | Vulcan Materials Co. | 878,399 | ||||||
| 13,175 | WestRock Co. | 746,496 | ||||||
|
| |||||||
| 31,023,341 | ||||||||
|
| |||||||
| Media - 3.0% | ||||||||
| 19,327 | CBS Corp., Class B | 1,232,676 | ||||||
| 11,317 | Charter Communications, Inc., Class A(2) | 3,812,131 | ||||||
| 248,322 | Comcast Corp., Class A | 9,664,692 | ||||||
| 8,068 | Discovery Communications, Inc., Class A(2) | 208,396 | ||||||
| 11,062 | Discovery Communications, Inc., Class C(2) | 278,873 | ||||||
| 11,935 | DISH Network Corp., Class A(2) | 749,041 | ||||||
| 20,731 | Interpublic Group of Cos., Inc. (The) | 509,983 | ||||||
| 20,053 | News Corp., Class A | 274,726 | ||||||
| 6,285 | News Corp., Class B | 88,933 | ||||||
| 12,212 | Omnicom Group, Inc. | 1,012,375 | ||||||
| 5,032 | Scripps Networks Interactive, Inc., Class A | 343,736 | ||||||
| 40,692 | Time Warner, Inc. | 4,085,884 | ||||||
| 55,215 | Twenty-First Century Fox, Inc., Class A | 1,564,793 | ||||||
| 25,558 | Twenty-First Century Fox, Inc., Class B | 712,302 | ||||||
| 18,485 | Viacom, Inc., Class B | 620,541 | ||||||
| 76,329 | Walt Disney Co. (The) | 8,109,956 | ||||||
|
| |||||||
| 33,269,038 | ||||||||
|
| |||||||
| Pharmaceuticals, Biotechnology & Life Sciences - 8.6% | ||||||||
| 83,507 | AbbVie, Inc. | 6,055,093 | ||||||
| 16,911 | Agilent Technologies, Inc. | 1,002,991 | ||||||
| 11,782 | Alexion Pharmaceuticals, Inc.(2) | 1,433,516 | ||||||
| 17,623 | Allergan plc | 4,283,975 | ||||||
| 38,612 | Amgen, Inc. | 6,650,145 | ||||||
| 11,208 | Biogen, Inc.(2) | 3,041,403 | ||||||
| 86,440 | Bristol-Myers Squibb Co. | 4,816,437 | ||||||
| 40,969 | Celgene Corp.(2) | 5,320,644 | ||||||
| 50,947 | Eli Lilly & Co. | 4,192,938 | ||||||
| 68,563 | Gilead Sciences, Inc. | 4,852,889 | ||||||
| 7,661 | Illumina, Inc.(2) | 1,329,337 | ||||||
| 8,918 | Incyte Corp.(2) | 1,122,865 | ||||||
| 141,343 | Johnson & Johnson | 18,698,265 | ||||||
| 5,213 | Mallinckrodt plc(2) | 233,595 | ||||||
| 143,512 | Merck & Co., Inc. | 9,197,684 | ||||||
| 1,355 | Mettler-Toledo International, Inc.(2) | 797,472 | ||||||
| 24,185 | Mylan N.V.(2) | 938,862 | ||||||
| 5,774 | PerkinElmer, Inc. | 393,440 | ||||||
The accompanying Notes are an integral part of these financial statements.
| 4 |
|
| HIMCO VIT Index Fund |
Schedule of Investments – (continued)
June 30, 2017 (Unaudited)
Shares or Principal Amount | Market Value(1) | |||||||
| COMMON STOCKS - 99.1% - (continued) | ||||||||
| Pharmaceuticals, Biotechnology & Life Sciences - 8.6% - (continued) | ||||||||
| 7,523 | Perrigo Co. plc | $ | 568,137 | |||||
| 313,128 | Pfizer, Inc. | 10,517,969 | ||||||
| 3,998 | Regeneron Pharmaceuticals, Inc.(2) | 1,963,578 | ||||||
| 20,527 | Thermo Fisher Scientific, Inc. | 3,581,346 | ||||||
| 13,068 | Vertex Pharmaceuticals, Inc.(2) | 1,684,073 | ||||||
| 4,200 | Waters Corp.(2) | 772,128 | ||||||
| 25,752 | Zoetis, Inc. | 1,606,410 | ||||||
|
| |||||||
| 95,055,192 | ||||||||
|
| |||||||
| Real Estate - 2.9% | ||||||||
| 4,779 | Alexandria Real Estate Equities, Inc., REIT | 575,726 | ||||||
| 22,300 | American Tower Corp., REIT | 2,950,736 | ||||||
| 8,239 | Apartment Investment & Management Co., Class A, REIT | 354,030 | ||||||
| 7,230 | AvalonBay Communities, Inc., REIT | 1,389,389 | ||||||
| 8,073 | Boston Properties, Inc., REIT | 993,140 | ||||||
| 15,778 | CBRE Group, Inc., Class A, REIT(2) | 574,319 | ||||||
| 19,209 | Crown Castle International Corp., REIT | 1,924,358 | ||||||
| 8,383 | Digital Realty Trust, Inc., REIT | 946,860 | ||||||
| 4,088 | Equinix, Inc., REIT | 1,754,406 | ||||||
| 19,264 | Equity Residential, REIT | 1,268,149 | ||||||
| 3,442 | Essex Property Trust, Inc., REIT | 885,523 | ||||||
| 6,607 | Extra Space Storage, Inc., REIT | 515,346 | ||||||
| 3,790 | Federal Realty Investment Trust, REIT | 479,018 | ||||||
| 30,564 | GGP, Inc., REIT | 720,088 | ||||||
| 24,586 | HCP, Inc., REIT | 785,769 | ||||||
| 38,814 | Host Hotels & Resorts, Inc., REIT | 709,132 | ||||||
| 12,888 | Iron Mountain, Inc., REIT | 442,832 | ||||||
| 22,334 | Kimco Realty Corp., REIT | 409,829 | ||||||
| 6,249 | Macerich Co. (The), REIT | 362,817 | ||||||
| 5,959 | Mid-America Apartment Communities, Inc., REIT | 627,959 | ||||||
| 27,825 | Prologis, Inc., REIT | 1,631,658 | ||||||
| 7,845 | Public Storage, REIT | 1,635,918 | ||||||
| 14,327 | Realty Income Corp., REIT | 790,564 | ||||||
| 7,675 | Regency Centers Corp., REIT | 480,762 | ||||||
| 16,381 | Simon Property Group, Inc., REIT | 2,649,791 | ||||||
| 5,343 | SL Green Realty Corp., REIT | 565,289 | ||||||
| 14,030 | UDR, Inc., REIT | 546,749 | ||||||
| 18,620 | Ventas, Inc., REIT | 1,293,718 | ||||||
| 9,038 | Vornado Realty Trust, REIT | 848,668 | ||||||
| 19,212 | Welltower, Inc., REIT | 1,438,018 | ||||||
| 39,420 | Weyerhaeuser Co., REIT | 1,320,570 | ||||||
|
| |||||||
| 31,871,131 | ||||||||
|
| |||||||
| Retailing - 5.4% | ||||||||
| 3,875 | Advance Auto Parts, Inc. | 451,786 | ||||||
| 20,816 | Amazon.com, Inc.(2) | 20,149,888 | ||||||
| 3,454 | AutoNation, Inc.(2) | 145,621 | ||||||
| 1,477 | AutoZone, Inc.(2) | 842,569 | ||||||
| 7,616 | Bed Bath & Beyond, Inc. | 231,526 | ||||||
| 13,921 | Best Buy Co., Inc. | 798,091 | ||||||
| 9,718 | CarMax, Inc.(2) | 612,817 | ||||||
| 13,237 | Dollar General Corp. | 954,255 | ||||||
| 12,419 | Dollar Tree, Inc.(2) | 868,336 | ||||||
| 6,379 | Expedia, Inc. | 950,152 | ||||||
| 6,886 | Foot Locker, Inc. | 339,342 | ||||||
| 11,550 | Gap, Inc. (The) | 253,985 | ||||||
| 7,734 | Genuine Parts Co. | 717,406 | ||||||
| 62,730 | Home Depot, Inc. (The) | 9,622,782 | ||||||
Shares or Principal Amount | Market Value(1) | |||||||
| COMMON STOCKS - 99.1% - (continued) | ||||||||
| Retailing - 5.4% - (continued) | ||||||||
| 8,945 | Kohl’s Corp. | $ | 345,903 | |||||
| 12,642 | L Brands, Inc. | 681,277 | ||||||
| 16,175 | LKQ Corp.(2) | 532,966 | ||||||
| 45,022 | Lowe’s Cos., Inc. | 3,490,556 | ||||||
| 15,977 | Macy’s, Inc. | 371,305 | ||||||
| 22,614 | Netflix, Inc.(2) | 3,378,758 | ||||||
| 5,837 | Nordstrom, Inc. | 279,184 | ||||||
| 4,775 | O’Reilly Automotive, Inc.(2) | 1,044,484 | ||||||
| 2,580 | Priceline Group, Inc. (The)(2) | 4,825,942 | ||||||
| 20,568 | Ross Stores, Inc. | 1,187,391 | ||||||
| 3,589 | Signet Jewelers Ltd. | 226,968 | ||||||
| 34,271 | Staples, Inc. | 345,109 | ||||||
| 28,948 | Target Corp. | 1,513,691 | ||||||
| 5,625 | Tiffany & Co. | 528,019 | ||||||
| 33,752 | TJX Cos., Inc. (The) | 2,435,882 | ||||||
| 6,746 | Tractor Supply Co. | 365,701 | ||||||
| 5,794 | TripAdvisor, Inc.(2) | 221,331 | ||||||
| 3,060 | Ulta Salon Cosmetics & Fragrance, Inc.(2) | 879,260 | ||||||
|
| |||||||
| 59,592,283 | ||||||||
|
| |||||||
| Semiconductors & Semiconductor Equipment - 3.4% | ||||||||
| 40,659 | Advanced Micro Devices, Inc.(2) | 507,424 | ||||||
| 19,257 | Analog Devices, Inc. | 1,498,195 | ||||||
| 56,385 | Applied Materials, Inc. | 2,329,264 | ||||||
| 21,059 | Broadcom Ltd. | 4,907,800 | ||||||
| 247,077 | Intel Corp. | 8,336,378 | ||||||
| 8,225 | KLA-Tencor Corp. | 752,670 | ||||||
| 8,464 | Lam Research Corp. | 1,197,064 | ||||||
| 12,036 | Microchip Technology, Inc. | 928,938 | ||||||
| 54,564 | Micron Technology, Inc.(2) | 1,629,281 | ||||||
| 31,219 | NVIDIA Corp. | 4,513,019 | ||||||
| 6,669 | Qorvo, Inc.(2) | 422,281 | ||||||
| 77,520 | QUALCOMM, Inc. | 4,280,654 | ||||||
| 9,682 | Skyworks Solutions, Inc. | 928,988 | ||||||
| 52,276 | Texas Instruments, Inc. | 4,021,593 | ||||||
| 13,015 | Xilinx, Inc. | 837,125 | ||||||
|
| |||||||
| 37,090,674 | ||||||||
|
| |||||||
| Software & Services - 13.2% | ||||||||
| 32,535 | Accenture plc, Class A | 4,023,929 | ||||||
| 36,381 | Activision Blizzard, Inc. | 2,094,454 | ||||||
| 25,956 | Adobe Systems, Inc.(2) | 3,671,217 | ||||||
| 9,071 | Akamai Technologies, Inc.(2) | 451,827 | ||||||
| 2,921 | Alliance Data Systems Corp. | 749,791 | ||||||
| 15,616 | Alphabet, Inc., Class A(2) | 14,517,883 | ||||||
| 15,656 | Alphabet, Inc., Class C(2) | 14,227,077 | ||||||
| 4,486 | ANSYS, Inc.(2) | 545,856 | ||||||
| 10,176 | Autodesk, Inc.(2) | 1,025,944 | ||||||
| 23,475 | Automatic Data Processing, Inc. | 2,405,248 | ||||||
| 16,442 | CA, Inc. | 566,756 | ||||||
| 7,931 | Citrix Systems, Inc.(2) | 631,149 | ||||||
| 30,904 | Cognizant Technology Solutions Corp., Class A | 2,052,026 | ||||||
| 7,623 | CSRA, Inc. | 242,030 | ||||||
| 14,857 | DXC Technology Co. | 1,139,829 | ||||||
| 52,814 | eBay, Inc.(2) | 1,844,265 | ||||||
| 16,267 | Electronic Arts, Inc.(2) | 1,719,747 | ||||||
| 124,023 | Facebook, Inc., Class A(2) | 18,724,993 | ||||||
| 17,345 | Fidelity National Information Services, Inc. | 1,481,263 | ||||||
| 11,143 | Fiserv, Inc.(2) | 1,363,235 | ||||||
| 4,745 | Gartner, Inc.(2) | 586,055 | ||||||
The accompanying Notes are an integral part of these financial statements.
| 5 |
|
| HIMCO VIT Index Fund |
Schedule of Investments – (continued)
June 30, 2017 (Unaudited)
Shares or Principal Amount | Market Value(1) | |||||||
| COMMON STOCKS - 99.1% - (continued) | ||||||||
| Software & Services - 13.2% - (continued) | ||||||||
| 8,001 | Global Payments, Inc. | $ | 722,650 | |||||
| 44,858 | International Business Machines Corp. | 6,900,506 | ||||||
| 12,771 | Intuit, Inc. | 1,696,117 | ||||||
| 49,216 | MasterCard, Inc., Class A | 5,977,283 | ||||||
| 405,089 | Microsoft Corp. | 27,922,785 | ||||||
| 157,603 | Oracle Corp. | 7,902,214 | ||||||
| 16,776 | Paychex, Inc. | 955,225 | ||||||
| 58,617 | PayPal Holdings, Inc.(2) | 3,145,974 | ||||||
| 9,328 | Red Hat, Inc.(2) | 893,156 | ||||||
| 35,084 | salesforce.com, Inc.(2) | 3,038,274 | ||||||
| 31,914 | Symantec Corp. | 901,571 | ||||||
| 7,887 | Synopsys, Inc.(2) | 575,199 | ||||||
| 8,690 | Total System Services, Inc. | 506,193 | ||||||
| 4,632 | VeriSign, Inc.(2) | 430,591 | ||||||
| 96,871 | Visa, Inc., Class A | 9,084,562 | ||||||
| 24,726 | Western Union Co. (The) | 471,030 | ||||||
|
| |||||||
| 145,187,904 | ||||||||
|
| |||||||
| Technology Hardware & Equipment - 5.5% | ||||||||
| 16,035 | Amphenol Corp., Class A | 1,183,704 | ||||||
| 273,566 | Apple, Inc. | 39,398,975 | ||||||
| 262,349 | Cisco Systems, Inc. | 8,211,524 | ||||||
| 48,284 | Corning, Inc. | 1,450,934 | ||||||
| 3,395 | F5 Networks, Inc.(2) | 431,369 | ||||||
| 7,160 | FLIR Systems, Inc. | 248,165 | ||||||
| 6,397 | Harris Corp. | 697,785 | ||||||
| 87,352 | Hewlett Packard Enterprise Co. | 1,449,170 | ||||||
| 88,323 | HP, Inc. | 1,543,886 | ||||||
| 20,048 | Juniper Networks, Inc. | 558,938 | ||||||
| 8,577 | Motorola Solutions, Inc. | 743,969 | ||||||
| 14,217 | NetApp, Inc. | 569,391 | ||||||
| 15,583 | Seagate Technology plc | 603,841 | ||||||
| 18,628 | TE Connectivity Ltd. | 1,465,651 | ||||||
| 15,281 | Western Digital Corp. | 1,353,896 | ||||||
| 11,201 | Xerox Corp. | 321,805 | ||||||
|
| |||||||
| 60,233,003 | ||||||||
|
| |||||||
| Telecommunication Services - 2.1% | ||||||||
| 322,581 | AT&T, Inc. | 12,170,981 | ||||||
| 28,796 | CenturyLink, Inc. | 687,648 | ||||||
| 15,359 | Level 3 Communications, Inc.(2) | 910,789 | ||||||
| 214,041 | Verizon Communications, Inc. | 9,559,071 | ||||||
|
| |||||||
| 23,328,489 | ||||||||
|
| |||||||
| Transportation - 2.3% | ||||||||
| 6,485 | Alaska Air Group, Inc. | 582,094 | ||||||
| 25,846 | American Airlines Group, Inc. | 1,300,571 | ||||||
| 7,392 | CH Robinson Worldwide, Inc. | 507,683 | ||||||
| 48,413 | CSX Corp. | 2,641,413 | ||||||
| 38,620 | Delta Air Lines, Inc. | 2,075,439 | ||||||
| 9,453 | Expeditors International of Washington, Inc. | 533,905 | ||||||
| 12,907 | FedEx Corp. | 2,805,078 | ||||||
| 4,501 | JB Hunt Transport Services, Inc. | 411,301 | ||||||
| 5,566 | Kansas City Southern | 582,482 | ||||||
| 15,205 | Norfolk Southern Corp. | 1,850,448 | ||||||
| 31,726 | Southwest Airlines Co. | 1,971,454 | ||||||
| 42,366 | Union Pacific Corp. | 4,614,081 | ||||||
| 14,785 | United Continental Holdings, Inc.(2) | 1,112,571 | ||||||
| 36,139 | United Parcel Service, Inc., Class B | 3,996,612 | ||||||
|
| |||||||
| 24,985,132 | ||||||||
|
| |||||||
Shares or Principal Amount | Market Value(1) | |||||||
| COMMON STOCKS - 99.1% - (continued) | ||||||||
| Utilities - 3.1% | ||||||||
| 34,637 | AES Corp. | $ | 384,817 | |||||
| 11,954 | Alliant Energy Corp. | 480,192 | ||||||
| 12,731 | Ameren Corp. | 696,004 | ||||||
| 25,800 | American Electric Power Co., Inc. | 1,792,326 | ||||||
| 9,350 | American Water Works Co., Inc. | 728,833 | ||||||
| 22,612 | CenterPoint Energy, Inc. | 619,117 | ||||||
| 14,715 | CMS Energy Corp. | 680,569 | ||||||
| 16,023 | Consolidated Edison, Inc. | 1,294,979 | ||||||
| 33,002 | Dominion Energy, Inc. | 2,528,943 | ||||||
| 9,412 | DTE Energy Co. | 995,696 | ||||||
| 36,722 | Duke Energy Corp. | 3,069,592 | ||||||
| 17,095 | Edison International | 1,336,658 | ||||||
| 9,416 | Entergy Corp. | 722,866 | ||||||
| 16,627 | Eversource Energy | 1,009,425 | ||||||
| 48,592 | Exelon Corp. | 1,752,713 | ||||||
| 23,283 | FirstEnergy Corp. | 678,932 | ||||||
| 24,564 | NextEra Energy, Inc. | 3,442,153 | ||||||
| 16,971 | NiSource, Inc. | 430,385 | ||||||
| 16,585 | NRG Energy, Inc. | 285,594 | ||||||
| 26,791 | PG&E Corp. | 1,778,119 | ||||||
| 5,853 | Pinnacle West Capital Corp. | 498,441 | ||||||
| 35,846 | PPL Corp. | 1,385,806 | ||||||
| 26,543 | Public Service Enterprise Group, Inc. | 1,141,614 | ||||||
| 7,499 | SCANA Corp. | 502,508 | ||||||
| 13,161 | Sempra Energy | 1,483,903 | ||||||
| 52,186 | Southern Co. (The) | 2,498,666 | ||||||
| 16,558 | WEC Energy Group, Inc. | 1,016,330 | ||||||
| 26,642 | Xcel Energy, Inc. | 1,222,335 | ||||||
|
| |||||||
| 34,457,516 | ||||||||
|
| |||||||
Total Common Stocks | 1,089,830,936 | |||||||
|
| |||||||
Total Long-Term Investments | 1,089,830,936 | |||||||
|
| |||||||
| SHORT-TERM INVESTMENTS - 0.9% | ||||||||
| Repurchase Agreements - 0.9% | ||||||||
RBC Capital Markets LLC TriParty Repurchase Agreement (dated 06/30/2017, repurchase price $9,951,879, collateralized by GNMA 3.50% - 4.00%, 2043 - 2047, U.S. Treasury Notes 1.50% - 2.38%, 2017 - 2024, U.S. Treasury Inflation Index Note 0.38% , 2025, value of $10,123,187) | ||||||||
| $ | 9,951,000 | 1.06%, 07/03/2017 | 9,951,000 | |||||
|
| |||||||
Total Short-Term Investments | 9,951,000 | |||||||
|
| |||||||
Total Investments | 100.0 | % | $ | 1,099,781,936 | ||||||||
Other Assets and Liabilities | — | % | (333,023 | ) | ||||||||
|
|
|
| |||||||||
Net Assets | 100.0 | % | $ | 1,099,448,913 | ||||||||
|
|
|
| |||||||||
The accompanying Notes are an integral part of these financial statements.
| 6 |
|
| HIMCO VIT Index Fund |
Schedule of Investments – (continued)
June 30, 2017 (Unaudited)
| Note: | Percentage of investments as shown is the ratio of the total market value to total net assets. |
| The Fund may refer to any one or more of the industry classifications used by one or more widely recognized market indices, ratings group indices and/or as defined by Fund management. Industry classifications may not be identical across all security types. |
| Equity industry classifications used in this report are the Global Industry Classification Standard (GICS®), which was developed by and is the exclusive property and service mark of MSCI, Inc. and S&P. |
| For Fund compliance purposes, the Fund may not use the same classification system shown in this report as these classifications are used for reporting ease. |
| (1) | See Significant Accounting Policies of accompanying Notes to Financial Statements regarding valuation of securities. |
| (2) | Non-income producing. |
| (3) | Affiliated company as defined under Sections 2(a)(2) and 2(a)(3) of the Investment Company Act of 1940. Hartford Investment Management Company, the Fund’s adviser, is a wholly-owned subsidiary of The Hartford Financial Services Group, Inc. A summary of transactions for the six-month period ended June 30, 2017 is as follows: |
Company | Beginning Value At January 1, 2017 | Purchase Cost | Sales Proceeds | Realized Gain (Loss) | Unrealized Gain (Loss) | Ending Value At June 30, 2017 | Dividend Income | |||||||||||||||||||||
Hartford Financial Services Group, Inc. (The) | $ | 984,497 | $ | — | $ | (68,886) | $ | 12,372 | $ | 85,304 | $ | 1,013,287 | $ | 9,268 | ||||||||||||||
| (4) | At June 30, 2017, the cost of securities for federal income tax purposes was $595,633,196, and the aggregate gross unrealized appreciation and depreciation based on that cost were: |
Unrealized Appreciation | $ | 518,510,625 | ||
Unrealized Depreciation | (14,361,885 | ) | ||
|
| |||
Net Unrealized Appreciation | $ | 504,148,740 | ||
|
|
Futures Contracts Outstanding at June 30, 2017
Description | Number of Contracts | Expiration Date | Aggregate Cost | Notional Value | Unrealized Appreciation/ (Depreciation) | |||||||||||||||
Long position contracts: | ||||||||||||||||||||
S&P 500 (E-Mini) | 88 | 09/15/2017 | $ | 10,700,546 | $ | 10,651,976 | $ | (48,570) | ||||||||||||
| Cash of $560,000 was pledged as initial margin deposit and collateral for the daily variation margin on open futures contracts at June 30, 2017. |
| GLOSSARY: (abbreviations used in preceding Schedule of Investments) | ||
| Index Abbreviations: | ||
MSCI | Morgan Stanley Capital International | |
S&P | Standard & Poor’s | |
| Other Abbreviations: | ||
ETF | Exchange Traded Fund | |
GNMA | Government National Mortgage Association | |
REIT | Real Estate Investment Trust | |
| Counterparty Abbreviations: | ||
RBC | RBC Dominion Securities | |
The accompanying Notes are an integral part of these financial statements.
| 7 |
|
| HIMCO VIT Index Fund |
Schedule of Investments – (concluded)
June 30, 2017 (Unaudited)
Diversification by Sector
as of June 30, 2017
| Sector | Percentage of Net Assets | |||
Equity Securities | ||||
Consumer Discretionary | 12.2 | % | ||
Consumer Staples | 9.0 | |||
Energy | 6.0 | |||
Financials | 14.4 | |||
Health Care | 14.3 | |||
Industrials | 10.2 | |||
Information Technology | 22.1 | |||
Materials | 2.8 | |||
Real Estate | 2.9 | |||
Telecommunication Services | 2.1 | |||
Utilities | 3.1 | |||
|
| |||
Total | 99.1 | % | ||
|
| |||
Short-Term Investments | 0.9 | |||
Other assets and liabilities | — | |||
|
| |||
Total | 100.0 | % | ||
|
| |||
A sector may be comprised of several industries. For Fund compliance purposes, the Fund may not use the same classification system and these sector classifications are used for reporting ease.
Investment Valuation Hierarchy Level Summary at June 30, 2017
Description | Total | Level 1(1) | Level 2(1) | Level 3(1) | ||||||||||||
Assets: | ||||||||||||||||
Common Stocks(2) | $ | 1,089,830,936 | $ | 1,089,830,936 | $ | — | $ | — | ||||||||
Short-Term Investments | 9,951,000 | — | 9,951,000 | — | ||||||||||||
|
|
|
|
|
|
|
| |||||||||
Total | $ | 1,099,781,936 | $ | 1,089,830,936 | $ | 9,951,000 | $ | — | ||||||||
|
|
|
|
|
|
|
| |||||||||
Liabilities: | ||||||||||||||||
Futures(3) | $ | (48,570 | ) | $ | (48,570 | ) | $ | — | $ | — | ||||||
|
|
|
|
|
|
|
| |||||||||
Total | $ | (48,570 | ) | $ | (48,570 | ) | $ | — | $ | — | ||||||
|
|
|
|
|
|
|
| |||||||||
| (1) | For the six-month period ended June 30, 2017, there were no transfers between any levels. |
| (2) | Refer to the Schedule of Investments for further industry breakout. |
| (3) | Derivative instruments (excluding purchased and written options, if applicable) are valued at the unrealized appreciation/depreciation on the investments. |
| Note: | For purposes of reporting transfers between different hierarchy levels, both transfers in and out of each level, as applicable, are shown as if they occurred at the beginning of the period. |
The accompanying Notes are an integral part of these financial statements.
| 8 |
|
| HIMCO VIT Index Fund |
Statement of Assets and Liabilities
June 30, 2017 (Unaudited)
Assets: | ||||
Investments in unaffiliated securities, at market value (cost $563,709,281) | $ | 1,098,768,649 | ||
Investments in affiliated securities, at market value (cost $785,938) | 1,013,287 | |||
Cash(1) | 567,095 | |||
Receivables: | ||||
Fund shares sold | 532,832 | |||
Dividends and interest | 1,091,374 | |||
Variation margin on futures contracts | 4,077 | |||
Other assets | 8,771 | |||
|
| |||
Total assets | 1,101,986,085 | |||
|
| |||
Liabilities: | ||||
Payables: | ||||
Investment securities purchased | 461,833 | |||
Fund shares redeemed | 1,603,783 | |||
Investment management fees | 224,970 | |||
Distribution fees | 81,374 | |||
Accrued expenses | 165,212 | |||
|
| |||
Total liabilities | 2,537,172 | |||
|
| |||
Net assets | $ | 1,099,448,913 | ||
|
| |||
Summary of Net Assets: | ||||
Capital stock and paid-in-capital | $ | 471,716,230 | ||
Undistributed net investment income | 27,525,653 | |||
Accumulated net realized gain | 64,968,883 | |||
Unrealized appreciation of investments | 535,238,147 | |||
|
| |||
Net assets | $ | 1,099,448,913 | ||
|
| |||
Class IA: Net asset value per share | $ | 45.39 | ||
|
| |||
Shares Outstanding | 15,629,003 | |||
|
| |||
Net Assets | $ | 709,478,437 | ||
|
| |||
Class IB: Net asset value per share | $ | 44.80 | ||
|
| |||
Shares Outstanding | 8,705,072 | |||
|
| |||
Net Assets | $ | 389,970,476 | ||
|
|
| (1) | Cash of $560,000 was pledged as initial margin deposit and collateral for the daily variation margin on open futures contracts at June 30, 2017. |
The accompanying Notes are an integral part of these financial statements.
| 9 |
|
| HIMCO VIT Index Fund |
For the Six-Month Period Ended June 30, 2017 (Unaudited)
Investment Income: | ||||
Dividends from unaffiliated securities | $ | 11,153,169 | ||
Dividends from affiliated securities | 9,268 | |||
Interest | 23,238 | |||
|
| |||
Total investment income, net | 11,185,675 | |||
|
| |||
Expenses: | ||||
Investment management fees | 1,631,550 | |||
Transfer agent fees | 7,522 | |||
Distribution fees - Class IB | 488,667 | |||
Custodian fees | 10,608 | |||
Accounting service fees | 153,447 | |||
Trustees fees | 63,141 | |||
Audit fees | 33,310 | |||
Printing fees | 42,257 | |||
Legal fees | 73,598 | |||
Insurance fees | 32,395 | |||
Other expenses | 31,358 | |||
|
| |||
Total expenses (before waivers) | 2,567,853 | |||
|
| |||
Total waivers | (284,110 | ) | ||
|
| |||
Total expenses | 2,283,743 | |||
|
| |||
Net Investment Income | 8,901,932 | |||
|
| |||
Net Realized Gain on Investments and Other Financial Instruments: | ||||
Net realized gain on investments in unaffiliated securities | 31,617,168 | |||
Net realized gain on investments in affiliated securities | 12,372 | |||
Net realized gain on futures | 616,109 | |||
|
| |||
Net Realized Gain on Investments and Other Financial Instruments | 32,245,649 | |||
|
| |||
Net Changes in Unrealized Appreciation (Depreciation) of Investments and Other Financial Instruments: | ||||
Net unrealized appreciation of investments | 53,995,391 | |||
Net unrealized depreciation of futures contracts | (31,106 | ) | ||
|
| |||
Net Changes in Unrealized Appreciation of Investments and Other Financial Instruments | 53,964,285 | |||
|
| |||
Net Realized and Unrealized Gain on Investments and Other Financial Instruments | 86,209,934 | |||
|
| |||
Net Increase in Net Assets Resulting from Operations | $ | 95,111,866 | ||
|
|
The accompanying Notes are an integral part of these financial statements.
| 10 |
|
| HIMCO VIT Index Fund |
Statements of Changes in Net Assets
| For the Six-Month Period Ended June 30, 2017 (Unaudited) | For the Year Ended December 31, 2016 | |||||||
Operations: | ||||||||
Net investment income | $ | 8,901,932 | $ | 19,187,983 | ||||
Net realized gain on investments and other financial instruments | 32,245,649 | 67,798,334 | ||||||
Net unrealized appreciation (depreciation) of investments and other financial instruments | 53,964,285 | 24,458,604 | ||||||
|
|
|
| |||||
Net Increase in Net Assets Resulting from Operations | 95,111,866 | 111,444,921 | ||||||
|
|
|
| |||||
Distributions to Shareholders: | ||||||||
From net investment income | ||||||||
Class IA | — | (13,966,007 | ) | |||||
Class IB | — | (8,249,355 | ) | |||||
|
|
|
| |||||
Total distributions from net investment income | — | (22,215,362 | ) | |||||
|
|
|
| |||||
From net realized gain on investments | ||||||||
Class IA | — | (46,415,619 | ) | |||||
Class IB | — | (27,416,493 | ) | |||||
|
|
|
| |||||
Total distributions from net realized gain on investments | — | (73,832,112 | ) | |||||
|
|
|
| |||||
Total distributions | — | (96,047,474 | ) | |||||
|
|
|
| |||||
Capital Share Transactions: | ||||||||
Class IA | ||||||||
Sold | 12,520,978 | 21,673,449 | ||||||
Issued on reinvestment of distributions | — | 60,381,626 | ||||||
Redeemed | (41,410,754 | ) | (96,689,732 | ) | ||||
|
|
|
| |||||
Total capital share transactions | (28,889,776 | ) | (14,634,657 | ) | ||||
|
|
|
| |||||
Class IB | ||||||||
Sold | 17,331,559 | 20,176,793 | ||||||
Issued on reinvestment of distributions | — | 35,665,848 | ||||||
Redeemed | (42,730,824 | ) | (93,903,225 | ) | ||||
|
|
|
| |||||
Total capital share transactions | (25,399,265 | ) | (38,060,584 | ) | ||||
|
|
|
| |||||
Net decrease from capital share transactions | (54,289,041 | ) | (52,695,241 | ) | ||||
|
|
|
| |||||
Net Increase (Decrease) in Net Assets | 40,822,825 | (37,297,794 | ) | |||||
|
|
|
| |||||
Net Assets: | ||||||||
Beginning of period | 1,058,626,088 | 1,095,923,882 | ||||||
|
|
|
| |||||
End of period | $ | 1,099,448,913 | $ | 1,058,626,088 | ||||
|
|
|
| |||||
Undistributed net investment income | $ | 27,525,653 | $ | 18,623,721 | ||||
|
|
|
| |||||
Shares: | ||||||||
Class IA | ||||||||
Sold | 283,920 | 529,762 | ||||||
Issued on reinvestment of distributions | — | 1,499,047 | ||||||
Redeemed | (939,863 | ) | (2,384,897 | ) | ||||
|
|
|
| |||||
Total share activity | (655,943 | ) | (356,088 | ) | ||||
|
|
|
| |||||
Class IB | ||||||||
Sold | 401,900 | 504,675 | ||||||
Issued on reinvestment of distributions | — | 895,227 | ||||||
Redeemed | (979,575 | ) | (2,344,051 | ) | ||||
|
|
|
| |||||
Total share activity | (577,675 | ) | (944,149 | ) | ||||
|
|
|
| |||||
The accompanying Notes are an integral part of these financial statements.
| 11 |
|
| HIMCO VIT Index Fund |
June 30, 2017 (Unaudited)
| 1. | Organization: |
HIMCO Variable Insurance Trust (the “Trust”) is an open-end registered management investment company. The Trust is organized under the laws of the State of Delaware and is registered with the Securities and Exchange Commission (“SEC”) under the Investment Company Act of 1940, as amended (“1940 Act”).
HIMCO VIT Index Fund (the “Fund”) serves as an underlying investment option for certain variable annuity and variable life insurance separate accounts of Hartford Life Insurance Company (“Hartford Life”) and its affiliates and certain qualified retirement plans. The Fund may also serve as an underlying investment option for certain variable annuity and variable life separate accounts of other insurance companies. Owners of variable annuity contracts and policyholders of variable life insurance contracts may choose the funds permitted in the variable insurance contract prospectus. In addition, participants in certain qualified retirement plans may choose the Fund if permitted by their plans.
The Fund is a series of the Trust. The Fund is the successor of a series of Hartford Series Fund, Inc. (the “Hartford Index HLS Fund”). The reorganization of the Hartford Index HLS Fund with and into the Fund occurred on October 20, 2014. All information regarding and references to periods prior to October 20, 2014 relate to the Hartford Index HLS Fund. The Fund is a diversified open-end management investment company and applies specialized accounting and reporting under Accounting Standards Codification Topic 946, Financial Services – Investment Companies. The Fund is authorized to issue an unlimited number of shares for each class.
The Fund is divided into Class IA and Class IB shares. Each class is offered at the per share net asset value (“NAV”) without a sales charge and is subject to the same expenses, except that the Class IB shares are subject to distribution and service fees charged pursuant to a distribution plan (the “Distribution Plan”) approved by the Board of Trustees in accordance with Rule 12b-1 under the 1940 Act and the requirements of the applicable market conduct rules of the Financial Industry Regulatory Authority concerning asset-based sales charges.
| 2. | Significant Accounting Policies: |
The following is a summary of significant accounting policies followed by the Fund in the preparation of its financial statements, which are in accordance with United States Generally Accepted Accounting Principles (“U.S. GAAP”). The preparation of financial statements in accordance with U.S. GAAP may require management to make estimates and assumptions that affect the reported amounts of assets and liabilities and disclosure of contingent assets and liabilities at the date of the financial statements and the reported amounts of increases and decreases in net assets resulting from operations during the reporting period. Actual results could differ from those estimates.
| a) | Determination of Net Asset Value – The NAV of each class of the Fund’s shares is determined as of the close of regular trading on the New York Stock Exchange (the “Exchange”) (normally 4:00 p.m. Eastern Time) (the “NYSE Close”) on each day that the Exchange is open (“Valuation Date”). If the Exchange is closed due to weather or other extraordinary circumstances on a day it would typically be open for business, the Fund will treat such day as a typical business day and accept purchase and redemption orders and calculate the Fund’s NAV as of 4:00 p.m. Eastern Time. The NAV for each class of shares is determined by dividing the value of the Fund’s net assets attributable to a class of shares by the number of shares outstanding for that class. For any day where, due to technical or other issues, trading is halted before the scheduled close of the Exchange, and not as part of a trading halt that is effected on a market-wide basis, the Fund may elect to continue to treat the Valuation Date as occurring at the time of the schedule close of the Exchange. Information that becomes known to the Fund after the NAV has been calculated on a particular day will not generally be used to retroactively adjust the NAV determined earlier that day. |
| b) | Investment Valuation and Fair Value Measurements – For purposes of calculating the NAV, portfolio securities and other assets held in the Fund’s portfolio for which market prices are readily available are valued at market value. Market value is generally determined on the basis of last reported sales prices or official close price. If no sales were reported, market value is based on prices obtained from independent pricing services, a quotation reporting system or established market makers. If market prices are not readily available or are deemed unreliable, the Fund will use the fair value of the security or other instrument as determined in good faith under policies and procedures established by and under the supervision of the Board of Trustees. Market prices are considered not readily available where there is an absence of |
| 12 |
|
| HIMCO VIT Index Fund |
Notes to Financial Statements – (continued)
June 30, 2017 (Unaudited)
| current or reliable market-based data (e.g., trade information or broker quotes), including where events occur after the close of the relevant market, but prior to the NYSE Close that materially affect the values of the Fund’s portfolio holdings or assets. In addition, market prices are considered not readily available when, due to extraordinary circumstances, the exchanges or markets on which the securities or other instruments trade do not open for trading for the entire day and no other market prices are available. Securities and other instruments that are primarily traded on foreign markets may trade on days that are not business days of the Fund. The value of the foreign securities or other instruments in which the Fund invests may change on days when a shareholder will not be able to purchase or redeem shares of the Fund. Fair value pricing is subjective in nature and the use of fair value pricing by the Fund may cause the NAV of its shares to differ significantly from the NAV that would have been calculated using market prices at the close of the exchange on which a portfolio holding is primarily traded. There can be no assurance that the Fund could obtain the fair value assigned to an investment if the Fund were to sell the investment at approximately the time at which the Fund determines its NAV. |
Fixed income securities, including those with a remaining maturity of less than sixty (60 days), and non-exchange traded derivatives held by the Fund are valued in accordance with procedures established by the Board of Trustees. Such investments are normally valued on the basis of quotes obtained from independent pricing services or brokers and dealers. Prices obtained from independent pricing services use information provided by market makers or estimates of market values obtained from yield data relating to investments or securities with similar characteristics. Senior floating rate interests generally trade in over-the-counter (“OTC”) markets and are priced through an independent pricing service utilizing independent market quotations from loan dealers or financial institutions. Generally, the Fund may use fair valuation in regard to fixed income positions when the Fund holds defaulted or distressed investments or investments in a company in which a reorganization is pending. If pricing services do not provide a price for short term investments maturing in 60 days or less, such investments are generally valued at amortized cost if their original term to maturity was 60 days or less, or by amortizing their value on the 61st day prior to maturity, if the original term exceeded 60 days.
Exchange traded futures, options and options on futures are valued in accordance with procedures established by the Board of Trustees. Such instruments are normally valued on the basis of quotes obtained from independent pricing services. Prices obtained from independent pricing services use most recent settlement prices and/or bid and ask prices for futures; and last sale prices and bid and ask prices for options and options on futures. If pricing services are not able to provide prices for futures, such instruments will generally be valued at the most recent trade price as of the NYSE Close. If pricing services are not able to provide prices for options and options on futures, such instruments will generally be valued on the basis of quotes obtained from brokers, dealers or market makers. If the option is out of the money, within 30 days of expiration and no bid price is available, the option may be valued at zero. If such instruments do not trade on an exchange, values may be supplied by an independent pricing service using a formula or other objective method that may take into consideration the style, direction, expiration, strike price, notional value and volatility or other adjustments.
U.S. GAAP defines fair value as the price that the fund would receive to sell an asset or pay to transfer a liability in an orderly transaction between market participants at the measurement date. The U.S. GAAP fair value measurement standards require disclosure of a fair value hierarchy for each major category of assets and liabilities. Various inputs are used in determining the fair value of the Fund’s investments. These inputs are summarized into three broad hierarchy levels. This hierarchy is based on whether the valuation inputs are observable or unobservable. The determination of which category within the fair value hierarchy is appropriate for any given instrument is based on the lowest level of input that is significant to the fair value measurement. These levels are:
| • | Level 1 – Inputs using (unadjusted) quoted prices in active markets or exchanges for identical assets and liabilities. Level 1 may include exchange traded instruments, such as domestic equities, some foreign equities, options, futures, investment companies, exchange traded funds, rights and warrants. |
| • | Level 2 – Observable inputs other than Level 1 prices, which may include, but are not limited to, quoted prices for similar assets or liabilities in markets that are active, quoted prices for identical or similar assets or liabilities in markets that are not active, inputs other than quoted prices that are observable for the assets or liabilities or other market corroborated inputs. Level 2 may include debt investments that are traded less frequently than exchange traded instruments and are valued using independent pricing services; foreign equities, which are principally traded |
| 13 |
|
| HIMCO VIT Index Fund |
Notes to Financial Statements – (continued)
June 30, 2017 (Unaudited)
| on certain foreign markets and are adjusted daily pursuant to a fair value pricing service in order to reflect an adjustment for the factors occurring after the close of certain foreign markets but before the NYSE Close; senior floating rate interests, which are valued using an aggregate of dealer bids; short-term investments, which are valued at amortized cost; and swaps, which are valued based upon the terms of each swap contract. |
| • | Level 3 – Significant unobservable inputs based on the best information available in the circumstances, to the extent observable inputs are not available. Level 3 may include financial instruments whose values are determined using indicative market quotes or require significant management judgment or estimation. These unobservable valuation inputs may include estimates for current yields, maturity/duration, prepayment speed, and indicative market quotes for comparable investments along with other assumptions relating to credit quality, collateral value, complexity of the investment structure, general market conditions and liquidity. This category may include investments where trading has been halted or there are certain restrictions on trading. While these investments are priced using unobservable inputs, the valuation of these investments reflects the best available data and management believes the prices are a reasonable representation of exit price. |
The procedures adopted by the Board of Trustees define how investments are to be valued, including the formation and activities of a Valuation Committee. The Valuation Committee has the overall responsibility for implementing the procedures adopted by the Board of Trustees, including the responsibility for determining the fair value of the Fund’s investments. The Valuation Committee is also responsible for determining in good faith the fair value of an investment when the value cannot be obtained from primary pricing services or alternative sources or if the valuation of an investment, as provided by the primary pricing service or alternative source, is believed not to reflect the investment’s fair value as of the Valuation Date.
The Valuation Committee is comprised of the Trust’s Chief Executive Officer, Treasurer, Chief Operating Officer, and Chief Legal Officer, or their designees, and other personnel of the investment manager subject to prior approval by the Board of Trustees. In addition, the Trust’s Chief Compliance Officer (“CCO”) shall designate a member of the compliance group to attend Valuation Committee meetings as a non-voting resource, to monitor for and provide guidance with respect to compliance with these procedures and to keep the Trust’s CCO regularly informed of pricing and Valuation Committee proceedings. Two members of the Valuation Committee or their designees, representing different departments, shall constitute a quorum for purposes of permitting the Committee to take action. The Valuation Committee will consider all relevant factors in determining an investment’s fair value, and may seek the advice of the Fund’s adviser, knowledgeable brokers, and legal counsel in making such determination.
At each quarterly meeting of the Board of Trustees, the Valuation Committee provides a written report that includes details of all fair-valued investments to the extent any are fair-valued, including the reason for the fair valuation, and an indication, when possible, of the accuracy of the valuation by disclosing the next available reliable public price quotation or the disposition price of such investments (the “look-back” review). The Board of Trustees then must consider for ratification all of the fair value determinations made during the previous quarter.
Valuation levels are not necessarily indicative of the risk associated with investing in such investments. Individual investments within any of the above mentioned asset classes may be assigned a different hierarchical level than those presented above, as individual circumstances dictate.
For additional information, refer to the Investment Valuation Hierarchy Level Summary included in the Schedule of Investments.
| c) | Investment Transactions and Investment Income – Investment transactions are recorded as of the trade date (the date the order to buy or sell is executed) for financial reporting purposes. Investments purchased or sold on a when-issued or delayed-delivery basis may be settled a month or more after the trade date. Realized gains and losses are determined on the basis of identified cost. |
Dividend income from domestic securities is recorded on the ex-dividend date. Interest income, including amortization of premium, accretion of discounts and additional principal received in-kind in lieu of cash, is accrued on a daily basis.
| d) | Joint Trading Account – The Fund may invest cash balances into a joint trading account that may be invested in one or more repurchase agreements. |
| 14 |
|
| HIMCO VIT Index Fund |
Notes to Financial Statements – (continued)
June 30, 2017 (Unaudited)
| e) | Fund Share Valuation and Dividend Distributions to Shareholders – Orders for the Fund’s shares are executed in accordance with the investment instructions of the contract holders and plan participants. Each class of shares offered by the Fund has equal rights as to assets and voting privileges (except that shareholders of a class have exclusive voting rights regarding any matter relating solely to that class of shares). Income and non-class specific expenses are allocated daily to each class on the basis of the relative net assets of the class. Realized and unrealized gains and losses are allocated daily based on the relative net assets of each class of shares of the Fund. |
Orders for the purchase of the Fund’s shares received prior to the close of the Exchange on any day the Exchange is open for business are priced at the NAV determined as of the close of the Exchange. Orders received after the close of the Exchange, or on a day on which the Exchange and/or the Fund is not open for business, are priced at the next determined NAV.
Dividends are declared pursuant to a policy adopted by the Board of Trustees based upon the investment performance of the Fund. The policy of the Fund is to pay dividends from net investment income and to make distributions of realized gains, if any, at least once per year.
Distributions from net investment income, realized capital gains and capital are determined in accordance with federal income tax regulations, which may differ from U.S. GAAP with respect to character and timing. These differences may include, but are not limited to, losses deferred due to wash sale adjustments, foreign currency gains and losses, adjustments related to Passive Foreign Investment Companies (“PFICs”), Real Estate Investment Trusts (“REITs”), Regulated Investment Companies (“RICs”), certain derivatives and partnerships. Permanent book and federal income tax basis differences relating to shareholder distributions will result in reclassifications to certain of the Fund’s capital accounts (see Federal Income Taxes: Reclassification of Capital Accounts note).
| 3. | Securities and Other Investments: |
| a) | Repurchase Agreements and Reverse Repurchase Agreements – A repurchase agreement is an agreement by which a counterparty agrees to sell an investment and agrees to repurchase the investment sold from the buyer, the Fund, at a mutually agreed upon time and price. A reverse repurchase agreement is an agreement by which the Fund agrees to sell an investment and agrees to repurchase the investment sold from the buyer, the counterparty, at a mutually agreed upon time and price. During the period of the repurchase agreement, the counterparty will deposit cash and or securities in a third party custodial account to serve as collateral. At the time the Fund enters into a repurchase agreement, the value of the underlying collateral, including accrued interest, will be equal to or exceed the value of the repurchase agreement. Repurchase agreements expose the Fund to counterparty risk – that is, the risk that the counterparty will not fulfill its obligations. To minimize counterparty risk, the investments that serve to collateralize the repurchase agreement are held by the Fund’s custodian in book entry or physical form in the custodial account of the Fund or in a third party custodial account. Repurchase agreements are valued at cost plus accrued interest, which approximates fair value. Repurchase agreements have master netting arrangements which allow the Fund to offset amounts owed to a counterparty with amounts owed by the counterparty, including any collateral. Upon an event of default under a master repurchase agreement, the non-defaulting party may close out all transactions traded under such agreement and net amounts owed under each transaction to one net amount payable by one party to the other. Absent an event of default, the master repurchase agreement does not result in an offset of reported amounts of assets and liabilities in the Statement of Assets and Liabilities across transactions between the Fund and the applicable counterparty. The Fund, as shown on the Schedule of Investments, had outstanding repurchase agreements and related collateral as of June 30, 2017. |
| b) | Investments Purchased on a When-Issued or Delayed-Delivery Basis – Delivery and payment for investments that have been purchased by the Fund on a forward commitment, or when-issued or delayed-delivery basis, take place beyond the customary settlement period. The Fund may dispose of or renegotiate a delayed-delivery transaction after it is entered into, and may sell delayed-delivery investments before they are delivered, which may result in a realized gain or loss. During this period, such investments are subject to market fluctuations, and the Fund identifies investments segregated in its records with a value at least equal to the amount of the commitment. When-issued and delayed delivery investments and forward commitments involve the risk that the investment the Fund buys will lose value prior to its delivery. There are also risks that the investment will never be issued or that the other party to the transaction will not |
| 15 |
|
| HIMCO VIT Index Fund |
Notes to Financial Statements – (continued)
June 30, 2017 (Unaudited)
| meet its obligation. If this occurs, the Fund loses both the investment opportunity for the assets it set aside to pay for the investment and any gain in the investment’s price. The Fund did not hold when-issued or delayed-delivery investments as of June 30, 2017. |
| 4. | Financial Derivative Instruments: |
The following disclosures contain information on how and why the Fund uses derivative instruments, the credit-risk-related contingent features in certain derivative instruments, and how derivative instruments affect the Fund’s financial position and results of operations. The location and fair value amounts of these instruments in the Statement of Assets and Liabilities and the realized gains and losses and changes in unrealized gains and losses in the Statement of Operations, each categorized by type of derivative contract, are included in the following Additional Derivative Instrument Information footnote. The derivative instruments outstanding as of year-end are disclosed in the notes to the Schedule of Investments, if applicable. The amounts of realized gains and losses and changes in unrealized appreciation and depreciation on derivative instruments during the year are disclosed in the Statement of Operations.
| a) | Futures Contracts – The Fund may enter into futures contracts. A futures contract is an agreement between two parties to buy or sell an asset at a set price on a future date. The Fund uses futures contracts to manage or obtain exposure to the investment markets, commodities, or movements in interest rates and currency values. The primary risks associated with the use of futures contracts are the imperfect correlation between the change in market value of the investments held by the Fund and the prices of futures contracts and the possibility of an illiquid market. Upon entering into a futures contract, the Fund is required to deposit with a futures commission merchant (“FCM”) an amount of cash or U.S. Government or Agency Obligations in accordance with the initial margin requirements of the broker or exchange. Futures contracts are marked to market daily at the most recent settlement price reported by an exchange on which, over time, they are traded most extensively, and an appropriate payable or receivable for the change in value (“variation margin”) is recorded by the Fund. Gains or losses are recognized but not considered realized until the contracts expire or are closed. Futures contracts involve, to varying degrees, risk of loss in excess of the variation margin disclosed in the Statement of Assets and Liabilities; however, the Fund seeks to reduce this risk through the use of an FCM. The Fund, as shown on the Schedule of Investments, had outstanding futures contracts as of June 30, 2017. |
Additional Derivative Instrument Information:
Fair Value of Derivative Instruments in the Statement of Assets and Liabilities as of June 30, 2017:
| Risk Exposure Category | ||||||||||||||||||||||||||||
| Interest Rate Contracts | Foreign Exchange Contracts | Credit Contracts | Equity Contracts | Commodity Contracts | Other Contracts | Total | ||||||||||||||||||||||
Liabilities: | ||||||||||||||||||||||||||||
Unrealized depreciation on futures(1) | $ | — | $ | — | $ | — | $ | 48,570 | $ | — | $ | — | $ | 48,570 | ||||||||||||||
|
|
|
|
|
|
|
|
|
|
|
|
|
| |||||||||||||||
Total | $ | — | $ | — | $ | — | $ | 48,570 | $ | — | $ | — | $ | 48,570 | ||||||||||||||
|
|
|
|
|
|
|
|
|
|
|
|
|
| |||||||||||||||
| (1) | Includes cumulative appreciation/depreciation on financial futures contracts as reported in the Schedule of Investments. Only current day’s variation margin is reported within the Statement of Assets and Liabilities. |
The volume of derivatives that is presented in the Schedule of Investments is consistent with the derivative activity during the six-month period ended June 30, 2017.
| 16 |
|
| HIMCO VIT Index Fund |
Notes to Financial Statements – (continued)
June 30, 2017 (Unaudited)
The Effect of Derivative Instruments in the Statement of Operations for the six-month period ended June 30, 2017:
| Risk Exposure Category | ||||||||||||||||||||||||||||
| Interest Rate Contracts | Foreign Exchange Contracts | Credit Contracts | Equity Contracts | Commodity Contracts | Other Contracts | Total | ||||||||||||||||||||||
Realized Gain on Derivatives Recognized as a Result of Operations: |
| |||||||||||||||||||||||||||
Net realized gain on futures | $ | — | $ | — | $ | — | $ | 616,109 | $ | — | $ | — | $ | 616,109 | ||||||||||||||
|
|
|
|
|
|
|
|
|
|
|
|
|
| |||||||||||||||
Total | $ | — | $ | — | $ | — | $ | 616,109 | $ | — | $ | — | $ | 616,109 | ||||||||||||||
|
|
|
|
|
|
|
|
|
|
|
|
|
| |||||||||||||||
Net Change in Unrealized Appreciation (Depreciation) on Derivatives Recognized as a Result of Operations: |
| |||||||||||||||||||||||||||
Net change in unrealized depreciation of futures | $ | — | $ | — | $ | — | $ | (31,106 | ) | $ | — | $ | — | $ | (31,106 | ) | ||||||||||||
|
|
|
|
|
|
|
|
|
|
|
|
|
| |||||||||||||||
Total | $ | — | $ | — | $ | — | $ | (31,106 | ) | $ | — | $ | — | $ | (31,106 | ) | ||||||||||||
|
|
|
|
|
|
|
|
|
|
|
|
|
| |||||||||||||||
| b) | Balance Sheet Offsetting Information – Set forth below are tables which disclose both gross information and net information about instruments and transactions eligible for offset in the financial statements, and instruments and transactions that are subject to a master netting arrangement, as well as amounts related to margin, reflected as financial collateral (including cash collateral), held at clearing brokers, counterparties and the Fund’s custodian. The master netting arrangements allow the clearing brokers to net any collateral held in or on behalf of the Fund, or liabilities or payment obligations of the clearing brokers to the Fund, against any liabilities or payment obligations of the Fund to the clearing brokers. The Fund is required to deposit financial collateral (including cash collateral) at the Fund’s custodian on behalf of clearing brokers and counterparties to continually meet the original and maintenance requirements established by the clearing brokers and counterparties. Such requirements are specific to the respective clearing broker or counterparty. Certain master netting arrangements may not be enforceable in a bankruptcy. |
The following tables present the Fund’s derivative assets and liabilities, presented on a gross basis as no amounts are netted within the Statement of Assets and Liabilities, by counterparty net of amounts available for offset under a master netting agreement or similar agreement (“MNA”) and net of the related collateral received/pledged by the Fund as of June 30, 2017:
Derivative Financial Instruments: | Assets | Liabilities | ||||||
Futures contracts | $ | — | $ | 48,570 | ||||
|
|
|
| |||||
Total gross amount of derivative assets and liabilities in the Statement of Assets and Liabilities | — | 48,570 | ||||||
|
|
|
| |||||
Derivatives not subject to a MNA | — | 48,570 | ||||||
|
|
|
| |||||
Total gross amount of derivative assets and liabilities subject to MNA or similar agreements | $ | — | $ | — | ||||
|
|
|
| |||||
| 5. | Principal Risks: |
The market values of equity securities, such as common stocks and preferred stocks, or equity related investments, such as futures and options, may decline due to general market conditions which are not specifically related to a particular company, such as real or perceived adverse economic conditions, changes in the general outlook for corporate earnings, changes in interest or currency rates or adverse investor sentiment generally. The market value of equity securities may also decline due to factors which affect a particular industry or industries, such as labor shortages or increased production costs and competitive conditions within an industry. Equity securities and equity related investments generally have greater market price volatility than fixed income securities.
The Fund may be exposed to counterparty risk, or the risk that an institution or other entity with which the Fund has unsettled or open transactions will default.
| 17 |
|
| HIMCO VIT Index Fund |
Notes to Financial Statements – (continued)
June 30, 2017 (Unaudited)
| 6. | Federal Income Taxes: |
| a) | Federal Income Taxes – For federal income tax purposes, the Fund intends to continue to qualify as a RIC under Subchapter M of the Internal Revenue Code of 1986, as amended (“IRC”), by distributing substantially all of its taxable net investment income and net realized capital gains to its shareholders and otherwise complying with the requirements of the IRC. The Fund distributed substantially all of its income and capital gains in prior years, if applicable, and intends to distribute substantially all of its income and capital gains prior to the next fiscal year-end. Accordingly, no provision for federal income or excise taxes has been made in the accompanying financial statements. Distributions from short-term capital gains are treated as ordinary income distributions for federal income tax purposes. |
| b) | Net Investment Income (Loss), Net Realized Gains (Losses) and Distributions – Net investment income (loss) and net realized gains (losses) may differ for financial statement and tax purposes primarily because of losses deferred due to wash sale adjustments, adjustments related to REITs, certain derivatives and corporate actions. The character of distributions made during the year from net investment income or net realized gains may differ from their ultimate characterization for federal income tax purposes. Also, due to the timing of dividend distributions, the fiscal year in which amounts are distributed may differ from the year that the income or realized gains (losses) were recorded by the Fund. |
| c) | Distributions and Components of Distributable Earnings – The tax character of distributions paid by the Fund for the periods indicated is as follows (as adjusted for dividends payable, if applicable): |
| For the Year Ended December 31, 2016 | For the Year Ended December 31, 2015 | |||||||
Ordinary Income | $ | 22,579,859 | $ | 4,413,528 | ||||
Long-Term Capital Gains(1) | 73,467,615 | 13,266,673 | ||||||
| (1) | The Fund designates these distributions as capital gain dividends per IRC Sec. 852(b) (3) (C). |
As of December 31, 2016, the Fund’s components of distributable earnings (deficit) on a tax basis were as follows:
| Amount | ||||
Undistributed Ordinary Income | $ | 19,068,465 | ||
Undistributed Long-Term Capital Gain | 62,292,559 | |||
Unrealized Appreciation (Depreciation)(1) | 451,259,793 | |||
|
| |||
Total Accumulated Earnings (Deficit) | $ | 532,620,817 | ||
|
| |||
| (1) | Differences between book-basis and tax-basis unrealized appreciation (depreciation) may be attributable to the losses deferred due to wash sale adjustments, adjustments related to REITs, certain derivatives and corporate actions. |
| d) | Reclassification of Capital Accounts – The Fund may record reclassifications in its capital accounts. These reclassifications have no impact on the total net assets of the Fund. The reclassifications are a result of permanent differences between U.S. GAAP and tax accounting for such items as REITs and corporate actions. Adjustments are made to reflect the impact these items have on current and future distributions to shareholders. Therefore, the source of the Fund’s distributions may be shown in the accompanying Statements of Changes in Net Assets as from undistributed net investment income, from accumulated net realized gains on investments or from capital depending on the type of book and tax differences that exist. For the fiscal year ended December 31, 2016, the Fund recorded reclassifications to increase (decrease) the accounts listed below: |
| Amount | ||||
Paid In Capital | $ | — | ||
Undistributed Net Investment Income | (860,783 | ) | ||
Accumulated Net Realized Gain | 860,783 | |||
| 18 |
|
| HIMCO VIT Index Fund |
Notes to Financial Statements – (continued)
June 30, 2017 (Unaudited)
| e) | Capital Loss Carryforward – Under U.S. tax law, the Fund is permitted to carry forward capital losses for an unlimited period. Additionally, capital loss carryforwards retain their character as either short-term or long-term capital losses rather than being considered all short-term as permitted under prior regulation. |
The Fund had no capital loss carryforwards for U.S. federal income tax purposes as of December 31, 2016.
| f) | Accounting for Uncertainty in Income Taxes – In accordance with U.S. GAAP, the Fund analyzes all open tax years, as defined by the statute of limitations, for all major jurisdictions. Generally, tax authorities can examine all tax returns filed for the last three years. The Fund does not have an examination in progress. |
The Fund has reviewed all open tax years and major jurisdictions and concluded that these financial reporting rules had no effect on the Fund’s financial position or results of operations. There is no tax liability resulting from unrecognized tax benefits relating to uncertain income tax positions taken or expected to be taken on the tax return for the fiscal year ended December 31, 2016. The Fund is also not aware of any tax positions for which it is reasonably possible that the total amounts of unrecognized tax benefits will significantly change in the next twelve months.
| 7. | Fees and Expenses: |
| a) | Investment Management Agreement – Hartford Investment Management Company (“Hartford Investment Management”) serves as the Fund’s investment manager pursuant to an Investment Management Agreement with the Trust. Hartford Investment Management is a wholly owned subsidiary of The Hartford Financial Services Group, Inc. (“The Hartford”). The investment manager provides day-to-day investment management services to the Fund and has overall investment supervisory responsibility for the Fund. In addition, the investment manager provides administrative personnel, services, equipment, facilities and office space for operation of the Fund. |
The schedule below reflects the rates of compensation as a percentage of the Fund’s average daily net assets paid to the investment manager for investment management services rendered as of June 30, 2017; the rates are accrued daily and paid monthly.
Average Daily Net Assets | Annual Fee | |||
On first $2 billion | 0.30% | |||
On next $3 billion | 0.20% | |||
On next $5 billion | 0.18% | |||
Over $10 billion | 0.17% | |||
| b) | Accounting Services Agreement – State Street Bank and Trust Company (“State Street Bank”) provides the Fund with accounting services pursuant to a fund accounting agreement by and between the Trust, on behalf of the Fund, and State Street Bank. The amount paid for accounting services can be found in the Statement of Operations. These fees are accrued daily and paid monthly. |
| c) | Operating Expenses – Allocable expenses incurred by the Trust are allocated to the Fund and allocated to classes within the Fund in proportion to the average daily net assets of the Fund and each class, except where allocation of certain expenses is more fairly made directly to the Fund or to specific classes within the Fund. |
Hartford Investment Management has contractually agreed to reimburse expenses (exclusive of taxes, interest expense, brokerage commissions, acquired fund fees and expenses and extraordinary expenses) to the extent necessary to maintain total annual operating expenses of the Fund as follows; 0.33% for Class IA and 0.58% for Class IB. This contractual arrangement will remain in effect until April 30, 2018 and shall renew automatically for one-year terms, unless the investment manager provides written notice of termination prior to the start of the next term or upon approval of the Board of Trustees of the Fund.
| d) | Distribution Plan for Class IB Shares – HIMCO Distribution Services Company, a wholly owned subsidiary of The Hartford, serves as the principal underwriter and distributor of the Fund. The Trust, on behalf of the Fund, has adopted a Distribution Plan pursuant to Rule 12b-1 of the 1940 Act for Class IB shares to compensate the distributor, from assets |
| 19 |
|
| HIMCO VIT Index Fund |
Notes to Financial Statements – (continued)
June 30, 2017 (Unaudited)
| attributable to the services rendered and expenses borne in connection with activities primarily intended to result in the sale of the Class IB shares, subject to the review and approval of the Board of Trustees. |
The Distribution Plan provides that the Fund may pay annually up to 0.25% of the average daily net assets of the Fund attributable to its Class IB shares for activities primarily intended to result in the sale of Class IB shares. The Board of Trustees has the authority to suspend or reduce these payments at any point in time. Under the terms of the Distribution Plan and the principal underwriting agreement, the Fund is authorized to make payments monthly to the distributor that may be used to pay or reimburse entities, including insurance company affiliates of Hartford Investment Management, providing distribution and shareholder servicing with respect to the Class IB shares for such entities’ fees or expenses incurred or paid in that regard. The distribution fee paid during the period can be found in the Statement of Operations. These fees are accrued daily and paid monthly or at such other intervals as the Board of Trustees may determine.
| e) | Transfer Agent Fees – State Street Bank provides transfer agent services to the Fund. The transfer agent is reimbursed for out-of-pocket expenses and other costs associated with the services it provides to the Fund, including costs invoiced by sub-contractors. Hartford Investment Management and its affiliates may pay, out of their own assets, compensation to third-party administrators for recordkeeping and other administrative services. The amount paid for transfer agent services can be found in the Statement of Operations. These fees are accrued daily and paid monthly. |
| f) | Trustee Fees – The Board of Trustees is responsible for oversight of the Fund. The Board of Trustees elects officers who are responsible for the day to day operations of the Fund. The Board of Trustees oversees the investment manager and the other principal service providers of the Fund. The Board of Trustees currently holds four regularly scheduled meetings throughout each year. In addition, the Board of Trustees may hold special meetings at other times either in person or by telephone. The Trustee fees paid during the period can be found in the Statement of Operations. |
| 8. | Investment Transactions: |
For the six-month period ended June 30, 2017, the aggregate cost of purchases and proceeds from sales of investment securities (excluding short-term investments) was as follows:
| Amount | ||||
Cost of Purchases | $ | 25,349,311 | ||
Sales Proceeds | 74,078,453 | |||
| 9. | Pending Legal Proceedings: |
On June 2, 2011, a complaint was filed against Hartford Investment Management Company in the United States District Court of Connecticut (Deutsche Bank Trust Company Americas v. Aetna, Inc., ING Investment Trust Co., Milan E. Chilla, Hartford Investment Management Co., and UBS AG (D. Conn.)). In a similar action, plaintiffs filed a complaint listing The Hartford Index HLS Fund, which was merged into HIMCO VIT Index Fund in October, 2014, as members of the defendant class (The Official Committee of Unsecured Creditors of Tribune Company v. Fitzsimons, et al. (Bankr. D. Del.)). The complaints relate to the bankruptcy of the Tribune Company, which was a public company that repurchased its shares in a leveraged buyout in 2007, but entered bankruptcy a year later. The plaintiffs in each case allege that the repurchase of shares acted as a fraudulent transfer. The plaintiffs in each case seek to recover from each class member the amount of consideration received in the buyout. The Hartford Index HLS Fund held 23,987 shares and received $815,558 in the buyout. The Hartford Index HLS Fund is listed as a member of the defendant shareholder class in an exhibit to the Complaint. Each action was transferred to the United States District Court for the Southern District of New York. In September 2013, the court dismissed the Deutsche Bank Trust Company Americas action, and this dismissal was affirmed in March 2016 by the United States Court of Appeals for the Second Circuit. The plaintiff in the Deutsche Bank Trust Company Americas action has filed a petition for writ of certiorari, which is pending before the U.S. Supreme Court. In The Official Committee of Unsecured Creditors of Tribune Company action, the court in January 2017 granted the motion to dismiss filed in 2014 by the shareholder defendants. As a result, the shareholder defendants, including The Hartford Index HLS Fund, have all now been dismissed from the case. Because other non-shareholder defendants remain in the lawsuit, the dismissal order is not immediately appealable by the plaintiff, but an eventual appeal is expected. The Hartford, on behalf of the Fund, intends to continue to vigorously defend these actions.
| 20 |
|
| HIMCO VIT Index Fund |
Notes to Financial Statements – (concluded)
June 30, 2017 (Unaudited)
| 10. | Recent Accounting Pronouncements: |
In October 2016, the SEC adopted amendments to rules under the 1940 Act (“final rules”) intended to modernize the reporting and disclosure of information by registered investment companies. The final rules amend Regulation S-X and require investment companies to provide standardized, enhanced derivatives disclosures in fund financial statements in a format designed for individual investors. The amendments to Regulation S-X also update the disclosures for other investments in and advances to affiliates and amend the rules regarding the general form and content of fund financial statements. The compliance date for the amendments to Regulation S-X is August 1, 2017. Management is currently evaluating the amendments and their impact, if any, on the Fund’s financial statements.
| 11. | Indemnifications: |
Under the Trust’s organizational documents, the Trust shall indemnify its officers and trustees to the full extent required or permitted under The Delaware Statutory Trust Act and the federal securities laws. In addition, the Trust, on behalf of the Fund, may enter into contracts that contain a variety of indemnifications. The Trust’s maximum exposure under these arrangements is unknown. However, as of the date of these financial statements the Trust has not had prior claims or losses pursuant to these contracts and expects the risk of loss to be remote.
| 12. | Subsequent Event: |
Management has evaluated the need for disclosures and/or adjustments resulting from subsequent events through the date the Financial Statements were issued. Based on this evaluation, no adjustments to, or disclosures in, the Financial Statements were necessary as of June 30, 2017.
| 21 |
|
| HIMCO VIT Index Fund |
| — Selected Per-Share Data(1) — | — Ratios and Supplemental Data — | |||||||||||||||||||||||||||||||||||||||||||||||||||
Class | Net Asset Value at, Beginning of Period | Net Investment Income (Loss) | Net Realized and Unrealized Gain (Loss) on Investments | Total from Investment Operations | Distributions from Net Investment Income | Distributions from Realized Gain on Investments | Total Distributions | Net Asset Value End of Period | Total Return(2) | Net Assets at End of Period (000s) | Ratio of Expenses to Average Net Assets Before Adjust- ments(3) | Ratio of Expenses to Average Net Assets After Adjust- ments(3) | Ratio of Net Investment Income (Loss) to Average Net Assets | |||||||||||||||||||||||||||||||||||||||
| HIMCO VIT Index Fund | ||||||||||||||||||||||||||||||||||||||||||||||||||||
For the Six-Month Period Ended June 30, 2017 (Unaudited) |
| |||||||||||||||||||||||||||||||||||||||||||||||||||
IA | $ | 41.58 | $ | 0.38 | $ | 3.43 | $ | 3.81 | $ | — | $ | — | $ | — | $ | 45.39 | 9.19 | %(4) | $ | 709,478 | 0.38 | %(5) | 0.33 | %(5) | 1.73 | %(5) | ||||||||||||||||||||||||||
IB | 41.09 | 0.32 | 3.39 | 3.71 | — | — | — | 44.80 | 9.03 | (4) | 389,970 | 0.63 | (5) | 0.58 | (5) | 1.48 | (5) | |||||||||||||||||||||||||||||||||||
For the Year Ended December 31, 2016 |
| |||||||||||||||||||||||||||||||||||||||||||||||||||
IA | $ | 40.92 | $ | 0.79 | $ | 3.82 | $ | 4.61 | $ | (0.91 | ) | $ | (3.04 | ) | $ | (3.95 | ) | $ | 41.58 | 11.59 | % | $ | 677,208 | 0.38 | % | 0.33 | % | 1.93 | % | |||||||||||||||||||||||
IB | 40.57 | 0.68 | 3.79 | 4.47 | (0.91 | ) | (3.04 | ) | (3.95 | ) | 41.09 | 11.34 | 381,418 | 0.63 | 0.58 | 1.68 | ||||||||||||||||||||||||||||||||||||
For the Year Ended December 31, 2015 |
| |||||||||||||||||||||||||||||||||||||||||||||||||||
IA | $ | 41.11 | $ | 0.79 | $ | (0.34 | ) | $ | 0.45 | $ | (0.15 | ) | $ | (0.49 | ) | $ | (0.64 | ) | $ | 40.92 | 1.06 | % | $ | 680,974 | 0.42 | % | 0.33 | % | 1.92 | % | ||||||||||||||||||||||
IB | 40.86 | 0.69 | (0.34 | ) | 0.35 | (0.15 | ) | (0.49 | ) | (0.64 | ) | 40.57 | 0.82 | 414,950 | 0.67 | 0.58 | 1.67 | |||||||||||||||||||||||||||||||||||
For the Year Ended December 31, 2014 |
| |||||||||||||||||||||||||||||||||||||||||||||||||||
IA | $ | 38.54 | $ | 0.69 | $ | 4.23 | $ | 4.92 | $ | (0.58 | ) | $ | (1.77 | ) | $ | (2.35 | ) | $ | 41.11 | 13.33 | % | $ | 760,768 | 0.33 | % | 0.33 | % | 1.74 | % | |||||||||||||||||||||||
IB | 38.35 | 0.59 | 4.19 | 4.78 | (0.50 | ) | (1.77 | ) | (2.27 | ) | 40.86 | 13.01 | 467,467 | 0.58 | 0.58 | 1.49 | ||||||||||||||||||||||||||||||||||||
For the Year Ended December 31, 2013(6) |
| |||||||||||||||||||||||||||||||||||||||||||||||||||
IA | $ | 29.69 | $ | 0.62 | $ | 8.85 | $ | 9.47 | $ | (0.62 | ) | $ | — | $ | (0.62 | ) | $ | 38.54 | 31.95 | % | $ | 763,868 | 0.33 | % | 0.33 | % | 1.79 | % | ||||||||||||||||||||||||
IB | 29.56 | 0.53 | 8.80 | 9.33 | (0.54 | ) | — | (0.54 | ) | 38.35 | 31.61 | 413,119 | 0.58 | 0.58 | 1.54 | |||||||||||||||||||||||||||||||||||||
For the Year Ended December 31, 2012(6)(7) |
| |||||||||||||||||||||||||||||||||||||||||||||||||||
IA | $ | 26.20 | $ | 0.61 | $ | 3.48 | $ | 4.09 | $ | (0.60 | ) | $ | — | $ | (0.60 | ) | $ | 29.69 | 15.63 | % | $ | 691,786 | 0.33 | % | 0.33 | % | 1.98 | % | ||||||||||||||||||||||||
IB | 26.09 | 0.49 | 3.51 | 4.00 | (0.53 | ) | — | (0.53 | ) | 29.56 | 15.34 | 307,129 | 0.58 | 0.58 | 1.75 | |||||||||||||||||||||||||||||||||||||
| (1) | Information presented relates to a share outstanding throughout the indicated period. Net investment income (loss) per share amounts are calculated based on average shares outstanding unless otherwise noted. |
| (2) | The figures do not include sales charges or other fees which may be applied at the variable life insurance, variable annuity or qualified retirement plan product level. Any such additional sales charges or other fees would lower the Fund’s performance. |
| (3) | Adjustments include waivers and reimbursements, if applicable. |
| (4) | Not annualized. |
| (5) | Annualized. |
| (6) | Financial highlights for the fiscal years ended December 31, 2013 and December 31, 2012 were audited by the Predecessor Fund’s auditor. |
| (7) | Net investment income (loss) per share amounts have been calculated using the SEC method. |
| Portfolio Turnover Rate for All Share Classes | ||||
For the Six Months Ended June 30, 2017 (Unaudited) | 2 | % | ||
For the Year Ended December 31, 2016 | 12 | |||
For the Year Ended December 31, 2015 | 8 | |||
For the Year Ended December 31, 2014 | 3 | |||
For the Year Ended December 31, 2013(1) | 3 | |||
For the Year Ended December 31, 2012(1) | 7 | |||
| (1) | Financial highlights for the fiscal years ended December 31, 2013 and December 31, 2012 were audited by the Predecessor Fund’s auditor. |
| 22 |
|
| HIMCO VIT Index Fund |
HOW TO OBTAIN A COPY OF THE FUND’S PROXY VOTING POLICIES AND VOTING RECORDS (UNAUDITED)
A description of the policies and procedures that the Fund uses to determine how to vote proxies relating to portfolio securities and information about how the Fund voted proxies relating to portfolio securities during the most recent twelve-month period ended June 30 are available (1) without charge, upon request, by calling 1-800-862-6668 and (2) on the SEC’s website at http://www.sec.gov. Additionally, a complete list of holdings is available on the Fund’s website at www.HVITFunds.com.
QUARTERLY PORTFOLIO HOLDINGS INFORMATION (UNAUDITED)
The Fund files a complete schedule of portfolio holdings with the SEC for the first and third quarters of each fiscal year on Form N-Q. The Fund’s Forms N-Q are available (1) without charge, upon request, by calling 1-800-862-6668 and (2) on the SEC’s website at http://www.sec.gov. The Form N-Q may be reviewed and copied at the SEC’s Public Reference Room in Washington, DC. Information on the operation of the Public Reference Room may be obtained by calling 1-800-SEC-0330.
| 23 |
|
| HIMCO VIT Index Fund |
Your Fund’s Expenses
As a shareholder of the Fund, you incur two types of costs: (1) transaction costs and (2) ongoing costs, including investment management fees, distribution and/or service (12b-1) fees, if any, and other fund expenses. This example is intended to help you understand your ongoing costs (in dollars) of investing in the Fund and to compare these costs with the ongoing costs of investing in other mutual funds. The example is based on an investment of $1,000 invested at the beginning of the period and held for the entire period of January 1, 2017 through June 30, 2017.
Actual Expenses
The first set of rows of the table below provides information about actual account values and actual expenses. You may use the information in this row, together with the amount you invested, to estimate the expenses that you paid over the period. Simply divide your account value by $1,000 (for example, an $8,600 account value divided by $1,000 = 8.6), then multiply the result by the number in the line under the heading entitled “Expenses Paid During Period” to estimate the expenses you paid on your account during this period.
Hypothetical Example for Comparison Purposes
The second set of rows of the table below provides information about hypothetical account values and hypothetical expenses based on the Fund’s actual expense ratio and an assumed rate of return of 5% per year before expenses, which is not the Fund’s actual return. The hypothetical account values and expenses may not be used to estimate the actual ending account balance or expenses you paid for the period. You may use this information to compare the ongoing costs of investing in the Fund and other funds. To do so, compare this 5% hypothetical example with the 5% hypothetical examples that appear in the shareholder reports of the other funds.
Please note that the expenses shown in the table are meant to highlight your ongoing costs only and do not reflect any transactional costs, such as sales charges (loads) or fees which may be applied at the variable life insurance, variable annuity, or qualified retirement plan product level. Therefore, the second set of rows of the table is useful in comparing ongoing costs only, and will not help you determine the relative total costs of owning different funds. In addition, if these transactional costs were included, your costs would be higher.
| Beginning Account Value 1/1/17 | Ending Account Value 6/30/17 | Expenses Paid During Period 1/1/17 - 6/30/17(1) | Net Annualized Expense Ratio(2) | |||||||||||||
Actual | ||||||||||||||||
Class IA | $ | 1,000 | $ | 1,091.90 | $ | 1.71 | 0.33 | % | ||||||||
Class IB | $ | 1,000 | $ | 1,090.30 | $ | 3.01 | 0.58 | % | ||||||||
Hypothetical | ||||||||||||||||
Class IA | $ | 1,000 | $ | 1,023.16 | $ | 1.66 | 0.33 | % | ||||||||
Class IB | $ | 1,000 | $ | 1,021.92 | $ | 2.91 | 0.58 | % | ||||||||
| (1) | Expenses are equal to the class’s annualized expense ratio listed in the table above, multiplied by the average account value over the period, multiplied by 181, the number of days in the most recent fiscal half-year, divided by 365, to reflect the one-half year period. |
| (2) | Net annualized expense ratio is reflective of any applicable contractual fee waivers and/or expense reimbursements or voluntary fee waivers. Details regarding fee waivers can be found in Fees and Expenses of the accompanying Notes to Financial Statements. |
| 24 |
|
THIS PRIVACY POLICY IS NOT PART OF THIS REPORT
Privacy Policy and Practices of The Hartford Financial Services Group, Inc. and its Affiliates
(herein called “we, our and us”)
This Privacy Policy applies to our United States Operations
We value your trust. We are committed to the responsible:
a) management;
b) use; and
c) protection;
of Personal Information.
This notice describes how we collect, disclose, and protect Personal Information.
We collect Personal Information to:
a) service your Transactions with us; and
b) support our business functions.
We may obtain Personal Information from:
a) You;
b) your Transactions with us; and
c) third parties such as a consumer-reporting agency.
Based on the type of product or service You apply for or get from us, Personal Information such as:
a) your name;
b) your address;
c) your income;
d) your payment; or
e) your credit history;
may be gathered from sources such as applications, Transactions, and consumer reports.
To serve You and service our business, we may share certain Personal Information. We will share Personal Information, only as allowed by law, with affiliates such as:
a) our insurance companies;
b) our employee agents;
c) our brokerage firms; and
d) our administrators.
As allowed by law, we may share Personal Financial Information with our affiliates to:
a) market our products; or
b) market our services;
to You without providing You with an option to prevent these disclosures.
We may also share Personal Information, only as allowed by law, with unaffiliated third parties including:
a) independent agents;
b) brokerage firms;
c) insurance companies;
d) administrators; and
e) service providers;
who help us serve You and service our business.
When allowed by law, we may share certain Personal Financial Information with other unaffiliated third parties who assist us by performing services or functions such as:
a) taking surveys;
b) marketing our products or services; or
c) offering financial products or services under a joint agreement between us and one or more financial institutions.
We, and third parties we partner with, may track some of the pages You visit through the use of:
a) cookies;
b) pixel tagging; or
c) other technologies;
and currently do not process or comply with any web browser’s “do not track” signal or similar mechanism that indicates a request to disable online tracking of individual users who visit our websites or use our services.
For more information, our Online Privacy Policy, which governs information we collect on our website and our affiliate websites, which is available at Online Privacy Policy.
We will not sell or share your Personal Financial Information with anyone for purposes unrelated to our business functions without offering You the opportunity to:
a) “opt-out;” or
b) “opt-in;”
as required by law.
We only disclose Personal Health Information with:
a) your proper written authorization; or
b) as otherwise allowed or required by law.
Our employees have access to Personal Information in the course of doing their jobs, such as:
a) underwriting policies;
b) paying claims;
c) developing new products; or
d) advising customers of our products and services.
We use manual and electronic security procedures to maintain:
a) the confidentiality; and
b) the integrity of;
Personal Information that we have. We use these procedures to guard against unauthorized access.
Some techniques we use to protect Personal Information include:
a) secured files;
b) user authentication;
c) encryption;
d) firewall technology; and
e) the use of detection software.
We are responsible for and must:
a) identify information to be protected;
b) provide an adequate level of protection for that data;
c) grant access to protected data only to those people who must use it in the performance of their job-related duties.
Employees who violate our privacy policies and procedures may be subject to discipline, which may include ending their employment with us.
We will continue to follow our Privacy Policy regarding Personal Information even when a business relationship no longer exists between us.
As used in this Privacy Notice:
Application means your request for our product or service.
Personal Financial Information means financial information such as:
a) credit history;
b) income;
c) financial benefits; or
d) policy or claim information.
Personal Financial Information may include Social Security Numbers, Driver’s license numbers, or other government-issued identification numbers, or credit, debit card, or bank account numbers.
Personal Health Information means health information such as:
a) your medical records; or
b) information about your illness, disability or injury.
Personal Information means information that identifies You personally and is not otherwise available to the public. It includes:
a) Personal Financial Information; and
b) Personal Health Information.
Transaction means your business dealings with us, such as:
a) your Application;
b) your request for us to pay a claim; and
c) your request for us to take an action on your account.
You means an individual who has given us Personal Information in conjunction with:
a) asking about;
b) applying for; or
c) obtaining;
a financial product or service from us if the product or service is used mainly for personal, family, or household purposes.
This Customer Privacy Notice is being provided on behalf of The Hartford Financial Services Group, Inc. and its affiliates, to the extent required by the Gramm-Leach-Bliley Act and implementing regulations.
1stAGChoice, Inc.; Access CoverageCorp, Inc.; Access CoverageCorp Technologies, Inc.; American Maturity Life Insurance Company; Archway 60 R, LLC; Business Management Group, Inc.; DMS R, LLC; First State Insurance Company; Fountain Investors I LLC; Fountain Investors II LLC; Fountain Investors III LLC; Fountain Investors IV LLC; FP R, LLC (Delaware); FTC Resolution Company LLC; Hart Re Group L.L.C.; Hartford Accident and Indemnity Company; Hartford Administrative Services Company; Hartford Casualty General Agency, Inc.; Hartford Casualty Insurance Company; Hartford Financial Services, LLC; Hartford Fire General Agency, Inc.; Hartford Fire Insurance Company; Hartford Funds Distributors, LLC; Hartford Funds Management Company, LLC; Hartford Funds Management Group, Inc.; Hartford Group Benefits Holding Company; Hartford Holdings, Inc.; Hartford HLS Series Fund II, Inc.; Hartford Insurance Company of Illinois; Hartford Insurance Company of the Midwest; Hartford Insurance Company of the Southeast; Hartford Integrated Technologies, Inc.; Hartford International Life Reassurance Corporation; Hartford Investment Management Company; Hartford Life and Accident Insurance Company; Hartford Life and Annuity Insurance Company; Hartford Life Insurance Company; Hartford Life, Inc.; Hartford Life International Holding Company; Hartford Life Private Placement, LLC; Hartford Lloyd’s Corporation; Hartford Lloyd’s Insurance Company; Hartford of Texas General Agency, Inc.; Hartford Residual Market, L.C.C.; Hartford Securities Distribution Company, Inc.; Hartford Series Fund, Inc.; Hartford Specialty Insurance Services of Texas, LLC; Hartford Strategic Investments, LLC; Hartford Underwriters General Agency, Inc.; Hartford Underwriters Insurance Company; Hartford-Comprehensive Employee Benefit Service Company; HDC R, LLC .; Heritage Holdings, Inc.; HIMCO Distribution Services Company; HIMCO Variable Insurance Trust; HLA LLC; HL Investment Advisors, LLC; Horizon Management Group, LLC; HRA Brokerage Services, Inc.; Lanidex Class B, LLC; ; Lanidex R, LLC (Delaware); Lattice Strategies LLC; Maxum Casualty Insurance Company; Maxum Indemnity Company; Maxum Specialty Services Corporation; MPC Resolution Company LLC; New England Insurance Company; New England Reinsurance Corporation; Northern Homelands Company; Nutmeg Insurance Agency, Inc.; Nutmeg Insurance Company; Pacific Insurance Company, Limited; Property and Casualty Insurance Company of Hartford; Sentinel Insurance Company, Ltd.; Trumbull Flood Management, L.L.C.; Trumbull Insurance Company; Twin City Fire Insurance Company.
Revised March 2017

This report is prepared for the general information of contract owners and qualified retirement plan participants. It is not an offer to buy or sell an annuity contract or qualified retirement plan, fund or any security. It should not be used in connection with any offer, except in conjunction with the appropriate product prospectus (which contains all pertinent product information including the applicable sales, administrative and other charges) and the current prospectus and/or summary prospectus of the Fund available for investment thereunder.
The information cannot be used or relied upon for the purpose of avoiding IRS penalties. These materials are not intended to provide tax, accounting or legal advice. As with all matters of a tax or legal nature, you should consult your own tax or legal counsel for advice.
You should carefully consider investment objectives, risks, and charges and expenses of the HIMCO VIT Index Fund before investing. This and other information can be found in the Fund’s prospectus or summary prospectus, which can be obtained from your investment representative or from www.hvitfunds.com. Please read them carefully before investing.
Hartford Investment Management is an SEC-registered investment adviser. SEC registration does not imply a certain level of skill or training; nor does it imply that the SEC has sponsored, recommended, or otherwise approved of Hartford Investment Management.
Distributor: HIMCO Distribution Services Company, member FINRA, SIPC, a broker-dealer affiliated with Hartford Investment Management. Not FDIC Insured – No Bank Guarantee – May Lose Value

HIMCO VIT Portfolio Diversifier Fund
This report is prepared for the general information of contract owners and qualified retirement plan participants. It is not an offer to buy or sell an annuity contract or qualified retirement plan, fund or any security. It should not be used in connection with any offer, except in conjunction with the appropriate product prospectus (which contains all pertinent product information including the applicable sales, administrative and other charges) and the current prospectus and/or summary prospectus of the Fund available for investment thereunder.
| HIMCO VIT Portfolio Diversifier Fund |
June 30, 2017 (Unaudited)
Shares or Principal Amount | Market Value(1) | |||||||
| COMMON STOCKS - 25.0% | ||||||||
| Automobiles & Components - 0.2% | ||||||||
| 702 | BorgWarner, Inc. | $ | 29,737 | |||||
| 943 | Delphi Automotive plc | 82,654 | ||||||
| 13,773 | Ford Motor Co. | 154,120 | ||||||
| 4,836 | General Motors Co. | 168,921 | ||||||
| 887 | Goodyear Tire & Rubber Co. (The) | 31,010 | ||||||
| 616 | Harley-Davidson, Inc. | 33,276 | ||||||
|
| |||||||
| 499,718 | ||||||||
|
| |||||||
| Banks - 1.6% | ||||||||
| 35,046 | Bank of America Corp. | 850,216 | ||||||
| 2,857 | BB&T Corp. | 129,736 | ||||||
| 9,696 | Citigroup, Inc. | 648,468 | ||||||
| 1,784 | Citizens Financial Group, Inc. | 63,653 | ||||||
| 623 | Comerica, Inc. | 45,629 | ||||||
| 2,642 | Fifth Third Bancorp | 68,586 | ||||||
| 3,828 | Huntington Bancshares, Inc. | 51,755 | ||||||
| 12,511 | JPMorgan Chase & Co. | 1,143,505 | ||||||
| 3,860 | KeyCorp | 72,336 | ||||||
| 542 | M&T Bank Corp. | 87,777 | ||||||
| 1,213 | People’s United Financial, Inc. | 21,422 | ||||||
| 1,704 | PNC Financial Services Group, Inc. (The) | 212,778 | ||||||
| 4,233 | Regions Financial Corp. | 61,971 | ||||||
| 1,703 | SunTrust Banks, Inc. | 96,594 | ||||||
| 5,579 | US Bancorp | 289,662 | ||||||
| 15,838 | Wells Fargo & Co. | 877,584 | ||||||
| 714 | Zions Bancorp | 31,352 | ||||||
|
| |||||||
| 4,753,024 | ||||||||
|
| |||||||
| Capital Goods - 1.8% | ||||||||
| 2,104 | 3M Co. | 438,032 | ||||||
| 155 | Acuity Brands, Inc. | 31,508 | ||||||
| 335 | Allegion plc | 27,175 | ||||||
| 810 | AMETEK, Inc. | 49,062 | ||||||
| 1,552 | Arconic, Inc. | 35,153 | ||||||
| 1,977 | Boeing Co. (The) | 390,952 | ||||||
| 2,075 | Caterpillar, Inc. | 222,979 | ||||||
| 544 | Cummins, Inc. | 88,248 | ||||||
| 1,036 | Deere & Co. | 128,039 | ||||||
| 548 | Dover Corp. | 43,960 | ||||||
| 1,575 | Eaton Corp. plc | 122,582 | ||||||
| 2,270 | Emerson Electric Co. | 135,337 | ||||||
| 1,019 | Fastenal Co. | 44,357 | ||||||
| 458 | Flowserve Corp. | 21,265 | ||||||
| 492 | Fluor Corp. | 22,524 | ||||||
| 1,062 | Fortive Corp. | 67,278 | ||||||
| 542 | Fortune Brands Home & Security, Inc. | 35,360 | ||||||
| 999 | General Dynamics Corp. | 197,902 | ||||||
| 30,668 | General Electric Co. | 828,343 | ||||||
| 2,685 | Honeywell International, Inc. | 357,884 | ||||||
| 1,095 | Illinois Tool Works, Inc. | 156,859 | ||||||
| 902 | Ingersoll-Rand plc | 82,434 | ||||||
| 425 | Jacobs Engineering Group, Inc. | 23,116 | ||||||
| 3,304 | Johnson Controls International plc | 143,261 | ||||||
| 274 | L3 Technologies, Inc. | 45,780 | ||||||
| 877 | Lockheed Martin Corp. | 243,464 | ||||||
| 1,125 | Masco Corp. | 42,986 | ||||||
| 615 | Northrop Grumman Corp. | 157,877 | ||||||
| 1,237 | PACCAR, Inc. | 81,691 | ||||||
| 469 | Parker-Hannifin Corp. | 74,955 | ||||||
| 590 | Pentair plc | 39,259 | ||||||
| 522 | Quanta Services, Inc.(2) | 17,184 | ||||||
Shares or Principal Amount | Market Value(1) | |||||||
| COMMON STOCKS - 25.0% - (continued) | ||||||||
| Capital Goods - 1.8% - (continued) | ||||||||
| 1,025 | Raytheon Co. | $ | 165,517 | |||||
| 454 | Rockwell Automation, Inc. | 73,530 | ||||||
| 572 | Rockwell Collins, Inc. | 60,106 | ||||||
| 359 | Roper Technologies, Inc. | 83,119 | ||||||
| 204 | Snap-on, Inc. | 32,232 | ||||||
| 539 | Stanley Black & Decker, Inc. | 75,853 | ||||||
| 943 | Textron, Inc. | 44,415 | ||||||
| 172 | TransDigm Group, Inc. | 46,246 | ||||||
| 298 | United Rentals, Inc.(2) | 33,588 | ||||||
| 2,624 | United Technologies Corp. | 320,417 | ||||||
| 189 | WW Grainger, Inc. | 34,120 | ||||||
| 633 | Xylem, Inc. | 35,087 | ||||||
|
| |||||||
| 5,401,036 | ||||||||
|
| |||||||
| Commercial & Professional Services - 0.1% | ||||||||
| 304 | Cintas Corp. | 38,316 | ||||||
| 423 | Equifax, Inc. | 58,129 | ||||||
| 1,118 | IHS Markit Ltd.(2) | 49,237 | ||||||
| 1,183 | Nielsen Holdings plc | 45,735 | ||||||
| 810 | Republic Services, Inc. | 51,621 | ||||||
| 449 | Robert Half International, Inc. | 21,520 | ||||||
| 299 | Stericycle, Inc.(2) | 22,820 | ||||||
| 541 | Verisk Analytics, Inc.(2) | 45,644 | ||||||
| 1,431 | Waste Management, Inc. | 104,964 | ||||||
|
| |||||||
| 437,986 | ||||||||
|
| |||||||
| Consumer Durables & Apparel - 0.3% | ||||||||
| 990 | Coach, Inc. | 46,867 | ||||||
| 1,204 | DR Horton, Inc. | 41,622 | ||||||
| 404 | Garmin Ltd. | 20,616 | ||||||
| 1,282 | Hanesbrands, Inc. | 29,691 | ||||||
| 396 | Hasbro, Inc. | 44,158 | ||||||
| 466 | Leggett & Platt, Inc. | 24,479 | ||||||
| 716 | Lennar Corp., Class A | 38,177 | ||||||
| 1,203 | Mattel, Inc. | 25,901 | ||||||
| 549 | Michael Kors Holdings Ltd.(2) | 19,901 | ||||||
| 222 | Mohawk Industries, Inc.(2) | 53,655 | ||||||
| 1,701 | Newell Brands, Inc. | 91,208 | ||||||
| 4,667 | NIKE, Inc., Class B | 275,353 | ||||||
| 1,000 | PulteGroup, Inc. | 24,530 | ||||||
| 275 | PVH Corp. | 31,487 | ||||||
| 194 | Ralph Lauren Corp. | 14,317 | ||||||
| 650 | Under Armour, Inc., Class A(2) | 14,144 | ||||||
| 648 | Under Armour, Inc., Class C(2) | 13,064 | ||||||
| 1,128 | VF Corp. | 64,973 | ||||||
| 260 | Whirlpool Corp. | 49,821 | ||||||
|
| |||||||
| 923,964 | ||||||||
|
| |||||||
| Consumer Services - 0.5% | ||||||||
| 1,474 | Carnival Corp. | 96,650 | ||||||
| 101 | Chipotle Mexican Grill, Inc.(2) | 42,026 | ||||||
| 438 | Darden Restaurants, Inc. | 39,613 | ||||||
| 727 | H&R Block, Inc. | 22,472 | ||||||
| 722 | Hilton Worldwide Holdings, Inc. | 44,656 | ||||||
| 1,094 | Marriott International, Inc., Class A | 109,739 | ||||||
| 2,870 | McDonald’s Corp. | 439,569 | ||||||
| 591 | Royal Caribbean Cruises Ltd. | 64,555 | ||||||
| 5,100 | Starbucks Corp. | 297,381 | ||||||
| 367 | Wyndham Worldwide Corp. | 36,850 | ||||||
| 281 | Wynn Resorts Ltd. | 37,688 | ||||||
The accompanying Notes are an integral part of these financial statements.
| 2 |
|
| HIMCO VIT Portfolio Diversifier Fund |
Schedule of Investments – (continued)
June 30, 2017 (Unaudited)
Shares or Principal Amount | Market Value(1) | |||||||
| COMMON STOCKS - 25.0% - (continued) | ||||||||
| Consumer Services - 0.5% - (continued) | ||||||||
| 1,165 | Yum! Brands, Inc. | $ | 85,930 | |||||
|
| |||||||
| 1,317,129 | ||||||||
|
| |||||||
| Diversified Financials - 1.3% | ||||||||
| 199 | Affiliated Managers Group, Inc. | 33,006 | ||||||
| 2,644 | American Express Co. | 222,731 | ||||||
| 537 | Ameriprise Financial, Inc. | 68,355 | ||||||
| 3,662 | Bank of New York Mellon Corp. (The) | 186,835 | ||||||
| 6,689 | Berkshire Hathaway, Inc., Class B(2) | 1,132,916 | ||||||
| 427 | BlackRock, Inc. | 180,369 | ||||||
| 1,701 | Capital One Financial Corp. | 140,537 | ||||||
| 324 | CBOE Holdings, Inc. | 29,614 | ||||||
| 4,285 | Charles Schwab Corp. (The) | 184,084 | ||||||
| 1,197 | CME Group, Inc. | 149,912 | ||||||
| 1,339 | Discover Financial Services | 83,272 | ||||||
| 965 | E*TRADE Financial Corp.(2) | 36,699 | ||||||
| 1,206 | Franklin Resources, Inc. | 54,017 | ||||||
| 1,289 | Goldman Sachs Group, Inc. (The) | 286,029 | ||||||
| 2,085 | Intercontinental Exchange, Inc. | 137,443 | ||||||
| 1,433 | Invesco Ltd. | 50,427 | ||||||
| 1,137 | Leucadia National Corp. | 29,744 | ||||||
| 586 | Moody’s Corp. | 71,304 | ||||||
| 5,016 | Morgan Stanley | 223,513 | ||||||
| 401 | NASDAQ, Inc. | 28,667 | ||||||
| 1,003 | Navient Corp. | 16,700 | ||||||
| 760 | Northern Trust Corp. | 73,880 | ||||||
| 451 | Raymond James Financial, Inc. | 36,179 | ||||||
| 908 | S&P Global, Inc. | 132,559 | ||||||
| 1,245 | State Street Corp. | 111,714 | ||||||
| 2,712 | Synchrony Financial | 80,872 | ||||||
| 850 | T Rowe Price Group, Inc. | 63,078 | ||||||
|
| |||||||
| 3,844,456 | ||||||||
|
| |||||||
| Energy - 1.5% | ||||||||
| 1,973 | Anadarko Petroleum Corp. | 89,456 | ||||||
| 1,339 | Apache Corp. | 64,178 | ||||||
| 1,498 | Baker Hughes, Inc. | 81,656 | ||||||
| 1,639 | Cabot Oil & Gas Corp. | 41,106 | ||||||
| 2,675 | Chesapeake Energy Corp.(2) | 13,295 | ||||||
| 6,672 | Chevron Corp. | 696,090 | ||||||
| 334 | Cimarex Energy Co. | 31,399 | ||||||
| 522 | Concho Resources, Inc.(2) | 63,439 | ||||||
| 4,357 | ConocoPhillips | 191,534 | ||||||
| 1,851 | Devon Energy Corp. | 59,176 | ||||||
| 2,033 | EOG Resources, Inc. | 184,027 | ||||||
| 609 | EQT Corp. | 35,681 | ||||||
| 14,922 | Exxon Mobil Corp. | 1,204,653 | ||||||
| 3,056 | Halliburton Co. | 130,522 | ||||||
| 381 | Helmerich & Payne, Inc. | 20,703 | ||||||
| 952 | Hess Corp. | 41,764 | ||||||
| 6,761 | Kinder Morgan, Inc. | 129,541 | ||||||
| 2,993 | Marathon Oil Corp. | 35,467 | ||||||
| 1,827 | Marathon Petroleum Corp. | 95,607 | ||||||
| 571 | Murphy Oil Corp. | 14,635 | ||||||
| 1,338 | National Oilwell Varco, Inc. | 44,074 | ||||||
| 698 | Newfield Exploration Co.(2) | 19,865 | ||||||
| 1,603 | Noble Energy, Inc. | 45,365 | ||||||
| 2,693 | Occidental Petroleum Corp. | 161,230 | ||||||
| 1,337 | ONEOK, Inc. | 69,738 | ||||||
| 1,545 | Phillips 66 | 127,756 | ||||||
| 599 | Pioneer Natural Resources Co. | 95,588 | ||||||
Shares or Principal Amount | Market Value(1) | |||||||
| COMMON STOCKS - 25.0% - (continued) | ||||||||
| Energy - 1.5% - (continued) | ||||||||
| 663 | Range Resources Corp. | $ | 15,362 | |||||
| 4,893 | Schlumberger Ltd. | 322,155 | ||||||
| 1,643 | TechnipFMC plc(2) | 44,690 | ||||||
| 531 | Tesoro Corp. | 49,702 | ||||||
| 1,386 | Transocean Ltd.(2) | 11,407 | ||||||
| 1,575 | Valero Energy Corp. | 106,249 | ||||||
| 2,910 | Williams Cos., Inc. (The) | 88,115 | ||||||
|
| |||||||
| 4,425,225 | ||||||||
|
| |||||||
| Food & Staples Retailing - 0.5% | ||||||||
| 1,545 | Costco Wholesale Corp. | 247,092 | ||||||
| 3,588 | CVS Health Corp. | 288,691 | ||||||
| 3,214 | Kroger Co. (The) | 74,950 | ||||||
| 1,734 | Sysco Corp. | 87,272 | ||||||
| 5,202 | Wal-Mart Stores, Inc. | 393,687 | ||||||
| 3,007 | Walgreens Boots Allliance, Inc. | 235,478 | ||||||
| 1,125 | Whole Foods Market, Inc. | 47,374 | ||||||
|
| |||||||
| 1,374,544 | ||||||||
|
| |||||||
| Food, Beverage & Tobacco - 1.3% | ||||||||
| 6,802 | Altria Group, Inc. | 506,545 | ||||||
| 2,010 | Archer-Daniels-Midland Co. | 83,174 | ||||||
| 621 | Brown-Forman Corp., Class B | 30,181 | ||||||
| 675 | Campbell Soup Co. | 35,201 | ||||||
| 13,541 | Coca-Cola Co. (The) | 607,314 | ||||||
| 1,423 | Conagra Brands, Inc. | 50,886 | ||||||
| 604 | Constellation Brands, Inc., Class A | 117,013 | ||||||
| 647 | Dr Pepper Snapple Group, Inc. | 58,948 | ||||||
| 2,029 | General Mills, Inc. | 112,407 | ||||||
| 493 | Hershey Co. (The) | 52,933 | ||||||
| 950 | Hormel Foods Corp. | 32,405 | ||||||
| 410 | JM Smucker Co. (The) | 48,515 | ||||||
| 888 | Kellogg Co. | 61,680 | ||||||
| 2,101 | Kraft Heinz Co. (The) | 179,930 | ||||||
| 399 | McCormick & Co., Inc. | 38,907 | ||||||
| 650 | Molson Coors Brewing Co., Class B | 56,121 | ||||||
| 5,343 | Mondelez International, Inc., Class A | 230,764 | ||||||
| 1,420 | Monster Beverage Corp.(2) | 70,546 | ||||||
| 5,031 | PepsiCo, Inc. | 581,030 | ||||||
| 5,469 | Philip Morris International, Inc. | 642,334 | ||||||
| 2,914 | Reynolds American, Inc. | 189,527 | ||||||
| 1,015 | Tyson Foods, Inc., Class A | 63,569 | ||||||
|
| |||||||
| 3,849,930 | ||||||||
|
| |||||||
| Health Care Equipment & Services - 1.4% | ||||||||
| 6,111 | Abbott Laboratories | 297,056 | ||||||
| 1,168 | Aetna, Inc. | 177,337 | ||||||
| 266 | Align Technology, Inc.(2) | 39,932 | ||||||
| 584 | AmerisourceBergen Corp. | 55,205 | ||||||
| 933 | Anthem, Inc. | 175,525 | ||||||
| 1,718 | Baxter International, Inc. | 104,008 | ||||||
| 801 | Becton Dickinson and Co. | 156,283 | ||||||
| 4,822 | Boston Scientific Corp.(2) | 133,666 | ||||||
| 1,112 | Cardinal Health, Inc. | 86,647 | ||||||
| 607 | Centene Corp.(2) | 48,487 | ||||||
| 1,035 | Cerner Corp.(2) | 68,796 | ||||||
| 902 | Cigna Corp. | 150,986 | ||||||
| 172 | Cooper Cos., Inc. (The) | 41,180 | ||||||
| 255 | CR Bard, Inc. | 80,608 | ||||||
| 2,151 | Danaher Corp. | 181,523 | ||||||
| 547 | DaVita, Inc.(2) | 35,424 | ||||||
| 807 | DENTSPLY SIRONA, Inc. | 52,326 | ||||||
The accompanying Notes are an integral part of these financial statements.
| 3 |
|
| HIMCO VIT Portfolio Diversifier Fund |
Schedule of Investments – (continued)
June 30, 2017 (Unaudited)
Shares or Principal Amount | Market Value(1) | |||||||
| COMMON STOCKS - 25.0% - (continued) | ||||||||
| Health Care Equipment & Services - 1.4% - (continued) | ||||||||
| 739 | Edwards Lifesciences Corp.(2) | $ | 87,379 | |||||
| 413 | Envision Healthcare Corp.(2) | 25,883 | ||||||
| 2,090 | Express Scripts Holding Co.(2) | 133,426 | ||||||
| 1,008 | HCA Healthcare, Inc.(2) | 87,898 | ||||||
| 279 | Henry Schein, Inc.(2) | 51,063 | ||||||
| 986 | Hologic, Inc.(2) | 44,745 | ||||||
| 508 | Humana, Inc. | 122,235 | ||||||
| 310 | IDEXX Laboratories, Inc.(2) | 50,040 | ||||||
| 130 | Intuitive Surgical, Inc.(2) | 121,598 | ||||||
| 360 | Laboratory Corp. of America Holdings(2) | 55,490 | ||||||
| 743 | McKesson Corp. | 122,253 | ||||||
| 4,821 | Medtronic plc | 427,864 | ||||||
| 287 | Patterson Cos., Inc. | 13,475 | ||||||
| 482 | Quest Diagnostics, Inc. | 53,579 | ||||||
| 1,092 | Stryker Corp. | 151,548 | ||||||
| 3,394 | UnitedHealth Group, Inc. | 629,315 | ||||||
| 315 | Universal Health Services, Inc., Class B | 38,455 | ||||||
| 324 | Varian Medical Systems, Inc.(2) | 33,433 | ||||||
| 709 | Zimmer Biomet Holdings, Inc. | 91,036 | ||||||
|
| |||||||
| 4,225,704 | ||||||||
|
| |||||||
| Household & Personal Products - 0.5% | ||||||||
| 878 | Church & Dwight Co., Inc. | 45,551 | ||||||
| 454 | Clorox Co. (The) | 60,491 | ||||||
| 3,111 | Colgate-Palmolive Co. | 230,618 | ||||||
| 1,659 | Coty, Inc., Class A | 31,123 | ||||||
| 788 | Estee Lauder Cos., Inc. (The), Class A | 75,632 | ||||||
| 1,250 | Kimberly-Clark Corp. | 161,388 | ||||||
| 9,007 | Procter & Gamble Co. (The) | 784,960 | ||||||
|
| |||||||
| 1,389,763 | ||||||||
|
| |||||||
| Insurance - 0.7% | ||||||||
| 1,398 | Aflac, Inc. | 108,597 | ||||||
| 1,284 | Allstate Corp. (The) | 113,557 | ||||||
| 3,097 | American International Group, Inc. | 193,624 | ||||||
| 923 | Aon plc | 122,713 | ||||||
| 632 | Arthur J Gallagher & Co. | 36,182 | ||||||
| 193 | Assurant, Inc. | 20,012 | ||||||
| 1,644 | Chubb Ltd. | 239,005 | ||||||
| 528 | Cincinnati Financial Corp. | 38,254 | ||||||
| 145 | Everest Re Group Ltd. | 36,916 | ||||||
| 1,294 | Hartford Financial Services Group, Inc. (The)(3) | 68,026 | ||||||
| 791 | Lincoln National Corp. | 53,456 | ||||||
| 972 | Loews Corp. | 45,499 | ||||||
| 1,815 | Marsh & McLennan Cos., Inc. | 141,497 | ||||||
| 3,805 | MetLife, Inc. | 209,047 | ||||||
| 944 | Principal Financial Group, Inc. | 60,482 | ||||||
| 2,046 | Progressive Corp. (The) | 90,208 | ||||||
| 1,511 | Prudential Financial, Inc. | 163,400 | ||||||
| 383 | Torchmark Corp. | 29,299 | ||||||
| 984 | Travelers Cos., Inc. (The) | 124,505 | ||||||
| 805 | Unum Group | 37,537 | ||||||
| 448 | Willis Towers Watson PLC | 65,166 | ||||||
| 921 | XL Group Ltd. | 40,340 | ||||||
|
| |||||||
| 2,037,322 | ||||||||
|
| |||||||
| Materials - 0.7% | ||||||||
| 767 | Air Products & Chemicals, Inc. | 109,727 | ||||||
| 390 | Albemarle Corp. | 41,161 | ||||||
| 312 | Avery Dennison Corp. | 27,571 | ||||||
| 1,233 | Ball Corp. | 52,045 | ||||||
Shares or Principal Amount | Market Value(1) | |||||||
| COMMON STOCKS - 25.0% - (continued) | ||||||||
| Materials - 0.7% - (continued) | ||||||||
| 819 | CF Industries Holdings, Inc. | $ | 22,899 | |||||
| 3,958 | Dow Chemical Co. (The) | 249,631 | ||||||
| 514 | Eastman Chemical Co. | 43,171 | ||||||
| 919 | Ecolab, Inc. | 121,997 | ||||||
| 3,053 | EI du Pont de Nemours & Co. | 246,408 | ||||||
| 472 | FMC Corp. | 34,480 | ||||||
| 4,687 | Freeport-McMoRan, Inc.(2) | 56,291 | ||||||
| 278 | International Flavors & Fragrances, Inc. | 37,530 | ||||||
| 1,454 | International Paper Co. | 82,311 | ||||||
| 1,163 | LyondellBasell Industries N.V., Class A | 98,146 | ||||||
| 221 | Martin Marietta Materials, Inc. | 49,190 | ||||||
| 1,545 | Monsanto Co. | 182,866 | ||||||
| 1,236 | Mosaic Co. (The) | 28,218 | ||||||
| 1,878 | Newmont Mining Corp. | 60,828 | ||||||
| 1,124 | Nucor Corp. | 65,046 | ||||||
| 902 | PPG Industries, Inc. | 99,184 | ||||||
| 1,007 | Praxair, Inc. | 133,478 | ||||||
| 690 | Sealed Air Corp. | 30,884 | ||||||
| 285 | Sherwin-Williams Co. (The) | 100,024 | ||||||
| 465 | Vulcan Materials Co. | 58,906 | ||||||
| 884 | WestRock Co. | 50,087 | ||||||
|
| |||||||
| 2,082,079 | ||||||||
|
| |||||||
| Media - 0.8% | ||||||||
| 1,297 | CBS Corp., Class B | 82,722 | ||||||
| 760 | Charter Communications, Inc., Class A(2) | 256,006 | ||||||
| 16,666 | Comcast Corp., Class A | 648,641 | ||||||
| 542 | Discovery Communications, Inc., Class A(2) | 14,000 | ||||||
| 742 | Discovery Communications, Inc., Class C(2) | 18,706 | ||||||
| 801 | DISH Network Corp., Class A(2) | 50,271 | ||||||
| 1,391 | Interpublic Group of Cos., Inc. (The) | 34,218 | ||||||
| 1,341 | News Corp., Class A | 18,372 | ||||||
| 421 | News Corp., Class B | 5,957 | ||||||
| 820 | Omnicom Group, Inc. | 67,978 | ||||||
| 338 | Scripps Networks Interactive, Inc., Class A | 23,089 | ||||||
| 2,731 | Time Warner, Inc. | 274,220 | ||||||
| 3,706 | Twenty-First Century Fox, Inc., Class A | 105,028 | ||||||
| 1,715 | Twenty-First Century Fox, Inc., Class B | 47,797 | ||||||
| 1,241 | Viacom, Inc., Class B | 41,660 | ||||||
| 5,123 | Walt Disney Co. (The) | 544,319 | ||||||
|
| |||||||
| 2,232,984 | ||||||||
|
| |||||||
| Pharmaceuticals, Biotechnology & Life Sciences - 2.2% | ||||||||
| 5,605 | AbbVie, Inc. | 406,418 | ||||||
| 1,135 | Agilent Technologies, Inc. | 67,317 | ||||||
| 791 | Alexion Pharmaceuticals, Inc.(2) | 96,241 | ||||||
| 1,183 | Allergan plc | 287,575 | ||||||
| 2,591 | Amgen, Inc. | 446,248 | ||||||
| 752 | Biogen, Inc.(2) | 204,063 | ||||||
| 5,801 | Bristol-Myers Squibb Co. | 323,232 | ||||||
| 2,750 | Celgene Corp.(2) | 357,142 | ||||||
| 3,419 | Eli Lilly & Co. | 281,384 | ||||||
| 4,602 | Gilead Sciences, Inc. | 325,730 | ||||||
| 514 | Illumina, Inc.(2) | 89,189 | ||||||
| 599 | Incyte Corp.(2) | 75,420 | ||||||
| 9,486 | Johnson & Johnson | 1,254,903 | ||||||
| 349 | Mallinckrodt plc(2) | 15,639 | ||||||
| 9,632 | Merck & Co., Inc. | 617,315 | ||||||
| 91 | Mettler-Toledo International, Inc.(2) | 53,557 | ||||||
| 1,623 | Mylan N.V.(2) | 63,005 | ||||||
| 388 | PerkinElmer, Inc. | 26,438 | ||||||
The accompanying Notes are an integral part of these financial statements.
| 4 |
|
| HIMCO VIT Portfolio Diversifier Fund |
Schedule of Investments – (continued)
June 30, 2017 (Unaudited)
Shares or Principal Amount | Market Value(1) | |||||||
| COMMON STOCKS - 25.0% - (continued) | ||||||||
| Pharmaceuticals, Biotechnology & Life Sciences - 2.2% - (continued) | ||||||||
| 504 | Perrigo Co. plc | $ | 38,062 | |||||
| 21,016 | Pfizer, Inc. | 705,927 | ||||||
| 268 | Regeneron Pharmaceuticals, Inc.(2) | 131,625 | ||||||
| 1,378 | Thermo Fisher Scientific, Inc. | 240,420 | ||||||
| 877 | Vertex Pharmaceuticals, Inc.(2) | 113,019 | ||||||
| 282 | Waters Corp.(2) | 51,843 | ||||||
| 1,728 | Zoetis, Inc. | 107,793 | ||||||
|
| |||||||
| 6,379,505 | ||||||||
|
| |||||||
| Real Estate - 0.7% | ||||||||
| 321 | Alexandria Real Estate Equities, Inc., REIT | 38,671 | ||||||
| 1,497 | American Tower Corp., REIT | 198,083 | ||||||
| 551 | Apartment Investment & Management Co., Class A, REIT | 23,677 | ||||||
| 485 | AvalonBay Communities, Inc., REIT | 93,202 | ||||||
| 542 | Boston Properties, Inc., REIT | 66,677 | ||||||
| 1,059 | CBRE Group, Inc., Class A, REIT(2) | 38,548 | ||||||
| 1,289 | Crown Castle International Corp., REIT | 129,132 | ||||||
| 563 | Digital Realty Trust, Inc., REIT | 63,591 | ||||||
| 274 | Equinix, Inc., REIT | 117,590 | ||||||
| 1,293 | Equity Residential, REIT | 85,118 | ||||||
| 231 | Essex Property Trust, Inc., REIT | 59,429 | ||||||
| 442 | Extra Space Storage, Inc., REIT | 34,476 | ||||||
| 254 | Federal Realty Investment Trust, REIT | 32,103 | ||||||
| 2,051 | GGP, Inc., REIT | 48,322 | ||||||
| 1,650 | HCP, Inc., REIT | 52,734 | ||||||
| 2,605 | Host Hotels & Resorts, Inc., REIT | 47,593 | ||||||
| 865 | Iron Mountain, Inc., REIT | 29,721 | ||||||
| 1,495 | Kimco Realty Corp., REIT | 27,433 | ||||||
| 419 | Macerich Co. (The), REIT | 24,327 | ||||||
| 400 | Mid-America Apartment Communities, Inc., REIT | 42,152 | ||||||
| 1,868 | Prologis, Inc., REIT | 109,540 | ||||||
| 526 | Public Storage, REIT | 109,687 | ||||||
| 962 | Realty Income Corp., REIT | 53,083 | ||||||
| 515 | Regency Centers Corp., REIT | 32,260 | ||||||
| 1,099 | Simon Property Group, Inc., REIT | 177,774 | ||||||
| 359 | SL Green Realty Corp., REIT | 37,982 | ||||||
| 942 | UDR, Inc., REIT | 36,710 | ||||||
| 1,250 | Ventas, Inc., REIT | 86,850 | ||||||
| 607 | Vornado Realty Trust, REIT | 56,997 | ||||||
| 1,289 | Welltower, Inc., REIT | 96,482 | ||||||
| 2,646 | Weyerhaeuser Co., REIT | 88,641 | ||||||
|
| |||||||
| 2,138,585 | ||||||||
|
| |||||||
| Retailing - 1.4% | ||||||||
| 260 | Advance Auto Parts, Inc. | 30,313 | ||||||
| 1,397 | Amazon.com, Inc.(2) | 1,352,296 | ||||||
| 232 | AutoNation, Inc.(2) | 9,781 | ||||||
| 99 | AutoZone, Inc.(2) | 56,476 | ||||||
| 511 | Bed Bath & Beyond, Inc. | 15,534 | ||||||
| 934 | Best Buy Co., Inc. | 53,546 | ||||||
| 652 | CarMax, Inc.(2) | 41,115 | ||||||
| 888 | Dollar General Corp. | 64,016 | ||||||
| 834 | Dollar Tree, Inc.(2) | 58,313 | ||||||
| 428 | Expedia, Inc. | 63,751 | ||||||
| 462 | Foot Locker, Inc. | 22,767 | ||||||
| 775 | Gap, Inc. (The) | 17,042 | ||||||
| 519 | Genuine Parts Co. | 48,143 | ||||||
| 4,210 | Home Depot, Inc. (The) | 645,814 | ||||||
Shares or Principal Amount | Market Value(1) | |||||||
| COMMON STOCKS - 25.0% - (continued) | ||||||||
| Retailing - 1.4% - (continued) | ||||||||
| 600 | Kohl’s Corp. | $ | 23,202 | |||||
| 849 | L Brands, Inc. | 45,753 | ||||||
| 1,086 | LKQ Corp.(2) | 35,784 | ||||||
| 3,022 | Lowe’s Cos., Inc. | 234,296 | ||||||
| 1,068 | Macy’s, Inc. | 24,820 | ||||||
| 1,518 | Netflix, Inc.(2) | 226,804 | ||||||
| 392 | Nordstrom, Inc. | 18,749 | ||||||
| 320 | O’Reilly Automotive, Inc.(2) | 69,997 | ||||||
| 173 | Priceline Group, Inc. (The)(2) | 323,600 | ||||||
| 1,380 | Ross Stores, Inc. | 79,667 | ||||||
| 241 | Signet Jewelers Ltd. | 15,241 | ||||||
| 2,300 | Staples, Inc. | 23,161 | ||||||
| 1,943 | Target Corp. | 101,600 | ||||||
| 378 | Tiffany & Co. | 35,483 | ||||||
| 2,265 | TJX Cos., Inc. (The) | 163,465 | ||||||
| 453 | Tractor Supply Co. | 24,557 | ||||||
| 389 | TripAdvisor, Inc.(2) | 14,860 | ||||||
| 205 | Ulta Salon Cosmetics & Fragrance, Inc.(2) | 58,905 | ||||||
|
| |||||||
| 3,998,851 | ||||||||
|
| |||||||
| Semiconductors & Semiconductor Equipment - 0.9% | ||||||||
| 2,729 | Advanced Micro Devices, Inc.(2) | 34,058 | ||||||
| 1,292 | Analog Devices, Inc. | 100,518 | ||||||
| 3,784 | Applied Materials, Inc. | 156,317 | ||||||
| 1,413 | Broadcom Ltd. | 329,300 | ||||||
| 16,583 | Intel Corp. | 559,510 | ||||||
| 552 | KLA-Tencor Corp. | 50,514 | ||||||
| 568 | Lam Research Corp. | 80,332 | ||||||
| 808 | Microchip Technology, Inc. | 62,361 | ||||||
| 3,662 | Micron Technology, Inc.(2) | 109,347 | ||||||
| 2,095 | NVIDIA Corp. | 302,853 | ||||||
| 448 | Qorvo, Inc.(2) | 28,367 | ||||||
| 5,203 | QUALCOMM, Inc. | 287,310 | ||||||
| 650 | Skyworks Solutions, Inc. | 62,368 | ||||||
| 3,509 | Texas Instruments, Inc. | 269,947 | ||||||
| 874 | Xilinx, Inc. | 56,216 | ||||||
|
| |||||||
| 2,489,318 | ||||||||
|
| |||||||
| Software & Services - 3.3% | ||||||||
| 2,184 | Accenture plc, Class A | 270,117 | ||||||
| 2,442 | Activision Blizzard, Inc. | 140,586 | ||||||
| 1,742 | Adobe Systems, Inc.(2) | 246,388 | ||||||
| 608 | Akamai Technologies, Inc.(2) | 30,284 | ||||||
| 196 | Alliance Data Systems Corp. | 50,311 | ||||||
| 1,048 | Alphabet, Inc., Class A(2) | 974,305 | ||||||
| 1,051 | Alphabet, Inc., Class C(2) | 955,075 | ||||||
| 301 | ANSYS, Inc.(2) | 36,626 | ||||||
| 683 | Autodesk, Inc.(2) | 68,860 | ||||||
| 1,576 | Automatic Data Processing, Inc. | 161,477 | ||||||
| 1,101 | CA, Inc. | 37,951 | ||||||
| 532 | Citrix Systems, Inc.(2) | 42,337 | ||||||
| 2,074 | Cognizant Technology Solutions Corp., Class A | 137,714 | ||||||
| 510 | CSRA, Inc. | 16,193 | ||||||
| 997 | DXC Technology Co. | 76,490 | ||||||
| 3,545 | eBay, Inc.(2) | 123,791 | ||||||
| 1,092 | Electronic Arts, Inc.(2) | 115,446 | ||||||
| 8,324 | Facebook, Inc., Class A(2) | 1,256,758 | ||||||
| 1,164 | Fidelity National Information Services, Inc. | 99,406 | ||||||
| 748 | Fiserv, Inc.(2) | 91,510 | ||||||
| 318 | Gartner, Inc.(2) | 39,276 | ||||||
The accompanying Notes are an integral part of these financial statements.
| 5 |
|
| HIMCO VIT Portfolio Diversifier Fund |
Schedule of Investments – (continued)
June 30, 2017 (Unaudited)
Shares or Principal Amount | Market Value(1) | |||||||
| COMMON STOCKS - 25.0% - (continued) | ||||||||
| Software & Services - 3.3% - (continued) | ||||||||
| 537 | Global Payments, Inc. | $ | 48,502 | |||||
| 3,011 | International Business Machines Corp. | 463,182 | ||||||
| 857 | Intuit, Inc. | 113,818 | ||||||
| 3,303 | MasterCard, Inc., Class A | 401,149 | ||||||
| 27,188 | Microsoft Corp. | 1,874,069 | ||||||
| 10,578 | Oracle Corp. | 530,381 | ||||||
| 1,126 | Paychex, Inc. | 64,114 | ||||||
| 3,934 | PayPal Holdings, Inc.(2) | 211,138 | ||||||
| 626 | Red Hat, Inc.(2) | 59,939 | ||||||
| 2,355 | salesforce.com, Inc.(2) | 203,943 | ||||||
| 2,142 | Symantec Corp. | 60,511 | ||||||
| 529 | Synopsys, Inc.(2) | 38,580 | ||||||
| 583 | Total System Services, Inc. | 33,960 | ||||||
| 311 | VeriSign, Inc.(2) | 28,911 | ||||||
| 6,502 | Visa, Inc., Class A | 609,758 | ||||||
| 1,660 | Western Union Co. (The) | 31,623 | ||||||
|
| |||||||
| 9,744,479 | ||||||||
|
| |||||||
| Technology Hardware & Equipment - 1.4% | ||||||||
| 1,076 | Amphenol Corp., Class A | 79,430 | ||||||
| 18,361 | Apple, Inc. | 2,644,351 | ||||||
| 17,608 | Cisco Systems, Inc. | 551,130 | ||||||
| 3,241 | Corning, Inc. | 97,392 | ||||||
| 228 | F5 Networks, Inc.(2) | 28,970 | ||||||
| 479 | FLIR Systems, Inc. | 16,602 | ||||||
| 429 | Harris Corp. | 46,795 | ||||||
| 5,863 | Hewlett Packard Enterprise Co. | 97,267 | ||||||
| 5,928 | HP, Inc. | 103,621 | ||||||
| 1,346 | Juniper Networks, Inc. | 37,527 | ||||||
| 576 | Motorola Solutions, Inc. | 49,962 | ||||||
| 952 | NetApp, Inc. | 38,128 | ||||||
| 1,046 | Seagate Technology plc | 40,533 | ||||||
| 1,250 | TE Connectivity Ltd. | 98,350 | ||||||
| 1,026 | Western Digital Corp. | 90,904 | ||||||
| 749 | Xerox Corp. | 21,519 | ||||||
|
| |||||||
| 4,042,481 | ||||||||
|
| |||||||
| Telecommunication Services - 0.5% | ||||||||
| 21,650 | AT&T, Inc. | 816,854 | ||||||
| 1,933 | CenturyLink, Inc. | 46,160 | ||||||
| 1,031 | Level 3 Communications, Inc.(2) | 61,138 | ||||||
| 14,366 | Verizon Communications, Inc. | 641,586 | ||||||
|
| |||||||
| 1,565,738 | ||||||||
|
| |||||||
| Transportation - 0.6% | ||||||||
| 434 | Alaska Air Group, Inc. | 38,956 | ||||||
| 1,735 | American Airlines Group, Inc. | 87,305 | ||||||
| 496 | CH Robinson Worldwide, Inc. | 34,065 | ||||||
| 3,249 | CSX Corp. | 177,266 | ||||||
| 2,592 | Delta Air Lines, Inc. | 139,294 | ||||||
| 633 | Expeditors International of Washington, Inc. | 35,752 | ||||||
| 866 | FedEx Corp. | 188,208 | ||||||
| 302 | JB Hunt Transport Services, Inc. | 27,597 | ||||||
| 374 | Kansas City Southern | 39,139 | ||||||
| 1,020 | Norfolk Southern Corp. | 124,134 | ||||||
| 2,129 | Southwest Airlines Co. | 132,296 | ||||||
| 2,843 | Union Pacific Corp. | 309,631 | ||||||
| 992 | United Continental Holdings, Inc.(2) | 74,648 | ||||||
| 2,426 | United Parcel Service, Inc., Class B | 268,291 | ||||||
|
| |||||||
| 1,676,582 | ||||||||
|
| |||||||
Shares or Principal Amount | Market Value(1) | |||||||
| COMMON STOCKS - 25.0% - (continued) | ||||||||
| Utilities - 0.8% | ||||||||
| 2,325 | AES Corp. | $ | 25,831 | |||||
| 800 | Alliant Energy Corp. | 32,136 | ||||||
| 854 | Ameren Corp. | 46,688 | ||||||
| 1,732 | American Electric Power Co., Inc. | 120,322 | ||||||
| 628 | American Water Works Co., Inc. | 48,953 | ||||||
| 1,518 | CenterPoint Energy, Inc. | 41,563 | ||||||
| 988 | CMS Energy Corp. | 45,695 | ||||||
| 1,075 | Consolidated Edison, Inc. | 86,882 | ||||||
| 2,215 | Dominion Energy, Inc. | 169,736 | ||||||
| 632 | DTE Energy Co. | 66,859 | ||||||
| 2,465 | Duke Energy Corp. | 206,049 | ||||||
| 1,147 | Edison International | 89,684 | ||||||
| 632 | Entergy Corp. | 48,519 | ||||||
| 1,116 | Eversource Energy | 67,752 | ||||||
| 3,261 | Exelon Corp. | 117,624 | ||||||
| 1,563 | FirstEnergy Corp. | 45,577 | ||||||
| 1,649 | NextEra Energy, Inc. | 231,074 | ||||||
| 1,136 | NiSource, Inc. | 28,809 | ||||||
| 1,110 | NRG Energy, Inc. | 19,114 | ||||||
| 1,798 | PG&E Corp. | 119,333 | ||||||
| 393 | Pinnacle West Capital Corp. | 33,468 | ||||||
| 2,406 | PPL Corp. | 93,016 | ||||||
| 1,781 | Public Service Enterprise Group, Inc. | 76,601 | ||||||
| 502 | SCANA Corp. | 33,639 | ||||||
| 883 | Sempra Energy | 99,558 | ||||||
| 3,503 | Southern Co. (The) | 167,724 | ||||||
| 1,111 | WEC Energy Group, Inc. | 68,193 | ||||||
| 1,788 | Xcel Energy, Inc. | 82,033 | ||||||
|
| |||||||
| 2,312,432 | ||||||||
|
| |||||||
Total Common Stocks | 73,142,835 | |||||||
|
| |||||||
| EXCHANGE-TRADED FUND - 0.2% | ||||||||
| Diversified Financial Services - 0.2% | ||||||||
| 3,070 | Vanguard S&P 500 ETF | 681,724 | ||||||
|
| |||||||
Total Exchange-Traded Funds | 681,724 | |||||||
|
| |||||||
| ASSET & COMMERCIAL MORTGAGE BACKED SECURITIES - 0.4% | ||||||||
Banc of America Commercial Mortgage Trust, | ||||||||
Series 2007-5, Class A4 | ||||||||
| $ | 4,660 | 5.49%, 02/10/2051 | 4,666 | |||||
Bear Stearns Commercial Mortgage Securities Trust, | ||||||||
Series 2007-PW18, Class A4 | ||||||||
| 17,668 | 5.70%, 06/11/2050 | 17,753 | ||||||
Chase Issuance Trust, | ||||||||
Series 2013-A1, Class A1 | ||||||||
| 100,000 | 1.30%, 02/18/2020 | 99,903 | ||||||
Citibank Credit Card Issuance Trust, | ||||||||
Series 2007-A8, Class A8, | ||||||||
| 100,000 | 5.65%, 09/20/2019 | 100,883 | ||||||
Citigroup Commercial Mortgage Trust | ||||||||
Series 2008-C7, Class A4 | ||||||||
| 11,924 | 6.39%, 12/10/2049(4) | 11,945 | ||||||
The accompanying Notes are an integral part of these financial statements.
| 6 |
|
| HIMCO VIT Portfolio Diversifier Fund |
Schedule of Investments – (continued)
June 30, 2017 (Unaudited)
Shares or Principal Amount | Market Value(1) | |||||||
| ASSET & COMMERCIAL MORTGAGE BACKED SECURITIES - 0.4% - (continued) | ||||||||
Citigroup Commercial Mortgage Trust - (continued) | ||||||||
Series 2014-GC23, Class A4 | ||||||||
| $ | 50,000 | 3.62%, 07/10/2047 | $ | 52,045 | ||||
Citigroup/Deutsche Bank Commercial Mortgage Trust, | ||||||||
Series 2007-CD5, Class A4 | ||||||||
| 2,318 | 5.89%, 11/15/2044(4) | 2,320 | ||||||
COMM Mortgage Trust | ||||||||
Series 2013-CR9, Class A4, | ||||||||
| 35,000 | 4.37%, 07/10/2045(4) | 37,904 | ||||||
Series 2014-UBS5, Class A4 | ||||||||
| 45,000 | 3.84%, 09/10/2047 | 47,235 | ||||||
Series 2014-UBS6, Class A5 | ||||||||
| 50,000 | 3.64%, 12/10/2047 | 51,671 | ||||||
Series 2015-LC23, Class A4 | ||||||||
| 35,000 | 3.77%, 10/10/2048 | 36,615 | ||||||
Commercial Mortgage Pass-Through Certificates, | ||||||||
| 30,000 | 3.15%, 08/15/2045 | 30,829 | ||||||
Commercial Mortgage Trust | ||||||||
Series 2007-GG11, Class A4 | ||||||||
| 1,698 | 5.74%, 12/10/2049 | 1,696 | ||||||
Series 2013-LC6, Class A4 | ||||||||
| 15,000 | 2.94%, 01/10/2046 | 15,161 | ||||||
CSAIL Commercial Mortgage Trust, | ||||||||
| 35,000 | 3.81%, 11/15/2048 | 36,579 | ||||||
GS Mortgage Securities Corp. II, | ||||||||
| 10,000 | 2.94%, 02/10/2046 | 10,142 | ||||||
GS Mortgage Securities Trust | ||||||||
Series 2012-GC6, Class A3 | ||||||||
| 19,925 | 3.48%, 01/10/2045 | 20,786 | ||||||
Series 2012-GCJ7, Class A4 | ||||||||
| 49,095 | 3.38%, 05/10/2045 | 51,044 | ||||||
Series 2013-GC12, Class A4 | ||||||||
| 40,000 | 3.14%, 06/10/2046 | 40,848 | ||||||
Series 2013-GC14, Class A5 | ||||||||
| 35,000 | 4.24%, 08/10/2046 | 37,791 | ||||||
Series 2013-GC16, Class A4 | ||||||||
| 40,000 | 4.27%, 11/10/2046 | 43,233 | ||||||
Series 2014-GC18, Class A4 | ||||||||
| 40,000 | 4.07%, 01/10/2047 | 42,644 | ||||||
Series 2015-GS1, Class A3 | ||||||||
| 30,000 | 3.73%, 11/10/2048 | 31,344 | ||||||
JP Morgan Chase Commercial Mortgage Securities Trust, | ||||||||
| 8,422 | 4.17%, 08/15/2046 | 8,967 | ||||||
JPMBB Commercial Mortgage Securities Trust, | ||||||||
| 40,000 | 3.80%, 09/15/2047 | 41,863 | ||||||
LB-UBS Commercial Mortgage Trust, | ||||||||
| 9,379 | 5.87%, 09/15/2045(4) | 9,438 | ||||||
ML-CFC Commercial Mortgage Trust, | ||||||||
| 18,717 | 5.70%, 09/12/2049 | 18,731 | ||||||
Shares or Principal Amount | Market Value(1) | |||||||
| ASSET & COMMERCIAL MORTGAGE BACKED SECURITIES - 0.4% - (continued) | ||||||||
Morgan Stanley Bank of America Merrill Lynch Trust | ||||||||
Series 2014-C15, Class A4 | ||||||||
| $ | 40,000 | 4.05%, 04/15/2047 | $ | 42,668 | ||||
Series 2014-C16, Class A5 | ||||||||
| 50,000 | 3.89%, 06/15/2047 | 52,891 | ||||||
Series 2015-C22, Class A4 | ||||||||
| 30,000 | 3.31%, 04/15/2048 | 30,562 | ||||||
Series 2015-C27, Class A4 | ||||||||
| 30,000 | 3.75%, 12/15/2047 | 31,412 | ||||||
Morgan Stanley Capital I Trust, | ||||||||
| 7,455 | 5.81%, 12/12/2049 | 7,477 | ||||||
Wachovia Bank Commercial Mortgage Trust, | ||||||||
| 2,505 | 5.68%, 05/15/2046 | 2,503 | ||||||
WF-RBS Commercial Mortgage Trust, | ||||||||
| 40,000 | 2.88%, 12/15/2045 | 40,328 | ||||||
|
| |||||||
Total Asset & Commercial Mortgage Backed Securities | 1,111,877 | |||||||
|
| |||||||
| CORPORATE BONDS - 14.3% | ||||||||
| Advertising - 0.0% | ||||||||
Omnicom Group, Inc. | ||||||||
| 40,000 | 3.63%, 05/01/2022 | 41,750 | ||||||
|
| |||||||
| Aerospace/Defense - 0.3% | ||||||||
Boeing Co. (The) | ||||||||
| 230,000 | 4.88%, 02/15/2020 | 247,579 | ||||||
| 35,000 | 6.13%, 02/15/2033 | 45,799 | ||||||
General Dynamics Corp. | ||||||||
| 15,000 | 3.88%, 07/15/2021 | 15,954 | ||||||
Lockheed Martin Corp. | ||||||||
| 140,000 | 4.25%, 11/15/2019 | 147,427 | ||||||
| 75,000 | 4.85%, 09/15/2041 | 84,932 | ||||||
Northrop Grumman Corp. | ||||||||
| 40,000 | 4.75%, 06/01/2043 | 45,067 | ||||||
| 20,000 | 5.05%, 08/01/2019 | 21,252 | ||||||
Raytheon Co. | ||||||||
| 95,000 | 3.13%, 10/15/2020 | 98,427 | ||||||
United Technologies Corp. | ||||||||
| 65,000 | 4.50%, 04/15/2020 | 69,503 | ||||||
| 100,000 | 4.50%, 06/01/2042 | 109,195 | ||||||
|
| |||||||
| 885,135 | ||||||||
|
| |||||||
| Agriculture - 0.2% | ||||||||
Altria Group, Inc. | ||||||||
| 300,000 | 4.75%, 05/05/2021 | 327,212 | ||||||
Archer-Daniels-Midland Co. | ||||||||
| 33,000 | 4.02%, 04/16/2043 | 34,260 | ||||||
Philip Morris International, Inc. | ||||||||
| 105,000 | 4.50%, 03/26/2020 | 112,002 | ||||||
| 75,000 | 4.50%, 03/20/2042 | 79,780 | ||||||
Reynolds American, Inc. | ||||||||
| 90,000 | 4.45%, 06/12/2025 | 96,422 | ||||||
|
| |||||||
| 649,676 | ||||||||
|
| |||||||
The accompanying Notes are an integral part of these financial statements.
| 7 |
|
| HIMCO VIT Portfolio Diversifier Fund |
Schedule of Investments – (continued)
June 30, 2017 (Unaudited)
Shares or Principal Amount | Market Value(1) | |||||||
| CORPORATE BONDS - 14.3% - (continued) | ||||||||
| Auto Manufacturers - 0.3% | ||||||||
Daimler Finance North America LLC | ||||||||
| $ | 18,000 | 8.50%, 01/18/2031 | $ | 27,048 | ||||
Ford Motor Co. | ||||||||
| 175,000 | 7.45%, 07/16/2031 | 221,259 | ||||||
General Motors Co. | ||||||||
| 100,000 | 3.50%, 10/02/2018 | 101,756 | ||||||
| 120,000 | 6.25%, 10/02/2043 | 133,290 | ||||||
Toyota Motor Credit Corp. MTN | ||||||||
| 70,000 | 2.00%, 10/24/2018 | 70,380 | ||||||
| 190,000 | 3.40%, 09/15/2021 | 198,552 | ||||||
|
| |||||||
| 752,285 | ||||||||
|
| |||||||
| Beverages - 0.4% | ||||||||
Anheuser-Busch InBev Finance, Inc. | ||||||||
| 395,000 | 3.65%, 02/01/2026 | 406,957 | ||||||
Anheuser-Busch InBev Worldwide, Inc. |
| |||||||
| 110,000 | 3.75%, 07/15/2042 | 106,464 | ||||||
| 125,000 | 5.38%, 01/15/2020 | 135,347 | ||||||
Coca-Cola Co. (The) | ||||||||
| 210,000 | 3.15%, 11/15/2020 | 218,192 | ||||||
Diageo Capital plc | ||||||||
| 25,000 | 3.88%, 04/29/2043 | 25,035 | ||||||
Molson Coors Brewing Co. | ||||||||
| 65,000 | 4.20%, 07/15/2046 | 64,101 | ||||||
PepsiCo, Inc. |
| |||||||
| 60,000 | 3.13%, 11/01/2020 | 62,147 | ||||||
| 85,000 | 5.50%, 01/15/2040 | 105,970 | ||||||
|
| |||||||
| 1,124,213 | ||||||||
|
| |||||||
| Biotechnology - 0.2% | ||||||||
Amgen, Inc. |
| |||||||
| 105,000 | 3.88%, 11/15/2021 | 110,675 | ||||||
| 25,000 | 4.40%, 05/01/2045 | 25,679 | ||||||
| 68,000 | 4.66%, 06/15/2051 | 72,022 | ||||||
Celgene Corp. | ||||||||
| 160,000 | 3.25%, 08/15/2022 | 164,483 | ||||||
Gilead Sciences, Inc. |
| |||||||
| 230,000 | 3.70%, 04/01/2024 | 239,105 | ||||||
| 20,000 | 4.40%, 12/01/2021 | 21,576 | ||||||
| 45,000 | 4.80%, 04/01/2044 | 49,037 | ||||||
|
| |||||||
| 682,577 | ||||||||
|
| |||||||
| Chemicals - 0.3% | ||||||||
Dow Chemical Co. (The) |
| |||||||
| 200,000 | 4.13%, 11/15/2021 | 212,472 | ||||||
| 50,000 | 4.38%, 11/15/2042 | 51,643 | ||||||
Eastman Chemical Co. | ||||||||
| 68,000 | 3.80%, 03/15/2025 | 69,978 | ||||||
Ecolab, Inc. | ||||||||
| 45,000 | 4.35%, 12/08/2021 | 48,936 | ||||||
EI du Pont de Nemours & Co. | ||||||||
| 20,000 | 5.60%, 12/15/2036 | 23,868 | ||||||
LYB International Finance BV |
| |||||||
| 130,000 | 4.00%, 07/15/2023 | 137,733 | ||||||
| 30,000 | 4.88%, 03/15/2044 | 31,768 | ||||||
Monsanto Co. | ||||||||
| 80,000 | 4.40%, 07/15/2044 | 81,365 | ||||||
Potash Corp. of Saskatchewan, Inc. | ||||||||
| 35,000 | 6.50%, 05/15/2019 | 37,661 | ||||||
PPG Industries, Inc. | ||||||||
| 20,000 | 3.60%, 11/15/2020 | 20,850 | ||||||
Shares or Principal Amount | Market Value(1) | |||||||
| CORPORATE BONDS - 14.3% - (continued) | ||||||||
| Chemicals - 0.3% - (continued) | ||||||||
Praxair, Inc. | ||||||||
| $ | 55,000 | 2.45%, 02/15/2022 | $ | 55,330 | ||||
|
| |||||||
| 771,604 | ||||||||
|
| |||||||
| Commercial Banks - 3.1% | ||||||||
Bank of America Corp. | ||||||||
| 250,000 | 3.30%, 01/11/2023 | 254,925 | ||||||
| 445,000 | 5.00%, 05/13/2021 | 485,552 | ||||||
| 115,000 | 5.88%, 02/07/2042 | 144,115 | ||||||
Bank of New York Mellon Corp. (The) | ||||||||
| 150,000 | 3.55%, 09/23/2021 | 156,666 | ||||||
Bank of Nova Scotia | ||||||||
| 95,000 | 4.38%, 01/13/2021 | 101,505 | ||||||
Barclays PLC | ||||||||
| 270,000 | 2.88%, 06/08/2020 | 272,674 | ||||||
BB&T Corp. | ||||||||
| 130,000 | 5.25%, 11/01/2019 | 138,951 | ||||||
Capital One Financial Corp. | ||||||||
| 140,000 | 4.75%, 07/15/2021 | 151,048 | ||||||
Citigroup, Inc. | ||||||||
| 210,000 | 2.65%, 10/26/2020 | 212,009 | ||||||
| 275,000 | 6.63%, 06/15/2032 | 343,799 | ||||||
Cooperatieve Rabobank UA | ||||||||
| 195,000 | 4.50%, 01/11/2021 | 209,583 | ||||||
| 65,000 | 5.25%, 05/24/2041 | 79,356 | ||||||
Credit Suisse | ||||||||
| 650,000 | 5.30%, 08/13/2019 | 694,271 | ||||||
Deutsche Bank AG | ||||||||
| 70,000 | 3.70%, 05/30/2024 | 69,986 | ||||||
Fifth Third Bancorp | ||||||||
| 100,000 | 3.50%, 03/15/2022 | 103,286 | ||||||
Goldman Sachs Group, Inc. (The) | ||||||||
| 525,000 | 3.85%, 07/08/2024 | 544,905 | ||||||
| 89,000 | 6.25%, 02/01/2041 | 116,260 | ||||||
HSBC Holdings plc | ||||||||
| 650,000 | 5.10%, 04/05/2021 | 706,682 | ||||||
HSBC USA, Inc. | ||||||||
| 110,000 | 3.50%, 06/23/2024 | 113,324 | ||||||
JPMorgan Chase & Co. | ||||||||
| 455,000 | 4.95%, 03/25/2020 | 487,978 | ||||||
| 220,000 | 5.50%, 10/15/2040 | 268,576 | ||||||
| 155,000 | 6.30%, 04/23/2019 | 166,822 | ||||||
Landwirtschaftliche Rentenbank | ||||||||
| 160,000 | 1.88%, 09/17/2018 | 160,804 | ||||||
Morgan Stanley | ||||||||
| 90,000 | 4.30%, 01/27/2045 | 93,071 | ||||||
| 655,000 | 5.50%, 07/28/2021 | 726,300 | ||||||
PNC Financial Services Group, Inc. (The) | ||||||||
| 170,000 | 3.30%, 03/08/2022 | 176,237 | ||||||
| 150,000 | 5.13%, 02/08/2020 | 161,357 | ||||||
Royal Bank of Canada | ||||||||
| 60,000 | 4.65%, 01/27/2026 | 64,307 | ||||||
State Street Corp. | ||||||||
| 80,000 | 4.38%, 03/07/2021 | 85,731 | ||||||
Sumitomo Mitsui Financial Group, Inc. | ||||||||
| 300,000 | 2.93%, 03/09/2021 | 304,768 | ||||||
Toronto-Dominion Bank (The) | ||||||||
| 300,000 | 2.25%, 11/05/2019 | 302,225 | ||||||
US Bancorp | ||||||||
| 180,000 | 4.13%, 05/24/2021 | 192,509 | ||||||
The accompanying Notes are an integral part of these financial statements.
| 8 |
|
| HIMCO VIT Portfolio Diversifier Fund |
Schedule of Investments – (continued)
June 30, 2017 (Unaudited)
Shares or Principal Amount | Market Value(1) | |||||||
| CORPORATE BONDS - 14.3% - (continued) | ||||||||
| Commercial Banks - 3.1% - (continued) | ||||||||
Wells Fargo & Co. | ||||||||
| $ | 200,000 | 3.50%, 03/08/2022 | $ | 207,772 | ||||
| 270,000 | 4.60%, 04/01/2021 | 291,047 | ||||||
| 180,000 | 5.61%, 01/15/2044 | 214,052 | ||||||
Westpac Banking Corp. | ||||||||
| 250,000 | 4.88%, 11/19/2019 | 266,223 | ||||||
|
| |||||||
| 9,068,676 | ||||||||
|
| |||||||
| Commercial Services - 0.0% | ||||||||
Princeton University | ||||||||
| 75,000 | 4.95%, 03/01/2019 | 79,028 | ||||||
|
| |||||||
| Construction Materials - 0.0% | ||||||||
Johnson Controls International plc | ||||||||
| 100,000 | 5.00%, 03/30/2020 | 106,811 | ||||||
|
| |||||||
| Diversified Financial Services - 0.4% | ||||||||
American Express Co. | ||||||||
| 148,000 | 2.65%, 12/02/2022 | 148,170 | ||||||
BlackRock, Inc. | ||||||||
| 105,000 | 5.00%, 12/10/2019 | 112,741 | ||||||
GE Capital International Funding Co. | ||||||||
| 468,000 | 2.34%, 11/15/2020 | 471,742 | ||||||
General Electric Capital Corp. | ||||||||
| 100,000 | 5.88%, 01/14/2038 | 129,412 | ||||||
HSBC Finance Corp. | ||||||||
| 80,000 | 6.68%, 01/15/2021 | 90,157 | ||||||
National Rural Utilities Cooperative Finance Corp. | ||||||||
| 110,000 | 3.05%, 02/15/2022 | 112,730 | ||||||
|
| |||||||
| 1,064,952 | ||||||||
|
| |||||||
| Electric - 0.9% | ||||||||
Alabama Power Co. | ||||||||
| 107,000 | 6.00%, 03/01/2039 | 136,138 | ||||||
Berkshire Hathaway Energy Co. | ||||||||
| 135,000 | 6.13%, 04/01/2036 | 173,436 | ||||||
CenterPoint Energy Houston Electric LLC | ||||||||
| 15,000 | 3.55%, 08/01/2042 | 14,660 | ||||||
CMS Energy Corp. | ||||||||
| 60,000 | 5.05%, 03/15/2022 | 65,997 | ||||||
Commonwealth Edison Co. | ||||||||
| 40,000 | 3.80%, 10/01/2042 | 39,971 | ||||||
Consolidated Edison Co. of New York, Inc. | ||||||||
| 80,000 | 3.95%, 03/01/2043 | 80,902 | ||||||
| 40,000 | 6.65%, 04/01/2019 | 43,178 | ||||||
Dominion Energy, Inc. | ||||||||
| 140,000 | 4.45%, 03/15/2021 | 149,737 | ||||||
Series C | ||||||||
| 75,000 | 4.90%, 08/01/2041 | 81,957 | ||||||
Duke Energy Carolinas LLC | ||||||||
| 90,000 | 4.00%, 09/30/2042 | 92,855 | ||||||
| 30,000 | 5.30%, 02/15/2040 | 36,876 | ||||||
Entergy Louisiana LLC | ||||||||
| 100,000 | 4.05%, 09/01/2023 | 107,046 | ||||||
Exelon Generation Co. LLC | ||||||||
| 75,000 | 4.00%, 10/01/2020 | 78,252 | ||||||
| 135,000 | 6.25%, 10/01/2039 | 147,305 | ||||||
Florida Power & Light Co. | ||||||||
| 85,000 | 5.69%, 03/01/2040 | 109,892 | ||||||
Georgia Power Co. | ||||||||
| 100,000 | 2.85%, 05/15/2022 | 100,495 | ||||||
Shares or Principal Amount | Market Value(1) | |||||||
| CORPORATE BONDS - 14.3% - (continued) | ||||||||
| Electric - 0.9% - (continued) | ||||||||
Indiana Michigan Power Co. | ||||||||
| $ | 25,000 | 6.05%, 03/15/2037 | $ | 30,990 | ||||
Kentucky Utilities Co. | ||||||||
| 70,000 | 5.13%, 11/01/2040 | 83,909 | ||||||
Nevada Power Co., Series R | ||||||||
| 55,000 | 6.75%, 07/01/2037 | 74,245 | ||||||
NiSource Finance Corp. | ||||||||
| 40,000 | 5.25%, 02/15/2043 | 46,096 | ||||||
Northern States Power Co. | ||||||||
| 80,000 | 3.40%, 08/15/2042 | 75,868 | ||||||
Ohio Power Co., Series M | ||||||||
| 75,000 | 5.38%, 10/01/2021 | 83,500 | ||||||
Oncor Electric Delivery Co. LLC | ||||||||
| 95,000 | 7.00%, 09/01/2022 | 114,362 | ||||||
Pacific Gas & Electric Co. | ||||||||
| 135,000 | 6.05%, 03/01/2034 | 174,202 | ||||||
Progress Energy, Inc. | ||||||||
| 140,000 | 3.15%, 04/01/2022 | 142,919 | ||||||
| 130,000 | 4.40%, 01/15/2021 | 138,100 | ||||||
PSEG Power LLC | ||||||||
| 25,000 | 5.13%, 04/15/2020 | 26,759 | ||||||
Public Service Electric & Gas Co. | ||||||||
| 65,000 | 3.95%, 05/01/2042 | 67,347 | ||||||
South Carolina Electric & Gas Co. | ||||||||
| 40,000 | 6.05%, 01/15/2038 | 48,609 | ||||||
Southern California Edison Co. | ||||||||
| 75,000 | 4.50%, 09/01/2040 | 83,165 | ||||||
Xcel Energy, Inc. | ||||||||
| 65,000 | 4.70%, 05/15/2020 | 68,810 | ||||||
|
| |||||||
| 2,717,578 | ||||||||
|
| |||||||
| Electrical Components & Equipment - 0.0% | ||||||||
Emerson Electric Co. | ||||||||
| 70,000 | 4.88%, 10/15/2019 | 74,567 | ||||||
|
| |||||||
| Electronics - 0.1% | ||||||||
Honeywell International, Inc. | ||||||||
| 80,000 | 4.25%, 03/01/2021 | 85,849 | ||||||
| 20,000 | 5.70%, 03/15/2037 | 25,683 | ||||||
Thermo Fisher Scientific, Inc. | ||||||||
| 150,000 | 4.15%, 02/01/2024 | 159,970 | ||||||
|
| |||||||
| 271,502 | ||||||||
|
| |||||||
| Environmental Control - 0.1% | ||||||||
Republic Services, Inc. | ||||||||
| 95,000 | 5.00%, 03/01/2020 | 102,031 | ||||||
Waste Management, Inc. | ||||||||
| 105,000 | 4.75%, 06/30/2020 | 113,046 | ||||||
|
| |||||||
| 215,077 | ||||||||
|
| |||||||
| Food - 0.3% | ||||||||
General Mills, Inc. | ||||||||
| 80,000 | 5.65%, 02/15/2019 | 84,729 | ||||||
JM Smucker Co. (The) | ||||||||
| 70,000 | 3.50%, 03/15/2025 | 71,942 | ||||||
Kellogg Co. | ||||||||
| 45,000 | 4.00%, 12/15/2020 | 47,533 | ||||||
Kraft Foods Group, Inc. | ||||||||
| 183,000 | 5.38%, 02/10/2020 | 197,234 | ||||||
Kraft Heinz Foods Co. | ||||||||
| 100,000 | 5.00%, 06/04/2042 | 105,568 | ||||||
The accompanying Notes are an integral part of these financial statements.
| 9 |
|
| HIMCO VIT Portfolio Diversifier Fund |
Schedule of Investments – (continued)
June 30, 2017 (Unaudited)
Shares or Principal Amount | Market Value(1) | |||||||
| CORPORATE BONDS - 14.3% - (continued) | ||||||||
| Food - 0.3% - (continued) | ||||||||
Kroger Co. (The) | ||||||||
| $ | 70,000 | 6.80%, 12/15/2018 | $ | 74,675 | ||||
| 40,000 | 7.50%, 04/01/2031 | 53,042 | ||||||
Tyson Foods, Inc. | ||||||||
| 50,000 | 3.95%, 08/15/2024 | 52,321 | ||||||
Unilever Capital Corp. | ||||||||
| 50,000 | 5.90%, 11/15/2032 | 65,161 | ||||||
|
| |||||||
| 752,205 | ||||||||
|
| |||||||
| Forest Products&Paper - 0.1% | ||||||||
Georgia-Pacific LLC | ||||||||
| 10,000 | 7.75%, 11/15/2029 | 13,863 | ||||||
International Paper Co. | ||||||||
| 200,000 | 3.80%, 01/15/2026 | 205,551 | ||||||
|
| |||||||
| 219,414 | ||||||||
|
| |||||||
| Gas - 0.0% | ||||||||
Atmos Energy Corp. | ||||||||
| 8,000 | 5.50%, 06/15/2041 | 9,777 | ||||||
Sempra Energy | ||||||||
| 65,000 | 6.00%, 10/15/2039 | 82,274 | ||||||
|
| |||||||
| 92,051 | ||||||||
|
| |||||||
| Healthcare-Products - 0.3% | ||||||||
Abbott Laboratories | ||||||||
| 100,000 | 2.90%, 11/30/2021 | 101,117 | ||||||
| 70,000 | 2.95%, 03/15/2025 | 68,320 | ||||||
| 100,000 | 4.75%, 11/30/2036 | 108,846 | ||||||
Becton Dickinson and Co. | ||||||||
| 35,000 | 4.69%, 12/15/2044 | 36,045 | ||||||
Boston Scientific Corp. | ||||||||
| 70,000 | 6.00%, 01/15/2020 | 76,185 | ||||||
Covidien International Finance S.A. | ||||||||
| 45,000 | 3.20%, 06/15/2022 | 46,527 | ||||||
Medtronic, Inc. | ||||||||
| 225,000 | 3.50%, 03/15/2025 | 234,059 | ||||||
Zimmer Biomet Holdings, Inc. | ||||||||
| 60,000 | 3.55%, 04/01/2025 | 60,605 | ||||||
|
| |||||||
| 731,704 | ||||||||
|
| |||||||
| Healthcare-Services - 0.2% | ||||||||
Anthem, Inc. | ||||||||
| 90,000 | 4.65%, 01/15/2043 | 96,996 | ||||||
Cigna Corp. | ||||||||
| 50,000 | 4.00%, 02/15/2022 | 52,851 | ||||||
| 10,000 | 5.38%, 02/15/2042 | 12,024 | ||||||
Quest Diagnostics, Inc. | ||||||||
| 110,000 | 4.70%, 04/01/2021 | 117,696 | ||||||
UnitedHealth Group, Inc. | ||||||||
| 125,000 | 6.88%, 02/15/2038 | 177,550 | ||||||
|
| |||||||
| 457,117 | ||||||||
|
| |||||||
| Household Products - 0.1% | ||||||||
Colgate-Palmolive Co. | ||||||||
| 90,000 | 2.30%, 05/03/2022 | 90,795 | ||||||
Procter & Gamble Co. (The) | ||||||||
| 57,000 | 5.55%, 03/05/2037 | 76,387 | ||||||
|
| |||||||
| 167,182 | ||||||||
|
| |||||||
| Household Products/Wares - 0.0% | ||||||||
Kimberly-Clark Corp. | ||||||||
| 12,000 | 5.30%, 03/01/2041 | 14,792 | ||||||
|
| |||||||
Shares or Principal Amount | Market Value(1) | |||||||
| CORPORATE BONDS - 14.3% - (continued) | ||||||||
| Insurance - 0.5% | ||||||||
Allstate Corp. (The) | ||||||||
| $ | 45,000 | 5.55%, 05/09/2035 | $ | 55,054 | ||||
American International Group, Inc. | ||||||||
| 110,000 | 4.50%, 07/16/2044 | 111,857 | ||||||
Aon Corp. | ||||||||
| 20,000 | 5.00%, 09/30/2020 | 21,537 | ||||||
Aon plc | ||||||||
| 60,000 | 4.75%, 05/15/2045 | 64,920 | ||||||
Berkshire Hathaway, Inc. | ||||||||
| 75,000 | 4.50%, 02/11/2043 | 82,415 | ||||||
Chubb INA Holdings, Inc. | ||||||||
| 165,000 | 2.70%, 03/13/2023 | 165,136 | ||||||
| 75,000 | 2.88%, 11/03/2022 | 76,296 | ||||||
Lincoln National Corp. | ||||||||
| 60,000 | 4.00%, 09/01/2023 | 63,212 | ||||||
Marsh & McLennan Cos., Inc. | ||||||||
| 35,000 | 4.80%, 07/15/2021 | 38,051 | ||||||
MetLife, Inc. | ||||||||
| 25,000 | 4.88%, 11/13/2043 | 28,259 | ||||||
| 90,000 | 5.70%, 06/15/2035 | 110,938 | ||||||
| 120,000 | 7.72%, 02/15/2019 | 131,073 | ||||||
Principal Financial Group, Inc. | ||||||||
| 70,000 | 3.30%, 09/15/2022 | 71,942 | ||||||
Prudential Financial, Inc. | ||||||||
| 145,000 | 5.38%, 06/21/2020 | 158,405 | ||||||
| 65,000 | 5.80%, 11/16/2041 | 80,927 | ||||||
Travelers Cos., Inc. (The) | ||||||||
| 70,000 | 4.60%, 08/01/2043 | 78,075 | ||||||
|
| |||||||
| 1,338,097 | ||||||||
|
| |||||||
| Iron/Steel - 0.0% | ||||||||
Vale Overseas Ltd. | ||||||||
| 90,000 | 6.88%, 11/10/2039 | 96,525 | ||||||
|
| |||||||
| IT Services - 0.4% | ||||||||
Apple, Inc. | ||||||||
| 425,000 | 2.40%, 05/03/2023 | 421,655 | ||||||
| 110,000 | 3.45%, 02/09/2045 | 103,363 | ||||||
Dell International LLC / EMC Corp. | ||||||||
| 240,000 | 5.45%, 06/15/2023(5) | 260,441 | ||||||
Hewlett Packard Enterprise Co. | ||||||||
| 170,000 | 4.40%, 10/15/2022 | 180,222 | ||||||
HP, Inc. | ||||||||
| 45,000 | 4.30%, 06/01/2021 | 47,827 | ||||||
International Business Machines Corp. | ||||||||
| 105,000 | 5.60%, 11/30/2039 | 129,745 | ||||||
|
| |||||||
| 1,143,253 | ||||||||
|
| |||||||
| Machinery-Construction & Mining - 0.1% | ||||||||
Caterpillar, Inc. | ||||||||
| 40,000 | 3.80%, 08/15/2042 | 40,157 | ||||||
| 185,000 | 3.90%, 05/27/2021 | 196,535 | ||||||
|
| |||||||
| 236,692 | ||||||||
|
| |||||||
| Machinery-Diversified - 0.0% | ||||||||
Deere & Co. | ||||||||
| 55,000 | 3.90%, 06/09/2042 | 57,413 | ||||||
|
| |||||||
| Media - 0.5% | ||||||||
21st Century Fox America, Inc. | ||||||||
| 131,000 | 6.40%, 12/15/2035 | 166,015 | ||||||
CBS Corp. | ||||||||
| 90,000 | 3.70%, 08/15/2024 | 92,352 | ||||||
The accompanying Notes are an integral part of these financial statements.
| 10 |
|
| HIMCO VIT Portfolio Diversifier Fund |
Schedule of Investments – (continued)
June 30, 2017 (Unaudited)
Shares or Principal Amount | Market Value(1) | |||||||
| CORPORATE BONDS - 14.3% - (continued) | ||||||||
| Media - 0.5% - (continued) | ||||||||
Charter Communications Operating LLC / Charter Communications Operating Capital | ||||||||
| $ | 140,000 | 4.91%, 07/23/2025 | $ | 151,245 | ||||
Comcast Corp. | ||||||||
| 150,000 | 4.65%, 07/15/2042 | 164,464 | ||||||
| 105,000 | 5.15%, 03/01/2020 | 113,772 | ||||||
| 90,000 | 7.05%, 03/15/2033 | 123,013 | ||||||
Discovery Communications LLC | ||||||||
| 30,000 | 4.88%, 04/01/2043 | 28,009 | ||||||
Time Warner Cable LLC | ||||||||
| 245,000 | 4.00%, 09/01/2021 | 256,100 | ||||||
| 40,000 | 4.50%, 09/15/2042 | 38,060 | ||||||
| 65,000 | 6.75%, 07/01/2018 | 68,004 | ||||||
Time Warner, Inc. | ||||||||
| 140,000 | 3.80%, 02/15/2027 | 140,946 | ||||||
| 60,000 | 4.85%, 07/15/2045 | 61,781 | ||||||
Viacom, Inc. | ||||||||
| 98,000 | 4.38%, 03/15/2043 | 87,112 | ||||||
Walt Disney Co. (The) | ||||||||
| 60,000 | 2.55%, 02/15/2022 | 60,558 | ||||||
| 55,000 | 4.13%, 12/01/2041 | 57,631 | ||||||
|
| |||||||
| 1,609,062 | ||||||||
|
| |||||||
| Mining - 0.1% | ||||||||
Barrick Gold Corp. | ||||||||
| 45,000 | 5.25%, 04/01/2042 | 51,201 | ||||||
BHP Billiton Finance USA Ltd. | ||||||||
| 63,000 | 2.88%, 02/24/2022 | 64,281 | ||||||
| 15,000 | 4.13%, 02/24/2042 | 15,358 | ||||||
Newmont Mining Corp. | ||||||||
| 50,000 | 6.25%, 10/01/2039 | 61,365 | ||||||
Rio Tinto Finance USA Ltd. | ||||||||
| 50,000 | 5.20%, 11/02/2040 | 59,119 | ||||||
Southern Copper Corp. | ||||||||
| 55,000 | 6.75%, 04/16/2040 | 63,348 | ||||||
|
| |||||||
| 314,672 | ||||||||
|
| |||||||
| Miscellaneous Manufacturer - 0.2% | ||||||||
3M Co. | ||||||||
| 50,000 | 5.70%, 03/15/2037 | 63,907 | ||||||
Eaton Corp. | ||||||||
| 115,000 | 2.75%, 11/02/2022 | 115,627 | ||||||
General Electric Co. | ||||||||
| 67,000 | 4.13%, 10/09/2042 | 70,511 | ||||||
Illinois Tool Works, Inc. | ||||||||
| 35,000 | 3.90%, 09/01/2042 | 36,346 | ||||||
Newell Brands, Inc. | ||||||||
| 150,000 | 4.20%, 04/01/2026 | 159,268 | ||||||
|
| |||||||
| 445,659 | ||||||||
|
| |||||||
| Multi-National - 0.8% | ||||||||
Asian Development Bank | ||||||||
| 100,000 | 1.75%, 09/11/2018 | 100,399 | ||||||
| 90,000 | 2.00%, 01/22/2025 | 87,836 | ||||||
European Bank for Reconstruction & Development | ||||||||
| 150,000 | 1.75%, 11/26/2019 | 150,311 | ||||||
European Investment Bank | ||||||||
| 850,000 | 2.88%, 09/15/2020 | 877,566 | ||||||
Inter-American Development Bank | ||||||||
| 570,000 | 3.88%, 02/14/2020 | 601,046 | ||||||
Shares or Principal Amount | Market Value(1) | |||||||
| CORPORATE BONDS - 14.3% - (continued) | ||||||||
| Multi-National - 0.8% - (continued) | ||||||||
International Bank for Reconstruction & Development | ||||||||
| $ | 512,000 | 7.63%, 01/19/2023 | $ | 656,190 | ||||
|
| |||||||
| 2,473,348 | ||||||||
|
| |||||||
| Office/Business Equipment - 0.0% | ||||||||
Xerox Corp. | ||||||||
| 10,000 | 4.07%, 03/17/2022(5) | 10,256 | ||||||
|
| |||||||
| Oil&Gas - 1.0% | ||||||||
Anadarko Petroleum Corp. | ||||||||
| 60,000 | 6.20%, 03/15/2040 | 68,514 | ||||||
Apache Corp. | ||||||||
| 85,000 | 5.10%, 09/01/2040 | 86,839 | ||||||
BP Capital Markets plc | ||||||||
| 280,000 | 3.25%, 05/06/2022 | 288,032 | ||||||
Canadian Natural Resources Ltd. | ||||||||
| 40,000 | 6.50%, 02/15/2037 | 47,498 | ||||||
Chevron Corp. | ||||||||
| 125,000 | 2.36%, 12/05/2022 | 124,422 | ||||||
| 150,000 | 2.43%, 06/24/2020 | 151,878 | ||||||
ConocoPhillips | ||||||||
| 108,000 | 6.50%, 02/01/2039 | 141,805 | ||||||
Devon Financing Co. LLC | ||||||||
| 65,000 | 7.88%, 09/30/2031 | 84,349 | ||||||
Exxon Mobil Corp. | ||||||||
| 55,000 | 2.71%, 03/06/2025 | 54,611 | ||||||
| 40,000 | 3.57%, 03/06/2045 | 38,476 | ||||||
Hess Corp. | ||||||||
| 28,000 | 5.60%, 02/15/2041 | 27,526 | ||||||
Kerr-McGee Corp. | ||||||||
| 60,000 | 6.95%, 07/01/2024 | 70,367 | ||||||
Marathon Oil Corp. | ||||||||
| 15,000 | 6.60%, 10/01/2037 | 16,553 | ||||||
Marathon Petroleum Corp. | ||||||||
| 35,000 | 5.00%, 09/15/2054 | 32,025 | ||||||
| 15,000 | 5.13%, 03/01/2021 | 16,259 | ||||||
Nexen Energy ULC | ||||||||
| 50,000 | 7.50%, 07/30/2039 | 72,218 | ||||||
Noble Energy, Inc. | ||||||||
| 60,000 | 6.00%, 03/01/2041 | 67,139 | ||||||
Occidental Petroleum Corp. | ||||||||
| 40,000 | 4.10%, 02/01/2021 | 42,609 | ||||||
| 35,000 | 4.40%, 04/15/2046 | 36,381 | ||||||
Petroleos Mexicanos | ||||||||
| 100,000 | 4.88%, 01/24/2022 | 103,021 | ||||||
| 195,000 | 6.50%, 06/02/2041 | 193,635 | ||||||
Phillips 66 | ||||||||
| 35,000 | 4.30%, 04/01/2022 | 37,504 | ||||||
| 45,000 | 4.88%, 11/15/2044 | 48,236 | ||||||
Shell International Finance BV | ||||||||
| 140,000 | 3.63%, 08/21/2042 | 130,967 | ||||||
| 170,000 | 4.30%, 09/22/2019 | 178,971 | ||||||
Statoil ASA | ||||||||
| 35,000 | 5.10%, 08/17/2040 | 40,346 | ||||||
| 255,000 | 5.25%, 04/15/2019 | 269,987 | ||||||
Suncor Energy, Inc. | ||||||||
| 60,000 | 6.50%, 06/15/2038 | 76,832 | ||||||
Total Capital S.A. | ||||||||
| 95,000 | 4.25%, 12/15/2021 | 102,121 | ||||||
Valero Energy Corp. | ||||||||
| 140,000 | 6.13%, 02/01/2020 | 153,487 | ||||||
The accompanying Notes are an integral part of these financial statements.
| 11 |
|
| HIMCO VIT Portfolio Diversifier Fund |
Schedule of Investments – (continued)
June 30, 2017 (Unaudited)
Shares or Principal Amount | Market Value(1) | |||||||
| CORPORATE BONDS - 14.3% - (continued) | ||||||||
| Office/Business Equipment - 0.0% - (continued) | ||||||||
Valero Energy Corp. - (continued) | ||||||||
| $ | 40,000 | 7.50%, 04/15/2032 | $ | 51,322 | ||||
|
| |||||||
| 2,853,930 | ||||||||
|
| |||||||
| Oil&Gas Services - 0.0% | ||||||||
Baker Hughes, Inc. | ||||||||
| 46,000 | 5.13%, 09/15/2040 | 52,557 | ||||||
National Oilwell Varco, Inc. | ||||||||
| 50,000 | 2.60%, 12/01/2022 | 48,345 | ||||||
| 15,000 | 3.95%, 12/01/2042 | 12,375 | ||||||
|
| |||||||
| 113,277 | ||||||||
|
| |||||||
| Pharmaceuticals - 0.7% | ||||||||
AbbVie, Inc. | ||||||||
| 420,000 | 2.90%, 11/06/2022 | 423,951 | ||||||
Allergan Funding SCS | ||||||||
| 200,000 | 3.85%, 06/15/2024 | 208,638 | ||||||
Allergan Funding SCS | ||||||||
| 7,000 | 4.75%, 03/15/2045 | 7,556 | ||||||
AstraZeneca plc | ||||||||
| 60,000 | 6.45%, 09/15/2037 | 80,802 | ||||||
Baxalta, Inc. | ||||||||
| 100,000 | 4.00%, 06/23/2025 | 104,301 | ||||||
Bristol-Myers Squibb Co. | ||||||||
| 25,000 | 3.25%, 08/01/2042 | 22,599 | ||||||
Cardinal Health, Inc. | ||||||||
| 105,000 | 3.50%, 11/15/2024 | 107,266 | ||||||
Express Scripts Holding Co. | ||||||||
| 165,000 | 4.50%, 02/25/2026 | 174,868 | ||||||
GlaxoSmithKline Capital, Inc. | ||||||||
| 40,000 | 2.80%, 03/18/2023 | 40,608 | ||||||
| 47,000 | 6.38%, 05/15/2038 | 64,529 | ||||||
Johnson & Johnson | ||||||||
| 100,000 | 5.95%, 08/15/2037 | 134,528 | ||||||
McKesson Corp. | ||||||||
| 70,000 | 3.80%, 03/15/2024 | 72,860 | ||||||
| 50,000 | 4.75%, 03/01/2021 | 53,635 | ||||||
Merck & Co., Inc. | ||||||||
| 75,000 | 3.60%, 09/15/2042 | 73,275 | ||||||
Mylan N.V. | ||||||||
| 60,000 | 3.95%, 06/15/2026 | 60,794 | ||||||
Novartis Capital Corp. | ||||||||
| 145,000 | 2.40%, 09/21/2022 | 145,619 | ||||||
Pfizer, Inc. | ||||||||
| 140,000 | 3.00%, 12/15/2026 | 140,391 | ||||||
Sanofi | ||||||||
| 20,000 | 4.00%, 03/29/2021 | 21,272 | ||||||
Teva Pharmaceutical Finance IV BV | ||||||||
| 28,000 | 3.65%, 11/10/2021 | 28,914 | ||||||
Teva Pharmaceutical Finance Netherlands III BV | ||||||||
| 160,000 | 3.15%, 10/01/2026 | 151,948 | ||||||
Wyeth LLC | ||||||||
| 40,000 | 5.95%, 04/01/2037 | 51,709 | ||||||
|
| |||||||
| 2,170,063 | ||||||||
|
| |||||||
| Pipelines - 0.4% | ||||||||
Energy Transfer Partners L.P. | ||||||||
| 100,000 | 6.50%, 02/01/2042 | 111,704 | ||||||
| 64,000 | 9.00%, 04/15/2019 | 71,173 | ||||||
Enterprise Products Operating LLC | ||||||||
| 100,000 | 4.45%, 02/15/2043 | 99,378 | ||||||
Shares or Principal Amount | Market Value(1) | |||||||
| CORPORATE BONDS - 14.3% - (continued) | ||||||||
| Pipelines - 0.4% - (continued) | ||||||||
Enterprise Products Operating LLC - (continued) | ||||||||
| $ | 40,000 | 4.85%, 03/15/2044 | $ | 42,402 | ||||
Kinder Morgan Energy Partners L.P. | ||||||||
| 55,000 | 4.70%, 11/01/2042 | 51,925 | ||||||
| 102,000 | 6.38%, 03/01/2041 | 115,014 | ||||||
MPLX L.P. | ||||||||
| 100,000 | 4.13%, 03/01/2027 | 100,341 | ||||||
ONEOK Partners L.P. | ||||||||
| 40,000 | 6.65%, 10/01/2036 | 48,139 | ||||||
Plains All American Pipeline L.P. / PAA Finance Corp. | ||||||||
| 65,000 | 6.65%, 01/15/2037 | 73,044 | ||||||
TransCanada PipeLines Ltd. | ||||||||
| 195,000 | 3.75%, 10/16/2023 | 204,587 | ||||||
| 55,000 | 3.80%, 10/01/2020 | 57,728 | ||||||
Transcontinental Gas Pipe Line Co. LLC | ||||||||
| 20,000 | 4.45%, 08/01/2042 | 19,807 | ||||||
Williams Partners L.P. | ||||||||
| 125,000 | 4.13%, 11/15/2020 | 130,662 | ||||||
| 40,000 | 6.30%, 04/15/2040 | 46,356 | ||||||
|
| |||||||
| 1,172,260 | ||||||||
|
| |||||||
| Real Estate Investment Trusts - 0.1% | ||||||||
Boston Properties L.P. | ||||||||
| 100,000 | 5.88%, 10/15/2019 | 107,222 | ||||||
ERP Operating L.P. | ||||||||
| 40,000 | 4.50%, 07/01/2044 | 42,636 | ||||||
Welltower, Inc. | ||||||||
| 40,000 | 3.75%, 03/15/2023 | 41,505 | ||||||
| 55,000 | 5.25%, 01/15/2022 | 60,383 | ||||||
Weyerhaeuser Co. | ||||||||
| 40,000 | 7.38%, 03/15/2032 | 55,076 | ||||||
|
| |||||||
| 306,822 | ||||||||
|
| |||||||
| Retail - 0.5% | ||||||||
CVS Health Corp. | ||||||||
| 340,000 | 4.00%, 12/05/2023 | 359,146 | ||||||
Home Depot, Inc. (The) | ||||||||
| 160,000 | 2.70%, 04/01/2023 | 162,331 | ||||||
| 85,000 | 5.88%, 12/16/2036 | 110,726 | ||||||
McDonald’s Corp. | ||||||||
| 100,000 | 2.75%, 12/09/2020 | 101,813 | ||||||
| 84,000 | 3.70%, 02/15/2042 | 78,568 | ||||||
Target Corp. | ||||||||
| 140,000 | 2.30%, 06/26/2019 | 141,727 | ||||||
| 119,000 | 2.50%, 04/15/2026 | 112,907 | ||||||
Wal-Mart Stores, Inc. | ||||||||
| 50,000 | 3.25%, 10/25/2020 | 52,071 | ||||||
| 50,000 | 4.25%, 04/15/2021 | 54,042 | ||||||
| 121,000 | 5.63%, 04/15/2041 | 157,124 | ||||||
Walgreen Co. | ||||||||
| 110,000 | 3.10%, 09/15/2022 | 112,208 | ||||||
Walgreens Boots Alliance, Inc. | ||||||||
| 40,000 | 4.80%, 11/18/2044 | 42,566 | ||||||
|
| |||||||
| 1,485,229 | ||||||||
|
| |||||||
| Semiconductors - 0.2% | ||||||||
Broadcom Corp./Broadcom Cayman Finance Ltd. | ||||||||
| 110,000 | 3.88%, 01/15/2027(5) | 112,959 | ||||||
The accompanying Notes are an integral part of these financial statements.
| 12 |
|
| HIMCO VIT Portfolio Diversifier Fund |
Schedule of Investments – (continued)
June 30, 2017 (Unaudited)
Shares or Principal Amount | Market Value(1) | |||||||
| CORPORATE BONDS - 14.3% - (continued) | ||||||||
| Semiconductors - 0.2% - (continued) | ||||||||
Intel Corp. | ||||||||
| $ | 330,000 | 2.70%, 12/15/2022 | $ | 334,220 | ||||
QUALCOMM, Inc. | ||||||||
| 85,000 | 3.45%, 05/20/2025 | 87,367 | ||||||
Texas Instruments, Inc. | ||||||||
| 80,000 | 1.65%, 08/03/2019 | 80,056 | ||||||
|
| |||||||
| 614,602 | ||||||||
|
| |||||||
| Software - 0.4% | ||||||||
Microsoft Corp. | ||||||||
| 225,000 | 3.13%, 11/03/2025 | 229,576 | ||||||
| 180,000 | 3.30%, 02/06/2027 | 185,413 | ||||||
| 70,000 | 4.00%, 02/12/2055 | 70,884 | ||||||
| 85,000 | 5.20%, 06/01/2039 | 103,291 | ||||||
Oracle Corp. | ||||||||
| 210,000 | 2.65%, 07/15/2026 | 201,509 | ||||||
| 55,000 | 4.13%, 05/15/2045 | 56,545 | ||||||
| 40,000 | 5.38%, 07/15/2040 | 48,648 | ||||||
Visa, Inc. | ||||||||
| 250,000 | 3.15%, 12/14/2025 | 253,817 | ||||||
|
| |||||||
| 1,149,683 | ||||||||
|
| |||||||
| Telecommunications - 0.8% | ||||||||
America Movil S.A.B. de C.V. | ||||||||
| 60,000 | 6.13%, 11/15/2037 | 72,354 | ||||||
AT&T Mobility LLC | ||||||||
| 25,000 | 7.13%, 12/15/2031 | 31,933 | ||||||
AT&T, Inc. | ||||||||
| 250,000 | 3.60%, 02/17/2023 | 255,865 | ||||||
| 222,000 | 4.55%, 03/09/2049 | 209,785 | ||||||
| 55,000 | 5.00%, 03/01/2021 | 59,469 | ||||||
| 120,000 | 5.15%, 03/15/2042 | 122,543 | ||||||
| 14,000 | 5.35%, 09/01/2040 | 14,824 | ||||||
British Telecommunications plc | ||||||||
| 43,000 | 9.13%, 12/15/2030 | 65,381 | ||||||
Cisco Systems, Inc. | ||||||||
| 120,000 | 4.45%, 01/15/2020 | 127,841 | ||||||
| 60,000 | 5.50%, 01/15/2040 | 74,825 | ||||||
Deutsche Telekom International Finance BV | ||||||||
| 37,000 | 8.75%, 06/15/2030 | 54,874 | ||||||
Orange S.A. | ||||||||
| 80,000 | 5.38%, 07/08/2019 | 85,137 | ||||||
| 25,000 | 5.38%, 01/13/2042 | 29,240 | ||||||
Qwest Corp. | ||||||||
| 11,000 | 6.88%, 09/15/2033 | 10,824 | ||||||
Rogers Communications, Inc. | ||||||||
| 30,000 | 4.50%, 03/15/2043 | 31,002 | ||||||
| 50,000 | 6.80%, 08/15/2018 | 52,745 | ||||||
Telefonica Emisiones SAU | ||||||||
| 100,000 | 5.46%, 02/16/2021 | 109,993 | ||||||
Verizon Communications, Inc. | ||||||||
| 143,000 | 2.95%, 03/15/2022(5) | 143,993 | ||||||
| 276,000 | 5.01%, 08/21/2054 | 271,616 | ||||||
| 240,000 | 5.15%, 09/15/2023 | 266,589 | ||||||
Vodafone Group plc | ||||||||
| 95,000 | 5.45%, 06/10/2019 | 101,118 | ||||||
| 50,000 | 6.15%, 02/27/2037 | 60,607 | ||||||
|
| |||||||
| 2,252,558 | ||||||||
|
| |||||||
Shares or Principal Amount | Market Value(1) | |||||||
| CORPORATE BONDS - 14.3% - (continued) | ||||||||
| Transportation - 0.3% | ||||||||
Burlington Northern Santa Fe LLC | ||||||||
| $ | 47,000 | 4.38%, 09/01/2042 | $ | 50,486 | ||||
| 45,000 | 4.45%, 03/15/2043 | 48,886 | ||||||
| 170,000 | 4.70%, 10/01/2019 | 180,733 | ||||||
Canadian National Railway Co. | ||||||||
| 40,000 | 2.85%, 12/15/2021 | 40,874 | ||||||
Canadian Pacific Railway Co. | ||||||||
| 60,000 | 4.45%, 03/15/2023 | 64,732 | ||||||
| 8,000 | 7.13%, 10/15/2031 | 10,914 | ||||||
CSX Corp. | ||||||||
| 85,000 | 3.70%, 10/30/2020 | 88,819 | ||||||
| 105,000 | 4.25%, 06/01/2021 | 111,947 | ||||||
FedEx Corp. | ||||||||
| 70,000 | 4.10%, 02/01/2045 | 68,674 | ||||||
Norfolk Southern Corp. | ||||||||
| 70,000 | 4.84%, 10/01/2041 | 78,665 | ||||||
Union Pacific Corp. | ||||||||
| 67,000 | 3.80%, 10/01/2051 | 65,607 | ||||||
| 60,000 | 4.00%, 02/01/2021 | 63,591 | ||||||
United Parcel Service, Inc. | ||||||||
| 110,000 | 3.13%, 01/15/2021 | 114,231 | ||||||
|
| |||||||
| 988,159 | ||||||||
|
| |||||||
Total Corporate Bonds | 41,771,456 | |||||||
|
| |||||||
| FOREIGN GOVERNMENT OBLIGATIONS - 1.1% | ||||||||
| Canada - 0.2% | ||||||||
Hydro-Quebec | ||||||||
| 70,000 | 8.40%, 01/15/2022 | 86,563 | ||||||
Province of British Columbia | ||||||||
| 105,000 | 2.65%, 09/22/2021 | 107,720 | ||||||
Province of Manitoba | ||||||||
| 85,000 | 2.10%, 09/06/2022 | 84,158 | ||||||
Province of Ontario | ||||||||
| 285,000 | 4.40%, 04/14/2020 | 303,954 | ||||||
Province of Quebec | ||||||||
| 70,000 | 7.50%, 09/15/2029 | 99,903 | ||||||
|
| |||||||
| 682,298 | ||||||||
|
| |||||||
| Colombia - 0.1% | ||||||||
Colombia Government International Bond | ||||||||
| 240,000 | 8.13%, 05/21/2024 | 305,760 | ||||||
|
| |||||||
| Germany - 0.4% | ||||||||
KFW | ||||||||
| 420,000 | 2.13%, 01/17/2023 | 419,432 | ||||||
| 561,000 | 4.00%, 01/27/2020 | 593,543 | ||||||
|
| |||||||
| 1,012,975 | ||||||||
|
| |||||||
| Hungary - 0.1% | ||||||||
Hungary Government International Bond | ||||||||
| 100,000 | 5.38%, 03/25/2024 | 112,572 | ||||||
|
| |||||||
| Italy - 0.0% | ||||||||
Italy Government International Bond | ||||||||
| 45,000 | 5.38%, 06/15/2033 | 50,941 | ||||||
|
| |||||||
| Mexico - 0.1% | ||||||||
Mexico Government International Bond | ||||||||
| 70,000 | 3.63%, 03/15/2022 | 72,590 | ||||||
The accompanying Notes are an integral part of these financial statements.
| 13 |
|
| HIMCO VIT Portfolio Diversifier Fund |
Schedule of Investments – (continued)
June 30, 2017 (Unaudited)
Shares or Principal Amount | Market Value(1) | |||||||
| FOREIGN GOVERNMENT OBLIGATIONS - 1.1% - (continued) | ||||||||
| Mexico - 0.1% - (continued) | ||||||||
Mexico Government International Bond - (continued) | ||||||||
| $ | 252,000 | 6.05%, 01/11/2040 | $ | 297,058 | ||||
|
| |||||||
| 369,648 | ||||||||
|
| |||||||
| Panama - 0.0% | ||||||||
Panama Government International Bond | ||||||||
| 50,000 | 6.70%, 01/26/2036 | 64,375 | ||||||
|
| |||||||
| Peru - 0.0% | ||||||||
Peruvian Government International Bond | ||||||||
| 75,000 | 5.63%, 11/18/2050 | 90,862 | ||||||
|
| |||||||
| Philippines - 0.1% | ||||||||
Philippine Government International Bond | ||||||||
| 120,000 | 4.00%, 01/15/2021 | 127,902 | ||||||
| 100,000 | 6.38%, 10/23/2034 | 134,238 | ||||||
|
| |||||||
| 262,140 | ||||||||
|
| |||||||
| Poland - 0.1% | ||||||||
Poland Government International Bond | ||||||||
| 140,000 | 5.00%, 03/23/2022 | 155,400 | ||||||
|
| |||||||
| Uruguay - 0.0% | ||||||||
Uruguay Government International Bond | ||||||||
| 45,000 | 5.10%, 06/18/2050 | 45,810 | ||||||
|
| |||||||
Total Foreign Government Obligations | 3,152,781 | |||||||
|
| |||||||
| MUNICIPAL BONDS - 0.3% | ||||||||
| Airport Revenues - 0.0% | ||||||||
County of Clark Department of Aviation | ||||||||
| 5,000 | 6.82%, 07/01/2045 | 7,252 | ||||||
|
| |||||||
| General Obligations - 0.1% | ||||||||
California State GO, | ||||||||
| 105,000 | 7.60%, 11/01/2040 | 163,444 | ||||||
Connecticut State, GO | ||||||||
| 45,000 | 5.85%, 03/15/2032 | 53,655 | ||||||
Massachusetts State, GO | ||||||||
| 15,000 | 5.46%, 12/01/2039 | 18,921 | ||||||
Mississippi State, GO | ||||||||
| 25,000 | 5.25%, 11/01/2034 | 29,823 | ||||||
New York, NY, GO | ||||||||
| 15,000 | 5.85%, 06/01/2040 | 19,694 | ||||||
Texas State, GO | ||||||||
| 30,000 | 5.52%, 04/01/2039 | 39,286 | ||||||
|
| |||||||
| 324,823 | ||||||||
|
| |||||||
| Higher Education (Universities, Dorms, etc.) - 0.0% | ||||||||
University of California Build America Bonds Rev., | ||||||||
| 50,000 | 5.77%, 05/15/2043 | 64,048 | ||||||
University of Texas System | ||||||||
| 25,000 | 4.79%, 08/15/2046 | 29,509 | ||||||
|
| |||||||
| 93,557 | ||||||||
|
| |||||||
| Miscellaneous - 0.0% | ||||||||
New Jersey State Economic Development Authority Lease Rev. | ||||||||
| 15,000 | 7.43%, 02/15/2029 | 18,436 | ||||||
|
| |||||||
Shares or Principal Amount | Market Value(1) | |||||||
| MUNICIPAL BONDS - 0.3% - (continued) | ||||||||
| Tax Allocation - 0.0% | ||||||||
New York State Dormitory Authority | ||||||||
| $ | 20,000 | 5.60%, 03/15/2040 | $ | 25,046 | ||||
|
| |||||||
| Transportation - 0.1% | ||||||||
Bay Area Toll Authority | ||||||||
| 30,000 | 6.26%, 04/01/2049 | 42,699 | ||||||
Metropolitan Transportation Authority | ||||||||
| 20,000 | 5.87%, 11/15/2039 | 25,007 | ||||||
| 25,000 | 6.55%, 11/15/2031 | 32,549 | ||||||
| 15,000 | 6.65%, 11/15/2039 | 20,477 | ||||||
New Jersey State Turnpike Authority | ||||||||
| 45,000 | 7.10%, 01/01/2041 | 66,040 | ||||||
| 15,000 | 7.41%, 01/01/2040 | 22,661 | ||||||
Port Authority of New York & New Jersey | ||||||||
| 50,000 | 4.93%, 10/01/2051 | 58,773 | ||||||
|
| |||||||
| 268,206 | ||||||||
|
| |||||||
| Utilities - Electric - 0.1% | ||||||||
American Municipal Power Inc. | ||||||||
| 45,000 | 6.05%, 02/15/2043 | 55,504 | ||||||
Municipal Electric Authority of Georgia | ||||||||
| 40,000 | 6.64%, 04/01/2057 | 49,043 | ||||||
|
| |||||||
| 104,547 | ||||||||
|
| |||||||
| Utilities - Water and Sewer - 0.0% | ||||||||
New York City Water & Sewer System | ||||||||
| 45,000 | 5.88%, 06/15/2044 | 61,981 | ||||||
|
| |||||||
Total Municipal Bonds | 903,848 | |||||||
|
| |||||||
| U.S. GOVERNMENT AGENCIES - 15.8% | ||||||||
| FHLB - 0.3% | ||||||||
| 650,000 | 1.38%, 11/15/2019 | 648,002 | ||||||
| 60,000 | 5.50%, 07/15/2036 | 81,210 | ||||||
|
| |||||||
| 729,212 | ||||||||
|
| |||||||
| FHLMC - 4.5% | ||||||||
| 10,000 | 2.41%, 03/25/2023 | 10,058 | ||||||
| 10,000 | 2.45%, 08/25/2023 | 10,049 | ||||||
| 68,885 | 2.50%, 07/01/2027 | 69,762 | ||||||
| 47,245 | 2.50%, 09/01/2027 | 47,843 | ||||||
| 77,127 | 2.50%, 10/01/2027 | 78,093 | ||||||
| 178,871 | 2.50%, 04/01/2028 | 181,080 | ||||||
| 219,098 | 2.50%, 06/01/2028 | 221,797 | ||||||
| 65,661 | 2.50%, 01/01/2029 | 66,471 | ||||||
| 289,999 | 2.50%, 12/01/2031 | 292,249 | ||||||
| 111,452 | 2.50%, 12/01/2042 | 107,553 | ||||||
| 10,000 | 2.53%, 05/25/2026 | 9,802 | ||||||
| 10,000 | 2.57%, 07/25/2026 | 9,822 | ||||||
| 10,000 | 2.65%, 08/25/2026 | 9,859 | ||||||
| 15,000 | 2.67%, 12/25/2024 | 15,076 | ||||||
| 10,000 | 2.67%, 03/25/2026 | 9,929 | ||||||
| 10,000 | 2.75%, 01/25/2026 | 10,000 | ||||||
| 15,000 | 2.79%, 01/25/2022 | 15,405 | ||||||
| 15,000 | 2.81%, 01/25/2025 | 15,191 | ||||||
| 10,000 | 3.00%, 12/25/2025 | 10,196 | ||||||
| 20,741 | 3.00%, 12/01/2025 | 21,316 | ||||||
| 144,035 | 3.00%, 11/01/2026 | 148,028 | ||||||
| 16,016 | 3.00%, 03/01/2027 | 16,460 | ||||||
| 53,442 | 3.00%, 04/01/2027 | 54,924 | ||||||
| 79,974 | 3.00%, 09/01/2027 | 82,191 | ||||||
The accompanying Notes are an integral part of these financial statements.
| 14 |
|
| HIMCO VIT Portfolio Diversifier Fund |
Schedule of Investments – (continued)
June 30, 2017 (Unaudited)
Shares or Principal Amount | Market Value(1) | |||||||
| U.S. GOVERNMENT AGENCIES - 15.8% - (continued) | ||||||||
| FHLMC - 4.5% - (continued) | ||||||||
| $ | 310,514 | 3.00%, 10/01/2028 | $ | 319,122 | ||||
| 291,091 | 3.00%, 12/01/2031 | 299,197 | ||||||
| 63,763 | 3.00%, 10/01/2042 | 64,000 | ||||||
| 157,084 | 3.00%, 10/01/2042 | 157,658 | ||||||
| 98,720 | 3.00%, 11/01/2042 | 99,088 | ||||||
| 102,057 | 3.00%, 12/01/2042 | 102,462 | ||||||
| 46,435 | 3.00%, 01/01/2043 | 46,613 | ||||||
| 141,143 | 3.00%, 01/01/2043 | 141,835 | ||||||
| 52,496 | 3.00%, 02/01/2043 | 52,693 | ||||||
| 216,313 | 3.00%, 02/01/2043 | 217,126 | ||||||
| 132,344 | 3.00%, 02/01/2043 | 132,720 | ||||||
| 28,166 | 3.00%, 05/01/2043 | 28,278 | ||||||
| 73,718 | 3.00%, 05/01/2043 | 74,012 | ||||||
| 762,053 | 3.00%, 08/01/2045 | 760,898 | ||||||
| 288,427 | 3.00%, 09/01/2046 | 287,991 | ||||||
| 588,700 | 3.00%, 12/01/2046 | 587,808 | ||||||
| 491,129 | 3.00%, 01/01/2047 | 490,385 | ||||||
| 10,000 | 3.01%, 07/25/2025 | 10,234 | ||||||
| 15,000 | 3.02%, 01/25/2025 | 15,394 | ||||||
| 10,000 | 3.06%, 11/25/2023(4) | 10,344 | ||||||
| 15,000 | 3.06%, 12/25/2024 | 15,456 | ||||||
| 10,000 | 3.12%, 09/25/2026(4) | 10,223 | ||||||
| 10,000 | 3.15%, 11/25/2025 | 10,327 | ||||||
| 15,000 | 3.22%, 03/25/2027(4) | 15,440 | ||||||
| 10,000 | 3.30%, 10/25/2026 | 10,358 | ||||||
| 15,000 | 3.33%, 05/25/2025(4) | 15,700 | ||||||
| 15,000 | 3.33%, 08/25/2025(4) | 15,698 | ||||||
| 10,000 | 3.35%, 11/25/2026 | 10,396 | ||||||
| 10,000 | 3.41%, 12/25/2026 | 10,484 | ||||||
| 15,000 | 3.43%, 01/25/2027(4) | 15,746 | ||||||
| 61,118 | 3.50%, 04/01/2026 | 63,830 | ||||||
| 56,489 | 3.50%, 08/01/2026 | 58,871 | ||||||
| 184,952 | 3.50%, 10/01/2026 | 192,751 | ||||||
| 78,046 | 3.50%, 10/01/2026 | 81,337 | ||||||
| 258,951 | 3.50%, 07/01/2029 | 270,298 | ||||||
| 22,522 | 3.50%, 10/01/2040 | 23,245 | ||||||
| 33,487 | 3.50%, 10/01/2041 | 34,547 | ||||||
| 120,272 | 3.50%, 11/01/2041 | 124,082 | ||||||
| 70,552 | 3.50%, 02/01/2042 | 72,797 | ||||||
| 24,743 | 3.50%, 03/01/2042 | 25,531 | ||||||
| 68,233 | 3.50%, 04/01/2042 | 70,401 | ||||||
| 67,020 | 3.50%, 04/01/2042 | 69,155 | ||||||
| 119,267 | 3.50%, 09/01/2042 | 123,066 | ||||||
| 59,612 | 3.50%, 09/01/2042 | 61,509 | ||||||
| 176,934 | 3.50%, 11/01/2042 | 182,570 | ||||||
| 70,536 | 3.50%, 01/01/2043 | 72,695 | ||||||
| 186,032 | 3.50%, 12/01/2043 | 191,833 | ||||||
| 436,535 | 3.50%, 09/01/2044 | 449,969 | ||||||
| 1,312,838 | 3.50%, 08/01/2046 | 1,349,768 | ||||||
| 680,000 | 3.75%, 03/27/2019 | 707,431 | ||||||
| 17,993 | 4.00%, 06/01/2024 | 18,852 | ||||||
| 48,240 | 4.00%, 07/01/2026 | 50,657 | ||||||
| 47,595 | 4.00%, 10/01/2040 | 50,256 | ||||||
| 87,850 | 4.00%, 10/01/2040 | 92,755 | ||||||
| 65,126 | 4.00%, 10/01/2040 | 68,770 | ||||||
| 10,686 | 4.00%, 12/01/2040 | 11,284 | ||||||
| 54,145 | 4.00%, 12/01/2040 | 57,169 | ||||||
| 14,501 | 4.00%, 02/01/2041 | 15,312 | ||||||
| 92,031 | 4.00%, 02/01/2041 | 97,183 | ||||||
| 14,006 | 4.00%, 04/01/2041 | 14,789 | ||||||
| 85,881 | 4.00%, 01/01/2042 | 90,690 | ||||||
Shares or Principal Amount | Market Value(1) | |||||||
| U.S. GOVERNMENT AGENCIES - 15.8% - (continued) | ||||||||
| FHLMC - 4.5% - (continued) | ||||||||
| $ | 148,912 | 4.00%, 02/01/2042 | $ | 157,253 | ||||
| 248,434 | 4.00%, 11/01/2043 | 263,037 | ||||||
| 247,276 | 4.00%, 05/01/2044 | 260,260 | ||||||
| 152,315 | 4.00%, 07/01/2044 | 160,312 | ||||||
| 240,817 | 4.00%, 12/01/2046 | 253,461 | ||||||
| 1,682 | 4.50%, 05/01/2018 | 1,719 | ||||||
| 12,441 | 4.50%, 11/01/2024 | 13,227 | ||||||
| 37,967 | 4.50%, 09/01/2031 | 40,872 | ||||||
| 120,530 | 4.50%, 10/01/2039 | 130,066 | ||||||
| 19,500 | 4.50%, 05/01/2040 | 20,967 | ||||||
| 55,100 | 4.50%, 10/01/2040 | 59,235 | ||||||
| 106,830 | 4.50%, 06/01/2041 | 114,855 | ||||||
| 109,374 | 4.50%, 09/01/2041 | 117,512 | ||||||
| 33,059 | 5.00%, 05/01/2023 | 34,712 | ||||||
| 63,919 | 5.00%, 03/01/2027 | 69,391 | ||||||
| 45,849 | 5.00%, 11/01/2033 | 50,244 | ||||||
| 23,208 | 5.00%, 02/01/2038 | 25,385 | ||||||
| 5,136 | 5.00%, 04/01/2039 | 5,607 | ||||||
| 380,975 | 5.00%, 08/01/2041 | 418,860 | ||||||
| 61,136 | 5.00%, 08/01/2041 | 66,405 | ||||||
| 170,420 | 5.50%, 05/01/2036 | 190,467 | ||||||
| 12,744 | 5.50%, 05/01/2038 | 14,179 | ||||||
| 36,256 | 5.50%, 05/01/2038 | 40,360 | ||||||
| 40,250 | 5.50%, 08/01/2038 | 44,826 | ||||||
| 25,025 | 6.00%, 06/01/2036 | 28,373 | ||||||
| 24,012 | 6.00%, 04/01/2037 | 27,129 | ||||||
| 13,477 | 6.00%, 10/01/2037 | 15,178 | ||||||
| 150,000 | 6.25%, 07/15/2032 | 213,231 | ||||||
|
| |||||||
| 13,171,366 | ||||||||
|
| |||||||
| FNMA - 6.8% | ||||||||
| 900,000 | 1.75%, 06/20/2019 | 905,909 | ||||||
| 5,000 | 2.29%, 06/25/2026 | 4,784 | ||||||
| 10,000 | 2.37%, 07/25/2026(4) | 9,610 | ||||||
| 5,000 | 2.49%, 05/25/2026 | 4,860 | ||||||
| 10,000 | 2.50%, 10/25/2026(4) | 9,648 | ||||||
| 160,434 | 2.50%, 03/01/2027 | 162,346 | ||||||
| 74,500 | 2.50%, 07/01/2027 | 75,384 | ||||||
| 171,533 | 2.50%, 12/01/2027 | 173,574 | ||||||
| 93,878 | 2.50%, 02/01/2028 | 94,962 | ||||||
| 258,529 | 2.50%, 04/01/2028 | 261,506 | ||||||
| 241,489 | 2.50%, 07/01/2028 | 244,272 | ||||||
| 582,840 | 2.50%, 10/01/2031 | 586,678 | ||||||
| 129,936 | 2.50%, 01/01/2043 | 125,898 | ||||||
| 10,000 | 2.53%, 09/25/2026(4) | 9,742 | ||||||
| 15,000 | 2.53%, 09/25/2024 | 14,880 | ||||||
| 10,000 | 2.58%, 03/25/2026 | 9,818 | ||||||
| 15,000 | 2.59%, 12/25/2024 | 14,903 | ||||||
| 10,000 | 2.70%, 02/25/2026 | 9,924 | ||||||
| 10,000 | 2.72%, 10/25/2024 | 10,034 | ||||||
| 10,000 | 2.80%, 06/25/2025(4) | 10,010 | ||||||
| 10,000 | 2.90%, 01/25/2025(4) | 10,153 | ||||||
| 10,000 | 2.94%, 01/25/2026(4) | 10,122 | ||||||
| 39,028 | 3.00%, 12/01/2025 | 40,162 | ||||||
| 35,652 | 3.00%, 12/01/2026 | 36,617 | ||||||
| 76,073 | 3.00%, 03/01/2027 | 78,294 | ||||||
| 87,720 | 3.00%, 04/01/2027 | 90,279 | ||||||
| 250,615 | 3.00%, 07/01/2027 | 257,925 | ||||||
| 50,710 | 3.00%, 08/01/2027 | 52,131 | ||||||
| 169,252 | 3.00%, 02/01/2030 | 173,834 | ||||||
| 440,422 | 3.00%, 02/01/2032 | 452,365 | ||||||
The accompanying Notes are an integral part of these financial statements.
| 15 |
|
| HIMCO VIT Portfolio Diversifier Fund |
Schedule of Investments – (continued)
June 30, 2017 (Unaudited)
Shares or Principal Amount | Market Value(1) | |||||||
| U.S. GOVERNMENT AGENCIES - 15.8% - (continued) | ||||||||
| FNMA - 6.8% - (continued) | ||||||||
| $ | 37,380 | 3.00%, 04/01/2042 | $ | 37,561 | ||||
| 37,501 | 3.00%, 09/01/2042 | 37,548 | ||||||
| 73,951 | 3.00%, 11/01/2042 | 74,264 | ||||||
| 122,858 | 3.00%, 11/01/2042 | 123,379 | ||||||
| 167,114 | 3.00%, 12/01/2042 | 168,308 | ||||||
| 193,851 | 3.00%, 01/01/2043 | 194,662 | ||||||
| 108,089 | 3.00%, 02/01/2043 | 108,714 | ||||||
| 268,434 | 3.00%, 02/01/2043 | 269,558 | ||||||
| 157,741 | 3.00%, 04/01/2043 | 158,867 | ||||||
| 350,956 | 3.00%, 04/01/2043 | 353,891 | ||||||
| 93,724 | 3.00%, 04/01/2043 | 94,121 | ||||||
| 64,197 | 3.00%, 07/01/2043 | 64,452 | ||||||
| 114,071 | 3.00%, 10/01/2043 | 114,524 | ||||||
| 200,825 | 3.00%, 11/01/2043 | 200,696 | ||||||
| 936,647 | 3.00%, 03/01/2046 | 936,044 | ||||||
| 550,063 | 3.00%, 10/01/2046 | 550,011 | ||||||
| 111,970 | 3.00%, 11/01/2046 | 111,968 | ||||||
| 1,060,417 | 3.00%, 11/01/2046 | 1,059,734 | ||||||
| 413,545 | 3.00%, 12/01/2046 | 413,279 | ||||||
| 390,667 | 3.00%, 01/01/2047 | 390,416 | ||||||
| 7,976 | 3.50%, 09/01/2025 | 8,303 | ||||||
| 85,747 | 3.50%, 10/01/2028 | 89,527 | ||||||
| 160,663 | 3.50%, 07/01/2029 | 167,278 | ||||||
| 244,824 | 3.50%, 01/01/2041 | 252,818 | ||||||
| 48,248 | 3.50%, 02/01/2041 | 49,824 | ||||||
| 49,682 | 3.50%, 04/01/2041 | 51,316 | ||||||
| 65,214 | 3.50%, 11/01/2041 | 67,441 | ||||||
| 81,599 | 3.50%, 01/01/2042 | 84,198 | ||||||
| 32,058 | 3.50%, 03/01/2042 | 33,078 | ||||||
| 76,629 | 3.50%, 05/01/2042 | 79,067 | ||||||
| 100,567 | 3.50%, 06/01/2042 | 103,860 | ||||||
| 87,390 | 3.50%, 07/01/2042 | 90,144 | ||||||
| 234,304 | 3.50%, 07/01/2042 | 241,771 | ||||||
| 64,793 | 3.50%, 08/01/2042 | 66,852 | ||||||
| 87,326 | 3.50%, 08/01/2042 | 90,069 | ||||||
| 75,964 | 3.50%, 08/01/2042 | 78,356 | ||||||
| 319,673 | 3.50%, 09/01/2042 | 329,874 | ||||||
| 49,760 | 3.50%, 09/01/2042 | 51,307 | ||||||
| 96,107 | 3.50%, 09/01/2042 | 99,124 | ||||||
| 68,538 | 3.50%, 01/01/2043 | 70,624 | ||||||
| 205,644 | 3.50%, 05/01/2043 | 212,033 | ||||||
| 95,579 | 3.50%, 08/01/2043 | 98,701 | ||||||
| 96,744 | 3.50%, 08/01/2043 | 99,834 | ||||||
| 142,224 | 3.50%, 08/01/2043 | 146,858 | ||||||
| 80,935 | 3.50%, 08/01/2044 | 83,176 | ||||||
| 31,306 | 3.50%, 10/01/2044 | 32,173 | ||||||
| 80,353 | 3.50%, 01/01/2045 | 82,578 | ||||||
| 124,543 | 3.50%, 02/01/2045 | 127,993 | ||||||
| 669,514 | 3.50%, 11/01/2045 | 689,360 | ||||||
| 625,287 | 3.50%, 07/01/2046 | 642,607 | ||||||
| 198,355 | 3.50%, 01/01/2047 | 203,850 | ||||||
| 103,572 | 4.00%, 05/01/2020 | 107,221 | ||||||
| 28,372 | 4.00%, 04/01/2025 | 29,859 | ||||||
| 39,606 | 4.00%, 09/01/2025 | 41,680 | ||||||
| 48,483 | 4.00%, 08/01/2026 | 50,190 | ||||||
| 108,022 | 4.00%, 08/01/2040 | 114,074 | ||||||
| 19,790 | 4.00%, 08/01/2040 | 20,903 | ||||||
| 164,303 | 4.00%, 09/01/2040 | 173,393 | ||||||
| 7,878 | 4.00%, 10/01/2040 | 8,317 | ||||||
| 344,962 | 4.00%, 12/01/2040 | 364,075 | ||||||
| 132,120 | 4.00%, 02/01/2041 | 139,451 | ||||||
Shares or Principal Amount | Market Value(1) | |||||||
| U.S. GOVERNMENT AGENCIES - 15.8% - (continued) | ||||||||
| FNMA - 6.8% - (continued) | ||||||||
| $ | 36,216 | 4.00%, 04/01/2041 | $ | 38,089 | ||||
| 18,013 | 4.00%, 07/01/2041 | 19,096 | ||||||
| 44,121 | 4.00%, 09/01/2041 | 46,551 | ||||||
| 352,647 | 4.00%, 12/01/2041 | 373,509 | ||||||
| 141,702 | 4.00%, 01/01/2042 | 149,450 | ||||||
| 488,288 | 4.00%, 11/01/2043 | 516,966 | ||||||
| 28,413 | 4.00%, 01/01/2044 | 29,883 | ||||||
| 252,444 | 4.00%, 01/01/2044 | 266,413 | ||||||
| 26,397 | 4.00%, 05/01/2044 | 27,762 | ||||||
| 171,336 | 4.00%, 12/01/2044 | 180,197 | ||||||
| 17,915 | 4.50%, 05/01/2025 | 18,818 | ||||||
| 51,643 | 4.50%, 04/01/2026 | 54,539 | ||||||
| 10,128 | 4.50%, 04/01/2029 | 10,888 | ||||||
| 77,514 | 4.50%, 06/01/2030 | 83,304 | ||||||
| 14,731 | 4.50%, 08/01/2038 | 15,842 | ||||||
| 50,516 | 4.50%, 01/01/2039 | 54,181 | ||||||
| 34,640 | 4.50%, 02/01/2039 | 37,243 | ||||||
| 97,853 | 4.50%, 04/01/2039 | 105,197 | ||||||
| 32,014 | 4.50%, 11/01/2039 | 34,337 | ||||||
| 56,793 | 4.50%, 02/01/2040 | 61,296 | ||||||
| 112,780 | 4.50%, 09/01/2040 | 122,031 | ||||||
| 107,179 | 4.50%, 10/01/2040 | 115,705 | ||||||
| 77,395 | 4.50%, 04/01/2041 | 83,027 | ||||||
| 20,703 | 4.50%, 04/01/2041 | 22,392 | ||||||
| 93,155 | 4.50%, 04/01/2041 | 100,398 | ||||||
| 111,662 | 4.50%, 07/01/2041 | 120,817 | ||||||
| 178,388 | 4.50%, 01/01/2044 | 191,698 | ||||||
| 38,067 | 5.00%, 02/01/2022 | 38,982 | ||||||
| 31,383 | 5.00%, 05/01/2028 | 34,260 | ||||||
| 200,263 | 5.00%, 05/01/2035 | 219,854 | ||||||
| 169,605 | 5.00%, 08/01/2035 | 186,359 | ||||||
| 84,369 | 5.00%, 03/01/2037 | 92,104 | ||||||
| 1,515 | 5.00%, 05/01/2037 | 1,653 | ||||||
| 31,515 | 5.00%, 02/01/2039 | 34,421 | ||||||
| 45,912 | 5.00%, 04/01/2039 | 50,121 | ||||||
| 26,560 | 5.00%, 01/01/2040 | 29,045 | ||||||
| 253,728 | 5.00%, 01/01/2041 | 277,249 | ||||||
| 237,408 | 5.50%, 10/01/2035 | 264,337 | ||||||
| 26,096 | 5.50%, 05/01/2037 | 29,122 | ||||||
| 8,212 | 5.50%, 01/01/2038 | 9,137 | ||||||
| 13,371 | 5.50%, 02/01/2038 | 14,900 | ||||||
| 101,744 | 5.50%, 02/01/2038 | 113,908 | ||||||
| 52,207 | 5.50%, 06/01/2038 | 58,024 | ||||||
| 20,676 | 5.50%, 07/01/2038 | 22,989 | ||||||
| 19,442 | 5.50%, 08/01/2038 | 21,553 | ||||||
| 60,755 | 5.50%, 09/01/2038 | 67,472 | ||||||
| 17,687 | 5.50%, 05/01/2040 | 19,697 | ||||||
| 130,000 | 5.63%, 07/15/2037 | 178,472 | ||||||
| 30,531 | 6.00%, 04/01/2036 | 34,498 | ||||||
| 50,537 | 6.00%, 07/01/2037 | 57,262 | ||||||
| 76,081 | 6.00%, 07/01/2037 | 86,354 | ||||||
| 29,395 | 6.50%, 06/01/2039 | 33,144 | ||||||
| 53,000 | 6.63%, 11/15/2030 | 75,772 | ||||||
|
| |||||||
| 19,906,096 | ||||||||
|
| |||||||
| GNMA - 4.1% | ||||||||
| 23,221 | 2.50%, 10/15/2027 | 23,633 | ||||||
| 70,393 | 2.50%, 01/15/2043 | 68,839 | ||||||
| 148,325 | 2.50%, 03/20/2047 | 144,798 | ||||||
| 47,446 | 3.00%, 04/15/2027 | 49,057 | ||||||
| 94,781 | 3.00%, 03/20/2028 | 97,974 | ||||||
The accompanying Notes are an integral part of these financial statements.
| 16 |
|
| HIMCO VIT Portfolio Diversifier Fund |
Schedule of Investments – (continued)
June 30, 2017 (Unaudited)
Shares or Principal Amount | Market Value(1) | |||||||
| U.S. GOVERNMENT AGENCIES - 15.8% - (continued) | ||||||||
| GNMA - 4.1% - (continued) | ||||||||
| $ | 40,751 | 3.00%, 06/20/2042 | $ | 41,320 | ||||
| 175,181 | 3.00%, 08/20/2042 | 177,628 | ||||||
| 178,661 | 3.00%, 09/20/2042 | 181,157 | ||||||
| 105,335 | 3.00%, 11/15/2042 | 106,845 | ||||||
| 135,776 | 3.00%, 12/20/2042 | 137,673 | ||||||
| 100,014 | 3.00%, 05/15/2043 | 101,439 | ||||||
| 224,309 | 3.00%, 06/20/2043 | 227,442 | ||||||
| 207,434 | 3.00%, 07/20/2043 | 210,332 | ||||||
| 232,576 | 3.00%, 10/20/2045 | 235,166 | ||||||
| 668,077 | 3.00%, 09/20/2046 | 675,517 | ||||||
| 486,000 | 3.00%, 11/20/2046 | 491,413 | ||||||
| 978,898 | 3.00%, 12/20/2046 | 989,800 | ||||||
| 8,815 | 3.50%, 09/15/2025 | 9,210 | ||||||
| 30,444 | 3.50%, 09/20/2040 | 31,567 | ||||||
| 36,468 | 3.50%, 12/15/2040 | 37,805 | ||||||
| 14,333 | 3.50%, 02/15/2041 | 14,858 | ||||||
| 13,350 | 3.50%, 12/20/2041 | 13,874 | ||||||
| 71,582 | 3.50%, 01/20/2042 | 74,414 | ||||||
| 30,390 | 3.50%, 02/20/2042 | 31,601 | ||||||
| 18,712 | 3.50%, 03/15/2042 | 19,405 | ||||||
| 131,404 | 3.50%, 04/20/2042 | 136,683 | ||||||
| 162,662 | 3.50%, 05/20/2042 | 169,196 | ||||||
| 8,904 | 3.50%, 06/15/2042 | 9,230 | ||||||
| 57,527 | 3.50%, 06/15/2042 | 59,752 | ||||||
| 91,966 | 3.50%, 06/20/2042 | 95,745 | ||||||
| 109,959 | 3.50%, 08/20/2042 | 114,376 | ||||||
| 140,720 | 3.50%, 04/20/2043 | 146,373 | ||||||
| 173,733 | 3.50%, 07/20/2043 | 180,713 | ||||||
| 101,637 | 3.50%, 08/15/2043 | 105,878 | ||||||
| 288,115 | 3.50%, 09/20/2043 | 299,691 | ||||||
| 858,389 | 3.50%, 04/20/2045 | 890,039 | ||||||
| 1,242,713 | 3.50%, 11/20/2046 | 1,288,534 | ||||||
| 688,218 | 3.50%, 01/20/2047 | 713,594 | ||||||
| 14,881 | 4.00%, 08/15/2026 | 15,596 | ||||||
| 223,910 | 4.00%, 08/15/2039 | 235,714 | ||||||
| 28,763 | 4.00%, 07/20/2040 | 30,504 | ||||||
| 17,792 | 4.00%, 08/15/2040 | 18,780 | ||||||
| 18,733 | 4.00%, 10/20/2040 | 19,895 | ||||||
| 115,860 | 4.00%, 12/15/2040 | 122,708 | ||||||
| 36,360 | 4.00%, 06/15/2041 | 38,374 | ||||||
| 29,914 | 4.00%, 09/15/2041 | 32,140 | ||||||
| 13,407 | 4.00%, 12/20/2041 | 14,190 | ||||||
| 27,265 | 4.00%, 01/20/2042 | 28,851 | ||||||
| 16,880 | 4.00%, 03/20/2042 | 17,855 | ||||||
| 63,444 | 4.00%, 05/20/2042 | 67,092 | ||||||
| 45,508 | 4.00%, 06/15/2042 | 47,961 | ||||||
| 248,354 | 4.00%, 06/20/2044 | 261,547 | ||||||
| 200,816 | 4.00%, 09/20/2044 | 211,483 | ||||||
| 221,587 | 4.00%, 11/20/2044 | 233,359 | ||||||
| 424,325 | 4.00%, 11/20/2045 | 446,866 | ||||||
| 247,774 | 4.00%, 03/20/2047 | 260,986 | ||||||
| 67,354 | 4.50%, 05/15/2039 | 73,495 | ||||||
| 221,322 | 4.50%, 09/15/2039 | 242,132 | ||||||
| 20,123 | 4.50%, 04/15/2040 | 21,578 | ||||||
| 6,598 | 4.50%, 05/20/2040 | 7,089 | ||||||
| 8,230 | 4.50%, 06/15/2040 | 8,822 | ||||||
| 50,444 | 4.50%, 06/20/2040 | 54,202 | ||||||
| 142,742 | 4.50%, 09/20/2040 | 153,431 | ||||||
| 95,699 | 4.50%, 10/15/2040 | 103,140 | ||||||
| 30,201 | 4.50%, 10/20/2040 | 32,562 | ||||||
| 65,541 | 4.50%, 03/20/2041 | 70,429 | ||||||
Shares or Principal Amount | Market Value(1) | |||||||
| U.S. GOVERNMENT AGENCIES - 15.8% - (continued) | ||||||||
| GNMA - 4.1% - (continued) | ||||||||
| $ | 13,833 | 4.50%, 04/15/2041 | $ | 15,002 | ||||
| 42,182 | 4.50%, 06/20/2041 | 45,326 | ||||||
| 92,939 | 5.00%, 11/20/2035 | 102,312 | ||||||
| 43,803 | 5.00%, 09/15/2039 | 48,105 | ||||||
| 75,120 | 5.00%, 02/15/2040 | 82,886 | ||||||
| 104,509 | 5.00%, 09/20/2040 | 114,822 | ||||||
| 64,595 | 5.00%, 02/20/2041 | 71,002 | ||||||
| 54,482 | 5.00%, 03/20/2041 | 60,156 | ||||||
| 58,544 | 5.00%, 08/20/2041 | 64,276 | ||||||
| 16,409 | 5.00%, 12/20/2041 | 18,256 | ||||||
| 15,764 | 5.50%, 05/20/2038 | 17,370 | ||||||
| 38,781 | 5.50%, 07/15/2038 | 43,185 | ||||||
| 36,785 | 5.50%, 08/20/2041 | 40,735 | ||||||
| 77,496 | 6.00%, 02/15/2036 | 87,363 | ||||||
| 19,376 | 6.00%, 08/20/2041 | 21,748 | ||||||
|
| |||||||
| 12,105,896 | ||||||||
|
| |||||||
| Tennessee Valley Authority - 0.1% | ||||||||
| 213,000 | 6.75%, 11/01/2025 | 279,100 | ||||||
|
| |||||||
Total U.S. Government Agencies | 46,191,670 | |||||||
|
| |||||||
| U.S. GOVERNMENT SECURITIES - 17.6% | ||||||||
| U.S. Treasury Securities - 17.6% | ||||||||
| U.S. Treasury Bonds - 2.5% | ||||||||
| 1,160,000 | 2.50%, 02/15/2045 | 1,082,561 | ||||||
| 3,660,000 | 2.50%, 02/15/2046 | 3,406,658 | ||||||
| 276,000 | 3.13%, 11/15/2041 | 292,258 | ||||||
| 2,180,000 | 3.13%, 02/15/2043 | 2,303,135 | ||||||
| 100,000 | 3.50%, 02/15/2039 | 112,981 | ||||||
|
| |||||||
| 7,197,593 | ||||||||
|
| |||||||
| U.S. Treasury Notes - 15.1% | ||||||||
| 5,500,000 | 1.00%, 11/30/2018 | 5,473,358 | ||||||
| 3,300,000 | 1.13%, 02/28/2021 | 3,232,970 | ||||||
| 4,000,000 | 1.25%, 11/30/2018 | 3,994,688 | ||||||
| 1,000,000 | 1.38%, 03/31/2020 | 996,289 | ||||||
| 6,920,000 | 1.63%, 06/30/2019 | 6,950,815 | ||||||
| 2,650,000 | 1.63%, 05/15/2026 | 2,512,325 | ||||||
| 6,838,000 | 1.75%, 05/15/2022 | 6,800,603 | ||||||
| 2,750,000 | 2.00%, 02/15/2025 | 2,712,295 | ||||||
| 3,800,000 | 2.00%, 11/15/2026 | 3,705,296 | ||||||
| 315,000 | 2.13%, 05/15/2025 | 313,019 | ||||||
| 2,410,000 | 2.75%, 11/15/2023 | 2,508,661 | ||||||
| 2,825,000 | 2.75%, 02/15/2024 | 2,939,325 | ||||||
| 2,215,000 | 3.13%, 05/15/2021 | 2,330,421 | ||||||
|
| |||||||
| 44,470,065 | ||||||||
|
| |||||||
Total U.S. Government Securities | 51,667,658 | |||||||
|
| |||||||
Total Long-Term investments - Excluding Purchased Options | 218,623,849 | |||||||
|
| |||||||
The accompanying Notes are an integral part of these financial statements.
| 17 |
|
| HIMCO VIT Portfolio Diversifier Fund |
Schedule of Investments – (continued)
June 30, 2017 (Unaudited)
Shares or Principal Amount | Market Value(1) | |||||||||||
| SHORT-TERM INVESTMENTS - 12.9% | ||||||||||||
| Repurchase Agreements - 0.3% | ||||||||||||
RBC Capital Markets LLC TriParty Repurchase Agreement (dated 06/30/2017, repurchase price $779,069, collateralized by FNMA 6.00%, 2036, GNMA 3.50% - 4.00%, 2043 - 2047, U.S. Treasury Bill 0.00% , 2017, value of $792,459) |
| |||||||||||
| 779,000 | 1.06%, 07/03/2017 | $ | 779,000 | |||||||||
|
| |||||||||||
| U.S. Government Agencies - 12.6% | ||||||||||||
| FHLB - 4.4% | ||||||||||||
| 10,000,000 | 0.87%, 08/23/2017(6) | 9,985,550 | ||||||||||
| 3,000,000 | 1.05%, 08/23/2017(6) | 2,995,665 | ||||||||||
|
| |||||||||||
| 12,981,215 | ||||||||||||
|
| |||||||||||
| FHLMC - 4.4% | ||||||||||||
| 3,000,000 | 1.01%, 10/05/2017(6) | 2,991,696 | ||||||||||
| 4,043,000 | 1.03%, 08/11/2017(6) | 4,038,532 | ||||||||||
| 6,000,000 | 1.08%, 11/03/2017(6) | 5,978,064 | ||||||||||
|
| |||||||||||
| 13,008,292 | ||||||||||||
|
| |||||||||||
Shares or Principal Amount | Market Value(1) | |||||||||||
| SHORT-TERM INVESTMENTS - 12.9% - (continued) | ||||||||||||
| FNMA - 3.8% | ||||||||||||
| 6,000,000 | 0.80%, 07/05/2017(6) | $ | 5,999,664 | |||||||||
| 5,000,000 | 0.92%, 09/07/2017(6) | 4,990,560 | ||||||||||
|
| |||||||||||
| 10,990,224 | ||||||||||||
|
| |||||||||||
| 36,979,731 | ||||||||||||
|
| |||||||||||
Total Short-Term investments | 37,758,731 | |||||||||||
|
| |||||||||||
Total Investments Excluding Purchased Options | 87.6 | % | $ | 256,382,580 | ||||||||
Total Purchased Options | 7.1 | % | 20,798,665 | |||||||||
|
|
|
| |||||||||
Total Investments | 94.7 | % | $ | 277,181,245 | ||||||||
Other Assets and Liabilities | 5.3 | % | 15,395,708 | |||||||||
|
|
|
| |||||||||
Total Net Assets | 100.0 | % | $ | 292,576,953 | ||||||||
|
|
|
| |||||||||
| Note: | Percentage of investments as shown is the ratio of the total market value to total net assets. |
| The Fund may refer to any one or more of the industry classifications used by one or more widely recognized market indices, ratings group indices and/or as defined by Fund management. Industry classifications may not be identical across all security types. |
| Equity industry classifications used in this report are the Global Industry Classification Standard (GICS®), which was developed by and is the exclusive property and service mark of MSCI, Inc. and S&P. |
| For Fund compliance purposes, the Fund may not use the same classification system shown in this report as these classifications are used for reporting ease. |
| (1) | See Significant Accounting Policies of accompanying Notes to Financial Statements regarding valuation of securities. |
| (2) | Non-income producing. |
| (3) | Affiliated company as defined under Sections 2(a)(2) and 2(a)(3) of the Investment Company Act of 1940. Hartford Investment Management Company, the Fund’s adviser, is a wholly-owned subsidiary of The Hartford Financial Services Group, Inc. A summary of transactions for the six-month period ended June 30, 2017 is as follows: |
Company | Beginning Value At January 1, 2017 | Purchase Cost | Sales Proceeds | Realized Gain (Loss) | Unrealized Gain (Loss) | Ending Value At June 30, 2017 | Dividend Income | |||||||||||||||||||||
Hartford Financial Services Group, Inc. (The) | $ | 81,100 | $ | — | $ | (19,853) | $ | 3,217 | $ | 3,562 | $ | 68,026 | $ | 639 | ||||||||||||||
| (4) | Variable rate securities; the rate reported is the coupon rate in effect at June 30, 2017. |
| (5) | Securities issued within terms of a private placement memorandum, exempt from registration under Rule 144A under the Securities Act of 1933, as amended, and may be sold only to qualified institutional buyers. Unless otherwise indicated, these holdings are determined to be liquid. At June 30, 2017, the aggregate value of these securities was $527,649, which represents 0.2% of total net assets. |
| (6) | The interest rate disclosed for these securities represents the effective yield on the date of the acquisition. |
The accompanying Notes are an integral part of these financial statements.
| 18 |
|
| HIMCO VIT Portfolio Diversifier Fund |
Schedule of Investments – (continued)
June 30, 2017 (Unaudited)
| (7) | At June 30, 2017, the cost of securities for federal income tax purposes was $278,749,581, and the aggregate gross unrealized appreciation and depreciation based on that cost were: |
Unrealized Appreciation | $ | 21,078,493 | ||
Unrealized Depreciation | (22,646,829 | ) | ||
|
| |||
Net Unrealized Depreciation | $ | (1,568,336 | ) | |
|
|
Futures Contracts Outstanding at June 30, 2017
Description | Number of Contracts | Expiration Date | Aggregate Cost | Notional Value | Unrealized Appreciation/ (Depreciation) | |||||||||||||||
Short position contracts: | ||||||||||||||||||||
S&P 500 (E-Mini) | (433 | ) | 09/15/2017 | (52,597,718 | ) | $ (52,412,478) | $ 185,240 | |||||||||||||
Cash of $3,700,000 was pledged as initial margin deposit and collateral for the daily variation margin on open futures contracts at June 30, 2017.
OTC Option Contracts Outstanding at June 30, 2017
Description | Counterparty | Risk Exposure Category | Exercise Price | Expiration Date | Number of Contracts | Market Value | Premiums Received/Paid by Fund(1) | Unrealized Appreciation Depreciation | ||||||||||||||||||||||||
Purchased option contracts: | ||||||||||||||||||||||||||||||||
Put option contracts | ||||||||||||||||||||||||||||||||
S&P 500 Index Option | BCLY | EQ | 2,098 | 11/02/21 | 31,706 | $ | 6,932,961 | $ | 13,320,087 | $ | (6,387,126 | ) | ||||||||||||||||||||
S&P 500 Index Option | CSI | EQ | 2,098 | 11/02/21 | 31,705 | 6,932,743 | 13,290,419 | (6,357,676 | ) | |||||||||||||||||||||||
S&P 500 Index Option | JPM | EQ | 2,098 | 11/02/21 | 31,706 | 6,932,961 | 13,371,213 | (6,438,252 | ) | |||||||||||||||||||||||
|
|
|
|
|
|
|
| |||||||||||||||||||||||||
Total put option contracts |
| 95,117 | $ | 20,798,665 | $ | 39,981,719 | $ | (19,183,054 | ) | |||||||||||||||||||||||
|
|
|
|
|
|
|
| |||||||||||||||||||||||||
Total purchased option contracts |
| 95,117 | $ | 20,798,665 | $ | 39,981,719 | $ | (19,183,054 | ) | |||||||||||||||||||||||
|
|
|
|
|
|
|
| |||||||||||||||||||||||||
| (1) | For purchased options, premiums are paid by the Fund, for written options, premiums are received. |
| The brokers deposited securities valued at $14,119,762 and cash of $7,040,000 with the custodian to serve as collateral for the options purchased by the Fund. The collateral is maintained in a segregated account at the custodian on behalf of the Fund. Since the brokers retain legal title to the securities, the securities are not considered assets of the Fund and are not included in the Statement of Assets and Liabilities. |
| GLOSSARY: (abbreviations used in preceding Schedule of Investments) | ||
| Index Abbreviations: | ||
MSCI | Morgan Stanley Capital International | |
S&P | Standard & Poor’s | |
| Other Abbreviations: | ||
EQ | Equity | |
ETF | Exchange Traded Fund | |
FHLB | Federal Home Loan Bank | |
FHLMC | Federal Home Loan Mortgage Corp. | |
FNMA | Federal National Mortgage Association | |
GNMA | Government National Mortgage Association | |
MTN | Medium Term Note | |
REIT | Real Estate Investment Trust | |
| Municipal Abbreviations: | ||
DA | Development Authority | |
GO | General Obligation | |
| Counterparty Abbreviations: | ||
BCLY | Barclays Bank PLC | |
CSI | Credit Suisse International | |
JPM | JP Morgan Chase & Co. | |
RBC | RBC Dominion Securities | |
The accompanying Notes are an integral part of these financial statements.
| 19 |
|
| HIMCO VIT Portfolio Diversifier Fund |
Schedule of Investments – (concluded)
June 30, 2017 (Unaudited)
Credit Exposure
as of June 30, 2017
| Credit Rating* | Percentage of Net Assets | |||
AAA/Aaa | 20.7 | % | ||
AA/Aa | 17.0 | |||
A | 6.3 | |||
BBB/Baa | 5.4 | |||
Not Rated | 0.1 | |||
Non-Debt Securities and Other Short-Term Instruments | 45.2 | |||
Other assets and liabilities | 5.3 | |||
|
| |||
Total | 100.0 | % | ||
|
| |||
| * | Credit exposure is the long-term credit ratings for the Fund’s holdings, as of the date noted, as provided by Standard and Poor’s Corporation (“S&P”), Moody’s Investors Service, Inc. (“Moody’s”) or Fitch. Inc. (“Fitch”) and typically range from AAA/Aaa (highest) to C/D (lowest). Presentation of S&P, Moody’s and Fitch credit ratings in this report have been selected for informational purposes for shareholders, as well as the Fund’s consideration of industry practice. If S&P, Moody’s and Fitch assign different ratings, the median rating is used. If only two agencies assign ratings, the lower rating is used. Fixed income securities that are not rated by either agency are listed as “Not Rated.” Ratings do not apply to the Fund itself or to the Fund’s shares. Ratings may change. |
Investment Valuation Hierarchy Level Summary at June 30, 2017
Description | Total | Level 1(1) | Level 2(1) | Level 3(1) | ||||||||||||
Assets: | ||||||||||||||||
Common Stocks(2) | $ | 73,142,835 | $ | 73,142,835 | $ | — | $ | — | ||||||||
Exchange-Traded Funds | 681,724 | 681,724 | — | — | ||||||||||||
Asset & Commercial Mortgage Backed Securities | 1,111,877 | — | 1,111,877 | — | ||||||||||||
Corporate Bonds | 41,771,456 | — | 41,771,456 | — | ||||||||||||
Foreign Government Obligations | 3,152,781 | — | 3,061,919 | 90,862 | ||||||||||||
Municipal Bonds | 903,848 | — | 903,848 | — | ||||||||||||
U.S. Government Agencies | 46,191,670 | — | 46,191,670 | — | ||||||||||||
U.S. Government Securities | 51,667,658 | — | 51,667,658 | — | ||||||||||||
Short-Term Investments | 37,758,731 | — | 37,758,731 | — | ||||||||||||
Put Options Purchased | 20,798,665 | — | 20,798,665 | — | ||||||||||||
|
|
|
|
|
|
|
| |||||||||
Total | $ | 277,181,245 | $ | 73,824,559 | $ | 203,265,824 | $ | 90,862 | ||||||||
|
|
|
|
|
|
|
| |||||||||
Futures(3) | $ | 185,240 | $ | 185,240 | $ | — | $ | — | ||||||||
|
|
|
|
|
|
|
| |||||||||
Total | $ | 185,240 | $ | 185,240 | $ | — | $ | — | ||||||||
|
|
|
|
|
|
|
| |||||||||
| (1) | For the six-month period ended June 30, 2017, investments valued at $2,405,370 were transferred from Leve1 1 to Level 2 due to a U.S. Treasury security that no longer represented the most recent issue and is exclusively traded in the secondary market. For the same time period investments valued at $40,500 were transferred from Level 3 to Level 2 due to a security that was previously valued using significant unobservable inputs but is now valued using observable inputs. |
| (2) | Refer to the Schedule of Investments for further industry breakout. |
| (3) | Derivative instruments (excluding purchased and written options, if applicable) are valued at the unrealized appreciation/depreciation on the investments. |
| Note: | For purposes of reporting transfers between different hierarchy levels, both transfers in and out of each level, as applicable, are shown as if they occurred at the beginning of the period. |
| Level 3 investments held by the Fund at the beginning and/or end of the period in relation to net assets were not significant and accordingly, a reconciliation of Level 3 assets for the six-month period ended June 30, 2017 is not presented. |
| None of the unobservable inputs for Level 3 assets, individually or collectively, had a material impact on the Fund. |
The accompanying Notes are an integral part of these financial statements.
| 20 |
|
| HIMCO VIT Portfolio Diversifier Fund |
Statement of Assets and Liabilities
June 30, 2017 (Unaudited)
Assets: |
| |||
Investments in unaffiliated securities, at market value (cost $278,112,207) | $ | 277,113,219 | ||
Investments in affiliated securities, at market value (cost $53,589) | 68,026 | |||
Cash(1) | 14,716,452 | |||
Receivables: |
| |||
Investment securities sold | 766,687 | |||
Dividends and interest | 939,177 | |||
Other assets | 2,764 | |||
|
| |||
Total assets | 293,606,325 | |||
|
| |||
Liabilities: |
| |||
Payables: |
| |||
Investment securities purchased | 715,809 | |||
Fund shares redeemed | 67,646 | |||
Investment management fees | 110,570 | |||
Variation margin on futures contracts | 19,485 | |||
Distribution fees | 60,519 | |||
Trustees fees | 184 | |||
Accrued expenses | 55,159 | |||
|
| |||
Total liabilities | 1,029,372 | |||
|
| |||
Net assets | $ | 292,576,953 | ||
|
| |||
Summary of Net Assets: |
| |||
Capital stock and paid-in-capital | $ | 400,309,821 | ||
Undistributed net investment income | 4,393,578 | |||
Accumulated net realized loss | (111,327,135 | ) | ||
Unrealized depreciation of investments | (799,311 | ) | ||
|
| |||
Net assets | $ | 292,576,953 | ||
|
| |||
Class IB: Net asset value per share | $ | 7.18 | ||
|
| |||
Shares Outstanding | 40,745,262 | |||
|
| |||
Net Assets | $ | 292,576,953 | ||
|
| |||
| (1) | Cash of $3,700,000 was pledged as initial margin deposit and collateral for the daily variation margin on open futures contracts at June 30, 2017. |
The accompanying Notes are an integral part of these financial statements.
| 21 |
|
| HIMCO VIT Portfolio Diversifier Fund |
For the Six-Month Period Ended June 30, 2017 (Unaudited)
Investment Income: |
| |||
Dividends from unaffiliated securities | $ | 786,635 | ||
Dividends from affiliated securities | 639 | |||
Interest | 1,953,461 | |||
Other Income | 205 | |||
|
| |||
Total investment income, net | 2,740,940 | |||
|
| |||
Expenses: |
| |||
Investment management fees | 895,848 | |||
Transfer agent fees | 2,415 | |||
Distribution fees - Class IB | 373,270 | |||
Custodian fees | 17,166 | |||
Accounting service fees | 105,456 | |||
Trustees fees | 18,933 | |||
Audit fees | 15,896 | |||
Printing fees | 14,510 | |||
Legal fees | 21,334 | |||
Insurance fees | 10,210 | |||
Other expenses | 9,421 | |||
|
| |||
Total expenses (before waivers) | 1,484,459 | |||
|
| |||
Total waivers | (209,864 | ) | ||
|
| |||
Total expenses, net | 1,274,595 | |||
|
| |||
Net Investment Income | 1,466,345 | |||
|
| |||
Net Realized Gain (Loss) on Investments and Other Financial Instruments: |
| |||
Net realized gain on investments in unaffiliated securities | 6,946,983 | |||
Net realized gain on investments in affiliated securities | 3,217 | |||
Net realized loss on futures | (5,255,646 | ) | ||
|
| |||
Net Realized Gain on Investments and Other Financial Instruments | 1,694,554 | |||
|
| |||
Net Changes in Unrealized Appreciation (Depreciation) of Investments and Other Financial Instruments: |
| |||
Net unrealized appreciation of investments | 851,678 | |||
Net unrealized depreciation of purchased options | (10,824,381 | ) | ||
Net unrealized appreciation of futures contracts | 321,118 | |||
|
| |||
Net Changes in Unrealized Depreciation of Investments and Other Financial Instruments | (9,651,585 | ) | ||
|
| |||
Net Realized and Unrealized Loss on Investments and Other Financial Instruments | (7,957,031 | ) | ||
|
| |||
Net Decrease in Net Assets Resulting from Operations | $ | (6,490,686 | ) | |
|
| |||
The accompanying Notes are an integral part of these financial statements.
| 22 |
|
| HIMCO VIT Portfolio Diversifier Fund |
Statements of Changes in Net Assets
| For the Six-Month Period Ended June 30, 2017 (Unaudited) | For the Year Ended December 31, 2016 | |||||||
Operations: |
| |||||||
Net investment income | $ | 1,466,345 | $ | 2,537,220 | ||||
Net realized gain on investments and other financial instruments | 1,694,554 | (18,732,372 | ) | |||||
Net unrealized appreciation (depreciation) of investments and other financial instruments | (9,651,585 | ) | 2,238,371 | |||||
|
|
|
| |||||
Net Decrease in Net Assets Resulting from Operations | (6,490,686 | ) | (13,956,781 | ) | ||||
|
|
|
| |||||
Distributions to Shareholders: |
| |||||||
From net investment income |
| |||||||
Capital Share Transactions: |
| |||||||
Class IB |
| |||||||
Sold | 14,390,317 | 54,100,898 | ||||||
Redeemed | (27,872,269 | ) | (72,733,609 | ) | ||||
|
|
|
| |||||
Total capital share transactions | (13,481,952 | ) | (18,632,711 | ) | ||||
|
|
|
| |||||
Net decrease from capital share transactions | (13,481,952 | ) | (18,632,711 | ) | ||||
|
|
|
| |||||
Net Decrease in Net Assets | (19,972,638 | ) | (32,589,492 | ) | ||||
|
|
|
| |||||
Net Assets: |
| |||||||
Beginning of period | 312,549,591 | 345,139,083 | ||||||
|
|
|
| |||||
End of period | $ | 292,576,953 | $ | 312,549,591 | ||||
|
|
|
| |||||
Undistributed net investment income | $ | 4,393,578 | $ | 2,927,233 | ||||
|
|
|
| |||||
Shares: |
| |||||||
Class IB |
| |||||||
Sold | 1,991,417 | 7,156,098 | ||||||
Redeemed | (3,853,465 | ) | (9,439,893 | ) | ||||
|
|
|
| |||||
Total share activity | (1,862,048 | ) | (2,283,795 | ) | ||||
|
|
|
| |||||
The accompanying Notes are an integral part of these financial statements.
| 23 |
|
| HIMCO VIT Portfolio Diversifier Fund |
June 30, 2017 (Unaudited)
| 1. | Organization: |
HIMCO Variable Insurance Trust (the “Trust”) is an open-end registered management investment company. The Trust is organized under the laws of the State of Delaware and is registered with the Securities and Exchange Commission (“SEC”) under the Investment Company Act of 1940, as amended (“1940 Act”).
HIMCO VIT Portfolio Diversifier Fund (the “Fund”) serves as an underlying investment option for certain variable annuity separate accounts of Hartford Life Insurance Company (“Hartford Life”) and its affiliates and Forethought Life Insurance Company (“Forethought”). The Fund’s shares are available only to separate accounts of Hartford Life and its affiliates and Forethought who have elected a guaranteed benefit rider subject to an allocation requiring investment in the Fund.
The Fund is a series of the Trust. The Fund is the successor of a series of Hartford Series Fund, Inc. (the “Hartford Portfolio Diversifier HLS Fund”). The reorganization of the Hartford Portfolio Diversifier HLS Fund with and into the Fund occurred on October 20, 2014. All information regarding and references to periods prior to October 20, 2014 relate to the Hartford Portfolio Diversifier HLS Fund. The Fund is a diversified open-end management investment company and applies specialized accounting and reporting under Accounting Standards Codification Topic 946, Financial Services – Investment Companies. The Fund is authorized to issue an unlimited number of shares.
Class IB shares of the Fund are offered at the per share net asset value (“NAV”) without a sales charge and are subject to distribution and service fees charged pursuant to a distribution plan (the “Distribution Plan”) approved by the Board of Trustees in accordance with Rule 12b-1 under the 1940 Act and the requirements of the applicable market conduct rules of the Financial Industry Regulatory Authority concerning asset-based sales charges.
| 2. | Significant Accounting Policies: |
The following is a summary of significant accounting policies followed by the Fund in the preparation of its financial statements, which are in accordance with United States Generally Accepted Accounting Principles (“U.S. GAAP”). The preparation of financial statements in accordance with U.S. GAAP may require management to make estimates and assumptions that affect the reported amounts of assets and liabilities and disclosure of contingent assets and liabilities at the date of the financial statements and the reported amounts of increases and decreases in net assets resulting from operations during the reporting period. Actual results could differ from those estimates.
| a) | Determination of Net Asset Value – The NAV per share is determined for the Fund’s shares as of the close of regular trading on the New York Stock Exchange (the “Exchange”) (normally 4:00 p.m. Eastern Time) (the “NYSE Close”) on each day that the Exchange is open (“Valuation Date”). If the Exchange is closed due to weather or other extraordinary circumstances on a day it would typically be open for business, the Fund will treat such day as a typical business day and accept purchase and redemption orders and calculate the Fund’s NAV as of 4:00 p.m. Eastern Time. The NAV for each share is determined by dividing the value of the Fund’s net assets by the number of shares outstanding. For any day where, due to technical or other issues, trading is halted before the scheduled close of the Exchange, and not as part of a trading halt that is effected on a market-wide basis, the Fund may elect to continue to treat the Valuation Date as occurring at the time of the schedule close of the Exchange. Information that becomes known to the Fund after the NAV has been calculated on a particular day will not generally be used to retroactively adjust the NAV determined earlier that day. |
| b) | Investment Valuation and Fair Value Measurements – For purposes of calculating the NAV, portfolio securities and other assets held in the Fund’s portfolio for which market prices are readily available are valued at market value. Market value is generally determined on the basis of last reported sales prices or official close price. If no sales were reported, market value is based on prices obtained from independent pricing services, a quotation reporting system or established market makers. If market prices are not readily available or are deemed unreliable, the Fund will use the fair value of the security or other instrument as determined in good faith under policies and procedures established by and under the supervision of the Board of Trustees. Market prices are considered not readily available where there is an absence of current or reliable market-based data (e.g., trade information or broker quotes), including where events occur after the close of the relevant market, but prior to the NYSE Close that materially affect the values of the Fund’s portfolio holdings or assets. In addition, market prices are considered not readily available when, due to extraordinary circumstances, the exchanges or markets on which the securities or other instruments trade do not open for trading for |
| 24 |
|
| HIMCO VIT Portfolio Diversifier Fund |
Notes to Financial Statements – (continued)
June 30, 2017 (Unaudited)
| the entire day and no other market prices are available. Securities and other instruments that are primarily traded on foreign markets may trade on days that are not business days of the Fund. The value of the foreign securities or other instruments in which the Fund invests may change on days when a shareholder will not be able to purchase or redeem shares of the Fund. Fair value pricing is subjective in nature and the use of fair value pricing by the Fund may cause the NAV of its shares to differ significantly from the NAV that would have been calculated using market prices at the close of the exchange on which a portfolio holding is primarily traded. There can be no assurance that the Fund could obtain the fair value assigned to an investment if the Fund were to sell the investment at approximately the time at which the Fund determines its NAV. |
Fixed income securities, including those with a remaining maturity of less than sixty (60 days), and non-exchange traded derivatives held by the Fund are valued in accordance with procedures established by the Board of Trustees. Such investments are normally valued on the basis of quotes obtained from independent pricing services or brokers and dealers. Prices obtained from independent pricing services use information provided by market makers or estimates of market values obtained from yield data relating to investments or securities with similar characteristics. Senior floating rate interests generally trade in over-the-counter (“OTC”) markets and are priced through an independent pricing service utilizing independent market quotations from loan dealers or financial institutions. Generally, the Fund may use fair valuation in regard to fixed income positions when the Fund holds defaulted or distressed investments or investments in a company in which a reorganization is pending. If pricing services do not provide a price for short term investments maturing in 60 days or less, such investments are generally valued at amortized cost if their original term to maturity was 60 days or less, or by amortizing their value on the 61st day prior to maturity, if the original term exceeded 60 days.
Exchange traded futures, options and options on futures are valued in accordance with procedures established by the Board of Trustees. Such instruments are normally valued on the basis of quotes obtained from independent pricing services. Prices obtained from independent pricing services use most recent settlement prices and/or bid and ask prices for futures; and last sale prices and bid and ask prices for options and options on futures. If pricing services are not able to provide prices for futures, such instruments will generally be valued at the most recent trade price as of the NYSE Close. If pricing services are not able to provide prices for options and options on futures, such instruments will generally be valued on the basis of quotes obtained from brokers, dealers or market makers. If the option is out of the money, within 30 days of expiration and no bid price is available, the option may be valued at zero. If such instruments do not trade on an exchange, values may be supplied by an independent pricing service using a formula or other objective method that may take into consideration the style, direction, expiration, strike price, notional value and volatility or other adjustments.
Investments in registered open-end investment companies are valued at the respective NAV of each such investment on the Valuation Date. Such open-end funds may use fair value pricing as disclosed in their prospectuses.
Financial instruments for which prices are not available from an independent pricing service may be valued using market quotations obtained from one or more dealers that make markets in the respective financial instrument in accordance with procedures established by the Board of Trustees.
U.S. GAAP defines fair value as the price that the fund would receive to sell an asset or pay to transfer a liability in an orderly transaction between market participants at the measurement date. The U.S. GAAP fair value measurement standards require disclosure of a fair value hierarchy for each major category of assets and liabilities. Various inputs are used in determining the fair value of the Fund’s investments. These inputs are summarized into three broad hierarchy levels. This hierarchy is based on whether the valuation inputs are observable or unobservable. The determination of which category within the fair value hierarchy is appropriate for any given instrument is based on the lowest level of input that is significant to the fair value measurement. These levels are:
| • | Level 1 – Inputs using (unadjusted) quoted prices in active markets or exchanges for identical assets and liabilities. Level 1 may include exchange traded instruments, such as domestic equities, some foreign equities, options, futures, investment companies, exchange traded funds, rights and warrants. |
| • | Level 2 – Observable inputs other than Level 1 prices, which may include, but are not limited to, quoted prices for similar assets or liabilities in markets that are active, quoted prices for identical or similar assets or liabilities in markets that are not active, inputs other than quoted prices that are observable for the assets or liabilities or other market corroborated inputs. Level 2 may include debt investments that are traded less frequently than exchange |
| 25 |
|
| HIMCO VIT Portfolio Diversifier Fund |
Notes to Financial Statements – (continued)
June 30, 2017 (Unaudited)
| traded instruments and are valued using independent pricing services; foreign equities, which are principally traded on certain foreign markets and are adjusted daily pursuant to a fair value pricing service in order to reflect an adjustment for the factors occurring after the close of certain foreign markets but before the NYSE Close; senior floating rate interests, which are valued using an aggregate of dealer bids; short-term investments, which are valued at amortized cost; and swaps, which are valued based upon the terms of each swap contract. |
| • | Level 3 – Significant unobservable inputs based on the best information available in the circumstances, to the extent observable inputs are not available. Level 3 may include financial instruments whose values are determined using indicative market quotes or require significant management judgment or estimation. These unobservable valuation inputs may include estimates for current yields, maturity/duration, prepayment speed, and indicative market quotes for comparable investments along with other assumptions relating to credit quality, collateral value, complexity of the investment structure, general market conditions and liquidity. This category may include investments where trading has been halted or there are certain restrictions on trading. While these investments are priced using unobservable inputs, the valuation of these investments reflects the best available data and management believes the prices are a reasonable representation of exit price. |
The procedures adopted by the Board of Trustees define how investments are to be valued, including the formation and activities of a Valuation Committee. The Valuation Committee has the overall responsibility for implementing the procedures adopted by the Board of Trustees, including the responsibility for determining the fair value of the Fund’s investments. The Valuation Committee is also responsible for determining in good faith the fair value of an investment when the value cannot be obtained from primary pricing services or alternative sources or if the valuation of an investment, as provided by the primary pricing service or alternative source, is believed not to reflect the investment’s fair value as of the Valuation Date.
The Valuation Committee is comprised of the Trust’s Chief Executive Officer, Treasurer, Chief Operating Officer, and Chief Legal Officer, or their designees, and other personnel of the investment manager subject to prior approval by the Board of Trustees. In addition, the Trust’s Chief Compliance Officer (“CCO”) shall designate a member of the compliance group to attend Valuation Committee meetings as a non-voting resource, to monitor for and provide guidance with respect to compliance with these procedures and to keep the Trust’s CCO regularly informed of pricing and Valuation Committee proceedings. Two members of the Valuation Committee or their designees, representing different departments, shall constitute a quorum for purposes of permitting the Committee to take action. The Valuation Committee will consider all relevant factors in determining an investment’s fair value, and may seek the advice of the Fund’s adviser, knowledgeable brokers, and legal counsel in making such determination.
At each quarterly meeting of the Board of Trustees, the Valuation Committee provides a written report that includes details of all fair-valued investments to the extent any are fair-valued, including the reason for the fair valuation, and an indication, when possible, of the accuracy of the valuation by disclosing the next available reliable public price quotation or the disposition price of such investments (the “look-back” review). The Board of Trustees then must consider for ratification all of the fair value determinations made during the previous quarter.
Valuation levels are not necessarily indicative of the risk associated with investing in such investments. Individual investments within any of the above mentioned asset classes may be assigned a different hierarchical level than those presented above, as individual circumstances dictate.
For additional information, refer to the Investment Valuation Hierarchy Level Summary included in the Schedule of Investments.
| c) | Investment Transactions and Investment Income – Investment transactions are recorded as of the trade date (the date the order to buy or sell is executed) for financial reporting purposes. Investments purchased or sold on a when-issued or delayed-delivery basis may be settled a month or more after the trade date. Realized gains and losses are determined on the basis of identified cost. |
Dividend income from domestic securities is recorded on the ex-dividend date. Interest income, including amortization of premium, accretion of discounts and additional principal received in-kind in lieu of cash, is accrued on a daily basis. Paydown gains and losses on mortgage related and other asset backed securities are included in interest income in the Statement of Operations, as applicable.
| 26 |
|
| HIMCO VIT Portfolio Diversifier Fund |
Notes to Financial Statements – (continued)
June 30, 2017 (Unaudited)
| d) | Joint Trading Account – The Fund may invest cash balances into a joint trading account that may be invested in one or more repurchase agreements. |
| e) | Fund Share Valuation and Dividend Distributions to Shareholders – Orders for the Fund’s shares are executed in accordance with the investment instructions of the contract holders and plan participants. |
Orders for the purchase of the Fund’s shares received prior to the close of the Exchange on any day the Exchange is open for business are priced at the NAV determined as of the close of the Exchange. Orders received after the close of the Exchange, or on a day on which the Exchange and/or the Fund is not open for business, are priced at the next determined NAV.
Dividends are declared pursuant to a policy adopted by the Board of Trustees based upon the investment performance of the Fund. The policy of the Fund is to pay dividends from net investment income and to make distributions of realized gains, if any, at least once per year.
Distributions from net investment income, realized capital gains and capital are determined in accordance with federal income tax regulations, which may differ from U.S. GAAP with respect to character and timing. These differences may include, but are not limited to, losses deferred due to wash sale adjustments, foreign currency gains and losses, adjustments related to Passive Foreign Investment Companies (“PFICs”), Real Estate Investment Trusts (“REITs”), Regulated Investment Companies (“RICs”), certain derivatives and partnerships. Permanent book and federal income tax basis differences relating to shareholder distributions will result in reclassifications to certain of the Fund’s capital accounts (see Federal Income Taxes: Reclassification of Capital Accounts note).
| 3. | Securities and Other Investments: |
| a) | Repurchase Agreements and Reverse Repurchase Agreements – A repurchase agreement is an agreement by which a counterparty agrees to sell an investment and agrees to repurchase the investment sold from the buyer, the Fund, at a mutually agreed upon time and price. A reverse repurchase agreement is an agreement by which the Fund agrees to sell an investment and agrees to repurchase the investment sold from the buyer, the counterparty, at a mutually agreed upon time and price. During the period of the repurchase agreement, the counterparty will deposit cash and or securities in a third party custodial account to serve as collateral. At the time the Fund enters into a repurchase agreement, the value of the underlying collateral, including accrued interest, will be equal to or exceed the value of the repurchase agreement. Repurchase agreements expose the Fund to counterparty risk – that is, the risk that the counterparty will not fulfill its obligations. To minimize counterparty risk, the investments that serve to collateralize the repurchase agreement are held by the Fund’s custodian in book entry or physical form in the custodial account of the Fund or in a third party custodial account. Repurchase agreements are valued at cost plus accrued interest, which approximates fair value. Repurchase agreements have master netting arrangements which allow the Fund to offset amounts owed to a counterparty with amounts owed by the counterparty, including any collateral. Upon an event of default under a master repurchase agreement, the non-defaulting party may close out all transactions traded under such agreement and net amounts owed under each transaction to one net amount payable by one party to the other. Absent an event of default, the master repurchase agreement does not result in an offset of reported amounts of assets and liabilities in the Statement of Assets and Liabilities across transactions between the Fund and the applicable counterparty. The Fund, as shown on the Schedule of Investments, had outstanding repurchase agreements and related collateral as of June 30, 2017. |
| b) | Illiquid and Restricted Investments – The Fund is permitted to invest in illiquid investments in an amount up to 15% of its net assets. Illiquid investments are those that may not be sold or disposed of in the ordinary course of business within seven days at approximately the price used for such investments in determination of the Fund’s NAV. The Fund may not be able to sell illiquid investments when the investment manager considers it desirable to do so or may have to sell such investments at a price that is lower than the price that could be obtained if the investments were more liquid. A sale of illiquid investments may require more time and may result in higher dealer discounts and other selling expenses than does the sale of those that are liquid. Illiquid investments also may be more difficult to value due to the lack of reliable market quotations for such investments, and investments in them may have an adverse impact on the Fund’s NAV. The Fund may invest in certain restricted investments. Restricted investments may be sold in private placement transactions between issuers and their purchasers and may be neither listed on an exchange nor traded in other established markets. |
| 27 |
|
| HIMCO VIT Portfolio Diversifier Fund |
Notes to Financial Statements – (continued)
June 30, 2017 (Unaudited)
| The Fund may also purchase investments that may have restrictions on transfer or resale (including Rule 144A securities and Regulation S securities). These securities may either be determined to be liquid or illiquid pursuant to policies and guidelines established by the Board of Trustees. The Fund did not hold illiquid and/or restricted investments as of June 30, 2017. |
| c) | Investments Purchased on a When-Issued or Delayed-Delivery Basis – Delivery and payment for investments that have been purchased by the Fund on a forward commitment, or when-issued or delayed-delivery basis, take place beyond the customary settlement period. The Fund may dispose of or renegotiate a delayed-delivery transaction after it is entered into, and may sell delayed-delivery investments before they are delivered, which may result in a realized gain or loss. During this period, such investments are subject to market fluctuations, and the Fund identifies investments segregated in its records with a value at least equal to the amount of the commitment. When-issued and delayed delivery investments and forward commitments involve the risk that the investment the Fund buys will lose value prior to its delivery. There are also risks that the investment will never be issued or that the other party to the transaction will not meet its obligation. If this occurs, the Fund loses both the investment opportunity for the assets it set aside to pay for the investment and any gain in the investment’s price. The Fund did not hold when-issued or delayed-delivery investments as of June 30, 2017. |
| d) | Mortgage Related and Other Asset Backed Securities – The Fund may invest in mortgage related and other asset backed securities. These securities include mortgage pass-through securities, collateralized mortgage obligations, commercial mortgage backed securities, stripped mortgage backed securities, asset backed securities, collateralized debt obligations and other securities that directly or indirectly represent a participation in, or are secured by and payable from, mortgage loans on real property. Mortgage related securities are created from pools of residential or commercial mortgage loans, including mortgage loans made by savings and loan institutions, mortgage bankers, commercial banks and others. Asset backed securities are created from many types of assets, including auto loans, credit card receivables, home equity loans, and student loans. These securities provide a monthly payment that consists of both interest and principal payments. Interest payments may be determined by fixed or adjustable rates. The rate of pre-payments on underlying mortgages will affect the price and volatility of a mortgage related security, and may have the effect of shortening or extending the effective duration of the security relative to what was anticipated at the time of purchase. The timely payment of principal and interest of certain mortgage related securities is guaranteed by the full faith and credit of the United States Government. Mortgage related and other asset backed securities created and guaranteed by non-governmental issuers, including government-sponsored corporations, may be supported by various forms of insurance or guarantees, but there can be no assurance that the private insurers or guarantors can meet their obligations under the insurance policies or guarantee arrangements. The Fund, as shown on the Schedule of Investments, had mortgage related and other asset backed securities as of June 30, 2017. |
| 4. | Financial Derivative Instruments: |
The following disclosures contain information on how and why the Fund uses derivative instruments, the credit-risk-related contingent features in certain derivative instruments, and how derivative instruments affect the Fund’s financial position and results of operations. The location and fair value amounts of these instruments in the Statement of Assets and Liabilities and the realized gains and losses and changes in unrealized gains and losses in the Statement of Operations, each categorized by type of derivative contract, are included in the following Additional Derivative Instrument Information footnote. The derivative instruments outstanding as of year-end are disclosed in the notes to the Schedule of Investments, if applicable. The amounts of realized gains and losses and changes in unrealized appreciation and depreciation on derivative instruments during the year are disclosed in the Statement of Operations.
| a) | Futures Contracts – The Fund may enter into futures contracts. A futures contract is an agreement between two parties to buy or sell an asset at a set price on a future date. The Fund uses futures contracts to manage or obtain exposure to the investment markets, commodities, or movements in interest rates and currency values. The primary risks associated with the use of futures contracts are the imperfect correlation between the change in market value of the investments held by the Fund and the prices of futures contracts and the possibility of an illiquid market. Upon entering into a futures contract, the Fund is required to deposit with a futures commission merchant (“FCM”) an amount of cash or U.S. Government or Agency Obligations in accordance with the initial margin requirements of the broker or exchange. |
| 28 |
|
| HIMCO VIT Portfolio Diversifier Fund |
Notes to Financial Statements – (continued)
June 30, 2017 (Unaudited)
| Futures contracts are marked to market daily at the most recent settlement price reported by an exchange on which, over time, they are traded most extensively, and an appropriate payable or receivable for the change in value (“variation margin”) is recorded by the Fund. Gains or losses are recognized but not considered realized until the contracts expire or are closed. Futures contracts involve, to varying degrees, risk of loss in excess of the variation margin disclosed in the Statement of Assets and Liabilities; however, the Fund seeks to reduce this risk through the use of an FCM. The Fund, as shown on the Schedule of Investments, had outstanding futures contracts as of June 30, 2017. |
| b) | Options Contracts – An option contract is a contract sold by one party to another party that offers the buyer the right, but not the obligation, to buy (call) or sell (put) an investment or other financial asset at an agreed-upon price during a specific period of time or on a specific date. Option contracts are either privately negotiated in the OTC market (“OTC options”) or executed in a registered exchange (“exchange traded options). The Fund may write (sell) covered call and put options on futures, swaps (“swaptions”), securities, commodities or currencies. “Covered” means that so long as the Fund is obligated as the writer of an option, it will own either the underlying investments or currency or an option to purchase the same underlying investments or currency having an expiration date of the covered option and an exercise price equal to or less than the exercise price of the covered option, or will pledge cash or other liquid investments having a value equal to or greater than the fluctuating market value of the option investment or currency. Writing put options increases the Fund’s exposure to the underlying instrument. Writing call options decreases the Fund’s exposure to the underlying instrument. Premiums received from writing options that expire are treated as realized gains. Premiums received from writing options that are exercised or closed are added to the proceeds or offset amounts paid on the underlying futures, swap, investment or currency transaction to determine the realized gain or loss. The Fund as a writer of an option has no control over whether the underlying instrument may be sold (call) or purchased (put) and as a result bears the market risk of an unfavorable change in the price of the instrument underlying the written option. There is the risk the Fund may not be able to enter into a closing transaction because of an illiquid market. The Fund may also purchase put and call options. Purchasing call options increases the Fund’s exposure to the underlying instrument. Purchasing put options decreases the Fund’s exposure to the underlying instrument. The Fund pays a premium, which is included on the Fund’s Statement of Assets and Liabilities as an investment and is subsequently marked to market to reflect the current value of the option. Premiums paid for purchasing options that expire are treated as realized losses. Certain options may be purchased with premiums to be determined on a future date. The premiums for these options are based upon implied volatility parameters at specified terms. The risk associated with purchasing put and call options is generally limited to the premium paid. Premiums paid for purchasing options that are exercised or closed are added to the amounts paid or offset against the proceeds on the underlying investment transaction to determine the realized gain or loss. Entering into over-the-counter options also exposes the Fund to counterparty risk. Counterparty risk is the possibility that the counterparty to the agreements may default on its obligation to perform or disagree as to the meaning of the contractual terms in the agreements. The Fund, as shown on the Schedule of Investments, had outstanding purchased options as of June 30, 2017. The Fund did not hold written options contracts as of June 30, 2017. |
Additional Derivative Instrument Information:
Fair Value of Derivative Instruments in the Statement of Assets and Liabilities as of June 30, 2017:
| Risk Exposure Category | ||||||||||||||||||||||||||||
| Interest Rate Contracts | Foreign Exchange Contracts | Credit Contracts | Equity Contracts | Commodity Contracts | Other Contracts | Total | ||||||||||||||||||||||
Assets: |
| |||||||||||||||||||||||||||
Investments in unaffiliated securities, at market value (purchased options) | $ | — | $ | — | $ | — | $ | 20,798,665 | $ | — | $ | — | $ | 20,798,665 | ||||||||||||||
Unrealized appreciation on futures(1) | — | — | — | 185,240 | — | — | 185,240 | |||||||||||||||||||||
|
|
|
|
|
|
|
|
|
|
|
|
|
| |||||||||||||||
Total | $ | — | $ | — | $ | — | $ | 20,983,905 | $ | — | $ | — | $ | 20,983,905 | ||||||||||||||
|
|
|
|
|
|
|
|
|
|
|
|
|
| |||||||||||||||
| (1) | Includes cumulative appreciation/depreciation on financial futures contracts as reported in the Schedule of Investments. Only current day’s variation margin is reported within the Statement of Assets and Liabilities. |
The volume of derivatives that is presented in the Schedule of Investments is consistent with the derivative activity during the six-month period ended June 30, 2017.
| 29 |
|
| HIMCO VIT Portfolio Diversifier Fund |
Notes to Financial Statements – (continued)
June 30, 2017 (Unaudited)
The Effect of Derivative Instruments in the Statement of Operations for the six-month period ended June 30, 2017:
| Risk Exposure Category | ||||||||||||||||||||||||||||
| Interest Rate Contracts | Foreign Exchange Contracts | Credit Contracts | Equity Contracts | Commodity Contracts | Other Contracts | Total | ||||||||||||||||||||||
Realized Loss on Derivatives Recognized as a Result of Operations: |
| |||||||||||||||||||||||||||
Net realized loss on futures | $ | — | $ | — | $ | — | $ | (5,255,646 | ) | $ | — | $ | — | $ | (5,255,646 | ) | ||||||||||||
|
|
|
|
|
|
|
|
|
|
|
|
|
| |||||||||||||||
Total | $ | — | $ | — | $ | — | $ | (5,255,646 | ) | $ | — | $ | — | $ | (5,255,646 | ) | ||||||||||||
|
|
|
|
|
|
|
|
|
|
|
|
|
| |||||||||||||||
Net Change in Unrealized Appreciation (Depreciation) on Derivatives Recognized as a Result of Operations: |
| |||||||||||||||||||||||||||
Net change in unrealized depreciation of investments in purchased options | $ | — | $ | — | $ | — | $ | (10,824,381 | ) | $ | — | $ | — | $ | (10,824,381 | ) | ||||||||||||
Net change in unrealized appreciation of futures | — | — | — | 321,118 | — | — | 321,118 | |||||||||||||||||||||
|
|
|
|
|
|
|
|
|
|
|
|
|
| |||||||||||||||
Total | $ | — | $ | — | $ | — | $ | (10,503,263 | ) | $ | — | $ | — | $ | (10,503,263 | ) | ||||||||||||
|
|
|
|
|
|
|
|
|
|
|
|
|
| |||||||||||||||
| c) | Balance Sheet Offsetting Information – Set forth below are tables which disclose both gross information and net information about instruments and transactions eligible for offset in the financial statements, and instruments and transactions that are subject to a master netting arrangement, as well as amounts related to margin, reflected as financial collateral (including cash collateral), held at clearing brokers, counterparties and the Fund’s custodian. The master netting arrangements allow the clearing brokers to net any collateral held in or on behalf of the Fund, or liabilities or payment obligations of the clearing brokers to the Fund, against any liabilities or payment obligations of the Fund to the clearing brokers. The Fund is required to deposit financial collateral (including cash collateral) at the Fund’s custodian on behalf of clearing brokers and counterparties to continually meet the original and maintenance requirements established by the clearing brokers and counterparties. Such requirements are specific to the respective clearing broker or counterparty. Certain master netting arrangements may not be enforceable in a bankruptcy. |
The following tables present the Fund’s derivative assets and liabilities, presented on a gross basis as no amounts are netted within the Statement of Assets and Liabilities, by counterparty net of amounts available for offset under a master netting agreement or similar agreement (“MNA”) and net of the related collateral received/pledged by the Fund as of June 30, 2017:
| Assets | Liabilities | |||||||
Derivative Financial Instruments: | ||||||||
Futures contracts | $ | 185,240 | $ | — | ||||
Purchased options | 20,798,665 | — | ||||||
|
|
|
| |||||
Total gross amount of derivative assets and liabilities in the Statement of Assets and Liabilities | 20,983,905 | — | ||||||
|
|
|
| |||||
Derivatives not subject to a MNA | (185,240 | ) | — | |||||
|
|
|
| |||||
Total gross amount of derivative assets and liabilities subject to MNA or similar agreements | $ | 20,798,665 | $ | — | ||||
|
|
|
| |||||
| Gross Amount of Assets | Financial Instruments and Derivatives Available for Offset | Non-cash Collateral Received* | Cash Collateral Received* | Net Amount of Assets | ||||||||||||||||
Counterparty |
| |||||||||||||||||||
Barclays Bank PLC | $ | 6,932,961 | $ | — | $ | (6,932,961 | ) | $ | — | $ | — | |||||||||
Credit Suisse International | 6,932,743 | — | — | (6,932,743 | ) | — | ||||||||||||||
JP Morgan Chase & Co. | 6,932,961 | — | (6,932,961 | ) | — | — | ||||||||||||||
|
|
|
|
|
|
|
|
|
| |||||||||||
Total subject to a master netting or similar arrangement | $ | 20,798,665 | $ | — | $ | (13,865,922 | ) | $ | (6,932,743 | ) | $ | — | ||||||||
|
|
|
|
|
|
|
| �� |
|
| ||||||||||
| * | In some instances, the actual collateral received and/or pledged may be more than the amount shown. |
| 30 |
|
| HIMCO VIT Portfolio Diversifier Fund |
Notes to Financial Statements – (continued)
June 30, 2017 (Unaudited)
| 5. | Principal Risks: |
The market values of equity securities, such as common stocks and preferred stocks, or equity related investments, such as futures and options, may decline due to general market conditions which are not specifically related to a particular company, such as real or perceived adverse economic conditions, changes in the general outlook for corporate earnings, changes in interest or currency rates or adverse investor sentiment generally. The market value of equity securities may also decline due to factors which affect a particular industry or industries, such as labor shortages or increased production costs and competitive conditions within an industry. Equity securities and equity related investments generally have greater market price volatility than fixed income securities.
Credit risk depends largely on the perceived financial health of bond issuers. In general, the credit rating is inversely related to the credit risk of the issuer. Higher rated bonds generally are deemed to have less credit risk, while lower or unrated bonds are deemed to have higher risk of default. The share price, yield and total return of a fund that holds securities with higher credit risk may be more volatile than those of a fund that holds bonds with lower credit risk. Similar to credit risk, the Fund may be exposed to counterparty risk, or the risk that an institution or other entity with which the Fund has unsettled or open transactions will default.
The Fund’s investments expose the Fund to various risks including, but not limited to, interest rate, prepayment, extension and equity risks. Interest rate risk is the risk that fixed income securities will decline in value because of changes in interest rates. As nominal interest rates rise, the values of certain fixed income securities held by the Fund are likely to decrease. A nominal interest rate can be described as the sum of a real interest rate and an expected inflation rate. Fixed income securities with longer durations tend to be more sensitive to changes in interest rates, usually making them more volatile than securities with shorter durations. Duration is useful primarily as a measure of the sensitivity of a fixed income security’s market price to interest rate (i.e., yield) movements. Rising interest rates may cause prepayments to occur at a slower than expected rate, thereby effectively lengthening the maturity of the security and making the security more sensitive to interest rate changes. Prepayment and extension risk are major risks of mortgage backed securities and certain asset backed securities. For certain asset backed securities, the actual maturity may be less than the stated maturity shown in the Schedule of Investments, if applicable. As a result, the timing of income recognition relating to these securities may vary based upon the actual maturity.
| 6. | Federal Income Taxes: |
| a) | Federal Income Taxes – For federal income tax purposes, the Fund intends to continue to qualify as a RIC under Subchapter M of the Internal Revenue Code of 1986, as amended (“IRC”), by distributing substantially all of its taxable net investment income and net realized capital gains to its shareholders and otherwise complying with the requirements of the IRC. The Fund distributed substantially all of its income and capital gains in prior years, if applicable, and intends to distribute substantially all of its income and capital gains prior to the next fiscal year-end. Accordingly, no provision for federal income or excise taxes has been made in the accompanying financial statements. Distributions from short-term capital gains are treated as ordinary income distributions for federal income tax purposes. |
| b) | Net Investment Income (Loss), Net Realized Gains (Losses) and Distributions – Net investment income (loss) and net realized gains (losses) may differ for financial statement and tax purposes primarily because of losses deferred due to wash sale adjustments, paydown gain/loss, adjustments related to certain corporate actions, REITS, RICs and certain derivatives. The character of distributions made during the year from net investment income or net realized gains may differ from their ultimate characterization for federal income tax purposes. Also, due to the timing of dividend distributions, the fiscal year in which amounts are distributed may differ from the year that the income or realized gains (losses) were recorded by the Fund. |
| c) | Distributions and Components of Distributable Earnings – The tax character of distributions paid by the Fund for the periods indicated is as follows (as adjusted for dividends payable, if applicable): |
| For the Year Ended December 31, 2016 | For the Year Ended December 31, 2015 | |||||||
Ordinary Income | $ | — | $ | 3,190,703 | ||||
| 31 |
|
| HIMCO VIT Portfolio Diversifier Fund |
Notes to Financial Statements – (continued)
June 30, 2017 (Unaudited)
As of December 31, 2016, the Fund’s components of distributable earnings (deficit) on a tax basis were as follows:
| Amount | ||||
Undistributed Ordinary Income | $ | 2,927,233 | ||
Undistributed Long-Term Capital Gain | — | |||
Accumulated Capital and Other Losses | (91,489,524 | ) | ||
Unrealized Appreciation (Depreciation)(1) | (12,679,891 | ) | ||
|
| |||
Total Accumulated Earnings (Deficit) | $ | (101,242,182 | ) | |
|
| |||
| (1) | Differences between book-basis and tax-basis unrealized appreciation (depreciation) may be attributable to the losses deferred due to wash sale adjustments, adjustments related to REITs, RICs, certain derivatives and corporate actions. |
| d) | Reclassification of Capital Accounts – The Fund may record reclassifications in its capital accounts. These reclassifications have no impact on the total net assets of the Fund. The reclassifications are a result of permanent differences between U.S. GAAP and tax accounting for such items as paydown gain/loss and certain distributions from REITs after gain/loss. Adjustments are made to reflect the impact these items have on current and future distributions to shareholders. Therefore, the source of the Fund’s distributions may be shown in the accompanying Statements of Changes in Net Assets as from undistributed net investment income, from accumulated net realized gains on investments or from capital depending on the type of book and tax differences that exist. For the fiscal year ended December 31, 2016, the Fund recorded reclassifications to increase (decrease) the accounts listed below: |
| Amount | ||||
Paid In Capital | $ | (6,601 | ) | |
Undistributed Net Investment Income | 370,473 | |||
Accumulated Net Realized Loss | (363,872 | ) | ||
| e) | Capital Loss Carryforward – Under U.S. tax law, the Fund is permitted to carry forward capital losses for an unlimited period. Additionally, capital loss carryforwards retain their character as either short-term or long-term capital losses rather than being considered all short-term as permitted under prior regulation. |
At December 31, 2016 (tax-year-end), the Fund had capital loss carryforwards for U.S. federal income tax purposes as follows:
Capital loss carryforwards with no expiration:
| Amount | ||||
Short-Term Capital Loss Carryforward | $ | 20,086,492 | ||
Long-Term Capital Loss Carryforward | 71,403,032 | |||
|
| |||
Total | $ | 91,489,524 | ||
|
| |||
| f) | Accounting for Uncertainty in Income Taxes – In accordance with U.S. GAAP, the Fund analyzes all open tax years, as defined by the statute of limitations, for all major jurisdictions. Generally, tax authorities can examine all tax returns filed for the last three years. The Fund does not have an examination in progress. |
The Fund has reviewed all open tax years and major jurisdictions and concluded that these financial reporting rules had no effect on the Fund’s financial position or results of operations. There is no tax liability resulting from unrecognized tax benefits relating to uncertain income tax positions taken or expected to be taken on the tax return for the fiscal year ended December 31, 2016. The Fund is also not aware of any tax positions for which it is reasonably possible that the total amounts of unrecognized tax benefits will significantly change in the next twelve months.
| 7. | Fees and Expenses: |
| a) | Investment Management Agreement – Hartford Investment Management Company (“Hartford Investment Management”) serves as the Fund’s investment manager pursuant to an Investment Management Agreement with the Trust. Hartford |
| 32 |
|
| HIMCO VIT Portfolio Diversifier Fund |
Notes to Financial Statements – (continued)
June 30, 2017 (Unaudited)
| Investment Management is a wholly owned subsidiary of The Hartford Financial Services Group, Inc. (“The Hartford”). The investment manager provides day-to-day investment management services to the Fund and has overall investment supervisory responsibility for the Fund. In addition, the investment manager provides administrative personnel, services, equipment, facilities and office space for operation of the Fund. |
The schedule below reflects the rates of compensation as a percentage of the Fund’s average daily net assets paid to the investment manager for investment management services rendered as of June 30, 2017; the rates are accrued daily and paid monthly.
Average Daily Net Assets | Annual Fee | |||
On first $500 million | 0.60% | |||
On next $500 million | 0.55% | |||
On next $4 billion | 0.50% | |||
On next $5 billion | 0.48% | |||
Over $10 billion | 0.47% | |||
| b) | Accounting Services Agreement – State Street Bank and Trust Company (“State Street Bank”) provides the Fund with accounting services pursuant to a fund accounting agreement by and between the Trust, on behalf of the Fund, and State Street Bank. The amount paid for accounting services can be found in the Statement of Operations. These fees are accrued daily and paid monthly. |
| c) | Operating Expenses – Allocable expenses incurred by the Trust are allocated to the Fund in proportion to the average daily net assets of the Fund, except where allocation of certain expenses is more fairly made directly to the Fund. |
Hartford Investment Management has contractually agreed to reimburse expenses (exclusive of taxes, interest expense, brokerage commissions, acquired fund fees and expenses and extraordinary expenses) to the extent necessary to maintain total annual operating expenses for the Class IB shares of the Fund at the annual rate of 0.85% of average daily net assets. This contractual arrangement will remain in effect until April 30, 2018 and shall renew automatically for one-year terms, unless the investment manager provides written notice of termination prior to the start of the next term or upon approval of the Board of Trustees of the Fund.
| d) | Distribution Plan for Class IB Shares – HIMCO Distribution Services Company, a wholly owned subsidiary of The Hartford, serves as the principal underwriter and distributor of the Fund. The Trust, on behalf of the Fund, has adopted a Distribution Plan pursuant to Rule 12b-1 of the 1940 Act for Class IB shares to compensate the distributor, from assets attributable to the services rendered and expenses borne in connection with activities primarily intended to result in the sale of the Class IB shares, subject to the review and approval of the Board of Trustees. |
The Distribution Plan provides that the Fund may pay annually up to 0.25% of the average daily net assets of the Fund attributable to its Class IB shares for activities primarily intended to result in the sale of Class IB shares. The Board of Trustees has the authority to suspend or reduce these payments at any point in time. Under the terms of the Distribution Plan and the principal underwriting agreement, the Fund is authorized to make payments monthly to the distributor that may be used to pay or reimburse entities, including insurance company affiliates of Hartford Investment Management, providing distribution and shareholder servicing with respect to the Class IB shares for such entities’ fees or expenses incurred or paid in that regard. The distribution fee paid during the period can be found in the Statement of Operations. These fees are accrued daily and paid monthly or at such other intervals as the Board of Trustees may determine.
| e) | Transfer Agent Fees – State Street Bank provides transfer agent services to the Fund. The transfer agent is reimbursed for out-of-pocket expenses and other costs associated with the services it provides to the Fund, including costs invoiced by sub-contractors. Hartford Investment Management and its affiliates may pay, out of their own assets, compensation to third-party administrators for recordkeeping and other administrative services. The amount paid for transfer agent services can be found in the Statement of Operations. These fees are accrued daily and paid monthly. |
| f) | Trustee Fees – The Board of Trustees is responsible for oversight of the Fund. The Board of Trustees elects officers who are responsible for the day to day operations of the Fund. The Board of Trustees oversees the investment manager and the other principal service providers of the Fund. The Board of Trustees currently holds four regularly scheduled |
| 33 |
|
| HIMCO VIT Portfolio Diversifier Fund |
Notes to Financial Statements – (concluded)
June 30, 2017 (Unaudited)
| meetings throughout each year. In addition, the Board of Trustees may hold special meetings at other times either in person or by telephone. The Trustee fees paid during the period can be found in the Statement of Operations. |
| 8. | Investment Transactions: |
For the six-month period ended June 30, 2017, the aggregate cost of purchases and proceeds from sales of investment securities (excluding short-term investments) was as follows:
| Excluding Government Obligations | U.S. Government Obligations | Total | ||||||||||
Cost of Purchases | $ | 10,155,482 | $ | 18,575,831 | $ | 28,731,313 | ||||||
Sales Proceeds | 34,206,832 | 27,633,743 | 61,840,575 | |||||||||
| 9. | Recent Accounting Pronouncements: |
In October 2016, the SEC adopted amendments to rules under the 1940 Act (“final rules”) intended to modernize the reporting and disclosure of information by registered investment companies. The final rules amend Regulation S-X and require investment companies to provide standardized, enhanced derivatives disclosures in fund financial statements in a format designed for individual investors. The amendments to Regulation S-X also update the disclosures for other investments in and advances to affiliates and amend the rules regarding the general form and content of fund financial statements. The compliance date for the amendments to Regulation S-X is August 1, 2017. Management is currently evaluating the amendments and their impact, if any, on the Fund’s financial statements.
| 10. | Indemnifications: |
Under the Trust’s organizational documents, the Trust shall indemnify its officers and trustees to the full extent required or permitted under The Delaware Statutory Trust Act and the federal securities laws. In addition, the Trust, on behalf of the Fund, may enter into contracts that contain a variety of indemnifications. The Trust’s maximum exposure under these arrangements is unknown. However, as of the date of these financial statements the Trust has not had prior claims or losses pursuant to these contracts and expects the risk of loss to be remote.
| 11. | Subsequent Event: |
Management has evaluated the need for disclosures and/or adjustments resulting from subsequent events through the date the Financial Statements were issued. Based on this evaluation, no adjustments to, or disclosures in, the Financial Statements were necessary as of June 30, 2017.
| 34 |
|
| HIMCO VIT Portfolio Diversifier Fund |
| — Selected Per-Share Data(1) — | — Ratios and Supplemental Data — | |||||||||||||||||||||||||||||||||||||||||||||||
Class | Net Asset Value at, Beginning of Period | Net Investment Income (Loss) | Net Realized and Unrealized Gain (Loss) on Investments | Total from Investment Operations | Distributions from Net Investment Income | Total Distributions | Net Asset Value End of Period | Total Return(2) | Net Assets at End of Period (000s) | Ratio of Expenses to Average Net Assets Before Adjust- ments(3) | Ratio of Expenses to Average Net Assets After Adjust- ments(3) | Ratio of Net Investment Income (Loss) to Average Net Assets | ||||||||||||||||||||||||||||||||||||
| HIMCO VIT Portfolio Diversifier Fund | ||||||||||||||||||||||||||||||||||||||||||||||||
For the Six-Month Period Ended June 30, 2017 (Unaudited) |
| |||||||||||||||||||||||||||||||||||||||||||||||
IB | $ | 7.34 | $ | 0.04 | $ | (0.20 | ) | $ | (0.16 | ) | $ | — | $ | — | $ | 7.18 | (2.18 | )%(4) | $ | 292,577 | 0.99 | %(5) | 0.85 | %(5) | 0.98 | %(5) | ||||||||||||||||||||||
For the Year Ended December 31, 2016 |
| |||||||||||||||||||||||||||||||||||||||||||||||
IB | $ | 7.69 | $ | 0.06 | $ | (0.41 | ) | $ | (0.35 | ) | $ | — | $ | — | $ | 7.34 | (4.55 | )% | $ | 312,550 | 0.97 | % | 0.85 | % | 0.78 | % | ||||||||||||||||||||||
For the Year Ended December 31, 2015 |
| |||||||||||||||||||||||||||||||||||||||||||||||
IB | $ | 7.91 | $ | 0.06 | $ | (0.21 | ) | $ | (0.15 | ) | $ | (0.07 | ) | $ | (0.07 | ) | $ | 7.69 | (1.89 | )% | $ | 345,139 | 1.02 | % | 0.85 | % | 0.71 | % | ||||||||||||||||||||
For the Year Ended December 31, 2014 |
| |||||||||||||||||||||||||||||||||||||||||||||||
IB | $ | 8.13 | $ | 0.05 | $ | (0.21 | ) | $ | (0.16 | ) | $ | (0.06 | ) | $ | (0.06 | ) | $ | 7.91 | (2.03 | )% | $ | 417,007 | 0.90 | % | 0.85 | % | 0.59 | % | ||||||||||||||||||||
For the Year Ended December 31, 2013(6) |
| |||||||||||||||||||||||||||||||||||||||||||||||
IB | $ | 9.38 | $ | 0.03 | $ | (1.25 | ) | $ | (1.22 | ) | $ | (0.03 | ) | $ | (0.03 | ) | $ | 8.13 | (12.96 | )% | $ | 443,121 | 0.89 | % | 0.85 | % | 0.29 | % | ||||||||||||||||||||
For the Year Ended December 31, 2012(6)(7) |
| |||||||||||||||||||||||||||||||||||||||||||||||
IB | $ | 10.18 | $ | 0.02 | $ | (0.79 | ) | $ | (0.77 | ) | $ | (0.03 | ) | $ | (0.03 | ) | $ | 9.38 | (7.58 | )% | $ | 295,762 | 0.91 | % | 0.85 | % | 0.27 | % | ||||||||||||||||||||
| (1) | Information presented relates to a share outstanding throughout the indicated period. Net investment income (loss) per share amounts are calculated based on average shares outstanding unless otherwise noted. |
| (2) | The figures do not include sales charges or other fees which may be applied at the variable life insurance, variable annuity or qualified retirement plan product level. Any such additional sales charges or other fees would lower the Fund’s performance. |
| (3) | Adjustments include waivers and reimbursements, if applicable. |
| (4) | Not annualized. |
| (5) | Annualized. |
| (6) | Financial highlights for the fiscal years ended December 31, 2013 and December 31, 2012 were audited by the Predecessor Fund’s auditor. |
| (7) | Net investment income (loss) per share amounts have been calculated using the SEC method. |
| Portfolio Turnover Rate | ||||
For the Six Months Ended June 30, 2017 (Unaudited) | 11 | % | ||
For the Year Ended December 31, 2016 | 52 | |||
For the Year Ended December 31, 2015 | 34 | |||
For the Year Ended December 31, 2014 | 33 | |||
For the Year Ended December 31, 2013(1) | 31 | |||
For the Year Ended December 31, 2012(1) | 61 | |||
| (1) | Financial highlights for the fiscal years ended December 31, 2013 and December 31, 2012 were audited by the Predecessor Fund’s auditor. |
| 35 |
|
| HIMCO VIT Portfolio Diversifier Fund |
HOW TO OBTAIN A COPY OF THE FUND’S PROXY VOTING POLICIES AND VOTING RECORDS (UNAUDITED)
A description of the policies and procedures that the Fund uses to determine how to vote proxies relating to portfolio securities and information about how the Fund voted proxies relating to portfolio securities during the most recent twelve-month period ended June 30 are available (1) without charge, upon request, by calling 1-800-862-6668 and (2) on the SEC’s website at http://www.sec.gov. Additionally, a complete list of holdings is available on the Fund’s website at www.HVITFunds.com.
QUARTERLY PORTFOLIO HOLDINGS INFORMATION (UNAUDITED)
The Fund files a complete schedule of portfolio holdings with the SEC for the first and third quarters of each fiscal year on Form N-Q. The Fund’s Forms N-Q are available (1) without charge, upon request, by calling 1-800-862-6668 and (2) on the SEC’s website at http://www.sec.gov. The Form N-Q may be reviewed and copied at the SEC’s Public Reference Room in Washington, DC. Information on the operation of the Public Reference Room may be obtained by calling 1-800-SEC-0330.
| 36 |
|
| HIMCO VIT Portfolio Diversifier Fund |
Your Fund’s Expenses
As a shareholder of the Fund, you incur two types of costs: (1) transaction costs and (2) ongoing costs, including investment management fees, distribution and/or service (12b-1) fees, if any, and other fund expenses. This example is intended to help you understand your ongoing costs (in dollars) of investing in the Fund and to compare these costs with the ongoing costs of investing in other mutual funds. The example is based on an investment of $1,000 invested at the beginning of the period and held for the entire period of January 1, 2017 through June 30, 2017.
Actual Expenses
The first set of rows of the table below provides information about actual account values and actual expenses. You may use the information in this row, together with the amount you invested, to estimate the expenses that you paid over the period. Simply divide your account value by $1,000 (for example, an $8,600 account value divided by $1,000 = 8.6), then multiply the result by the number in the line under the heading entitled “Expenses Paid During Period” to estimate the expenses you paid on your account during this period.
Hypothetical Example for Comparison Purposes
The second set of rows of the table below provides information about hypothetical account values and hypothetical expenses based on the Fund’s actual expense ratio and an assumed rate of return of 5% per year before expenses, which is not the Fund’s actual return. The hypothetical account values and expenses may not be used to estimate the actual ending account balance or expenses you paid for the period. You may use this information to compare the ongoing costs of investing in the Fund and other funds. To do so, compare this 5% hypothetical example with the 5% hypothetical examples that appear in the shareholder reports of the other funds.
Please note that the expenses shown in the table are meant to highlight your ongoing costs only and do not reflect any transactional costs, such as sales charges (loads) or fees which may be applied at the variable life insurance, variable annuity, or qualified retirement plan product level. Therefore, the second set of rows of the table is useful in comparing ongoing costs only, and will not help you determine the relative total costs of owning different funds. In addition, if these transactional costs were included, your costs would be higher.
| Beginning Account Value 1/1/17 | Ending Account Value 6/30/17 | Expenses Paid During Period 1/1/17 - 6/30/17(1) | Net Annualized Expense Ratio(2) | |||||||||||||
Actual |
| |||||||||||||||
Class IB | $ | 1,000 | $ | 978.20 | $ | 4.17 | 0.85 | % | ||||||||
Hypothetical |
| |||||||||||||||
Class IB | $ | 1,000 | $ | 1,020.58 | $ | 4.26 | 0.85 | % | ||||||||
| (1) | Expenses are equal to the class’s annualized expense ratio listed in the table above, multiplied by the average account value over the period, multiplied by 181, the number of days in the most recent fiscal half-year, divided by 365, to reflect the one-half year period. |
| (2) | Net annualized expense ratio is reflective of any applicable contractual fee waivers and/or expense reimbursements or voluntary fee waivers. Details regarding fee waivers can be found in Fees and Expenses of the accompanying Notes to Financial Statements. |
| 37 |
|
THIS PRIVACY POLICY IS NOT PART OF THIS REPORT
Privacy Policy and Practices of The Hartford Financial Services Group, Inc. and its Affiliates
(herein called “we, our and us”)
This Privacy Policy applies to our United States Operations
We value your trust. We are committed to the responsible:
a) management;
b) use; and
c) protection;
of Personal Information.
This notice describes how we collect, disclose, and protect
Personal Information.
We collect Personal Information to:
a) service your Transactions with us; and
b) support our business functions.
We may obtain Personal Information from:
a) You;
b) your Transactions with us; and
c) third parties such as a consumer-reporting agency.
Based on the type of product or service You apply for or get from us, Personal Information such as:
a) your name;
b) your address;
c) your income;
d) your payment; or
e) your credit history;
may be gathered from sources such as applications,
Transactions, and consumer reports.
To serve You and service our business, we may share certain Personal Information. We will share Personal Information, only as allowed by law, with affiliates such as:
a) our insurance companies;
b) our employee agents;
c) our brokerage firms; and
d) our administrators.
As allowed by law, we may share Personal Financial Information with our affiliates to:
a) market our products; or
b) market our services;
to You without providing You with an option to prevent these disclosures.
We may also share Personal Information, only as allowed
by law, with unaffiliated third parties including:
a) independent agents;
b) brokerage firms;
c) insurance companies;
d) administrators; and
e) service providers;
who help us serve You and service our business.
When allowed by law, we may share certain Personal
Financial Information with other unaffiliated third parties
who assist us by performing services or functions such as:
a) taking surveys;
b) marketing our products or services; or
c) offering financial products or services under a joint
agreement between us and one or more financial institutions.
We, and third parties we partner with, may track some
of the pages You visit through the use of:
a) cookies;
b) pixel tagging; or
c) other technologies;
and currently do not process or comply with any web
browser’s “do not track” signal or similar mechanism that
indicates a request to disable online tracking of individual
users who visit our websites or use our services.
For more information, our Online Privacy Policy, which governs information we collect on our website and our affiliate websites, which is available at
Online Privacy Policy.
We will not sell or share your Personal Financial
Information with anyone for purposes unrelated to our
business functions without offering You the opportunity to:
a) “opt-out;” or
b) “opt-in;”
as required by law.
We only disclose Personal Health Information with:
a) your proper written authorization; or
b) as otherwise allowed or required by law.
Our employees have access to Personal Information in
the course of doing their jobs, such as:
a) underwriting policies;
b) paying claims;
c) developing new products; or
d) advising customers of our products and services.
We use manual and electronic security procedures to maintain:
a) the confidentiality; and
b) the integrity of;
Personal Information that we have. We use these procedures to guard against unauthorized access.
Some techniques we use to protect Personal Information
include:
a) secured files;
b) user authentication;
c) encryption;
d) firewall technology; and
e) the use of detection software.
We are responsible for and must:
a) identify information to be protected;
b) provide an adequate level of protection for that data;
c) grant access to protected data only to those people who must use it in the performance of their job-related duties.
Employees who violate our privacy policies and procedures may be subject to discipline, which may include ending their employment with us.
We will continue to follow our Privacy Policy regarding Personal Information even when a business relationship no longer exists between us.
As used in this Privacy Notice:
Application means your request for our product or service.
Personal Financial Information means financial information such as:
a) credit history;
b) income;
c) financial benefits; or
d) policy or claim information.
Personal Financial Information may include Social
Security Numbers, Driver’s license numbers, or other
government-issued identification numbers, or credit,
debit card, or bank account numbers.
Personal Health Information means health information
such as:
a) your medical records; or
b) information about your illness, disability or injury.
Personal Information means information that identifies
You personally and is not otherwise available to the public.
It includes:
a) Personal Financial Information; and
b) Personal Health Information.
Transaction means your business dealings with us,
such as:
a) your Application;
b) your request for us to pay a claim; and
c) your request for us to take an action on your account.
You means an individual who has given us Personal
Information in conjunction with:
a) asking about;
b) applying for; or
c) obtaining;
a financial product or service from us if the product or service is used mainly for personal, family, or household purposes.
This Customer Privacy Notice is being provided on behalf of The Hartford Financial Services Group, Inc. and its affiliates, to the extent required by the Gramm-Leach-Bliley Act and implementing regulations.
1stAGChoice, Inc.; Access CoverageCorp, Inc.; Access CoverageCorp Technologies, Inc.; American Maturity Life Insurance Company; Archway 60 R, LLC; Business Management Group, Inc.; DMS R, LLC; First State Insurance Company; Fountain Investors I LLC; Fountain Investors II LLC; Fountain Investors III LLC; Fountain Investors IV LLC; FP R, LLC (Delaware); FTC Resolution Company LLC; Hart Re Group L.L.C.; Hartford Accident and Indemnity Company; Hartford Administrative Services Company; Hartford Casualty General Agency, Inc.; Hartford Casualty Insurance Company; Hartford Financial Services, LLC; Hartford Fire General Agency, Inc.; Hartford Fire Insurance Company; Hartford Funds Distributors, LLC; Hartford Funds Management Company, LLC; Hartford Funds Management Group, Inc.; Hartford Group Benefits Holding Company; Hartford Holdings, Inc.; Hartford HLS Series Fund II, Inc.; Hartford Insurance Company of Illinois; Hartford Insurance Company of the Midwest; Hartford Insurance Company of the Southeast; Hartford Integrated Technologies, Inc.; Hartford International Life Reassurance Corporation; Hartford Investment Management Company; Hartford Life and Accident Insurance Company; Hartford Life and Annuity Insurance Company; Hartford Life Insurance Company; Hartford Life, Inc.; Hartford Life International Holding Company; Hartford Life Private Placement, LLC; Hartford Lloyd’s Corporation; Hartford Lloyd’s Insurance Company; Hartford of Texas General Agency, Inc.; Hartford Residual Market, L.C.C.; Hartford Securities Distribution Company, Inc.; Hartford Series Fund, Inc.; Hartford Specialty Insurance Services of Texas, LLC; Hartford Strategic Investments, LLC; Hartford Underwriters General Agency, Inc.; Hartford Underwriters Insurance Company; Hartford-Comprehensive Employee Benefit Service Company; HDC R, LLC .; Heritage Holdings, Inc.; HIMCO Distribution Services Company; HIMCO Variable Insurance Trust; HLA LLC; HL Investment Advisors, LLC; Horizon Management Group, LLC; HRA Brokerage Services, Inc.; Lanidex Class B, LLC; ; Lanidex R, LLC (Delaware); Lattice Strategies LLC; Maxum Casualty Insurance Company; Maxum Indemnity Company; Maxum Specialty Services Corporation; MPC Resolution Company LLC; New England Insurance Company; New England Reinsurance Corporation; Northern Homelands Company; Nutmeg Insurance Agency, Inc.; Nutmeg Insurance Company; Pacific Insurance Company, Limited; Property and Casualty Insurance Company of Hartford; Sentinel Insurance Company, Ltd.; Trumbull Flood Management, L.L.C.; Trumbull Insurance Company; Twin City Fire Insurance Company.
Revised March 2017

This report is prepared for the general information of contract owners and qualified retirement plan participants. It is not an offer to buy or sell an annuity contract or qualified retirement plan, fund or any security. It should not be used in connection with any offer, except in conjunction with the appropriate product prospectus (which contains all pertinent product information including the applicable sales, administrative and other charges) and the current prospectus and/or summary prospectus of the Fund available for investment thereunder.
The information cannot be used or relied upon for the purpose of avoiding IRS penalties. These materials are not intended to provide tax, accounting or legal advice. As with all matters of a tax or legal nature, you should consult your own tax or legal counsel for advice.
You should carefully consider investment objectives, risks, and charges and expenses of the HIMCO VIT Portfolio Diversifier Fund before investing. This and other information can be found in the Fund’s prospectus or summary prospectus, which can be obtained from your investment representative or from www.hvitfunds.com. Please read them carefully before investing.
Hartford Investment Management is an SEC-registered investment adviser. SEC registration does not imply a certain level of skill or training; nor does it imply that the SEC has sponsored, recommended, or otherwise approved of Hartford Investment Management.
Distributor: HIMCO Distribution Services Company, member FINRA, SIPC, a broker-dealer affiliated with Hartford Investment Management. Not FDIC Insured – No Bank Guarantee – May Lose Value
HIMCO Variable Insurance Trust
HIMCO Variable Insurance Trust Financial Statements: | ||||
Schedules of Investments as of June 30, 2017 (Unaudited): | ||||
| 2 | ||||
| 2 | ||||
| 3 | ||||
| 3 | ||||
| 4 | ||||
| 4 | ||||
| 5 | ||||
| 5 | ||||
| 6 | ||||
| 6 | ||||
| 7 | ||||
Statements of Assets and Liabilities as of June 30, 2017 (Unaudited) | 8 | |||
Statements of Operations for the Six-Month Period Ended June 30, 2017 (Unaudited) | 10 | |||
| 12 | ||||
| 16 | ||||
| 25 | ||||
How to Obtain a Copy of the Funds’ Proxy Voting Policies and Voting Records (Unaudited) | 30 | |||
| 30 | ||||
| 31 | ||||
This report is prepared for the general information of contract owners and is not an offer to buy or sell an annuity contract, fund or any security. It should not be used in connection with any offer, except in conjunction with the appropriate product prospectus (which contains all pertinent product information including the applicable sales, administrative and other charges) and the current prospectus and/or summary prospectus of the Funds available for investment thereunder.
| HIMCO VIT American Funds Blue Chip Income and Growth Fund |
Schedule of Investments
June 30, 2017 (Unaudited)
Shares | Market Value(1) | |||||||||||
| INVESTMENT COMPANIES - 100.1% | ||||||||||||
| 1,636,976 | American Funds Insurance Series - Asset Allocation Fund Class 1 | $ | 36,586,424 | |||||||||
|
| |||||||||||
Total Investment Companies | $ | 36,586,424 | ||||||||||
|
| |||||||||||
Total Investments | 100.1 | % | $ | 36,586,424 | ||||||||
Other Assets and Liabilities | (0.1 | )% | (22,097 | ) | ||||||||
|
|
|
| |||||||||
Total Net Assets | 100.0 | % | $ | 36,564,327 | ||||||||
|
|
|
| |||||||||
| Note: | Percentage of investments as shown is the ratio of the total market value to total net assets. |
| (1) | See Significant Accounting Policies of accompanying Notes to Financial Statements regarding valuation of securities. |
| (2) | At June 30, 2017, the cost of securities for federal income tax purposes was $34,671,369, and the aggregate gross unrealized appreciation and depreciation based on that cost were: |
Unrealized Appreciation | $ | 1,915,055 | ||
Unrealized Depreciation | — | |||
|
| |||
Net Unrealized Appreciation | $ | 1,915,055 | ||
|
|
At June 30, 2017, the investment valuation hierarchy levels were:
Assets: | ||||
Investments in Securities - Level 1 | $ | 36,586,424 | ||
|
| |||
Total | $ | 36,586,424 | ||
|
|
Shares | Market Value(1) | |||||||||||
| INVESTMENT COMPANIES - 100.1% | ||||||||||||
| 2,621,743 | American Funds Insurance Series - Blue Chip Income and Growth Fund Class 1 | $ | 36,022,742 | |||||||||
|
| |||||||||||
Total Investment Companies | $ | 36,022,742 | ||||||||||
|
| |||||||||||
Total Investments | 100.1 | % | $ | 36,022,742 | ||||||||
Other Assets and Liabilities | (0.1 | )% | (22,830 | ) | ||||||||
|
|
|
| |||||||||
Total Net Assets | 100.0 | % | $ | 35,999,912 | ||||||||
|
|
|
| |||||||||
| Note: | Percentage of investments as shown is the ratio of the total market value to total net assets. |
| (1) | See Significant Accounting Policies of accompanying Notes to Financial Statements regarding valuation of securities. |
| (2) | At June 30, 2017, the cost of securities for federal income tax purposes was $33,658,790, and the aggregate gross unrealized appreciation and depreciation based on that cost were: |
Unrealized Appreciation | $ | 2,363,952 | ||
Unrealized Depreciation | — | |||
|
| |||
Net Unrealized Appreciation | $ | 2,363,952 | ||
|
|
At June 30, 2017, the investment valuation hierarchy levels were:
Assets: | ||||
Investments in Securities - Level 1 | $ | 36,022,742 | ||
|
| |||
Total | $ | 36,022,742 | ||
|
|
The accompanying Notes are an integral part of these financial statements.
| 2 |
|
Shares | Market Value(1) | |||||||||||
| INVESTMENT COMPANIES - 100.1% | ||||||||||||
| 12,263,650 | American Funds Insurance Series - Bond Fund Class 1 | $ | 133,183,240 | |||||||||
|
| |||||||||||
Total Investment Companies | $ | 133,183,240 | ||||||||||
|
| |||||||||||
Total Investments | 100.1 | % | $ | 133,183,240 | ||||||||
Other Assets and Liabilities | (0.1 | )% | (71,908 | ) | ||||||||
|
|
|
| |||||||||
Total Net Assets | 100.0 | % | $ | 133,111,332 | ||||||||
|
|
|
| |||||||||
| Note: | Percentage of investments as shown is the ratio of the total market value to total net assets. |
| (1) | See Significant Accounting Policies of accompanying Notes to Financial Statements regarding valuation of securities. |
| (2) | At June 30, 2017, the cost of securities for federal income tax purposes was $134,795,776, and the aggregate gross unrealized appreciation and depreciation based on that cost were: |
Unrealized Appreciation | $ | — | ||
Unrealized Depreciation | (1,612,536 | ) | ||
|
| |||
Net Unrealized Depreciation | $ | (1,612,536 | ) | |
|
|
At June 30, 2017, the investment valuation hierarchy levels were:
Assets: | ||||
Investments in Securities - Level 1 | $ | 133,183,240 | ||
|
| |||
Total | $ | 133,183,240 | ||
|
|
Shares | Market Value(1) | |||||||||||
| INVESTMENT COMPANIES - 100.1% | ||||||||||||
| 923,474 | American Funds Insurance Series - Global Bond Fund Class 1 | $ | 10,823,111 | |||||||||
|
| |||||||||||
Total Investment Companies | $ | 10,823,111 | ||||||||||
|
| |||||||||||
Total Investments | 100.1 | % | $ | 10,823,111 | ||||||||
Other Assets and Liabilities | (0.1 | )% | (9,824 | ) | ||||||||
|
|
|
| |||||||||
Total Net Assets | 100.0 | % | $ | 10,813,287 | ||||||||
|
|
|
| |||||||||
| Note: | Percentage of investments as shown is the ratio of the total market value to total net assets. |
| (1) | See Significant Accounting Policies of accompanying Notes to Financial Statements regarding valuation of securities. |
| (2) | At June 30, 2017, the cost of securities for federal income tax purposes was $11,247,182, and the aggregate gross unrealized appreciation and depreciation based on that cost were: |
Unrealized Appreciation | $ | — | ||
Unrealized Depreciation | (424,071 | ) | ||
|
| |||
Net Unrealized Depreciation | $ | (424,071 | ) | |
|
|
At June 30, 2017, the investment valuation hierarchy levels were:
Assets: | ||||
Investments in Securities - Level 1 | $ | 10,823,111 | ||
|
| |||
Total | $ | 10,823,111 | ||
|
|
The accompanying Notes are an integral part of these financial statements.
| 3 |
|
| HIMCO VIT American Funds Global Growth and Income Fund |
Schedule of Investments
June 30, 2017 (Unaudited)
Shares | Market Value(1) | |||||||||||
| INVESTMENT COMPANIES - 100.1% | ||||||||||||
| 2,259,967 | American Funds Insurance Series - Global Growth and Income Fund Class 1 | $ | 33,108,524 | |||||||||
|
| |||||||||||
Total Investment Companies | $ | 33,108,524 | ||||||||||
|
| |||||||||||
Total Investments | 100.1 | % | $ | 33,108,524 | ||||||||
Other Assets and Liabilities | (0.1 | )% | (21,341 | ) | ||||||||
|
|
|
| |||||||||
Total Net Assets | 100.0 | % | $ | 33,087,183 | ||||||||
|
|
|
| |||||||||
| Note: | Percentage of investments as shown is the ratio of the total market value to total net assets. |
| (1) | See Significant Accounting Policies of accompanying Notes to Financial Statements regarding valuation of securities. |
| (2) | At June 30, 2017, the cost of securities for federal income tax purposes was $25,023,305, and the aggregate gross unrealized appreciation and depreciation based on that cost were: |
Unrealized Appreciation | $ | 8,085,219 | ||
Unrealized Depreciation | — | |||
|
| |||
Net Unrealized Appreciation | $ | 8,085,219 | ||
|
|
At June 30, 2017, the investment valuation hierarchy levels were:
Assets: | ||||
Investments in Securities - Level 1 | $ | 33,108,524 | ||
|
| |||
Total | $ | 33,108,524 | ||
|
|
Shares | Market Value(1) | |||||||||||
| INVESTMENT COMPANIES - 100.1% | ||||||||||||
| 659,003 | American Funds Insurance Series - Global Growth Fund Class 1 | $ | 18,247,787 | |||||||||
|
| |||||||||||
Total Investment Companies | $ | 18,247,787 | ||||||||||
|
| |||||||||||
Total Investments | 100.1 | % | $ | 18,247,787 | ||||||||
Other Assets and Liabilities | (0.1 | )% | (13,161 | ) | ||||||||
|
|
|
| |||||||||
Total Net Assets | 100.0 | % | $ | 18,234,626 | ||||||||
|
|
|
| |||||||||
| Note: | Percentage of investments as shown is the ratio of the total market value to total net assets. |
| (1) | See Significant Accounting Policies of accompanying Notes to Financial Statements regarding valuation of securities. |
| (2) | At June 30, 2017, the cost of securities for federal income tax purposes was $16,620,301, and the aggregate gross unrealized appreciation and depreciation based on that cost were: |
Unrealized Appreciation | $ | 1,627,486 | ||
Unrealized Depreciation | — | |||
|
| |||
Net Unrealized Appreciation | $ | 1,627,486 | ||
|
|
At June 30, 2017, the investment valuation hierarchy levels were:
Assets: | ||||
Investments in Securities - Level 1 | $ | 18,247,787 | ||
|
| |||
Total | $ | 18,247,787 | ||
|
|
The accompanying Notes are an integral part of these financial statements.
| 4 |
|
| HIMCO VIT American Funds Global Small Capitalization Fund |
Schedule of Investments
June 30, 2017 (Unaudited)
Shares | Market Value(1) | |||||||||||
| INVESTMENT COMPANIES - 100.1% | ||||||||||||
| 1,603,015 | American Funds Insurance Series - Global Small Capitalization Fund Class 1 | $ | 36,452,571 | |||||||||
|
| |||||||||||
Total Investment Companies | $ | 36,452,571 | ||||||||||
|
| |||||||||||
Total Investments | 100.1 | % | $ | 36,452,571 | ||||||||
Other Assets and Liabilities | (0.1 | )% | (24,312 | ) | ||||||||
|
|
|
| |||||||||
Total Net Assets | 100.0 | % | $ | 36,428,259 | ||||||||
|
|
|
| |||||||||
| Note: | Percentage of investments as shown is the ratio of the total market value to total net assets. |
| (1) | See Significant Accounting Policies of accompanying Notes to Financial Statements regarding valuation of securities. |
| (2) | At June 30, 2017, the cost of securities for federal income tax purposes was $34,607,735, and the aggregate gross unrealized appreciation and depreciation based on that cost were: |
Unrealized Appreciation | $ | 1,844,836 | ||
Unrealized Depreciation | — | |||
|
| |||
Net Unrealized Appreciation | $ | 1,844,836 | ||
|
|
At June 30, 2017, the investment valuation hierarchy levels were:
Assets: | ||||
Investments in Securities - Level 1 | $ | 36,452,571 | ||
|
| |||
Total | $ | 36,452,571 | ||
|
|
Shares | Market Value(1) | |||||||||||
| INVESTMENT COMPANIES - 100.1% | ||||||||||||
| 3,259,037 | American Funds Insurance Series - Growth Fund Class 1 | $ | 228,393,328 | |||||||||
|
| |||||||||||
Total Investment Companies | $ | 228,393,328 | ||||||||||
|
| |||||||||||
Total Investments | 100.1 | % | $ | 228,393,328 | ||||||||
Other Assets and Liabilities | (0.1 | )% | (119,547 | ) | ||||||||
|
|
|
| |||||||||
Total Net Assets | 100.0 | % | $ | 228,273,781 | ||||||||
|
|
|
| |||||||||
| Note: | Percentage of investments as shown is the ratio of the total market value to total net assets. |
| (1) | See Significant Accounting Policies of accompanying Notes to Financial Statements regarding valuation of securities. |
| (2) | At June 30, 2017, the cost of securities for federal income tax purposes was $211,209,040, and the aggregate gross unrealized appreciation and depreciation based on that cost were: |
Unrealized Appreciation | $ | 17,184,288 | ||
Unrealized Depreciation | — | |||
|
| |||
Net Unrealized Appreciation | $ | 17,184,288 | ||
|
|
At June 30, 2017, the investment valuation hierarchy levels were:
Assets: | ||||
Investments in Securities - Level 1 | $ | 228,393,328 | ||
|
| |||
Total | $ | 228,393,328 | ||
|
|
The accompanying Notes are an integral part of these financial statements.
| 5 |
|
Shares | Market Value(1) | |||||||||||
| INVESTMENT COMPANIES - 100.1% | ||||||||||||
| 2,886,783 | American Funds Insurance Series - Growth-Income Fund Class 1 | $ | 131,550,720 | |||||||||
|
| |||||||||||
Total Investment Companies | $ | 131,550,720 | ||||||||||
|
| |||||||||||
Total Investments | 100.1 | % | $ | 131,550,720 | ||||||||
Other Assets and Liabilities | (0.1 | )% | (68,338 | ) | ||||||||
|
|
|
| |||||||||
Total Net Assets | 100.0 | % | $ | 131,482,382 | ||||||||
|
|
|
| |||||||||
| Note: | Percentage of investments as shown is the ratio of the total market value to total net assets. |
| (1) | See Significant Accounting Policies of accompanying Notes to Financial Statements regarding valuation of securities. |
| (2) | At June 30, 2017, the cost of securities for federal income tax purposes was $124,157,672, and the aggregate gross unrealized appreciation and depreciation based on that cost were: |
Unrealized Appreciation | $ | 7,393,048 | ||
Unrealized Depreciation | — | |||
|
| |||
Net Unrealized Appreciation | $ | 7,393,048 | ||
|
|
At June 30, 2017, the investment valuation hierarchy levels were:
Assets: | ||||
Investments in Securities - Level 1 | $ | 131,550,720 | ||
|
| |||
Total | $ | 131,550,720 | ||
|
|
Shares | Market Value(1) | |||||||||||
| INVESTMENT COMPANIES - 100.1% | ||||||||||||
| 6,968,878 | American Funds Insurance Series - International Fund Class 1 | $ | 137,077,829 | |||||||||
|
| |||||||||||
Total Investment Companies | $ | 137,077,829 | ||||||||||
|
| |||||||||||
Total Investments | 100.1 | % | $ | 137,077,829 | ||||||||
Other Assets and Liabilities | (0.1 | )% | (77,827 | ) | ||||||||
|
|
|
| |||||||||
Total Net Assets | 100.0 | % | $ | 137,000,002 | ||||||||
|
|
|
| |||||||||
Note: Percentage of investments as shown is the ratio of the total market value to total net assets.
(1) See Significant Accounting Policies of accompanying Notes to Financial Statements regarding valuation of securities.
(2) At June 30, 2017, the cost of securities for federal income tax purposes was $124,729,922, and the aggregate gross unrealized appreciation and depreciation based on that cost were: | ||
Unrealized Appreciation | $ | 12,347,907 | ||
Unrealized Depreciation | — | |||
|
| |||
Net Unrealized Appreciation | $ | 12,347,907 | ||
|
|
At June 30, 2017, the investment valuation hierarchy levels were:
Assets: | ||||
Investments in Securities - Level 1 | $ | 137,077,829 | ||
|
| |||
Total | $ | 137,077,829 | ||
|
|
The accompanying Notes are an integral part of these financial statements.
| 6 |
|
| HIMCO VIT American Funds New World Fund |
Schedule of Investments
June 30, 2017 (Unaudited)
Shares | Market Value(1) | |||||||||||
| INVESTMENT COMPANIES - 100.1% | ||||||||||||
| 876,091 | American Funds Insurance Series - New World Fund Class 1 | $ | 19,764,619 | |||||||||
|
| |||||||||||
Total Investment Companies | $ | 19,764,619 | ||||||||||
|
| |||||||||||
Total Investments | 100.1 | % | $ | 19,764,619 | ||||||||
Other Assets and Liabilities | (0.1 | )% | (14,216 | ) | ||||||||
|
|
|
| |||||||||
Total Net Assets | 100.0 | % | $ | 19,750,403 | ||||||||
|
|
|
| |||||||||
| Note: | Percentage of investments as shown is the ratio of the total market value to total net assets. |
| (1) | See Significant Accounting Policies of accompanying Notes to Financial Statements regarding valuation of securities. |
| (2) | At June 30, 2017, the cost of securities for federal income tax purposes was $19,572,475, and the aggregate gross unrealized appreciation and depreciation based on that cost were: |
Unrealized Appreciation | $ | 192,144 | ||
Unrealized Depreciation | — | |||
|
| |||
Net Unrealized Appreciation | $ | 192,144 | ||
|
|
At June 30, 2017, the investment valuation hierarchy levels were:
Assets: | ||||
Investments in Securities - Level 1 | $ | 19,764,619 | ||
|
| |||
Total | $ | 19,764,619 | ||
|
|
The accompanying Notes are an integral part of these financial statements.
| 7 |
|
| HIMCO Variable Insurance Trust |
Statements of Assets and Liabilities
June 30, 2017 (Unaudited)
| HIMCO VIT American Funds Asset Allocation Fund | HIMCO VIT American Funds Blue Chip Income and Growth Fund | HIMCO VIT American Funds Bond Fund | ||||||||||
Assets: | ||||||||||||
Investments in underlying funds, at market value | $ | 36,586,424 | $ | 36,022,742 | $ | 133,183,240 | ||||||
Receivables: | ||||||||||||
Investment securities sold | 1,686 | 5,952 | 659,128 | |||||||||
Other assets | 348 | 316 | 1,238 | |||||||||
|
|
|
|
|
| |||||||
Total assets | 36,588,458 | 36,029,010 | 133,843,606 | |||||||||
|
|
|
|
|
| |||||||
Liabilities: | ||||||||||||
Payables: | ||||||||||||
Fund shares redeemed | 1,686 | 5,952 | 659,128 | |||||||||
Investment management fees | 5,743 | 5,889 | 24,075 | |||||||||
Distribution fees | 7,581 | 7,443 | 27,555 | |||||||||
Trustees fees | 3 | — | 87 | |||||||||
Accrued expenses | 9,118 | 9,814 | 21,429 | |||||||||
|
|
|
|
|
| |||||||
Total liabilities | 24,131 | 29,098 | 732,274 | |||||||||
|
|
|
|
|
| |||||||
Net assets | $ | 36,564,327 | $ | 35,999,912 | $ | 133,111,332 | ||||||
|
|
|
|
|
| |||||||
Summary of Net Assets: | ||||||||||||
Capital stock and paid-in-capital | $ | 29,072,228 | $ | 24,834,051 | $ | 130,219,608 | ||||||
Undistributed net investment income | 521,956 | 1,102,067 | 3,920,618 | |||||||||
Accumulated net realized gain (loss) | 5,055,088 | 7,692,139 | (279,118 | ) | ||||||||
Unrealized appreciation (depreciation) | 1,915,055 | 2,371,655 | (749,776 | ) | ||||||||
|
|
|
|
|
| |||||||
Net assets | $ | 36,564,327 | $ | 35,999,912 | $ | 133,111,332 | ||||||
|
|
|
|
|
| |||||||
Class IB: Net asset value per share | $ | 8.61 | $ | 9.99 | $ | 9.45 | ||||||
|
|
|
|
|
| |||||||
Shares Outstanding | 4,245,694 | 3,604,028 | 14,090,964 | |||||||||
|
|
|
|
|
| |||||||
Net Assets | $ | 36,564,327 | $ | 35,999,912 | $ | 133,111,332 | ||||||
|
|
|
|
|
| |||||||
Cost of investments in underlying fund | $ | 34,671,369 | $ | 33,651,087 | $ | 133,933,016 | ||||||
|
|
|
|
|
| |||||||
The accompanying Notes are an integral part of these financial statements.
| 8 |
|
| HIMCO Variable Insurance Trust |
Statements of Assets and Liabilities (concluded)
June 30, 2017 (Unaudited)
| HIMCO VIT American Funds Global Bond Fund | HIMCO VIT American Funds Global Growth and Income Fund | HIMCO VIT American Funds Global Growth Fund | HIMCO VIT American Funds Global Small Capitalization Fund | HIMCO VIT American Funds Growth Fund | HIMCO VIT American Funds Growth- Income Fund | HIMCO VIT American Funds International Fund | HIMCO VIT American Funds New World Fund | |||||||||||||||||||||||
| $ | 10,823,111 | $ | 33,108,524 | $ | 18,247,787 | $ | 36,452,571 | $ | 228,393,328 | $ | 131,550,720 | $ | 137,077,829 | $ | 19,764,619 | |||||||||||||||
| 5,875 | 624 | 3,043 | 232,625 | 612,267 | 466,961 | 385,086 | 9,701 | |||||||||||||||||||||||
| 94 | 298 | 146 | 326 | 2,008 | 1,170 | 1,206 | 165 | |||||||||||||||||||||||
|
|
|
|
|
|
|
|
|
|
|
|
|
|
|
| |||||||||||||||
| 10,829,080 | 33,109,446 | 18,250,976 | 36,685,522 | 229,007,603 | 132,018,851 | 137,464,121 | 19,774,485 | |||||||||||||||||||||||
|
|
|
|
|
|
|
|
|
|
|
|
|
|
|
| |||||||||||||||
| 5,875 | 624 | 3,043 | 232,625 | 612,267 | 466,961 | 385,086 | 9,701 | |||||||||||||||||||||||
| 332 | 4,673 | 2,076 | 6,114 | 41,311 | 22,883 | 24,457 | 2,229 | |||||||||||||||||||||||
| 2,242 | 6,888 | 3,804 | 7,616 | 47,913 | 27,302 | 28,577 | 4,107 | |||||||||||||||||||||||
| — | 23 | — | 1 | — | — | — | — | |||||||||||||||||||||||
| 7,344 | 10,055 | 7,427 | 10,907 | 32,331 | 19,323 | 25,999 | 8,045 | |||||||||||||||||||||||
|
|
|
|
|
|
|
|
|
|
|
|
|
|
|
| |||||||||||||||
| 15,793 | 22,263 | 16,350 | 257,263 | 733,822 | 536,469 | 464,119 | 24,082 | |||||||||||||||||||||||
|
|
|
|
|
|
|
|
|
|
|
|
|
|
|
| |||||||||||||||
| $ | 10,813,287 | $ | 33,087,183 | $ | 18,234,626 | $ | 36,428,259 | $ | 228,273,781 | $ | 131,482,382 | $ | 137,000,002 | $ | 19,750,403 | |||||||||||||||
|
|
|
|
|
|
|
|
|
|
|
|
|
|
|
| |||||||||||||||
| $ | 11,475,037 | $ | 20,231,230 | $ | 13,779,798 | $ | 26,536,552 | $ | 137,301,721 | $ | 82,855,341 | $ | 105,841,564 | $ | 20,397,868 | |||||||||||||||
| 65,417 | 504,150 | 120,473 | 109,531 | 1,323,815 | 2,351,916 | 1,547,757 | 59,110 | |||||||||||||||||||||||
| (522,964 | ) | 3,317,623 | 2,663,938 | 7,896,541 | 66,847,113 | 35,671,594 | 14,519,232 | (1,388,932 | ) | |||||||||||||||||||||
| (204,203 | ) | 9,034,180 | 1,670,417 | 1,885,635 | 22,801,132 | 10,603,531 | 15,091,449 | 682,357 | ||||||||||||||||||||||
|
|
|
|
|
|
|
|
|
|
|
|
|
|
|
| |||||||||||||||
| $ | 10,813,287 | $ | 33,087,183 | $ | 18,234,626 | $ | 36,428,259 | $ | 228,273,781 | $ | 131,482,382 | $ | 137,000,002 | $ | 19,750,403 | |||||||||||||||
|
|
|
|
|
|
|
|
|
|
|
|
|
|
|
| |||||||||||||||
| $ | 8.96 | $ | 6.86 | $ | 7.51 | $ | 7.03 | $ | 7.57 | $ | 8.46 | $ | 7.92 | $ | 6.08 | |||||||||||||||
|
|
|
|
|
|
|
|
|
|
|
|
|
|
|
| |||||||||||||||
| 1,207,320 | 4,821,827 | 2,426,707 | 5,178,231 | 30,139,740 | 15,543,355 | 17,307,310 | 3,247,317 | |||||||||||||||||||||||
|
|
|
|
|
|
|
|
|
|
|
|
|
|
|
| |||||||||||||||
| $ | 10,813,287 | $ | 33,087,183 | $ | 18,234,626 | $ | 36,428,259 | $ | 228,273,781 | $ | 131,482,382 | $ | 137,000,002 | $ | 19,750,403 | |||||||||||||||
|
|
|
|
|
|
|
|
|
|
|
|
|
|
|
| |||||||||||||||
| $ | 11,027,314 | $ | 24,074,344 | $ | 16,577,370 | $ | 34,566,936 | $ | 205,592,196 | $ | 120,947,189 | $ | 121,986,380 | $ | 19,082,262 | |||||||||||||||
|
|
|
|
|
|
|
|
|
|
|
|
|
|
|
| |||||||||||||||
The accompanying Notes are an integral part of these financial statements.
| 9 |
|
| HIMCO Variable Insurance Trust |
Statements of Operations
For the Six-Month Period Ended June 30, 2017 (Unaudited)
| HIMCO VIT American Funds Asset Allocation Fund | HIMCO VIT American Funds Blue Chip Income and Growth Fund | HIMCO VIT American Funds Bond Fund | ||||||||||
Investment Income: | ||||||||||||
Dividends from underlying fund | $ | 139,416 | $ | 291,987 | $ | 2,186,025 | ||||||
|
|
|
|
|
| |||||||
Total investment income | 139,416 | 291,987 | 2,186,025 | |||||||||
|
|
|
|
|
| |||||||
Expenses: | ||||||||||||
Investment management fees | 124,617 | 138,815 | 334,580 | |||||||||
Transfer agent fees | 833 | 822 | 1,401 | |||||||||
Distribution fees - Class IB | 47,930 | 46,272 | 167,290 | |||||||||
Accounting service fees | 5,353 | 5,165 | 14,786 | |||||||||
Trustee fees | 2,413 | 2,250 | 8,423 | |||||||||
Audit fees | 7,859 | 7,805 | 10,448 | |||||||||
Printing fees | 2,683 | 3,066 | 7,166 | |||||||||
Legal fees | 2,736 | 2,590 | 9,485 | |||||||||
Insurance fees | 1,283 | 1,167 | 4,576 | |||||||||
Other expenses | 1,441 | 1,433 | 1,626 | |||||||||
|
|
|
|
|
| |||||||
Total expenses (before waivers) | 197,148 | 209,385 | 559,781 | |||||||||
|
|
|
|
|
| |||||||
Total waivers | (87,869 | ) | (102,035 | ) | (191,743 | ) | ||||||
|
|
|
|
|
| |||||||
Total expenses, net | 109,279 | 107,350 | 368,038 | |||||||||
|
|
|
|
|
| |||||||
Net Investment Income (Loss) | 30,137 | 184,637 | 1,817,987 | |||||||||
|
|
|
|
|
| |||||||
Net Realized Gain (Loss) on Investments: | ||||||||||||
Capital gain distribution received from underlying fund | 1,632,268 | 1,178,104 | 507,254 | |||||||||
Net realized gain (loss) on investments in underlying funds | 922,722 | 1,192,614 | (562,370 | ) | ||||||||
|
|
|
|
|
| |||||||
Net Realized Gain on Investments | 2,554,990 | 2,370,718 | (55,116 | ) | ||||||||
|
|
|
|
|
| |||||||
Net Changes in Unrealized Appreciation (Depreciation) of Investments: | ||||||||||||
Net unrealized appreciation (depreciation) of investments in underlying fund | 416,718 | (536,687 | ) | 1,351,491 | ||||||||
|
|
|
|
|
| |||||||
Net Realized and Unrealized Gain (Loss) on Investments | 2,971,708 | 1,834,031 | 1,296,375 | |||||||||
|
|
|
|
|
| |||||||
Net Increase in Net Assets Resulting from Operations | $ | 3,001,845 | $ | 2,018,668 | $ | 3,114,362 | ||||||
|
|
|
|
|
| |||||||
The accompanying Notes are an integral part of these financial statements.
| 10 |
|
| HIMCO Variable Insurance Trust |
Statements of Operations (concluded)
For the Six-Month Period Ended June 30, 2017 (Unaudited)
| HIMCO VIT American Funds Global Bond Fund | HIMCO VIT American Funds Global Growth and Income Fund | HIMCO VIT American Funds Global Growth Fund | HIMCO VIT American Funds Global Small Capitalization Fund | HIMCO VIT American Funds Growth Fund | HIMCO VIT American Funds Growth- Income Fund | HIMCO VIT American Funds International Fund | HIMCO VIT American Funds New World Fund | |||||||||||||||||||||||
| $ | 65,135 | $ | 107,829 | $ | 21,942 | $ | 154,400 | $ | 918,314 | $ | 471,873 | $ | 522,643 | $ | 33,518 | |||||||||||||||
|
|
|
|
|
|
|
|
|
|
|
|
|
|
|
| |||||||||||||||
| 65,135 | 107,829 | 21,942 | 154,400 | 918,314 | 471,873 | 522,643 | 33,518 | |||||||||||||||||||||||
|
|
|
|
|
|
|
|
|
|
|
|
|
|
|
| |||||||||||||||
| 39,825 | 129,397 | 84,874 | 145,525 | 857,584 | 462,754 | 578,527 | 105,658 | |||||||||||||||||||||||
| 663 | 792 | 695 | 814 | 1,947 | 1,386 | 1,397 | 711 | |||||||||||||||||||||||
| 13,275 | 40,436 | 21,219 | 45,476 | 285,861 | 165,269 | 170,155 | 24,013 | |||||||||||||||||||||||
| 2,533 | 4,666 | 3,049 | 5,039 | 23,816 | 14,512 | 14,701 | 3,322 | |||||||||||||||||||||||
| 648 | 2,020 | 997 | 2,242 | 13,927 | 8,118 | 8,331 | 1,154 | |||||||||||||||||||||||
| 7,443 | 7,919 | 7,508 | 8,015 | 12,599 | 10,209 | 10,505 | 7,573 | |||||||||||||||||||||||
| 2,178 | 2,654 | 2,399 | 3,459 | 12,498 | 5,737 | 11,549 | 3,135 | |||||||||||||||||||||||
| 737 | 2,270 | 1,137 | 2,543 | 15,879 | 9,251 | 9,462 | 1,317 | |||||||||||||||||||||||
| 344 | 1,100 | 536 | 1,204 | 7,419 | 4,320 | 4,453 | 614 | |||||||||||||||||||||||
| 1,386 | 1,432 | 1,397 | 1,437 | 1,789 | 1,609 | 1,618 | 1,403 | |||||||||||||||||||||||
|
|
|
|
|
|
|
|
|
|
|
|
|
|
|
| |||||||||||||||
| 69,032 | 192,686 | 123,811 | 215,754 | 1,233,319 | 683,165 | 810,698 | 148,900 | |||||||||||||||||||||||
|
|
|
|
|
|
|
|
|
|
|
|
|
|
|
| |||||||||||||||
| (38,234 | ) | (103,726 | ) | (74,584 | ) | (110,249 | ) | (615,859 | ) | (326,184 | ) | (436,357 | ) | (93,190 | ) | |||||||||||||||
|
|
|
|
|
|
|
|
|
|
|
|
|
|
|
| |||||||||||||||
| 30,798 | 88,960 | 49,227 | 105,505 | 617,460 | 356,981 | 374,341 | 55,710 | |||||||||||||||||||||||
|
|
|
|
|
|
|
|
|
|
|
|
|
|
|
| |||||||||||||||
| 34,337 | 18,869 | (27,285 | ) | 48,895 | 300,854 | 114,892 | 148,302 | (22,192 | ) | |||||||||||||||||||||
|
|
|
|
|
|
|
|
|
|
|
|
|
|
|
| |||||||||||||||
| 931 | 579,581 | 540,154 | — | 21,381,464 | 8,339,126 | 1,540,056 | — | |||||||||||||||||||||||
| (61,451 | ) | 1,242,390 | 219,580 | 53,754 | 10,938,053 | 4,889,856 | 2,670,835 | (228,723 | ) | |||||||||||||||||||||
|
|
|
|
|
|
|
|
|
|
|
|
|
|
|
| |||||||||||||||
| (60,520 | ) | 1,821,971 | 759,734 | 53,754 | 32,319,517 | 13,228,982 | 4,210,891 | (228,723 | ) | |||||||||||||||||||||
|
|
|
|
|
|
|
|
|
|
|
|
|
|
|
| |||||||||||||||
| 527,429 | 2,592,633 | 2,126,689 | 4,203,929 | (806,982 | ) | (1,094,789 | ) | 18,697,182 | 2,804,860 | |||||||||||||||||||||
|
|
|
|
|
|
|
|
|
|
|
|
|
|
|
| |||||||||||||||
| 466,909 | 4,414,604 | 2,886,423 | 4,257,683 | 31,512,535 | 12,134,193 | 22,908,073 | 2,576,137 | |||||||||||||||||||||||
|
|
|
|
|
|
|
|
|
|
|
|
|
|
|
| |||||||||||||||
| $ | 501,246 | $ | 4,433,473 | $ | 2,859,138 | $ | 4,306,578 | $ | 31,813,389 | $ | 12,249,085 | $ | 23,056,375 | $ | 2,553,945 | |||||||||||||||
|
|
|
|
|
|
|
|
|
|
|
|
|
|
|
| |||||||||||||||
The accompanying Notes are an integral part of these financial statements.
| 11 |
|
| HIMCO Variable Insurance Trust |
Statements of Changes in Net Assets
| HIMCO VIT American Funds Asset Allocation Fund | HIMCO VIT American Funds Blue Chip Income and Growth Fund | |||||||||||||||
| For the Six-Month Period Ended June 30, 2017 (Unaudited) | For the Year Ended December 31, 2016 | For the Six-Month Period Ended June 30, 2017 (Unaudited) | For the Year Ended December 31, 2016 | |||||||||||||
Operations: | ||||||||||||||||
Net investment income (loss) | $ | 30,137 | $ | 491,821 | $ | 184,637 | $ | 917,430 | ||||||||
Net realized gain (loss) on investments | 2,554,990 | 2,500,099 | 2,370,718 | 5,329,289 | ||||||||||||
Net unrealized appreciation (depreciation) of investments | 416,718 | 471,223 | (536,687 | ) | 108,356 | |||||||||||
|
|
|
|
|
|
|
| |||||||||
Net Increase (Decrease) in Net Assets Resulting from Operations | 3,001,845 | 3,463,143 | 2,018,668 | 6,355,075 | ||||||||||||
|
|
|
|
|
|
|
| |||||||||
Distributions to Shareholders: | ||||||||||||||||
From net investment income | ||||||||||||||||
Class IB | — | (1,013,091 | ) | — | (899,736 | ) | ||||||||||
From net realized gain on investments | ||||||||||||||||
Class IB | — | (6,577,960 | ) | �� | (8,179,373 | ) | ||||||||||
|
|
|
|
|
|
|
| |||||||||
Total distributions | — | (7,591,051 | ) | — | (9,079,109 | ) | ||||||||||
|
|
|
|
|
|
|
| |||||||||
Capital Share Transactions: | ||||||||||||||||
Class IB | ||||||||||||||||
Sold | 1,119,362 | 2,407,590 | 544,286 | 3,895,906 | ||||||||||||
Issued on reinvestment of distributions | — | 7,591,051 | — | 9,079,109 | ||||||||||||
Redeemed | (7,057,295 | ) | (10,463,729 | ) | (4,036,979 | ) | (9,650,580 | ) | ||||||||
|
|
|
|
|
|
|
| |||||||||
Net increase (decrease) from capital share transactions | (5,937,933 | ) | (465,088 | ) | (3,492,693 | ) | 3,324,435 | |||||||||
|
|
|
|
|
|
|
| |||||||||
Net Increase (Decrease) in Net Assets | (2,936,088 | ) | (4,592,996 | ) | (1,474,025 | ) | 600,401 | |||||||||
|
|
|
|
|
|
|
| |||||||||
Net Assets: | ||||||||||||||||
Beginning of period | 39,500,415 | 44,093,411 | 37,473,937 | 36,873,536 | ||||||||||||
|
|
|
|
|
|
|
| |||||||||
End of period | $ | 36,564,327 | $ | 39,500,415 | $ | 35,999,912 | $ | 37,473,937 | ||||||||
|
|
|
|
|
|
|
| |||||||||
Undistributed net investment income | $ | 521,956 | $ | 491,819 | $ | 1,102,067 | $ | 917,430 | ||||||||
|
|
|
|
|
|
|
| |||||||||
Shares: | ||||||||||||||||
Class IB | ||||||||||||||||
Sold | 133,258 | 281,473 | 55,874 | 362,953 | ||||||||||||
Issued on reinvestment of distributions | — | 965,783 | — | 995,516 | ||||||||||||
Redeemed | (840,267 | ) | (1,222,357 | ) | (410,486 | ) | (951,358 | ) | ||||||||
|
|
|
|
|
|
|
| |||||||||
Total share activity | (707,009 | ) | 24,899 | (354,612 | ) | 407,111 | ||||||||||
|
|
|
|
|
|
|
| |||||||||
The accompanying Notes are an integral part of these financial statements.
| 12 |
|
| HIMCO Variable Insurance Trust |
Statements of Changes in Net Assets (continued)
| HIMCO VIT American Funds Bond Fund | HIMCO VIT American Funds Global Bond Fund | HIMCO VIT American Funds Global Growth and Income Fund | HIMCO VIT American Funds Global Growth Fund | |||||||||||||||||||||||||||
| For the Six-Month Period Ended June 30, 2017 (Unaudited) | For the Year Ended December 31, 2016 | For the Six-Month Period Ended June 30, 2017 (Unaudited) | For the Year Ended December 31, 2016 | For the Six-Month Period Ended June 30, 2017 (Unaudited) | For the Year Ended December 31, 2016 | For the Six-Month Period Ended June 30, 2017 (Unaudited) | For the Year Ended December 31, 2016 | |||||||||||||||||||||||
| $ | 1,817,987 | $ | 2,102,636 | $ | 34,337 | $ | 31,081 | $ | 18,869 | $ | 485,284 | $ | (27,285 | ) | $ | 147,759 | ||||||||||||||
| (55,116 | ) | 2,397 | (60,520 | ) | (162,063 | ) | 1,821,971 | 3,036,099 | 759,734 | 2,285,113 | ||||||||||||||||||||
| 1,351,491 | 2,071,693 | 527,429 | 345,022 | 2,592,633 | (1,263,416 | ) | 2,126,689 | (2,436,159 | ) | |||||||||||||||||||||
|
|
|
|
|
|
|
|
|
|
|
|
|
|
|
| |||||||||||||||
| 3,114,362 | 4,176,726 | 501,246 | 214,040 | 4,433,473 | 2,257,967 | 2,859,138 | (3,287 | ) | ||||||||||||||||||||||
|
|
|
|
|
|
|
|
|
|
|
|
|
|
|
| |||||||||||||||
| — | (4,871,873 | ) | — | (169,483 | ) | — | (665,667 | ) | — | (314,071 | ) | |||||||||||||||||||
| — | (1,344,209 | ) | — | — | — | (4,556,731 | ) | — | (2,791,775 | ) | ||||||||||||||||||||
|
|
|
|
|
|
|
|
|
|
|
|
|
|
|
| |||||||||||||||
| — | (6,216,082 | ) | — | (169,483 | ) | — | (5,222,398 | ) | — | (3,105,846 | ) | |||||||||||||||||||
|
|
|
|
|
|
|
|
|
|
|
|
|
|
|
| |||||||||||||||
| 7,012,965 | 10,784,893 | 1,111,869 | 2,616,991 | 141,573 | 439,412 | 1,111,886 | 1,146,915 | |||||||||||||||||||||||
| — | 6,216,082 | — | 169,483 | — | 5,222,398 | — | 3,105,846 | |||||||||||||||||||||||
| (12,770,601 | ) | (30,890,662 | ) | (1,111,514 | ) | (3,078,042 | ) | (3,620,398 | ) | (8,905,562 | ) | (1,377,777 | ) | (4,501,163 | ) | |||||||||||||||
|
|
|
|
|
|
|
|
|
|
|
|
|
|
|
| |||||||||||||||
| (5,757,636 | ) | (13,889,687 | ) | 355 | (291,568 | ) | (3,478,825 | ) | (3,243,752 | ) | (265,891 | ) | (248,402 | ) | ||||||||||||||||
|
|
|
|
|
|
|
|
|
|
|
|
|
|
|
| |||||||||||||||
| (2,643,274 | ) | (15,929,043 | ) | 501,601 | (247,011 | ) | 954,648 | (6,208,183 | ) | 2,593,247 | (3,357,535 | ) | ||||||||||||||||||
|
|
|
|
|
|
|
|
|
|
|
|
|
|
|
| |||||||||||||||
| 135,754,606 | 151,683,649 | 10,311,686 | 10,558,697 | 32,132,535 | 38,340,718 | 15,641,379 | 18,998,914 | |||||||||||||||||||||||
|
|
|
|
|
|
|
|
|
|
|
|
|
|
|
| |||||||||||||||
| $ | 133,111,332 | $ | 135,754,606 | $ | 10,813,287 | $ | 10,311,686 | $ | 33,087,183 | $ | 32,132,535 | $ | 18,234,626 | $ | 15,641,379 | |||||||||||||||
|
|
|
|
|
|
|
|
|
|
|
|
|
|
|
| |||||||||||||||
| $ | 3,920,618 | $ | 2,102,631 | $ | 65,417 | $ | 31,080 | $ | 504,150 | $ | 485,281 | $ | 120,473 | $ | 147,758 | |||||||||||||||
|
|
|
|
|
|
|
|
|
|
|
|
|
|
|
| |||||||||||||||
| 752,532 | 1,134,890 | 127,615 | 291,034 | 22,323 | 69,783 | 157,313 | 162,704 | |||||||||||||||||||||||
| — | 652,950 | — | 18,442 | — | 868,951 | — | 474,175 | |||||||||||||||||||||||
| (1,369,016 | ) | (3,223,939 | ) | (126,758 | ) | (349,266 | ) | (565,730 | ) | (1,420,127 | ) | (195,792 | ) | (637,207 | ) | |||||||||||||||
|
|
|
|
|
|
|
|
|
|
|
|
|
|
|
| |||||||||||||||
| (616,484 | ) | (1,436,099 | ) | 857 | (39,790 | ) | (543,407 | ) | (481,393 | ) | (38,479 | ) | (328 | ) | ||||||||||||||||
|
|
|
|
|
|
|
|
|
|
|
|
|
|
|
| |||||||||||||||
The accompanying Notes are an integral part of these financial statements.
| 13 |
|
| HIMCO Variable Insurance Trust |
Statements of Changes in Net Assets (continued)
| HIMCO VIT American Funds Global Small Capitalization Fund | HIMCO VIT American Funds Growth Fund | |||||||||||||||
| For the Six-Month Period Ended June 30, 2017 (Unaudited) | For the Year Ended December 31, 2016 | For the Six-Month Period Ended June 30, 2017 (Unaudited) | For the Year Ended December 31, 2016 | |||||||||||||
Operations: | ||||||||||||||||
Net investment income (loss) | $ | 48,895 | $ | 60,637 | $ | 300,854 | $ | 1,022,969 | ||||||||
Net realized gain (loss) on investments | 53,754 | 8,131,856 | 32,319,517 | 43,069,946 | ||||||||||||
Net unrealized appreciation (depreciation) of investments | 4,203,929 | (7,572,548 | ) | (806,982 | ) | (23,789,767 | ) | |||||||||
|
|
|
|
|
|
|
| |||||||||
Net Increase (Decrease) in Net Assets Resulting from Operations | 4,306,578 | 619,945 | 31,813,389 | 20,303,148 | ||||||||||||
|
|
|
|
|
|
|
| |||||||||
Distributions to Shareholders: | ||||||||||||||||
From net investment income | ||||||||||||||||
Class IB | — | (160,017 | ) | — | (748,434 | ) | ||||||||||
From net realized gain on investments | ||||||||||||||||
Class IB | — | (7,330,124 | ) | — | (92,964,012 | ) | ||||||||||
|
|
|
|
|
|
|
| |||||||||
Total distributions | — | (7,490,141 | ) | — | (93,712,446 | ) | ||||||||||
|
|
|
|
|
|
|
| |||||||||
Capital Share Transactions: | ||||||||||||||||
Class IB | ||||||||||||||||
Sold | 673,144 | 2,369,229 | 1,403,612 | 4,156,939 | ||||||||||||
Issued on reinvestment of distributions | — | 7,490,141 | — | 93,712,446 | ||||||||||||
Redeemed | (4,132,927 | ) | (9,144,876 | ) | (30,210,761 | ) | (56,278,674 | ) | ||||||||
|
|
|
|
|
|
|
| |||||||||
Net increase (decrease) from capital share transactions | (3,459,783 | ) | 714,494 | (28,807,149 | ) | 41,590,711 | ||||||||||
|
|
|
|
|
|
|
| |||||||||
Net Increase (Decrease) in Net Assets | 846,795 | (6,155,702 | ) | 3,006,240 | (31,818,587 | ) | ||||||||||
|
|
|
|
|
|
|
| |||||||||
Net Assets: | ||||||||||||||||
Beginning of period | 35,581,464 | 41,737,166 | 225,267,541 | 257,086,128 | ||||||||||||
|
|
|
|
|
|
|
| |||||||||
End of period | $ | 36,428,259 | $ | 35,581,464 | $ | 228,273,781 | $ | 225,267,541 | ||||||||
|
|
|
|
|
|
|
| |||||||||
Undistributed net investment income | $ | 109,531 | $ | 60,636 | $ | 1,323,815 | $ | 1,022,961 | ||||||||
|
|
|
|
|
|
|
| |||||||||
Shares: | ||||||||||||||||
Class IB | ||||||||||||||||
Sold | 99,513 | 341,446 | 191,048 | 453,446 | ||||||||||||
Issued on reinvestment of distributions | — | 1,172,166 | — | 14,551,622 | ||||||||||||
Redeemed | (611,541 | ) | (1,353,152 | ) | (4,210,370 | ) | (6,998,542 | ) | ||||||||
|
|
|
|
|
|
|
| |||||||||
Total share activity | (512,028 | ) | 160,460 | (4,019,322 | ) | 8,006,526 | ||||||||||
|
|
|
|
|
|
|
| |||||||||
The accompanying Notes are an integral part of these financial statements.
| 14 |
|
| HIMCO Variable Insurance Trust |
Statements of Changes in Net Assets (concluded)
| HIMCO VIT American Funds Growth-Income Fund | HIMCO VIT American Funds International Fund | HIMCO VIT American Funds New World Fund | ||||||||||||||||||||
| For the Six-Month Period Ended June 30, 2017 (Unaudited) | For the Year Ended December 31, 2016 | For the Six-Month Period Ended June 30, 2017 (Unaudited) | For the Year Ended December 31, 2016 | For the Six-Month Period Ended June 30, 2017 (Unaudited) | For the Year Ended December 31, 2016 | |||||||||||||||||
| $ | 114,892 | $ | 2,237,028 | $ | 148,302 | $ | 1,399,466 | $ | (22,192 | ) | $ | 81,306 | ||||||||||
| 13,228,982 | 26,215,232 | 4,210,891 | 12,521,810 | (228,723 | ) | (946,938 | ) | |||||||||||||||
| (1,094,789 | ) | (13,955,688 | ) | 18,697,182 | (9,028,302 | ) | 2,804,860 | 1,766,630 | ||||||||||||||
|
|
|
|
|
|
|
|
|
|
|
| |||||||||||
| 12,249,085 | 14,496,572 | 23,056,375 | 4,892,974 | 2,553,945 | 900,998 | |||||||||||||||||
|
|
|
|
|
|
|
|
|
|
|
| |||||||||||
| — | (2,142,064 | ) | — | (1,915,253 | ) | — | (402,896 | ) | ||||||||||||||
| — | (39,353,428 | ) | — | (15,464,176 | ) | — | (796,215 | ) | ||||||||||||||
|
|
|
|
|
|
|
|
|
|
|
| |||||||||||
| — | (41,495,492 | ) | — | (17,379,429 | ) | — | (1,199,111 | ) | ||||||||||||||
|
|
|
|
|
|
|
|
|
|
|
| |||||||||||
| 1,914,366 | 3,246,275 | 2,985,929 | 8,845,165 | 864,711 | 1,098,215 | |||||||||||||||||
| — | 41,495,492 | — | 17,379,429 | — | 1,199,111 | |||||||||||||||||
| (14,776,315 | ) | (32,328,123 | ) | (19,738,509 | ) | (32,294,458 | ) | (2,241,286 | ) | (4,718,145 | ) | |||||||||||
|
|
|
|
|
|
|
|
|
|
|
| |||||||||||
| (12,861,949 | ) | 12,413,644 | (16,752,580 | ) | (6,069,864 | ) | (1,376,575 | ) | (2,420,819 | ) | ||||||||||||
|
|
|
|
|
|
|
|
|
|
|
| |||||||||||
| (612,864 | ) | (14,585,276 | ) | 6,303,795 | (18,556,319 | ) | 1,177,370 | (2,718,932 | ) | |||||||||||||
|
|
|
|
|
|
|
|
|
|
|
| |||||||||||
| 132,095,246 | 146,680,522 | 130,696,207 | 149,252,526 | 18,573,033 | 21,291,965 | |||||||||||||||||
|
|
|
|
|
|
|
|
|
|
|
| |||||||||||
| $ | 131,482,382 | $ | 132,095,246 | $ | 137,000,002 | $ | 130,696,207 | $ | 19,750,403 | $ | 18,573,033 | |||||||||||
|
|
|
|
|
|
|
|
|
|
|
| |||||||||||
| $ | 2,351,916 | $ | 2,237,024 | $ | 1,547,757 | $ | 1,399,455 | $ | 59,110 | $ | 81,302 | |||||||||||
|
|
|
|
|
|
|
|
|
|
|
| |||||||||||
| 230,670 | 356,388 | 424,988 | 1,274,593 | 146,177 | 201,679 | |||||||||||||||||
| — | 5,540,119 | — | 2,522,414 | — | 218,020 | |||||||||||||||||
| (1,804,197 | ) | (3,661,440 | ) | (2,664,861 | ) | (4,612,014 | ) | (388,583 | ) | (882,871 | ) | |||||||||||
|
|
|
|
|
|
|
|
|
|
|
| |||||||||||
| (1,573,527 | ) | 2,235,067 | (2,239,873 | ) | (815,007 | ) | (242,406 | ) | (463,172 | ) | ||||||||||||
|
|
|
|
|
|
|
|
|
|
|
| |||||||||||
The accompanying Notes are an integral part of these financial statements.
| 15 |
|
| HIMCO Variable Insurance Trust |
Notes to Financial Statements
June 30, 2017 (Unaudited)
| 1. | Organization: |
HIMCO Variable Insurance Trust (the “Trust”) is an open-end registered management investment company. The Trust is organized under the laws of the State of Delaware and is registered with the Securities and Exchange Commission (“SEC”) under the Investment Company Act of 1940, as amended (“1940 Act”).
The financial statements and the accompanying notes relate to the following funds: HIMCO VIT American Funds Asset Allocation Fund (“Asset Allocation Fund”), HIMCO VIT American Funds Blue Chip Income and Growth Fund (“Blue Chip Income and Growth Fund”), HIMCO VIT American Funds Bond Fund (“Bond Fund”), HIMCO VIT American Funds Global Bond Fund (“Global Bond Fund”), HIMCO VIT American Funds Global Growth and Income Fund (“Global Growth and Income Fund”), HIMCO VIT American Funds Global Growth Fund (“Global Growth Fund”), HIMCO VIT American Funds Global Small Capitalization Fund (“Global Small Capitalization Fund”), HIMCO VIT American Funds Growth Fund (“Growth Fund”), HIMCO VIT American Funds Growth-Income Fund (“Growth-Income Fund”), HIMCO VIT American Funds International Fund (“International Fund”) and HIMCO VIT American Funds New World Fund (“New World Fund”) (each a “Fund” or collectively the “Funds”). The Funds are each a series of the Trust. Each Fund is the successor of a series of Hartford Series Fund, Inc. (collectively referred to as the “American Funds HLS Funds”). The reorganization of the American Funds HLS with and into the respective Funds occurred on October 20, 2014. All information regarding and references to periods prior to October 20, 2014 relate to the respective American Funds HLS Funds.
Each Fund is a diversified open-end management investment company, except for the HIMCO VIT American Funds Global Bond Fund, which is non-diversified. Each Fund is authorized to issue an unlimited number of shares. The Funds are investment companies and apply specialized accounting and reporting under Accounting Standards Codification Topic 946, Financial Services – Investment Companies. The Funds serve as underlying investment options for certain variable annuity and variable life insurance separate accounts of Hartford Life Insurance Company (“Hartford Life”) and its affiliates.
The Funds operate in the manner of “feeder funds”, investing all of their assets in shares of corresponding mutual funds (the “Master Funds”). Each Master Fund is offered by American Funds Insurance Series® and is a registered open-end investment company. The Funds and their related Master Funds are listed below:
Fund | Master Fund | |
Asset Allocation Fund | Asset Allocation Fund Class 1 | |
Blue Chip Income and Growth Fund | Blue Chip Income and Growth Fund Class 1 | |
Bond Fund | Bond Fund Class 1 | |
Global Bond Fund | Global Bond Fund Class 1 | |
Global Growth and Income Fund | Global Growth and Income Fund Class 1 | |
Global Growth Fund | Global Growth Fund Class 1 | |
Global Small Capitalization Fund | Global Small Capitalization Fund Class 1 | |
Growth Fund | Growth Fund Class 1 | |
Growth-Income Fund | Growth-Income Fund Class 1 | |
International Fund | International Fund Class 1 | |
New World Fund | New World Fund Class 1 |
The financial statements of the Master Funds, including the Summary Investment Portfolios, are provided separately and should be read in conjunction with the Funds’ financial statements.
Class IB shares of the Funds are offered at the per share net asset value (“NAV”) without a sales charge and are subject to distribution and service fees charged pursuant to a distribution plan (the “Distribution Plan”) approved by the Board of Trustees in accordance with Rule 12b-1 under the 1940 Act and the requirements of the applicable market conduct rules of the Financial Industry Regulatory Authority concerning asset-based sales charges.
| 2. | Significant Accounting Policies: |
The following is a summary of significant accounting policies followed by the Funds in the preparation of their financial statements, which are in accordance with United States Generally Accepted Accounting Principles (“U.S. GAAP”). The
| 16 |
|
| HIMCO Variable Insurance Trust |
Notes to Financial Statements – (continued)
June 30, 2017 (Unaudited)
preparation of financial statements in accordance with U.S. GAAP may require management to make estimates and assumptions that affect the reported amounts of assets and liabilities and disclosure of contingent assets and liabilities at the date of the financial statements and the reported amounts of increases and decreases in net assets resulting from operations during the reporting period. Actual results could differ from those estimates.
| a) | Determination of Net Asset Value – The NAV per share of each Fund is determined as of the close of regular trading on the New York Stock Exchange (the “Exchange”) (normally 4:00 p.m. Eastern Time) (the “NYSE Close”) on each day that the Exchange is open (the “Valuation Date”). If the Exchange is closed due to weather or other extraordinary circumstances on a day it would typically be open for business, the Funds will treat such day as a typical business day and accept purchase and redemption orders and calculate the Funds’ NAV as of 4:00 p.m. Eastern Time. The NAV for each share is determined by dividing the value of a Fund’s net assets by the number of shares outstanding. For any day where, due to technical or other issues, trading is halted before the scheduled close of the Exchange, and not as part of a trading halt that is effected on a market-wide basis, the Fund may elect to continue to treat the Valuation Date as occurring at the time of the schedule close of the Exchange. Information that becomes known to the Funds after the NAV has been calculated on a particular day will not generally be used to retroactively adjust the NAV determined earlier that day. |
| b) | Investment Valuation – The Funds do not buy investment securities directly. Instead, each Fund invests all of its assets in a separate mutual fund, which has the same investment objective and strategies as the Fund. Each Master Fund is a series of American Funds Insurance Series®. Investments in Class 1 shares of the Master Funds are valued at the respective NAV of each Master Fund as determined as of the NYSE Close on the Valuation Date. If market prices are not readily available or are deemed unreliable, a Fund will use the fair value of the security or other instrument as determined in good faith under policies and procedures established by and under the supervision of the Board of Trustees. The Prospectuses, Statements of Additional Information and Shareholder Reports by the Master Funds explain the valuation methods used for the Master Funds, including the circumstances under which the Master Funds may use fair value pricing and the effects of doing so. Such Prospectuses, Statements of Additional Information and Shareholder Reports are available on the SEC EDGAR database on its internet site at http://www.sec.gov. |
U.S. GAAP defines fair value as the price that a fund would receive to sell an asset or pay to transfer a liability in an orderly transaction between market participants at the measurement date. The U.S. GAAP fair value measurement standards require disclosure of a fair value hierarchy for each major category of assets and liabilities. Various inputs are used in determining the fair value of each Fund’s investments. These inputs are summarized into three broad hierarchy levels. This hierarchy is based on whether the valuation inputs are observable or unobservable. The determination of which category within the fair value hierarchy is appropriate for any given instrument is based on the lowest level of input that is significant to the fair value measurement. These levels are:
| • | Level 1 – Inputs using (unadjusted) quoted prices in active markets or exchanges for identical assets and liabilities. |
| • | Level 2 – Observable inputs other than Level 1 prices, which may include, but are not limited to, quoted prices for similar assets or liabilities in markets that are active, quoted prices for identical or similar assets or liabilities in markets that are not active, inputs other than quoted prices that are observable for the assets or liabilities or other market corroborated inputs. |
| • | Level 3 – Significant unobservable inputs based on the best information available in the circumstances, to the extent observable inputs are not available. Level 3 may include financial instruments whose values are determined using indicative market quotes or require significant management judgment or estimation. |
The procedures adopted by the Board of Trustees define how investments are to be valued, including the formation and activities of a Valuation Committee. The Valuation Committee has the overall responsibility for implementing the procedures adopted by the Board of Trustees, including the responsibility for determining the fair value of the Funds’ investments. The Valuation Committee is also responsible for determining in good faith the fair value of an investment when the value cannot be obtained from primary pricing services or alternative sources or if the valuation of an investment, as provided by the primary pricing service or alternative source, is believed not to reflect the investment’s fair value as of the Valuation Date.
| 17 |
|
| HIMCO Variable Insurance Trust |
Notes to Financial Statements – (continued)
June 30, 2017 (Unaudited)
The Valuation Committee is comprised of the Trust’s Chief Executive Officer, Treasurer, Chief Operating Officer, and Chief Legal Officer, or their designees, and other personnel of the investment manager subject to prior approval by the Board of Trustees. In addition, the Trust’s Chief Compliance Officer (“CCO”) shall designate a member of the compliance group to attend Valuation Committee meetings as a non-voting resource, to monitor for and provide guidance with respect to compliance with these procedures and to keep the Trust’s CCO regularly informed of pricing and Valuation Committee proceedings. Two members of the Valuation Committee or their designees, representing different departments, shall constitute a quorum for purposes of permitting the Committee to take action. The Valuation Committee will consider all relevant factors in determining an investment’s fair value, and may seek the advice of the Funds’ adviser, knowledgeable brokers, and legal counsel in making such determination.
At each quarterly meeting of the Board of Trustees, the Valuation Committee provides a written report that includes details of all fair-valued investments to the extent any are fair-valued, including the reason for the fair valuation, and an indication, when possible, of the accuracy of the valuation by disclosing the next available reliable public price quotation or the disposition price of such investments (the “look-back” review). The Board of Trustees then must consider for ratification all of the fair value determinations made during the previous quarter.
Valuation levels are not necessarily indicative of the risk associated with investing in such investments.
For additional information, refer to the Investment Valuation Hierarchy Level Summary included in the Schedule of Investments for each Fund.
For purposes of reporting transfers between different hierarchy levels, both transfers in and out of each level, as applicable, are shown as if they occurred at the beginning of the period. During the six-month period ended June 30, 2017, there were no transfers between different hierarchy levels.
| c) | Investment Transactions and Investment Income – Investment transactions are recorded as of the trade date (the date the order to buy or sell is executed) for financial reporting purposes. Realized gains and losses are determined on the basis of identified cost. |
Income and capital gain distributions from the Master Funds are recorded on the ex-dividend date.
| d) | Fund Share Valuation and Dividend Distributions to Shareholders – Orders for the Funds’ shares are executed in accordance with the investment instructions of the contract holders. Orders for the purchase of a Fund’s shares received by an insurance company prior to the close of the Exchange on any day the Exchange is open for business are priced at the NAV determined as of the close of the Exchange. Orders received by an insurance company after the close of the Exchange, or on a day on which the Exchange and/or the Fund is not open for business, are priced at the next determined NAV. |
Dividends are declared pursuant to a policy adopted by the Board of Trustees based upon the investment performance of the Funds. The policy of all the Funds is to pay dividends from net investment income and to make distributions of realized gains, if any, at least once per year.
Distributions from net investment income, realized capital gains and capital are determined in accordance with federal income tax regulations, which may differ from U.S. GAAP with respect to character and timing. These differences may include, but are not limited to, losses deferred due to wash sale adjustments and short-term capital gain adjustments. Permanent book and federal income tax basis differences relating to shareholder distributions will result in reclassifications to certain of the Funds’ capital accounts (see Federal Income Taxes: Reclassification of Capital Accounts note).
| 3. | Principal Risks: |
The Funds are exposed to the risks of the Master Funds in direct proportion to the amount of assets each Fund allocates to each Master Fund. The market values of the Master Funds may decline due to general market conditions which are not specifically related to a particular fund, such as real or perceived adverse economic conditions or adverse investor sentiment generally.
| 18 |
|
| HIMCO Variable Insurance Trust |
Notes to Financial Statements – (continued)
June 30, 2017 (Unaudited)
| 4. | Federal Income Taxes: |
| a) | Federal Income Taxes – For federal income tax purposes, the Funds intend to continue to qualify as Regulated Investment Companies (“RIC”) under Subchapter M of the Internal Revenue Code of 1986, as amended (“IRC”) by distributing substantially all of their taxable net investment income and net realized capital gains to their shareholders and otherwise complying with the requirements of the IRC. The Funds distributed substantially all of their income and capital gains in the prior years, if applicable, and each Fund intends to distribute substantially all of its income and capital gains prior to the next fiscal year end. Accordingly, no provision for federal income or excise taxes has been made in the accompanying financial statements. Distributions from short-term capital gains are treated as ordinary income distributions for federal income tax purposes. |
| b) | Net Investment Income (Loss), Net Realized Gains (Losses) and Distributions – Net investment income (loss) and net realized gains (losses) may differ for financial statement and tax purposes primarily because of losses deferred due to wash sale adjustments and short-term capital gain distribution adjustments. The character of distributions made during the year from net investment income or net realized gains may differ from their ultimate characterization for federal income tax purposes. Also, due to the timing of dividend distributions, the fiscal year in which amounts are distributed may differ from the year that the net investment income (loss) or net realized gains (losses) were recorded by a Fund. |
| c) | Distributions and Components of Distributable Earnings – The tax character of distributions paid by the Funds for the periods indicated is as follows (as adjusted for dividends payable, if applicable): |
| For the Year Ended December 31, 2016 | For the Year Ended December 31, 2015 | |||||||||||||||
| Ordinary Income | Long-Term Capital Gains(1) | Ordinary Income | Long-Term Capital Gains(1) | |||||||||||||
Asset Allocation Fund | $ | (1,013,091 | ) | $ | (6,577,960 | ) | $ | (721,372 | ) | $ | (758,343 | ) | ||||
Blue Chip Income and Growth Fund | (899,736 | ) | (8,179,373 | ) | (1,263,856 | ) | (708,750 | ) | ||||||||
Bond Fund | (4,871,873 | ) | (1,344,209 | ) | (3,092,400 | ) | (414,404 | ) | ||||||||
Global Bond Fund | (169,483 | ) | — | (168,861 | ) | (1,369 | ) | |||||||||
Global Growth and Income Fund | (665,667 | ) | (4,556,731 | ) | (1,501,497 | ) | (668,984 | ) | ||||||||
Global Growth Fund | (314,071 | ) | (2,791,775 | ) | (165,242 | ) | (168,621 | ) | ||||||||
Global Small Capitalization Fund | (160,017 | ) | (7,330,124 | ) | — | (544,795 | ) | |||||||||
Growth Fund | (748,434 | ) | (92,964,012 | ) | (2,530,703 | ) | (6,406,141 | ) | ||||||||
Growth-Income Fund | (2,142,064 | ) | (39,353,428 | ) | (1,666,340 | ) | (3,952,087 | ) | ||||||||
International Fund | (1,915,253 | ) | (15,464,176 | ) | (2,004,068 | ) | (1,164,587 | ) | ||||||||
New World Fund | (402,897 | ) | (796,214 | ) | (261,451 | ) | (8,094 | ) | ||||||||
| (1) | The Funds designate these distributions as capital gain dividends per IRC Sec. 852(b) (3) (C). |
| 19 |
|
| HIMCO Variable Insurance Trust |
Notes to Financial Statements – (continued)
June 30, 2017 (Unaudited)
As of December 31, 2016, the components of distributable earnings (deficit) on a tax basis were as follows:
| Undistributed Ordinary Income | Undistributed Long-Term Capital Gain | Accumulated Capital(1) | Unrealized Appreciation (Depreciation)(2) | Total Accumulated Earnings (Deficit) | ||||||||||||||||
Asset Allocation Fund | $ | 491,819 | $ | 2,500,098 | $ | — | $ | 1,498,337 | $ | 4,490,254 | ||||||||||
Blue Chip Income and Growth Fund | 917,430 | 5,329,124 | — | 2,900,639 | 9,147,193 | |||||||||||||||
Bond Fund | 2,102,631 | 233,729 | — | (2,558,998 | ) | (222,638 | ) | |||||||||||||
Global Bond Fund | 31,080 | — | (296,561 | ) | (897,515 | ) | (1,162,996 | ) | ||||||||||||
Global Growth and Income Fund | 485,281 | 2,444,613 | — | 5,492,586 | 8,422,480 | |||||||||||||||
Global Growth Fund | 147,758 | 1,944,018 | — | (496,086 | ) | 1,595,690 | ||||||||||||||
Global Small Capitalization Fund | 60,636 | 7,872,633 | — | (2,348,140 | ) | 5,585,129 | ||||||||||||||
Growth Fund | 1,022,961 | 40,141,913 | — | 17,993,797 | 59,158,671 | |||||||||||||||
Growth-Income Fund | 2,237,024 | 25,652,357 | — | 8,488,575 | 36,377,956 | |||||||||||||||
International Fund | 1,399,455 | 12,905,587 | — | (6,202,979 | ) | 8,102,063 | ||||||||||||||
New World Fund | 81,302 | — | (760,202 | ) | (2,522,510 | ) | (3,201,410 | ) | ||||||||||||
| (1) | The Funds had capital loss carryforwards that are identified in the Capital Loss Carryforward note that follows. |
| (2) | The differences between book-basis and tax-basis unrealized appreciation (depreciation) are attributable primarily to the tax deferral of wash sale losses. |
| (d) | Reclassification of Capital Accounts – The Funds may record reclassifications in their capital accounts. These reclassifications have no impact on the total net assets of the Funds. The reclassifications are a result of permanent differences between U.S. GAAP and tax accounting. Adjustments are made to reflect the impact these items have on current and future distributions to shareholders. Therefore, the source of a Fund’s distributable income may be shown in the accompanying Statements of Assets and Liabilities as from net investment income, from net realized gains on investments or from capital depending on the type of book and tax differences that exist. For the fiscal year ended December 31, 2016, the Funds recorded the following reclassifications to increase (decrease) the accounts listed below. |
| Paid in Capital | Undistributed Net Investment Income (Loss) | Accumulated Net Realized Gain (Loss) | ||||||||||
Global Growth Fund | $ | 1 | $ | — | $ | (1 | ) | |||||
New World Fund | — | (1 | ) | 1 | ||||||||
| e) | Capital Loss Carryforward – Under U.S. tax law, the Funds are permitted to carry forward capital losses for an unlimited period. Additionally, capital loss carryforwards retain their character as either short-term or long-term capital losses rather than being considered all short-term as permitted under prior regulation. |
At December 31, 2016 (tax-year-end), the following Funds had long-term capital loss carryforwards with no expiration for U.S. federal income tax purposes as follows:
| Amount | ||||
Global Bond Fund | $ | 296,561 | ||
New World Fund | 760,202 | |||
| f) | Accounting for Uncertainty in Income Taxes – In accordance with U.S. GAAP, the Funds analyze all open tax years, as defined by the statute of limitations, for all major jurisdictions. Generally, tax authorities can examine all tax returns filed for the last three years. The Funds do not have an examination in progress. |
The Funds have reviewed all open tax years and major jurisdictions and concluded that these financial reporting rules have no effect on the Funds’ financial positions or results of operations. There is no tax liability resulting from unrecognized tax benefits relating to uncertain income tax positions taken or expected to be taken on the tax returns for the fiscal year ended December 31, 2016. The Funds are also not aware of any tax positions for which it is reasonably possible that the total amounts of unrecognized tax benefits will significantly change in the next twelve months.
| 20 |
|
| HIMCO Variable Insurance Trust |
Notes to Financial Statements – (continued)
June 30, 2017 (Unaudited)
| 5. | Fees and Expenses: |
| a) | Investment Management Agreement – Hartford Investment Management Company (“Hartford Investment Management”) serves as the Funds’ investment manager pursuant to an Investment Management Agreement with the Trust. Hartford Investment Management is a wholly owned subsidiary of The Hartford Financial Services Group, Inc. (“The Hartford”). The investment manager provides day-to-day investment management services to the Funds and has overall investment supervisory responsibility for each Fund. In addition, the investment manager provides administrative personnel, services, equipment, facilities and office space for operation of the Funds. |
The schedule below reflects the rates of compensation as a percentage of each Fund’s average daily net assets paid to the investment manager for investment management services rendered during the six-month period ended June 30, 2017. The rates are accrued daily and paid monthly:
Fund | Annual Rate* | |||
Asset Allocation Fund | 0.65 | % | ||
Blue Chip Income and Growth Fund | 0.75 | % | ||
Bond Fund | 0.50 | % | ||
Global Bond Fund | 0.75 | % | ||
Global Growth and Income Fund | 0.80 | % | ||
Global Growth Fund | 1.00 | % | ||
Global Small Capitalization Fund | 0.80 | % | ||
Growth Fund | 0.75 | % | ||
Growth-Income Fund | 0.70 | % | ||
International Fund | 0.85 | % | ||
New World Fund | 1.10 | % | ||
| * | Hartford Investment Management has contractually agreed with the Trust, on behalf of each Fund, to waive a portion of its management fee to the extent necessary to maintain its net management fee at 0.25% of average daily net assets per annum, for as long as the Fund is part of a master-feeder fund structure. The Board of Trustees may change or eliminate this waiver if the fund structure changes. |
| b) | Accounting Services Agreement – State Street Bank and Trust Company (“State Street Bank”) provides the Funds with accounting services pursuant to a fund accounting agreement by and between the Trust, on behalf of the Funds, and State Street Bank. The amount paid for accounting services can be found in the Statements of Operations. These fees are accrued daily and paid monthly. |
| c) | Operating Expenses – Allocable expenses incurred by the Trust are allocated to each Fund in proportion to the average daily net assets of each Fund, except where allocation of certain expenses is more fairly made directly to the Fund. Hartford Investment Management has contractually agreed to reimburse expenses (exclusive of taxes, interest expense, brokerage commissions, acquired fund fees and expenses and extraordinary expenses) to the extent necessary to maintain total annual operating expenses for the Class IB shares of each Fund as follows: |
Fund | Annual Rate | |||
Asset Allocation Fund | 0.86 | % | ||
Blue Chip Income and Growth Fund | 0.99 | % | ||
Bond Fund | 0.93 | % | ||
Global Bond Fund | 1.15 | % | ||
Global Growth and Income Fund | 1.18 | % | ||
Global Growth Fund | 1.14 | % | ||
Global Small Capitalization Fund | 1.32 | % | ||
Growth Fund | 0.89 | % | ||
Growth-Income Fund | 0.83 | % | ||
International Fund | 1.09 | % | ||
New World Fund | 1.36 | % | ||
| 21 |
|
| HIMCO Variable Insurance Trust |
Notes to Financial Statements – (continued)
June 30, 2017 (Unaudited)
This contractual arrangement will remain in effect until April 30, 2018, and shall renew automatically for one-year terms unless the investment manager provides written notice of termination prior to the start of the next term or upon approval of the Board of Trustees of the Funds.
| d) | Distribution Plan for Class IB Shares – HIMCO Distribution Services Company, a wholly owned subsidiary of The Hartford, serves as the Funds’ principal underwriter and distributor. The Trust, on behalf of the Funds, has adopted a Distribution Plan pursuant to Rule 12b-1 of the 1940 Act for Class IB shares to compensate the distributor, from assets attributable to the services rendered and expenses borne in connection with activities primarily intended to result in the sale of the Class IB shares, subject to the review and approval of the Board of Trustees. |
The Distribution Plan provides that each Fund may pay annually up to 0.25% of the average daily net assets of each Fund attributable to its Class IB shares for activities primarily intended to result in the sale of Class IB shares. The Board of Trustees has the authority to suspend or reduce these payments at any point in time. Under the terms of the Distribution Plan and the principal underwriting agreement, each Fund is authorized to make payments monthly to the distributor that may be used to pay or reimburse entities, including insurance company affiliates of Hartford Investment Management, providing distribution and shareholder servicing with respect to the Class IB shares for such entities’ fees or expenses incurred or paid in that regard. The distribution fee paid during the period can be found in the Statement of Operations. These fees are accrued daily and paid monthly or at such other intervals as the Board of Trustees may determine.
| e) | Transfer Agent Fees – State Street Bank provides transfer agent services to the Funds. The transfer agent is reimbursed for out-of-pocket expenses and other costs associated with the services it provides to the Funds, including costs invoiced by sub-contractors. Hartford Investment Management and its affiliates may pay, out of their own assets, compensation to third-party administrators for recordkeeping and other administrative services. The amount paid for transfer agent services can be found in the Statements of Operations. These fees are accrued daily and paid monthly. |
| f) | Trustee Fees – The Board of Trustees is responsible for oversight of the Funds. The Board of Trustees elects officers who are responsible for the day to day operations of the Funds. The Board of Trustees oversees the investment manager and the other principal service providers of the Funds. The Board of Trustees currently holds four regularly scheduled meetings throughout each year. In addition, the Board of Trustees may hold special meetings at other times either in person or by telephone. The Trustee fees paid during the period can be found in the Statements of Operations. |
| 6. | Investment Transactions: |
For the six-month period ended June 30, 2017, the aggregate cost of purchases and sales of investments in Master Funds (excluding short-term investments) was as follows:
| Cost of Purchases | Sales Proceeds | |||||||
Asset Allocation Fund | $ | 2,616,906 | $ | 6,906,168 | ||||
Blue Chip Income and Growth Fund | 1,981,845 | 4,124,832 | ||||||
Bond Fund | 9,507,501 | 12,958,559 | ||||||
Global Bond Fund | 1,088,846 | 1,063,659 | ||||||
Global Growth and Income Fund | 785,104 | 3,676,745 | ||||||
Global Growth Fund | 1,564,443 | 1,327,834 | ||||||
Global Small Capitalization Fund | 764,472 | 4,186,717 | ||||||
Growth Fund | 22,930,789 | 30,073,186 | ||||||
Growth-Income Fund | 10,332,056 | 14,760,680 | ||||||
International Fund | 4,767,896 | 19,843,606 | ||||||
New World Fund | 855,819 | 2,265,255 | ||||||
| 7. | Recent Accounting Pronouncements: |
In October 2016, the SEC adopted amendments to rules under the 1940 Act (“final rules”) intended to modernize the reporting and disclosure of information by registered investment companies. The final rules amend Regulation S-X and
| 22 |
|
| HIMCO Variable Insurance Trust |
Notes to Financial Statements – (continued)
June 30, 2017 (Unaudited)
require investment companies to provide standardized, enhanced derivatives disclosures in fund financial statements in a format designed for individual investors. The amendments to Regulation S-X also update the disclosures for other investments in and advances to affiliates and amend the rules regarding the general form and content of fund financial statements. The compliance date for the amendments to Regulation S-X is August 1, 2017. Management is currently evaluating the amendments and their impact, if any, on the Funds’ financial statements.
| 8. | Plan of Liquidation: |
At meetings held on June 1, 2017 and June 19, 2017, the Board approved (i) a Plan of Liquidation for each of the Funds (each, a “Feeder Fund” and, collectively, the “Feeder Funds”) and (ii) submission of an Agreement and Plan of Substitution for each Feeder Fund by Hartford Life and Hartford Life and Annuity Insurance Company (collectively, the “Insurance Companies”), who sponsor the variable life insurance policies and variable annuity contracts (collectively, the “Contracts”) for which the Feeder Funds serve as investment vehicles, to the holders of such Contracts (the “Contract Holders”). The Board determined that each Feeder Fund should be liquidated and dissolved contingent upon receiving Contract Holder approval of the applicable Agreement and Plan of Substitution.
Agreement and Plan of Substitution. If Contract Holders approve the Agreement and Plan of Substitution for a Feeder Fund, the Feeder Fund will be liquidated on or about the close of business on November 10, 2017 (the “Liquidation Date”), pursuant to the Plan of Liquidation approved by the Board on behalf of the Feeder Fund. Each Feeder Fund invests in Class 1 shares of a corresponding Master Fund. The Agreement and Plan of Substitution provides that on or about November 10, 2017, the Insurance Companies will redeem shares of the Feeder Fund in complete liquidation of the Feeder Fund. The Insurance Companies will then purchase Class 4 shares of each Master Fund with the cash proceeds from the redemption (each such transaction, a “Substitution”). Each Substitution will take place at relative net asset value with no change in the dollar amount of any Contract Holder’s beneficial investment in the Feeder Fund. The Master Funds are the same funds as those in which the Feeder Funds currently invest. Each Substitution is not expected to increase a Contract Holder’s fees or charges paid under the Contracts. In addition, the net portfolio expense ratio of each Master Fund is expected to be lower than that of the corresponding Feeder Fund immediately following the Substitution. If the Agreement and Plan of Substitution is approved, each Contract Holder’s beneficial interest in shares of each Feeder Fund would be replaced with shares of the corresponding Master Fund as indicated below:
Name of Feeder Fund | Name of Master Fund | |
HIMCO VIT American Funds Asset Allocation Fund Class IB Shares | American Funds Insurance Series – Asset Allocation Fund Class 4 Shares | |
HIMCO VIT American Funds Blue Chip Income and Growth Fund Class IB Shares | American Funds Insurance Series – Blue Chip Income and Growth Fund Class 4 Shares | |
HIMCO VIT American Funds Bond Fund Class IB Shares | American Funds Insurance Series – Bond Fund Class 4 Shares | |
HIMCO VIT American Funds Global Bond Fund Class IB Shares | American Funds Insurance Series – Global Bond Fund Class 4 Shares | |
HIMCO VIT American Funds Global Growth Fund Class IB Shares | American Funds Insurance Series – Global Growth Fund Class 4 Shares | |
HIMCO VIT American Funds Global Growth and Income Fund Class IB Shares | American Funds Insurance Series – Global Growth and Income Fund Class 4 Shares | |
HIMCO VIT American Funds Global Small Capitalization Fund Class IB Shares | American Funds Insurance Series – Global Small Capitalization Fund Class 4 Shares | |
HIMCO VIT American Funds Growth Fund Class IB Shares | American Funds Insurance Series – Growth Fund Class 4 Shares | |
HIMCO VIT American Funds Growth-Income Fund Class IB Shares | American Funds Insurance Series – Growth-Income Fund Class 4 Shares | |
HIMCO VIT American Funds International Fund Class IB Shares | American Funds Insurance Series – International Fund Class 4 Shares | |
HIMCO VIT American Funds New World Fund Class IB Shares | American Funds Insurance Series – New World Fund Class 4 Shares |
| 23 |
|
| HIMCO Variable Insurance Trust |
Notes to Financial Statements – (concluded)
June 30, 2017 (Unaudited)
More information about the Agreement and Plan of Substitution and the Master Funds will be provided in proxy materials that are expected to be mailed in August 2017. If Contract Holders do not approve the Agreement and Plan of Substitution for a Feeder Fund, the Feeder Fund will not be liquidated and the Board will consider what, if any, steps to take. Apart from the proxy materials, no further notification regarding the liquidation of the Feeder Funds will be sent, unless circumstances change from those described above.
Transfer Rights. At any time prior to the Liquidation Date, Contract Holders may transfer their beneficial interests in a Feeder Fund to any of the other investment options offered under their respective Contracts, subject to the terms of the relevant Contract prospectuses and Contracts, and no transfer fees or other charges will be imposed. Following a Substitution, Contract Holders who had any beneficial interest automatically transferred from investing in a Feeder Fund to investing in the corresponding Master Fund may transfer such interests among any of the investment options available under their respective Contracts in accordance with the terms of the Contracts, also free of any transfer fees or other charges. Any such transfer will not be counted as one of the free transfers permitted per calendar year under the Contracts, provided that the transfer occurs prior to, or within 90 days after, the date of the Substitution. Please note, however, that if you have elected an optional living and/or death benefit rider in your Contract, any transfers may be subject to investment restrictions. Please see your Contract prospectus and your Contract for more information about the investment options available for your optional living and/or death benefit rider, if applicable. In addition, Contract Holders’ transfer rights are subject to any market timing/short-term trading provisions described in their respective Contract prospectuses or their Contracts. The Insurance Companies will issue supplements to the prospectuses for its affected Contracts advising Contract Holders of their rights to transfer under their respective Contracts.
| 9. | Indemnifications: |
Under the Trust’s organizational documents, the Trust shall indemnify its officers and trustees to the full extent required or permitted under The Delaware Statutory Trust Act and the federal securities laws. In addition, the Trust, on behalf of the Funds, may enter into contracts that contain a variety of indemnifications. The Trust’s maximum exposure under these arrangements is unknown. However, as of the date of these financial statements, the Trust has not had prior claims or losses pursuant to these contracts and expects the risk of loss to be remote.
| 10. | Subsequent Event: |
Management has evaluated the need for disclosures and/or adjustments resulting from subsequent events through the date the Financial Statements were issued. Based on this evaluation, no adjustments to, or disclosures in, the Financial Statements were necessary as of June 30, 2017.
| 24 |
|
| HIMCO Variable Insurance Trust |
Financial Highlights
| — Selected Per-Share Data(1) — | — Ratios and Supplemental Data — | |||||||||||||||||||||||||||||||||||||||||||||||||||
Class | Net Asset Value at, Beginning of Period | Net Investment Income (Loss) | Net Realized and Unrealized Gain (Loss) on Investments | Total from Investment Operations | Distributions from Net Investment Income | Distributions from Realized Gain on Investments | Total Distributions | Net Asset Value End of Period | Total Return(2) | Net Assets at End of Period (000s) | Ratio of Expenses to Average Net Assets Before Adjust- ments(3) | Ratio of Expenses to Average Net Assets After Adjust- ments(3) | Ratio of Net Investment Income (Loss) to Average Net Assets(3) | |||||||||||||||||||||||||||||||||||||||
| HIMCO VIT American Funds Asset Allocation Fund | ||||||||||||||||||||||||||||||||||||||||||||||||||||
For the Six-Month Period Ended June 30, 2017 (Unaudited) |
| |||||||||||||||||||||||||||||||||||||||||||||||||||
IB | $ | 7.98 | $ | 0.01 | $ | 0.62 | $ | 0.63 | $ | — | $ | — | $ | — | $ | 8.61 | 7.89 | %(4) | $ | 36,564 | 1.03 | %(5) | 0.57 | %(5) | 0.16 | %(5) | ||||||||||||||||||||||||||
For the Year Ended December 31, 2016 |
| |||||||||||||||||||||||||||||||||||||||||||||||||||
IB | $ | 8.95 | $ | 0.10 | $ | 0.68 | $ | 0.78 | $ | (0.23 | ) | $ | (1.52 | ) | $ | (1.75 | ) | $ | 7.98 | 9.11 | % | $ | 39,500 | 1.01 | % | 0.57 | % | 1.20 | % | |||||||||||||||||||||||
For the Year Ended December 31, 2015 |
| |||||||||||||||||||||||||||||||||||||||||||||||||||
IB | $ | 9.12 | $ | 0.18 | $ | (0.08 | ) | $ | 0.10 | $ | (0.13 | ) | $ | (0.14 | ) | $ | (0.27 | ) | $ | 8.95 | 1.12 | % | $ | 44,093 | 1.01 | % | 0.56 | % | 1.99 | % | ||||||||||||||||||||||
For the Year Ended December 31, 2014 |
| |||||||||||||||||||||||||||||||||||||||||||||||||||
IB | $ | 12.63 | $ | 0.12 | $ | 0.44 | $ | 0.56 | $ | (0.18 | ) | $ | (3.89 | ) | $ | (4.07 | ) | $ | 9.12 | 5.05 | % | $ | 54,855 | 0.99 | % | 0.55 | % | 1.09 | % | |||||||||||||||||||||||
For the Year Ended December 31, 2013(6) |
| |||||||||||||||||||||||||||||||||||||||||||||||||||
IB | $ | 11.04 | $ | 0.12 | $ | 2.39 | $ | 2.51 | $ | (0.17 | ) | $ | (0.75 | ) | $ | (0.92 | ) | $ | 12.63 | 23.40 | % | $ | 62,961 | 0.95 | % | 0.55 | % | 0.97 | % | |||||||||||||||||||||||
For the Year Ended December 31, 2012(6)(7) |
| |||||||||||||||||||||||||||||||||||||||||||||||||||
IB | $ | 9.70 | $ | 0.19 | $ | 1.34 | $ | 1.53 | $ | (0.17 | ) | $ | (0.02 | ) | $ | (0.19 | ) | $ | 11.04 | 15.80 | % | $ | 64,616 | 0.95 | % | 0.55 | % | 1.56 | % | |||||||||||||||||||||||
| HIMCO VIT American Funds Blue Chip Income and Growth Fund | ||||||||||||||||||||||||||||||||||||||||||||||||||||
For the Six-Month Period Ended June 30, 2017 (Unaudited) |
| |||||||||||||||||||||||||||||||||||||||||||||||||||
IB | $ | 9.47 | $ | 0.05 | $ | 0.47 | $ | 0.52 | $ | — | $ | — | $ | — | $ | 9.99 | 5.49 | %(4) | $ | 36,000 | 1.13 | %(5) | 0.58 | %(5) | 1.00 | %(5) | ||||||||||||||||||||||||||
For the Year Ended December 31, 2016 |
| |||||||||||||||||||||||||||||||||||||||||||||||||||
IB | $ | 10.38 | $ | 0.25 | $ | 1.56 | $ | 1.81 | $ | (0.27 | ) | $ | (2.45 | ) | $ | (2.72 | ) | $ | 9.47 | 18.46 | % | $ | 37,474 | 1.12 | % | 0.58 | % | 2.44 | % | |||||||||||||||||||||||
For the Year Ended December 31, 2015 |
| |||||||||||||||||||||||||||||||||||||||||||||||||||
IB | $ | 11.25 | $ | 0.23 | $ | (0.58 | ) | $ | (0.35 | ) | $ | (0.33 | ) | $ | (0.19 | ) | $ | (0.52 | ) | $ | 10.38 | (3.30 | )% | $ | 36,874 | 1.13 | % | 0.57 | % | 2.07 | % | |||||||||||||||||||||
For the Year Ended December 31, 2014 |
| |||||||||||||||||||||||||||||||||||||||||||||||||||
IB | $ | 12.31 | $ | 0.34 | $ | 1.38 | $ | 1.72 | $ | (0.20 | ) | $ | (2.58 | ) | $ | (2.78 | ) | $ | 11.25 | 15.02 | % | $ | 47,550 | 1.10 | % | 0.57 | % | 2.83 | % | |||||||||||||||||||||||
For the Year Ended December 31, 2013(6) |
| |||||||||||||||||||||||||||||||||||||||||||||||||||
IB | $ | 10.11 | $ | 0.17 | $ | 3.02 | $ | 3.19 | $ | (0.18 | ) | $ | (0.81 | ) | $ | (0.99 | ) | $ | 12.31 | 32.55 | % | $ | 43,502 | 1.07 | % | 0.57 | % | 1.51 | % | |||||||||||||||||||||||
For the Year Ended December 31, 2012(6)(7) |
| |||||||||||||||||||||||||||||||||||||||||||||||||||
IB | $ | 9.07 | $ | 0.15 | $ | 1.07 | $ | 1.22 | $ | (0.12 | ) | $ | (0.06 | ) | $ | (0.18 | ) | $ | 10.11 | 13.53 | % | $ | 39,920 | 1.07 | % | 0.57 | % | 1.67 | % | |||||||||||||||||||||||
| HIMCO VIT American Funds Bond Fund | ||||||||||||||||||||||||||||||||||||||||||||||||||||
For the Six-Month Period Ended June 30, 2017 (Unaudited) |
| |||||||||||||||||||||||||||||||||||||||||||||||||||
IB | $ | 9.23 | $ | 0.13 | $ | 0.09 | $ | 0.22 | $ | — | $ | — | $ | — | $ | 9.45 | 2.38 | %(4) | $ | 133,111 | 0.84 | %(5) | 0.55 | %(5) | 2.72 | %(5) | ||||||||||||||||||||||||||
For the Year Ended December 31, 2016 |
| |||||||||||||||||||||||||||||||||||||||||||||||||||
IB | $ | 9.40 | $ | 0.14 | $ | 0.12 | $ | 0.26 | $ | (0.34 | ) | $ | (0.09 | ) | $ | (0.43 | ) | $ | 9.23 | 2.66 | % | $ | 135,755 | 0.83 | % | 0.55 | % | 1.45 | % | |||||||||||||||||||||||
For the Year Ended December 31, 2015 |
| |||||||||||||||||||||||||||||||||||||||||||||||||||
IB | $ | 9.60 | $ | 0.27 | $ | (0.28 | ) | $ | (0.01 | ) | $ | (0.17 | ) | $ | (0.02 | ) | $ | (0.19 | ) | $ | 9.40 | (0.06 | )% | $ | 151,684 | 0.84 | % | 0.54 | % | 2.81 | % | |||||||||||||||||||||
For the Year Ended December 31, 2014 |
| |||||||||||||||||||||||||||||||||||||||||||||||||||
IB | $ | 9.75 | $ | 0.14 | $ | 0.34 | $ | 0.48 | $ | (0.17 | ) | $ | (0.46 | ) | $ | (0.63 | ) | $ | 9.60 | 4.98 | % | $ | 189,076 | 0.81 | % | 0.54 | % | 1.42 | % | |||||||||||||||||||||||
For the Year Ended December 31, 2013(6) |
| |||||||||||||||||||||||||||||||||||||||||||||||||||
IB | $ | 10.52 | $ | 0.17 | $ | (0.42 | ) | $ | (0.25 | ) | $ | (0.22 | ) | $ | (0.30 | ) | $ | (0.52 | ) | $ | 9.75 | (2.37 | )% | $ | 236,846 | 0.79 | % | 0.54 | % | 1.67 | % | |||||||||||||||||||||
For the Year Ended December 31, 2012(6)(7) |
| |||||||||||||||||||||||||||||||||||||||||||||||||||
IB | $ | 10.52 | $ | 0.23 | $ | 0.29 | $ | 0.52 | $ | (0.29 | ) | $ | (0.23 | ) | $ | (0.52 | ) | $ | 10.52 | 5.01 | % | $ | 199,008 | 0.79 | % | 0.54 | % | 2.13 | % | |||||||||||||||||||||||
See Portfolio Turnover information at the conclusion of Financial Highlights
| 25 |
|
| HIMCO Variable Insurance Trust |
Financial Highlights – (continued)
| — Selected Per-Share Data(1) — | — Ratios and Supplemental Data — | |||||||||||||||||||||||||||||||||||||||||||||||||||
Class | Net Asset Value at, Beginning of Period | Net Investment Income (Loss) | Net Realized and Unrealized Gain (Loss) on Investments | Total from Investment Operations | Distributions from Net Investment Income | Distributions from Realized Gain on Investments | Total Distributions | Net Asset Value End of Period | Total Return(2) | Net Assets at End of Period (000s) | Ratio of Expenses to Average Net Assets Before Adjust- ments(3) | Ratio of Expenses to Average Net Assets After Adjust- ments(3) | Ratio of Net Investment Income (Loss) to Average Net Assets(3) | |||||||||||||||||||||||||||||||||||||||
| HIMCO VIT American Funds Global Bond Fund | ||||||||||||||||||||||||||||||||||||||||||||||||||||
For the Six-Month Period Ended June 30, 2017 (Unaudited) |
| |||||||||||||||||||||||||||||||||||||||||||||||||||
IB | $ | 8.55 | $ | 0.03 | $ | 0.38 | $ | 0.41 | $ | — | $ | — | $ | — | $ | 8.96 | 4.80 | %(4) | $ | 10,813 | 1.30 | %(5) | 0.58 | %(5) | 0.65 | %(5) | ||||||||||||||||||||||||||
For the Year Ended December 31, 2016 |
| |||||||||||||||||||||||||||||||||||||||||||||||||||
IB | $ | 8.47 | $ | 0.02 | $ | 0.19 | $ | 0.21 | $ | (0.13 | ) | $ | — | $ | (0.13 | ) | $ | 8.55 | 2.40 | % | $ | 10,312 | 1.25 | % | 0.58 | % | 0.28 | % | ||||||||||||||||||||||||
For the Year Ended December 31, 2015 |
| |||||||||||||||||||||||||||||||||||||||||||||||||||
IB | $ | 8.98 | $ | 0.11 | $ | (0.50 | ) | $ | (0.39 | ) | $ | (0.12 | ) | $ | — | (8) | $ | (0.12 | ) | $ | 8.47 | (4.39 | )% | $ | 10,559 | 1.25 | % | 0.58 | % | 1.29 | % | |||||||||||||||||||||
For the Year Ended December 31, 2014 |
| |||||||||||||||||||||||||||||||||||||||||||||||||||
IB | $ | 9.66 | $ | 0.10 | $ | 0.05 | $ | 0.15 | $ | (0.01 | ) | $ | (0.82 | ) | $ | (0.83 | ) | $ | 8.98 | 1.17 | % | $ | 15,042 | 1.22 | % | 0.63 | % | 1.01 | % | |||||||||||||||||||||||
For the Year Ended December 31, 2013(6) |
| |||||||||||||||||||||||||||||||||||||||||||||||||||
IB | $ | 11.10 | $ | (0.06 | ) | $ | (0.29 | ) | $ | (0.35 | ) | $ | (0.37 | ) | $ | (0.72 | ) | $ | (1.09 | ) | $ | 9.66 | (3.03 | )% | $ | 17,007 | 1.09 | % | 0.59 | % | (0.59 | )% | ||||||||||||||||||||
For the Year Ended December 31, 2012(6)(7) |
| |||||||||||||||||||||||||||||||||||||||||||||||||||
IB | $ | 11.02 | $ | 0.24 | $ | 0.38 | $ | 0.62 | $ | (0.31 | ) | $ | (0.23 | ) | $ | (0.54 | ) | $ | 11.10 | 5.83 | % | $ | 38,193 | 1.07 | % | 0.57 | % | 1.69 | % | |||||||||||||||||||||||
| HIMCO VIT American Funds Global Growth and Income Fund | ||||||||||||||||||||||||||||||||||||||||||||||||||||
For the Six-Month Period Ended June 30, 2017 (Unaudited) |
| |||||||||||||||||||||||||||||||||||||||||||||||||||
IB | $ | 5.99 | $ | — | (8) | $ | 0.87 | $ | 0.87 | $ | — | $ | — | $ | — | $ | 6.86 | 14.52 | %(4) | $ | 33,087 | 1.19 | %(5) | 0.55 | %(5) | 0.12 | %(5) | |||||||||||||||||||||||||
For the Year Ended December 31, 2016 |
| |||||||||||||||||||||||||||||||||||||||||||||||||||
IB | $ | 6.56 | $ | 0.09 | $ | 0.37 | $ | 0.46 | $ | (0.13 | ) | $ | (0.90 | ) | $ | (1.03 | ) | $ | 5.99 | 7.02 | % | $ | 32,133 | 1.18 | % | 0.54 | % | 1.40 | % | |||||||||||||||||||||||
For the Year Ended December 31, 2015 |
| |||||||||||||||||||||||||||||||||||||||||||||||||||
IB | $ | 7.01 | $ | 0.10 | $ | (0.20 | ) | $ | (0.10 | ) | $ | (0.24 | ) | $ | (0.11 | ) | $ | (0.35 | ) | $ | 6.56 | (1.64 | )% | $ | 38,341 | 1.17 | % | 0.55 | % | 1.49 | % | |||||||||||||||||||||
For the Year Ended December 31, 2014 |
| |||||||||||||||||||||||||||||||||||||||||||||||||||
IB | $ | 11.24 | $ | 0.29 | $ | 0.32 | $ | 0.61 | $ | (0.37 | ) | $ | (4.47 | ) | $ | (4.84 | ) | $ | 7.01 | 5.36 | % | $ | 48,147 | 1.15 | % | 0.57 | % | 3.04 | % | |||||||||||||||||||||||
For the Year Ended December 31, 2013(6) |
| |||||||||||||||||||||||||||||||||||||||||||||||||||
IB | $ | 9.58 | $ | 0.24 | $ | 1.84 | $ | 2.08 | $ | (0.26 | ) | $ | (0.16 | ) | $ | (0.42 | ) | $ | 11.24 | 22.16 | % | $ | 52,712 | 1.11 | % | 0.56 | % | 2.28 | % | |||||||||||||||||||||||
For the Year Ended December 31, 2012(6)(7) |
| |||||||||||||||||||||||||||||||||||||||||||||||||||
IB | $ | 8.38 | $ | 0.23 | $ | 1.20 | $ | 1.43 | $ | (0.23 | ) | $ | — | $ | (0.23 | ) | $ | 9.58 | 17.30 | % | $ | 74,927 | 1.10 | % | 0.55 | % | 2.05 | % | ||||||||||||||||||||||||
| HIMCO VIT American Funds Global Growth Fund | ||||||||||||||||||||||||||||||||||||||||||||||||||||
For the Six-Month Period Ended June 30, 2017 (Unaudited) |
| |||||||||||||||||||||||||||||||||||||||||||||||||||
IB | $ | 6.34 | $ | (0.01 | ) | $ | 1.18 | $ | 1.17 | $ | — | $ | — | $ | — | $ | 7.51 | 18.45 | %(4) | $ | 18,235 | 1.46 | %(5) | 0.58 | %(5) | (0.32 | )%(5) | |||||||||||||||||||||||||
For the Year Ended December 31, 2016 |
| |||||||||||||||||||||||||||||||||||||||||||||||||||
IB | $ | 7.71 | $ | 0.06 | $ | (0.01 | ) | $ | 0.05 | $ | (0.14 | ) | $ | (1.28 | ) | $ | (1.42 | ) | $ | 6.34 | 0.15 | % | $ | 15,641 | 1.44 | % | 0.59 | % | 0.87 | % | ||||||||||||||||||||||
For the Year Ended December 31, 2015 |
| |||||||||||||||||||||||||||||||||||||||||||||||||||
IB | $ | 7.35 | $ | 0.12 | $ | 0.36 | $ | 0.48 | $ | (0.06 | ) | $ | (0.06 | ) | $ | (0.12 | ) | $ | 7.71 | 6.60 | % | $ | 18,999 | 1.43 | % | 0.59 | % | 1.51 | % | |||||||||||||||||||||||
For the Year Ended December 31, 2014 |
| |||||||||||||||||||||||||||||||||||||||||||||||||||
IB | $ | 12.56 | $ | 0.08 | $ | 0.07 | $ | 0.15 | $ | (0.12 | ) | $ | (5.24 | ) | $ | (5.36 | ) | $ | 7.35 | 1.97 | % | $ | 20,704 | 1.42 | % | 0.60 | % | 0.75 | % | |||||||||||||||||||||||
For the Year Ended December 31, 2013(6) |
| |||||||||||||||||||||||||||||||||||||||||||||||||||
IB | $ | 10.45 | $ | 0.08 | $ | 2.83 | $ | 2.91 | $ | (0.06 | ) | $ | (0.74 | ) | $ | (0.80 | ) | $ | 12.56 | 28.77 | % | $ | 24,509 | 1.34 | % | 0.59 | % | 0.71 | % | |||||||||||||||||||||||
For the Year Ended December 31, 2012(6)(7) |
| |||||||||||||||||||||||||||||||||||||||||||||||||||
IB | $ | 8.74 | $ | 0.06 | $ | 1.86 | $ | 1.92 | $ | (0.10 | ) | $ | (0.11 | ) | $ | (0.21 | ) | $ | 10.45 | 22.19 | % | $ | 29,055 | 1.33 | % | 0.58 | % | 0.48 | % | |||||||||||||||||||||||
See Portfolio Turnover information at the conclusion of Financial Highlights
| 26 |
|
| HIMCO Variable Insurance Trust |
Financial Highlights – (continued)
| — Selected Per-Share Data(1) — | — Ratios and Supplemental Data — | |||||||||||||||||||||||||||||||||||||||||||||||||||
Class | Net Asset Value at, Beginning of Period | Net Investment Income (Loss) | Net Realized and Unrealized Gain (Loss) on Investments | Total from Investment Operations | Distributions from Net Investment Income | Distributions from Realized Gain on Investments | Total Distributions | Net Asset Value End of Period | Total Return(2) | Net Assets at End of Period (000s) | Ratio of Expenses to Average Net Assets Before Adjust- ments(3) | Ratio of Expenses to Average Net Assets After Adjust- ments(3) | Ratio of Net Investment Income (Loss) to Average Net Assets(3) | |||||||||||||||||||||||||||||||||||||||
| HIMCO VIT American Funds Global Small Capitalization Fund | ||||||||||||||||||||||||||||||||||||||||||||||||||||
For the Six-Month Period Ended June 30, 2017 (Unaudited) |
| |||||||||||||||||||||||||||||||||||||||||||||||||||
IB | $ | 6.25 | $ | 0.01 | $ | 0.77 | $ | 0.78 | $ | — | $ | — | $ | — | $ | 7.03 | 12.48 | %(4) | $ | 36,428 | 1.19 | %(5) | 0.58 | %(5) | 0.27 | %(5) | ||||||||||||||||||||||||||
For the Year Ended December 31, 2016 |
| |||||||||||||||||||||||||||||||||||||||||||||||||||
IB | $ | 7.55 | $ | 0.01 | $ | 0.15 | $ | 0.16 | $ | (0.03 | ) | $ | (1.43 | ) | $ | (1.46 | ) | $ | 6.25 | 1.67 | % | $ | 35,581 | 1.17 | % | 0.59 | % | 0.16 | % | |||||||||||||||||||||||
For the Year Ended December 31, 2015 |
| |||||||||||||||||||||||||||||||||||||||||||||||||||
IB | $ | 7.64 | $ | 0.03 | $ | (0.02 | ) | $ | 0.01 | $ | — | $ | (0.10 | ) | $ | (0.10 | ) | $ | 7.55 | (0.03 | )% | $ | 41,737 | 1.17 | % | 0.58 | % | 0.34 | % | |||||||||||||||||||||||
For the Year Ended December 31, 2014 |
| |||||||||||||||||||||||||||||||||||||||||||||||||||
IB | $ | 9.47 | $ | (0.02 | ) | $ | 0.16 | $ | 0.14 | $ | (0.03 | ) | $ | (1.94 | ) | $ | (1.97 | ) | $ | 7.64 | 1.75 | % | $ | 50,478 | 1.15 | % | 0.57 | % | (0.26 | )% | ||||||||||||||||||||||
For the Year Ended December 31, 2013(6) |
| |||||||||||||||||||||||||||||||||||||||||||||||||||
IB | $ | 8.29 | $ | 0.03 | $ | 2.18 | $ | 2.21 | $ | (0.09 | ) | $ | (0.94 | ) | $ | (1.03 | ) | $ | 9.47 | 27.89 | % | $ | 61,224 | 1.13 | % | 0.58 | % | 0.30 | % | |||||||||||||||||||||||
For the Year Ended December 31, 2012(6)(7) |
| |||||||||||||||||||||||||||||||||||||||||||||||||||
IB | $ | 7.83 | $ | 0.10 | $ | 1.23 | $ | 1.33 | $ | (0.10 | ) | $ | (0.77 | ) | $ | (0.87 | ) | $ | 8.29 | 17.85 | % | $ | 53,881 | 1.11 | % | 0.56 | % | 0.99 | % | |||||||||||||||||||||||
| HIMCO VIT American Funds Growth Fund | ||||||||||||||||||||||||||||||||||||||||||||||||||||
For the Six-Month Period Ended June 30, 2017 (Unaudited) |
| |||||||||||||||||||||||||||||||||||||||||||||||||||
IB | $ | 6.59 | $ | 0.01 | $ | 0.97 | $ | 0.98 | $ | — | $ | — | $ | — | $ | 7.57 | 14.87 | %(4) | $ | 228,274 | 1.08 | %(5) | 0.54 | %(5) | 0.26 | %(5) | ||||||||||||||||||||||||||
For the Year Ended December 31, 2016 |
| |||||||||||||||||||||||||||||||||||||||||||||||||||
IB | $ | 9.83 | $ | 0.04 | $ | 0.76 | $ | 0.80 | $ | (0.03 | ) | $ | (4.01 | ) | $ | (4.04 | ) | $ | 6.59 | 9.10 | % | $ | 225,268 | 1.07 | % | 0.54 | % | 0.43 | % | |||||||||||||||||||||||
For the Year Ended December 31, 2015 |
| |||||||||||||||||||||||||||||||||||||||||||||||||||
IB | $ | 9.53 | $ | 0.03 | $ | 0.59 | $ | 0.62 | $ | (0.09 | ) | $ | (0.23 | ) | $ | (0.32 | ) | $ | 9.83 | 6.50 | % | $ | 257,086 | 1.09 | % | 0.54 | % | 0.26 | % | |||||||||||||||||||||||
For the Year Ended December 31, 2014 |
| |||||||||||||||||||||||||||||||||||||||||||||||||||
IB | $ | 13.09 | $ | 0.10 | $ | 0.70 | $ | 0.80 | $ | (0.10 | ) | $ | (4.26 | ) | $ | (4.36 | ) | $ | 9.53 | 8.21 | % | $ | 299,254 | 1.06 | % | 0.54 | % | 0.85 | % | |||||||||||||||||||||||
For the Year Ended December 31, 2013(6) |
| |||||||||||||||||||||||||||||||||||||||||||||||||||
IB | $ | 10.45 | $ | 0.07 | $ | 3.00 | $ | 3.07 | $ | (0.06 | ) | $ | (0.37 | ) | $ | (0.43 | ) | $ | 13.09 | 29.78 | % | $ | 351,018 | 1.04 | % | 0.54 | % | 0.60 | % | |||||||||||||||||||||||
For the Year Ended December 31, 2012(6)(7) |
| |||||||||||||||||||||||||||||||||||||||||||||||||||
IB | $ | 8.95 | $ | 0.05 | $ | 1.51 | $ | 1.56 | $ | (0.03 | ) | $ | (0.03 | ) | $ | (0.06 | ) | $ | 10.45 | 17.56 | % | $ | 333,889 | 1.04 | % | 0.54 | % | 0.50 | % | |||||||||||||||||||||||
| HIMCO VIT American Funds Growth-Income Fund | ||||||||||||||||||||||||||||||||||||||||||||||||||||
For the Six-Month Period Ended June 30, 2017 (Unaudited) |
| |||||||||||||||||||||||||||||||||||||||||||||||||||
IB | $ | 7.72 | $ | 0.01 | $ | 0.73 | $ | 0.74 | $ | — | $ | — | $ | — | $ | 8.46 | 9.59 | %(4) | $ | 131,482 | 1.03 | %(5) | 0.54 | %(5) | 0.17 | %(5) | ||||||||||||||||||||||||||
For the Year Ended December 31, 2016 |
| |||||||||||||||||||||||||||||||||||||||||||||||||||
IB | $ | 9.86 | $ | 0.14 | $ | 0.87 | $ | 1.01 | $ | (0.16 | ) | $ | (2.99 | ) | $ | (3.15 | ) | $ | 7.72 | 11.21 | % | $ | 132,095 | 1.03 | % | 0.54 | % | 1.62 | % | |||||||||||||||||||||||
For the Year Ended December 31, 2015 |
| |||||||||||||||||||||||||||||||||||||||||||||||||||
IB | $ | 10.09 | $ | 0.13 | $ | — | (8) | $ | 0.13 | $ | (0.11 | ) | $ | (0.25 | ) | $ | (0.36 | ) | $ | 9.86 | 1.19 | % | $ | 146,681 | 1.04 | % | 0.54 | % | 1.32 | % | ||||||||||||||||||||||
For the Year Ended December 31, 2014 |
| |||||||||||||||||||||||||||||||||||||||||||||||||||
IB | $ | 13.26 | $ | 0.11 | $ | 1.03 | $ | 1.14 | $ | (0.15 | ) | $ | (4.16 | ) | $ | (4.31 | ) | $ | 10.09 | 10.30 | % | $ | 171,832 | 1.01 | % | 0.54 | % | 0.90 | % | |||||||||||||||||||||||
For the Year Ended December 31, 2013(6) |
| |||||||||||||||||||||||||||||||||||||||||||||||||||
IB | $ | 10.20 | $ | 0.11 | $ | 3.23 | $ | 3.34 | $ | (0.14 | ) | $ | (0.14 | ) | $ | (0.28 | ) | $ | 13.26 | 33.14 | % | $ | 197,689 | 0.99 | % | 0.54 | % | 0.97 | % | |||||||||||||||||||||||
For the Year Ended December 31, 2012(6)(7) |
| |||||||||||||||||||||||||||||||||||||||||||||||||||
IB | $ | 8.81 | $ | 0.13 | $ | 1.38 | $ | 1.51 | $ | (0.12 | ) | $ | — | $ | (0.12 | ) | $ | 10.20 | 17.16 | % | $ | 183,220 | 0.99 | % | 0.54 | % | 1.29 | % | ||||||||||||||||||||||||
See Portfolio Turnover information at the conclusion of Financial Highlights
| 27 |
|
| HIMCO Variable Insurance Trust |
Financial Highlights – (continued)
| — Selected Per-Share Data(1) — | — Ratios and Supplemental Data — | |||||||||||||||||||||||||||||||||||||||||||||||||||
Class | Net Asset Value at, Beginning of Period | Net Investment Income (Loss) | Net Realized and Unrealized Gain (Loss) on Investments | Total from Investment Operations | Distributions from Net Investment Income | Distributions from Realized Gain on Investments | Total Distributions | Net Asset Value End of Period | Total Return(2) | Net Assets at End of Period (000s) | Ratio of Expenses to Average Net Assets Before Adjust- ments(3) | Ratio of Expenses to Average Net Assets After Adjust- ments(3) | Ratio of Net Investment Income (Loss) to Average Net Assets(3) | |||||||||||||||||||||||||||||||||||||||
| HIMCO VIT American Funds International Fund | ||||||||||||||||||||||||||||||||||||||||||||||||||||
For the Six-Month Period Ended June 30, 2017 (Unaudited) |
| |||||||||||||||||||||||||||||||||||||||||||||||||||
IB | $ | 6.69 | $ | 0.01 | $ | 1.22 | $ | 1.23 | $ | — | $ | — | $ | — | $ | 7.92 | 18.39 | %(4) | $ | 137,000 | 1.19 | %(5) | 0.55 | %(5) | 0.22 | %(5) | ||||||||||||||||||||||||||
For the Year Ended December 31, 2016 |
| |||||||||||||||||||||||||||||||||||||||||||||||||||
IB | $ | 7.33 | $ | 0.07 | $ | 0.20 | $ | 0.27 | $ | (0.10 | ) | $ | (0.81 | ) | $ | (0.91 | ) | $ | 6.69 | 3.27 | % | $ | 130,696 | 1.18 | % | 0.55 | % | 0.99 | % | |||||||||||||||||||||||
For the Year Ended December 31, 2015 |
| |||||||||||||||||||||||||||||||||||||||||||||||||||
IB | $ | 7.85 | $ | 0.09 | $ | (0.45 | ) | $ | (0.36 | ) | $ | (0.10 | ) | $ | (0.06 | ) | $ | (0.16 | ) | $ | 7.33 | (4.83 | )% | $ | 149,253 | 1.20 | % | 0.55 | % | 1.12 | % | |||||||||||||||||||||
For the Year Ended December 31, 2014 |
| |||||||||||||||||||||||||||||||||||||||||||||||||||
IB | $ | 10.27 | $ | 0.09 | $ | (0.36 | ) | $ | (0.27 | ) | $ | (0.12 | ) | $ | (2.03 | ) | $ | (2.15 | ) | $ | 7.85 | (2.88 | )% | $ | 180,339 | 1.17 | % | 0.55 | % | 0.98 | % | |||||||||||||||||||||
For the Year Ended December 31, 2013(6) |
| |||||||||||||||||||||||||||||||||||||||||||||||||||
IB | $ | 8.73 | $ | 0.09 | $ | 1.74 | $ | 1.83 | $ | (0.11 | ) | $ | (0.18 | ) | $ | (0.29 | ) | $ | 10.27 | 21.23 | % | $ | 226,400 | 1.15 | % | 0.55 | % | 0.99 | % | |||||||||||||||||||||||
For the Year Ended December 31, 2012(6)(7) |
| |||||||||||||||||||||||||||||||||||||||||||||||||||
IB | $ | 7.54 | $ | 0.10 | $ | 1.22 | $ | 1.32 | $ | (0.13 | ) | $ | — | $ | (0.13 | ) | $ | 8.73 | 17.58 | % | $ | 225,298 | 1.14 | % | 0.54 | % | 1.15 | % | ||||||||||||||||||||||||
| HIMCO VIT American Funds New World Fund | ||||||||||||||||||||||||||||||||||||||||||||||||||||
For the Six-Month Period Ended June 30, 2017 (Unaudited) |
| |||||||||||||||||||||||||||||||||||||||||||||||||||
IB | $ | 5.32 | $ | (0.01 | ) | $ | 0.77 | $ | 0.76 | $ | — | $ | — | $ | — | $ | 6.08 | 14.29 | %(4) | $ | 19,750 | 1.55 | %(5) | 0.58 | %(5) | (0.23 | )%(5) | |||||||||||||||||||||||||
For the Year Ended December 31, 2016 |
| |||||||||||||||||||||||||||||||||||||||||||||||||||
IB | $ | 5.39 | $ | 0.02 | $ | 0.26 | $ | 0.28 | $ | (0.12 | ) | $ | (0.23 | ) | $ | (0.35 | ) | $ | 5.32 | 4.89 | % | $ | 18,573 | 1.52 | % | 0.57 | % | 0.41 | % | |||||||||||||||||||||||
For the Year Ended December 31, 2015 |
| |||||||||||||||||||||||||||||||||||||||||||||||||||
IB | $ | 5.65 | $ | 0.09 | $ | (0.29 | ) | $ | (0.20 | ) | $ | (0.06 | ) | $ | — | (8) | $ | (0.06 | ) | $ | 5.39 | (3.52 | )% | $ | 21,292 | 1.51 | % | 0.58 | % | 1.61 | % | |||||||||||||||||||||
For the Year Ended December 31, 2014 |
| |||||||||||||||||||||||||||||||||||||||||||||||||||
IB | $ | 9.17 | $ | 0.05 | $ | (0.54 | ) | $ | (0.49 | ) | $ | (0.10 | ) | $ | (2.93 | ) | $ | (3.03 | ) | $ | 5.65 | (8.17 | )% | $ | 27,138 | 1.49 | % | 0.59 | % | 0.59 | % | |||||||||||||||||||||
For the Year Ended December 31, 2013(6) |
| |||||||||||||||||||||||||||||||||||||||||||||||||||
IB | $ | 9.46 | $ | 0.07 | $ | 0.89 | $ | 0.96 | $ | (0.08 | ) | $ | (1.17 | ) | $ | (1.25 | ) | $ | 9.17 | 11.06 | % | $ | 34,304 | 1.43 | % | 0.58 | % | 0.77 | % | |||||||||||||||||||||||
For the Year Ended December 31, 2012(6)(7) |
| |||||||||||||||||||||||||||||||||||||||||||||||||||
IB | $ | 8.66 | $ | 0.07 | $ | 1.38 | $ | 1.45 | $ | (0.15 | ) | $ | (0.50 | ) | $ | (0.65 | ) | $ | 9.46 | 17.47 | % | $ | 51,697 | 1.41 | % | 0.56 | % | 0.61 | % | |||||||||||||||||||||||
| (1) | Information presented relates to a share outstanding throughout the indicated period. Net investment income (loss) per share amounts are calculated based on average shares outstanding unless otherwise noted. |
| (2) | The figures do not include sales charges or other fees which may be applied at the variable life insurance, variable annuity or qualified retirement plan product level. Any such additional sales charges or other fees would lower the Fund’s performance. |
| (3) | Adjustments include waivers and reimbursements, if applicable. Ratios do not include expenses of the Master Funds. |
| (4) | Not annualized. |
| (5) | Annualized. |
| (6) | Financial highlights for the fiscal years ended December 31, 2013 and December 31, 2012 were audited by the Predecessor Funds’ auditor. |
| (7) | Net investment income (loss) per share amounts have been calculated using the SEC method. |
| (8) | Per share amount is less than $0.005. |
See Portfolio Turnover information at the conclusion of Financial Highlights
| 28 |
|
| HIMCO Variable Insurance Trust |
Financial Highlights – (concluded)
| Portfolio Turnover Rate | ||||||||||||||||||||||||
| For the Six Months Ended June 30, 2017 (Unaudited) | For the Year Ended December 31, 2016 | For the Year Ended December 31, 2015 | For the Year Ended December 31, 2014 | For the Year Ended December 31, 2013(1) | For the Year Ended December 31, 2012(1) | |||||||||||||||||||
HIMCO VIT American Funds Asset Allocation Fund | 7 | % | 9 | % | 16 | % | 11 | % | 29 | % | 14 | % | ||||||||||||
HIMCO VIT American Funds Blue Chip Income and Growth Fund | 5 | 19 | 18 | 15 | 16 | 23 | ||||||||||||||||||
HIMCO VIT American Funds Bond Fund | 7 | 9 | 9 | 6 | 15 | 15 | ||||||||||||||||||
HIMCO VIT American Funds Global Bond Fund | 10 | 22 | 5 | 12 | 10 | 8 | ||||||||||||||||||
HIMCO VIT American Funds Global Growth and Income Fund | 2 | 3 | 3 | 7 | 4 | 5 | ||||||||||||||||||
HIMCO VIT American Funds Global Growth Fund | 8 | 15 | 18 | 15 | 7 | 4 | ||||||||||||||||||
HIMCO VIT American Funds Global Small Capitalization Fund | 2 | 24 | 16 | 5 | 11 | 4 | ||||||||||||||||||
HIMCO VIT American Funds Growth Fund | 10 | 12 | 22 | 8 | 3 | 4 | ||||||||||||||||||
HIMCO VIT American Funds Growth-Income Fund | 8 | 15 | 19 | 8 | 6 | 9 | ||||||||||||||||||
HIMCO VIT American Funds International Fund | 4 | 16 | 14 | 6 | 4 | 7 | ||||||||||||||||||
HIMCO VIT American Funds New World Fund | 4 | 6 | 11 | 16 | 6 | 8 | ||||||||||||||||||
| (1) | Financial highlights for the fiscal years ended December 31, 2013 and December 31, 2012 were audited by the Predecessor Funds’ auditor. |
| 29 |
|
| HIMCO Variable Insurance Trust |
HOW TO OBTAIN A COPY OF THE FUNDS’ PROXY VOTING POLICIES AND VOTING RECORDS (UNAUDITED)
A description of the policies and procedures that the Funds use to determine how to vote proxies relating to portfolio securities and information about how the Funds voted proxies relating to portfolio securities during the most recent twelve-month period ended June 30 are available (1) without charge, upon request, by calling 1-800-862-6668 and (2) on the SEC’s website at http://www.sec.gov.
QUARTERLY PORTFOLIO HOLDINGS INFORMATION (UNAUDITED)
The Funds file complete schedules of portfolio holdings with the SEC for the first and third quarters of each fiscal year on Form N-Q. The Funds’ Forms N-Q are available (1) without charge, upon request, by calling 1-800-862-6668 and (2) on the SEC’s website at http://www.sec.gov. The Form N-Q may be reviewed and copied at the SEC’s Public Reference Room in Washington, DC. Information on the operation of the Public Reference Room may be obtained by calling 1-800-SEC-0330.
| 30 |
|
| HIMCO Variable Insurance Trust |
Expense Example (Unaudited)
Your Fund’s Expenses
As a shareholder of a Fund, you incur two types of costs: (1) transaction costs and (2) ongoing costs, including investment management fees, distribution and/or service (12b-1) fees, if any, and other fund expenses. This example is intended to help you understand your ongoing costs (in dollars) of investing in a Fund and to compare these costs with the ongoing costs of investing in other mutual funds. The example is based on an investment of $1,000 invested at the beginning of the period and held for the entire period of January 1, 2017 through June 30, 2017.
Actual Expenses
The first set of rows of the table below provides information about actual account values and actual expenses. You may use the information in this row, together with the amount you invested, to estimate the expenses that you paid over the period. Simply divide your account value by $1,000 (for example, an $8,600 account value divided by $1,000 = 8.6), then multiply the result by the number in the line under the heading entitled “Expenses Paid During Period” to estimate the expenses you paid on your account during this period.
Hypothetical Example for Comparison Purposes
The second set of rows of the table below provides information about hypothetical account values and hypothetical expenses based on a Fund’s actual expense ratio and an assumed rate of return of 5% per year before expenses, which is not the Fund’s actual return. The hypothetical account values and expenses may not be used to estimate the actual ending account balance or expenses you paid for the period. You may use this information to compare the ongoing costs of investing in a Fund and other funds. To do so, compare this 5% hypothetical example with the 5% hypothetical examples that appear in the shareholder reports of the other funds.
Please note that the expenses shown in the table are meant to highlight your ongoing costs only and do not reflect any transactional costs, such as sales charges (loads) or fees which may be applied at the variable life insurance, variable annuity, or qualified retirement plan product level. Therefore, the second set of rows of the table is useful in comparing ongoing costs only, and will not help you determine the relative total costs of owning different funds. In addition, if these transactional costs were included, your costs would be higher.
| Fund Name | Beginning Account Value 1/1/17 | Ending Account Value 6/30/17 | Expenses Paid During Period 1/1/17 - 6/30/17(1) | Net Annualized Expense Ratio(2) | ||||||||||||
HIMCO VIT American Funds Asset Allocation Fund |
| |||||||||||||||
Actual | ||||||||||||||||
Class IB | $ | 1,000.00 | $ | 1,078.90 | $ | 4.43 | 0.86 | % | ||||||||
Hypothetical | ||||||||||||||||
Class IB | $ | 1,000.00 | $ | 1,020.53 | $ | 4.31 | 0.86 | % | ||||||||
HIMCO VIT American Funds Blue Chip Income and Growth Fund |
| |||||||||||||||
Actual | ||||||||||||||||
Class IB | $ | 1,000.00 | $ | 1,054.90 | $ | 5.04 | 0.99 | % | ||||||||
Hypothetical | ||||||||||||||||
Class IB | $ | 1,000.00 | $ | 1,019.89 | $ | 4.96 | 0.99 | % | ||||||||
HIMCO VIT American Funds Bond Fund |
| |||||||||||||||
Actual | ||||||||||||||||
Class IB | $ | 1,000.00 | $ | 1,023.80 | $ | 4.67 | 0.93 | % | ||||||||
Hypothetical | ||||||||||||||||
Class IB | $ | 1,000.00 | $ | 1,020.18 | $ | 4.66 | 0.93 | % | ||||||||
HIMCO VIT American Funds Global Bond Fund |
| |||||||||||||||
Actual | ||||||||||||||||
Class IB | $ | 1,000.00 | $ | 1,048.00 | $ | 5.84 | 1.15 | % | ||||||||
Hypothetical | ||||||||||||||||
Class IB | $ | 1,000.00 | $ | 1,019.09 | $ | 5.76 | 1.15 | % | ||||||||
| 31 |
|
| HIMCO Variable Insurance Trust |
Expense Example (Unaudited) – (concluded)
| Fund Name | Beginning Account Value 1/1/17 | Ending Account Value 6/30/17 | Expenses Paid During Period 1/1/17 - 6/30/17(1) | Net Annualized Expense Ratio(2) | ||||||||||||
HIMCO VIT American Funds Global Growth and Income Fund |
| |||||||||||||||
Actual | ||||||||||||||||
Class IB | $ | 1,000.00 | $ | 1,145.20 | $ | 6.28 | 1.18 | % | ||||||||
Hypothetical | ||||||||||||||||
Class IB | $ | 1,000.00 | $ | 1,018.94 | $ | 5.91 | 1.18 | % | ||||||||
HIMCO VIT American Funds Global Growth Fund |
| |||||||||||||||
Actual | ||||||||||||||||
Class IB | $ | 1,000.00 | $ | 1,184.50 | $ | 6.17 | 1.14 | % | ||||||||
Hypothetical | ||||||||||||||||
Class IB | $ | 1,000.00 | $ | 1,019.14 | $ | 5.71 | 1.14 | % | ||||||||
HIMCO VIT American Funds Global Small Capitalization Fund |
| |||||||||||||||
Actual | ||||||||||||||||
Class IB | $ | 1,000.00 | $ | 1,124.80 | $ | 6.95 | 1.32 | % | ||||||||
Hypothetical | ||||||||||||||||
Class IB | $ | 1,000.00 | $ | 1,018.25 | $ | 6.61 | 1.32 | % | ||||||||
HIMCO VIT American Funds Growth Fund |
| |||||||||||||||
Actual | ||||||||||||||||
Class IB | $ | 1,000.00 | $ | 1,148.70 | $ | 4.74 | 0.89 | % | ||||||||
Hypothetical | ||||||||||||||||
Class IB | $ | 1,000.00 | $ | 1,020.38 | $ | 4.46 | 0.89 | % | ||||||||
HIMCO VIT American Funds Growth-Income Fund |
| |||||||||||||||
Actual | ||||||||||||||||
Class IB | $ | 1,000.00 | $ | 1,095.90 | $ | 4.31 | 0.83 | % | ||||||||
Hypothetical | ||||||||||||||||
Class IB | $ | 1,000.00 | $ | 1,020.68 | $ | 4.16 | 0.83 | % | ||||||||
HIMCO VIT American Funds International Fund |
| |||||||||||||||
Actual | ||||||||||||||||
Class IB | $ | 1,000.00 | $ | 1,183.90 | $ | 5.90 | 1.09 | % | ||||||||
Hypothetical | ||||||||||||||||
Class IB | $ | 1,000.00 | $ | 1,019.39 | $ | 5.46 | 1.09 | % | ||||||||
HIMCO VIT American Funds New World Fund |
| |||||||||||||||
Actual | ||||||||||||||||
Class IB | $ | 1,000.00 | $ | 1,142.90 | $ | 7.23 | 1.36 | % | ||||||||
Hypothetical | ||||||||||||||||
Class IB | $ | 1,000.00 | $ | 1,018.05 | $ | 6.81 | 1.36 | % | ||||||||
| (1) | Expenses are equal to the class’s annualized expense ratio listed in the table above, multiplied by the average account value over the period, multiplied by 181, the number of days in the most recent fiscal half-year, divided by 365, to reflect the one-half year period. |
| (2) | Net annualized expense ratio is reflective of any applicable contractual fee waivers and/or expense reimbursements or voluntary fee waivers. Details regarding fee waivers can be found in Fees and Expenses of the accompanying Notes to Financial Statements. |
| 32 |
|
THIS PRIVACY POLICY IS NOT PART OF THIS REPORT
Privacy Policy and Practices of The Hartford Financial Services Group, Inc. and its Affiliates
(herein called “we, our and us”)
This Privacy Policy applies to our United States Operations
We value your trust. We are committed to the responsible:
a) management;
b) use; and
c) protection;
of Personal Information.
This notice describes how we collect, disclose, and protect Personal Information.
We collect Personal Information to:
a) service your Transactions with us; and
b) support our business functions.
We may obtain Personal Information from:
a) You;
b) your Transactions with us; and
c) third parties such as a consumer-reporting agency.
Based on the type of product or service You apply for or get from us, Personal Information such as:
a) your name;
b) your address;
c) your income;
d) your payment; or
e) your credit history;
may be gathered from sources such as applications, Transactions, and consumer reports.
To serve You and service our business, we may share certain Personal Information. We will share Personal Information, only as allowed by law, with affiliates such as:
a) our insurance companies;
b) our employee agents;
c) our brokerage firms; and
d) our administrators.
As allowed by law, we may share Personal Financial Information with our affiliates to:
a) market our products; or
b) market our services;
to You without providing You with an option to prevent these disclosures.
We may also share Personal Information, only as allowed by law, with unaffiliated third parties including:
a) independent agents;
b) brokerage firms;
c) insurance companies;
d) administrators; and
e) service providers;
who help us serve You and service our business.
When allowed by law, we may share certain Personal Financial Information with other unaffiliated third parties who assist us by performing services or functions such as:
a) taking surveys;
b) marketing our products or services; or
c) offering financial products or services under a joint agreement between us and one or more financial institutions.
We, and third parties we partner with, may track some of the pages You visit through the use of:
a) cookies;
b) pixel tagging; or
c) other technologies;
and currently do not process or comply with any web browser’s “do not track” signal or similar mechanism that indicates a request to disable online tracking of individual users who visit our websites or use our services.
For more information, our Online Privacy Policy, which governs information we collect on our website and our affiliate websites, which is available at Online Privacy Policy.
We will not sell or share your Personal Financial Information with anyone for purposes unrelated to our business functions without offering You the opportunity to:
a) “opt-out;” or
b) “opt-in;”
as required by law.
We only disclose Personal Health Information with:
a) your proper written authorization; or
b) as otherwise allowed or required by law.
Our employees have access to Personal Information in the course of doing their jobs, such as:
a) underwriting policies;
b) paying claims;
c) developing new products; or
d) advising customers of our products and services.
We use manual and electronic security procedures to maintain:
a) the confidentiality; and
b) the integrity of;
Personal Information that we have. We use these procedures to guard against unauthorized access.
Some techniques we use to protect Personal Information include:
a) secured files;
b) user authentication;
c) encryption;
d) firewall technology; and
e) the use of detection software.
We are responsible for and must:
a) identify information to be protected;
b) provide an adequate level of protection for that data;
c) grant access to protected data only to those people who must use it in the performance of their job-related duties.
Employees who violate our privacy policies and procedures may be subject to discipline, which may include ending their employment with us.
We will continue to follow our Privacy Policy regarding Personal Information even when a business relationship no longer exists between us.
As used in this Privacy Notice:
Application means your request for our product or service.
Personal Financial Information means financial information such as:
a) credit history;
b) income;
c) financial benefits; or
d) policy or claim information.
Personal Financial Information may include Social Security Numbers, Driver’s license numbers, or other government-issued identification numbers, or credit, debit card, or bank account numbers.
Personal Health Information means health information such as:
a) your medical records; or
b) information about your illness, disability or injury.
Personal Information means information that identifies You personally and is not otherwise available to the public. It includes:
a) Personal Financial Information; and
b) Personal Health Information.
Transaction means your business dealings with us, such as:
a) your Application;
b) your request for us to pay a claim; and
c) your request for us to take an action on your account.
You means an individual who has given us Personal Information in conjunction with:
a) asking about;
b) applying for; or
c) obtaining;
a financial product or service from us if the product or service is used mainly for personal, family, or household purposes.
This Customer Privacy Notice is being provided on behalf of The Hartford Financial Services Group, Inc. and its affiliates, to the extent required by the Gramm-Leach-Bliley Act and implementing regulations.
1stAGChoice, Inc.; Access CoverageCorp, Inc.; Access CoverageCorp Technologies, Inc.; American Maturity Life Insurance Company; Archway 60 R, LLC; Business Management Group, Inc.; DMS R, LLC; First State Insurance Company; Fountain Investors I LLC; Fountain Investors II LLC; Fountain Investors III LLC; Fountain Investors IV LLC; FP R, LLC (Delaware); FTC Resolution Company LLC; Hart Re Group L.L.C.; Hartford Accident and Indemnity Company; Hartford Administrative Services Company; Hartford Casualty General Agency, Inc.; Hartford Casualty Insurance Company; Hartford Financial Services, LLC; Hartford Fire General Agency, Inc.; Hartford Fire Insurance Company; Hartford Funds Distributors, LLC; Hartford Funds Management Company, LLC; Hartford Funds Management Group, Inc.; Hartford Group Benefits Holding Company; Hartford Holdings, Inc.; Hartford HLS Series Fund II, Inc.; Hartford Insurance Company of Illinois; Hartford Insurance Company of the Midwest; Hartford Insurance Company of the Southeast; Hartford Integrated Technologies, Inc.; Hartford International Life Reassurance Corporation; Hartford Investment Management Company; Hartford Life and Accident Insurance Company; Hartford Life and Annuity Insurance Company; Hartford Life Insurance Company; Hartford Life, Inc.; Hartford Life International Holding Company; Hartford Life Private Placement, LLC; Hartford Lloyd’s Corporation; Hartford Lloyd’s Insurance Company; Hartford of Texas General Agency, Inc.; Hartford Residual Market, L.C.C.; Hartford Securities Distribution Company, Inc.; Hartford Series Fund, Inc.; Hartford Specialty Insurance Services of Texas, LLC; Hartford Strategic Investments, LLC; Hartford Underwriters General Agency, Inc.; Hartford Underwriters Insurance Company; Hartford-Comprehensive Employee Benefit Service Company; HDC R, LLC .; Heritage Holdings, Inc.; HIMCO Distribution Services Company; HIMCO Variable Insurance Trust; HLA LLC; HL Investment Advisors, LLC; Horizon Management Group, LLC; HRA Brokerage Services, Inc.; Lanidex Class B, LLC; ; Lanidex R, LLC (Delaware); Lattice Strategies LLC; Maxum Casualty Insurance Company; Maxum Indemnity Company; Maxum Specialty Services Corporation; MPC Resolution Company LLC; New England Insurance Company; New England Reinsurance Corporation; Northern Homelands Company; Nutmeg Insurance Agency, Inc.; Nutmeg Insurance Company; Pacific Insurance Company, Limited; Property and Casualty Insurance Company of Hartford; Sentinel Insurance Company, Ltd.; Trumbull Flood Management, L.L.C.; Trumbull Insurance Company; Twin City Fire Insurance Company.
Revised March 2017

This report is prepared for the general information of contract owners and is not an offer to buy or sell an annuity contract, fund or any security. It should not be used in connection with any offer, except in conjunction with the appropriate product prospectus (which contains all pertinent product information including the applicable sales, administrative and other charges) and the current prospectus and/or summary prospectus of the Fund available for investment thereunder.
The information cannot be used or relied upon for the purpose of avoiding IRS penalties. These materials are not intended to provide tax, accounting or legal advice. As with all matters of a tax or legal nature, you should consult your own tax or legal counsel for advice.
You should carefully consider investment objectives, risks, and charges and expenses of HIMCO Variable Insurance Trust Funds before investing. This and other information can be found in the Fund’s prospectus or summary prospectus, which can be obtained from your investment representative or from www.hvitfunds.com. Please read them carefully before investing.
Hartford Investment Management is an SEC-registered investment adviser. SEC registration does not imply a certain level of skill or training; nor does it imply that the SEC has sponsored, recommended, or otherwise approved of Hartford Investment Management.
Distributor: HIMCO Distribution Services Company, member FINRA, SIPC, a broker-dealer affiliated with Hartford Investment Management. Not FDIC Insured – No Bank Guarantee – May Lose Value

American Funds Insurance Series, from Capital Group, is the underlying investment vehicle for many variable annuities and insurance products. For more than 85 years, Capital has invested with a long-term focus based on thorough research and attention to risk.
Investing for short periods makes losses more likely. Investments are not FDIC-insured, nor are they deposits of or guaranteed by a bank or any other entity, so they may lose value. For current information and month-end results, visit americanfunds.com/afis. For information about your insurance contract and month-end results, go to the website of the company that issued your contract.
Investing outside the United States involves risks, such as currency fluctuations, periods of illiquidity and price volatility, as more fully described in the prospectus. These risks may be heightened in connection with investments in developing countries. Investing in small-capitalization stocks can involve greater risk than is customarily associated with investing in stocks of larger, more established companies. The return of principal for bond funds and for funds with significant underlying bond holdings is not guaranteed. Fund shares are subject to the same interest rate, inflation and credit risks associated with the underlying bond holdings. High-yield bonds are subject to greater fluctuations in value and risk of loss of income and principal than investment-grade bonds. Bond ratings, which typically range from AAA/Aaa (highest) to D (lowest), are assigned by credit rating agencies such as Standard & Poor’s, Moody’s and/or Fitch as an indication of an issuer’s creditworthiness. Futures contracts may not provide an effective hedge of the underlying securities because changes in the prices of futures contracts may not track those of the securities they are intended to hedge. In addition, the managed risk strategy may not effectively protect the funds from market declines and will limit the funds’ participation in market gains. The use of the managed risk strategy could cause the funds’ returns to lag those of the applicable underlying funds in certain rising market conditions. Refer to the funds’ prospectuses and the Risk Factors section of this report for more information on these and other risks associated with investing in the funds.
Global stocks rallied for the six months ended June 30, 2017, with the MSCI ACWI (All Country World Index)1 gaining 11.48%. Against a backdrop of supportive global monetary policy, strong corporate earnings and improving economic data in the U.S., Europe and Japan helped to diminish investors’ concerns about increasing populism and geopolitical uncertainty.
The MSCI USA Index1 advanced 9.53%, and several market indexes hit a series of new highs in anticipation of the Trump administration reducing regulations and delivering tax reforms. While the U.S. economy continued to grow, there were some signs of moderation in the form of tepid consumer activity and hiring. The U.S. Federal Reserve increased short-term interest rates by a quarter percentage point in both March and June. These rate hikes can be considered steps toward “normalization” after central banks pursued accommodative monetary policies focused on healing stresses in the global financial system caused by the 2008 financial crisis.
European markets also rose, despite heightened political uncertainty ahead of pivotal elections in the U.K. and France that served as referenda on the future of Europe. The MSCI Europe Index climbed 15.36%, reversing last year’s weakness, with Spain (23.81%), France (17.05%), Germany (15.32%) and the U.K.
(10.00%) all registering double-digit gains. Elsewhere among developed markets, Japanese equities rose 9.92%,
See page 2 for footnotes.
buoyed by the country’s longest streak of economic expansion in more than a decade.
Emerging markets enjoyed some of the best results with the MSCI EM (Emerging Markets) Index1 up 18.43%. Gains were solid across Asia as Chinese equities advanced 24.86%, outweighing concerns about the nation’s debt load. Chinese industrial production remained robust, as the government introduced policies to cool the housing market and confront the country’s high debt. Indian equities soared 20.53%, despite the currency demonetization initiative announced by Prime Minister Modi in November as part of his efforts to curtail corruption. Russian stocks slipped 14.18% as oil prices fell, and OPEC and Russia considered extending cuts in oil production to speed up rebalancing of global inventories.
In bond markets, U.S. investment-grade and high-yield corporates advanced 3.80% and 4.92%, respectively, as demand remained healthy despite tightening monetary policy. Bloomberg Barclays Global Aggregate Index2, a measure of global investment-grade bonds (rated BBB/Baa and above), rose 4.41%, while the Bloomberg Barclays U.S. Aggregate Index2 (which measures U.S. investment-grade bonds) improved to 2.27%. The 10-year Treasury yield, which stood at 2.45% on December 31, 2016, declined marginally to 2.31%. U.S. dollar-denominated emerging markets bonds, as measured by the J.P. Morgan EMBI (Emerging Markets Bond Index) Global3,
| American Funds Insurance Series 1 |
climbed 6.20% as their higher yields were popular in the current interest rate environment.
The U.S. dollar depreciated against most currencies. Gainers included the euro (8.13%), Japanese yen (3.80%) and Singapore dollar (4.93%).
AFIS funds recorded positive returns during the period; those funds with exposure to growth stocks and companies outside the U.S. enjoyed the strongest returns.
Looking ahead
In today’s uncertain political environment, the underlying economic reality is generally positive. The U.S. is likely to continue growing at a moderate pace, even as some countries experience sluggish growth and low inflation. While China is currently growing, its development has relied on infrastructure spending, and investments in fixed assets may be approaching a point of diminishing returns. Geopolitical challenges plague many parts of the world. The European landscape continues to evolve following parliamentary elections in the U.K. and the presidential victory of Emmanuel Macron in France. The conflict in Syria and mounting tensions in the Middle East bear watching as well. Against this backdrop, markets may be more volatile going forward, which is not a negative per se. Volatility often creates opportunities for long-term investors. So, we believe that investors should keep to their long-term plans and not panic.
Valuations are richer in the U.S. than in other parts of the world, but this is normal given that U.S. indexes comprise a greater proportion of innovative technology companies (which tend to have higher multiples) and a lesser proportion of financial companies (which tend to have lower multiples). Our goal is to see through uncertainties and focus on the fundamental outlook for each business that we evaluate. Our investment approach – based on extensive research, a long-term outlook and close attention to valuation – has served investors well over time.
We have confidence that this time-tested and robust approach will continue to serve our investors well in the long run. We thank you for your support and look forward to reporting to you again in six months’ time.
Sincerely,

Donald D. O’Neal
Vice Chairman of the Board

Alan N. Berro
President
August 14, 2017
All market indexes referenced in this report are unmanaged and, therefore, have no expenses. Investors cannot invest directly in an index.
1Country returns are based on MSCI indexes, which reflect reinvestment of distributions and dividends net of withholding taxes, except for the MSCI USA Index, which reflects dividends gross of withholding taxes. Source: MSCI.
2Bloomberg Barclays source: Bloomberg Index Services Ltd.
3This report, and any product, index or fund referred to herein, is not sponsored, endorsed or promoted in any way by J.P. Morgan or any of its affiliates who provide no warranties whatsoever, express or implied, and shall have no liability to any prospective investor, in connection with this report. J.P. Morgan disclaimer: http://www.jpmorgan.com/pages/jpmorgan/ib/girg.
2 American Funds Insurance Series |
Summary investment portfolios
Summary investment portfolios are designed to streamline this report and help investors better focus on the funds’ principal holdings. Ultra-Short Bond Fund, Managed Risk Growth Fund, Managed Risk International Fund, Managed Risk Blue Chip Income and Growth Fund, Managed Risk Growth-Income Fund and Managed Risk Asset Allocation Fund show a complete listing of portfolio holdings. See the inside back cover for details on how to obtain a complete schedule of portfolio holdings for each fund in the series.
Unless otherwise indicated, American Funds Insurance Series investment results are for Class 2 shares (Class P2 shares for managed risk funds). Class 1A shares began operations on January 6, 2017. Class 2 shares began operations on April 30, 1997. Class 3 shares began operations on January 16, 2004. Class 4 shares began operations on December 14, 2012. Results encompassing periods prior to those dates assume a hypothetical investment in Class 1 shares and include the deduction of additional annual expenses (0.25% for Class 1A shares, 0.25% for Class 2 shares, 0.18% for Class 3 shares and 0.50% for Class 4 shares).
The variable annuities and life insurance contracts that use the series funds contain certain fees and expenses not reflected in this report. Investment results assume all distributions are reinvested and reflect applicable fees and expenses. The series investment adviser waived a portion of its management fees for all existing funds from September 1, 2004, through December 31, 2008, for U.S. Government/AAA-Rated Securities Fund from July 1, 2010, through December 31, 2010, and for Blue Chip Income and Growth Fund from February 1, 2014, through January 31, 2015. For the managed risk funds, the investment adviser is currently waiving a portion of its management fee equal to 0.05% of the funds’ net assets and is currently reimbursing a portion of other expenses for all funds except Managed Risk Asset Allocation Fund. The waivers and reimbursements will be in effect through at least May 1, 2018, unless modified or terminated by the series board. After that time, the investment adviser may elect to extend, modify or terminate the reimbursements. The waivers may only be modified or terminated with the approval of the series board. Applicable fund results shown reflect the waivers and reimbursements, without which results would have been lower. See the Financial Highlights tables in this report for details.
The Managed Risk Growth Fund pursues its objective by investing in shares of American Funds Insurance Series – Growth Fund.SM The Managed Risk International Fund pursues its objective by investing in shares of American Funds Insurance Series – International Fund.SM The Managed Risk Blue Chip Income and Growth Fund pursues its objective by investing in shares of American Funds Insurance Series – Blue Chip Income and Growth Fund.SM The Managed Risk Growth-Income Fund pursues its objective by investing in shares of American Funds Insurance Series – Growth-Income Fund.SM The Managed Risk Asset Allocation Fund pursues its objective by investing in shares of American Funds Insurance Series – Asset Allocation Fund.SM The funds seek to manage portfolio volatility and provide downside protection, primarily through the use of exchange-traded futures contracts. The benefit of the funds’ managed risk strategy should be most apparent during periods of high volatility and in down markets. In steady or rising markets, the funds’ results can be expected to lag those of the underlying fund.
Individual funds are listed in this report according to their risk potential, with managed risk funds listed last.
| American Funds Insurance Series | 3 |
Fund results shown are for past periods and are not predictive of results for future periods. Current and future results may be lower or higher than those shown. Unit prices and returns will vary, so investors may lose money. For current information and month-end results, visit americanfunds.com/afis. For information about your insurance contract and month-end results, go to the website of the company that issued your contract.
Global Growth Fund rose 18.57% for the six months ended June 30, 2017, compared with a 11.48% increase for the MSCI ACWI (All Country World Index).1
Global stocks rose amid strong corporate earnings and improving economic data in the U.S., Europe and Japan. Several key market indexes hit a series of new highs. U.S. equity markets surged in anticipation of lower regulation and tax cuts. Information technology stocks led markets higher, as the share price of U.S. tech giants Apple and Alphabet advanced. European stocks climbed higher despite the U.K’s pivotal vote to leave the European Union. Markets cheered Emmanuel Macron’s victory in the French presidential election as the centrist leader pledged to keep France in the European Union. Emerging markets also enjoyed strong returns, supported by technology companies reporting strong earnings.
Larger-than-index investments and strong stock selection in information technology and consumer discretionary contributed most to the fund’s returns. An eclectic mix of stocks boosted the fund’s returns. Nintendo shares rose to an eight-year high on optimism that more third-party developers would create games for the company’s new flagship console. Consumer discretionary company Amazon advanced and posted a double-digit return as the company expanded its product offerings through Prime. Mortgage lender Indiabulls Housing Finance rose, benefitting from India’s affordable housing initiative.
The fund’s exposure to companies in the energy sector detracted from returns. Seven Generations and Schlumberger slipped and hindered returns as oil prices declined on concerns of oversupply.
Stocks of companies domiciled in the U.S. and Japan were additive to results on a relative basis, while stocks of companies based in Denmark and Korea hindered relative returns.
While political uncertainties may result in volatility, the fund’s portfolio managers are optimistic long-term investments can be found among companies with innovative products and services that are changing the way people live around the world.
Percent of net assets
Country diversification
The Americas | ||||
United States | 40.6 | % | ||
Other | 1.4 | |||
|
| |||
| 42.0 | ||||
|
| |||
Europe | ||||
United Kingdom | 7.1 | |||
France | 6.8 | |||
Switzerland | 3.5 | |||
Netherlands | 3.5 | |||
Spain | 1.7 | |||
Germany | 1.7 | |||
Russian Federation | 1.2 | |||
Finland | 1.2 | |||
Denmark | 1.0 | |||
Europe (continued) | ||||
Italy | 1.0 | % | ||
Sweden | 1.0 | |||
Other | .6 | |||
|
| |||
| 30.3 | ||||
|
| |||
Asia/Pacific Basin | ||||
Japan | 7.5 | |||
China | 5.1 | |||
Taiwan | 4.0 | |||
Hong Kong | 2.7 | |||
India | 1.8 | |||
South Korea | 1.3 | |||
Other | 1.4 | |||
|
| |||
| 23.8 | ||||
|
| |||
Other regions | ||||
South Africa | 1.1 | % | ||
|
| |||
Short-term securities & other assets less liabilities | 2.8 | |||
|
| |||
Total | 100.0 | % | ||
|
| |||
| 4 | American Funds Insurance Series |
Global Growth Fund
Percent of net assets
Largest individual
equity securities
Amazon | 4.92 | % | ||
TSMC | 3.44 | |||
Alphabet | 3.33 | |||
Nintendo | 2.96 | |||
ASML Holding | 2.94 |
| 2.32 | % | |||
British American Tobacco | 2.26 | |||
Regeneron Pharmaceuticals | 2.05 | |||
AIA Group | 1.92 | |||
Alibaba Group | 1.88 |
Average annual
total returns based on
a $1,000 investment
For periods ended June 30, 2017
| 6 months | 1 year | 5 years | 10 years | Lifetime (since April 30, 1997) | Expense ratio | |||||||
Class 1 | 18.75% | 23.89% | 13.95% | 7.04% | 9.81% | .56% | ||||||
Class 1A | 18.66 | 23.64 | 13.68 | 6.77 | 9.54 | .812 | ||||||
Class 2 | 18.57 | 23.54 | 13.66 | 6.77 | 9.54 | .81 | ||||||
Class 4 | 18.44 | 23.25 | 13.47 | 6.54 | 9.29 | 1.06 |
Investment results assume all distributions are reinvested and respect applicable fees and expenses. The fund’s investment adviser waived a portion of its management fees from September 1, 2004, through December 31, 2008. Applicable fund results shown reflect the waiver, without which they would have been lower. Expense ratios are as of the fund’s prospectus dated May 1, 2017. See the Financial Highlights table in this report for details.
Any market index shown is unmanaged and, therefore, has no expenses. Investors cannot invest directly in an index.
1Source: MSCI. The MSCI index result reflects dividends net of withholding taxes and reinvestment of distributions.
2Based on estimated amounts for the current fiscal year.
Percent of net assets
Where the fund’s
assets were
invested as of
June 30, 2017
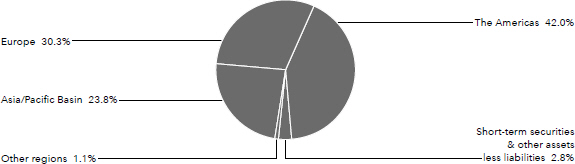
| American Funds Insurance Series | 5 |
Global Small Capitalization Fund
Fund results shown are for past periods and are not predictive of results for future periods. Current and future results may be lower or higher than those shown. Unit prices and returns will vary, so investors may lose money. For current information and month-end results, visit americanfunds.com/afis. For information about your insurance contract and month-end results, go to the website of the company that issued your contract.
Global Small Capitalization Fund increased 12.71% for the six months ended June 30, 2017, leading its benchmark, the MSCI All Country World Small Cap Index,1 which gained 10.36%.
Global stocks rose amid strong corporate earnings and improving economic data in the U.S., Europe and Japan. Several key market indexes hit a series of new highs. U.S. equity markets surged in anticipation of lower regulation and tax cuts. European stocks climbed higher despite the U.K’s pivotal vote to leave the European Union. Markets cheered Emmanuel Macron’s victory in the French presidential election as the centrist leader pledged to keep France in the European Union. Emerging markets also enjoyed strong returns, buoyed by technology companies reporting strong earnings.
Consumer discretionary holdings aided returns, with zooplus reporting revenue growth. The company was among the top contributors to returns. Information technology company Sunny Optical rallied on optimism the smartphone market is improving as shipments of smartphone camera lenses grew at a robust pace and was also among the top contributors to results.
Energy stocks were the biggest detractors from returns, as the price of oil declined due to concerns of oversupply. Among the top detractors were investments in Laredo Petroleum, SM Energy and Carrizo.
While investments in U.S. companies were additive to relative returns, larger-than-index investments in U.K. domiciled companies detracted from relative results.
While political uncertainties may result in volatility, the fund’s portfolio managers are optimistic that our investment process can help identify companies outside the U.S. with innovative products and services that are changing the way people live around the globe.
Percent of net assets
Country diversification
The Americas | ||||
United States | 40.4 | % | ||
Canada | 2.3 | |||
Other | 1.8 | |||
|
| |||
| 44.5 | ||||
|
| |||
Asia/Pacific Basin | ||||
Japan | 6.3 | |||
China | 5.2 | |||
India | 4.0 | |||
Hong Kong | 3.2 | |||
Thailand | 2.2 | |||
Asia/Pacific Basin (continued) |
| |||
Taiwan | 2.1 | % | ||
Philippines | 1.9 | |||
Indonesia | 1.0 | |||
Other | 1.5 | |||
|
| |||
| 27.4 | ||||
|
| |||
Europe | ||||
United Kingdom | 11.2 | |||
Germany | 3.5 | |||
Other | 6.6 | |||
|
| |||
| 21.3 | ||||
|
| |||
Short-term securities & other assets less liabilities | 6.8 | % | ||
|
| |||
Total | 100.0 | % | ||
|
| |||
Percent of net assets
Largest individual
equity securities
Qorvo | 2.80 | % | ||
Insulet | 1.65 | |||
GW Pharmaceuticals | 1.62 | |||
China Biologic Products | 1.41 | |||
Domino’s Pizza | 1.27 |
zooplus | 1.23 | % | ||
Kotak Mahindra Bank | 1.20 | |||
athenahealth | 1.19 | |||
Hilton Grand Vacations | 1.00 | |||
Kite Pharma | .99 |
| 6 | American Funds Insurance Series |
Global Small Capitalization Fund
Average annual
total returns based on
a $1,000 investment
For periods ended June 30, 2017
| 6 months | 1 year | 5 years | 10 years | Lifetime (since April 30, 1998) | Expense ratio | |||||||
Class 1 | 12.82% | 20.09% | 11.22% | 3.15% | 9.42% | .74% | ||||||
Class 1A | 12.77 | 19.88 | 10.96 | 2.90 | 9.16 | .992 | ||||||
Class 2 | 12.71 | 19.85 | 10.95 | 2.90 | 9.16 | .99 | ||||||
Class 4 | 12.57 | 19.52 | 10.69 | 2.65 | 8.88 | 1.24 |
Investment results assume all distributions are reinvested and reflect applicable fees and expenses. The fund’s investment adviser waived a portion of its management fees from September 1, 2004, through December 31, 2008. Applicable fund results shown reflect the waiver, without which they would have been lower. Expense ratios are as of the fund’s prospectus dated May 1, 2017. See the Financial Highlights table in this report for details.
Any market index shown is unmanaged and, therefore, has no expenses. Investors cannot invest directly in an index.
1Source: MSCI. The MSCI index result reflects dividends net of withholding taxes and reinvestment of distributions.
2Based on estimated amounts for the current fiscal year.
Percent of net assets
Where the fund’s
assets were
invested as of
June 30, 2017
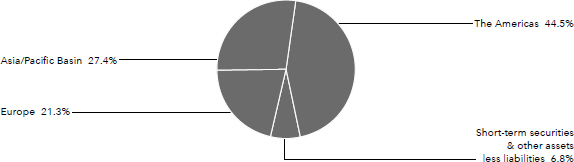
| American Funds Insurance Series | 7 |
Growth Fund
Fund results shown are for past periods and are not predictive of results for future periods. Current and future results may be lower or higher than those shown. Unit prices and returns will vary, so investors may lose money. For current information and month-end results, visit americanfunds.com/afis. For information about your insurance contract and month-end results, go to the website of the company that issued your contract.
Growth Fund gained 15.00% for the six months ended June 30, 2017, compared with a 9.34% increase in its benchmark index, Standard & Poor’s 500 Composite Index.1
U.S. stocks rose to new highs led by strong corporate earnings and improving economic sentiment. Positive economic data on employment and industrial production bolstered optimism in the economy. Information technology stocks advanced, led by tech giants such as Alphabet and Apple, amid growing optimism over consumer demand. Defensive sectors also rose, led by health care and consumer staples.
Larger-than-index investments and strong stock selection in consumer discretionary and information technology boosted the fund’s returns. Among the fund’s top contributors to returns (posting double-digit gains) were consumer discretionary companies Amazon and Tesla and information technology companies Facebook and Broadcom.
Exposure to the energy sector detracted from fund results as the price of crude oil declined, despite OPEC’s decision to extend production cuts into 2018. Energy exploration and production companies Noble Energy and EOG Resources, as well as oil-field services company Schlumberger, detracted from returns.
The fund’s portfolio managers are keeping a close watch on the U.S. economy, which continues to show modest economic growth. Portfolio managers continue to favor well-managed, growth-oriented companies that are capable of generating free cash flow in myriad economic environments and remain optimistic that our global research will help us identify attractive long-term investment opportunities.
Percent of net assets
Largest individual
equity securities
Amazon | 5.72 | % | ||
| 5.34 | ||||
Alphabet | 3.43 | |||
Microsoft | 3.41 | |||
Broadcom | 3.03 |
UnitedHealth Group | 2.76 | % | ||
Apple | 2.35 | |||
Tesla | 2.31 | |||
Home Depot | 1.94 | |||
ASML | 1.91 |
| 8 | American Funds Insurance Series |
Growth Fund
Average annual total returns based on a $1,000 investment
For periods ended June 30, 2017
| 6 months | 1 year | 5 years | 10 years | Lifetime (since February 8, 1984) | Expense ratio | |||||||
Class 1 | 15.15% | 25.04% | 15.95% | 7.55% | 12.66% | .35% | ||||||
Class 1A | 15.07 | 24.80 | 15.67 | 7.28 | 12.38 | .602 | ||||||
Class 2 | 15.00 | 24.74 | 15.66 | 7.28 | 12.36 | .60 | ||||||
Class 3 | 15.05 | 24.82 | 15.75 | 7.35 | 12.46 | .53 | ||||||
Class 4 | 14.86 | 24.42 | 15.41 | 7.03 | 12.11 | .85 |
Investment results assume all distributions are reinvested and reflect applicable fees and expenses. The fund’s investment adviser waived a portion of its management fees from September 1, 2004, through December 31, 2008. Applicable fund results shown reflect the waiver, without which they would have been lower. Expense ratios are as of the fund’s prospectus dated May 1, 2017. See the Financial Highlights table in this report for details.
Any market index shown is unmanaged and, therefore, has no expenses. Investors cannot invest directly in an index.
1Source: S&P Dow Jones Indices LLC.
2Based on estimated amounts for the current fiscal year.
Percent of net assets
Where the fund’s
assets were
invested as of
June 30, 2017
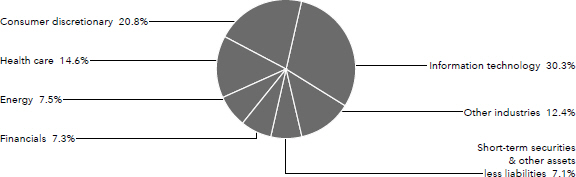
| American Funds Insurance Series | 9 |
International Fund
Fund results shown are for past periods and are not predictive of results for future periods. Current and future results may be lower or higher than those shown. Unit prices and returns will vary, so investors may lose money. For current information and month-end results, visit americanfunds.com/afis. For information about your insurance contract and month-end results, go to the website of the company that issued your contract.
International Fund gained 18.55% for the six months ended June 30, 2017. Its benchmark, the MSCI ACWI (All Country World Index) ex USA,1 rose 14.10%.
It was a challenging start to the year as rising populism, the U.K. vote to depart the EU by March 2019, and pivotal elections in Europe dominated investor concerns. By the end of the period, global markets advanced amid strong corporate earnings and improving economic data in the U.S., Europe and Japan. Global markets were led by the information technology sector, as technology companies reported strong earnings.
Investments in the information technology sector contributed most to returns. The fund took advantage of the rally in the information technology sector, helped by investments in Tencent and Alibaba Group. Strong Chinese consumption contributed to revenue growth for both companies. Investments in the financials sector were also among the top contributors to the fund’s returns. HDFC Bank surged after the company reported a more than 18% increase in fourth-quarter profits as the bank continued to gain market share from state-owned banks. Investments in the energy sector hindered the fund’s returns. Tullow was among the top detractors to returns, as the company’s share price declined on write-downs due to the weakness in crude oil prices.
The fund’s portfolio managers strive to maintain a balanced approach and look for companies that have the potential to thrive in today’s uncertain political environment. That is why we take a multilayered approach to research, and invest in different geographies, industries and ultimately companies that can control their own destiny through efficiencies or innovative products.
Percent of net assets
Country diversification
Asia/Pacific Basin | ||||
Japan | 11.6 | % | ||
Hong Kong | 9.3 | |||
China | 9.1 | |||
India | 7.8 | |||
South Korea | 6.5 | |||
Australia | 1.8 | |||
Thailand | 1.2 | |||
Philippines | 1.1 | |||
|
| |||
| 48.4 | ||||
|
| |||
Europe | ||||
United Kingdom | 11.8 | |||
France | 7.3 | |||
Switzerland | 4.3 | |||
Europe (continued) | ||||
Netherlands | 3.5 | % | ||
Germany | 2.3 | |||
Spain | 2.3 | |||
Italy | 1.7 | |||
Denmark | 1.0 | |||
Belgium | 1.0 | |||
Other | 1.5 | |||
|
| |||
| 36.7 | ||||
|
| |||
The Americas | ||||
Canada | 2.0 | |||
Brazil | 1.0 | |||
United States | .6 | |||
|
| |||
| 3.6 | ||||
|
| |||
Other regions | ||||
Israel | 1.4 | % | ||
South Africa | .9 | |||
|
| |||
| 2.3 | ||||
|
| |||
Short-term securities & other assets less liabilities | 9.0 | |||
|
| |||
Total | 100.0 | % | ||
|
| |||
Percent of net assets
Largest individual
equity securities
Tencent | 3.43 | % | ||
AIA Group | 3.34 | |||
HDFC Bank | 3.33 | |||
Samsung Electronics | 3.26 | |||
Alibaba Group | 2.96 |
Airbus Group | 2.40 | % | ||
Altice | 2.36 | |||
Novartis | 1.86 | |||
Kering | 1.67 | |||
UniCredit | 1.65 |
| 10 | American Funds Insurance Series |
International Fund
Average annual total
returns based on
a $1,000 investment
For periods ended June 30, 2017
| 6 months | 1 year | 5 years | 10 years | Lifetime (since May 1, 1990) | Expense ratio | |||||||
Class 1 | 18.71% | 24.54% | 9.67% | 3.17% | 8.28% | .54% | ||||||
Class 1A | 18.58 | 24.25 | 9.40 | 2.91 | 8.01 | .792 | ||||||
Class 2 | 18.55 | 24.20 | 9.40 | 2.91 | 8.00 | .79 | ||||||
Class 3 | 18.64 | 24.32 | 9.48 | 2.98 | 8.09 | .72 | ||||||
Class 4 | 18.48 | 23.94 | 9.16 | 2.67 | 7.75 | 1.04 |
Investment results assume all distributions are reinvested and reflect applicable fees and expenses. The fund’s investment adviser waived a portion of its management fees from September 1, 2004, through December 31, 2008. Applicable fund results shown reflect the waiver, without which they would have been lower. Expense ratios are as of the fund’s prospectus dated May 1, 2017. See the Financial Highlights table in this report for details.
Any market index shown is unmanaged and, therefore, has no expenses. Investors cannot invest directly in an index.
1Source: MSCI. The MSCI index result reflects dividends net of withholding taxes and reinvestment of distributions.
2Based on estimated amounts for the current fiscal year.
Percent of net assets
Where the fund’s
assets were
invested as of
June 30, 2017
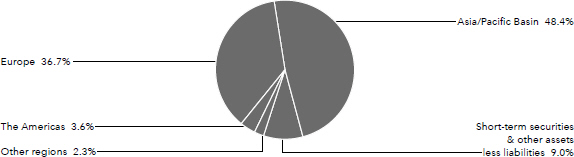
| American Funds Insurance Series | 11 |
New World Fund®
Fund results shown are for past periods and are not predictive of results for future periods. Current and future results may be lower or higher than those shown. Unit prices and returns will vary, so investors may lose money. For current information and month-end results, visit americanfunds.com/afis. For information about your insurance contract and month-end results, go to the website of the company that issued your contract.
New World Fund gained 14.48% for the six months ended June 30, 2017. Its benchmark indexes, the MSCI ACWI (All Country World Index) and the MSCI Emerging Markets Index,1 rose 11.48% and 18.43%, respectively.
It was a challenging start to the year as rising populism, the U.K.’s vote to depart the EU by March 2019, and pivotal elections in Europe dominated investor concerns. By the end of the period, global markets advanced amid strong corporate earnings and improving economic data in the U.S., Europe and Japan. Global markets were led by the information technology sector, as technology companies reported strong earnings.
Investments in India were the most additive to the fund’s returns, with Reliance Industries and HDFC Bank among the top contributors to results. Reliance Industries rose as the company launched India’s largest fourth-generation, mobile-telecom network and reported strong earnings from its refining and petrochemical businesses. HDFC Bank also surged after the company reported a more than 18% increase in fourth-quarter profits as the bank continued to gain market share from state-owned banks. Russian food retailer Lenta was a key detractor hurt by lower profits amid sluggish consumer demand. Reliance Communications also detracted from the fund’s returns as the company reported fourth-quarter losses.
While political and economic uncertainty remains, the fund’s portfolio managers continue to carefully monitor the portfolio while also looking for idiosyncratic investment opportunities when stock prices are favorable.
Percent of net assets
Country diversification
Asia/Pacific Basin | ||||
India | 11.2 | % | ||
China | 9.6 | |||
Japan | 7.3 | |||
Taiwan | 4.3 | |||
Indonesia | 2.1 | |||
Australia | 1.8 | |||
South Korea | 1.6 | |||
Hong Kong | 1.3 | |||
Thailand | 1.1 | |||
Other | .2 | |||
|
| |||
| 40.5 | ||||
|
|
The Americas | ||||
United States | 19.2 | % | ||
Brazil | 6.8 | |||
Mexico | 4.7 | |||
Argentina | 2.1 | |||
Other | .6 | |||
|
| |||
| 33.4 | ||||
|
| |||
Europe | ||||
United Kingdom | 7.5 | |||
Russian Federation | 3.4 | |||
France | 2.6 | |||
Switzerland | 1.5 | |||
Other | 2.5 | |||
|
| |||
| 17.5 | ||||
|
| |||
Other regions | ||||
South Africa | 1.6 | % | ||
Other | .8 | |||
|
| |||
| 2.4 | ||||
|
| |||
Short-term securities & other assets less liabilities | 6.2 | |||
|
| |||
Total | 100.0 | % | ||
|
| |||
Percent of net assets
Largest individual
equity securities
Reliance Industries | 4.41 | % | ||
British American Tobacco | 3.12 | |||
TSMC | 2.93 | |||
Murata Manufacturing | 2.81 | |||
Alphabet | 2.51 |
IEnova | 2.29 | % | ||
HDFC Bank | 2.12 | |||
| 1.91 | ||||
SoftBank | 1.67 | |||
Samsung Electronics | 1.62 |
| 12 | American Funds Insurance Series |
New World Fund
Average annual
total returns based on
a $1,000 investment
For periods ended June 30, 2017
| 6 months | 1 year | 5 years | 10 years | Lifetime (since June 17, 1999) | Expense ratio | |||||||
Class 1 | 14.59% | 18.19% | 6.42% | 3.73% | 8.31% | .78% | ||||||
Class 1A | 14.49 | 17.93 | 6.16 | 3.48 | 8.04 | 1.032 | ||||||
Class 2 | 14.48 | 17.85 | 6.14 | 3.48 | 8.04 | 1.03 | ||||||
Class 4 | 14.32 | 17.59 | 5.91 | 3.23 | 7.78 | 1.28 |
Investment results assume all distributions are reinvested and reflect applicable fees and expenses. The fund’s investment adviser waived a portion of its management fees from September 1, 2004, through December 31, 2008. Applicable fund results shown reflect the waiver, without which they would have been lower. Expense ratios are as of the fund’s prospectus dated May 1, 2017. See the Financial Highlights table in this report for details.
Any market index shown is unmanaged and, therefore, has no expenses. Investors cannot invest directly in an index.
1Source: MSCI. Results for MSCI indexes reflect dividends net of withholding taxes and reinvestment of distributions.
2Based on estimated amounts for the current fiscal year.
Percent of net assets
Where the fund’s
assets were
invested as of
June 30, 2017
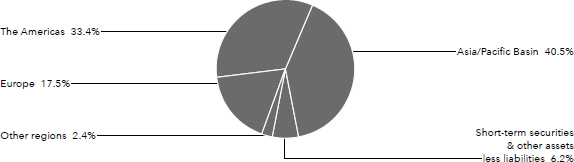
| American Funds Insurance Series | 13 |
Blue Chip Income and Growth Fund
Fund results shown are for past periods and are not predictive of results for future periods. Current and future results may be lower or higher than those shown. Unit prices and returns will vary, so investors may lose money. For current information and month-end results, visit americanfunds.com/afis. For information about your insurance contract and month-end results, go to the website of the company that issued your contract.
Blue Chip Income and Growth Fund gained 5.76% for the six months ended June 30, 2017, trailing its benchmark index, Standard & Poor’s 500 Composite Index,1 which rose 9.34%.
U.S. stocks rose to new highs led by strong corporate earnings and improving economic sentiment. Positive economic data on employment and industrial production bolstered optimism in the economy. Information technology stocks advanced, led by tech giants such as Alphabet and Apple, amid growing optimism over consumer demand. Defensive sectors also rose, led by health care and consumer staples.
Investments in industrials and consumer staples boosted the fund’s returns. Among the fund’s top contributors to returns (posting double-digit gains) was industrials company CSX as the company appointed a new CEO and took cost-cutting measures to spur a turnaround. Consumer staples company Philip Morris International was also among the fund’s top contributors as the company climbed to record highs.
Investments in the energy sector hindered returns as the price of oil declined amid concerns of oversupply. Energy exploration and production companies Halliburton and Canadian Natural Resources hindered returns.
Given the fund’s focus on investing in dividend-paying stocks, lower-than-index investments and stock selection in information technology were a drag on relative returns. On a country basis, lower-than-index investments in U.S. domiciled companies also detracted from the fund’s relative returns.
The fund’s portfolio managers are keeping a close watch on the U.S. economy, which continues to show modest economic growth. Portfolio managers continue to favor well-managed, high-quality companies that are capable of generating positive cash flow in myriad economic environments and remain optimistic that our global research will help us identify attractive long-term investment opportunities.
Percent of net assets
Largest individual
equity securities
AbbVie | 5.52 | % | ||
Amgen | 4.59 | |||
Verizon Communications | 4.43 | |||
JPMorgan Chase | 4.00 | |||
Wells Fargo | 3.40 |
Prudential Financial | 3.22 | % | ||
Apple | 3.22 | |||
Altria | 3.15 | |||
Intel | 2.84 | |||
Texas Instruments | 2.28 |
| 14 | American Funds Insurance Series |
Blue Chip Income and Growth Fund
Average annual
total returns based on
a $1,000 investment
For periods ended June 30, 2017
| 6 months | 1 year | 5 years | 10 years | Lifetime (since July 5, 2001) | Expense ratio | |||||||
Class 1 | 5.82% | 14.53% | 14.71% | 6.50% | 6.38% | .41% | ||||||
Class 1A | 5.74 | 14.30 | 14.43 | 6.24 | 6.12 | .662 | ||||||
Class 2 | 5.76 | 14.24 | 14.43 | 6.24 | 6.12 | .66 | ||||||
Class 4 | 5.52 | 13.88 | 14.26 | 6.03 | 5.89 | .91 |
Investment results assume all distributions are reinvested and reflect applicable fees and expenses. The fund’s investment adviser waived a portion of its management fees from September 1, 2004, through December 31, 2008, and from February 1, 2014, through January 31, 2015. Applicable fund results shown reflect the waiver, without which they would have been lower. Expense ratios are as of the fund’s prospectus dated May 1, 2017. See the Financial Highlights table in this report for details.
Any market index shown is unmanaged and, therefore, has no expenses. Investors cannot invest directly in an index.
1Source: S&P Dow Jones Indices LLC.
2Based on estimated amounts for the current fiscal year.
Percent of net assets
Where the fund’s
assets were
invested as of
June 30, 2017
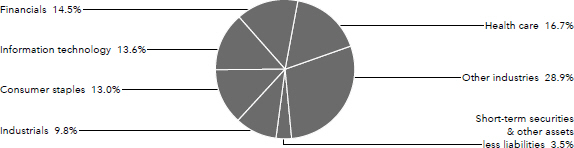
| American Funds Insurance Series | 15 |
Global Growth and Income Fund
Fund results shown are for past periods and are not predictive of results for future periods. Current and future results may be lower or higher than those shown. Unit prices and returns will vary, so investors may lose money. For current information and month-end results, visit americanfunds.com/afis. For information about your insurance contract and month-end results, go to the website of the company that issued your contract.
Global Growth and Income Fund gained 14.70% for the six months ended June 30, 2017, in line with the MSCI ACWI (All Country World Index),1 which rose 11.48%.
Global stocks rallied amid strong corporate earnings and improving economic data in the U.S., Europe and Japan. Several key market indexes hit a series of new highs, despite political uncertainty. U.S. equity markets surged in anticipation of lower regulation and tax cuts, led by information technology stocks. European stocks also climbed higher despite the U.K’s pivotal vote to leave the European Union. Markets cheered Emmanuel Macron’s victory in the French presidential election as the centrist leader pledged to keep France in the European Union. Emerging markets enjoyed strong returns as well, buoyed by strong earnings growth of technology companies.
Several sectors, led by information technology, made positive contributions to the fund’s returns. The fund’s holdings in Nintendo, Broadcom and TSMC were among the top contributors to results. Nintendo shares soared to an eight-year high on optimism that more third-party developers would create games for the company’s new flagship console. Semiconductor manufacturer TSMC rose, fueled by higher demand for smartphone microchips and optimism over demand for Apple’s next iPhone. Semiconductor manufacturer Broadcom also rose as the company’s second-quarter earnings topped analyst estimates.
Exposure to the energy sector was a drag on the fund’s returns. Among the fund’s top detractors to returns were Helmerich & Payne, BP and Royal Dutch Shell, which slid as oil prices declined on concerns of oversupply.
The fund’s cash position enables portfolio managers to better navigate a challenging environment by focusing on opportunities when stock prices are favorable. The fund’s portfolio managers are also optimistic they can uncover promising long-term investment opportunities, and companies with sustainable dividends and income.
Percent of net assets
Country diversification
The Americas | ||||
United States | 35.4 | % | ||
Mexico | 3.5 | |||
Canada | 2.3 | |||
Brazil | 1.6 | |||
Argentina | .3 | |||
|
| |||
| 43.1 | ||||
|
| |||
Europe | ||||
United Kingdom | 12.5 | |||
Switzerland | 4.9 | |||
France | 4.2 | |||
Germany | 3.9 | |||
Denmark | 1.2 | |||
Europe (continued) | ||||
Ireland | 1.2 | % | ||
Other | 2.1 | |||
|
| |||
| 30.0 | ||||
|
| |||
Asia/Pacific Basin | ||||
Japan | 8.2 | |||
Taiwan | 5.0 | |||
India | 2.7 | |||
China | 2.0 | |||
Australia | 1.2 | |||
Other | 2.7 | |||
|
| |||
| 21.8 | ||||
|
| |||
Short-term securities & other assets less liabilities | 5.1 | % | ||
|
| |||
Total | 100.0 | % | ||
|
| |||
Percent of net assets
Largest individual
equity securities
Nintendo | 4.81 | % | ||
British American Tobacco | 4.03 | |||
TSMC | 3.36 | |||
Microsoft | 3.23 | |||
Nestlé | 2.51 |
UnitedHealth Group | 2.44 | % | ||
Broadcom | 2.26 | |||
Airbus Group SE | 1.98 | |||
IEnova | 1.73 | |||
Murata Manufacturing | 1.44 |
| 16 | American Funds Insurance Series |
Global Growth and Income Fund
Average annual
total returns based on
a $1,000 investment
For periods ended June 30, 2017
| 6 months | 1 year | 5 years | 10 years | Lifetime (since May 1, 2006) | Expense ratio | |||||||
Class 1 | 14.88% | 21.35% | 12.12% | 5.61% | 6.72% | .63% | ||||||
Class 1A | 14.87 | 21.20 | 11.87 | 5.36 | 6.46 | .882 | ||||||
Class 2 | 14.70 | 21.02 | 11.85 | 5.34 | 6.45 | .88 | ||||||
Class 4 | 14.58 | 20.71 | 11.61 | 5.10 | 6.20 | 1.13 |
Investment results assume all distributions are reinvested and reflect applicable fees and expenses. The fund’s investment adviser waived a portion of its management fees from May 1, 2006, through December 31, 2008. Applicable fund results shown reflect the waiver, without which they would have been lower. Expense ratios are as of the fund’s prospectus dated May 1, 2017. See the Financial Highlights table in this report for details.
Any market index shown is unmanaged and, therefore, has no expenses. Investors cannot invest directly in an index.
1Source MSCI. The MSCI index result reflects dividends net of withholding taxes and reinvestment of distributions.
2Based on estimated amounts for the current fiscal year.
Percent of net assets
Where the fund’s
assets were
invested as of
June 30, 2017
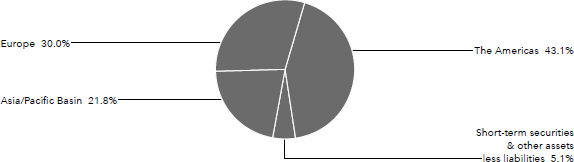
| American Funds Insurance Series | 17 |
Growth-Income Fund
Fund results shown are for past periods and are not predictive of results for future periods. Current and future results may be lower or higher than those shown. Unit prices and returns will vary, so investors may lose money. For current information and month-end results, visit americanfunds.com/afis. For information about your insurance contract and month-end results, go to the website of the company that issued your contract.
Growth-Income Fund gained 9.77% for the six months ended June 30, 2017. Standard & Poor’s 500 Composite Index,1 a market capitalization-weighted index based on the results of approximately 500 widely held common stocks, rose 9.34%.
U.S. stocks rose to new highs led by strong corporate earnings and improving economic sentiment, as well as the anticipation of fewer regulations and more tax cuts. Positive economic data on employment and industrial production bolstered optimism in the economy. Information technology stocks advanced, led by tech giants such as Alphabet and Apple, amid growing optimism over consumer demand. Defensive sectors also rose, led by health care and consumer staples.
Regarding the fund, stock selection and an overweight position in consumer discretionary contributed most to the fund’s returns. Among the fund’s top contributors to results (posting double-digit gains) was consumer discretionary company Amazon. An increase in revenue from Amazon Web Services contributed to the company’s strong first-quarter earnings.
The fund’s weakest sector on an absolute basis was energy, impacted by persistent oversupply concerns that continued to drive oil prices lower. Investments in the telecommunication services sector also hindered returns and Verizon Communications was among the top detractors as the company reported first-quarter earnings that missed analyst expectations.
The portfolio managers exercise some caution when considering the potential impact on the U.S. economy and markets that could result from the new administration’s lack of success so far in various reforms. Should uncertainty eventually result in increased volatility, the fund’s healthy cash position can give portfolio managers an opportunity to invest in companies with more favorable valuations for the long term. The portfolio managers remain confident in our robust research process and its ability to identify attractive investments.
Percent of net assets
Largest individual
equity securities
Amazon | 3.64 | % | ||
Microsoft | 2.24 | |||
Alphabet | 2.21 | |||
Netflix | 1.97 | |||
AbbVie | 1.94 |
Amgen | 1.74 | % | ||
Verizon Communications | 1.71 | |||
Texas Instruments | 1.63 | |||
Broadcom | 1.53 | |||
JPMorgan Chase | 1.46 |
| 18 | American Funds Insurance Series |
Growth-Income Fund
Average annual
total returns based on
a $1,000 investment
For periods ended June 30, 2017
| 6 months | 1 year | 5 years | 10 years | Lifetime (since February 8, 1984) | Expense ratio | |||||||
Class 1 | 9.90% | 19.02% | 15.01% | 6.72% | 11.27% | .29% | ||||||
Class 1A | 9.85 | 18.82 | 14.74 | 6.46 | 10.99 | .542 | ||||||
Class 2 | 9.77 | 18.70 | 14.72 | 6.45 | 10.96 | .54 | ||||||
Class 3 | 9.83 | 18.82 | 14.80 | 6.53 | 11.07 | .47 | ||||||
Class 4 | 9.64 | 18.43 | 14.47 | 6.20 | 10.72 | .79 |
Investment results assume all distributions are reinvested and reflect applicable fees and expenses. The fund’s investment adviser waived a portion of its management fees from September 1, 2004, through December 31, 2008. Applicable fund results shown reflect the waiver, without which they would have been lower. Expense ratios are as of the fund’s prospectus dated May 1, 2017. See the Financial Highlights table in this report for details.
Any market index shown is unmanaged and, therefore, has no expenses. Investors cannot invest directly in an index.
1Source: S&P Dow Jones Indices LLC.
2Based on estimated amounts for the current fiscal year.
Percent of net assets
Where the fund’s
assets were
invested as of
June 30, 2017
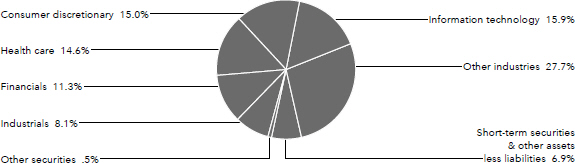
| American Funds Insurance Series | 19 |
International Growth and Income Fund
Fund results shown are for past periods and are not predictive of results for future periods. Current and future results may be lower or higher than those shown. Unit prices and returns will vary, so investors may lose money. For current information and month-end results, visit americanfunds.com/afis. For information about your insurance contract and month-end results, go to the website of the company that issued your contract.
International Growth and Income Fund rose 15.48% for the six months ended June 30, 2017, while the MSCI ACWI (All Country World Index) ex USA1 gained 14.10%.
Strong corporate earnings and improving economic data in the U.S., Europe and Japan, with a backdrop of supportive global monetary policy, helped to diminish investors’ concerns about increasing populism and geopolitical uncertainty. Information technology stocks led U.S. markets higher, as the share price of U.S. tech giants Apple and Alphabet advanced. European stocks also climbed higher despite the U.K’s pivotal vote to leave the European Union. Markets cheered Emmanuel Macron’s victory in the French presidential election as the centrist leader pledged to keep France in the European Union. Emerging markets enjoyed strong returns buoyed by strong earnings from technology companies.
The top contributor to the fund’s results was the financials sector. HDFC Bank surged after the company reported a more than 18% increase in fourth-quarter profits as the bank continued to gain market share from state-owned banks. HDFC Bank was among the top contributors to the fund’s returns. On the downside, investments in the energy sector detracted from returns as the price of crude oil slipped on concerns of oversupply. Among stock investments, Teva Pharmaceutical dragged down results as the company missed first-quarter revenue expectations.
By region, holdings in the U.S., India and Hong Kong contributed to relative returns, and holdings in China, Israel and Sweden were a drag on relative returns.
As geopolitics weigh on investor sentiment, the fund’s portfolio managers are optimistic that our global research and the fund’s flexible mandate can help us identify attractive investment opportunities.
Percent of net assets
Country diversification
Europe | ||||
United Kingdom | 21.0 | % | ||
France | 6.9 | |||
Switzerland | 4.9 | |||
Spain | 3.9 | |||
Germany | 2.4 | |||
Portugal | 2.0 | |||
Netherlands | 1.8 | |||
Italy | 1.8 | |||
Denmark | 1.6 | |||
Other | 3.4 | |||
|
| |||
| 49.7 | ||||
|
| |||
Asia/Pacific Basin | ||||
Hong Kong | 7.4 | |||
Japan | 4.7 | |||
Asia/Pacific Basin (continued) |
| |||
South Korea | 3.9 | % | ||
China | 3.8 | |||
India | 3.5 | |||
Taiwan | 2.9 | |||
Thailand | 1.9 | |||
Australia | 1.2 | |||
Other | .4 | |||
|
| |||
| 29.7 | ||||
|
| |||
The Americas | ||||
United States | 2.6 | |||
Brazil | 1.6 | |||
Canada | 1.3 | |||
Other | .8 | |||
|
| |||
| 6.3 | ||||
|
| |||
Other regions | ||||
Israel | 2.1 | % | ||
Other | .6 | |||
|
| |||
| 2.7 | ||||
|
| |||
Short-term securities & other assets less liabilities | 11.6 | |||
|
| |||
Total | 100.0 | % | ||
|
| |||
Percent of net assets
Largest individual
equity securities
HDFC Bank | 3.52 | % | ||
Royal Dutch Shell | 3.37 | |||
Imperial Brands | 2.39 | |||
TSMC | 2.32 | |||
Cheung Kong Property Holdings | 2.18 |
Samsung Electronics | 2.06 | % | ||
Novartis | 2.06 | |||
Shanghai International Airport Co., Ltd., Class A | 2.05 | |||
Capita PLC | 2.00 | |||
Teva Pharmaceutical Industries Ltd. (ADR) | 1.88 |
| 20 | American Funds Insurance Series |
International Growth and Income Fund
Average annual
total returns based on
a $1,000 investment
For periods ended June 30, 2017
| 6 months | 1 year | 5 years | Lifetime (since November 18, 2008) | Expense ratio | ||||||
Class 1 | 15.54% | 16.13% | 7.19% | 9.97% | .68% | |||||
Class 1A | 15.53 | 15.98 | 6.95 | 9.71 | .932 | |||||
Class 2 | 15.48 | 15.89 | 6.93 | 9.70 | .93 | |||||
Class 4 | 15.29 | 15.52 | 6.74 | 9.46 | 1.18 |
Investment results assume all distributions are reinvested and reflect applicable fees and expenses. The fund’s investment adviser waived a portion of its management fees from November 18, 2008, through December 31, 2008. Applicable fund results shown reflect the waiver, without which they would have been lower. Expense ratios are as of the fund’s prospectus dated May 1, 2017. See the Financial Highlights table in this report for details.
Any market index shown is unmanaged and, therefore, has no expenses. Investors cannot invest directly in an index.
1Source: MSCI. The MSCI index result reflects dividends net of withholding taxes and reinvestment of distributions.
2Based on estimated amounts for the current fiscal year.
Percent of net assets
Where the fund’s
assets were
invested as of
June 30, 2017
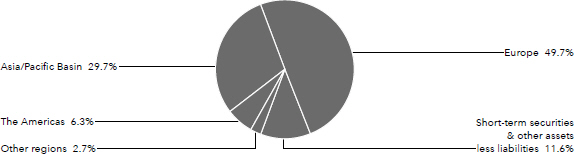
| American Funds Insurance Series | 21 |
Capital Income Builder®
Fund results shown are for past periods and are not predictive of results for future periods. Current and future results may be lower or higher than those shown. Unit prices and returns will vary, so investors may lose money. For current information and month-end results, visit americanfunds.com/afis. For information about your insurance contract and month-end results, go to the website of the company that issued your contract.
Capital Income Builder, a mix of stocks and bonds, rose 8.15% for the six months ended June 30, 2017. During the same period, the MSCI ACWI (All Country World Index)1 rose 11.48%. The Bloomberg Barclays U.S. Aggregate Index2 gained 2.27%. The index blend of 70%/30% MSCI ACWI/Bloomberg Barclays U.S. Aggregate Index3 rose 8.65%. The Lipper Global Equity Income Funds Average4 a measure of similar funds, increased 8.92%.
Global stocks rose amid strong corporate earnings and improving economic data in the U.S., Europe and Japan. Several key market indexes hit a series of new highs. U.S. equity markets surged in anticipation of lower regulation and tax cuts. Information technology stocks led markets higher. European stocks climbed higher despite the U.K’s pivotal vote to leave the European Union. Markets cheered Emmanuel Macron’s victory in the French presidential election as the centrist leader pledged to keep France in the European Union.
In the equity portfolio, the top contributor to the fund’s returns was the consumer staples sector due in part to good stock selection. Consumer staples company Philip Morris International was among the top contributors to returns, as the company reached record highs and registered double-digit gains. The fund’s fixed income holdings also rose on an absolute basis, contributing to the fund’s objective of generating a stream of income for its investors.
Given the fund’s focus on investing in stocks that pay dividends, we did not hold non-yielding information technology stocks that were strong in the first half. This hindered relative returns. Investments in the energy sector were also a detractor as the price of oil declined due to concerns of oversupply. Energy exploration and production company Helmerich & Payne and oil transportation company Inter Pipeline detracted from the fund’s returns.
The fund’s portfolio managers are keeping a close watch on the U.S. economy, which continues to show modest economic growth. Portfolio managers continue to maintain an overweight position in defensive sectors such as consumer staples, telecommunication services and utilities. They continue to search for companies dedicated to both paying dividends and increasing them over time to meet the fund’s objectives of providing above-average and growing income.
Percent of net assets
Country diversification
The Americas | ||||
United States | 51.4 | % | ||
Canada | 2.3 | |||
|
| |||
| 53.7 | ||||
|
| |||
Europe | ||||
United Kingdom | 15.3 | |||
France | 3.3 | |||
Switzerland | 2.8 | |||
Sweden | 2.5 | |||
Finland | 2.2 | |||
Italy | 1.9 | |||
Other | 3.5 | |||
|
| |||
| 31.5 | ||||
|
| |||
Asia/Pacific Basin | ||||
Hong Kong | 2.1 | % | ||
Singapore | 1.9 | |||
Australia | 1.8 | |||
Taiwan | 1.6 | |||
Other | 1.9 | |||
|
| |||
| 9.3 | ||||
|
|
Other regions | ||||
United Arab Emirates | .2 | % | ||
|
| |||
Short-term securities & other assets less liabilities | 5.3 | |||
|
| |||
Total | 100.0 | % | ||
|
| |||
| 22 | American Funds Insurance Series |
Capital Income Builder
Average annual
total returns based on
a $1,000 investment
For periods ended June 30, 2017
| 6 months | 1 year | Lifetime (since May 1, 2014) | Expense ratio | |||||
Class 1 | 8.27% | 6.94% | 3.51% | .54% | ||||
Class 1A | 8.12 | 6.65 | 3.24 | .805 | ||||
Class 2 | 8.15 | 6.73 | 3.44 | .80 | ||||
Class 4 | 7.92 | 6.43 | 2.99 | 1.04 |
Investment results assume all distributions are reinvested and reflect applicable fees and expenses. Expense ratios are as of the fund’s prospectus dated May 1, 2017. See the Financial Highlights table in this report for details.
Any market index shown is unmanaged and, therefore, has no expenses. Investors cannot invest directly in an index.
1Source: MSCI. The MSCI index result reflects dividends net of withholding taxes and reinvestment of distributions.
2Source: Bloomberg Index Services Ltd.
3Data sources: MSCI and Bloomberg Index Services Ltd. The 70%/30% MSCI ACWI/Bloomberg Barclays U.S. Aggregate Index blends the MSCI ACWI (All Country World Index) with the Bloomberg Barclays U.S. Aggregate Index by weighting their total returns at 70% and 30%, respectively. Its result assumes the blend is rebalanced monthly.
4Source: Thomson Reuters Lipper.
5Based on estimated amounts for the current fiscal year.
Percent of net assets
Where the fund’s
assets were
invested as of
June 30, 2017
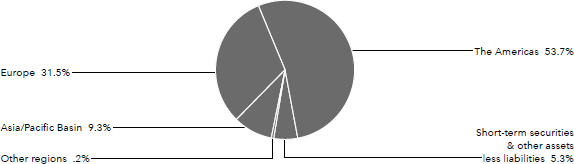
| American Funds Insurance Series | 23 |
Asset Allocation Fund
Fund results shown are for past periods and are not predictive of results for future periods. Current and future results may be lower or higher than those shown. Unit prices and returns will vary, so investors may lose money. For current information and month-end results, visit americanfunds.com/afis. For information about your insurance contract and month-end results, go to the website of the company that issued your contract.
Asset Allocation Fund, which is a mix of stocks and bonds, rose 8.17% for the six months ended June 30, 2017. Standard & Poor’s 500 Composite Index,1 the benchmark for the fund’s equity holdings, gained 9.34% over the same period, while the Bloomberg Barclays U.S. Aggregate Index,2 which measures investment-grade U.S. bonds (rated BBB/Baa and above), rose 2.27%. A blend of the two indexes, the 60%/40% S&P 500/Bloomberg Barclays U.S. Aggregate Index,3 advanced 6.48%.
U.S. stocks rose to new highs led by strong corporate earnings and improving economic sentiment. Positive economic data on employment and industrial production bolstered optimism in the economy. Information technology stocks advanced, led by tech giants such as Alphabet, Facebook and Apple, amid growing optimism over consumer demand. Defensive sectors also rose, led by health care and consumer staples. Bonds also advanced, led by U.S. long credit.
Investments in the information technology and consumer staples sectors boosted the fund’s returns. Consumer staples company Philip Morris International climbed to record highs and was the top contributor to results. Holdings in the energy sector detracted the most from the fund’s returns as oil prices slumped. Noble Energy and Weatherford International slid amid investor concerns about a glut of crude oil.
The fund’s relatively defensive interest rate exposure compared to its fixed income benchmark was additive to results. Federal agency mortgage-backed securities also accounted for gains.
The fund’s portfolio managers are keeping a close watch on the U.S. economy, which continues to show modest economic growth. They continue to favor well-managed companies that are capable of generating positive cash flow and dividend income for investors in myriad economic environments. The fund’s cash position allows portfolio managers to remain flexible and better navigate uncertainty by focusing on opportunities when stock prices are favorable.
Percent of net assets
Largest individual
equity securities
Microsoft | 3.15 | % | ||
TSMC | 2.55 | |||
Philip Morris International | 2.38 | |||
Comcast | 2.02 | |||
UnitedHealth Group | 1.91 |
JPMorgan Chase | 1.70 | % | ||
Lockheed Martin | 1.67 | |||
Johnson & Johnson | 1.60 | |||
Chubb | 1.51 | |||
DuPont | 1.50 |
| 24 | American Funds Insurance Series |
Asset Allocation Fund
Average annual
total returns based on
a $1,000 investment
For periods ended June 30, 2017
| 6 months | 1 year | 5 years | 10 years | Lifetime (since August 1,1989) | Expense ratio | |||||||
Class 1 | 8.28% | 13.41% | 11.27% | 6.26% | 8.57% | .29% | ||||||
Class 1A | 8.23 | 13.21 | 11.01 | 6.00 | 8.30 | .544 | ||||||
Class 2 | 8.17 | 13.16 | 10.99 | 5.99 | 8.29 | .54 | ||||||
Class 3 | 8.20 | 13.25 | 11.08 | 6.07 | 8.37 | .47 | ||||||
Class 4 | 8.02 | 12.89 | 10.82 | 5.77 | 8.05 | .79 |
Investment results assume all distributions are reinvested and reflect applicable fees and expenses. The fund’s investment adviser waived a portion of its management fees from September 1, 2004, through December 31, 2008. Applicable fund results shown reflect the waiver, without which they would have been lower. Expense ratios are as of the fund’s prospectus dated May 1, 2017. See the Financial Highlights table in this report for details.
Any market index shown is unmanaged and, therefore, has no expenses. Investors cannot invest directly in an index.
1Source: S&P Dow Jones Indices LLC.
2Source: Bloomberg Index Services Ltd.
3Data sources: S&P Dow Jones Indices LLC and Bloomberg Index Services Ltd. The 60%/40% S&P 500/Bloomberg Barclays U.S. Aggregate Index blends the S&P 500 with the Bloomberg Barclays U.S. Aggregate Index by weighting their total returns at 60% and 40%, respectively. Its result assumes the blend is rebalanced monthly.
4Based on estimated amounts for the current fiscal year.
Percent of net assets
Where the fund’s
assets were
invested as of
June 30, 2017
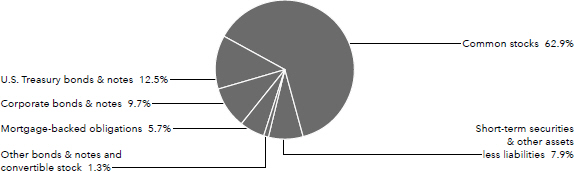
| American Funds Insurance Series | 25 |
Global Balanced Fund
Fund results shown are for past periods and are not predictive of results for future periods. Current and future results may be lower or higher than those shown. Unit prices and returns will vary, so investors may lose money. For current information and month-end results, visit americanfunds.com/afis. For information about your insurance contract and month-end results, go to the website of the company that issued your contract.
Global Balanced Fund rose 11.12% for the six months ended June 30, 2017. The MSCI ACWI (All Country World Index),1 which measures global stocks, gained 11.48%, while the Bloomberg Barclays Global Aggregate Index,2 a measure of investment-grade bonds (rated BBB/Baa and above), increased 4.41%. The 60%/40% MSCI ACWI/ Bloomberg Barclays Global Aggregate Index3 rose 8.61%.
Several key market indexes hit a series of new highs as the U.S. continued to demonstrate slow and steady economic expansion. The Federal Reserve raised the benchmark federal funds rate by a quarter percentage point twice this year, reassuring investors of persistent U.S. economic strength.
Overseas, European stocks rose despite political turmoil ahead of pivotal elections in the U.K. and France that served as referendums on the future of Europe. Markets cheered Emmanuel Macron’s victory as the centrist leader pledged to keep France in the European Union. Emerging markets also enjoyed some of the best results with solid gains across Asia.
Strong selection and larger-than-index investments in consumer staples were beneficial and contributed the most to the fund’s returns. Consumer staples company British American Tobacco was among the fund’s top contributors to returns (posting double-digit gains). British American Tobacco rose as the company’s vaping business gained market share in Europe. The company expected that a weak pound would have a positive impact on the company’s profits repatriated to the U.K. Consumer staples company Philip Morris International also boosted the fund’s results, as the company’s shares reached record highs.
Larger-than-index investments in the energy sector were a detractor, hurt by concerns of an oversupply of crude oil that drove oil prices lower. Energy exploration and production companies LUKOIL PJSC and ConocoPhillips, oil-field services company Schlumberger and energy delivery company Enbridge were among the top detractors.
In fixed income, above-benchmark investments in Mexican debt and lower-than-index investments in euro-denominated debt contributed to relative returns. Exposure to select currencies, such as the Polish zloty, was also additive to relative results.
The fund’s portfolio managers exercise caution amid geopolitical uncertainty and continue to stay the course of focusing on global research and bottom-up analysis. As valuations for many companies are up, security selection is particularly important at this point in the market cycle. Portfolio managers continue to monitor changes in consumer behavior, the democratization of technology and e-commerce that present opportunities in the consumer staples sector for long-term investors.
| Percent of net assets | Percent of net assets | |||||||||||
Largest sectors | Information technology | 12.5% | Largest fixed income | U.S. Treasury | 8.5% | |||||||
in common stock | Consumer staples | 7.9 | holdings (by issuer) | Japanese Government | 2.7 | |||||||
holdings | Industrials | 7.4 | Polish Government | 1.4 | ||||||||
Financials | 6.6 | Mexican Government | 1.2 | |||||||||
| Health care | 5.7 | Spanish Government | .8 | |||||||||
26 | American Funds Insurance Series |
Global Balanced Fund
Percent of net assets
Currency
diversification
Equity securities | Bonds & | Forward currency contracts | Short-term securities & other assets less liabilities | Total | |||||||||||||||||||||
U.S. dollars | 32.9 | % | 16.7 | % | (.1 | )% | 6.0 | % | 55.5 | % | |||||||||||||||
Euros | 7.6 | 3.2 | 1.6 | - | 12.4 | ||||||||||||||||||||
British pounds | 6.9 | .9 | (.8 | ) | - | 7.0 | |||||||||||||||||||
Japanese yen | 3.4 | 2.7 | .8 | - | 6.9 | ||||||||||||||||||||
Swiss franc | 2.4 | - | - | - | 2.4 | ||||||||||||||||||||
Swedish kronor | 1.5 | - | .5 | - | 2.0 | ||||||||||||||||||||
Hong Kong dollars | 1.7 | - | - | - | 1.7 | ||||||||||||||||||||
New Taiwan dollars | 1.6 | - | - | - | 1.6 | ||||||||||||||||||||
Polish zloty | - | 1.4 | (.1 | ) | - | 1.3 | |||||||||||||||||||
Indian rupees | .6 | .7 | (.3 | ) | - | 1.0 | |||||||||||||||||||
Other currencies | 4.2 | 5.6 | (1.6 | ) | - | 8.2 | |||||||||||||||||||
|
| ||||||||||||||||||||||||
| 100.0 | % | ||||||||||||||||||||||||
|
| ||||||||||||||||||||||||
Percent of net assets
Largest individual
equity securities
Nintendo | 2.29 | % | ||
British American Tobacco | 1.98 | |||
Microsoft | 1.81 | |||
Humana | 1.73 | |||
ASML Holding | 1.61 |
TSMC | 1.57 | % | ||
JPMorgan Chase | 1.35 | |||
Merck | 1.29 | |||
Boeing | 1.26 | |||
Philip Morris International | 1.22 |
Average annual
total returns based on
a $1,000 investment
| For periods ended June 30, 2017 | ||||||||||||||||||||
| 6 months | 1 year | 5 years | Lifetime (since May 2, 2011) | Expense ratio | ||||||||||||||||
Class 1 | 11.19% | 12.47% | 7.36% | 5.67% | .72% | |||||||||||||||
Class 1A | 11.19 | 12.33 | 7.12 | 5.43 | .974 | |||||||||||||||
Class 2 | 11.12 | 12.22 | 7.11 | 5.42 | .97 | |||||||||||||||
Class 4 | 11.00 | 12.01 | 7.07 | 5.34 | 1.24 | |||||||||||||||
Investment results assume all distributions are reinvested and reflect applicable fees and expenses. Expense ratios are as of the fund’s prospectus dated May 1, 2017. See the Financial Highlights table in this report for details.
Any market index shown is unmanaged and, therefore, has no expenses. Investors cannot invest directly in an index.
1Source: MSCI. The MSCI index result reflects dividends net of withholding taxes and reinvestment of distributions.
2Source: Bloomberg Index Services Ltd.
3Data sources: MSCI and Bloomberg Index Services Ltd. The 60%/40% MSCI ACWI/Bloomberg Barclays Global Aggregate Index blends the MSCI ACWI (All Country World Index) with the Bloomberg Barclays Global Aggregate Index by weighting their cumulative total returns at 60% and 40%, respectively. Its result assumes the blend is rebalanced monthly.
4Based on estimated amounts for the current fiscal year.
Percent of net assets
Where the fund’s
assets were
invested as of
June 30, 2017
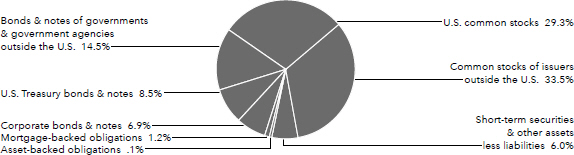
| American Funds Insurance Series | 27 |
Bond Fund
Fund results shown are for past periods and are not predictive of results for future periods. Current and future results may be lower or higher than those shown. Unit prices and returns will vary, so investors may lose money. For current information and month-end results, visit americanfunds.com/afis. For information about your insurance contract and month-end results, go to the website of the company that issued your contract.
Bond Fund gained 2.51% for the six months ended June 30, 2017, outpacing its benchmark, the Bloomberg Barclays U.S. Aggregate Index1 which rose 2.27%.
U.S. bond markets generated modest returns amid political uncertainty and a mixed global economy. The Federal Reserve raised the benchmark federal funds rate by a quarter percentage point twice this year, reassuring investors of persistent U.S. economic strength. The yield on the benchmark 10-year Treasury note fell 14 basis points to end the six-month period at 2.31%.
The fund had a modestly overweight duration relative to the benchmark, which generally helped returns as yields marginally declined. The fund also benefited from sector allocation, with U.S. high-yield securities contributing most to the fund.
On the whole, the U.S. economy appears to be in good shape and is expected to grow at a moderate pace. As U.S. interest rates increase, investors have the opportunity of reinvesting at higher yields. The fund’s portfolio managers expect continued investor demand for flight-to-safety assets and higher yields. Given uncertainty over how the Federal Reserve will reduce assets on its balance sheet, portfolio managers may experience periods of volatility in the months ahead. Nonetheless, they will continue to search the bond market for promising investment opportunities.
Percent of net assets
Largest holdings
(by issuer)
U.S. Treasury | 21.2 | % | ||
Freddie Mac | 10.8 | |||
Fannie Mae | 10.5 | |||
Ginnie Mae | 5.4 | |||
Mexican Government | 2.2 |
Japanese Government | 1.5 | % | ||
Portuguese Government | 1.4 | |||
State of Illinois | 1.1 | |||
Pemex | .9 | |||
Enbridge Energy Partners, LP | .9 |
| 28 | American Funds Insurance Series |
Bond Fund
Average annual
total returns based on
a $1,000 investment
For periods ended June 30, 2017
| 6 months | 1 year | 5 years | 10 years | Lifetime (since January 2, 1996) | Expense ratio | |||||||
Class 1 | 2.62% | .32% | 2.45% | 3.28% | 4.80% | .38% | ||||||
Class 1A | 2.52 | .10 | 2.20 | 3.03 | 4.54 | .632 | ||||||
Class 2 | 2.51 | .06 | 2.19 | 3.02 | 4.54 | .63 | ||||||
Class 4 | 2.29 | -.18 | 1.96 | 2.78 | 4.28 | .88 |
Investment results assume all distributions are reinvested and reflect applicable fees and expenses. The fund’s investment adviser waived a portion of its management fees from September 1, 2004, through December 31, 2008. Applicable fund results shown reflect the waiver, without which they would have been lower. Expense ratios are as of the fund’s prospectus dated May 1, 2017. See the Financial Highlights table in this report for details.
Any market index shown is unmanaged and, therefore, has no expenses. Investors cannot invest directly in an index.
1Source: Bloomberg Index Services Ltd.
2Based on estimated amounts for the current fiscal year.
Percent of net assets
Where the fund’s
assets were
invested as of
June 30, 2017
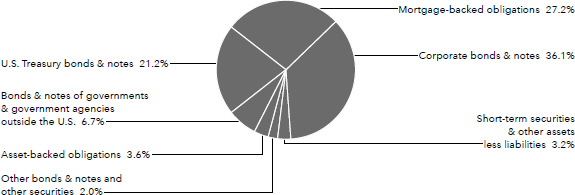
| American Funds Insurance Series | 29 |
Global Bond Fund
Fund results shown are for past periods and are not predictive of results for future periods. Current and future results may be lower or higher than those shown. Unit prices and returns will vary, so investors may lose money. For current information and month-end results, visit americanfunds.com/afis. For information about your insurance contract and month-end results, go to the website of the company that issued your contract.
Global Bond Fund rose 4.94% for the six months ended June 30, 2017, while the Bloomberg Barclays Global Aggregate Index1 rose 4.41%.
Global bond markets rose as a mixed global economy and political turmoil contributed to investor demand for perceived flight-to-safety assets and high quality credit. Although there was much optimism at the beginning of the year about U.S. fiscal policy designed to spur growth, uncertainty about fiscal expansion contributed to a weaker U.S. dollar. The Federal Reserve raised the benchmark federal funds rate by a quarter percentage point twice this year, reassuring investors of persistent U.S. economic strength. Global central banks kept monetary policy steady to remain flexible amid economic uncertainty. The yield on the benchmark 10-year Treasury note fell 14 basis points to end the period at 2.31%. Meanwhile, 10-year U.K. bonds traded at lower yields.
Low exposure to euro-denominated debt and Japanese debt combined with above-benchmark investments in Mexican debt contributed to relative returns. Exposure to select currencies, such as the Polish zloty and Hungarian forint, were also additive to relative results.
The fund’s portfolio managers maintain a cautious approach to investing in global bond markets, and believe that our global research can help identify attractive long-term investments around the world. Having the flexibility to diversify and adjust exposure by country, sector and currency continues to serve as a hallmark of the fund’s approach to global investing.
Percent of net assets
Currency weighting (after hedging) by country |
| ||||
United States2 | 48.6 | % | |||
Japan | 16.1 | ||||
Euro zone3 | 11.4 | ||||
United Kingdom | 3.6 | ||||
Poland | 2.8 | ||||
Norway | 2.1 | ||||
Sweden | 2.0 | ||||
Colombia | 1.3 | ||||
Mexico | 1.1 | ||||
India | 1.1 | ||||
Turkey | 1.1 | ||||
Denmark | .9 | ||||
Malaysia | .9 | ||||
Chile | .8 | ||||
Hungary | .5 | ||||
Thailand | .4 | ||||
Egypt | .3 | ||||
Argentina | .2 | ||||
Canada | .2 | ||||
Israel | .2 | ||||
Philippines | .1 | ||||
Other | 4.3 | ||||
|
| ||||
Total | 100.0 | % | |||
|
| ||||
Non-U.S. government bonds by country |
| |||||||
Euro zone3: | ||||||||
Germany | 3.5 | % | ||||||
Portugal | 2.4 | |||||||
Spain | 1.0 | |||||||
Italy | .8 | |||||||
Other | 2.5 | 10.2 | % | |||||
|
| |||||||
Japan | 9.1 | |||||||
Poland | 4.5 | |||||||
Mexico | 3.6 | |||||||
India | 2.5 | |||||||
Malaysia | 2.1 | |||||||
Norway | 1.7 | |||||||
Australia | 1.7 | |||||||
United Kingdom | 1.6 | |||||||
Colombia | 1.2 | |||||||
Other | 9.3 | |||||||
|
| |||||||
Total | 47.5 | % | ||||||
|
| |||||||
Percent of net assets
Largest holdings
(by issuer)
U.S. Treasury | 15.7 | % | ||
Japanese Government | 9.1 | |||
Polish Government | 4.5 | |||
Mexican Government | 3.6 | |||
German Government | 3.3 |
Indian Government | 2.4 | % | ||
Portuguese Government | 2.4 | |||
Malaysian Government | 2.1 | |||
Norwegian Government | 1.7 | |||
Australian Government | 1.7 |
| 30 | American Funds Insurance Series |
Global Bond Fund
Average annual
total returns based on a $1,000 investment
For periods ended June 30, 2017
| 6 months | 1 year | 5 years | 10 years | Lifetime (since October 4, 2006) | Expense ratio | |||||||
Class 1 | 5.09% | .14% | 1.32% | 4.06% | 4.21% | .57% | ||||||
Class 1A | 5.08 | .01 | 1.09 | 3.82 | 3.96 | .824 | ||||||
Class 2 | 4.94 | -.17 | 1.06 | 3.80 | 3.945 | .82 | ||||||
Class 4 | 4.88 | -.37 | .90 | 3.59 | 3.73 | 1.07 |
Investment results assume all distributions are reinvested and reflect applicable fees and expenses. The fund’s investment adviser waived a portion of its management fees from October 4, 2006, through December 31, 2008. Applicable fund results shown reflect the waiver, without which they would have been lower. Expense ratios are as of the fund’s prospectus dated May 1, 2017. See the Financial Highlights table in this report for details.
Any market index shown is unmanaged and, therefore, has no expenses. Investors cannot invest directly in an index.
1Source: Bloomberg Index Services Ltd.
2Includes U.S. dollar-denominated debt of other countries, totaling 13.9%.
3Countries using the euro as a common currency; those represented in the fund’s portfolio are Belgium, France, Germany, Greece, Ireland, Italy, Latvia, Lithuania, Luxembourg, the Netherlands, Slovenia and Spain.
4Based on estimated amounts for the current fiscal year.
5Global Bond Fund Class 2 shares were first sold on November 6, 2006. Results prior to that date are hypothetical based on Class 1 share results adjusted for estimated additional annual expenses of 0.25%.
Percent of net assets
Where the fund’s
assets were
invested as of
June 30, 217
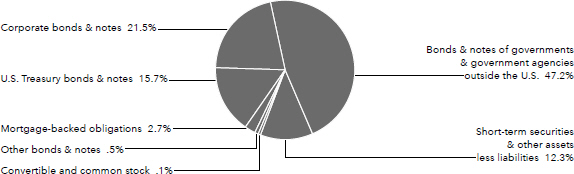
| American Funds Insurance Series | 31 |
High-Income Bond Fund
Fund results shown are for past periods and are not predictive of results for future periods. Current and future results may be lower or higher than those shown. Unit prices and returns will vary, so investors may lose money. For current information and month-end results, visit americanfunds.com/afis. For information about your insurance contract and month-end results, go to the website of the company that issued your contract.
High-Income Bond Fund gained 4.43% for the six months ended June 30, 2017. The fund’s benchmark, the Bloomberg Barclays U.S. Corporate High Yield 2% Issuer Capped Index,1 increased 4.92%.
Renewed investor expectations of more rapid economic growth led to higher interest rates as the Federal Reserve increased the benchmark federal funds rate in March and June of this year by a quarter percentage point each time. U.S. bond markets rose for the six-month period, led by U.S. long credit. The yield on the benchmark 10-year Treasury note fell 14 basis points to end the period at 2.31%, and the spread between U.S. corporate bonds and Treasuries declined by a modest 14 basis points.
The fund’s allocation to high-yield debt and exposure to short interest duration, or the fund’s relatively low sensitivity to interest rates compared with the benchmark, were additive to results. High-yield bond investments in the energy sector, however, detracted from returns as oil prices declined due to concerns of oversupply.
The fund’s portfolio managers believe current fundamentals support a constructive high-yield market environment. While we are monitoring the Federal Reserve’s tightening monetary policy, maturities in the high-yield market have tended to be shorter than some other markets, which should help dampen the effect of rising rates.
Percent of net assets
Largest holdings
(by issuer)
VRX | 2.8 | % | ||
Altice | 1.9 | |||
Cheniere Energy | 1.8 | |||
First Quantum Minerals | 1.7 | |||
Tenet Healthcare | 1.5 |
Sprint Nextel | 1.4 | % | ||
Chesapeake Energy | 1.4 | |||
AES | 1.3 | |||
Cliffs Natural Resources | 1.3 | |||
CCO Holdings LLC and CCO Holdings Capital | 1.3 |
| 32 | American Funds Insurance Series |
High-Income Bond Fund
Average annual
total returns based on
a $1,000 investment
For periods ended June 30, 2017
| 6 months | 1 year | 5 years | 10 years | Lifetime (since February 8, 1984) | Expense ratio | |||||||
Class 1 | 4.60% | 13.18% | 5.79% | 5.63% | 8.94% | .49% | ||||||
Class 1A | 4.60 | 13.03 | 5.56 | 5.38 | 8.67 | .742 | ||||||
Class 2 | 4.43 | 13.00 | 5.54 | 5.37 | 8.61 | .74 | ||||||
Class 3 | 4.46 | 12.94 | 5.59 | 5.44 | 8.74 | .67 | ||||||
Class 4 | 4.29 | 12.63 | 5.37 | 5.15 | 8.41 | .99 |
Investment results assume all distributions are reinvested and reflect applicable fees and expenses. The fund’s investment adviser waived a portion of its management fees from September 1, 2004, through December 31, 2008. Applicable fund results shown reflect the waiver, without which they would have been lower. Expense ratios are as of the fund’s prospectus dated May 1, 2017. See the Financial Highlights table in this report for details.
Any market index shown is unmanaged and, therefore, has no expenses. Investors cannot invest directly in an index.
1Source: Bloomberg Index Services Ltd.
2Based on estimated amounts for the current fiscal year.
Percent of net assets
Where the fund’s
assets were
invested as of
June 30, 2017
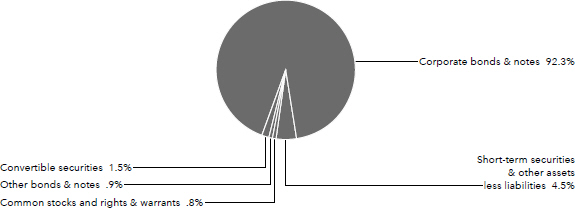
| American Funds Insurance Series | 33 |
Mortgage Fund
Fund results shown are for past periods and are not predictive of results for future periods. Current and future results may be lower or higher than those shown. Unit prices and returns will vary, so investors may lose money. For current information and month-end results, visit americanfunds.com/afis. For information about your insurance contract and month-end results, go to the website of the company that issued your contract.
Mortgage Fund gained 1.37% for the six months ended June 30, 2017, while the Bloomberg Barclays U.S. Mortgage-Backed Securities Index1 rose 1.35%.
The Federal Reserve increased the benchmark federal funds overnight lending rate in March and June of this year by a quarter percentage point each time. Long maturity U.S. Treasury yields modestly declined, pushing their prices higher. The housing market continued to function smoothly as home sales rose modestly and home prices increased about 5% on a year-over-year basis.
The fund’s investments in the agency mortgage-backed securities sector, inflation linked treasury bonds and securitized debt were additive to relative returns. As the yield curve flattened, the fund’s curve positioning detracted from relative returns.
The fund’s portfolio managers seek to identify high-quality mortgage-backed securities based on our bottom-up approach to investing. In the current environment, demand for fiight-to-safety assets and the fund’s low correlation to equities should help investors navigate macroeconomic and geopolitical uncertainty and remain well diversified.
Percent of net assets
Breakdown of
mortgage-backed
obligations
30-year pass-throughs: | ||||||||
Ginnie Mae | 14.1 | % | ||||||
Fannie Mae | 6.8 | |||||||
Freddie Mac | 27.9 | 48.8 | % | |||||
|
| |||||||
Other | 13.2 | |||||||
|
| |||||||
Total | 62.0 | % | ||||||
|
|
| 34 | American Funds Insurance Series |
Mortgage Fund
Average annual
total returns based on
a $1,000 investment
For periods ended June 30, 2017
| 6 months | 1 year | 5 years | Lifetime (since May 2, 2011) | Expense ratio | ||||||
Class 1 | 1.51% | 1.12% | 2.17% | 2.83% | .46% | |||||
Class 1A | 1.41 | .89 | 1.92 | 2.58 | .712 | |||||
Class 2 | 1.37 | .85 | 1.91 | 2.58 | .71 | |||||
Class 4 | 1.25 | .62 | 1.78 | 2.41 | .96 |
Investment results assume all distributions are reinvested and reflect applicable fees and expenses. Expense ratios are as of the fund’s prospectus dated May 1, 2017. See the Financial Highlights table in this report for details.
Any market index shown is unmanaged and, therefore, has no expenses. Investors cannot invest directly in an index.
1Source: Bloomberg Index Services Ltd.
2Based on estimated amounts for the current fiscal year.
Percent of net assets
Where the fund’s
assets were
invested as of
June 30, 2017
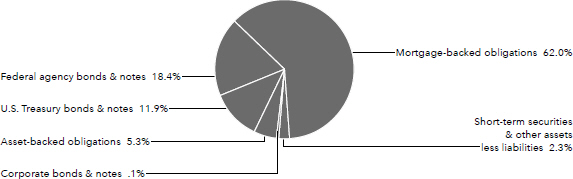
| American Funds Insurance Series | 35 |
Ultra-Short Bond Fund
Fund results shown are for past periods and are not predictive of results for future periods. Current and future results may be lower or higher than those shown. Unit prices and returns will vary, so investors may lose money. For current information and month-end results, visit americanfunds.com/afis. For information about your insurance contract and month-end results, go to the website of the company that issued your contract.
Ultra-Short Bond Fund gained 0.09% for the six months ended June 30, 2017, while the Bloomberg Barclays Short-Term Government/Corporate Index1 gained 0.43%.
The fund’s returns were higher than in 2016 as yields on three-month Treasury bills were up approximately 50 basis points since the end of last year. Short-term interest rates still remain near historically low levels.
The Federal Reserve raised the benchmark federal funds rate by a quarter percentage point twice this year, reassuring investors of persistent U.S. economic strength. Given these increases in interest rates, the fund’s portfolio managers believe the fund has the potential to provide current income.
| 36 | American Funds Insurance Series |
Ultra-Short Bond Fund
Average annual total returns based on a $1,000 investment
For periods ended June 30, 2017
| 6 months | 1 year | 5 years | 10 years | Lifetime (since February 8, 1984) | Expense ratio | |||||||
Class 1 | .27% | .36% | –.09% | .36% | 3.53% | .35% | ||||||
Class 1A | .26 | .23 | –.31 | .12 | 3.28 | .602 | ||||||
Class 2 | .09 | –.00 | –.36 | .09 | 3.24 | .60 | ||||||
Class 3 | .18 | .09 | –.29 | .16 | 3.35 | .53 | ||||||
Class 4 | –.00 | –.18 | –.45 | –.08 | 3.04 | .85 | ||||||
Investment results assume all distributions are reinvested and reflect applicable fees and expenses. The fund’s investment adviser waived a portion of its management fees from September 1, 2004, through December 31, 2008. Applicable fund results shown reflect the waiver, without which they would have been lower. Expense ratios are as of the fund’s prospectus dated May 1, 2017. See the Financial Highlights table in this report for details.
Any market index shown is unmanaged and, therefore, has no expenses. Investors cannot invest directly in an index.
1 Source: Bloomberg Index Services Ltd.
2 Based on estimated amounts for the current fiscal year.
Percent of net assets
Where the fund’s assets were invested as of June 30, 2017
Commercial paper | 68.9 | % | ||
Federal agency discount notes | 24.8 | |||
Bonds & notes of governments & government agencies outside the U.S. | 3.2 | |||
U.S. Treasury bills | 3.2 | |||
Other assets less liabilities | (.1 | ) | ||
|
| |||
Total | 100.0 | % | ||
|
|
| American Funds Insurance Series | 37 |
U.S. Government/AAA-Rated Securities Fund
Fund results shown are for past periods and are not predictive of results for future periods. Current and future results may be lower or higher than those shown. Unit prices and returns will vary, so investors may lose money. For current information and month-end results, visit americanfunds.com/afis. For information about your insurance contract and month-end results, go to the website of the company that issued your contract.
U.S. Government/AAA-Rated Securities Fund gained 1.76% for the six months ended June 30, 2017, while the Bloomberg Barclays U.S. Government/Mortgage-Backed Securities Index1 rose 1.64%.
The Federal Reserve increased the benchmark federal funds rate by a quarter percentage point twice this year – moves that lend credence to the case for continued domestic growth and economic stability. U.S. government debt rose modestly. The yield on the benchmark 10-year Treasury note declined by 14 basis points over the six months to end the period at 2.31%.
Some of the major themes driving the markets in the first half of 2017 were concerns about global economic growth, geopolitical events such as elections in Europe, and recent weak consumer price inflation in the U.S.
During the period, the fund’s duration contributed to relative returns. The fund also benefited from sector allocation, with U.S. agency securities contributing to relative returns. As the yield curve flattened, yield curve positioning detracted from relative returns.
The fund strives to meet its objective of providing a high level of current income consistent with the preservation of capital. The fund’s portfolio managers have positioned the fund with the expectation that rate hikes over the next two to three years will be at a slower pace than is currently priced into the market. They believe this can lead to a steepening yield curve and higher inflation expectations.
Percent of net assets
Breakdown of mortgage-backed obligations
30-year pass-throughs: | ||||||||
Freddie Mac | 10.5 | % | ||||||
Fannie Mae | 13.2 | |||||||
Ginnie Mac | 8.1 | 31.8 | % | |||||
|
| |||||||
Other | 4.2 | |||||||
|
| |||||||
Total | 36.0 | % | ||||||
|
|
38 | American Funds Insurance Series |
U.S. Government/AAA-Rated Securities Fund
Average annual
total returns based on
a $1,000 investment
For periods ended June 30, 2017
| 6 months | 1 year | 5 years | 10 years | Lifetime (since December 2, 1985) | Expense ratio | |||||||
Class 1 | 1.87% | -.67% | 1.63% | 3.96% | 5.96% | .36% | ||||||
Class 1A | 1.86 | -.80 | 1.40 | 3.72 | 5.70 | .612 | ||||||
Class 2 | 1.76 | -.93 | 1.36 | 3.70 | 5.66 | .61 | ||||||
Class 3 | 1.83 | -.86 | 1.43 | 3.78 | 5.77 | .54 | ||||||
Class 4 | 1.62 | -1.24 | 1.21 | 3.49 | 5.45 | .86 |
Investment results assume all distributions are reinvested and reflect applicable fees and expenses. The fund’s investment adviser waived a portion of its management fees from September 1, 2004, through December 31, 2008, and from July 1, 2010, through December 31, 2010. Applicable fund results shown reflect the waiver, without which they would have been lower. Expense ratios are as of the fund’s prospectus dated May 1, 2017. See the Financial Highlights table in this report for details.
Any market index shown is unmanaged and, therefore, has no expenses. Investors cannot invest directly in an index.
1Source: Bloomberg Index Services Ltd.
2Based on estimated amounts for the current fiscal year.
Percent of net assets
Where the fund’s
assets were
invested as of
June 30, 2017
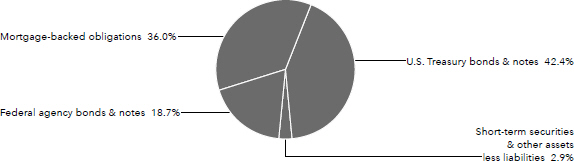
| American Funds Insurance Series | 39 |
Managed Risk Growth Fund
Fund results shown are for past periods and are not predictive of results for future periods. Current and future results may be lower or higher than those shown. Unit prices and returns will vary, so investors may lose money. For current information and month-end results, visit americanfunds.com/afis. For information about your insurance contract and month-end results, go to the website of the company that issued your contract.
Managed Risk Growth Fund gained 13.91% for the six months ended June 30, 2017. Standard & Poor’s 500 Managed Risk Index – Moderate Aggressive1 rose 7.89%. Standard & Poor’s 500 Composite Index,2 a market capitalization-weighted index based on the results of approximately 500 widely held common stocks, gained 9.34%.
The fund pursues its objective by investing in shares of American Funds Insurance Series – Growth FundSM while seeking to manage portfolio volatility and provide downside protection, primarily through the use of exchange-traded futures contracts. The benefit of the fund’s managed risk strategy should be most apparent during periods of high volatility and in down markets. In steady or rising markets, the fund’s results can be expected to lag those of the underlying fund.
While the underlying fund’s larger-than-index investments and strong stock selection in consumer discretionary and information technology added to returns, energy stocks detracted from the fund’s results.
Average annual total returns based on a $1,000 investment
For periods ended June 30, 2017
| 6 months | 1 year | Lifetime (since May 1, 2013) | Gross expense ratio | Net expense ratio | ||||||
Class P1 | 14.10% | 20.64% | 8.32% | .87% | .71% | |||||
Class P2 | 13.91 | 20.24 | 7.96 | 1.12 | .96 |
Investment results assume all distributions are reinvested and reflect applicable fees and expenses. Expense ratios, which are restated for Class P1 shares to reflect current fees, are as of the fund’s prospectus dated May 1, 2017. The investment adviser is currently waiving a portion of its management fee equal to 0.05% of the fund’s net assets. In addition, the investment adviser is currently reimbursing a portion of miscellaneous expenses. Investment results and net expense ratios shown reflect the waiver and reimbursement, without which the results would have been lower and the expenses would have been higher. This waiver and reimbursement will be in effect through at least May 1, 2018, unless modified or terminated by the fund’s board. The adviser may elect at its discretion to extend, modify or terminate the reimbursement at that time. The waiver may only be modified or terminated with the approval of the fund’s board. See the Financial Highlights table in this report for details.
Any market index shown is unmanaged and, therefore, has no expenses. Investors cannot invest directly in an index.
1Source: S&P Dow Jones Indices LLC. Standard & Poor’s Managed Risk Index Series is designed to simulate a dynamic protective portfolio that allocates between the underlying equity index and cash, based on realized volatilities of the underlying equity and bond indexes, while maintaining a fixed allocation to the underlying bond index. These indexes are generated and published under agreements between Standard & Poor’s Dow Jones Indices and Milliman Financial Risk Management LLC.
2Source: S&P Dow Jones Indices LLC.
Milliman Financial Risk Management LLC serves as the subadviser with respect to the management of the fund’s managed risk strategy.
| 40 | American Funds Insurance Series |
Managed Risk International Fund
Fund results shown are for past periods and are not predictive of results for future periods. Current and future results may be lower or higher than those shown. Unit prices and returns will vary, so investors may lose money. For current information and month-end results, visit americanfunds.com/afis. For information about your insurance contract and month-end results, go to the website of the company that issued your contract.
Managed Risk International Fund advanced 16.57% for the six months ended June 30, 2017, outpacing the Standard & Poor’s EPAC Ex. Korea LargeMidCap Managed Risk Index – Moderate Aggressive,1 which rose 11.59%. The MSCI ACWI (All Country World Index) ex USA2 rose 14.10%.
The fund pursues its objective by investing in shares of American Funds Insurance Series – International FundSM while seeking to manage portfolio volatility and provide downside protection, primarily through the use of exchange-traded futures contracts. The benefit of the fund’s managed risk strategy should be most apparent during periods of high volatility and in down markets. In steady or rising markets, the fund’s results can be expected to lag those of the underlying fund.
The underlying fund’s investments in the information technology sector contributed most to returns, while holdings in the energy sector hindered returns.
Average annual total returns based on a $1,000 investment
For periods ended June 30, 2017
| 6 months | 1 year | Lifetime (since May 1, 2013) | Gross expense ratio | Net expense ratio | ||||||
Class P1 | 16.87% | 17.80% | 2.40% | 1.05% | .89% | |||||
Class P2 | 16.57 | 17.37 | 2.00 | 1.30 | 1.14 |
Investment results assume all distributions are reinvested and reflect applicable fees and expenses. Expense ratios, which are restated for Class P1 shares to reflect current fees, are as of the fund’s prospectus dated May 1, 2017. The investment adviser is currently waiving a portion of its management fee equal to 0.05% of the fund’s net assets. In addition, the investment adviser is currently reimbursing a portion of miscellaneous expenses. Investment results and net expense ratios shown reflect the waiver and reimbursement, without which the results would have been lower and the expenses would have been higher. This waiver and reimbursement will be in effect through at least May 1, 2018, unless modified or terminated by the fund’s board. The adviser may elect at its discretion to extend, modify or terminate the reimbursement at that time. The waiver may only be modified or terminated with the approval of the fund’s board. See the Financial Highlights table in this report for details.
Any market index shown is unmanaged and, therefore, has no expenses. Investors cannot invest directly in an index.
1Source: S&P Dow Jones Indices LLC. Standard & Poor’s Managed Risk Index Series is designed to simulate a dynamic protective portfolio that allocates between the underlying equity index and cash, based on realized volatilities of the underlying equity and bond indexes, while maintaining a fixed allocation to the underlying bond index. These indexes are generated and published under agreements between Standard & Poor’s Dow Jones Indices and Milliman Financial Risk Management LLC.
2Source: MSCI. The MSCI index result reflects reinvestment of distributions and dividends net of withholding taxes.
Milliman Financial Risk Management LLC serves as the subadviser with respect to the management of the fund’s managed risk strategy.
| American Funds Insurance Series | 41 |
Managed Risk Blue Chip Income and Growth Fund
Fund results shown are for past periods and are not predictive of results for future periods. Current and future results may be lower or higher than those shown. Unit prices and returns will vary, so investors may lose money. For current information and month-end results, visit americanfunds.com/afis. For information about your insurance contract and month-end results, go to the website of the company that issued your contract.
Managed Risk Blue Chip Income and Growth Fund gained 5.11% for the six months ended June 30, 2017, trailing Standard & Poor’s 500 Managed Risk Index – Moderate Aggressive,1 which rose 7.89%. Standard & Poor’s 500 Composite Index,2 a market capitalization-weighted index based on the results of approximately 500 widely held common stocks, gained 9.34%.
The fund pursues its objective by investing in shares of American Funds Insurance Series – Blue Chip Income and Growth FundSM while seeking to manage portfolio volatility and provide downside protection, primarily through the use of exchange-traded futures contracts. The benefit of the fund’s managed risk strategy should be most apparent during periods of high volatility and in down markets. In steady or rising markets, the fund’s results can be expected to lag those of the underlying fund.
The underlying fund’s investments in industrials and consumer discretionary boosted fund results on a relative basis, while investments in the information technology sector were a drag on relative returns.
Average annual total returns based on a $1,000 investment
For periods ended June 30, 2017
| 6 months | 1 year | Lifetime (since May 1, 2013) | Gross expense ratio | Net expense ratio | ||||||
Class P1 | 5.37% | 12.31% | 7.60% | .92% | .76% | |||||
Class P2 | 5.11 | 11.89 | 7.21 | 1.17 | 1.01 |
Investment results assume all distributions are reinvested and reflect applicable fees and expenses. Expense ratios, which are restated for Class P1 shares to reflect current fees, are as of the fund’s prospectus dated May 1, 2017. The investment adviser is currently waiving a portion of its management fee equal to 0.05% of the fund’s net assets. In addition, the investment adviser is currently reimbursing a portion of miscellaneous expenses. Investment results and net expense ratios shown reflect the waiver and reimbursement, without which the results would have been lower and the expenses would have been higher. This waiver and reimbursement will be in effect through at least May 1, 2018, unless modified or terminated by the fund’s board. The adviser may elect at its discretion to extend, modify or terminate the reimbursement at that time. The waiver may only be modified or terminated with the approval of the fund’s board. See the Financial Highlights table in this report for details.
Any market index shown is unmanaged and, therefore, has no expenses. Investors cannot invest directly in an index.
1Source: S&P Dow Jones Indices LLC. Standard & Poor’s Managed Risk Index Series is designed to simulate a dynamic protective portfolio that allocates between the underlying equity index and cash, based on realized volatilities of the underlying equity and bond indexes, while maintaining a fixed allocation to the underlying bond index. These indexes are generated and published under agreements between Standard & Poor’s Dow Jones Indices and Milliman Financial Risk Management LLC.
2Source: S&P Dow Jones Indices LLC.
Milliman Financial Risk Management LLC serves as the subadviser with respect to the management of the fund’s managed risk strategy.
| 42 | American Funds Insurance Series |
Managed Risk Growth-Income Fund
Fund results shown are for past periods and are not predictive of results for future periods. Current and future results may be lower or higher than those shown. Unit prices and returns will vary, so investors may lose money. For current information and month-end results, visit americanfunds.com/afis. For information about your insurance contract and month-end results, go to the website of the company that issued your contract.
Managed Risk Growth-Income Fund gained 9.10% for the six months ended June 30, 2017, outpacing the Standard & Poor’s 500 Managed Risk Index – Moderate Aggressive,1 which rose 7.89%. Standard & Poor’s 500 Composite Index,2 a market capitalization-weighted index based on the results of approximately 500 widely held common stocks, gained 9.34%.
The fund pursues its objective by investing in shares of American Funds Insurance Series – Growth-Income FundSM while seeking to manage portfolio volatility and provide downside protection, primarily through the use of exchange-traded futures contracts. The benefit of the fund’s managed risk strategy should be most apparent during periods of high volatility and in down markets. In steady or rising markets, the fund’s results can be expected to lag those of the underlying fund.
The underlying fund’s stock selection and overweight position in consumer discretionary added the most to returns. The fund’s weakest sector on an absolute basis was energy, impacted by a decline in oil prices on concerns of oversupply.
Average annual total returns based on a $1,000 investment
For periods ended June 30, 2017
| 6 months | 1 year | Lifetime (since May 1, 2013) | Gross expense ratio | Net expense ratio | ||||||
Class P1 | 9.11% | 15.96% | 7.83% | .83% | .67% | |||||
Class P2 | 9.10 | 15.77 | 7.50 | 1.08 | .92 |
Investment results assume all distributions are reinvested and reflect applicable fees and expenses. Expense ratios, which are restated for Class P1 shares to reflect current fees, are as of the fund’s prospectus dated May 1, 2017. The investment adviser is currently waiving a portion of its management fee equal to 0.05% of the fund’s net assets. In addition, the investment adviser is currently reimbursing a portion of miscellaneous expenses. Investment results and net expense ratios shown reflect the waiver and reimbursement, without which the results would have been lower and the expenses would have been higher. This waiver and reimbursement will be in effect through at least May 1, 2018, unless modified or terminated by the fund’s board. The adviser may elect at its discretion to extend, modify or terminate the reimbursement at that time. The waiver may only be modified or terminated with the approval of the fund’s board. See the Financial Highlights table in this report for details.
Any market index shown is unmanaged and, therefore, has no expenses. Investors cannot invest directly in an index.
1Source: S&P Dow Jones Indices LLC. Standard & Poor’s Managed Risk Index Series is designed to simulate a dynamic protective portfolio that allocates between the underlying equity index and cash, based on realized volatilities of the underlying equity and bond indexes, while maintaining a fixed allocation to the underlying bond index. These indexes are generated and published under agreements between Standard & Poor’s Dow Jones Indices and Milliman Financial Risk Management LLC.
2Source: S&P Dow Jones Indices LLC.
Milliman Financial Risk Management LLC serves as the subadviser with respect to the management of the fund’s managed risk strategy.
| American Funds Insurance Series | 43 |
Managed Risk Asset Allocation Fund
Fund results shown are for past periods and are not predictive of results for future periods. Current and future results may be lower or higher than those shown. Unit prices and returns will vary, so investors may lose money. For current information and month-end results, visit americanfunds.com/afis. For information about your insurance contract and month-end results, go to the website of the company that issued your contract.
Managed Risk Asset Allocation Fund rose 7.43% for the six months ended June 30, 2017, beating the Standard & Poor’s 500 Managed Risk Index – Moderate,1 which rose 7.16%. Standard & Poor’s 500 Composite Index,2 a market capitalization-weighted index based on the results of approximately 500 widely held common stocks, gained 9.34%, while the Bloomberg Barclays U.S. Aggregate Index,3 which measures investment-grade U.S. bonds (rated BBB/Baa and above), rose 2.27%.
The fund pursues its objective by investing in shares of American Funds Insurance Series – Asset Allocation FundSM while seeking to manage portfolio volatility and provide downside protection, primarily through the use of exchange-traded futures contracts. The benefit of the fund’s managed risk strategy should be most apparent during periods of high volatility and in down markets. In steady or rising markets, the fund’s results can be expected to lag those of the underlying fund.
The underlying fund’s investments in the information technology sector contributed the most to absolute returns. Holdings in the energy sector hindered returns as oil prices slumped on concerns of oversupply.
Average annual total returns based on a $1,000 investment
For periods ended June 30, 2017
| 6 months | 1 year | Lifetime (since September 28, 2012) | Gross expense ratio | Net expense ratio | ||||||
Class P1 | 7.53% | 12.01% | 8.11% | .70% | .65% | |||||
Class P2 | 7.43 | 11.74 | 7.84 | .95 | .90 |
Investment results assume all distributions are reinvested and reflect applicable fees and expenses. Expense ratios are as of the fund’s prospectus dated May 1, 2017. The investment adviser is currently waiving a portion of its management fee equal to 0.05% of the fund’s net assets. Investment results and net expense ratios shown reflect the waiver, without which the results would have been lower and the expenses would have been higher. This waiver will be in effect through at least May 1, 2018, unless modified or terminated by the fund’s board. The waiver may only be modified or terminated with the approval of the fund’s board. See the Financial Highlights table in this report for details.
Any market index shown is unmanaged and, therefore, has no expenses. Investors cannot invest directly in an index.
1Source: S&P Dow Jones Indices LLC. Standard & Poor’s Managed Risk Index Series is designed to simulate a dynamic protective portfolio that allocates between the underlying equity index and cash, based on realized volatilities of the underlying equity and bond indexes, while maintaining a fixed allocation to the underlying bond index. These indexes are generated and published under agreements between Standard & Poor’s Dow Jones Indices and Milliman Financial Risk Management LLC.
2Source: S&P Dow Jones Indices LLC.
3Source: Bloomberg Index Services Ltd.
Milliman Financial Risk Management LLC serves as the subadviser with respect to the management of the fund’s managed risk strategy.
| 44 | American Funds Insurance Series |
| Summary investment portfolio June 30, 2017 | unaudited |
| Common stocks 97.12% | Shares | Value (000) | ||||||||
| Information | Taiwan Semiconductor Manufacturing Co., Ltd. | 27,614,000 | $ | 189,267 | ||||||
| technology | Taiwan Semiconductor Manufacturing Co., Ltd. (ADR) | 335,000 | 11,712 | |||||||
| 29.76% | Alphabet Inc., Class A1 | 140,400 | 130,527 | |||||||
Alphabet Inc., Class C1 | 71,052 | 64,567 | ||||||||
Nintendo Co., Ltd. | 516,200 | 172,931 | ||||||||
ASML Holding NV | 675,542 | 88,036 | ||||||||
ASML Holding NV (New York registered) | 643,900 | 83,907 | ||||||||
Facebook, Inc., Class A1 | 898,500 | 135,656 | ||||||||
Alibaba Group Holding Ltd. (ADR)1 | 781,050 | 110,050 | ||||||||
Microsoft Corp. | 1,380,000 | 95,123 | ||||||||
Visa Inc., Class A | 998,800 | 93,668 | ||||||||
Murata Manufacturing Co., Ltd. | 608,000 | 92,274 | ||||||||
Broadcom Ltd. | 392,200 | 91,402 | ||||||||
Samsung Electronics Co., Ltd. | 18,520 | 38,476 | ||||||||
Samsung Electronics Co., Ltd., nonvoting preferred | 18,500 | 30,107 | ||||||||
Tencent Holdings Ltd. | 1,800,000 | 64,369 | ||||||||
AAC Technologies Holdings Inc. | 4,418,540 | 55,236 | ||||||||
Just Eat PLC1 | 5,264,900 | 44,915 | ||||||||
Other securities | 148,947 | |||||||||
|
| |||||||||
| 1,741,170 | ||||||||||
|
| |||||||||
| Consumer | Amazon.com, Inc.1 | 297,100 | 287,593 | |||||||
| discretionary | Ulta Beauty, Inc.1 | 315,300 | 90,598 | |||||||
| 19.00% | Home Depot, Inc. | 513,000 | 78,694 | |||||||
Peugeot SA | 3,878,800 | 77,373 | ||||||||
Priceline Group Inc.1 | 39,000 | 72,950 | ||||||||
Industria de Diseño Textil, SA | 1,723,000 | 66,142 | ||||||||
McDonald’s Corp. | 293,000 | 44,876 | ||||||||
Naspers Ltd., Class N | 208,300 | 40,522 | ||||||||
Other securities | 352,875 | |||||||||
|
| |||||||||
| 1,111,623 | ||||||||||
|
| |||||||||
| Health care | Regeneron Pharmaceuticals, Inc.1 | 243,700 | 119,691 | |||||||
| 13.90% | UnitedHealth Group Inc. | 344,700 | 63,914 | |||||||
Bayer AG | 421,600 | 54,509 | ||||||||
Boston Scientific Corp.1 | 1,779,200 | 49,319 | ||||||||
Express Scripts Holding Co.1 | 720,200 | 45,978 | ||||||||
AstraZeneca PLC | 686,500 | 45,914 | ||||||||
Sartorius AG, non-registered shares, nonvoting preferred | 444,000 | 42,841 | ||||||||
Straumann Holding AG | 71,500 | 40,675 | ||||||||
Eurofins Scientific SE, non-registered shares | 68,145 | 38,383 | ||||||||
Mettler-Toledo International Inc.1 | 65,000 | 38,255 | ||||||||
Other securities | 273,900 | |||||||||
|
| |||||||||
| 813,379 | ||||||||||
|
| |||||||||
| Financials | AIA Group Ltd. | 15,387,900 | 112,441 | |||||||
| 9.74% | JPMorgan Chase & Co. | 869,100 | 79,436 | |||||||
Indiabulls Housing Finance Ltd. | 3,031,000 | 50,463 | ||||||||
Prudential PLC | 1,905,134 | 43,696 | ||||||||
MarketAxess Holdings Inc. | 188,000 | 37,807 | ||||||||
Other securities | 245,859 | |||||||||
|
| |||||||||
| 569,702 | ||||||||||
|
| |||||||||
| American Funds Insurance Series | 45 |
Global Growth Fund
| Common stocks (continued) | Shares | Value (000) | ||||||||
| Consumer staples | British American Tobacco PLC | 1,938,000 | $ | 132,114 | ||||||
| 7.61% | Nestlé SA | 739,650 | 64,369 | |||||||
Altria Group, Inc. | 650,000 | 48,405 | ||||||||
Pernod Ricard SA | 301,400 | 40,363 | ||||||||
Other securities | 159,630 | |||||||||
|
| |||||||||
| 444,881 | ||||||||||
|
| |||||||||
Industrials 6.14% | Airbus SE, non-registered shares | 1,109,500 | 91,239 | |||||||
KONE Oyj, Class B | 880,000 | 44,767 | ||||||||
Caterpillar Inc. | 399,000 | 42,877 | ||||||||
ASSA ABLOY AB, Class B | 1,677,000 | 36,846 | ||||||||
Other securities | 143,617 | |||||||||
|
| |||||||||
| 359,346 | ||||||||||
|
| |||||||||
Energy 2.46% | Other securities | 144,098 | ||||||||
|
| |||||||||
Materials 2.06% | Sherwin-Williams Co. | 116,000 | 40,711 | |||||||
Other securities | 79,594 | |||||||||
|
| |||||||||
| 120,305 | ||||||||||
|
| |||||||||
| Telecommunication | SoftBank Group Corp. | 776,000 | 62,763 | |||||||
services 1.46% | Other securities | 22,870 | ||||||||
|
| |||||||||
| 85,633 | ||||||||||
|
| |||||||||
| Miscellaneous | Other common stocks in initial period of acquisition | 291,977 | ||||||||
|
| |||||||||
| 4.99% | Total common stocks (cost: $4,016,519,000) | 5,682,114 | ||||||||
|
| |||||||||
| Bonds, notes & other debt instruments 0.04% | Principal amount (000) | |||||||||
| U.S. Treasury bonds & notes 0.04% | ||||||||||
U.S. Treasury | Other securities | 1,999 | ||||||||
|
| |||||||||
| 0.04% | Total bonds, notes & other debt instruments (cost: $1,999,000) | 1,999 | ||||||||
|
| |||||||||
| Short-term securities 3.03% | ||||||||||
Other securities | 177,358 | |||||||||
|
| |||||||||
Total short-term securities (cost: $177,375,000) | 177,358 | |||||||||
|
| |||||||||
Total investment securities 100.19% (cost: $4,195,893,000) | 5,861,471 | |||||||||
Other assets less liabilities (0.19)% | (10,921 | ) | ||||||||
|
| |||||||||
Net assets 100.00% | $ | 5,850,550 | ||||||||
|
| |||||||||
| 46 | American Funds Insurance Series |
Global Growth Fund
This summary investment portfolio is designed to streamline the report and help investors better focus on the fund’s principal holdings. See the inside back cover for details on how to obtain a complete schedule of portfolio holdings.
As permitted by U.S. Securities and Exchange Commission regulations, “Miscellaneous” securities include holdings in their first year of acquisition that have not previously been publicly disclosed.
“Other securities” includes all issues that are not disclosed separately in the summary investment portfolio. “Other securities” includes securities which were valued under fair value procedures adopted by authority of the board of trustees. The total value of securities which were valued under fair value procedures was $41,497,000, which represented .71% of the net assets of the fund. “Other securities” also includes securities (with an aggregate value of $153,405,000, which represented 2.62% of the net assets of the fund) which were acquired in transactions exempt from registration under Rule 144A or Section 4(2) of the Securities Act of 1933 and may be resold in the U.S. in transactions exempt from registration, normally to qualified institutional buyers.
Forward currency contracts
| Contract amount | Unrealized appreciation | |||||||||
Purchases (000) | Sales (000) | Counterparty | Settlement date | |||||||
USD5,243 | JPY581,294 | Bank of America, N.A. | 7/25/2017 | $69 | ||||||
| 1 | Security did not produce income during the last 12 months. |
Key to abbreviations and symbol
ADR = American Depositary Receipts
JPY = Japanese yen
USD/$ = U.S. dollars
See Notes to Financial Statements
| American Funds Insurance Series | 47 |
Global Small Capitalization Fund
| Summary investment portfolio June 30, 2017 | unaudited |
| Common stocks 92.48% | Shares | Value (000) | ||||||||
| Consumer | Domino’s Pizza, Inc. | 242,300 | $ | 51,254 | ||||||
| discretionary | zooplus AG, non-registered shares1 | 250,671 | 49,817 | |||||||
| 21.57% | Hilton Grand Vacations Inc.1 | 1,114,900 | 40,203 | |||||||
GVC Holdings PLC | 4,048,748 | 39,892 | ||||||||
Cedar Fair, LP | 531,000 | 38,285 | ||||||||
Melco International Development Ltd. | 13,831,000 | 37,025 | ||||||||
Five Below, Inc.1 | 684,000 | 33,769 | ||||||||
Tele Columbus AG1 | 2,743,000 | 30,389 | ||||||||
Hostelworld Group PLC2 | 5,720,000 | 25,852 | ||||||||
Vail Resorts, Inc. | 121,107 | 24,564 | ||||||||
AA PLC | 7,894,804 | 23,444 | ||||||||
Other securities | 475,713 | |||||||||
|
| |||||||||
| 870,207 | ||||||||||
|
| |||||||||
| Information | Qorvo, Inc.1 | 1,783,038 | 112,902 | |||||||
| technology | VTech Holdings Ltd. | 2,189,000 | 34,682 | |||||||
| 16.57% | AAC Technologies Holdings Inc. | 2,563,061 | 32,041 | |||||||
ZPG PLC | 6,660,920 | 31,388 | ||||||||
II-VI, Inc.1 | 814,200 | 27,927 | ||||||||
Paycom Software, Inc.1 | 374,985 | 25,653 | ||||||||
Hamamatsu Photonics KK | 785,753 | 24,102 | ||||||||
Lumentum Holdings Inc.1 | 419,900 | 23,955 | ||||||||
Mellanox Technologies, Ltd.1 | 553,000 | 23,945 | ||||||||
Topcon Corp. | 1,360,510 | 23,394 | ||||||||
Other securities | 308,651 | |||||||||
|
| |||||||||
| 668,640 | ||||||||||
|
| |||||||||
| Health care | Insulet Corp.1 | 1,298,633 | 66,633 | |||||||
| 16.05% | GW Pharmaceuticals PLC (ADR)1 | 652,600 | 65,423 | |||||||
China Biologic Products, Inc.1 | 503,000 | 56,889 | ||||||||
athenahealth, Inc.1 | 342,000 | 48,068 | ||||||||
Kite Pharma, Inc.1 | 385,539 | 39,969 | ||||||||
Illumina, Inc.1 | 230,200 | 39,944 | ||||||||
Integra LifeSciences Holdings Corp.1 | 688,523 | 37,531 | ||||||||
NuVasive, Inc.1 | 460,750 | 35,441 | ||||||||
iRhythm Technologies, Inc.1 | 807,980 | 34,331 | ||||||||
Bluebird Bio, Inc.1 | 267,765 | 28,129 | ||||||||
Ultragenyx Pharmaceutical Inc.1 | 387,108 | 24,043 | ||||||||
Other securities | 170,898 | |||||||||
|
| |||||||||
| 647,299 | ||||||||||
|
| |||||||||
| Industrials | International Container Terminal Services, Inc. | 20,180,000 | 39,112 | |||||||
| 10.02% | Other securities | 364,989 | ||||||||
|
| |||||||||
| 404,101 | ||||||||||
|
| |||||||||
| Financials | Kotak Mahindra Bank Ltd. | 3,282,732 | 48,540 | |||||||
| 8.40% | Essent Group Ltd.1 | 1,058,841 | 39,325 | |||||||
Texas Capital Bancshares, Inc.1 | 481,423 | 37,262 | ||||||||
Webster Financial Corp. | 553,000 | 28,878 | ||||||||
Avanza Bank Holding AB | 560,129 | 24,460 | ||||||||
Other securities | 160,380 | |||||||||
|
| |||||||||
| 338,845 | ||||||||||
|
| |||||||||
| Consumer staples | COSMOS Pharmaceutical Corp. | 193,900 | 37,720 | |||||||
| 3.65% | Other securities | 109,464 | ||||||||
|
| |||||||||
| 147,184 | ||||||||||
|
| |||||||||
| 48 | American Funds Insurance Series |
Global Small Capitalization Fund
| Common stocks | Shares | Value (000) | ||||||||
| Materials | Lundin Mining Corp. | 5,999,000 | $ | 34,094 | ||||||
| 3.46% | Other securities | 105,345 | ||||||||
|
| |||||||||
| 139,439 | ||||||||||
|
| |||||||||
| Real estate | WHA Corp. PCL | 340,831,250 | 31,705 | |||||||
| 2.75% | MGM Growth Properties LLC REIT, Class A | 1,048,600 | 30,608 | |||||||
Other securities | 48,469 | |||||||||
|
| |||||||||
| 110,782 | ||||||||||
|
| |||||||||
| Energy | Other securities | 104,542 | ||||||||
|
| |||||||||
| 2.59% | ||||||||||
| Utilities | ENN Energy Holdings Ltd. | 4,991,400 | 30,112 | |||||||
| 2.16% | Other securities | 57,118 | ||||||||
|
| |||||||||
| 87,230 | ||||||||||
|
| |||||||||
| Telecommunication | Other securities | 17,039 | ||||||||
|
| |||||||||
| services 0.42% | ||||||||||
| Miscellaneous | Other common stocks in initial period of acquisition | 195,276 | ||||||||
|
| |||||||||
| 4.84% | Total common stocks (cost: $3,037,636,000) | 3,730,584 | ||||||||
|
| |||||||||
| Rights & warrants 0.02% | ||||||||||
| Real estate | Other securities | 227 | ||||||||
|
| |||||||||
| 0.01% | ||||||||||
| Miscellaneous | Other rights & warrants in initial period of acquisition | 424 | ||||||||
|
| |||||||||
| 0.01% | Total rights & warrants (cost: $431,000) | 651 | ||||||||
|
| |||||||||
| Bonds, notes & other debt instruments 0.69% | Principal amount (000) | |||||||||
| Corporate bonds & notes 0.59% | ||||||||||
| Consumer | Caesars Entertainment Operating Co. 10.00% 20183 | $ | 25,950 | 24,004 | ||||||
|
| |||||||||
| discretionary 0.59% | ||||||||||
| U.S. Treasury bonds & notes 0.10% | ||||||||||
| U.S. Treasury | Other securities | 4,116 | ||||||||
|
| |||||||||
| 0.10% | Total bonds, notes & other debt instruments (cost: $25,619,000) | 28,120 | ||||||||
|
| |||||||||
| Short-term securities 6.87% | ||||||||||
Bank of Montreal 1.15% due 8/15/2017 | 30,000 | 29,952 | ||||||||
Fairway Finance Corp. 1.24% due 9/13/20174 | 10,000 | 9,973 | ||||||||
Federal Home Loan Bank 1.03%-1.05% due 9/6/2017-10/3/2017 | 52,700 | 52,572 | ||||||||
Nordea Bank AB 1.03% due 7/20/20174 | 55,900 | 55,864 | ||||||||
| American Funds Insurance Series | 49 |
Global Small Capitalization Fund
Short-term securities (continued) | Principal amount (000) | Value (000) | ||||||||
Statoil ASA 1.14% due 7/28/20174 | $25,000 | $ | 24,979 | |||||||
Victory Receivables Corp. 1.22% due 7/21/20174 | 30,000 | 29,975 | ||||||||
Other securities | 73,788 | |||||||||
|
| |||||||||
Total short-term securities (cost: $277,117,000) | 277,103 | |||||||||
|
| |||||||||
Total investment securities 100.06% (cost: $3,340,803,000) | 4,036,458 | |||||||||
Other assets less liabilities (0.06)% | (2,599 | ) | ||||||||
|
| |||||||||
Net assets 100.00% | $ | 4,033,859 | ||||||||
|
| |||||||||
This summary investment portfolio is designed to streamline the report and help investors better focus on the fund’s principal holdings. See the inside back cover for details on how to obtain a complete schedule of portfolio holdings.
As permitted by U.S. Securities and Exchange Commission regulations, “Miscellaneous” securities include holdings in their first year of acquisition that have not previously been publicly disclosed.
“Other securities” includes all issues that are not disclosed separately in the summary investment portfolio. Some securities in “Other securities” (with an aggregate value of $11,697,000, an aggregate cost of $10,011,000, and which represented .29% of the net assets of the fund) were acquired from 5/1/2015 to 4/28/2017 through private placement transactions exempt from registration under the Securities Act of 1933, which may subject them to legal or contractual restrictions on resale. “Other securities“ also includes a security which was pledged as collateral. The total value of pledged collateral was $654,000, which represented .02% of the net assets of the fund.
Forward currency contracts
Contract amount | Unrealized appreciation (depreciation) at 6/30/2017 (000) | |||||||||||
| Purchases (000) | Sales (000) | Counterparty | Settlement date | |||||||||
USD3,971 | JPY437,000 | UBS AG | 7/12/2017 | $ 83 | ||||||||
USD44,059 | GBP34,000 | HSBC Bank | 7/13/2017 | (244 | ) | |||||||
USD15,876 | JPY1,765,175 | JPMorgan Chase | 7/28/2017 | 162 | ||||||||
USD10,245 | INR663,163 | Citibank | 7/31/2017 | 30 | ||||||||
USD15,586 | GBP12,190 | Citibank | 8/21/2017 | (317 | ) | |||||||
|
| |||||||||||
| $ | (286 | ) | ||||||||||
|
|
Investments in affiliates
A company is an affiliate of the fund under the Investment Company Act of 1940 if the fund’s holdings in that company represent 5% or more of the outstanding voting shares. The value of the fund’s affiliated-company holdings is either shown in the summary investment portfolio or included in the value of “Other securities” under the respective industry sectors. Further details on such holdings and related transactions during the six months ended June 30, 2017, appear below.
| Beginning shares | Additions | Reductions | Ending shares | Net realized gain (loss) (000) | Net unrealized appreciation (000) | Dividend income (000) | Value of affiliates at 6/30/2017 (000) | |||||||||||||||||||||||||||||||||
Hostelworld Group PLC | – | 5,720,000 | – | 5,720,000 | $ | – | $ | 2,585 | $ | 999 | $ | 25,852 | ||||||||||||||||||||||||||||
Time Technoplast Ltd.5 | 11,888,000 | – | 11,888,000 | – | 5,933 | 107 | – | – | ||||||||||||||||||||||||||||||||
Indochine Mining Ltd.1,5,6 | 182,998 | – | 182,998 | – | (8,032 | ) | 8,032 | – | – | |||||||||||||||||||||||||||||||
Victoria Oil & Gas PLC1,5 | 6,966,560 | – | 6,966,560 | – | (1,438 | ) | 3,759 | – | – | |||||||||||||||||||||||||||||||
|
|
|
|
|
|
|
| |||||||||||||||||||||||||||||||||
| $ | (3,537) | $ | 14,483 | $ | 999 | $ | 25,852 | |||||||||||||||||||||||||||||||||
|
|
|
|
|
|
|
| |||||||||||||||||||||||||||||||||
| 50 | American Funds Insurance Series |
Global Small Capitalization Fund
| 1 | Security did not produce income during the last 12 months. |
| 2 | Represents an affiliated company as defined under the Investment Company Act of 1940. |
| 3 | Scheduled interest and/or principal payment was not received. |
| 4 | Acquired in a transaction exempt from registration under Section 4(2) of the Securities Act of 1933. May be resold in the U.S. in transactions exempt from registration, normally to qualified institutional buyers. The total value of all such securities was $190,528,000, which represented 4.72% of the net assets of the fund. |
| 5 | Unaffiliated issuer at 6/30/2017. |
| 6 | Valued under fair value procedures adopted by authority of the board of trustees. The total value of all such securities, including those in “Miscellaneous“ and “Other securities,“ was $56,540,000, which represented 1.40% of the net assets of the fund. This amount includes $43,269,000 related to certain securities trading outside the U.S. whose values were adjusted as a result of significant market movements following the close of local trading. |
Key to abbreviations and symbol
ADR = American Depositary Receipts
GBP = British pounds
INR = Indian rupees
JPY = Japanese yen
USD/$ = U.S. dollars
See Notes to Financial Statements
| American Funds Insurance Series | 51 |
| Summary investment portfolio June 30, 2017 | unaudited |
| Common stocks 92.89% | Shares | Value (000) | ||||||||
| Information | Facebook, Inc., Class A1 | 8,340,500 | $ | 1,259,249 | ||||||
| technology | Alphabet Inc., Class C1 | 613,000 | 557,052 | |||||||
| 30.26% | Alphabet Inc., Class A1 | 271,500 | 252,408 | |||||||
Microsoft Corp. | 11,676,000 | 804,827 | ||||||||
Broadcom Ltd. | 3,068,300 | 715,067 | ||||||||
Apple Inc. | 3,851,000 | 554,621 | ||||||||
ASML Holding NV (New York registered) | 2,251,504 | 293,393 | ||||||||
ASML Holding NV | 1,199,568 | 156,327 | ||||||||
Taiwan Semiconductor Manufacturing Co., Ltd. | 48,812,000 | 334,559 | ||||||||
Taiwan Semiconductor Manufacturing Co., Ltd. (ADR) | 3,225,392 | 112,760 | ||||||||
Visa Inc., Class A | 2,955,000 | 277,120 | ||||||||
Samsung Electronics Co., Ltd. | 89,330 | 185,585 | ||||||||
Intel Corp. | 4,926,000 | 166,203 | ||||||||
Alibaba Group Holding Ltd. (ADR)1 | 1,143,000 | 161,049 | ||||||||
TE Connectivity Ltd. | 1,925,000 | 151,459 | ||||||||
Adobe Systems Inc.1 | 1,000,000 | 141,440 | ||||||||
Other securities | 1,016,208 | |||||||||
|
| |||||||||
| 7,139,327 | ||||||||||
|
| |||||||||
| Consumer | Amazon.com, Inc.1 | 1,393,416 | 1,348,827 | |||||||
| discretionary | Tesla, Inc.1 | 1,506,200 | 544,657 | |||||||
| 20.78% | Home Depot, Inc. | 2,985,000 | 457,899 | |||||||
Netflix, Inc.1 | 2,746,000 | 410,280 | ||||||||
Comcast Corp., Class A | 10,390,000 | 404,379 | ||||||||
Ulta Beauty, Inc.1 | 1,120,000 | 321,821 | ||||||||
Priceline Group Inc.1 | 131,531 | 246,031 | ||||||||
Starbucks Corp. | 4,195,000 | 244,610 | ||||||||
Charter Communications, Inc., Class A1 | 698,680 | 235,350 | ||||||||
Other securities | 688,079 | |||||||||
|
| |||||||||
| 4,901,933 | ||||||||||
|
| |||||||||
| Health care | UnitedHealth Group Inc. | 3,517,500 | 652,215 | |||||||
| 14.59% | Regeneron Pharmaceuticals, Inc.1 | 834,500 | 409,856 | |||||||
Centene Corp.1 | 4,031,052 | 322,000 | ||||||||
Intuitive Surgical, Inc.1 | 313,500 | 293,239 | ||||||||
Humana Inc. | 993,200 | 238,984 | ||||||||
Vertex Pharmaceuticals Inc.1 | 1,711,200 | 220,522 | ||||||||
Boston Scientific Corp.1 | 7,845,000 | 217,463 | ||||||||
Thermo Fisher Scientific Inc. | 995,000 | 173,598 | ||||||||
Incyte Corp.1 | 1,040,000 | 130,946 | ||||||||
Other securities | 784,045 | |||||||||
|
| |||||||||
| 3,442,868 | ||||||||||
|
| |||||||||
| Energy | EOG Resources, Inc. | 2,402,400 | 217,465 | |||||||
| 7.45% | Schlumberger Ltd. | 2,900,000 | 190,936 | |||||||
Concho Resources Inc.1 | 1,550,000 | 188,372 | ||||||||
Noble Energy, Inc. | 5,663,000 | 160,263 | ||||||||
Suncor Energy Inc. | 4,402,090 | 128,621 | ||||||||
Other securities | 872,407 | |||||||||
|
| |||||||||
| 1,758,064 | ||||||||||
|
| |||||||||
| Financials | JPMorgan Chase & Co. | 2,635,000 | 240,839 | |||||||
| 7.34% | Wells Fargo & Co. | 3,335,000 | 184,792 | |||||||
Legal & General Group PLC | 40,158,246 | 135,102 | ||||||||
Other securities | 1,171,273 | |||||||||
|
| |||||||||
| 1,732,006 | ||||||||||
|
| |||||||||
| 52 | American Funds Insurance Series |
Growth Fund
| Common stocks | Shares | Value (000) | ||||||||
| Industrials | Boeing Co. | 876,400 | $ | 173,308 | ||||||
| 6.13% | Fortive Corp. | 2,329,397 | 147,567 | |||||||
TransDigm Group Inc. | 524,000 | 140,888 | ||||||||
MTU Aero Engines AG | 941,034 | 132,738 | ||||||||
Rockwell Collins, Inc. | 1,225,000 | 128,723 | ||||||||
Other securities | 723,031 | |||||||||
|
| |||||||||
| 1,446,255 | ||||||||||
|
| |||||||||
| Consumer staples | Constellation Brands, Inc., Class A | 815,000 | 157,890 | |||||||
| 2.32% | Other securities | 389,821 | ||||||||
|
| |||||||||
| 547,711 | ||||||||||
|
| |||||||||
| Telecommunication | Zayo Group Holdings, Inc.1 | 6,245,000 | 192,970 | |||||||
| services | Other securities | 26,491 | ||||||||
|
| |||||||||
| 0.93% | 219,461 | |||||||||
|
| |||||||||
Other 1.38% | Other securities | 324,938 | ||||||||
|
| |||||||||
Miscellaneous 1.71% | Other common stocks in initial period of acquisition | 402,317 | ||||||||
|
| |||||||||
Total common stocks (cost: $14,405,033,000) | 21,914,880 | |||||||||
|
| |||||||||
| Convertible stocks 0.05% | ||||||||||
| Consumer | Other securities | 12,276 | ||||||||
|
| |||||||||
discretionary 0.05% | Total convertible stocks (cost: $10,650,000) | 12,276 | ||||||||
|
| |||||||||
| Short-term securities 7.21% | Principal amount (000) | |||||||||
Apple Inc. 0.89%-1.15% due 7/20/2017-9/19/20172 | $ | 135,000 | 134,824 | |||||||
Chariot Funding, LLC 0.95%-1.00% due 7/7/2017-7/14/20172 | 150,000 | 149,954 | ||||||||
Federal Home Loan Bank 0.84%-1.03% due 7/5/2017-9/20/2017 | 909,575 | 908,835 | ||||||||
Jupiter Securitization Co., LLC 0.95% due 7/3/20172 | 20,000 | 19,998 | ||||||||
Other securities | 486,947 | |||||||||
|
| |||||||||
Total short-term securities (cost: $1,700,520,000) | 1,700,558 | |||||||||
|
| |||||||||
Total investment securities 100.15% (cost: $16,116,203,000) | 23,627,714 | |||||||||
Other assets less liabilities (0.15)% | (35,001 | ) | ||||||||
|
| |||||||||
Net assets 100.00% | $ | 23,592,713 | ||||||||
|
| |||||||||
This summary investment portfolio is designed to streamline the report and help investors better focus on the fund’s principal holdings. See the inside back cover for details on how to obtain a complete schedule of portfolio holdings.
As permitted by U.S. Securities and Exchange Commission regulations, “Miscellaneous” securities include holdings in their first year of acquisition that have not previously been publicly disclosed.
“Other securities” includes all issues that are not disclosed separately in the summary investment portfolio. “Other securities” includes a security which was valued under fair value procedures adopted by authority of the board of trustees. The total value of the security which was valued under fair value procedures was $12,276,000, which represented .05% of the net assets of the fund. This security was acquired for $10,650,000 on 5/22/2015 through a private placement transaction exempt from registration under the Securities Act of 1933, which may subject it to legal or contractual restrictions on resale.
| American Funds Insurance Series | 53 |
Growth Fund
The following footnotes apply to either the individual securities noted or one or more of the securities aggregated and listed as a single line item.
| 1 | Security did not produce income during the last 12 months. |
| 2 | Acquired in a transaction exempt from registration under Section 4(2) of the Securities Act of 1933. May be resold in the U.S. in transactions exempt from registration, normally to qualified institutional buyers. The total value of all such securities, including those in “Other securities,” was $686,896,000, which represented 2.91% of the net assets of the fund. |
Key to abbreviation
ADR = American Depositary Receipts
See Notes to Financial Statements
| 54 | American Funds Insurance Series |
| International Fund | ||
| Summary investment portfolio June 30, 2017 | unaudited |
| Common stocks 90.29% | Shares | Value (000) | ||||||||
| Financials | AIA Group Ltd. | 40,078,700 | $ | 292,860 | ||||||
| 16.62% | HDFC Bank Ltd.1 | 10,149,569 | 261,259 | |||||||
HDFC Bank Ltd. (ADR) | 352,300 | 30,639 | ||||||||
UniCredit SpA2 | 7,776,692 | 145,223 | ||||||||
Prudential PLC | 5,142,265 | 117,944 | ||||||||
Kotak Mahindra Bank Ltd. | 6,186,048 | 91,469 | ||||||||
Barclays PLC | 34,317,708 | 90,623 | ||||||||
BNP Paribas SA | 1,002,776 | 72,224 | ||||||||
Credit Suisse Group AG | 4,172,789 | 60,314 | ||||||||
Other securities | 296,876 | |||||||||
|
| |||||||||
| 1,459,431 | ||||||||||
|
| |||||||||
| Information | Tencent Holdings Ltd. | 8,410,399 | 300,762 | |||||||
| technology | Samsung Electronics Co., Ltd. | 137,599 | 285,865 | |||||||
| 13.61% | Alibaba Group Holding Ltd. (ADR)2 | 1,844,800 | 259,932 | |||||||
ASML Holding NV | 693,834 | 90,420 | ||||||||
Nintendo Co., Ltd. | 188,239 | 63,062 | ||||||||
Other securities | 194,919 | |||||||||
|
| |||||||||
| 1,194,960 | ||||||||||
|
| |||||||||
| Consumer | Altice NV, Class A2 | 7,869,893 | 181,570 | |||||||
| discretionary | Altice NV, Class B2 | 1,118,127 | 25,803 | |||||||
| 13.22% | Kering SA | 431,324 | 146,904 | |||||||
Galaxy Entertainment Group Ltd. | 18,326,000 | 111,259 | ||||||||
Hyundai Motor Co. | 653,354 | 91,081 | ||||||||
Naspers Ltd., Class N | 364,200 | 70,850 | ||||||||
Sony Corp. | 1,580,500 | 60,227 | ||||||||
Sands China Ltd. | 13,028,000 | 59,655 | ||||||||
Other securities | 413,431 | |||||||||
|
| |||||||||
| 1,160,780 | ||||||||||
|
| |||||||||
| Health care | Novartis AG | 1,967,000 | 163,694 | |||||||
| 9.59% | Teva Pharmaceutical Industries Ltd. (ADR) | 3,660,300 | 121,595 | |||||||
Grifols, SA, Class B, preferred nonvoting, non-registered shares | 3,304,730 | 69,828 | ||||||||
Grifols, SA, Class A, non-registered shares | 881,000 | 24,537 | ||||||||
Grifols, SA, Class B (ADR) | 793,690 | 16,771 | ||||||||
Takeda Pharmaceutical Co. Ltd. | 1,646,500 | 83,573 | ||||||||
UCB SA | 1,111,391 | 76,455 | ||||||||
Merck KGaA | 567,900 | 68,592 | ||||||||
Sysmex Corp. | 1,055,000 | 62,939 | ||||||||
Other securities | 153,565 | |||||||||
|
| |||||||||
| 841,549 | ||||||||||
|
| |||||||||
| Consumer staples | Nestlé SA | 1,317,700 | 114,675 | |||||||
| 8.28% | AMOREPACIFIC Corp. | 385,274 | 102,367 | |||||||
Pernod Ricard SA | 717,437 | 96,077 | ||||||||
Associated British Foods PLC | 2,250,488 | 86,058 | ||||||||
British American Tobacco PLC | 1,126,000 | 76,760 | ||||||||
Treasury Wine Estates Ltd. | 6,529,100 | 66,040 | ||||||||
Other securities | 185,182 | |||||||||
|
| |||||||||
| 727,159 | ||||||||||
|
| |||||||||
| Industrials | Airbus SE, non-registered shares | 2,559,364 | 210,469 | |||||||
| 8.08% | Rolls-Royce Holdings PLC2 | 8,468,900 | 98,280 | |||||||
Other securities | 400,540 | |||||||||
|
| |||||||||
| 709,289 | ||||||||||
|
| |||||||||
| American Funds Insurance Series | 55 |
International Fund
| Common stocks (continued) | Shares | Value (000) | ||||||||
| Utilities | Power Grid Corp. of India Ltd. | 35,497,206 | $ | 115,628 | ||||||
| 5.86% | DONG Energy AS | 1,873,324 | 84,568 | |||||||
ENN Energy Holdings Ltd. | 13,136,000 | 79,246 | ||||||||
CK Infrastructure Holdings Ltd. | 7,942,000 | 66,731 | ||||||||
China Gas Holdings Ltd. | 31,610,000 | 63,807 | ||||||||
Other securities | 104,190 | |||||||||
|
| |||||||||
| 514,170 | ||||||||||
|
| |||||||||
| Materials | Nitto Denko Corp. | 1,092,000 | 89,710 | |||||||
| 5.29% | Grasim Industries Ltd. | 3,031,988 | 58,264 | |||||||
Other securities | 316,366 | |||||||||
|
| |||||||||
| 464,340 | ||||||||||
|
| |||||||||
| Energy | Royal Dutch Shell PLC, Class B | 2,974,624 | 79,907 | |||||||
| 3.80% | Royal Dutch Shell PLC, Class A | 2,338,425 | 61,980 | |||||||
Other securities | 191,776 | |||||||||
|
| |||||||||
| 333,663 | ||||||||||
|
| |||||||||
| Telecommunication | Nippon Telegraph and Telephone Corp. | 2,715,000 | 128,176 | |||||||
| services | SoftBank Group Corp. | 911,900 | 73,755 | |||||||
| 3.02% | Other securities | 63,242 | ||||||||
|
| |||||||||
| 265,173 | ||||||||||
|
| |||||||||
| Real estate | Cheung Kong Property Holdings Ltd. | 12,918,528 | 101,181 | |||||||
| 1.93% | Other securities | 68,688 | ||||||||
|
| |||||||||
| 169,869 | ||||||||||
|
| |||||||||
| Miscellaneous | Other common stocks in initial period of acquisition | 86,831 | ||||||||
|
| |||||||||
| 0.99% | Total common stocks (cost: $6,468,357,000) | 7,927,214 | ||||||||
|
| |||||||||
| Bonds, notes & other debt instruments 0.75% | Principal amount (000) | |||||||||
| Corporate bonds & notes 0.45% | ||||||||||
| Other | Other securities | 39,031 | ||||||||
|
| |||||||||
| 0.45% | Total corporate bonds & notes | 39,031 | ||||||||
|
| |||||||||
| U.S. Treasury bonds & notes 0.26% | ||||||||||
| U.S. Treasury | Other securities | 22,819 | ||||||||
|
| |||||||||
| 0.26% | ||||||||||
| Bonds & notes of governments outside the U.S. 0.04% | ||||||||||
Other securities | 3,838 | |||||||||
|
| |||||||||
Total bonds, notes & other debt instruments (cost: $55,678,000) | 65,688 | |||||||||
|
| |||||||||
| 56 | American Funds Insurance Series |
International Fund
| Short-term securities 9.06% | Principal amount (000) | Value (000) | ||||||||
| Bank of Tokyo-Mitsubishi UFJ, Ltd. 1.03% due 7/12/2017 | $ | 55,000 | $ | 54,978 | ||||||
| Federal Home Loan Bank 0.82%–1.07% due 7/7/2017–10/27/2017 | 408,200 | 407,665 | ||||||||
| Mizuho Bank, Ltd. 0.95%–1.19% due 7/3/2017–7/26/20173 | 105,200 | 105,145 | ||||||||
| Other securities | 228,011 | |||||||||
|
| |||||||||
| Total short-term securities (cost: $795,808,000) | 795,799 | |||||||||
|
| |||||||||
| Total investment securities 100.10% (cost: $7,319,843,000) | 8,788,701 | |||||||||
| Other assets less liabilities (0.10)% | (9,083 | ) | ||||||||
|
| |||||||||
| Net assets 100.00% | $ | 8,779,618 | ||||||||
|
| |||||||||
This summary investment portfolio is designed to streamline the report and help investors better focus on the fund’s principal holdings. See the inside back cover for details on how to obtain a complete schedule of portfolio holdings.
As permitted by U.S. Securities and Exchange Commission regulations, “Miscellaneous” securities include holdings in their first year of acquisition that have not previously been publicly disclosed.
“Other securities” includes all issues that are not disclosed separately in the summary investment portfolio.
| American Funds Insurance Series | 57 |
International Fund
Forward currency contracts
| Contract amount | Unrealized appreciation | |||||||||
Purchases (000) | Sales (000) | Counterparty | Settlement date | |||||||
USD26,925 | INR1,744,071 | Bank of America, N.A. | 7/31/2017 | $59 | ||||||
The following footnotes apply to either the individual securities noted or one or more of the securities aggregated and listed as a single line item.
| 1 | Valued under fair value procedures adopted by authority of the board of trustees. The total value of the security was $261,259,000, which represented 2.98% of the net assets of the fund. |
| 2 | Security did not produce income during the last 12 months. |
| 3 | Acquired in a transaction exempt from registration under Rule 144A or Section 4(2) of the Securities Act of 1933. May be resold in the U.S. in transactions exempt from registration, normally to qualified institutional buyers. The total value of all such securities, including those in “Other securities,” was $340,257,000, which represented 3.88% of the net assets of the fund. |
Key to abbreviations and symbol
ADR = American Depositary Receipts
INR = Indian rupees
USD/$ = U.S. dollars
See Notes to Financial Statements
| 58 | American Funds Insurance Series |
| Summary investment portfolio June 30, 2017 | unaudited |
| Common stocks 89.02% | Shares | Value (000) | ||||||||
| Information | Taiwan Semiconductor Manufacturing Co., Ltd. | 9,887,000 | $ | 67,766 | ||||||
| technology | Taiwan Semiconductor Manufacturing Co., Ltd. (ADR) | 700,000 | 24,472 | |||||||
| 24.07% | Murata Manufacturing Co., Ltd. | 584,000 | 88,632 | |||||||
Alphabet Inc., Class C1 | 69,700 | 63,338 | ||||||||
Alphabet Inc., Class A1 | 16,900 | 15,712 | ||||||||
Facebook, Inc., Class A1 | 399,100 | 60,256 | ||||||||
Samsung Electronics Co., Ltd. | 18,500 | 38,434 | ||||||||
Samsung Electronics Co., Ltd., nonvoting preferred | 7,750 | 12,613 | ||||||||
Alibaba Group Holding Ltd. (ADR)1 | 361,550 | 50,942 | ||||||||
Microsoft Corp. | 729,000 | 50,250 | ||||||||
Intel Corp. | 1,293,460 | 43,641 | ||||||||
United Microelectronics Corp. | 80,327,000 | 38,949 | ||||||||
Broadcom Ltd. | 159,750 | 37,230 | ||||||||
Baidu, Inc., Class A (ADR)1 | 177,600 | 31,766 | ||||||||
Yandex NV, Class A1 | 1,201,950 | 31,539 | ||||||||
TravelSky Technology Ltd., Class H | 7,580,456 | 22,331 | ||||||||
Other securities | 80,686 | |||||||||
|
| |||||||||
| �� | 758,557 | |||||||||
|
| |||||||||
| Consumer | Matahari Department Store Tbk PT2 | 38,552,200 | 40,941 | |||||||
| discretionary | Domino’s Pizza, Inc. | 173,400 | 36,679 | |||||||
| 10.99% | Kroton Educacional SA, ordinary nominative | 7,721,000 | 34,656 | |||||||
Naspers Ltd., Class N | 177,519 | 34,534 | ||||||||
Sony Corp. | 700,000 | 26,674 | ||||||||
Maruti Suzuki India Ltd. | 224,500 | 25,068 | ||||||||
MakeMyTrip Ltd., non-registered shares1 | 733,931 | 24,623 | ||||||||
Starbucks Corp. | 380,000 | 22,158 | ||||||||
Other securities | 101,056 | |||||||||
|
| |||||||||
| 346,389 | ||||||||||
|
| |||||||||
| Financials | HDFC Bank Ltd.2 | 1,891,100 | 48,678 | |||||||
| 10.66% | HDFC Bank Ltd. (ADR) | 208,400 | 18,125 | |||||||
BM&FBOVESPA SA - Bolsa de Valores, Mercadorias e Futuros, ordinary nominative | 7,928,300 | 47,265 | ||||||||
Grupo Financiero Galicia SA, Class B (ADR) | 935,951 | 39,909 | ||||||||
AIA Group Ltd. | 4,611,600 | 33,698 | ||||||||
Housing Development Finance Corp. Ltd. | 1,158,700 | 28,950 | ||||||||
Other securities | 119,565 | |||||||||
|
| |||||||||
| 336,190 | ||||||||||
|
| |||||||||
| Consumer staples | British American Tobacco PLC | 1,440,000 | 98,165 | |||||||
| 8.59% | CP ALL PCL | 17,121,500 | 31,627 | |||||||
Nestlé SA | 312,196 | 27,169 | ||||||||
Lenta Ltd. (GDR)1 | 4,126,200 | 23,973 | ||||||||
Lenta Ltd. (GDR)1,3 | 244,500 | 1,421 | ||||||||
Foshan Haitian Flavouring and Food Co. Ltd., Class A | 1,999,900 | 12,030 | ||||||||
Other securities | 76,381 | |||||||||
|
| |||||||||
| 270,766 | ||||||||||
|
| |||||||||
| Energy | Reliance Industries Ltd.1 | 6,506,589 | 138,915 | |||||||
| 8.57% | Other securities | 131,101 | ||||||||
|
| |||||||||
| 270,016 | ||||||||||
|
| |||||||||
| American Funds Insurance Series | 59 |
New World Fund
| Common stocks (continued) | Shares | Value (000) | ||||||||
| Industrials | Airbus SE, non-registered shares | 612,229 | $ | 50,347 | ||||||
| 6.26% | Eicher Motors Ltd.1 | 104,200 | 43,589 | |||||||
Grupo Aeroportuario del Sureste, SA de CV, Series B | 1,315,200 | 27,749 | ||||||||
Other securities | 75,792 | |||||||||
|
| |||||||||
| 197,477 | ||||||||||
|
| |||||||||
| Health care | Hypermarcas SA, ordinary nominative | 4,903,700 | 41,149 | |||||||
| 4.95% | CSL Ltd. | 269,500 | 28,591 | |||||||
Other securities | 86,271 | |||||||||
|
| |||||||||
| 156,011 | ||||||||||
|
| |||||||||
| Materials | Randgold Resources Ltd. | 529,600 | 46,939 | |||||||
| 4.88% | Vale SA, Class A, preferred nominative | 2,830,000 | 22,988 | |||||||
Klabin SA, units | 4,487,400 | 21,984 | ||||||||
Other securities | 61,817 | |||||||||
|
| |||||||||
| 153,728 | ||||||||||
|
| |||||||||
| Utilities | Infraestructura Energética Nova, SAB de CV | 13,547,613 | 72,222 | |||||||
| 2.72% | Other securities | 13,535 | ||||||||
|
| |||||||||
| 85,757 | ||||||||||
|
| |||||||||
| Telecommunication | SoftBank Group Corp. | 650,000 | 52,572 | |||||||
| services | Other securities | 8,558 | ||||||||
|
| |||||||||
| 1.94% | 61,130 | |||||||||
|
| |||||||||
| Real estate | American Tower Corp. REIT | 236,800 | 31,333 | |||||||
| 1.17% | Other securities | 5,471 | ||||||||
|
| |||||||||
| 36,804 | ||||||||||
|
| |||||||||
| Miscellaneous | Other common stocks in initial period of acquisition | 133,078 | ||||||||
|
| |||||||||
| 4.22% | Total common stocks (cost: $2,336,213,000) | 2,805,903 | ||||||||
|
| |||||||||
| Rights & warrants 1.54% | ||||||||||
| Consumer staples | Foshan Haitian Flavouring and Food Co., Ltd., Class A, warrants, expire 20182,3 | 5,330,000 | 32,061 | |||||||
| 1.34% | Other securities | 10,052 | ||||||||
|
| |||||||||
| 42,113 | ||||||||||
|
| |||||||||
| Consumer | Other securities | 6,248 | ||||||||
|
| |||||||||
| discretionary | Total rights & warrants (cost: $40,814,000) | 48,361 | ||||||||
|
| |||||||||
| 0.20% | ||||||||||
| Bonds, notes & other debt instruments 3.20% | Principal amount (000) | |||||||||
| Bonds & notes of governments & government agencies outside the U.S. 2.59% | ||||||||||
Other securities | 81,623 | |||||||||
|
| |||||||||
| Corporate bonds & notes 0.56% | ||||||||||
| Other | Other securities | 17,837 | ||||||||
|
| |||||||||
| 0.56% | Total corporate bonds & notes | 17,837 | ||||||||
|
| |||||||||
| 60 | American Funds Insurance Series |
New World Fund
| Bonds, notes & other debt instruments | Principal amount (000) | Value (000) | ||||||||
| U.S. Treasury bonds & notes 0.05% | ||||||||||
| U.S. Treasury | Other securities | $ | 1,499 | |||||||
|
| |||||||||
| 0.05% | Total bonds, notes & other debt instruments (cost: $99,154,000) | 100,959 | ||||||||
|
| |||||||||
| Short-term securities 5.56% | ||||||||||
Federal Home Loan Bank 0.83%-0.95% due 7/11/2017-8/23/2017 | $40,000 | 39,957 | ||||||||
Liberty Street Funding Corp. 1.22% due 7/5/20173 | 24,300 | 24,296 | ||||||||
Nordea Bank AB 1.03% due 7/20/20173 | 39,200 | 39,175 | ||||||||
Sumitomo Mitsui Banking Corp. 1.15% due 7/21/20173 | 22,200 | 22,184 | ||||||||
Victory Receivables Corp. 1.20%-1.22% due 7/11/2017-7/21/20173 | 37,700 | 37,672 | ||||||||
Other securities | 12,063 | |||||||||
|
| |||||||||
Total short-term securities (cost: $175,358,000) | 175,347 | |||||||||
|
| |||||||||
Total investment securities 99.32% (cost: $2,651,539,000) | 3,130,570 | |||||||||
Other assets less liabilities 0.68% | 21,335 | |||||||||
|
| |||||||||
Net assets 100.00% | $ | 3,151,905 | ||||||||
|
| |||||||||
This summary investment portfolio is designed to streamline the report and help investors better focus on the fund’s principal holdings. See the inside back cover for details on how to obtain a complete schedule of portfolio holdings.
As permitted by U.S. Securities and Exchange Commission regulations, “Miscellaneous” securities include holdings in their first year of acquisition that have not previously been publicly disclosed.
“Other securities” includes all issues that are not disclosed separately in the summary investment portfolio.
| American Funds Insurance Series | 61 |
New World Fund
Forward currency contracts
Contract amount
| Unrealized appreciation (depreciation) at 6/30/2017 | |||||||||
| Purchases (000) | Sales (000) | Counterparty | Settlement date | |||||||
USD526 | COP1,530,569 | Citibank | 7/10/2017 | $ 25 | ||||||
USD1,315 | ZAR16,955 | Goldman Sachs | 7/10/2017 | 21 | ||||||
USD1,397 | BRL4,600 | JPMorgan Chase | 7/10/2017 | 12 | ||||||
USD3,162 | INR204,401 | JPMorgan Chase | 7/10/2017 | 4 | ||||||
USD496 | TRY1,775 | Bank of America, N.A. | 7/10/2017 | (7) | ||||||
USD1,897 | MXN34,748 | Bank of America, N.A. | 7/10/2017 | (14) | ||||||
USD2,964 | ZAR38,500 | Barclays Bank PLC | 7/12/2017 | 28 | ||||||
USD1,265 | COP3,721,800 | JPMorgan Chase | 7/17/2017 | 47 | ||||||
USD900 | BRL3,000 | JPMorgan Chase | 7/21/2017 | (1) | ||||||
USD298 | EUR265 | HSBC Bank | 7/21/2017 | (5) | ||||||
USD3,967 | INR257,150 | JPMorgan Chase | 8/10/2017 | 11 | ||||||
USD685 | INR44,350 | Citibank | 8/10/2017 | 2 | ||||||
USD1,389 | JPY153,000 | Bank of America, N.A. | 8/17/2017 | 25 | ||||||
USD570 | JPY63,000 | UBS AG | 8/21/2017 | 8 | ||||||
USD595 | EUR530 | HSBC Bank | 8/23/2017 | (12) | ||||||
| ||||||||||
| $144 | ||||||||||
|
The following footnotes apply to either the individual securities noted or one or more of the securities aggregated and listed as a single line item.
| 1 | Security did not produce income during the last 12 months. |
| 2 | Valued under fair value procedures adopted by authority of the board of trustees. The total value of all such securities, including those in “Other securities,“ was $158,032,000, which represented 5.01% of the net assets of the fund. This amount includes $58,508,000 related to certain securities trading outside the U.S. whose values were adjusted as a result of significant market movements following the close of local trading. |
| 3 | Acquired in a transaction exempt from registration under Rule 144A or Section 4(2) of the Securities Act of 1933. May be resold in the U.S. in transactions exempt from registration, normally to qualified institutional buyers. The total value of all such securities was $209,408,000, which represented 6.64% of the net assets of the fund. |
Key to abbreviations and symbol
ADR = American Depositary Receipts
BRL = Brazilian reais
COP = Colombian pesos
EUR = Euros
GDR = Global Depositary Receipts
INR = Indian rupees
JPY = Japanese yen
MXN = Mexican pesos
TRY = Turkish lira
USD/$ = U.S. dollars
ZAR = South African rand
See Notes to Financial Statements
| 62 | American Funds Insurance Series |
Blue Chip Income and Growth Fund
| Summary investment portfolio June 30, 2017 | unaudited |
| Common stocks 96.55% | Shares | Value (000) | ||||||||
| Health care | AbbVie Inc. | 6,761,500 | $ | 490,277 | ||||||
| 16.68% | Amgen Inc. | 2,366,500 | 407,582 | |||||||
Teva Pharmaceutical Industries Ltd. (ADR) | 5,375,800 | 178,584 | ||||||||
Medtronic PLC | 1,460,000 | 129,575 | ||||||||
Abbott Laboratories | 1,576,100 | 76,614 | ||||||||
Bristol-Myers Squibb Co. | 1,125,000 | 62,685 | ||||||||
Other securities | 136,236 | |||||||||
|
| |||||||||
| 1,481,553 | ||||||||||
|
| |||||||||
| Financials | JPMorgan Chase & Co. | 3,884,900 | 355,080 | |||||||
| 14.50% | Wells Fargo & Co. | 5,444,000 | 301,652 | |||||||
Prudential Financial, Inc. | 2,649,000 | 286,463 | ||||||||
Citigroup Inc. | 2,531,000 | 169,273 | ||||||||
American International Group, Inc. | 1,506,300 | 94,174 | ||||||||
Other securities | 81,000 | |||||||||
|
| |||||||||
| 1,287,642 | ||||||||||
|
| |||||||||
| Information | Apple Inc. | 1,983,180 | 285,618 | |||||||
| technology | Intel Corp. | 7,487,200 | 252,618 | |||||||
| 13.63% | Texas Instruments Inc. | 2,630,000 | 202,326 | |||||||
Oracle Corp. | 3,150,000 | 157,941 | ||||||||
Microsoft Corp. | 2,050,000 | 141,306 | ||||||||
Western Union Co. | 6,290,000 | 119,825 | ||||||||
Other securities | 50,764 | |||||||||
|
| |||||||||
| 1,210,398 | ||||||||||
|
| |||||||||
| Consumer staples | Altria Group, Inc. | 3,754,000 | 279,560 | |||||||
| 13.04% | Kimberly-Clark Corp. | 1,395,800 | 180,212 | |||||||
Kellogg Co. | 2,152,800 | 149,533 | ||||||||
Philip Morris International Inc. | 1,250,000 | 146,813 | ||||||||
Reynolds American Inc. | 1,607,000 | 104,519 | ||||||||
Mondelez International, Inc. | 1,580,000 | 68,240 | ||||||||
Kraft Heinz Co. | 776,666 | 66,514 | ||||||||
Other securities | 162,787 | |||||||||
|
| |||||||||
| 1,158,178 | ||||||||||
|
| |||||||||
| Industrials | CSX Corp. | 3,641,500 | 198,680 | |||||||
| 9.76% | General Dynamics Corp. | 740,696 | 146,732 | |||||||
Illinois Tool Works Inc. | 650,000 | 93,112 | ||||||||
Union Pacific Corp. | 750,000 | 81,683 | ||||||||
Rockwell Automation | 450,000 | 72,882 | ||||||||
Boeing Co. | 329,000 | 65,060 | ||||||||
General Electric Co. | 2,400,000 | 64,824 | ||||||||
Other securities | 143,711 | |||||||||
|
| |||||||||
| 866,684 | ||||||||||
|
| |||||||||
| Telecommunication | Verizon Communications Inc. | 8,804,171 | 393,194 | |||||||
| services | AT&T Inc. | 4,181,000 | 157,749 | |||||||
| 7.54% | CenturyLink, Inc. | 4,966,000 | 118,588 | |||||||
|
| |||||||||
| 669,531 | ||||||||||
|
| |||||||||
| American Funds Insurance Series | 63 |
Blue Chip Income and Growth Fund
| Common stocks (continued) | Shares | Value (000) | ||||||||
| Energy | Canadian Natural Resources, Ltd. | 6,859,000 | $ | 197,814 | ||||||
| 5.83% | Exxon Mobil Corp. | 2,054,000 | 165,819 | |||||||
Halliburton Co. | 2,419,700 | 103,345 | ||||||||
Other securities | 50,842 | |||||||||
|
| |||||||||
| 517,820 | ||||||||||
|
| |||||||||
| Consumer | Amazon.com, Inc.1 | 104,500 | 101,156 | |||||||
| discretionary | Las Vegas Sands Corp. | 1,435,000 | 91,682 | |||||||
| 4.81% | McDonald’s Corp. | 500,000 | 76,580 | |||||||
General Motors Co. | 2,000,000 | 69,860 | ||||||||
Other securities | 87,945 | |||||||||
|
| |||||||||
| 427,223 | ||||||||||
|
| |||||||||
| Materials | Vale SA, Class A, preferred nominative (ADR) | 14,564,737 | 118,703 | |||||||
| 3.73% | Vale SA, ordinary nominative (ADR) | 460,500 | 4,029 | |||||||
Freeport-McMoRan Inc.1 | 6,840,000 | 82,148 | ||||||||
Other securities | 125,996 | |||||||||
|
| |||||||||
| 330,876 | ||||||||||
|
| |||||||||
| Utilities | Exelon Corp. | 2,263,000 | 81,626 | |||||||
| 1.67% | Other securities | 66,357 | ||||||||
|
| |||||||||
| 147,983 | ||||||||||
|
| |||||||||
Real estate 0.45% | Other securities | 40,072 | ||||||||
|
| |||||||||
Miscellaneous 4.91% | Other common stocks in initial period of acquisition | 435,631 | ||||||||
|
| |||||||||
Total common stocks (cost: $6,803,622,000) | 8,573,591 | |||||||||
|
| |||||||||
| Short-term securities 3.24% | Principal amount (000) | |||||||||
ExxonMobil Corp. 1.14% due 9/11/2017 | $ | 33,000 | 32,924 | |||||||
Federal Home Loan Bank 0.91%–1.03% due 7/19/2017–9/5/2017 | 135,000 | 134,856 | ||||||||
Jupiter Securitization Co., LLC 0.93% due 7/17/20172 | 50,000 | 49,972 | ||||||||
Other securities | 70,180 | |||||||||
|
| |||||||||
Total short-term securities (cost: $287,927,000) | 287,932 | |||||||||
|
| |||||||||
Total investment securities 99.79% (cost: $7,091,549,000) | 8,861,523 | |||||||||
Other assets less liabilities 0.21% | 18,249 | |||||||||
|
| |||||||||
Net assets 100.00% | $ | 8,879,772 | ||||||||
|
| |||||||||
This summary investment portfolio is designed to streamline the report and help investors better focus on the fund’s principal holdings. See the inside back cover for details on how to obtain a complete schedule of portfolio holdings.
As permitted by U.S. Securities and Exchange Commission regulations, “Miscellaneous” securities include holdings in their first year of acquisition that have not previously been publicly disclosed.
“Other securities” includes all issues that are not disclosed separately in the summary investment portfolio.
| 64 | American Funds Insurance Series |
Blue Chip Income and Growth Fund
| 1 | Security did not produce income during the last 12 months. |
| 2 | Acquired in a transaction exempt from registration under Section 4(2) of the Securities Act of 1933. May be resold in the U.S. in transactions exempt from registration, normally to qualified institutional buyers. The total value of all such securities, including those in “Other securities,” was $112,653,000, which represented 1.27% of the net assets of the fund. |
Key to abbreviation
ADR = American Depositary Receipts
See Notes to Financial Statements
| American Funds Insurance Series | 65 |
| ||
| Summary investment portfolio June 30, 2017 | unaudited |
| Common stocks 92.54% | Shares |
Value (000) | ||||||||
| Information | Nintendo Co., Ltd. | 278,000 | $ | 93,132 | ||||||
| technology | Taiwan Semiconductor Manufacturing Co., Ltd. | 9,480,800 | 64,982 | |||||||
| 22.19% | Microsoft Corp. | 907,000 | 62,520 | |||||||
Broadcom Ltd. | 188,000 | 43,813 | ||||||||
Murata Manufacturing Co., Ltd. | 183,000 | 27,773 | ||||||||
Facebook, Inc., Class A1 | 140,300 | 21,183 | ||||||||
Apple Inc. | 138,000 | 19,875 | ||||||||
AAC Technologies Holdings Inc. | 1,503,500 | 18,795 | ||||||||
TE Connectivity Ltd. | 200,000 | 15,736 | ||||||||
Alibaba Group Holding Ltd. (ADR)1 | 105,000 | 14,795 | ||||||||
Alphabet Inc., Class C1 | 9,000 | 8,179 | ||||||||
Alphabet Inc., Class A1 | 6,000 | 5,578 | ||||||||
Other securities | 33,060 | |||||||||
|
| |||||||||
| 429,421 | ||||||||||
|
| |||||||||
| Financials | YES Bank Ltd. | 815,000 | 18,453 | |||||||
| 10.78% | Prudential PLC | 765,000 | 17,546 | |||||||
Blackstone Group LP | 453,250 | 15,116 | ||||||||
First Republic Bank | 145,000 | 14,514 | ||||||||
CIT Group Inc. | 250,000 | 12,175 | ||||||||
Capital One Financial Corp. | 144,000 | 11,897 | ||||||||
Other securities | 118,856 | |||||||||
|
| |||||||||
| 208,557 | ||||||||||
|
| |||||||||
| Industrials | Airbus SE, non-registered shares | 467,000 | 38,404 | |||||||
| 9.93% | Grupo Aeroportuario del Pacífico SAB de CV | 2,080,000 | 23,425 | |||||||
Lockheed Martin Corp. | 82,300 | 22,847 | ||||||||
Boeing Co. | 113,000 | 22,346 | ||||||||
Deutsche Post AG | 523,000 | 19,605 | ||||||||
Flughafen Zürich AG | 69,000 | 16,939 | ||||||||
Ryanair Holdings PLC (ADR)1 | 141,375 | 15,213 | ||||||||
Other securities | 33,256 | |||||||||
|
| |||||||||
| 192,035 | ||||||||||
|
| |||||||||
| Consumer staples | British American Tobacco PLC | 1,144,000 | 77,987 | |||||||
| 9.80% | Nestlé SA | 558,700 | 48,622 | |||||||
Costco Wholesale Corp. | 130,600 | 20,887 | ||||||||
Other securities | 42,166 | |||||||||
|
| |||||||||
| 189,662 | ||||||||||
|
| |||||||||
| Consumer | Amazon.com, Inc.1 | 20,000 | 19,360 | |||||||
| discretionary | Home Depot, Inc. | 122,000 | 18,715 | |||||||
| 8.82% | Sony Corp. | 480,000 | 18,291 | |||||||
ProSiebenSat.1 Media SE | 430,000 | 17,995 | ||||||||
Vivendi SA | 715,200 | 15,921 | ||||||||
Nitori Holdings Co., Ltd. | 105,000 | 14,040 | ||||||||
Other securities | 66,281 | |||||||||
|
| |||||||||
| 170,603 | ||||||||||
|
| |||||||||
| Energy | Royal Dutch Shell PLC, Class B (ADR) | 347,000 | 18,887 | |||||||
| 7.07% | Royal Dutch Shell PLC, Class A (ADR) | 141,457 | 7,524 | |||||||
BP PLC | 4,030,206 | 23,243 | ||||||||
Reliance Industries Ltd.1 | 1,052,094 | 22,462 | ||||||||
| 66 | American Funds Insurance Series |
Global Growth and Income Fund
| Common stocks | Shares | Value (000) | ||||||||
Enbridge Inc. | 260,760 | $ | 10,381 | |||||||
Enbridge Inc. (CAD denominated) | 239,029 | 9,522 | ||||||||
Other securities | 44,840 | |||||||||
|
| |||||||||
| 136,859 | ||||||||||
|
| |||||||||
| Health care | UnitedHealth Group Inc. | 255,100 | 47,301 | |||||||
| 6.99% | Hypermarcas SA, ordinary nominative | 2,150,000 | 18,041 | |||||||
Other securities | 69,904 | |||||||||
|
| |||||||||
| 135,246 | ||||||||||
|
| |||||||||
| Materials | Randgold Resources Ltd. | 271,100 | 24,028 | |||||||
| 4.23% | James Hardie Industries PLC (CDI) | 850,000 | 13,393 | |||||||
Other securities | 44,467 | |||||||||
|
| |||||||||
| 81,888 | ||||||||||
|
| |||||||||
| Real estate | MGM Growth Properties LLC REIT, Class A | 943,856 | 27,551 | |||||||
| 3.61% | Gaming and Leisure Properties, Inc. REIT | 604,000 | 22,753 | |||||||
Other securities | 19,600 | |||||||||
|
| |||||||||
| 69,904 | ||||||||||
|
| |||||||||
| Utilities | Infraestructura Energética Nova, SAB de CV | 6,281,884 | 33,488 | |||||||
| 3.50% | DONG Energy AS | 491,552 | 22,190 | |||||||
Other securities | 12,119 | |||||||||
|
| |||||||||
| 67,797 | ||||||||||
|
| |||||||||
| Telecommunication | Vodafone Group PLC | 4,350,000 | 12,337 | |||||||
| services | Other securities | 20,272 | ||||||||
|
| |||||||||
| 1.69% | 32,609 | |||||||||
|
| |||||||||
| Miscellaneous | Other common stocks in initial period of acquisition | 76,045 | ||||||||
|
| |||||||||
| 3.93% | Total common stocks (cost: $1,435,467,000) | 1,790,626 | ||||||||
|
| |||||||||
| Rights & warrants 0.01% | ||||||||||
| Miscellaneous | Other rights & warrants in initial period of acquisition | 178 | ||||||||
|
| |||||||||
| 0.01% | Total rights & warrants (cost: $187,000) | 178 | ||||||||
|
| |||||||||
| Convertible bonds 0.35% | Principal amount (000) | |||||||||
| Miscellaneous | Other convertible bonds in initial period of acquisition | 6,821 | ||||||||
|
| |||||||||
| 0.35% | Total convertible bonds (cost: $6,003,000) | 6,821 | ||||||||
|
| |||||||||
| Bonds, notes & other debt instruments 1.98% | ||||||||||
| Corporate bonds & notes 1.90% | ||||||||||
| Telecommunication | Sprint Corp. 7.25% 2021 | $ | 33,000 | 36,754 | ||||||
|
| |||||||||
| services | ||||||||||
| 1.90% | ||||||||||
| American Funds Insurance Series | 67 |
Global Growth and Income Fund
| Bonds, notes & other debt instruments (continued) | Principal amount (000) | Value (000) | ||||||||
| U.S. Treasury bonds & notes 0.08% | ||||||||||
| U.S. Treasury | Other securities | $ | 1,599 | |||||||
|
| |||||||||
| 0.08% | Total bonds, notes & other debt instruments (cost: $32,553,000) | 38,353 | ||||||||
|
| |||||||||
| Short-term securities 3.59% | ||||||||||
Bank of Tokyo-Mitsubishi UFJ, Ltd. 1.16% due 7/14/2017 | $47,800 | 47,778 | ||||||||
Nestlé Capital Corp. 1.14% due 9/12/20172 | 15,500 | 15,463 | ||||||||
Other securities | 6,098 | |||||||||
|
| |||||||||
Total short-term securities (cost: $69,341,000) | 69,339 | |||||||||
|
| |||||||||
Total investment securities 98.47% (cost: $1,543,551,000) | 1,905,317 | |||||||||
Other assets less liabilities 1.53% | 29,699 | |||||||||
|
| |||||||||
Net assets 100.00% | $ | 1,935,016 | ||||||||
|
| |||||||||
This summary investment portfolio is designed to streamline the report and help investors better focus on the fund’s principal holdings. See the inside back cover for details on how to obtain a complete schedule of portfolio holdings.
“Other securities” includes all issues that are not disclosed separately in the summary investment portfolio. “Miscellaneous” includes a security which was valued under fair value procedures adopted by authority of the board of trustees. The total value of the security which was valued under fair value procedures was $6,491,000, which represented .34% of the net assets of the fund. This entire amount relates to certain securities trading outside the U.S. whose values were adjusted as a result of significant market movements following the close of local trading.
The following footnotes apply to either the individual securities noted or one or more of the securities aggregated and listed as a single line item.
| 1 | Security did not produce income during the last 12 months. |
| 2 | Acquired in a transaction exempt from registration under Section 4(2) of the Securities Act of 1933. May be resold in the U.S. in transactions exempt from registration, normally to qualified institutional buyers. The total value of all such securities was $15,463,000, which represented .80% of the net assets of the fund. |
Key to abbreviations
ADR = American Depositary Receipts
CAD = Canadian dollars
CDI = CREST Depository Interest
See Notes to Financial Statements
| 68 | American Funds Insurance Series |
| ||
| Summary investment portfolio June 30, 2017 | unaudited |
| Common stocks 92.56% | Shares | Value (000) | ||||||||
| Information | Microsoft Corp. | 9,171,027 | $ | 632,159 | ||||||
| technology | Alphabet Inc., Class A1 | 373,700 | 347,421 | |||||||
| 15.92% | Alphabet Inc., Class C1 | 303,884 | 276,149 | |||||||
Texas Instruments Inc. | 5,992,659 | 461,015 | ||||||||
Broadcom Ltd. | 1,857,590 | 432,911 | ||||||||
Apple Inc. | 2,379,100 | 342,638 | ||||||||
Oracle Corp. | 5,921,000 | 296,879 | ||||||||
Intel Corp. | 7,904,600 | 266,701 | ||||||||
Accenture PLC, Class A | 1,654,500 | 204,629 | ||||||||
QUALCOMM Inc. | 3,218,175 | 177,708 | ||||||||
Other securities | 1,059,988 | |||||||||
|
| |||||||||
| 4,498,198 | ||||||||||
|
| |||||||||
| Consumer | Amazon.com, Inc.1 | 1,061,200 | 1,027,242 | |||||||
| discretionary | Netflix, Inc.1 | 3,716,277 | 555,249 | |||||||
| 14.98% | Comcast Corp., Class A | 6,032,600 | 234,789 | |||||||
Twenty-First Century Fox, Inc., Class A | 6,891,000 | 195,291 | ||||||||
Home Depot, Inc. | 1,243,000 | 190,676 | ||||||||
Time Warner Inc. | 1,767,902 | 177,515 | ||||||||
Other securities | 1,850,600 | |||||||||
|
| |||||||||
| 4,231,362 | ||||||||||
|
| |||||||||
| Health care | AbbVie Inc. | 7,549,600 | 547,422 | |||||||
| 14.57% | Amgen Inc. | 2,858,916 | 492,391 | |||||||
Stryker Corp. | 2,203,757 | 305,837 | ||||||||
UnitedHealth Group Inc. | 1,513,596 | 280,651 | ||||||||
Medtronic PLC | 2,805,700 | 249,006 | ||||||||
Express Scripts Holding Co.1 | 3,627,500 | 231,580 | ||||||||
Gilead Sciences, Inc. | 3,212,100 | 227,352 | ||||||||
Humana Inc. | 877,000 | 211,024 | ||||||||
Merck & Co., Inc. | 3,128,280 | 200,491 | ||||||||
Illumina, Inc.1 | 1,100,300 | 190,924 | ||||||||
Other securities | 1,181,029 | |||||||||
|
| |||||||||
| 4,117,707 | ||||||||||
|
| |||||||||
| Financials | JPMorgan Chase & Co. | 4,499,400 | 411,245 | |||||||
| 11.34% | Goldman Sachs Group, Inc. | 1,010,280 | 224,181 | |||||||
Marsh & McLennan Companies, Inc. | 2,726,100 | 212,527 | ||||||||
Wells Fargo & Co. | 3,381,200 | 187,352 | ||||||||
Bank of New York Mellon Corp. | 3,486,500 | 177,881 | ||||||||
American International Group, Inc. | 2,716,489 | 169,835 | ||||||||
Aon PLC, Class A | 1,214,800 | 161,508 | ||||||||
Other securities | 1,658,137 | |||||||||
|
| |||||||||
| 3,202,666 | ||||||||||
|
| |||||||||
| Industrials | CSX Corp. | 4,913,400 | 268,075 | |||||||
| 8.11% | Union Pacific Corp. | 2,186,433 | 238,124 | |||||||
General Dynamics Corp. | 1,122,100 | 222,288 | ||||||||
Other securities | 1,564,302 | |||||||||
|
| |||||||||
| 2,292,789 | ||||||||||
|
| |||||||||
| Consumer staples | Philip Morris International Inc. | 2,912,130 | 342,030 | |||||||
| 7.27% | Coca-Cola Co. | 5,964,900 | 267,526 | |||||||
Procter & Gamble Co. | 1,887,992 | 164,539 | ||||||||
Other securities | 1,280,352 | |||||||||
|
| |||||||||
| 2,054,447 | ||||||||||
|
| |||||||||
| American Funds Insurance Series | 69 |
Growth-Income Fund
| Common stocks (continued) | Shares | Value (000) | ||||||||
| Energy | TOTAL SA | 4,688,868 | $ | 231,808 | ||||||
| 5.94% | EOG Resources, Inc. | 2,345,155 | 212,284 | |||||||
Chevron Corp. | 1,716,900 | 179,124 | ||||||||
Other securities | 1,055,603 | |||||||||
|
| |||||||||
| 1,678,819 | ||||||||||
|
| |||||||||
| Materials | Celanese Corp., Series A | 3,424,433 | 325,116 | |||||||
| 4.68% | Dow Chemical Co. | 3,554,100 | 224,157 | |||||||
Monsanto Co. | 1,666,485 | 197,245 | ||||||||
Vale SA, Class A, preferred nominative (ADR) | 18,591,184 | 151,518 | ||||||||
Vale SA, Class A, preferred nominative | 4,440,000 | 36,065 | ||||||||
Other securities | 388,416 | |||||||||
|
| |||||||||
| 1,322,517 | ||||||||||
|
| |||||||||
| Real estate | Other securities | 517,877 | ||||||||
|
| |||||||||
| 1.83% | ||||||||||
| Telecommunication | Verizon Communications Inc. | 10,842,400 | 484,221 | |||||||
| services | Other securities | 22,544 | ||||||||
|
| |||||||||
| 1.79% | 506,765 | |||||||||
|
| |||||||||
| Utilities | Sempra Energy | 1,649,600 | 185,992 | |||||||
| 0.85% | Other securities | 53,804 | ||||||||
|
| |||||||||
| 239,796 | ||||||||||
|
| |||||||||
| Mutual funds | Other securities | 132,822 | ||||||||
|
| |||||||||
| 0.47% | ||||||||||
| Miscellaneous | Other common stocks in initial period of acquisition | 1,358,818 | ||||||||
|
| |||||||||
| 4.81% | Total common stocks (cost: $19,495,854,000) | 26,154,583 | ||||||||
|
| |||||||||
| Convertible stocks 0.02% | ||||||||||
| Financials | Other securities | 5,722 | ||||||||
|
| |||||||||
| 0.02% | Total convertible stocks (cost: $6,000,000) | 5,722 | ||||||||
|
| |||||||||
| Convertible bonds 0.33% | Principal amount (000) | |||||||||
| Other | Other securities | 93,133 | ||||||||
|
| |||||||||
| 0.33% | Total convertible bonds (cost: $71,028,000) | 93,133 | ||||||||
|
| |||||||||
| Bonds, notes & other debt instruments 0.20% | ||||||||||
| U.S. Treasury bonds & notes 0.20% | ||||||||||
| U.S. Treasury | U.S. Treasury 1.625% 2026 | $ | 59,900 | 56,801 | ||||||
|
| |||||||||
| 0.20% | Total bonds, notes & other debt instruments (cost: $60,218,000) | 56,801 | ||||||||
|
| |||||||||
| 70 | American Funds Insurance Series |
Growth-Income Fund
| Short-term securities 6.85% | Principal amount (000) | Value (000) | ||||||||
Apple Inc. 0.89% due 7/11/20172 | $ | 50,000 | $ | 49,984 | ||||||
Chariot Funding, LLC 0.95% due 7/7/20172 | 50,000 | 49,988 | ||||||||
Coca-Cola Co. 1.09% due 8/2/20172 | 50,000 | 49,950 | ||||||||
Federal Home Loan Bank 0.80%–1.04% due 7/5/2017–10/3/2017 | 1,169,400 | 1,168,348 | ||||||||
Jupiter Securitization Co., LLC 1.17% due 7/27/20172 | 50,000 | 49,954 | ||||||||
U.S. Treasury Bills 0.59%–0.91% due 7/6/2017–9/21/2017 | 242,100 | 241,864 | ||||||||
Other securities | 325,405 | |||||||||
|
| |||||||||
Total short-term securities (cost: $1,935,411,000) | 1,935,493 | |||||||||
|
| |||||||||
Total investment securities 99.96% (cost: $21,568,511,000) | 28,245,732 | |||||||||
Other assets less liabilities 0.04% | 11,308 | |||||||||
|
| |||||||||
Net assets 100.00% | $ | 28,257,040 | ||||||||
|
| |||||||||
This summary investment portfolio is designed to streamline the report and help investors better focus on the fund’s principal holdings. See the inside back cover for details on how to obtain a complete schedule of portfolio holdings.
As permitted by U.S. Securities and Exchange Commission regulations, “Miscellaneous” securities include holdings in their first year of acquisition that have not previously been publicly disclosed.
“Other securities” includes all issues that are not disclosed separately in the summary investment portfolio. One security in “Other securities” (with a value of $5,722,000, an aggregate cost of $6,000,000, and which represented .02% of the net assets of the fund) was acquired on 6/28/2012 through private placement transactions exempt from registration under the Securities Act of 1933, which may subject it to legal or contractual restrictions on resale.
| 1 | Security did not produce income during the last 12 months. |
| 2 | Acquired in a transaction exempt from registration under Section 4(2) of the Securities Act of 1933. May be resold in the U.S. in transactions exempt from registration, normally to qualified institutional buyers. The total value of all such securities was $500,083,000, which represented 1.77% of the net assets of the fund. |
Key to abbreviation
ADR = American Depositary Receipts
See Notes to Financial Statements
| American Funds Insurance Series | 71 |
International Growth and Income Fund
| ||
| Summary investment portfolio June 30, 2017 | unaudited |
| Common stocks 85.41% | Shares |
Value | ||||||||
| Financials | HDFC Bank Ltd.1 | 1,884,593 | $ | 48,511 | ||||||
| 18.04% | Zurich Insurance Group AG | 83,900 | 24,420 | |||||||
KB Financial Group Inc. | 356,500 | 17,978 | ||||||||
Banco Santander, SA | 2,571,524 | 17,011 | ||||||||
Prudential PLC | 738,000 | 16,927 | ||||||||
St. James’s Place PLC | 1,048,000 | 16,134 | ||||||||
AIA Group Ltd. | 1,833,000 | 13,394 | ||||||||
UniCredit SpA2 | 674,400 | 12,594 | ||||||||
Sampo Oyj, Class A | 203,000 | 10,403 | ||||||||
Lloyds Banking Group PLC | 11,968,000 | 10,311 | ||||||||
BNP Paribas SA | 137,300 | 9,889 | ||||||||
Bank of Montreal | 76,927 | 5,649 | ||||||||
Other securities | 45,458 | |||||||||
|
| |||||||||
| 248,679 | ||||||||||
|
| |||||||||
| �� | ||||||||||
| Consumer staples | Imperial Brands PLC | 734,463 | 32,988 | |||||||
| 10.42% | Philip Morris International Inc. | 208,700 | 24,512 | |||||||
Pernod Ricard SA | 128,650 | 17,228 | ||||||||
British American Tobacco PLC | 212,600 | 14,493 | ||||||||
CALBEE, Inc. | 284,400 | 11,164 | ||||||||
Other securities | 43,232 | |||||||||
|
| |||||||||
| 143,617 | ||||||||||
|
| |||||||||
| Industrials | Shanghai International Airport Co., Ltd., Class A | 5,134,562 | 28,257 | |||||||
| 10.40% | Capita PLC | 3,066,000 | 27,614 | |||||||
Airbus SE, non-registered shares | 163,000 | 13,404 | ||||||||
Abertis Infraestructuras, SA, Class A, non-registered shares | 721,507 | 13,366 | ||||||||
ASSA ABLOY AB, Class B | 585,700 | 12,868 | ||||||||
CK Hutchison Holdings Ltd. | 847,348 | 10,636 | ||||||||
Other securities | 37,151 | |||||||||
|
| |||||||||
| 143,296 | ||||||||||
|
| |||||||||
| Consumer | HUGO BOSS AG | 207,500 | 14,528 | |||||||
| discretionary | Toyota Motor Corp. | 226,000 | 11,841 | |||||||
| 8.04% | Ctrip.com International, Ltd. (ADR)2 | 202,200 | 10,891 | |||||||
Christian Dior SE1 | 33,500 | 9,759 | ||||||||
Other securities | 63,860 | |||||||||
|
| |||||||||
| 110,879 | ||||||||||
|
| |||||||||
| Utilities | EDP - Energias de Portugal, SA | 6,947,820 | 22,719 | |||||||
| 7.70% | DONG Energy AS | 497,000 | 22,436 | |||||||
SSE PLC | 801,800 | 15,174 | ||||||||
Power Assets Holdings Ltd. | 1,313,000 | 11,596 | ||||||||
CK Infrastructure Holdings Ltd. | 1,282,000 | 10,772 | ||||||||
Other securities | 23,472 | |||||||||
|
| |||||||||
| 106,169 | ||||||||||
|
| |||||||||
| Information | Taiwan Semiconductor Manufacturing Co., Ltd. | 4,668,000 | 31,995 | |||||||
| technology | Samsung Electronics Co., Ltd. | 13,671 | 28,402 | |||||||
| 7.48% | Flex Ltd.2 | 703,000 | 11,466 | |||||||
Other securities | 31,277 | |||||||||
|
| |||||||||
| 103,140 | ||||||||||
|
| |||||||||
| 72 | American Funds Insurance Series |
International Growth and Income Fund
| Common stocks | Shares | Value (000) | ||||||||
| Health care | Novartis AG | 341,145 | $ | 28,390 | ||||||
| 6.07% | Teva Pharmaceutical Industries Ltd. (ADR) | 781,700 | 25,968 | |||||||
Other securities | 29,248 | |||||||||
|
| |||||||||
| 83,606 | ||||||||||
|
| |||||||||
| Energy | Royal Dutch Shell PLC, Class A | 1,753,707 | 46,482 | |||||||
| 4.64% | TOTAL SA | 208,000 | 10,283 | |||||||
Other securities | 7,118 | |||||||||
|
| |||||||||
| 63,883 | ||||||||||
|
| |||||||||
| Real estate | Cheung Kong Property Holdings Ltd. | 3,833,348 | 30,024 | |||||||
| 4.41% | Sun Hung Kai Properties Ltd. | 888,000 | 13,046 | |||||||
Other securities | 17,772 | |||||||||
|
| |||||||||
| 60,842 | ||||||||||
|
| |||||||||
| Telecommunication | BT Group PLC | 4,904,461 | 18,828 | |||||||
| services | Nippon Telegraph and Telephone Corp. | 332,800 | 15,712 | |||||||
| 2.75% | Other securities | 3,327 | ||||||||
|
| |||||||||
| 37,867 | ||||||||||
|
| |||||||||
| Materials | Rio Tinto PLC | 274,325 | 11,583 | |||||||
| 2.69% | Fortescue Metals Group Ltd. | 2,403,000 | 9,641 | |||||||
Other securities | 15,822 | |||||||||
|
| |||||||||
| 37,046 | ||||||||||
|
| |||||||||
| Miscellaneous | Other common stocks in initial period of acquisition | 38,208 | ||||||||
|
| |||||||||
| 2.77% | Total common stocks (cost: $1,081,498,000) | 1,177,232 | ||||||||
|
| |||||||||
| Bonds, notes & other debt instruments 2.96% | Principal amount (000) | |||||||||
| Corporate bonds & notes 1.47% | ||||||||||
| Health care | Teva Pharmaceutical Finance Company BV 3.15%–4.10% 2026–2046 | $ | 2,775 | 2,604 | ||||||
| 0.54% | Other securities | 4,823 | ||||||||
|
| |||||||||
| 7,427 | ||||||||||
|
| |||||||||
| Materials | FMG Resources 9.75% 20223 | 5,900 | 6,748 | |||||||
|
| |||||||||
| 0.49% | ||||||||||
| Energy | Other securities | 6,066 | ||||||||
|
| |||||||||
| 0.44% | Total corporate bonds & notes | 20,241 | ||||||||
|
| |||||||||
| Bonds & notes of governments & government agencies outside the U.S. 1.46% | ||||||||||
Other securities | 20,189 | |||||||||
|
| |||||||||
| U.S. Treasury bonds & notes 0.03% | ||||||||||
| U.S. Treasury | Other securities | 419 | ||||||||
|
| |||||||||
| 0.03% | Total bonds, notes & other debt instruments (cost: $38,065,000) | 40,849 | ||||||||
|
| |||||||||
| American Funds Insurance Series | 73 |
International Growth and Income Fund
| Short-term securities 12.16% | Principal amount (000) | Value (000) | ||||||||
Chariot Funding, LLC 1.18% due 7/18/20173 | $15,000 | $ | 14,991 | |||||||
CPPIB Capital Inc. 1.14% due 7/18/20173 | 32,200 | 32,182 | ||||||||
Fairway Finance Corp. 1.24% due 9/13/20173 | 15,000 | 14,960 | ||||||||
Federal Home Loan Bank 1.00%–1.03% due 7/12/2017–8/23/2017 | 45,200 | 45,167 | ||||||||
General Electric Co. 1.08% due 7/3/2017 | 15,600 | 15,599 | ||||||||
Victory Receivables Corp. 1.06%–1.14% due 7/3/2017–7/11/20173 | 30,000 | 29,990 | ||||||||
Other securities | 14,659 | |||||||||
|
| |||||||||
Total short-term securities (cost: $167,548,000) | 167,548 | |||||||||
|
| |||||||||
Total investment securities 100.53% (cost: $1,287,111,000) | 1,385,629 | |||||||||
Other assets less liabilities (0.53)% | (7,261 | ) | ||||||||
|
| |||||||||
Net assets 100.00% | $ | 1,378,368 | ||||||||
|
| |||||||||
This summary investment portfolio is designed to streamline the report and help investors better focus on the fund’s principal holdings. See the inside back cover for details on how to obtain a complete schedule of portfolio holdings.
As permitted by U.S. Securities and Exchange Commission regulations, “Miscellaneous” securities include holdings in their first year of acquisition that have not previously been publicly disclosed.
“Other securities” includes all issues that are not disclosed separately in the summary investment portfolio.
The following footnotes apply to either the individual securities noted or one or more of the securities aggregated and listed as a single line item.
| 1 | Valued under fair value procedures adopted by authority of the board of trustees. The total value of all such securities, including those in “Other securities,“ was $65,021,000, which represented 4.72% of the net assets of the fund. This amount includes $4,659,000 related to certain securities trading outside the U.S. whose values were adjusted as a result of significant market movements following the close of local trading. |
| 2 | Security did not produce income during the last 12 months. |
| 3 | Acquired in a transaction exempt from registration under Rule 144A or Section 4(2) of the Securities Act of 1933. May be resold in the U.S. in transactions exempt from registration, normally to qualified institutional buyers. The total value of all such securities was $103,694,000, which represented 7.52% of the net assets of the fund. |
Key to Abbreviation
ADR = American Depositary Receipts
See Notes to Financial Statements
| 74 | American Funds Insurance Series |
| ||
| Summary investment portfolio June 30, 2017 | unaudited |
| Common stocks 72.88% | Shares |
Value | ||||||||
| Financials | Sampo Oyj, Class A | 217,380 | $ | 11,140 | ||||||
| 14.27% | Swedbank AB, Class A | 211,087 | 5,144 | |||||||
Lloyds Banking Group PLC | 5,949,400 | �� | 5,126 | |||||||
Zurich Insurance Group AG | 17,206 | 5,008 | ||||||||
Mercury General Corp. | 88,510 | 4,780 | ||||||||
KBC Groep NV | 57,447 | 4,357 | ||||||||
HSBC Holdings PLC (GBP denominated) | 437,200 | 4,053 | ||||||||
ABN AMRO Group NV, depository receipts | 141,555 | 3,753 | ||||||||
Other securities | 28,217 | |||||||||
|
| |||||||||
| 71,578 | ||||||||||
|
| |||||||||
| Consumer staples | Philip Morris International Inc. | 190,235 | 22,342 | |||||||
| 12.66% | Coca-Cola Co. | 250,145 | 11,219 | |||||||
Altria Group, Inc. | 149,110 | 11,104 | ||||||||
British American Tobacco PLC | 93,200 | 6,353 | ||||||||
Imperial Brands PLC | 123,800 | 5,561 | ||||||||
Diageo PLC | 168,400 | 4,976 | ||||||||
Other securities | 1,979 | |||||||||
|
| |||||||||
| 63,534 | ||||||||||
|
| |||||||||
| Telecommunication | Vodafone Group PLC | 3,422,700 | 9,707 | |||||||
| services | Singapore Telecommunications Ltd. | 2,861,700 | 8,086 | |||||||
| 7.90% | Verizon Communications Inc. | 151,851 | 6,782 | |||||||
HKT Trust and HKT Ltd., units | 4,775,340 | 6,263 | ||||||||
Other securities | 8,792 | |||||||||
|
| |||||||||
| 39,630 | ||||||||||
|
| |||||||||
| Energy | Royal Dutch Shell PLC, Class B | 279,360 | 7,504 | |||||||
| 7.40% | Royal Dutch Shell PLC, Class B (ADR) | 8,500 | 463 | |||||||
Royal Dutch Shell PLC, Class A | 3,192 | 85 | ||||||||
Exxon Mobil Corp. | 92,600 | 7,476 | ||||||||
Enbridge Inc. (CAD denominated) | 174,970 | 6,970 | ||||||||
Helmerich & Payne, Inc. | 96,200 | 5,227 | ||||||||
Inter Pipeline Ltd. | 244,600 | 4,791 | ||||||||
Other securities | 4,585 | |||||||||
|
| |||||||||
| 37,101 | ||||||||||
|
| |||||||||
| Health care | AstraZeneca PLC | 104,010 | 6,956 | |||||||
| 6.03% | AstraZeneca PLC (ADR) | 114,800 | 3,914 | |||||||
Pfizer Inc. | 232,100 | 7,796 | ||||||||
Roche Holding AG, non-registered shares, nonvoting | 26,075 | 6,640 | ||||||||
Other securities | 4,933 | |||||||||
|
| |||||||||
| 30,239 | ||||||||||
|
| |||||||||
| Information | Taiwan Semiconductor Manufacturing Co., Ltd. | 1,003,000 | 6,875 | |||||||
| technology | Microsoft Corp. | 61,720 | 4,254 | |||||||
| 4.94% | Paychex, Inc. | 67,410 | 3,838 | |||||||
Other securities | 9,790 | |||||||||
|
| |||||||||
| 24,757 | ||||||||||
|
| |||||||||
| Real estate | Crown Castle International Corp. REIT | 83,300 | 8,345 | |||||||
| 4.68% | Iron Mountain Inc. REIT | 165,295 | 5,680 | |||||||
Nexity SA, Class A, non-registered shares | 89,436 | 5,197 | ||||||||
Other securities | 4,262 | |||||||||
|
| |||||||||
| 23,484 | ||||||||||
|
| |||||||||
| American Funds Insurance Series | 75 |
Capital Income Builder
| Common stocks (continued) | Shares | Value (000) | ||||||||
| Industrials | Sydney Airport, units | 963,757 | $ | 5,252 | ||||||
| 4.07% | Boeing Co. | 20,200 | 3,994 | |||||||
Airbus SE, non-registered shares | 45,592 | 3,749 | ||||||||
Other securities | 7,438 | |||||||||
|
| |||||||||
| 20,433 | ||||||||||
|
| |||||||||
| Utilities | SSE PLC | 309,313 | 5,854 | |||||||
| 3.97% | CMS Energy Corp. | 79,100 | 3,658 | |||||||
Other securities | 10,410 | |||||||||
|
| |||||||||
| 19,922 | ||||||||||
|
| |||||||||
| Consumer | Greene King PLC | 549,600 | 4,821 | |||||||
| discretionary | Las Vegas Sands Corp. | 71,400 | 4,562 | |||||||
| 3.60% | Other securities | 8,686 | ||||||||
|
| |||||||||
| 18,069 | ||||||||||
|
| |||||||||
| Materials | Amcor Ltd. | 294,697 | 3,672 | |||||||
| 1.23% | Other securities | 2,506 | ||||||||
|
| |||||||||
| 6,178 | ||||||||||
|
| |||||||||
| Miscellaneous | Other common stocks in initial period of acquisition | 10,684 | ||||||||
|
| |||||||||
| 2.13% | Total common stocks (cost: $346,870,000) | 365,609 | ||||||||
|
| |||||||||
| Convertible stocks 1.22% | ||||||||||
| Real estate | American Tower Corp., Series B, 5.50% depository share, convertible preferred 2018 | 50,600 | 6,134 | |||||||
|
| |||||||||
| 1.22% | Total convertible stocks (cost: $5,305,000) | 6,134 | ||||||||
|
| |||||||||
| Bonds, notes & other debt instruments 20.55% | Principal amount (000) | |||||||||
| Mortgage-backed obligations 7.49% | ||||||||||
| Federal agency | Fannie Mae 4.00% 2036–20471 | $ | 5,869 | 6,208 | ||||||
| mortgage-backed | Fannie Mae 4.00% 20471 | 3,830 | 4,029 | |||||||
| obligations | Freddie Mac 4.00% 20471 | 13,957 | 14,701 | |||||||
| 7.38% | Freddie Mac 4.50% 20471 | 6,924 | 7,419 | |||||||
Freddie Mac 2.50%–4.00% 2032–20471 | 777 | 802 | ||||||||
Other securities | 3,842 | |||||||||
|
| |||||||||
| 37,001 | ||||||||||
|
| |||||||||
| Other | Other securities | 553 | ||||||||
|
| |||||||||
| 0.11% | Total mortgage-backed obligations | 37,554 | ||||||||
|
| |||||||||
| U.S. Treasury bonds & notes 7.47% | ||||||||||
| U.S. Treasury | U.S. Treasury 8.00% 2021 | 5,500 | 6,932 | |||||||
| 6.85% | U.S. Treasury 8.125% 2021 | 8,200 | 10,267 | |||||||
U.S. Treasury 1.875% 2022 | 3,900 | 3,905 | ||||||||
U.S. Treasury 2.00% 2025 | 9,400 | 9,242 | ||||||||
U.S. Treasury 2.00%–2.88% 2026–2045 | 4,100 | 4,018 | ||||||||
|
| |||||||||
| 34,364 | ||||||||||
|
| |||||||||
| 76 | American Funds Insurance Series |
Capital Income Builder
| Bonds, notes & other debt instruments | Principal amount (000) | Value (000) | ||||||||
| U.S. Treasury | U.S. Treasury Inflation-Protected Securities 0.38%-0.63% 2025-20262 | $ | 3,089 | $ | 3,096 | |||||
|
| |||||||||
| inflation-protected | Total U.S. Treasury bonds & notes | 37,460 | ||||||||
|
| |||||||||
| securities | ||||||||||
| 0.62% | ||||||||||
| Corporate bonds & notes 4.57% | ||||||||||
| Financials | Other securities | 7,592 | ||||||||
|
| |||||||||
| 1.51% | ||||||||||
| Consumer staples | Altria Group, Inc. 9.25% 2019 | 200 | 230 | |||||||
| 0.40% | Other securities | 1,767 | ||||||||
|
| |||||||||
| 1,997 | ||||||||||
|
| |||||||||
| Telecommunication | Verizon Communications Inc. 4.50%-4.60% 2020-2021 | 600 | 643 | |||||||
|
| |||||||||
| services | ||||||||||
| 0.13% | ||||||||||
| Other | Other securities | 12,695 | ||||||||
|
| |||||||||
| 2.53% | Total corporate bonds & notes | 22,927 | ||||||||
|
| |||||||||
| Asset-backed obligations 1.02% | ||||||||||
Other securities | 5,117 | |||||||||
|
| |||||||||
Total bonds, notes & other debt instruments (cost: $103,148,000) | 103,058 | |||||||||
|
| |||||||||
| Short-term securities 5.06% | ||||||||||
Total short-term securities (cost: $25,392,000) | 25,394 | |||||||||
|
| |||||||||
Total investment securities 99.71% (cost: $480,715,000) | 500,195 | |||||||||
Other assets less liabilities 0.29% | 1,468 | |||||||||
|
| |||||||||
Net assets 100.00% | $ | 501,663 | ||||||||
|
| |||||||||
This summary investment portfolio is designed to streamline the report and help investors better focus on the fund’s principal holdings. See the inside back cover for details on how to obtain a complete schedule of portfolio holdings.
As permitted by U.S. Securities and Exchange Commission regulations, “Miscellaneous” securities include holdings in their first year of acquisition that have not previously been publicly disclosed.
“Other securities” includes all issues that are not disclosed separately in the summary investment portfolio. “Other securities” includes securities which were valued under fair value procedures adopted by authority of the board of trustees. The total value of securities which were valued under fair value procedures was $1,125,000, which represented .22% of the net assets of the fund. This amount includes $1,040,000 related to certain securities trading outside the U.S. whose values were adjusted as a result of significant market movements following the close of local trading. “Other securities“ also includes securities (with an aggregate value of $484,000, which represented .10% of the net assets of the fund) which were acquired in transactions exempt from registration under Rule 144A of the Securities Act of 1933 and may be resold in the U.S. in transactions exempt from registration, normally to qualified institutional buyers.
| American Funds Insurance Series | 77 |
Capital Income Builder
Forward currency contracts
| Contract amount | ||||||||||||||||
| Purchases (000) | Sales (000) | Counterparty | Settlement date | Unrealized depreciation at 6/30/2017 (000) | ||||||||||||
| USD257 | NZD357 | Bank of America, N.A. | 7/21/2017 | $(5) | ||||||||||||
The following footnotes apply to either the individual securities noted or one or more of the securities aggregated and listed as a single line item.
| 1 | Principal payments may be made periodically. Therefore, the effective maturity date may be earlier than the stated maturity date. |
| 2 | Index-linked bond whose principal amount moves with a government price index. |
Key to abbreviations
ADR = American Depositary Receipts
CAD = Canadian dollars
GBP = British pounds
USD/$ = U.S. dollars
See Notes to Financial Statements
| 78 | American Funds Insurance Series |
| ||
| Summary investment portfolio June 30, 2017 | unaudited |
| Common stocks 62.94% | Shares | Value (000) | ||||||||
| Information | Microsoft Corp. | 10,820,000 | $ | 745,823 | ||||||
| technology | Taiwan Semiconductor Manufacturing Co., Ltd. (ADR) | 15,550,000 | 543,628 | |||||||
| 18.29% | Taiwan Semiconductor Manufacturing Co., Ltd. | 8,600,000 | 58,945 | |||||||
ASML Holding NV (New York registered) | 2,502,100 | 326,049 | ||||||||
ASML Holding NV | 50,859 | 6,628 | ||||||||
VeriSign, Inc.1 | 3,240,000 | 301,190 | ||||||||
Broadcom Ltd. | 1,245,000 | 290,147 | ||||||||
Facebook, Inc., Class A1 | 1,722,000 | 259,987 | ||||||||
Intel Corp. | 6,000,000 | 202,440 | ||||||||
Apple Inc. | 1,132,850 | 163,153 | ||||||||
Western Digital Corp. | 1,800,000 | 159,480 | ||||||||
AAC Technologies Holdings Inc. | 12,661,500 | 158,280 | ||||||||
Alphabet Inc., Class C | 168,985 | 153,562 | ||||||||
Intuit Inc. | 1,133,200 | 150,500 | ||||||||
Symantec Corp. | 5,000,000 | 141,250 | ||||||||
Texas Instruments Inc. | 1,520,200 | 116,949 | ||||||||
Other securities | 546,100 | |||||||||
|
| |||||||||
| 4,324,111 | ||||||||||
|
| |||||||||
| Health care | UnitedHealth Group Inc. | 2,431,000 | 450,756 | |||||||
| 8.52% | Johnson & Johnson | 2,850,000 | 377,026 | |||||||
Humana Inc. | 1,310,000 | 315,212 | ||||||||
Express Scripts Holding Co.1 | 3,550,000 | 226,632 | ||||||||
Merck & Co., Inc. | 2,170,300 | 139,095 | ||||||||
Other securities | 503,990 | |||||||||
|
| |||||||||
| 2,012,711 | ||||||||||
|
| |||||||||
| Consumer | Comcast Corp., Class A | 12,246,000 | 476,614 | |||||||
| discretionary | Newell Brands Inc. | 5,600,000 | 300,272 | |||||||
| 7.96% | Home Depot, Inc. | 1,600,000 | 245,440 | |||||||
Amazon.com, Inc.1 | 210,225 | 203,498 | ||||||||
VF Corp. | 2,730,000 | 157,248 | ||||||||
General Motors Co. | 3,500,000 | 122,255 | ||||||||
Other securities | 376,668 | |||||||||
|
| |||||||||
| 1,881,995 | ||||||||||
|
| |||||||||
| Financials | JPMorgan Chase & Co. | 4,400,000 | 402,160 | |||||||
| 7.68% | Chubb Ltd. | 2,458,500 | 357,417 | |||||||
First Republic Bank | 2,480,000 | 248,248 | ||||||||
Citigroup Inc. | 2,750,000 | 183,920 | ||||||||
Bank of America Corp. | 7,000,000 | 169,820 | ||||||||
Other securities | 454,362 | |||||||||
|
| |||||||||
| 1,815,927 | ||||||||||
|
| |||||||||
| Consumer staples | Philip Morris International Inc. | 4,794,000 | 563,055 | |||||||
| 5.18% | Associated British Foods PLC | 4,600,000 | 175,904 | |||||||
Nestlé SA | 908,230 | 79,041 | ||||||||
Nestlé SA (ADR) | 900,000 | 78,480 | ||||||||
Other securities | 327,673 | |||||||||
|
| |||||||||
| 1,224,153 | ||||||||||
|
| |||||||||
| Energy | Noble Energy, Inc. | 9,000,000 | 254,700 | |||||||
| 4.48% | Weatherford International PLC1 | 48,600,000 | 188,082 | |||||||
Chevron Corp. | 1,279,750 | 133,516 | ||||||||
Other securities | 483,206 | |||||||||
|
| |||||||||
| 1,059,504 | ||||||||||
|
| |||||||||
| American Funds Insurance Series | 79 |
Asset Allocation Fund
| Common stocks (continued) | Shares | Value (000) | ||||||||
| Industrials | Lockheed Martin Corp. | 1,422,000 | $ | 394,761 | ||||||
| 3.53% | Boeing Co. | 1,551,800 | 306,869 | |||||||
Other securities | 132,724 | |||||||||
|
| |||||||||
| 834,354 | ||||||||||
|
| |||||||||
| Materials | E.I. du Pont de Nemours and Co. | 4,405,000 | 355,528 | |||||||
| 3.39% | LyondellBasell Industries NV | 2,200,000 | 185,658 | |||||||
Other securities | 261,012 | |||||||||
|
| |||||||||
| 802,198 | ||||||||||
|
| |||||||||
| Real estate | Other securities | 279,872 | ||||||||
|
| |||||||||
| 1.19% | ||||||||||
| Telecommunication | AT&T Inc. | 3,700,800 | 139,631 | |||||||
| services | Other securities | 90,487 | ||||||||
|
| |||||||||
| 0.97% | 230,118 | |||||||||
|
| |||||||||
| Utilities | Other securities | 76,630 | ||||||||
|
| |||||||||
| 0.33% | ||||||||||
| Miscellaneous | Other common stocks in initial period of acquisition | 335,415 | ||||||||
|
| |||||||||
| 1.42% | Total common stocks (cost: $10,593,691,000) | 14,876,988 | ||||||||
|
| |||||||||
| Convertible stocks 0.04% | ||||||||||
| Industrials | Other securities | 4,426 | ||||||||
|
| |||||||||
| 0.02% | ||||||||||
| Miscellaneous | Other convertible stocks in initial period of acquisition | 5,350 | ||||||||
|
| |||||||||
| 0.02% | Total convertible stocks (cost: $19,828,000) | 9,776 | ||||||||
|
| |||||||||
| Bonds, notes & other debt instruments 29.13% | Principal amount (000) | |||||||||
| U.S. Treasury bonds & notes 12.55% | ||||||||||
| U.S. Treasury | U.S. Treasury 1.50% 2019 | $ 400,000 | 400,924 | |||||||
| 10.27% | U.S. Treasury 1.25% 20202 | 328,117 | 326,102 | |||||||
U.S. Treasury 1.625% 2020 | 125,000 | 125,156 | ||||||||
U.S. Treasury 2.875% 2046 | 147,158 | 148,198 | ||||||||
U.S. Treasury 3.00% 2047 | 112,750 | 116,484 | ||||||||
U.S. Treasury 0.63%-4.75% 2018-2046 | 1,312,407 | 1,312,155 | ||||||||
|
| |||||||||
| 2,429,019 | ||||||||||
|
| |||||||||
| U.S. Treasury | U.S. Treasury Inflation-Protected Security 0.625% 20243 | 213,965 | 217,193 | |||||||
| inflation-protected | U.S. Treasury Inflation-Protected Security 1.375% 20443 | 134,572 | 146,704 | |||||||
| securities | U.S. Treasury Inflation-Protected Securities 0.13%-2.63% 2017-20463 | 176,480 | 174,433 | |||||||
|
| |||||||||
| 2.28% | 538,330 | |||||||||
|
| |||||||||
Total U.S. Treasury bonds & notes | 2,967,349 | |||||||||
|
| |||||||||
| 80 | American Funds Insurance Series |
Asset Allocation Fund
| Bonds, notes & other debt instruments | Principal amount (000) | Value (000) | ||||||||
| Corporate bonds & notes 9.69% | ||||||||||
| Energy | Other securities | $ | 451,692 | |||||||
|
| |||||||||
| 1.91% | ||||||||||
| Financials | ACE INA Holdings Inc. 2.30%-4.35% 2020-2045 | $ 6,905 | 7,084 | |||||||
| 1.50% | JPMorgan Chase & Co. 2.55%-5.30% 2020-2049 | 13,252 | 13,467 | |||||||
Other securities | 334,443 | |||||||||
|
| |||||||||
| 354,994 | ||||||||||
|
| |||||||||
| Health care | Johnson & Johnson 2.25%-3.75% 2022-2047 | 11,785 | 12,009 | |||||||
| 1.38% | UnitedHealth Group Inc. 3.35% 2022 | 4,355 | 4,549 | |||||||
Other securities | 310,806 | |||||||||
|
| |||||||||
| 327,364 | ||||||||||
|
| |||||||||
| Consumer | Comcast Corp. 1.63%-5.88% 2018-2036 | 9,285 | 8,875 | |||||||
| discretionary | Home Depot, Inc. 1.80%-4.25% 2020-2047 | 13,665 | 13,890 | |||||||
| 0.92% | Newell Rubbermaid Inc. 2.60%-5.50% 2019-2046 | 9,253 | 9,825 | |||||||
Other securities | 185,214 | |||||||||
|
| |||||||||
| 217,804 | ||||||||||
|
| |||||||||
| Industrials | Lockheed Martin Corp. 2.50%-3.55% 2020-2026 | 15,050 | 15,474 | |||||||
| 0.48% | Other securities | 96,927 | ||||||||
|
| |||||||||
| 112,401 | ||||||||||
|
| |||||||||
| Consumer staples | Philip Morris International Inc. 1.88%-4.25% 2020-2044 | 13,445 | 13,608 | |||||||
| 0.47% | Other securities | 96,430 | ||||||||
|
| |||||||||
| 110,038 | ||||||||||
|
| |||||||||
| Information | Apple Inc. 2.50%-3.35% 2022-2027 | 3,695 | 3,739 | |||||||
| technology | Broadcom Ltd. 2.38%-3.88% 2020-20274 | 19,670 | 20,114 | |||||||
| 0.43% | Microsoft Corp. 2.40%-4.20% 2026-2037 | 10,150 | 10,692 | |||||||
Other securities | 67,529 | |||||||||
|
| |||||||||
| 102,074 | ||||||||||
|
| |||||||||
| Other | Other securities | 614,941 | ||||||||
|
| |||||||||
| 2.60% | Total corporate bonds & notes | 2,291,308 | ||||||||
|
| |||||||||
| Mortgage-backed obligations 5.68% | ||||||||||
| Federal agency | Fannie Mae 0%-7.50% 2021-20565,6,7 | 582,350 | 606,624 | |||||||
| mortgage-backed | Freddie Mac 1.69%-6.50% 2022-20505,6,7 | 419,104 | 435,897 | |||||||
| obligations | Other securities | 223,537 | ||||||||
|
| |||||||||
| 5.36% | 1,266,058 | |||||||||
|
| |||||||||
| Other | Other securities | 75,787 | ||||||||
|
| |||||||||
| 0.32% | Total mortgage-backed obligations | 1,341,845 | ||||||||
|
| |||||||||
| American Funds Insurance Series | 81 |
Asset Allocation Fund
| Bonds, notes & other debt instruments (continued) | Principal amount (000) | Value (000) | ||||||||
| Federal agency bonds & notes 0.22% | ||||||||||
Fannie Mae 1.88%-2.00% 2022-2026 | $ 16,000 | $ | 15,378 | |||||||
Federal Home Loan Bank 0.875% 2018 | 17,140 | 17,071 | ||||||||
Freddie Mac 0.75% 2018 | 18,768 | 18,702 | ||||||||
Other securities | 210 | |||||||||
|
| |||||||||
Total federal agency bonds & notes | 51,361 | |||||||||
|
| |||||||||
| Other 0.99% | ||||||||||
Other securities | 234,779 | |||||||||
|
| |||||||||
Total bonds, notes & other debt instruments (cost: $6,822,677,000) | 6,886,642 | |||||||||
|
| |||||||||
| Short-term securities 9.92% | ||||||||||
Apple Inc. 0.91%-0.92% due 7/18/2017-7/25/20174 | 100,000 | 99,935 | ||||||||
Federal Home Loan Bank 0.64%-1.05% due 7/3/2017-10/10/2017 | 1,551,500 | 1,550,290 | ||||||||
Johnson & Johnson 1.07%-1.12% due 8/31/2017-9/19/20174 | 85,000 | 84,819 | ||||||||
Jupiter Securitization Co., LLC 1.17% due 7/27/20174 | 50,000 | 49,954 | ||||||||
Microsoft Corp. 1.02% due 8/22/20174 | 34,200 | 34,143 | ||||||||
U.S. Treasury Bills 0.59%-0.91% due 7/6/2017-8/24/2017 | 368,700 | 368,423 | ||||||||
Other securities | 157,419 | |||||||||
|
| |||||||||
Total short-term securities (cost: $2,344,887,000) | 2,344,983 | |||||||||
|
| |||||||||
Total investment securities 102.03% (cost: $19,781,083,000) | 24,118,389 | |||||||||
Other assets less liabilities (2.03)% | (479,072 | ) | ||||||||
|
| |||||||||
Net assets 100.00% | $ | 23,639,317 | ||||||||
|
| |||||||||
This summary investment portfolio is designed to streamline the report and help investors better focus on the fund’s principal holdings. See the inside back cover for details on how to obtain a complete schedule of portfolio holdings.
As permitted by U.S. Securities and Exchange Commission regulations, “Miscellaneous” securities include holdings in their first year of acquisition that have not previously been publicly disclosed.
“Other securities” includes all issues that are not disclosed separately in the summary investment portfolio. “Miscellaneous” and “Other securities” includes securities which were valued under fair value procedures adopted by authority of the board of trustees. The total value of securities which were valued under fair value procedures was $38,105,000, which represented .16% of the net assets of the fund. “Other securities” also includes loan participations and assignments, which may be subject to legal or contractual restrictions on resale. The total value of all such loans was $57,784,000, which represented .24% of the net assets of the fund. Some securities in “Other securities” (with an aggregate value of $27,635,000, an aggregate cost of $48,070,000, and which represented .12% of the net assets of the fund) were acquired from 3/10/2010 to 3/6/2017 through private placement transactions exempt from registration under the Securities Act of 1933, which may subject them to legal or contractual restrictions on resale.
Futures contracts
| Contracts | Type | Number of contracts | Expiration | Notional amount8 (000) | Value at 6/30/20179 (000) | Unrealized | ||||||||||||||||||
10 Year U.S. Treasury Note Futures | Short | 200 | September 2017 | $ | (20,000 | ) | $ | (25,106 | ) | $145 | ||||||||||||||
2 Year U.S. Treasury Note Futures | Short | 883 | October 2017 | (176,600 | ) | (190,825 | ) | 200 | ||||||||||||||||
| ||||||||||||||||||||||||
| $345 | ||||||||||||||||||||||||
| ||||||||||||||||||||||||
| 82 | American Funds Insurance Series |
Asset Allocation Fund
Swap contracts
Interest rate swaps
| Receive | Pay | Expiration date | Notional (000) | Value at 6/30/2017 (000) | Upfront payments/ receipts (000) | Unrealized (depreciation) appreciation at 6/30/2017 (000) | ||||||||||||||||||||
3-month USD-LIBOR | 1.875% | 3/20/2019 | $ | 2,320,000 | $ (511 | ) | $– | $ (511 | ) | |||||||||||||||||
1.32625% | U.S. EFFR | 4/5/2019 | 366,600 | (396 | ) | – | (396 | ) | ||||||||||||||||||
3-month USD-LIBOR | 1.501% | 6/8/2019 | 100,000 | 180 | – | 180 | ||||||||||||||||||||
1.336% | U.S. EFFR | 6/8/2019 | 100,000 | (142 | ) | – | (142 | ) | ||||||||||||||||||
1.6365% | 3-month USD-LIBOR | 10/16/2019 | 124,000 | (32 | ) | – | (32 | ) | ||||||||||||||||||
3-month USD-LIBOR | 3.402% | 6/23/2044 | 18,000 | (3,218 | ) | – | (3,218 | ) | ||||||||||||||||||
3-month USD-LIBOR | 2.945% | 10/16/2044 | 28,000 | (2,411 | ) | – | (2,411 | ) | ||||||||||||||||||
|
|
|
| |||||||||||||||||||||||
| $– | $(6,530 | ) | ||||||||||||||||||||||||
|
|
|
| |||||||||||||||||||||||
The following footnotes apply to either the individual securities noted or one or more of the securities aggregated and listed as a single line item.
| 1 | Security did not produce income during the last 12 months. |
| 2 | A portion of this security was pledged as collateral. The total value of pledged collateral was $7,892,000, which represented .03% of the net assets of the fund. |
| 3 | Index-linked bond whose principal amount moves with a government price index. |
| 4 | Acquired in a transaction exempt from registration under Rule 144A or Section 4(2) of the Securities Act of 1933. May be resold in the U.S. in transactions exempt from registration, normally to qualified institutional buyers. The total value of all such securities, including those in “Other securities,” was $1,152,860,000, which represented 4.88% of the net assets of the fund. |
| 5 | Principal payments may be made periodically. Therefore, the effective maturity date may be earlier than the stated maturity date. |
| 6 | Coupon rate may change periodically. |
| 7 | Purchased on a TBA basis. |
| 8 | Notional amount is calculated based on the number of contracts and notional contract size. |
| 9 | Value is calculated based on the notional amount and current market price. |
Key to abbreviations and symbol
ADR = American Depositary Receipts
EFFR = Federal Funds Effective Rate
LIBOR = London Interbank Offered Rate
TBA = To-be-announced
USD/$ = U.S. dollars
See Notes to Financial Statements
| American Funds Insurance Series | 83 |
| Global Balanced Fund | ||
| Summary investment portfolio June 30, 2017 | unaudited |
| Common stocks 62.81% | Shares | Value (000) | ||||||||
| Information | Nintendo Co., Ltd. | 19,800 | $ | 6,633 | ||||||
| technology | Microsoft Corp. | 76,100 | 5,246 | |||||||
| 12.53% | ASML Holding NV | 35,689 | 4,651 | |||||||
Taiwan Semiconductor Manufacturing Co., Ltd. | 664,000 | 4,551 | ||||||||
Alphabet Inc., Class C1 | 2,155 | 1,958 | ||||||||
Keyence Corp. | 4,400 | 1,930 | ||||||||
Broadcom Ltd. | 7,850 | 1,830 | ||||||||
Amphenol Corp., Class A | 24,000 | 1,772 | ||||||||
Symantec Corp. | 62,565 | 1,768 | ||||||||
Samsung Electronics Co., Ltd. | 830 | 1,724 | ||||||||
Other securities | 4,231 | |||||||||
|
| |||||||||
| 36,294 | ||||||||||
|
| |||||||||
| Consumer staples | British American Tobacco PLC | 84,150 | 5,736 | |||||||
| 7.92% | Philip Morris International Inc. | 30,200 | 3,547 | |||||||
Nestlé SA | 33,200 | 2,889 | ||||||||
Reynolds American Inc. | 42,104 | 2,738 | ||||||||
Altria Group, Inc. | 31,000 | 2,309 | ||||||||
Other securities | 5,708 | |||||||||
|
| |||||||||
| 22,927 | ||||||||||
|
| |||||||||
| Industrials | Boeing Co. | 18,500 | 3,658 | |||||||
| 7.40% | Flughafen Zürich AG | 12,235 | 3,004 | |||||||
ASSA ABLOY AB, Class B | 118,000 | 2,593 | ||||||||
BAE Systems PLC | 280,000 | 2,310 | ||||||||
AB Volvo, Class B | 102,000 | 1,739 | ||||||||
Edenred SA | 65,000 | 1,695 | ||||||||
General Electric Co. | 54,000 | 1,459 | ||||||||
Other securities | 4,988 | |||||||||
|
| |||||||||
| 21,446 | ||||||||||
|
| |||||||||
| Financials | JPMorgan Chase & Co. | 42,700 | 3,903 | |||||||
| 6.64% | HSBC Holdings PLC (GBP denominated) | 303,468 | 2,813 | |||||||
BM&FBOVESPA SA - Bolsa de Valores, Mercadorias e Futuros, ordinary nominative | 376,000 | 2,241 | ||||||||
HDFC Bank Ltd. (ADR) | 21,605 | 1,879 | ||||||||
AIA Group Ltd. | 250,000 | 1,827 | ||||||||
BlackRock, Inc. | 4,000 | 1,689 | ||||||||
Other securities | 4,886 | |||||||||
|
| |||||||||
| 19,238 | ||||||||||
|
| |||||||||
| Health care | Humana Inc. | 20,830 | 5,012 | |||||||
| 5.74% | Merck & Co., Inc. | 58,120 | 3,725 | |||||||
Mettler-Toledo International Inc.1 | 3,500 | 2,060 | ||||||||
Fisher & Paykel Healthcare Corp. Ltd. | 204,000 | 1,712 | ||||||||
Other securities | 4,103 | |||||||||
|
| |||||||||
| 16,612 | ||||||||||
|
| |||||||||
| Consumer | Amazon.com, Inc.1 | 3,600 | 3,485 | |||||||
| discretionary | Home Depot, Inc. | 22,030 | 3,380 | |||||||
| 4.76% | Peugeot SA | 119,000 | 2,374 | |||||||
Nokian Renkaat Oyj | 50,634 | 2,096 | ||||||||
Other securities | 2,439 | |||||||||
|
| |||||||||
| 13,774 | ||||||||||
|
| |||||||||
| 84 | American Funds Insurance Series |
Global Balanced Fund
| Common stocks | Shares | Value (000) | ||||||||
| Materials | E.I. du Pont de Nemours and Co. | 37,500 | $ | 3,027 | ||||||
| 4.75% | Other securities | 10,721 | ||||||||
|
| |||||||||
| 13,748 | ||||||||||
|
| |||||||||
| Energy | Royal Dutch Shell PLC, Class B | 100,000 | 2,686 | |||||||
| 4.37% | ConocoPhillips | 49,506 | 2,176 | |||||||
Enbridge Inc. (CAD denominated) | 50,594 | 2,016 | ||||||||
LUKOIL Oil Co. PJSC (ADR) | 39,800 | 1,938 | ||||||||
Other securities | 3,832 | |||||||||
|
| |||||||||
| 12,648 | ||||||||||
|
| |||||||||
| Utilities | Dominion Energy, Inc. | 28,500 | 2,184 | |||||||
| 2.17% | Enel Américas SA (ADR) | 197,000 | 1,857 | |||||||
Other securities | 2,237 | |||||||||
|
| |||||||||
| 6,278 | ||||||||||
|
| |||||||||
| Real estate | Equinix, Inc. REIT | 4,240 | 1,820 | |||||||
| 1.18% | Other securities | 1,610 | ||||||||
|
| |||||||||
| 3,430 | ||||||||||
|
| |||||||||
| Telecommunication | Other securities | 1,804 | ||||||||
|
| |||||||||
services 0.62% | ||||||||||
| Miscellaneous | Other common stocks in initial period of acquisition | 13,687 | ||||||||
|
| |||||||||
| 4.73% | Total common stocks (cost: $142,482,000) | 181,886 | ||||||||
|
| |||||||||
| Bonds, notes & other debt instruments 31.18% | Principal amount (000) | |||||||||
| Bonds & notes of governments & government agencies outside the U.S. 14.54% | ||||||||||
Japan 0.10%-2.30% 2018-20442 | ¥809,803 | 7,805 | ||||||||
Poland (Republic of) 3.25%-5.75% 2017-2025 | PLN13,590 | 3,979 | ||||||||
Russian Federation 7.00% 2023 | RUB135,000 | 2,209 | ||||||||
United Mexican States 4.00%-10.00% 2017-20402 | MXN53,729 | 3,089 | ||||||||
United Mexican States 4.60%-4.75% 2044-2046 | $ 350 | 347 | ||||||||
Other securities | 24,667 | |||||||||
|
| |||||||||
| 42,096 | ||||||||||
|
| |||||||||
| U.S. Treasury bonds & notes 8.53% | ||||||||||
| U.S. Treasury | U.S. Treasury 0.75%-3.13% 2017-2046 | 17,763 | 17,681 | |||||||
|
| |||||||||
| 6.10% | ||||||||||
| U.S. Treasury | U.S. Treasury Inflation-Protected Securities 0.13%–2.38% 2021–20442 | 6,983 | 7,032 | |||||||
|
| |||||||||
| inflation-protected | Total U.S. Treasury bonds & notes | 24,713 | ||||||||
|
| |||||||||
| securities | ||||||||||
| 2.43% | ||||||||||
| American Funds Insurance Series | 85 |
Global Balanced Fund
| Bonds, notes & other debt instruments (continued) | Principal amount (000) | Value (000) | ||||||||
| Corporate bonds & notes 6.86% | ||||||||||
| Financials | HSBC Holdings PLC 3.375% 2024 | € 100 | $ | 120 | ||||||
| 1.70% | HSBC Holdings PLC 3.90%-4.30% 2026 | $ 400 | 420 | |||||||
JPMorgan Chase & Co. 2.55%-6.75% 2021-2049 | 389 | 407 | ||||||||
Other securities | 3,987 | |||||||||
|
| |||||||||
| 4,934 | ||||||||||
|
| |||||||||
| Health care | Humana Inc. 3.15% 2022 | 100 | 102 | |||||||
| 0.71% | Other securities | 1,945 | ||||||||
|
| |||||||||
| 2,047 | ||||||||||
|
| |||||||||
| Consumer staples | Philip Morris International Inc. 2.00%-4.25% 2020-2044 | 195 | 198 | |||||||
| 0.44% | Reynolds American Inc. 4.00%-5.85% 2022-2045 | 145 | 160 | |||||||
Other securities | 900 | |||||||||
|
| |||||||||
| 1,258 | ||||||||||
|
| |||||||||
| Information | Microsoft Corp. 2.40%-3.30% 2026-2027 | 640 | 651 | |||||||
| technology | Other securities | 338 | ||||||||
|
| |||||||||
| 0.34% | 989 | |||||||||
|
| |||||||||
| Industrials | General Electric Capital Corp. 3.15% 2022 | 50 | 52 | |||||||
| 0.25% | Other securities | 671 | ||||||||
|
| |||||||||
| 723 | ||||||||||
|
| |||||||||
| Other | Other securities | 9,903 | ||||||||
|
| |||||||||
| 3.42% | Total corporate bonds & notes | 19,854 | ||||||||
|
| |||||||||
| Mortgage-backed obligations 1.18% | ||||||||||
| Other | Other securities | 3,413 | ||||||||
|
| |||||||||
| 1.18% | Total mortgage-backed obligations | 3,413 | ||||||||
|
| |||||||||
| Asset-backed obligations 0.07% | ||||||||||
Other securities | 200 | |||||||||
|
| |||||||||
Total bonds, notes & other debt instruments (cost: $90,647,000) | 90,276 | |||||||||
|
| |||||||||
| Short-term securities 5.18% | ||||||||||
British Columbia (Province of) 0.92% due 7/17/2017 | 3,000 | 2,998 | ||||||||
CPPIB Capital Inc. 1.16% due 7/18/20173 | 3,000 | 2,998 | ||||||||
General Electric Co. 1.08% due 7/3/2017 | 3,400 | 3,400 | ||||||||
Gotham Funding Corp. 1.20% due 7/14/20173 | 2,000 | 1,999 | ||||||||
U.S. Treasury Bills 0.63% due 7/6/2017 | 1,500 | 1,500 | ||||||||
Victory Receivables Corp. 1.20% due 7/17/20173 | 2,100 | 2,099 | ||||||||
|
| |||||||||
Total short-term securities (cost: $14,995,000) | 14,994 | |||||||||
|
| |||||||||
Total investment securities 99.17% (cost: $248,124,000) | 287,156 | |||||||||
Other assets less liabilities 0.83% | 2,396 | |||||||||
|
| |||||||||
Net assets 100.00% | $ | 289,552 | ||||||||
|
| |||||||||
This summary investment portfolio is designed to streamline the report and help investors better focus on the fund’s principal holdings. See the inside back cover for details on how to obtain a complete schedule of portfolio holdings.
| 86 | American Funds Insurance Series |
Global Balanced Fund
As permitted by U.S. Securities and Exchange Commission regulations, “Miscellaneous” securities include holdings in their first year of acquisition that have not previously been publicly disclosed.
“Other securities” includes all issues that are not disclosed separately in the summary investment portfolio. “Other securities” includes securities which were valued under fair value procedures adopted by authority of the board of trustees. The total value of securities which were valued under fair value procedures was $2,240,000, which represented .77% of the net assets of the fund. This amount includes $1,468,000 related to certain securities trading outside the U.S. whose values were adjusted as a result of significant market movements following the close of local trading.
Forward currency contracts
| Contract amount | Unrealized appreciation (depreciation) | |||||||||||||||
| Purchases (000) | Sales (000) | Counterparty | Settlement date | at 6/30/2017 (000) | ||||||||||||
| USD1,114 | JPY125,000 | JPMorgan Chase | 7/7/2017 | $ 2 | ||||||||||||
| USD310 | PLN1,158 | JPMorgan Chase | 7/7/2017 | (2 | ) | |||||||||||
| SEK7,759 | USD895 | Citibank | 7/10/2017 | 26 | ||||||||||||
| NOK6,100 | USD721 | Bank of America, N.A. | 7/10/2017 | 9 | ||||||||||||
| USD561 | INR36,300 | JPMorgan Chase | 7/10/2017 | 1 | ||||||||||||
| USD387 | INR25,000 | JPMorgan Chase | 7/10/2017 | – | 4 | |||||||||||
| GBP276 | AUD475 | UBS AG | 7/10/2017 | (5 | ) | |||||||||||
| USD770 | MXN14,100 | Bank of America, N.A. | 7/10/2017 | (6 | ) | |||||||||||
| GBP255 | USD330 | JPMorgan Chase | 7/11/2017 | 2 | ||||||||||||
| USD294 | THB10,000 | Bank of America, N.A. | 7/11/2017 | (1 | ) | |||||||||||
| USD170 | ILS600 | JPMorgan Chase | 7/11/2017 | (3 | ) | |||||||||||
| JPY33,581 | USD307 | JPMorgan Chase | 7/11/2017 | (8 | ) | |||||||||||
| SEK1,625 | USD187 | Barclays Bank PLC | 7/12/2017 | 6 | ||||||||||||
| NOK2,443 | USD288 | Barclays Bank PLC | 7/12/2017 | 5 | ||||||||||||
| EUR335 | GBP290 | HSBC Bank | 7/12/2017 | 4 | ||||||||||||
| EUR344 | GBP300 | Goldman Sachs | 7/13/2017 | 3 | ||||||||||||
| USD326 | MXN6,000 | Bank of America, N.A. | 7/14/2017 | (3 | ) | |||||||||||
| JPY43,839 | USD399 | Bank of America, N.A. | 7/18/2017 | (9 | ) | |||||||||||
| EUR361 | USD403 | Citibank | 7/19/2017 | 10 | ||||||||||||
| USD739 | AUD970 | Citibank | 7/19/2017 | (6 | ) | |||||||||||
| JPY72,628 | USD665 | JPMorgan Chase | 7/19/2017 | (19 | ) | |||||||||||
| EUR719 | USD803 | UBS AG | 7/20/2017 | 19 | ||||||||||||
| JPY31,929 | USD288 | Citibank | 7/20/2017 | (4 | ) | |||||||||||
| USD2,206 | GBP1,700 | Barclays Bank PLC | 7/20/2017 | (10 | ) | |||||||||||
| EUR982 | USD1,094 | Bank of America, N.A. | 7/24/2017 | 29 | ||||||||||||
| EUR645 | USD724 | Citibank | 7/24/2017 | 13 | ||||||||||||
| EUR266 | USD297 | Goldman Sachs | 7/24/2017 | 8 | ||||||||||||
| EUR134 | USD150 | JPMorgan Chase | 7/24/2017 | 4 | ||||||||||||
| USD220 | ZAR2,900 | UBS AG | 7/24/2017 | – | 4 | |||||||||||
| USD267 | ZAR3,500 | JPMorgan Chase | 7/24/2017 | – | 4 | |||||||||||
| USD648 | MYR2,800 | JPMorgan Chase | 7/24/2017 | (3 | ) | |||||||||||
| JPY21,085 | AUD250 | UBS AG | 7/24/2017 | (4 | ) | |||||||||||
| JPY22,275 | USD200 | Goldman Sachs | 7/27/2017 | (2 | ) | |||||||||||
| USD207 | AUD275 | Bank of America, N.A. | 7/27/2017 | (4 | ) | |||||||||||
| JPY40,289 | USD362 | Bank of America, N.A. | 7/27/2017 | (4 | ) | |||||||||||
| USD358 | AUD475 | Bank of America, N.A. | 7/27/2017 | (7 | ) | |||||||||||
| EUR357 | USD400 | Citibank | 7/28/2017 | 8 | ||||||||||||
| USD298 | MXN5,430 | JPMorgan Chase | 7/28/2017 | 1 | ||||||||||||
| JPY57,092 | USD512 | UBS AG | 8/4/2017 | (4 | ) | |||||||||||
| USD256 | JPY28,000 | Bank of New York Mellon | 8/9/2017 | 7 | ||||||||||||
| SEK1,270 | USD147 | Bank of America, N.A. | 8/9/2017 | 4 | ||||||||||||
| USD614 | CAD800 | Goldman Sachs | 8/10/2017 | (4 | ) | |||||||||||
| JPY22,250 | USD202 | HSBC Bank | 8/14/2017 | (4 | ) | |||||||||||
| SEK1,613 | USD186 | UBS AG | 8/21/2017 | 6 | ||||||||||||
| JPY23,305 | USD211 | HSBC Bank | 8/21/2017 | (3 | ) | |||||||||||
| JPY36,271 | USD327 | HSBC Bank | 8/23/2017 | (4 | ) | |||||||||||
|
| |||||||||||||||
| $ 48 | ||||||||||||||||
|
| |||||||||||||||
| American Funds Insurance Series | 87 |
Global Balanced Fund
The following footnotes apply to either the individual securities noted or one or more of the securities aggregated and listed as a single line item.
| 1 | Security did not produce income during the last 12 months. |
| 2 | Index-linked bond whose principal amount moves with a government price index. |
| 3 | Acquired in a transaction exempt from registration under Rule 144A or Section 4(2) of the Securities Act of 1933. May be resold in the U.S. in transactions exempt from registration, normally to qualified institutional buyers. The total value of all such securities, including those in “Other securities,” was $12,075,000, which represented 4.17% of the net assets of the fund. |
| 4 | Amount less than one thousand. |
Key to abbreviations and symbols
ADR = American Depositary Receipts
AUD = Australian dollars
CAD = Canadian dollars
EUR/€ = Euros
GBP = British pounds
ILS = Israeli shekels
INR = Indian rupees
JPY/¥ = Japanese yen
MXN = Mexican pesos
MYR = Malaysian ringgits
NOK = Norwegian kroner
PLN = Polish zloty
RUB = Russian rubles
SEK = Swedish kronor
THB = Thai baht
USD/$ = U.S. dollars
ZAR = South African rand
See Notes to Financial Statements
| 88 | American Funds Insurance Series |
| ||
| Summary investment portfolio June 30, 2017 | unaudited |
| Bonds, notes & other debt instruments 96.74% | Principal amount (000) | Value (000) | ||||||||
| Corporate bonds & notes 36.14% | ||||||||||
| Financials | Bank of America Corp. 3.124% 2023 | $ 42,500 | $ | 43,007 | ||||||
| 8.57% | Capital One Financial Corp. 2.50% 2020 | 48,000 | 48,237 | |||||||
Citigroup Inc. 2.15%-3.89% 2018-2028 | 77,415 | 77,721 | ||||||||
Intesa Sanpaolo SpA 5.017% 20241 | 51,415 | 52,223 | ||||||||
Morgan Stanley 2.50% 2021 | 44,400 | 44,386 | ||||||||
US Bancorp. 2.00%-3.15% 2020-2027 | 3,800 | 3,814 | ||||||||
Other securities | 630,256 | |||||||||
|
| |||||||||
| 899,644 | ||||||||||
|
| |||||||||
| Energy | Other securities | 657,739 | ||||||||
|
| |||||||||
| 6.26% | ||||||||||
| Health care | Other securities | 520,526 | ||||||||
|
| |||||||||
| 4.96% | ||||||||||
| Utilities | Other securities | 444,402 | ||||||||
|
| |||||||||
| 4.23% | ||||||||||
| Consumer | Other securities | 383,633 | ||||||||
|
| |||||||||
| discretionary | ||||||||||
| 3.65% | ||||||||||
| Consumer staples | Other securities | 284,721 | ||||||||
|
| |||||||||
| 2.71% | ||||||||||
| Telecommunication | Other securities | 172,408 | ||||||||
|
| |||||||||
services 1.64% | ||||||||||
| Real estate | Other securities | 131,668 | ||||||||
|
| |||||||||
| 1.25% | ||||||||||
| Industrials | Other securities | 121,291 | ||||||||
|
| |||||||||
| 1.15% | ||||||||||
| Information | Apple Inc. 1.55%-3.35% 2021-2027 | 16,442 | 16,225 | |||||||
| technology | Other securities | 94,798 | ||||||||
|
| |||||||||
| 1.06% | 111,023 | |||||||||
|
| |||||||||
| Materials | Other securities | 69,005 | ||||||||
|
| |||||||||
| 0.66% | Total corporate bonds & notes | 3,796,060 | ||||||||
|
| |||||||||
| Mortgage-backed obligations 27.23% | ||||||||||
| Federal agency | Fannie Mae 3.00% 20462 | 77,742 | 77,700 | |||||||
| mortgage-backed | Fannie Mae 4.00% 20462 | 51,064 | 53,719 | |||||||
| obligations | Fannie Mae 3.00% 20472,3 | 43,330 | 43,198 | |||||||
| 26.58% | Fannie Mae 3.50% 20472,3 | 46,740 | 47,995 | |||||||
Fannie Mae 4.00% 20472,3 | 385,400 | 404,391 | ||||||||
Fannie Mae 4.00% 20472,3 | 120,500 | 126,657 | ||||||||
Fannie Mae 4.50% 20472,3 | 190,000 | 203,790 | ||||||||
| American Funds Insurance Series | 89 |
Bond Fund
| Bonds, notes & other debt instruments (continued) | Principal amount (000) | Value (000) | ||||||||
| Mortgage-backed obligations (continued) | ||||||||||
| Federal agency | Fannie Mae 2.77%-9.31% 2023-20472,3,4 | $ 124,544 | $ | 131,829 | ||||||
| mortgage-backed | Freddie Mac 3.00% 20352 | 54,447 | 55,516 | |||||||
| obligations | Freddie Mac 3.50% 20452 | 42,618 | 44,145 | |||||||
| (continued) | Freddie Mac 3.50% 20462 | 106,869 | 109,878 | |||||||
Freddie Mac 3.00% 20472,3 | 131,109 | 130,812 | ||||||||
Freddie Mac 3.50% 20472,3 | 255,000 | 261,465 | ||||||||
Freddie Mac 3.50% 20472,3 | 50,000 | 51,355 | ||||||||
Freddie Mac 4.00% 20472,3 | 301,000 | 315,956 | ||||||||
Freddie Mac 4.00% 20472,3 | 50,000 | 52,580 | ||||||||
Freddie Mac 0%-5.50% 2021-20472,3 | 109,965 | 115,144 | ||||||||
Government National Mortgage Assn. 4.00% 20472,3 | 315,681 | 332,180 | ||||||||
Government National Mortgage Assn. 4.00% 20472,3 | 55,919 | 58,759 | ||||||||
Government National Mortgage Assn. 4.50% 20472 | 50,760 | 54,049 | ||||||||
Government National Mortgage Assn. 4.50% 2040-20472 | 113,500 | 120,753 | ||||||||
|
| |||||||||
| 2,791,871 | ||||||||||
|
| |||||||||
| Other | Other securities | 68,205 | ||||||||
|
| |||||||||
| 0.65% | Total mortgage-backed obligations | �� | 2,860,076 | |||||||
|
| |||||||||
| U.S. Treasury bonds & notes 21.22% | ||||||||||
| U.S. Treasury | U.S. Treasury 8.75% 2020 | 40,000 | 48,706 | |||||||
| 18.45% | U.S. Treasury 1.375% 20215 | 70,000 | 69,037 | |||||||
U.S. Treasury 2.00% 2022 | 222,750 | 223,262 | ||||||||
U.S. Treasury 2.125% 2022 | 150,000 | 151,647 | ||||||||
U.S. Treasury 2.25% 2023 | 115,000 | 116,145 | ||||||||
U.S. Treasury 2.125% 2024 | 260,000 | 260,325 | ||||||||
U.S. Treasury 2.25% 2024 | 80,000 | 80,759 | ||||||||
U.S. Treasury 2.25% 2027 | 226,075 | 225,094 | ||||||||
U.S. Treasury 2.375% 2027 | 281,212 | 283,102 | ||||||||
U.S. Treasury 3.00% 2047 | 196,713 | 203,228 | ||||||||
U.S. Treasury 3.00% 2047 | 106,625 | 110,215 | ||||||||
U.S. Treasury 0.75%-6.13% 2019-2046 | 159,234 | 166,226 | ||||||||
|
| |||||||||
| 1,937,746 | ||||||||||
|
| |||||||||
| U.S. Treasury | U.S. Treasury Inflation-Protected Security 0.375% 20256 | 52,608 | 52,271 | |||||||
| inflation-protected | U.S. Treasury Inflation-Protected Security 0.375% 20276 | 79,415 | 78,066 | |||||||
| securities | U.S. Treasury Inflation-Protected Security 0.875% 20476 | 90,148 | 87,605 | |||||||
| 2.77% | U.S. Treasury Inflation-Protected Securities 1.00%-2.00% 2026-20466 | 68,221 | 72,769 | |||||||
|
| |||||||||
| 290,711 | ||||||||||
|
| |||||||||
Total U.S. Treasury bonds & notes | 2,228,457 | |||||||||
|
| |||||||||
| Bonds & notes of governments & government agencies outside the U.S. 6.66% | ||||||||||
Japan, Series 19, 0.10% 20246 | ¥ 5,339,655 | 49,482 | ||||||||
Japan, Series 20, 0.10% 20256 | 11,261,250 | 104,458 | ||||||||
Portuguese Republic 5.125% 2024 | $ 94,400 | 96,524 | ||||||||
Portuguese Republic 2.20%-4.13% 2022-2027 | € 40,000 | 48,860 | ||||||||
United Mexican States, Series M, 6.50% 2021 | MXN3,132,700 | 172,114 | ||||||||
United Mexican States 3.60%-6.05% 2025-2047 | $ 25,020 | 26,130 | ||||||||
United Mexican States 4.00%-5.75% 2026-20466 | MXN671,343 | 35,797 | ||||||||
Other securities | 165,840 | |||||||||
|
| |||||||||
| 699,205 | ||||||||||
|
| |||||||||
| Asset-backed obligations 3.59% | ||||||||||
Other securities | 376,981 | |||||||||
|
| |||||||||
| 90 | American Funds Insurance Series |
Bond Fund
| Bonds, notes & other debt instruments | Principal amount (000) | Value (000) | ||||||||
| Municipals 1.78% | ||||||||||
| Illinois 1.14% | G.O. Bonds, Pension Funding Series 2003, 4.95% 2023 | $ 16,830 | $ | 16,913 | ||||||
G.O. Bonds, Pension Funding Series 2003, 5.10% 20332 | 81,515 | 76,389 | ||||||||
G.O. Bonds, Pension Funding Series 2013, 5.877% 2019 | 400 | 414 | ||||||||
G.O. Bonds, Series 2013-B, 3.65% 2020 | 1,000 | 984 | ||||||||
G.O. Bonds, Series 2013-B, 4.11% 2022 | 750 | 710 | ||||||||
G.O. Bonds, Series 2013-B, 4.31% 2023 | 2,125 | 1,991 | ||||||||
G.O. Bonds, Series 2013-B, 4.91% 2027 | 1,450 | 1,339 | ||||||||
G.O. Bonds, Taxable Build America Bonds, Series 2010-3, 5.547% 2019 | 335 | 344 | ||||||||
G.O. Bonds, Taxable Build America Bonds, Series 2010-1, 6.63% 2035 | 13,780 | 14,156 | ||||||||
G.O. Bonds, Taxable Build America Bonds, Series 2010-2, 5.65% 2020 | 250 | 258 | ||||||||
G.O. Bonds, Taxable Build America Bonds, Series 2010-2, 5.85% 2022 | 2,000 | 2,037 | ||||||||
G.O. Bonds, Taxable Build America Bonds, Series 2010-2, 5.95% 2023 | 2,950 | 2,986 | ||||||||
G.O. Bonds, Taxable Build America Bonds, Series 2010-2, 6.15% 2025 | 750 | 751 | ||||||||
G.O. Bonds, Taxable Build America Bonds, Series 2010-3, 5.727% 2020 | 400 | 414 | ||||||||
G.O. Bonds, Taxable Build America Bonds, Series 2010-5, 6.20% 2021 | 375 | 387 | ||||||||
|
| |||||||||
| 120,073 | ||||||||||
|
| |||||||||
| Other 0.64% | Other securities | 66,721 | ||||||||
|
| |||||||||
Total municipals | 186,794 | |||||||||
|
| |||||||||
| Federal agency bonds & notes 0.12% | ||||||||||
Fannie Mae 2.125% 2026 | 12,410 | 12,135 | ||||||||
|
| |||||||||
Total bonds, notes & other debt instruments (cost: $10,083,200,000) | 10,159,708 | |||||||||
|
| |||||||||
| Common stocks 0.02% | Shares | |||||||||
| Other | Other securities | 1,095 | ||||||||
|
| |||||||||
| 0.01% | ||||||||||
| Miscellaneous | Other common stocks in initial period of acquisition | 1,049 | ||||||||
|
| |||||||||
| 0.01% | Total common stocks (cost: $1,644,000) | 2,144 | ||||||||
|
| |||||||||
| Rights & warrants 0.00% | ||||||||||
| Utilities | Other securities | 71 | ||||||||
|
| |||||||||
| 0.00% | Total rights & warrants (cost: $100,000) | 71 | ||||||||
|
| |||||||||
| Short-term securities 22.07% | Principal amount (000) | |||||||||
Apple Inc. 1.10%-1.18% due 8/7/2017-10/2/20171 | $ 105,000 | 104,788 | ||||||||
Citibank, N.A. 1.29% due 9/29/2017 | 100,000 | 100,002 | ||||||||
Federal Home Loan Bank 0.64%-1.05% due 7/5/2017-9/26/2017 | 1,178,600 | 1,177,176 | ||||||||
Freddie Mac 0.83% due 8/7/2017 | 50,000 | 49,959 | ||||||||
General Electric Co. 1.08% due 7/3/2017 | 43,500 | 43,496 | ||||||||
Johnson & Johnson 1.07% due 8/31/20171 | 94,300 | 94,120 | ||||||||
National Rural Utilities Cooperative Finance Corp. 1.15% due 8/2/2017 | 59,200 | 59,136 | ||||||||
| American Funds Insurance Series | 91 |
Bond Fund
Short-term securities (continued) | Principal amount (000) | Value (000) | ||||||||
U.S. Bank, N.A. 1.21% due 10/24/2017-10/25/2017 | $175,000 | $ | 175,016 | |||||||
U.S. Treasury Bills 0.59%-1.07% due 7/13/2017-12/21/2017 | 447,000 | 445,424 | ||||||||
Other securities | 68,845 | |||||||||
|
| |||||||||
Total short-term securities (cost: $2,317,806,000) | 2,317,962 | |||||||||
|
| |||||||||
Total investment securities 118.83% (cost: $12,402,750,000) | 12,479,885 | |||||||||
Other assets less liabilities (18.83)% | (1,977,186 | ) | ||||||||
|
| |||||||||
Net assets 100.00% | $ | 10,502,699 | ||||||||
|
| |||||||||
This summary investment portfolio is designed to streamline the report and help investors better focus on the fund’s principal holdings. See the inside back cover for details on how to obtain a complete schedule of portfolio holdings.
As permitted by U.S. Securities and Exchange Commission regulations, “Miscellaneous” securities include holdings in their first year of acquisition that have not previously been publicly disclosed.
“Other securities” includes all issues that are not disclosed separately in the summary investment portfolio. “Other securities” includes securities which were valued under fair value procedures adopted by authority of the board of trustees. The total value of securities which were valued under fair value procedures was $1,623,000, which represented .02% of the net assets of the fund. “Other securities“ also includes loan participations and assignments, which may be subject to legal or contractual restrictions on resale. The total value of all such loans was $26,163,000, which represented .25% of the net assets of the fund.
Futures contracts
| Contracts | Type | Number of contracts | Expiration | Notional amount7 (000) | Value at 6/30/20178 (000) | Unrealized appreciation (depreciation) at 6/30/2017 (000) | ||||||||||||||||||
10 Year Euro-Bund Futures | Short | 120 | September 2017 | $ (12,000 | ) | $ (22,186 | ) | $ 345 | ||||||||||||||||
10 Year U.S. Treasury Note Futures | Long | 2,174 | September 2017 | 217,400 | 272,905 | (1,303) | ||||||||||||||||||
10 Year Ultra U.S. Treasury Note Futures | Short | 45 | September 2017 | (4,500 | ) | (6,066 | ) | 19 | ||||||||||||||||
30 Year Ultra U.S. Treasury Bond Futures | Short | 51 | September 2017 | (5,100 | ) | (8,460 | ) | 28 | ||||||||||||||||
5 Year U.S. Treasury Note Futures | Long | 4,995 | October 2017 | 499,500 | 588,591 | (3,244) | ||||||||||||||||||
2 Year U.S. Treasury Note Futures | Short | 3,200 | October 2017 | (640,000 | ) | (691,550 | ) | 547 | ||||||||||||||||
|
| |||||||||||||||||||||||
| $(3,608) | ||||||||||||||||||||||||
|
| |||||||||||||||||||||||
Forward currency contracts
| Contract amount | Counterparty | Settlement | Unrealized (depreciation) appreciation | |||||||||||||
Purchases (000) | Sales (000) | at 6/30/2017 (000) | ||||||||||||||
|
| |||||||||||||||
| USD66,550 | MXN1,220,000 | Bank of America, N.A. | 7/10/2017 | $ (561) | ||||||||||||
| USD65,409 | MXN1,200,000 | JPMorgan Chase | 7/10/2017 | (602) | ||||||||||||
| USD65,343 | MXN1,200,000 | JPMorgan Chase | 7/11/2017 | (656) | ||||||||||||
| USD31,168 | JPY3,430,000 | UBS AG | 7/12/2017 | 656 | ||||||||||||
| USD13,134 | JPY1,445,000 | Bank of America, N.A. | 7/12/2017 | 280 | ||||||||||||
| USD54,738 | EUR48,800 | Citibank | 7/17/2017 | (1,051) | ||||||||||||
| USD65,574 | JPY7,300,000 | HSBC Bank | 7/24/2017 | 599 | ||||||||||||
| USD44,244 | JPY4,925,000 | JPMorgan Chase | 7/24/2017 | 408 | ||||||||||||
| USD13,837 | MXN252,000 | Barclays Bank PLC | 7/24/2017 | 9 | ||||||||||||
| USD18,708 | EUR16,750 | Citibank | 7/28/2017 | (453) | ||||||||||||
| USD56,861 | AUD75,000 | JPMorgan Chase | 8/4/2017 | (756) | ||||||||||||
| USD5,364 | EUR4,750 | JPMorgan Chase | 9/7/2017 | (81) | ||||||||||||
| 92 | American Funds Insurance Series |
Bond Fund
| Contract amount | Counterparty | Settlement | Unrealized (depreciation) appreciation | |||||||||||||
Purchases (000) | Sales (000) | at 6/30/2017 (000) | ||||||||||||||
|
| |||||||||||||||
| USD9,606 | EUR8,500 | JPMorgan Chase | 9/7/2017 | $ | (138 | ) | ||||||||||
| USD9,708 | EUR8,600 | JPMorgan Chase | 9/7/2017 | (151 | ) | |||||||||||
|
| |||||||||||||||
| $ | (2,497 | ) | ||||||||||||||
|
| |||||||||||||||
Swap contracts
Interest rate swaps
| Receive | Pay | Expiration date | Notional (000) | Value at 6/30/2017 (000) | Upfront payments/ receipts (000) | Unrealized (depreciation) appreciation at 6/30/2017 (000) | ||||||||||||||||
1.35375% | U.S. EFFR | 4/27/2019 | $ | 37,000 | $ | (28 | ) | $– | $ | (28 | ) | |||||||||||
1.669% | 3-month USD-LIBOR | 10/28/2019 | 112,000 | 46 | – | 46 | ||||||||||||||||
1.6915% | 3-month USD-LIBOR | 6/3/2020 | 1,600 | (2 | ) | – | (2 | ) | ||||||||||||||
1.7345% | 3-month USD-LIBOR | 12/31/2020 | 120,000 | (258 | ) | – | (258 | ) | ||||||||||||||
3-month USD-LIBOR | 1.975% | 4/27/2022 | 15,000 | (30 | ) | – | (30 | ) | ||||||||||||||
3-month USD-LIBOR | 2.1305% | 7/17/2022 | 100,000 | (859 | ) | – | (859 | ) | ||||||||||||||
1.9375% | 3-month USD-LIBOR | 12/18/2022 | 150,000 | (411 | ) | – | (411 | ) | ||||||||||||||
3-month USD-LIBOR | 2.701% | 6/9/2024 | 60,000 | (2,354 | ) | – | (2,354 | ) | ||||||||||||||
3-month USD-LIBOR | 2.6815% | 9/24/2024 | 1,600 | (61 | ) | – | (61 | ) | ||||||||||||||
3-month USD-LIBOR | 2.54% | 10/3/2024 | 400 | (11 | ) | – | (11 | ) | ||||||||||||||
6-month EURIBOR | 0.9852% | 10/17/2024 | € | 25,000 | (841 | ) | – | (841 | ) | |||||||||||||
3-month USD-LIBOR | 2.342% | 10/21/2024 | $ | 290 | (4 | ) | – | (4 | ) | |||||||||||||
3-month USD-LIBOR | 2.326% | 10/22/2024 | 800 | (11 | ) | – | (11 | ) | ||||||||||||||
3-month USD-LIBOR | 2.372% | 10/24/2024 | 1,150 | (19 | ) | – | (19 | ) | ||||||||||||||
3-month USD-LIBOR | 2.438% | 11/19/2024 | 2,750 | (59 | ) | – | (59 | ) | ||||||||||||||
3-month USD-LIBOR | 2.4585% | 11/24/2024 | 23,000 | (522 | ) | – | (522 | ) | ||||||||||||||
3-month USD-LIBOR | 2.4295% | 11/25/2024 | 800 | (17 | ) | – | (17 | ) | ||||||||||||||
3-month USD-LIBOR | 2.353% | 12/8/2024 | 700 | (11 | ) | – | (11 | ) | ||||||||||||||
3-month USD-LIBOR | 2.2845% | 12/12/2024 | 330 | (3 | ) | – | (3 | ) | ||||||||||||||
3-month USD-LIBOR | 1.8185% | 1/20/2025 | 900 | 21 | – | 21 | ||||||||||||||||
3-month USD-LIBOR | 1.9365% | 1/22/2025 | 1,500 | 22 | – | 22 | ||||||||||||||||
3-month USD-LIBOR | 2.192% | 3/18/2025 | 1,850 | (6 | ) | – | (6 | ) | ||||||||||||||
3-month USD-LIBOR | 2.0475% | 3/23/2025 | 450 | 3 | – | 3 | ||||||||||||||||
3-month USD-LIBOR | 2.3175% | 5/8/2025 | 1,500 | (18 | ) | – | (18 | ) | ||||||||||||||
3-month USD-LIBOR | 2.339% | 5/13/2025 | 375 | (5 | ) | – | (5 | ) | ||||||||||||||
3-month USD-LIBOR | 2.351% | 5/15/2025 | 590 | (8 | ) | – | (8 | ) | ||||||||||||||
3-month USD-LIBOR | 2.287% | 5/20/2025 | 500 | (5 | ) | – | (5 | ) | ||||||||||||||
3-month USD-LIBOR | 2.227% | 5/28/2025 | 260 | (1 | ) | – | (1 | ) | ||||||||||||||
3-month USD-LIBOR | 2.2125% | 5/29/2025 | 465 | (2 | ) | – | (2 | ) | ||||||||||||||
3-month USD-LIBOR | 2.451% | 6/5/2025 | 650 | (14 | ) | – | (14 | ) | ||||||||||||||
3-month USD-LIBOR | 2.46% | 6/10/2025 | 2,536 | (56 | ) | – | (56 | ) | ||||||||||||||
3-month USD-LIBOR | 2.455% | 6/24/2025 | 235 | (5 | ) | – | (5 | ) | ||||||||||||||
3-month USD-LIBOR | 2.428% | 7/2/2025 | 2,000 | (39 | ) | – | (39 | ) | ||||||||||||||
3-month USD-LIBOR | 2.397% | 7/13/2025 | 900 | (15 | ) | – | (15 | ) | ||||||||||||||
3-month USD-LIBOR | 2.535% | 7/15/2025 | 800 | (22 | ) | – | (22 | ) | ||||||||||||||
3-month USD-LIBOR | 2.4615% | 7/22/2025 | 1,300 | (28 | ) | – | (28 | ) | ||||||||||||||
3-month USD-LIBOR | 2.312% | 7/29/2025 | 1,000 | (11 | ) | – | (11 | ) | ||||||||||||||
3-month USD-LIBOR | 2.331% | 7/30/2025 | 435 | (5 | ) | – | (5 | ) | ||||||||||||||
3-month USD-LIBOR | 2.2135% | 9/4/2025 | 5,000 | (14 | ) | – | (14 | ) | ||||||||||||||
3-month USD-LIBOR | 2.228% | 9/4/2025 | 12,000 | (46 | ) | – | (46 | ) | ||||||||||||||
6-month JPY-LIBOR | 0.282% | 2/2/2026 | ¥ | 5,500,000 | (290 | ) | – | (290 | ) | |||||||||||||
| American Funds Insurance Series | 93 |
Bond Fund
Swap contracts (continued)
Interest rate swaps (continued)
| Receive | Pay | Expiration date | Notional (000) | Value at 6/30/2017 (000) | Upfront payments/ receipts (000) | Unrealized (depreciation) appreciation at 6/30/2017 (000) | ||||||||||||||||
3-month USD-LIBOR | 1.6705% | 3/4/2026 | $ | 248,000 | $ | 10,597 | $– | $10,597 | ||||||||||||||
6-month JPY-LIBOR | 0.0875% | 3/10/2026 | ¥ | 11,100,000 | 1,107 | – | 1,107 | |||||||||||||||
3-month USD-LIBOR | 1.5925% | 5/9/2026 | $ | 1,000 | 51 | – | 51 | |||||||||||||||
3-month USD-LIBOR | 1.595% | 5/12/2026 | 8,500 | 430 | – | 430 | ||||||||||||||||
3-month USD-LIBOR | 1.592% | 5/12/2026 | 4,000 | 203 | – | 203 | ||||||||||||||||
3.0865% | 3-month USD-LIBOR | 8/18/2034 | 2,250 | 203 | – | 203 | ||||||||||||||||
2.913% | 3-month USD-LIBOR | 11/24/2034 | 10,000 | 655 | – | 655 | ||||||||||||||||
2.844% | 3-month USD-LIBOR | 6/11/2035 | 3,250 | 181 | – | 181 | ||||||||||||||||
2.9535% | 3-month USD-LIBOR | 6/30/2035 | 2,500 | 180 | – | 180 | ||||||||||||||||
2.773% | 3-month USD-LIBOR | 7/13/2035 | 500 | 23 | – | 23 | ||||||||||||||||
2.589% | 3-month USD-LIBOR | 9/4/2035 | 3,100 | 53 | – | 53 | ||||||||||||||||
3-month USD-LIBOR | 3.0515% | 11/14/2044 | 1,000 | (108 | ) | – | (108 | ) | ||||||||||||||
3-month USD-LIBOR | 2.925% | 12/3/2044 | 1,230 | (101 | ) | – | (101 | ) | ||||||||||||||
3-month USD-LIBOR | 2.6695% | 12/19/2044 | 200 | (6 | ) | – | (6 | ) | ||||||||||||||
3-month USD-LIBOR | 2.5755% | 3/5/2045 | 1,470 | (15 | ) | – | (15 | ) | ||||||||||||||
2.377% | 3-month USD-LIBOR | 4/29/2045 | 1,910 | (59 | ) | – | (59 | ) | ||||||||||||||
3-month USD-LIBOR | 2.757% | 5/8/2045 | 1,500 | (72 | ) | – | (72 | ) | ||||||||||||||
6-month JPY-LIBOR | 0.58295% | 3/23/2046 | ¥ | 2,000,000 | 1,173 | – | 1,173 | |||||||||||||||
0.64355% | 6-month JPY-LIBOR | 4/27/2046 | 2,000,000 | (884 | ) | – | (884 | ) | ||||||||||||||
3-month USD-LIBOR | 2.1155% | 5/13/2046 | $ | 2,400 | 212 | – | 212 | |||||||||||||||
|
|
|
| |||||||||||||||||||
| $– | $ 7,824 | |||||||||||||||||||||
|
|
|
| |||||||||||||||||||
The following footnotes apply to either the individual securities noted or one or more of the securities aggregated and listed as a single line item.
| 1 | Acquired in a transaction exempt from registration under Rule 144A or Section 4(2) of the Securities Act of 1933. May be resold in the U.S. in transactions exempt from registration, normally to qualified institutional buyers. The total value of all such securities, including those in “Other securities,” was $1,375,344,000, which represented 13.10% of the net assets of the fund. |
| 2 | Principal payments may be made periodically. Therefore, the effective maturity date may be earlier than the stated maturity date. |
| 3 | Purchased on a TBA basis. |
| 4 | Coupon rate may change periodically. |
| 5 | A portion of this security was pledged as collateral. The total value of pledged collateral was $28,506,000, which represented .27% of the net assets of the fund. |
| 6 | Index-linked bond whose principal amount moves with a government price index. |
| 7 | Notional amount is calculated based on the number of contracts and notional contract size. |
| 8 | Value is calculated based on the notional amount and current market price. |
Key to abbreviations and symbols
AUD = Australian dollars
EFFR = Federal Funds Effective Rate
EUR/€ = Euros
EURIBOR = Euro Interbank Offered Rate
G.O. = General Obligation
JPY/¥ = Japanese yen
LIBOR = London Interbank Offered Rate
MXN = Mexican pesos
USD/$ = U.S. dollars
TBA = To-be-announced
See Notes to Financial Statements
| 94 | American Funds Insurance Series |
| ||
| Summary investment portfolio June 30, 2017 | unaudited |
| Bonds, notes & other debt instruments 87.58% | Principal amount (000) |
Value | ||||||||
Euros | Belgium (Kingdom of), Series 77, 1.00% 2026 | € 12,900 | $ | 15,210 | ||||||
| 12.89% | French Republic O.A.T. 1.85% 20271 | 8,756 | 12,413 | |||||||
Germany (Federal Republic of) 0.10% 20261 | 18,150 | 22,325 | ||||||||
Germany (Federal Republic of) 0.50% 2026 | 13,000 | 15,087 | ||||||||
Germany (Federal Republic of) 2.50% 2046 | 24,695 | 36,813 | ||||||||
Germany (Federal Republic of) 0.10%-6.25% 2023-20401 | 3,423 | 5,560 | ||||||||
Hungary 3.88%-6.00% 2019-2020 | 2,200 | 2,753 | ||||||||
Italy (Republic of) 1.45% 2022 | 10,575 | 12,359 | ||||||||
Portuguese Government 2.875% 2026 | 4,200 | 4,832 | ||||||||
Portuguese Republic 2.20% 2022 | 10,300 | 12,305 | ||||||||
Portuguese Republic 4.125% 2027 | 32,040 | 39,996 | ||||||||
Spain (Kingdom of) 1.30% 2026 | 13,400 | 15,174 | ||||||||
Other securities | 114,201 | |||||||||
|
| |||||||||
|
309,028
|
| ||||||||
|
| |||||||||
Japanese yen | Japan, Series 326, 0.70% 2022 | ¥1,935,000 | 17,908 | |||||||
| 9.13% | Japan, Series 18, 0.10% 20241 | 4,704,210 | 43,384 | |||||||
Japan, Series 19, 0.10% 20241 | 2,672,325 | 24,764 | ||||||||
Japan, Series 344, 0.10% 2026 | 1,355,000 | 12,095 | ||||||||
Japan, Series 116, 2.20% 2030 | 1,735,000 | 19,271 | ||||||||
Japan, Series 145, 1.70% 2033 | 2,005,000 | 21,481 | ||||||||
Japan, Series 42, 1.70% 2044 | 2,045,000 | 22,240 | ||||||||
Japan 0.10%-2.30% 2022-20351 | 6,040,270 | 57,615 | ||||||||
|
| |||||||||
|
218,758
|
| ||||||||
|
| |||||||||
Polish zloty | Poland (Republic of), Series 1017, 5.25% 2017 | PLN54,472 | 14,873 | |||||||
| 4.50% | Poland (Republic of), Series 0420, 1.50% 2020 | 124,425 | 33,073 | |||||||
Poland (Republic of), Series 1021, 5.75% 2021 | 50,980 | 15,611 | ||||||||
Poland (Republic of), Series 0922, 5.75% 2022 | 46,600 | 14,430 | ||||||||
Poland (Republic of) 2.00%-5.25% 2020-2025 | 106,690 | 29,851 | ||||||||
|
| |||||||||
|
107,838
|
| ||||||||
|
| |||||||||
Mexican pesos | United Mexican States, Series M, 6.50% 2021 | MXN793,300 | 43,585 | |||||||
| 3.43% | United Mexican States, Series M20, 10.00% 2024 | 209,500 | 13,764 | |||||||
United Mexican States 4.00%-10.00% 2017-20421 | 435,052 | 24,797 | ||||||||
|
| |||||||||
|
82,146
|
| ||||||||
|
| |||||||||
Indian rupees | India (Republic of) 7.80% 2021 | INR1,087,600 | 17,504 | |||||||
| 2.44% | India (Republic of) 8.83% 2023 | 1,284,200 | 21,947 | |||||||
India (Republic of) 6.97%-7.88% 2023-2030 | 1,173,470 | 18,929 | ||||||||
|
| |||||||||
|
58,380
|
| ||||||||
|
| |||||||||
Malaysian | Malaysia (Federation of) 3.58%-4.50% 2018-2030 | MYR216,165 |
|
50,426
|
| |||||
|
| |||||||||
ringgits 2.10% | ||||||||||
British pounds | United Kingdom 3.25% 2044 | £ 9,000 | 14,977 | |||||||
| 1.76% | United Kingdom 1.50%-3.50% 2023-2045 | 16,630 | 24,011 | |||||||
Other securities | 3,150 | |||||||||
|
| |||||||||
|
42,138
|
| ||||||||
|
| |||||||||
Norwegian kroner | Norway (Kingdom of) 3.75% 2021 | NKr305,750 |
|
40,554
|
| |||||
|
| |||||||||
| 1.69% | ||||||||||
| American Funds Insurance Series | 95 |
Global Bond Fund
| Bonds, notes & other debt instruments (continued) | Principal amount (000) | Value (000) | ||||||||
Australian dollars | Australia (Commonwealth of), Series 124, 5.75% 2021 | A$27,800 | $ | 24,290 | ||||||
| 1.69% | Australia (Commonwealth of), Series 128, 5.75% 2022 | 13,650 | 12,267 | |||||||
Australia (Commonwealth of), Series 138, 3.25% 2029 | 4,250 | 3,433 | ||||||||
Other securities | 388 | |||||||||
|
| |||||||||
|
40,378
|
| ||||||||
|
| |||||||||
Colombian pesos | Colombia (Republic of), Series B, 7.00% 2022 | COP35,100,000 | 12,099 | |||||||
| 1.22% | Colombia (Republic of), Series B, 7.50% 2026 | 41,451,000 | 14,599 | |||||||
Colombia (Republic of), Series B, 6.00% 2028 | 8,306,600 | 2,612 | ||||||||
|
| |||||||||
|
29,310
|
| ||||||||
|
| |||||||||
Danish kroner | Other securities |
| 25,593
|
| ||||||
|
| |||||||||
| 1.07% | ||||||||||
Turkish lira | Turkey (Republic of) 9.20% 2021 | TRY47,700 | 12,995 | |||||||
| 1.02% | Turkey (Republic of) 10.50%-11.00% 2020-2022 | 39,700 | 11,436 | |||||||
|
| |||||||||
|
24,431
|
| ||||||||
|
| |||||||||
Israeli shekels | Israel (State of) 5.50% 2042 | ILS29,300 | 11,699 | |||||||
| 0.82% | Other securities | 8,055 | ||||||||
|
| |||||||||
|
19,754
|
| ||||||||
|
| |||||||||
Chilean pesos | Chile (Banco Central de) 4.50% 2021 | CLP12,705,000 |
| 19,736
|
| |||||
|
| |||||||||
| 0.82% | ||||||||||
Canadian dollars | Canada 2.25% 2025 | C$18,050 |
| 14,534
|
| |||||
|
| |||||||||
| 0.61% | ||||||||||
Hungarian forints | Hungary 2.00%-6.50% 2019-2025 | HUF3,145,600 |
| 12,713
|
| |||||
|
| |||||||||
| 0.53% | ||||||||||
U.S. dollars | Hungary 4.00%-6.25% 2019-2024 | $ 8,070 | 8,684 | |||||||
| 40.21% | Turkey (Republic of) 6.25%-6.75% 2022-2040 | 2,090 | 2,282 | |||||||
U.S. Treasury 1.125% 20212 | 43,160 | 42,282 | ||||||||
U.S. Treasury 2.25% 2025 | 15,750 | 15,757 | ||||||||
U.S. Treasury 2.00% 2026 | 55,335 | 53,973 | ||||||||
U.S. Treasury 2.25% 2046 | 13,950 | 12,302 | ||||||||
U.S. Treasury 2.875% 2046 | 15,925 | 16,038 | ||||||||
U.S. Treasury 3.00% 2047 | 16,225 | 16,771 | ||||||||
U.S. Treasury 1.13%-3.00% 2019-2045 | 74,590 | 74,673 | ||||||||
U.S. Treasury Inflation-Protected Security 0.125% 20221 | 40,717 | 40,538 | ||||||||
U.S. Treasury Inflation-Protected Security 0.625% 20241 | 32,720 | 33,214 | ||||||||
U.S. Treasury Inflation-Protected Security 1.00% 20461 | 24,353 | 24,371 | ||||||||
U.S. Treasury Inflation-Protected Securities 0.13%-2.38% 2024-20451 | 46,201 | 46,484 | ||||||||
United Mexican States 4.75% 2044 | 3,200 | 3,211 | ||||||||
Other securities | 573,204 | |||||||||
|
| |||||||||
|
963,784
|
| ||||||||
|
| |||||||||
Other | Other securities | 39,430 | ||||||||
|
| |||||||||
| 1.65% | Total bonds, notes & other debt instruments (cost: $2,077,893,000) |
|
2,098,931
|
| ||||||
|
| |||||||||
| 96 | American Funds Insurance Series |
Global Bond Fund
| Convertible stocks 0.04% | Shares | Value (000) | ||||||||
U.S. dollars | Other securities | $
| 143
|
| ||||||
|
| |||||||||
| 0.00% | ||||||||||
Miscellaneous | Other convertible stocks in initial period of acquisition | 909 | ||||||||
|
| |||||||||
| 0.04% | Total convertible stocks (cost: $1,202,000) |
|
1,052
|
| ||||||
|
| |||||||||
| Common stocks 0.04% | ||||||||||
U.S. dollars | Other securities | 1,000 | ||||||||
|
| |||||||||
| 0.04% | Total common stocks (cost: $3,941,000) |
|
1,000
|
| ||||||
|
| |||||||||
| Short-term securities 12.92% | Principal amount (000) | |||||||||
CPPIB Capital Inc. 1.16% due 7/18/20173 | $ 20,000 | 19,989 | ||||||||
Federal Home Loan Bank 1.02%-1.08% due 8/23/2017-10/16/2017 | 40,000 | 39,922 | ||||||||
Japanese Treasury Discount Bills (0.16)% due 5/21/2018 | ¥15,300,000 | 136,144 | ||||||||
John Deere Financial Inc. 1.05% due 7/6/20173 | $ 25,000 | 24,995 | ||||||||
Liberty Street Funding Corp. 1.28% due 9/18/20173 | 15,000 | 14,958 | ||||||||
Mizuho Bank, Ltd. 1.19% due 7/27/20173 | 20,000 | 19,982 | ||||||||
Unilever Capital Corp. 1.10% due 7/24/20173 | 29,800 | 29,778 | ||||||||
Other securities | 23,940 | |||||||||
|
| |||||||||
Total short-term securities (cost: $309,095,000) |
|
309,708
|
| |||||||
|
| |||||||||
Total investment securities 100.58% (cost: $2,392,131,000) | 2,410,691 | |||||||||
Other assets less liabilities (0.58)% | (14,015 | ) | ||||||||
|
| |||||||||
Net assets 100.00% |
$
|
2,396,676
|
| |||||||
|
| |||||||||
This summary investment portfolio is designed to streamline the report and help investors better focus on the fund’s principal holdings. See the inside back cover for details on how to obtain a complete schedule of portfolio holdings.
As permitted by U.S. Securities and Exchange Commission regulations, “Miscellaneous” securities include holdings in their first year of acquisition that have not previously been publicly disclosed.
“Other securities” includes all issues that are not disclosed separately in the summary investment portfolio. “Miscellaneous” and “Other securities” includes securities which were valued under fair value procedures adopted by authority of the board of trustees. The total value of securities which were valued under fair value procedures was $2,143,000, which represented .09% of the net assets of the fund. “Other securities“ also includes loan participations and assignments, which may be subject to legal or contractual restrictions on resale. The total value of all such loans was $7,941,000, which represented .33% of the net assets of the fund. Some securities in “Other securities” (with an aggregate value of $4,289,000, an aggregate cost of $5,384,000, and which represented .18% of the net assets of the fund) were acquired from 3/10/2010 to 3/6/2017 through private placement transactions exempt from registration under the Securities Act of 1933, which may subject them to legal or contractual restrictions on resale.
Futures contracts
| Contracts | Type | Number of contracts | Expiration | Notional amount4 (000) | Value at 6/30/20175 (000) | Unrealized (depreciation) appreciation at 6/30/2017 (000) | ||||||||||||||||||||||
| 10 Year Ultra U.S. Treasury Note Futures | Long | 89 | September 2017 | $ | 8,900 | $ | 11,998 | $ | (32 | ) | ||||||||||||||||||
| 30 Year Ultra U.S. Treasury Bond Futures | Long | 85 | September 2017 | 8,500 | 14,099 | 192 | ||||||||||||||||||||||
| 10 Year U.S. Treasury Note Futures | Long | 82 | September 2017 | 8,200 | 10,294 | (25 | ) | |||||||||||||||||||||
| 5 Year U.S. Treasury Note Futures | Long | 549 | October 2017 | 54,900 | 64,692 | (143 | ) | |||||||||||||||||||||
| 90 Day Euro Dollar Futures | Short | 220 | March 2018 | (55,000 | ) | (54,142 | ) | 24 | ||||||||||||||||||||
|
| |||||||||||||||||||||||||||
| $ | 16 | |||||||||||||||||||||||||||
|
| |||||||||||||||||||||||||||
| American Funds Insurance Series | 97 |
Global Bond Fund
Forward currency contracts
| Contract amount | Unrealized (depreciation) appreciation | |||||||||||||||
| Purchases (000) | Sales (000) | Counterparty | Settlement date | at 6/30/2017 (000) | ||||||||||||
| USD4,775 | PLN17,827 | JPMorgan Chase | 7/7/2017 | $ (36 | ) | |||||||||||
| SEK123,798 | USD14,284 | Citibank | 7/10/2017 | 419 | ||||||||||||
| NOK93,000 | USD10,999 | Bank of America, N.A. | 7/10/2017 | 143 | ||||||||||||
| USD16,422 | MYR70,000 | JPMorgan Chase | 7/10/2017 | 123 | ||||||||||||
| USD20,237 | INR1,308,300 | JPMorgan Chase | 7/10/2017 | 24 | ||||||||||||
| USD7,734 | INR500,000 | JPMorgan Chase | 7/10/2017 | 9 | ||||||||||||
| USD12,581 | MXN230,400 | Bank of America, N.A. | 7/10/2017 | (93 | ) | |||||||||||
| GBP5,907 | AUD10,150 | UBS AG | 7/10/2017 | (104 | ) | |||||||||||
| USD15,633 | MXN286,625 | Goldman Sachs | 7/10/2017 | (134 | ) | |||||||||||
| USD15,606 | MXN286,625 | Bank of America, N.A. | 7/10/2017 | (161 | ) | |||||||||||
| JPY935,361 | USD8,575 | HSBC Bank | 7/10/2017 | (255 | ) | |||||||||||
| EUR15,020 | PLN63,358 | UBS AG | 7/11/2017 | 69 | ||||||||||||
| USD4,069 | THB138,500 | Bank of America, N.A. | 7/11/2017 | (8 | ) | |||||||||||
| USD4,229 | AUD5,600 | JPMorgan Chase | 7/11/2017 | (74 | ) | |||||||||||
| JPY391,780 | USD3,584 | JPMorgan Chase | 7/11/2017 | (99 | ) | |||||||||||
| USD9,013 | ILS31,900 | JPMorgan Chase | 7/11/2017 | (136 | ) | |||||||||||
| EUR17,250 | USD18,995 | UBS AG | 7/12/2017 | 720 | ||||||||||||
| SEK60,114 | USD6,908 | Barclays Bank PLC | 7/12/2017 | 232 | ||||||||||||
| EUR19,534 | PLN82,342 | HSBC Bank | 7/12/2017 | 106 | ||||||||||||
| NOK46,831 | USD5,513 | Barclays Bank PLC | 7/12/2017 | 97 | ||||||||||||
| EUR5,840 | GBP5,090 | Goldman Sachs | 7/13/2017 | 42 | ||||||||||||
| USD2,024 | BRL6,700 | Citibank | 7/14/2017 | 8 | ||||||||||||
| USD4,732 | MXN87,000 | Bank of America, N.A. | 7/14/2017 | (51 | ) | |||||||||||
| USD6,220 | MXN116,370 | HSBC Bank | 7/14/2017 | (177 | ) | |||||||||||
| USD4,823 | INR310,000 | JPMorgan Chase | 7/17/2017 | 39 | ||||||||||||
| USD5,125 | AUD6,800 | Bank of America, N.A. | 7/17/2017 | (101 | ) | |||||||||||
| JPY3,321,365 | USD30,215 | JPMorgan Chase | 7/18/2017 | (661 | ) | |||||||||||
| JPY3,567,358 | USD32,460 | Bank of America, N.A. | 7/18/2017 | (717 | ) | |||||||||||
| EUR5,283 | USD5,900 | Citibank | 7/19/2017 | 141 | ||||||||||||
| JPY414,706 | USD3,801 | HSBC Bank | 7/19/2017 | (110 | ) | |||||||||||
| USD12,768 | AUD16,760 | Citibank | 7/19/2017 | (111 | ) | |||||||||||
| JPY726,285 | USD6,655 | JPMorgan Chase | 7/19/2017 | (193 | ) | |||||||||||
| EUR5,244 | USD5,857 | UBS AG | 7/20/2017 | 139 | ||||||||||||
| USD3,045 | BRL10,100 | HSBC Bank | 7/20/2017 | 10 | ||||||||||||
| JPY351,002 | USD3,164 | Citibank | 7/20/2017 | (40 | ) | |||||||||||
| GBP5,633 | USD7,117 | JPMorgan Chase | 7/24/2017 | 226 | ||||||||||||
| EUR5,084 | USD5,666 | Goldman Sachs | 7/24/2017 | 149 | ||||||||||||
| EUR18,255 | NOK174,000 | UBS AG | 7/24/2017 | 25 | ||||||||||||
| USD6,827 | ZAR89,650 | JPMorgan Chase | 7/24/2017 | 4 | ||||||||||||
| USD2,980 | ZAR39,200 | UBS AG | 7/24/2017 | (3 | ) | |||||||||||
| EUR4,253 | GBP3,750 | HSBC Bank | 7/24/2017 | (24 | ) | |||||||||||
| USD13,597 | MYR58,750 | JPMorgan Chase | 7/24/2017 | (74 | ) | |||||||||||
| USD6,037 | ILS21,303 | Bank of America, N.A. | 7/24/2017 | (76 | ) | |||||||||||
| USD7,728 | AUD10,200 | UBS AG | 7/24/2017 | (109 | ) | |||||||||||
| JPY1,976,140 | USD17,751 | HSBC Bank | 7/24/2017 | (162 | ) | |||||||||||
| EUR6,645 | USD7,490 | Bank of America, N.A. | 7/25/2017 | 111 | ||||||||||||
| GBP5,792 | EUR6,700 | JPMorgan Chase | 7/25/2017 | (112 | ) | |||||||||||
| JPY445,496 | USD4,000 | Goldman Sachs | 7/27/2017 | (34 | ) | |||||||||||
| JPY835,989 | USD7,521 | Bank of America, N.A. | 7/27/2017 | (79 | ) | |||||||||||
| USD5,808 | AUD7,700 | Bank of America, N.A. | 7/27/2017 | (108 | ) | |||||||||||
| USD7,542 | AUD10,000 | Bank of America, N.A. | 7/27/2017 | (141 | ) | |||||||||||
| JPY1,698,519 | USD15,271 | Citibank | 7/27/2017 | (151 | ) | |||||||||||
| EUR5,439 | USD6,100 | Citibank | 7/28/2017 | 122 | ||||||||||||
| SEK172,682 | USD20,325 | Goldman Sachs | 8/3/2017 | 214 | ||||||||||||
| EUR14,702 | USD16,481 | JPMorgan Chase | 8/4/2017 | 343 | ||||||||||||
| GBP25,426 | EUR28,875 | Bank of America, N.A. | 8/4/2017 | 112 | ||||||||||||
| JPY1,655,674 | USD14,857 | UBS AG | 8/4/2017 | (113 | ) | |||||||||||
| 98 | American Funds Insurance Series |
Global Bond Fund
| Contract amount | Unrealized (depreciation) appreciation | |||||||||||||||
| Purchases (000) | Sales (000) | Counterparty | Settlement date | at 6/30/2017 (000) | ||||||||||||
| NOK31,682 | DKK24,600 | Citibank | 8/9/2017 | $11 | ||||||||||||
| JPY392,473 | USD3,596 | Citibank | 8/9/2017 | (101 | ) | |||||||||||
| NOK70,523 | CHF8,000 | Bank of America, N.A. | 8/10/2017 | 89 | ||||||||||||
| USD5,959 | NZD8,200 | Citibank | 8/10/2017 | (45 | ) | |||||||||||
| USD9,203 | CAD12,000 | Goldman Sachs | 8/10/2017 | (57 | ) | |||||||||||
| JPY1,310,000 | USD11,894 | HSBC Bank | 8/14/2017 | (224 | ) | |||||||||||
| USD11,444 | CNH80,000 | Citibank | 8/14/2017 | (314 | ) | |||||||||||
| SEK30,059 | USD3,464 | Barclays Bank PLC | 8/17/2017 | 114 | ||||||||||||
| JPY846,335 | USD7,628 | HSBC Bank | 8/23/2017 | (85 | ) | |||||||||||
| USD138,524 | JPY15,300,000 | Citibank | 5/21/2018 | 255 | ||||||||||||
|
| |||||||||||||||
| $(1,177 | ) | |||||||||||||||
|
| |||||||||||||||
Swap contracts
Interest rate swaps
| Receive | Pay | Expiration date | Notional (000) | Value at 6/30/2017 (000) | Upfront payments/ receipts (000) | Unrealized (depreciation) appreciation at 6/30/2017 (000) | ||||||||||||||||
U.S. EFFR | 1.299% | 1/31/2018 | $450,000 | $ | (14 | ) | $– | $ | (14 | ) | ||||||||||||
1.707% | 3-month USD-LIBOR | 3/16/2019 | 12,000 | 29 | – | 29 | ||||||||||||||||
1.6505% | 3-month USD-LIBOR | 3/21/2019 | 85,000 | 122 | – | 123 | ||||||||||||||||
1.36% | 6-month NOK-NIBOR | 12/19/2019 | NKr250,000 | 128 | – | 128 | ||||||||||||||||
1.572% | 3-month USD-LIBOR | 9/16/2020 | $ 10,000 | (60 | ) | – | (60 | ) | ||||||||||||||
6.775% | 28-day MXN-TIIE | 6/20/2022 | MXN280,000 | (16 | ) | – | (16 | ) | ||||||||||||||
6.73% | 28-day MXN-TIIE | 6/20/2022 | 340,000 | (56 | ) | – | (56 | ) | ||||||||||||||
6-month HUF-BUBOR | 2.58% | 3/31/2027 | HUF2,540,000 | (276 | ) | – | (276 | ) | ||||||||||||||
3-month USD-LIBOR | 2.52611% | 11/24/2045 | $ 17,400 | 6 | – | 6 | ||||||||||||||||
3-month USD-LIBOR | 2.535% | 11/24/2045 | 1,100 | (2 | ) | – | (2 | ) | ||||||||||||||
3-month USD-LIBOR | 2.556% | 11/27/2045 | 10,000 | (60 | ) | – | (60 | ) | ||||||||||||||
3-month USD-LIBOR | 2.354% | 1/29/2046 | 6,000 | 221 | – | 221 | ||||||||||||||||
3-month USD-LIBOR | 2.116% | 4/15/2046 | 2,250 | 198 | – | 198 | ||||||||||||||||
3-month USD-LIBOR | 1.909% | 10/11/2046 | 5,750 | 771 | – | 771 | ||||||||||||||||
3-month USD-LIBOR | 2.699% | 1/31/2047 | 2,800 | (104 | ) | – | (104 | ) | ||||||||||||||
3-month USD-LIBOR | 2.659% | 2/8/2047 | 6,000 | (170 | ) | – | (170 | ) | ||||||||||||||
3-month USD-LIBOR | 2.696% | 3/7/2047 | 4,500 | (165 | ) | – | (165 | ) | ||||||||||||||
6-month EURIBOR | 1.4162% | 3/8/2047 | € 4,400 | 150 | – | 150 | ||||||||||||||||
6-month EURIBOR | 1.4247% | 4/28/2047 | 2,500 | 80 | – | 80 | ||||||||||||||||
|
|
|
| |||||||||||||||||||
| $– | $ | 783 | ||||||||||||||||||||
|
|
|
| |||||||||||||||||||
The following footnotes apply to either the individual securities noted or one or more of the securities aggregated and listed as a single line item.
| 1 | Index-linked bond whose principal amount moves with a government price index. |
| 2 | A portion of this security was pledged as collateral. The total value of pledged collateral was $14,439,000, which represented .60% of the net assets of the fund. |
| 3 | Acquired in a transaction exempt from registration under Rule 144A or Section 4(2) of the Securities Act of 1933. May be resold in the U.S. in transactions exempt from registration, normally to qualified institutional buyers. The total value of all such securities was $283,746,000, which represented 11.84% of the net assets of the fund. |
| 4 | Notional amount is calculated based on the number of contracts and notional contract size. |
| 5 | Value is calculated based on the notional amount and current market price. |
| American Funds Insurance Series | 99 |
Global Bond Fund
Key to abbreviations and symbols
AUD/A$ = Australian dollars
BRL = Brazilian reais
BUBOR = Budapest Interbank Offered Rate
CAD/C$ = Canadian dollars
CHF = Swiss francs
CLP = Chilean pesos
CNH = Chinese yuan renminbi
COP = Colombian pesos
DKK = Danish kroner
EFFR = Federal Funds Effective Rate
EUR/€ = Euros
EURIBOR = Euro Interbank Offered Rate
GBP/£ = British pounds
HUF = Hungarian forints
ILS = Israeli shekels
INR = Indian rupees
INR = Indian rupees
JPY/¥ = Japanese yen
LIBOR = London Interbank Offered Rate
MXN = Mexican pesos
MYR = Malaysian ringgits
NIBOR = Norwegian Interbank Offered Rate
NOK/NKr = Norwegian kroner
NZD = New Zealand dollars
PLN = Polish zloty
SEK = Swedish kronor
THB = Thai baht
TIIE = Equilibrium Interbank Interest Rate
TRY = Turkish lira
USD/$ = U.S. dollars
ZAR = South African rand
See Notes to Financial Statements
| 100 | American Funds Insurance Series |
| Summary investment portfolio June 30, 2017 | unaudited |
| Bonds, notes & other debt instruments 93.24% | Principal amount (000) |
Value | ||||||||
| Corporate bonds & notes 92.32% | ||||||||||
| Energy | American Energy (Permian Basin) 7.125% 20201 | $ 8,045 | $ | 6,677 | ||||||
| 17.72% | Blackstone CQP Holdco LP, 6.50% 20211,2 | 24,675 | 24,811 | |||||||
Cheniere Energy, Inc. 5.13%-7.00% 2024-20271 | 2,810 | 2,941 | ||||||||
Chesapeake Energy Corp. 8.00% 20251 | 7,550 | 7,503 | ||||||||
Chesapeake Energy Corp. 4.41%-8.00% 2019-20271,3 | 14,253 | 14,042 | ||||||||
CONSOL Energy Inc. 5.875% 2022 | 12,599 | 12,442 | ||||||||
NGL Energy Partners LP 6.875% 2021 | 6,640 | 6,623 | ||||||||
Southwestern Energy Co. 4.10% 2022 | 7,605 | 7,125 | ||||||||
Sunoco LP 6.25% 2021 | 5,950 | 6,233 | ||||||||
Teekay Corp. 8.50% 2020 | 11,168 | 10,233 | ||||||||
Weatherford International PLC 6.75% 2040 | 7,980 | 6,903 | ||||||||
Weatherford International PLC 4.50%-9.88% 2021-20421 | 13,125 | 12,038 | ||||||||
Other securities | 161,409 | |||||||||
|
| |||||||||
| 278,980 | ||||||||||
|
| |||||||||
| Health care | Centene Corp. 4.75% 2022 | 7,715 | 8,091 | |||||||
| 13.08% | Centene Corp. 4.75%-6.13% 2021-2025 | 9,130 | 9,574 | |||||||
Kinetic Concepts, Inc. 12.50% 20211 | 7,813 | 8,829 | ||||||||
Molina Healthcare, Inc. 5.375% 2022 | 9,615 | 10,228 | ||||||||
Rotech Healthcare Inc., Term Loan, (3-month USD-LIBOR + 11.00%) 13.00% 2020 (84.62% PIK)3,4,5,6,7 | 6,351 | 6,222 | ||||||||
Tenet Healthcare Corp. 4.38%-7.00% 2021-20251 | 11,832 | 11,934 | ||||||||
Tenet Healthcare Corp., First Lien 4.50%-6.00% 2020-2021 | 11,515 | 12,114 | ||||||||
VPI Escrow Corp. 6.375% 20201 | 9,690 | 9,436 | ||||||||
VPI Escrow Corp. 5.625% 20211 | 1,175 | 1,066 | ||||||||
VPI Escrow Corp. 6.50%-7.50% 2021-20241 | 6,615 | 6,756 | ||||||||
VRX Escrow Corp. 6.125% 20251 | 18,995 | 16,146 | ||||||||
VRX Escrow Corp. 5.38%-7.25% 2020-20231 | 10,960 | 9,947 | ||||||||
Other securities | 95,614 | |||||||||
|
| |||||||||
| 205,957 | ||||||||||
|
| |||||||||
| Consumer | Cablevision Systems Corp. 6.75% 2021 | 5,875 | 6,521 | |||||||
| discretionary | Cablevision Systems Corp. 5.50%-7.75% 2018-20271 | 1,575 | 1,662 | |||||||
| 12.04% | CCO Holdings LLC and CCO Holdings Capital Corp. 5.75% 20261 | 10,620 | 11,390 | |||||||
CCO Holdings LLC and CCO Holdings Capital Corp. 4.91%-5.88% 2024-20271 | 8,625 | 9,082 | ||||||||
Clear Channel Worldwide Holdings, Inc. 7.625% 2020 | 12,713 | 12,697 | ||||||||
iHeartCommunications, Inc. 9.00% 2019 | 9,685 | 7,639 | ||||||||
Petsmart, Inc. 5.875% 20251 | 7,365 | 7,135 | ||||||||
Petsmart, Inc. 7.13%-8.88% 2023-20251 | 10,625 | 9,614 | ||||||||
Petsmart Inc., Term Loan B-2, (3-month USD-LIBOR + 3.00%) 4.22% 20223,4,5 | 3,444 | 3,207 | ||||||||
Wynn Las Vegas, LLC and Wynn Capital Corp. 5.50% 20251 | 6,525 | 6,880 | ||||||||
Wynn Macau, Ltd. 5.25% 20211 | 7,275 | 7,475 | ||||||||
Other securities | 106,178 | |||||||||
|
| |||||||||
| 189,480 | ||||||||||
|
| |||||||||
| Materials | ArcelorMittal 7.50% 2041 | 9,555 | 10,582 | |||||||
| 11.98% | Cliffs Natural Resources Inc. 8.25% 20201 | 7,865 | 8,612 | |||||||
Cliffs Natural Resources Inc. 5.75% 20251 | 11,950 | 11,323 | ||||||||
Cliffs Natural Resources Inc. 6.25% 2040 | 825 | 627 | ||||||||
First Quantum Minerals Ltd. 7.00% 20211 | 10,813 | 11,137 | ||||||||
First Quantum Minerals Ltd. 7.50% 20251 | 11,625 | 11,422 | ||||||||
First Quantum Minerals Ltd. 7.25% 2022-20231 | 3,575 | 3,629 | ||||||||
FMG Resources 9.75% 20221 | 7,555 | 8,641 | ||||||||
Ryerson Inc. 11.00% 20221 | 6,901 | 7,824 | ||||||||
Other securities | 114,730 | |||||||||
|
| |||||||||
| 188,527 | ||||||||||
|
| |||||||||
| American Funds Insurance Series | 101 |
High-Income Bond Fund
| Bonds, notes & other debt instruments (continued) | Principal amount (000) |
Value | ||||||||
| Corporate bonds & notes (continued) | ||||||||||
Telecommunication services 11.33% | Altice NV 5.50%-7.50% 2022-20261 | $ 4,385 | $ | 4,694 | ||||||
Cequel Communications Holdings I, LLC and Cequel Capital Corp. 6.375% 20201 | 5,267 | 5,386 | ||||||||
Frontier Communications Corp. 10.50% 2022 | 6,780 | 6,483 | ||||||||
Frontier Communications Corp. 8.50%-11.00% 2020-2025 | 12,912 | 12,786 | ||||||||
Ligado Networks, Term Loan, (3-month USD-LIBOR + 8.75%) 9.85% 2020 | 19,138 | 18,414 | ||||||||
Neptune Finco Corp. (Altice NV) 6.63%-10.13% 2023-20251 | 4,450 | 5,022 | ||||||||
Numericable Group SA 6.00%-7.38% 2022-20261 | 5,365 | 5,760 | ||||||||
SoftBank Group Corp. 4.50% 20201 | 6,225 | 6,487 | ||||||||
Sprint Corp. 11.50% 2021 | 5,355 | 6,881 | ||||||||
Sprint Corp. 6.875% 2028 | 5,650 | 6,294 | ||||||||
Sprint Nextel Corp. 7.13%-7.88% 2021-2024 | 8,320 | 9,421 | ||||||||
Wind Acquisition SA 7.375% 20211 | 13,300 | 13,840 | ||||||||
Windstream Holdings, Inc. 7.75% 2021 | 8,225 | 7,773 | ||||||||
Other securities | 69,087 | |||||||||
|
| |||||||||
| 178,328 | ||||||||||
|
| |||||||||
| Information | BMC Software, Inc. 8.125% 20211 | 8,390 | 8,728 | |||||||
| technology | Gogo Inc. 12.50% 20221 | 7,850 | 8,959 | |||||||
| 7.69% | Kronos Inc., Term Loan B, (3-month USD-LIBOR + 8.25%) 9.420% 20243,4,5 | 7,870 | 8,172 | |||||||
Solera Holdings, Inc. 10.50% 20241 | 6,075 | 7,009 | ||||||||
Unisys Corp. 10.75% 20221 | 7,325 | 8,057 | ||||||||
Other securities | 80,102 | |||||||||
|
| |||||||||
| 121,027 | ||||||||||
|
| |||||||||
| Industrials | Associated Materials, LLC 9.00% 20241 | 8,700 | 9,309 | |||||||
| 7.08% | Corporate Risk Holdings LLC 9.50% 20191 | 12,782 | 13,613 | |||||||
Corporate Risk Holdings LLC 13.50% 2020 (100% PIK)1,6,7 | 1,307 | 1,399 | ||||||||
DAE Aviation Holdings, Inc. 10.00% 20231 | 6,625 | 7,370 | ||||||||
Other securities | 79,785 | |||||||||
|
| |||||||||
| 111,476 | ||||||||||
|
| |||||||||
| Utilities | AES Corp. 4.88%-8.00% 2020-20261 | 19,325 | 20,979 | |||||||
| 3.70% | Other securities | 37,244 | ||||||||
|
| |||||||||
| 58,223 | ||||||||||
|
| |||||||||
| Financials | CIT Group Inc. 3.875% 2019 | 9,335 | 9,592 | |||||||
| 3.54% | Other securities | 46,101 | ||||||||
|
| |||||||||
| 55,693 | ||||||||||
|
| |||||||||
| Real estate | Iron Mountain Inc. 5.75% 2024 | 5,975 | 6,124 | |||||||
| 2.10% | Other securities | 26,965 | ||||||||
|
| |||||||||
| 33,089 | ||||||||||
|
| |||||||||
| Consumer staples | Other securities | 31,758 | ||||||||
|
| |||||||||
| 2.02% | ||||||||||
| Municipals | Other securities | 594 | ||||||||
|
| |||||||||
| 0.04% | Total corporate bonds & notes | 1,453,132 | ||||||||
|
| |||||||||
| 102 | American Funds Insurance Series |
High-Income Bond Fund
| Bonds, notes & other debt instruments | Principal amount (000) |
Value | ||||||||
| Other bonds & notes 0.92% | ||||||||||
U.S. Treasury 1.25% 20198 | $ 10,000 | $ | 9,978 | |||||||
Other securities | 4,489 | |||||||||
|
| |||||||||
| 14,467 | ||||||||||
|
| |||||||||
Total bonds, notes & other debt instruments (cost: $1,442,832,000) | 1,467,599 | |||||||||
|
| |||||||||
| Convertible bonds 0.37% | ||||||||||
| Consumer | Other securities | 1,747 | ||||||||
|
| |||||||||
| discretionary | ||||||||||
| 0.11% | ||||||||||
| Miscellaneous | Other convertible bonds in initial period of acquisition | 4,092 | ||||||||
|
| |||||||||
| 0.26% | Total convertible bonds (cost: $5,452,000) | 5,839 | ||||||||
|
| |||||||||
| Convertible stocks 1.07% | Shares | |||||||||
| Telecommunication | Frontier Communications Corp., Series A, convertible preferred | 10,000 | 294 | |||||||
|
| |||||||||
| services | ||||||||||
| 0.02% | ||||||||||
| Other | Other securities | 4,581 | ||||||||
|
| |||||||||
| 0.29% | ||||||||||
| Miscellaneous | Other convertible stocks in initial period of acquisition | 11,953 | ||||||||
|
| |||||||||
| 0.76% | Total convertible stocks (cost: $20,794,000) | 16,828 | ||||||||
|
| |||||||||
| Common stocks 0.80% | ||||||||||
| Information | Corporate Risk Holdings I, Inc.6,9 | 218,504 | 3,402 | |||||||
| technology | Other securities | – | ||||||||
|
| |||||||||
| 0.22% | 3,402 | |||||||||
|
| |||||||||
| Other | Other securities | 7,219 | ||||||||
|
| |||||||||
| 0.45% | ||||||||||
| Miscellaneous | Other common stocks in initial period of acquisition | 1,986 | ||||||||
|
| |||||||||
| 0.13% | Total common stocks (cost: $38,036,000) | 12,607 | ||||||||
|
| |||||||||
| Rights & warrants 0.00% | ||||||||||
| Utilities | Other securities | 46 | ||||||||
|
| |||||||||
| 0.00% | ||||||||||
| Miscellaneous | Other rights & warrants in initial period of acquisition | – | ||||||||
|
| |||||||||
| 0.00% | Total rights & warrants (cost: $65,000) | 46 | ||||||||
|
| |||||||||
| American Funds Insurance Series | 103 |
High-Income Bond Fund
| Short-term securities 3.95% | Principal amount (000) |
Value | ||||||||
ExxonMobil Corp. 1.10% due 7/10/2017 | $ 19,700 | $ | 19,694 | |||||||
Federal Home Loan Bank 0.85% due 7/14/2017 | 10,000 | 9,998 | ||||||||
General Electric Co. 1.08% due 7/3/2017 | 32,400 | 32,398 | ||||||||
|
| |||||||||
Total short-term securities (cost: $62,090,000) | 62,090 | |||||||||
|
| |||||||||
Total investment securities 99.43% (cost: $1,569,269,000) | 1,565,009 | |||||||||
Other assets less liabilities 0.57% | 8,949 | |||||||||
|
| |||||||||
Net assets 100.00% | $ | 1,573,958 | ||||||||
|
| |||||||||
This summary investment portfolio is designed to streamline the report and help investors better focus on the fund’s principal holdings. See the inside back cover for details on how to obtain a complete schedule of portfolio holdings.
As permitted by U.S. Securities and Exchange Commission regulations, “Miscellaneous” securities include holdings in their first year of acquisition that have not previously been publicly disclosed.
“Other securities” includes all issues that are not disclosed separately in the summary investment portfolio.
Swap contracts
Interest rate swaps
| Receive | Pay | Expiration date | Notional (000) | Value at 6/30/2017 (000) | Upfront payments/ receipts (000) | Unrealized appreciation (depreciation) at 6/30/2017 (000) | ||||||||||||||||
3-month USD-LIBOR | 2.0745% | 11/21/2026 | $ | 18,600 | $267 | $– | $267 | |||||||||||||||
3-month USD-LIBOR | 2.2825% | 4/13/2027 | 10,700 | (21 | ) | – | (21) | |||||||||||||||
| $– | $246 | |||||||||||||||||||||
Credit default swaps
Centrally cleared credit default swaps on credit indices — buy protection
| Receive | Pay/ Payment frequency | Expiration date | Notional (000) | Value at 6/30/2017 (000) | Upfront payments (000) | Unrealized appreciation at 6/30/2017 (000) | ||||||||||||||||
CDX.NA.HY.28 | 5.00%/Quarterly | 6/20/2022 | $ | 62,600 | $ | (4,318 | ) | $ | (4,467 | ) | $149 | |||||||||||
The following footnotes apply to either the individual securities noted or one or more of the securities aggregated and listed as a single line item.
| 1 | Acquired in a transaction exempt from registration under Rule 144A or Section 4(2) of the Securities Act of 1933. May be resold in the U.S. in transactions exempt from registration, normally to qualified institutional buyers. The total value of all such securities was $758,939,000, which represented 48.22% of the net assets of the fund. |
| 2 | Acquired through a private placement transaction exempt from registration under the Securities Act of 1933. May be subject to legal or contractual restrictions on resale. Further details on these holdings appear on the next page. |
| 3 | Coupon rate may change periodically. |
| 4 | Loan participations and assignments; may be subject to legal or contractual restrictions on resale. The total value of all such loans, including those in “Other securities,” was $107,360,000, which represented 6.82% of the net assets of the fund. |
| 5 | Principal payments may be made periodically. Therefore, the effective maturity date may be earlier than the stated maturity date. |
| 6 | Valued under fair value procedures adopted by authority of the board of trustees. The total value of all such securities, including those in “Miscellaneous“ and “Other securities,“ was $32,053,000, which represented 2.04% of the net assets of the fund. |
| 7 | Payment in kind; the issuer has the option of paying additional securities in lieu of cash. Most recent payment was 100% cash unless otherwise noted. |
| 8 | A portion of this security was pledged as collateral. The total value of pledged collateral was $3,469,000, which represented .22% of the net assets of the fund. |
| 9 | Security did not produce income during the last 12 months. |
| 104 | American Funds Insurance Series |
High-Income Bond Fund
| Private placement securities | Acquisition date(s) | Cost (000) | Value (000) | Percent of net assets | ||||||||||||
Blackstone CQP Holdco LP, 6.50% 2021 | 3/6/2017 | $ | 24,675 | $ | 24,811 | 1.58 | % | |||||||||
Other securities | 3/10/2010-8/22/2014 | 13,197 | 4,239 | .26 | ||||||||||||
|
|
|
|
|
| |||||||||||
Total private placement securities | $ | 37,872 | $ | 29,050 | 1.84 | % | ||||||||||
|
|
|
|
|
| |||||||||||
Key to abbreviations and symbol
LIBOR = London Interbank Offered Rate
USD/$ = U.S. dollars
See Notes to Financial Statements
| American Funds Insurance Series | 105 |
| Summary investment portfolio June 30, 2017 | unaudited |
| Bonds, notes & other debt instruments 97.67% | Principal amount (000) |
Value | ||||||||
| Mortgage-backed obligations 62.02% | ||||||||||
| Federal agency | Fannie Mae 4.00% 20361 | $ 5,460 | $ | 5,803 | ||||||
| mortgage-backed | Fannie Mae 4.00% 20471 | 10,353 | 10,891 | |||||||
| obligations | Fannie Mae 4.00% 20471 | 3,985 | 4,192 | |||||||
| 54.82% | Fannie Mae 4.00%-5.00% 2036-20471,2 | 2,523 | 2,660 | |||||||
Freddie Mac 5.00% 20341 | 1,816 | 1,991 | ||||||||
Freddie Mac 4.00% 20361 | 6,443 | 6,851 | ||||||||
Freddie Mac 4.00% 20361 | 1,107 | 1,169 | ||||||||
Freddie Mac 3.50% 20451 | 10,635 | 11,016 | ||||||||
Freddie Mac 4.00% 20471,2 | 47,854 | 50,232 | ||||||||
Freddie Mac 4.00% 20471 | 10,000 | 10,528 | ||||||||
Freddie Mac 4.00% 20471 | 9,969 | 10,501 | ||||||||
Freddie Mac 4.50% 20471,2 | 3,700 | 3,963 | ||||||||
Freddie Mac Pool #760014 2.981% 20451,3 | 3,309 | 3,405 | ||||||||
Government National Mortgage Assn. 3.75% 20341 | 1,438 | 1,510 | ||||||||
Government National Mortgage Assn. 5.50% 20401 | 2,558 | 2,862 | ||||||||
Government National Mortgage Assn. 5.00% 20411 | 1,445 | 1,552 | ||||||||
Government National Mortgage Assn. 3.50% 20431 | 2,588 | 2,703 | ||||||||
Government National Mortgage Assn. 3.50% 20431 | 1,978 | 2,064 | ||||||||
Government National Mortgage Assn. 3.50% 20431 | 1,942 | 2,013 | ||||||||
Government National Mortgage Assn. 4.25% 20441 | 1,782 | 1,905 | ||||||||
Government National Mortgage Assn. 4.00% 20461 | 1,608 | 1,668 | ||||||||
Government National Mortgage Assn. 4.00% 20471 | 13,380 | 14,098 | ||||||||
Government National Mortgage Assn. 4.00% 20471 | 4,972 | 5,248 | ||||||||
Government National Mortgage Assn. 4.50% 20471 | 5,152 | 5,484 | ||||||||
Government National Mortgage Assn. 4.737% 20651 | 1,995 | 2,102 | ||||||||
Government National Mortgage Assn. 4.62% 20661 | 2,037 | 2,184 | ||||||||
Government National Mortgage Assn. 3.50%-6.50% 2038-20661 | 12,773 | 13,366 | ||||||||
Seasoned Credit Risk Transfer, Series 2017-1, Class HA, 2.00% 20561 | 1,571 | 1,574 | ||||||||
Vendee Mortgage Trust, Series 2011-2, Class V, 3.75% 20281 | 4,727 | 4,793 | ||||||||
Vendee Mortgage Trust, Series 2010-1, Class DA, 4.25% 20351 | 799 | 820 | ||||||||
|
| |||||||||
| 189,148 | ||||||||||
|
| |||||||||
| Collateralized | Mortgage Repurchase Agreement Financing Trust, Series 2017-1, Class A1, | |||||||||
| mortgage-backed | (1-month USD-LIBOR + 0.85%) 1.967% 20191,3,4 | 1,620 | 1,621 | |||||||
| (privately | Towd Point Mortgage Trust, Series 2017-1, Class A1, 2.75% 20561,3,4 | 2,636 | 2,663 | |||||||
| originated) | Towd Point Mortgage Trust, Series 2015-2, Class 2A11, 3.00% 20571,3,4 | 2,520 | 2,556 | |||||||
| 3.76% | Other securities | 6,137 | ||||||||
|
| |||||||||
| 12,977 | ||||||||||
|
| |||||||||
| Other | Freddie Mac, Series KJ02, Class A2, multifamily 2.597% 20201 | 4,502 | 4,588 | |||||||
| mortgage-backed | Freddie Mac, Series K031, Class A2, multifamily 3.30% 20231,3 | 4,722 | 4,955 | |||||||
| securities | Freddie Mac, Series K032, Class A2, multifamily 3.31% 20231,3 | 1,250 | 1,313 | |||||||
|
| |||||||||
| 3.15% | 10,856 | |||||||||
|
| |||||||||
| Commercial | Other securities | 995 | ||||||||
|
| |||||||||
| mortgage-backed | Total mortgage-backed obligations | 213,976 | ||||||||
|
| |||||||||
securities 0.29% | ||||||||||
| Federal agency bonds & notes 18.37% | ||||||||||
Fannie Mae 1.875% 2022 | 3,000 | 2,996 | ||||||||
Fannie Mae 2.00% 2022 | 40,000 | 40,203 | ||||||||
Federal Home Loan Bank 1.375% 2021 | 3,000 | 2,966 | ||||||||
Federal Home Loan Bank 1.875% 2021 | 10,000 | 10,034 | ||||||||
United States Agency for International Development, Jordan (Kingdom of) 2.503% 2020 | 7,000 | 7,184 | ||||||||
|
| |||||||||
| 63,383 | ||||||||||
|
| |||||||||
| 106 | American Funds Insurance Series |
Mortgage Fund
| Bonds, notes & other debt instruments | Principal amount (000) |
Value | ||||||||
| U.S. Treasury bonds & notes 11.90% | ||||||||||
| U.S. Treasury | U.S. Treasury Inflation-Protected Security 0.375% 20255,6 | $ 10,516 | $ | 10,449 | ||||||
| inflation-protected | U.S. Treasury Inflation-Protected Security 0.625% 20265,6 | 4,497 | 4,529 | |||||||
| securities | U.S. Treasury Inflation-Protected Security 2.125% 20416 | 123 | 153 | |||||||
| 8.79% | U.S. Treasury Inflation-Protected Security 0.75% 20426 | 6,963 | 6,641 | |||||||
U.S. Treasury Inflation-Protected Security 1.375% 20446 | 7,842 | 8,549 | ||||||||
|
| |||||||||
| 30,321 | ||||||||||
|
| |||||||||
| U.S. Treasury | U.S. Treasury 1.875% 2022 | 9,000 | 8,999 | |||||||
| 3.11% | U.S. Treasury 1.50%-2.13% 2020-2022 | 1,744 | 1,755 | |||||||
|
| |||||||||
| 10,754 | ||||||||||
|
| |||||||||
Total U.S. Treasury bonds & notes | 41,075 | |||||||||
|
| |||||||||
| Asset-backed obligations 5.32% | ||||||||||
Hertz Vehicle Financing LLC, Rental Car Asset-backed Notes, Series 2015-1, Class A, | 1,823 | 1,814 | ||||||||
Other securities | 16,529 | |||||||||
|
| |||||||||
| 18,343 | ||||||||||
|
| |||||||||
| Corporate bonds & notes 0.06% | ||||||||||
| Financials | Other securities | 214 | ||||||||
|
| |||||||||
| 0.06% | Total bonds, notes & other debt instruments (cost: $335,741,000) | 336,991 | ||||||||
|
| |||||||||
| Short-term securities 18.17% | ||||||||||
Bank of Tokyo-Mitsubishi UFJ, Ltd. 1.37% due 11/16/2017 | 5,000 | 4,974 | ||||||||
Coca-Cola Co. 1.22% due 12/6/20174 | 10,000 | 9,945 | ||||||||
Federal Home Loan Bank 1.00%-1.03% due 10/20/2017-11/10/2017 | 15,679 | 15,621 | ||||||||
Freddie Mac 1.02% due 11/20/2017 | 3,750 | 3,734 | ||||||||
General Electric Co. 1.08% due 7/3/2017 | 8,800 | 8,799 | ||||||||
John Deere Canada ULC 1.16% due 7/25/20174 | 4,700 | 4,696 | ||||||||
Mitsubishi UFJ Trust and Banking Corp. 1.35% due 11/16/20174 | 5,000 | 4,974 | ||||||||
Private Export Funding Corp. 1.26% due 11/17/20174 | 5,000 | 4,975 | ||||||||
Svenska Handelsbanken Inc. 1.28% due 11/29/20174 | 5,000 | 4,972 | ||||||||
|
| |||||||||
Total short-term securities (cost: $62,695,000) | 62,690 | |||||||||
|
| |||||||||
Total investment securities 115.84% (cost: $398,436,000) | 399,681 | |||||||||
Other assets less liabilities (15.84)% | (54,657 | ) | ||||||||
|
| |||||||||
Net assets 100.00% | $ | 345,024 | ||||||||
|
| |||||||||
This summary investment portfolio is designed to streamline the report and help investors better focus on the fund’s principal holdings. See the inside back cover for details on how to obtain a complete schedule of portfolio holdings.
“Other securities” includes all issues that are not disclosed separately in the summary investment portfolio. “Other securities” includes securities which were valued under fair value procedures adopted by authority of the board of trustees. The total value of securities which were valued under fair value procedures was $1,423,000, which represented .41% of the net assets of the fund.
| American Funds Insurance Series | 107 |
Mortgage Fund
Futures contracts
| Contracts | Type | Number of contracts | Expiration | Notional amount7 (000) | Value at 6/30/20178 (000) | Unrealized appreciation (depreciation) at 6/30/2017 (000) | ||||||||||||||||||
20 Year U.S. Treasury Bond Futures | Long | 48 | September 2017 | $ | 4,800 | $ | 7,377 | $ | 57 | |||||||||||||||
30 Year Ultra U.S. Treasury Bond Futures | Long | 5 | September 2017 | 500 | 830 | 11 | ||||||||||||||||||
10 Year Ultra U.S. Treasury Note Futures | Short | 17 | September 2017 | (1,700 | ) | (2,292 | ) | 16 | ||||||||||||||||
5 Year U.S. Treasury Note Futures | Long | 2,195 | October 2017 | 219,500 | 258,650 | (626 | ) | |||||||||||||||||
30 Day Federal Funds Futures | Long | 208 | October 2017 | 86,667 | 85,629 | (5 | ) | |||||||||||||||||
|
| |||||||||||||||||||||||
| $ | (547 | ) | ||||||||||||||||||||||
|
| |||||||||||||||||||||||
Swap contracts
Interest rate swaps
| Receive | Pay | Expiration date | Notional (000) | Value at 6/30/2017 (000) | Upfront payments/ receipts (000) | Unrealized appreciation (depreciation) at 6/30/2017 (000) | ||||||||||||||||
U.S. EFFR | 1.1745% | 11/1/2017 | $ | 1,000,000 | $ | 30 | $ | – | $ | 30 | ||||||||||||
U.S. EFFR | 1.17865% | 11/1/2017 | 500,000 | 10 | – | 10 | ||||||||||||||||
U.S. EFFR | 1.2165% | 11/1/2017 | 700,000 | (14 | ) | – | (14 | ) | ||||||||||||||
3-month USD-LIBOR | 1.217% | 9/22/2021 | 11,500 | 310 | – | 310 | ||||||||||||||||
3-month USD-LIBOR | 1.225% | 9/22/2021 | 11,500 | 306 | – | 306 | ||||||||||||||||
3-month USD-LIBOR | 1.2796% | 10/11/2021 | 14,500 | 361 | – | 361 | ||||||||||||||||
3-month USD-LIBOR | 2.24% | 12/5/2026 | 10,500 | 3 | – | 3 | ||||||||||||||||
3-month USD-LIBOR | 2.27% | 12/5/2026 | 8,500 | (20 | ) | – | (20 | ) | ||||||||||||||
3-month USD-LIBOR | 3.34% | 6/27/2044 | 3,500 | (582 | ) | – | (582 | ) | ||||||||||||||
3-month USD-LIBOR | 3.206% | 7/31/2044 | 2,000 | (279 | ) | – | (279 | ) | ||||||||||||||
3-month USD-LIBOR | 3.238% | 8/8/2044 | 2,000 | (292 | ) | – | (292 | ) | ||||||||||||||
3-month USD-LIBOR | 3.2265% | 9/25/2044 | 3,000 | (431 | ) | – | (431 | ) | ||||||||||||||
3-month USD-LIBOR | 2.5055% | 1/9/2045 | 2,000 | 9 | – | 9 | ||||||||||||||||
3-month USD-LIBOR | 2.454% | 1/15/2045 | 3,200 | 49 | – | 49 | ||||||||||||||||
3-month USD-LIBOR | 2.516% | 10/20/2045 | 2,500 | 6 | – | 6 | ||||||||||||||||
3-month USD-LIBOR | 2.525% | 10/20/2045 | 1,500 | 1 | – | 1 | ||||||||||||||||
3-month USD-LIBOR | 2.5315% | 10/26/2045 | 4,000 | (3 | ) | – | (3 | ) | ||||||||||||||
3-month USD-LIBOR | 2.52822% | 11/23/2045 | 3,560 | – | 9 | – | – | 9 | ||||||||||||||
3-month USD-LIBOR | 2.4835% | 12/3/2045 | 2,000 | 19 | – | 19 | ||||||||||||||||
3-month USD-LIBOR | 2.59125% | 12/16/2045 | 2,250 | (30 | ) | – | (30 | ) | ||||||||||||||
3-month USD-LIBOR | 2.4095% | 1/14/2046 | 1,500 | 38 | – | 38 | ||||||||||||||||
3-month USD-LIBOR | 2.33725% | 2/1/2046 | 5,000 | 203 | – | 203 | ||||||||||||||||
|
|
|
| |||||||||||||||||||
| $ | – | $ | (306 | ) | ||||||||||||||||||
|
|
|
| |||||||||||||||||||
The following footnotes apply to either the individual securities noted or one or more of the securities aggregated and listed as a single line item.
| 1 | Principal payments may be made periodically. Therefore, the effective maturity date may be earlier than the stated maturity date. |
| 2 | Purchased on a TBA basis. |
| 3 | Coupon rate may change periodically. |
| 4 | Acquired in a transaction exempt from registration under Rule 144A or Section 4(2) of the Securities Act of 1933. May be resold in the U.S. in transactions exempt from registration, normally to qualified institutional buyers. The total value of all such securities was $55,065,000, which represented 15.96% of the net assets of the fund. |
| 5 | A portion of this security was pledged as collateral. The total value of pledged collateral was $9,431,000, which represented 2.73% of the net assets of the fund. |
| 6 | Index-linked bond whose principal amount moves with a government price index. |
| 7 | Notional amount is calculated based on the number of contracts and notional contract size. |
| 8 | Value is calculated based on the notional amount and current market price. |
| 9 | Amount less than one thousand. |
| 108 | American Funds Insurance Series |
Mortgage Fund
Key to abbreviations and symbol
EFFR = Effective Federal Funds Rate
LIBOR = London Interbank Offered Rate
TBA = To-be-announced
USD/$ = U.S. dollars
See Notes to Financial Statements
| American Funds Insurance Series | 109 |
| ||
| Investment portfolio June 30, 2017 | unaudited |
| Short-term securities 100.11% | Principal amount (000) |
Value | ||||||||
Commercial paper 72.15% | ||||||||||
Apple Inc. 1.08% due 8/3/20171 | $ 9,000 | $ | 8,991 | |||||||
Australia & New Zealand Banking Group, Ltd. 1.10% due 9/6/20171 | 5,000 | 4,988 | ||||||||
Bridgestone Americas, Inc. 1.05% due 7/11/20171 | 8,500 | 8,497 | ||||||||
CAFCO, LLC 1.28% due 10/3/20171 | 10,000 | 9,968 | ||||||||
Chariot Funding, LLC 1.18% due 7/18/20171 | 10,000 | 9,994 | ||||||||
Cisco Systems, Inc. 0.98% due 7/12/20171 | 10,000 | 9,996 | ||||||||
Emerson Electric Co. 1.08% due 8/1/20171 | 5,500 | 5,495 | ||||||||
ExxonMobil Corp. 1.14% due 9/11/2017 | 10,000 | 9,977 | ||||||||
Fairway Finance Corp. 1.16% due 8/28/20171 | 10,000 | 9,979 | ||||||||
John Deere Canada ULC 1.12% due 7/10/20171 | 8,300 | 8,297 | ||||||||
KfW 0.95% due 7/5/20171 | 10,000 | 9,999 | ||||||||
Liberty Street Funding Corp. 1.28% due 9/18/20171 | 10,000 | 9,972 | ||||||||
Microsoft Corp. 0.97% due 7/17/20171 | 10,000 | 9,995 | ||||||||
Mizuho Bank, Ltd. 1.11% due 7/3/20171 | 10,000 | 9,999 | ||||||||
National Australia Bank Ltd. 1.14% due 7/24/20171 | 11,400 | 11,391 | ||||||||
Nestlé Finance International Ltd. 1.14% due 9/7/2017 | 8,000 | 7,982 | ||||||||
Old Line Funding, LLC 1.02% due 7/17/20171 | 10,000 | 9,994 | ||||||||
Paccar Financial Corp. 1.12% due 7/28/2017 | 6,700 | 6,694 | ||||||||
Pfizer Inc. 1.15% due 9/18/20171 | 10,000 | 9,975 | ||||||||
Prudential Funding, LLC 1.10% due 7/17/2017 | 10,000 | 9,995 | ||||||||
Simon Property Group, L.P. 1.08% due 8/14/20171 | 10,000 | 9,985 | ||||||||
Sumitomo Mitsui Banking Corp. 1.15% due 8/1/20171 | 12,900 | 12,886 | ||||||||
Total Capital Canada Ltd. 1.05% due 8/15/20171 | 10,000 | 9,985 | ||||||||
United Parcel Service Inc. 1.08% due 7/5/20171 | 9,000 | 8,999 | ||||||||
|
| |||||||||
|
224,033
|
| ||||||||
|
| |||||||||
| Federal agency discount notes 24.74% | ||||||||||
Fannie Mae 0.80% due 7/17/2017 | 15,000 | 14,995 | ||||||||
Federal Home Loan Bank 0.64%-0.90% due 7/7/2017-8/1/2017 | 35,700 | 35,682 | ||||||||
Freddie Mac 0.82%-1.03% due 7/13/2017-11/10/2017 | 16,300 | 16,251 | ||||||||
International Bank for Reconstruction and Development 0.86% due 7/13/2017 | 9,900 | 9,898 | ||||||||
|
| |||||||||
|
76,826
|
| ||||||||
|
| |||||||||
| U.S. Treasury bonds & notes 3.22% | ||||||||||
U.S. Treasury Bills 0.90% due 8/24/2017 | 10,000 | 9,987 | ||||||||
|
| |||||||||
Total short-term securities (cost: $310,858,000) |
|
310,846
|
| |||||||
|
| |||||||||
Total investment securities 100.11% (cost: $310,858,000) | 310,846 | |||||||||
Other assets less liabilities (0.11)% |
| (347
| )
| |||||||
|
| |||||||||
Net assets 100.00% |
$
|
310,499
|
| |||||||
|
| |||||||||
1 Acquired in a transaction exempt from registration under Section 4(2) of the Securities Act of 1933. May be resold in the U.S. in transactions exempt from registration, normally to qualified institutional buyers. The total value of all such securities was $189,386,000, which represented 60.99% of the net assets of the fund.
See Notes to Financial Statements
| 110 | American Funds Insurance Series |
U.S. Government/AAA-Rated Securities Fund
| ||
| Summary investment portfolio June 30, 2017 | unaudited | |
| Bonds, notes & other debt instruments 97.12% | Principal amount (000) | Value (000) | ||||||||
U.S. Treasury bonds & notes 42.41%
| ||||||||||
U.S. Treasury | U.S. Treasury 1.125% 2021 | $ 31,950 | $ | 31,114 | ||||||
| 32.16% | U.S. Treasury 1.375% 2021 | 20,000 | 19,786 | |||||||
U.S. Treasury 1.75% 20211 | 40,540 | 40,437 | ||||||||
U.S. Treasury 2.00% 2021 | 46,300 | 46,638 | ||||||||
U.S. Treasury 2.00% 2021 | 44,350 | 44,745 | ||||||||
U.S. Treasury 2.00% 2021 | 26,500 | 26,769 | ||||||||
U.S. Treasury 2.125% 2021 | 23,450 | 23,774 | ||||||||
U.S. Treasury 2.25% 2021 | 64,745 | 65,989 | ||||||||
U.S. Treasury 2.25% 2021 | 38,000 | 38,752 | ||||||||
U.S. Treasury 1.75% 2022 | 198,300 | 197,138 | ||||||||
U.S. Treasury 1.875% 2022 | 63,000 | 62,995 | ||||||||
U.S. Treasury 2.125% 2022 | 21,970 | 22,146 | ||||||||
U.S. Treasury 1.50% 2023 | 26,020 | 25,333 | ||||||||
U.S. Treasury 2.125% 2023 | 98,795 | 99,135 | ||||||||
U.S. Treasury 2.00% 2024 | 30,000 | 29,741 | ||||||||
U.S. Treasury 2.875% 2046 | 23,339 | 23,504 | ||||||||
U.S. Treasury 3.00% 2047 | 32,660 | 33,760 | ||||||||
U.S. Treasury 3.00% 2047 | 17,140 | 17,708 | ||||||||
U.S. Treasury 0.75%-6.25% 2019-2030 | 76,561 | 77,973 | ||||||||
|
| |||||||||
| 927,437 | ||||||||||
|
| |||||||||
U.S. Treasury | U.S. Treasury Inflation-Protected Security 0.25% 20252 | 26,984 | 26,533 | |||||||
| inflation-protected | U.S. Treasury Inflation-Protected Security 0.375% 20252 | 85,884 | 85,334 | |||||||
| securities | U.S. Treasury Inflation-Protected Security 2.375% 20252 | 24,645 | 28,096 | |||||||
| 10.25% | U.S. Treasury Inflation-Protected Security 0.375% 20272 | 32,896 | 32,337 | |||||||
U.S. Treasury Inflation-Protected Security 0.75% 20422 | 21,306 | 20,320 | ||||||||
U.S. Treasury Inflation-Protected Security 1.375% 20441,2 | 68,930 | 75,144 | ||||||||
U.S. Treasury Inflation-Protected Securities 0.13%-2.13% 2020-20472 | 27,968 | 27,679 | ||||||||
|
| |||||||||
| 295,443 | ||||||||||
|
| |||||||||
Total U.S. Treasury bonds & notes | 1,222,880 | |||||||||
|
| |||||||||
Mortgage-backed obligations 35.97%
| ||||||||||
Federal agency | Fannie Mae 3.00% 20363 | 30,230 | 30,707 | |||||||
| mortgage-backed | Fannie Mae 4.00% 20363 | 17,031 | 18,100 | |||||||
| obligations | Fannie Mae 3.00% 20373 | 19,307 | 19,612 | |||||||
| 35.32% | Fannie Mae 3.00% 20463 | 29,492 | 29,476 | |||||||
Fannie Mae 4.00% 20473,4 | 56,000 | 58,760 | ||||||||
Fannie Mae 4.00% 20473 | 46,481 | 48,897 | ||||||||
Fannie Mae 4.00% 20473 | 25,000 | 26,300 | ||||||||
Fannie Mae 4.50% 20473,4 | 64,000 | 68,645 | ||||||||
Fannie Mae 0%-9.47% 2017-20473,4,5 | 77,529 | 81,587 | ||||||||
Freddie Mac 3.50% 20463 | 57,957 | 59,791 | ||||||||
Freddie Mac 4.00% 20473,4 | 84,742 | 88,953 | ||||||||
Freddie Mac 4.00% 20473,4 | 75,000 | 78,870 | ||||||||
Freddie Mac 4.00% 20473 | 58,200 | 61,273 | ||||||||
Freddie Mac 0%-5.50% 2023-20453,5 | 18,081 | 18,783 | ||||||||
Government National Mortgage Assn. 4.50% 20453 | 21,214 | 22,562 | ||||||||
Government National Mortgage Assn. 4.00% 20473 | 87,804 | 92,676 | ||||||||
Government National Mortgage Assn. 4.00% 20473 | 26,264 | 27,675 | ||||||||
Government National Mortgage Assn. 4.50% 20473 | 24,310 | 25,876 | ||||||||
Government National Mortgage Assn. 1.68%-6.64% 2034-20653,5 | 119,472 | 125,833 | ||||||||
Other securities | 34,048 | |||||||||
|
| |||||||||
| 1,018,424 | ||||||||||
|
| |||||||||
| American Funds Insurance Series | 111 |
U.S. Government/AAA-Rated Securities Fund
| Bonds, notes & other debt instruments (continued) | Principal amount (000) | Value (000) | ||||||||
Mortgage-backed obligations (continued)
| ||||||||||
Other | Fannie Mae 2.72%-3.50% 2022-20243,5 | $ | 10,225 | $ | 10,676 | |||||
mortgage-backed securities 0.65% | Freddie Mac 1.38%-3.32% 2020-20233,5 | 8,050 | 8,102 | |||||||
|
| |||||||||
|
| 18,778
|
| ||||||||
|
| |||||||||
Total mortgage-backed obligations |
| 1,037,202
|
| |||||||
|
| |||||||||
| Federal agency bonds & notes 18.74% | ||||||||||
Fannie Mae 1.25%-7.13% 2019-2030 | 31,400 | 33,110 | ||||||||
Federal Home Loan Bank 1.75% 2018 | 74,000 | 74,372 | ||||||||
Federal Home Loan Bank 3.375% 2023 | 16,715 | 17,929 | ||||||||
Federal Home Loan Bank 5.50% 2036 | 600 | 814 | ||||||||
Freddie Mac 3.75% 2019 | 12,750 | 13,265 | ||||||||
Private Export Funding Corp. 1.45%-3.55% 2019-2024 | 28,840 | 29,342 | ||||||||
Tennessee Valley Authority, Series A, 3.875% 2021 | 32,975 | 35,440 | ||||||||
Tennessee Valley Authority 2.88%-5.88% 2027-2060 | 14,330 | 15,785 | ||||||||
TVA Southaven 3.846% 20333 | 1,466 | 1,489 | ||||||||
U.S. Department of Housing and Urban Development 0.93%-3.70% 2017-2034 | 91,632 | 93,759 | ||||||||
United States Agency for International Development, Jordan (Kingdom of) 1.945% 2019 | 19,750 | 19,935 | ||||||||
United States Agency for International Development, Jordan (Kingdom of) 2.503% 2020 | 88,000 | 90,310 | ||||||||
United States Agency for International Development, Jordan (Kingdom of) 2.578% 2022 | 43,000 | 44,236 | ||||||||
United States Agency for International Development, Jordan (Kingdom of) 3.00% 2025 | 43,250 | 45,198 | ||||||||
United States Agency for International Development, Morocco (Kingdom of) 7.55% 20263 | 3,760 | 4,540 | ||||||||
United States Agency for International Development, State of Iraq, 2.149% 2022 | 6,670 | 6,693 | ||||||||
United States Agency for International Development, Tunisia (Kingdom of) 1.416% 2021 | 3,000 | 2,940 | ||||||||
United States Agency for International Development, Ukraine 1.47%-1.84% 2019-2021 | 5,855 | 5,783 | ||||||||
Other securities | 5,208 | |||||||||
|
| |||||||||
|
| 540,148
|
| ||||||||
|
| |||||||||
Total bonds, notes & other debt instruments (cost: $2,789,296,000) |
| 2,800,230
|
| |||||||
|
| |||||||||
| Short-term securities 7.09% | ||||||||||
Bank of Montreal 1.30% due 11/22/2017 | 40,000 | 39,995 | ||||||||
General Electric Co. 1.08% due 7/3/2017 | 35,000 | 34,997 | ||||||||
U.S. Treasury Bills 1.09% due 12/7/2017 | 90,000 | 89,580 | ||||||||
Other securities | 39,973 | |||||||||
|
| |||||||||
Total short-term securities (cost: $204,540,000) |
| 204,545
|
| |||||||
|
| |||||||||
Total investment securities 104.21% (cost: $2,993,836,000) | 3,004,775 | |||||||||
Other assets less liabilities (4.21)% | (121,503 | ) | ||||||||
|
| |||||||||
Net assets 100.00% | $
| 2,883,272
|
| |||||||
|
| |||||||||
This summary investment portfolio is designed to streamline the report and help investors better focus on the fund’s principal holdings. See the inside back cover for details on how to obtain a complete schedule of portfolio holdings.
“Other securities” includes all issues that are not disclosed separately in the summary investment portfolio. “Other securities“ also includes securities (with an aggregate value of $25,458,000, which represented .88% of the net assets of the fund) which were acquired in transactions exempt from registration under Section 4(2) of the Securities Act of 1933 and may be resold in the U.S. in transactions exempt from registration, normally to qualified institutional buyers.
| 112 | American Funds Insurance Series |
U.S. Government/AAA-Rated Securities Fund
Futures contracts
| Contracts | Type | Number of contracts | Expiration | Notional amount6 (000) | Value at 6/30/20177 (000) | Unrealized (depreciation) appreciation at 6/30/2017 (000) | ||||||||||||||||||
| 10 Year U.S. Treasury Note Futures | Long | 1,141 | September 2017 | $ | 114,100 | $ | 143,231 | $(1,183 | ) | |||||||||||||||
| 10 Year Ultra U.S. Treasury Note Futures | Long | 179 | September 2017 | 17,900 | 24,131 | (65 | ) | |||||||||||||||||
| 20 Year U.S. Treasury Bond Futures | Short | 3 | September 2017 | (300 | ) | (461 | ) | 8 | ||||||||||||||||
| 30 Year Ultra U.S. Treasury Bond Futures | Short | 115 | September 2017 | (11,500 | ) | (19,076 | ) | 183 | ||||||||||||||||
| 5 Year U.S. Treasury Note Futures | Long | 14,313 | October 2017 | 1,431,300 | 1,686,586 | (4,366 | ) | |||||||||||||||||
| 2 Year U.S. Treasury Note Futures | Long | 700 | October 2017 | 140,000 | 151,277 | (243 | ) | |||||||||||||||||
| 30 Day Federal Funds Futures | Long | 1,013 | October 2017 | 422,084 | 417,031 | (23 | ) | |||||||||||||||||
| 90 Day Euro Dollar Futures | Short | 1,175 | September 2018 | (293,750 | ) | (288,727 | ) | (487 | ) | |||||||||||||||
| 90 Day Euro Dollar Futures | Short | 625 | December 2018 | (156,250 | ) | (153,438 | ) | (321 | ) | |||||||||||||||
|
| |||||||||||||||||||||||
| $(6,497 | ) | |||||||||||||||||||||||
|
| |||||||||||||||||||||||
Swap contracts
Interest rate swaps
| Receive | Pay | Expiration date | Notional (000) | Value at 6/30/2017 (000) | Upfront payments/ receipts (000) | Unrealized appreciation (depreciation) at 6/30/2017 (000) | ||||||||||||||||
| U.S. EFFR | 1.1745% | 11/1/2017 | $ | 7,246,700 | $ 217 | $– | $ 217 | |||||||||||||||
| U.S. EFFR | 1.17865% | 11/1/2017 | 3,623,300 | 72 | – | 72 | ||||||||||||||||
| U.S. EFFR | 1.19125% | 11/1/2017 | 3,075,000 | 31 | – | 31 | ||||||||||||||||
| U.S. EFFR | 1.201% | 11/1/2017 | 1,565,000 | – | – | – | ||||||||||||||||
| U.S. EFFR | 1.19875% | 11/1/2017 | 1,565,000 | – | – | – | ||||||||||||||||
| U.S. EFFR | 1.211% | 11/1/2017 | 1,940,000 | (39 | ) | – | (39 | ) | ||||||||||||||
| U.S. EFFR | 1.2165% | 11/1/2017 | 4,800,000 | (96 | ) | – | (96 | ) | ||||||||||||||
| 1.6715% | 3-month USD-LIBOR | 3/17/2019 | 223,000 | 408 | – | 408 | ||||||||||||||||
| 1.654% | 3-month USD-LIBOR | 3/20/2019 | 222,000 | 333 | – | 333 | ||||||||||||||||
| 1.329% | U.S. EFFR | 3/27/2019 | 131,000 | (127 | ) | – | (127 | ) | ||||||||||||||
| 1.32625% | U.S. EFFR | 4/5/2019 | 68,800 | (74 | ) | – | (74 | ) | ||||||||||||||
| 1.34875% | U.S. EFFR | 4/5/2019 | 120,000 | (83 | ) | – | (83 | ) | ||||||||||||||
| 3-month USD-LIBOR | 1.5165% | 4/19/2019 | 130,000 | 146 | – | 146 | ||||||||||||||||
| 3-month USD-LIBOR | 1.504% | 6/8/2019 | 60,500 | 105 | – | 105 | ||||||||||||||||
| 3-month USD-LIBOR | 1.5055% | 6/8/2019 | 60,500 | 103 | – | 103 | ||||||||||||||||
| 1.337% | U.S. EFFR | 6/8/2019 | 121,000 | (169 | ) | – | (169 | ) | ||||||||||||||
| 3-month USD-LIBOR | 1.5395% | 6/12/2019 | 60,500 | 66 | – | 66 | ||||||||||||||||
| 1.367% | U.S. EFFR | 6/12/2019 | 60,500 | (51 | ) | – | (51 | ) | ||||||||||||||
| 3-month USD-LIBOR | 1.553% | 6/14/2019 | 60,500 | 53 | – | 53 | ||||||||||||||||
| 1.37% | U.S. EFFR | 6/14/2019 | 60,500 | (48 | ) | – | (48 | ) | ||||||||||||||
| 3-month USD-LIBOR | 1.555% | 6/21/2019 | 60,500 | 59 | – | 59 | ||||||||||||||||
| 1.362% | U.S. EFFR | 6/21/2019 | 60,500 | (60 | ) | – | (60 | ) | ||||||||||||||
| 3-month USD-LIBOR | 1.5445% | 6/28/2019 | 60,500 | 77 | – | 77 | ||||||||||||||||
| 1.351% | U.S. EFFR | 6/28/2019 | 60,500 | (77 | ) | – | (77 | ) | ||||||||||||||
| 1.9425% | 3-month USD-LIBOR | 3/17/2020 | 165,000 | 1,044 | – | 1,044 | ||||||||||||||||
| 3-month USD-LIBOR | 1.217% | 9/22/2021 | 60,000 | 1,616 | – | 1,616 | ||||||||||||||||
| 3-month USD-LIBOR | 1.225% | 9/22/2021 | 60,000 | 1,596 | – | 1,596 | ||||||||||||||||
| 3-month USD-LIBOR | 1.2255% | 9/23/2021 | 5,000 | 133 | – | 133 | ||||||||||||||||
| 3-month USD-LIBOR | 1.9665% | 2/2/2022 | 50,000 | (120 | ) | – | (120 | ) | ||||||||||||||
| 3-month USD-LIBOR | 2.01215% | 2/2/2022 | 119,000 | (524 | ) | – | (524 | ) | ||||||||||||||
| 3-month USD-LIBOR | 2.0025% | 2/7/2022 | 59,000 | (233 | ) | – | (233 | ) | ||||||||||||||
| 3-month USD-LIBOR | 2.2175% | 3/17/2022 | 52,000 | (696 | ) | – | (696 | ) | ||||||||||||||
| 3-month USD-LIBOR | 1.8675% | 4/19/2022 | 70,000 | 204 | – | 204 | ||||||||||||||||
| 3-month USD-LIBOR | 1.75918% | 4/29/2022 | 58,000 | 466 | – | 466 | ||||||||||||||||
| 2.80% | 3-month USD-LIBOR | 9/2/2022 | 280,000 | 2,576 | – | 2,576 | ||||||||||||||||
| American Funds Insurance Series | 113 |
U.S. Government/AAA-Rated Securities Fund
Swap contracts (continued)
Interest rate swaps (continued)
| Receive | Pay | Expiration date | Notional (000) | Value at 6/30/2017 (000) | Upfront payments/ receipts (000) | Unrealized appreciation (depreciation) at 6/30/2017 (000) | ||||||||||||||||
| 2.75% | 3-month USD-LIBOR | 9/2/2022 | $ | 280,000 | $2,316 | $– | $2,316 | |||||||||||||||
| 3-month USD-LIBOR | 2.74125% | 11/22/2023 | 15,000 | (617 | ) | – | (617 | ) | ||||||||||||||
| 3-month USD-LIBOR | 2.0815% | 2/10/2024 | 28,700 | (6 | ) | – | (6 | ) | ||||||||||||||
| 3-month USD-LIBOR | 2.0955% | 2/10/2024 | 14,300 | (15 | ) | – | (15 | ) | ||||||||||||||
| 3-month USD-LIBOR | 2.3875% | 3/17/2024 | 160,700 | (3,079 | ) | – | (3,079 | ) | ||||||||||||||
| 3-month USD-LIBOR | 1.798% | 2/2/2026 | 35,000 | 1,121 | – | 1,121 | ||||||||||||||||
| 3-month USD-LIBOR | 2.24% | 12/5/2026 | 55,100 | 16 | – | 16 | ||||||||||||||||
| 3-month USD-LIBOR | 2.27% | 12/5/2026 | 44,900 | (103 | ) | – | (103 | ) | ||||||||||||||
| 2.579% | 3-month USD-LIBOR | 3/14/2027 | 53,000 | 1,518 | – | 1,518 | ||||||||||||||||
| 2.333% | 3-month USD-LIBOR | 3/29/2027 | 42,000 | 278 | – | 278 | ||||||||||||||||
| 3-month USD-LIBOR | 2.97125% | 9/2/2030 | 62,000 | (1,920 | ) | – | (1,920 | ) | ||||||||||||||
| 3-month USD-LIBOR | 3.005% | 9/2/2030 | 62,000 | (2,098 | ) | – | (2,098 | ) | ||||||||||||||
| 3-month USD-LIBOR | 3.34% | 6/27/2044 | 45,000 | (7,477 | ) | – | (7,477 | ) | ||||||||||||||
| 3-month USD-LIBOR | 3.206% | 7/31/2044 | 16,000 | (2,230 | ) | – | (2,230 | ) | ||||||||||||||
| 3-month USD-LIBOR | 3.238% | 8/8/2044 | 16,000 | (2,333 | ) | – | (2,333 | ) | ||||||||||||||
| 3-month USD-LIBOR | 2.7045% | 1/2/2045 | 12,000 | (440 | ) | – | (440 | ) | ||||||||||||||
| 3-month USD-LIBOR | 2.5055% | 1/9/2045 | 11,000 | 50 | – | 50 | ||||||||||||||||
| 3-month USD-LIBOR | 2.4945% | 1/9/2045 | 2,000 | 14 | – | 14 | ||||||||||||||||
| 3-month USD-LIBOR | 2.7025% | 9/10/2045 | 30,000 | (1,105 | ) | – | (1,105 | ) | ||||||||||||||
| 3-month USD-LIBOR | 2.516% | 10/20/2045 | 36,000 | 91 | – | 91 | ||||||||||||||||
| 3-month USD-LIBOR | 2.525% | 10/20/2045 | 24,000 | 15 | – | 15 | ||||||||||||||||
| 3-month USD-LIBOR | 2.5315% | 10/26/2045 | 10,000 | (8 | ) | – | (8 | ) | ||||||||||||||
| 3-month USD-LIBOR | 2.52822% | 11/23/2045 | 13,350 | (1 | ) | – | (1 | ) | ||||||||||||||
| 3-month USD-LIBOR | 2.59125% | 12/16/2045 | 9,000 | (121 | ) | – | (121 | ) | ||||||||||||||
| 3-month USD-LIBOR | 1.768% | 8/17/2046 | 8,200 | 1,344 | – | 1,344 | ||||||||||||||||
| 3-month USD-LIBOR | 2.3985% | 6/9/2047 | 22,500 | 643 | – | 643 | ||||||||||||||||
| 2.44345% | 3-month USD-LIBOR | 6/29/2047 | 21,000 | (390 | ) | – | (390 | ) | ||||||||||||||
|
|
|
| |||||||||||||||||||
| $– | $(7,629 | ) | ||||||||||||||||||||
|
|
|
| |||||||||||||||||||
The following footnotes apply to either the individual securities noted or one or more of the securities aggregated and listed as a single line item.
| 1 | A portion of this security was pledged as collateral. The total value of pledged collateral was $69,299,000, which represented 2.40% of the net assets of the fund. |
| 2 | Index-linked bond whose principal amount moves with a government price index. |
| 3 | Principal payments may be made periodically. Therefore, the effective maturity date may be earlier than the stated maturity date. |
| 4 | Purchased on a TBA basis. |
| 5 | Coupon rate may change periodically. |
| 6 | Notional amount is calculated based on the number of contracts and notional contract size. |
| 7 | Value is calculated based on the notional amount and current market price. |
Key to abbreviations
EFFR = Federal Funds Effective Rate
LIBOR = London Interbank Offered Rate
TBA = To-be-announced
See Notes to Financial Statements
| 114 | American Funds Insurance Series |
| ||
| Summary investment portfolio June 30, 2017 | unaudited |
| Growth funds 93.32% | Shares | Value (000) | ||||||||
American Funds Insurance Series – Growth Fund, Class 1 | 3,280,267 | $ | 229,881 | |||||||
|
| |||||||||
Total growth funds (cost: $228,002,000) |
| 229,881
|
| |||||||
|
| |||||||||
| Short-term securities 6.77% | ||||||||||
Government Cash Management Fund | 16,661,618 | 16,662 | ||||||||
|
| |||||||||
Total short-term securities (cost: $16,662,000) |
| 16,662
|
| |||||||
|
| |||||||||
Total investment securities 100.09% (cost: $244,664,000) | 246,543 | |||||||||
Other assets less liabilities (0.09)% | (216 | ) | ||||||||
|
| |||||||||
Net assets 100.00% | $
| 246,327
|
| |||||||
|
| |||||||||
Investment in affiliates
American Funds Insurance Series – Growth Fund, Class 1 is an affiliate of the fund under the Investment Company Act of 1940 since it is controlled by the same board of trustees as the series. Further details on this holding and related transactions during the six months
ended June 30, 2017, appear below.
| Beginning shares | Additions | Reductions | Ending shares | Net realized loss (000) | Net unrealized appreciation (000) | Dividend income (000) | Value of affiliate at 6/30/2017 (000) | |||||||||||||||||||||||||
| 2,821,842 | 603,955 | 145,530 | 3,280,267 | $(574 | ) | $8,123 | $365 | $229,881 | ||||||||||||||||||||||||
See Notes to Financial Statements
| American Funds Insurance Series | 115 |
Managed Risk International Fund
| ||
| Investment portfolio June 30, 2017 | unaudited |
| Growth funds 94.42% | Shares |
Value | ||||||||
American Funds Insurance Series - International Fund, Class 1 | 5,939,497 | $ | 116,830 | |||||||
|
| |||||||||
Total growth funds (cost: $109,949,000) |
|
116,830
|
| |||||||
|
| |||||||||
| Short-term securities 5.67% | ||||||||||
Government Cash Management Fund | 7,013,879 | 7,014 | ||||||||
|
| |||||||||
Total short-term securities (cost: $7,014,000) |
|
7,014
|
| |||||||
|
| |||||||||
Total investment securities 100.09% (cost: $116,963,000) | 123,844 | |||||||||
Other assets less liabilities (0.09)% | (108 | ) | ||||||||
|
| |||||||||
Net assets 100.00% |
$
|
123,736
|
| |||||||
|
| |||||||||
Investment in affiliates
American Funds Insurance Series – International Fund, Class 1 is an affiliate of the fund under the Investment Company Act of 1940 since it is controlled by the same board of trustees as the series. Further details on this holding and related transactions during the six
months ended June 30, 2017, appear below.
| Beginning shares | Additions | Reductions | Ending shares | Net realized loss (000) | Net unrealized appreciation (000) | Dividend income (000) | Value of affiliate at 6/30/2017 (000) | |||||||||||||||||||||||||
| 5,381,857 | 791,338 | 233,698 | 5,939,497 | $(483 | ) | $16,607 | $397 | $116,830 | ||||||||||||||||||||||||
See Notes to Financial Statements
| 116 | American Funds Insurance Series |
Managed Risk Blue Chip Income and Growth Fund
| ||
| Investment portfolio June 30, 2017 | unaudited | |
| Growth-and-income funds 94.65% | Shares |
Value | ||||||||
American Funds Insurance Series – Blue Chip Income and Growth Fund, Class 1 | 24,910,308 | $ | 342,268 | |||||||
|
| |||||||||
Total growth-and-income funds (cost: $338,625,000) |
|
342,268
|
| |||||||
|
| |||||||||
| Short-term securities 5.44% | ||||||||||
Government Cash Management Fund | 19,687,948 | 19,688 | ||||||||
|
| |||||||||
Total short-term securities (cost: $19,688,000) |
|
19,688
|
| |||||||
|
| |||||||||
Total investment securities 100.09% (cost: $358,313,000) | 361,956 | |||||||||
Other assets less liabilities (0.09)% | (323 | ) | ||||||||
|
| |||||||||
Net assets 100.00% |
$
|
361,633
|
| |||||||
|
| |||||||||
Investment in affiliates
American Funds Insurance Series – Blue Chip Income and Growth Fund, Class 1 is an affiliate of the fund under the Investment Company Act of 1940 since it is controlled by the same board of trustees as the series. Further details on this holding and related transactions during the six months ended June 30, 2017, appear below.
| Beginning shares | Additions | Reductions | Ending shares | Net realized loss (000) | Net unrealized appreciation (000) | Dividend income (000) | Value of affiliate at 6/30/2017 (000) | |||||||||||||||||||||||||
| 20,295,700 | 5,700,424 | 1,085,816 | 24,910,308 | $(296 | ) | $3,936 | $1,244 | $342,268 | ||||||||||||||||||||||||
See Notes to Financial Statements
| American Funds Insurance Series | 117 |
Managed Risk Growth-Income Fund
| ||
| Investment portfolio June 30, 2017 | unaudited | |
| Growth-and-income funds 95.01% | Shares |
Value | ||||||||
American Funds Insurance Series – Growth-Income Fund, Class 1 | 3,872,003 | $ | 176,447 | |||||||
|
| |||||||||
Total growth-and-income funds (cost: $182,552,000) |
|
176,447
|
| |||||||
|
| |||||||||
| Short-term securities 5.07% | ||||||||||
Government Cash Management Fund | 9,412,597 | 9,413 | ||||||||
|
| |||||||||
Total short-term securities (cost: $9,413,000) |
| 9,413
|
| |||||||
|
| |||||||||
Total investment securities 100.08% (cost: $191,965,000) | 185,860 | |||||||||
Other assets less liabilities (0.08)% | (154 | ) | ||||||||
|
| |||||||||
Net assets 100.00% |
$
|
185,706
|
| |||||||
|
| |||||||||
Investment in affiliates
American Funds Insurance Series – Growth-Income Fund, Class 1 is an affiliate of the fund under the Investment Company Act of 1940 since it is controlled by the same board of trustees as the series. Further details on this holding and related transactions during the six months ended June 30, 2017, appear below.
| Beginning shares | Additions | Reductions | Ending shares | Net realized loss (000) | Net unrealized appreciation (000) | Dividend income (000) | Value of affiliate at 6/30/2017 (000) | |||||||||||||||||||||||||
| 3,415,529 | 565,019 | 108,545 | 3,872,003 | $(554 | ) | $4,193 | $488 | $176,447 | ||||||||||||||||||||||||
See Notes to Financial Statements
| 118 | American Funds Insurance Series |
Managed Risk Asset Allocation Fund
| ||
| Investment portfolio June 30, 2017 | unaudited | |
| Asset allocation funds 94.13% | Shares |
Value | ||||||||
American Funds Insurance Series – Asset Allocation Fund, Class 1 | 172,084,829 | $ | 3,846,096 | |||||||
|
| |||||||||
Total asset allocation funds (cost: $3,739,099,000) |
|
3,846,096
|
| |||||||
|
| |||||||||
| Short-term securities 5.97% | ||||||||||
Government Cash Management Fund | 244,055,456 | 244,055 | ||||||||
|
| |||||||||
Total short-term securities (cost: $244,055,000) |
|
244,055
|
| |||||||
|
| |||||||||
Total investment securities 100.10% (cost: $3,983,154,000) | 4,090,151 | |||||||||
Other assets less liabilities (0.10)% | (3,925 | ) | ||||||||
|
| |||||||||
Net assets 100.00% |
$
|
4,086,226
|
| |||||||
|
| |||||||||
Investment in affiliates
American Funds Insurance Series – Asset Allocation Fund, Class 1 is an affiliate of the fund under the Investment Company Act of 1940 since it is controlled by the same board of trustees as the series. Further details on this holding and related transactions during the six months ended June 30, 2017, appear below.
| Beginning shares | Additions | Reductions | Ending shares | Net realized gain (000) | Net unrealized appreciation (000) | Dividend income (000) | Value of affiliate at 6/30/2017 (000) | |||||||||||||||||||||||||
| 153,453,622 | 19,254,736 | 623,529 | 172,084,829 | $1,372 | $97,975 | $12,067 | $3,846,096 | |||||||||||||||||||||||||
See Notes to Financial Statements
| American Funds Insurance Series | 119 |
Statements of assets and liabilities at June 30, 2017
Global Growth Fund | Global Small Capitalization Fund | Growth Fund | International Fund | New World Fund | ||||||||||||||||
Assets: | ||||||||||||||||||||
Investment securities, at value: | ||||||||||||||||||||
Unaffiliated issuers | $5,861,471 | $4,010,606 | $23,627,714 | $8,788,701 | $3,130,570 | |||||||||||||||
Affiliated issuers | – | 25,852 | – | – | – | |||||||||||||||
Cash | 522 | 1,412 | 4,457 | 81 | 7,786 | |||||||||||||||
Cash denominated in currencies other than U.S. dollars | 2,465 | 130 | 1,115 | 2,672 | 642 | |||||||||||||||
Unrealized appreciation on open forward currency contracts | 69 | 275 | – | 59 | 183 | |||||||||||||||
Receivables for: | ||||||||||||||||||||
Sales of investments | 4,174 | 8,550 | 18,948 | 21,757 | 41,134 | |||||||||||||||
Sales of fund’s shares | 3,230 | 1,295 | 9,536 | 4,861 | 3,298 | |||||||||||||||
Dividends and interest | 14,596 | 4,318 | 25,910 | 16,327 | 10,630 | |||||||||||||||
Closed forward currency contracts | – | – | – | – | – | |||||||||||||||
Variation margin on futures contracts | – | – | – | – | – | |||||||||||||||
Variation margin on swap contracts | – | – | – | – | – | |||||||||||||||
Other | 102 | 48 | 29 | 433 | 96 | |||||||||||||||
| 5,886,629 | 4,052,486 | 23,687,709 | 8,834,891 | 3,194,339 | ||||||||||||||||
Liabilities: | ||||||||||||||||||||
Unrealized depreciation on open forward currency contracts | – | 561 | – | – | 39 | |||||||||||||||
Payables for: | ||||||||||||||||||||
Purchases of investments | 187 | 10,345 | 45,536 | 25,621 | 35,060 | |||||||||||||||
Repurchases of fund’s shares | 30,325 | 3,300 | 35,223 | 20,368 | 1,610 | |||||||||||||||
Investment advisory services | 2,536 | 2,353 | 6,383 | 3,586 | 1,863 | |||||||||||||||
Services provided by related parties | 874 | 551 | 3,467 | 954 | 295 | |||||||||||||||
Trustees’ deferred compensation | 67 | 44 | 507 | 217 | 28 | |||||||||||||||
Closed forward currency contracts | – | 922 | – | – | 13 | |||||||||||||||
Variation margin on futures contracts | – | – | – | – | – | |||||||||||||||
Variation margin on swap contracts | – | – | – | – | – | |||||||||||||||
Non-U.S. taxes | 1,573 | 131 | 3,240 | 3,527 | 2,891 | |||||||||||||||
Other | 517 | 420 | 640 | 1,000 | 635 | |||||||||||||||
| 36,079 | 18,627 | 94,996 | 55,273 | 42,434 | ||||||||||||||||
Net assets at June 30, 2017 | $5,850,550 | $4,033,859 | $23,592,713 | $8,779,618 | $3,151,905 | |||||||||||||||
Net assets consist of: | ||||||||||||||||||||
Capital paid in on shares of beneficial interest | $3,828,761 | $3,294,628 | $14,280,881 | $7,019,945 | $2,613,842 | |||||||||||||||
Undistributed (distributions in excess of) net investment income | 27,922 | 9,675 | 92,306 | 76,172 | 3,247 | |||||||||||||||
Undistributed (accumulated) net realized gain (loss) | 328,168 | 34,174 | 1,707,987 | 217,143 | 57,659 | |||||||||||||||
Net unrealized appreciation (depreciation) | 1,665,699 | 695,382 | 7,511,539 | 1,466,358 | 477,157 | |||||||||||||||
Net assets at June 30, 2017 | $5,850,550 | $4,033,859 | $23,592,713 | $8,779,618 | $3,151,905 | |||||||||||||||
Investment securities, at cost: | ||||||||||||||||||||
Unaffiliated issuers | $4,195,893 | $3,317,537 | $16,116,203 | $7,319,843 | $2,651,539 | |||||||||||||||
Affiliated issuers | – | 23,266 | – | – | – | |||||||||||||||
Cash denominated in currencies other than U.S. dollars, at cost | 2,465 | 130 | 1,116 | 2,672 | 642 | |||||||||||||||
See end of statements of assets and liabilities for footnote.
See Notes to Financial Statements
| 120 | American Funds Insurance Series |
unaudited
(dollars in thousands)
| Blue Chip | Global | International | ||||||||||||||||||||||||||||||||
| Income and | Growth | Growth- | Growth | Capital | Asset | Global | Global | |||||||||||||||||||||||||||
| Growth | and Income | Income | and Income | Income | Allocation | Balanced | Bond | Bond | ||||||||||||||||||||||||||
| Fund | Fund | Fund | Fund | Builder | Fund | Fund | Fund | Fund | ||||||||||||||||||||||||||
| $8,861,523 | $1,905,317 | $28,245,732 | $1,385,629 | $500,195 | $24,118,389 | $287,156 | $12,479,885 | $2,410,691 | ||||||||||||||||||||||||||
| – | – | – | – | – | – | – | – | – | ||||||||||||||||||||||||||
| 3,653 | 826 | 9,219 | (631 | ) | 227 | 5,697 | 164 | 6,728 | 1,516 | |||||||||||||||||||||||||
| – | 2,892 | 1,750 | 1,145 | 42 | 176 | 67 | 5,698 | 946 | ||||||||||||||||||||||||||
| – | – | – | – | – | – | 167 | 1,952 | 4,096 | ||||||||||||||||||||||||||
| 11,968 | 34,405 | 46,304 | 1,862 | 6,500 | 375,868 | 2,342 | 1,651,319 | 50,152 | ||||||||||||||||||||||||||
| 1,687 | 764 | 12,051 | 331 | 277 | 17,908 | 666 | 3,283 | 5,342 | ||||||||||||||||||||||||||
| 11,191 | 7,813 | 31,347 | 6,945 | 2,732 | 81,492 | 1,362 | 60,244 | 19,501 | ||||||||||||||||||||||||||
| – | – | – | – | – | – | – | – | 185 | ||||||||||||||||||||||||||
| – | – | – | – | – | 139 | – | 393 | 11 | ||||||||||||||||||||||||||
| – | – | – | – | – | 484 | – | 1,659 | 293 | ||||||||||||||||||||||||||
| 25 | 93 | 233 | 49 | 8 | 129 | 17 | 83 | 417 | ||||||||||||||||||||||||||
| 8,890,047 | 1,952,110 | 28,346,636 | 1,395,330 | 509,981 | 24,600,282 | 291,941 | 14,211,244 | 2,493,150 | ||||||||||||||||||||||||||
| – | – | – | – | 5 | – | 119 | 4,449 | 5,273 | ||||||||||||||||||||||||||
| 2,383 | 12,999 | 68,823 | 13,336 | 7,613 | 939,301 | 1,949 | 3,693,052 | 87,634 | ||||||||||||||||||||||||||
| 3,816 | 1,580 | 10,079 | 1,624 | 162 | 7,758 | 29 | 4,204 | 824 | ||||||||||||||||||||||||||
| 2,863 | 984 | 6,102 | 674 | 205 | 5,222 | 156 | 3,239 | 1,042 | ||||||||||||||||||||||||||
| 812 | 331 | 3,122 | 75 | 64 | 1,957 | 46 | 934 | 262 | ||||||||||||||||||||||||||
| 69 | 21 | 577 | 7 | 1 | 231 | 2 | 106 | 22 | ||||||||||||||||||||||||||
| – | – | – | – | – | – | 9 | – | 299 | ||||||||||||||||||||||||||
| – | – | – | – | – | – | – | 1,470 | 209 | ||||||||||||||||||||||||||
| – | – | – | – | – | 273 | – | 780 | 151 | ||||||||||||||||||||||||||
| – | 1,020 | 374 | – | 72 | 4,039 | 51 | – | 345 | ||||||||||||||||||||||||||
| 332 | 159 | 519 | 1,246 | 196 | 2,184 | 28 | 311 | 413 | ||||||||||||||||||||||||||
| 10,275 | 17,094 | 89,596 | 16,962 | 8,318 | 960,965 | 2,389 | 3,708,545 | 96,474 | ||||||||||||||||||||||||||
| $8,879,772 | $1,935,016 | $28,257,040 | $1,378,368 | $501,663 | $23,639,317 | $289,552 | $10,502,699 | $2,396,676 | ||||||||||||||||||||||||||
| $6,601,086 | $1,418,581 | $20,172,320 | $1,270,585 | $484,727 | $18,507,550 | $242,493 | $10,362,915 | $2,383,849 | ||||||||||||||||||||||||||
| 96,117 | 28,427 | 217,613 | 22,391 | 1,143 | 209,787 | 1,472 | 112,798 | 20,272 | ||||||||||||||||||||||||||
| 412,570 | 126,714 | 1,189,775 | (12,441 | ) | (3,691 | ) | 590,837 | 6,492 | (52,014 | ) | (25,858 | ) | ||||||||||||||||||||||
| 1,769,999 | 361,294 | 6,677,332 | 97,833 | 19,484 | 4,331,143 | 39,095 | 79,000 | 18,413 | ||||||||||||||||||||||||||
| $8,879,772 | $1,935,016 | $28,257,040 | $1,378,368 | $501,663 | $23,639,317 | $289,552 | $10,502,699 | $2,396,676 | ||||||||||||||||||||||||||
| $7,091,549 | $1,543,551 | $21,568,511 | $1,287,111 | $480,715 | $19,781,083 | $248,124 | $12,402,750 | $2,392,131 | ||||||||||||||||||||||||||
| – | – | – | – | – | – | – | – | – | ||||||||||||||||||||||||||
| – | 2,887 | 1,750 | 1,142 | 42 | 176 | 67 | 5,626 | 945 | ||||||||||||||||||||||||||
| American Funds Insurance Series | 121 |
Statements of assets and liabilities at June 30, 2017
| U.S. | ||||||||||||||||||||
| High- | Government/ | Managed | ||||||||||||||||||
| Income | AAA-Rated | Risk | ||||||||||||||||||
| Bond | Mortgage | Ultra-Short | Securities | Growth | ||||||||||||||||
| Fund | Fund | Bond Fund | Fund | Fund | ||||||||||||||||
Assets: | ||||||||||||||||||||
Investment securities, at value: | ||||||||||||||||||||
Unaffiliated issuers | $1,565,009 | $399,681 | $310,846 | $3,004,775 | $ 16,662 | |||||||||||||||
Affiliated issuers | – | – | – | – | 229,881 | |||||||||||||||
Cash | 2,087 | 1,268 | 141 | 5,626 | – | |||||||||||||||
Cash denominated in currencies other than U.S. dollars | – | * | – | – | – | – | ||||||||||||||
Receivables for: | ||||||||||||||||||||
Sales of investments | 23,105 | 98,441 | – | 1,299,112 | 33 | |||||||||||||||
Sales of fund’s shares | 166 | 31 | 74 | 710 | 12 | |||||||||||||||
Dividends and interest | 24,063 | 1,178 | – | 10,370 | 11 | |||||||||||||||
Variation margin on futures contracts | – | 6 | – | 216 | – | |||||||||||||||
Variation margin on swap contracts | 89 | 273 | – | 3,491 | – | |||||||||||||||
Other | 4 | – | – | – | – | |||||||||||||||
| 1,614,523 | 500,878 | 311,061 | 4,324,300 | 246,599 | ||||||||||||||||
Liabilities: | ||||||||||||||||||||
Payables for: | ||||||||||||||||||||
Purchases of investments | 37,730 | 154,771 | – | 1,434,167 | 2 | |||||||||||||||
Repurchases of fund’s shares | 1,310 | 518 | 390 | 1,014 | 45 | |||||||||||||||
Investment advisory services | 635 | 122 | 83 | 823 | 20 | |||||||||||||||
Services provided by related parties | 186 | 17 | 60 | 345 | 199 | |||||||||||||||
Trustees’ deferred compensation | 53 | 2 | 19 | 60 | 1 | |||||||||||||||
Variation margin on futures contracts | – | 412 | – | 2,983 | – | |||||||||||||||
Variation margin on swap contracts | 166 | 5 | – | 1,584 | – | |||||||||||||||
Non-U.S. taxes | 5 | – | – | – | – | |||||||||||||||
Other | 480 | 7 | 10 | 52 | 5 | |||||||||||||||
| 40,565 | 155,854 | 562 | 1,441,028 | 272 | ||||||||||||||||
Net assets at June 30, 2017 | $1,573,958 | $345,024 | $310,499 | $2,883,272 | $246,327 | |||||||||||||||
| ||||||||||||||||||||
Net assets consist of: | ||||||||||||||||||||
Capital paid in on shares of beneficial interest | $1,731,295 | $339,619 | $310,090 | $2,848,473 | $230,262 | |||||||||||||||
Undistributed (distributions in excess of) net investment income | 50,886 | 2,404 | 421 | 22,411 | (312 | ) | ||||||||||||||
Undistributed (accumulated) net realized gain (loss) | (204,289 | ) | 2,608 | – | 15,576 | 14,498 | ||||||||||||||
Net unrealized appreciation (depreciation) | (3,934 | ) | 393 | (12 | ) | (3,188 | ) | 1,879 | ||||||||||||
Net assets at June 30, 2017 | $1,573,958 | $345,024 | $310,499 | $2,883,272 | $246,327 | |||||||||||||||
| ||||||||||||||||||||
Investment securities, at cost: | ||||||||||||||||||||
Unaffiliated issuers | $1,569,335 | $398,436 | $310,858 | $2,993,836 | $ 16,662 | |||||||||||||||
Affiliated issuers | – | – | – | – | 228,002 | |||||||||||||||
Cash denominated in currencies other than U.S. dollars, at cost | – | * | – | – | – | – | ||||||||||||||
See end of statements of assets and liabilities for footnote.
See Notes to Financial Statements
| 122 | American Funds Insurance Series |
unaudited (dollars in thousands) |
| Managed | Managed | Managed | ||||||||||||||
| Managed | Risk Blue | Risk | Risk | |||||||||||||
| Risk | Chip Income | Growth- | Asset | |||||||||||||
| International | and Growth | Income | Allocation | |||||||||||||
| Fund | Fund | Fund | Fund | |||||||||||||
| $ 7,014 | $ 19,688 | $ 9,413 | $ 244,055 | |||||||||||||
| 116,830 | 342,268 | 176,447 | 3,846,096 | |||||||||||||
| – | – | – | – | |||||||||||||
| – | – | – | – | |||||||||||||
| 28 | 18 | – | – | |||||||||||||
| 82 | 12 | 118 | 8,289 | |||||||||||||
| 5 | 14 | 6 | 169 | |||||||||||||
| – | – | – | – | |||||||||||||
| – | – | – | – | |||||||||||||
| – | * | – | – | – | ||||||||||||
| 123,959 | 362,000 | 185,984 | 4,098,609 | |||||||||||||
| – | 8 | 107 | 6,991 | |||||||||||||
| 112 | 23 | 3 | 772 | |||||||||||||
| 10 | 30 | 15 | 335 | |||||||||||||
| 100 | 295 | 150 | 3,016 | |||||||||||||
| 1 | 1 | 1 | 16 | |||||||||||||
| – | – | – | – | |||||||||||||
| – | – | – | – | |||||||||||||
| – | – | – | – | |||||||||||||
| – | 10 | 2 | 1,253 | |||||||||||||
| 223 | 367 | 278 | 12,383 | |||||||||||||
| $123,736 | $361,633 | $185,706 | $4,086,226 | |||||||||||||
| $122,756 | $347,062 | $184,750 | $3,803,412 | |||||||||||||
| 56 | 197 | (35 | ) | 2,234 | ||||||||||||
| (5,957 | ) | 10,731 | 7,096 | 173,583 | ||||||||||||
| 6,881 | 3,643 | (6,105 | ) | 106,997 | ||||||||||||
| $123,736 | $361,633 | $185,706 | $4,086,226 | |||||||||||||
| $ 7,014 | $ 19,688 | $ 9,413 | $ 244,055 | |||||||||||||
| 109,949 | 338,625 | 182,552 | 3,739,099 | |||||||||||||
| – | – | – | – | |||||||||||||
| American Funds Insurance Series | 123 |
Statements of assets and liabilities at June 30, 2017
| Global | ||||||||||||||||||||||
| Global | Small | New | ||||||||||||||||||||
| Growth | Capitalization | Growth | International | World | ||||||||||||||||||
| Fund | Fund | Fund | Fund | Fund | ||||||||||||||||||
Shares of beneficial interest issued and outstanding
| ||||||||||||||||||||||
Class 1: | Net assets | $1,866,425 | $1,526,093 | $7,756,995 | $4,486,803 | $1,840,696 | ||||||||||||||||
| Shares outstanding | 67,412 | 67,096 | 110,682 | 228,103 | 81,594 | |||||||||||||||||
| Net asset value per share | $27.69 | $22.74 | $70.08 | $19.67 | $22.56 | |||||||||||||||||
Class 1A: | Net assets | $561 | $147 | $811 | $369 | $167 | ||||||||||||||||
| Shares outstanding | 20 | �� | 7 | 12 | 19 | 7 | ||||||||||||||||
| Net asset value per share | $27.67 | $22.73 | $70.03 | $19.65 | $22.54 | |||||||||||||||||
Class 2: | Net assets | $3,849,664 | $2,446,269 | $15,059,300 | $4,164,515 | $990,023 | ||||||||||||||||
| Shares outstanding | 140,379 | 110,503 | 216,397 | 212,643 | 44,314 | |||||||||||||||||
| Net asset value per share | $27.42 | $22.14 | $69.59 | $19.58 | $22.34 | |||||||||||||||||
Class 3: | Net assets | $200,617 | $29,834 | |||||||||||||||||||
| Shares outstanding | 2,847 | 1,515 | ||||||||||||||||||||
| Net asset value per share | $70.47 | $19.70 | ||||||||||||||||||||
Class 4: | Net assets | $133,900 | $61,350 | $574,990 | $98,097 | $321,019 | ||||||||||||||||
| Shares outstanding | 4,897 | 2,747 | 8,341 | 5,049 | 14,411 | |||||||||||||||||
| Net asset value per share | $27.35 | $22.33 | $68.93 | $19.43 | $22.28 | |||||||||||||||||
| U.S. | ||||||||||||||||||||||
| High- | Government/ | Managed | ||||||||||||||||||||
| Income | AAA-Rated | Risk | ||||||||||||||||||||
| Bond | Mortgage | Ultra-Short | Securities | Growth | ||||||||||||||||||
| Fund | Fund | Bond Fund | Fund | Fund | ||||||||||||||||||
Shares of beneficial interest issued and outstanding
| ||||||||||||||||||||||
Class 1: | Net assets | $741,061 | $273,166 | $32,502 | $1,328,206 | |||||||||||||||||
| Shares outstanding | 70,436 | 25,725 | 2,878 | 108,547 | ||||||||||||||||||
| Net asset value per share | $10.52 | $10.62 | $11.30 | $12.24 | ||||||||||||||||||
Class 1A: | Net assets | $111 | $104 | $10 | $111 | |||||||||||||||||
| Shares outstanding | 11 | 10 | 1 | 9 | ||||||||||||||||||
| Net asset value per share | $10.52 | $10.61 | $11.30 | $12.24 | ||||||||||||||||||
Class 2: | Net assets | $797,660 | $62,273 | $257,613 | $1,486,950 | |||||||||||||||||
| Shares outstanding | 77,013 | 5,881 | 23,411 | 122,821 | ||||||||||||||||||
| Net asset value per share | $10.36 | $10.59 | $11.00 | $12.11 | ||||||||||||||||||
Class 3: | Net assets | $13,052 | $3,675 | $10,727 | ||||||||||||||||||
| Shares outstanding | 1,237 | 331 | 875 | |||||||||||||||||||
| Net asset value per share | $10.55 | $11.12 | $12.26 | |||||||||||||||||||
Class 4: | Net assets | $22,074 | $9,481 | $16,699 | $57,278 | |||||||||||||||||
| Shares outstanding | 1,983 | 901 | 1,501 | 4,724 | ||||||||||||||||||
| Net asset value per share | $11.13 | $10.52 | $11.12 | $12.13 | ||||||||||||||||||
Class P1: | Net assets | $1,322 | ||||||||||||||||||||
| Shares outstanding | 111 | |||||||||||||||||||||
| Net asset value per share | $11.95 | |||||||||||||||||||||
Class P2: | Net assets | $245,005 | ||||||||||||||||||||
| Shares outstanding | 20,616 | |||||||||||||||||||||
| Net asset value per share | $11.88 | |||||||||||||||||||||
*Amount less than one thousand.
See Notes to Financial Statements
| 124 | American Funds Insurance Series |
unaudited
(dollars and shares in thousands, except per-share amounts)
| Blue Chip | Global | International | ||||||||||||||||||||||||||||||||
| Income and | Growth | Growth- | Growth | Capital | Asset | Global | Global | |||||||||||||||||||||||||||
| Growth | and Income | Income | and Income | Income | Allocation | Balanced | Bond | Bond | ||||||||||||||||||||||||||
| Fund | Fund | Fund | Fund | Builder | Fund | Fund | Fund | Fund | ||||||||||||||||||||||||||
|
|
|
| ||||||||||||||||||||||||||||||||
| $5,269,923 | $409,724 | $14,186,521 | $1,066,860 | $201,987 | $15,067,547 | $75,469 | $6,409,191 | $1,222,013 | ||||||||||||||||||||||||||
| 383,409 | 27,964 | 311,300 | 63,870 | 20,022 | 674,106 | 6,145 | 590,394 | 104,285 | ||||||||||||||||||||||||||
| $13.74 | $14.65 | $45.57 | $16.70 | $10.09 | $22.35 | $12.28 | $10.86 | $11.72 | ||||||||||||||||||||||||||
| $161 | $11 | $450 | $17 | $75 | $1,979 | $11 | $391 | $31 | ||||||||||||||||||||||||||
| 12 | 1 | 10 | 1 | 7 | 89 | 1 | 36 | 3 | ||||||||||||||||||||||||||
| $13.74 | $14.65 | $45.55 | $16.70 | $10.08 | $22.34 | $12.28 | $10.85 | $11.72 | ||||||||||||||||||||||||||
| $3,434,403 | $1,500,617 | $13,333,215 | $264,171 | $732 | $5,349,839 | $193,166 | $3,971,247 | $1,160,083 | ||||||||||||||||||||||||||
| 252,757 | 102,680 | 295,740 | 15,876 | 73 | 241,782 | 15,774 | 370,598 | 99,817 | ||||||||||||||||||||||||||
| $13.59 | $14.61 | $45.08 | $16.64 | $10.09 | $22.13 | $12.25 | $10.72 | $11.62 | ||||||||||||||||||||||||||
| $159,906 | $36,628 | |||||||||||||||||||||||||||||||||
| 3,505 | 1,638 | |||||||||||||||||||||||||||||||||
| $45.62 | $22.36 | |||||||||||||||||||||||||||||||||
| $175,285 | $24,664 | $576,948 | $47,320 | $298,869 | $3,183,324 | $20,906 | $121,870 | $14,549 | ||||||||||||||||||||||||||
| 12,922 | 1,704 | 12,896 | 2,857 | 29,679 | 144,458 | 1,718 | 11,361 | 1,260 | ||||||||||||||||||||||||||
| $13.56 | $14.47 | $44.74 | $16.56 | $10.07 | $22.04 | $12.17 | $10.73 | $11.55 | ||||||||||||||||||||||||||
| Managed | Managed | Managed | ||||||||||||||||||||||||||||||||
| Managed | Risk Blue | Risk | Risk | |||||||||||||||||||||||||||||||
| Risk | Chip Income | Growth- | Asset | |||||||||||||||||||||||||||||||
| International | and Growth | Income | Allocation | |||||||||||||||||||||||||||||||
| Fund | Fund | Fund | Fund | |||||||||||||||||||||||||||||||
|
|
|
| ||||||||||||||||||||||||||||||||
| $125 | $201 | $1,792 | $1,466,442 | |||||||||||||||||||||||||||||||
| 12 | 17 | 156 | 115,455 | |||||||||||||||||||||||||||||||
| $10.17 | $11.96 | $11.45 | $12.70 | |||||||||||||||||||||||||||||||
| $123,611 | $361,432 | $183,914 | $2,619,784 | |||||||||||||||||||||||||||||||
| 12,238 | 30,441 | 16,138 | 206,573 | |||||||||||||||||||||||||||||||
| $10.10 | $11.87 | $11.40 | $12.68 | |||||||||||||||||||||||||||||||
| American Funds Insurance Series | 125 |
Statements of operations for the six months ended June 30, 2017
| Global | ||||||||||||||||||||
| Global | Small | New | ||||||||||||||||||
| Growth | Capitalization | Growth | International | World | ||||||||||||||||
| Fund | Fund | Fund | Fund | Fund | ||||||||||||||||
Investment income: | ||||||||||||||||||||
Income (net of non-U.S. taxes)*: | ||||||||||||||||||||
Dividends | $ 56,592 | $ 27,833 | $ 137,104 | $ 97,141 | $ 29,601 | |||||||||||||||
Interest | 1,196 | 1,457 | 4,798 | 5,105 | 6,559 | |||||||||||||||
| 57,788 | 29,290 | 141,902 | 102,246 | 36,160 | ||||||||||||||||
Fees and expenses*: | ||||||||||||||||||||
Investment advisory services | 14,558 | 14,170 | 37,258 | 20,281 | 11,051 | |||||||||||||||
Distribution services | 4,749 | 3,060 | 19,178 | 5,092 | 1,550 | |||||||||||||||
Insurance administrative services | 140 | 65 | 645 | 100 | 351 | |||||||||||||||
Transfer agent services | – | † | – | † | 1 | – | † | – | † | |||||||||||
Administrative services | 279 | 203 | 1,140 | 408 | 156 | |||||||||||||||
Reports to shareholders | 152 | 105 | 626 | 216 | 80 | |||||||||||||||
Registration statement and prospectus | 9 | 15 | 45 | 11 | 16 | |||||||||||||||
Trustees’ compensation | 27 | 20 | 111 | 39 | 15 | |||||||||||||||
Auditing and legal | – | † | 3 | 4 | 4 | 17 | ||||||||||||||
Custodian | 344 | 225 | 238 | 674 | 401 | |||||||||||||||
Other | 6 | 44 | 3 | 15 | 20 | |||||||||||||||
Total fees and expenses before waivers/reimbursements | 20,264 | 17,910 | 59,249 | 26,840 | 13,657 | |||||||||||||||
Less waivers/reimbursements of fees and expenses: | ||||||||||||||||||||
Investment advisory services waivers | – | – | – | – | – | |||||||||||||||
Miscellaneous fee reimbursements | – | – | – | – | – | |||||||||||||||
Total waivers/reimbursements of fees and expenses | – | – | – | – | – | |||||||||||||||
Total fees and expenses after waivers/reimbursements | 20,264 | 17,910 | 59,249 | 26,840 | 13,657 | |||||||||||||||
Net investment income (loss) | 37,524 | 11,380 | 82,653 | 75,406 | 22,503 | |||||||||||||||
Net realized gain (loss) and unrealized appreciation (depreciation): | ||||||||||||||||||||
Net realized gain (loss) on*: | ||||||||||||||||||||
Investments | ||||||||||||||||||||
Unaffiliated issuers | 329,123 | 8,706 | 1,883,619 | 214,021 | 184,399 | |||||||||||||||
Affiliated issuers | – | (3,537 | ) | – | – | – | ||||||||||||||
Futures contracts | – | – | – | – | – | |||||||||||||||
Forward currency contracts | 134 | (3,099 | ) | – | (8,385 | ) | (859 | ) | ||||||||||||
Swap contracts | – | – | – | – | – | |||||||||||||||
Currency transactions | (1,077 | ) | 27 | (282 | ) | (905 | ) | (1,656 | ) | |||||||||||
| 328,180 | 2,097 | 1,883,337 | 204,731 | 181,884 | ||||||||||||||||
Net unrealized appreciation (depreciation) on: | ||||||||||||||||||||
Investments | ||||||||||||||||||||
Unaffiliated issuers | 586,020 | 463,321 | 1,218,360 | 1,103,867 | 218,406 | |||||||||||||||
Affiliated issuers | – | 14,483 | – | – | – | |||||||||||||||
Futures contracts | – | – | – | – | – | |||||||||||||||
Forward currency contracts | (290 | ) | (1,672 | ) | – | 2,203 | 134 | |||||||||||||
Swap contracts | – | – | – | – | – | |||||||||||||||
Currency translations | 502 | 81 | 65 | 572 | (64 | ) | ||||||||||||||
| 586,232 | 476,213 | 1,218,425 | 1,106,642 | 218,476 | ||||||||||||||||
Net realized gain (loss) and unrealized appreciation (depreciation) | 914,412 | 478,310 | 3,101,762 | 1,311,373 | 400,360 | |||||||||||||||
Net increase in net assets resulting from operations | $951,936 | $489,690 | $3,184,415 | $1,386,779 | $422,863 | |||||||||||||||
See end of statements of operations for footnotes.
See Notes to Financial Statements
| 126 | American Funds Insurance Series |
unaudited
(dollars in thousands)
| Blue Chip | Global | International | ||||||||||||||||||||||||||||||||
| Income and | Growth | Growth- | Growth | Capital | Asset | Global | Global | |||||||||||||||||||||||||||
| Growth | and Income | Income | and Income | Income | Allocation | Balanced | Bond | Bond | ||||||||||||||||||||||||||
| Fund | Fund | Fund | Fund | Builder | Fund | Fund | Fund | Fund | ||||||||||||||||||||||||||
| $117,580 | $ 33,520 | $ 257,726 | $ 25,860 | $ 9,573 | $ 160,259 | $ 2,571 | $ – | $ 84 | ||||||||||||||||||||||||||
| 1,689 | 2,408 | 9,438 | 1,699 | 836 | 95,123 | 1,163 | 139,252 | 33,891 | ||||||||||||||||||||||||||
| 119,269 | 35,928 | 267,164 | 27,559 | 10,409 | 255,382 | 3,734 | 139,252 | 33,975 | ||||||||||||||||||||||||||
| 17,382 | 6,061 | 35,953 | 3,690 | 1,138 | 30,178 | 887 | 19,889 | 6,109 | ||||||||||||||||||||||||||
| 4,478 | 1,834 | 17,289 | 370 | 346 | 10,448 | 250 | 5,056 | 1,438 | ||||||||||||||||||||||||||
| 195 | 24 | 671 | 52 | 345 | 3,823 | 18 | 136 | 16 | ||||||||||||||||||||||||||
| — | † | — | † | 2 | – | – | † | 1 | – | † | 1 | – | † | |||||||||||||||||||||
| 447 | 102 | 1,364 | 59 | 23 | 1,121 | 13 | 551 | 115 | ||||||||||||||||||||||||||
| 170 | 35 | 588 | 12 | 5 | 585 | 3 | 270 | 43 | ||||||||||||||||||||||||||
| 153 | 3 | 40 | 17 | 22 | 251 | 4 | 120 | 4 | ||||||||||||||||||||||||||
| 44 | 10 | 133 | 6 | 2 | 109 | 1 | 55 | 11 | ||||||||||||||||||||||||||
| 1 | 1 | 5 | 1 | – | 3 | 1 | 2 | 1 | ||||||||||||||||||||||||||
| 57 | 140 | 242 | 118 | 14 | 107 | 15 | 108 | 300 | ||||||||||||||||||||||||||
| 2 | 5 | 7 | 2 | 1 | 114 | 10 | 30 | 20 | ||||||||||||||||||||||||||
| 22,929 | 8,215 | 56,294 | 4,327 | 1,896 | 46,740 | 1,202 | 26,218 | 8,057 | ||||||||||||||||||||||||||
| – | – | – | – | – | – | – | – | – | ||||||||||||||||||||||||||
| – | – | – | – | – | – | – | – | – | ||||||||||||||||||||||||||
| – | – | – | – | – | – | – | – | – | ||||||||||||||||||||||||||
| 22,929 | 8,215 | 56,294 | 4,327 | 1,896 | 46,740 | 1,202 | 26,218 | 8,057 | ||||||||||||||||||||||||||
| 96,340 | 27,713 | 210,870 | 23,232 | 8,513 | 208,642 | 2,532 | 113,034 | 25,918 | ||||||||||||||||||||||||||
| 380,596 | 127,997 | 1,140,134 | (1,933 | ) | 3,295 | 592,305 | 5,873 | (18,640 | ) | (10,428 | ) | |||||||||||||||||||||||
| – | – | – | – | – | – | – | – | – | ||||||||||||||||||||||||||
| – | – | – | – | – | 1,548 | – | 19,307 | 657 | ||||||||||||||||||||||||||
| – | (157 | ) | – | (143 | ) | (26 | ) | – | (115 | ) | (43,217 | ) | (10,947 | ) | ||||||||||||||||||||
| – | – | – | – | – | 3,474 | – | (1,445 | ) | (918 | ) | ||||||||||||||||||||||||
| (14 | ) | (269 | ) | (223 | ) | (366 | ) | 24 | (660 | ) | (14 | ) | 390 | (3,174 | ) | |||||||||||||||||||
| 380,582 | 127,571 | 1,139,911 | (2,442 | ) | 3,293 | 596,667 | 5,744 | (43,605 | ) | (24,810 | ) | |||||||||||||||||||||||
| 25,575 | 132,297 | 1,200,176 | 148,712 | 23,246 | 955,474 | 19,960 | 217,370 | 108,647 | ||||||||||||||||||||||||||
| – | – | – | – | – | – | – | – | – | ||||||||||||||||||||||||||
| – | – | – | – | – | 104 | – | (2,500 | ) | 16 | |||||||||||||||||||||||||
| – | (147 | ) | – | 105 | – | – | (53 | ) | (4,424 | ) | 4,188 | |||||||||||||||||||||||
| – | – | – | – | – | (2,901 | ) | – | (637 | ) | (339 | ) | |||||||||||||||||||||||
| 38 | 115 | 178 | 128 | 17 | 116 | 28 | 407 | 755 | ||||||||||||||||||||||||||
| 25,613 | 132,265 | 1,200,354 | 148,945 | 23,263 | 952,793 | 19,935 | 210,216 | 113,267 | ||||||||||||||||||||||||||
| 406,195 | 259,836 | 2,340,265 | 146,503 | 26,556 | 1,549,460 | 25,679 | 166,611 | 88,457 | ||||||||||||||||||||||||||
| $502,535 | $287,549 | $2,551,135 | $169,735 | $35,069 | $1,758,102 | $28,211 | $279,645 | $114,375 | ||||||||||||||||||||||||||
| American Funds Insurance Series | 127 |
Statements of operations for the six months ended June 30, 2017
| U.S. | ||||||||||||||||||||
| High- | Government/ | Managed | ||||||||||||||||||
| Income | AAA-Rated | Risk | ||||||||||||||||||
| Bond | Mortgage | Ultra-Short | Securities | Growth | ||||||||||||||||
| Fund | Fund | Bond Fund | Fund | Fund | ||||||||||||||||
Investment income: | ||||||||||||||||||||
Income (net of non-U.S. taxes)*: | ||||||||||||||||||||
Dividends | $ 783 | $ – | $ – | $ – | $ 365 | |||||||||||||||
Interest | 56,796 | 3,282 | 1,365 | 29,712 | 42 | |||||||||||||||
| 57,579 | 3,282 | 1,365 | 29,712 | 407 | ||||||||||||||||
Fees and expenses*: | ||||||||||||||||||||
Investment advisory services | 4,128 | 716 | 520 | 5,091 | 170 | |||||||||||||||
Distribution services | 1,040 | 89 | 362 | 1,933 | 283 | |||||||||||||||
Insurance administrative services | 32 | 11 | 17 | 68 | 284 | |||||||||||||||
Transfer agent services | – | † | – | † | – | † | – | † | – | † | ||||||||||
Administrative services | 89 | 17 | 16 | 151 | – | |||||||||||||||
Accounting and administrative services | – | – | – | – | 28 | |||||||||||||||
Reports to shareholders | 33 | 3 | 6 | 54 | 2 | |||||||||||||||
Registration statement and prospectus | 3 | 1 | 1 | 6 | 7 | |||||||||||||||
Trustees’ compensation | 10 | 1 | 1 | 15 | 1 | |||||||||||||||
Auditing and legal | 9 | – | † | – | † | – | – | |||||||||||||
Custodian | 4 | 1 | 1 | 4 | 6 | |||||||||||||||
Other | 19 | 18 | – | † | 22 | 115 | ||||||||||||||
Total fees and expenses before waivers/reimbursements | 5,367 | 857 | 924 | 7,344 | 896 | |||||||||||||||
Less waivers/reimbursements of fees and expenses: | ||||||||||||||||||||
Investment advisory services waivers | – | – | – | – | 57 | |||||||||||||||
Miscellaneous fee reimbursements | – | – | – | – | 125 | |||||||||||||||
Total waivers/reimbursements of fees and expenses | – | – | – | – | 182 | |||||||||||||||
Total fees and expenses after waivers/reimbursements | 5,367 | 857 | 924 | 7,344 | 714 | |||||||||||||||
Net investment income (loss) | 52,212 | 2,425 | 441 | 22,368 | (307 | ) | ||||||||||||||
Net realized gain (loss) and unrealized appreciation (depreciation): | ||||||||||||||||||||
Net realized gain (loss) on*: | ||||||||||||||||||||
Investments | ||||||||||||||||||||
Unaffiliated issuers | 30,949 | 143 | – | (1,796 | ) | – | ||||||||||||||
Affiliated issuers | – | – | – | – | (574 | ) | ||||||||||||||
Futures contracts | – | 1,927 | – | 11,432 | – | |||||||||||||||
Swap contracts | 330 | 261 | – | 16,310 | – | |||||||||||||||
Currency transactions | (38 | ) | (1 | ) | – | – | – | |||||||||||||
Capital gain distributions received | – | – | – | – | 21,739 | |||||||||||||||
| 31,241 | 2,330 | – | 25,946 | 21,165 | ||||||||||||||||
Net unrealized appreciation (depreciation) on: | ||||||||||||||||||||
Investments | ||||||||||||||||||||
Unaffiliated issuers | (2,555 | ) | 1,601 | (35 | ) | 24,528 | – | |||||||||||||
Affiliated issuers | – | – | – | – | 8,123 | |||||||||||||||
Futures contracts | – | (230 | ) | – | (82 | ) | – | |||||||||||||
Swap contracts | (676 | ) | (962 | ) | – | (17,657 | ) | – | ||||||||||||
| (3,231 | ) | 409 | (35 | ) | 6,789 | 8,123 | ||||||||||||||
Net realized gain (loss) and unrealized appreciation (depreciation) | 28,010 | 2,739 | (35 | ) | 32,735 | 29,288 | ||||||||||||||
Net increase in net assets resulting from operations | $80,222 | $5,164 | $ 406 | $ 55,103 | $28,981 | |||||||||||||||
* Additional information related to non-U.S. taxes, affiliated transactions and class-specific fees and expenses is included in the Notes to Financial Statements.
† Amount less than one thousand.
See Notes to Financial Statements
| 128 | American Funds Insurance Series |
unaudited (dollars in thousands) |
| Managed | Managed | Managed | ||||||||||||||||||||||||||||
| Managed | Risk Blue | Risk | Risk | |||||||||||||||||||||||||||
| Risk | Chip Income | Growth- | Asset | |||||||||||||||||||||||||||
| International | and Growth | Income | Allocation | �� | ||||||||||||||||||||||||||
| Fund | Fund | Fund | Fund | |||||||||||||||||||||||||||
| $ 397 | $ 1,244 | $ 488 | $ 12,067 | |||||||||||||||||||||||||||
| 21 | 61 | 29 | 749 | |||||||||||||||||||||||||||
| 418 | 1,305 | 517 | 12,816 | |||||||||||||||||||||||||||
| 84 | 259 | 131 | 2,889 | |||||||||||||||||||||||||||
| 140 | 431 | 217 | 3,127 | |||||||||||||||||||||||||||
| 140 | 432 | 219 | 4,815 | |||||||||||||||||||||||||||
| – | † | – | † | – | † | – | † | |||||||||||||||||||||||
| – | – | – | – | |||||||||||||||||||||||||||
| 26 | 29 | 27 | 68 | |||||||||||||||||||||||||||
| 1 | 3 | 2 | 45 | |||||||||||||||||||||||||||
| 3 | 16 | 4 | 98 | |||||||||||||||||||||||||||
| 1 | 2 | 1 | 18 | |||||||||||||||||||||||||||
| – | – | – | – | |||||||||||||||||||||||||||
| 6 | 6 | 6 | 6 | |||||||||||||||||||||||||||
| 42 | 186 | 83 | 342 | |||||||||||||||||||||||||||
| 443 | 1,364 | 690 | 11,408 | |||||||||||||||||||||||||||
| 28 | 86 | 44 | 963 | |||||||||||||||||||||||||||
| 62 | 190 | 96 | — | |||||||||||||||||||||||||||
| 90 | 276 | 140 | 963 | |||||||||||||||||||||||||||
| 353 | 1,088 | 550 | 10,445 | |||||||||||||||||||||||||||
| 65 | 217 | (33 | ) | 2,371 | ||||||||||||||||||||||||||
| – | – | – | – | |||||||||||||||||||||||||||
| (483 | ) | (296 | ) | (554 | ) | 1,372 | ||||||||||||||||||||||||
| (506 | ) | – | – | – | ||||||||||||||||||||||||||
| – | – | – | – | |||||||||||||||||||||||||||
| 8 | – | – | – | |||||||||||||||||||||||||||
| 1,333 | 12,607 | 11,243 | 172,372 | |||||||||||||||||||||||||||
| 352 | 12,311 | 10,689 | 173,744 | |||||||||||||||||||||||||||
| – | – | – | – | |||||||||||||||||||||||||||
| 16,607 | 3,936 | 4,193 | 97,975 | |||||||||||||||||||||||||||
| 18 | – | – | – | |||||||||||||||||||||||||||
| – | – | – | – | |||||||||||||||||||||||||||
| 16,625 | 3,936 | 4,193 | 97,975 | |||||||||||||||||||||||||||
| 16,977 | 16,247 | 14,882 | 271,719 | |||||||||||||||||||||||||||
| $17,042 | $16,464 | $14,849 | $274,090 | |||||||||||||||||||||||||||
| American Funds Insurance Series | 129 |
Statements of changes in net assets
| Global Small | ||||||||||||||||||||||||
| Global Growth Fund | Capitalization Fund | Growth Fund | ||||||||||||||||||||||
| Six months | Six months | Six months | ||||||||||||||||||||||
| ended | Year ended | ended | Year ended | ended | Year ended | |||||||||||||||||||
| June 30 | December 31 | June 30 | December 31 | June 30 | December 31 | |||||||||||||||||||
| 2017* | 2016 | 2017* | 2016 | 2017* | 2016 | |||||||||||||||||||
Operations: | ||||||||||||||||||||||||
Net investment income (loss) | $ 37,524 | $ 43,253 | $ 11,380 | $ 16,207 | $ 82,653 | $ 179,970 | ||||||||||||||||||
Net realized gain (loss) | 328,180 | 182,760 | 2,097 | (26,426 | ) | 1,883,337 | 2,252,045 | |||||||||||||||||
Net unrealized appreciation (depreciation) | 586,232 | (192,438 | ) | 476,213 | 93,893 | 1,218,425 | (489,479 | ) | ||||||||||||||||
Net increase (decrease) in net assets resulting from operations | 951,936 | 33,575 | 489,690 | 83,674 | 3,184,415 | 1,942,536 | ||||||||||||||||||
Dividends and distributions paid to shareholders: | ||||||||||||||||||||||||
Dividends from net investment income | (5,483 | ) | (51,522 | ) | (16,092 | ) | (13,487 | ) | (31,422 | ) | (177,667 | ) | ||||||||||||
Distributions from net realized gain on investments | (174,096 | ) | (443,911 | ) | – | (724,863 | ) | (2,251,429 | ) | (1,900,853 | ) | |||||||||||||
Total dividends and distributions paid to shareholders | (179,579 | ) | (495,433 | ) | (16,092 | ) | (738,350 | ) | (2,282,851 | ) | (2,078,520 | ) | ||||||||||||
Net capital share transactions | (128,527 | ) | 134,946 | (316,593 | ) | 300,027 | 1,141,399 | (111,950 | ) | |||||||||||||||
Total increase (decrease) in net assets | 643,830 | (326,912 | ) | 157,005 | (354,649 | ) | 2,042,963 | (247,934 | ) | |||||||||||||||
Net assets: | ||||||||||||||||||||||||
Beginning of period | 5,206,720 | 5,533,632 | 3,876,854 | 4,231,503 | 21,549,750 | 21,797,684 | ||||||||||||||||||
End of period | $5,850,550 | $5,206,720 | $4,033,859 | $3,876,854 | $23,592,713 | $21,549,750 | ||||||||||||||||||
Undistributed (distributions in excess of) net investment income | $27,922 | $(4,119 | ) | $9,675 | $14,387 | $92,306 | $41,075 | |||||||||||||||||
| International Growth | ||||||||||||||||||||||||
| and Income Fund | Capital Income Builder | Asset Allocation Fund | ||||||||||||||||||||||
| Six months | Six months | Six months | ||||||||||||||||||||||
| ended | Year ended | ended | Year ended | ended | Year ended | |||||||||||||||||||
| June 30 | December 31 | June 30 | December 31 | June 30 | December 31 | |||||||||||||||||||
| 2017* | 2016 | 2017* | 2016 | 2017* | 2016 | |||||||||||||||||||
Operations: | ||||||||||||||||||||||||
Net investment income (loss) | $ 23,232 | $ 30,357 | $ 8,513 | $ 10,171 | $ 208,642 | $ 356,748 | ||||||||||||||||||
Net realized gain (loss) | (2,442 | ) | (11,768 | ) | 3,293 | (5,074 | ) | 596,667 | 1,072,096 | |||||||||||||||
Net unrealized appreciation (depreciation) | 148,945 | (534 | ) | 23,263 | 5,120 | 952,793 | 360,724 | |||||||||||||||||
Net increase (decrease) in net assets resulting from operations | 169,735 | 18,055 | 35,069 | 10,217 | 1,758,102 | 1,789,568 | ||||||||||||||||||
Dividends and distributions paid to shareholders: | ||||||||||||||||||||||||
Dividends from net investment income | (2,360 | ) | (30,394 | ) | (6,422 | ) | (11,031 | ) | (70,189 | ) | (347,205 | ) | ||||||||||||
Distributions from net realized gain on investments | – | (4,687 | ) | – | – | (1,069,604 | ) | (465,866 | ) | |||||||||||||||
Total dividends and distributions paid to shareholders | (2,360 | ) | (35,081 | ) | (6,422 | ) | (11,031 | ) | (1,139,793 | ) | (813,071 | ) | ||||||||||||
Net capital share transactions | 109,541 | 125,599 | 60,981 | 175,844 | 1,973,107 | 1,700,837 | ||||||||||||||||||
Total increase (decrease) in net assets | 276,916 | 108,573 | 89,628 | 175,030 | 2,591,416 | 2,677,334 | ||||||||||||||||||
Net assets: | ||||||||||||||||||||||||
Beginning of period | 1,101,452 | 992,879 | 412,035 | 237,005 | 21,047,901 | 18,370,567 | ||||||||||||||||||
End of period | $1,378,368 | $1,101,452 | $501,663 | $412,035 | $23,639,317 | $21,047,901 | ||||||||||||||||||
Undistributed (distributions in excess of) net investment income | $22,391 | $1,519 | $1,143 | $(948 | ) | $209,787 | $71,334 | |||||||||||||||||
See end of statements of changes in net assets for footnote.
See Notes to Financial Statements
| 130 | American Funds Insurance Series |
(dollars in thousands)
| Blue Chip Income | Global Growth | |||||||||||||||||||||||||||||||||||||
| International Fund | New World Fund | and Growth Fund | and Income Fund | Growth-Income Fund | ||||||||||||||||||||||||||||||||||
| Six months | Six months | Six months | Six months | Six months | ||||||||||||||||||||||||||||||||||
| ended | Year ended | ended | Year ended | ended | Year ended | ended | Year ended | ended | Year ended | |||||||||||||||||||||||||||||
| June 30 | December 31 | June 30 | December 31 | June 30 | December 31 | June 30 | December 31 | June 30 | December 31 | |||||||||||||||||||||||||||||
| 2017* | 2016 | 2017* | 2016 | 2017* | 2016 | 2017* | 2016 | 2017* | 2016 | |||||||||||||||||||||||||||||
| $ 75,406 | $ 107,613 | $ 22,503 | $ 30,850 | $ 96,340 | $ 173,682 | $ 27,713 | $ 37,944 | $ 210,870 | $ 406,211 | |||||||||||||||||||||||||||||
| 204,731 | 174,210 | 181,884 | (49,262 | ) | 380,582 | 340,410 | 127,571 | 63,152 | 1,139,911 | 1,870,618 | ||||||||||||||||||||||||||||
| 1,106,642 | 486 | 218,476 | 165,410 | 25,613 | 803,943 | 132,265 | 36,088 | 1,200,354 | 478,434 | |||||||||||||||||||||||||||||
| | 1,386,779 |
| 282,309 | 422,863 | 146,998 | 502,535 | 1,318,035 | 287,549 | 137,184 | 2,551,135 | 2,755,263 | |||||||||||||||||||||||||||
| (28,350 | ) | (112,086 | ) | (4,703 | ) | (26,290 | ) | (30,871 | ) | (170,997 | ) | (5,647 | ) | (36,671 | ) | (72,640 | ) | (395,167 | ) | |||||||||||||||||||
| (100,923 | ) | (637,485 | ) | – | – | (328,661 | ) | (595,206 | ) | (33,691 | ) | – | (1,807,557 | ) | (2,694,334 | ) | ||||||||||||||||||||||
| (129,273 | ) | (749,571 | ) | (4,703 | ) | (26,290 | ) | (359,532 | ) | (766,203 | ) | (39,338 | ) | (36,671 | ) | (1,880,197 | ) | (3,089,501 | ) | |||||||||||||||||||
| 67,237 | 439,487 | (160,120 | ) | 79,376 | 93,531 | 1,193,132 | (304,804 | ) | 114,314 | 1,492,912 | 2,214,035 | |||||||||||||||||||||||||||
| 1,324,743 | (27,775 | ) | 258,040 | 200,084 | 236,534 | 1,744,964 | (56,593 | ) | 214,827 | 2,163,850 | 1,879,797 | |||||||||||||||||||||||||||
| 7,454,875 | 7,482,650 | 2,893,865 | 2,693,781 | 8,643,238 | 6,898,274 | 1,991,609 | 1,776,782 | 26,093,190 | 24,213,393 | |||||||||||||||||||||||||||||
| $8,779,618 | $7,454,875 | $3,151,905 | $2,893,865 | $8,879,772 | $8,643,238 | $1,935,016 | $1,991,609 | $28,257,040 | $26,093,190 | |||||||||||||||||||||||||||||
| | $76,172 |
| $29,116 | $3,247 | $(14,553 | ) | $96,117 | $30,648 | $28,427 | $6,361 | $217,613 | $79,383 | ||||||||||||||||||||||||||
| Global Balanced Fund | Bond Fund | Global Bond Fund | High-Income Bond Fund | Mortgage Fund | ||||||||||||||||||||||||||||||||||
| Six months | Six months | Six months | Six months | Six months | ||||||||||||||||||||||||||||||||||
| ended | Year ended | ended | Year ended | ended | Year ended | ended | Year ended | ended | Year ended | |||||||||||||||||||||||||||||
| June 30 | December 31 | June 30 | December 31 | June 30 | December 31 | June 30 | December 31 | June 30 | December 31 | |||||||||||||||||||||||||||||
| 2017* | 2016 | 2017* | 2016 | 2017* | 2016 | 2017* | 2016 | 2017* | 2016 | |||||||||||||||||||||||||||||
| $ 2,532 | $ 3,667 | $ 113,034 | $ 188,699 | $ 25,918 | $ 49,208 | $ 52,212 | $ 106,342 | $ 2,425 | $ 4,590 | |||||||||||||||||||||||||||||
| 5,744 | 1,518 | (43,605 | ) | 163,219 | (24,810 | ) | (11,548 | ) | 31,241 | (82,614 | ) | 2,330 | 4,966 | |||||||||||||||||||||||||
| 19,935 | 5,219 | 210,216 | (52,479 | ) | 113,267 | 25,290 | (3,231 | ) | 262,380 | 409 | (1,322 | ) | ||||||||||||||||||||||||||
| | 28,211 |
| 10,404 | 279,645 | 299,439 | 114,375 | 62,950 | 80,222 | 286,108 | 5,164 | 8,234 | |||||||||||||||||||||||||||
| – | (3,285 | ) | (60,071 | ) | (197,417 | ) | – | (15,576 | ) | (19,156 | ) | (106,140 | ) | (1,054 | ) | (6,310 | ) | |||||||||||||||||||||
| (934 | ) | – | (157,394 | ) | (35,948 | ) | (14,450 | ) | (4,207 | ) | – | – | (2,214 | ) | (3,532 | ) | ||||||||||||||||||||||
| (934 | ) | (3,285 | ) | (217,465 | ) | (233,365 | ) | (14,450 | ) | (19,783 | ) | (19,156 | ) | (106,140 | ) | (3,268 | ) | (9,842 | ) | |||||||||||||||||||
| 10,395 | 25,497 | (448,998 | ) | 898,544 | 48,567 | (40,534 | ) | (268,749 | ) | (193,559 | ) | 2,723 | (117 | ) | ||||||||||||||||||||||||
| 37,672 | 32,616 | (386,818 | ) | 964,618 | 148,492 | 2,633 | (207,683 | ) | (13,591 | ) | 4,619 | (1,725 | ) | |||||||||||||||||||||||||
| 251,880 | 219,264 | 10,889,517 | 9,924,899 | 2,248,184 | 2,245,551 | 1,781,641 | 1,795,232 | 340,405 | 342,130 | |||||||||||||||||||||||||||||
| $289,552 | $251,880 | $10,502,699 | $10,889,517 | $2,396,676 | $2,248,184 | $1,573,958 | $1,781,641 | $345,024 | $340,405 | |||||||||||||||||||||||||||||
| | $1,472 |
| $(1,060 | ) | $112,798 | $59,835 | $20,272 | $(5,646 | ) | $50,886 | $17,830 | $2,404 | $1,033 | |||||||||||||||||||||||||
| American Funds Insurance Series | 131 |
Statements of changes in net assets
| U.S. Government/ | Managed Risk | |||||||||||||||||||||||
| Ultra-Short Bond Fund | AAA-Rated Securities Fund | Growth Fund | ||||||||||||||||||||||
| Six months | Six months | Six months | ||||||||||||||||||||||
| ended | Year ended | ended | Year ended | ended | Year ended | |||||||||||||||||||
| June 30 | December 31 | June 30 | December 31 | June 30 | December 31 | |||||||||||||||||||
| 2017* | 2016 | 2017* | 2016 | 2017* | 2016 | |||||||||||||||||||
Operations: | ||||||||||||||||||||||||
Net investment income (loss) | $ 441 | $ (452 | ) | $ 22,368 | $ 36,028 | $ (307 | ) | $ 731 | ||||||||||||||||
Net realized gain (loss) | – | – | 25,946 | 9,371 | 21,165 | (560 | ) | |||||||||||||||||
Net unrealized appreciation (depreciation) | (35 | ) | (3 | ) | 6,789 | (5,718 | ) | 8,123 | 6,120 | |||||||||||||||
Net increase (decrease) in net assets resulting from operations | 406 | (455 | ) | 55,103 | 39,681 | 28,981 | 6,291 | |||||||||||||||||
Dividends and distributions paid to shareholders: | ||||||||||||||||||||||||
Dividends from net investment income | – | – | (7,654 | ) | (46,049 | ) | (734 | ) | (330 | ) | ||||||||||||||
Distributions from net realized gain on investments | – | – | – | (60,973 | ) | (4,142 | ) | (15,012 | ) | |||||||||||||||
Total dividends and distributions paid to shareholders | – | – | (7,654 | ) | (107,022 | ) | (4,876 | ) | (15,342 | ) | ||||||||||||||
Net capital share transactions | (40,923 | ) | (11,965 | ) | (201,901 | ) | 43,179 | 21,094 | 64,347 | |||||||||||||||
Total increase (decrease) in net assets | (40,517 | ) | (12,420 | ) | (154,452 | ) | (24,162 | ) | 45,199 | 55,296 | ||||||||||||||
Net assets: | ||||||||||||||||||||||||
Beginning of period | 351,016 | 363,436 | 3,037,724 | 3,061,886 | 201,128 | 145,832 | ||||||||||||||||||
End of period | $310,499 | $351,016 | $2,883,272 | $3,037,724 | $246,327 | $201,128 | ||||||||||||||||||
Undistributed (distributions in excess of) net investment income | $421 | $(20 | ) | $22,411 | $7,697 | $(312 | ) | $729 | ||||||||||||||||
*Unaudited.
See Notes to Financial Statements
| 132 | American Funds Insurance Series |
| (dollars in thousands) |
| Managed Risk | Managed Risk Blue Chip | Managed Risk | Managed Risk | |||||||||||||||||||||||||||
| International Fund | Income and Growth Fund | Growth-Income Fund | Asset Allocation Fund | |||||||||||||||||||||||||||
| Six months | Six months | Six months | Six months | |||||||||||||||||||||||||||
| ended | Year ended | ended | Year ended | ended | Year ended | ended | Year ended | |||||||||||||||||||||||
| June 30 | December 31 | June 30 | December 31 | June 30 | December 31 | June 30 | December 31 | |||||||||||||||||||||||
| 2017* | 2016 | 2017* | 2016 | 2017* | 2016 | 2017* | 2016 | |||||||||||||||||||||||
| $ 65 | $ 884 | $ 217 | $ 4,012 | $ (33 | ) | $ 1,562 | $ 2,371 | $ 41,207 | ||||||||||||||||||||||
| 352 | (4,433 | ) | 12,311 | 5,539 | 10,689 | 5,070 | 173,744 | 37,559 | ||||||||||||||||||||||
| 16,625 | 1,071 | 3,936 | 15,029 | 4,193 | 2,438 | 97,975 | 148,316 | |||||||||||||||||||||||
| | 17,042 |
| (2,478 | ) | 16,464 | 24,580 | 14,849 | 9,070 | 274,090 | 227,082 | ||||||||||||||||||||
| (900 | ) | (843 | ) | (4,294 | ) | (3,375 | ) | (1,867 | ) | (1,707 | ) | (31,722 | ) | (44,188 | ) | |||||||||||||||
| (1,403 | ) | (2,185 | ) | (5,569 | ) | (5,923 | ) | (7,726 | ) | (8,465 | ) | (38,742 | ) | (93,578 | ) | |||||||||||||||
| (2,303 | ) | (3,028 | ) | (9,863 | ) | (9,298 | ) | (9,593 | ) | (10,172 | ) | (70,464 | ) | (137,766 | ) | |||||||||||||||
| 11,392 | 19,951 | 63,816 | 138,529 | 19,694 | 39,189 | 323,620 | 804,645 | |||||||||||||||||||||||
| 26,131 | 14,445 | 70,417 | 153,811 | 24,950 | 38,087 | 527,246 | 893,961 | |||||||||||||||||||||||
| 97,605 | 83,160 | 291,216 | 137,405 | 160,756 | 122,669 | 3,558,980 | 2,665,019 | |||||||||||||||||||||||
| $123,736 | $97,605 | $361,633 | $291,216 | $185,706 | $160,756 | $4,086,226 | $3,558,980 | |||||||||||||||||||||||
| $56 | $891 | $197 | $4,274 | $(35 | ) | $1,865 | $2,234 | $31,585 | ||||||||||||||||||||||
| American Funds Insurance Series | 133 |
| Notes to financial statements | unaudited |
1. Organization
American Funds Insurance Series (the “series”) is registered under the Investment Company Act of 1940 as an open-end, diversified management investment company with 28 different funds (the “funds”). Twenty-three funds in the series are covered in this report. The other five funds in the series are covered in a separate report. The assets of each fund are segregated, with each fund accounted for separately. Capital Research and Management Company (“CRMC”) is the series’ investment adviser. Milliman Financial Risk Management LLC (“Milliman FRM”) is the subadviser for the risk management strategy for eight of the funds (the “managed risk funds”), five of which are covered in this report.
The managed risk funds covered in this report are Managed Risk Growth Fund, Managed Risk International Fund, Managed Risk Blue Chip Income and Growth Fund, Managed Risk Growth-Income Fund and Managed Risk Asset Allocation Fund. The managed risk funds invest in other funds within the series (the “underlying funds”) and employ Milliman FRM to implement the risk management strategy, which consists of using hedging instruments – primarily short positions on exchange-traded futures contracts – to attempt to stabilize the volatility of the funds around target volatility levels and reduce the downside exposure of the funds during periods of significant market declines.
Shareholders approved a proposal to reorganize the series from a Massachusetts business trust to a Delaware statutory trust. The reorganization may be completed in the next 12 months; however, the series reserves the right to delay the implementation.
The investment objectives for each fund covered in this report are as follows:
Global Growth Fund – Seeks to provide long-term growth of capital.
Global Small Capitalization Fund – Seeks to provide long-term growth of capital.
Growth Fund – Seeks to provide growth of capital.
International Fund – Seeks to provide long-term growth of capital.
New World Fund – Seeks long-term capital appreciation.
Blue Chip Income and Growth Fund – Seeks to produce income exceeding the average yield on U.S. stocks generally and to provide an opportunity for growth of principal consistent with sound common stock investing.
Global Growth and Income Fund – Seeks to provide long-term growth of capital while providing current income.
Growth-Income Fund – Seeks to achieve long-term growth of capital and income.
International Growth and Income Fund – Seeks to provide long-term growth of capital while providing current income.
Capital Income Builder – Seeks to provide a level of current income that exceeds the average yield on U.S. stocks generally and to provide a growing stream of income over the years. Secondarily, seeks to provide growth of capital.
Asset Allocation Fund – Seeks to provide high total return consistent with preservation of capital over the long term.
Global Balanced Fund – Seeks the balanced accomplishment of three objectives: long-term growth of capital, conservation of principal and current income.
Bond Fund – Seeks to provide as high a level of current income as is consistent with the preservation of capital.
Global Bond Fund – Seeks to provide, over the long term, a high level of total return consistent with prudent investment management.
High-Income Bond Fund – Seeks to provide a high level of current income and, secondarily, capital appreciation.
Mortgage Fund – Seeks to provide current income and preservation of capital.
| 134 | American Funds Insurance Series |
Ultra-Short Bond Fund – Seeks to provide current income, consistent with the maturity and quality standards applicable to the fund, and preservation of capital and liquidity.
U.S. Government/AAA-Rated Securities Fund – Seeks to provide a high level of current income consistent with preservation of capital.
Managed Risk Growth Fund – Seeks to provide growth of capital while seeking to manage volatility and provide downside protection.
Managed Risk International Fund – Seeks to provide long-term growth of capital while seeking to manage volatility and provide downside protection.
Managed Risk Blue Chip Income and Growth Fund – Seeks to produce income exceeding the average yield on U.S. stocks generally and to provide an opportunity for growth of principal consistent with sound common stock investing, in each case while seeking to manage volatility and provide downside protection.
Managed Risk Growth-Income Fund – Seeks to achieve long-term growth of capital and income while seeking to manage volatility and provide downside protection.
Managed Risk Asset Allocation Fund – Seeks to provide high total return consistent with preservation of capital over the long term while seeking to manage volatility and provide downside protection.
Each fund in the series, except the managed risk funds, offers either four or five share classes (Classes 1, 1A, 2, 3 or 4); the managed risk funds offer two share classes (Classes P1 and P2). Holders of all share classes of each fund have equal pro rata rights to assets, dividends and liquidation proceeds of each fund held. Each share class of each fund has identical voting rights, except for the exclusive right to vote on matters affecting only its class. Share classes have different fees and expenses (“class-specific fees and expenses”), primarily due to different arrangements for certain distribution expenses. Differences in class-specific fees and expenses will result in differences in net investment income and, therefore, the payment of different per-share dividends by each class of each fund.
2. Significant accounting policies
Each fund is an investment company that applies the accounting and reporting guidance issued in Topic 946 by the U.S. Financial Accounting Standards Board. Each fund’s financial statements have been prepared to comply with U.S. generally accepted accounting principles (“U.S. GAAP”). These principles require the series’ investment adviser to make estimates and assumptions that affect reported amounts and disclosures. Actual results could differ from those estimates. Subsequent events, if any, have been evaluated through the date of issuance in the preparation of the financial statements. The funds follow the significant accounting policies described in this section, as well as the valuation policies described in the next section on valuation.
Security transactions and related investment income – Security transactions are recorded by the funds as of the date the trades are executed with brokers. Realized gains and losses from security transactions are determined based on the specific identified cost of the securities. In the event a security is purchased with a delayed payment date, the funds will segregate liquid assets sufficient to meet their payment obligations. Dividend income is recognized on the ex-dividend date and interest income is recognized on an accrual basis. Market discounts, premiums and original issue discounts on fixed-income securities are amortized daily over the expected life of the security.
Fees and expenses – The fees and expenses of the underlying funds held by the managed risk funds are not included in the fees and expenses reported for each of the managed risk funds; however, they are indirectly reflected in the valuation of each of the underlying funds. These fees are included in the net effective expense ratios that are provided as supplementary information in the financial highlights tables.
Class allocations – Income, fees and expenses (other than class-specific fees and expenses) and realized and unrealized gains and losses are allocated daily among the various share classes of each fund based on their relative net assets. Class-specific fees and expenses, such as distribution expenses, are accrued daily and charged directly to the respective share class of each fund.
Dividends and distributions to shareholders – Dividends and distributions to shareholders are recorded on each fund’s ex-dividend date.
| American Funds Insurance Series | 135 |
Currency translation – Assets and liabilities, including investment securities, denominated in currencies other than U.S. dollars are translated into U.S. dollars at the exchange rates supplied by one or more pricing vendors on the valuation date. Purchases and sales of investment securities and income and expenses are translated into U.S. dollars at the exchange rates on the dates of such transactions. The effects of changes in exchange rates on investment securities are included with the net realized gain or loss and net unrealized appreciation or depreciation on investments in the funds’ statements of operations. The realized gain or loss and unrealized appreciation or depreciation resulting from all other transactions denominated in currencies other than U.S. dollars are disclosed separately.
3. Valuation
CRMC, the series’ investment adviser, values the funds’ investments at fair value as defined by U.S. GAAP. The net asset value of each share class of each fund is generally determined as of approximately 4:00 p.m. New York time each day the New York Stock Exchange is open.
Methods and inputs – The series’ investment adviser uses the following methods and inputs to establish the fair value of each fund’s assets and liabilities. Use of particular methods and inputs may vary over time based on availability and relevance as market and economic conditions evolve.
Equity securities are generally valued at the official closing price of, or the last reported sale price on, the exchange or market on which such securities are traded, as of the close of business on the day the securities are being valued or, lacking any sales, at the last available bid price. Prices for each security are taken from the principal exchange or market on which the security trades. The value of an underlying fund is based on its reported net asset value.
Fixed-income securities, including short-term securities, are generally valued at prices obtained from one or more pricing vendors. Vendors value such securities based on one or more of the inputs described in the following table. The table provides examples of inputs that are commonly relevant for valuing particular classes of fixed-income securities in which the funds are authorized to invest. However, these classifications are not exclusive and any of the inputs may be used to value any other class of fixed-income security.
| Fixed-income class
| Examples of standard inputs
| |
All | Benchmark yields, transactions, bids, offers, quotations from dealers and trading systems, new issues, spreads and other relationships observed in the markets among comparable securities; and proprietary pricing models such as yield measures calculated using factors such as cash flows, financial or collateral performance and other reference data (collectively referred to as “standard inputs”)
| |
Corporate bonds & notes; convertible securities
| Standard inputs and underlying equity of the issuer
| |
Bonds & notes of governments & government agencies
| Standard inputs and interest rate volatilities
| |
Mortgage-backed; asset-backed obligations | Standard inputs and cash flows, prepayment information, default rates, delinquency and loss assumptions, collateral characteristics, credit enhancements and specific deal information
| |
Municipal securities | Standard inputs and, for certain distressed securities, cash flows or liquidation values using a net present value calculation based on inputs that include, but are not limited to, financial statements and debt contracts
| |
When the series’ investment adviser deems it appropriate to do so (such as when vendor prices are unavailable or not deemed to be representative), fixed-income securities will be valued in good faith at the mean quoted bid and ask prices that are reasonably and timely available (or bid prices, if ask prices are not available) or at prices for securities of comparable maturity, quality and type.
| 136 | American Funds Insurance Series |
Securities with both fixed-income and equity characteristics, or equity securities traded principally among fixed-income dealers, are generally valued in the manner described for either equity or fixed-income securities, depending on which method is deemed most appropriate by the series’ investment adviser. The Government Cash Management Fund held by the managed risk funds is managed to maintain a $1.00 net asset value per share. The net asset value of each share class of each managed risk fund is calculated based on the reported net asset values of the underlying funds in which each fund invests.
Exchange-traded futures are generally valued at the official settlement price of, or the last reported sale price on, the exchange or market on which such instruments are traded, as of the close of business on the day the futures are being valued or, lacking any sales, at the last available bid price. Prices for each future are taken from the exchange or market on which the security trades. Forward currency contracts are valued at the mean of representative quoted bid and ask prices, generally based on prices supplied by one or more pricing vendors. Interest rate swaps and credit default swaps are generally valued by pricing vendors based on market inputs that include the index and term of index, reset frequency, payer/receiver, currency and pay frequency.
Securities and other assets for which representative market quotations are not readily available or are considered unreliable by the series’ investment adviser are fair valued as determined in good faith under fair value guidelines adopted by authority of the series’ board of trustees as further described. The investment adviser follows fair valuation guidelines, consistent with U.S. Securities and Exchange Commission rules and guidance, to consider relevant principles and factors when making fair value determinations. The investment adviser considers relevant indications of value that are reasonably and timely available to it in determining the fair value to be assigned to a particular security, such as the type and cost of the security; contractual or legal restrictions on resale of the security; relevant financial or business developments of the issuer; actively traded similar or related securities; conversion or exchange rights on the security; related corporate actions; significant events occurring after the close of trading in the security; and changes in overall market conditions. In addition, the closing prices of equity securities and futures that trade in markets outside U.S. time zones may be adjusted to reflect significant events that occur after the close of local trading but before the net asset value of each share class of each fund is determined. Fair valuations and valuations of investments and futures that are not actively trading involve judgment and may differ materially from valuations that would have been used had greater market activity occurred.
Processes and structure – The series’ board of trustees has delegated authority to the series’ investment adviser to make fair value determinations, subject to board oversight. The investment adviser has established a Joint Fair Valuation Committee (the “Fair Valuation Committee”) to administer, implement and oversee the fair valuation process, and to make fair value decisions. The Fair Valuation Committee regularly reviews its own fair value decisions, as well as decisions made under its standing instructions to the investment adviser’s valuation teams. The Fair Valuation Committee reviews changes in fair value measurements from period to period and may, as deemed appropriate, update the fair valuation guidelines to better reflect the results of back testing and address new or evolving issues. The Fair Valuation Committee reports any changes to the fair valuation guidelines to the board of trustees with supplemental information to support the changes. The series’ board and audit committee also regularly review reports that describe fair value determinations and methods.
The series’ investment adviser has also established a Fixed-Income Pricing Review Group to administer and oversee the fixed-income valuation process, including the use of fixed-income pricing vendors. This group regularly reviews pricing vendor information and market data. Pricing decisions, processes and controls over security valuation are also subject to additional internal reviews, including an annual control self-evaluation program facilitated by the investment adviser’s compliance group.
Classifications – The series’ investment adviser classifies the funds’ assets and liabilities into three levels based on the inputs used to value the assets or liabilities. Level 1 values are based on quoted prices in active markets for identical securities. Level 2 values are based on significant observable market inputs, such as quoted prices for similar securities and quoted prices in inactive markets. Certain securities trading outside the U.S. may transfer between Level 1 and Level 2 due to valuation adjustments resulting from significant market movements following the close of local trading. Level 3 values are based on significant unobservable inputs that reflect the investment adviser’s determination of assumptions that market participants might reasonably use in valuing the securities.
| American Funds Insurance Series | 137 |
The valuation levels are not necessarily an indication of the risk or liquidity associated with the underlying investment. For example, U.S. government securities are reflected as Level 2 because the inputs used to determine fair value may not always be quoted prices in an active market. The following tables present the funds’ valuation levels as of June 30, 2017 (dollars in thousands):
Global Growth Fund
| Investment securities | ||||||||||||||||
|
| |||||||||||||||
Level 1*
| Level 2
| Level 3
| Total
| |||||||||||||
| ||||||||||||||||
Assets: | ||||||||||||||||
Common stocks: | ||||||||||||||||
Information technology | $1,741,170 | $ – | $– | $1,741,170 | ||||||||||||
Consumer discretionary | 1,079,024 | 32,599 | – | 1,111,623 | ||||||||||||
Health care | 813,379 | – | – | 813,379 | ||||||||||||
Financials | 569,702 | – | – | 569,702 | ||||||||||||
Consumer staples | 444,881 | – | – | 444,881 | ||||||||||||
Industrials | 359,346 | – | – | 359,346 | ||||||||||||
Energy | 144,098 | – | – | 144,098 | ||||||||||||
Materials | 111,407 | 8,898 | – | 120,305 | ||||||||||||
Telecommunication services | 85,633 | – | – | 85,633 | ||||||||||||
Miscellaneous | 291,977 | – | – | 291,977 | ||||||||||||
Bonds, notes & other debt instruments | – | 1,999 | – | 1,999 | ||||||||||||
Short-term securities | – | 177,358 | – | 177,358 | ||||||||||||
| ||||||||||||||||
Total
|
| $5,640,617
|
|
| $220,854
|
|
| $–
|
|
| $5,861,471
|
| ||||
| ||||||||||||||||
| Other investments† | ||||||||||||||||
|
| |||||||||||||||
Level 1
| Level 2
| Level 3
| Total
| |||||||||||||
| ||||||||||||||||
Assets: | ||||||||||||||||
Unrealized appreciation on open forward currency contracts | $– | $69 | $– | $69 | ||||||||||||
| ||||||||||||||||
*Securities with a value of $2,454,098,000, which represented 41.95% of the net assets of the fund, transferred from Level 2 to Level 1 since the prior fiscal year-end, primarily due to a lack of significant market movements following the close of local trading. |
| |||||||||||||||
| †Forward currency contracts are not included in the investment portfolio. | ||||||||||||||||
Global Small Capitalization Fund
|
| |||||||||||||||
| Investment securities | ||||||||||||||||
|
| |||||||||||||||
Level 1*
| Level 2
| Level 3
| Total
| |||||||||||||
| ||||||||||||||||
Assets: | ||||||||||||||||
Common stocks: | ||||||||||||||||
Consumer discretionary | $ 855,368 | $14,839 | $ – | $ 870,207 | ||||||||||||
Information technology | 668,640 | – | – | 668,640 | ||||||||||||
Health care | 644,673 | 2,626 | – | 647,299 | ||||||||||||
Industrials | 385,813 | 18,288 | – | 404,101 | ||||||||||||
Financials | 338,845 | – | – | 338,845 | ||||||||||||
Consumer staples | 147,184 | – | – | 147,184 | ||||||||||||
Materials | 139,439 | – | – | 139,439 | ||||||||||||
Real estate | 110,782 | – | – | 110,782 | ||||||||||||
Energy | 93,339 | 1,355 | 9,848 | 104,542 | ||||||||||||
Utilities | 87,230 | – | – | 87,230 | ||||||||||||
Telecommunication services | 10,878 | 6,161 | – | 17,039 | ||||||||||||
Miscellaneous | 191,853 | 1,563 | 1,860 | 195,276 | ||||||||||||
Rights & warrants | 651 | – | – | 651 | ||||||||||||
Bonds, notes & other debt instruments | – | 28,120 | – | 28,120 | ||||||||||||
Short-term securities | – | 277,103 | – | 277,103 | ||||||||||||
| ||||||||||||||||
Total
|
| $3,674,695
|
|
| $350,055
|
|
| $11,708
|
|
| $4,036,458
|
| ||||
| ||||||||||||||||
| 138 | American Funds Insurance Series |
| Other investments† | ||||||||||||||||
| Level 1 | Level 2 | Level 3 | Total | |||||||||||||
Assets: | ||||||||||||||||
Unrealized appreciation on open forward currency contracts | $ | – | $ | 275 | $ | – | $ | 275 | ||||||||
Liabilities: | ||||||||||||||||
Unrealized depreciation on open forward currency contracts | – | (561 | ) | – | (561 | ) | ||||||||||
| ||||||||||||||||
Total | $ | – | $ | (286 | ) | $ | – | $ | (286 | ) | ||||||
| ||||||||||||||||
*Securities with a value of $1,441,058,000, which represented 35.72% of the net assets of the fund, transferred from Level 2 to Level 1 since the prior fiscal year-end, primarily due to a lack of significant market movements following the close of local trading.
†Forward currency contracts are not included in the investment portfolio.
Growth Fund
| Investment securities | ||||||||||||||||
| Level 1* | Level 2 | Level 3 | Total | |||||||||||||
Assets: | ||||||||||||||||
Common stocks: | ||||||||||||||||
Information technology | $ | 7,139,327 | $ | – | $ | – | $ | 7,139,327 | ||||||||
Consumer discretionary | 4,901,933 | – | – | 4,901,933 | ||||||||||||
Health care | 3,442,868 | – | – | 3,442,868 | ||||||||||||
Energy | 1,758,064 | – | – | 1,758,064 | ||||||||||||
Financials | 1,732,006 | – | – | 1,732,006 | ||||||||||||
Industrials | 1,446,255 | – | – | 1,446,255 | ||||||||||||
Consumer staples | 547,711 | – | – | 547,711 | ||||||||||||
Telecommunication services | 219,461 | – | – | 219,461 | ||||||||||||
Other | 324,938 | – | – | 324,938 | ||||||||||||
Miscellaneous | 402,317 | – | – | 402,317 | ||||||||||||
Convertible stocks | – | – | 12,276 | 12,276 | ||||||||||||
Short-term securities | – | 1,700,558 | – | 1,700,558 | ||||||||||||
| ||||||||||||||||
Total | $ | 21,914,880 | $ | 1,700,558 | $ | 12,276 | $ | 23,627,714 | ||||||||
| ||||||||||||||||
*Securities with a value of $1,434,478,000, which represented 6.08% of the net assets of the fund, transferred from Level 2 to Level 1 since the prior fiscal year-end, primarily due to a lack of significant market movements following the close of local trading.
International Fund
| Investment securities | ||||||||||||||||
| Level 1* | Level 2 | Level 3 | Total | |||||||||||||
Assets: | ||||||||||||||||
Common stocks: | ||||||||||||||||
Financials | $ | 1,198,172 | $ | 261,259 | $ | – | $ | 1,459,431 | ||||||||
Information technology | 1,194,960 | – | – | 1,194,960 | ||||||||||||
Consumer discretionary | 1,160,780 | – | – | 1,160,780 | ||||||||||||
Health care | 841,549 | – | – | 841,549 | ||||||||||||
Consumer staples | 727,159 | – | – | 727,159 | ||||||||||||
Industrials | 709,289 | – | – | 709,289 | ||||||||||||
Utilities | 514,170 | – | – | 514,170 | ||||||||||||
Materials | 464,340 | – | – | 464,340 | ||||||||||||
Energy | 333,663 | – | – | 333,663 | ||||||||||||
Telecommunication services | 265,173 | – | – | 265,173 | ||||||||||||
Real estate | 169,869 | – | – | 169,869 | ||||||||||||
Miscellaneous | 86,831 | – | – | 86,831 | ||||||||||||
Bonds, notes & other debt instruments | – | 65,688 | – | 65,688 | ||||||||||||
Short-term securities | – | 795,799 | – | 795,799 | ||||||||||||
| ||||||||||||||||
Total | $ | 7,665,955 | $ | 1,122,746 | $ | – | $ | 8,788,701 | ||||||||
| ||||||||||||||||
See next page for footnote.
| American Funds Insurance Series | 139 |
| Other investments† | ||||||||||||||||
| Level 1 | Level 2 | Level 3 | Total | |||||||||||||
Assets: | ||||||||||||||||
Unrealized appreciation on open forward currency contracts | $ | – | $ | 59 | $ | – | $ | 59 | ||||||||
| ||||||||||||||||
*Securities with a value of $6,567,118,000, which represented 74.80% of the net assets of the fund, transferred from Level 2 to Level 1 since the prior fiscal year-end, primarily due to a lack of significant market movements following the close of local trading.
†Forward currency contracts are not included in the investment portfolio.
New World Fund
| Investment securities | ||||||||||||||||
| Level 1* | Level 2 | Level 3 | Total | |||||||||||||
Assets: | ||||||||||||||||
Common stocks: | ||||||||||||||||
Information technology | $ | 758,557 | $ | – | $ | – | $ | 758,557 | ||||||||
Consumer discretionary | 305,448 | 40,941 | – | 346,389 | ||||||||||||
Financials | 282,536 | 53,654 | – | 336,190 | ||||||||||||
Consumer staples | 270,766 | – | – | 270,766 | ||||||||||||
Energy | 257,425 | 12,591 | – | 270,016 | ||||||||||||
Industrials | 197,477 | – | – | 197,477 | ||||||||||||
Health care | 156,011 | – | – | 156,011 | ||||||||||||
Materials | 151,643 | 2,085 | – | 153,728 | ||||||||||||
Utilities | 85,757 | – | – | 85,757 | ||||||||||||
Telecommunication services | 61,130 | – | – | 61,130 | ||||||||||||
Real estate | 36,777 | – | 27 | 36,804 | ||||||||||||
Miscellaneous | 133,078 | – | – | 133,078 | ||||||||||||
Rights & warrants | – | 48,361 | – | 48,361 | ||||||||||||
Bonds, notes & other debt instruments | – | 100,959 | – | 100,959 | ||||||||||||
Short-term securities | – | 175,347 | – | 175,347 | ||||||||||||
| ||||||||||||||||
Total | $ | 2,696,605 | $ | 433,938 | $ | 27 | $ | 3,130,570 | ||||||||
| ||||||||||||||||
| Other investments† | ||||||||||||||||
| Level 1 | Level 2 | Level 3 | Total | |||||||||||||
Assets: | ||||||||||||||||
Unrealized appreciation on open forward currency contracts | $ | – | $ | 183 | $ | – | $ | 183 | ||||||||
Liabilities: | ||||||||||||||||
Unrealized depreciation on open forward currency contracts | – | (39 | ) | – | (39 | ) | ||||||||||
| ||||||||||||||||
Total | $ | – | $ | 144 | $ | – | $ | 144 | ||||||||
| ||||||||||||||||
*Securities with a value of $841,725,000, which represented 26.71% of the net assets of the fund, transferred from Level 2 to Level 1 since the prior fiscal year-end, primarily due to a lack of significant market movements following the close of local trading.
†Forward currency contracts are not included in the investment portfolio.
| 140 | American Funds Insurance Series |
Blue Chip Income and Growth Fund
| Investment securities | ||||||||||||||||
| Level 1 | Level 2 | Level 3 | Total | |||||||||||||
Assets: | ||||||||||||||||
Common stocks: | ||||||||||||||||
Health care | $ | 1,481,553 | $ | – | $ | – | $ | 1,481,553 | ||||||||
Financials | 1,287,642 | – | – | 1,287,642 | ||||||||||||
Information technology | 1,210,398 | – | – | 1,210,398 | ||||||||||||
Consumer staples | 1,158,178 | – | – | 1,158,178 | ||||||||||||
Industrials | 866,684 | – | – | 866,684 | ||||||||||||
Telecommunication services | 669,531 | – | – | 669,531 | ||||||||||||
Energy | 517,820 | – | – | 517,820 | ||||||||||||
Consumer discretionary | 427,223 | – | – | 427,223 | ||||||||||||
Materials | 330,876 | – | – | 330,876 | ||||||||||||
Utilities | 147,983 | – | – | 147,983 | ||||||||||||
Real estate | 40,072 | – | – | 40,072 | ||||||||||||
Miscellaneous | 435,631 | – | – | 435,631 | ||||||||||||
Short-term securities | – | 287,932 | – | 287,932 | ||||||||||||
| ||||||||||||||||
Total | $ | 8,573,591 | $ | 287,932 | $ | – | $ | 8,861,523 | ||||||||
| ||||||||||||||||
Global Growth and Income Fund
| Investment securities | ||||||||||||||||
| Level 1* | Level 2 | Level 3 | Total | |||||||||||||
Assets: | ||||||||||||||||
Common stocks: | ||||||||||||||||
Information technology | $ | 429,421 | $ | – | $ | – | $ | 429,421 | ||||||||
Financials | 208,557 | – | – | 208,557 | ||||||||||||
Industrials | 192,035 | – | – | 192,035 | ||||||||||||
Consumer staples | 189,662 | – | – | 189,662 | ||||||||||||
Consumer discretionary | 170,603 | – | – | 170,603 | ||||||||||||
Energy | 136,859 | – | – | 136,859 | ||||||||||||
Health care | 135,246 | – | – | 135,246 | ||||||||||||
Materials | 81,888 | – | – | 81,888 | ||||||||||||
Real estate | 69,904 | – | – | 69,904 | ||||||||||||
Utilities | 67,797 | – | – | 67,797 | ||||||||||||
Telecommunication services | 32,609 | – | – | 32,609 | ||||||||||||
Miscellaneous | 69,554 | 6,491 | – | 76,045 | ||||||||||||
Rights & warrants | 178 | – | – | 178 | ||||||||||||
Convertible bonds | – | 6,821 | – | 6,821 | ||||||||||||
Bonds, notes & other debt instruments | – | 38,353 | – | 38,353 | ||||||||||||
Short-term securities | – | 69,339 | – | 69,339 | ||||||||||||
| ||||||||||||||||
Total | $ | 1,784,313 | $ | 121,004 | $ | – | $ | 1,905,317 | ||||||||
| ||||||||||||||||
*Securities with a value of $741,282,000, which represented 38.31% of the net assets of the fund, transferred from Level 2 to Level 1 since the prior fiscal year-end, primarily due to a lack of significant market movements following the close of local trading.
| American Funds Insurance Series | 141 |
Growth-Income Fund
| Investment securities | ||||||||||||||||
| Level 1* | Level 2 | Level 3 | Total | |||||||||||||
Assets: | ||||||||||||||||
Common stocks: | ||||||||||||||||
Information technology | $ | 4,498,198 | $ | – | $ | – | $ | 4,498,198 | ||||||||
Consumer discretionary | 4,231,362 | – | – | 4,231,362 | ||||||||||||
Health care | 4,117,707 | – | – | 4,117,707 | ||||||||||||
Financials | 3,202,666 | – | – | 3,202,666 | ||||||||||||
Industrials | 2,292,789 | – | – | 2,292,789 | ||||||||||||
Consumer staples | 1,956,533 | 97,914 | – | 2,054,447 | ||||||||||||
Energy | 1,678,819 | – | – | 1,678,819 | ||||||||||||
Materials | 1,322,517 | – | – | 1,322,517 | ||||||||||||
Real estate | 517,877 | – | – | 517,877 | ||||||||||||
Telecommunication services | 506,765 | – | – | 506,765 | ||||||||||||
Utilities | 239,796 | – | – | 239,796 | ||||||||||||
Mutual funds | 132,822 | – | – | 132,822 | ||||||||||||
Miscellaneous | 1,320,207 | 38,611 | – | 1,358,818 | ||||||||||||
Convertible stocks | – | 5,722 | – | 5,722 | ||||||||||||
Convertible bonds | – | 93,133 | – | 93,133 | ||||||||||||
Bonds, notes & other debt instruments | – | 56,801 | – | 56,801 | ||||||||||||
Short-term securities | – | 1,935,493 | – | 1,935,493 | ||||||||||||
| ||||||||||||||||
Total | $ | 26,018,058 | $ | 2,227,674 | $ | – | $ | 28,245,732 | ||||||||
| ||||||||||||||||
*Securities with a value of $1,532,209,000, which represented 5.42% of the net assets of the fund, transferred from Level 2 to Level 1 since the prior fiscal year-end, primarily due to a lack of significant market movements following the close of local trading.
International Growth and Income Fund
| Investment securities | ||||||||||||||||
| Level 1* | Level 2 | Level 3 | Total | |||||||||||||
Assets: | ||||||||||||||||
Common stocks: | ||||||||||||||||
Financials | $ | 195,509 | $ | 53,170 | $ | – | $ | 248,679 | ||||||||
Consumer staples | 141,525 | – | 2,092 | 143,617 | ||||||||||||
Industrials | 143,296 | – | – | 143,296 | ||||||||||||
Consumer discretionary | 101,120 | 9,759 | – | 110,879 | ||||||||||||
Utilities | 106,169 | – | – | 106,169 | ||||||||||||
Information technology | 103,140 | – | – | 103,140 | ||||||||||||
Health care | 83,606 | – | – | 83,606 | ||||||||||||
Energy | 63,883 | – | – | 63,883 | ||||||||||||
Real estate | 60,842 | – | – | 60,842 | ||||||||||||
Telecommunication services | 37,867 | – | – | 37,867 | ||||||||||||
Materials | 37,046 | – | – | 37,046 | ||||||||||||
Miscellaneous | 38,208 | – | – | 38,208 | ||||||||||||
Bonds, notes & other debt instruments | – | 40,849 | – | 40,849 | ||||||||||||
Short-term securities | – | 167,548 | – | 167,548 | ||||||||||||
| ||||||||||||||||
Total | $ | 1,112,211 | $ | 271,326 | $ | 2,092 | $ | 1,385,629 | ||||||||
| ||||||||||||||||
*Securities with a value of $781,320,000, which represented 56.68% of the net assets of the fund, transferred from Level 2 to Level 1 since the prior fiscal year-end, primarily due to a lack of significant market movements following the close of local trading.
| 142 | American Funds Insurance Series |
Capital Income Builder
| Investment securities | ||||||||||||||||
| Level 1* | Level 2 | Level 3 | Total | |||||||||||||
Assets: | ||||||||||||||||
Common stocks: | ||||||||||||||||
Financials | $ | 70,538 | $ | 1,040 | $ | – | $ | 71,578 | ||||||||
Consumer staples | 63,534 | – | – | 63,534 | ||||||||||||
Telecommunication services | 39,630 | – | – | 39,630 | ||||||||||||
Energy | 37,101 | – | – | 37,101 | ||||||||||||
Health care | 30,239 | – | – | 30,239 | ||||||||||||
Information technology | 24,757 | – | – | 24,757 | ||||||||||||
Real estate | 23,484 | – | – | 23,484 | ||||||||||||
Industrials | 20,433 | – | – | 20,433 | ||||||||||||
Utilities | 19,922 | – | – | 19,922 | ||||||||||||
Consumer discretionary | 18,069 | – | – | 18,069 | ||||||||||||
Materials | 6,178 | – | – | 6,178 | ||||||||||||
Miscellaneous | 10,684 | – | – | 10,684 | ||||||||||||
Convertible stocks | 6,134 | – | – | 6,134 | ||||||||||||
Bonds, notes & other debt instruments: | ||||||||||||||||
Mortgage-backed obligations | – | 37,554 | – | 37,554 | ||||||||||||
U.S. Treasury bonds & notes | – | 37,460 | – | 37,460 | ||||||||||||
Corporate bonds & notes | – | 22,927 | – | 22,927 | ||||||||||||
Asset-backed obligations | – | 5,117 | – | 5,117 | ||||||||||||
Short-term securities | – | 25,394 | – | 25,394 | ||||||||||||
| ||||||||||||||||
Total | $ | 370,703 | $ | 129,492 | $ | – | $ | 500,195 | ||||||||
| ||||||||||||||||
| Other investments† | ||||||||||||||||
| Level 1 | Level 2 | Level 3 | Total | |||||||||||||
Liabilities: | ||||||||||||||||
Unrealized depreciation on open forward currency contracts | $– | $(5) | $– | $(5) | ||||||||||||
*Securities with a value of $152,994,000, which represented 30.50% of the net assets of the fund, transferred from Level 2 to Level 1 since the prior fiscal year-end, primarily due to a lack of significant market movements following the close of local trading.
†Forward currency contracts are not included in the investment portfolio.
Asset Allocation Fund
| Investment securities | ||||||||||||||||
| Level 1* | Level 2 | Level 3 | Total | |||||||||||||
Assets: | ||||||||||||||||
Common stocks: | ||||||||||||||||
Information technology | $ | 4,321,483 | $ | – | $ | 2,628 | $ | 4,324,111 | ||||||||
Health care | 2,012,092 | – | 619 | 2,012,711 | ||||||||||||
Consumer discretionary | 1,881,995 | – | – | 1,881,995 | ||||||||||||
Financials | 1,808,282 | 7,645 | – | 1,815,927 | ||||||||||||
Consumer staples | 1,224,153 | – | – | 1,224,153 | ||||||||||||
Energy | 1,059,504 | – | – | 1,059,504 | ||||||||||||
Industrials | 832,587 | 1,766 | 1 | 834,354 | ||||||||||||
Materials | 800,596 | 1,602 | – | 802,198 | ||||||||||||
Real estate | 279,872 | – | – | 279,872 | ||||||||||||
Telecommunication services | 230,118 | – | – | 230,118 | ||||||||||||
Utilities | 76,630 | – | – | 76,630 | ||||||||||||
Miscellaneous | 335,415 | – | – | 335,415 | ||||||||||||
Convertible stocks | – | 4,426 | 5,350 | 9,776 | ||||||||||||
Bonds, notes & other debt instruments: | ||||||||||||||||
U.S. Treasury bonds & notes | – | 2,967,349 | – | 2,967,349 | ||||||||||||
Corporate bonds & notes | – | 2,278,161 | 13,147 | 2,291,308 | ||||||||||||
Mortgage-backed obligations | – | 1,341,845 | – | 1,341,845 | ||||||||||||
Federal agency bonds & notes | – | 51,361 | – | 51,361 | ||||||||||||
Other | – | 234,779 | – | 234,779 | ||||||||||||
Short-term securities | – | 2,344,983 | – | 2,344,983 | ||||||||||||
| ||||||||||||||||
Total | $ | 14,862,727 | $ | 9,233,917 | $ | 21,745 | $ | 24,118,389 | ||||||||
| ||||||||||||||||
| American Funds Insurance Series | 143 |
| Other investments† | ||||||||||||||||
| Level 1 | Level 2 | Level 3 | Total | |||||||||||||
Assets: | ||||||||||||||||
Unrealized appreciation on futures contracts | $ | 345 | $ | – | $ | – | $ | 345 | ||||||||
Unrealized appreciation on interest rate swaps | – | 180 | – | 180 | ||||||||||||
Liabilities: | ||||||||||||||||
Unrealized depreciation on interest rate swaps | – | (6,710 | ) | – | (6,710 | ) | ||||||||||
| ||||||||||||||||
Total | $ | 345 | $ | (6,530 | ) | $ | – | $ | (6,185 | ) | ||||||
| ||||||||||||||||
*Securities with a value of $591,467,000, which represented 2.50% of the net assets of the fund, transferred from Level 2 to Level 1 since the prior fiscal year-end, primarily due to a lack of significant market movements following the close of local trading.
†Futures contracts and interest rate swaps are not included in the investment portfolio.
Global Balanced Fund
| Investment securities | ||||||||||||||||
| Level 1* | Level 2 | Level 3 | Total | |||||||||||||
Assets: | ||||||||||||||||
Common stocks: | ||||||||||||||||
Information technology | $ | 36,294 | $ | – | $ | – | $ | 36,294 | ||||||||
Consumer staples | 22,927 | – | – | 22,927 | ||||||||||||
Industrials | 21,446 | – | – | 21,446 | ||||||||||||
Financials | 17,770 | 1,468 | – | 19,238 | ||||||||||||
Health care | 16,612 | – | – | 16,612 | ||||||||||||
Consumer discretionary | 13,774 | – | – | 13,774 | ||||||||||||
Materials | 12,976 | 772 | – | 13,748 | ||||||||||||
Energy | 12,648 | – | – | 12,648 | ||||||||||||
Utilities | 6,278 | – | – | 6,278 | ||||||||||||
Real estate | 3,430 | – | – | 3,430 | ||||||||||||
Telecommunication services | 1,804 | – | – | 1,804 | ||||||||||||
Miscellaneous | 13,687 | – | – | 13,687 | ||||||||||||
Bonds, notes & other debt instruments: | ||||||||||||||||
Bonds & notes of governments & government agencies outside the U.S. | – | 42,096 | – | 42,096 | ||||||||||||
U.S. Treasury bonds & notes | – | 24,713 | – | 24,713 | ||||||||||||
Corporate bonds & notes | – | 19,854 | – | 19,854 | ||||||||||||
Mortgage-backed obligations | – | 3,413 | – | 3,413 | ||||||||||||
Asset-backed obligations | – | 200 | – | 200 | ||||||||||||
Short-term securities | – | 14,994 | – | 14,994 | ||||||||||||
| ||||||||||||||||
Total | $ | 179,646 | $ | 107,510 | $ | – | $ | 287,156 | ||||||||
| ||||||||||||||||
| Other investments† | ||||||||||||||||
| Level 1 | Level 2 | Level 3 | Total | |||||||||||||
Assets: | �� | |||||||||||||||
Unrealized appreciation on open forward currency contracts | $ | – | $ | 167 | $ | – | $ | 167 | ||||||||
Liabilities: | ||||||||||||||||
Unrealized depreciation on open forward currency contracts | – | (119 | ) | – | (119 | ) | ||||||||||
| ||||||||||||||||
Total | $ | – | $ | 48 | $ | – | $ | 48 | ||||||||
| ||||||||||||||||
*Securities with a value of $71,519,000, which represented 24.70% of the net assets of the fund, transferred from Level 2 to Level 1 since the prior fiscal year-end, primarily due to a lack of significant market movements following the close of local trading.
†Forward currency contracts are not included in the investment portfolio.
| 144 | American Funds Insurance Series |
Bond Fund
| Investment securities | ||||||||||||||||
| Level 1 | Level 2 | Level 3 | Total | |||||||||||||
Assets: | ||||||||||||||||
Bonds, notes & other debt instruments: | ||||||||||||||||
Corporate bonds & notes | $ | – | $ | 3,795,603 | $ 457 | $ | 3,796,060 | |||||||||
Mortgage-backed obligations | – | 2,860,076 | – | 2,860,076 | ||||||||||||
U.S. Treasury bonds & notes | – | 2,228,457 | – | 2,228,457 | ||||||||||||
Bonds & notes of governments & government agencies outside the U.S. | – | 699,205 | – | 699,205 | ||||||||||||
Asset-backed obligations | – | 376,981 | – | 376,981 | ||||||||||||
Municipals | – | 186,794 | – | 186,794 | ||||||||||||
Federal agency bonds & notes | – | 12,135 | – | 12,135 | ||||||||||||
Common stocks | 1,049 | – | 1,095 | 2,144 | ||||||||||||
Rights & warrants | – | – | 71 | 71 | ||||||||||||
Short-term securities | – | 2,317,962 | – | 2,317,962 | ||||||||||||
| ||||||||||||||||
Total | $ | 1,049 | $ | 12,477,213 | $1,623 | $ | 12,479,885 | |||||||||
| ||||||||||||||||
| Other investments* | ||||||||||||||||
| Level 1 | Level 2 | Level 3 | Total | |||||||||||||
Assets: | ||||||||||||||||
Unrealized appreciation on futures contracts | $ | 939 | $ | – | $– | $ | 939 | |||||||||
Unrealized appreciation on open forward currency contracts | – | 1,952 | – | 1,952 | ||||||||||||
Unrealized appreciation on interest rate swaps | – | 15,160 | – | 15,160 | ||||||||||||
Liabilities: | ||||||||||||||||
Unrealized depreciation on futures contracts | (4,547 | ) | – | – | (4,547 | ) | ||||||||||
Unrealized depreciation on open forward currency contracts | – | (4,449 | ) | – | (4,449 | ) | ||||||||||
Unrealized depreciation on interest rate swaps | – | (7,336 | ) | – | (7,336 | ) | ||||||||||
| ||||||||||||||||
Total | $ | (3,608 | ) | $ | 5,327 | $– | $ | 1,719 | ||||||||
| ||||||||||||||||
*Futures contracts, forward currency contracts and interest rate swaps are not included in the investment portfolio.
Global Bond Fund
| Investment securities | ||||||||||||||||
| Level 1 | Level 2 | Level 3 | Total | |||||||||||||
Assets: | ||||||||||||||||
Bonds, notes & other debt instruments: | ||||||||||||||||
Euros | $ | – | $ | 309,028 | $ | – | $ | 309,028 | ||||||||
Japanese yen | – | 218,758 | – | 218,758 | ||||||||||||
Polish zloty | – | 107,838 | – | 107,838 | ||||||||||||
Mexican pesos | – | 82,146 | – | 82,146 | ||||||||||||
Indian rupees | – | 58,380 | – | 58,380 | ||||||||||||
Malaysian ringgits | – | 50,426 | – | 50,426 | ||||||||||||
British pounds | – | 42,138 | – | 42,138 | ||||||||||||
Norwegian kroner | – | 40,554 | – | 40,554 | ||||||||||||
Australian dollars | – | 40,378 | – | 40,378 | ||||||||||||
Colombian pesos | – | 29,310 | – | 29,310 | ||||||||||||
Danish kroner | – | 25,593 | – | 25,593 | ||||||||||||
Turkish lira | – | 24,431 | – | 24,431 | ||||||||||||
Israeli shekels | – | 19,754 | – | 19,754 | ||||||||||||
Chilean pesos | – | 19,736 | – | 19,736 | ||||||||||||
Canadian dollars | – | 14,534 | – | 14,534 | ||||||||||||
Hungarian forints | – | 12,713 | – | 12,713 | ||||||||||||
U.S. dollars | – | 963,589 | 195 | 963,784 | ||||||||||||
Other | – | 39,430 | – | 39,430 | ||||||||||||
Convertible stocks | – | 143 | 909 | 1,052 | ||||||||||||
Common stocks | 104 | 494 | 402 | 1,000 | ||||||||||||
Short-term securities | – | 309,708 | – | 309,708 | ||||||||||||
| ||||||||||||||||
Total | $ | 104 | $ | 2,409,081 | $ | 1,506 | $ | 2,410,691 | ||||||||
| ||||||||||||||||
| American Funds Insurance Series | 145 |
| Other investments* | ||||||||||||||||
| Level 1 | Level 2 | Level 3 | Total | |||||||||||||
Assets: | ||||||||||||||||
Unrealized appreciation on futures contracts | $ | 216 | $ | – | $ | – | $ | 216 | ||||||||
Unrealized appreciation on open forward currency contracts | – | 4,096 | – | 4,096 | ||||||||||||
Unrealized appreciation on interest rate swaps | – | 1,706 | – | 1,706 | ||||||||||||
Liabilities: | ||||||||||||||||
Unrealized depreciation on futures contracts | (200 | ) | – | – | (200 | ) | ||||||||||
Unrealized depreciation on open forward currency contracts | – | (5,273 | ) | – | (5,273 | ) | ||||||||||
Unrealized depreciation on interest rate swaps | – | (923 | ) | – | (923 | ) | ||||||||||
| ||||||||||||||||
Total | $ | 16 | $ | (394 | ) | $ | – | $ | (378 | ) | ||||||
| ||||||||||||||||
*Futures contracts, forward currency contracts and interest rate swaps are not included in the investment portfolio.
High-Income Bond Fund
| Investment securities | ||||||||||||||||
| Level 1 | Level 2 | Level 3 | Total | |||||||||||||
Assets: | ||||||||||||||||
Bonds, notes & other debt instruments: | ||||||||||||||||
Corporate bonds & notes | $ | – | $ | 1,440,254 | $ | 12,878 | $ | 1,453,132 | ||||||||
Other | – | 14,467 | – | 14,467 | ||||||||||||
Convertible bonds | – | 5,839 | – | 5,839 | ||||||||||||
Convertible stocks | 8,476 | 3,163 | 5,189 | 16,828 | ||||||||||||
Common stocks | 3,052 | 4,062 | 5,493 | 12,607 | ||||||||||||
Rights & warrants | – | – | 46 | 46 | ||||||||||||
Short-term securities | – | 62,090 | – | 62,090 | ||||||||||||
| ||||||||||||||||
Total | $ | 11,528 | $ | 1,529,875 | $ | 23,606 | $ | 1,565,009 | ||||||||
| ||||||||||||||||
| Other investments* | ||||||||||||||||
| Level 1 | Level 2 | Level 3 | Total | |||||||||||||
Assets: | ||||||||||||||||
Unrealized appreciation on interest rate swaps | $ | – | $ | 267 | $ | – | $ | 267 | ||||||||
Unrealized appreciation on credit default swaps | – | 149 | – | 149 | ||||||||||||
Liabilities: | ||||||||||||||||
Unrealized depreciation on interest rate swaps | – | (21 | ) | – | (21 | ) | ||||||||||
| ||||||||||||||||
Total | $ | – | $ | 395 | $ | – | $ | 395 | ||||||||
| ||||||||||||||||
*Interest rate swaps and credit default swaps are not included in the investment portfolio.
The following table reconciles the valuation of the fund’s Level 3 investment securities and related transactions for the six months ended June 30, 2017 (dollars in thousands):
| Beginning value at 1/1/2017 | Transfers into Level 32 | Purchases | Sales | Net realized gain3 | Unrealized appreciation3 | Transfers out of Level 32 | Ending value at 6/30/2017 | |||||||||||||||||||||||||
Investment securities | $ | 22,631 | $ | 47 | $ | 258 | $ | (16 | ) | $ | – | $ | 686 | $ | – | $ | 23,606 | |||||||||||||||
Net unrealized appreciation during the period on Level 3 investment securities held at June 30, 2017 |
| $ | 686 | |||||||||||||||||||||||||||||
2Transfers into or out of Level 3 are based on the beginning market value of the quarter in which they occurred.
3Net realized gain and unrealized appreciation are included in the related amounts on investments in the statement of operations.
| 146 | American Funds Insurance Series |
Unobservable inputs – Valuation of the fund’s Level 3 securities is based on significant unobservable inputs that reflect the investment adviser’s determination of assumptions that market participants might reasonably use in valuing the securities. The following table provides additional information used by the fund’s investment adviser to fair value the fund’s Level 3 securities (dollars in thousands):
| Value at 6/30/2017 | Valuation techniques | Unobservable inputs | Range | Impact to valuation from an increase in input* | ||||||||||||
Corporate bonds & notes | $ | 12,878 | Yield to call price | Yield to call | 2.5% - 5.0% | Decrease | ||||||||||
| Yield analysis | Yield risk premium | 100 - 500 bps risk premium | Decrease | |||||||||||||
Convertible stocks | 5,189 | Accreted value (stated value increased by accrued dividends) | Payment-in-kind (PIK) dividend rate | N/A | Increase | |||||||||||
Common stocks | 5,493 | Estimated liquidation proceeds | Discount to reflect timing of receipt and amount of proceeds | 25% discount | Decrease | |||||||||||
| Enterprise valuation | EV/EBITDA multiple | 5.0x - 11.5x | Increase | |||||||||||||
| Arms-length transaction | Arms-length transaction | N/A | N/A | |||||||||||||
Rights & warrants | 46 | Net Present Value Model | Discount rate | 12% discount | Decrease | |||||||||||
| $ | 23,606 | |||||||||||||||
|
| |||||||||||||||
*This column represents the directional change in fair value of the Level 3 securities that would result in an increase from the corresponding input. A decrease to the unobservable input would have the opposite effect. Significant increases and decreases in these inputs in isolation could result in significantly higher or lower fair value measurements.
Key to abbreviations
EBITDA = Earnings before income taxes, depreciation and amortization
EV = Enterprise value
Mortgage Fund
| Investment securities | ||||||||||||||||
| Level 1 | Level 2 | Level 3 | Total | |||||||||||||
Assets: | ||||||||||||||||
Bonds, notes & other debt instruments: | ||||||||||||||||
Mortgage-backed obligations | $– | $ | 213,976 | $ | – | $ | 213,976 | |||||||||
Federal agency bonds & notes | – | 63,383 | – | 63,383 | ||||||||||||
U.S. Treasury bonds & notes | – | 41,075 | – | 41,075 | ||||||||||||
Asset-backed obligations | – | 18,343 | – | 18,343 | ||||||||||||
Corporate bonds & notes | – | – | 214 | 214 | ||||||||||||
Short-term securities | – | 62,690 | – | 62,690 | ||||||||||||
| ||||||||||||||||
Total | $– | $ | 399,467 | $ | 214 | $ | 399,681 | |||||||||
| ||||||||||||||||
| Other investments* | ||||||||||||||||
| Level 1 | Level 2 | Level 3 | Total | |||||||||||||
Assets: | ||||||||||||||||
Unrealized appreciation on futures contracts | $ | 84 | $ | – | $ | – | $ | 84 | ||||||||
Unrealized appreciation on interest rate swaps | – | 1,345 | – | 1,345 | ||||||||||||
Liabilities: | ||||||||||||||||
Unrealized depreciation on futures contracts | (631 | ) | – | – | (631 | ) | ||||||||||
Unrealized depreciation on interest rate swaps | – | (1,651 | ) | – | (1,651 | ) | ||||||||||
| ||||||||||||||||
Total | $ | (547 | ) | $ | (306 | ) | $ | – | $ | (853 | ) | |||||
| ||||||||||||||||
*Futures contracts and interest rate swaps are not included in the investment portfolio.
Ultra-Short Bond Fund
At June 30, 2017, all of the fund’s investment securities were classified as Level 2.
| American Funds Insurance Series | 147 |
U.S. Government/AAA-Rated Securities Fund
| Investment securities | ||||||||||||||||
| Level 1 | Level 2 | Level 3 | Total | |||||||||||||
Assets: | ||||||||||||||||
Bonds, notes & other debt instruments: | ||||||||||||||||
U.S. Treasury bonds & notes | $ | – | $ | 1,222,880 | $ | – | $ | 1,222,880 | ||||||||
Mortgage-backed obligations | – | 1,037,202 | – | 1,037,202 | ||||||||||||
Federal agency bonds & notes | – | 540,148 | – | 540,148 | ||||||||||||
Short-term securities | – | 204,545 | – | 204,545 | ||||||||||||
| ||||||||||||||||
Total | $ | – | $ | 3,004,775 | $ | – | $ | 3,004,775 | ||||||||
| ||||||||||||||||
| Other investments | ||||||||||||||||
| Level 1 | Level 2 | Level 3 | Total | |||||||||||||
Assets: | ||||||||||||||||
Unrealized appreciation on futures contracts | $ | 191 | $ | – | $ | – | $ | 191 | ||||||||
Unrealized appreciation on interest rate swaps | – | 16,711 | – | 16,711 | ||||||||||||
Liabilities: | ||||||||||||||||
Unrealized depreciation on futures contracts | (6,688 | ) | – | – | (6,688 | ) | ||||||||||
Unrealized depreciation on interest rate swaps | – | (24,340 | ) | – | (24,340 | ) | ||||||||||
| ||||||||||||||||
Total | $ | (6,497 | ) | $ | (7,629 | ) | $ | – | $ | (14,126 | ) | |||||
| ||||||||||||||||
*Futures contracts and interest rate swaps are not included in the investment portfolio.
Managed Risk Growth Fund
At June 30, 2017, all of the fund’s investments were classified as Level 1.
Managed Risk International Fund
At June 30, 2017, all of the fund’s investments were classified as Level 1.
Managed Risk Blue Chip Income and Growth Fund
At June 30, 2017, all of the fund’s investments were classified as Level 1.
Managed Risk Growth-Income Fund
At June 30, 2017, all of the fund’s investments were classified as Level 1.
Managed Risk Asset Allocation Fund
At June 30, 2017, all of the fund’s investments were classified as Level 1.
4. Risk factors
Investing in the funds may involve certain risks including, but not limited to, those described below.
Market conditions – The prices of, and the income generated by, the common stocks, bonds and other securities held by a fund may decline – sometimes rapidly or unpredictably – due to various factors, including events or conditions affecting the general economy or particular industries; overall market changes; local, regional or global political, social or economic instability; governmental or governmental agency responses to economic conditions; and currency exchange rate, interest rate and commodity price fluctuations.
Issuer risks – The prices of, and the income generated by, securities held by a fund may decline in response to various factors directly related to the issuers of such securities, including reduced demand for an issuer’s goods or services, poor management performance and strategic initiatives such as mergers, acquisitions or dispositions and the market response to any such initiatives.
Investing in growth-oriented stocks – Growth-oriented common stocks and other equity-type securities (such as preferred stocks, convertible preferred stocks and convertible bonds) may involve larger price swings and greater potential for loss than other types of investments. These risks may be even greater in the case of smaller capitalization stocks.
Investing in income-oriented stocks – Income provided by a fund may be reduced by changes in the dividend policies of, and the capital resources available for dividend payments at, the companies in which the fund invests.
| 148 | American Funds Insurance Series |
Investing in small companies — Investing in smaller companies may pose additional risks. For example, it is often more difficult to value or dispose of small company stocks and more difficult to obtain information about smaller companies than about larger companies. Furthermore, smaller companies often have limited product lines, operating histories, markets and/or financial resources, may be dependent on one or a few key persons for management, and can be more susceptible to losses. Moreover, the prices of their stocks may be more volatile than stocks of larger, more established companies.
Investing outside the U.S. — Securities of issuers domiciled outside the U.S., or with significant operations or revenues outside the U.S., may lose value because of adverse political, social, economic or market developments (including social instability, regional conflicts, terrorism and war) in the countries or regions in which the issuers operate or generate revenue. These securities may also lose value due to changes in foreign currency exchange rates against the U.S. dollar and/or currencies of other countries. Issuers of these securities may be more susceptible to actions of foreign governments, such as the imposition of price controls or punitive taxes, that could adversely impact the value of these securities. Securities markets in certain countries may be more volatile and/or less liquid than those in the U.S. Investments outside the U.S. may also be subject to different accounting practices and different regulatory, legal and reporting standards and practices, and may be more difficult to value, than those in the U.S. In addition, the value of investments outside the U.S. may be reduced by foreign taxes, including foreign withholding taxes on interest and dividends. Further, there may be increased risks of delayed settlement of securities purchased or sold by the fund. The risks of investing outside the U.S. may be heightened in connection with investments in emerging markets.
Investing in developing countries — Investing in countries with developing economies and/or markets may involve risks in addition to and greater than those generally associated with investing in developed countries. For instance, developing countries may have less developed legal and accounting systems than those in developed countries. The governments of these countries may be less stable and more likely to impose capital controls, nationalize a company or industry, place restrictions on foreign ownership and on withdrawing sale proceeds of securities from the country, and/or impose punitive taxes that could adversely affect the prices of securities. In addition, the economies of these countries may be dependent on relatively few industries that are more susceptible to local and global changes. Securities markets in these countries can also be relatively small and have substantially lower trading volumes. As a result, securities issued in these countries may be more volatile and less liquid, and may be more difficult to value, than securities issued in countries with more developed economies and/or markets. Less certainty with respect to security valuations may lead to additional challenges and risks in calculating the fund’s net asset value. Additionally, there may be increased settlement risks for transactions in local securities.
Investing in emerging markets — Investing in emerging markets may involve risks in addition to and greater than those generally associated with investing in the securities markets of developed countries. For instance, developing countries may have less developed legal and accounting systems than those in developed countries. The governments of these countries may be less stable and more likely to impose capital controls, nationalize a company or industry, place restrictions on foreign ownership and on withdrawing sale proceeds of securities from the country, and/or impose punitive taxes that could adversely affect the prices of securities. In addition, the economies of these countries may be dependent on relatively few industries that are more susceptible to local and global changes. Securities markets in these countries can also be relatively small and have substantially lower trading volumes. As a result, securities issued in these countries may be more volatile and less liquid, and may be more difficult to value, than securities issued in countries with more developed economies and/or markets. Less certainty with respect to security valuations may lead to additional challenges and risks in calculating a fund’s net asset value. Additionally, there may be increased settlement risks for transactions in local securities.
Investing in debt instruments — The prices of, and the income generated by, bonds and other debt securities held by a fund may be affected by changing interest rates and by changes in the effective maturities and credit ratings of these securities.
Rising interest rates will generally cause the prices of bonds and other debt securities to fall. Falling interest rates may cause an issuer to redeem, call or refinance a debt security before its stated maturity, which may result in a fund having to reinvest the proceeds in lower yielding securities. Longer maturity debt securities generally have greater sensitivity to changes in interest rates and may be subject to greater price fluctuations than shorter maturity debt securities.
Bonds and other debt securities are also subject to credit risk, which is the possibility that the credit strength of an issuer will weaken and/or an issuer of a debt security will fail to make timely payments of principal or interest and the security will go into default. Lower quality debt securities generally have higher rates of interest and may be subject to greater price fluctuations than higher quality debt securities. Credit risk is gauged, in part, by the credit ratings of the debt securities in which a fund invests. However, ratings are only the opinions of the rating agencies issuing them and are not guarantees as to credit quality or an evaluation of market risk. The funds’ investment adviser relies on its own credit analysts to research issuers and issues in seeking to mitigate various credit and default risks.
| American Funds Insurance Series | 149 |
Investing in lower rated debt instruments — Lower rated bonds and other lower rated debt securities generally have higher rates of interest and involve greater risk of default or price declines due to changes in the issuer’s creditworthiness than those of higher quality debt securities. The market prices of these securities may fluctuate more than the prices of higher quality debt securities and may decline significantly in periods of general economic difficulty. These risks may be increased with respect to investments in junk bonds.
Investing in derivatives — The use of derivatives involves a variety of risks, which may be different from, or greater than, the risks associated with investing in traditional cash securities, such as stocks and bonds. Changes in the value of a derivative may not correlate perfectly with, and may be more sensitive to market events than, the underlying asset, rate or index, and a derivative instrument may expose a fund to losses in excess of its initial investment. Derivatives may be difficult for a fund to buy or sell at an opportune time or price and may be difficult to terminate or otherwise offset. A fund’s use of derivatives may result in losses to the fund, and investing in derivatives may reduce a fund’s returns and increase a fund’s price volatility. A fund’s counterparty to a derivative transaction (including, if applicable, the fund’s clearing broker, the derivatives exchange or the clearinghouse) may be unable or unwilling to honor its financial obligations in respect of the transaction.
Currency — The prices of, and the income generated by, most debt securities held by a fund may also be affected by changes in relative currency values. If the U.S. dollar appreciates against foreign currencies, the value in U.S. dollars of a fund’s securities denominated in such currencies would generally fall and vice versa. U.S. dollar-denominated securities of foreign issuers may also be affected by changes in relative currency values.
Investing in mortgage-related and other asset-backed securities — Mortgage-related securities, such as mortgage-backed securities, and other asset-backed securities, include debt obligations that represent interests in pools of mortgages or other income-bearing assets, such as consumer loans or receivables. Such securities often involve risks that are different from or more acute than the risks associated with investing in other types of debt securities. Mortgage-backed and other asset-backed securities are subject to changes in the payment patterns of borrowers of the underlying debt. When interest rates fall, borrowers are more likely to refinance or prepay their debt before its stated maturity. This may result in a fund having to reinvest the proceeds in lower yielding securities, effectively reducing a fund’s income. Conversely, if interest rates rise and borrowers repay their debt more slowly than expected, the time in which the mortgage-backed and other asset-backed securities are paid off could be extended, reducing a fund’s cash available for reinvestment in higher yielding securities.
Investing in future delivery contracts — A fund may enter into contracts, such as to-be-announced contracts and mortgage dollar rolls, that involve a fund selling mortgage-related securities and simultaneously contracting to repurchase similar securities for delivery at a future date at a predetermined price. This can increase a fund’s market exposure, and the market price of the securities that the fund contracts to repurchase could drop below their purchase price. While a fund can preserve and generate capital through the use of such contracts by, for example, realizing the difference between the sale price and the future purchase price, the income generated by the fund may be reduced by engaging in such transactions. In addition, these transactions may increase the turnover rate of a fund.
Investing in inflation linked bonds — The values of inflation linked bonds generally fluctuate in response to changes in real interest rates — i.e., rates of interest after factoring in inflation. A rise in real interest rates may cause the prices of inflation linked securities to fall, while a decline in real interest rates may cause the prices to increase. Inflation linked bonds may experience greater losses than other debt securities with similar durations when real interest rates rise faster than nominal interest rates. There can be no assurance that the value of an inflation linked security will be directly correlated to changes in interest rates; for example, if interest rates rise for reasons other than inflation, the increase may not be reflected in the security’s inflation measure.
Investing in inflation linked bonds may also reduce a fund’s distributable income during periods of extreme deflation. If prices for goods and services decline throughout the economy, the principal and income on inflation linked securities may decline and result in losses to a fund.
Investing in securities backed by the U.S. government — Securities backed by the U.S. Treasury or the full faith and credit of the U.S. government are guaranteed only as to the timely payment of interest and principal when held to maturity. Accordingly, the current market values for these securities will fluctuate with changes in interest rates. Securities issued by government-sponsored entities and federal agencies and instrumentalities that are not backed by the full faith and credit of the U.S. government are neither issued nor guaranteed by the U.S. government.
Investing in repurchase agreements — Upon entering into a repurchase agreement, a fund purchases a security from a bank or broker-dealer, which simultaneously commits to repurchase the security within a specified time at the fund’s cost with interest. The security purchased by the fund constitutes collateral for the seller’s repurchase obligation. If the party agreeing to repurchase should default, the fund may seek to sell the security it holds as collateral. The fund may incur a loss if the value of the collateral securing the repurchase obligation falls below the repurchase price. The fund may also incur disposition costs and encounter procedural delays in connection with liquidating the collateral.
| 150 | American Funds Insurance Series |
Interest rate risk — The values and liquidity of the securities held by a fund may be affected by changing interest rates. For example, the values of these securities may decline when interest rates rise and increase when interest rates fall. Longer maturity debt securities generally have greater sensitivity to changes in interest rates and may be subject to greater price fluctuations than shorter maturity debt securities. A fund may invest in variable and floating rate securities. Although such securities are generally less sensitive to interest rate changes, the value of variable and floating rate securities may decline if their interest rates do not rise as quickly, or as much, as general interest rates. Conversely, floating rate securities will not generally increase in value if interest rates decline. During periods of extremely low short-term interest rates, a fund may not be able to maintain a positive yield and, given the current historically low interest rate environment, risks associated with rising rates are currently heightened.
Credit and liquidity support — Changes in the credit quality of banks and financial institutions providing credit and liquidity support features with respect to securities held by a fund could cause the values of these securities to decline.
Asset allocation — A fund’s percentage allocation to equity securities, debt securities and money market instruments could cause the fund to underperform relative to relevant benchmarks and other funds with similar investment objectives.
Nondiversification — As nondiversified funds, certain funds have the ability to invest a larger percentage of their assets in the securities of a smaller number of issuers than diversified funds. Although the funds do not intend to limit their investments to the securities of a small number of issuers, if they were to do so, poor performance by a single large holding could adversely impact the funds’ investment results more than if the funds were invested in a larger number of issuers.
Liquidity risk — Certain fund holdings may be deemed to be less liquid or illiquid because they cannot be readily sold without significantly impacting the value of the holdings. Liquidity risk may result from the lack of an active market for a holding, legal or contractual restrictions on resale, or the reduced number and capacity of market participants to make a market in such holding. Market prices for less liquid or illiquid holdings may be volatile, and reduced liquidity may have an adverse impact on the market price of such holdings. Additionally, the sale of less liquid or illiquid holdings may involve substantial delays (including delays in settlement) and additional costs and the fund may be unable to sell such holdings when necessary to meet its liquidity needs.
Management — The investment adviser to the funds actively manages the funds’ investments. Consequently, the funds are subject to the risk that the methods and analyses employed by the investment adviser in this process may not produce the desired results. This could cause the funds to lose value or their investment results to lag relevant benchmarks or other funds with similar objectives.
Investing in the managed risk funds may involve additional risks including, but not limited to, those described below.
Fund structure — The managed risk funds invest in underlying funds and incur expenses related to those underlying funds. In addition, investors in the managed risk funds will incur fees to pay for certain expenses related to the operations of the managed risk funds. An investor holding the underlying fund directly would incur lower overall expenses but would not receive the benefit of the managed risk strategy.
Management — The managed risk funds are subject to the risk that the methods employed by the subadviser in implementing the managed risk strategy may not produce the desired results. This could cause the managed risk funds to lose value or their investment results to lag relevant benchmarks or other funds with similar objectives.
Underlying fund risks — Because the managed risk funds’ investments consist of individual underlying funds, the managed risk funds’ risks are directly related to the risks of the respective underlying fund in which each managed fund invests. For this reason, it is important to understand the risks associated with investing both in the managed risk fund and the respective underlying fund.
Investing in futures contracts — In addition to the risks generally associated with investing in derivative instruments, futures contracts are subject to the creditworthiness of the clearing organizations, exchanges and futures commission merchants with which a fund transacts. Additionally, although futures require only a small initial investment in the form of a deposit of initial margin, the amount of a potential loss on a futures contract could greatly exceed the initial amount invested. While futures contracts are generally liquid instruments, under certain market conditions, futures may be deemed to be illiquid. For example, a fund may be temporarily prohibited from closing out its position in a futures contract if intraday price change limits or limits on trading volume imposed by the applicable futures exchange are triggered. If a fund is unable to close out a position on a futures contract, the fund would remain subject to the risk of adverse price movements until the fund is able to close out the futures position. The ability of a fund to successfully utilize futures contracts may depend in part upon the ability of the fund’s investment adviser or subadviser to accurately forecast interest rates and other economic factors and to assess and predict the impact of such economic factors on the futures in which the fund invests. If the investment adviser or subadviser incorrectly forecasts economic developments or incorrectly predicts the impact of such developments on the futures in which it invests, a fund could be exposed to the risk of loss.
| American Funds Insurance Series | 151 |
Hedging — There may be imperfect or even negative correlation between the prices of the futures contracts and the prices of the underlying securities. For example, futures contracts may not provide an effective hedge because changes in futures contract prices may not track those of the underlying securities or indexes they are intended to hedge. In addition, there are significant differences between the securities and futures markets that could result in an imperfect correlation between the markets, causing a given hedge not to achieve its objectives. The degree of imperfection of correlation depends on circumstances such as variations in speculative market demand for futures, including technical influences in futures trading, and differences between the financial instruments being hedged and the instruments underlying the standard contracts available for trading. A decision as to whether, when and how to hedge involves the exercise of skill and judgment, and even a well-conceived hedge may be unsuccessful to some degree because of market behavior or unexpected interest rate trends. In addition, the fund’s investment in exchange-traded futures and their resulting costs could limit the fund’s gains in rising markets relative to those of the underlying fund, or to those of unhedged funds in general.
Short positions — Losses from short positions in futures contracts occur when the underlying index increases in value. As the underlying index increases in value, the holder of the short position in the corresponding futures contract is required to pay the difference in value of the futures contract resulting from the increase in the index on a daily basis. Losses from a short position in an index futures contract could potentially be very large if the value of the underlying index rises dramatically in a short period of time.
5. Certain investment techniques
Index-linked bonds — Some of the funds have invested in index-linked bonds, which are fixed-income securities whose principal value is periodically adjusted to a government price index. Over the life of an index-linked bond, interest is paid on the adjusted principal value. Increases or decreases in the principal value of index-linked bonds are recorded as interest income in the fund’s statement of operations.
Mortgage dollar rolls — Some of the funds have entered into mortgage dollar roll transactions in which the fund sells a mortgage-backed security to a counterparty and simultaneously enters into an agreement with the same counterparty to buy back a similar security on a specific future date at a predetermined price. Mortgage dollar rolls are accounted for as purchase and sale transactions, which may increase the funds’ portfolio turnover rates.
Loan transactions — Some of the funds have entered into loan transactions in which the fund acquires a loan either through an agent, by assignment from another holder, or as a participation interest in another holder’s portion of a loan. The loan is often administered by a financial institution that acts as agent for the holders of the loan, and the fund may be required to receive approval from the agent and/or borrower prior to the sale of the investment. The loan’s interest rate and maturity date may change based on the terms of the loan, including potential early payments of principal.
Short-term securities — The managed risk funds hold shares of the Government Cash Management Fund, a cash management vehicle offered by the Bank of New York Mellon (“BNY Mellon”), the funds’ custodian bank. The Government Cash Management Fund is managed by the Dreyfus Corporation.
Futures contracts — Some of the funds have entered into futures contracts, which provide for the future sale by one party and purchase by another party of a specified amount of a specific financial instrument for a specified price, date, time and place designated at the time the contract is made. Futures contracts are used to strategically manage portfolio volatility and downside equity risk.
Upon entering into futures contracts, and to maintain the fund’s open positions in futures contracts, the fund is required to deposit with a futures broker, or FCM, in a segregated account in the name of the FCM an amount of cash, U.S. government securities, suitable money market instruments, or other liquid securities, known as “initial margin.” The margin required for a particular futures contract is set by the exchange on which the contract is traded to serve as collateral, and may be significantly modified from time to time by the exchange during the term of the contract. When initial margin is deposited with brokers, a receivable is recorded in the fund’s statement of assets and liabilities.
On a daily basis, each fund pays or receives variation margin based on the increase or decrease in the value of the futures contracts and records variation margin on futures contracts in each fund’s statement of assets and liabilities. In addition, each fund segregates liquid assets equivalent to the fund’s outstanding obligations under the contract in excess of the initial margin and variation margin, if any. Futures contracts may involve a risk of loss in excess of the variation margin shown on each fund’s statement of assets and liabilities.
| 152 | American Funds Insurance Series |
Each fund records realized gains or losses at the time the futures contract is closed or expires. Net realized gains or losses and net unrealized appreciation or depreciation from futures contracts are recorded in each fund’s statement of operations.
Forward currency contracts — Some of the funds have entered into forward currency contracts, which represent agreements to exchange currencies on specific future dates at predetermined rates. The series’ investment adviser uses forward currency contracts to manage the fund’s exposure to changes in exchange rates. Upon entering into these contracts, risks may arise from the potential inability of counterparties to meet the terms of their contracts and from possible movements in exchange rates.
On a daily basis, the series’ investment adviser values forward currency contracts based on the applicable exchange rates and records unrealized appreciation or depreciation for open forward currency contracts in each fund’s statement of assets and liabilities. Realized gains or losses are recorded at the time the forward contract is closed or offset by another contract with the same broker for the same settlement date and currency. Closed forward currency contracts that have not reached their settlement date are included in the respective receivables or payables for closed forward currency contracts in each fund’s statement of assets and liabilities. Net realized gains or losses from closed forward currency contracts and net unrealized appreciation or depreciation from open forward currency contracts are recorded in each fund’s statement of operations.
Interest rate swaps — Some of the funds have entered into interest rate swaps, which are agreements to exchange one stream of future interest payments for another based on a specified notional amount. Typically, interest rate swaps exchange a fixed interest rate for a payment that floats relative to a benchmark or vice versa. The series’ investment adviser uses interest rate swaps to manage the interest rate sensitivity of the fund by increasing or decreasing the duration of the fund or a portion of the fund’s portfolio. Risks may arise as a result of the series’ investment adviser incorrectly anticipating changes in interest rates, increased volatility, reduced liquidity and the potential inability of counterparties to meet the terms of their agreements.
Upon entering into an interest rate swap contract, the fund is required to deposit cash, U.S. government securities or other liquid securities, which is known as “initial margin.” Generally, the initial margin required for a particular interest rate swap is set and held as collateral by the clearinghouse on which the contract is cleared. The amount of initial margin required may be significantly modified from time to time by the clearinghouse during the term of the contract.
On a daily basis, the series’ investment adviser records daily interest accruals related to the exchange of future payments as a receivable and payable in each fund’s statement of assets and liabilities. Each fund also pays or receives a “variation margin” based on the increase or decrease in the value of the interest rate swaps, including accrued interest, and records variation margin on interest rate swaps in each fund’s statement of assets and liabilities. Each fund records realized gains and losses on both the net accrued interest and any gain or loss recognized at the time the interest rate swap is closed or expires. Net realized gains or losses, as well as any net unrealized appreciation or depreciation, from interest rate swaps are recorded in each fund’s statement of operations.
Credit default swap indices — Some of the funds have entered into centrally cleared credit default swap agreements on credit indices (“CDSI”) that involve one party (the protection buyer) making a stream of payments to another party (the protection seller) in exchange for the right to receive a specified return upon the occurrence of a credit event, such as a default or restructuring, with respect to any of the underlying issuers (reference obligations) in the referenced index. The series’ investment adviser uses credit default swaps to assume exposure to a diversified portfolio of credits or to hedge against existing credit risks.
CDSI are portfolios of credit instruments or exposures designed to be representative of some part of the credit market, such as the high-yield or investment-grade credit market. CDSI are generally traded using standardized terms, including a fixed spread and standard maturity dates, and reference all the names in the index. If there is a credit event, it is settled based on that name’s weight in the index. The composition of the underlying issuers or obligations within a particular index may change periodically, usually every six months. A specified credit event may affect all or individual underlying reference obligations included in the index, and will be settled based upon the relative weighting of the affected obligation(s) within the index. The value of each CDSI can be used as a measure of the current payment/performance risk of the CDSI and represents the likelihood of an expected liability or profit should the notional amount of the CDSI be closed or sold as of the period end. An increasing value, as compared to the notional amount of the CDSI, represents a deterioration of the referenced indices’ credit soundness and a greater likelihood of risk of default or other credit event occurring as defined under the terms of the agreement. When a fund provides sell protection, its maximum exposure is the notional amount of the credit default swap agreement.
Upon entering into a centrally cleared CDSI contract, the fund is required to deposit with a derivatives clearing member (“DCM”) in a segregated account in the name of the DCM an amount of cash, U.S. government securities or other liquid securities, which is known as initial margin. Generally, the initial margin required for a particular credit default swap is set and held as collateral by the clearinghouse on which the contract is cleared. The amount of initial margin required may be significantly modified from time to time by the clearinghouse during the term of the contract. Securities deposited as initial margin are designated on the investment portfolio.
| American Funds Insurance Series | 153 |
On a daily basis, interest accruals related to the exchange of future payments are recorded as a receivable and payable in each fund’s statement of assets and liabilities. Each fund also pays or receives a variation margin based on the increase or decrease in the value of the centrally cleared swaps, and records variation margin in each fund’s statement of assets and liabilities. Each fund records realized gains and losses on both the net accrued interest and any gain or loss recognized at the time the swap is closed or expires. Net realized gains or losses, as well as any net unrealized appreciation or depreciation, from credit default swaps are recorded in each fund’s statement of operations.
The following table presents the average month-end notional amounts of futures contracts, forward currency contracts, interest rate swaps and credit default swaps for each fund (dollars in thousands):
Futures
| Forwards
| Interest rate swaps
| Credit default swaps
| |||||||||||||
Global Growth Fund | Not applicable | $ 5,416 | Not applicable | Not applicable | ||||||||||||
Global Small Capitalization Fund | Not applicable | 94,919 | Not applicable | Not applicable | ||||||||||||
International Fund | Not applicable | 259,198 | Not applicable | Not applicable | ||||||||||||
New World Fund | Not applicable | 13,461 | Not applicable | Not applicable | ||||||||||||
Global Growth and Income Fund | Not applicable | 7,767 | * | Not applicable | Not applicable | |||||||||||
International Growth and Income Fund | Not applicable | 15,682 | * | Not applicable | Not applicable | |||||||||||
Capital Income Builder | Not applicable | 469 | Not applicable | Not applicable | ||||||||||||
Asset Allocation Fund | $ 219,612 | Not applicable | $ 2,097,900 | Not applicable | ||||||||||||
Global Balanced Fund | Not applicable | 17,483 | Not applicable | Not applicable | ||||||||||||
Bond Fund | 1,612,655 | 385,299 | 1,705,816 | Not applicable | ||||||||||||
Global Bond Fund | 89,251 | 519,687 | 244,046 | Not applicable | ||||||||||||
High-Income Bond Fund | Not applicable | Not applicable | 23,513 | $ 33,633 | ||||||||||||
Mortgage Fund | 231,062 | Not applicable | 408,752 | Not applicable | ||||||||||||
U.S. Government/AAA-Rated Securities Fund | 2,614,240 | Not applicable | 6,343,500 | Not applicable | ||||||||||||
Managed Risk International Fund
|
| 42,606
| *
|
| Not applicable
|
|
| Not applicable
|
|
| Not applicable
|
| ||||
| *No | contracts were held at the end of the reporting period; amount represents the average month-end notional amount of contracts while they were held. |
| 154 American Funds Insurance Series |
The following tables present the financial statement impacts resulting from the funds’ use of futures contracts, forward currency contracts, interest rate swaps and/or credit default swaps as of, or for the six months ended June 30, 2017 (dollars in thousands):
| Global Growth Fund | Global Small | International Fund | ||||||||||||||
Assets | Risk type
| Location on statements of assets and liabilities
| ||||||||||||||
Futures contracts | Interest | Net unrealized appreciation* | $ – | $ – | $ – | |||||||||||
Futures contracts | Equity | Net unrealized appreciation* | – | – | – | |||||||||||
Futures contracts | Currency | Net unrealized appreciation* | – | – | – | |||||||||||
Forward currency | Currency | Unrealized appreciation on open forward currency contracts | 69 | 275 | 59 | |||||||||||
Forward currency | Currency | Receivables for closed forward currency contracts | – | – | – | |||||||||||
Interest rate swaps | Interest | Net unrealized appreciation* | – | – | – | |||||||||||
Credit default swaps | Credit | Net unrealized appreciation* | – | – | – | |||||||||||
| $ 69 | $ 275 | $ 59 | ||||||||||||||
Liabilities | Risk type
| Location on statements of assets and liabilities
| ||||||||||||||
Futures contracts | Interest | Net unrealized depreciation* | $ – | $ – | $ – | |||||||||||
Futures contracts | Equity | Net unrealized depreciation* | – | – | – | |||||||||||
Futures contracts | Currency | Net unrealized depreciation* | – | – | – | |||||||||||
Forward currency | Currency | Unrealized depreciation on open forward currency contracts | – | 561 | – | |||||||||||
Forward currency | Currency | Payables for closed forward currency contracts | – | 922 | – | |||||||||||
Interest rate swaps | Interest | Net unrealized depreciation* | – | – | – | |||||||||||
Credit default swaps | Credit | Net unrealized depreciation* | – | – | – | |||||||||||
| $ – | $ 1,483 | $ – | ||||||||||||||
Net realized gain (loss)
| Risk type
| Location on statements of operations
| ||||||||||||||
Futures contracts | Interest | Net realized gain on futures contracts | $ – | $ – | $ – | |||||||||||
Futures contracts | Equity | Net realized gain on futures contracts | – | – | – | |||||||||||
Futures contracts | Currency | Net realized gain on futures contracts | – | – | – | |||||||||||
Forward currency | Currency | Net realized gain (loss) on forward currency contracts | 134 | (3,099 | ) | (8,385 | ) | |||||||||
Interest rate swaps | Interest | Net realized gain on interest rate swaps | – | – | – | |||||||||||
Credit default swaps | Credit | Net realized gain on credit default swaps | – | – | – | |||||||||||
| $ 134 | $(3,099 | ) | $(8,385 | ) | ||||||||||||
Net unrealized (depreciation) appreciation
| Risk type
| Location on statements of operations
| ||||||||||||||
Futures contracts | Interest | Net unrealized appreciation (depreciation) on futures contracts | $ – | $ – | $ – | |||||||||||
Futures contracts | Equity | Net unrealized appreciation on futures contracts | – | – | – | |||||||||||
Futures contracts | Currency | Net unrealized appreciation on futures contracts | – | – | – | |||||||||||
Forward currency | Currency | Net unrealized (depreciation) appreciation on forward currency contracts | (290 | ) | (1,672 | ) | 2,203 | |||||||||
Interest rate swaps | Interest | Net unrealized appreciation on interest rate swaps | – | – | – | |||||||||||
Credit default swaps | Credit | Net unrealized appreciation on credit default swaps | – | – | – | |||||||||||
| $(290 | ) | $(1,672 | ) | $ 2,203 | ||||||||||||
| $(290 | ) | $(1,672 | ) | $2,203 | ||||||||||||
See end of tables for footnote.
| American Funds Insurance Series | 155 |
New World Fund | Global Growth and Income Fund | International Growth and Income Fund | ||||||||||||||
Assets | Risk type | Location on statements of assets and liabilities | ||||||||||||||
Futures contracts | Interest | Net unrealized appreciation* | $ – | $ – | $ – | |||||||||||
Futures contracts | Equity | Net unrealized appreciation* | – | – | – | |||||||||||
Futures contracts | Currency | Net unrealized appreciation* | – | – | – | |||||||||||
Forward currency | Currency | Unrealized appreciation on open forward currency contracts | 183 | – | – | |||||||||||
Forward currency | Currency | Receivables for closed forward currency contracts | – | – | – | |||||||||||
Interest rate swaps | Interest | Net unrealized appreciation* | – | – | – | |||||||||||
Credit default swaps | Credit | Net unrealized appreciation* | – | – | – | |||||||||||
| $ 183 | $ – | $ – | ||||||||||||||
Liabilities | Risk type | Location on statements of assets and liabilities | ||||||||||||||
Futures contracts | Interest | Net unrealized depreciation* | $ – | $ – | $ – | |||||||||||
Futures contracts | Equity | Net unrealized depreciation* | – | – | – | |||||||||||
Futures contracts | Currency | Net unrealized depreciation* | – | – | – | |||||||||||
Forward currency | Currency | Unrealized depreciation on open forward currency contracts | 39 | – | – | |||||||||||
Forward currency | Currency | Payables for closed forward currency contracts | 13 | – | – | |||||||||||
Interest rate swaps | Interest | Net unrealized depreciation* | – | – | – | |||||||||||
Credit default swaps | Credit | Net unrealized depreciation* | – | – | – | |||||||||||
| $ 52 | $ – | $ – | ||||||||||||||
Net realized loss | Risk type | Location on statements of operations | ||||||||||||||
Futures contracts | Interest | Net realized gain on futures contracts | $ – | $ – | $ – | |||||||||||
Futures contracts | Equity | Net realized gain on futures contracts | – | – | – | |||||||||||
Futures contracts | Currency | Net realized gain on futures contracts | – | – | – | |||||||||||
Forward currency | Currency | Net realized loss on forward currency contracts | (859 | ) | (157 | ) | (143 | ) | ||||||||
Interest rate swaps | Interest | Net realized gain on interest rate swaps | – | – | – | |||||||||||
Credit default swaps | Credit | Net realized gain on credit default swaps | – | – | – | |||||||||||
| $(859 | ) | $(157 | ) | $(143 | ) | |||||||||||
Net unrealized appreciation (depreciation) | Risk type | Location on statements of operations | ||||||||||||||
Futures contracts | Interest | Net unrealized appreciation on futures contracts | $ – | $ – | $ – | |||||||||||
Futures contracts | Equity | Net unrealized appreciation on futures contracts | – | – | – | |||||||||||
Futures contracts | Currency | Net unrealized appreciation on futures contracts | – | – | – | |||||||||||
Forward currency | Currency | Net unrealized appreciation (depreciation) on forward currency contracts | 134 | (147 | ) | 105 | ||||||||||
Interest rate swaps | Interest | Net unrealized appreciation on interest rate swaps | – | – | – | |||||||||||
Credit default swaps | Credit | Net unrealized appreciation on credit default swaps | – | – | – | |||||||||||
| $ 134 | $(147 | ) | $ 105 | |||||||||||||
| 156 | American Funds Insurance Series |
Capital Income Builder | Asset Allocation Fund | Global Balanced Fund | ||||||||||||||
Assets
| Risk type | Location on statements of assets and liabilities | ||||||||||||||
Futures contracts | Interest | Net unrealized appreciation* | $ – | $ 345 | $ – | |||||||||||
Futures contracts | Equity | Net unrealized appreciation* | – | – | – | |||||||||||
Futures contracts | Currency | Net unrealized appreciation* | – | – | – | |||||||||||
Forward currency | Currency | Unrealized appreciation on open forward currency contracts | – | – | 167 | |||||||||||
Forward currency | Currency | Receivables for closed forward currency contracts | – | – | – | |||||||||||
Interest rate swaps | Interest | Net unrealized appreciation* | – | 180 | – | |||||||||||
Credit default swaps | Credit | Net unrealized appreciation* | – | – | – | |||||||||||
| $ – | $ 525 | $ 167 | ||||||||||||||
Liabilities
| Risk type | Location on statements of assets and liabilities | ||||||||||||||
Futures contracts | Interest | Net unrealized depreciation* | $ – | $ – | $ – | |||||||||||
Futures contracts | Equity | Net unrealized depreciation* | – | – | – | |||||||||||
Futures contracts | Currency | Net unrealized depreciation* | – | – | – | |||||||||||
Forward currency | Currency | Unrealized depreciation on open forward currency contracts | 5 | – | 119 | |||||||||||
Forward currency | Currency | Payables for closed forward currency contracts | – | – | 9 | |||||||||||
Interest rate swaps | Interest | Net unrealized depreciation* | – | 6,710 | – | |||||||||||
Credit default swaps | Credit | Net unrealized depreciation* | – | – | – | |||||||||||
| $ 5 | $ 6,710 | $ 128 | ||||||||||||||
Net realized gain (loss)
| Risk type
| Location on statements of operations
| ||||||||||||||
Futures contracts | Interest | Net realized gain on futures contracts | $ – | $ 1,548 | $ – | |||||||||||
Futures contracts | Equity | Net realized gain on futures contracts | – | – | – | |||||||||||
Futures contracts | Currency | Net realized gain on futures contracts | – | – | – | |||||||||||
Forward currency | Currency | Net realized loss on forward currency contracts | (26 | ) | – | (115 | ) | |||||||||
Interest rate swaps | Interest | Net realized gain on interest rate swaps | – | 3,474 | – | |||||||||||
Credit default swaps | Credit | Net realized gain on credit default swaps | – | – | – | |||||||||||
| $(26 | ) | $ 5,022 | $(115 | ) | ||||||||||||
Net unrealized appreciation (depreciation)
| Risk type
| Location on statements of operations
| ||||||||||||||
Futures contracts | Interest | Net unrealized appreciation on futures contracts | $ – | $ 104 | $ – | |||||||||||
Futures contracts | Equity | Net unrealized appreciation on futures contracts | – | – | – | |||||||||||
Futures contracts | Currency | Net unrealized appreciation on futures contracts | – | – | – | |||||||||||
Forward currency | Currency | Net unrealized depreciation on forward currency contracts | – | – | (53 | ) | ||||||||||
Interest rate swaps | Interest | Net unrealized depreciation on interest rate swaps | – | (2,901 | ) | – | ||||||||||
Credit default swaps | Credit | Net unrealized appreciation on credit default swaps | – | – | – | |||||||||||
| $ – | $(2,797 | ) | $ (53 | ) | ||||||||||||
See end of tables for footnote.
| American Funds Insurance Series | 157 |
Bond Fund | Global Bond Fund | High- Income Bond Fund | ||||||||||||||
Assets
| Risk type | Location on statements of assets and liabilities | ||||||||||||||
Futures contracts | Interest | Net unrealized appreciation* | $ 939 | $ 216 | $ – | |||||||||||
Futures contracts | Equity | Net unrealized appreciation* | – | – | – | |||||||||||
Futures contracts | Currency | Net unrealized appreciation* | – | – | – | |||||||||||
Forward currency | Currency | Unrealized appreciation on open forward currency contracts | 1,952 | 4,096 | – | |||||||||||
Forward currency | Currency | Receivables for closed forward currency contracts | – | 185 | – | |||||||||||
Interest rate swaps | Interest | Net unrealized appreciation* | 15,160 | 1,706 | 267 | |||||||||||
Credit default swaps | Credit | Net unrealized appreciation* | – | – | 149 | |||||||||||
| $ 18,051 | $ 6,203 | $ 416 | ||||||||||||||
Liabilities
| Risk type | Location on statements of assets and liabilities | ||||||||||||||
Futures contracts | Interest | Net unrealized depreciation* | $ 4,547 | $ 200 | $ – | |||||||||||
Futures contracts | Equity | Net unrealized depreciation* | – | – | – | |||||||||||
Futures contracts | Currency | Net unrealized depreciation* | – | – | – | |||||||||||
Forward currency | Currency | Unrealized depreciation on open forward currency contracts | 4,449 | 5,273 | – | |||||||||||
Forward currency | Currency | Payables for closed forward currency contracts | – | 299 | – | |||||||||||
Interest rate swaps | Interest | Net unrealized depreciation* | 7,336 | 923 | 21 | |||||||||||
Credit default swaps | Credit | Net unrealized depreciation* | – | – | – | |||||||||||
| $ 16,332 | $ 6,695 | $ 21 | ||||||||||||||
Net realized gain (loss)
| Risk type
| Location on statements of operations
| ||||||||||||||
Futures contracts | Interest | Net realized gain on futures contracts | $ 19,307 | $ 657 | $ – | |||||||||||
Futures contracts | Equity | Net realized gain on futures contracts | – | – | – | |||||||||||
Futures contracts | Currency | Net realized gain on futures contracts | – | – | – | |||||||||||
Forward currency | Currency | Net realized loss on forward currency contracts | (43,217 | ) | (10,947 | ) | – | |||||||||
Interest rate swaps | Interest | Net realized loss on interest rate swaps | (1,445 | ) | (918 | ) | (223 | ) | ||||||||
Credit default swaps | Credit | Net realized gain on credit default swaps | – | – | 553 | |||||||||||
| $(25,355 | ) | $(11,208 | ) | $ 330 | ||||||||||||
Net unrealized (depreciation) appreciation
| Risk type
| Location on statements of operations
| ||||||||||||||
Futures contracts | Interest | Net unrealized (depreciation) appreciation on futures contracts | $ (2,500 | ) | $ 16 | $ ��– | ||||||||||
Futures contracts | Equity | Net unrealized appreciation on futures contracts | – | – | – | |||||||||||
Futures contracts | Currency | Net unrealized appreciation on futures contracts | – | – | – | |||||||||||
Forward currency | Currency | Net unrealized (depreciation) appreciation on forward currency contracts | (4,424 | ) | 4,188 | – | ||||||||||
Interest rate swaps | Interest | Net unrealized depreciation on interest rate swaps | (637 | ) | (339 | ) | (181 | ) | ||||||||
Credit default swaps | Credit | Net unrealized depreciation on credit default swaps | – | – | (495 | ) | ||||||||||
| $ (7,561 | ) | $ 3,865 | $(676 | ) | ||||||||||||
| 158 | American Funds Insurance Series |
| Mortgage Fund | U.S. Government/ AAA-Rated Securities Fund | Managed Risk International Fund | ||||||||||||||
Assets | Risk type | Location on statements of assets and liabilities | ||||||||||||||
Futures contracts | Interest | Net unrealized appreciation* | $ 84 | $ 191 | $ – | |||||||||||
Futures contracts | Equity | Net unrealized appreciation* | – | – | – | |||||||||||
Futures contracts | Currency | Net unrealized appreciation* | – | – | – | |||||||||||
Forward currency | Currency | Unrealized appreciation on open forward currency contracts | – | – | – | |||||||||||
Forward currency | Currency | Receivables for closed forward currency contracts | – | – | – | |||||||||||
Interest rate swaps | Interest | Net unrealized appreciation* | 1,345 | 16,711 | – | |||||||||||
Credit default swaps | Credit | Net unrealized appreciation* | – | – | – | |||||||||||
| $ 1,429 | $ 16,902 | $ – | ||||||||||||||
Liabilities | Risk type | Location on statements of assets and liabilities | ||||||||||||||
Futures contracts | Interest | Net unrealized depreciation* | $ 631 | $ 6,688 | $ – | |||||||||||
Futures contracts | Equity | Net unrealized depreciation* | – | – | – | |||||||||||
Futures contracts | Currency | Net unrealized depreciation* | – | – | – | |||||||||||
Forward currency | Currency | Unrealized depreciation on open forward currency contracts | – | – | – | |||||||||||
Forward currency | Currency | Payables for closed forward currency contracts | – | – | – | |||||||||||
Interest rate swaps | Interest | Net unrealized depreciation* | 1,651 | 24,340 | – | |||||||||||
Credit default swaps | Credit | Net unrealized depreciation* | – | – | – | |||||||||||
| $ 2,282 | $ 31,028 | $ – | ||||||||||||||
Net realized gain (loss) | Risk type | Location on statements of operations | ||||||||||||||
Futures contracts | Interest | Net realize gain on futures contracts | $ 1,927 | $ 11,432 | $ – | |||||||||||
Futures contracts | Equity | Net realized loss on futures contracts | – | – | (624 | ) | ||||||||||
Futures contracts | Currency | Net realized gain on futures contracts | – | – | 118 | |||||||||||
Forward currency | Currency | Net realized gain on forward currency contracts | – | – | – | |||||||||||
Interest rate swaps | Interest | Net realized gain on interest rate swaps | 261 | 16,310 | – | |||||||||||
Credit default swaps | Credit | Net realized gain on credit default swaps | – | – | – | |||||||||||
| $ 2,188 | $ 27,742 | $(506 | ) | |||||||||||||
Net unrealized (depreciation) appreciation | Risk type | Location on statements of operations | ||||||||||||||
Futures contracts | Interest | Net unrealized depreciation on futures contracts | $ (230 | ) | $ (82 | ) | $ – | |||||||||
Futures contracts | Equity | Net unrealized depreciation on futures contracts | – | – | 160 | |||||||||||
Futures contracts | Currency | Net unrealized appreciation on futures contracts | – | – | (142 | ) | ||||||||||
Forward currency | Currency | Net unrealized appreciation on forward currency contracts | – | – | – | |||||||||||
Interest rate swaps | Interest | Net unrealized depreciation on interest rate swaps | (962 | ) | (17,657 | ) | – | |||||||||
Credit default swaps | Credit | Net unrealized appreciation on credit default swaps | – | – | – | |||||||||||
| $(1,192 | ) | $(17,739 | ) | $ 18 | ||||||||||||
| * | Includes cumulative appreciation/depreciation on futures contracts, interest rate swaps and/or credit default swaps as reported in the applicable table(s) following each fund’s investment portfolio. Only current day’s variation margin is reported within the statements of assets and liabilities. |
| American Funds Insurance Series | 159 |
Collateral – Funds that invest in futures contracts, forward currency contracts, interest rate swaps, credit default swaps and/or future delivery contracts participate in a collateral program. For futures contracts, interest rate swaps and credit default swaps, the program calls for the fund to pledge collateral for initial and variation margin by contract. For forward currency contracts, the program calls for the fund to either receive or pledge collateral based on the net gain or loss on unsettled forward currency contracts by counterparty. For future delivery contracts, the program calls for the fund to either receive or pledge collateral based on the net gain or loss on unsettled contracts by certain counterparties. The purpose of the collateral is to cover potential losses that could occur in the event that either party cannot meet its contractual obligations.
Rights of offset – Funds that hold forward currency contracts have enforceable master netting agreements with certain counterparties, where amounts payable by each party to the other in the same currency (with the same settlement date and with the same counter-party) are settled net of each party’s payment obligation. If an early termination date occurs under these agreements following an event of default or termination event, all obligations of each party to its counterparty are settled net through a single payment in a single currency (“close-out netting”). For financial reporting purposes, the funds do not offset financial assets and financial liabilities that are subject to these master netting arrangements in the statements of assets and liabilities.
The following tables present each fund’s forward currency contracts by counterparty that are subject to master netting agreements but that are not offset in the funds’ statements of assets and liabilities. The net amount column shows the impact of offsetting on the funds’ statement of assets and liabilities as of June 30, 2017, if close-out netting was exercised (dollars in thousands):
Global Growth Fund
| Gross amounts recognized in the | Gross amounts not offset in the statement of assets and liabilities and subject to a master netting agreement | |||||||||||||||||||
| Counterparty | statement of assets and liabilities | Available to offset | Non-cash collateral* | Cash collateral | Net amount | |||||||||||||||
Assets: | ||||||||||||||||||||
Bank of America, N.A. | $69 | $– | $– | $– | $69 | |||||||||||||||
| Global Small Capitalization Fund | ||||||||||||||||||||
| Gross amounts recognized in the | Gross amounts not offset in the statement of assets and liabilities and subject to a master netting agreement | |||||||||||||||||||
| Counterparty | statement of assets and liabilities | Available to offset | Non-cash collateral* | Cash collateral | Net amount | |||||||||||||||
Assets: | ||||||||||||||||||||
Citibank | $ 30 | $ 30 | $ – | $– | $ – | |||||||||||||||
JPMorgan Chase | 162 | – | – | – | 162 | |||||||||||||||
UBS AG | 83 | – | – | – | 83 | |||||||||||||||
Total | $ 275 | $(30) | $ – | $– | $245 | |||||||||||||||
Liabilities: | ||||||||||||||||||||
Bank of America, N.A. | $ 442 | $ – | $(339 | ) | $– | $103 | ||||||||||||||
Citibank | 317 | (30) | (287 | ) | – | – | ||||||||||||||
Goldman Sachs | 480 | – | – | – | 480 | |||||||||||||||
HSBC Bank | 244 | – | – | – | 244 | |||||||||||||||
Total | $1,483 | $(30) | $(626) | $– | $827 | |||||||||||||||
| International Fund | ||||||||||||||||||||
| Gross amounts recognized in the | Gross amounts not offset in the statement of assets and liabilities and subject to a master netting agreement | |||||||||||||||||||
| Counterparty | statement of assets and liabilities | Available to offset | Non-cash collateral* | Cash collateral | Net amount | |||||||||||||||
Assets: | ||||||||||||||||||||
Bank of America, N.A. | $59 | $– | $– | $– | $59 | |||||||||||||||
| 160 | American Funds Insurance Series |
New World Fund
| ||||||||||||||||||||
Gross amounts recognized in the | Gross amounts not offset in the statement of assets and liabilities and subject to a master netting agreement | |||||||||||||||||||
| Counterparty | statement of assets and liabilities | Available to offset | Non-cash collateral* | Cash collateral | Net amount | |||||||||||||||
Assets: | ||||||||||||||||||||
Bank of America, N.A. | $ 25 | $(21) | $– | $– | $ 4 | |||||||||||||||
Barclays Bank PLC | 28 | – | – | – | 28 | |||||||||||||||
Citibank | 27 | (2) | – | – | 25 | |||||||||||||||
Goldman Sachs | 21 | – | – | – | 21 | |||||||||||||||
JPMorgan Chase | 73 | (12) | – | – | 61 | |||||||||||||||
UBS AG | 9 | – | – | – | 9 | |||||||||||||||
Total | $183 | $(35) | $– | $– | $148 | |||||||||||||||
Liabilities: | ||||||||||||||||||||
Bank of America, N.A. | $21 | $(21) | $– | $– | $– | |||||||||||||||
Citibank | 2 | (2) | – | – | – | |||||||||||||||
HSBC Bank | 17 | – | – | – | 17 | |||||||||||||||
JPMorgan Chase | 12 | (12) | – | – | – | |||||||||||||||
Total | $ 52 | $(35) | $– | $– | $17 | |||||||||||||||
| Capital Income Builder | ||||||||||||||||||||
| Gross amounts recognized in the | Gross amounts not offset in the statement of assets and liabilities and subject to a master netting agreement | |||||||||||||||||||
| Counterparty | statement of assets and liabilities | Available to offset | Non-cash collateral* | Cash collateral | Net amount | |||||||||||||||
Liabilities: | ||||||||||||||||||||
Bank of America, N.A. | $5 | $– | $– | $– | $5 | |||||||||||||||
| Global Balanced Fund | ||||||||||||||||||||
| Gross amounts recognized in the | Gross amounts not offset in the statement of assets and liabilities and subject to a master netting agreement | |||||||||||||||||||
| Counterparty | statement of assets and liabilities | Available to offset | Non-cash collateral* | Cash collateral | Net amount | |||||||||||||||
Assets: | ||||||||||||||||||||
Bank of America, N.A. | $ 42 | $(33) | $– | $– | $9 | |||||||||||||||
Bank of New York Mellon | 7 | – | – | – | 7 | |||||||||||||||
Barclays Bank PLC | 11 | (10) | – | – | 1 | |||||||||||||||
Citibank | 57 | (10) | – | – | 47 | |||||||||||||||
Goldman Sachs | 10 | (10) | – | – | – | |||||||||||||||
HSBC Bank | 5 | (5) | – | – | – | |||||||||||||||
JPMorgan Chase | 10 | (10) | – | – | – | |||||||||||||||
UBS AG | 25 | (13) | – | – | – | |||||||||||||||
Total | $167 | $(91) | $– | $– | $76 | |||||||||||||||
Liabilities: | ||||||||||||||||||||
Bank of America, N.A. | $ 33 | $(33 | ) | $– | $– | $– | ||||||||||||||
Barclays Bank PLC | 10 | (10 | ) | – | – | – | ||||||||||||||
Citibank | 10 | (10 | ) | – | – | – | ||||||||||||||
Goldman Sachs | 13 | (10 | ) | – | – | – | ||||||||||||||
HSBC Bank | 11 | (5 | ) | – | – | 3 | ||||||||||||||
JPMorgan Chase | 38 | (10 | ) | – | – | 6 | ||||||||||||||
UBS AG | 13 | (13 | ) | – | – | 28 | ||||||||||||||
Total | $128 | $(91 | ) | $– | $– | $37 | ||||||||||||||
See end of tables for footnote.
| American Funds Insurance Series | 161 |
Bond Fund
Gross amounts | Gross amounts not offset in the statement of assets and liabilities and subject to a master netting agreement | |||||||||||||||||||
| Counterparty | Available to offset | Non-cash collateral* | Cash collateral | Net amount | ||||||||||||||||
Assets: | ||||||||||||||||||||
Bank of America, N.A. | $ 280 | $(280) | $ – | $– | $ – | |||||||||||||||
Barclays Bank PLC | 9 | – | – | – | 9 | |||||||||||||||
HSBC Bank | 599 | – | (400) | – | 199 | |||||||||||||||
JPMorgan Chase | 408 | (408) | – | – | – | |||||||||||||||
UBS AG | 656 | – | (391) | – | 265 | |||||||||||||||
|
| |||||||||||||||||||
Total | $1,952 | $(688) | $ (791) | $– | $ – | |||||||||||||||
|
| |||||||||||||||||||
Liabilities: | ||||||||||||||||||||
Bank of America, N.A. | $ 561 | $(280) | $ (281) | $– | $ – | |||||||||||||||
Citi | 1,504 | – | (1,504) | – | – | |||||||||||||||
JPMorgan Chase | 2,384 | (408) | (1,976) | – | – | |||||||||||||||
|
| |||||||||||||||||||
Total | $4,449 | $(688) | $(3,761) | $– | $ – | |||||||||||||||
|
| |||||||||||||||||||
| Global Bond Fund | ||||||||||||||||||||
Gross amounts | Gross amounts not offset in the statement of assets and liabilities and subject to a master netting agreement | |||||||||||||||||||
| Counterparty | Available to offset | Non-cash collateral* | Cash collateral | Net amount | ||||||||||||||||
Assets: | ||||||||||||||||||||
Bank of America, N.A. | $ 461 | $ (461 | ) | $ – | $– | $ – | ||||||||||||||
Barclays Bank PLC | 444 | – | (353) | – | 91 | |||||||||||||||
Citibank | 1,119 | (761 | ) | – | – | 358 | ||||||||||||||
Goldman Sachs | 406 | (388 | ) | – | – | 18 | ||||||||||||||
HSBC Bank | 130 | (130 | ) | – | – | – | ||||||||||||||
JPMorgan Chase | 768 | (768 | ) | – | – | – | ||||||||||||||
UBS AG | 953 | (329 | ) | (573) | – | 51 | ||||||||||||||
|
| |||||||||||||||||||
Total | $4,281 | $(2,837 | ) | $ (926) | $– | $518 | ||||||||||||||
|
| |||||||||||||||||||
Liabilities: | ||||||||||||||||||||
Bank of America, N.A. | $1,636 | $ (461 | ) | $(1,174) | $– | $ 1 | ||||||||||||||
Citibank | 761 | (761 | ) | – | – | – | ||||||||||||||
Goldman Sachs | 388 | (388 | ) | – | – | – | ||||||||||||||
HSBC Bank | 1,044 | (130 | ) | (914) | – | – | ||||||||||||||
JPMorgan Chase | 1,414 | (768 | ) | (547) | – | 99 | ||||||||||||||
UBS AG | 329 | (329 | ) | – | – | – | ||||||||||||||
|
| |||||||||||||||||||
Total | $5,572 | $(2,837 | ) | $(2,635) | $– | $100 | ||||||||||||||
|
| |||||||||||||||||||
*Non-cash collateral is shown on a settlement basis.
6. Taxation and distributions
Federal income taxation – Each fund complies with the requirements under Subchapter M of the Internal Revenue Code applicable to mutual funds and intends to distribute substantially all of its net taxable income and net capital gains each year. The funds are not subject to income taxes to the extent such distributions are made. Therefore, no federal income tax provision is required.
As of and during the period ended June 30, 2017, none of the funds had a liability for any unrecognized tax benefits. Each fund recognizes interest and penalties, if any, related to unrecognized tax benefits as income tax expense in the statements of operations. During the period, none of the funds incurred any significant interest or penalties.
The funds are not subject to examination by U.S. federal tax authorities for tax years before 2013. Capital Income Builder is not subject to examination by U.S. federal tax authorities for tax years before 2014, the year the fund commenced operations.
| 162 | American Funds Insurance Series |
The funds are not subject to examination by state tax authorities for tax years before 2012. Managed Risk Growth Fund, Managed Risk International Fund, Managed Risk Blue Chip Income and Growth Fund and Managed Risk Growth-Income Fund are not subject to examination by state tax authorities for tax years before 2013, the year the funds commenced operations. Capital Income Builder is not subject to examination by state tax authorities for tax years before 2014, the year the fund commenced operations.
The following funds are not subject to examination by tax authorities outside the U.S. for the years indicated: Global Growth Fund, Global Small Capitalization Fund, Growth Fund, International Fund, New World Fund, Global Growth and Income Fund and Growth-Income Fund for tax years before 2010; International Growth and Income Fund for tax years before 2011; Global Balanced Fund for tax years before 2012; Asset Allocation Fund, Bond Fund and Global Bond Fund for tax years before 2014 and High-Income Bond Fund for tax years before 2015. All other funds are not subject to examination by tax authorities outside the U.S.
Non-U.S. taxation – Dividend and interest income are recorded net of non-U.S. taxes paid. The funds may file withholding tax reclaims in certain jurisdictions to recover a portion of amounts previously withheld. As a result of recent rulings from European courts, some of the funds filed for additional reclaims related to prior years. These reclaims are recorded when the amount is known and there are no significant uncertainties on collectability. Gains realized by the funds on the sale of securities in certain countries, if any, may be subject to non-U.S. taxes. If applicable, the funds record an estimated deferred tax liability based on unrealized gains to provide for potential non-U.S. taxes payable upon the sale of these securities.
Distributions – Distributions paid to shareholders are based on net investment income and net realized gains determined on a tax basis, which may differ from net investment income and net realized gains for financial reporting purposes. These differences are due primarily to different treatment for items such as currency gains and losses; short-term capital gains and losses; capital losses related to sales of certain securities within 30 days of purchase; unrealized appreciation of certain investments in securities outside the U.S.; deferred expenses; cost of investments sold; paydowns on fixed-income securities; net capital losses; net operating losses; non-U.S. taxes on capital gains and income on certain investments. The fiscal year in which amounts are distributed may differ from the year in which the net investment income and net realized gains are recorded by the funds for financial reporting purposes.
As indicated in the tables in this section, some of the funds had capital loss carryforwards available at December 31, 2016. These will be used to offset any capital gains realized by the funds in the current year or in subsequent years through the expiration date. Funds with capital loss carryforwards will not make distributions from capital gains while a capital loss carryforward remains.
Under the Regulated Investment Company Modernization Act of 2010 (the “Act”), net capital losses recognized after December 31, 2010, may be carried forward indefinitely, and their character is retained as short-term and/or long-term losses. Previously, net capital losses were carried forward for eight years and treated as short-term losses. As a transition rule, the Act requires that post-enactment net capital losses be used before pre-enactment net capital losses.
Additional tax basis disclosures are as follows (dollars in thousands):
| Global Growth Fund | Global Small Capitalization Fund | Growth Fund | International Fund | New World Fund | Blue Chip Income and Growth Fund | |||||||||||||||||||
As of December 31, 2016: | ||||||||||||||||||||||||
Undistributed ordinary income | $ | 5,309 | $ 16,070 | $ | 87,925 | $ | 31,353 | $ | 4,686 | $ | 69,604 | |||||||||||||
Undistributed long-term capital gain | 174,084 | – | 2,194,931 | 97,715 | – | 288,969 | ||||||||||||||||||
Capital loss carryforward: | ||||||||||||||||||||||||
No expiration | – | (55,253 | ) | – | – | (123,342 | ) | – | ||||||||||||||||
As of June 30, 2017: | ||||||||||||||||||||||||
Gross unrealized appreciation on investment securities | 1,723,657 | 995,883 | 7,934,845 | 1,907,042 | 566,247 | 1,945,350 | ||||||||||||||||||
Gross unrealized depreciation on investment securities | (67,086 | ) | (213,154 | ) | (588,537 | ) | (426,727 | ) | (107,302 | ) | (142,595 | ) | ||||||||||||
Net unrealized appreciation (depreciation) on investment securities | 1,656,571 | 782,729 | 7,346,308 | 1,480,315 | 458,945 | 1,802,755 | ||||||||||||||||||
Cost of investment securities | 4,204,900 | 3,253,729 | 16,281,406 | 7,308,386 | 2,671,625 | 7,058,768 | ||||||||||||||||||
| American Funds Insurance Series | 163 |
Global and Income | Growth- Income Fund | International and Income | Capital Income Builder | Asset Allocation Fund | Global Balanced Fund | |||||||||||||||||||
As of December 31, 2016: | ||||||||||||||||||||||||
Undistributed ordinary income | $ | 5,588 | $ | 95,174 | $ | 2,317 | $ | 21 | $ | 85,089 | $ | – | ||||||||||||
Late year ordinary loss deferral* | – | – | – | – | – | (473 | ) | |||||||||||||||||
Undistributed long-term capital gain | 33,689 | 1,784,903 | – | – | 1,054,302 | 933 | ||||||||||||||||||
Capital loss carryforward: | ||||||||||||||||||||||||
No expiration | – | – | (12,324 | ) | (6,972 | ) | – | – | ||||||||||||||||
As of June 30, 2017: | ||||||||||||||||||||||||
Gross unrealized appreciation on investment securities | 393,064 | 7,610,076 | 142,939 | 31,197 | 4,922,131 | 45,605 | ||||||||||||||||||
Gross unrealized depreciation on investment securities | (31,215 | ) | (875,561 | ) | (43,073 | ) | (13,180 | ) | (588,465 | ) | (6,316 | ) | ||||||||||||
Net unrealized appreciation (depreciation) on investment securities | 361,849 | 6,734,515 | 99,866 | 18,017 | 4,333,666 | 39,289 | ||||||||||||||||||
Cost of investment securities | 1,543,468 | 21,511,217 | 1,285,763 | 482,178 | 19,784,723 | 247,867 | ||||||||||||||||||
Bond Fund | Global Bond Fund | High- Fund | Mortgage Fund | Ultra-Short Fund |
U.S. | |||||||||||||||||||
As of December 31, 2016: | ||||||||||||||||||||||||
Undistributed ordinary income | $ | 176,002 | $ | 14,185 | $ | 19,119 | $ | 1,751 | $ | – | $ | 7,538 | ||||||||||||
Late year ordinary loss deferral* | – | (9,683 | ) | – | – | – | – | |||||||||||||||||
Undistributed long-term capital gain | 41,190 | 267 | – | 1,475 | – | – | ||||||||||||||||||
Capital loss carryforward: | ||||||||||||||||||||||||
No expiration | – | – | (170,563 | ) | – | – | (6,295 | ) | ||||||||||||||||
Expiring 2017 | – | – | (45,026 | ) | – | – | – | |||||||||||||||||
| – | – | (215,589 | ) | – | – | (6,295 | ) | |||||||||||||||||
As of June 30, 2017: | ||||||||||||||||||||||||
Gross unrealized appreciation on investment securities | 135,012 | 58,070 | 38,595 | 2,810 | 5 | 16,247 | ||||||||||||||||||
Gross unrealized depreciation on investment securities | (65,501 | ) | (41,725 | ) | (65,040 | ) | (1,580 | ) | (17 | ) | (13,386 | ) | ||||||||||||
Net unrealized appreciation (depreciation) on investment securities | 69,511 | 16,345 | (26,445 | ) | 1,230 | (12 | ) | 2,861 | ||||||||||||||||
Cost of investment securities | 12,410,374 | 2,394,346 | 1,591,454 | 398,451 | 310,858 | 3,001,914 | ||||||||||||||||||
| Managed Risk Growth Fund | Managed Risk International Fund | Managed Risk Blue Chip Income and Growth Fund | Managed Risk Growth- Income Fund | Managed Asset | ||||||||||||||||||||
As of December 31, 2016: | ||||||||||||||||||||||||
Undistributed ordinary income | $ | 729 | $ | 891 | $ | 4,274 | $ | 1,865 | $ | 31,585 | ||||||||||||||
Undistributed long-term capital gain | 4,133 | 1,396 | 5,561 | 7,717 | 38,638 | |||||||||||||||||||
As of June 30, 2017: | ||||||||||||||||||||||||
Gross unrealized appreciation on investment securities | – | 211 | 1,764 | – | 106,941 | |||||||||||||||||||
Gross unrealized depreciation on investment securities | (5,400 | ) | – | – | (10,243 | ) | – | |||||||||||||||||
Net unrealized appreciation (depreciation) on investment securities | (5,400 | ) | 211 | 1,764 | (10,243 | ) | 106,941 | |||||||||||||||||
Cost of investment securities | 251,943 | 123,633 | 360,192 | 196,103 | 3,983,210 | |||||||||||||||||||
*These deferrals are considered incurred in the subsequent year.
| 164 | American Funds Insurance Series |
The tax character of distributions paid to shareholders of each fund was as follows (dollars in thousands):
Global Growth Fund
| Six months ended June 30, 2017 | Year ended December 31, 2016 | |||||||||||||||||||||||||||
|
|
|
| |||||||||||||||||||||||||
| Share class | Ordinary income | Long-term capital gains | Total dividends and | Ordinary income | Long-term capital gains | Total dividends and | ||||||||||||||||||||||
|
|
| ||||||||||||||||||||||||||
Class 1 | $2,246 | $ 55,298 | $ 57,544 | $24,109 | $126,735 | $150,844 | ||||||||||||||||||||||
Class 1A* | 1 | 16 | 17 | |||||||||||||||||||||||||
Class 2 | 3,157 | 114,893 | 118,050 | 44,725 | 291,772 | 336,497 | ||||||||||||||||||||||
Class 4 | 79 | 3,889 | 3,968 | 945 | 7,147 | 8,092 | ||||||||||||||||||||||
|
|
|
| |||||||||||||||||||||||||
Total | $5,483 | $174,096 | $179,579 | $69,779 | $425,654 | $495,433 | ||||||||||||||||||||||
|
|
|
| |||||||||||||||||||||||||
Global Small Capitalization Fund
| ||||||||||||||||||||||||||||
| Six months ended June 30, 2017 | Year ended December 31, 2016 | |||||||||||||||||||||||||||
|
|
|
| |||||||||||||||||||||||||
| Share class | Ordinary income | Long-term capital gains | Total dividends paid | Ordinary income | Long-term capital gains | Total dividends and distributions paid | ||||||||||||||||||||||
|
|
| ||||||||||||||||||||||||||
Class 1 | $ 6,344 | $– | $ 6,344 | $11,807 | $273,687 | $285,494 | ||||||||||||||||||||||
Class 1A* | – | † | – | – | † | |||||||||||||||||||||||
Class 2 | 9,528 | – | 9,528 | 12,193 | 433,806 | 445,999 | ||||||||||||||||||||||
Class 4 | 220 | – | 220 | 142 | 6,715 | 6,857 | ||||||||||||||||||||||
|
|
|
| |||||||||||||||||||||||||
Total | $16,092 | $– | $16,092 | $24,142 | $714,208 | $738,350 | ||||||||||||||||||||||
|
|
|
| |||||||||||||||||||||||||
Growth Fund
| ||||||||||||||||||||||||||||
| Six months ended June 30, 2017 | Year ended December 31, 2016 | |||||||||||||||||||||||||||
|
|
|
| |||||||||||||||||||||||||
| Share class | Ordinary income | Long-term capital gains | Total dividends and distributions paid | Ordinary income | Long-term capital gains | Total dividends and distributions paid | ||||||||||||||||||||||
|
|
| ||||||||||||||||||||||||||
Class 1 | $30,665 | $ 713,987 | $ 744,652 | $ 68,458 | $ 603,135 | $ 671,593 | ||||||||||||||||||||||
Class 1A* | 3 | 63 | 66 | |||||||||||||||||||||||||
Class 2 | 54,612 | 1,409,266 | 1,463,878 | 105,243 | 1,244,603 | 1,349,846 | ||||||||||||||||||||||
Class 3 | 740 | 18,484 | 19,224 | 1,482 | 16,336 | 17,818 | ||||||||||||||||||||||
Class 4 | 1,903 | 53,128 | 55,031 | 2,484 | 36,779 | 39,263 | ||||||||||||||||||||||
|
|
|
| |||||||||||||||||||||||||
Total | $87,923 | $2,194,928 | $2,282,851 | $177,667 | $1,900,853 | $2,078,520 | ||||||||||||||||||||||
|
|
|
| |||||||||||||||||||||||||
International Fund
| ||||||||||||||||||||||||||||
| Six months ended June 30, 2017 | Year ended December 31, 2016 | |||||||||||||||||||||||||||
|
|
|
| |||||||||||||||||||||||||
| Share class | Ordinary income | Long-term capital gains | Total dividends and distributions paid | Ordinary income | Long-term capital gains | Total dividends and distributions paid | ||||||||||||||||||||||
|
|
| ||||||||||||||||||||||||||
Class 1 | $16,895 | $49,783 | $ 66,678 | $ 59,237 | $296,124 | $355,361 | ||||||||||||||||||||||
Class 1A* | 1 | 3 | 4 | |||||||||||||||||||||||||
Class 2 | 14,140 | 46,642 | 60,782 | 51,666 | 334,251 | 385,917 | ||||||||||||||||||||||
Class 3 | 103 | 331 | 434 | 389 | 2,445 | 2,834 | ||||||||||||||||||||||
Class 4 | 309 | 1,066 | 1,375 | 794 | 4,665 | 5,459 | ||||||||||||||||||||||
|
|
|
| |||||||||||||||||||||||||
Total | $31,448 | $97,825 | $129,273 | $112,086 | $637,485 | $749,571 | ||||||||||||||||||||||
|
|
|
| |||||||||||||||||||||||||
See end of tables for footnotes.
| American Funds Insurance Series | 165 |
New World Fund
| Six months ended June 30, 2017 | Year ended December 31, 2016 | |||||||||||||||||||||||||||
|
|
|
| |||||||||||||||||||||||||
| Share class | Ordinary income | Long-term capital gains | Total dividends paid | Ordinary income | Long-term capital gains | Total dividends paid | ||||||||||||||||||||||
|
|
| ||||||||||||||||||||||||||
Class 1 | $3,080 | $– | $3,080 | $17,725 | $– | $17,725 | ||||||||||||||||||||||
Class 1A* | – | † | – | – | † | |||||||||||||||||||||||
Class 2 | 1,283 | – | 1,283 | 7,100 | – | 7,100 | ||||||||||||||||||||||
Class 4 | 340 | – | 340 | 1,465 | – | 1,465 | ||||||||||||||||||||||
|
|
|
| |||||||||||||||||||||||||
Total | $4,703 | $– | $4,703 | $26,290 | $– | $26,290 | ||||||||||||||||||||||
|
|
|
| |||||||||||||||||||||||||
Blue Chip Income and Growth Fund
| ||||||||||||||||||||||||||||
| Six months ended June 30, 2017 | Year ended December 31, 2016 | |||||||||||||||||||||||||||
|
|
|
| |||||||||||||||||||||||||
| Share class | Ordinary income | Long-term capital gains | Total dividends and distributions paid | Ordinary income | Long-term capital gains | Total dividends and distributions paid | ||||||||||||||||||||||
|
|
| ||||||||||||||||||||||||||
Class 1 | $42,318 | $170,748 | $213,066 | $137,434 | $292,079 | $429,513 | ||||||||||||||||||||||
Class 1A* | 2 | 5 | 7 | |||||||||||||||||||||||||
Class 2 | 26,549 | 113,013 | 139,562 | 92,301 | 236,696 | 328,997 | ||||||||||||||||||||||
Class 4 | 1,292 | 5,605 | 6,897 | 2,759 | 4,934 | 7,693 | ||||||||||||||||||||||
|
|
|
| |||||||||||||||||||||||||
Total | $70,161 | $289,371 | $359,532 | $232,494 | $533,709 | $766,203 | ||||||||||||||||||||||
|
|
|
| |||||||||||||||||||||||||
Global Growth and Income Fund
| ||||||||||||||||||||||||||||
| Six months ended June 30, 2017 | Year ended December 31, 2016 | |||||||||||||||||||||||||||
|
|
|
| |||||||||||||||||||||||||
| Share class | Ordinary income | Long-term capital gains | Total dividends and distributions paid | Ordinary income | Long-term capital gains | Total dividends paid | ||||||||||||||||||||||
|
|
| ||||||||||||||||||||||||||
Class 1 | $1,322 | $ 7,109 | $ 8,431 | $11,131 | $– | $11,131 | ||||||||||||||||||||||
Class 1A* | – | † | – | † | – | † | ||||||||||||||||||||||
Class 2 | 4,262 | 26,178 | 30,440 | 25,283 | – | 25,283 | ||||||||||||||||||||||
Class 4 | 63 | 404 | 467 | 257 | – | 257 | ||||||||||||||||||||||
|
|
|
| |||||||||||||||||||||||||
Total | $5,647 | $33,691 | $39,338 | $36,671 | $– | $36,671 | ||||||||||||||||||||||
|
|
|
| |||||||||||||||||||||||||
| �� | ||||||||||||||||||||||||||||
Growth-Income Fund
| ||||||||||||||||||||||||||||
| Six months ended June 30, 2017 | Year ended December 31, 2016 | |||||||||||||||||||||||||||
|
|
|
| |||||||||||||||||||||||||
| Share class | Ordinary income | Long-term capital gains | Total dividends and distributions paid | Ordinary income | Long-term capital gains | Total dividends and distributions paid | ||||||||||||||||||||||
|
|
| ||||||||||||||||||||||||||
Class 1 | $50,076 | $ 884,958 | $ 935,034 | $263,296 | $1,172,060 | $1,435,356 | ||||||||||||||||||||||
Class 1A* | 1 | 16 | 17 | |||||||||||||||||||||||||
Class 2 | 43,011 | 853,292 | 896,303 | 250,881 | 1,329,722 | 1,580,603 | ||||||||||||||||||||||
Class 3 | 528 | 10,140 | 10,668 | 3,141 | 16,262 | 19,403 | ||||||||||||||||||||||
Class 4 | 1,662 | 36,513 | 38,175 | 8,305 | 45,834 | 54,139 | ||||||||||||||||||||||
|
|
|
| |||||||||||||||||||||||||
Total | $95,278 | $1,784,919 | $1,880,197 | $525,623 | $2,563,878 | $3,089,501 | ||||||||||||||||||||||
|
|
|
| |||||||||||||||||||||||||
| 166 | American Funds Insurance Series |
International Growth and Income Fund
| Six months ended June 30, 2017 | Year ended December 31, 2016 | |||||||||||||||||||||||||||
|
|
|
| |||||||||||||||||||||||||
| Share class | Ordinary income | Long-term capital gains | Total dividends paid | Ordinary income | Long-term capital gains | Total dividends and distributions paid | ||||||||||||||||||||||
|
|
| ||||||||||||||||||||||||||
Class 1 | $1,924 | $– | $1,924 | $23,268 | $3,458 | $26,726 | ||||||||||||||||||||||
Class 1A* | – | † | – | – | † | |||||||||||||||||||||||
Class 2 | 382 | – | 382 | 6,231 | 1,080 | 7,311 | ||||||||||||||||||||||
Class 4 | 54 | – | 54 | 895 | 149 | 1,044 | ||||||||||||||||||||||
|
|
|
| |||||||||||||||||||||||||
Total | $2,360 | $– | $2,360 | $30,394 | $4,687 | $35,081 | ||||||||||||||||||||||
|
|
|
| |||||||||||||||||||||||||
Capital Income Builder
| ||||||||||||||||||||||||||||
| Six months ended June 30, 2017 | Year ended December 31, 2016 | |||||||||||||||||||||||||||
|
|
|
| |||||||||||||||||||||||||
| Share class | Ordinary income | Long-term capital gains | Total dividends paid | Ordinary income | Long-term capital gains | Total dividends paid | ||||||||||||||||||||||
|
|
| ||||||||||||||||||||||||||
Class 1 | $2,810 | $– | $2,810 | $ 4,372 | $– | $ 4,372 | ||||||||||||||||||||||
Class 1A* | 1 | – | 1 | |||||||||||||||||||||||||
Class 2 | 7 | – | 7 | 2 | – | 2 | ||||||||||||||||||||||
Class 4 | 3,604 | – | 3,604 | 6,657 | – | 6,657 | ||||||||||||||||||||||
|
|
|
| |||||||||||||||||||||||||
Total | $6,422 | $– | $6,422 | $11,031 | $– | $11,031 | ||||||||||||||||||||||
|
|
|
| |||||||||||||||||||||||||
Asset Allocation Fund
| ||||||||||||||||||||||||||||
| Six months ended June 30, 2017 | Year ended December 31, 2016 | |||||||||||||||||||||||||||
|
|
|
| |||||||||||||||||||||||||
| Share class | Ordinary income | Long-term capital gains | Total dividends and distributions paid | Ordinary income | Long-term capital gains | Total distributions paid | ||||||||||||||||||||||
|
|
| ||||||||||||||||||||||||||
Class 1 | $56,922 | $ 666,425 | $ 723,347 | $229,739 | $280,306 | $510,045 | ||||||||||||||||||||||
Class 1A* | 6 | 70 | 76 | |||||||||||||||||||||||||
Class 2 | 18,277 | 241,077 | 259,354 | 81,019 | 120,303 | 201,322 | ||||||||||||||||||||||
Class 3 | 130 | 1,646 | 1,776 | 580 | 860 | 1,440 | ||||||||||||||||||||||
Class 4 | 10,033 | 145,207 | 155,240 | 38,591 | 61,673 | 100,264 | ||||||||||||||||||||||
|
|
|
| |||||||||||||||||||||||||
Total | $85,368 | $1,054,425 | $1,139,793 | $349,929 | $463,142 | $813,071 | ||||||||||||||||||||||
|
|
|
| |||||||||||||||||||||||||
Global Balanced Fund
| ||||||||||||||||||||||||||||
| Six months ended June 30, 2017 | Year ended December 31, 2016 | |||||||||||||||||||||||||||
|
|
|
| |||||||||||||||||||||||||
| Share class | Ordinary income | Long-term capital gains | Total distributions paid | Ordinary income | Long-term capital gains | Total dividends paid | ||||||||||||||||||||||
|
|
| ||||||||||||||||||||||||||
Class 1 | $– | $243 | $243 | $ 939 | $– | $ 939 | ||||||||||||||||||||||
Class 1A* | – | – | † | – | † | |||||||||||||||||||||||
Class 2 | – | 628 | 628 | 2,225 | – | 2,225 | ||||||||||||||||||||||
Class 4 | – | 63 | 63 | 121 | – | 121 | ||||||||||||||||||||||
|
|
|
| |||||||||||||||||||||||||
Total | $– | $934 | $934 | $3,285 | $– | $3,285 | ||||||||||||||||||||||
|
|
|
| |||||||||||||||||||||||||
See end of tables for footnotes.
| American Funds Insurance Series | 167 |
Bond Fund
| Six months ended June 30, 2017 | Year ended December 31, 2016 | |||||||||||||||||||||||||||
|
|
|
| |||||||||||||||||||||||||
| Share class | Ordinary income | Long-term capital gains | Total dividends and distributions paid | Ordinary income | Long-term capital gains | Total dividends and distributions paid | ||||||||||||||||||||||
|
|
| ||||||||||||||||||||||||||
Class 1 | $110,298 | $25,594 | $135,892 | $138,255 | $11,305 | $149,560 | ||||||||||||||||||||||
Class 1A* | 6 | 1 | 7 | |||||||||||||||||||||||||
Class 2 | 64,031 | 15,280 | 79,311 | 74,576 | 7,465 | 82,041 | ||||||||||||||||||||||
Class 4 | 1,814 | 441 | 2,255 | 1,614 | 150 | 1,764 | ||||||||||||||||||||||
|
|
|
| |||||||||||||||||||||||||
Total | $176,149 | $41,316 | $217,465 | $214,445 | $18,920 | $233,365 | ||||||||||||||||||||||
|
|
|
| |||||||||||||||||||||||||
Global Bond Fund
| ||||||||||||||||||||||||||||
| Six months ended June 30, 2017 | Year ended December 31, 2016 | |||||||||||||||||||||||||||
|
|
|
| |||||||||||||||||||||||||
| Share class | Ordinary income | Long-term capital gains | Total distributions paid | Ordinary income | Long-term capital gains | Total dividends and distributions paid | ||||||||||||||||||||||
|
|
| ||||||||||||||||||||||||||
Class 1 | $ 7,194 | $103 | $ 7,297 | $10,101 | $ 872 | $10,973 | ||||||||||||||||||||||
Class 1A* | – | † | – | † | – | † | ||||||||||||||||||||||
Class 2 | 6,965 | 100 | 7,065 | 7,811 | 923 | 8,734 | ||||||||||||||||||||||
Class 4 | 87 | 1 | 88 | 68 | 8 | 76 | ||||||||||||||||||||||
|
|
|
| |||||||||||||||||||||||||
Total | $14,246 | $204 | $14,450 | $17,980 | $1,803 | $19,783 | ||||||||||||||||||||||
|
|
|
| |||||||||||||||||||||||||
High-Income Bond Fund
| ||||||||||||||||||||||||||||
| Six months ended June 30, 2017 | Year ended December 31, 2016 | |||||||||||||||||||||||||||
|
|
|
| |||||||||||||||||||||||||
| Share class | Ordinary income | Long-term capital gains | Total dividends paid | Ordinary income | Long-term capital gains | Total dividends paid | ||||||||||||||||||||||
|
|
| ||||||||||||||||||||||||||
Class 1 | $ 9,084 | $– | $ 9,084 | $ 57,104 | $– | $ 57,104 | ||||||||||||||||||||||
Class 1A* | 1 | – | 1 | |||||||||||||||||||||||||
Class 2 | 9,562 | – | 9,562 | 47,007 | – | 47,007 | ||||||||||||||||||||||
Class 3 | 156 | – | 156 | 746 | – | 746 | ||||||||||||||||||||||
Class 4 | 353 | – | 353 | 1,283 | – | 1,283 | ||||||||||||||||||||||
|
|
|
| |||||||||||||||||||||||||
Total | $19,156 | $– | $19,156 | $106,140 | $– | $106,140 | ||||||||||||||||||||||
|
|
|
| |||||||||||||||||||||||||
Mortgage Fund
| ||||||||||||||||||||||||||||
| Six months ended June 30, 2017 | Year ended December 31, 2016 | |||||||||||||||||||||||||||
|
|
|
| |||||||||||||||||||||||||
| Share class | Ordinary income | Long-term capital gains | Total dividends and distributions paid | Ordinary income | Long-term capital gains | Total dividends and distributions paid | ||||||||||||||||||||||
|
|
| ||||||||||||||||||||||||||
Class 1 | $1,450 | $1,186 | $2,636 | $7,780 | $152 | $7,932 | ||||||||||||||||||||||
Class 1A* | – | † | – | † | – | † | ||||||||||||||||||||||
Class 2 | 291 | 262 | 553 | 1,648 | 35 | 1,683 | ||||||||||||||||||||||
Class 4 | 40 | 39 | 79 | 222 | 5 | 227 | ||||||||||||||||||||||
|
|
|
| |||||||||||||||||||||||||
Total | $1,781 | $1,487 | $3,268 | $9,650 | $192 | $9,842 | ||||||||||||||||||||||
|
|
|
| |||||||||||||||||||||||||
| 168 | American Funds Insurance Series |
U.S. Government/AAA-Rated Securities Fund
| Six months ended June 30, 2017 | Year ended December 31, 2016 | |||||||||||||||||||||||||||
|
|
|
| |||||||||||||||||||||||||
| Share class | Ordinary income | Long-term capital gains | Total dividends paid | Ordinary income | Long-term capital gains | Total dividends and distributions paid | ||||||||||||||||||||||
|
|
| ||||||||||||||||||||||||||
Class 1 | $ | 3,834 | $ | – | $ | 3,834 | $ | 44,429 | $ | 7,982 | $ | 52,411 | ||||||||||||||||
Class 1A* | – | † | – | – | † | |||||||||||||||||||||||
Class 2 | 3,682 | – | 3,682 | 43,530 | 8,728 | 52,258 | ||||||||||||||||||||||
Class 3 | 27 | – | 27 | 307 | 60 | 367 | ||||||||||||||||||||||
Class 4 | 111 | – | 111 | 1,615 | 371 | 1,986 | ||||||||||||||||||||||
|
|
|
| |||||||||||||||||||||||||
Total | $ | 7,654 | $ | – | $ | 7,654 | $ | 89,881 | $ | 17,141 | $ | 107,022 | ||||||||||||||||
|
|
|
| |||||||||||||||||||||||||
Managed Risk Growth Fund
| ||||||||||||||||||||||||||||
| Six months ended June 30, 2017 | Year ended December 31, 2016 | |||||||||||||||||||||||||||
|
|
|
| |||||||||||||||||||||||||
| Share class | Ordinary income | Long-term capital gains | Total dividends and distributions paid | Ordinary income | Long-term capital gains | Total dividends and distributions paid | ||||||||||||||||||||||
|
|
| ||||||||||||||||||||||||||
Class P1 | $ | 7 | $ | 22 | $ | 29 | $ | 3 | $ | 57 | $ | 60 | ||||||||||||||||
Class P2 | 727 | 4,120 | 4,847 | 327 | 14,955 | 15,282 | ||||||||||||||||||||||
|
|
|
| |||||||||||||||||||||||||
Total | $ | 734 | $ | 4,142 | $ | 4,876 | $ | 330 | $ | 15,012 | $ | 15,342 | ||||||||||||||||
|
|
|
| |||||||||||||||||||||||||
Managed Risk International Fund
| ||||||||||||||||||||||||||||
| Six months ended June 30, 2017 | Year ended December 31, 2016 | |||||||||||||||||||||||||||
|
|
|
| |||||||||||||||||||||||||
| Share class | Ordinary income | Long-term capital gains | Total dividends and distributions paid | Ordinary income | Long-term capital gains | Total dividends and distributions paid | ||||||||||||||||||||||
|
|
| ||||||||||||||||||||||||||
Class P1 | $ | 1 | $ | 2 | $ | 3 | $ | 2 | $ | 4 | $ | 6 | ||||||||||||||||
Class P2 | 899 | 1,401 | 2,300 | 841 | 2,181 | 3,022 | ||||||||||||||||||||||
|
|
|
| |||||||||||||||||||||||||
Total | $ | 900 | $ | 1,403 | $ | 2,303 | $ | 843 | $ | 2,185 | $ | 3,028 | ||||||||||||||||
|
|
|
| |||||||||||||||||||||||||
Managed Risk Blue Chip Income and Growth Fund
|
| |||||||||||||||||||||||||||
| Six months ended June 30, 2017 | Year ended December 31, 2016 | |||||||||||||||||||||||||||
|
|
|
| |||||||||||||||||||||||||
| Share class | Ordinary income | Long-term capital gains | Total dividends and distributions paid | Ordinary income | Long-term capital gains | Total dividends and distributions paid | ||||||||||||||||||||||
|
|
| ||||||||||||||||||||||||||
Class P1 | $ | 2 | $ | 3 | $ | 5 | $ | 5 | $ | 8 | $ | 13 | ||||||||||||||||
Class P2 | 4,292 | 5,566 | 9,858 | 3,370 | 5,915 | 9,285 | ||||||||||||||||||||||
|
|
|
| |||||||||||||||||||||||||
Total | $ | 4,294 | $ | 5,569 | $ | 9,863 | $ | 3,375 | $ | 5,923 | $ | 9,298 | ||||||||||||||||
|
|
|
| |||||||||||||||||||||||||
Managed Risk Growth-Income Fund
|
| |||||||||||||||||||||||||||
| Six months ended June 30, 2017 | Year ended December 31, 2016 | |||||||||||||||||||||||||||
|
|
|
| |||||||||||||||||||||||||
| Share class | Ordinary income | Long-term capital gains | Total dividends and distributions paid | Ordinary income | Long-term capital gains | Total dividends and distributions paid | ||||||||||||||||||||||
|
|
| ||||||||||||||||||||||||||
Class P1 | $ | 19 | $ | 73 | $ | 92 | $ | 15 | $ | 64 | $ | 79 | ||||||||||||||||
Class P2 | 1,848 | 7,653 | 9,501 | 1,692 | 8,401 | 10,093 | ||||||||||||||||||||||
|
|
|
| |||||||||||||||||||||||||
Total | $ | 1,867 | $ | 7,726 | $ | 9,593 | $ | 1,707 | $ | 8,465 | $ | 10,172 | ||||||||||||||||
|
|
|
| |||||||||||||||||||||||||
See end of tables for footnotes.
| American Funds Insurance Series | 169 |
Managed Risk Asset Allocation Fund
| Six months ended June 30, 2017 | Year ended December 31, 2016 | |||||||||||||||||||||||||||
|
|
|
| |||||||||||||||||||||||||
| Share class | Ordinary income | Long-term capital gains | Total dividends and distributions paid | Ordinary income | Long-term capital gains | Total dividends and distributions paid | ||||||||||||||||||||||
|
|
| ||||||||||||||||||||||||||
Class P1 | $ | 11,454 | $ | 13,811 | $ | 25,265 | $ | 16,330 | $ | 29,417 | $ | 45,747 | ||||||||||||||||
Class P2 | 20,268 | 24,931 | 45,199 | 27,858 | 64,161 | 92,019 | ||||||||||||||||||||||
|
|
|
| |||||||||||||||||||||||||
Total | $ | 31,722 | $ | 38,742 | $ | 70,464 | $ | 44,188 | $ | 93,578 | $ | 137,766 | ||||||||||||||||
|
|
|
| |||||||||||||||||||||||||
*Class 1A shares began investment operations on January 6, 2017.
†Amount less than one thousand.
7. Fees and transactions
CRMC, the series’ investment adviser, is the parent company of American Funds Distributors,® Inc. (“AFD”), the distributor of the series’ shares, and American Funds Service Company® (“AFS”), the series’ transfer agent. CRMC, AFD and AFS are considered related parties to the series.
Investment advisory services – The series has an investment advisory and service agreement with CRMC that provides for monthly fees accrued daily. These fees are based on annual rates that generally decrease as average net asset levels increase. CRMC receives investment advisory fees from the underlying funds held by the managed risk funds. These fees are included in the net effective expense ratios that are provided as supplementary information in the financial highlights tables. Subadvisory fees for the managed risk funds are paid by CRMC to Milliman FRM. The managed risk funds are not responsible for paying any subadvisory fees.
Investment advisory services waivers – CRMC is waiving a portion of its investment advisory services fees for each of the managed risk funds. Investment advisory services fees are presented in each fund’s statement of operations gross of the waivers from CRMC. For the six months ended June 30, 2017, total investment advisory services fees waived by CRMC were $1,178,000.
| 170 | American Funds Insurance Series |
The range of rates, net asset levels and the current annualized rates of average net assets for each fund before and after any investment advisory services waivers (if applicable), are as follows:
| Rates | Net asset level (in billions) | For the before waiver | For the after waiver | |||||||||||||||||||||
| Fund | Beginning with | Ending with | Up to | In excess of | ||||||||||||||||||||
Global Growth Fund | .690 | % | .460 | % | $ | .6 | $ | 5.0 | .523 | % | .523 | % | ||||||||||||
Global Small Capitalization Fund | .800 | .635 | .6 | 5.0 | .698 | .698 | ||||||||||||||||||
Growth Fund | .500 | .280 | .6 | 34.0 | .327 | .327 | ||||||||||||||||||
International Fund | .690 | .430 | .5 | 21.0 | .498 | .498 | ||||||||||||||||||
New World Fund | .850 | .620 | .5 | 2.5 | .707 | .707 | ||||||||||||||||||
Blue Chip Income and Growth Fund | .500 | .360 | .6 | 6.5 | .389 | .389 | ||||||||||||||||||
Global Growth and Income Fund | .690 | .480 | .6 | 3.0 | .593 | .593 | ||||||||||||||||||
Growth-Income Fund | .500 | .219 | .6 | 34.0 | .264 | .264 | ||||||||||||||||||
International Growth and Income Fund | .690 | .530 | .5 | 1.0 | .622 | .622 | ||||||||||||||||||
Capital Income Builder Fund | .500 | all | .500 | .500 | ||||||||||||||||||||
Asset Allocation Fund | .500 | .240 | .6 | 21.0 | .269 | .269 | ||||||||||||||||||
Global Balanced Fund | .660 | .510 | .5 | 1.0 | .660 | .660 | ||||||||||||||||||
Bond Fund | .480 | .330 | .6 | 8.0 | .361 | .361 | ||||||||||||||||||
Global Bond Fund | .570 | .450 | 1.0 | 3.0 | .530 | .530 | ||||||||||||||||||
High-Income Bond Fund | .500 | .420 | .6 | 2.0 | .465 | .465 | ||||||||||||||||||
Mortgage Fund | .420 | .290 | .6 | 3.0 | .420 | .420 | ||||||||||||||||||
Ultra-Short Bond Fund | .320 | .270 | 1.0 | 2.0 | .320 | .320 | ||||||||||||||||||
U.S. Government/AAA-Rated Securities Fund | .420 | .290 | .6 | 3.0 | .338 | .338 | ||||||||||||||||||
Managed Risk Growth Fund | .150 | all | .150 | .100 | ||||||||||||||||||||
Managed Risk International Fund | .150 | all | .150 | .100 | ||||||||||||||||||||
Managed Risk Blue Chip Income and Growth Fund | .150 | all | .150 | .100 | ||||||||||||||||||||
Managed Risk Growth-Income Fund | .150 | all | .150 | .100 | ||||||||||||||||||||
Managed Risk Asset Allocation Fund
|
| .150
|
|
| all
|
|
| .150
|
|
| .100
|
| ||||||||||||
Distribution services – The series has plans of distribution for all share classes except Class 1. Under the plans, the board of trustees approves certain categories of expenses that are used to finance activities primarily intended to sell fund shares. The plans provide for payments to pay service fees to firms that have entered into agreements with the series. These payments, based on an annualized percentage of average daily net assets, range from 0.18% to 0.50% as noted in the table below. In some cases, the board of trustees has limited the amounts that may be paid to less than the maximum allowed by the plans.
| Share class | Currently approved limits | Plan limits | ||||||||
Class 1A | 0.00 | % | 0.25 | % | ||||||
Class 2 | 0.25 | 0.25 | ||||||||
Class 3 | 0.18 | 0.18 | ||||||||
Class 4 | 0.25 | 0.25 | ||||||||
Class P1 | 0.00 | 0.25 | ||||||||
Class P2
|
| 0.25
|
|
| 0.50
|
| ||||
Insurance administrative services – The series has an insurance administrative services plan for Class 1A, 4, P1 and P2 shares. Under the plan, these share classes pay 0.25% of each insurance company’s respective average daily net assets in each share class to compensate the insurance companies for services provided to their separate accounts and contractholders for which the shares of the fund are beneficially owned as underlying investments of such contractholders’ annuities. These services include, but are not limited to, maintenance, shareholder communications and transactional services. The insurance companies are not related parties to the series.
Transfer agent services – The series has a shareholder services agreement with AFS under which the funds compensate AFS for providing transfer agent services to all of the funds’ share classes. These services include recordkeeping, shareholder communications and transaction processing. In addition, the managed risk funds reimburse AFS for amounts paid to third parties for performing transfer agent services on behalf of fund shareholders.
Administrative services – The series has an administrative services agreement with CRMC to provide administrative services to all of the funds’ share classes. The services include, but are not limited to, coordinating, monitoring, assisting and overseeing third parties that provide services to fund shareholders. Under the agreement, each share class of each fund, except the managed risk funds, pays an
| American Funds Insurance Series | 171 |
annual fee of 0.01% based on its respective average daily net assets to compensate CRMC for providing administrative services. For the managed risk funds, CRMC receives administrative services fees of 0.01% of average daily net assets from Class 1 shares of the underlying funds for administrative services provided to the series.
Accounting and administrative services – The managed risk funds have a subadministration agreement with BNY Mellon under which the fund compensates BNY Mellon for providing accounting and administrative services to each of the managed risk funds’ share classes. These services include, but are not limited to, fund accounting (including calculation of net asset value), financial reporting and tax services. BNY Mellon is not a related party to the managed risk funds.
Miscellaneous fee reimbursements – CRMC is currently reimbursing a portion of miscellaneous fees and expenses for each of the managed risk funds. Miscellaneous expenses exclude investment advisory services and distribution services fees. For the six months ended June 30, 2017, total expenses reimbursed by CRMC were $473,000.
Class-specific expenses under the agreements described above were as follows (dollars in thousands):
Global Growth Fund
| Share class | Distribution services | Insurance administrative services | Administrative services | |||||||||
| ||||||||||||
Class 1 | Not applicable | Not applicable | $ 89 | |||||||||
Class 1A* | $ – | $ – | † | – | † | |||||||
Class 2 | 4,609 | Not applicable | 184 | |||||||||
Class 4 | 140 | 140 | 6 | |||||||||
|
| |||||||||||
Total class-specific expenses | $4,749 | $140 | $279 | |||||||||
|
| |||||||||||
International Fund
| Share class | Distribution services | Insurance administrative services | Administrative services | |||||||||
| ||||||||||||
Class 1 | Not applicable | Not applicable | $203 | |||||||||
Class 1A* | $ – | $ – | † | – | † | |||||||
Class 2 | 4,966 | Not applicable | 199 | |||||||||
Class 3 | 26 | Not applicable | 2 | |||||||||
Class 4 | 100 | 100 | 4 | |||||||||
|
| |||||||||||
Total class-specific expenses | $5,092 | $100 | $408 | |||||||||
|
| |||||||||||
Global Small Capitalization Fund
| Share class | Distribution services | Insurance administrative services | Administrative services | |||||||||
| ||||||||||||
Class 1 | Not applicable | Not applicable | $ 81 | |||||||||
Class 1A* | $ – | $ – | † | – | † | |||||||
Class 2 | 2,995 | Not applicable | 120 | |||||||||
Class 4 | 65 | 65 | 2 | |||||||||
|
| |||||||||||
Total class-specific expenses | $3,060 | $65 | $203 | |||||||||
|
| |||||||||||
New World Fund
| Share class | Distribution services | Insurance administrative services | Administrative services | |||||||||
| ||||||||||||
Class 1 | Not applicable | Not applicable | $ 94 | |||||||||
Class 1A* | $ – | $ – | † | – | † | |||||||
Class 2 | 1,199 | Not applicable | 48 | |||||||||
Class 4 | 351 | 351 | 14 | |||||||||
|
| |||||||||||
Total class-specific expenses | $1,550 | $351 | $156 | |||||||||
|
| |||||||||||
Growth Fund
| Share class | Distribution services | Insurance administrative services | Administrative services | |||||||||
| ||||||||||||
Class 1 | Not applicable | Not applicable | $ 370 | |||||||||
Class 1A* | $ – | $ – | † | – | † | |||||||
Class 2 | 18,358 | Not applicable | 734 | |||||||||
Class 3 | 175 | Not applicable | 10 | |||||||||
Class 4 | 645 | 645 | 26 | |||||||||
|
| |||||||||||
Total class-specific expenses | $19,178 | $645 | $1,140 | |||||||||
|
| |||||||||||
Blue Chip Income and Growth Fund
| Share class | Distribution services | Insurance administrative services | Administrative services | |||||||||
| ||||||||||||
Class 1 | Not applicable | Not applicable | $268 | |||||||||
Class 1A* | $ – | $ – | † | – | † | |||||||
Class 2 | 4,283 | Not applicable | 171 | |||||||||
Class 4 | 195 | 195 | 8 | |||||||||
|
| |||||||||||
Total class-specific expenses | $4,478 | $195 | $447 | |||||||||
|
| |||||||||||
| 172 | American Funds Insurance Series |
Global Growth and Income Fund
| Share class | Distribution services | Insurance administrative services | Administrative services | |||||||||
Class 1 | Not applicable | Not applicable | $ 29 | |||||||||
Class 1A* | $ — | $ — | — | |||||||||
Class 2 | 1,810 | Not applicable | 72 | |||||||||
Class 4 | 24 | 24 | 1 | |||||||||
|
| |||||||||||
Total class-specific expenses | $1,834 | $24 | $102 | |||||||||
|
| |||||||||||
Global Balanced Fund
| Share class | Distribution services | Insurance administrative services | Administrative services | |||||||||
Class 1 | Not applicable | Not applicable | $ 3 | |||||||||
Class 1A* | $ — | $ — | — | |||||||||
Class 2 | 232 | Not applicable | 9 | |||||||||
Class 4 | 18 | 18 | 1 | |||||||||
|
| |||||||||||
Total class-specific expenses | $250 | $18 | $13 | |||||||||
|
| |||||||||||
Growth-Income Fund
| Share class | Distribution services | Insurance administrative services | Administrative services | |||||||||
Class 1 | Not applicable | Not applicable | $ 670 | |||||||||
Class 1A* | $ — | $ — | † | — | † | |||||||
Class 2 | 16,474 | Not applicable | 659 | |||||||||
Class 3 | 144 | Not applicable | 8 | |||||||||
Class 4 | 671 | 671 | 27 | |||||||||
|
| |||||||||||
Total class-specific expenses | $17,289 | $671 | $1,364 | |||||||||
|
| |||||||||||
Bond Fund
| Share class | Distribution services | Insurance administrative services | Administrative services | |||||||||
Class 1 | Not applicable | Not applicable | $349 | |||||||||
Class 1A* | $ — | $ — | † | — | † | |||||||
Class 2 | 4,920 | Not applicable | 197 | |||||||||
Class 4 | 136 | 136 | 5 | |||||||||
|
| |||||||||||
Total class-specific expenses | $5,056 | $136 | $551 | |||||||||
|
| |||||||||||
International Growth and Income Fund
| Share class | Distribution services | Insurance administrative services | Administrative services | |||||||||
Class 1 | Not applicable | Not applicable | $44 | |||||||||
Class 1A* | $ — | $ — | † | — | † | |||||||
Class 2 | 318 | Not applicable | 13 | |||||||||
Class 4 | 52 | 52 | 2 | |||||||||
|
| |||||||||||
Total class-specific expenses | $370 | $52 | $59 | |||||||||
|
| |||||||||||
Global Bond Fund
| Share class | Distribution services | Insurance administrative services | Administrative services | |||||||||
Class 1 | Not applicable | Not applicable | $ 58 | |||||||||
Class 1A* | $ — | $ — | † | — | † | |||||||
Class 2 | 1,422 | Not applicable | 57 | |||||||||
Class 4 | 16 | 16 | — | † | ||||||||
|
| |||||||||||
Total class-specific expenses | $1,438 | $16 | $115 | |||||||||
|
| |||||||||||
Capital Income Builder
| Share class | Distribution services | Insurance administrative services | Administrative services | |||||||||
Class 1 | Not applicable | Not applicable | $ 9 | |||||||||
Class 1A* | $ — | $ — | † | — | † | |||||||
Class 2 | 1 | Not applicable | — | † | ||||||||
Class 4 | 345 | 345 | 14 | |||||||||
|
| |||||||||||
Total class-specific expenses | $346 | $345 | $23 | |||||||||
|
| |||||||||||
High-Income Bond Fund
| Share class | Distribution services | Insurance administrative services | Administrative services | |||||||||
Class 1 | Not applicable | Not applicable | $47 | |||||||||
Class 1A* | $ — | $ — | † | — | † | |||||||
Class 2 | 996 | Not applicable | 40 | |||||||||
Class 3 | 12 | Not applicable | 1 | |||||||||
Class 4 | 32 | 32 | 1 | |||||||||
|
| |||||||||||
Total class-specific expenses | $1,040 | $32 | $89 | |||||||||
|
| |||||||||||
Asset Allocation Fund
| Share class | Distribution services | Insurance administrative services | Administrative services | |||||||||
Class 1 | Not applicable | Not applicable | $ 702 | |||||||||
Class 1A* | $ — | $ 1 | — | † | ||||||||
Class 2 | 6,593 | Not applicable | 264 | |||||||||
Class 3 | 33 | Not applicable | 2 | |||||||||
Class 4 | 3,822 | 3,822 | 153 | |||||||||
|
| |||||||||||
Total class-specific expenses | $10,448 | $3,823 | $1,121 | |||||||||
|
| |||||||||||
See end of tables for footnotes.
| American Funds Insurance Series | 173 |
Mortgage Fund
| Share class | Distribution services | Insurance administrative services | Administrative services | |||||||||
| ||||||||||||
Class 1 | Not applicable | Not applicable | $14 | |||||||||
Class 1A* | $ – | $ – | † | – | † | |||||||
Class 2 | 78 | Not applicable | 3 | |||||||||
Class 4 | 11 | 11 | – | |||||||||
|
| |||||||||||
Total class-specific expenses | $89 | $11 | $17 | |||||||||
|
| |||||||||||
Managed Risk International Fund
| Distribution services | Insurance administrative services | |||||||
| ||||||||
Class P1 | Not applicable | $ – | † | |||||
Class P2 | $140 | 140 | ||||||
|
| |||||||
Total class-specific expenses | $140 | $140 | ||||||
|
| |||||||
Ultra-Short Bond Fund
| Share class | Distribution services | Insurance administrative services | Administrative services | |||||||||
| ||||||||||||
Class 1 | Not applicable | Not applicable | $ 2 | |||||||||
Class 1A* | $ – | $ – | – | |||||||||
Class 2 | 341 | Not applicable | 13 | |||||||||
Class 3 | 4 | Not applicable | – | |||||||||
Class 4 | 17 | 17 | 1 | |||||||||
|
| |||||||||||
Total class-specific expenses | $362 | $17 | $16 | |||||||||
|
| |||||||||||
Managed Risk Blue Chip
Income and Growth Fund
| Distribution services | Insurance administrative services | |||||||
| ||||||||
Class P1 | Not applicable | $ – | † | |||||
Class P2 | $431 | 432 | ||||||
|
| |||||||
Total class-specific expenses | $431 | $432 | ||||||
|
| |||||||
U.S. Government/AAA-Rated Securities Fund
| Share class | Distribution services | Insurance administrative services | Administrative services | |||||||||
| ||||||||||||
Class 1 | Not applicable | Not applicable | $ 73 | |||||||||
Class 1A* | $ – | $ – | † | – | † | |||||||
Class 2 | 1,856 | Not applicable | 74 | |||||||||
Class 3 | 9 | Not applicable | 1 | |||||||||
Class 4 | 68 | 68 | 3 | |||||||||
|
| |||||||||||
Total class-specific expenses | $1,933 | $68 | $151 | |||||||||
|
| |||||||||||
Managed Risk Growth-Income Fund
| Distribution services | Insurance administrative services | |||||||
| ||||||||
Class P1 | Not applicable | $ 2 | ||||||
Class P2 | $217 | 217 | ||||||
|
| |||||||
Total class-specific expenses | $217 | $219 | ||||||
|
| |||||||
Managed Risk Growth Fund
| Distribution services | Insurance administrative services | |||||||
| ||||||||
Class P1 | Not applicable | $ 1 | ||||||
Class P2 | $283 | 283 | ||||||
|
| |||||||
Total class-specific expenses | $283 | $284 | ||||||
|
| |||||||
* Class 1A shares began investment operations on January 6, 2017.
† Amount less than one thousand.
Managed Risk Asset Allocation Fund
| Distribution services | Insurance administrative services | |||||||
| ||||||||
Class P1 | Not applicable | $1,688 | ||||||
Class P2 | $3,127 | 3,127 | ||||||
|
| |||||||
Total class-specific expenses | $3,127 | $4,815 | ||||||
|
| |||||||
| 174 | American Funds Insurance Series |
Trustees’ deferred compensation – Trustees who are unaffiliated with CRMC may elect to defer the cash payment of part or all of their compensation. These deferred amounts, which remain as liabilities of the funds, are treated as if invested in one or more of the American Funds. These amounts represent general, unsecured liabilities of the funds and vary according to the total returns of the selected funds. Trustees’ compensation, shown on the accompanying financial statements, reflects current fees (either paid in cash or deferred) and a net increase in the value of the deferred amounts as follows (dollars in thousands):
| Current fees | Increase in value of deferred amounts | Total trustees’ compensation | ||||||||||
Global Growth Fund | $19 | $ 8 | $ 27 | |||||||||
Global Small Capitalization Fund | 14 | 6 | 20 | |||||||||
Growth Fund | 80 | 31 | 111 | |||||||||
International Fund | 28 | 11 | 39 | |||||||||
New World Fund | 11 | 4 | 15 | |||||||||
Blue Chip Income and Growth Fund | 32 | 12 | 44 | |||||||||
Global Growth and Income Fund | 7 | 3 | 10 | |||||||||
Growth-Income Fund | 96 | 37 | 133 | |||||||||
International Growth and Income Fund | 4 | 2 | 6 | |||||||||
Capital Income Builder | 1 | 1 | 2 | |||||||||
Asset Allocation Fund | 78 | 31 | 109 | |||||||||
Global Balanced Fund | 1 | — | * | 1 | ||||||||
Bond Fund | 40 | 15 | 55 | |||||||||
Global Bond Fund | 8 | 3 | 11 | |||||||||
High-Income Bond Fund | 7 | 2 | 9 | |||||||||
Mortgage Fund | 1 | — | * | 1 | ||||||||
Ultra-Short Bond Fund | 1 | — | * | 1 | ||||||||
U.S. Government/AAA-Rated Securities Fund | 11 | 4 | 15 | |||||||||
Managed Risk Growth Fund | 1 | — | * | 1 | ||||||||
Managed Risk International Fund | 1 | — | * | 1 | ||||||||
Managed Risk Blue Chip Income and Growth Fund | 2 | — | * | 2 | ||||||||
Managed Risk Growth-Income Fund | 1 | — | * | 1 | ||||||||
Managed Risk Asset Allocation Fund | 13 | 5 | 18 | |||||||||
*Amount less than one thousand.
Affiliated officers and trustees – Officers and certain trustees of the series are or may be considered to be affiliated with CRMC, AFD and AFS. No affiliated officers or trustees received any compensation directly from any fund in the series.
Security transactions with related funds – The funds may purchase from, or sell securities to, other CRMC-managed funds (or funds managed by certain affiliates of CRMC) under procedures adopted by the fund’s board of trustees. The funds involved in such transactions are considered related by virtue of having a common investment adviser (or affiliated investment advisers), common trustees and/or common officers. When such transactions occur, each transaction is executed at the current market price of the security and no brokerage commissions or fees are paid in accordance with Rule 17a-7 of the 1940 Act.
The following table presents purchase and sales transactions between each fund and related funds as of June 30, 2017 (dollars in thousands):
| Purchases | Sales | |||||||
Global Small Capitalization Fund | $15,273 | $ | 105,787 | |||||
International Fund | 68,017 | 31,582 | ||||||
Blue Chip Income and Growth Fund | 67,182 | 170,978 | ||||||
8. Committed line of credit
Global Small Capitalization Fund, New World Fund and High-Income Bond Fund participate with other funds managed by CRMC in a $1 billion credit facility (the “line of credit”) to be utilized for temporary purposes to fund shareholder redemptions. Each fund has agreed to pay commitment fees on its pro-rata portion of the line of credit, which are reflected in other expenses in each fund’s statement of operations. None of the funds borrowed on this line of credit at any time during the six months ended June 30, 2017.
| American Funds Insurance Series | 175 |
9. Capital share transactions
Capital share transactions in the funds were as follows (dollars and shares in thousands):
Global Growth Fund
| Sales1 | Reinvestments of dividends and distributions | Repurchases1 | Net (decrease) increase | |||||||||||||||||||||||||||||
| Share class | Amount | Shares | Amount | Shares | Amount | Shares | Amount | Shares | ||||||||||||||||||||||||
Six months ended June 30, 2017 | ||||||||||||||||||||||||||||||||
Class 1 | $ 89,305 | 3,373 | $ 57,544 | 2,074 | $(157,017) | (5,802) | $ (10,168) | (355) | ||||||||||||||||||||||||
Class 1A2 | 538 | 19 | 16 | 1 | (1) | –3 | 553 | 20 | ||||||||||||||||||||||||
Class 2 | 29,976 | 1,163 | 118,050 | 4,296 | (292,351) | (11,106) | (144,325) | (5,647) | ||||||||||||||||||||||||
Class 4 | 26,902 | 1,016 | 3,969 | 145 | (5,458) | (208) | 25,413 | 953 | ||||||||||||||||||||||||
|
| |||||||||||||||||||||||||||||||
Total net increase (decrease) | $146,721 | 5,571 | $179,579 | 6,516 | $(454,827) | (17,116) | $(128,527) | (5,029) | ||||||||||||||||||||||||
|
| |||||||||||||||||||||||||||||||
Year ended December 31, 2016 | ||||||||||||||||||||||||||||||||
Class 1 | $214,321 | 8,771 | $150,842 | 6,520 | $(225,629) | (9,136) | $ 139,534 | 6,155 | ||||||||||||||||||||||||
Class 2 | 98,924 | 4,087 | 336,499 | 14,694 | (451,495) | (18,489) | (16,072) | 292 | ||||||||||||||||||||||||
Class 4 | 31,776 | 1,313 | 8,092 | 354 | (28,384) | (1,172) | 11,484 | 495 | ||||||||||||||||||||||||
|
| |||||||||||||||||||||||||||||||
Total net increase (decrease) | $345,021 | 14,171 | $495,433 | 21,568 | $(705,508) | (28,797) | $ 134,946 | 6,942 | ||||||||||||||||||||||||
|
| |||||||||||||||||||||||||||||||
Global Small Capitalization Fund
|
| |||||||||||||||||||||||||||||||
| Sales1 | Reinvestments of dividends and distributions | Repurchases1 | Net (decrease) increase | |||||||||||||||||||||||||||||
| Share class | Amount | Shares | Amount | Shares | Amount | Shares | Amount | Shares | ||||||||||||||||||||||||
Six months ended June 30, 2017 | ||||||||||||||||||||||||||||||||
Class 1 | $ 78,076 | 3,560 | $ 6,317 | 277 | $(280,989) | (12,408) | $(196,596) | (8,571) | ||||||||||||||||||||||||
Class 1A2 | 141 | 7 | – | – | 3 | –3 | –3 | 141 | 7 | |||||||||||||||||||||||
Class 2 | 15,219 | 726 | 9,527 | 429 | (158,031) | (7,414) | (133,285) | (6,259) | ||||||||||||||||||||||||
Class 4 | 15,135 | 704 | 220 | 9 | (2,208) | (103) | 13,147 | 610 | ||||||||||||||||||||||||
|
| |||||||||||||||||||||||||||||||
Total net increase (decrease) | $108,571 | 4,997 | $ 16,064 | 715 | $(441,228) | (19,925) | $(316,593) | (14,213) | ||||||||||||||||||||||||
|
| |||||||||||||||||||||||||||||||
Year ended December 31, 2016 | ||||||||||||||||||||||||||||||||
Class 1 | $161,105 | 7,595 | $285,447 | 14,932 | $(368,707) | (16,753) | $ 77,845 | 5,774 | ||||||||||||||||||||||||
Class 2 | 54,521 | 2,619 | 445,999 | 23,986 | (293,447) | (14,137) | 207,073 | 12,468 | ||||||||||||||||||||||||
Class 4 | 16,563 | 792 | 6,857 | 365 | (8,311) | (402) | 15,109 | 755 | ||||||||||||||||||||||||
|
| |||||||||||||||||||||||||||||||
Total net increase (decrease) | $232,189 | 11,006 | $738,303 | 39,283 | $(670,465) | (31,292) | $ 300,027 | 18,997 | ||||||||||||||||||||||||
|
| |||||||||||||||||||||||||||||||
| 176 | American Funds Insurance Series |
Growth Fund
| Sales1 | Reinvestments of dividends and distributions | Repurchases1 | Net increase (decrease) | |||||||||||||||||||||||||||||
| Share class | Amount | Shares | Amount | Shares | Amount | Shares | Amount | Shares | ||||||||||||||||||||||||
Six months ended June 30, 2017 | ||||||||||||||||||||||||||||||||
Class 1 | $282,329 | 3,905 | $ 742,365 | 10,520 | $ (491,403) | (6,732) | $ 533,291 | 7,693 | ||||||||||||||||||||||||
Class 1A2 | 802 | 11 | 66 | 1 | (5) | –3 | 863 | 12 | ||||||||||||||||||||||||
Class 2 | 116,105 | 1,603 | 1,463,878 | 20,888 | (1,084,545) | (14,970) | 495,438 | 7,521 | ||||||||||||||||||||||||
Class 3 | 275 | 4 | 19,224 | 271 | (10,062) | (137) | 9,437 | 138 | ||||||||||||||||||||||||
Class 4 | 68,757 | 954 | 55,030 | 793 | (21,417) | (300) | 102,370 | 1,447 | ||||||||||||||||||||||||
|
| |||||||||||||||||||||||||||||||
Total net increase (decrease) | $468,268 | 6,477 | $2,280,563 | 32,473 | $(1,607,432) | (22,139) | $1,141,399 | 16,811 | ||||||||||||||||||||||||
|
| |||||||||||||||||||||||||||||||
Year ended December 31, 2016 | ||||||||||||||||||||||||||||||||
Class 1 | $458,166 | 7,079 | $ 669,418 | 10,693 | $ (964,251) | (14,691) | $ 163,333 | 3,081 | ||||||||||||||||||||||||
Class 2 | 177,712 | 2,745 | 1,349,846 | 21,732 | (1,859,064) | (28,538) | (331,506) | (4,061) | ||||||||||||||||||||||||
Class 3 | 1,102 | 18 | 17,818 | 284 | (27,723) | (425) | (8,803) | (123) | ||||||||||||||||||||||||
Class 4 | 75,062 | 1,167 | 39,264 | 638 | (49,300) | (768) | 65,026 | 1,037 | ||||||||||||||||||||||||
|
| |||||||||||||||||||||||||||||||
Total net increase (decrease) | $712,042 | 11,009 | $2,076,346 | 33,347 | $(2,900,338) | (44,422) | $ (111,950) | (66) | ||||||||||||||||||||||||
|
| |||||||||||||||||||||||||||||||
International Fund
|
| |||||||||||||||||||||||||||||||
| Sales1 | Reinvestments of dividends and distributions | Repurchases1 | Net increase (decrease) | |||||||||||||||||||||||||||||
| Share class | Amount | Shares | Amount | Shares | Amount | Shares | Amount | Shares | ||||||||||||||||||||||||
Six months ended June 30, 2017 | ||||||||||||||||||||||||||||||||
Class 1 | $383,721 | 20,353 | $ 66,548 | 3,387 | $ (240,741) | (12,822) | $ 209,528 | 10,918 | ||||||||||||||||||||||||
Class 1A2 | 361 | 19 | 4 | – | 3 | –3 | –3 | 365 | 19 | |||||||||||||||||||||||
Class 2 | 85,351 | 4,660 | 60,782 | 3,107 | (308,160) | (16,553) | (162,027) | (8,786) | ||||||||||||||||||||||||
Class 3 | 159 | 9 | 434 | 22 | (1,871) | (101) | (1,278) | (70) | ||||||||||||||||||||||||
Class 4 | 24,587 | 1,324 | 1,376 | 71 | (5,314) | (287) | 20,649 | 1,108 | ||||||||||||||||||||||||
|
| |||||||||||||||||||||||||||||||
Total net increase (decrease) | $494,179 | 26,365 | $129,144 | 6,587 | $ (556,086) | (29,763) | $ 67,237 | 3,189 | ||||||||||||||||||||||||
|
| |||||||||||||||||||||||||||||||
Year ended December 31, 2016 | ||||||||||||||||||||||||||||||||
Class 1 | $502,624 | 29,474 | $355,240 | 22,171 | $ (416,969) | (24,055) | $ 440,895 | 27,590 | ||||||||||||||||||||||||
Class 2 | 190,542 | 11,247 | 385,917 | 24,231 | (598,017) | (34,790) | (21,558) | 688 | ||||||||||||||||||||||||
Class 3 | 122 | 7 | 2,834 | 177 | (5,902) | (343) | (2,946) | (159) | ||||||||||||||||||||||||
Class 4 | 25,077 | 1,477 | 5,458 | 345 | (7,439) | (436) | 23,096 | 1,386 | ||||||||||||||||||||||||
|
| |||||||||||||||||||||||||||||||
Total net increase (decrease) | $718,365 | 42,205 | $749,449 | 46,924 | $(1,028,327) | (59,624) | $ 439,487 | 29,505 | ||||||||||||||||||||||||
|
| |||||||||||||||||||||||||||||||
New World Fund
|
| |||||||||||||||||||||||||||||||
| Sales1 | Reinvestments of dividends | Repurchases1 | Net (decrease) increase | |||||||||||||||||||||||||||||
| Share class | Amount | Shares | Amount | Shares | Amount | Shares | Amount | Shares | ||||||||||||||||||||||||
Six months ended June 30, 2017 | ||||||||||||||||||||||||||||||||
Class 1 | $126,934 | 5,828 | $ 3,072 | 136 | $(287,145) | (12,786) | $(157,139) | (6,822) | ||||||||||||||||||||||||
Class 1A2 | 163 | 7 | – | – | 3 | –3 | –3 | 163 | 7 | |||||||||||||||||||||||
Class 2 | 123,916 | 5,750 | 1,283 | 57 | (173,508) | (8,085) | (48,309) | (2,278) | ||||||||||||||||||||||||
Class 4 | 53,144 | 2,480 | 340 | 15 | (8,319) | (389) | 45,165 | 2,106 | ||||||||||||||||||||||||
|
| |||||||||||||||||||||||||||||||
Total net increase (decrease) | $304,157 | 14,065 | $ 4,695 | 208 | $(468,972) | (21,260) | $(160,120) | (6,987) | ||||||||||||||||||||||||
|
| |||||||||||||||||||||||||||||||
Year ended December 31, 2016 | ||||||||||||||||||||||||||||||||
Class 1 | $343,390 | 17,604 | $17,686 | 901 | $(250,303) | (12,858) | $ 110,773 | 5,647 | ||||||||||||||||||||||||
Class 2 | 51,238 | 2,661 | 7,100 | 365 | (149,682) | (7,790) | (91,344) | (4,764) | ||||||||||||||||||||||||
Class 4 | 71,177 | 3,754 | 1,465 | 75 | (12,695) | (670) | 59,947 | 3,159 | ||||||||||||||||||||||||
|
| |||||||||||||||||||||||||||||||
Total net increase (decrease) | $465,805 | 24,019 | $26,251 | 1,341 | $(412,680) | (21,318) | $ 79,376 | 4,042 | ||||||||||||||||||||||||
|
| |||||||||||||||||||||||||||||||
See end of tables for footnotes.
| American Funds Insurance Series | 177 |
Blue Chip Income and Growth Fund
| Sales1 | Reinvestments of dividends and distributions | Repurchases1 | Net increase (decrease) | |||||||||||||||||||||||||||||
| Share class | Amount | Shares | Amount | Shares | Amount | Shares | Amount | Shares | ||||||||||||||||||||||||
Six months ended June 30, 2017 |
| |||||||||||||||||||||||||||||||
Class 1 | $ 345,090 | 24,688 | $211,819 | 15,371 | $(475,150) | (33,513) | $ 81,759 | 6,546 | ||||||||||||||||||||||||
Class 1A2 | 168 | 12 | 7 | 1 | (10) | (1) | 165 | 12 | ||||||||||||||||||||||||
Class 2 | 27,058 | 1,962 | 139,561 | 10,239 | (197,271) | (14,224) | (30,652) | (2,023) | ||||||||||||||||||||||||
Class 4 | 49,953 | 3,614 | 6,897 | 507 | (14,591) | (1,051) | 42,259 | 3,070 | ||||||||||||||||||||||||
|
| |||||||||||||||||||||||||||||||
Total net increase (decrease) | $ 422,269 | 30,276 | $358,284 | 26,118 | $(687,022) | (48,789) | $ 93,531 | 7,605 | ||||||||||||||||||||||||
|
| |||||||||||||||||||||||||||||||
Year ended December 31, 2016 | ||||||||||||||||||||||||||||||||
Class 1 | $ 986,168 | 74,990 | $426,031 | 33,628 | $(260,962) | (20,029) | $1,151,237 | 88,589 | ||||||||||||||||||||||||
Class 2 | 42,572 | 3,274 | 328,996 | 26,334 | (424,524) | (32,897) | (52,956) | (3,289) | ||||||||||||||||||||||||
Class 4 | 105,759 | 8,137 | 7,693 | 611 | (18,601) | (1,441) | 94,851 | 7,307 | ||||||||||||||||||||||||
|
| |||||||||||||||||||||||||||||||
Total net increase (decrease) | $1,134,499 | 86,401 | $762,720 | 60,573 | $(704,087) | (54,367) | $1,193,132 | 92,607 | ||||||||||||||||||||||||
|
| |||||||||||||||||||||||||||||||
Global Growth and Income Fund
|
| |||||||||||||||||||||||||||||||
| Sales1 | Reinvestments of dividends and distributions | Repurchases1 | Net (decrease) increase | |||||||||||||||||||||||||||||
| Share class | Amount | Shares | Amount | Shares | Amount | Shares | Amount | Shares | ||||||||||||||||||||||||
Six months ended June 30, 2017 | ||||||||||||||||||||||||||||||||
Class 12 | $ 43,654 | 3,156 | $ 7,982 | 546 | $(289,329) | (19,613) | $(237,693) | (15,911) | ||||||||||||||||||||||||
Class 1A | 10 | 1 | – | 3 | – | 3 | – | – | 10 | 1 | ||||||||||||||||||||||
Class 2 | 11,144 | 809 | 30,440 | 2,091 | (115,651) | (8,266) | (74,067) | (5,366) | ||||||||||||||||||||||||
Class 4 | 8,243 | 584 | 467 | 33 | (1,764) | (126) | 6,946 | 491 | ||||||||||||||||||||||||
|
| |||||||||||||||||||||||||||||||
Total net increase (decrease) | $ 63,051 | 4,550 | $38,889 | 2,670 | $(406,744) | (28,005) | $(304,804) | (20,785) | ||||||||||||||||||||||||
|
| |||||||||||||||||||||||||||||||
Year ended December 31, 2016 | ||||||||||||||||||||||||||||||||
Class 1 | $292,208 | 23,201 | $10,481 | 808 | $ (49,576) | (3,887) | $ 253,113 | 20,122 | ||||||||||||||||||||||||
Class 2 | 25,520 | 2,043 | 25,283 | 1,955 | (199,986) | (15,865) | (149,183) | (11,867) | ||||||||||||||||||||||||
Class 4 | 12,357 | 989 | 257 | 20 | (2,230) | (180) | 10,384 | 829 | ||||||||||||||||||||||||
|
| |||||||||||||||||||||||||||||||
Total net increase (decrease) | $330,085 | 26,233 | $36,021 | 2,783 | $(251,792) | (19,932) | $ 114,314 | 9,084 | ||||||||||||||||||||||||
|
| |||||||||||||||||||||||||||||||
Growth-Income Fund
|
| |||||||||||||||||||||||||||||||
| Sales1 | Reinvestments of dividends and distributions | Repurchases1 | Net increase (decrease) | |||||||||||||||||||||||||||||
| Share class | Amount | Shares | Amount | Shares | Amount | Shares | Amount | Shares | ||||||||||||||||||||||||
Six months ended June 30, 2017 | ||||||||||||||||||||||||||||||||
Class 1 | $ 885,451 | 18,923 | $ 932,415 | 20,385 | $ (538,378) | (11,476) | $1,279,488 | 27,832 | ||||||||||||||||||||||||
Class 1A2 | 452 | 10 | 17 | – | 3 | (3) | –3 | 466 | 10 | |||||||||||||||||||||||
Class 2 | 71,012 | 1,527 | 896,303 | 19,808 | (825,238) | (17,743) | 142,077 | 3,592 | ||||||||||||||||||||||||
Class 3 | 232 | 5 | 10,668 | 233 | (11,221) | (239) | (321) | (1) | ||||||||||||||||||||||||
Class 4 | 56,549 | 1,226 | 38,175 | 850 | (23,522) | (509) | 71,202 | 1,567 | ||||||||||||||||||||||||
|
| |||||||||||||||||||||||||||||||
Total net increase (decrease) | $1,013,696 | 21,691 | $1,877,578 | 41,276 | $(1,398,362) | (29,967) | $1,492,912 | 33,000 | ||||||||||||||||||||||||
|
| |||||||||||||||||||||||||||||||
Year ended December 31, 2016 | ||||||||||||||||||||||||||||||||
Class 1 | $1,364,357 | 31,261 | $1,429,866 | 34,358 | $ (830,642) | (18,888) | $1,963,581 | 46,731 | ||||||||||||||||||||||||
Class 2 | 142,903 | 3,288 | 1,580,603 | 38,422 | (1,561,195) | (35,880) | 162,311 | 5,830 | ||||||||||||||||||||||||
Class 3 | 1,293 | 30 | 19,402 | 467 | (23,792) | (543) | (3,097) | (46) | ||||||||||||||||||||||||
Class 4 | 72,892 | 1,695 | 54,139 | 1,325 | (35,791) | (829) | 91,240 | 2,191 | ||||||||||||||||||||||||
|
| |||||||||||||||||||||||||||||||
Total net increase (decrease) | $1,581,445 | 36,274 | $3,084,010 | 74,572 | $(2,451,420) | (56,140) | $2,214,035 | 54,706 | ||||||||||||||||||||||||
|
| |||||||||||||||||||||||||||||||
| 178 | American Funds Insurance Series |
International Growth and Income Fund
| Sales1 | Reinvestments of dividends and distributions | Repurchases1 | Net increase (decrease) | |||||||||||||||||||||||||||||
| Share class | Amount | Shares | Amount | Shares | Amount | Shares | Amount | Shares | ||||||||||||||||||||||||
Six months ended June 30, 2017 | ||||||||||||||||||||||||||||||||
Class 1 | $170,779 | 10,248 | $ 1,924 | 116 | $(51,629) | (3,183) | $121,074 | 7,181 | ||||||||||||||||||||||||
Class 1A2 | 15 | 1 | – | 3 | – | 3 | – | – | 15 | 1 | ||||||||||||||||||||||
Class 2 | 4,036 | 261 | 383 | 23 | (20,376) | (1,299) | (15,957) | (1,015) | ||||||||||||||||||||||||
Class 4 | 5,798 | 368 | 53 | 3 | (1,442) | (92) | 4,409 | 279 | ||||||||||||||||||||||||
|
| |||||||||||||||||||||||||||||||
Total net increase (decrease) | $180,628 | 10,878 | $ 2,360 | 142 | $(73,447) | (4,574) | $109,541 | 6,446 | ||||||||||||||||||||||||
|
| |||||||||||||||||||||||||||||||
Year ended December 31, 2016 | ||||||||||||||||||||||||||||||||
Class 1 | $105,994 | 7,226 | $26,726 | 1,853 | $(5,982) | (396) | $126,738 | 8,683 | ||||||||||||||||||||||||
Class 2 | 17,101 | 1,182 | 7,312 | 508 | (30,910) | (2,088) | (6,497) | (398) | ||||||||||||||||||||||||
Class 4 | 8,076 | 551 | 1,044 | 73 | (3,762) | (258) | 5,358 | 366 | ||||||||||||||||||||||||
|
| |||||||||||||||||||||||||||||||
Total net increase (decrease) | $131,171 | 8,959 | $35,082 | 2,434 | $(40,654) | (2,742) | $125,599 | 8,651 | ||||||||||||||||||||||||
|
| |||||||||||||||||||||||||||||||
| Capital Income Builder | ||||||||||||||||||||||||||||||||
| Sales1 | Reinvestments of dividends | Repurchases1 | Net increase | |||||||||||||||||||||||||||||
| Share class | Amount | Shares | Amount | Shares | Amount | Shares | Amount | Shares | ||||||||||||||||||||||||
Six months ended June 30, 2017 | ||||||||||||||||||||||||||||||||
Class 1 | $ 36,029 | 3,673 | $ 2,810 | 282 | $(3,569) | (367) | $35,270 | 3,588 | ||||||||||||||||||||||||
Class 1A2 | 73 | 7 | 1 | – | 3 | – | 3 | –3 | 74 | 7 | ||||||||||||||||||||||
Class 2 | 569 | 58 | 7 | 1 | (10) | (1) | 566 | 58 | ||||||||||||||||||||||||
Class 4 | 31,567 | 3,215 | 3,604 | 363 | (10,100) | (1,029) | 25,071 | 2,549 | ||||||||||||||||||||||||
|
| |||||||||||||||||||||||||||||||
Total net increase (decrease) | $ 68,238 | 6,953 | $ 6,422 | 646 | $(13,679) | (1,397) | $60,981 | 6,202 | ||||||||||||||||||||||||
|
| |||||||||||||||||||||||||||||||
Year ended December 31, 2016 | ||||||||||||||||||||||||||||||||
Class 1 | $ 95,122 | 9,946 | $ 4,372 | 458 | $(23,129) | (2,439) | $76,365 | 7,965 | ||||||||||||||||||||||||
Class 2 | 144 | 15 | 2 | – | (2) | – | 144 | 15 | ||||||||||||||||||||||||
Class 4 | 113,152 | 11,813 | 6,657 | 699 | (20,474) | (2,162) | 99,335 | 10,350 | ||||||||||||||||||||||||
|
| |||||||||||||||||||||||||||||||
Total net increase (decrease) | $208,418 | 21,774 | $11,031 | 1,157 | $(43,605) | (4,601) | $175,844 | 18,330 | ||||||||||||||||||||||||
|
| |||||||||||||||||||||||||||||||
| Asset Allocation Fund | ||||||||||||||||||||||||||||||||
| Sales1 | Reinvestments of dividends and distributions | Repurchases1 | Net increase (decrease) | |||||||||||||||||||||||||||||
| Share class | Amount | Shares | Amount | Shares | Amount | Shares | Amount | Shares | ||||||||||||||||||||||||
Six months ended June 30, 2017 | ||||||||||||||||||||||||||||||||
Class 1 | $1,223,552 | 53,798 | $ 723,346 | 32,207 | $(270,322) | (11,893) | $1,676,576 | 74,112 | ||||||||||||||||||||||||
Class 1A2 | 1,962 | 85 | 76 | 4 | (1) | –3 | 2,037 | 89 | ||||||||||||||||||||||||
Class 2 | 79,620 | 3,555 | 259,355 | 11,661 | (287,825) | (12,784) | 51,150 | 2,432 | ||||||||||||||||||||||||
Class 3 | 561 | 25 | 1,775 | 78 | (2,001) | (88) | 335 | 15 | ||||||||||||||||||||||||
Class 4 | 198,612 | 8,889 | 155,241 | 7,009 | (110,844) | (4,987) | 243,009 | 10,911 | ||||||||||||||||||||||||
|
| |||||||||||||||||||||||||||||||
Total net increase (decrease) | $1,504,307 | 66,352 | $1,139,793 | 50,959 | $(670,993) | (29,752) | $1,973,107 | 87,559 | ||||||||||||||||||||||||
|
| |||||||||||||||||||||||||||||||
Year ended December 31, 2016 | ||||||||||||||||||||||||||||||||
Class 1 | $1,419,998 | 67,404 | $ 510,045 | 24,119 | $ (436,287) | (20,771) | $1,493,756 | 70,752 | ||||||||||||||||||||||||
Class 2 | 190,550 | 9,074 | 201,323 | 9,626 | (504,479) | (24,294) | (112,606) | (5,594) | ||||||||||||||||||||||||
Class 3 | 672 | 32 | 1,439 | 68 | (4,926) | (233) | (2,815) | (133) | ||||||||||||||||||||||||
Class 4 | 385,933 | 18,332 | 100,264 | 4,812 | (163,695) | (7,917) | 322,502 | 15,227 | ||||||||||||||||||||||||
|
| |||||||||||||||||||||||||||||||
Total net increase (decrease) | $1,997,153 | 94,842 | $ 813,071 | 38,625 | $(1,109,387) | (53,215) | $1,700,837 | 80,252 | ||||||||||||||||||||||||
|
| |||||||||||||||||||||||||||||||
See end of tables for footnotes.
| American Funds Insurance Series | 179 |
Global Balanced Fund
| Sales1 | Reinvestments of dividends and distributions | Repurchases1 | Net increase (decrease) | |||||||||||||||||||||||||||||
| Share class | Amount | Shares | Amount | Shares | Amount | Shares | Amount | Shares | ||||||||||||||||||||||||
Six months ended June 30, 2017 | ||||||||||||||||||||||||||||||||
Class 1 | $ 7,400 | 625 | $ 243 | 20 | $ (2,827) | (243) | $ 4,816 | 402 | ||||||||||||||||||||||||
Class 1A2 | 10 | 1 | – | 3 | – | 3 | – | – | 10 | 1 | ||||||||||||||||||||||
Class 2 | 8,051 | 686 | 628 | 51 | (13,017) | (1,108) | (4,338) | (371) | ||||||||||||||||||||||||
Class 4 | 10,398 | 883 | 63 | 5 | (554) | (47) | 9,907 | 841 | ||||||||||||||||||||||||
|
| |||||||||||||||||||||||||||||||
Total net increase (decrease) | $25,859 | 2,195 | $934 | 76 | $(16,398) | (1,398) | $10,395 | 873 | ||||||||||||||||||||||||
|
| |||||||||||||||||||||||||||||||
Year ended December 31, 2016 | ||||||||||||||||||||||||||||||||
Class 1 | $20,046 | 1,826 | $939 | 85 | $(6,690) | (590) | $14,295 | 1,321 | ||||||||||||||||||||||||
Class 2 | 22,939 | 2,066 | 2,226 | 201 | (22,938) | (2,086) | 2,227 | 181 | ||||||||||||||||||||||||
Class 4 | 9,506 | 864 | 121 | 11 | (652) | (59) | 8,975 | 816 | ||||||||||||||||||||||||
|
| |||||||||||||||||||||||||||||||
Total net increase (decrease) | $52,491 | 4,756 | $3,286 | 297 | $(30,280) | (2,735) | $25,497 | 2,318 | ||||||||||||||||||||||||
|
| |||||||||||||||||||||||||||||||
| Bond Fund | ||||||||||||||||||||||||||||||||
| Sales1 | Reinvestments of dividends and distributions | Repurchases1 | Net (decrease) increase | |||||||||||||||||||||||||||||
| Share class | Amount | Shares | Amount | Shares | Amount | Shares | Amount | Shares | ||||||||||||||||||||||||
Six months ended June 30, 2017 | ||||||||||||||||||||||||||||||||
Class 1 | $ 510,398 | 46,925 | $134,744 | 12,407 | $(1,110,594) | (101,036) | $ (465,452) | (41,704) | ||||||||||||||||||||||||
Class 1A2 | 390 | 35 | 7 | 1 | – | 3 | –3 | 397 | 36 | |||||||||||||||||||||||
Class 2 | 61,700 | 5,733 | 79,311 | 7,392 | (144,658) | (13,418) | (3,647) | (293) | ||||||||||||||||||||||||
Class 4 | 28,880 | 2,677 | 2,255 | 210 | (11,431) | (1,057) | 19,704 | 1,830 | ||||||||||||||||||||||||
|
| |||||||||||||||||||||||||||||||
Total net increase (decrease) | $ 601,368 | 55,370 | $216,317 | 20,010 | $(1,266,683) | (115,511) | $ (448,998) | (40,131) | ||||||||||||||||||||||||
|
| |||||||||||||||||||||||||||||||
Year ended December 31, 2016 | ||||||||||||||||||||||||||||||||
Class 1 | $1,345,167 | 121,199 | $148,075 | 13,631 | $ (420,052) | (38,234) | $1,073,190 | 96,596 | ||||||||||||||||||||||||
Class 2 | 144,585 | 13,214 | 82,041 | 7,631 | (444,145) | (40,888) | (217,519) | (20,043) | ||||||||||||||||||||||||
Class 4 | 57,784 | 5,273 | 1,763 | 164 | (16,674) | (1,523) | 42,873 | 3,914 | ||||||||||||||||||||||||
|
| |||||||||||||||||||||||||||||||
Total net increase (decrease) | $1,547,536 | 139,686 | $231,879 | 21,426 | $ (880,871) | (80,645) | $ 898,544 | 80,467 | ||||||||||||||||||||||||
|
| |||||||||||||||||||||||||||||||
| Global Bond Fund | ||||||||||||||||||||||||||||||||
| Sales1 | Reinvestments of dividends and distributions | Repurchases1 | Net increase (decrease) | |||||||||||||||||||||||||||||
| Share class | Amount | Shares | Amount | Shares | Amount | Shares | Amount | Shares | ||||||||||||||||||||||||
Six months ended June 30, 2017 | ||||||||||||||||||||||||||||||||
Class 1 | $ 84,823 | 7,382 | $7,297 | 621 | $(35,529) | (3,105) | $56,591 | 4,898 | ||||||||||||||||||||||||
Class 1A2 | 31 | 3 | – | 3 | – | 3 | – | 3 | – | 31 | 3 | |||||||||||||||||||||
Class 2 | 25,366 | 2,239 | 7,064 | 606 | (42,479) | (3,713) | (10,049) | (868) | ||||||||||||||||||||||||
Class 4 | 3,024 | 266 | 88 | 7 | (1,118) | (98) | 1,994 | 175 | ||||||||||||||||||||||||
|
| |||||||||||||||||||||||||||||||
Total net increase (decrease) | $113,244 | 9,890 | $14,449 | 1,234 | $(79,126) | (6,916) | $48,567 | 4,208 | ||||||||||||||||||||||||
|
| |||||||||||||||||||||||||||||||
Year ended December 31, 2016 | ||||||||||||||||||||||||||||||||
Class 1 | $213,129 | 18,309 | $10,956 | 974 | $(159,412) | (13,652) | $64,673 | 5,631 | ||||||||||||||||||||||||
Class 2 | 36,347 | 3,158 | 8,734 | 780 | (156,676) | (13,741) | (111,595) | (9,803) | ||||||||||||||||||||||||
Class 4 | 10,946 | 954 | 76 | 7 | (4,634) | (404) | 6,388 | 557 | ||||||||||||||||||||||||
|
| |||||||||||||||||||||||||||||||
Total net increase (decrease) | $260,422 | 22,421 | $19,766 | 1,761 | $(320,722) | (27,797) | $(40,534) | (3,615) | ||||||||||||||||||||||||
|
| |||||||||||||||||||||||||||||||
| 180 | American Funds Insurance Series |
High-Income Bond Fund
| Sales1
| Reinvestments of dividends
| Repurchases1
| Net (decrease) increase
| |||||||||||||||||||||||||||||
| Share class |
Amount |
Shares |
Amount |
Shares |
Amount |
Shares |
Amount |
Shares | ||||||||||||||||||||||||
Six months ended June 30, 2017 | ||||||||||||||||||||||||||||||||
Class 1 | $ 38,805 | 3,712 | $8,924 | 846 | $ | (290,478 | ) | (27,344 | ) | $(242,749) | (22,786) | |||||||||||||||||||||
Class 1A2 | 114 | 11 | 1 | – | 3 | (5 | ) | – | 3 | 110 | 11 | |||||||||||||||||||||
Class 2 | 8,564 | 833 | 9,562 | 921 | (45,151 | ) | (4,381 | ) | (27,025) | (2,627) | ||||||||||||||||||||||
Class 3 | 380 | 36 | 156 | 15 | (641 | ) | (61 | ) | (105) | (10) | ||||||||||||||||||||||
Class 4 | 54,593 | 4,954 | 353 | 31 | (53,926 | ) | (4,896 | ) | 1,020 | 89 | ||||||||||||||||||||||
|
| |||||||||||||||||||||||||||||||
Total net increase (decrease) | $102,456 | 9,546 | $18,996 | 1,813 | $ | (390,201 | ) | (36,682 | ) | $(268,749) | (25,323) | |||||||||||||||||||||
|
| |||||||||||||||||||||||||||||||
Year ended December 31, 2016 | ||||||||||||||||||||||||||||||||
Class 1 | $ 69,042 | 6,945 | $ 56,592 | 5,626 | $ | (291,328 | ) | (30,021 | ) | $(165,694) | (17,450) | |||||||||||||||||||||
Class 2 | 22,831 | 2,394 | 47,007 | 4,738 | (116,168 | ) | (11,943 | ) | (46,330) | (4,811) | ||||||||||||||||||||||
Class 3 | 2,650 | 279 | 746 | 74 | (3,553 | ) | (365 | ) | (157) | (12) | ||||||||||||||||||||||
Class 4 | 90,979 | 8,413 | 1,283 | 120 | (73,640 | ) | (6,754 | ) | 18,622 | 1,779 | ||||||||||||||||||||||
|
| |||||||||||||||||||||||||||||||
Total net increase (decrease) | $185,502 | 18,031 | $105,628 | 10,558 | $ | (484,689 | ) | (49,083 | ) | $(193,559) | (20,494) | |||||||||||||||||||||
|
| |||||||||||||||||||||||||||||||
Mortgage Fund | ||||||||||||||||||||||||||||||||
| Sales1
| Reinvestments of dividends and distributions
| Repurchases1
| Net increase (decrease)
| |||||||||||||||||||||||||||||
| Share class |
Amount |
Shares |
Amount |
Shares |
Amount |
Shares |
Amount |
Shares | ||||||||||||||||||||||||
Six months ended June 30, 2017 | ||||||||||||||||||||||||||||||||
Class 1 | $29,211 | 2,753 | $2,512 | 236 | $ | (29,154 | ) | (2,743 | ) | $ | 2,569 | 246 | ||||||||||||||||||||
Class 1A2 | 109 | 10 | 1 | 1 | (5 | ) | (1 | ) | 105 | 10 | ||||||||||||||||||||||
Class 2 | 3,827 | 361 | 553 | 52 | (5,124 | ) | (483 | ) | (744 | ) | (70) | |||||||||||||||||||||
Class 4 | 3,237 | 307 | 79 | 7 | (2,523 | ) | (239 | ) | 793 | 75 | ||||||||||||||||||||||
|
| |||||||||||||||||||||||||||||||
Total net increase (decrease) | $36,384 | 3,431 | $3,145 | 296 | $ | (36,806 | ) | (3,466 | ) | $ | 2,723 | 261 | ||||||||||||||||||||
|
| |||||||||||||||||||||||||||||||
Year ended December 31, 2016 | ||||||||||||||||||||||||||||||||
Class 1 | $28,827 | 2,669 | $7,933 | 749 | $ | (38,385 | ) | (3,569 | ) | $ | (1,625 | ) | (151) | |||||||||||||||||||
Class 2 | 18,388 | 1,714 | 1,683 | 159 | (15,825 | ) | (1,473 | ) | 4,246 | 400 | ||||||||||||||||||||||
Class 4 | 14,879 | 1,395 | 227 | 22 | (17,844 | ) | (1,676 | ) | (2,738 | ) | (259) | |||||||||||||||||||||
|
| |||||||||||||||||||||||||||||||
Total net increase (decrease) | $62,094 | 5,778 | $9,843 | 930 | $ | (72,054 | ) | (6,718 | ) | $ | (117 | ) | (10) | |||||||||||||||||||
|
| |||||||||||||||||||||||||||||||
Ultra-Short Bond Fund | ||||||||||||||||||||||||||||||||
| Sales1
| Reinvestments of dividends and distributions
| Repurchases1
| Net (decrease) increase
| |||||||||||||||||||||||||||||
| Share class |
Amount |
Shares |
Amount |
Shares |
Amount |
Shares |
Amount |
Shares | ||||||||||||||||||||||||
Six months ended June 30, 2017 | ||||||||||||||||||||||||||||||||
Class 1 | $ 3,979 | 353 | $— | — | $ | (9,066 | ) | (804 | ) | $ (5,087) | (451) | |||||||||||||||||||||
Class 1A2 | 10 | 1 | — | — | – | – | 10 | 1 | ||||||||||||||||||||||||
Class 2 | 26,711 | 2,429 | — | — | (66,149 | ) | (6,017 | ) | (39,438) | (3,588) | ||||||||||||||||||||||
Class 3 | 74 | 7 | — | — | (351 | ) | (31 | ) | (277) | (24) | ||||||||||||||||||||||
Class 4 | 9,477 | 852 | — | — | (5,608 | ) | (504 | ) | 3,869 | 348 | ||||||||||||||||||||||
|
| |||||||||||||||||||||||||||||||
Total net increase (decrease) | $ 40,251 | 3,642 | $— | — | $ | (81,174 | ) | (7,356 | ) | $(40,923) | (3,714) | |||||||||||||||||||||
|
| |||||||||||||||||||||||||||||||
Year ended December 31, 2016 | ||||||||||||||||||||||||||||||||
Class 1 | $ 15,562 | 1,382 | $— | — | $ | (17,527 | ) | (1,556 | ) | $ (1,965) | (174) | |||||||||||||||||||||
Class 2 | 128,178 | 11,656 | — | — | (133,142 | ) | (12,108 | ) | (4,964) | (452) | ||||||||||||||||||||||
Class 3 | 2,647 | 238 | — | — | (4,768 | ) | (429 | ) | (2,121) | (191) | ||||||||||||||||||||||
Class 4 | 18,372 | 1,649 | — | — | (21,287 | ) | (1,911 | ) | (2,915) | (262) | ||||||||||||||||||||||
|
| |||||||||||||||||||||||||||||||
Total net increase (decrease) | $164,759 | 14,925 | $— | — | $ | (176,724 | ) | (16,004 | ) | $(11,965) | (1,079) | |||||||||||||||||||||
|
| |||||||||||||||||||||||||||||||
See end of tables for footnotes.
| American Funds Insurance Series | 181 |
U.S. Government/AAA-Rated Securities Fund
| Sales1
| Reinvestments of dividends and distributions
| Repurchases1
| Net (decrease) increase
| |||||||||||||||||||||||||||||
| Share class |
Amount |
Shares |
Amount |
Shares |
Amount |
Shares |
Amount |
Shares | ||||||||||||||||||||||||
Six months ended June 30, 2017 | ||||||||||||||||||||||||||||||||
Class 1 | $ 44,091 | 3,625 | $ 3,834 | 312 | $(211,044) | (17,165 | ) | $(163,119) | (13,228) | |||||||||||||||||||||||
Class 1A2 | 111 | 9 | — | 3 | — | 3 | —3 | — | 3 | 111 | 9 | |||||||||||||||||||||
Class 2 | 18,100 | 1,504 | 3,682 | 303 | (60,061) | (4,986 | ) | (38,279) | (3,179) | |||||||||||||||||||||||
Class 3 | 691 | 57 | 26 | 2 | (642) | (53 | ) | 75 | 6 | |||||||||||||||||||||||
Class 4 | 11,941 | 987 | 111 | 10 | (12,741) | (1,058 | ) | (689) | (61) | |||||||||||||||||||||||
|
| |||||||||||||||||||||||||||||||
Total net increase (decrease) | $ 74,934 | 6,182 | $ 7,653 | 627 | $(284,488) | (23,262 | ) | $(201,901) | (16,453) | |||||||||||||||||||||||
|
| |||||||||||||||||||||||||||||||
Year ended December 31, 2016 | ||||||||||||||||||||||||||||||||
Class 1 | $111,564 | 8,949 | $ 52,411 | 4,280 | $(89,943) | (7,217 | ) | $74,032 | 6,012 | |||||||||||||||||||||||
Class 2 | 65,544 | 5,287 | 52,257 | 4,303 | (160,525) | (13,019 | ) | (42,724) | (3,429) | |||||||||||||||||||||||
Class 3 | 1,568 | 125 | 368 | 30 | (2,199) | (176 | ) | (263) | (21) | |||||||||||||||||||||||
Class 4 | 58,794 | 4,745 | 1,986 | 163 | (48,646) | (3,930 | ) | 12,134 | 978 | |||||||||||||||||||||||
|
| |||||||||||||||||||||||||||||||
Total net increase (decrease) | $237,470 | 19,106 | $107,022 | 8,776 | $(301,313) | (24,342 | ) | $ 43,179 | 3,540 | |||||||||||||||||||||||
|
| |||||||||||||||||||||||||||||||
Managed Risk Growth Fund |
| |||||||||||||||||||||||||||||||
| Sales1
| Reinvestments of dividends and distributions
| Repurchases1
| Net increase
| |||||||||||||||||||||||||||||
| Share class |
Amount |
Shares |
Amount |
Shares |
Amount |
Shares |
Amount |
Shares | ||||||||||||||||||||||||
Six months ended June 30, 2017 | ||||||||||||||||||||||||||||||||
Class P1 | $ 506 | 43 | $ 29 | 3 | $ (95) | (8 | ) | $ 440 | 38 | |||||||||||||||||||||||
Class P2 | 23,896 | 2,084 | 4,847 | 408 | (8,089) | (699 | ) | 20,654 | 1,793 | |||||||||||||||||||||||
|
| |||||||||||||||||||||||||||||||
Total net increase (decrease) | $24,402 | 2,127 | $ 4,876 | 411 | $ (8,184) | (707 | ) | $21,094 | 1,831 | |||||||||||||||||||||||
|
| |||||||||||||||||||||||||||||||
Year ended December 31, 2016 | ||||||||||||||||||||||||||||||||
Class P1 | $ 492 | 46 | $ 60 | 6 | $ (168) | (16 | ) | $ 384 | 36 | |||||||||||||||||||||||
Class P2 | 63,452 | 5,983 | 15,282 | 1,507 | (14,771) | (1,388 | ) | 63,963 | 6,102 | |||||||||||||||||||||||
|
| |||||||||||||||||||||||||||||||
Total net increase (decrease) | $63,944 | 6,029 | $15,342 | 1,513 | $(14,939) | (1,404 | ) | $64,347 | 6,138 | |||||||||||||||||||||||
|
| |||||||||||||||||||||||||||||||
Managed Risk International Fund |
| |||||||||||||||||||||||||||||||
| Sales1
| Reinvestments of dividends and distributions
| Repurchases1
| Net (decrease) increase
| |||||||||||||||||||||||||||||
| Share class |
Amount |
Shares |
Amount |
Shares |
Amount |
Shares |
Amount |
Shares | ||||||||||||||||||||||||
Six months ended June 30, 2017 | ||||||||||||||||||||||||||||||||
Class P1 | $ 95 | 10 | $ 3 | — | 3 | $ (131) | (13 | ) | $ (33) | (3) | ||||||||||||||||||||||
Class P2 | 14,561 | 1,527 | 2,300 | 230 | (5,436) | (552 | ) | 11,425 | 1,205 | |||||||||||||||||||||||
|
| |||||||||||||||||||||||||||||||
Total net increase (decrease) | $14,656 | 1,537 | $2,303 | 230 | $(5,567) | (565 | ) | $11,392 | 1,202 | |||||||||||||||||||||||
|
| |||||||||||||||||||||||||||||||
Year ended December 31, 2016 | ||||||||||||||||||||||||||||||||
Class P1 | $ 41 | 4 | $ 6 | 1 | $ (53) | (6 | ) | $ (6) | (1) | |||||||||||||||||||||||
Class P2 | 25,545 | 2,830 | 3,022 | 346 | (8,610) | (948 | ) | 19,957 | 2,228 | |||||||||||||||||||||||
|
| |||||||||||||||||||||||||||||||
Total net increase (decrease) | $25,586 | 2,834 | $3,028 | 347 | $ (8,663) | (954 | ) | $19,951 | 2,227 | |||||||||||||||||||||||
|
| |||||||||||||||||||||||||||||||
| 182 | American Funds Insurance Series |
Managed Risk Blue Chip Income and Growth Fund
| Sales1 | Reinvestments of dividends and distributions | Repurchases1 | Net (decrease) increase | |||||||||||||||||||||||||||||
| Share class | Amount | Shares | Amount | Shares | Amount | Shares | Amount | Shares | ||||||||||||||||||||||||
Six months ended June 30, 2017 |
| |||||||||||||||||||||||||||||||
Class P1 | $ | 59 | 5 | $ 5 | 1 | $ (133) | (11 | ) | $ | (69 | ) | (5) | ||||||||||||||||||||
Class P2 | 73,692 | 6,177 | 9,858 | 830 | (19,665 | ) | (1,636 | ) | 63,885 | 5,371 | ||||||||||||||||||||||
|
| |||||||||||||||||||||||||||||||
Total net increase (decrease) | $ | 73,751 | 6,182 | $9,863 | 831 | $(19,798) | (1,647 | ) | $ | 63,816 | 5,366 | |||||||||||||||||||||
|
| |||||||||||||||||||||||||||||||
Year ended December 31, 2016 | ||||||||||||||||||||||||||||||||
Class P1 | $ | 60 | 6 | $ 13 | 1 | $ (20) | (2 | ) | $ | 53 | 5 | |||||||||||||||||||||
Class P2 | 139,800 | 12,424 | 9,285 | 848 | (10,609 | ) | (952 | ) | 138,476 | 12,320 | ||||||||||||||||||||||
|
| |||||||||||||||||||||||||||||||
Total net increase (decrease) | $ | 139,860 | 12,430 | $9,298 | 849 | $(10,629) | (954 | ) | $ | 138,529 | 12,325 | |||||||||||||||||||||
|
| |||||||||||||||||||||||||||||||
Managed Risk Growth-Income Fund |
| |||||||||||||||||||||||||||||||
| Sales1 | Reinvestments of dividends and distributions | Repurchases1 | Net increase | |||||||||||||||||||||||||||||
| Share class | Amount | Shares | Amount | Shares | Amount | Shares | Amount | Shares | ||||||||||||||||||||||||
Six months ended June 30, 2017 |
| |||||||||||||||||||||||||||||||
Class P1 | $ 549 | 47 | $ 92 | 8 | $ (91) | (8 | ) | $ 550 | 47 | |||||||||||||||||||||||
Class P2 | 17,017 | 1,467 | 9,501 | 835 | (7,374) | (636 | ) | 19,144 | 1,666 | |||||||||||||||||||||||
|
| |||||||||||||||||||||||||||||||
Total net increase (decrease) | $17,566 | 1,514 | $ 9,593 | 843 | $ (7,465) | (644 | ) | $19,694 | 1,713 | |||||||||||||||||||||||
|
| |||||||||||||||||||||||||||||||
Year ended December 31, 2016 |
| |||||||||||||||||||||||||||||||
Class P1 | $ 746 | 68 | $ 79 | 7 | $ (343) | (31 | ) | $ 482 | 44 | |||||||||||||||||||||||
Class P2 | 41,955 | 3,864 | 10,093 | 964 | (13,341) | (1,227 | ) | 38,707 | 3,601 | |||||||||||||||||||||||
|
| |||||||||||||||||||||||||||||||
Total net increase (decrease) | $42,701 | 3,932 | $10,172 | 971 | $(13,684) | (1,258 | ) | $39,189 | 3,645 | |||||||||||||||||||||||
|
| |||||||||||||||||||||||||||||||
Managed Risk Asset Allocation Fund |
| |||||||||||||||||||||||||||||||
| Sales1 | Reinvestments of dividends and distributions | Repurchases1 | Net increase | |||||||||||||||||||||||||||||
| Share class | Amount | Shares | Amount | Shares | Amount | Shares | Amount | Shares | ||||||||||||||||||||||||
Six months ended June 30, 2017 |
| |||||||||||||||||||||||||||||||
Class P1 | $ | 167,060 | 13,314 | $ 25,265 | 1,986 | $ (13,626) | (1,081 | ) | $ | 178,699 | 14,219 | |||||||||||||||||||||
Class P2 | 173,524 | 13,882 | 45,199 | 3,559 | (73,802) | (5,872 | ) | 144,921 | 11,569 | |||||||||||||||||||||||
|
| |||||||||||||||||||||||||||||||
Total net increase (decrease) | $ | 340,584 | 27,196 | $ 70,464 | 5,545 | $ (87,428) | (6,953 | ) | $ | 323,620 | 25,788 | |||||||||||||||||||||
|
| |||||||||||||||||||||||||||||||
Year ended December 31, 2016 |
| |||||||||||||||||||||||||||||||
Class P1 | $ | 443,537 | 37,855 | $ 45,747 | 3,957 | $ (14,583) | (1,270 | ) | $ | 474,701 | 40,542 | |||||||||||||||||||||
Class P2 | 369,887 | 31,502 | 92,019 | 7,990 | (131,962) | (11,243 | ) | 329,944 | 28,249 | |||||||||||||||||||||||
|
| |||||||||||||||||||||||||||||||
Total net increase (decrease) | $ | 813,424 | 69,357 | $137,766 | 11,947 | $(146,545) | (12,513 | ) | $ | 804,645 | 68,791 | |||||||||||||||||||||
|
| |||||||||||||||||||||||||||||||
1Includes exchanges between share classes of the fund.
2Class 1A shares began investment operations on January 6, 2017.
3Amount less than one thousand.
| American Funds Insurance Series | 183 |
10. Investment transactions and other disclosures
The following tables present additional information for each of the funds for the six months ended June 30, 2017 (dollars in thousands):
| Global | Blue Chip | |||||||||||||||||||||||||||||
| Global | Small | New | Income and | |||||||||||||||||||||||||||
| Growth | Capitalization | Growth | International | World | Growth | |||||||||||||||||||||||||
| Fund | Fund | Fund | Fund | Fund | Fund | |||||||||||||||||||||||||
Purchases of investment securities* | $1,296,935 | $ 697,762 | $3,483,444 | $1,232,121 | $1,178,332 | $1,874,187 | ||||||||||||||||||||||||
Sales of investment securities* | 1,445,347 | 1,010,526 | 5,044,575 | 1,446,519 | 1,181,361 | 1,711,030 | ||||||||||||||||||||||||
Non-U.S. taxes paid on interest income | – | – | – | (11) | 19 | – | ||||||||||||||||||||||||
Non-U.S. taxes paid on realized gains | 51 | – | – | 512 | – | – | ||||||||||||||||||||||||
Non-U.S. taxes provided on unrealized gains | 49 | 33 | – | 2,992 | 2,114 | – | ||||||||||||||||||||||||
Dividends from affiliated issuers | – | 999 | – | – | – | – | ||||||||||||||||||||||||
Net realized (loss) gain from affiliated issuers | – | (3,537) | – | – | – | – | ||||||||||||||||||||||||
| Global | International | |||||||||||||||||||||||||||||
| Growth | Growth- | Growth | Capital | Asset | Global | |||||||||||||||||||||||||
| and Income | Income | and Income | Income | Allocation | Balanced | |||||||||||||||||||||||||
| Fund | Fund | Fund | Builder | Fund | Fund | |||||||||||||||||||||||||
Purchases of investment securities* | $438,265 | $3,807,445 | $448,899 | $183,484 | $7,356,916 | $72,913 | ||||||||||||||||||||||||
Sales of investment securities* | 728,490 | 3,914,474 | 390,545 | 137,173 | 6,913,815 | 56,404 | ||||||||||||||||||||||||
Non-U.S. taxes paid on interest income | – | – | 8 | – | – | 10 | ||||||||||||||||||||||||
Non-U.S. taxes paid on realized gains | 494 | 10 | 66 | – | – | 1 | ||||||||||||||||||||||||
Non-U.S. taxes provided on unrealized gains | 569 | 122 | 737 | – | 108 | 3 | ||||||||||||||||||||||||
Dividends from affiliated issuers | – | – | – | – | – | – | ||||||||||||||||||||||||
Net realized (loss) gain from affiliated issuers | – | – | – | – | – | – | ||||||||||||||||||||||||
| U.S. | ||||||||||||||||||||||||||||||
| High- | Government/ | |||||||||||||||||||||||||||||
| Global | Income | Ultra-Short | AAA-Rated | |||||||||||||||||||||||||||
| Bond | Bond | Bond | Mortgage | Bond | Securities | |||||||||||||||||||||||||
| Fund | Fund | Fund | Fund | Fund | Fund | |||||||||||||||||||||||||
Purchases of investment securities* | $10,776,837 | $1,043,219 | $698,302 | $1,402,401 | $– | $9,719,948 | ||||||||||||||||||||||||
Sales of investment securities* | 12,666,209 | 1,178,903 | 896,758 | 1,393,925 | – | 9,645,828 | ||||||||||||||||||||||||
Non-U.S. taxes paid on interest income | – | 313 | (5) | – | – | – | ||||||||||||||||||||||||
Non-U.S. taxes paid on realized gains | – | 223 | – | – | – | – | ||||||||||||||||||||||||
Non-U.S. taxes provided on unrealized gains | 10 | 188 | 5 | – | – | – | ||||||||||||||||||||||||
Dividends from affiliated issuers | – | – | – | – | – | – | ||||||||||||||||||||||||
Net realized (loss) gain from affiliated issuers | – | – | – | – | – | – | ||||||||||||||||||||||||
| Managed | Managed | Managed | ||||||||||||||||||||||||||||
| Managed | Managed | Risk Blue | Risk | Risk | ||||||||||||||||||||||||||
| Risk | Risk | Chip Income | Growth- | Asset | ||||||||||||||||||||||||||
| Growth | International | and Growth | Income | Allocation | ||||||||||||||||||||||||||
| Fund | Fund | Fund | Fund | Fund | ||||||||||||||||||||||||||
Purchases of investment securities* | $43,200 | $14,631 | $79,280 | $26,194 | $434,120 | |||||||||||||||||||||||||
Sales of investment securities* | 10,750 | 4,448 | 15,254 | 5,069 | 14,247 | |||||||||||||||||||||||||
Non-U.S. taxes paid on interest income | – | – | – | – | – | |||||||||||||||||||||||||
Non-U.S. taxes paid on realized gains | – | – | – | – | – | |||||||||||||||||||||||||
Non-U.S. taxes provided on unrealized gains | – | – | – | – | – | |||||||||||||||||||||||||
Dividends from affiliated issuers | 365 | 397 | 1,244 | 488 | 12,067 | |||||||||||||||||||||||||
Net realized (loss) gain from affiliated issuers | (574) | (483) | (296) | (554) | 1,372 | |||||||||||||||||||||||||
*Excludes short-term securities and U.S. government obligations, if any.
| 184 | American Funds Insurance Series |
11. Ownership concentration
At June 30, 2017, CRMC held aggregate ownership of 11% of the outstanding shares of Global Balanced Fund. The ownership represents the seed money invested in the fund when the fund began operations. In addition, American Funds Insurance Series -Portfolio Series - Managed Risk Growth and Income Portfolio, American Funds Insurance Series - Managed Risk Asset Allocation Fund and American Funds Insurance Series - Portfolio Series - Managed Risk Global Allocation Portfolio held 34%, 16% and 15% of the outstanding shares of Capital Income Builder, Asset Allocation Fund and Global Balanced Fund, respectively.
| American Funds Insurance Series | 185 |
Financial highlights
| Income (loss) from investment operations1 | Dividends and distributions | |||||||||||||||||||||||||||||||||||||||||||||||
| Period ended | Net asset value, beginning of period | Net investment income (loss) | Net gains (losses) on (both | Total from investment operations | Dividends (from net | Distributions (from gains) | Total dividends and distributions | Net asset value, end | Total return | Net assets, end of period (in millions) | Ratio of expenses to average net assets | Ratio of (loss) to average | ||||||||||||||||||||||||||||||||||||
Global Growth Fund |
| |||||||||||||||||||||||||||||||||||||||||||||||
Class 1: | ||||||||||||||||||||||||||||||||||||||||||||||||
6/30/172,3 | $24.05 | $.20 | $4.31 | $4.51 | $(.03 | ) | $(.84) | $(.87 | ) | $27.69 | 18.75 | %4 | $1,866 | .55 | %5 | 1.53 | %5 | |||||||||||||||||||||||||||||||
12/31/16 | 26.39 | .25 | (.14 | ) | .11 | (.29 | ) | (2.16) | (2.45 | ) | 24.05 | .87 | 1,630 | .56 | 1.00 | |||||||||||||||||||||||||||||||||
12/31/15 | 27.48 | .25 | 1.80 | 2.05 | (.35 | ) | (2.79) | (3.14 | ) | 26.39 | 7.24 | 1,626 | .55 | .90 | ||||||||||||||||||||||||||||||||||
12/31/14 | 30.11 | .31 | 6 | .40 | .71 | (.40 | ) | (2.94) | (3.34 | ) | 27.48 | 2.52 | 1,558 | .55 | 1.08 | 6 | ||||||||||||||||||||||||||||||||
12/31/13 | 23.58 | .31 | 6.62 | 6.93 | (.40 | ) | – | (.40 | ) | 30.11 | 29.51 | 1,508 | .55 | 1.17 | ||||||||||||||||||||||||||||||||||
12/31/12 | 19.40 | .30 | 4.14 | 4.44 | (.26 | ) | – | (.26 | ) | 23.58 | 22.89 | 1,466 | .56 | 1.38 | ||||||||||||||||||||||||||||||||||
Class 1A: | ||||||||||||||||||||||||||||||||||||||||||||||||
6/30/172,3,7 | 24.50 | .24 | 3.80 | 4.04 | (.03 | ) | (.84 | ) | (.87 | ) | 27.67 | 16.49 | 4 | 1 | .38 | 4 | .87 | 4 | ||||||||||||||||||||||||||||||
Class 2: | ||||||||||||||||||||||||||||||||||||||||||||||||
6/30/172,3 | 23.85 | .16 | 4.27 | 4.43 | (.02 | ) | (.84 | ) | (.86) | 27.42 | 18.57 | 4 | 3,850 | | .80 | 5 | 1.27 | 5 | ||||||||||||||||||||||||||||||
12/31/16 | 26.19 | .18 | (.14 | ) | .04 | (.22 | ) | (2.16 | ) | (2.38 | ) | 23.85 | .62 | 3,483 | .81 | .76 | ||||||||||||||||||||||||||||||||
12/31/15 | 27.30 | .18 | 1.78 | 1.96 | (.28 | ) | (2.79 | ) | (3.07 | ) | 26.19 | 6.94 | 3,817 | .80 | .66 | |||||||||||||||||||||||||||||||||
12/31/14 | 29.92 | .24 | 6 | .41 | .65 | (.33 | ) | (2.94 | ) | (3.27 | ) | 27.30 | 2.31 | 3,992 | .80 | .85 | 6 | |||||||||||||||||||||||||||||||
12/31/13 | 23.44 | .24 | 6.58 | 6.82 | (.34 | ) | – | (.34 | ) | 29.92 | 29.18 | 4,379 | .80 | .91 | ||||||||||||||||||||||||||||||||||
12/31/12 | 19.29 | .24 | 4.11 | 4.35 | (.20 | ) | – | (.20 | ) | 23.44 | 22.56 | 3,723 | .81 | 1.13 | ||||||||||||||||||||||||||||||||||
Class 4: | ||||||||||||||||||||||||||||||||||||||||||||||||
6/30/172,3 | 23.81 | .14 | 4.26 | 4.40 | (.02 | ) | (.84 | ) | (.86) | 27.35 | 18.44 | 4 | 134 | 1.05 | 5 | 1.07 | 5 | |||||||||||||||||||||||||||||||
12/31/16 | 26.16 | .12 | (.14 | ) | (.02 | ) | (.17 | ) | (2.16 | ) | (2.33 | ) | 23.81 | .37 | 94 | 1.06 | .50 | |||||||||||||||||||||||||||||||
12/31/15 | 27.34 | .09 | 1.81 | 1.90 | (.29 | ) | (2.79 | ) | (3.08 | ) | 26.16 | 6.69 | 91 | 1.05 | .34 | |||||||||||||||||||||||||||||||||
12/31/14 | 30.07 | .07 | 6 | .50 | .57 | (.36 | ) | (2.94 | ) | (3.30 | ) | 27.34 | 2.01 | 19 | 1.05 | .26 | 6 | |||||||||||||||||||||||||||||||
12/31/13 | 23.58 | .13 | 6.77 | 6.90 | (.41 | ) | – | (.41 | ) | 30.07 | 29.36 | 1 | 1.06 | .43 | ||||||||||||||||||||||||||||||||||
12/31/122,8 | 23.53 | .01 | .29 | .30 | (.25 | ) | – | (.25 | ) | 23.58 | 1.27 | 4,9 | – | 10 | .02 | 4,9 | .04 | 4,9 | ||||||||||||||||||||||||||||||
Global Small Capitalization Fund |
| |||||||||||||||||||||||||||||||||||||||||||||||
Class 1: | ||||||||||||||||||||||||||||||||||||||||||||||||
6/30/172,3 | $20.24 | $.08 | $2.52 | $2.60 | $ (.10 | ) | $ – | $(.10) | $22.74 | 12.82 | %4 | $1,526 | .73 | %5 | .72 | %5 | ||||||||||||||||||||||||||||||||
12/31/16 | 24.41 | .12 | .17 | .29 | (.11 | ) | (4.35 | ) | (4.46 | ) | 20.24 | 2.35 | 1,532 | .74 | .57 | |||||||||||||||||||||||||||||||||
12/31/15 | 26.09 | .04 | .36 | .40 | – | (2.08 | ) | (2.08 | ) | 24.41 | .50 | 1,706 | .73 | .15 | ||||||||||||||||||||||||||||||||||
12/31/14 | 25.69 | .09 | .52 | .61 | (.09 | ) | (.12 | ) | (.21 | ) | 26.09 | 2.36 | 1,411 | .74 | .34 | |||||||||||||||||||||||||||||||||
12/31/13 | 20.16 | .04 | 5.70 | 5.74 | (.21 | ) | – | (.21 | ) | 25.69 | 28.60 | 1,241 | .74 | .17 | ||||||||||||||||||||||||||||||||||
12/31/12 | 17.28 | .09 | 3.09 | 3.18 | (.30 | ) | – | (.30 | ) | 20.16 | 18.51 | 1,019 | .75 | .46 | ||||||||||||||||||||||||||||||||||
Class 1A: | ||||||||||||||||||||||||||||||||||||||||||||||||
6/30/172,3,7 | 20.70 | .11 | 2.02 | 2.13 | (.10 | ) | – | (.10 | ) | 22.73 | 10.26 | 4 | – | 10 | .45 | 4 | .49 | 4 | ||||||||||||||||||||||||||||||
Class 2: | ||||||||||||||||||||||||||||||||||||||||||||||||
6/30/172,3 | 19.72 | .05 | 2.46 | 2.51 | (.09 | ) | – | (.09 | ) | 22.14 | 12.71 | 4 | 2,447 | .98 | 5 | .46 | 5 | |||||||||||||||||||||||||||||||
12/31/16 | 23.90 | .07 | .15 | .22 | (.05 | ) | (4.35 | ) | (4.40 | ) | 19.72 | 2.10 | 2,303 | .99 | .31 | |||||||||||||||||||||||||||||||||
12/31/15 | 25.64 | (.03 | ) | .37 | .34 | – | (2.08 | ) | (2.08 | ) | 23.90 | .27 | 2,492 | .98 | (.10 | ) | ||||||||||||||||||||||||||||||||
12/31/14 | 25.25 | .03 | .51 | .54 | (.03 | ) | (.12 | ) | (.15 | ) | 25.64 | 2.12 | 2,738 | .99 | .10 | |||||||||||||||||||||||||||||||||
12/31/13 | 19.86 | (.01 | ) | 5.60 | 5.59 | (.20 | ) | – | (.20 | ) | 25.25 | 28.28 | 2,955 | .99 | (.05 | ) | ||||||||||||||||||||||||||||||||
12/31/12 | 17.04 | .04 | 3.03 | 3.07 | (.25 | ) | – | (.25 | ) | 19.86 | 18.18 | 2,603 | 1.00 | .20 | ||||||||||||||||||||||||||||||||||
Class 4: | ||||||||||||||||||||||||||||||||||||||||||||||||
6/30/172,3 | 19.91 | .03 | 2.47 | 2.50 | (.08 | ) | – | (.08 | ) | 22.33 | 12.57 | 4 | 61 | 1.23 | 5 | .26 | 5 | |||||||||||||||||||||||||||||||
12/31/16 | 24.11 | .01 | .16 | .17 | (.02 | ) | (4.35 | ) | (4.37 | ) | 19.91 | 1.85 | 42 | 1.24 | .03 | |||||||||||||||||||||||||||||||||
12/31/15 | 25.92 | (.10 | ) | .37 | .27 | – | (2.08 | ) | (2.08 | ) | 24.11 | (.02 | ) | 34 | 1.23 | (.37 | ) | |||||||||||||||||||||||||||||||
12/31/14 | 25.57 | (.05 | ) | .54 | .49 | (.02 | ) | (.12 | ) | (.14 | ) | 25.92 | 1.88 | 12 | 1.24 | (.17 | ) | |||||||||||||||||||||||||||||||
12/31/13 | 20.16 | (.12 | ) | 5.74 | 5.62 | (.21 | ) | – | (.21 | ) | 25.57 | 28.01 | 4 | 1.24 | (.50 | ) | ||||||||||||||||||||||||||||||||
12/31/122,8 | 19.68 | .01 | .54 | .55 | (.07 | ) | – | (.07 | ) | 20.16 | 2.80 | 4,9 | – | 10 | .04 | 4,9 | .04 | 4,9 | ||||||||||||||||||||||||||||||
| 186 | American Funds Insurance Series |
| Income (loss) from investment operations1 | Dividends and distributions | |||||||||||||||||||||||||||||||||||||||||||||||
Period ended | Net asset value, beginning of period | Net investment income (loss) | Net gains (both | Total from investment operations | Dividends (from net investment income) | Distributions (from capital gains) | Total dividends and distributions | Net asset of period | Total return | Net assets, end of period (in millions) | Ratio of expenses to average net assets | Ratio of to average | ||||||||||||||||||||||||||||||||||||
Growth Fund |
| |||||||||||||||||||||||||||||||||||||||||||||||
Class 1: | ||||||||||||||||||||||||||||||||||||||||||||||||
6/30/172,3 | $67.29 | $.33 | $9.91 | $10.24 | $(.12 | ) | $(7.33 | ) | $(7.45 | ) | $70.08 | 15.15 | %4 | $7,757 | .35 | %5 | .90 | %5 | ||||||||||||||||||||||||||||||
12/31/16 | 68.02 | .67 | 5.40 | 6.07 | (.67 | ) | (6.13 | ) | (6.80 | ) | 67.29 | 9.77 | 6,931 | .35 | 1.03 | |||||||||||||||||||||||||||||||||
12/31/15 | 80.15 | .64 | 5.08 | 5.72 | (.61 | ) | (17.24 | ) | (17.85 | ) | 68.02 | 7.12 | 6,796 | .35 | .87 | |||||||||||||||||||||||||||||||||
12/31/14 | 78.54 | .88 | 6 | 5.79 | 6.67 | (1.16 | ) | (3.90 | ) | (5.06 | ) | 80.15 | 8.78 | 7,118 | .35 | 1.12 | 6 | |||||||||||||||||||||||||||||||
12/31/13 | 60.90 | .64 | 17.84 | 18.48 | (.84 | ) | – | (.84 | ) | 78.54 | 30.43 | 7,003 | .35 | .93 | ||||||||||||||||||||||||||||||||||
12/31/12 | 52.07 | .63 | 8.83 | 9.46 | (.63 | ) | – | (.63 | ) | 60.90 | 18.19 | 7,116 | .35 | 1.10 | ||||||||||||||||||||||||||||||||||
Class 1A: | ||||||||||||||||||||||||||||||||||||||||||||||||
6/30/172,3,7 | 68.84 | .38 | 8.26 | 8.64 | (.12 | ) | (7.33 | ) | (7.45 | ) | 70.03 | 12.48 | 4 | 1 | .28 | 4 | .51 | 4 | ||||||||||||||||||||||||||||||
Class 2: | ||||||||||||||||||||||||||||||||||||||||||||||||
6/30/172,3 | 66.92 | .23 | 9.86 | 10.09 | (.09 | ) | (7.33 | ) | (7.42 | ) | 69.59 | 15.00 | 4 | 15,059 | .60 | 5 | .65 | 5 | ||||||||||||||||||||||||||||||
12/31/16 | 67.69 | .51 | 5.36 | 5.87 | (.51 | ) | (6.13 | ) | (6.64 | ) | 66.92 | 9.49 | 13,978 | .60 | .78 | |||||||||||||||||||||||||||||||||
12/31/15 | 79.84 | .46 | 5.06 | 5.52 | (.43 | ) | (17.24 | ) | (17.67 | ) | 67.69 | 6.86 | 14,414 | .60 | .62 | |||||||||||||||||||||||||||||||||
12/31/14 | 77.94 | .68 | 6 | 5.75 | 6.43 | (.63 | ) | (3.90 | ) | (4.53 | ) | 79.84 | 8.51 | 15,413 | .60 | .87 | 6 | |||||||||||||||||||||||||||||||
12/31/13 | 60.45 | .47 | 17.68 | 18.15 | (.66 | ) | – | (.66 | ) | 77.94 | 30.11 | 16,334 | .60 | .68 | ||||||||||||||||||||||||||||||||||
12/31/12 | 51.68 | .47 | 8.77 | 9.24 | (.47 | ) | – | (.47 | ) | 60.45 | 17.89 | 14,911 | .60 | .83 | ||||||||||||||||||||||||||||||||||
Class 3: | ||||||||||||||||||||||||||||||||||||||||||||||||
6/30/172,3 | 67.67 | .26 | 9.97 | 10.23 | (.10 | ) | (7.33 | ) | (7.43 | ) | 70.47 | 15.05 | 4 | 201 | .53 | 5 | .72 | 5 | ||||||||||||||||||||||||||||||
12/31/16 | 68.37 | .56 | 5.42 | 5.98 | (.55 | ) | (6.13 | ) | (6.68 | ) | 67.67 | 9.56 | 183 | .53 | .85 | |||||||||||||||||||||||||||||||||
12/31/15 | 80.47 | .51 | 5.11 | 5.62 | (.48 | ) | (17.24 | ) | (17.72 | ) | 68.37 | 6.92 | 194 | .53 | .69 | |||||||||||||||||||||||||||||||||
12/31/14 | 78.62 | .74 | 6 | 5.79 | 6.53 | (.78 | ) | (3.90 | ) | (4.68 | ) | 80.47 | 8.58 | 208 | .53 | .94 | 6 | |||||||||||||||||||||||||||||||
12/31/13 | 60.97 | .52 | 17.84 | 18.36 | (.71 | ) | – | (.71 | ) | 78.62 | 30.20 | 216 | .53 | .75 | ||||||||||||||||||||||||||||||||||
12/31/12 | 52.13 | .53 | 8.83 | 9.36 | (.52 | ) | – | (.52 | ) | 60.97 | 17.97 | 189 | .53 | .92 | ||||||||||||||||||||||||||||||||||
Class 4: | ||||||||||||||||||||||||||||||||||||||||||||||||
6/30/172,3 | 66.41 | .15 | 9.77 | 9.92 | (.07 | ) | (7.33 | ) | (7.40 | ) | 68.93 | 14.86 | 4 | 575 | .85 | 5 | .41 | 5 | ||||||||||||||||||||||||||||||
12/31/16 | 67.26 | .34 | 5.32 | 5.66 | (.38 | ) | (6.13 | ) | (6.51 | ) | 66.41 | 9.22 | 458 | .85 | .53 | |||||||||||||||||||||||||||||||||
12/31/15 | 79.74 | .29 | 5.02 | 5.31 | (.55 | ) | (17.24 | ) | (17.79 | ) | 67.26 | 6.59 | 394 | .85 | .42 | |||||||||||||||||||||||||||||||||
12/31/14 | 78.32 | .37 | 6 | 5.87 | 6.24 | (.92 | ) | (3.90 | ) | (4.82 | ) | 79.74 | 8.25 | 24 | .85 | .47 | 6 | |||||||||||||||||||||||||||||||
12/31/13 | 60.90 | .29 | 17.90 | 18.19 | (.77 | ) | – | (.77 | ) | 78.32 | 29.96 | 5 | .85 | .40 | ||||||||||||||||||||||||||||||||||
12/31/122,8 | 60.55 | .03 | .78 | .81 | (.46 | ) | – | (.46 | ) | 60.90 | 1.33 | 4,9 | – | 10 | .02 | 4,9 | .05 | 4,9 | ||||||||||||||||||||||||||||||
See end of tables for footnotes.
| American Funds Insurance Series | 187 |
Financial highlights (continued)
| Income (loss) from investment operations1 | Dividends and distributions | |||||||||||||||||||||||||||||||||||||||||||||||
| Period ended | Net asset value, beginning of period | Net investment income (loss) | Net gains (losses) on securities (both realized and unrealized) | Total from investment operations | Dividends (from net investment income) | Distributions (from capital gains) | Total dividends and distributions | Net asset value, end of period | Total return | Net assets, end of period (in millions) | Ratio of expenses to average net assets | Ratio of net income (loss) to average net assets | ||||||||||||||||||||||||||||||||||||
International Fund |
| |||||||||||||||||||||||||||||||||||||||||||||||
Class 1: | ||||||||||||||||||||||||||||||||||||||||||||||||
6/30/172,3 | $16.82 | $.18 | $2.97 | $3.15 | $(.07 | ) | $(.23 | ) | $(.30 | ) | $19.67 | 18.71 | %4 | $4,487 | .53 | %5 | 1.98 | %5 | ||||||||||||||||||||||||||||||
12/31/16 | 18.08 | .27 | .30 | .57 | (.28 | ) | (1.55 | ) | (1.83 | ) | 16.82 | 3.78 | 3,652 | .54 | 1.57 | |||||||||||||||||||||||||||||||||
12/31/15 | 20.35 | .29 | (1.03 | ) | (.74 | ) | (.35 | ) | (1.18 | ) | (1.53 | ) | 18.08 | (4.25 | ) | 3,427 | .54 | 1.41 | ||||||||||||||||||||||||||||||
12/31/14 | 21.22 | .30 | (.81 | ) | (.51 | ) | (.36 | ) | – | (.36 | ) | 20.35 | (2.41 | ) | 3,282 | .54 | 1.43 | |||||||||||||||||||||||||||||||
12/31/13 | 17.68 | .27 | 3.59 | 3.86 | (.32 | ) | – | (.32 | ) | 21.22 | 21.91 | 3,324 | .54 | 1.41 | ||||||||||||||||||||||||||||||||||
12/31/12 | 15.21 | .30 | 2.47 | 2.77 | (.30 | ) | – | (.30 | ) | 17.68 | 18.21 | 3,618 | .54 | 1.81 | ||||||||||||||||||||||||||||||||||
Class 1A: | ||||||||||||||||||||||||||||||||||||||||||||||||
6/30/172,3,7 | 17.17 | .17 | 2.61 | 2.78 | (.07 | ) | (.23 | ) | (.30 | ) | 19.65 | 16.17 | 4 | – | 10 | .36 | 4 | .90 | 4 | |||||||||||||||||||||||||||||
Class 2: | ||||||||||||||||||||||||||||||||||||||||||||||||
6/30/172,3 | 16.76 | .16 | 2.95 | 3.11 | (.06 | ) | (.23 | ) | (.29 | ) | 19.58 | 18.55 | 4 | 4,165 | .78 | 5 | 1.72 | 5 | ||||||||||||||||||||||||||||||
12/31/16 | 18.02 | .23 | .30 | .53 | (.24 | ) | (1.55 | ) | (1.79 | ) | 16.76 | 3.53 | 3,710 | .79 | 1.35 | |||||||||||||||||||||||||||||||||
12/31/15 | 20.29 | .24 | (1.03 | ) | (.79 | ) | (.30 | ) | (1.18 | ) | (1.48 | ) | 18.02 | (4.53 | ) | 3,978 | .79 | 1.17 | ||||||||||||||||||||||||||||||
12/31/14 | 21.15 | .25 | (.81 | ) | (.56 | ) | (.30 | ) | – | (.30 | ) | 20.29 | (2.65 | ) | 4,374 | .79 | 1.19 | |||||||||||||||||||||||||||||||
12/31/13 | 17.62 | .22 | 3.58 | 3.80 | (.27 | ) | – | (.27 | ) | 21.15 | 21.64 | 5,916 | .79 | 1.15 | ||||||||||||||||||||||||||||||||||
12/31/12 | 15.16 | .26 | 2.45 | 2.71 | (.25 | ) | – | (.25 | ) | 17.62 | 17.91 | 5,465 | .79 | 1.57 | ||||||||||||||||||||||||||||||||||
Class 3: | ||||||||||||||||||||||||||||||||||||||||||||||||
6/30/172,3 | 16.85 | .16 | 2.98 | 3.14 | (.06 | ) | (.23 | ) | (.29 | ) | 19.70 | 18.64 | 4 | 30 | .71 | 5 | 1.79 | 5 | ||||||||||||||||||||||||||||||
12/31/16 | 18.11 | .24 | .30 | .54 | (.25 | ) | (1.55 | ) | (1.80 | ) | 16.85 | 3.57 | 27 | .72 | 1.42 | |||||||||||||||||||||||||||||||||
12/31/15 | 20.38 | .25 | (1.03 | ) | (.78 | ) | (.31 | ) | (1.18 | ) | (1.49 | ) | 18.11 | (4.44 | ) | 32 | .72 | 1.24 | ||||||||||||||||||||||||||||||
12/31/14 | 21.24 | .27 | (.82 | ) | (.55 | ) | (.31 | ) | – | (.31 | ) | 20.38 | (2.56 | ) | 38 | .72 | 1.28 | |||||||||||||||||||||||||||||||
12/31/13 | 17.70 | .23 | 3.59 | 3.82 | (.28 | ) | – | (.28 | ) | 21.24 | 21.67 | 46 | .72 | 1.22 | ||||||||||||||||||||||||||||||||||
12/31/12 | 15.23 | .27 | 2.47 | 2.74 | (.27 | ) | – | (.27 | ) | 17.70 | 17.97 | 44 | .72 | 1.65 | ||||||||||||||||||||||||||||||||||
Class 4: | ||||||||||||||||||||||||||||||||||||||||||||||||
6/30/172,3 | 16.64 | .14 | 2.94 | 3.08 | (.06 | ) | (.23 | ) | (.29 | ) | 19.43 | 18.48 | 4 | 98 | 1.03 | 5 | 1.51 | 5 | ||||||||||||||||||||||||||||||
12/31/16 | 17.93 | .18 | .29 | .47 | (.21 | ) | (1.55 | ) | (1.76 | ) | 16.64 | 3.21 | 66 | 1.04 | 1.03 | |||||||||||||||||||||||||||||||||
12/31/15 | 20.23 | .17 | (1.00 | ) | (.83 | ) | (.29 | ) | (1.18 | ) | (1.47 | ) | 17.93 | (4.75 | ) | 46 | 1.04 | .88 | ||||||||||||||||||||||||||||||
12/31/14 | 21.16 | .07 | (.68 | ) | (.61 | ) | (.32 | ) | – | (.32 | ) | 20.23 | (2.88 | ) | 18 | 1.04 | .31 | |||||||||||||||||||||||||||||||
12/31/13 | 17.68 | (.01 | ) | 3.79 | 3.78 | (.30 | ) | – | (.30 | ) | 21.16 | 21.48 | 2 | 1.04 | (.07 | ) | ||||||||||||||||||||||||||||||||
12/31/122,8 | 17.79 | .01 | .16 | .17 | (.28 | ) | – | (.28 | ) | 17.68 | .98 | 4,9 | – | 10 | .02 | 4,9 | .05 | 4,9 | ||||||||||||||||||||||||||||||
New World Fund |
| |||||||||||||||||||||||||||||||||||||||||||||||
Class 1: | ||||||||||||||||||||||||||||||||||||||||||||||||
6/30/172,3 | $19.72 | $.17 | $2.71 | $2.88 | $(.04 | ) | $ – | $(.04 | ) | $22.56 | 14.59 | %4 | $1,841 | .75 | %5 | 1.55 | %5 | |||||||||||||||||||||||||||||||
12/31/16 | 18.87 | .24 | .81 | 1.05 | (.20 | ) | – | (.20 | ) | 19.72 | 5.59 | 1,743 | .78 | 1.25 | ||||||||||||||||||||||||||||||||||
12/31/15 | 20.72 | .19 | (.71 | ) | (.52 | ) | (.17 | ) | (1.16 | ) | (1.33 | ) | 18.87 | (2.96 | ) | 1,562 | .79 | .92 | ||||||||||||||||||||||||||||||
12/31/14 | 25.08 | .29 | 6 | (1.92 | ) | (1.63 | ) | (.29 | ) | (2.44 | ) | (2.73 | ) | 20.72 | (7.63 | ) | 1,433 | .78 | 1.23 | 6 | ||||||||||||||||||||||||||||
12/31/13 | 22.93 | .34 | 2.31 | 2.65 | (.39 | ) | (.11 | ) | (.50 | ) | 25.08 | 11.66 | 1,388 | .78 | 1.45 | |||||||||||||||||||||||||||||||||
12/31/12 | 19.65 | .33 | 3.23 | 3.56 | (.28 | ) | – | (.28 | ) | 22.93 | 18.13 | 1,140 | .79 | 1.54 | ||||||||||||||||||||||||||||||||||
Class 1A: | ||||||||||||||||||||||||||||||||||||||||||||||||
6/30/172,3,7 | 20.14 | .21 | 2.23 | 2.44 | (.04 | ) | – | (.04 | ) | 22.54 | 12.10 | 4 | – | 10 | .46 | 4 | .95 | 4 | ||||||||||||||||||||||||||||||
Class 2: | ||||||||||||||||||||||||||||||||||||||||||||||||
6/30/172,3 | 19.54 | .14 | 2.69 | 2.83 | (.03 | ) | – | (.03 | ) | 22.34 | 14.48 | 4 | 990 | 1.00 | 5 | 1.31 | 5 | |||||||||||||||||||||||||||||||
12/31/16 | 18.71 | .19 | .79 | .98 | (.15 | ) | – | (.15 | ) | 19.54 | 5.26 | 911 | 1.03 | 1.00 | ||||||||||||||||||||||||||||||||||
12/31/15 | 20.54 | .14 | (.69 | ) | (.55 | ) | (.12 | ) | (1.16 | ) | (1.28 | ) | 18.71 | (3.14 | ) | 961 | 1.04 | .68 | ||||||||||||||||||||||||||||||
12/31/14 | 24.88 | .24 | 6 | (1.91 | ) | (1.67 | ) | (.23 | ) | (2.44 | ) | (2.67 | ) | 20.54 | (7.87 | ) | 1,084 | 1.03 | 1.01 | 6 | ||||||||||||||||||||||||||||
12/31/13 | 22.75 | .28 | 2.29 | 2.57 | (.33 | ) | (.11 | ) | (.44 | ) | 24.88 | 11.38 | 1,307 | 1.03 | 1.22 | |||||||||||||||||||||||||||||||||
12/31/12 | 19.50 | .28 | 3.19 | 3.47 | (.22 | ) | – | (.22 | ) | 22.75 | 17.82 | 1,378 | 1.04 | 1.31 | ||||||||||||||||||||||||||||||||||
Class 4: | ||||||||||||||||||||||||||||||||||||||||||||||||
6/30/172,3 | 19.51 | .12 | 2.67 | 2.79 | (.02 | ) | – | (.02 | ) | 22.28 | 14.32 | 4 | 321 | 1.25 | 5 | 1.12 | 5 | |||||||||||||||||||||||||||||||
12/31/16 | 18.69 | .14 | .80 | .94 | (.12 | ) | – | (.12 | ) | 19.51 | 5.04 | 240 | 1.28 | .75 | ||||||||||||||||||||||||||||||||||
12/31/15 | 20.56 | .08 | (.68 | ) | (.60 | ) | (.11 | ) | (1.16 | ) | (1.27 | ) | 18.69 | (3.37 | ) | 171 | 1.29 | .39 | ||||||||||||||||||||||||||||||
12/31/14 | 24.99 | .09 | 6 | (1.83 | ) | (1.74 | ) | (.25 | ) | (2.44 | ) | (2.69 | ) | 20.56 | (8.13 | ) | 64 | 1.28 | .40 | 6 | ||||||||||||||||||||||||||||
12/31/13 | 22.93 | .14 | 2.41 | 2.55 | (.38 | ) | (.11 | ) | (.49 | ) | 24.99 | 11.20 | 8 | 1.29 | .56 | |||||||||||||||||||||||||||||||||
12/31/122,8 | 22.83 | .01 | .35 | .36 | (.26 | ) | – | (.26 | ) | 22.93 | 1.58 | 4,9 | – | 10 | .04 | 4,9 | .04 | 4,9 | ||||||||||||||||||||||||||||||
| 188 | American Funds Insurance Series |
| Income (loss) from investment operations1 | Dividends and distributions | |||||||||||||||||||||||||||||||||||||||||||||||
| Period ended | Net asset value, beginning of period | Net investment income (loss) | Net gains (losses) on securities (both realized and unrealized) | Total from investment operations | Dividends (from net investment income) | Distributions (from capital gains) | Total dividends and distributions | Net asset value, end of period | Total return | Net assets, end of period (in millions) | Ratio of expenses to average net assets | Ratio of to average | ||||||||||||||||||||||||||||||||||||
Blue Chip Income and Growth Fund |
| |||||||||||||||||||||||||||||||||||||||||||||||
Class 1: | ||||||||||||||||||||||||||||||||||||||||||||||||
6/30/172,3 | $13.53 | $.16 | $.63 | $.79 | $(.05 | ) | $(.53 | ) | $(.58 | ) | $13.74 | 5.82 | %4 | $5,270 | .41 | %5 | 2.26 | %5 | ||||||||||||||||||||||||||||||
12/31/16 | 12.62 | .31 | 1.97 | 2.28 | (.29 | ) | (1.08 | ) | (1.37 | ) | 13.53 | 19.06 | 5,099 | .41 | 2.39 | |||||||||||||||||||||||||||||||||
12/31/15 | 14.69 | .31 | (.64 | ) | (.33 | ) | (.29 | ) | (1.45 | ) | (1.74 | ) | 12.62 | (2.72 | ) | 3,638 | .41 | 2.23 | ||||||||||||||||||||||||||||||
12/31/14 | 13.12 | .46 | 6 | 1.59 | 2.05 | (.48 | ) | – | (.48 | ) | 14.69 | 15.69 | 3,542 | .42 | 3.31 | 6 | ||||||||||||||||||||||||||||||||
12/31/13 | 10.05 | .27 | 3.06 | 3.33 | (.26 | ) | – | (.26 | ) | 13.12 | 33.26 | 2,814 | .42 | 2.27 | ||||||||||||||||||||||||||||||||||
12/31/12 | 9.00 | .24 | 1.04 | 1.28 | (.23 | ) | – | (.23 | ) | 10.05 | 14.18 | 1,357 | .43 | 2.41 | ||||||||||||||||||||||||||||||||||
Class 1A: | ||||||||||||||||||||||||||||||||||||||||||||||||
6/30/172,3,7 | 13.75 | .13 | .44 | .57 | (.05 | ) | (.53 | ) | (.58 | ) | 13.74 | 4.05 | 4 | – | 10 | .29 | 4 | .92 | 4 | |||||||||||||||||||||||||||||
Class 2: | ||||||||||||||||||||||||||||||||||||||||||||||||
6/30/172,3 | 13.39 | .14 | .64 | .78 | (.05 | ) | (.53 | ) | (.58 | ) | 13.59 | 5.76 | 4 | 3,435 | .66 | 5 | 2.01 | 5 | ||||||||||||||||||||||||||||||
12/31/16 | 12.51 | .28 | 1.94 | 2.22 | (.26 | ) | (1.08 | ) | (1.34 | ) | 13.39 | 18.70 | 3,412 | .66 | 2.16 | |||||||||||||||||||||||||||||||||
12/31/15 | 14.57 | .27 | (.62 | ) | (.35 | ) | (.26 | ) | (1.45 | ) | (1.71 | ) | 12.51 | (2.93 | ) | 3,228 | .66 | 1.97 | ||||||||||||||||||||||||||||||
12/31/14 | 13.02 | .44 | 6 | 1.55 | 1.99 | (.44 | ) | – | (.44 | ) | 14.57 | 15.36 | 3,722 | .67 | 3.14 | 6 | ||||||||||||||||||||||||||||||||
12/31/13 | 9.97 | .23 | 3.05 | 3.28 | (.23 | ) | – | (.23 | ) | 13.02 | 33.00 | 3,755 | .67 | 2.03 | ||||||||||||||||||||||||||||||||||
12/31/12 | 8.93 | .21 | 1.03 | 1.24 | (.20 | ) | – | (.20 | ) | 9.97 | 13.88 | 3,382 | .68 | 2.17 | ||||||||||||||||||||||||||||||||||
Class 4: | ||||||||||||||||||||||||||||||||||||||||||||||||
6/30/172,3 | 13.39 | .12 | .62 | .74 | (.04 | ) | (.53 | ) | (.57 | ) | 13.56 | 5.52 | 4 | 175 | .91 | 5 | 1.75 | 5 | ||||||||||||||||||||||||||||||
12/31/16 | 12.53 | .24 | 1.96 | 2.20 | (.26 | ) | (1.08 | ) | (1.34 | ) | 13.39 | 18.49 | 132 | .91 | 1.81 | |||||||||||||||||||||||||||||||||
12/31/15 | 14.63 | .24 | (.63 | ) | (.39 | ) | (.26 | ) | (1.45 | ) | (1.71 | ) | 12.53 | (3.21 | ) | 32 | .91 | 1.75 | ||||||||||||||||||||||||||||||
12/31/14 | 13.12 | .34 | 6 | 1.63 | 1.97 | (.46 | ) | – | (.46 | ) | 14.63 | 15.13 | 9 | .92 | 2.33 | 6 | ||||||||||||||||||||||||||||||||
12/31/13 | 10.05 | .18 | 3.15 | 3.33 | (.26 | ) | – | (.26 | ) | 13.12 | 33.27 | – | 10 | .86 | 1.39 | |||||||||||||||||||||||||||||||||
12/31/122,8 | 10.20 | .01 | .03 | .04 | (.19 | ) | – | (.19 | ) | 10.05 | .38 | 4,9 | – | 10 | .02 | 4,9 | .10 | 4,9 | ||||||||||||||||||||||||||||||
Global Growth and Income Fund |
| |||||||||||||||||||||||||||||||||||||||||||||||
Class 1: | ||||||||||||||||||||||||||||||||||||||||||||||||
6/30/172,3 | $13.02 | $.20 | $1.74 | $1.94 | $(.05 | ) | $(.26) | $(.31 | ) | $14.65 | 14.88 | %4 | $410 | .62 | %5 | 2.89 | %5 | |||||||||||||||||||||||||||||||
12/31/16 | 12.35 | .28 | .66 | .94 | (.27 | ) | – | (.27 | ) | 13.02 | 7.61 | 571 | .63 | 2.18 | ||||||||||||||||||||||||||||||||||
12/31/15 | 12.78 | .36 | (.50 | ) | (.14 | ) | (.29 | ) | – | (.29 | ) | 12.35 | (1.14 | ) | 293 | .64 | 2.79 | |||||||||||||||||||||||||||||||
12/31/14 | 12.53 | .43 | 6 | .31 | .74 | (.49 | ) | – | (.49 | ) | 12.78 | 6.00 | 200 | .63 | 3.34 | 6 | ||||||||||||||||||||||||||||||||
12/31/13 | 10.56 | .39 | 2.00 | 2.39 | (.42 | ) | – | (.42 | ) | 12.53 | 22.81 | 206 | .62 | 3.35 | ||||||||||||||||||||||||||||||||||
12/31/12 | 9.20 | .25 | 1.39 | 1.64 | (.28 | ) | – | (.28 | ) | 10.56 | 17.93 | 180 | .62 | 2.56 | ||||||||||||||||||||||||||||||||||
Class 1A: | ||||||||||||||||||||||||||||||||||||||||||||||||
6/30/172,3,7 | 13.21 | .20 | 1.55 | 1.75 | (.05 | ) | (.26 | ) | (.31 | ) | 14.65 | 13.23 | 4,9 | – | 10 | .29 | 4,9 | 1.43 | 4,9 | |||||||||||||||||||||||||||||
Class 2: | ||||||||||||||||||||||||||||||||||||||||||||||||
6/30/172,3 | 13.00 | .18 | 1.73 | 1.91 | (.04 | ) | (.26 | ) | (.30 | ) | 14.61 | 14.70 | 4 | 1,500 | .87 | 5 | 2.65 | 5 | ||||||||||||||||||||||||||||||
12/31/16 | 12.33 | .25 | .65 | .90 | (.23 | ) | – | (.23 | ) | 13.00 | 7.34 | 1,405 | .88 | 1.98 | ||||||||||||||||||||||||||||||||||
12/31/15 | 12.75 | .22 | (.39 | ) | (.17 | ) | (.25 | ) | – | (.25 | ) | 12.33 | (1.34 | ) | 1,479 | .89 | 1.73 | |||||||||||||||||||||||||||||||
12/31/14 | 12.51 | .41 | 6 | .29 | .70 | (.46 | ) | – | (.46 | ) | 12.75 | 5.64 | 1,685 | .88 | 3.22 | 6 | ||||||||||||||||||||||||||||||||
12/31/13 | 10.54 | .36 | 2.00 | 2.36 | (.39 | ) | – | (.39 | ) | 12.51 | 22.54 | 1,822 | .87 | 3.09 | ||||||||||||||||||||||||||||||||||
12/31/12 | 9.19 | .23 | 1.38 | 1.61 | (.26 | ) | – | (.26 | ) | 10.54 | 17.56 | 1,837 | .87 | 2.31 | ||||||||||||||||||||||||||||||||||
Class 4: | ||||||||||||||||||||||||||||||||||||||||||||||||
6/30/172,3 | 12.89 | .17 | 1.71 | 1.88 | (.04 | ) | (.26 | ) | (.30 | ) | 14.47 | 14.58 | 4 | 25 | 1.12 | 5 | 2.49 | 5 | ||||||||||||||||||||||||||||||
12/31/16 | 12.26 | .21 | .65 | .86 | (.23 | ) | – | (.23 | ) | 12.89 | 7.04 | 16 | 1.13 | 1.63 | ||||||||||||||||||||||||||||||||||
12/31/15 | 12.71 | .17 | (.37 | ) | (.20 | ) | (.25 | ) | – | (.25 | ) | 12.26 | (1.60 | ) | 5 | 1.14 | 1.32 | |||||||||||||||||||||||||||||||
12/31/14 | 12.50 | .30 | 6 | .37 | .67 | (.46 | ) | – | (.46 | ) | 12.71 | 5.41 | 1 | 1.13 | 2.30 | 6 | ||||||||||||||||||||||||||||||||
12/31/13 | 10.55 | .28 | 2.09 | 2.37 | (.42 | ) | – | (.42 | ) | 12.50 | 22.60 | 1 | 1.12 | 2.27 | ||||||||||||||||||||||||||||||||||
12/31/122,8 | 10.64 | .01 | .13 | .14 | (.23 | ) | – | (.23 | ) | 10.55 | 1.27 | 4,9 | – | 10 | .03 | 4,9 | .08 | 4,9 | ||||||||||||||||||||||||||||||
See end of tables for footnotes.
| American Funds Insurance Series | 189 |
Financial highlights (continued)
| Income (loss) from investment operations1 | Dividends and distributions | |||||||||||||||||||||||||||||||||||||||||||||||
| Period ended | Net asset value, beginning of period | Net investment income (loss) | Net gains (losses) on securities (both realized and unrealized) | Total from investment operations | Dividends (from net investment income) | Distributions (from capital gains) | Total dividends and distributions | Net asset value, end of period | Total return | Net assets, end of period (in millions) | Ratio of expenses to average net assets | Ratio of to average | ||||||||||||||||||||||||||||||||||||
Growth-Income Fund |
| |||||||||||||||||||||||||||||||||||||||||||||||
Class 1: | ||||||||||||||||||||||||||||||||||||||||||||||||
6/30/172,3 | $ | 44.41 | $ | .39 | $ | 4.02 | $ | 4.41 | $ | (.14 | ) | $ | (3.11 | ) | $ | (3.25 | ) | $ | 45.57 | 9.90 | %4 | $ | 14,187 | .28 | %5 | 1.68 | %5 | |||||||||||||||||||||
12/31/16 | 45.40 | .79 | 4.09 | 4.88 | (.75 | ) | (5.12 | ) | (5.87 | ) | 44.41 | 11.80 | 12,588 | .29 | 1.79 | |||||||||||||||||||||||||||||||||
12/31/15 | 52.76 | .79 | .37 | 1.16 | (.75 | ) | (7.77 | ) | (8.52 | ) | 45.40 | 1.72 | 10,747 | .29 | 1.59 | |||||||||||||||||||||||||||||||||
12/31/14 | 50.72 | .81 | 4.57 | 5.38 | (.80 | ) | (2.54 | ) | (3.34 | ) | 52.76 | 10.91 | 10,812 | .29 | 1.56 | |||||||||||||||||||||||||||||||||
12/31/13 | 38.48 | .66 | 12.31 | 12.97 | (.73 | ) | – | (.73 | ) | 50.72 | 33.82 | 9,857 | .29 | 1.49 | ||||||||||||||||||||||||||||||||||
12/31/12 | 33.27 | .66 | 5.25 | 5.91 | (.70 | ) | – | (.70 | ) | 38.48 | 17.79 | 9,782 | .29 | 1.79 | ||||||||||||||||||||||||||||||||||
Class 1A: | ||||||||||||||||||||||||||||||||||||||||||||||||
6/30/172,3,7 | 45.39 | .32 | 3.09 | 3.41 | (.14 | ) | (3.11 | ) | (3.25 | ) | 45.55 | 7.48 | 4 | – | 10 | .23 | 4 | .68 | 4 | |||||||||||||||||||||||||||||
Class 2: | ||||||||||||||||||||||||||||||||||||||||||||||||
6/30/172,3 | 44.00 | .33 | 3.98 | 4.31 | (.12 | ) | (3.11 | ) | (3.23 | ) | 45.08 | 9.77 | 4 | 13,333 | .53 | 5 | 1.43 | 5 | ||||||||||||||||||||||||||||||
12/31/16 | 45.04 | .67 | 4.05 | 4.72 | (.64 | ) | (5.12 | ) | (5.76 | ) | 44.00 | 11.51 | 12,854 | .54 | 1.54 | |||||||||||||||||||||||||||||||||
12/31/15 | 52.41 | .66 | .37 | 1.03 | (.63 | ) | (7.77 | ) | (8.40 | ) | 45.04 | 1.45 | 12,895 | .54 | 1.34 | |||||||||||||||||||||||||||||||||
12/31/14 | 50.40 | .67 | 4.55 | 5.22 | (.67 | ) | (2.54 | ) | (3.21 | ) | 52.41 | 10.63 | 14,337 | .54 | 1.31 | |||||||||||||||||||||||||||||||||
12/31/13 | 38.24 | .55 | 12.23 | 12.78 | (.62 | ) | – | (.62 | ) | 50.40 | 33.50 | 14,980 | .54 | 1.25 | ||||||||||||||||||||||||||||||||||
12/31/12 | 33.07 | .56 | 5.22 | 5.78 | (.61 | ) | – | (.61 | ) | 38.24 | 17.48 | 13,403 | .54 | 1.53 | ||||||||||||||||||||||||||||||||||
Class 3: | ||||||||||||||||||||||||||||||||||||||||||||||||
6/30/172,3 | 44.47 | .35 | 4.03 | 4.38 | (.12 | ) | (3.11 | ) | (3.23 | ) | 45.62 | 9.83 | 4 | 160 | .46 | 5 | 1.50 | 5 | ||||||||||||||||||||||||||||||
12/31/16 | 45.46 | .71 | 4.09 | 4.80 | (.67 | ) | (5.12 | ) | (5.79 | ) | 44.47 | 11.59 | 156 | .47 | 1.61 | |||||||||||||||||||||||||||||||||
12/31/15 | 52.82 | .70 | .37 | 1.07 | (.66 | ) | (7.77 | ) | (8.43 | ) | 45.46 | 1.53 | 161 | .47 | 1.41 | |||||||||||||||||||||||||||||||||
12/31/14 | 50.77 | .71 | 4.59 | 5.30 | (.71 | ) | (2.54 | ) | (3.25 | ) | 52.82 | 10.71 | 185 | .47 | 1.38 | |||||||||||||||||||||||||||||||||
12/31/13 | 38.52 | .58 | 12.32 | 12.90 | (.65 | ) | – | (.65 | ) | 50.77 | 33.58 | 193 | .47 | 1.32 | ||||||||||||||||||||||||||||||||||
12/31/12 | 33.30 | .59 | 5.26 | 5.85 | (.63 | ) | – | (.63 | ) | 38.52 | 17.59 | 168 | .47 | 1.60 | ||||||||||||||||||||||||||||||||||
Class 4: | ||||||||||||||||||||||||||||||||||||||||||||||||
6/30/172,3 | 43.73 | .27 | 3.95 | 4.22 | (.10 | ) | (3.11 | ) | (3.21 | ) | 44.74 | 9.64 | 4 | 577 | .78 | 5 | 1.18 | 5 | ||||||||||||||||||||||||||||||
12/31/16 | 44.82 | .56 | 4.02 | 4.58 | (.55 | ) | (5.12 | ) | (5.67 | ) | 43.73 | 11.25 | 495 | .79 | 1.29 | |||||||||||||||||||||||||||||||||
12/31/15 | 52.39 | .58 | .33 | .91 | (.71 | ) | (7.77 | ) | (8.48 | ) | 44.82 | 1.21 | 410 | .79 | 1.25 | |||||||||||||||||||||||||||||||||
12/31/14 | 50.56 | .58 | 4.51 | 5.09 | (.72 | ) | (2.54 | ) | (3.26 | ) | 52.39 | 10.34 | 30 | .79 | 1.11 | |||||||||||||||||||||||||||||||||
12/31/13 | 38.47 | .45 | 12.33 | 12.78 | (.69 | ) | – | (.69 | ) | 50.56 | 33.32 | 3 | .79 | .96 | ||||||||||||||||||||||||||||||||||
12/31/122,8 | 38.65 | .01 | .39 | .40 | (.58 | ) | – | (.58 | ) | 38.47 | 1.02 | 4,9 | – | 10 | .01 | 4,9 | .03 | 4,9 | ||||||||||||||||||||||||||||||
International Growth and Income Fund |
| |||||||||||||||||||||||||||||||||||||||||||||||
Class 1: | ||||||||||||||||||||||||||||||||||||||||||||||||
6/30/172,3 | $ | 14.48 | $ | .31 | $ | 1.94 | $ | 2.25 | $ | (.03 | ) | $ | – | $ | (.03 | ) | $ | 16.70 | 15.54 | %4 | $ | 1,067 | .66 | %5 | 3.98 | %5 | ||||||||||||||||||||||
12/31/16 | 14.72 | .43 | (.19 | ) | .24 | (.42 | ) | (.06 | ) | (.48 | ) | 14.48 | 1.71 | 820 | .68 | 2.93 | ||||||||||||||||||||||||||||||||
12/31/15 | 16.27 | .42 | (1.25 | ) | (.83 | ) | (.38 | ) | (.34 | ) | (.72 | ) | 14.72 | (5.34 | ) | 707 | .68 | 2.60 | ||||||||||||||||||||||||||||||
12/31/14 | 17.48 | .58 | 6 | (1.09 | ) | (.51 | ) | (.53 | ) | (.17 | ) | (.70 | ) | 16.27 | (2.93 | ) | 740 | .68 | 3.32 | 6 | ||||||||||||||||||||||||||||
12/31/13 | 15.29 | .44 | 2.50 | 2.94 | (.47 | ) | (.28 | ) | (.75 | ) | 17.48 | 19.39 | 696 | .69 | 2.63 | |||||||||||||||||||||||||||||||||
12/31/12 | 13.40 | .37 | 1.89 | 2.26 | (.37 | ) | – | (.37 | ) | 15.29 | 16.84 | 203 | .74 | 2.50 | ||||||||||||||||||||||||||||||||||
Class 1A: | ||||||||||||||||||||||||||||||||||||||||||||||||
6/30/172,3,7 | 14.69 | .33 | 1.71 | 2.04 | (.03 | ) | – | (.03 | ) | 16.70 | 13.89 | 4,9 | – | 10 | .33 | 4,9 | 2.09 | 4,9 | ||||||||||||||||||||||||||||||
Class 2: | ||||||||||||||||||||||||||||||||||||||||||||||||
6/30/172,3 | 14.43 | .29 | 1.94 | 2.23 | (.02 | ) | – | (.02 | ) | 16.64 | 15.48 | 4 | 264 | .91 | 5 | 3.76 | 5 | |||||||||||||||||||||||||||||||
12/31/16 | 14.68 | .40 | (.21 | ) | .19 | (.38 | ) | (.06 | ) | (.44 | ) | 14.43 | 1.44 | 244 | .93 | 2.72 | ||||||||||||||||||||||||||||||||
12/31/15 | 16.22 | .38 | (1.24 | ) | (.86 | ) | (.34 | ) | (.34 | ) | (.68 | ) | 14.68 | (5.60 | ) | 254 | .93 | 2.32 | ||||||||||||||||||||||||||||||
12/31/14 | 17.43 | .56 | 6 | (1.10 | ) | (.54 | ) | (.50 | ) | (.17 | ) | (.67 | ) | 16.22 | (3.15 | ) | 248 | .93 | 3.21 | 6 | ||||||||||||||||||||||||||||
12/31/13 | 15.25 | .38 | 2.51 | 2.89 | (.43 | ) | (.28 | ) | (.71 | ) | 17.43 | 19.09 | 257 | .94 | 2.28 | |||||||||||||||||||||||||||||||||
12/31/12 | 13.37 | .40 | 1.81 | 2.21 | (.33 | ) | – | (.33 | ) | 15.25 | 16.50 | 225 | .99 | 2.77 | ||||||||||||||||||||||||||||||||||
Class 4: | ||||||||||||||||||||||||||||||||||||||||||||||||
6/30/172,3 | 14.38 | .28 | 1.92 | 2.20 | (.02 | ) | – | (.02 | ) | 16.56 | 15.29 | 4 | 47 | 1.16 | 5 | 3.57 | 5 | |||||||||||||||||||||||||||||||
12/31/16 | 14.63 | .36 | (.19 | ) | .17 | (.36 | ) | (.06 | ) | (.42 | ) | 14.38 | 1.18 | 37 | 1.18 | 2.43 | ||||||||||||||||||||||||||||||||
12/31/15 | 16.19 | .33 | (1.23 | ) | (.90 | ) | (.32 | ) | (.34 | ) | (.66 | ) | 14.63 | (5.82 | ) | 32 | 1.18 | 2.02 | ||||||||||||||||||||||||||||||
12/31/14 | 17.45 | .26 | 6 | (.85 | ) | (.59 | ) | (.50 | ) | (.17 | ) | (.67 | ) | 16.19 | (3.39 | ) | 20 | 1.18 | 1.52 | 6 | ||||||||||||||||||||||||||||
12/31/13 | 15.29 | .03 | 2.87 | 2.90 | (.46 | ) | (.28 | ) | (.74 | ) | 17.45 | 19.16 | 1 | 1.19 | .18 | |||||||||||||||||||||||||||||||||
12/31/122,8 | 15.56 | .01 | .09 | .10 | (.37 | ) | – | (.37 | ) | 15.29 | .62 | 4,9 | – | 10 | .04 | 4,9 | .07 | 4,9 | ||||||||||||||||||||||||||||||
| 190 | American Funds Insurance Series |
| Income (loss) from investment operations1 | Dividends and distributions | |||||||||||||||||||||||||||||||||||||||||||||||
| Period ended | Net asset value, beginning of period | Net investment income (loss) | Net gains (losses) on securities (both realized and unrealized) | Total from investment operations | Dividends (from net investment income) | Distributions (from capital gains) | Total dividends and distributions | Net asset value, end of period | Total return | Net assets, end of period (in millions) | Ratio of expenses to average net assets | Ratio of net income (loss) to average net assets | ||||||||||||||||||||||||||||||||||||
Capital Income Builder |
| |||||||||||||||||||||||||||||||||||||||||||||||
Class 1: | ||||||||||||||||||||||||||||||||||||||||||||||||
6/30/172,3 | $ 9.46 | $.20 | $ .58 | $.78 | $(.15 | ) | $ – | $ (.15 | ) | $10.09 | 8.27 | %4 | $ 202 | .53 | %5 | 4.07 | %5 | |||||||||||||||||||||||||||||||
12/31/16 | 9.40 | .32 | .07 | .39 | (.33 | ) | – | (.33 | ) | 9.46 | 4.17 | 156 | .54 | 3.39 | ||||||||||||||||||||||||||||||||||
12/31/15 | 9.81 | .28 | (.40 | ) | (.12 | ) | (.29 | ) | – | (.29 | ) | 9.40 | (1.23 | ) | 80 | .56 | 2.88 | |||||||||||||||||||||||||||||||
12/31/142,11 | 10.00 | .19 | (.18 | ) | .01 | (.19 | ) | (.01 | ) | (.20 | ) | 9.81 | .12 | 4 | 20 | .56 | 5 | 2.87 | 5 | |||||||||||||||||||||||||||||
Class 1A: | ||||||||||||||||||||||||||||||||||||||||||||||||
6/30/172,3,7 | 9.57 | .21 | .45 | .66 | (.15 | ) | – | (.15 | ) | 10.08 | 6.88 | 4 | – | 10 | .33 | 4 | 2.09 | 4 | ||||||||||||||||||||||||||||||
Class 2: | ||||||||||||||||||||||||||||||||||||||||||||||||
6/30/172,3 | 9.46 | .20 | .57 | .77 | (.14 | ) | – | (.14 | ) | 10.09 | 8.15 | 4 | 1 | .78 | 5 | 4.13 | 5 | |||||||||||||||||||||||||||||||
12/31/16 | 9.40 | .27 | .11 | .38 | (.32 | ) | – | (.32 | ) | 9.46 | 4.08 | – | 10 | .80 | 2.82 | |||||||||||||||||||||||||||||||||
12/31/15 | 9.81 | .31 | (.43 | ) | (.12 | ) | (.29 | ) | – | (.29 | ) | 9.40 | (1.23 | )9 | – | 10 | .46 | 9 | 3.12 | 9 | ||||||||||||||||||||||||||||
12/31/142,11 | 10.00 | .20 | (.19 | ) | .01 | (.19 | ) | (.01 | ) | (.20 | ) | 9.81 | .12 | 4,9 | – | 10 | .47 | 5,9 | 2.94 | 5,9 | ||||||||||||||||||||||||||||
Class 4: | ||||||||||||||||||||||||||||||||||||||||||||||||
6/30/172,3 | 9.45 | .17 | .58 | .75 | (.13 | ) | – | (.13 | ) | 10.07 | 7.92 | 4 | 299 | 1.03 | 5 | 3.53 | 5 | |||||||||||||||||||||||||||||||
12/31/16 | 9.38 | .27 | .08 | .35 | (.28 | ) | – | (.28 | ) | 9.45 | 3.78 | 256 | 1.04 | 2.88 | ||||||||||||||||||||||||||||||||||
12/31/15 | 9.80 | .25 | (.42 | ) | (.17 | ) | (.25 | ) | – | (.25 | ) | 9.38 | (1.79 | ) | 157 | 1.05 | 2.55 | |||||||||||||||||||||||||||||||
12/31/142,11 | 10.00 | .14 | (.16 | ) | (.02 | ) | (.17 | ) | (.01 | ) | (.18 | ) | 9.80 | (.21 | )4 | 55 | 1.06 | 5 | 2.08 | 5 | ||||||||||||||||||||||||||||
Asset Allocation Fund |
| |||||||||||||||||||||||||||||||||||||||||||||||
Class 1: | ||||||||||||||||||||||||||||||||||||||||||||||||
6/30/172,3 | $21.68 | $.22 | $1.58 | $1.80 | $(.07 | ) | $(1.06 | ) | $(1.13 | ) | $22.35 | 8.28 | %4 | $15,067 | .29 | %5 | 1.99 | %5 | ||||||||||||||||||||||||||||||
12/31/16 | 20.62 | .42 | 1.54 | 1.96 | (.39 | ) | (.51 | ) | (.90 | ) | 21.68 | 9.69 | 13,008 | .29 | 1.97 | |||||||||||||||||||||||||||||||||
12/31/15 | 22.23 | .40 | (.02 | ) | .38 | (.40 | ) | (1.59 | ) | (1.99 | ) | 20.62 | 1.64 | 10,913 | .29 | 1.85 | ||||||||||||||||||||||||||||||||
12/31/14 | 22.49 | .44 | .81 | 1.25 | (.39 | ) | (1.12 | ) | (1.51 | ) | 22.23 | 5.66 | 11,997 | .30 | 1.95 | |||||||||||||||||||||||||||||||||
12/31/13 | 18.43 | .35 | 4.07 | 4.42 | (.36 | ) | – | (.36 | ) | 22.49 | 24.04 | 10,515 | .31 | 1.71 | ||||||||||||||||||||||||||||||||||
12/31/12 | 16.17 | .37 | 2.28 | 2.65 | (.39 | ) | – | (.39 | ) | 18.43 | 16.44 | 7,199 | .31 | 2.11 | ||||||||||||||||||||||||||||||||||
Class 1A: | ||||||||||||||||||||||||||||||||||||||||||||||||
6/30/172,3,7 | 21.97 | .26 | 1.24 | 1.50 | (.07 | ) | (1.06 | ) | (1.13 | ) | 22.34 | 6.81 | 4 | 2 | .25 | 4 | 1.14 | 4 | ||||||||||||||||||||||||||||||
Class 2: | ||||||||||||||||||||||||||||||||||||||||||||||||
6/30/172,3 | 21.49 | .19 | 1.57 | 1.76 | (.06 | ) | (1.06 | ) | (1.12 | ) | 22.13 | 8.17 | 4 | 5,350 | .54 | 5 | 1.73 | 5 | ||||||||||||||||||||||||||||||
12/31/16 | 20.45 | .36 | 1.53 | 1.89 | (.34 | ) | (.51 | ) | (.85 | ) | 21.49 | 9.41 | 5,144 | .54 | 1.72 | |||||||||||||||||||||||||||||||||
12/31/15 | 22.06 | .34 | (.01 | ) | .33 | (.35 | ) | (1.59 | ) | (1.94 | ) | 20.45 | 1.40 | 5,008 | .54 | 1.60 | ||||||||||||||||||||||||||||||||
12/31/14 | 22.33 | .37 | .81 | 1.18 | (.33 | ) | (1.12 | ) | (1.45 | ) | 22.06 | 5.40 | 5,494 | .55 | 1.69 | |||||||||||||||||||||||||||||||||
12/31/13 | 18.31 | .30 | 4.03 | 4.33 | (.31 | ) | – | (.31 | ) | 22.33 | 23.69 | 5,760 | .56 | 1.47 | ||||||||||||||||||||||||||||||||||
12/31/12 | 16.06 | .33 | 2.27 | 2.60 | (.35 | ) | – | (.35 | ) | 18.31 | 16.19 | 5,225 | .56 | 1.86 | ||||||||||||||||||||||||||||||||||
Class 3: | ||||||||||||||||||||||||||||||||||||||||||||||||
6/30/172,3 | 21.70 | .20 | 1.59 | 1.79 | (.07 | ) | (1.06 | ) | (1.13 | ) | 22.36 | 8.20 | 4 | 37 | .47 | 5 | 1.80 | 5 | ||||||||||||||||||||||||||||||
12/31/16 | 20.64 | .38 | 1.54 | 1.92 | (.35 | ) | (.51 | ) | (.86 | ) | 21.70 | 9.49 | 35 | .47 | 1.79 | |||||||||||||||||||||||||||||||||
12/31/15 | 22.25 | .36 | (.02 | ) | .34 | (.36 | ) | (1.59 | ) | (1.95 | ) | 20.64 | 1.46 | 36 | .47 | 1.67 | ||||||||||||||||||||||||||||||||
12/31/14 | 22.51 | .39 | .81 | 1.20 | (.34 | ) | (1.12 | ) | (1.46 | ) | 22.25 | 5.47 | 40 | .48 | 1.76 | |||||||||||||||||||||||||||||||||
12/31/13 | 18.45 | .32 | 4.06 | 4.38 | (.32 | ) | – | (.32 | ) | 22.51 | 23.81 | 42 | .49 | 1.54 | ||||||||||||||||||||||||||||||||||
12/31/12 | 16.18 | .34 | 2.29 | 2.63 | (.36 | ) | – | (.36 | ) | 18.45 | 16.28 | 38 | .49 | 1.93 | ||||||||||||||||||||||||||||||||||
Class 4: | ||||||||||||||||||||||||||||||||||||||||||||||||
6/30/172,3 | 21.43 | .17 | 1.56 | 1.73 | (.06 | ) | (1.06 | ) | (1.12 | ) | 22.04 | 8.02 | 4 | 3,183 | .79 | 5 | 1.49 | 5 | ||||||||||||||||||||||||||||||
12/31/16 | 20.40 | .31 | 1.53 | 1.84 | (.30 | ) | (.51 | ) | (.81 | ) | 21.43 | 9.16 | 2,861 | .79 | 1.47 | |||||||||||||||||||||||||||||||||
12/31/15 | 22.11 | .30 | (.02 | ) | .28 | (.40 | ) | (1.59 | ) | (1.99 | ) | 20.40 | 1.14 | 2,414 | .79 | 1.45 | ||||||||||||||||||||||||||||||||
12/31/14 | 22.46 | .34 | .79 | 1.13 | (.36 | ) | (1.12 | ) | (1.48 | ) | 22.11 | 5.16 | 32 | .80 | 1.55 | |||||||||||||||||||||||||||||||||
12/31/13 | 18.43 | .27 | 4.12 | 4.39 | (.36 | ) | – | (.36 | ) | 22.46 | 23.89 | 1 | .79 | 1.22 | ||||||||||||||||||||||||||||||||||
12/31/122,8 | 18.52 | .01 | .21 | .22 | (.31 | ) | – | (.31 | ) | 18.43 | 1.17 | 4,9 | – | 10 | .01 | 4,9 | .08 | 4,9 | ||||||||||||||||||||||||||||||
See end of tables for footnotes.
| American Funds Insurance Series | 191 |
Financial highlights (continued)
| Income (loss) from investment operations1 | Dividends and distributions | |||||||||||||||||||||||||||||||||||||||||||||||
| Period ended | Net asset value, beginning of period | Net investment income (loss) | Net gains (losses) on securities (both realized and unrealized) | Total from investment | Dividends (from net investment | Distributions (from | Total and distributions | Net asset value, end of period | Total return | Net assets, end of period | Ratio of expenses to average | Ratio of to average net assets | ||||||||||||||||||||||||||||||||||||
Global Balanced Fund |
| |||||||||||||||||||||||||||||||||||||||||||||||
Class 1: | ||||||||||||||||||||||||||||||||||||||||||||||||
6/30/172,3 | $11.08 | $.12 | $1.12 | $1.24 | $ – | $(.04 | ) | $(.04 | ) | $12.28 | 11.19 | %4 | $ 76 | .69 | %5 | 2.09 | %5 | |||||||||||||||||||||||||||||||
12/31/16 | 10.74 | .19 | .32 | .51 | (.17 | ) | – | (.17 | ) | 11.08 | 4.73 | 64 | .72 | 1.73 | ||||||||||||||||||||||||||||||||||
12/31/15 | 11.11 | .20 | (.28 | ) | (.08 | ) | (.14 | ) | (.15 | ) | (.29 | ) | 10.74 | (.69 | ) | 47 | .72 | 1.80 | ||||||||||||||||||||||||||||||
12/31/14 | 11.37 | .25 | 6 | (.03 | ) | .22 | (.18 | ) | (.30 | ) | (.48 | ) | 11.11 | 1.87 | 37 | .71 | 2.14 | 6 | ||||||||||||||||||||||||||||||
12/31/13 | 10.34 | .22 | 1.07 | 1.29 | (.18 | ) | (.08 | ) | (.26 | ) | 11.37 | 12.56 | 36 | .70 | 2.05 | |||||||||||||||||||||||||||||||||
12/31/12 | 9.35 | .20 | .98 | 1.18 | (.19 | ) | – | (.19 | ) | 10.34 | 12.58 | 32 | .72 | 2.00 | ||||||||||||||||||||||||||||||||||
Class 1A: |
| |||||||||||||||||||||||||||||||||||||||||||||||
6/30/172,3,7 | 11.18 | .12 | 1.02 | 1.14 | – | (.04 | ) | (.04 | ) | 12.28 | 10.20 | 4,9 | – | 10 | .33 | 4,9 | 1.03 | 4,9 | ||||||||||||||||||||||||||||||
Class 2: | ||||||||||||||||||||||||||||||||||||||||||||||||
6/30/172,3 | 11.06 | .11 | 1.12 | 1.23 | – | (.04 | ) | (.04 | ) | 12.25 | 11.12 | 4 | 193 | .94 | 5 | 1.83 | 5 | |||||||||||||||||||||||||||||||
12/31/16 | 10.72 | .16 | .32 | .48 | (.14 | ) | – | (.14 | ) | 11.06 | 4.48 | 178 | .97 | 1.48 | ||||||||||||||||||||||||||||||||||
12/31/15 | 11.09 | .18 | (.28 | ) | (.10 | ) | (.12 | ) | (.15 | ) | (.27 | ) | 10.72 | (.95 | ) | 171 | .97 | 1.60 | ||||||||||||||||||||||||||||||
12/31/14 | 11.35 | .22 | 6 | (.03 | ) | .19 | (.15 | ) | (.30 | ) | (.45 | ) | 11.09 | 1.63 | 179 | .96 | 1.88 | 6 | ||||||||||||||||||||||||||||||
12/31/13 | 10.33 | .20 | 1.06 | 1.26 | (.16 | ) | (.08 | ) | (.24 | ) | 11.35 | 12.23 | 156 | .95 | 1.79 | |||||||||||||||||||||||||||||||||
12/31/12 | 9.35 | .17 | .97 | 1.14 | (.16 | ) | – | (.16 | ) | 10.33 | 12.24 | 119 | .97 | 1.76 | ||||||||||||||||||||||||||||||||||
Class 4: |
| |||||||||||||||||||||||||||||||||||||||||||||||
6/30/172,3 | 11.00 | .10 | 1.11 | 1.21 | – | (.04 | ) | (.04 | ) | 12.17 | 11.00 | 4 | 21 | 1.19 | 5 | 1.67 | 5 | |||||||||||||||||||||||||||||||
12/31/16 | 10.69 | .12 | .33 | .45 | (.14 | ) | – | (.14 | ) | 11.00 | 4.21 | 10 | 1.24 | 1.12 | ||||||||||||||||||||||||||||||||||
12/31/15 | 11.09 | .06 | (.17 | ) | (.11 | ) | (.14 | ) | (.15 | ) | (.29 | ) | 10.69 | (1.00 | ) | 1 | 1.34 | .58 | ||||||||||||||||||||||||||||||
12/31/14 | 11.35 | .24 | 6 | (.02 | ) | .22 | (.18 | ) | (.30 | ) | (.48 | ) | 11.09 | 1.88 | 9 | – | 10 | .67 | 9 | 2.07 | 6,9 | |||||||||||||||||||||||||||
12/31/13 | 10.33 | .22 | 1.06 | 1.28 | (.18 | ) | (.08 | ) | (.26 | ) | 11.35 | 12.49 | 9 | – | 10 | .71 | 9 | 1.98 | 9 | |||||||||||||||||||||||||||||
12/31/122,8 | 10.47 | .01 | .03 | .04 | (.18 | ) | – | (.18 | ) | 10.33 | .40 | 4,9 | – | 10 | .03 | 4,9 | .05 | 4,9 | ||||||||||||||||||||||||||||||
Bond Fund |
| |||||||||||||||||||||||||||||||||||||||||||||||
Class 1: |
| |||||||||||||||||||||||||||||||||||||||||||||||
6/30/172,3 | $10.80 | $.12 | $.16 | $.28 | $(.06 | ) | $(.16 | ) | $(.22 | ) | $10.86 | 2.62 | %4 | $6,409 | .38 | %5 | 2.15 | %5 | ||||||||||||||||||||||||||||||
12/31/16 | 10.70 | .21 | .14 | .35 | (.21 | ) | (.04 | ) | (.25 | ) | 10.80 | 3.27 | 6,829 | .38 | 1.91 | |||||||||||||||||||||||||||||||||
12/31/15 | 11.08 | .22 | (.17 | ) | .05 | (.21 | ) | (.22 | ) | (.43 | ) | 10.70 | .45 | 5,731 | .38 | 1.95 | ||||||||||||||||||||||||||||||||
12/31/14 | 10.73 | .23 | .37 | .60 | (.25 | ) | – | 12 | (.25 | ) | 11.08 | 5.59 | 4,977 | .39 | 2.03 | |||||||||||||||||||||||||||||||||
12/31/13 | 11.29 | .22 | (.43 | ) | (.21 | ) | (.23 | ) | (.12 | ) | (.35 | ) | 10.73 | (1.89 | ) | 4,506 | .39 | 2.01 | ||||||||||||||||||||||||||||||
12/31/12 | 10.99 | .25 | .36 | .61 | (.31 | ) | – | (.31 | ) | 11.29 | 5.58 | 3,917 | .39 | 2.23 | ||||||||||||||||||||||||||||||||||
Class 1A: |
| |||||||||||||||||||||||||||||||||||||||||||||||
6/30/172,3,7 | 10.82 | .10 | .15 | .25 | (.06 | ) | (.16 | ) | (.22 | ) | 10.85 | 2.34 | 4 | – | .29 | 4 | .96 | 4 | ||||||||||||||||||||||||||||||
Class 2: | ||||||||||||||||||||||||||||||||||||||||||||||||
6/30/172,3 | 10.67 | .10 | .17 | .27 | (.06 | ) | (.16 | ) | (.22 | ) | 10.72 | 2.51 | 4 | 3,972 | .63 | 5 | 1.90 | 5 | ||||||||||||||||||||||||||||||
12/31/16 | 10.58 | .18 | .13 | .31 | (.18 | ) | (.04 | ) | (.22 | ) | 10.67 | 2.95 | 3,959 | .63 | 1.65 | |||||||||||||||||||||||||||||||||
12/31/15 | 10.95 | .18 | (.15 | ) | .03 | (.18 | ) | (.22 | ) | (.40 | ) | 10.58 | .28 | 4,135 | .63 | 1.69 | ||||||||||||||||||||||||||||||||
12/31/14 | 10.61 | .20 | .36 | .56 | (.22 | ) | – | 12 | (.22 | ) | 10.95 | 5.28 | 4,565 | .64 | 1.79 | |||||||||||||||||||||||||||||||||
12/31/13 | 11.17 | .19 | (.43 | ) | (.24 | ) | (.20 | ) | (.12 | ) | (.32 | ) | 10.61 | (2.16 | ) | 4,763 | .64 | 1.76 | ||||||||||||||||||||||||||||||
12/31/12 | 10.87 | .22 | .36 | .58 | (.28 | ) | – | (.28 | ) | 11.17 | 5.37 | 5,044 | .64 | 1.97 | ||||||||||||||||||||||||||||||||||
Class 4: | ||||||||||||||||||||||||||||||||||||||||||||||||
6/30/172,3 | 10.70 | .09 | .16 | .25 | (.06 | ) | (.16 | ) | (.22 | ) | 10.73 | 2.29 | 4 | 122 | .88 | 5 | 1.65 | 5 | ||||||||||||||||||||||||||||||
12/31/16 | 10.61 | .15 | .15 | .30 | (.17 | ) | (.04 | ) | (.21 | ) | 10.70 | 2.80 | 102 | .88 | 1.41 | |||||||||||||||||||||||||||||||||
12/31/15 | 11.01 | .16 | (.16 | ) | – | (.18 | ) | (.22 | ) | (.40 | ) | 10.61 | (.08 | ) | 59 | .88 | 1.47 | |||||||||||||||||||||||||||||||
12/31/14 | 10.69 | .16 | .39 | .55 | (.23 | ) | – | 12 | (.23 | ) | 11.01 | 5.15 | 29 | .89 | 1.43 | |||||||||||||||||||||||||||||||||
12/31/13 | 11.29 | .17 | (.43 | ) | (.26 | ) | (.22 | ) | (.12 | ) | (.34 | ) | 10.69 | (2.34 | ) | 3 | .89 | 1.58 | ||||||||||||||||||||||||||||||
12/31/122,8 | 11.55 | .01 | (.02 | ) | (.01 | ) | (.25 | ) | – | (.25 | ) | 11.29 | (.04 | )4,9 | – | 10 | .02 | 4,9 | .10 | 4,9 | ||||||||||||||||||||||||||||
| 192 | American Funds Insurance Series |
| Income (loss) from investment operations1 | Dividends and distributions | |||||||||||||||||||||||||||||||||||||||||||||||
| Period ended | Net asset value, beginning of period | Net investment income (loss) | Net gains (losses) on securities (both realized and unrealized) | Total from investment operations | Dividends (from net investment income) | Distributions (from capital gains) | Total dividends and distributions | Net asset value, end of period | Total return | Net assets, end of period (in millions) | Ratio of expenses to average net assets | Ratio of net income (loss) to average net assets | ||||||||||||||||||||||||||||||||||||
Global Bond Fund |
| |||||||||||||||||||||||||||||||||||||||||||||||
Class 1: | ||||||||||||||||||||||||||||||||||||||||||||||||
6/30/172,3 | $11.22 | $.14 | $ .43 | $ .57 | $ – | $(.07 | ) | $(.07 | ) | $11.72 | 5.09 | %4 | $1,222 | .57 | %5 | 2.38 | %5 | |||||||||||||||||||||||||||||||
12/31/16 | 11.01 | .26 | .06 | .32 | (.09 | ) | (.02 | ) | (.11 | ) | 11.22 | 2.92 | 1,115 | .57 | 2.26 | |||||||||||||||||||||||||||||||||
12/31/15 | 11.77 | .27 | (.71 | ) | (.44 | ) | (.01 | ) | (.31 | ) | (.32 | ) | 11.01 | (3.75 | ) | 1,032 | .57 | 2.34 | ||||||||||||||||||||||||||||||
12/31/14 | 11.88 | .29 | (.08 | ) | .21 | (.21 | ) | (.11 | ) | (.32 | ) | 11.77 | 1.71 | 1,194 | .57 | 2.35 | ||||||||||||||||||||||||||||||||
12/31/13 | 12.32 | .28 | (.58 | ) | (.30 | ) | – | (.14 | ) | (.14 | ) | 11.88 | (2.40 | ) | 1,093 | .56 | 2.37 | |||||||||||||||||||||||||||||||
12/31/12 | 11.96 | .28 | .48 | .76 | (.29 | ) | (.11 | ) | (.40 | ) | 12.32 | 6.43 | 959 | .56 | 2.29 | |||||||||||||||||||||||||||||||||
Class 1A: | ||||||||||||||||||||||||||||||||||||||||||||||||
6/30/172,3,7 | 11.22 | .13 | .44 | .57 | – | (.07 | ) | (.07 | ) | 11.72 | 5.09 | 4,9 | – | 10 | .28 | 4,9 | 1.15 | 4,9 | ||||||||||||||||||||||||||||||
Class 2: | ||||||||||||||||||||||||||||||||||||||||||||||||
6/30/172,3 | 11.14 | .12 | .43 | .55 | – | (.07 | ) | (.07 | ) | 11.62 | 4.94 | 4 | 1,160 | .82 | 5 | 2.12 | 5 | |||||||||||||||||||||||||||||||
12/31/16 | 10.93 | .23 | .07 | .30 | (.07 | ) | (.02 | ) | (.09 | ) | 11.14 | 2.71 | 1,121 | .82 | 2.01 | |||||||||||||||||||||||||||||||||
12/31/15 | 11.72 | .24 | (.71 | ) | (.47 | ) | (.01 | ) | (.31 | ) | (.32 | ) | 10.93 | (4.07 | ) | 1,208 | .82 | 2.09 | ||||||||||||||||||||||||||||||
12/31/14 | 11.81 | .26 | (.09 | ) | .17 | (.15 | ) | (.11 | ) | (.26 | ) | 11.72 | 1.39 | 1,386 | .82 | 2.11 | ||||||||||||||||||||||||||||||||
12/31/13 | 12.27 | .25 | (.57 | ) | (.32 | ) | – | (.14 | ) | (.14 | ) | 11.81 | (2.58 | ) | 1,496 | .81 | 2.11 | |||||||||||||||||||||||||||||||
12/31/12 | 11.91 | .25 | .48 | .73 | (.26 | ) | (.11 | ) | (.37 | ) | 12.27 | 6.19 | 1,664 | .81 | 2.06 | |||||||||||||||||||||||||||||||||
Class 4: | ||||||||||||||||||||||||||||||||||||||||||||||||
6/30/172,3 | 11.08 | .11 | .43 | .54 | – | (.07 | ) | (.07 | ) | 11.55 | 4.88 | 4 | 15 | 1.07 | 5 | 1.88 | 5 | |||||||||||||||||||||||||||||||
12/31/16 | 10.89 | .20 | .06 | .26 | (.05 | ) | (.02 | ) | (.07 | ) | 11.08 | 2.42 | 12 | 1.07 | 1.76 | |||||||||||||||||||||||||||||||||
12/31/15 | 11.70 | .21 | (.71 | ) | (.50 | ) | – | 12 | (.31 | ) | (.31 | ) | 10.89 | (4.27 | ) | 6 | 1.07 | 1.86 | ||||||||||||||||||||||||||||||
12/31/14 | 11.87 | .20 | (.05 | ) | .15 | (.21 | ) | (.11 | ) | (.32 | ) | 11.70 | 1.16 | 4 | 1.09 | 1.66 | ||||||||||||||||||||||||||||||||
12/31/13 | 12.31 | .27 | (.57 | ) | (.30 | ) | – | (.14 | ) | (.14 | ) | 11.87 | (2.41 | ) | – | 10 | .79 | 2.25 | ||||||||||||||||||||||||||||||
12/31/122,8 | 12.53 | .01 | (.04 | ) | (.03 | ) | (.19 | ) | – | (.19 | ) | 12.31 | (.28 | )4,9 | – | 10 | .02 | 4,9 | .11 | 4,9 | ||||||||||||||||||||||||||||
See end of tables for footnotes.
| American Funds Insurance Series | 193 |
Financial highlights (continued)
| Income (loss) from investment operations1 | Dividends and distributions | |||||||||||||||||||||||||||||||||||||||||||||||
| Period ended | Net asset value, beginning of period | Net investment income (loss) | Net gains (losses) on securities (both realized and unrealized) | Total from investment operations | Dividends (from net investment income) | Distributions (from capital gains) | Total dividends and distributions | Net asset value, end of period | Total return | Net assets, end of period (in millions) | Ratio of expenses to average net assets | Ratio of net income (loss) to average net assets | ||||||||||||||||||||||||||||||||||||
High-Income Bond Fund |
| |||||||||||||||||||||||||||||||||||||||||||||||
Class 1: | ||||||||||||||||||||||||||||||||||||||||||||||||
6/30/172,3 | $10.18 | $.31 | $ .16 | $ .47 | $(.13 | ) | $ – | $(.13 | ) | $10.52 | 4.60 | %4 | $ 741 | .48 | %5 | 6.00 | %5 | |||||||||||||||||||||||||||||||
12/31/16 | 9.19 | .61 | 1.02 | 1.63 | (.64 | ) | – | (.64 | ) | 10.18 | 17.83 | 949 | .49 | 6.18 | ||||||||||||||||||||||||||||||||||
12/31/15 | 10.54 | .64 | (1.36 | ) | (.72 | ) | (.63 | ) | – | (.63 | ) | 9.19 | (6.94 | ) | 1,017 | .48 | 6.12 | |||||||||||||||||||||||||||||||
12/31/14 | 11.13 | .67 | (.59 | ) | .08 | (.67 | ) | – | (.67 | ) | 10.54 | .80 | 1,017 | .48 | 5.90 | |||||||||||||||||||||||||||||||||
12/31/13 | 11.16 | .75 | .01 | .76 | (.79 | ) | – | (.79 | ) | 11.13 | 6.89 | 856 | .48 | 6.54 | ||||||||||||||||||||||||||||||||||
12/31/12 | 10.54 | .81 | .64 | 1.45 | (.83 | ) | – | (.83 | ) | 11.16 | 13.90 | 894 | .48 | 7.25 | ||||||||||||||||||||||||||||||||||
Class 1A: | ||||||||||||||||||||||||||||||||||||||||||||||||
6/30/172,3,7 | 10.28 | .29 | .08 | .37 | (.13 | ) | – | (.13 | ) | 10.52 | 3.59 | 4 | – | 10 | .34 | 4 | 2.78 | 4 | ||||||||||||||||||||||||||||||
Class 2: | ||||||||||||||||||||||||||||||||||||||||||||||||
6/30/172,3 | 10.04 | .29 | .16 | .45 | (.13 | ) | – | (.13 | ) | 10.36 | 4.43 | 4 | 798 | .73 | 5 | 5.75 | 5 | |||||||||||||||||||||||||||||||
12/31/16 | 9.06 | .58 | 1.01 | 1.59 | (.61 | ) | – | (.61 | ) | 10.04 | 17.69 | 799 | .74 | 5.92 | ||||||||||||||||||||||||||||||||||
12/31/15 | 10.41 | .60 | (1.35 | ) | (.75 | ) | (.60 | ) | – | (.60 | ) | 9.06 | (7.30 | ) | 765 | .73 | 5.85 | |||||||||||||||||||||||||||||||
12/31/14 | 10.99 | .63 | (.57 | ) | .06 | (.64 | ) | – | (.64 | ) | 10.41 | .63 | 929 | .73 | 5.67 | |||||||||||||||||||||||||||||||||
12/31/13 | 11.03 | .71 | .01 | .72 | (.76 | ) | – | (.76 | ) | 10.99 | 6.60 | 1,061 | .73 | 6.29 | ||||||||||||||||||||||||||||||||||
12/31/12 | 10.42 | .78 | .63 | 1.41 | (.80 | ) | – | (.80 | ) | 11.03 | 13.70 | 1,135 | .73 | 7.00 | ||||||||||||||||||||||||||||||||||
Class 3: | ||||||||||||||||||||||||||||||||||||||||||||||||
6/30/172,3 | 10.22 | .30 | .16 | .46 | (.13 | ) | – | (.13 | ) | 10.55 | 4.46 | 4 | 13 | .66 | 5 | 5.82 | 5 | |||||||||||||||||||||||||||||||
12/31/16 | 9.22 | .59 | 1.03 | 1.62 | (.62 | ) | – | (.62 | ) | 10.22 | 17.68 | 13 | .67 | 5.99 | ||||||||||||||||||||||||||||||||||
12/31/15 | 10.57 | .62 | (1.37 | ) | (.75 | ) | (.60 | ) | – | (.60 | ) | 9.22 | (7.13 | ) | 12 | .66 | 5.91 | |||||||||||||||||||||||||||||||
12/31/14 | 11.16 | .65 | (.59 | ) | .06 | (.65 | ) | – | (.65 | ) | 10.57 | .59 | 16 | .66 | 5.74 | |||||||||||||||||||||||||||||||||
12/31/13 | 11.18 | .73 | .02 | .75 | (.77 | ) | – | (.77 | ) | 11.16 | 6.77 | 19 | .66 | 6.36 | ||||||||||||||||||||||||||||||||||
12/31/12 | 10.56 | .80 | .63 | 1.43 | (.81 | ) | – | (.81 | ) | 11.18 | 13.67 | 21 | .66 | 7.07 | ||||||||||||||||||||||||||||||||||
Class 4: | ||||||||||||||||||||||||||||||||||||||||||||||||
6/30/172,3 | 10.79 | .30 | .16 | .46 | (.12 | ) | – | (.12 | ) | 11.13 | 4.29 | 4 | 22 | .98 | 5 | 5.48 | 5 | |||||||||||||||||||||||||||||||
12/31/16 | 9.73 | .60 | 1.07 | 1.67 | (.61 | ) | – | (.61 | ) | 10.79 | 17.29 | 21 | .99 | 5.55 | ||||||||||||||||||||||||||||||||||
12/31/15 | 11.05 | .62 | (1.43 | ) | (.81 | ) | (.51 | ) | – | (.51 | ) | 9.73 | (7.42 | ) | 1 | .98 | 5.51 | |||||||||||||||||||||||||||||||
12/31/14 | 11.12 | .63 | (.59 | ) | .04 | (.11 | ) | – | (.11 | ) | 11.05 | .35 | – | 10 | .98 | 5.49 | ||||||||||||||||||||||||||||||||
12/31/13 | 11.16 | .67 | .08 | .75 | (.79 | ) | – | (.79 | ) | 11.12 | 6.81 | – | 10 | .93 | 5.82 | |||||||||||||||||||||||||||||||||
12/31/122,8 | 11.80 | .04 | – | 12 | .04 | (.68 | ) | – | (.68 | ) | 11.16 | .34 | 4,9 | – | 10 | .02 | 4,9 | .35 | 4,9 | |||||||||||||||||||||||||||||
Mortgage Fund |
| |||||||||||||||||||||||||||||||||||||||||||||||
Class 1: | ||||||||||||||||||||||||||||||||||||||||||||||||
6/30/172,3 | $10.56 | $.08 | $ .08 | $ .16 | $(.03 | ) | $(.07 | ) | $(.10 | ) | $10.62 | 1.51 | %4 | $ 273 | .44 | %5 | 1.48 | %5 | ||||||||||||||||||||||||||||||
12/31/16 | 10.61 | .15 | .11 | .26 | (.20 | ) | (.11 | ) | (.31 | ) | 10.56 | 2.50 | 269 | .46 | 1.39 | |||||||||||||||||||||||||||||||||
12/31/15 | 10.70 | .10 | .13 | .23 | (.18 | ) | (.14 | ) | (.32 | ) | 10.61 | 2.09 | 272 | .45 | .89 | |||||||||||||||||||||||||||||||||
12/31/14 | 10.23 | .12 | .45 | .57 | (.10 | ) | – | (.10 | ) | 10.70 | 5.54 | 292 | .45 | 1.12 | ||||||||||||||||||||||||||||||||||
12/31/13 | 10.47 | .04 | (.18 | ) | (.14 | ) | (.08 | ) | (.02 | ) | (.10 | ) | 10.23 | (1.41 | ) | 198 | .44 | .35 | ||||||||||||||||||||||||||||||
12/31/12 | 10.37 | .01 | .25 | .26 | (.06 | ) | (.10 | ) | (.16 | ) | 10.47 | 2.57 | 87 | .45 | .08 | |||||||||||||||||||||||||||||||||
Class 1A: | ||||||||||||||||||||||||||||||||||||||||||||||||
6/30/172,3,7 | 10.55 | .07 | .09 | .16 | (.03 | ) | (.07 | ) | (.10 | ) | 10.61 | 1.52 | 4 | – | 10 | .32 | 4 | .68 | 4 | |||||||||||||||||||||||||||||
Class 2: | ||||||||||||||||||||||||||||||||||||||||||||||||
6/30/172,3 | 10.54 | .06 | .09 | .15 | (.03 | ) | (.07 | ) | (.10 | ) | 10.59 | 1.37 | 4 | 62 | .69 | 5 | 1.23 | 5 | ||||||||||||||||||||||||||||||
12/31/16 | 10.59 | .12 | .12 | .24 | (.18 | ) | (.11 | ) | (.29 | ) | 10.54 | 2.25 | 63 | .71 | 1.14 | |||||||||||||||||||||||||||||||||
12/31/15 | 10.68 | .07 | .13 | .20 | (.15 | ) | (.14 | ) | (.29 | ) | 10.59 | 1.86 | 59 | .70 | .65 | |||||||||||||||||||||||||||||||||
12/31/14 | 10.22 | .10 | .44 | .54 | (.08 | ) | – | (.08 | ) | 10.68 | 5.23 | 52 | .70 | .91 | ||||||||||||||||||||||||||||||||||
12/31/13 | 10.46 | – | 12 | (.17 | ) | (.17 | ) | (.05 | ) | (.02 | ) | (.07 | ) | 10.22 | (1.68 | ) | 49 | .69 | (.02 | ) | ||||||||||||||||||||||||||||
12/31/12 | 10.36 | (.02 | ) | .26 | .24 | (.04 | ) | (.10 | ) | (.14 | ) | 10.46 | 2.38 | 49 | .70 | (.16 | ) | |||||||||||||||||||||||||||||||
Class 4: | ||||||||||||||||||||||||||||||||||||||||||||||||
6/30/172,3 | 10.48 | .05 | .08 | .13 | (.02 | ) | (.07 | ) | (.09 | ) | 10.52 | 1.25 | 4 | 10 | .94 | 5 | .98 | 5 | ||||||||||||||||||||||||||||||
12/31/16 | 10.52 | .09 | .12 | .21 | (.14 | ) | (.11 | ) | (.25 | ) | 10.48 | 2.01 | 8 | .96 | .86 | |||||||||||||||||||||||||||||||||
12/31/15 | 10.65 | .04 | .14 | .18 | (.17 | ) | (.14 | ) | (.31 | ) | 10.52 | 1.62 | 11 | .97 | .37 | |||||||||||||||||||||||||||||||||
12/31/14 | 10.23 | .05 | .46 | .51 | (.09 | ) | – | (.09 | ) | 10.65 | 4.98 | 1 | .94 | .47 | ||||||||||||||||||||||||||||||||||
12/31/13 | 10.47 | .02 | (.16 | ) | (.14 | ) | (.08 | ) | (.02 | ) | (.10 | ) | 10.23 | (1.41 | )9 | – | 10 | .38 | 9 | .23 | 9 | |||||||||||||||||||||||||||
12/31/122,8 | 10.60 | – | 12 | .01 | .01 | (.06 | ) | (.08 | ) | (.14 | ) | 10.47 | .09 | 4,9 | – | 10 | .02 | 4,9 | .04 | 4,9 | ||||||||||||||||||||||||||||
| 194 | American Funds Insurance Series |
| Income (loss) from investment operations1 | ||||||||||||||||||||||||||||||||||||
| Period ended | Net asset value, beginning of period | Net investment income (loss) | Net gains (losses) on securities (both realized and unrealized) | Total from investment operations | Net asset value, end of period | Total return | Net assets, end of period (in millions) | Ratio of expenses to average net assets | Ratio of to average | |||||||||||||||||||||||||||
Ultra-Short Bond Fund |
| |||||||||||||||||||||||||||||||||||
Class 1: | ||||||||||||||||||||||||||||||||||||
6/30/172,3 | $11.27 | $ .03 | $ – | 12 | $ .03 | $11.30 | .27 | %4 | $ 32 | .34 | %5 | .50 | %5 | |||||||||||||||||||||||
12/31/1613 | 11.26 | .01 | – | 12 | .01 | 11.27 | .09 | 37 | .35 | .11 | ||||||||||||||||||||||||||
12/31/15 | 11.28 | (.03 | ) | .01 | (.02 | ) | 11.26 | (.18 | ) | 39 | .34 | (.24 | ) | |||||||||||||||||||||||
12/31/14 | 11.31 | (.03 | ) | – | (.03 | ) | 11.28 | (.27 | ) | 49 | .34 | (.26 | ) | |||||||||||||||||||||||
12/31/13 | 11.34 | (.03 | ) | – | 12 | (.03 | ) | 11.31 | (.27 | ) | 57 | .34 | (.24 | ) | ||||||||||||||||||||||
12/31/12 | 11.36 | (.03 | ) | .01 | (.02 | ) | 11.34 | (.18 | ) | 66 | .34 | (.22 | ) | |||||||||||||||||||||||
Class 1A: | ||||||||||||||||||||||||||||||||||||
6/30/172,3,7 | 11.27 | .03 | – | 12 | .03 | 11.30 | .27 | 4,9 | – | 10 | .16 | 4,9 | .25 | 4,9 | ||||||||||||||||||||||
Class 2: | ||||||||||||||||||||||||||||||||||||
6/30/172,3 | 10.99 | .01 | – | 12 | .01 | 11.00 | .09 | 4 | 257 | .59 | 5 | .25 | 5 | |||||||||||||||||||||||
12/31/1613 | 11.01 | (.02 | ) | – | 12 | (.02 | ) | 10.99 | (.18 | ) | 297 | .60 | (.14 | ) | ||||||||||||||||||||||
12/31/15 | 11.06 | (.05 | ) | – | 12 | (.05 | ) | 11.01 | (.45 | ) | 302 | .59 | (.49 | ) | ||||||||||||||||||||||
12/31/14 | 11.12 | (.06 | ) | – | (.06 | ) | 11.06 | (.54 | ) | 331 | .59 | (.51 | ) | |||||||||||||||||||||||
12/31/13 | 11.17 | (.05 | ) | – | 12 | (.05 | ) | 11.12 | (.45 | ) | 395 | .59 | (.49 | ) | ||||||||||||||||||||||
12/31/12 | 11.22 | (.05 | ) | – | 12 | (.05 | ) | 11.17 | (.45 | ) | 459 | .59 | (.47 | ) | ||||||||||||||||||||||
Class 3: | ||||||||||||||||||||||||||||||||||||
6/30/172,3 | 11.10 | .02 | – | 12 | .02 | 11.12 | .18 | 4 | 4 | .52 | 5 | .33 | 5 | |||||||||||||||||||||||
12/31/1613 | 11.11 | (.01 | ) | – | 12 | (.01 | ) | 11.10 | (.09 | ) | 4 | .53 | (.08 | ) | ||||||||||||||||||||||
12/31/15 | 11.16 | (.05 | ) | – | 12 | (.05 | ) | 11.11 | (.45 | ) | 6 | .52 | (.42 | ) | ||||||||||||||||||||||
12/31/14 | 11.21 | (.05 | ) | – | (.05 | ) | 11.16 | (.45 | ) | 8 | .52 | (.44 | ) | |||||||||||||||||||||||
12/31/13 | 11.26 | (.05 | ) | – | 12 | (.05 | ) | 11.21 | (.44 | ) | 8 | .52 | (.42 | ) | ||||||||||||||||||||||
12/31/12 | 11.30 | (.05 | ) | .01 | (.04 | ) | 11.26 | (.35 | ) | 11 | .52 | (.40 | ) | |||||||||||||||||||||||
Class 4: | ||||||||||||||||||||||||||||||||||||
6/30/172,3 | 11.12 | – | 12 | – | – | 12 | 11.12 | (.00 | )4 | 17 | .84 | 5 | .02 | 5 | ||||||||||||||||||||||
12/31/1613 | 11.17 | (.04 | ) | (.01 | ) | (.05 | ) | 11.12 | (.45 | ) | 13 | .85 | (.40 | ) | ||||||||||||||||||||||
12/31/15 | 11.25 | (.08 | ) | – | 12 | (.08 | ) | 11.17 | (.71 | ) | 16 | .85 | (.74 | ) | ||||||||||||||||||||||
12/31/14 | 11.30 | (.09 | ) | .04 | (.05 | ) | 11.25 | (.44 | ) | 7 | .84 | (.77 | ) | |||||||||||||||||||||||
12/31/13 | 11.34 | (.04 | ) | – | 12 | (.04 | ) | 11.30 | (.35 | )9 | – | 10 | .37 | 9 | (.32 | )9 | ||||||||||||||||||||
12/31/122,8 | 11.34 | – | 12 | – | 12 | – | 12 | 11.34 | .00 | 4,9 | – | 10 | .02 | 4,9 | (.01 | )4,9 | ||||||||||||||||||||
See end of tables for footnotes.
| American Funds Insurance Series | 195 |
Financial highlights (continued)
| Income (loss) from investment operations1 | Dividends and distributions | |||||||||||||||||||||||||||||||||||||||||||||||
| Period ended | Net asset value, beginning of period | Net investment income (loss) | Net gains (losses) on securities (both realized and unrealized) | Total from investment operations | Dividends (from net investment income) | Distributions (from capital gains) | Total dividends and distributions | Net asset value, end of period | Total return | Net assets, end of period (in millions) | Ratio of expenses to average net assets | Ratio of net income (loss) to average net assets | ||||||||||||||||||||||||||||||||||||
U.S. Government/AAA-Rated Securities Fund |
| |||||||||||||||||||||||||||||||||||||||||||||||
Class 1: | ||||||||||||||||||||||||||||||||||||||||||||||||
6/30/172,3 | $12.05 | $.10 | $.13 | $.23 | $(.04 | ) | $ – | $(.04 | ) | $12.24 | 1.87 | %4 | $1,328 | .35 | %5 | 1.62 | %5 | |||||||||||||||||||||||||||||||
12/31/16 | 12.31 | .16 | .03 | .19 | (.20 | ) | (.25 | ) | (.45 | ) | 12.05 | 1.44 | 1,467 | .36 | 1.31 | |||||||||||||||||||||||||||||||||
12/31/15 | 12.40 | .13 | .09 | .22 | (.21 | ) | (.10 | ) | (.31 | ) | 12.31 | 1.93 | 1,426 | .35 | 1.02 | |||||||||||||||||||||||||||||||||
12/31/14 | 11.94 | .15 | .48 | .63 | (.17 | ) | – | (.17 | ) | 12.40 | 5.24 | 1,723 | .35 | 1.24 | ||||||||||||||||||||||||||||||||||
12/31/13 | 12.75 | .08 | (.44 | ) | (.36 | ) | (.11 | ) | (.34 | ) | (.45 | ) | 11.94 | (2.87 | ) | 1,584 | .35 | .67 | ||||||||||||||||||||||||||||||
12/31/12 | 13.00 | .10 | .18 | .28 | (.16 | ) | (.37 | ) | (.53 | ) | 12.75 | 2.22 | 1,809 | .34 | .75 | |||||||||||||||||||||||||||||||||
Class 1A: | ||||||||||||||||||||||||||||||||||||||||||||||||
6/30/172,3,7 | 12.05 | .10 | .13 | .23 | (.04 | ) | – | (.04 | ) | 12.24 | 1.87 | 4 | – | 10 | .24 | 5 | .82 | 5 | ||||||||||||||||||||||||||||||
Class 2: | ||||||||||||||||||||||||||||||||||||||||||||||||
6/30/172,3 | 11.93 | .08 | .13 | .21 | (.03 | ) | – | (.03 | ) | 12.11 | 1.76 | 4 | 1,487 | .60 | 5 | 1.37 | 5 | |||||||||||||||||||||||||||||||
12/31/16 | 12.20 | .13 | .02 | .15 | (.17 | ) | (.25 | ) | (.42 | ) | 11.93 | 1.19 | 1,503 | .61 | 1.05 | |||||||||||||||||||||||||||||||||
12/31/15 | 12.29 | .10 | .09 | .19 | (.18 | ) | (.10 | ) | (.28 | ) | 12.20 | 1.59 | 1,579 | .60 | .79 | |||||||||||||||||||||||||||||||||
12/31/14 | 11.83 | .12 | .47 | .59 | (.13 | ) | – | (.13 | ) | 12.29 | 5.01 | 1,717 | .60 | 1.00 | ||||||||||||||||||||||||||||||||||
12/31/13 | 12.63 | .05 | (.43 | ) | (.38 | ) | (.08 | ) | (.34 | ) | (.42 | ) | 11.83 | (3.08 | ) | 1,801 | .60 | .42 | ||||||||||||||||||||||||||||||
12/31/12 | 12.89 | .06 | .18 | .24 | (.13 | ) | (.37 | ) | (.50 | ) | 12.63 | 1.91 | 1,995 | .59 | .50 | |||||||||||||||||||||||||||||||||
Class 3: | ||||||||||||||||||||||||||||||||||||||||||||||||
6/30/172,3 | 12.07 | .09 | .13 | .22 | (.03 | ) | – | (.03 | ) | 12.26 | 1.83 | 4 | 11 | .53 | 5 | 1.44 | 5 | |||||||||||||||||||||||||||||||
12/31/16 | 12.34 | .14 | .02 | .16 | (.18 | ) | (.25 | ) | (.43 | ) | 12.07 | 1.24 | 11 | .54 | 1.12 | |||||||||||||||||||||||||||||||||
12/31/15 | 12.43 | .11 | .09 | .20 | (.19 | ) | (.10 | ) | (.29 | ) | 12.34 | 1.64 | 11 | .53 | .85 | |||||||||||||||||||||||||||||||||
12/31/14 | 11.96 | .13 | .48 | .61 | (.14 | ) | – | (.14 | ) | 12.43 | 5.11 | 13 | .53 | 1.08 | ||||||||||||||||||||||||||||||||||
12/31/13 | 12.76 | .06 | (.43 | ) | (.37 | ) | (.09 | ) | (.34 | ) | (.43 | ) | 11.96 | (3.00 | ) | 14 | .53 | .47 | ||||||||||||||||||||||||||||||
12/31/12 | 13.01 | .07 | .19 | .26 | (.14 | ) | (.37 | ) | (.51 | ) | 12.76 | 2.02 | 20 | .52 | .58 | |||||||||||||||||||||||||||||||||
Class 4: | ||||||||||||||||||||||||||||||||||||||||||||||||
6/30/172,3 | 11.96 | .07 | .12 | .19 | (.02 | ) | – | (.02 | ) | 12.13 | 1.62 | 4 | 57 | .85 | 5 | 1.12 | 5 | |||||||||||||||||||||||||||||||
12/31/16 | 12.22 | .10 | .03 | .13 | (.14 | ) | (.25 | ) | (.39 | ) | 11.96 | .99 | 57 | .86 | .82 | |||||||||||||||||||||||||||||||||
12/31/15 | 12.34 | .07 | .08 | .15 | (.17 | ) | (.10 | ) | (.27 | ) | 12.22 | 1.29 | 46 | .85 | .56 | |||||||||||||||||||||||||||||||||
12/31/14 | 11.93 | .06 | .51 | .57 | (.16 | ) | – | (.16 | ) | 12.34 | 4.76 | 21 | .85 | .50 | ||||||||||||||||||||||||||||||||||
12/31/13 | 12.75 | .08 | (.44 | ) | (.36 | ) | (.12 | ) | (.34 | ) | (.46 | ) | 11.93 | (2.95 | ) | – | 10 | .84 | .68 | |||||||||||||||||||||||||||||
12/31/122,8 | 12.88 | .01 | (.01 | ) | – | (.13 | ) | – | (.13 | ) | 12.75 | (.01 | )4,9 | – | 10 | .02 | 4,9 | .05 | 4,9 | |||||||||||||||||||||||||||||
| Income from investment operations1 | Dividends and distributions | |||||||||||||||||||||||||||||||||||||||||||||||||||||||
| Period ended | Net asset value, beginning of period | Net investment income (loss) | Net gains (losses) on securities (both realized and unrealized) | Total from investment operations | Dividends (from net investment income) | Distribu- tions (from capital gains) | Total dividends and distribu- tions | Net asset value, end of period | Total return14 | Net assets, end of period (in millions) | Ratio of expenses to average net assets before waivers/ reimburse- ments | Ratio of expenses to average net assets after waivers/ reimburse- ments14 | Net effective expense ratio14,15 | Ratio of net income (loss) to average net assets14 | ||||||||||||||||||||||||||||||||||||||||||
Managed Risk Growth Fund |
| |||||||||||||||||||||||||||||||||||||||||||||||||||||||
Class P1: | ||||||||||||||||||||||||||||||||||||||||||||||||||||||||
6/30/172,3 | $ | 10.71 | $ – | 12 | $ | 1.51 | $ | 1.51 | $ | (.07 | ) | $ | (.20 | ) | $ | (.27 | ) | $ | 11.95 | 14.10 | %4,9 | $ | 1 | .52 | %5,9 | .36 | %5,9 | .70 | %5,9 | .03 | %5,9 | |||||||||||||||||||||||||
12/31/16 | 11.49 | .08 | .20 | .28 | (.05 | ) | (1.01 | ) | (1.06 | ) | 10.71 | 2.89 | 9 | 1 | .50 | 9 | .34 | 9 | .68 | 9 | .79 | 9 | ||||||||||||||||||||||||||||||||||
12/31/15 | 11.37 | .09 | .03 | .12 | – | – | – | 11.49 | 1.06 | 9 | – | 10 | .53 | 9 | .29 | 9 | .63 | 9 | .80 | 9 | ||||||||||||||||||||||||||||||||||||
12/31/14 | 11.43 | .31 | (.06 | ) | .25 | (.12 | ) | (.19 | ) | (.31 | ) | 11.37 | 2.18 | 9 | – | 10 | .50 | 9 | .32 | 9 | .65 | 9 | 2.71 | 9 | ||||||||||||||||||||||||||||||||
12/31/132,16 | 10.00 | .12 | 1.38 | 1.50 | (.07 | ) | – | (.07 | ) | 11.43 | 15.05 | 4,9 | – | 10 | .88 | 5,9 | .25 | 5,9 | .58 | 5,9 | 1.64 | 5,9 | ||||||||||||||||||||||||||||||||||
Class P2: | ||||||||||||||||||||||||||||||||||||||||||||||||||||||||
6/30/172,3 | 10.64 | (.02 | ) | 1.50 | 1.48 | (.04 | ) | (.20 | ) | (.24 | ) | 11.88 | 13.91 | 4 | 245 | .79 | 5 | .63 | 5 | .97 | 5 | (.27 | )5 | |||||||||||||||||||||||||||||||||
12/31/16 | 11.43 | .05 | .19 | .24 | (.02 | ) | (1.01 | ) | (1.03 | ) | 10.64 | 2.52 | 200 | .79 | .63 | .97 | .43 | |||||||||||||||||||||||||||||||||||||||
12/31/15 | 11.35 | .04 | .04 | .08 | – | – | – | 11.43 | .71 | 146 | .89 | .66 | 1.00 | .31 | ||||||||||||||||||||||||||||||||||||||||||
12/31/14 | 11.43 | .12 | .08 | .20 | (.09 | ) | (.19 | ) | (.28 | ) | 11.35 | 1.77 | 79 | .87 | .69 | 1.02 | 1.01 | |||||||||||||||||||||||||||||||||||||||
12/31/132,16 | 10.00 | .12 | 1.37 | 1.49 | (.06 | ) | – | (.06 | ) | 11.43 | 14.94 | 4,9 | 28 | 1.05 | 5,9 | .52 | 5,9 | .85 | 5,9 | 1.69 | 5,9 | |||||||||||||||||||||||||||||||||||
| 196 | American Funds Insurance Series |
| Income from investment operations1 | Dividends and distributions | |||||||||||||||||||||||||||||||||||||||||||||||||||||||
| Period ended | Net asset value, beginning of period | Net investment income (loss) | Net gains (losses) on securities (both realized and unrealized) | Total from investment operations | Dividends (from net investment income) | Distributions (from capital gains) | Total dividends and distributions | Net asset value, end of period | Total return14 | Net assets, end of period (in millions) | Ratio of expenses to average net assets before waivers/ reimbursements | Ratio of expenses to average net assets after waivers/ reimbursements14 | Net effective expense ratio14,15 | Ratio of net income (loss) to average net assets14 | ||||||||||||||||||||||||||||||||||||||||||
Managed Risk International Fund |
| |||||||||||||||||||||||||||||||||||||||||||||||||||||||
Class P1: | ||||||||||||||||||||||||||||||||||||||||||||||||||||||||
6/30/172,3 | $ 8.89 | $.02 | $ 1.48 | $1.50 | $(.10 | ) | $(.12 | ) | $(.22 | ) | $10.17 | 16.87 | %4,9 | $ – | 10 | .38 | %5,9 | .22 | %5,9 | .73 | %5,9 | .34 | %5,9 | |||||||||||||||||||||||||||||||||
12/31/16 | 9.48 | .10 | (.35 | ) | (.25 | ) | (.12 | ) | (.22 | ) | (.34 | ) | 8.89 | (2.59 | )9 | – | 10 | .39 | 9 | .23 | 9 | .74 | 9 | 1.15 | 9 | |||||||||||||||||||||||||||||||
12/31/15 | 10.10 | .18 | (.80 | ) | (.62 | ) | – | 12 | – | – | 12 | 9.48 | (6.12 | )9 | – | 10 | .45 | 9 | .21 | 9 | .72 | 9 | 1.75 | 9 | ||||||||||||||||||||||||||||||||
12/31/14 | 10.82 | .14 | (.71 | ) | (.57 | ) | (.15 | ) | – | (.15 | ) | 10.10 | (5.31 | )9 | – | 10 | .50 | 9 | .25 | 9 | .76 | 9 | 1.33 | 9 | ||||||||||||||||||||||||||||||||
12/31/132,16 | 10.00 | .13 | .78 | .91 | (.09 | ) | – | (.09 | ) | 10.82 | 9.08 | 4,9 | – | 10 | 1.05 | 5,9 | .23 | 5,9 | .73 | 5,9 | 1.92 | 5,9 | ||||||||||||||||||||||||||||||||||
Class P2: | ||||||||||||||||||||||||||||||||||||||||||||||||||||||||
6/30/172,3 | 8.83 | .01 | 1.46 | 1.47 | (.08 | ) | (.12 | ) | (.20 | ) | 10.10 | 16.57 | 4 | 124 | .79 | 5 | .63 | 5 | 1.14 | 5 | .12 | 5 | ||||||||||||||||||||||||||||||||||
12/31/16 | 9.43 | .09 | (.38 | ) | (.29 | ) | (.09 | ) | (.22 | ) | (.31 | ) | 8.83 | (3.05 | ) | 97 | .79 | .63 | 1.14 | .97 | ||||||||||||||||||||||||||||||||||||
12/31/15 | 10.09 | .13 | (.79 | ) | (.66 | ) | – | 12 | – | – | 12 | 9.43 | (6.52 | ) | 83 | .90 | .66 | 1.17 | 1.30 | |||||||||||||||||||||||||||||||||||||
12/31/14 | 10.82 | .16 | (.77 | ) | (.61 | ) | (.12 | ) | – | (.12 | ) | 10.09 | (5.68 | ) | 46 | .91 | .67 | 1.18 | 1.51 | |||||||||||||||||||||||||||||||||||||
12/31/132,16 | 10.00 | .18 | .72 | .90 | (.08 | ) | – | (.08 | ) | 10.82 | 8.99 | 4,9 | 17 | 1.19 | 5,9 | .44 | 5,9 | .94 | 5,9 | 2.66 | 5,9 | |||||||||||||||||||||||||||||||||||
Managed Risk Blue Chip Income and Growth Fund |
| |||||||||||||||||||||||||||||||||||||||||||||||||||||||
Class P1: | ||||||||||||||||||||||||||||||||||||||||||||||||||||||||
6/30/172,3 | $11.67 | $.02 | $ .61 | $ .63 | $(.15 | ) | $(.19 | ) | $(.34 | ) | $11.96 | 5.37 | %4,9 | $ – | 10 | .42 | %5,9 | .27 | %5,9 | .66 | %5,9 | .31 | %5,9 | |||||||||||||||||||||||||||||||||
12/31/16 | 10.80 | .20 | 1.25 | 1.45 | (.21 | ) | (.37 | ) | (.58 | ) | 11.67 | 13.77 | 9 | – | 10 | .43 | 9 | .27 | 9 | .67 | 9 | 1.83 | 9 | |||||||||||||||||||||||||||||||||
12/31/15 | 11.70 | .19 | (1.02 | ) | (.83 | ) | (.07 | ) | – | (.07 | ) | 10.80 | (7.07 | )9 | – | 10 | .50 | 9 | .27 | 9 | .66 | 9 | 1.64 | 9 | ||||||||||||||||||||||||||||||||
12/31/14 | 11.05 | .40 | .55 | .95 | (.30 | ) | – | (.30 | ) | 11.70 | 8.58 | 9 | – | 10 | .50 | 9 | .31 | 9 | .70 | 9 | 3.43 | 9 | ||||||||||||||||||||||||||||||||||
12/31/132,16 | 10.00 | .20 | 1.01 | 1.21 | (.16 | ) | – | (.16 | ) | 11.05 | 12.16 | 4,9 | – | 10 | .84 | 5,9 | .24 | 5,9 | .64 | 5,9 | 2.80 | 5,9 | ||||||||||||||||||||||||||||||||||
Class P2: | ||||||||||||||||||||||||||||||||||||||||||||||||||||||||
6/30/172,3 | 11.61 | .01 | .59 | .60 | (.15 | ) | (.19 | ) | (.34 | ) | 11.87 | 5.11 | 4 | 361 | .79 | 5 | .63 | 5 | 1.03 | 5 | .13 | 5 | ||||||||||||||||||||||||||||||||||
12/31/16 | 10.76 | .23 | 1.18 | 1.41 | (.19 | ) | (.37 | ) | (.56 | ) | 11.61 | 13.39 | 291 | .79 | .63 | 1.03 | 2.04 | |||||||||||||||||||||||||||||||||||||||
12/31/15 | 11.67 | .18 | (1.05 | ) | (.87 | ) | (.04 | ) | – | (.04 | ) | 10.76 | (7.43 | ) | 137 | .89 | .66 | 1.05 | 1.57 | |||||||||||||||||||||||||||||||||||||
12/31/14 | 11.05 | .50 | .40 | .90 | (.28 | ) | – | (.28 | ) | 11.67 | 8.10 | 98 | .88 | .69 | 1.08 | 4.27 | ||||||||||||||||||||||||||||||||||||||||
12/31/132,16 | 10.00 | .28 | .92 | 1.20 | (.15 | ) | – | (.15 | ) | 11.05 | 12.05 | 4,9 | 26 | 1.04 | 5,9 | .54 | 5,9 | .94 | 5,9 | 3.91 | 5,9 | |||||||||||||||||||||||||||||||||||
Managed Risk Growth-Income Fund |
| |||||||||||||||||||||||||||||||||||||||||||||||||||||||
Class P1: | ||||||||||||||||||||||||||||||||||||||||||||||||||||||||
6/30/172,3 | $11.07 | $.02 | $ .99 | $1.01 | $(.13 | ) | $(.50 | ) | $(.63 | ) | $11.45 | 9.11 | %4,9 | $ 2 | .53 | %5,9 | .37 | %5,9 | .65 | %5,9 | .27 | %5,9 | ||||||||||||||||||||||||||||||||||
12/31/16 | 11.25 | .16 | .52 | .68 | (.16 | ) | (.70 | ) | (.86 | ) | 11.07 | 6.49 | 9 | 1 | .52 | 9 | .36 | 9 | .64 | 9 | 1.46 | 9 | ||||||||||||||||||||||||||||||||||
12/31/15 | 11.67 | .25 | (.63 | ) | (.38 | ) | (.04 | ) | – | (.04 | ) | 11.25 | (3.27 | )9 | 1 | .56 | 9 | .31 | 9 | .59 | 9 | 2.17 | 9 | |||||||||||||||||||||||||||||||||
12/31/14 | 11.50 | .35 | .21 | .56 | (.14 | ) | (.25 | ) | (.39 | ) | 11.67 | 4.85 | 9 | – | 10 | .45 | 9 | .25 | 9 | .52 | 9 | 2.94 | 9 | |||||||||||||||||||||||||||||||||
12/31/132,16 | 10.00 | .14 | 1.47 | 1.61 | (.11 | ) | – | (.11 | ) | 11.50 | 16.15 | 4,9 | – | 10 | .92 | 5,9 | .23 | 5,9 | .50 | 5,9 | 2.01 | 5,9 | ||||||||||||||||||||||||||||||||||
Class P2: | ||||||||||||||||||||||||||||||||||||||||||||||||||||||||
6/30/172,3 | 11.02 | – | 12 | 1.00 | 1.00 | (.12 | ) | (.50 | ) | (.62 | ) | 11.40 | 9.10 | 4 | 184 | .79 | 5 | .63 | 5 | .91 | 5 | (.04 | )5 | |||||||||||||||||||||||||||||||||
12/31/16 | 11.22 | .12 | .52 | .64 | (.14 | ) | (.70 | ) | (.84 | ) | 11.02 | 6.08 | 160 | .79 | .63 | .91 | 1.13 | |||||||||||||||||||||||||||||||||||||||
12/31/15 | 11.65 | .12 | (.54 | ) | (.42 | ) | (.01 | ) | – | (.01 | ) | 11.22 | (3.64 | ) | 122 | .89 | .66 | .94 | 1.04 | |||||||||||||||||||||||||||||||||||||
12/31/14 | 11.50 | .16 | .35 | .51 | (.11 | ) | (.25 | ) | (.36 | ) | 11.65 | 4.42 | 76 | .87 | .69 | .96 | 1.38 | |||||||||||||||||||||||||||||||||||||||
12/31/132,16 | 10.00 | .20 | 1.40 | 1.60 | (.10 | ) | – | (.10 | ) | 11.50 | 16.04 | 4,9 | 24 | 1.09 | 5,9 | .50 | 5,9 | .77 | 5,9 | 2.73 | 5,9 | |||||||||||||||||||||||||||||||||||
Managed Risk Asset Allocation Fund |
| |||||||||||||||||||||||||||||||||||||||||||||||||||||||
Class P1: | ||||||||||||||||||||||||||||||||||||||||||||||||||||||||
6/30/172,3 | $12.02 | $.02 | $ .88 | $ .90 | $(.10 | ) | $(.12 | ) | $(.22 | ) | $12.70 | 7.53 | %4 | $1,466 | .43 | %5 | .38 | %5 | .66 | %5 | .30 | %5 | ||||||||||||||||||||||||||||||||||
12/31/16 | 11.72 | .19 | .67 | .86 | (.19 | ) | (.37 | ) | (.56 | ) | 12.02 | 7.57 | 1,217 | .43 | .38 | .66 | 1.65 | |||||||||||||||||||||||||||||||||||||||
12/31/15 | 12.29 | .25 | (.34 | ) | (.09 | ) | (.22 | ) | (.26 | ) | (.48 | ) | 11.72 | (.83 | ) | 712 | .54 | .40 | .68 | 2.06 | ||||||||||||||||||||||||||||||||||||
12/31/14 | 11.93 | .13 | .26 | .39 | (.03 | ) | – | (.03 | ) | 12.29 | 3.24 | 277 | .53 | .48 | .76 | 1.04 | ||||||||||||||||||||||||||||||||||||||||
12/31/13 | 9.99 | .27 | 1.81 | 2.08 | (.14 | ) | – | (.14 | ) | 11.93 | 20.82 | 9 | 112 | .55 | 9 | .47 | 9 | .75 | 9 | 2.37 | 9 | |||||||||||||||||||||||||||||||||||
12/31/122,17 | 10.00 | .15 | (.03 | ) | .12 | (.13 | ) | – | (.13 | ) | 9.99 | 1.24 | 4,9 | – | 10 | .15 | 5,9 | .07 | 5,9 | .37 | 5,9 | 1.72 | 5,9 | |||||||||||||||||||||||||||||||||
Class P2: | ||||||||||||||||||||||||||||||||||||||||||||||||||||||||
6/30/172,3 | 12.01 | – | 12 | .89 | .89 | (.10 | ) | (.12 | ) | (.22 | ) | 12.68 | 7.43 | 4 | 2,620 | .68 | 5 | .63 | 5 | .91 | 5 | .03 | 5 | |||||||||||||||||||||||||||||||||
12/31/16 | 11.71 | .14 | .69 | .83 | (.16 | ) | (.37 | ) | (.53 | ) | 12.01 | 7.27 | 2,342 | .68 | .63 | .91 | 1.20 | |||||||||||||||||||||||||||||||||||||||
12/31/15 | 12.27 | .14 | (.26 | ) | (.12 | ) | (.18 | ) | (.26 | ) | (.44 | ) | 11.71 | (1.07 | ) | 1,953 | .79 | .66 | .94 | 1.16 | ||||||||||||||||||||||||||||||||||||
12/31/14 | 11.93 | .16 | .19 | .35 | (.01 | ) | – | (.01 | ) | 12.27 | 2.91 | 1,780 | .79 | .73 | 1.01 | 1.33 | ||||||||||||||||||||||||||||||||||||||||
12/31/13 | 9.99 | .28 | 1.77 | 2.05 | (.11 | ) | – | (.11 | ) | 11.93 | 20.58 | 9 | 795 | .80 | 9 | .73 | 9 | 1.01 | 9 | 2.43 | 9 | |||||||||||||||||||||||||||||||||||
12/31/122,17 | 10.00 | .17 | (.05 | ) | .12 | (.13 | ) | – | (.13 | ) | 9.99 | 1.21 | 4,9 | – | 10 | .24 | 5,9 | .11 | 5,9 | .41 | 5,9 | 2.38 | 5,9 | |||||||||||||||||||||||||||||||||
See end of tables for footnotes.
| American Funds Insurance Series | 197 |
Financial highlights (continued)
Six months ended June 30, 20172,3,4 | Period ended December 31 | |||||||||||||||||||||
| Portfolio turnover rate for all share classes18 | 2016 | 2015 | 2014 | 2013 | 2012 | |||||||||||||||||
Global Growth Fund | 25% | 27 | % | 29 | % | 22 | % | 39 | % | 22 | % | |||||||||||
Global Small Capitalization Fund | 18 | 40 | 36 | 28 | 36 | 40 | ||||||||||||||||
Growth Fund | 16 | 26 | 20 | 29 | 19 | 21 | ||||||||||||||||
International Fund | 16 | 31 | 37 | 18 | 21 | 29 | ||||||||||||||||
New World Fund | 41 | 32 | 39 | 36 | 43 | 32 | ||||||||||||||||
Blue Chip Income and Growth Fund | 20 | 30 | 26 | 37 | 30 | 36 | ||||||||||||||||
Global Growth and Income Fund | 23 | 57 | 37 | 28 | 31 | 30 | ||||||||||||||||
Growth-Income Fund | 15 | 27 | 25 | 25 | 19 | 25 | ||||||||||||||||
International Growth and Income Fund | 35 | 32 | 35 | 34 | 34 | 31 | ||||||||||||||||
Capital Income Builder Fund | 37 | 53 | 128 | 35 | 4,11 | |||||||||||||||||
Asset Allocation Fund | 39 | 83 | 76 | 88 | 74 | 61 | ||||||||||||||||
Global Balanced Fund | 23 | 65 | 76 | 73 | 81 | 80 | ||||||||||||||||
Bond Fund | 247 | 375 | 434 | 365 | 354 | 253 | ||||||||||||||||
Global Bond Fund | 60 | 154 | 159 | 200 | 213 | 160 | ||||||||||||||||
High-Income Bond Fund | 45 | 89 | 66 | 54 | 64 | 48 | ||||||||||||||||
Mortgage Fund | 428 | 713 | 1103 | 790 | 715 | 444 | ||||||||||||||||
Ultra-Short Bond Fund | —19 | — | 13,19,20 | N/A | N/A | N/A | N/A | |||||||||||||||
U.S. Government/AAA-Rated Securities Fund | 388 | 539 | 901 | 387 | 621 | 447 | ||||||||||||||||
Managed Risk Growth Fund | 5 | 15 | 16 | 22 | 10 | 2,4,16 | ||||||||||||||||
Managed Risk International Fund | 4 | 26 | 15 | 22 | 6 | 2,4,16 | ||||||||||||||||
Managed Risk Blue Chip Income and Growth Fund | 5 | 9 | 20 | 22 | 3 | 2,4,16 | ||||||||||||||||
Managed Risk Growth-Income Fund | 3 | 14 | 11 | 28 | 2 | 2,4,16 | ||||||||||||||||
Managed Risk Asset Allocation Fund | —19 | 3 | 3 | 3 | 3 | — | 2,4,17,19 | |||||||||||||||
| Portfolio turnover rate for all share classes | Six months ended | Period ended December 31 | ||||||||||||||||||||
| excluding mortgage dollar roll transactions18 | June 30, 20172,3,4 | 2016 | 2015 | 2014 | 2013 | 2012 | ||||||||||||||||
Capital Income Builder | 19% | 41 | % | 38 | % | 24 | %4,12 | |||||||||||||||
Asset Allocation Fund | 21 | 43 | 28 | 42 | ||||||||||||||||||
Global Balanced Fund | 17 | 43 | 36 | 40 | ||||||||||||||||||
Bond Fund | 102 | 108 | 141 | 121 | Not available | |||||||||||||||||
Global Bond Fund | 44 | 70 | 88 | 134 | ||||||||||||||||||
Mortgage Fund | 60 | 113 | 138 | 108 | ||||||||||||||||||
U.S. Government/AAA-Rated Securities Fund | 81 | 273 | 352 | 88 | ||||||||||||||||||
| 198 | American Funds Insurance Series |
| 1 | Based on average shares outstanding. |
| 2 | Based on operations for the period shown and, accordingly, is not representative of a full year. |
| 3 | Unaudited. |
| 4 | Not annualized. |
| 5 | Annualized. |
| 6 | For the year ended December 31, 2014, reflects the impact of a corporate action event that resulted in a one-time increase to net investment income. If the corporate action event had not occurred, the net investment income per share and ratio of net income to average net assets would have been lower for all share classes. |
| 7 | Class 1A shares began investment operations on January 6, 2017. |
| 8 | Class 4 shares began investment operations on December 14, 2012. |
| 9 | All or a significant portion of assets in this class consisted of seed capital invested by CRMC and/or its affiliates. Certain fees (including, where applicable, fees for distribution services) are not charged or accrued on these seed capital assets. If such fees were paid by the fund on seed capital assets, fund expenses would have been higher and net income and total return would have been lower. |
| 10 | Amount less than $1 million. |
| 11 | For the period May 1, 2014, commencement of operations, through December 31, 2014. |
| 12 | Amount less than $.01. |
| 13 | On May 1, 2016, the fund converted from a cash fund to an ultra-short-term bond fund and changed its name from Cash Management Fund to Ultra-Short Bond Fund. |
| 14 | This column reflects the impact of certain waivers/reimbursements by CRMC. CRMC waived a portion of investment advisory services and reimbursed a portion of miscellaneous fees and expenses for the managed risk funds. |
| 15 | Ratio reflects weighted average net expense ratio of the underlying fund for the period presented. See Expense Example for further information regarding fees and expenses. |
| 16 | For the period May 1, 2013, commencement of operations, through December 31, 2013. |
| 17 | For the period September 28, 2012, commencement of operations, through December 31, 2012. |
| 18 | Refer to Note 5 for further information on mortgage dollar rolls. |
| 19 | Amount is either less than 1% or there is no turnover. |
| 20 | As revised to correct the December 31, 2016, portfolio turnover rate. Rate previously presented was 300%. |
See Notes to Financial Statements
| American Funds Insurance Series | 199 |
Expense example
| unaudited |
| The funds in American Funds Insurance Series serve as the underlying investment vehicle for various insurance products. As an owner of an insurance contract that invests in one of the funds in the series, you incur two types of costs: (1) transaction costs, such as initial sales charges on purchase payments and contingent deferred sales charges on redemptions (loads), and (2) ongoing costs, including management fees, distribution and service (12b-1) fees, and other expenses. Additional fees are charged by the insurance companies related to the various benefits they provide. This example is intended to help you understand your ongoing costs (in dollars) of investing in the underlying funds so you can compare these costs with the ongoing costs of investing in other mutual funds that serve a similar function in other annuity products. The example is based on an investment of $1,000 invested at the beginning of the period and held for the entire six-month period (January 1, 2017, through June 30, 2017). | Actual expenses: The first line of each share class in the table on the following pages provides information about actual account values and actual expenses. You may use the information in this line, together with the amount you invested, to estimate the expenses that you paid over the period. Simply divide your account value by $1,000 (for example, an $8,600 account value divided by $1,000 = 8.6), then multiply the result by the number in the first line under the heading titled “Expenses paid during period” to estimate the expenses you paid on your account during this period.
Hypothetical example for comparison purposes: The second line of each share class in the table on the following pages provides information about hypothetical account values and hypothetical expenses based on the actual expense ratio for the share class and an assumed rate of return of 5.00% per year before expenses, which is not the actual return of the share class. The hypothetical account values and expenses may not be used to estimate the actual ending account balance or expenses you paid for the period. You may use this information to compare the ongoing costs of investing in the fund and other funds. To do so, compare this 5.00% hypothetical example with the 5.00% hypothetical examples that appear in the shareholder reports of the other funds.
Notes: Additional fees are charged by the insurance companies related to the various benefits they provide. You can estimate the impact of these fees by adding the amount of the fees to the total estimated expenses you paid on your account during the period as calculated above. In addition, your ending account value would be lower by the amount of these fees.
Note that the expenses shown in the table on the following pages are meant to highlight your ongoing costs only and do not reflect any transactional costs. Therefore, the second line of each share class in the table is useful in comparing ongoing costs only and will not help you determine the relative total costs of owning different funds. In addition, if these transactional costs were included, your costs would have been higher. |
| 200 | American Funds Insurance Series |
| Beginning account value 1/1/2017 | Ending account value 6/30/2017 | Expenses paid during period1 | Annualized expense ratio | |||||||||||||
Global Growth Fund | ||||||||||||||||
Class 1 – actual return | $1,000.00 | $1,187.51 | $2.98 | .55 | % | |||||||||||
Class 1 – assumed 5% return | 1,000.00 | 1,022.07 | 2.76 | .55 | ||||||||||||
Class 1A – actual return2 | 1,000.00 | 1,164.85 | 4.05 | .78 | ||||||||||||
Class 1A – assumed 5% return2 | 1,000.00 | 1,020.93 | 3.91 | .78 | ||||||||||||
Class 2 – actual return | 1,000.00 | 1,185.67 | 4.34 | .80 | ||||||||||||
Class 2 – assumed 5% return | 1,000.00 | 1,020.83 | 4.01 | .80 | ||||||||||||
Class 4 – actual return | 1,000.00 | 1,184.45 | 5.69 | 1.05 | ||||||||||||
Class 4 – assumed 5% return | 1,000.00 | 1,019.59 | 5.26 | 1.05 | ||||||||||||
Global Small Capitalization Fund | ||||||||||||||||
Class 1 – actual return | $1,000.00 | $1,128.20 | $3.85 | .73 | % | |||||||||||
Class 1 – assumed 5% return | 1,000.00 | 1,021.17 | 3.66 | .73 | ||||||||||||
Class 1A – actual return2 | 1,000.00 | 1,102.63 | 4.74 | .94 | ||||||||||||
Class 1A – assumed 5% return2 | 1,000.00 | 1,020.13 | 4.71 | .94 | ||||||||||||
Class 2 – actual return | 1,000.00 | 1,127.06 | 5.17 | .98 | ||||||||||||
Class 2 – assumed 5% return | 1,000.00 | 1,019.93 | 4.91 | .98 | ||||||||||||
Class 4 – actual return | 1,000.00 | 1,125.66 | 6.48 | 1.23 | ||||||||||||
Class 4 – assumed 5% return | 1,000.00 | 1,018.70 | 6.16 | 1.23 | ||||||||||||
Growth Fund | ||||||||||||||||
Class 1 – actual return | $1,000.00 | $1,151.48 | $1.87 | .35 | % | |||||||||||
Class 1 – assumed 5% return | 1,000.00 | 1,023.06 | 1.76 | .35 | ||||||||||||
Class 1A – actual return2 | 1,000.00 | 1,124.75 | 2.95 | .58 | ||||||||||||
Class 1A – assumed 5% return2 | 1,000.00 | 1,021.92 | 2.91 | .58 | ||||||||||||
Class 2 – actual return | 1,000.00 | 1,150.04 | 3.20 | .60 | ||||||||||||
Class 2 – assumed 5% return | 1,000.00 | 1,021.82 | 3.01 | .60 | ||||||||||||
Class 3 – actual return | 1,000.00 | 1,150.49 | 2.83 | .53 | ||||||||||||
Class 3 – assumed 5% return | 1,000.00 | 1,022.17 | 2.66 | .53 | ||||||||||||
Class 4 – actual return | 1,000.00 | 1,148.65 | 4.53 | .85 | ||||||||||||
Class 4 – assumed 5% return | 1,000.00 | 1,020.58 | 4.26 | .85 | ||||||||||||
International Fund | ||||||||||||||||
Class 1 – actual return | $1,000.00 | $1,187.06 | $2.87 | .53 | % | |||||||||||
Class 1 – assumed 5% return | 1,000.00 | 1,022.17 | 2.66 | .53 | ||||||||||||
Class 1A – actual return2 | 1,000.00 | 1,161.69 | 3.89 | .75 | ||||||||||||
Class 1A – assumed 5% return2 | 1,000.00 | 1,021.08 | 3.76 | .75 | ||||||||||||
Class 2 – actual return | 1,000.00 | 1,185.45 | 4.23 | .78 | ||||||||||||
Class 2 – assumed 5% return | 1,000.00 | 1,020.93 | 3.91 | .78 | ||||||||||||
Class 3 – actual return | 1,000.00 | 1,186.37 | 3.85 | .71 | ||||||||||||
Class 3 – assumed 5% return | 1,000.00 | 1,021.27 | 3.56 | .71 | ||||||||||||
Class 4 – actual return | 1,000.00 | 1,184.80 | 5.58 | 1.03 | ||||||||||||
Class 4 – assumed 5% return | 1,000.00 | 1,019.69 | 5.16 | 1.03 | ||||||||||||
New World Fund | ||||||||||||||||
Class 1 – actual return | $1,000.00 | $1,145.94 | $3.99 | .75 | % | |||||||||||
Class 1 – assumed 5% return | 1,000.00 | 1,021.08 | 3.76 | .75 | ||||||||||||
Class 1A – actual return2 | 1,000.00 | 1,121.05 | 4.88 | .96 | ||||||||||||
Class 1A – assumed 5% return2 | 1,000.00 | 1,020.03 | 4.81 | .96 | ||||||||||||
Class 2 – actual return | 1,000.00 | 1,144.77 | 5.32 | 1.00 | ||||||||||||
Class 2 – assumed 5% return | 1,000.00 | 1,019.84 | 5.01 | 1.00 | ||||||||||||
Class 4 – actual return | 1,000.00 | 1,143.21 | 6.64 | 1.25 | ||||||||||||
Class 4 – assumed 5% return | 1,000.00 | 1,018.60 | 6.26 | 1.25 | ||||||||||||
See end of tables for footnotes.
| American Funds Insurance Series | 201 |
| Beginning account value 1/1/2017 | Ending account value 6/30/2017 | Expenses paid during period1 | Annualized expense ratio | |||||||||||||
Blue Chip Income and Growth Fund | ||||||||||||||||
Class 1 – actual return | $1,000.00 | $1,058.20 | $2.09 | .41 | % | |||||||||||
Class 1 – assumed 5% return | 1,000.00 | 1,022.76 | 2.06 | .41 | ||||||||||||
Class 1A – actual return2 | 1,000.00 | 1,040.53 | 2.98 | .61 | ||||||||||||
Class 1A – assumed 5% return2 | 1,000.00 | 1,021.77 | 3.06 | .61 | ||||||||||||
Class 2 – actual return | 1,000.00 | 1,057.61 | 3.37 | .66 | ||||||||||||
Class 2 – assumed 5% return | 1,000.00 | 1,021.52 | 3.31 | .66 | ||||||||||||
Class 4 – actual return | 1,000.00 | 1,055.18 | 4.64 | .91 | ||||||||||||
Class 4 – assumed 5% return | 1,000.00 | 1,020.28 | 4.56 | .91 | ||||||||||||
Global Growth and Income Fund | ||||||||||||||||
Class 1 – actual return | $1,000.00 | $1,148.78 | $3.30 | .62 | % | |||||||||||
Class 1 – assumed 5% return | 1,000.00 | 1,021.72 | 3.11 | .62 | ||||||||||||
Class 1A – actual return2 | 1,000.00 | 1,132.25 | 3.12 | .61 | ||||||||||||
Class 1A – assumed 5% return2 | 1,000.00 | 1,021.77 | 3.06 | .61 | ||||||||||||
Class 2 – actual return | 1,000.00 | 1,147.00 | 4.63 | .87 | ||||||||||||
Class 2 – assumed 5% return | 1,000.00 | 1,020.48 | 4.36 | .87 | ||||||||||||
Class 4 – actual return | 1,000.00 | 1,145.78 | 5.96 | 1.12 | ||||||||||||
Class 4 – assumed 5% return | 1,000.00 | 1,019.24 | 5.61 | 1.12 | ||||||||||||
Growth-Income Fund | ||||||||||||||||
Class 1 – actual return | $1,000.00 | $1,098.97 | $1.46 | .28 | % | |||||||||||
Class 1 – assumed 5% return | 1,000.00 | 1,023.41 | 1.40 | .28 | ||||||||||||
Class 1A – actual return2 | 1,000.00 | 1,074.84 | 2.39 | .48 | ||||||||||||
Class 1A – assumed 5% return2 | 1,000.00 | 1,022.41 | 2.41 | .48 | ||||||||||||
Class 2 – actual return | 1,000.00 | 1,097.65 | 2.76 | .53 | ||||||||||||
Class 2 – assumed 5% return | 1,000.00 | 1,022.17 | 2.66 | .53 | ||||||||||||
Class 3 – actual return | 1,000.00 | 1,098.35 | 2.39 | .46 | ||||||||||||
Class 3 – assumed 5% return | 1,000.00 | 1,022.51 | 2.31 | .46 | ||||||||||||
Class 4 – actual return | 1,000.00 | 1,096.35 | 4.05 | .78 | ||||||||||||
Class 4 – assumed 5% return | 1,000.00 | 1,020.93 | 3.91 | .78 | ||||||||||||
International Growth and Income Fund | ||||||||||||||||
Class 1 – actual return | $1,000.00 | $1,155.39 | $3.53 | .66 | % | |||||||||||
Class 1 – assumed 5% return | 1,000.00 | 1,021.52 | 3.31 | .66 | ||||||||||||
Class 1A – actual return2 | 1,000.00 | 1,138.89 | 3.54 | .69 | ||||||||||||
Class 1A – assumed 5% return2 | 1,000.00 | 1,021.37 | 3.46 | .69 | ||||||||||||
Class 2 – actual return | 1,000.00 | 1,154.82 | 4.86 | .91 | ||||||||||||
Class 2 – assumed 5% return | 1,000.00 | 1,020.28 | 4.56 | .91 | ||||||||||||
Class 4 – actual return | 1,000.00 | 1,152.92 | 6.19 | 1.16 | ||||||||||||
Class 4 – assumed 5% return | 1,000.00 | 1,019.04 | 5.81 | 1.16 | ||||||||||||
Capital Income Builder | ||||||||||||||||
Class 1 – actual return | $1,000.00 | $1,082.74 | $2.74 | .53 | % | |||||||||||
Class 1 – assumed 5% return | 1,000.00 | 1,022.17 | 2.66 | .53 | ||||||||||||
Class 1A – actual return2 | 1,000.00 | 1,068.83 | 3.42 | .69 | ||||||||||||
Class 1A – assumed 5% return2 | 1,000.00 | 1,021.37 | 3.46 | .69 | ||||||||||||
Class 2 – actual return | 1,000.00 | 1,081.55 | 4.03 | .78 | ||||||||||||
Class 2 – assumed 5% return | 1,000.00 | 1,020.93 | 3.91 | .78 | ||||||||||||
Class 4 – actual return | 1,000.00 | 1,079.18 | 5.31 | 1.03 | ||||||||||||
Class 4 – assumed 5% return | 1,000.00 | 1,019.69 | 5.16 | 1.03 | ||||||||||||
| 202 | American Funds Insurance Series |
| Beginning account value 1/1/2017 | Ending account value 6/30/2017 | Expenses paid during period1 | Annualized expense ratio | |||||||||||||
Asset Allocation Fund | ||||||||||||||||
Class 1 – actual return | $1,000.00 | $1,082.81 | $1.50 | .29 | % | |||||||||||
Class 1 – assumed 5% return | 1,000.00 | 1,023.36 | 1.45 | .29 | ||||||||||||
Class 1A – actual return2 | 1,000.00 | 1,068.08 | 2.63 | .53 | ||||||||||||
Class 1A – assumed 5% return2 | 1,000.00 | 1,022.17 | 2.66 | .53 | ||||||||||||
Class 2 – actual return | 1,000.00 | 1,081.69 | 2.79 | .54 | ||||||||||||
Class 2 – assumed 5% return | 1,000.00 | 1,022.12 | 2.71 | .54 | ||||||||||||
Class 3 – actual return | 1,000.00 | 1,081.96 | 2.43 | .47 | ||||||||||||
Class 3 – assumed 5% return | 1,000.00 | 1,022.46 | 2.36 | .47 | ||||||||||||
Class 4 – actual return | 1,000.00 | 1,080.20 | 4.07 | .79 | ||||||||||||
Class 4 – assumed 5% return | 1,000.00 | 1,020.88 | 3.96 | .79 | ||||||||||||
Global Balanced Fund | ||||||||||||||||
Class 1 – actual return | $1,000.00 | $1,111.92 | $3.61 | .69 | % | |||||||||||
Class 1 – assumed 5% return | 1,000.00 | 1,021.37 | 3.46 | .69 | ||||||||||||
Class 1A – actual return2 | 1,000.00 | 1,101.96 | 3.48 | .69 | ||||||||||||
Class 1A – assumed 5% return2 | 1,000.00 | 1,021.37 | 3.46 | .69 | ||||||||||||
Class 2 – actual return | 1,000.00 | 1,111.21 | 4.92 | .94 | ||||||||||||
Class 2 – assumed 5% return | 1,000.00 | 1,020.13 | 4.71 | .94 | ||||||||||||
Class 4 – actual return | 1,000.00 | 1,110.00 | 6.23 | 1.19 | ||||||||||||
Class 4 – assumed 5% return | 1,000.00 | 1,018.89 | 5.96 | 1.19 | ||||||||||||
Bond Fund | ||||||||||||||||
Class 1 – actual return | $1,000.00 | $1,026.20 | $1.91 | .38 | % | |||||||||||
Class 1 – assumed 5% return | 1,000.00 | 1,022.91 | 1.91 | .38 | ||||||||||||
Class 1A – actual return2 | 1,000.00 | 1,023.36 | 2.91 | .60 | ||||||||||||
Class 1A – assumed 5% return2 | 1,000.00 | 1,021.82 | 3.01 | .60 | ||||||||||||
Class 2 – actual return | 1,000.00 | 1,025.11 | 3.16 | .63 | ||||||||||||
Class 2 – assumed 5% return | 1,000.00 | 1,021.67 | 3.16 | .63 | ||||||||||||
Class 4 – actual return | 1,000.00 | 1,022.88 | 4.41 | .88 | ||||||||||||
Class 4 – assumed 5% return | 1,000.00 | 1,020.43 | 4.41 | .88 | ||||||||||||
Global Bond Fund | ||||||||||||||||
Class 1 – actual return | $1,000.00 | $1,050.89 | $2.90 | .57 | % | |||||||||||
Class 1 – assumed 5% return | 1,000.00 | 1,021.97 | 2.86 | .57 | ||||||||||||
Class 1A – actual return2 | 1,000.00 | 1,050.87 | 2.85 | .58 | ||||||||||||
Class 1A – assumed 5% return2 | 1,000.00 | 1,021.92 | 2.91 | .58 | ||||||||||||
Class 2 – actual return | 1,000.00 | 1,049.45 | 4.17 | .82 | ||||||||||||
Class 2 – assumed 5% return | 1,000.00 | 1,020.73 | 4.11 | .82 | ||||||||||||
Class 4 – actual return | 1,000.00 | 1,048.81 | 5.44 | 1.07 | ||||||||||||
Class 4 – assumed 5% return | 1,000.00 | 1,019.49 | 5.36 | 1.07 | ||||||||||||
See end of tables for footnotes.
| American Funds Insurance Series | 203 |
| Beginning account value 1/1/2017 | Ending account value 6/30/2017 | Expenses paid during period1 | Annualized expense ratio | |||||||||||||
High-Income Bond Fund | ||||||||||||||||
Class 1 – actual return | $1,000.00 | $1,046.04 | $2.44 | .48 | % | |||||||||||
Class 1 – assumed 5% return | 1,000.00 | 1,022.41 | 2.41 | .48 | ||||||||||||
Class 1A – actual return2 | 1,000.00 | 1,035.87 | 3.42 | .70 | ||||||||||||
Class 1A – assumed 5% return2 | 1,000.00 | 1,021.32 | 3.51 | .70 | ||||||||||||
Class 2 – actual return | 1,000.00 | 1,044.30 | 3.70 | .73 | ||||||||||||
Class 2 – assumed 5% return | 1,000.00 | 1,021.17 | 3.66 | .73 | ||||||||||||
Class 3 – actual return | 1,000.00 | 1,044.58 | 3.35 | .66 | ||||||||||||
Class 3 – assumed 5% return | 1,000.00 | 1,021.52 | 3.31 | .66 | ||||||||||||
Class 4 – actual return | 1,000.00 | 1,042.87 | 4.96 | .98 | ||||||||||||
Class 4 – assumed 5% return | 1,000.00 | 1,019.93 | 4.91 | .98 | ||||||||||||
Mortgage Fund | ||||||||||||||||
Class 1 – actual return | $1,000.00 | $1,015.13 | $2.20 | .44 | % | |||||||||||
Class 1 – assumed 5% return | 1,000.00 | 1,022.61 | 2.21 | .44 | ||||||||||||
Class 1A – actual return2 | 1,000.00 | 1,015.16 | 3.24 | .67 | ||||||||||||
Class 1A – assumed 5% return2 | 1,000.00 | 1,021.47 | 3.36 | .67 | ||||||||||||
Class 2 – actual return | 1,000.00 | 1,013.74 | 3.45 | .69 | ||||||||||||
Class 2 – assumed 5% return | 1,000.00 | 1,021.37 | 3.46 | .69 | ||||||||||||
Class 4 – actual return | 1,000.00 | 1,012.49 | 4.69 | .94 | ||||||||||||
Class 4 – assumed 5% return | 1,000.00 | 1,020.13 | 4.71 | .94 | ||||||||||||
Ultra-Short Bond Fund | ||||||||||||||||
Class 1 – actual return | $1,000.00 | $1,002.66 | $1.69 | .34 | % | |||||||||||
Class 1 – assumed 5% return | 1,000.00 | 1,023.11 | 1.71 | .34 | ||||||||||||
Class 1A – actual return2 | 1,000.00 | 1,002.66 | 1.58 | .33 | ||||||||||||
Class 1A – assumed 5% return2 | 1,000.00 | 1,023.16 | 1.66 | .33 | ||||||||||||
Class 2 – actual return | 1,000.00 | 1,000.91 | 2.93 | .59 | ||||||||||||
Class 2 – assumed 5% return | 1,000.00 | 1,021.87 | 2.96 | .59 | ||||||||||||
Class 3 – actual return | 1,000.00 | 1,001.80 | 2.58 | .52 | ||||||||||||
Class 3 – assumed 5% return | 1,000.00 | 1,022.22 | 2.61 | .52 | ||||||||||||
Class 4 – actual return | 1,000.00 | 1,000.00 | 4.17 | .84 | ||||||||||||
Class 4 – assumed 5% return | 1,000.00 | 1,020.63 | 4.21 | .84 | ||||||||||||
U.S. Government/AAA-Rated Securities Fund | ||||||||||||||||
Class 1 – actual return | $1,000.00 | $1,018.67 | $1.75 | .35 | % | |||||||||||
Class 1 – assumed 5% return | 1,000.00 | 1,023.06 | 1.76 | .35 | ||||||||||||
Class 1A – actual return2 | 1,000.00 | 1,018.67 | 2.47 | .51 | ||||||||||||
Class 1A – assumed 5% return2 | 1,000.00 | 1,022.27 | 2.56 | .51 | ||||||||||||
Class 2 – actual return | 1,000.00 | 1,017.59 | 3.00 | .60 | ||||||||||||
Class 2 – assumed 5% return | 1,000.00 | 1,021.82 | 3.01 | .60 | ||||||||||||
Class 3 – actual return | 1,000.00 | 1,018.30 | 2.65 | .53 | ||||||||||||
Class 3 – assumed 5% return | 1,000.00 | 1,022.17 | 2.66 | .53 | ||||||||||||
Class 4 – actual return | 1,000.00 | 1,016.22 | 4.25 | .85 | ||||||||||||
Class 4 – assumed 5% return | 1,000.00 | 1,020.58 | 4.26 | .85 | ||||||||||||
| 204 | American Funds Insurance Series |
| Beginning account value 1/1/2017 | Ending account value 6/30/2017 | Expenses paid during period1,3 | Annualized expense ratio3 | Effective expenses paid during period4 | Effective annualized expense ratio5 | |||||||||||||||||||
Managed Risk Growth Fund | ||||||||||||||||||||||||
Class P1 – actual return | $1,000.00 | $1,141.01 | $1.91 | .36 | % | $3.72 | .70 | % | ||||||||||||||||
Class P1 – assumed 5% return | 1,000.00 | 1,023.01 | 1.81 | .36 | 3.51 | .70 | ||||||||||||||||||
Class P2 – actual return | 1,000.00 | 1,139.10 | 3.34 | .63 | 5.14 | .97 | ||||||||||||||||||
Class P2 – assumed 5% return | 1,000.00 | 1,021.67 | 3.16 | .63 | 4.86 | .97 | ||||||||||||||||||
Managed Risk International Fund | ||||||||||||||||||||||||
Class P1 – actual return | $1,000.00 | $1,168.73 | $1.18 | .22 | % | $3.93 | .73 | % | ||||||||||||||||
Class P1 – assumed 5% return | 1,000.00 | 1,023.70 | 1.10 | .22 | 3.66 | .73 | ||||||||||||||||||
Class P2 – actual return | 1,000.00 | 1,165.74 | 3.38 | .63 | 6.12 | 1.14 | ||||||||||||||||||
Class P2 – assumed 5% return | 1,000.00 | 1,021.67 | 3.16 | .63 | 5.71 | 1.14 | ||||||||||||||||||
Managed Risk Blue Chip Income and Growth Fund |
| |||||||||||||||||||||||
Class P1 – actual return | $1,000.00 | $1,053.66 | $1.32 | .26 | % | $3.36 | .66 | % | ||||||||||||||||
Class P1 – assumed 5% return | 1,000.00 | 1,023.51 | 1.30 | .26 | 3.31 | .66 | ||||||||||||||||||
Class P2 – actual return | 1,000.00 | 1,051.08 | 3.20 | .63 | 5.24 | 1.03 | ||||||||||||||||||
Class P2 – assumed 5% return | 1,000.00 | 1,021.67 | 3.16 | .63 | 5.16 | 1.03 | ||||||||||||||||||
Managed Risk Growth-Income Fund |
| |||||||||||||||||||||||
Class P1 – actual return | $1,000.00 | $1,091.07 | $1.92 | .37 | % | $3.37 | .65 | % | ||||||||||||||||
Class P1 – assumed 5% return | 1,000.00 | 1,022.96 | 1.86 | .37 | 3.26 | .65 | ||||||||||||||||||
Class P2 – actual return | 1,000.00 | 1,091.03 | 3.27 | .63 | 4.72 | .91 | ||||||||||||||||||
Class P2 – assumed 5% return | 1,000.00 | 1,021.67 | 3.16 | .63 | 4.56 | .91 | ||||||||||||||||||
Managed Risk Asset Allocation Fund |
| |||||||||||||||||||||||
Class P1 – actual return | $1,000.00 | $1,075.26 | $1.96 | .38 | % | $3.40 | .66 | % | ||||||||||||||||
Class P1 – assumed 5% return | 1,000.00 | 1,022.91 | 1.91 | .38 | 3.31 | .66 | ||||||||||||||||||
Class P2 – actual return | 1,000.00 | 1,074.33 | 3.24 | .63 | 4.68 | .91 | ||||||||||||||||||
Class P2 – assumed 5% return | 1,000.00 | 1,021.67 | 3.16 | .63 | 4.56 | .91 | ||||||||||||||||||
| 1 | The “expenses paid during period” are equal to the “annualized expense ratio,” multiplied by the average account value over the period, multiplied by the number of days in the period, and divided by 365 (to reflect the one-half year period). |
| 2 | The period for the “annualized expense ratio” and “actual return” line is based on the number of days since the initial sale of the share class on January 6, 2017. The “assumed 5% return” line is based on 181 days. |
| 3 | The “expenses paid during period” and “annualized expense ratio” do not include the expenses of the underlying funds in which each fund invests. |
| 4 | The “effective expenses paid during period” are equal to the “effective annualized expense ratio,” multiplied by the average account value over the period, multiplied by the number of days in the period, and divided by 365 (to reflect the period). |
| 5 | The “effective annualized expense ratio” reflects the net annualized expense ratio of the class plus the class’s pro-rata share of the weighted average expense ratio of the underlying funds in which it invests. |
| American Funds Insurance Series | 205 |
This page was intentionally left blank.
| 206 | American Funds Insurance Series |
This page was intentionally left blank.
| American Funds Insurance Series | 207 |
Offices of the series and of the investment adviser
Capital Research and Management Company
333 South Hope Street
Los Angeles, CA 90071-1406
6455 Irvine Center Drive
Irvine, CA 92618-4518
Investment subadviser
Milliman Financial Risk Management LLC
(Managed Risk Funds only)
71 South Wacker Drive, 31st Floor
Chicago, IL 60606
Custodians of assets
State Street Bank and Trust Company
One Lincoln Street
Boston, MA 02111
Bank of New York Mellon
(Managed Risk Funds only)
One Wall Street
New York, NY 10286
Counsel
Morgan, Lewis & Bockius LLP
300 South Grand Avenue, 22nd Floor
Los Angeles, CA 90071-3132
Independent registered public accounting firm
PricewaterhouseCoopers LLP
601 South Figueroa Street
Los Angeles, CA 90017-3874
| 208 | American Funds Insurance Series |
Investors should carefully consider investment objectives, risks, charges and expenses. This and other important information is contained in the series prospectuses and summary prospectuses, which can be obtained from your financial professional and should be read carefully before investing. You may also call American Funds Service Company (AFS) at (800) 421-4225 or visit the American Funds website at americanfunds.com. Securities offered through American Funds Distributors, Inc.
“American Funds Proxy Voting Procedures and Principles” – which describes how we vote proxies relating to portfolio securities – is available on the American Funds website or upon request by calling AFS. The series files its proxy voting record with the U.S. Securities and Exchange Commission (SEC) for the 12 months ended June 30 by August 31. The proxy voting record is available free of charge on the SEC website at sec.gov and on the American Funds website.
Complete June 30, 2017, portfolios of American Funds Insurance Series’ investments are available free of charge by calling AFS or visiting the SEC website (where they are part of Form N-CSR).
American Funds Insurance Series files a complete list of its portfolio holdings with the SEC for the first and third quarters of each fiscal year on Form N-Q. This filing is available free of charge on the SEC website. You may also review or, for a fee, copy this filing at the SEC’s Public Reference Room in Washington, D.C. Additional information regarding the operation of the Public Reference Room may be obtained by calling the SEC’s Office of Investor Education and Advocacy at (800) SEC-0330. Additionally, the list of portfolio holdings is available by calling AFS.
This report is for the information of American Funds Insurance Series investors, but it also may be used as sales literature when preceded or accompanied by the current prospectuses or summary prospectuses for American Funds Insurance Series and the prospectus for the applicable insurance contract, which give details about charges, expenses, investment objectives and operating policies of the series. If used as sales material after September 30, 2017, this report must be accompanied by a statistical update for the most recently completed calendar quarter.
Fund attribution data was produced using FactSet, a third-party software system, based on daily portfolios. Securities in their initial period of acquisition may not be included in this analysis. The analysis includes equity investments only and excludes forward contracts and fixed income investments, if applicable. It does not account for buy-and-sell transactions that might have occurred intraday. As a result, average portfolio weight percentages are approximate and the actual average portfolio weight percentages might be higher or lower. Data elements, such as pricing, income, market cap, etc., were provided by FactSet. The indexes provided for attribution are based on FactSet’s methodology. The indexes are broad-based market benchmarks and may not be used by Capital Group® as the sole comparative index for the funds. Capital Group believes the software and information from FactSet to be reliable. However, Capital Group cannot be responsible for inaccuracies, incomplete information or updating of information by FactSet.
Futures contracts may not provide an effective hedge of the underlying securities because changes in the prices of futures contracts may not track those of the securities they are intended to hedge. In addition, the managed risk strategy may not effectively protect the fund from market declines and will limit the fund’s participation in market gains. The use of the managed risk strategy could cause the fund’s return to lag that of the underlying fund in certain rising market conditions.
Bloomberg® is a trademark and service mark of Bloomberg Finance L.P. (collectively with its affiliates, “Bloomberg”). Barclays® is a trademark and service mark of Barclays Bank Plc (collectively with its affiliates, “Barclays”), used under license. Bloomberg or Bloomberg’s licensors, including Barclays, own all proprietary rights in the Bloomberg Barclays Indices. Neither Bloomberg nor Barclays approve or endorse this material, or guarantees the accuracy or completeness of any information herein, or makes any warranty, express or implied, as to the results to be obtained therefrom and, to the maximum extent allowed by law, neither shall have any liability or responsibility for injury or damages arising in connection therewith. MSCI has not approved, reviewed or produced this report, makes no express or implied warranties or representations and is not liable whatsoever for any data in the report. You may not redistribute the MSCI data or use it as a basis for other indices or investment products. The S&P 500 is a product of S&P Dow Jones Indices LLC and/or its affiliates and has been licensed for use by Capital Group. Copyright © 2017 S&P Dow Jones Indices LLC, a division of S&P Global, and/or its affiliates. All rights reserved. Redistribution or reproduction in whole or in part is prohibited without written permission of S&P Dow Jones Indices LLC.
American Funds from Capital Group
The Capital AdvantageSM
Since 1931, American Funds, part of Capital Group, has helped investors pursue long-term investment success. Our consistent approach – in combination with The Capital SystemSM – has resulted in a superior long-term track record for American Funds Insurance Series®.
Aligned with investor success | The Capital System | Superior long-term track record | ||
We base our decisions on a long-term perspective, which we believe aligns our goals with the interests of our clients. American Funds Insurance Series (AFIS) portfolio managers average 27 years of investment experience, including 22 years at our company, reflecting a career commitment to our long-term approach.1 | The Capital System combines individual accountability with teamwork. Funds using The Capital System are divided into portions that are managed independently by investment professionals with diverse backgrounds, ages and investment approaches. An extensive global research effort is the backbone of our system. | AFIS equity funds have beaten their comparable Lipper indexes in 89% of 10-year periods and 100% of 20-year periods. AFIS fixed income funds have beaten comparable Lipper indexes in 52% of 10-year periods and 81% of 20-year periods.2 We strive to keep management fees competitive. Over the past 20 years, most funds’ fees have been below industry averages.3 | ||
| 1 | Portfolio manager experience as of the American Funds Insurance Series prospectus dated May 1, 2017. |
| 2 | Based on Class 2 share results for rolling periods through December 31, 2016. Periods covered are the shorter of the fund’s lifetime or since the comparable Lipper index inception date. The comparable Lipper indexes are: Global Funds Index (Global Growth Fund), Growth Funds Index (Growth Fund), International Funds Index (International Fund), Emerging Markets Funds Index (New World Fund), Growth & Income Funds Index (Blue Chip Income and Growth Fund, Growth-Income Fund), Balanced Funds Index (Asset Allocation Fund), Core Bond Funds Index (Bond Fund), High Yield Funds Index (High-Income Bond Fund) and General U.S. Government Funds Index (U.S. Government/AAA-Rated Securities Fund). The Lipper Global Small-/Mid-Cap Funds Average was used for Global Small Capitalization Fund. |
| 3 | Based on management fees for the 20-year period ended December 31, 2016, versus comparable Lipper categories, excluding funds of funds. |
| Lit. No. INGESRX-998-0817P |
Item 2. Code of Ethics.
Not applicable to this semi-annual filing.
Item 3. Audit Committee Financial Expert.
Not applicable to this semi-annual filing.
Item 4. Principal Accountant Fees and Services.
Not applicable to this semi-annual filing.
Item 5. Audit Committee of Listed Registrants
Not applicable to this semi-annual filing.
Item 6. Investments.
| (a) | The Schedule of Investments in securities of unaffiliated issuers as of the close of the reporting period is included as part of the annual report filed under Item 1 of this form. |
| (b) | Not applicable. |
Item 7. Disclosure of Proxy Voting Policies and Procedures for Closed-End Management Investment Companies.
Not applicable.
Item 8. Portfolio Managers of Closed-End Management Investment Companies.
Not applicable.
Item 9. Purchases of Equity Securities by Closed-End Management Investment Company and Affiliated Purchasers.
Not applicable.
Item 10. Submission of Matters to a Vote of Security Holders.
Not applicable.
Item 11. Controls and Procedures.
| (a) | The registrant’s principal executive and principal financial officers, or persons performing similar functions, have concluded that the registrant’s disclosure controls and procedures (as defined in Rule 30a-3(c) under the Investment Company Act of 1940, as amended (the “1940 Act”) (17 CFR 270.30a-3(c))) are generally effective to provide reasonable assurance, as of a date within 90 days of the filing date of the report that includes the disclosure required by this paragraph, based on their evaluation of these controls and procedures required by Rule 30a-3(b) under the 1940 Act (17 CFR 270.30a-3(b)) and Rules 13a-15(b) or 15d-15(b) under the Securities Exchange Act of 1934, as amended (17 CFR 240.13a-15(b) or 240.15d-15(b)). |
| (b) | The registrant did not experience a change in internal control over financial reporting. |
Item 12. Exhibits.
(a) | (1) Not applicable to this semi-annual filing. | |||
(2) Separate certifications for each principal executive officer and principal financial officer of the registrant as required by Rule 30a-2(a) under the Investment Company Act of 1940 (17 CFR 270.30a-2(a)). | ||||
(3) Not applicable | ||||
(b) | Certifications pursuant to Rule 30a-2(b) under the 1940 Act and Section 906 of the Sarbanes-Oxley Act of 2002. |
SIGNATURES
Pursuant to the requirements of the Securities Exchange Act of 1934 and the Investment Company Act of 1940, the registrant has duly caused this report to be signed on its behalf by the undersigned, thereunto duly authorized.
HIMCO Variable Insurance Trust
By: | /s/ Matthew Poznar | |||
Matthew Poznar | ||||
President | ||||
August 11, 2017 |
Pursuant to the requirements of the Securities Exchange Act of 1934 and the Investment Company Act of 1940, this report has been signed below by the following persons on behalf of the registrant and in the capacities and on the dates indicated.
HIMCO Variable Insurance Trust
By: | /s/ Matthew Poznar | |||
Matthew Poznar | ||||
President | ||||
August 11, 2017 | ||||
By: | /s/ Peter Sannizzaro | |||
Peter Sannizzaro | ||||
Treasurer | ||||
August 11, 2017 | ||||