| FREE WRITING PROSPECTUS | ||
| FILED PURSUANT TO RULE 433 | ||
| REGISTRATION FILE NO.: 333-206582-06 | ||
 |  |  |
| MORGAN STANLEY Co-Lead Bookrunning Manager | BofA Merrill Lynch Co-Lead Bookrunning Manager | UBS Securities LLC Co-Lead Bookrunning Manager |
| Natixis Securities Americas LLC | Academy Securities Co-Manager
| Citigroup |
STATEMENT REGARDING THIS FREE WRITING PROSPECTUS
The depositor has filed a registration statement (including a prospectus) with the SEC (File No. 333-206582) for the offering to which this communication relates. Before you invest, you should read the prospectus in that registration statement and other documents the depositor has filed with the SEC for more complete information about the depositor, the issuing entity and this offering. You may get these documents for free by visiting EDGAR on the SEC web site atwww.sec.gov. Alternatively, the depositor or any underwriter or any dealer participating in the offering will arrange to send you the prospectus if you request it by calling toll free 1-866-718-1649 or by email toprospectus@ms.com.
This is not a research report and was not prepared by any Underwriter’s research department. It was prepared by the Underwriters’ sales, trading, banking or other non-research personnel. Please see additional important information and qualifications at the end of this Term Sheet.
Neither this Term Sheet nor anything contained herein shall form the basis for any contract or commitment whatsoever.The information contained herein is preliminary as of the date hereof.This Term Sheet is subject to change, completion or amendment from time to time.The information contained herein will be superseded by similar information delivered to you as part of the Preliminary Prospectus.The information contained herein supersedes any such information previously delivered.The information contained herein should be reviewed only in conjunction with the entire Preliminary Prospectus.All of the information contained herein is subject to the same limitations and qualifications contained in the Preliminary Prospectus.The information contained herein does not contain all relevant information relating to the underlying mortgage loans or mortgaged properties.Such information is described in the Preliminary Prospectus.The information contained herein will be more fully described in the Preliminary Prospectus.The information contained herein should not be viewed as projections, forecasts, predictions or opinions with respect to value.Prior to making any investment decision, prospective investors are strongly urged to read the Preliminary Prospectus in its entirety.Neither the Securities and Exchange Commission nor any state securities commission has approved or disapproved of these securities or determined if this Term Sheet is truthful or complete.Any representation to the contrary is a criminal offense.
IMPORTANT NOTICE RELATING TO AUTOMATICALLY GENERATED EMAIL DISCLAIMERS
Any legends, disclaimers or other notices that may appear at the bottom of, or attached to, the email communication to which this Term Sheet may have been attached are not applicable to this Term Sheet and should be disregarded. Such legends, disclaimers or other notices have been automatically generated as a result of this Term Sheet having been sent via Bloomberg or another email system.
IMPORTANT NOTICE REGARDING THE CONDITIONS FOR THIS OFFERING OF ASSET-BACKED SECURITIES
THE ASSET-BACKED SECURITIES REFERRED TO IN THIS TERM SHEET ARE BEING OFFERED WHEN, AS AND IF ISSUED. IN PARTICULAR, YOU ARE ADVISED THAT THE ASSET-BACKED SECURITIES, AND THE ASSET POOL BACKING THEM, ARE SUBJECT TO MODIFICATION OR REVISION (INCLUDING, AMONG OTHER THINGS, THE POSSIBILITY THAT ONE OR MORE CLASSES OF SECURITIES MAY BE SPLIT, COMBINED OR ELIMINATED), AT ANY TIME PRIOR TO ISSUANCE OR AVAILABILITY OF A FINAL PROSPECTUS. AS A RESULT, YOU MAY COMMIT TO PURCHASE SECURITIES THAT HAVE CHARACTERISTICS THAT MAY CHANGE, AND YOU ARE ADVISED THAT ALL OR A PORTION OF THE SECURITIES MAY NOT BE ISSUED THAT HAVE THE CHARACTERISTICS DESCRIBED IN THIS TERM SHEET. OUR OBLIGATION TO SELL SECURITIES TO YOU IS CONDITIONED ON THE SECURITIES AND THE UNDERLYING TRANSACTION HAVING THE CHARACTERISTICS DESCRIBED IN THIS TERM SHEET. IF WE DETERMINE THAT THE FOREGOING CONDITION IS NOT SATISFIED IN ANY MATERIAL RESPECT, WE WILL NOTIFY YOU, AND NEITHER THE ISSUING ENTITY NOR ANY UNDERWRITER WILL HAVE ANY OBLIGATION TO YOU TO DELIVER ALL OR ANY PORTION OF THE SECURITIES WHICH YOU HAVE COMMITTED TO PURCHASE, AND THERE WILL BE NO LIABILITY BETWEEN US AS A CONSEQUENCE OF THE NON-DELIVERY.
This is not a research report and was not prepared by any Underwriter’s research department. Please see additional important information and qualifications at the end of this Term Sheet.
T-2
| MSC 2016-UBS12 | Structural Overview |
Offered Certificates
| Class | Expected Ratings (Fitch/KBRA/Moody’s)(1) | Approximate Initial Certificate Principal Balance or Notional Amount(2) | Approximate Initial Credit Support(3) | Pass-Through Rate Description | Expected Weighted Average Life (Years)(4) | Principal Window (Months)(4) | Certificate Principal UW NOI Debt Yield(5) | Certificate Principal to Value Ratio(6) |
| Class A-1 | AAAsf/AAA(sf)/Aaa(sf) | $38,800,000 | 30.000% | (7) | 2.62 | 1 – 57 | 15.1% | 43.3% |
| Class A-2 | AAAsf/AAA(sf)/Aaa(sf) | $54,700,000 | 30.000% | (7) | 4.88 | 57 – 59 | 15.1% | 43.3% |
| Class A-SB | AAAsf/AAA(sf)/Aaa(sf) | $56,000,000 | 30.000% | (7) | 7.47 | 59 – 117 | 15.1% | 43.3% |
| Class A-3 | AAAsf/AAA(sf)/Aaa(sf) | $190,000,000 | 30.000% | (7) | 9.84 | 117 – 119 | 15.1% | 43.3% |
| Class A-4 | AAAsf/AAA(sf)/Aaa(sf) | $237,609,000 | 30.000% | (7) | 9.94 | 119 – 119 | 15.1% | 43.3% |
| Class X-A | AAAsf/AAA(sf)/Aaa(sf) | $577,109,000(8) | N/A | Variable IO(9) | N/A | N/A | N/A | N/A |
| Class X-B | A-sf/AAA(sf)/NR | $132,941,000(8) | N/A | Variable IO(9) | N/A | N/A | N/A | N/A |
| Class A-S | AAAsf/AAA(sf)/Aa3(sf) | $50,497,000 | 23.875% | (7) | 9.94 | 119 – 119 | 13.9% | 47.0% |
| Class B | AA-sf/AA+(sf)/NR | $40,191,000 | 19.000% | (7) | 9.94 | 119 – 119 | 13.1% | 50.1% |
| Class C | A-sf/A(sf)/NR | $42,253,000 | 13.875% | (7) | 9.94 | 119 – 119 | 12.3% | 53.2% |
Privately Offered Certificates(10)
| Class | Expected Ratings (Fitch/KBRA/Moody’s)(1) | Approximate Initial Certificate Principal Balance or Notional Amount(2) | Approximate Initial Credit Support(3) | Pass-Through Rate Description | Expected Weighted Average Life (Years)(4) | Principal Window (Months)(4) | Certificate Principal UW NOI Debt Yield(5) | Certificate Principal to Value Ratio(6) |
| Class X-D | BBB-sf/BBB(sf)/NR | $49,466,000(8) | N/A | Variable IO(9) | N/A | N/A | N/A | N/A |
| Class X-E | BB-sf/BB(sf)/NR | $23,703,000(8) | N/A | Variable IO(9) | N/A | N/A | N/A | N/A |
| Class X-F | B-sf/B(sf)/NR | $10,306,000(8) | N/A | Variable IO(9) | N/A | N/A | N/A | N/A |
| Class X-G | NR/NR/NR | $30,916,736(8) | N/A | Variable IO(9) | N/A | N/A | N/A | N/A |
| Class D | BBB-sf/BBB(sf)/NR | $49,466,000 | 7.875% | (7) | 9.94 | 119 – 119 | 11.5% | 56.9% |
| Class E | BB-sf/BB(sf)/NR | $23,703,000 | 5.000% | (7) | 9.94 | 119 – 119 | 11.2% | 58.7% |
| Class F | B-sf/B(sf)/NR | $10,306,000 | 3.750% | (7) | 9.94 | 119 – 119 | 11.0% | 59.5% |
| Class G | NR/NR/NR | $30,916,736 | 0.000% | (7) | 9.98 | 119 – 120 | 10.6% | 61.8% |
| (1) | Ratings shown are those of Fitch Ratings, Inc. (“Fitch”), Kroll Bond Rating Agency, Inc.(“KBRA”) and Moody’s Investors Service, Inc. (“Moody’s”). Certain nationally recognized statistical rating organizations that were not hired by the depositor may use information they receive pursuant to Rule 17g-5 under the Securities Exchange Act of 1934, as amended, or otherwise to rate the certificates. There can be no assurance as to what ratings a non-hired nationally recognized statistical rating organization would assign. See “Risk Factors—Other Risks Relating to the Certificates—Nationally Recognized Statistical Rating Organizations May Assign Different Ratings to the Certificates; Ratings of the Certificates Reflect Only the Views of the Applicable Rating Agencies as of the Dates Such Ratings Were Issued; Ratings May Affect ERISA Eligibility; Ratings May Be Downgraded” and “Ratings” in the Preliminary Prospectus, expected to be dated November 14, 2016 (the “Preliminary Prospectus”). Capitalized terms used but not defined herein have the meanings assigned to such terms in the Preliminary Prospectus. |
| (2) | Approximate, subject to a permitted variance of plus or minus 5%. In addition, the notional amounts of the Class X-A, Class X-B, Class X-D, Class X-E, Class X-F and Class X-G certificates may vary depending upon the final pricing of the classes of principal balance certificates whose certificate balances comprise such notional amounts, and, if as a result of such pricing the pass-through rate of any class of the Class X-A, Class X-B, Class X-D, Class X-E, Class X-F or Class X-G certificates, as applicable, would be equal to zero at all times, such class of certificates will not be issued on the closing date of this securitization. |
| (3) | The approximate initial credit support percentages set forth for the certificates are approximate and, for the Class A-1, Class A-2, Class A-SB, Class A-3 and Class A-4 certificates, are represented in the aggregate. |
| (4) | The Expected Weighted Average Life and Principal Window during which distributions of principal would be received as set forth in the foregoing table with respect to each class of certificates having a certificate balance are based on the assumptions set forth under “Yield and Maturity Considerations—Weighted Average Life” in the Preliminary Prospectus and on the assumptions that there are no prepayments, modifications or losses in respect of the mortgage loans and that there are no extensions or forbearances of maturity dates or anticipated repayment dates of the mortgage loans. |
| (5) | Certificate Principal UW NOI Debt Yield for any class of principal balance certificates is calculated as the product of (a) the weighted average UW NOI Debt Yield for the mortgage pool, multiplied by (b) a fraction, the numerator of which is the total initial certificate balance of all the principal balance certificates, and the denominator of which is the total initial certificate balance of the subject class of principal balance certificates and all other classes of principal balance certificates, if any, that are senior to such class. The Certificate Principal UW NOI Debt Yields of the Class A-1, Class A-2, Class A-SB, Class A-3 and Class A-4 certificates are calculated in the aggregate for those classes as if they were a single class. |
| (6) | Certificate Principal to Value Ratio for any class of principal balance certificates is calculated as the product of (a) the weighted average Cut-off Date LTV Ratio of the mortgage pool, multiplied by (b) a fraction, the numerator of which is the total initial certificate balance of the subject class of principal balance certificates and all other classes of principal balance certificates, if any, that are senior to such class, and the denominator of which is the total initial certificate balance of all the principal balance certificates. The Certificate Principal to Value Ratios of the Class A-1, Class A-2, Class A-SB, Class A-3 and Class A-4 certificates are calculated in the aggregate for those classes as if they were a single class. |
This is not a research report and was not prepared by any Underwriter’s research department. Please see additional important information and qualifications at the end of this Term Sheet.
T-3
| MSC 2016-UBS12 | Structural Overview |
| (7) | The pass-through rate for each class of the Class A-1, Class A-2, Class A-SB, Class A-3, Class A-4, Class A-S, Class B, Class C, Class D, Class E, Class F and Class G certificates (collectively referred to as the “principal balance certificates”) will be one of the following: (i) a fixed rateper annum, (ii) a variable rateper annum equal to the weighted average of the net mortgage interest rates on the mortgage loans for the related distribution date, (iii) a variable rateper annum equal to the lesser of (a) a fixed rate and (b) the weighted average of the net mortgage interest rates on the mortgage loans for the related distribution date or (iv) a variable rateper annum equal to the weighted average of the net mortgage interest rates on the mortgage loans for the related distribution date minus a specified percentage. For purposes of the calculation of the weighted average of the net mortgage interest rates on the mortgage loans for each distribution date, the net mortgage interest rates will be adjusted as necessary to a 30/360 basis. |
| (8) | The Class X-A, Class X-B, Class X-D, Class X-E, Class X-F and Class X-G certificates (collectively referred to as the “Class X certificates”) are notional amount certificates and will not be entitled to distributions of principal. The notional amount of the Class X-A certificates will be equal to the aggregate certificate balance of the Class A-1, Class A-2, Class A-SB, Class A-3 and Class A-4 certificates. The notional amount of the Class X-B certificates will be equal to the aggregate certificate balance of the Class A-S, Class B and Class C certificates. The notional amount of each class of the Class X-D, Class X-E, Class X-F and Class X-G certificates will be equal to the outstanding certificate balance of the class of principal balance certificates that, with the addition of “X-,” has the same alphabetical designation as the subject class of Class X certificates. |
| (9) | The pass-through rate for the Class X-A certificates for any distribution date will be aper annum rate equal to the excess, if any, of (a) the weighted average of the net mortgage interest rates on the mortgage loans for the related distribution date, over (b) the weighted average of the pass-through rates on the Class A-1, Class A-2, Class A-SB, Class A-3 and Class A-4 certificates for the related distribution date, weighted on the basis of their respective certificate balances outstanding immediately prior to that distribution date. The pass-through rate for the Class X-B certificates for any distribution date will be aper annum rate equal to the excess, if any, of (a) the weighted average of the net mortgage interest rates on the mortgage loans for the related distribution date, over (b) the weighted average of the pass-through rates on the Class A-S, Class B and Class C certificates for the related distribution date, weighted on the basis of their respective certificate balances outstanding immediately prior to that distribution date. The pass-through rate for each class of the Class X-D, Class X-E, Class X-F and Class X-G certificates for any distribution date will be aper annum rate equal to the excess, if any, of (a) the weighted average of the net mortgage interest rates on the mortgage loans for the related distribution date, over (b) the pass-through rate for the related distribution date of the class of principal balance certificates that, with the addition of “X-,” has the same alphabetical designation as the subject class of Class X certificates. For purposes of the calculation of the weighted average of the net mortgage interest rates on the mortgage loans for each distribution date, the net mortgage interest rates will be adjusted as necessary to a 30/360 basis. |
| (10) | Not offered pursuant to the Preliminary Prospectus or this Term Sheet. Information provided in this Term Sheet regarding the characteristics of these certificates is provided only to enhance your understanding of the offered certificates. The privately offered certificates also include the Class V and Class R certificates, which do not have a certificate balance, notional amount, pass-through rate, rating or rated final distribution date, and which are not shown in the chart. The Class V certificates represent a beneficial ownership interest held through the grantor trust in certain excess interest in respect of mortgage loans having anticipated repayment dates, if any. The Class R certificates represent the beneficial ownership of the residual interest in each of the real estate mortgage investment conduits, as further described in the Preliminary Prospectus. |
This is not a research report and was not prepared by any Underwriter’s research department. Please see additional important information and qualifications at the end of this Term Sheet.
T-4
| MSC 2016-UBS12 | Structural Overview |
Issue Characteristics
| Offered Certificates: | $710,050,000 (approximate) monthly pay, multi-class, commercial mortgage pass-through certificates, consisting of eight principal balance classes (Class A-1, Class A-2, Class A-SB, Class A-3, Class A-4, Class A-S, Class B and Class C) and two interest-only classes (Class X-A and Class X-B) |
| Co-Lead Bookrunning Managers: | Morgan Stanley & Co. LLC, UBS Securities LLC and Merrill Lynch, Pierce, Fenner & Smith Incorporated |
| Co-Managers: | Natixis Securities Americas LLC, Citigroup Global Markets Inc. and Academy Securities, Inc. |
| Mortgage Loan Sellers: | UBS AG, New York Branch, Morgan Stanley Mortgage Capital Holdings LLC, Bank of America, National Association and Natixis Real Estate Capital LLC |
| Rating Agencies: | Fitch Ratings, Inc., Kroll Bond Rating Agency, Inc. and Moody’s Investors Service, Inc. |
| Master Servicer: | Midland Loan Services, a Division of PNC Bank, National Association |
| Special Servicer: | Rialto Capital Advisors, LLC |
| Trustee/Certificate Administrator/ Certificate Registrar/Custodian: | Wells Fargo Bank, National Association |
| Operating Advisor: | Park Bridge Lender Services LLC |
| Asset Representations Reviewer: | Park Bridge Lender Services LLC |
| Initial Directing Certificateholder: | RREF III Debt AIV, LP or another affiliate of Rialto Capital Advisors, LLC |
| Cut-off Date: | The mortgage loans will be considered part of the trust fund as of their respective cut-off dates. The cut-off date with respect to each mortgage loan is the respective due date for the monthly debt service payment that is due in December 2016 (or, in the case of any mortgage loan that has its first due date after December 2016, the date that would have been its due date in December 2016 under the terms of that mortgage loan if a monthly debt service payment were scheduled to be due in that month). |
| Expected Pricing Date: | Week of November 14, 2016 |
| Expected Closing Date: | Week of December 5, 2016 |
| Determination Dates: | The 11th day of each month or, if the 11th day is not a business day, then the business day immediately following such 11th day. |
| Distribution Dates: | The 4th business day following each determination date. The first distribution date will be in January 2017. |
| Rated Final Distribution Date: | The distribution date in December 2049 |
| Interest Accrual Period: | Preceding calendar month |
| Payment Structure: | Sequential pay |
| Tax Treatment: | REMIC |
| Optional Termination: | 1.00% clean-up call |
| Minimum Denominations: | $10,000 for each class of Offered Certificates (other than Class X-A and Class X-B certificates); $1,000,000 for the Class X-A and Class X-B certificates |
| Settlement Terms: | DTC, Euroclear and Clearstream |
| Legal/Regulatory Status: | Each class of Offered Certificates is expected to be eligible for exemptive relief under ERISA. No class of Offered Certificates is SMMEA eligible. |
| Analytics: | The certificate administrator is expected to make available all distribution date statements, CREFC® reports and supplemental notices received by it to certain modeling financial services as described in the Preliminary Prospectus. |
| Bloomberg Ticker: | MSC 2016-UB12<MTGE><GO> |
| Risk Factors: | THE CERTIFICATES INVOLVE CERTAIN RISKS AND MAY NOT BE SUITABLE FOR ALL INVESTORS. SEE THE “RISK FACTORS” SECTION OF THE PRELIMINARY PROSPECTUS. |
This is not a research report and was not prepared by any Underwriter’s research department. Please see additional important information and qualifications at the end of this Term Sheet.
T-5
| MSC 2016-UBS12 | Structural Overview |
Structural Overview
| Accrual: | Each class of Offered Certificates will accrue interest on a 30/360 basis. |
| Amount and Order of Distributions: | On each distribution date, funds available for distribution from the mortgage loans, net of (i) specified expenses of the issuing entity, including fees payable to, and costs and expenses reimbursable to, the master servicer, any primary servicer, the special servicer, the certificate administrator, the trustee, the operating advisor, the asset representations reviewer and CREFC®, (ii) any yield maintenance charges and prepayment premiums and (iii) any excess interest distributable to the Class V certificates, will be distributed in the following amounts and order of priority:
First, to the Class A-1, Class A-2, Class A-SB, Class A-3, Class A-4, Class X-A, Class X-B, Class X-D, Class X-E, Class X-F and Class X-G certificates, in respect of interest, up to an amount equal to, andpro rata in accordance with, the interest entitlements for those classes;
Second, to the Class A-1, Class A-2, Class A-SB, Class A-3 and Class A-4 certificates as follows, to the extent of funds allocated to principal and available for distribution: either (i)(a)first, to principal on the Class A-SB certificates, until the certificate balance of the Class A-SB certificates is reduced to the planned principal balance for the related distribution date set forth in Annex E to the Preliminary Prospectus, and (b)second, to principal on each class of the Class A-1, Class A-2, Class A-3, Class A-4 and Class A-SB certificates, in that order, in each case until the certificate balance of such class of certificates has been reduced to zero, or (ii) if the certificate balance of each class of principal balance certificates other than the Class A-1, Class A-2, Class A-SB, Class A-3 and Class A-4 certificates has been reduced to zero as a result of the allocation of losses on the mortgage loans to those certificates, to principal on the Class A-1, Class A-2, Class A-SB, Class A-3 and Class A-4 certificates,pro rata, without regard to the distribution priorities described above or the planned principal balance of the Class A-SB certificates;
Third, to the Class A-1, Class A-2, Class A-SB, Class A-3 and Class A-4 certificates: (a)first, up to an amount equal to, andpro rata based on, any previously unreimbursed losses on the mortgage loans allocable to principal that were previously borne by each such class, and (b)second, up to an amount equal to, andpro rata based on, interest on such unreimbursed losses previously allocated to each such class at the pass-through rate for such class from the date the related loss was allocated to such class;
Fourth, to each class of the Class A-S, Class B and Class C certificates, in that order, as follows: (a) to interest on such class of certificates in the amount of its interest entitlement; (b) to the extent of funds allocable to principal remaining after distributions in respect of principal to each class with a higher priority (as set forth in this clause or prior enumerated clauses set forth above), to principal on such class of certificates until its certificate balance has been reduced to zero; and (c) to reimburse such class of certificates,first, for any previously unreimbursed losses on the mortgage loans that were previously allocated to those certificates, andsecond, for interest on such unreimbursed losses at the pass-through rate for such class from the date the related loss was allocated to such class;
Fifth, to the non-offered certificates (other than the Class X-D, Class X-E, Class X-F, Class X-G, Class V and Class R certificates) in the amounts and order of priority described in “Description of the Certificates—Distributions” in the Preliminary Prospectus; and
Sixth, to the Class R certificates, any remaining amounts.
|
| Interest and Principal Entitlements: | The interest entitlement of each class of Offered Certificates on each distribution date generally will be the interest accrued during the related interest accrual period on the related certificate balance or notional amount at the related pass-through rate, net of any prepayment interest shortfalls allocated to that class for such distribution date as described below. If prepayment interest shortfalls arise from voluntary prepayments on serviced mortgage loans during any collection period, the master servicer is required to make a limited compensating interest payment to offset those shortfalls. See “Description of the Certificates—Prepayment Interest Shortfalls” in the Preliminary Prospectus. The remaining amount of prepayment interest shortfalls will be allocated to reduce the interest entitlement on all classes of certificates (other than the Class V and Class R certificates),pro rata, based on their respective amounts of accrued interest for the related distribution date. If a class receives less than the entirety of its interest entitlement on any distribution date, then the shortfall, excluding any shortfall due to prepayment interest shortfalls, will be added to its interest entitlement for the next succeeding distribution date.
The principal distribution amount for each distribution date generally will be the aggregate amount of principal received or advanced in respect of the mortgage loans, net of any non-recoverable advances and interest thereon and any workout-delayed reimbursement amounts that are reimbursed to the master servicer or the trustee during the related collection period. Non-recoverable advances and interest thereon are reimbursable from principal collections before reimbursement from other amounts. Workout-delayed reimbursement amounts will be reimbursable from principal collections.
|
| Special Servicer Compensation: | The principal compensation to be paid to the special servicer in respect of its special servicing activities will be the special servicing fee, the workout fee and the liquidation fee.
The special servicing fee for each distribution date is calculated at the special servicing fee rate based on the outstanding principal balance of each mortgage loan (and any related companion loan) that is serviced under the pooling and servicing agreement for this securitization (a “serviced mortgage loan” and “serviced companion loan”, respectively) that is being specially serviced or as to which the related mortgaged property has become an REO property. The special servicing fee rate will be a rate equal to the greater of 0.25%per annum and theper annum rate that would result in a special servicing fee of $3,500 for the related month. The special servicing fee will be payable monthly,first, from liquidation proceeds, insurance and condemnation |
This is not a research report and was not prepared by any Underwriter’s research department. Please see additional important information and qualifications at the end of this Term Sheet.
T-6
| MSC 2016-UBS12 | Structural Overview |
proceeds, and other collections in respect of the related specially serviced mortgage loan or REO property and,then, from general collections on all the mortgage loans and any REO properties.
The special servicer will also be entitled to (i) liquidation fees generally equal to 1.0% of liquidation proceeds and certain other collections in respect of a specially serviced mortgage loan (and any related serviced companion loan) or related REO property and of amounts received in respect of mortgage loan repurchases by the related mortgage loan sellers and (ii) workout fees generally equal to 1.0% of interest (other than post-ARD excess interest on mortgage loans with anticipated repayment dates and other than default interest) and principal payments made in respect of a rehabilitated mortgage loan (and any related serviced companion loan), in the case of each of clause (i) and (ii), subject to a cap of $1,000,000 and a floor of $25,000 with respect to any mortgage loan, whole loan or related REO property and subject to certain adjustments and exceptions as described in the Preliminary Prospectus under “Pooling and Servicing Agreement—Servicing and Other Compensation and Payment of Expenses—Special Servicer Compensation”.
With respect to any non-serviced mortgage loan, the related special servicer under the related other pooling and servicing agreement pursuant to which such mortgage loan is being serviced will be entitled to similar compensation as that described above with respect to such non-serviced mortgage loan under such other pooling and servicing agreement as further described in the Preliminary Prospectus, although any related fees may accrue at a different rate and there may be a higher (or no) cap on liquidation and workout fees.
| |
| Prepayment Premiums/Yield Maintenance Charges: | If any yield maintenance charge or prepayment premium is collected during any collection period with respect to any mortgage loan, then on the immediately succeeding distribution date, the certificate administrator will pay to the holders of each class of the Class A-1, Class A-2, Class A-SB, Class A-3, Class A-4, Class A-S, Class B, Class C and Class D certificates the product of (a) such yield maintenance charge or prepayment premium, (b) the related Base Interest Fraction for such class and the applicable principal prepayment, and (c) a fraction, the numerator of which is equal to the amount of principal distributed to such class for that distribution date, and the denominator of which is the total amount of principal distributed to all principal balance certificates (other than the Class E and the Control Eligible Certificates) for that distribution date. Any yield maintenance charge or prepayment premium that is collected during any collection period with respect to any mortgage loan and remaining after the distributions in the preceding sentence (as to the applicable distribution date, the “Class X YM Distribution Amount”) will be distributed to the holders of the Class X Certificates as follows: (1) first, to the Class X-A, Class X-B, Class X-D, Class X-E and Class X-F certificates, in each case in an amount equal to the product of (i) a fraction, the numerator of which is equal to the amount of principal distributed on the applicable distribution date with respect to the class(es) of principal balance certificates whose certificate balance(s) comprise the notional amount of the applicable class of Class X certificates, and the denominator of which is the total amount of principal distributed on the applicable distribution date with respect to the principal balance certificates, multiplied by (ii) the Class X YM Distribution Amount for the applicable distribution date, and (2) second, to the Class X-G certificates, in an amount equal to the portion of the Class X YM Distribution Amount remaining after the distributions to the holders of the Class X-A, Class X-B, Class X-D, Class X-E and Class X-F certificates. Notwithstanding any of the foregoing to the contrary, if at any time the certificate balances of the principal balance certificates (other than the Class E and the Control Eligible Certificates) have been reduced to zero as a result of the allocation of principal payments on the mortgage loans, the certificate administrator will pay to the holders of each class of principal balance certificates then entitled to distributions of principal on the related distribution date the product of (a) any yield maintenance charge or prepayment premium that is collected during any collection period with respect to any mortgage loan, (b) the related Base Interest Fraction for such class and the applicable principal prepayment and (c) a fraction, the numerator of which is equal to the amount of principal distributed to such class for that distribution date, and the denominator of which is the total amount of principal distributed to all principal balance certificates for that distribution date. Any yield maintenance charge or prepayment premium that is collected during any collection period with respect to any mortgage loan and remaining after the distributions in the preceding sentence (as to the applicable distribution date, the “Class X YM Subordinate Distribution Amount”) will be distributed to the holders of the Class X certificates as follows: (1) first, to the Class X-E and Class X-F certificates, in each case in an amount equal to the product of (i) a fraction, the numerator of which is equal to the amount of principal distributed on the applicable distribution date with respect to the class(es) of principal balance certificates whose certificate balance(s) comprise the notional amount of the applicable class of Class X certificates, and the denominator of which is the total amount of principal distributed on the applicable distribution date with respect to the principal balance certificates, multiplied by (ii) the Class X YM Subordinate Distribution Amount for the applicable distribution date, and (2) second, to the Class X-G certificates, in an amount equal to the portion of the Class X YM Subordinate Distribution Amount remaining after the distributions to the holders of the Class X-E and Class X-F certificates. “Base Interest Fraction” means, with respect to any principal prepayment of any mortgage loan that provides for the payment of a yield maintenance charge or prepayment premium, and with respect to any class of principal balance certificates, a fraction (A) the numerator of which is the greater of (x) zero and (y) the difference between (i) the pass-through rate on that class, and (ii) the applicable discount rate and (B) the denominator of which is the difference between (i) the mortgage interest rate on the related mortgage loan and (ii) the applicable discount rate; provided, that: under no circumstances will the Base Interest Fraction be greater than one; if the discount rate referred to above is greater than or equal to both the mortgage interest rate on the related mortgage loan and the pass-through rate on that class, then the Base Interest Fraction will equal zero; and if the discount rate referred to above is greater than or equal to the mortgage interest rate on the related mortgage loan and is less than the pass-through rate on that class, then the Base Interest Fraction will be equal to 1.0. |
This is not a research report and was not prepared by any Underwriter’s research department. Please see additional important information and qualifications at the end of this Term Sheet.
T-7
| MSC 2016-UBS12 | Structural Overview |
| Consistent with the foregoing, the Base Interest Fraction is equal to: | |||
| (Pass-Through Rate – Discount Rate) | |||
| (Mortgage Rate – Discount Rate) | |||
| Realized Losses: | On each distribution date, immediately following the distributions to be made to the certificateholders on that date, the certificate administrator is required to calculate the amount, if any, by which (i) the aggregate stated principal balance of the mortgage loans, including any successor REO loans expected to be outstanding immediately following that distribution date is less than (ii) the then aggregate certificate balance of the principal balance certificates after giving effect to distributions of principal on that distribution date (any such deficit, a “Realized Loss”), which amount will be applied to the Class G, Class F, Class E, Class D, Class C, Class B and Class A-S certificates, in that order, in each case until the related certificate balance has been reduced to zero, and then to the Class A-1, Class A-2, Class A-SB, Class A-3 and Class A-4 certificates,pro rata, based upon their respective certificate balances, until their respective certificate balances have been reduced to zero. |
| Serviced Whole Loans: | Each of the following mortgaged properties secures a mortgage loan and one or morepari passu promissory notes (each, a “servicedpari passu companion loan”) that will be serviced pursuant to the related intercreditor agreement and (subject to the discussion in the next paragraph) the pooling and servicing agreement for this transaction: 681 Fifth Avenue, 191 Peachtree, Wolfchase Galleria, The Orchard, The Falls, Greenwich Office Park and Federal Way Crossing I &II. With respect to each such mortgaged property, the related mortgage loan, together with the related servicedpari passu companion loan(s), is referred to herein (for so long as it is serviced under the pooling and servicing agreement for this transaction) as a “servicedpari passu whole loan.” Each servicedpari passu companion loan is not part of the mortgage pool and may be contributed to one or more future securitization transactions (if not already securitized) or may be otherwise transferred at any time, subject to compliance with the related intercreditor agreement. See the table below entitled “Mortgage Loans with Pari Passu Companion Loans” and “Description of the Mortgage Pool—The Whole Loans” in the Preliminary Prospectus, for additional information regarding each such whole loan.
With respect to the Greenwich Office Park whole loan (a “servicing shift whole loan”), the pooling and servicing agreement for this transaction will govern servicing of such whole loan until the securitization of the related control note; however, servicing of such whole loan will generally be directed by the holder of such control note (which is not included in this securitization), and such holder will have the right to replace the special servicer with respect to the related whole loan with or without cause. After the securitization of the related control note, each servicing shift whole loan will cease to be a serviced whole loan and will be serviced pursuant to the pooling and servicing agreement for another securitization transaction (see “Non-Serviced Whole Loans” below).
|
| Non-Serviced Whole Loans: | Each of the following mortgaged properties secures a mortgage loan (each, a “non-serviced mortgage loan”) and one or morepari passu promissory notes (each suchpari passu promissory note, a “non-serviced companion loan”) that will be serviced pursuant to the related intercreditor agreement and the pooling and servicing agreement or trust and servicing agreement (referred to herein as a related “pooling and servicing agreement”) for another securitization transaction: Vintage Park, 101 Hudson Street, Greenwich Office Park (after the securitization of the Greenwich Office Park control note), Novo Nordisk and Huntington Center. With respect to each such mortgaged property, the related mortgage loan, together with the related non-serviced companion loan(s), is referred to herein (for so long as it is serviced under the pooling and servicing agreement for another securitization transaction) as a “non-serviced whole loan.” Each non-serviced companion loan is not part of the mortgage pool and may be contributed to one or more future securitization transactions (if not already securitized) or may be otherwise transferred at any time, subject to compliance with the related intercreditor agreement. Servicing of each non-serviced whole loan will generally be directed by the holder of the related control note (or, if such control note is included in a securitization, the directing certificateholder thereunder (or other party designated to exercise the rights of such control note)), and such holder will have the right to replace the special servicer with respect to the related whole loan with or without cause. See the table below entitled “Mortgage Loans with Pari Passu Companion Loans” and “Description of the Mortgage Pool—The Whole Loans” in the Preliminary Prospectus for additional information regarding each such whole loan. |
| Directing Certificateholder/ Controlling Class: | The initial Directing Certificateholder is expected to be RREF III Debt AIV, LP (or another affiliate of Rialto Capital Advisors, LLC).
The “Directing Certificateholder” will be the Controlling Class Certificateholder (or its representative) selected by more than 50% (by certificate balance) of the Controlling Class Certificateholders;provided, that (1) absent that selection, (2) until a Directing Certificateholder is so selected or (3) upon receipt of a notice from a majority of the Controlling Class Certificateholders (by certificate balance) that a Directing Certificateholder is no longer designated, the Controlling Class Certificateholder that owns the largest aggregate certificate balance of the Controlling Class (or its representative) will be the Directing Certificateholder;provided, that (i) if such holder elects or has elected to not be the Directing Certificateholder, the holder of the next largest aggregate certificate balance of the Controlling Class will be the Directing Certificateholder, (ii) in the event no one holder owns the largest aggregate certificate balance of the Controlling Class, then there will be no Directing Certificateholder until appointed in accordance with the terms of the pooling and servicing agreement, and (iii) the certificate administrator and the other parties to the pooling and servicing agreement will be entitled to assume that the identity of the Directing Certificateholder has not changed until such parties receive written notice of a replacement of the Directing Certificateholder from a party holding the requisite interest in the Controlling Class (as confirmed by the certificate registrar), or the resignation of the then current Directing Certificateholder.
|
This is not a research report and was not prepared by any Underwriter’s research department. Please see additional important information and qualifications at the end of this Term Sheet.
T-8
| MSC 2016-UBS12 | Structural Overview |
The “Controlling Class” will be, as of any time of determination, the most subordinate class of Control Eligible Certificates then outstanding that has an aggregate certificate balance (as notionally reduced by any Cumulative Appraisal Reduction Amounts (as defined below)) at least equal to 25% of the initial certificate balance thereof; provided, that if at any time the certificate balances of the certificates other than the Control Eligible Certificates have been reduced to zero as a result of principal payments on the mortgage loans, then the Controlling Class will be the most subordinate class of Control Eligible Certificates that has a certificate balance greater than zero without regard to any Cumulative Appraisal Reduction Amounts. The Controlling Class as of the closing date will be the Class G certificates.
The “Control Eligible Certificates” will be any of the Class F and Class G certificates.
| |
| Control Rights: | Prior to a Control Termination Event, the Directing Certificateholder will have certain consent and consultation rights under the pooling and servicing agreement with respect to certain major decisions and other matters. A “Control Termination Event” will occur when (i) the Class F certificates have a certificate balance (taking into account the application of any Cumulative Appraisal Reduction Amounts to notionally reduce the certificate balance thereof) of less than 25% of the initial certificate balance thereof or (ii) a holder of the Class F certificates is the majority Controlling Class Certificateholder and has irrevocably waived its right, in writing, to exercise any of the rights of the Controlling Class Certificateholder and such rights have not been reinstated to a successor Controlling Class Certificateholder as described below; provided, that a Control Termination Event will be deemed not continuing in the event that the certificate balances of the principal balance certificates other than the Control Eligible Certificates have been reduced to zero as a result of principal payments on the mortgage loans.
After the occurrence of a Control Termination Event but prior to the occurrence of a Consultation Termination Event, the Directing Certificateholder will not have any consent rights, but the Directing Certificateholder and the operating advisor will each have certain non-binding consultation rights under the pooling and servicing agreement with respect to certain major decisions and other matters. A “Consultation Termination Event” will occur when (i) there is no class of Control Eligible Certificates that has a then outstanding certificate balance at least equal to 25% of the initial certificate balance of that class, in each case, without regard to the application of any Cumulative Appraisal Reduction Amounts; or (ii) a holder of the Class F certificates is the majority Controlling Class Certificateholder and has irrevocably waived its right, in writing, to exercise any of the rights of the Controlling Class Certificateholder and such rights have not been reinstated to a successor Controlling Class Certificateholder pursuant to the terms of the pooling and servicing agreement; provided that no Consultation Termination Event resulting solely from the operation of clause (ii) will be deemed to have existed or be in continuance with respect to a successor holder of the Class F certificates that has not irrevocably waived its right to exercise any of the rights of the Controlling Class Certificateholder; provided, that a Consultation Termination Event will be deemed not continuing in the event that the certificate balances of the principal balance certificates other than the Control Eligible Certificates have been reduced to zero as a result of principal payments on the mortgage loans.
After the occurrence of a Consultation Termination Event, the Directing Certificateholder will not have any consent or consultation rights, except with respect to any rights expressly set forth in the pooling and servicing agreement, and the operating advisor will retain certain non-binding consultation rights under the pooling and servicing agreement with respect to certain major decisions and other matters.
Notwithstanding any proviso to the definitions of “Control Termination Event” and “Consultation Termination Event,” a Control Termination Event and a Consultation Termination Event will be deemed to have occurred with respect to any Excluded Loan, and neither the Directing Certificateholder nor any Controlling Class Certificateholder will have any consent or consultation rights with respect to the servicing of such Excluded Loan.
An “Excluded Loan” is a mortgage loan or whole loan with respect to which the Directing Certificateholder or the holder of the majority of the Controlling Class is a Borrower Party. It is expected that there will be no Excluded Loans as of the Closing Date with respect to this securitization.
“Borrower Party” means a borrower, a mortgagor, a manager of a mortgaged property, the holder of a mezzanine loan that has been accelerated or as to which foreclosure or enforcement proceedings have been commenced against the equity collateral pledged to secure the related mezzanine loan, or any Borrower Party Affiliate.
“Borrower Party Affiliate” means, with respect to a borrower, a mortgagor, a manager of a mortgaged property or the holder of a mezzanine loan that has been accelerated or as to which foreclosure or enforcement proceedings have been commenced against the equity collateral pledged to secure the related mezzanine loan, (a) any other person controlling or controlled by or under common control with such borrower, mortgagor, manager or mezzanine lender, as applicable, or (b) any other person owning, directly or indirectly, 25% or more of the beneficial interests in such borrower, mortgagor, manager or mezzanine lender, as applicable. For the purposes of this definition, “control” when used with respect to any specified person means the power to direct the management and policies of such person, directly or indirectly, whether through the ownership of voting securities, by contract or otherwise and the terms “controlling” and “controlled” have meanings correlative to the foregoing.
Notwithstanding any of the foregoing to the contrary, if any mortgage loan is part of a whole loan, the Directing Certificateholder’s consent and/or consultation rights with respect thereto may be limited as described in the Preliminary Prospectus. In particular, with respect to each non-serviced whole loan and each servicing shift whole loan, the Directing Certificateholder will only have certain consultation rights with respect to certain major decisions and other matters related to such whole loan, in each case only prior to a Control Termination Event, and the holder of the related control note (or, if such control note has been securitized, the directing certificateholder with respect to such securitization or other designated party under the related pooling and servicing agreement) will be entitled to similar consent and/or consultation rights with respect to such whole loan.
|
This is not a research report and was not prepared by any Underwriter’s research department. Please see additional important information and qualifications at the end of this Term Sheet.
T-9
| MSC 2016-UBS12 | Structural Overview |
| Appraisal Reduction Amounts and Collateral Deficiency Amounts: | An “Appraisal Reduction Amount” generally will be created in the amount, if any, by which the principal balance of a required appraisal loan (which is a mortgage loan with respect to which certain defaults, modifications or insolvency events have occurred as further described in the Preliminary Prospectus) plus other amounts overdue or advanced in connection with such mortgage loan exceeds 90% of the appraised value of the related mortgaged property plus certain escrows and reserves (including letters of credit) held with respect to the mortgage loan.
A mortgage loan will cease to be subject to an Appraisal Reduction Amount when it has been brought current for at least three consecutive months, no additional event of default is foreseeable in the reasonable judgment of the special servicer and no other circumstances exist that would cause such mortgage loan or any related companion loan to be a specially serviced mortgage loan; however, a “Collateral Deficiency Amount” may exist with respect to any mortgage loan that is modified into an AB loan structure (an “AB Modified Loan”) and remains a rehabilitated mortgage loan and, if so, will generally equal the excess of (i) the stated principal balance of such AB Modified Loan (taking into account the related junior note(s) and anypari passu notes included therein, as well as any equity interests or other obligations senior thereto), over (ii) the sum of (in the case of a whole loan, solely to the extent allocable to the subject mortgage loan) (x) the most recent appraised value for the related mortgaged property plus (y) solely to the extent not reflected or taken into account in such appraised value and to the extent on deposit with, or otherwise under the control of, the lender as of the date of such determination, any capital or additional collateral contributed by the related borrower at the time the mortgage loan became an AB Modified Loan plus (z) certain escrows or reserves (including letters of credit) in addition to any amounts set forth in the immediately preceding clause (y) held with respect to the mortgage loan.
As used herein, a “Cumulative Appraisal Reduction Amount” will be the sum of any Appraisal Reduction Amounts and any Collateral Deficiency Amounts.
Any Appraisal Reduction Amount in respect of any non-serviced mortgage loan generally will be calculated in accordance with the other servicing agreement pursuant to which such mortgage loan is being serviced, which calculations are expected to be generally similar to those provided for in the pooling and servicing agreement for this transaction.
If any mortgage loan is part of a whole loan, any Appraisal Reduction Amount or Collateral Deficiency Amount will (or effectively will) be calculated in respect of such whole loan taken as a whole and allocated, to the extent provided in the related intercreditor agreement and the related pooling and servicing agreement,first, to any related subordinate companion loan, andsecond, to the related mortgage loan and anypari passu companion loan on apro rata basis by unpaid principal balance.
Appraisal Reduction Amounts will proportionately reduce the interest portion of debt service advances required to be made in respect of the related mortgage loan. Appraisal Reduction Amounts and Collateral Deficiency Amounts will be taken into account in determining the identity of the controlling class entitled to appoint the Directing Certificateholder, the existence of a Control Termination Event and the allocation of voting rights for certain purposes (see“—Directing Certificateholder/Controlling Class” above).
|
| Appraised-Out Class: | An “Appraised-Out Class” is any class of Control Eligible Certificates, the certificate balance of which (taking into account the application of any Appraisal Reduction Amounts or Collateral Deficiency Amounts to notionally reduce the certificate balance of such class) has been reduced to less than 25% of its initial certificate balance. Any Appraised-Out Class may not exercise any direction, control, consent and/or similar rights of the Controlling Class until such time, if any, as such class is reinstated as the Controlling Class, and the rights of the Controlling Class will be exercised by the most subordinate class of Control Eligible Certificates that is not an Appraised-Out Class, if any, during such period. |
| Appraisal Remedy: | The holders of the majority (by certificate balance) of an Appraised-Out Class (such holders, the “Requesting Holders”) will have the right, at their sole expense, to require the special servicer to order (or, with respect to a non-serviced mortgage loan, require the master servicer to request from the applicable outside special servicer) a second appraisal of any mortgage loan (or serviced whole loan) for which an appraisal reduction event has occurred or as to which there exists a Collateral Deficiency Amount. With respect to any serviced mortgage loan, the special servicer will be required to use its reasonable best efforts to ensure that such appraisal is delivered within 30 days from receipt of the Requesting Holders’ written request and will be required to ensure that such appraisal is prepared on an “as-is” basis by an MAI appraiser. With respect to any non-serviced mortgage loan, the master servicer will be required to use commercially reasonable efforts to obtain such second appraisal from the applicable outside special servicer and to forward such second appraisal to the special servicer. Upon receipt of such supplemental appraisal, the outside special servicer (for Appraisal Reduction Amounts on non-serviced mortgage loans, but only to the extent provided for in the applicable outside pooling and servicing agreement and applicable intercreditor agreement) and the special servicer (for Collateral Deficiency Amounts on non-serviced mortgage loans and for all Cumulative Appraisal Reduction Amounts on serviced mortgage loans) will be required to determine, in accordance with the servicing standard, whether, based on its assessment of such supplemental appraisal, any recalculation of the applicable Appraisal Reduction Amount or Collateral Deficiency Amount is warranted and, if so warranted, will be required to recalculate such Appraisal Reduction Amount or Collateral Deficiency Amount, as applicable, based upon such supplemental appraisal and receipt of information requested by the special servicer from the master servicer. If required by any such recalculation, the applicable Appraised-Out Class will be reinstated as the Controlling Class and each Appraised-Out Class will, if applicable, have its related certificate balance notionally restored to the extent required by such recalculation of the Appraisal Reduction Amount or Collateral Deficiency Amount, if applicable. |
This is not a research report and was not prepared by any Underwriter’s research department. Please see additional important information and qualifications at the end of this Term Sheet.
T-10
| MSC 2016-UBS12 | Structural Overview |
| Sale of Defaulted Loans: | Under certain circumstances, the special servicer may be required to use reasonable efforts to solicit offers for a defaulted serviced mortgage loan (and any related companion loan (to the extent provided under the related intercreditor agreement) and/or related REO properties). If the special servicer does not receive an offer at least equal to the outstanding principal balance plus all accrued and unpaid interest and outstanding costs and expenses and certain other specified amounts (the “Par Purchase Price”), the special servicer may purchase the defaulted loan or REO property at the Par Purchase Price or may accept the highest offer received from any person that is determined to be a fair price for such defaulted loan or REO property. If multiple offers are received during the period designated by the special servicer for receipt of offers, the special servicer is generally required to select the highest offer. If the highest offer is made by an Interested Person (i.e., certain specified parties under the pooling and servicing agreement for this transaction (the “PSA”), including the parties to the PSA, the Directing Certificateholder, any sponsor, any Borrower Party and known affiliates of the foregoing), the trustee, rather than the special servicer, will generally be required to determine whether the offer constitutes a fair price. Absent an offer at least equal to the Par Purchase Price, no offer from an Interested Person will constitute a fair price unless (x) it is the highest offer received and (y) at least one other offer is received from an independent third party. Neither the trustee nor any of its affiliates may make an offer for or purchase any specially serviced loan or REO property. See “Pooling and Servicing Agreement—Sale of Defaulted Loans and REO Properties” in the Prospectus.
Notwithstanding any of the foregoing to the contrary, the special servicer is not required to accept the highest offer and may accept a lower offer for a defaulted loan or REO property if it determines (in consultation with the Directing Certificateholder (unless a Consultation Termination Event exists or the mortgage loan is an Excluded Loan) and any related companion loan holders), in accordance with the Servicing Standard (and subject to the requirements of any related intercreditor agreement), that a rejection of such offer would be in the best interests of the certificateholders and any related companion loan holders, as a collective whole as if they constituted a single lender, so long as such lower offer was not made by the special servicer or any of its affiliates.
If title to any mortgaged property is acquired by the trust fund, the special servicer will be required to sell such mortgaged property prior to the close of the third calendar year beginning after the year of acquisition, unless (a) the IRS grants or has not denied an extension of time to sell such mortgaged property or (b) the special servicer, trustee and the certificate administrator receive an opinion of independent counsel to the effect that the holding of the property by the trust longer than the above-referenced three-year period will not result in the imposition of a tax on any REMIC of the trust fund or cause any REMIC of the trust fund to fail to qualify as a REMIC.
The Directing Certificateholder will not have a right of first refusal to purchase a defaulted loan.
The foregoing applies to mortgage loans serviced under the PSA. With respect to any non-serviced whole loan, if the special servicer under the applicable pooling and servicing agreement determines to sell the related controlling companion loan if it becomes a defaulted mortgage loan, then the applicable special servicer will be required to sell the related whole loan, including the related mortgage loan included in the MSC 2016-UBS12 securitization trust and the relatedpari passu companion loan(s) and, under certain circumstances, any subordinate companion loan(s), as a single loan. In connection with any such sale, the special servicer under the applicable pooling and servicing agreement will be required to follow procedures substantially similar to those set forth above.
|
| Appointment and Replacement of Special Servicer: | The Directing Certificateholder will appoint the initial special servicer as of the closing date. Prior to the occurrence and continuance of a Control Termination Event, the special servicer may generally be replaced by the Directing Certificateholder with or without cause.
After the occurrence and during the continuance of a Control Termination Event and upon (a) the written direction of holders of principal balance certificates evidencing not less than 25% of the voting rights of all classes of certificates entitled to principal (taking into account the application of Cumulative Appraisal Reduction Amounts to notionally reduce the certificate balances of classes to which such Cumulative Appraisal Reduction Amounts are allocable) requesting a vote to replace the special servicer with a replacement special servicer, (b) payment by such requesting holders to the certificate administrator of all reasonable fees and expenses to be incurred by the certificate administrator in connection with administering such vote and (c) delivery by such holders to each applicable rating agency of a rating agency communication, the certificate administrator will be required to post such notice on its internet website and by mail and conduct the solicitation of votes of all certificates in such regard, which such vote must occur within 180 days of the posting of such notice. Upon the written direction of holders of at least 75% of a Certificateholder Quorum, the trustee will be required to immediately replace the special servicer with a qualified replacement special servicer designated by such holders of certificates.
After the occurrence of a Consultation Termination Event, if the operating advisor determines that the special servicer is not performing its duties as required under the pooling and servicing agreement or is otherwise not acting in accordance with the servicing standard, the operating advisor may also recommend the replacement of the special servicer. The operating advisor’s recommendation to replace the special servicer must be confirmed by an affirmative vote of holders of principal balance certificates evidencing at least a majority of the aggregate voting rights (taking into account the application of any Cumulative Appraisal Reduction Amounts to notionally reduce the respective certificate balances) of all principal balance certificates on an aggregate basis, which such vote must occur within 180 days of the posting of such notice.
A “Certificateholder Quorum” means, in connection with any solicitation of votes in connection with the replacement of the special servicer or the asset representations reviewer, the holders of certificates evidencing at least 75% of the aggregate voting rights (taking into account, other than with respect to the termination of the asset representations reviewer, the application of any Appraisal Reduction Amounts to notionally reduce the certificate balance of the certificates) of all classes of certificates entitled to principal on an aggregate basis. |
This is not a research report and was not prepared by any Underwriter’s research department. Please see additional important information and qualifications at the end of this Term Sheet.
T-11
| MSC 2016-UBS12 | Structural Overview |
With respect to each serviced whole loan, any holder of a relatedpari passu companion loan, following a servicer termination event with respect to the special servicer that affects such holder, will be entitled to direct the trustee (and the trustee will be required) to terminate the special servicer solely with respect to such serviced whole loan. A replacement special servicer will be selected by the trustee or, prior to a Control Termination Event, by the Directing Certificateholder;provided, that any successor special servicer appointed to replace the special servicer with respect to such whole loan can generally not be the entity (or its affiliate) that was terminated at the direction of the holder of the relatedpari passu companion loan.
Notwithstanding any of the foregoing to the contrary, with respect to each servicing shift whole loan, the holder of the related control note will be entitled to replace the special servicer with respect to such whole loan at any time, with or without cause, and while it is a servicedpari passu whole loan, no other party may replace the special servicer for such whole loan unless there is a servicer termination event with respect thereto.
With respect to any non-serviced whole loan, the MSC 2016-UBS12 trust, as holder of the related mortgage loan, has the right to terminate the special servicer under the related pooling and servicing agreement if a servicer termination event occurs with respect to such special servicer that affects the trust in its capacity as such holder. Such rights may be exercised by the Directing Certificateholder prior to a Control Termination Event (or the special servicer (consistent with the servicing standard), following the occurrence and during the continuance of a Control Termination Event). The successor special servicer will be selected pursuant to the applicable pooling and servicing agreement by the related directing holder prior to a control termination event under such pooling and servicing agreement. | |
| Servicing Standard: | Each of the master servicer and the special servicer is obligated to service and administer the mortgage loans (and, if applicable, the serviced companion loans) in accordance with the definition of the “Servicing Standard” described in the Preliminary Prospectus and the terms of the pooling and servicing agreement, provided that each non-serviced mortgage loan, if any, will be serviced by another master servicer or special servicer under the pooling and servicing agreement with respect to the securitization of the related companion loan, which entities will be obligated to service and administer such non-serviced mortgage loan pursuant to a similar standard set forth in the related pooling and servicing agreement. |
| Excluded Special Servicer: | If the special servicer obtains knowledge that it has become a Borrower Party with respect to any mortgage loan (an “Excluded Special Servicer Loan”), the special servicer will be required to resign as special servicer of that Excluded Special Servicer Loan. Prior to the occurrence and continuance of a Control Termination Event, the Directing Certificateholder will be entitled to select a separate special servicer that is not a Borrower Party (an “Excluded Special Servicer”) with respect to any Excluded Special Servicer Loan, unless such Excluded Special Servicer Loan is also an Excluded Loan. After the occurrence and during the continuance of a Control Termination Event, if at any time the applicable Excluded Special Servicer Loan is also an Excluded Loan or if the Directing Certificateholder is entitled to appoint the Excluded Special Servicer but does not so appoint within 30 days of notice of such resignation, the resigning special servicer will be required to select the related Excluded Special Servicer. Any Excluded Special Servicer will be required to perform all of the obligations of the special servicer and will be entitled to all special servicing compensation with respect to such Excluded Special Servicer Loan earned while the related mortgage loan is an Excluded Special Servicer Loan. |
| Liquidated Loan Waterfall: | On liquidation of any mortgage loan, all net liquidation proceeds related to the mortgage loan (but not any related companion loan) will be applied so that amounts allocated as a recovery of accrued and unpaid interest will not, in the first instance, include any delinquent interest that was not advanced as a result of Appraisal Reduction Amounts or accrued on the portion of the stated principal balance thereof equal to any related Collateral Deficiency Amount in effect from time to time and as to which no advance was made. After the adjusted interest amount is so allocated, any remaining liquidation proceeds will be allocated to offset certain advances and to pay principal on the mortgage loan until the unpaid principal amount of the mortgage loan has been reduced to zero. Any remaining liquidation proceeds will then be allocated to pay delinquent interest that was not advanced as a result of Appraisal Reduction Amounts or that accrued on the portion of the stated principal balance thereof equal to any related Collateral Deficiency Amount in effect from time to time and as to which no advance was made. |
| Operating Advisor: | The operating advisor will be required to perform certain review duties if a Control Termination Event has occurred and is continuing, which will generally include a limited annual review of, and the preparation of a report regarding, certain actions of the special servicer with respect to the resolution and/or liquidation of specially serviced mortgage loans (other than any servicing shift mortgage loan). The review and report generally will be based on an annual meeting with the special servicer and any asset status reports and additional information delivered to the operating advisor by the special servicer. In addition, if a Control Termination Event has occurred and is continuing, the special servicer must consult with the operating advisor (in addition to the Directing Certificateholder if no Consultation Termination Event has occurred and is continuing) in connection with major decisions with respect to mortgage loans. Furthermore, under certain circumstances, but only if a Consultation Termination Event has occurred and is continuing, the operating advisor may recommend the replacement of the special servicer as described above under “—Appointment and Replacement of Special Servicer”; however, the operating advisor will not have any rights or obligations with respect to a non-serviced whole loan or servicing shift whole loan.
If a Consultation Termination Event has occurred and is continuing, the operating advisor may be removed and replaced without cause upon the affirmative direction of certificates owners holding not less than 75% of the voting rights of all certificates (taking into account the application of Cumulative Appraisal Reduction Amounts), following a proposal from certificate owners holding not less than 25% of the voting rights of all certificates (taking into account the application of Cumulative Appraisal Reduction Amounts). The certificateholders who initiate a vote on a termination and replacement of the operating advisor without cause must cause the payment of the fees and expenses incurred in the replacement. In addition, in the event there |
This is not a research report and was not prepared by any Underwriter’s research department. Please see additional important information and qualifications at the end of this Term Sheet.
T-12
| MSC 2016-UBS12 | Structural Overview |
are no classes of certificates outstanding other than the Control Eligible Certificates and the Class E, Class X-E, Class X-F, Class X-G, Class V and Class R certificates, then all of the rights and obligations of the operating advisor under the PSA will terminate without payment of any penalty or termination fee (other than any rights or obligations that accrued prior to the date of such termination (including accrued and unpaid compensation) and other than indemnification rights arising out of events occurring prior to such termination). See “Pooling and Servicing Agreement—The Operating Advisor—Termination of the Operating Advisor Without Cause” in the Preliminary Prospectus. | |
| Operating Advisor Expenses: | In addition to the Operating Advisor Fee and the Operating Advisor Consulting Fee, the operating advisor will be entitled to reimbursement of Operating Advisor Expenses in accordance with the terms of the PSA. “Operating Advisor Expenses” for each distribution date will equal any unreimbursed indemnification amounts or additional trust fund expenses payable to the operating advisor pursuant to the PSA (other than the Operating Advisor Fee and the Operating Advisor Consulting Fee). |
| Asset Representations Reviewer: | The asset representations reviewer will be required to review certain delinquent mortgage loans after a specified delinquency threshold has been met and the required percentage of certificateholders vote to direct a review as described below. The asset representations reviewer will be entitled to the Asset Representations Reviewer Fee with respect to such review. See “Pooling and Servicing Agreement—The Asset Representations Reviewer” in the Preliminary Prospectus.
The certificate administrator will be required to notify certificateholders if the specified delinquency threshold has been met as described in the Preliminary Prospectus under “—The Asset Representations Reviewer”.
If certificateholders evidencing not less than 5.0% of the voting rights request a vote to commence an asset review, and if subsequently (i) a majority of the certificateholders who cast votes and (ii) a majority of an Asset Review Quorum authorizes an asset review within 150 days of the request for a vote, the asset representations reviewer will be required to conduct an asset review of delinquent loans.
An “Asset Review Quorum” is, in connection with any solicitation of votes to authorize an asset review as described above, the holders of certificates evidencing at least 5.0% of the aggregate voting rights.
The asset representations reviewer may be terminated and replaced without cause. Upon (i) the written direction of certificateholders evidencing not less than 25% of the voting rights (without regard to the application of any Cumulative Appraisal Reduction Amounts) requesting a vote to terminate and replace the asset representations reviewer with a proposed successor asset representations reviewer that is an eligible asset representations reviewer, and (ii) payment by such holders to the certificate administrator of the reasonable fees and expenses to be incurred by the certificate administrator in connection with administering such vote, the certificate administrator will be required to promptly provide notice to all certificateholders and the asset representations reviewer of such request by posting such notice on its internet website, and by mailing such notice to all certificateholders and the asset representations reviewer. Upon the written direction of certificateholders evidencing at least 75% of a Certificateholder Quorum (without regard to the application of any Cumulative Appraisal Reduction Amounts), the trustee will be required to terminate all of the rights and obligations of the asset representations reviewer under the pooling and servicing agreement (other than any rights or obligations that accrued prior to the date of such termination and other than indemnification rights arising out of events occurring prior to such termination) by written notice to the asset representations reviewer, and the proposed successor asset representations reviewer will be appointed. See “Pooling and Servicing Agreement—The Asset Representations Reviewer” in the Preliminary Prospectus.
|
| Dispute Resolution Provisions: | The mortgage loan sellers will be subject to the dispute resolution provisions set forth in the PSA to the extent those provisions are triggered with respect to any mortgage loan sold to the depositor by a mortgage loan seller, and such mortgage loan seller will be obligated under the related mortgage loan purchase agreement to comply with all applicable provisions and to take part in any mediation or arbitration proceedings that may result. Generally, in the event that a Repurchase Request is not “Resolved” within 180 days after the related mortgage loan seller receives such Repurchase Request, then the enforcing servicer will be required to send a notice to the first certificateholder (or beneficial owner) to deliver a certificateholder repurchase request with respect to the mortgage loan (the “Initial Requesting Certificateholder”) (if any) and to the certificate administrator (which will be required to make such notice available to certificateholders via the certificate administrator’s website) indicating the enforcing servicer’s intended course of action with respect to the Repurchase Request. If (a) the enforcing servicer’s intended course of action with respect to the Repurchase Request does not involve pursuing further action to exercise rights against the related mortgage loan seller with respect to the Repurchase Request and the Initial Requesting Certificateholder, if any, or any other certificateholder or certificate owner wishes to exercise its right to refer the matter to mediation (including nonbinding arbitration) or arbitration, or (b) the enforcing servicer’s intended course of action is to pursue further action to exercise rights against the related mortgage loan seller with respect to the Repurchase Request but the Initial Requesting Certificateholder, if any, or any other certificateholder or certificate owner does not agree with the dispute resolution method selected by the enforcing servicer, then the Initial Requesting Certificateholder, if any, or such other certificateholder or certificate owner may deliver a written notice to the special servicer indicating its intent to exercise its right to refer the matter to either mediation or arbitration.
“Resolved” means, with respect to a Repurchase Request, (i) that the related material defect or breach has been cured, (ii) the related mortgage loan has been repurchased in accordance with the related mortgage loan purchase agreement, (iii) a mortgage loan has been substituted for the related mortgage loan in accordance with the related mortgage loan purchase agreement, (iv) the applicable mortgage loan seller has made a loss of value payment, (v) a contractually binding agreement has been entered into between the enforcing servicer, on behalf of the issuing entity, and the related mortgage loan seller that settles the related mortgage loan seller’s obligations under the related mortgage loan purchase agreement, or (vi) the related mortgage loan is no longer property of the issuing entity as a result of a sale or other disposition in |
This is not a research report and was not prepared by any Underwriter’s research department. Please see additional important information and qualifications at the end of this Term Sheet.
T-13
| MSC 2016-UBS12 | Structural Overview |
accordance with the pooling and servicing agreement. See “Pooling and Servicing Agreement—Dispute Resolution Provisions” in the Preliminary Prospectus. | |
| Investor Communications: | The certificate administrator is required to include on any Form 10-D any request received from a certificateholder to communicate with other certificateholders related to certificateholders exercising their rights under the terms of the PSA. Any certificateholder wishing to communicate with other certificateholders regarding the exercise of its rights under the terms of the PSA will be able to deliver a written request signed by an authorized representative of the requesting investor to the certificate administrator. |
| Deal Website: | The certificate administrator will be required to maintain a deal website which will include, among other items: (a) summaries of asset status reports prepared by the special servicer, (b) inspection reports, (c) appraisals, (d) various “special notices” described in the Preliminary Prospectus, (e) the “Investor Q&A Forum” and (f) a voluntary “Investor Registry”. Investors may access the deal website following execution of a certification and confidentiality agreement. |
This is not a research report and was not prepared by any Underwriter’s research department. Please see additional important information and qualifications at the end of this Term Sheet.
T-14
| MSC 2016-UBS12 | Collateral Overview |
| Mortgage Loan Sellers | No. of Mortgage Loans | No. of Mortgaged Properties | Aggregate Cut-off Date Balance | % of Pool(1) |
| UBS AG | 13 | 25 | $329,818,407 | 40.0% |
| Morgan Stanley Mortgage Capital Holdings LLC | 6 | 7 | $188,170,083 | 22.8% |
| Bank of America, National Association | 14 | 17 | $122,814,810 | 14.9% |
| Natixis Real Estate Capital LLC | 8 | 22 | $113,736,696 | 13.8% |
| Morgan Stanley Mortgage Capital Holdings LLC / UBS AG | 1 | 1 | $69,901,741 | 8.5% |
| Total: | 42 | 72 | $824,441,736 | 100.0% |
Pool Statistics
| Aggregate Cut-off Date Balance: | $824,441,736 |
| Number of Mortgage Loans: | 42 |
| Average Cut-off Date Balance per Mortgage Loan: | $19,629,565 |
| Number of Mortgaged Properties: | 72 |
| Average Cut-off Date Balance per Mortgaged Property: | $11,450,580 |
| Weighted Average Mortgage Rate: | 4.167% |
| % of Pool Secured by 5 Largest Mortgage Loans: | 40.8% |
| % of Pool Secured by 10 Largest Mortgage Loans: | 62.4% |
| % of Pool Secured by ARD Loans(2): | 8.8% |
| Weighted Average Original Term to Maturity (months)(2): | 116 |
| Weighted Average Remaining Term to Maturity (months)(2): | 115 |
| Weighted Average Seasoning (months): | 1 |
| % of Pool Secured by Single Tenant Mortgaged Properties: | 4.4% |
| % of Pool Secured by Refinance Loans: | 71.9% |
| % of Pool Secured by Acquisition Loans: | 23.7% |
| % of Pool Secured by Recapitalization Loans: | 4.4% |
Additional Debt
| % of Pool withPari Passu Mortgage Debt: | 62.8% |
| % of Pool with Mezzanine Debt: | 4.0% |
Credit Statistics(3)
| Weighted Average UW NOI DSCR: | 2.13x |
| Weighted Average UW NOI Debt Yield: | 10.6% |
| Weighted Average UW NCF DSCR: | 1.98x |
| Weighted Average UW NCF Debt Yield: | 9.9% |
| Weighted Average Cut-off Date LTV Ratio(4): | 61.8% |
| Weighted Average Maturity Date LTV Ratio(2)(4): | 54.2% |
Footnotes are set forth on the following page.
This is not a research report and was not prepared by any Underwriter’s research department. Please see additional important information and qualifications at the end of this Term Sheet.
T-15
| MSC 2016-UBS12 | Collateral Overview |
Amortization
| Weighted Average Original Amortization Term (months): | 353 |
| Weighted Average Remaining Amortization Term (months): | 352 |
| % of Pool Interest Only through Maturity(2): | 35.9% |
| % of Pool Interest Only followed by Amortizing Balloon: | 16.4% |
| % of Pool Amortizing Balloon: | 47.7% |
Lockboxes
| % of Pool with Hard Lockboxes: | 73.2% |
| % of Pool with Springing Lockboxes: | 18.9% |
| % of Pool with Soft Lockboxes: | 7.9% |
Reserves
| % of Pool Requiring Tax Reserves: | 74.1% |
| % of Pool Requiring Insurance Reserves: | 43.9% |
| % of Pool Requiring Replacement Reserves: | 81.5% |
| % of Pool Requiring TI/LC Reserves(5): | 54.9% |
Call Protection
| % of Pool with lockout period, followed by defeasance until open period: | 82.9% |
| % of Pool with lockout period, followed by the greater of a prepayment premium and yield maintenance until open period: | 12.7% |
| % of Pool with lockout period, followed by defeasance or the greater of a prepayment premium and yield maintenance until open period: | 4.4% |
| (1) | Unless otherwise indicated, all references to “% of Pool” in this Term Sheet reflect a percentage of the aggregate principal balance of the mortgage pool as of the Cut-off Date, after application of all payments of principal due during or prior to December 2016. |
| (2) | With respect to any ARD Loan, unless otherwise indicated, references in this Term Sheet to the applicable “maturity date” or “maturity” refer to the applicable anticipated repayment date with respect to such ARD Loan, and such applicable anticipated repayment date is treated as its maturity date for all purposes hereof. |
| (3) | With respect to any mortgage loan that is part of a whole loan, unless otherwise indicated, all LTV, DSCR and Debt Yield calculations in this Term Sheet include any relatedpari passucompanion loans (other than an unfundedpari passu companion loan with $39,580,000 of potential future advances with respect to the Novo Nordisk whole loan (the “Novo Nordisk Unfunded Companion Loan”)) and exclude any subordinate companion loans, as applicable. Additionally, LTV, DSCR and Debt Yield figures in this Term Sheet are calculated for mortgage loans without regard to any additional indebtedness that may be incurred at a future date. With respect to any leased fee loans, the SF/Unit and Balance per SF/Unit figures in this Term Sheet are based on the size of the non-collateral improvements. |
| (4) | The LTV ratios set forth in this Term Sheet are generally based on the “as-is” values of the related mortgaged properties; provided that the “as-is” value for a portfolio of mortgaged properties may include a premium relating to the valuation of the mortgaged properties as a whole rather than as the sum of individually valued mortgaged properties; provided, further, that such LTV ratios may be based on “as-stabilized”, “as complete” or other contingent values in certain cases in which reserves have been established at origination for the applicable condition or circumstance that is expected to result in stabilization. See the definition of “Appraised Value” under“Description of the Mortgage Pool—Certain Calculations and Definitions”in the Preliminary Prospectus. |
| (5) | Excludes hospitality, multifamily, manufactured housing, other (leased fee and net lease) and self-storage properties. |
This is not a research report and was not prepared by any Underwriter’s research department. Please see additional important information and qualifications at the end of this Term Sheet.
T-16
| MSC 2016-UBS12 | Characteristics of the Mortgage Loans |
| Top 10 Mortgage Loans(1) | |||||||||||||
| Loan No. | Mortgage Loan Seller | Property Name | City | State | Property Type | Cut-off Date Balance | % of Pool | SF/Units | Cut-off Date Balance per SF/Unit | UW NCF DSCR | UW NOI Debt Yield | Cut-off Date LTV | Maturity Date LTV |
| 1 | UBSAG | 681 Fifth Avenue(1) | New York | NY | Mixed Use | $80,000,000 | 9.7% | 82,573 | $2,603.76 | 1.67x | 7.3% | 48.9% | 48.9% |
| 2 | MSMCH | 191 Peachtree(1) | Atlanta | GA | Office | $80,000,000 | 9.7% | 1,222,142 | $143.60 | 2.69x | 11.5% | 64.9% | 64.9% |
| 3 | MSMCH/UBSAG | Wolfchase Galleria(1) | Memphis | TN | Retail | $69,901,741 | 8.5% | 391,862 | $420.48 | 1.72x | 10.7% | 64.9% | 52.0% |
| 4 | MSMCH | The Orchard(1) | Lake Forest | CA | Retail | $60,911,639 | 7.4% | 280,644 | $359.37 | 1.35x | 8.0% | 68.1% | 54.3% |
| 5 | UBSAG | The Falls(1) | Miami | FL | Retail | $45,500,000 | 5.5% | 839,507 | $178.68 | 3.36x | 12.3% | 49.2% | 49.2% |
| 6 | UBSAG | Vintage Park(1) | Houston | TX | Retail | $39,000,000 | 4.7% | 341,107 | $246.26 | 1.33x | 8.8% | 70.1% | 61.1% |
| 7 | BANA | 101 Hudson Street(1) | Jersey City | NJ | Office | $37,250,000 | 4.5% | 1,341,649 | $186.34 | 3.68x | 12.9% | 51.8% | 51.8% |
| 8 | UBSAG | U-Haul AREC 23 Portfolio | Various | Various | Self Storage | $36,167,377 | 4.4% | 509,124 | $71.04 | 1.72x | 10.8% | 53.3% | 38.3% |
| 9 | Natixis | Greenwich Office Park(1) | Greenwich | CT | Office | $33,000,000 | 4.0% | 379,861 | $230.35 | 1.94x | 9.7% | 65.3% | 65.3% |
| 10 | UBSAG | The Shores Resort & Spa | Daytona Beach Shores | FL | Hospitality | $32,958,565 | 4.0% | 212 | $155,464.93 | 2.63x | 18.6% | 60.5% | 49.5% |
| Total/Wtd. Avg. | $514,689,322 | 62.4% | 2.15x | 10.6% | 59.8% | 54.0% | |||||||
| (1) | With respect to any mortgage loan that is part of a whole loan, unless otherwise indicated, all LTV, DSCR, Debt Yield and Balance per SF/Unit calculations in this Term Sheet include any relatedpari passu companion loans (other than the Novo Nordisk Unfunded Companion Loan) and exclude any subordinate companion loans, as applicable. Additionally, LTV, DSCR, Debt Yield and Balance per SF/Unit figures in this Term Sheet are calculated for mortgage loans without regard to any additional indebtedness that may be incurred at a future date. With respect to any leased fee loans, the SF/Unit and Balance per SF/Unit figures in this Term Sheet are based on the size of the non-collateral improvements. |
This is not a research report and was not prepared by any Underwriter’s research department. Please see additional important information and qualifications at the end of this Term Sheet.
T-17
| MSC 2016-UBS12 | Characteristics of the Mortgage Loans |
| Mortgage Loans with Pari Passu Companion Loans | ||||||||||||
| Loan No. | Mortgage Seller | Property Name | Mortgage Loan Cut-off Date Balance | Aggregate Pari Passu Companion Loan Cut-off Date Balance | Combined Cut-off Date Balance | Lead Servicing Agreement | Master Servicer | Special Servicer | Control Rights | Combined UW NCF DSCR(1) | Combined UW NOI Debt Yield(1) | Combined Cut-off Date LTV(1) |
| 1 | UBSAG | 681 Fifth Avenue | $80,000,000 | $135,000,000 | $215,000,000 | MSC 2016-UBS12 | Midland | Rialto | MSC 2016-UBS12 | 1.67x | 7.3% | 48.9% |
| 2 | MSMCH | 191 Peachtree | $80,000,000 | $95,500,000 | $175,500,000 | MSC 2016-UBS12 | Midland | Rialto | MSC 2016-UBS12 | 2.69x | 11.5% | 64.9% |
| 3 | MSMCH/UBSAG | Wolfchase Galleria | $69,901,741 | $94,866,648 | $164,768,389 | MSC 2016-UBS12 | Midland | Rialto | MSC 2016-UBS12 | 1.72x | 10.7% | 64.9% |
| 4 | MSMCH | The Orchard | $60,911,639 | $39,942,058 | $100,853,697 | MSC 2016-UBS12 | Midland | Rialto | MSC 2016-UBS12 | 1.35x | 8.0% | 68.1% |
| 5 | UBSAG | The Falls | $45,500,000 | $104,500,000 | $150,000,000 | MSC 2016-UBS12 | Midland | Rialto | MSC 2016-UBS12 | 3.36x | 12.3% | 49.2% |
| 6 | UBSAG | Vintage Park | $39,000,000 | $45,000,000 | $84,000,000 | MSBAM 2016-C31 | Wells Fargo | Rialto | MSBAM 2016-C31 | 1.33x | 8.8% | 70.1% |
| 7 | BANA | 101 Hudson Street | $37,250,000 | $212,750,000 | $250,000,000 | MSC 2016-BNK2 | Wells Fargo | C-III | MSC 2016-BNK2 | 3.68x | 12.9% | 51.8% |
| 9 | Natixis | Greenwich Office Park | $33,000,000 | $54,500,000 | $87,500,000 | MSC 2016-UBS12(2) | Midland(2) | Rialto(2) | (2) | 1.94x | 9.7% | 65.3% |
| 11 | UBSAG | Federal Way Crossings I & II | $32,457,888 | $25,466,958 | $57,924,846 | MSC 2016-UBS12 | Midland | Rialto | MSC 2016-UBS12 | 1.36x | 8.7% | 69.7% |
| 12 | Natixis | Novo Nordisk | $20,000,000 | $148,300,000(1) | $168,300,000(1) | WFCM 2016-NXS6(2) | Wells Fargo(2) | CW Capital(2) | (2) | 2.97x | 10.5% | 52.6% |
| 13 | MSMCH | Huntington Center | $20,000,000 | $120,000,000 | $140,000,000 | MSBAM 2016-C31 | Wells Fargo | Rialto | MSBAM 2016-C31 | 1.54x | 9.2% | 75.0% |
| (1) | DSCR, Debt Yield and LTV calculations include any relatedpari passu companion loans (other than the Novo Nordisk Unfunded Companion Loan) and exclude any subordinate companion loans, as applicable. In addition, with respect to the Novo Nordisk Mortgage Loan, Aggregate Pari Passu Companion Loan Cut-off Date Balance and Combined Cut-off Date Balance exclude the Novo Nordisk Unfunded Companion Loan. |
| (2) | With respect to each of the Greenwich Office Park and Novo Nordisk whole loans, the holder of the related control note (Natixis) will be the controlling noteholder. No such control note is included in this securitization. Upon a securitization of such control note, servicing of the related whole loan will be governed by the pooling and servicing agreement entered into in connection with such securitization, and the representative of the controlling class under such pooling and servicing agreement is expected to have certain consent and control rights regarding servicing of the related whole loan similar to those of the MSC 2016-UBS12 directing certificateholder with respect to the mortgage loans serviced under the pooling and servicing agreement for this securitization. The master servicer and the special servicer under the pooling and servicing agreement for any such future securitization of a related control note may not be the same as the entities listed above with respect to the related whole loan. See “Description of the Mortgage Loans—The Whole Loans” in the Preliminary Prospectus. |
This is not a research report and was not prepared by any Underwriter’s research department. Please see additional important information and qualifications at the end of this Term Sheet.
T-18
| MSC 2016-UBS12 | Characteristics of the Mortgage Loans |
| Mortgage Loans with Mezzanine Debt | |||||||||||
| Loan No. | Mortgage Loan Seller | Property Name | Mortgage Loan Cut-off Date Balance | Cut-off Date Balance per Unit/SF | Mezzanine Debt Cut- off Date Balance | UW NCF DSCR | UW NOI Debt Yield | Cut-off Date LTV | Total Debt UW NCF DSCR(1) | Total Debt UW NOI Debt Yield(1) | Total Debt Cut- off Date LTV(1) |
| 9 | Natixis | Greenwich Office Park | $33,000,000 | $230.35 | $10,000,000 | 1.94x | 9.7% | 65.3% | 1.58x | 8.7% | 72.8% |
| (1) | Total Debt UW NCF DSCR, Total Debt UW NOI Debt Yield and Total Debt Cut-off Date LTV figures shown above are calculated based on any relatedpari passu notes, any related subordinate note(s) and the mezzanine debt. |
This is not a research report and was not prepared by any Underwriter’s research department. Please see additional important information and qualifications at the end of this Term Sheet.
T-19
| MSC 2016-UBS12 | Characteristics of the Mortgage Loans |
| Prior Securitization History(1) | ||||||||||||||
| Loan No. | Mortgage Loan Seller | Property Name | City | State | Property Type | Cut-off Date Balance | % of Pool | SF/Units | Cut-off Date Balance per SF/Unit | UW NCF DSCR | UW NOI Debt Yield | Cut-off Date LTV | Maturity Date LTV | Prior Securitization |
| 1 | UBSAG | 681 Fifth Avenue | New York | NY | Mixed Use | $80,000,000 | 9.7% | 82,573 | $2,603.76 | 1.67x | 7.3% | 48.9% | 48.9% | DBUBS 2011-LC1A; RCMC 2012-CREL1 |
| 3 | MSMCH/ UBSAG | Wolfchase Galleria | Memphis | TN | Retail | $69,901,741 | 8.5% | 391,862 | $420.48 | 1.72x | 10.7% | 64.9% | 52.0% | GECMC 2007-C1 |
| 4 | MSMCH | The Orchard | Lake Forest | CA | Retail | $60,911,639 | 7.4% | 280,644 | $359.37 | 1.35x | 8.0% | 68.1% | 54.3% | JPMCC 2007-LDPX |
| 6 | UBSAG | Vintage Park | Houston | TX | Retail | $39,000,000 | 4.7% | 341,107 | $246.26 | 1.33x | 8.8% | 70.1% | 61.1% | GSMS 2014-GSFL |
| 8 | UBSAG | U-Haul AREC 23 Portfolio | Various | Various | Self Storage | $36,167,377 | 4.4% | 509,124 | $71.04 | 1.72x | 10.8% | 53.3% | 38.3% | (2) |
| 11 | UBSAG | Federal Way Crossings I & II | Federal Way | WA | Retail | $32,457,888 | 3.9% | 207,686 | $278.91 | 1.36x | 8.7% | 69.7% | 56.7% | MLCFC 2006-4; MLCFC 2007-8 |
| 15 | UBSAG | Arkansas Multifamily Portfolio | Various | AR | Multifamily | $18,476,703 | 2.2% | 480 | $38,493.13 | 1.57x | 10.5% | 65.2% | 53.3% | (3) |
| 16 | BANA | Lexham Street Portfolio | West Hartford | CT | Various | $17,250,000 | 2.1% | 63,730 | $270.67 | 1.33x | 8.4% | 69.1% | 60.6% | LBUBS 2006-C7 |
| 21 | UBSAG | Chisholm Shopping Center | Yukon | OK | Retail | $11,733,075 | 1.4% | 205,685 | $57.04 | 2.12x | 14.4% | 47.3% | 37.7% | LBUBS 2007-C2 |
| 24 | BANA | Pleasant Hill Villas Apartments | Las Vegas | NV | Multifamily | $10,036,201 | 1.2% | 172 | $58,350.01 | 1.42x | 8.9% | 72.2% | 58.1% | JPMCC 2006-LDP9 |
| 25 | BANA | Park Circle Apartments | Lancaster | CA | Multifamily | $8,638,124 | 1.0% | 164 | $52,671.48 | 1.47x | 9.4% | 72.0% | 57.9% | WBCMT 2006-C28 |
| 26 | BANA | Hamden Retail Center | Hamden | CT | Retail | $7,800,000 | 0.9% | 45,862 | $170.08 | 1.45x | 9.2% | 67.0% | 57.2% | LBUBS 2006-C6 |
| 27 | UBSAG | Villager Square | Broomfield | CO | Retail | $7,750,064 | 0.9% | 85,131 | $91.04 | 1.61x | 10.5% | 67.7% | 55.2% | GCCFC 2007-GG9 |
| 30 | BANA | Westview Avenal Apartments | Avenal | CA | Multifamily | $6,201,474 | 0.8% | 150 | $41,343.16 | 1.52x | 9.6% | 74.9% | 60.3% | WBCMT 2006-C28 |
| 31 | BANA | Westview Apartments | Los Angeles | CA | Multifamily | $4,993,135 | 0.6% | 57 | $87,598.86 | 1.45x | 8.9% | 59.4% | 47.8% | JPMCC 2007-LDPX |
| 32 | BANA | Courtyard Van Nuys Apartments | Van Nuys | CA | Multifamily | $4,144,302 | 0.5% | 59 | $70,242.41 | 1.40x | 8.6% | 63.8% | 51.3% | WBCMT 2006-C28 |
| 36 | BANA | Northridge Pointe Apartments | Northridge | CA | Multifamily | $3,145,675 | 0.4% | 28 | $112,345.54 | 1.38x | 8.4% | 59.9% | 48.2% | WBCMT 2006-C28 |
| 37 | BANA | Mountain View Townhomes | Hemet | CA | Multifamily | $2,796,156 | 0.3% | 56 | $49,931.35 | 1.40x | 9.0% | 71.0% | 57.1% | JPMCC 2006-LDP9 |
| 38 | BANA | Sherman Pointe Apartments | Van Nuys | CA | Multifamily | $2,746,224 | 0.3% | 36 | $76,284.01 | 1.45x | 8.9% | 58.4% | 47.0% | JPMCC 2007-LDPX |
| 39 | BANA | Somerset Townhomes | Lancaster | CA | Multifamily | $2,716,265 | 0.3% | 45 | $60,361.45 | 1.42x | 8.9% | 67.9% | 54.7% | JPMCC 2006-LDP9 |
| 40 | MSMCH | Woodland Crossing Shopping Center | Tulsa | OK | Retail | $2,370,000 | 0.3% | 9,697 | $244.41 | 1.21x | 7.9% | 69.7% | 58.6% | CWCI 2006-C1 |
| 41 | UBSAG | Halsted Plaza | Chicago | IL | Retail | $1,997,610 | 0.2% | 59,847 | $33.38 | 3.00x | 21.8% | 31.7% | 26.2% | JPMCC 2007-CB18 |
| 42 | BANA | Wildwood Apartments | Las Vegas | NV | Multifamily | $1,997,254 | 0.2% | 49 | $40,760.29 | 1.74x | 11.4% | 74.0% | 59.5% | JPMCC 2006-LDP9 |
| Total | $433,230,907 | 52.5% | ||||||||||||
| (1) | Includes mortgage loans for which all or a portion of the previously existing debt was most recently securitized in conduit securitizations, based on information provided by the related borrower or obtained through searches of a third-party database. The information has not otherwise been confirmed by the mortgage loan sellers. With respect to any mortgage loan that is part of a whole loan, unless otherwise indicated, all LTV, DSCR, Debt Yield and Cut-off Date Balance per SF/Unit calculations include any relatedpari passu companion loans (other than the Novo Nordisk Unfunded Companion Loan) and exclude any related subordinate companion loans, as applicable. |
| (2) | With respect to the U-Haul AREC 23 Portfolio mortgage loan, the U-Haul at 19th Ave property was most recently securitized in JPMCC 2008-C2 and CSFB 2005-C4, the U-Haul Moving & Storage of Waterfalls property was most recently securitized in MLCFC 2007-7, the U-Haul Moving & Storage of Kakaako property was most recently securitized in GECMC 2006-C1 and the U-Haul Moving & Storage on Highway 64 property was most recently securitized in LBUBS 2006-C7. |
| (3) | With respect to the Arkansas Multifamily Portfolio mortgage loan, the Allied Garden Apartments property was most recently securitized in FNA 2014-M12. |
This is not a research report and was not prepared by any Underwriter’s research department. Please see additional important information and qualifications at the end of this Term Sheet.
T-20
| MSC 2016-UBS12 | Characteristics of the Mortgage Loans |
Mortgage Loans with Scheduled Balloon Payments and Related Classes(1)
| Class A-2 ($54,700,000) | ||||||||||||||||||||
| Loan No. | Mortgage Loan Seller | Property Name | State | Property Type | Cut-off Date Balance | % of Pool | Maturity Date Balance | % of Class A-2 Certificate Principal Balance | SF/ Units | Cut-off Date Balance per SF/Unit(2) | UW NCF DSCR(2) | UW NOI Debt Yield(2) | Cut-off Date LTV(2) | Maturity Date LTV(2) | Rem. IO Period (mos.) | Rem. Term to Maturity (mos.) | ||||
| 9 | Natixis | Greenwich Office Park | CT | Office | $33,000,000 | 4.0% | $33,000,000 | 60.3% | 379,861 | $230.35 | 1.94x | 9.7% | 65.3% | 65.3% | 59 | 59 | ||||
| 12 | Natixis | Novo Nordisk | NJ | Office | $20,000,000 | 2.4% | $20,000,000 | 36.6% | 761,824 | $220.92 | 2.97x | 10.5% | 52.6% | 52.6% | 57 | 57 | ||||
| Total/Wtd. Avg. | $53,000,000 | 6.4% | $53,000,000 | 96.9% | 2.33x | 10.0% | 60.5% | 60.5% | 58 | 58 | ||||||||||
| (1) | The table above reflects the mortgage loans whose balloon payments will be applied to pay down the Class A-2 certificates, assuming (i) that none of the mortgage loans experience prepayments, defaults or losses; (ii) there are no extensions of maturity dates; and (iii) each mortgage loan is paid in full on its stated maturity date or, in the case of any mortgage loan with an anticipated repayment date, on such anticipated repayment date. The table above is otherwise based on the Structuring Assumptions set forth under “Yield and Maturity Considerations—Weighted Average Life” in the Preliminary Prospectus. |
| (2) | Calculated taking into account relatedpari passu companion loans (other than the Novo Nordisk Unfunded Companion Loan). |
This is not a research report and was not prepared by any Underwriter’s research department. Please see additional important information and qualifications at the end of this Term Sheet.
T-21
| MSC 2016-UBS12 | Characteristics of the Mortgage Loans |
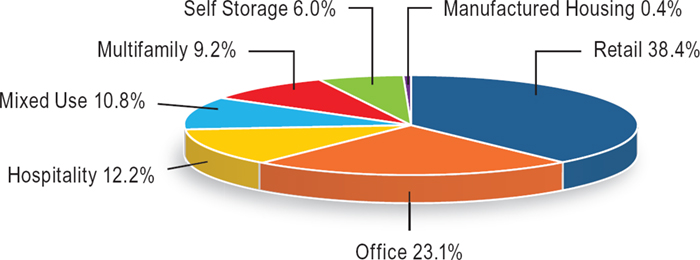
| Property Type Distribution(1) | ||||||||
| Property Type | Number of Mortgaged Properties | Aggregate Cut-off Date Balance | % of Pool | Wtd. Avg. Mortgage Rate | Wtd. Avg. UW NCF DSCR | Wtd. Avg. UW NOI Debt Yield | Wtd. Avg. Cut-off Date LTV | Wtd. Avg. Maturity Date LTV |
| Retail | 28 | $316,651,033 | 38.4% | 4.233% | 1.77x | 9.9% | 64.3% | 54.4% |
| Anchored | 4 | $112,852,666 | 13.7% | 4.198% | 1.45x | 9.0% | 66.4% | 53.3% |
| Regional Lifestyle Center | 2 | $84,500,000 | 10.2% | 4.159% | 2.42x | 10.7% | 58.8% | 54.7% |
| Regional Mall | 1 | $69,901,741 | 8.5% | 4.146% | 1.72x | 10.7% | 64.9% | 52.0% |
| Shadow Anchored | 2 | $20,300,000 | 2.5% | 4.341% | 1.40x | 8.7% | 67.8% | 60.4% |
| Single Tenant | 15 | $16,245,750 | 2.0% | 4.810% | 1.33x | 8.5% | 72.3% | 62.4% |
| Unanchored | 4 | $12,850,877 | 1.6% | 4.607% | 1.57x | 10.4% | 63.4% | 54.9% |
| Office | 5 | $190,250,000 | 23.1% | 3.707% | 2.66x | 11.1% | 62.2% | 61.4% |
| CBD | 3 | $137,250,000 | 16.6% | 3.536% | 2.79x | 11.5% | 62.8% | 61.8% |
| Suburban | 2 | $53,000,000 | 6.4% | 4.149% | 2.33x | 10.0% | 60.5% | 60.5% |
| Hospitality | 8 | $100,324,136 | 12.2% | 4.731% | 2.22x | 15.8% | 61.0% | 49.0% |
| Limited Service | 5 | $48,865,571 | 5.9% | 4.793% | 2.04x | 14.7% | 59.8% | 47.2% |
| Full Service | 1 | $32,958,565 | 4.0% | 4.761% | 2.63x | 18.6% | 60.5% | 49.5% |
| Select Service | 2 | $18,500,000 | 2.2% | 4.517% | 1.96x | 13.4% | 64.9% | 52.6% |
| Mixed Use | 3 | $88,766,733 | 10.8% | 4.158% | 1.64x | 7.4% | 50.9% | 50.1% |
| Office/Retail | 1 | $80,000,000 | 9.7% | 4.127% | 1.67x | 7.3% | 48.9% | 48.9% |
| Retail/Office | 2 | $8,766,733 | 1.1% | 4.450% | 1.33x | 8.4% | 69.1% | 60.6% |
| Multifamily | 16 | $75,769,957 | 9.2% | 4.462% | 1.50x | 9.7% | 67.1% | 54.1% |
| Garden | 15 | $70,776,822 | 8.6% | 4.476% | 1.50x | 9.8% | 67.7% | 54.6% |
| Mid Rise | 1 | $4,993,135 | 0.6% | 4.269% | 1.45x | 8.9% | 59.4% | 47.8% |
| Self Storage | 11 | $49,267,377 | 6.0% | 3.913% | 1.65x | 10.2% | 57.7% | 43.9% |
| Self Storage | 11 | $49,267,377 | 6.0% | 3.913% | 1.65x | 10.2% | 57.7% | 43.9% |
| Manufactured Housing | 1 | $3,412,500 | 0.4% | 4.431% | 2.21x | 13.7% | 68.3% | 58.3% |
| Manufactured Housing | 1 | $3,412,500 | 0.4% | 4.431% | 2.21x | 13.7% | 68.3% | 58.3% |
| Total/Wtd. Avg. | 72 | $824,441,736 | 100.0% | 4.167% | 1.98x | 10.6% | 61.8% | 54.2% |
| (1) | All numerical information concerning the mortgage loans is approximate and, in the case of mortgage loans secured by multiple properties, is based on allocated loan amounts with respect to such properties. All weighted average information regarding the mortgage loans reflects the weighting of the mortgage loans based on their outstanding principal balances as of the Cut-off Date or, in the case of mortgage loans secured by multiple properties, allocated loan amounts. The sum of numbers and percentages in columns may not match the “Total” due to rounding. With respect to any mortgage loan that is part of a whole loan, unless otherwise indicated, all LTV, DSCR and Debt Yield calculations include any relatedpari passu companion loans (other than the Novo Nordisk Unfunded Companion Loan) and exclude any related subordinate companion loans, as applicable. |
This is not a research report and was not prepared by any Underwriter’s research department. Please see additional important information and qualifications at the end of this Term Sheet.
T-22
| MSC 2016-UBS12 | Characteristics of the Mortgage Loans |
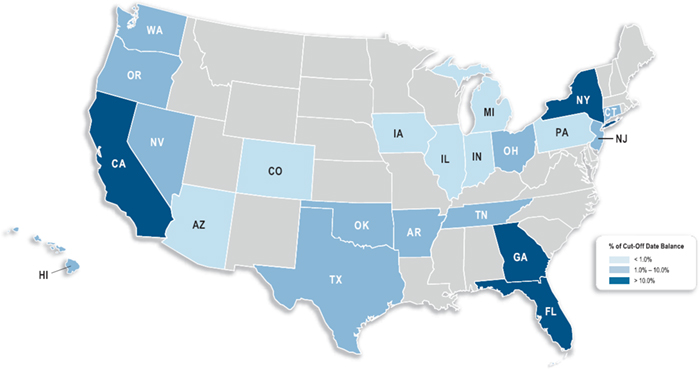
| Geographic Distribution(1) | ||||||||
| State or Other Jurisdiction | Number of Mortgaged Properties | Aggregate Cut-off Date Balance | % of Pool | Wtd. Avg. Mortgage Rate | Wtd. Avg. UW NCF DSCR | Wtd. Avg. UW NOI Debt Yield | Wtd. Avg. Cut-off Date LTV | Wtd. Avg. Maturity Date LTV |
| California | 13 | $128,317,102 | 15.6% | 4.148% | 1.40x | 8.5% | 67.8% | 55.4% |
| California – Southern(2) | 12 | $124,827,102 | 15.1% | 4.111% | 1.40x | 8.5% | 67.7% | 55.2% |
| California – Northern(2) | 1 | $3,490,000 | 0.4% | 5.500% | 1.29x | 9.0% | 69.8% | 61.2% |
| Georgia | 5 | $95,515,797 | 11.6% | 3.879% | 2.58x | 11.9% | 63.8% | 61.8% |
| Florida | 4 | $91,955,402 | 11.2% | 4.045% | 2.89x | 14.6% | 55.8% | 49.9% |
| New York | 2 | $90,287,417 | 11.0% | 4.216% | 1.76x | 8.4% | 48.4% | 47.5% |
| Connecticut | 8 | $76,550,000 | 9.3% | 4.510% | 1.76x | 10.3% | 66.2% | 60.3% |
| Tennessee | 2 | $73,414,687 | 8.9% | 4.129% | 1.72x | 10.7% | 64.3% | 51.3% |
| New Jersey | 2 | $57,250,000 | 6.9% | 3.245% | 3.43x | 12.1% | 52.1% | 52.1% |
| Texas | 2 | $45,388,444 | 5.5% | 4.920% | 1.39x | 9.3% | 68.8% | 58.8% |
| Washington | 1 | $32,457,888 | 3.9% | 4.589% | 1.36x | 8.7% | 69.7% | 56.7% |
| Ohio | 6 | $24,879,496 | 3.0% | 3.781% | 1.50x | 9.1% | 74.5% | 66.7% |
| Oklahoma | 9 | $24,724,522 | 3.0% | 4.290% | 1.75x | 11.5% | 57.6% | 47.1% |
| Arkansas | 4 | $18,476,703 | 2.2% | 4.745% | 1.57x | 10.5% | 65.2% | 53.3% |
| Oregon | 1 | $16,222,154 | 2.0% | 4.864% | 1.78x | 13.5% | 62.4% | 46.7% |
| Nevada | 2 | $12,033,455 | 1.5% | 4.269% | 1.47x | 9.3% | 72.5% | 58.3% |
| Hawaii | 1 | $9,500,922 | 1.2% | 3.793% | 1.72x | 10.8% | 53.3% | 38.3% |
| Colorado | 1 | $7,750,064 | 0.9% | 4.654% | 1.61x | 10.5% | 67.7% | 55.2% |
| Arizona | 1 | $4,940,080 | 0.6% | 3.793% | 1.72x | 10.8% | 53.3% | 38.3% |
| Pennsylvania | 4 | $4,048,174 | 0.5% | 4.810% | 1.33x | 8.5% | 72.3% | 62.4% |
| Indiana | 1 | $3,412,500 | 0.4% | 4.431% | 2.21x | 13.7% | 68.3% | 58.3% |
| Michigan | 1 | $2,744,489 | 0.3% | 3.793% | 1.72x | 10.8% | 53.3% | 38.3% |
| Iowa | 1 | $2,574,830 | 0.3% | 3.793% | 1.72x | 10.8% | 53.3% | 38.3% |
| Illinois | 1 | $1,997,610 | 0.2% | 5.030% | 3.00x | 21.8% | 31.7% | 26.2% |
| Total/Wtd. Avg. | 72 | $824,441,736 | 100.0% | 4.167% | 1.98x | 10.6% | 61.8% | 54.2% |
| (1) | All numerical information concerning the mortgage loans is approximate and, in the case of mortgage loans secured by multiple properties, is based on allocated loan amounts with respect to such properties. All weighted average information regarding the mortgage loans reflects the weighting of the mortgage loans based on their outstanding principal balances as of the Cut-off Date or, in the case of mortgage loans secured by multiple properties, allocated loan amounts. The sum of numbers and percentages in columns may not match the “Total” due to rounding. With respect to any mortgage loan that is part of a whole loan, unless otherwise indicated, all LTV, DSCR and Debt Yield calculations include any relatedpari passu companion loans (other than the Novo Nordisk Unfunded Companion Loan) and exclude any related subordinate companion loans, as applicable. |
| (2) | “California – Northern” includes zip codes above 93600, and “California – Southern” includes zip codes at or below 93600. |
This is not a research report and was not prepared by any Underwriter’s research department. Please see additional important information and qualifications at the end of this Term Sheet.
T-23
| MSC 2016-UBS12 | Collateral Statistics |
Collateral Statistics(1)
Cut-off Date Balance ($)
| No. of Mortgage Loans | Aggregate Cut-off Date Balance ($) | % of Pool | |
| 1,997,254 - 5,000,000 | 12 | 37,951,593 | 4.6 |
| 5,000,001 - 10,000,000 | 6 | 44,019,726 | 5.3 |
| 10,000,001 - 15,000,000 | 6 | 68,628,600 | 8.3 |
| 15,000,001 - 20,000,000 | 7 | 126,694,607 | 15.4 |
| 20,000,001 - 35,000,000 | 3 | 98,416,453 | 11.9 |
| 35,000,001 - 50,000,000 | 4 | 157,917,377 | 19.2 |
| 50,000,001 - 80,000,000 | 4 | 290,813,380 | 35.3 |
| Total: | 42 | $824,441,736 | 100.0% |
| Min: $1,997,254 | Max: $80,000,000 Avg: $19,629,565 | ||
State or Other Jurisdiction
| No. of Mortgaged Properties | Aggregate Cut-off Date Balance ($) | % of Pool | |
| California | 13 | 128,317,102 | 15.6 |
| California – Southern(2) | 12 | 124,827,102 | 15.1 |
| California – Northern(2) | 1 | 3,490,000 | 0.4 |
| Georgia | 5 | 95,515,797 | 11.6 |
| Florida | 4 | 91,955,402 | 11.2 |
| New York | 2 | 90,287,417 | 11.0 |
| Connecticut | 8 | 76,550,000 | 9.3 |
| Tennessee | 2 | 73,414,687 | 8.9 |
| New Jersey | 2 | 57,250,000 | 6.9 |
| Texas | 2 | 45,388,444 | 5.5 |
| Washington | 1 | 32,457,888 | 3.9 |
| Ohio | 6 | 24,879,496 | 3.0 |
| Oklahoma | 9 | 24,724,522 | 3.0 |
| Arkansas | 4 | 18,476,703 | 2.2 |
| Oregon | 1 | 16,222,154 | 2.0 |
| Nevada | 2 | 12,033,455 | 1.5 |
| Hawaii | 1 | 9,500,922 | 1.2 |
| Colorado | 1 | 7,750,064 | 0.9 |
| Arizona | 1 | 4,940,080 | 0.6 |
| Pennsylvania | 4 | 4,048,174 | 0.5 |
| Indiana | 1 | 3,412,500 | 0.4 |
| Michigan | 1 | 2,744,489 | 0.3 |
| Iowa | 1 | 2,574,830 | 0.3 |
| Illinois | 1 | 1,997,610 | 0.2 |
| Total: | 72 | $824,441,736 | 100.0% |
Property Type
| No. of Mortgaged Properties | Aggregate Cut-off Date Balance ($) | % of Pool | ||
| Retail | 28 | 316,651,033 | 38.4 | |
| Anchored | 4 | 112,852,666 | 13.7 | |
| Regional Lifestyle Center | 2 | 84,500,000 | 10.2 | |
| Regional Mall | 1 | 69,901,741 | 8.5 | |
| Shadow Anchored | 2 | 20,300,000 | 2.5 | |
| Single Tenant | 15 | 16,245,750 | 2.0 | |
| Unanchored | 4 | 12,850,877 | 1.6 | |
| Office | 5 | 190,250,000 | 23.1 | |
| CBD | 3 | 137,250,000 | 16.6 | |
| Suburban | 2 | 53,000,000 | 6.4 | |
| Hospitality | 8 | 100,324,136 | 12.2 | |
| Limited Service | 5 | 48,865,571 | 5.9 | |
| Full Service | 1 | 32,958,565 | 4.0 | |
| Select Service | 2 | 18,500,000 | 2.2 | |
| Mixed Use | 3 | 88,766,733 | 10.8 | |
| Office/Retail | 1 | 80,000,000 | 9.7 | |
| Retail/Office | 2 | $8,766,733 | 1.1 | |
| Multifamily | 16 | 75,769,957 | 9.2 | |
| Garden | 15 | 70,776,822 | 8.6 | |
| Mid Rise | 1 | 4,993,135 | 0.6 | |
| Self Storage | 11 | 49,267,377 | 6.0 | |
| Self Storage | 11 | 49,267,377 | 6.0 | |
| Manufactured Housing | 1 | 3,412,500 | 0.4 | |
| Manufactured Housing | 1 | 3,412,500 | 0.4 | |
| Total | 72 | $824,441,736 | 100.0% | |
Mortgage Rate (%)
| No. of Mortgage Loans | Aggregate Cut-off Date Balance ($) | % of Pool | |
| 3.1170 - 4.0000 | 7 | 299,829,016 | 36.4% |
| 4.0001 - 4.5000 | 20 | 278,226,504 | 33.7% |
| 4.5001 - 5.5000 | 15 | 246,386,216 | 29.9% |
| Total: | 42 | $824,441,736 | 100.0% |
| Min: 3.1170% Max: 5.5000% Wtd Avg: 4.1671% | |||
Original Term to Maturity or ARD (mos.)
| No. of Mortgage Loans | Aggregate Cut-off Date Balance ($) | % of Pool | |
| 60 | 2 | 53,000,000 | 6.4 |
| 120 | 40 | 771,441,736 | 93.6 |
| Total: | 42 | $824,441,736 | 100.0% |
| Min: 60 mos. Max: 120 mos. Wtd Avg: 116 mos. | |||
Remaining Term to Maturity or ARD (mos.)
| No. of Mortgage Loans | Aggregate Cut-off Date Balance ($) | % of Pool | |
| 57 - 84 | 2 | 53,000,000 | 6.4 |
| 100 - 120 | 40 | 771,441,736 | 93.6 |
| Total: | 42 | $824,441,736 | 100.0% |
| Min: 57 mos. Max: 120 mos. Wtd Avg: 115 mos. | |||
Original Amortization Term (mos.)
| No. of Mortgage Loans | Aggregate Cut-off Date Balance ($) | % of Pool | |
| Interest Only | 6 | 295,750,000 | 35.9 |
| 300 | 4 | 62,920,446 | 7.6 |
| 360 | 32 | 465,771,290 | 56.5 |
| Total: | 42 | $824,441,736 | 100.0% |
| Min: 300 mos. Max: 360 mos. Wtd Avg: 353 mos. | |||
Remaining Amortization Term (mos.)
| No. of Mortgage Loans | Aggregate Cut-off Date Balance ($) | % of Pool | |
| Interest Only | 6 | 295,750,000 | 35.9 |
| 299 - 300 | 4 | 62,920,446 | 7.6 |
| 301 - 360 | 32 | 465,771,290 | 56.5 |
| Total: | 42 | $824,441,736 | 100.0% |
| Min: 299 mos. Max: 360 mos. Wtd Avg: 352 mos. | |||
Mortgage Loan Sellers
| No. of Mortgage Loans | Aggregate Cut-off Date Balance ($) | % of Pool | |
| UBS AG, New York Branch | 13 | 329,818,407 | 40.0 |
| Morgan Stanley Mortgage Capital Holdings LLC | 6 | 188,170,083 | 22.8 |
| Bank of America, National Association | 14 | 122,814,810 | 14.9 |
| Natixis Real Estate Capital LLC | 8 | 113,736,696 | 13.8 |
| Morgan Stanley Mortgage Capital Holdings LLC / UBS AG, New York Branch | 1 | 69,901,741 | 8.5 |
| Total: | 42 | $824,441,736 | 100.0% |
Amortization Type
| No. of Mortgage Loans | Aggregate Cut-off Date Balance ($) | % of Pool | |
| Amortizing Balloon | 26 | 393,523,486 | 47.7 |
| Interest Only | 6 | 295,750,000 | 35.9 |
| Partial Interest Only | 10 | 135,168,250 | 16.4 |
| Total: | 42 | $824,441,736 | 100.0% |
Cut-off Date LTV Ratio (%)
| No. of Mortgage Loans | Aggregate Cut-off Date Balance ($) | % of Pool | |
| 31.7 - 40.0 | 1 | 1,997,610 | 0.2 |
| 40.1 - 50.0 | 5 | 151,662,963 | 18.4 |
| 50.1 - 60.0 | 6 | 104,302,411 | 12.7 |
| 60.1 - 65.0 | 7 | 228,115,205 | 27.7 |
| 65.1 - 70.0 | 15 | 233,448,588 | 28.3 |
| 70.1 - 75.0 | 8 | 104,914,958 | 12.7 |
| Total: | 42 | $824,441,736 | 100.0% |
| Min: 31.7% Max: 75.0% Wtd Avg: 61.8% | |||
Maturity Date or ARD LTV Ratio (%)
| No. of Mortgage Loans | Aggregate Cut-off Date Balance ($) | % of Pool | |
| 26.2 - 40.0 | 5 | 64,327,950 | 7.8 |
| 40.1 - 50.0 | 8 | 191,954,197 | 23.3 |
| 50.1 - 55.0 | 8 | 231,900,650 | 28.1 |
| 55.1 - 60.0 | 12 | 108,571,715 | 13.2 |
| 60.1 - 65.0 | 7 | 174,687,224 | 21.2 |
| 65.1 - 67.7 | 2 | 53,000,000 | 6.4 |
| Total: | 42 | $824,441,736 | 100.0% |
| Min: 26.2% Max: 67.7% Wtd Avg: 54.2% | |||
UW DSCR (x)
| No. of Mortgage Loans | Aggregate Cut-off Date Balance ($) | % of Pool | |
| 1.21 - 1.30 | 2 | 5,860,000 | 0.7 |
| 1.31 - 1.40 | 9 | 188,451,410 | 22.9 |
| 1.41 - 1.50 | 7 | 50,029,949 | 6.1 |
| 1.51 - 1.60 | 3 | 44,678,177 | 5.4 |
| 1.61 - 1.80 | 7 | 218,427,033 | 26.5 |
| 1.81 - 2.00 | 4 | 69,713,529 | 8.5 |
| 2.01 - 2.25 | 2 | 15,145,575 | 1.8 |
| 2.26 - 2.50 | 1 | 10,287,417 | 1.2 |
| 2.51 - 3.00 | 5 | 139,098,646 | 16.9 |
| 3.01 - 3.68 | 2 | 82,750,000 | 10.0 |
| Total: | 42 | $824,441,736 | 100.0% |
| Min: 1.21x Max: 3.68x Wtd Avg: 1.98x | |||
UW NOI Debt Yield (%)
| No. of Mortgage Loans | Aggregate Cut-off Date Balance ($) | % of Pool | |
| 7.3 - 8.0 | 3 | 143,281,639 | 17.4 |
| 8.1 - 9.0 | 14 | 164,621,597 | 20.0 |
| 9.1 - 9.5 | 3 | 36,438,124 | 4.4 |
| 9.6 - 10.0 | 2 | 39,201,474 | 4.8 |
| 10.1 - 11.0 | 5 | 152,295,885 | 18.5 |
| 11.1 - 12.0 | 2 | 81,997,254 | 9.9 |
| 12.1 - 14.0 | 8 | 145,486,627 | 17.6 |
| 14.1 - 16.0 | 1 | 11,733,075 | 1.4 |
| 16.1 - 21.8 | 4 | 49,386,063 | 6.0 |
| Total: | 42 | $824,441,736 | 100.0% |
| Min: 7.3% | Max: 21.8% | Wtd Avg: 10.6% |
| (1) | All numerical information concerning the mortgage loans is approximate and, in the case of mortgage loans secured by multiple properties, is based on allocated loan amounts with respect to such properties. All weighted average information regarding the mortgage loans reflects the weighting of the mortgage loans based on their outstanding principal balances as of the Cut-off Date or, in the case of mortgage loans secured by multiple properties, allocated loan amounts. The sum of numbers and percentages in columns may not match the “Total” due to rounding. With respect to any mortgage loan that is part of a whole loan, unless otherwise indicated, all LTV, DSCR and Debt Yield calculations include any relatedpari passu companion loans (other than the Novo Nordisk Unfunded Companion Loan) and exclude any related subordinate companion loans, as applicable. |
| (2) | “California – Northern” includes zip codes above 93600, and “California – Southern” includes zip codes at or below 93600. |
This is not a research report and was not prepared by any Underwriter’s research department. Please see additional important information and qualifications at the end of this Term Sheet.
T-24
| MSC 2016-UBS12 | Collateral Statistics |
Prepayment Restrictions
Percentage of Collateral by Prepayment Restrictions (%)(1)(2)(3)(4)
| Prepayment Restrictions | December 2016 | December 2017 | December 2018 | December 2019 | December 2020 |
| Locked Out/Defeasance | 100.0% | 100.0% | 83.2% | 83.3% | 83.4% |
| Yield Maintenance Total | 0.0% | 0.0% | 16.8% | 16.7% | 16.6% |
| Open | 0.0% | 0.0% | 0.0% | 0.0% | 0.0% |
| TOTAL | 100.0% | 100.0% | 100.0% | 100.0% | 100.0% |
| Pool Balance Outstanding | $824,441,736 | $817,708,728 | $810,583,413 | $802,002,663 | $792,803,509 |
| % Initial Pool Balance | 100.0% | 99.2% | 98.3% | 97.3% | 96.2% |
| Prepayment Restrictions | December 2021 | December 2022 | December 2023 | December 2024 | December 2025 |
| Locked Out/Defeasance | 82.3% | 82.3% | 82.4% | 82.5% | 82.6% |
| Yield Maintenance Total | 17.7% | 17.7% | 17.6% | 17.5% | 17.4% |
| Open | 0.0% | 0.0% | 0.0% | 0.0% | 0.0% |
| TOTAL | 100.0% | 100.0% | 100.0% | 100.0% | 100.0% |
| Pool Balance Outstanding | $730,017,268 | $719,325,229 | $708,152,471 | $696,535,526 | $684,337,569 |
| % Initial Pool Balance | 88.5% | 87.2% | 85.9% | 84.5% | 83.0% |
| (1) | The analysis is based on Structuring Assumptions set forth under “Yield and Maturity Considerations—Weighted Average Life” in the Preliminary Prospectus and a 0% CPR as discussed in the Preliminary Prospectus. |
| (2) | See description of Yield Maintenance under“Description of the Mortgage Pool—Certain Terms of the Mortgage Loans—Prepayment Protections and Certain Involuntary Prepayments” in the Preliminary Prospectus and Annex A-1 to the Preliminary Prospectus. |
| (3) | Mortgage loans modeled as Yield Maintenance include mortgage loans characterized by YM1 and DEF/YM1 on Annex A-1 to the Preliminary Prospectus. |
| (4) | There may be limited exceptions to the indicated prepayment restrictions arising out of casualties, condemnations, property releases and the application of earnout reserves |
This is not a research report and was not prepared by any Underwriter’s research department. Please see additional important information and qualifications at the end of this Term Sheet.
T-25
| MSC 2016-UBS12 | 681 Fifth Avenue |
Mortgage Loan No. 1 – 681 Fifth Avenue
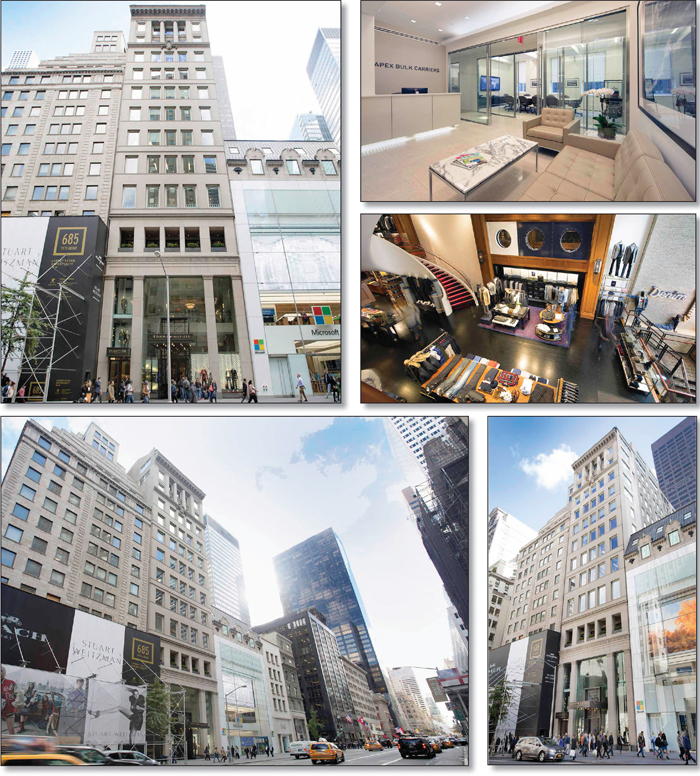
This is not a research report and was not prepared by any Underwriter’s research department. Please see additional important information and qualifications at the end of this Term Sheet.
T-26
| MSC 2016-UBS12 | 681 Fifth Avenue |
Mortgage Loan No. 1 – 681 Fifth Avenue
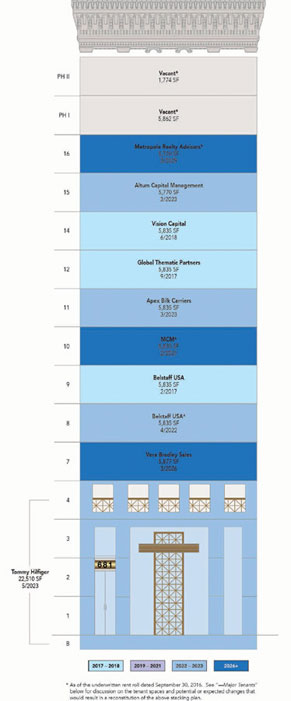
This is not a research report and was not prepared by any Underwriter’s research department. Please see additional important information and qualifications at the end of this Term Sheet.
T-27
| MSC 2016-UBS12 | 681 Fifth Avenue |
Mortgage Loan No. 1 – 681 Fifth Avenue
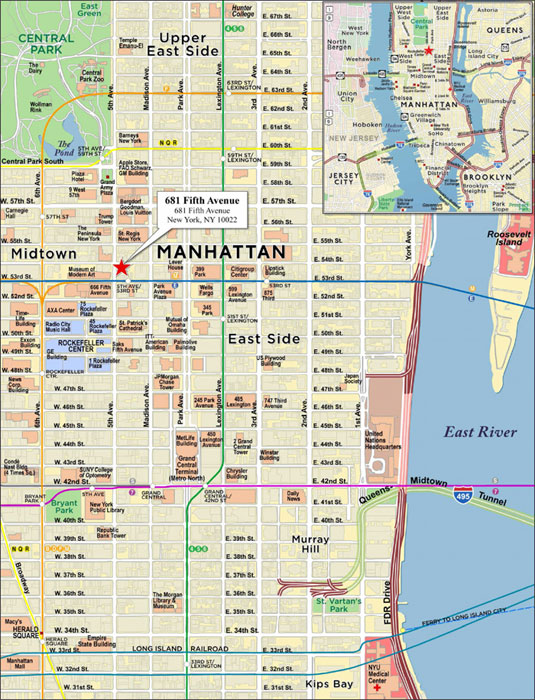
This is not a research report and was not prepared by any Underwriter’s research department. Please see additional important information and qualifications at the end of this Term Sheet.
T-28
| MSC 2016-UBS12 | 681 Fifth Avenue |
| Mortgage Loan No. 1 – 681 Fifth Avenue |
| Mortgage Loan Information | Property Information | |||||
| Mortgage Loan Seller: | UBS AG | Single Asset/Portfolio: | Single Asset | |||
| Original Balance(1): | $80,000,000 | Location: | New York, NY 10022 | |||
| Cut-off Date Balance(1): | $80,000,000 | General Property Type: | Mixed Use | |||
| % of Initial Pool Balance: | 9.7% | Detailed Property Type: | Office/Retail | |||
| Loan Purpose: | Refinance | Title Vesting: | Fee | |||
| Sponsor: | Robert Siegel | Year Built/Renovated: | 1913/2009 | |||
| Mortgage Rate: | 4.1265% | Size: | 82,573 SF | |||
| Note Date: | 11/4/2016 | Cut-off Date Balance per SF(1): | $2,604 | |||
| First Payment Date: | 12/6/2016 | Maturity Date Balance per SF(1): | $2,604 | |||
| Maturity Date: | 11/6/2026 | Property Manager: | Cushman & Wakefield, Inc.; Metropole Realty Advisors, Inc. (borrower-related) | |||
| Original Term to Maturity: | 120 months | |||||
| Original Amortization Term: | 0 months | |||||
| IO Period: | 120 months | Underwriting and Financial Information | ||||
| Seasoning: | 1 month | UW NOI(5)(6): | $15,590,650 | |||
| Prepayment Provisions(2): | LO (25); DEF (91); O (4) | UW NOI Debt Yield(1)(6): | 7.3% | |||
| Lockbox/Cash Mgmt Status: | Hard/In-Place | UW NOI Debt Yield at Maturity(1)(6): | 7.3% | |||
| Additional Debt Type(3): | Pari Passu | UW NCF DSCR(1)(6): | 1.67x | |||
| Additional Debt Balance(3): | $135,000,000 | Most Recent NOI(5)(6): | $14,449,529 (6/30/2016 TTM) | |||
| Future Debt Permitted (Type): | No (N/A) | 2nd Most Recent NOI(6): | $14,304,045 (12/31/2015) | |||
| Reserves(4) | 3rd Most Recent NOI(6): | $14,135,499 (12/31/2014) | ||||
| Type | Initial | Monthly | Cap | Most Recent Occupancy(6): | 90.8% (9/30/2016) | |
| RE Tax: | $848,821 | $151,575 | N/A | 2nd Most Recent Occupancy: | 90.8% (12/31/2015) | |
| Insurance: | $106,910 | $8,485 | N/A | 3rd Most Recent Occupancy: | 90.8% (12/31/2014) | |
| Recurring Replacements: | $0 | $1,376 | N/A | Appraised Value (as of): | $440,000,000 (10/1/2016) | |
| TI/LC: | $0 | Springing | N/A | Cut-off Date LTV Ratio(1): | 48.9% | |
| Other: | $2,472,743 | N/A | Springing | Maturity Date LTV Ratio(1): | 48.9% | |
| Sources and Uses | ||||||
| Sources | Proceeds | % of Total | Uses | Proceeds | % of Total | |
| Loan Amount(1): | $215,000,000 | 100.0% | Loan Payoff(7): | $144,877,973 | 67.4% | |
| Yield Maintenance Costs(7): | $9,704,812 | 4.5% | ||||
| Closing Costs: | $5,033,123 | 2.3% | ||||
| Reserves: | $3,428,474 | 1.6% | ||||
| Return of Equity: | $51,955,618 | 24.2% | ||||
| Total Sources: | $215,000,000 | 100.0% | Total Uses: | $215,000,000 | 100.0% | |
| (1) | The 681 Fifth Avenue Mortgage Loan is part of the 681 Fifth Avenue Whole Loan, which is comprised of sixpari passu promissory notes with an aggregate principal balance of $215,000,000. The Cut-off Date Balance per SF, Maturity Date Balance per SF, UW NOI Debt Yield, UW NOI Debt Yield at Maturity, UW NCF DSCR, Cut-off Date LTV Ratio and Maturity Date LTV Ratio numbers presented above are based on the aggregate principal balance of the promissory notes comprising the 681 Fifth Avenue Whole Loan. |
| (2) | Defeasance is permitted at any time after the end of the two-year period commencing on the closing date of the securitization of the last 681 Fifth Avenue Whole Loan promissory note to be securitized. |
| (3) | See “—The Mortgage Loan” and “—Additional Secured Indebtedness (not including trade debts)” below for further discussion of additional debt. |
| (4) | See “—Escrows and Reserves” below for further discussion of reserve requirements. |
| (5) | See“—Operating History and Underwritten Net Cash Flow” below for discussion of the increase in UW NOI over Most Recent NOI. |
| (6) | As of the underwritten rent roll dated September 30, 2016. See “—Major Tenants” below for discussion on the tenant spaces. |
| (7) | Loan Payoff includes a first mortgage loan and mezzanine loan, together with any applicable fees, of $119,675,056 and $25,202,917, respectively. Yield Maintenance Costs include yield maintenance premiums of $7.2 million and $2.5 million incurred in the payoff of the previous first mortgage and mezzanine loan, respectively. |
The Mortgage Loan. The largest mortgage loan (the “681 Fifth Avenue Mortgage Loan”) is part of a whole loan (the “681 Fifth Avenue Whole Loan”) evidenced by sixpari passu promissory notes in the aggregate original principal amount of $215,000,000, all of which are secured by a first priority fee mortgage encumbering a 17-story office and retail building totaling 82,573 SF in New York, New York (the “681 Fifth Avenue Property”). Promissory Note A-1, in the original principal amount of $80,000,000, represents the 681 Fifth Avenue Mortgage Loan. Promissory Notes A-2, A-3, A-4, A-5, and A-6, in the aggregate original principal amount of $135,000,000, collectively represent the serviced companion loans (the “681 Fifth Avenue ServicedPari Passu Companion Loans”). Promissory Notes A-2, A-3, and A-4, in the aggregate original principal amount of $49,000,000, are currently being held by UBS AG by and through its branch office at 1285 Avenue of the Americas, New York, New York (“UBS AG, New York Branch”), or an affiliate thereof, and are expected to be contributed to one or more future securitization trusts or otherwise transferred at any time. Promissory Notes A-5 and A-6, in the aggregate original principal amount of $86,000,000, are currently being held by Citigroup Global Markets Realty Corp., or an affiliate thereof, and are expected to be contributed to one or more future securitization trusts or otherwise transferred at any time. The 681 Fifth Avenue Whole Loan will be
This is not a research report and was not prepared by any Underwriter’s research department. Please see additional important information and qualifications at the end of this Term Sheet.
T-29
| MSC 2016-UBS12 | 681 Fifth Avenue |
serviced pursuant to the pooling and servicing agreement for the MSC 2016-UBS12 transaction. See “Description of the Mortgage Pool—The Whole Loans—The Serviced Pari Passu Whole Loans” and “Pooling and Servicing Agreement” in the Preliminary Prospectus.
The proceeds of the 681 Fifth Avenue Whole Loan were used to pay off a previous mortgage loan and mezzanine loan secured by the 681 Fifth Avenue Property, pay yield maintenance costs, fund reserves, pay closing costs, and return equity to the borrower. The previous mortgage loan secured by the 681 Fifth Avenue Property was included in the DBUBS 2011-LC1A transaction and the RCMC 2012-CREL1 transaction.
The Borrower and the Sponsor. The borrower is 681 Fifth Avenue LLC (the “681 Fifth Avenue Borrower”), a single-purpose Delaware limited liability company structured to be bankruptcy-remote, with two independent directors. The 681 Fifth Avenue Borrower is indirectly owned by Robert Siegel (54.5%), Katherine R. Stallings (2.0%), and Patrick Guerrand-Hermes and Martine Guerrand-Hermes (43.5%). The sponsor and the nonrecourse carve-out guarantor of the 681 Fifth Avenue Mortgage Loan is Robert Siegel.
Robert Siegel is the CEO of Metropole Realty Advisors, Inc. (“Metropole”), an affiliated property manager of the 681 Fifth Avenue Property and an affiliate of the 681 Fifth Avenue Borrower. Metropole engages in commercial real estate development, brokerage, and construction throughout the United States, including Chicago, New York, Los Angeles, and Hawaii. In addition to its real estate investments in luxury retail properties, Metropole has acted as an advisor to developers and high end retail tenants for over 35 years. Patrick Guerrand-Hermès and Martine Guerrand-Hermès are members of the Hermès family of designer clothing retailers.
The Property. The 681 Fifth Avenue Property is a pre-war, 17-story, 82,573 SF Class A mixed use retail and office building located at the southeast intersection of Fifth Avenue and East 54th Street. The 681 Fifth Avenue Property consists of 60,063 SF of office space and 22,510 SF of retail space with 42 feet of frontage along Fifth Avenue. The 681 Fifth Avenue Property is in close proximity to Central Park, Rockefeller Center, Radio City Music Hall, and Times Square, and within walking distance to several mass transit options including the B, D, E, F, M, N, Q, R, 4, 5, and 6 subway trains (all within six blocks). Located in proximity to destination retailers such as Saks Fifth Avenue department store, Niketown, Tiffany & Co., Louis Vuitton, Cartier, Apple Store, and Microsoft, the 681 Fifth Avenue Property benefits from consistent foot traffic and tourism. According to a third party market research report, in 2015, New York City welcomed approximately 58.3 million international and domestic visitors who spent $41 billion.
The 681 Fifth Avenue Borrower has contributed approximately $68.6 million in capital improvements, lease buyouts, and leasing commissions to the 681 Fifth Avenue Property. Between 2008 and 2009, the 681 Fifth Avenue Property underwent an extensive renovation modernizing the building to Class A quality retail and office standard. Upgrades include a replacement of the mechanical equipment, elevators, electrical service, windows, and upgrades to the lobby and common areas. The office space at the 681 Fifth Avenue Property is managed by Cushman & Wakefield, Inc., a third party management firm that manages a 590 million SF portfolio across the United States. The retail space at the 681 Fifth Avenue Property is managed by Metropole. Metropole currently occupies 5,770 SF (the 16th floor) at the 681 Fifth Avenue Property and has entered into a second amendment to its lease to relocate and expand its leased premises to 7,636 SF (the penthouse floors) at the 681 Fifth Avenue Property upon completion of tenant improvement work. At loan origination, $1,700,000 was reserved for outstanding tenant improvements for Metropole in connection with its relocation and expansion.
The 681 Fifth Avenue Property is currently 90.8% occupied as of September 30, 2016 by nine office tenants and one retail tenant. The largest tenant, Tommy Hilfiger, occupies 22,510 SF (27.3% NRA; 76.8% U/W Base Rent) of space and has been in occupancy at the 681 Fifth Avenue Property since June 2008. The second largest tenant, Vera Bradley, occupies 5,877 SF (7.1% NRA; 2.2% U/W Base Rent) of space expiring in March 2026. The third largest tenant, Vision Capital, occupies 5,835 SF (7.1% NRA; 3.0% U/W Base Rent) of space and has been in occupancy at the 681 Fifth Avenue Property since March 2011. No tenant at the 681 Fifth Avenue Property occupies more than 7.1% of net rentable area other than Tommy Hilfiger. Historical occupancy at the 681 Fifth Avenue Property has remained consistent at 90.8% since 2012.
Major Tenants.
Tommy Hilfiger (22,510 SF, 27.3% of NRA, 76.8% of underwritten rent).Tommy Hilfiger is a designer lifestyle brand. Founded in 1985, Tommy Hilfiger’s collections include apparel, accessories, and footwear for men, women, and kids, including sportswear and denim. Tommy Hilfiger was acquired in 2010 by PVH Corp. (NYSE: PVH; Moody’s/S&P: Ba2/BB+), a global apparel and retail company. Global retail revenue for the Tommy Hilfiger brand was $3.4 billion in 2015. Tommy Hilfiger has leased the entire retail space of 22,510 SF at the 681 Fifth Avenue Property since June 2008 and currently utilizes the space as one of its seven global flagship stores and its only store in New York City. Tommy Hilfiger pays a current base rent of $596.52 PSF which increases by 3.0% annually on June 1 under a 15-year modified gross lease that expires May 31, 2023. The tenant is required to reimburse real estate taxes based on 60% of the increase over the tenant’s 2007/2008 base year amount and insurance costs based on 50% of the increase over the tenant’s 2008 base year amount. The tenant has notified the 681 Fifth Avenue Borrower of its intention to explore subleasing its space. The currently in place lease provides the 681 Fifth Avenue Borrower the right to receive 75% of any sublease rent in excess of Tommy Hilfiger’s contractual rent. Tommy Hilfiger does not have a right to go dark on the ground floor and second floor and such default beyond any applicable cure period set forth in its lease would allow the 681 Fifth Avenue Borrower to realize on the tenant’s $6.66 million letter of credit security deposit for any unpaid amounts due to the 681 Fifth Avenue Borrower under the lease. Tommy Hilfiger does not have any renewal or termination options. As of November 14, 2016, PVH Corp. affirmatively provided a guaranty of the lease previously guaranteed by subsidiaries Tommy Hilfiger USA, Inc. and Tommy Hilfiger B.V.
This is not a research report and was not prepared by any Underwriter’s research department. Please see additional important information and qualifications at the end of this Term Sheet.
T-30
| MSC 2016-UBS12 | 681 Fifth Avenue |
The following table presents certain information relating to the leases at the 681 Fifth Avenue Property:
| Tenant Summary(1) | |||||||
| Tenant Name | Credit Rating (Fitch/Moody’s/S&P)(2) | Tenant SF | Approximate % of SF | Annual UW Rent | % of Total Annual UW Rent | Annual UW Rent PSF(3) | Lease Expiration |
| Major Tenants | |||||||
| Tommy Hilfiger(4) | NR/Ba2/BB+ | 22,510 | 27.3% | $13,830,596 | 76.8% | $614.42 | 5/31/2023 |
| Vera Bradley | NR/NR/NR | 5,877 | 7.1% | $399,606 | 2.2% | $67.99 | 3/31/2026 |
| Vision Capital | NR/NR/NR | 5,835 | 7.1% | $533,205 | 3.0% | $91.38 | 6/30/2018 |
| Global Thematic Partners | NR/NR/NR | 5,835 | 7.1% | $520,549 | 2.9% | $89.21 | 9/30/2017 |
| Apex Bulk Carriers | NR/NR/NR | 5,835 | 7.1% | $459,948 | 2.6% | $78.83 | 3/31/2023 |
| Subtotal/Wtd. Avg. | 45,892 | 55.6% | $15,743,904 | 87.4% | $343.06 | ||
| Other Tenants(5) | 29,045 | 35.2% | $2,274,284 | 12.6% | $78.30 | ||
| Vacant Space | 7,636 | 9.2% | $0 | 0.0% | $0.00 | ||
| Total/Wtd. Avg. | 82,573 | 100.0% | $18,018,189 | 100.0% | $240.44 | ||
| (1) | Information is based on the underwritten rent roll. |
| (2) | Certain ratings are those of the parent company whether or not the parent guarantees the lease. |
| (3) | Wtd. Avg. Annual UW Rent PSF excludes vacant space. |
| (4) | Tommy Hilfiger has notified the 681 Fifth Avenue Borrower of its intention to explore subleasing its space. |
| (5) | MCM Products USA, Inc. (“MCM”) currently subleases the 10th floor from Belstaff USA through February 12, 2017 and has entered into a direct lease for 100.0% of its current premises beginning February 14, 2017 through February 28, 2027. At loan origination, the 681 Fifth Avenue Borrower reserved $250,262 which is equal to seven months of free rent for MCM’s space and $134,600 for outstanding leasing commissions for MCM. Forall USA, Inc. currently subleases the 8th floor from Belstaff USA through March 31, 2022. |
The following table presents certain information relating to the lease rollover schedule at the 681 Fifth Avenue Property:
| Lease Rollover Schedule(1)(2) | ||||||||
| Year | # of | SF Rolling | Annual UW Rent PSF Rolling(3) | Approx. % of Total SF Rolling | Approx. of SF Rolling | Total UW Rent Rolling | Approx. % of Total Rent Rolling | Approx. of Total Rent Rolling |
| MTM | 0 | 0 | $0.00 | 0.0% | 0.0% | $0 | 0.0% | 0.0% |
| 2016 | 0 | 0 | $0.00 | 0.0% | 0.0% | $0 | 0.0% | 0.0% |
| 2017(4) | 2 | 11,670 | $75.92 | 14.1% | 14.1% | $885,939 | 4.9% | 4.9% |
| 2018 | 1 | 5,835 | $91.38 | 7.1% | 21.2% | $533,205 | 3.0% | 7.9% |
| 2019 | 0 | 0 | $0.00 | 0.0% | 21.2% | $0 | 0.0% | 7.9% |
| 2020 | 0 | 0 | $0.00 | 0.0% | 21.2% | $0 | 0.0% | 7.9% |
| 2021 | 0 | 0 | $0.00 | 0.0% | 21.2% | $0 | 0.0% | 7.9% |
| 2022(5) | 1 | 5,835 | $68.56 | 7.1% | 28.3% | $400,046 | 2.2% | 10.1% |
| 2023 | 3 | 34,115 | $434.34 | 41.3% | 69.6% | $14,817,427 | 82.2% | 92.3% |
| 2024 | 0 | 0 | $0.00 | 0.0% | 69.6% | $0 | 0.0% | 92.3% |
| 2025 | 0 | 0 | $0.00 | 0.0% | 69.6% | $0 | 0.0% | 92.3% |
| 2026 | 1 | 5877 | $67.99 | 7.1% | 76.7% | $399,606 | 2.2% | 94.6% |
| 2027 & Beyond(4)(6) | 2 | 11,605 | $84.62 | 14.1% | 90.8% | $981,965 | 5.4% | 100.0% |
| Vacant | 0 | 7,636 | $0.00 | 9.2% | 100.0% | $0 | 0.0% | 100.0% |
| Total/Wtd. Avg. | 10 | 82,573 | $240.44 | 100.0% | $18,018,189 | 100.0% |
| |
| (1) | Information is based on the underwritten rent roll. |
| (2) | Certain tenants may have lease termination options that are exercisable prior to the originally stated expiration date of the subject lease and that are not considered in the lease rollover schedule. |
| (3) | Wtd. Avg. Annual UW Rent PSF Rolling excludes vacant space. |
| (4) | MCM currently subleases the tenth floor, comprised of 5,835 SF, from Belstaff USA until its sublease expiration on February 12, 2017. MCM has an executed direct lease for 100.0% of its current premises beginning February 14, 2017 through February 28, 2027 at an initial rent of $73.53 PSF. MCM’s space is underwritten to its direct ten-year lease at $73.53 PSF beginning February 14, 2017. At loan origination, the 681 Fifth Avenue Borrower reserved $250,262 which is equal to seven months of free rent for MCM’s space. |
| (5) | Forall USA, Inc. currently subleases the 8th floor from Belstaff USA through March 31, 2022. |
| (6) | Metropole currently occupies 5,770 SF (16th floor) at the 681 Fifth Avenue Property and has entered into a second amendment to its lease to expand and relocate to 7,636 SF (penthouse floors) which is currently vacant, once tenant improvement work is completed. At loan origination, the 681 Fifth Avenue Borrower reserved $1.7 million for tenant improvement work in connection with Metropole’s relocation. Metropole will continue paying contractual rent on the 16th floor until its relocation, and after such move, will pay the same nominal annual UW rent of $552,944 with annual rent steps of 1.5%. |
The Market. The 681 Fifth Avenue Property is located on Fifth Avenue in the Plaza District between 53rd Street and 54th Street, in midtown Manhattan, with 42 feet of frontage along the east side of Fifth Avenue between the Microsoft and Coach retail locations. According to the appraisal, the Plaza District has historically exhibited the highest office rental rates in midtown Manhattan. Midtown Manhattan is the largest office market in Manhattan, and
This is not a research report and was not prepared by any Underwriter’s research department. Please see additional important information and qualifications at the end of this Term Sheet.
T-31
| MSC 2016-UBS12 | 681 Fifth Avenue |
features a number of well-known buildings including the GM building, the Empire State Building, and the Bank of America Tower. The 681 Fifth Avenue Property is located 0.2 miles north of the Saks Fifth Avenue department store and surrounded by well-known New York landmarks and attractions.
The estimated 2016 population within a one-, three- and five-mile radius of the 681 Fifth Avenue Property is 185,431, 1,291,066, and 2,745,842, respectively, according to a third party market research report. The population within a one-, three- and five-mile radius of the 681 Fifth Avenue Property is projected to increase by 0.63%, 0.62% and 0.78%, respectively, through 2021, according to a third party market research report. The estimated 2016 average household income within a one-, three- and five-mile radius of the 681 Fifth Avenue Property is estimated to be $165,450, $136,798, and $112,769, respectively.
According to the appraisal, the 681 Fifth Avenue Property is located within the Upper Fifth Avenue retail submarket of Manhattan in New York, New York, which consists of 69 ground floor retail units and, as of the second quarter of 2016, exhibited a vacancy rate of 11.6% and an average rental rate and asking rent range of $2,980 PSF and $2,700 to $4,450 PSF, respectively, for direct ground floor retail space. According to a third party market research report, the 681 Fifth Avenue Property is located within the Plaza District retail submarket of Manhattan in New York, New York, which consists of 249 retail buildings totaling approximately 4.3 million SF of retail space. As of the second quarter of 2016, the Plaza District retail submarket vacancy rate was 4.2% and the average rental rate was $160.00 PSF for retail space. According to the appraisal, in-place retail rent at the 681 Fifth Avenue Property is 25.7% below market.
According to a third party market research report, the 681 Fifth Avenue Property is located within the Plaza District office submarket of Manhattan in New York, New York, which consists of 445 buildings totaling approximately 88.3 million SF of office space. As of the second quarter of 2016, the Plaza District Class A office submarket vacancy rate was 8.8% and the average rental rate was $75.61 PSF. According to the appraisal, in-place office rents at the 681 Fifth Avenue Property are 7.1% below market.
The following table presents leasing data at certain office competitive properties with respect to the 681 Fifth Avenue Property:
| Competitive Property Summary | ||||
| Comparable Name | Original Year Built | Size (SF) | Total Occupancy | Asking Rent PSF |
| 681 Fifth Avenue Property | 1913 | 82,573(1) | 90.8%(1) | $87.66(2) |
| 610 Fifth Avenue | 1933 | 82,448 | 100.0% | N/A |
| 665 Fifth Avenue | 1974 | 135,300 | 100.0% | N/A |
| 685 Fifth Avenue | 1926 | 34,170 | 100.0% | N/A |
| 689 Fifth Avenue | 1926 | 90,000 | 100.0% | N/A |
| 720 Fifth Avenue | 1953 | 132,317 | 95.5% | $79.00 |
| 724 Fifth Avenue | 1921 | 54,000 | 100.0% | N/A |
| Total/Wtd. Avg.(3) | 528,235 | 98.9% | $79.00 | |
Source:Appraisal
| (1) | Information is based on the underwritten rent roll. |
| (2) | Based on appraisal concluded market rental rates for the 60,063 SF office space at the 681 Fifth Avenue Property. |
| (3) | Total/Wtd. Avg. excludes the 681 Fifth Avenue Property. |
This is not a research report and was not prepared by any Underwriter’s research department. Please see additional important information and qualifications at the end of this Term Sheet.
T-32
| MSC 2016-UBS12 | 681 Fifth Avenue |
Operating History and Underwritten Net Cash Flow.The following table presents certain information relating to the historical operating performance and the Underwritten Net Cash Flow at the 681 Fifth Avenue Property:
| Cash Flow Analysis | ||||||||||||
| 2013 | 2014 | 2015 | 6/30/2016 TTM | UW(1) | UW PSF | |||||||
| Base Rent(2) | $15,934,792 | $16,373,915 | $16,481,473 | $16,728,353 | $18,858,149 | $228.38 | ||||||
| Total Recoveries(3) | $351,725 | $466,253 | $630,174 | $702,957 | $2,216,241 | $26.84 | ||||||
| Other Income | $119,260 | $110,399 | $179,847 | $184,942 | $141,773 | $1.72 | ||||||
| Less Vacancy & Credit Loss | $0 | $0 | $0 | $0 | ($839,960) | ($10.17) | ||||||
| Effective Gross Income | $16,405,777 | $16,950,567 | $17,291,494 | $17,616,251 | $20,376,202 | $246.77 | ||||||
| Total Operating Expenses(3) | $2,677,722 | $2,815,068 | $2,987,449 | $3,166,722 | $4,785,552 | $57.96 | ||||||
| Net Operating Income | $13,728,055 | $14,135,499 | $14,304,045 | $14,449,529 | $15,590,650 | $188.81 | ||||||
| Capital Expenditures | $0 | $0 | $0 | $0 | $15,389 | $0.19 | ||||||
| TI/LC | $0 | $0 | $0 | $0 | $553,128 | $6.70 | ||||||
| Net Cash Flow | $13,728,055 | $14,135,499 | $14,304,045 | $14,449,529 | $15,022,133 | $181.93 | ||||||
| Occupancy % | 90.8% | 90.8% | 90.8% | 90.8% | 90.8% | |||||||
| NOI DSCR(4) | 1.53x | 1.57x | 1.59x | 1.61x | 1.73x | |||||||
| NCF DSCR(4) | 1.53x | 1.57x | �� | 1.59x | 1.61x | 1.67x | ||||||
| NOI Debt Yield(4) | 6.4% | 6.6% | 6.7% | 6.7% | 7.3% | |||||||
| NCF Debt Yield(4) | 6.4% | 6.6% | 6.7% | 6.7% | 7.0% | |||||||
| (1) | As of the underwritten rent roll dated September 30, 2016. MCM Products USA, Inc. (“MCM”) currently subleases the 10th floor from Belstaff USA through February 12, 2017 and has entered into a direct lease for 100.0% of its current premises beginning February 14, 2017 through February 28, 2027. At loan origination, the 681 Fifth Avenue Borrower reserved $250,262 which is equal to seven months of free rent for MCM’s space and $134,600 for outstanding leasing commissions for MCM. Forall USA, Inc. currently subleases the 8th floor from Belstaff USA through March 31, 2022. Metropole currently occupies 5,770 SF (16th floor) at the 681 Fifth Avenue Property and has entered into a second amendment to its lease to expand and relocate to 7,636 SF (penthouse floors) which is currently vacant, once tenant improvement work is completed. At loan origination, the 681 Fifth Avenue Borrower reserved $1.7 million for tenant improvement work in connection with Metropole’s relocation. Metropole will continue paying contractual rent on the 16th floor until its relocation, and after such move, will pay the same nominal annual UW rent of $552,944 with annual rent steps of 1.5%. |
| (2) | The increase in UW Base Rent over 6/30/2016 TTM Base Rent is primarily attributed to Tommy Hilfiger’s rent step up in June 2016 of $391,100, vacancy gross up of approximately $839,960, and contractual rent steps effective November 1, 2017 of $478,126. |
| (3) | The 681 Fifth Avenue Property currently benefits from a $19,095,750 real estate tax abatement that begins to amortize annually over a five-year term commencing during the 2016/2017 fiscal year and ends after the 2020/2021 fiscal year. UW real estate taxes are underwritten to the ten-year average of estimated real estate tax payments based on the assessed value of $36,068,402 and tax rate of 10.656% and the five-year abatement schedule. UW real estate tax recoveries are underwritten to the ten-year average of estimated reimbursements based on the estimated real estate tax payments and current in-place lease structures for reimbursement of increases in real estate taxes over base years. The estimated abated real estate taxes and unabated real estate taxes due in 2016/2017 and 2021/2022, respectively, are approximately $1.8 million and $3.9 million, respectively. The estimated real estate tax recoveries collected in 2016/2017 and 2021/2022 are approximately $744,000 and $2.6 million, respectively. |
| (4) | Debt service coverage ratios and debt yields are based on the 681 Fifth Avenue Whole Loan. |
Escrows and Reserves. The 681 Fifth Avenue Borrower deposited $848,821 in escrow for annual real estate taxes and $106,910 in escrow for insurance premiums at loan origination and is required to escrow monthly 1/12 of the annual estimated tax payments and annual estimated insurance premiums. The 681 Fifth Avenue Borrower also deposited $250,262 for rent concessions for MCM, $387,881 for outstanding tenant improvements for Vera Bradley, $1,700,000 for outstanding tenant improvements for Metropole (affiliated property manager and an affiliate of the 681 Fifth Avenue Borrower), and $134,600 for outstanding leasing commissions for MCM. On every monthly payment date, the 681 Fifth Avenue Borrower is required to escrow $1,376 for capital expenditures. During the continuance of a Material Tenant Trigger Event (as defined below), all excess cash flow is required to be deposited into a reserve (the “Material Tenant TI/LC Reserve”), subject to a cap of $10,000,000 (the “Material Tenant TI/LC Reserve Cap”), to be used in connection with tenant improvements and leasing commissions incurred with respect to a Material Tenant (as defined below) space.
A “Material Tenant Trigger Event” will commence upon the earlier of (i) a Material Tenant giving notice of its intention to terminate or cancel its lease; (ii) a Material Tenant failing to extend or renew its lease on or prior to 18 months prior to the then applicable expiration date of its lease; (iii) a Material Tenant being (a) more than 30 days in arrears with respect to the payment of base rent under its lease, (b) in default, beyond applicable notice and cure periods, with respect to any other monetary obligations in excess of $75,000, in the aggregate, under its lease, or (c) subject to a material non-monetary event of default beyond applicable notice and cure periods under its lease; (iv) the bankruptcy or insolvency of a Material Tenant or, if applicable, any guarantor of a Material Tenant’s obligations under its lease (other than Tommy Hilfiger B.V., f/k/a Elmira 1 B.V. as co-guarantor of Tommy Hilfiger’s lease); (v) the termination of a lease with a Material Tenant; or (vi) a Material Tenant going dark, vacating, ceasing to occupy or discontinuing its operations at the 681 Fifth Avenue Property; provided however, that clause (vi) will not constitute a Material Tenant Trigger Event if (a) the applicable Material Tenant is Tommy Hilfiger, (b) the applicable Material Tenant or related lease guarantor is an investment grade rated entity, or (c) the applicable Material Tenant has gone dark, vacated, ceased to occupy or discontinued its operations at the 681 Fifth Avenue Property on a temporary basis in connection with remodeling, renovation, or restoration of its premises. Notwithstanding the above, a termination or partial termination of the Tommy Hilfiger lease in connection with a new lease entered into in accordance with the loan documents will not, in and of itself, constitute a Material Tenant Trigger Event. A Material Tenant Trigger Event will continue until the 681 Fifth Avenue Borrower deposits with lender cash or a letter of credit in the amount of $10,000,000 to be held in the Material Tenant TI/LC Reserve, or in regard to clause (i) above, the Material Tenant withdraws its notice of intention to terminate or cancel; or in regard to clauses (i), (ii), (v), or (vi) above, (a) the 681 Fifth Avenue Borrower has entered into a new Major Lease (as defined below) or extension of the term of an existing Major Lease with respect to all or any portion of the retail space in accordance with the requirements of the loan documents and the 681 Fifth Avenue Property achieves a debt service coverage ratio of at least 1.50x; provided however, that in regard to clause (vi) above, such cure must be a new lease and not an extension of the existing lease and (b) the substantial completion of all landlord work and either (1) the expiration of all rent concessions, the payment of tenant allowances and the satisfaction of certain leasing commission payment obligations or (2) deposit by the 681 Fifth Avenue Borrower of certain amounts in lieu thereof, and the execution and delivery of an estoppel certificate to the lender; or in regard to clause (iii) above, the applicable event of default has been cured; or in regard to clause (iv) above, either (x) the affirmation of
This is not a research report and was not prepared by any Underwriter’s research department. Please see additional important information and qualifications at the end of this Term Sheet.
T-33
| MSC 2016-UBS12 | 681 Fifth Avenue |
the applicable lease in the bankruptcy proceeding, provided that the applicable Material Tenant will be actually paying all rents and other amounts due under such lease or (y) the discharge or dismissal of the applicable lease guarantor from such bankruptcy proceeding, provided that such bankruptcy proceeding does not have an adverse effect on such lease guarantor’s ability to perform its obligations under the applicable lease guaranty; or in regard to clause (vi) above, the applicable Material Tenant recommences its operations at the premises.
A “Material Tenant” means (i) Tommy Hilfiger or (ii) any tenant or replacement tenant that together with its affiliates, leases all or a portion of the retail space at the 681 Fifth Avenue Property.
A “Major Lease” means any lease that (i) either individually or together with its affiliates, assuming the exercise of all expansion rights (a) covers or is expected to cover 15,000 SF or more of the net rentable area of the 681 Fifth Avenue Property or (b) constitutes 10% or more of the annual rentable income for the 681 Fifth Avenue Property; (ii) contains an option or preferential right to purchase all or any portion of the 681 Fifth Avenue Property; (iii) is with an affiliate of the 681 Fifth Avenue Borrower, guarantor, or manager as tenant; (iv) is entered into during the continuation of an event of default; or (v) is entered into with any Material Tenant.
Lockbox and Cash Management. The 681 Fifth Avenue Whole Loan provides for a hard lockbox and in-place cash management. Provided no event of default has occurred and is continuing, all funds in the cash management account are required to be applied on each monthly payment date to pay debt service on the 681 Fifth Avenue Whole Loan, to fund the required reserves deposits as described above under “—Escrows and Reserves,” to pay for operating expenses in accordance with the annual budget and not otherwise paid or reserved for as described above under “—Escrows and Reserves,” during the continuance of either a Material Tenant Trigger Event and/or Cash Sweep Event (as defined below), to pay for any extraordinary expenses not referenced in the annual budget approved by the lender that exceed certain thresholds set forth in the loan documents, and during the continuance of a Material Tenant Trigger Event, to deposit the excess cash flow into the Material Tenant TI/LC Reserve, subject to the Material Tenant TI/LC Reserve Cap, and during the continuance of a Cash Sweep Event (and so long as no Material Tenant Trigger Event is then continuing unless the Material Tenant TI/LC Reserve Cap has been satisfied), to deposit the excess cash flow with the lender to be held as additional security for the 681 Fifth Avenue Whole Loan. Provided no Material Tenant Trigger Event is then continuing (unless the Material Tenant TI/LC Reserve Cap has been satisfied) and no Cash Sweep Event is then continuing, all excess cash flow will be remitted to the 681 Fifth Avenue Borrower.
A “Cash Sweep Event” will commence upon (i) an event of default, (ii) any bankruptcy action involving the 681 Fifth Avenue Borrower, guarantor, or an affiliated property manager, or (iii) as of the end of any calendar quarter, the debt service coverage ratio, generally based on the current monthly base rents annualized and expenses for trailing 12-month period, falling below 1.15x. A Cash Sweep Event will continue until, in regard to clause (i) above, the cure of such event of default and acceptance of such cure by the lender, in regard to clause (ii) above, the filing being discharged, stayed or dismissed within 60 days for the 681 Fifth Avenue Borrower or guarantor or 120 days for the affiliated property manager, and lender’s determination that such filing does not materially affect the 681 Fifth Avenue Borrower’s, guarantor’s or property manager’s monetary obligations, or in regard to clause (iii) above, the date the debt service coverage ratio (calculated as described in clause (iii)) is greater than or equal to 1.20x for two consecutive calendar quarters.
Additional Secured Indebtedness (not including trade debts). The 681 Fifth Avenue Property also secures the 681 Fifth Avenue Serviced Pari Passu Companion Loans, with a cut-off date balance of $135,000,000. The promissory notes evidencing the 681 Fifth Avenue Serviced Pari Passu Companion Loans accrue interest at the same rate as the 681 Fifth Avenue Mortgage Loan. The 681 Fifth Avenue Mortgage Loan is entitled to payments of principal and interest on a pro rata and pari passu basis with the 681 Fifth Avenue Serviced Pari Passu Companion Loans. The holders of the 681 Fifth Avenue Mortgage Loan and the 681 Fifth Avenue Serviced Pari Passu Companion Loans have entered into a co-lender agreement that sets forth the allocation of collections on the 681 Fifth Avenue Whole Loan. See “Description of the Mortgage Pool—The Whole Loans—The Serviced Pari Passu Whole Loans” in the Preliminary Prospectus.
Mezzanine Loan and Preferred Equity. Not permitted.
Release of Property. Not permitted.
Terrorism Insurance.The 681 Fifth Avenue Borrower is required to obtain insurance against acts of terrorism or other similar acts or events (or “fire following”) to the extent such insurance is available in form and substance reasonably satisfactory to lender (but, if the Terrorism Risk Insurance Program Reauthorization Act of 2007, as it may be amended, is no longer in effect, in no event is the 681 Fifth Avenue Borrower required to expend more than the sum of 200% of annual insurance premiums for all risk property and business interruption coverages, exclusive of the portion of premiums, if any with respect to flood, earthquake, and terrorism coverage).
This is not a research report and was not prepared by any Underwriter’s research department. Please see additional important information and qualifications at the end of this Term Sheet.
T-34
(THIS PAGE INTENTIONALLY LEFT BLANK)
This is not a research report and was not prepared by any Underwriter’s research department. Please see additional important information and qualifications at the end of this Term Sheet.
T-35
| MSC 2016-UBS12 | 191 Peachtree |
Mortgage Loan No. 2 – 191 Peachtree
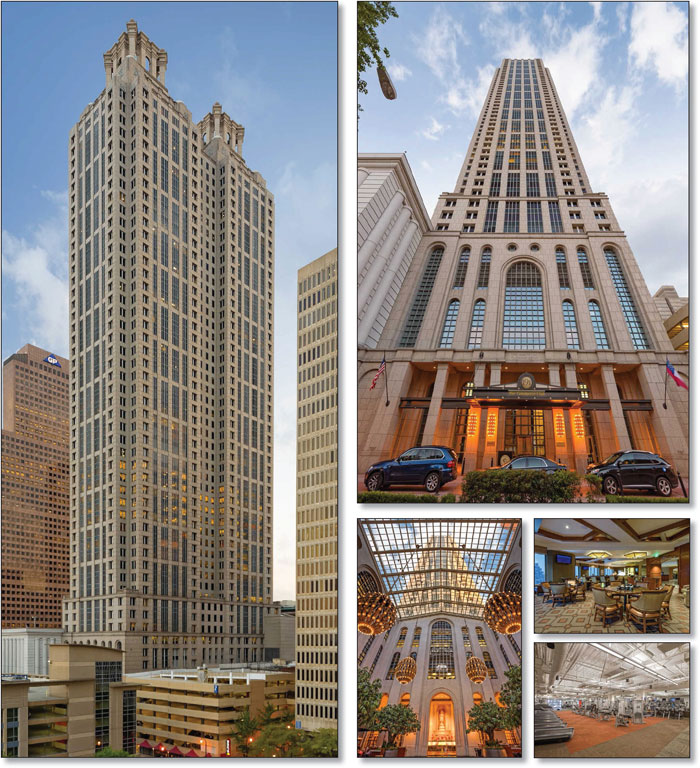
This is not a research report and was not prepared by any Underwriter’s research department. Please see additional important information and qualifications at the end of this Term Sheet.
T-36
| MSC 2016-UBS12 | 191 Peachtree |
Mortgage Loan No. 2 – 191 Peachtree
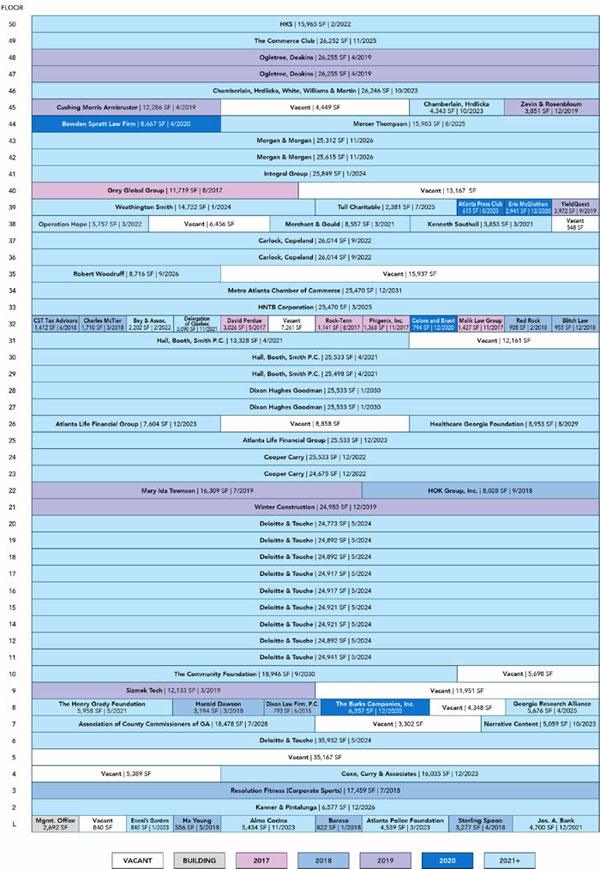
This is not a research report and was not prepared by any Underwriter’s research department. Please see additional important information and qualifications at the end of this Term Sheet.
T-37
| MSC 2016-UBS12 | 191 Peachtree |
Mortgage Loan No. 2 – 191 Peachtree
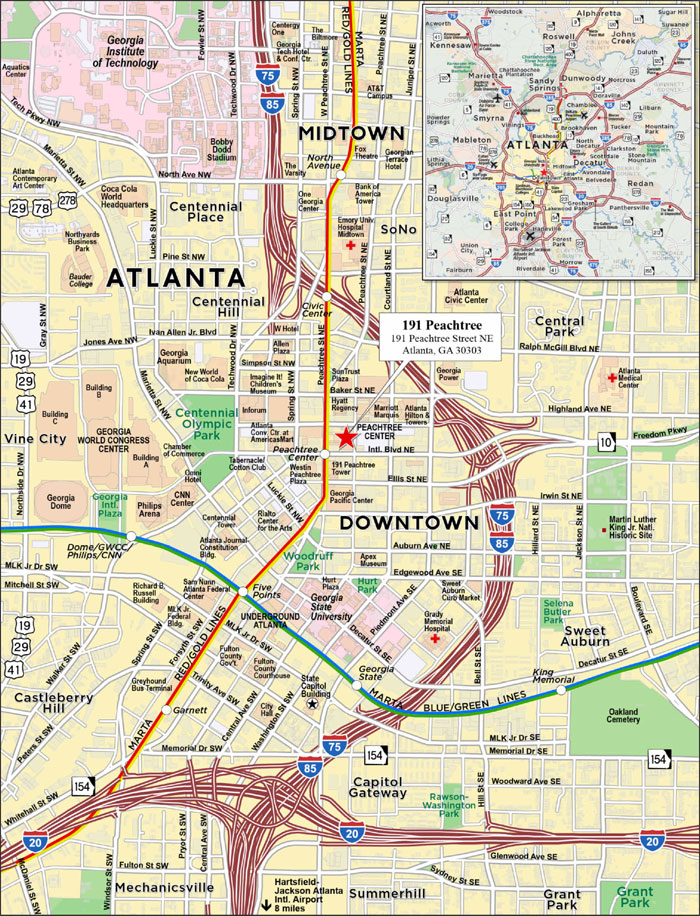
This is not a research report and was not prepared by any Underwriter’s research department. Please see additional important information and qualifications at the end of this Term Sheet.
T-38
| MSC 2016-UBS12 | 191 Peachtree |
| Mortgage Loan No. 2 – 191 Peachtree |
| Mortgage Loan Information | Property Information | ||||||
| Mortgage Loan Seller: | MSMCH | Single Asset/Portfolio: | Single Asset | ||||
| Original Balance(1): | $80,000,000 | Location: | Atlanta, GA 30303 | ||||
| Cut-off Date Balance(1): | $80,000,000 | General Property Type: | Office | ||||
| % of Initial Pool Balance: | 9.7% | Detailed Property Type: | CBD | ||||
| Loan Purpose: | Acquisition | Title Vesting: | Fee / Leasehold | ||||
| Sponsors: | Oaktree Capital Management, L.P.; Banyan Street Capital, LLC | Year Built/Renovated: | 1991/2016 | ||||
| Size: | 1,222,142 SF | ||||||
| Mortgage Rate: | 3.7320% | Cut-off Date Balance per SF(1): | $144 | ||||
| Note Date: | 10/25/2016 | Maturity Date Balance per SF(1): | $144 | ||||
| First Payment Date: | 12/5/2016 | Property Manager: | BSC Realty Services, LLC (borrower-related) | ||||
| Maturity Date: | 11/5/2026 | ||||||
| Original Term to Maturity: | 120 months | ||||||
| Original Amortization Term: | 0 months | ||||||
| IO Period: | 120 months | Underwriting and Financial Information | |||||
| Seasoning: | 1 month | UW NOI(6): | $20,236,332 | ||||
| Prepayment Provisions(2): | LO (25); DEF (88); O (7) | UW NOI Debt Yield(1): | 11.5% | ||||
| Lockbox/Cash Mgmt Status: | Hard/In Place | UW NOI Debt Yield at Maturity(1): | 11.5% | ||||
| Additional Debt Type(3): | Pari Passu | UW NCF DSCR(1): | 2.69x | ||||
| Additional Debt Balance(3): | $95,500,000 | Most Recent NOI: | $18,135,599 (9/30/2016 TTM) | ||||
| Future Debt Permitted (Type)(4): | Yes (Mezzanine) | 2nd Most Recent NOI: | $17,779,244 (12/31/2015) | ||||
| Reserves(5) | 3rd Most Recent NOI: | $17,893,899 (12/31/2014) | |||||
| Type | Initial | Monthly | Cap | Most Recent Occupancy: | 88.8% (9/1/2016) | ||
| RE Tax: | $616,031 | $308,016 | N/A | 2nd Most Recent Occupancy: | 89.3% (12/31/2015) | ||
| Insurance: | $0 | Springing | N/A | 3rd Most Recent Occupancy: | 85.5% (12/31/2014) | ||
| Recurring Replacements: | $0 | $25,461 | $1,222,142 | Appraised Value (as of): | $270,500,000 (10/3/2016) | ||
| TI/LC: | $7,777,741 | $101,845 | $6,110,710 | Cut-off Date LTV Ratio(1): | 64.9% | ||
| Other: | $0 | Springing | N/A | Maturity Date LTV Ratio(1): | 64.9% | ||
| Sources and Uses | ||||||
| Sources | Proceeds | % of Total | Uses | Proceeds | % of Total | |
| Loan Amount(1): | $175,500,000 | 62.4% | Purchase Price: | $267,500,000 | 95.0% | |
| Borrower Equity: | $105,965,740 | 37.6% | Reserves: | $8,393,772 | 3.0% | |
| Closing Costs: | $5,571,968 | 2.0% | ||||
| Total Sources: | $281,465,740 | 100.0% | Total Uses: | $281,465,740 | 100.0% | |
| (1) | The 191 Peachtree Mortgage Loan is part of the 191 Peachtree Whole Loan, which is comprised of fourpari passu promissory notes with an aggregate original principal balance of $175,500,000. The Cut-off Date Balance per SF, Maturity Date Balance per SF, UW NOI Debt Yield, UW NOI Debt Yield at Maturity, UW NCF DSCR, Cut-off Date LTV Ratio and Maturity Date LTV Ratio numbers presented above are based on the aggregate principal balance of the promissory notes comprising the 191 Peachtree Whole Loan. |
| (2) | The defeasance lockout period will be at least 25 payment dates beginning with and including the first payment date of December 5, 2016. Defeasance is permitted at any time after the earlier of (i) the third anniversary of the closing date of the 191 Peachtree Whole Loan, or (ii) two years from the closing date of the securitization of the last 191 Peachtree Whole Loan promissory note to be securitized. |
| (3) | See “—The Mortgage Loan”and“Additional Secured Indebtedness (not including trade debts)”,for further discussion of additional debt. |
| (4) | See “Mezzanine Loan and Preferred Equity” for further discussion of permitted mezzanine debt. |
| (5) | See “—Escrows and Reserves” below for further discussion of reserve requirements. |
| (6) | UW NOI includes UW Gross Potential Rent which has been underwritten based on the September 1, 2016 rent roll and includes rent steps of $702,066 through September 1, 2017 as well as three new leases that began or will begin in November and December 2016 totaling $966,728. |
The Mortgage Loan. The second largest mortgage loan (the “191 Peachtree Mortgage Loan”) is part of a whole loan (the “191 Peachtree Whole Loan”) evidenced by fourpari passu promissory notes in the aggregate original principal amount of $175,500,000, all of which are secured by a first priority fee and leasehold mortgage encumbering a 1,222,142 SF office property known as 191 Peachtree in Atlanta, Georgia (the “191 Peachtree Property”). Promissory Note A-1, in the original principal amount of $65,500,000, and Promissory Note A-4, in the original principal amount of $14,500,000, represent the 191 Peachtree Mortgage Loan and will be included in the MSC 2016-UBS12 Trust. Promissory Note A-2 with an original principal balance of $40,500,000 and Promissory Note A-3 with an original principal balance of $55,000,000 (collectively, the “191 Peachtree ServicedPari Passu Companion Loans”), are expected to be held by Morgan Stanley Bank, N.A. or an affiliate thereof on the closing date of this transaction, and are expected to be contributed to one or more future securitization transactions or may be otherwise transferred at any time. The 191 Peachtree Whole Loan will be serviced pursuant to the pooling and servicing agreement for the MSC 2016-UBS12 Trust. See “Description of the Mortgage Pool—The Whole Loans—The Serviced Pari Passu Whole Loans” and “The Pooling and Servicing Agreement” in the Preliminary Prospectus.
The proceeds of the 191 Peachtree Whole Loan, together with $105,965,740 of borrower equity, were used to acquire the 191 Peachtree Property, fund reserves and pay closing costs.
This is not a research report and was not prepared by any Underwriter’s research department. Please see additional important information and qualifications at the end of this Term Sheet.
T-39
| MSC 2016-UBS12 | 191 Peachtree |
The Borrower and the Sponsors. The borrower is Banyan Street/GAP 191 Peachtree Owner, LLC (the “191 Peachtree Borrower”), a single-purpose Delaware limited liability company with two independent directors. The loan sponsors are Oaktree Capital Management, L.P. and Banyan Street Capital, LLC, and the non-recourse carveout guarantors are Rodolfo Prio Touzet and Oaktree Pinnacle Investment Fund, L.P. The non-recourse carveout guaranty of Oaktree Pinnacle Investment Fund, L.P. is limited solely to certain voluntary or collusive bankruptcy events and transfer of the 191 Peachtree Property by deed and/or transfer of all or substantially all of the direct or indirect equity interests in the 191 Peachtree Borrower in contravention of the 191 Peachtree Whole Loan documents, and such guarantor is not a party to the environmental indemnity.
The 191 Peachtree Borrower is 100.0% owned by Banyan Tree/GAP 191 Peachtree Holdings, LLC, a Delaware entity, which in turn is 5% owned by Banyan Tree 191 Peachtree Holdings, LLC and 95% owned by 191 Peachtree Grand Avenue Partners, LLC. 191 Peachtree Grand Avenue Partners, LLC, through other entities, is ultimately controlled by Oaktree Pinnacle Investment Fund GP, Ltd. which is the sole director of Oaktree Capital Management, L.P., the investment manager.
Oaktree Capital Management, L.P. is an investment manager and is involved in a variety of real estate investments, including direct property investments, corporate investments, debt and real estate related equity securities.
Banyan Street Capital is a private real estate investment firm. The firm’s principals have been involved in the acquisition of real estate assets and have executed disposition strategies including the sale of operating businesses and real estate portfolios to publicly-traded REITs.
The Property. The 191 Peachtree Property consists of a 50-story, Class A, multi-tenant office building totaling 1,222,142 SF and a 14-story parking garage, an adjacent two-story mixed-use building located at 201 Peachtree Street and an 11-story parking garage located at 221 Peachtree Street. Amenities at the 191 Peachtree Property include on-site below grade parking, an owner-operated fitness center, a variety of eateries and access through a joined, eight-story atrium to the Ritz-Carlton Atlanta Downtown. The Peachtree Center subway station is located approximately 300 feet from the 191 Peachtree Property. The 191 Peachtree Property was constructed and developed by Cousins and Hines Property Group in 1991 and subsequently renovated in 2016. Historical capital expenditures totaled approximately $5.8 million and included primarily structural upgrades.
The 191 Peachtree Property is currently 88.8% leased to over 60 tenants primarily in the financial services, law and accounting industries and has an average occupancy of over 86% in the last five years. The largest tenant at the 191 Peachtree Property is Deloitte & Touche (21.3% of NRA). No other tenant occupies more than 5.3% of NRA.
The 191 Peachtree Property is located in the Atlanta Downtown submarket within the Central Business District of Atlanta, Georgia. The Atlanta Downtown submarket is defined as a four square-mile area centered near the intersection of Peachtree Street and Andrew Young International Boulevard. Georgia State University, Grady Memorial Hospital, Centennial Olympic Park, the CNN Center, Phillips Arena, the Georgia World Congress Center and the Georgia Dome are located in the area of the 191 Peachtree Property. Other nearby development includes Peachtree Center, a mixed use development owned by an affiliate of the 191 Peachtree Borrower that consists of approximately 2.3 million square feet of office space, three hotels and a three-tiered retail mall, which may compete with the 191 Peachtree Property, and AmericasMart, a permanent wholesale trade center that hosts several trade shows each year.
A portion of the 191 Peachtree Property located under the parking garage servicing the office building at 191 Peachtree Street is comprised of a leasehold interest with an entity of the Ritz Carlton Atlanta as the ground lessor under a 99-year term ground lease which expires February 10, 2087, and has one 99-year extension, making the final maturity February 20, 2186. The annual ground rent is $97,500 through February 9, 2017 and will increase by $2,500 per year for the remainder of the term.
Major Tenants.
Deloitte & Touche (259,998 SF, 21.3% of NRA, 27.7% of underwritten rent).Deloitte & Touche (“Deloitte”) is one of the “big four” accounting firms andprovides audit, consulting, tax and advisory services to manycompanies nationwide.The 191 Peachtree Property serves as Deloitte’s regional headquarters for the southeast, and was recently selected as the site for a new $10 Million “Innovation Lab” technology development center for the firm.Deloitte has been in occupancy since 2009, has a lease expiration of May 31, 2024 and has two five-year renewal options. Deloitte has a termination option effective May 31, 2021, provided that written notice is delivered prior to November 30, 2019. The termination payment is estimated to bethe unamortized portion of (i) construction allowance, (ii) payments made by the landlord pursuant to a separate lease with the tenant which was assigned to the 191 Peachtree Borrower, and (iii) brokerage commissions, other than to one specified broker, plus all rent which would have been due for the 12-month period following the termination date.
Hall, Booth, Smith, P.C. (64,359 SF, 5.3% of NRA, 5.1% of underwritten rent). Hall, Booth, Smith, P.C. is a law firm with offices in 12 locations serving clients nationally as well as internationally primarily in Europe. Hall, Booth, Smith, P.C. has been in occupancy since 2010, expanded in 2014 and has a lease expiration of April 30, 2021.
Ogletree, Deakins (52,510 SF, 4.3% of NRA, 5.2% of underwritten rent).Ogletree, Deakins is a law firm headquartered in Greenville, SC with over 47 offices in North America and two offices in Europe. Ogletree, Deakins specializes in labor and employment law and works with a variety of companies.Ogletree, Deakins has been in occupancy since 2009, expanded in 2013 and has a lease expiration of April 30, 2019.
Carlock, Copeland & Stair (52,028 SF, 4.3% of NRA, 4.0% of underwritten rent). Carlock, Copeland & Stair is a litigation law firm specializing in medical malpractice, professional liability, trucking and transportation, construction and workers’ compensation, with offices located primarily in the southeast. Carlock, Copeland & Stair has been in occupancy since 2011 and has a lease expiration of September 30, 2022. Carlock, Copeland & Stair has a termination option of up to 26,014 SF, all of which being on one floor, effective on December 31, 2019, provided that written notice is delivered prior to December 31, 2018. The termination payment is estimated to equal certain unamortized rental concessions, brokerage commissions, and tenant improvement costs and certain costs of the borrower in refitting the terminated space.
Morgan & Morgan (51,927 SF, 4.2% of NRA, 4.1% of underwritten rent). Morgan & Morgan is a personal injury law firm with offices in 34 locations nationally. Morgan & Morgan has been in occupancy since 2007, most recently expanded in 2016 and has a lease expiration date of November 30, 2026. Morgan & Morgan has received a rent abatement of $121,538 through November 2016, which amount was reserved at closing. Morgan & Morgan has a termination option of up to 15% of its leased square footage effective January 31, 2024, provided that written notice is delivered prior to January 31, 2023. The termination payment is estimated to equal the unamortized costs of free or abated rent, certain construction allowances, and broker’s commissions.
This is not a research report and was not prepared by any Underwriter’s research department. Please see additional important information and qualifications at the end of this Term Sheet.
T-40
| MSC 2016-UBS12 | 191 Peachtree |
The following table presents certain information relating to the leases at the 191 Peachtree Property:
| Tenant Summary(1) | |||||||
| Tenant Name | Credit Rating (Fitch/Moody’s/S&P)(2) | Tenant SF | Approximate % of SF | Annual UW Rent | % of Total Annual UW Rent | Annual UW Rent PSF(3) | Lease Expiration |
| Tenants | |||||||
| Deloitte & Touche | NR/NR/NR | 259,998 | 21.3% | $5,823,955 | 27.7% | $22.40 | 5/31/2024(4) |
| Hall, Booth, Smith, P.C. | NR/NR/NR | 64,359 | 5.3% | $1,066,429 | 5.1% | $16.57 | 4/30/2021 |
| Ogletree, Deakins | NR/NR/NR | 52,510 | 4.3% | $1,094,308 | 5.2% | $20.84 | 4/30/2019 |
| Carlock, Copeland & Stair | NR/NR/NR | 52,028 | 4.3% | $838,691 | 4.0% | $16.12 | 9/30/2022(5) |
| Morgan & Morgan(6) | NR/NR/NR | 51,927 | 4.2% | $865,818 | 4.1% | $16.67 | 11/30/2026(7) |
| Subtotal/Wtd. Avg. | 480,822 | 39.3% | $9,689,201 | 46.0% | $20.15 | ||
| Other Tenants | 603,854 | 49.4% | $11,358,132 | 54.0% | $18.81 | ||
| Vacant Space | 137,466 | 11.2% | $0 | 0.0% | $0.00 | ||
| Total/Wtd. Avg. | 1,222,142 | 100.0% | $21,047,334 | 100.0% | $19.40 | ||
| (1) | Information is based on the underwritten rent roll. |
| (2) | Certain ratings are those of the parent company whether or not the parent guarantees the lease. |
| (3) | Wtd. Avg. Annual UW Rent PSF excludes vacant space. |
| (4) | Deloitte has a termination option effective May 31, 2021 provided that written notice is delivered prior to November 30, 2019.The termination payment is estimated to be the unamortized portion of (i) construction allowance, (ii) payments made by the landlord pursuant to a separate lease with the tenant which was assigned to the 191 Peachtree Borrower, and (iii) brokerage commissions, other than to a specified broker, plus all rent which would have been due for the 12-month period following the termination date. |
| (5) | Carlock, Copeland & Stair has a termination option of up to26,014 SF, all of which being on one floor, effective on December 31, 2019, provided that written notice is delivered prior to December 31, 2018. The termination payment is estimated to equal certain unamortized rental concessions, brokerage commissions, and tenant improvement costs and certain costs of the borrower in refitting the terminated space. |
| (6) | Morgan & Morgan has received a rent abatement of $121,538 through November 2016, which amount was reserved at closing. |
| (7) | Morgan & Morgan has a termination option of up to 15% of its leased square footage effective January 31, 2024, provided that written notice is delivered prior to January 31, 2023. The termination payment is estimated to equal the unamortized costs of free or abated rent, certain construction allowances, and broker’s commissions. |
The following table presents certain information relating to the lease rollover schedule at the 191 Peachtree Property:
| Lease Rollover Schedule(1)(2) | ||||||||
| Year | # of Leases Rolling | SF Rolling | Approx. % of Total SF Rolling | Approx. Cumulative % of SF Rolling | UW Base Rent PSF Rolling(3) | Total UW Base Rent Rolling(3) | Approx. % of Total Rent Rolling | Approx. Cumulative % of Total Rent Rolling |
| 2016 | 0 | 0 | 0.0% | 0.0% | $0.00 | $0 | 0.0% | 0.0% |
| 2017 | 5 | 18,681 | 1.5% | 1.5% | $22.37 | $417,954 | 2.0% | 2.0% |
| 2018 | 8 | 16,997 | 1.4% | 2.9% | $19.04 | $323,559 | 1.5% | 3.5% |
| 2019 | 10 | 126,044 | 10.3% | 13.2% | $19.73 | $2,486,868 | 11.8% | 15.3% |
| 2020 | 5 | 19,374 | 1.6% | 14.8% | $26.22 | $507,952 | 2.4% | 17.8% |
| 2021 | 10 | 90,517 | 7.4% | 22.2% | $18.48 | $1,672,644 | 7.9% | 25.7% |
| 2022 | 7 | 126,160 | 10.3% | 32.5% | $18.78 | $2,369,561 | 11.3% | 37.0% |
| 2023 | 10 | 95,633 | 7.8% | 40.4% | $22.08 | $2,111,499 | 10.0% | 47.0% |
| 2024 | 12 | 300,569 | 24.6% | 65.0% | $22.19 | $6,668,599 | 31.7% | 78.7% |
| 2025 | 7 | 75,762 | 6.2% | 71.2% | $17.91 | $1,356,553 | 6.4% | 85.1% |
| 2026 | 8 | 67,220 | 5.5% | 76.7% | $17.51 | $1,176,953 | 5.6% | 90.7% |
| 2027 & Beyond | 11 | 147,719 | 12.1% | 88.8% | $13.24 | $1,955,191 | 9.3% | 100.0% |
| Vacant | 0 | 137,466 | 11.2% | 100.0% | $0.00 | $0 | 0.0% | 100.0% |
| Total/Wtd. Avg. | 93 | 1,222,142 | 100.0% | $19.40 | $21,047,334 | 100.0% | ||
| (1) | Information is based on the underwritten rent roll. |
| (2) | Certain tenants may have lease termination options that are exercisable prior to the originally stated expiration date of the subject lease and that are not considered in the lease rollover schedule. |
| (3) | UW Total Rent PSF Rolling and Total UW Rent Rolling exclude vacant space. |
The Market. The 191 Peachtree Property is located in the heart of downtown Atlanta, Georgia. Major local thoroughfares surround the 191 Peachtree Property connecting it to other nearby submarkets. The area is supported by the MARTA rail system and consists of both old and new commercial, retail and multi-family residential developments. Regional access is provided by Interstate 85, connecting Atlanta with North Carolina in the northeast and Alabama in the west. Interstate 85 further connects to Interstates 75 and 20; Interstate 75 connects the Atlanta area to Tennessee in the north and Florida in the south and Interstate 20 connects the Atlanta area to South Carolina in the east and to Alabama in the west.
The 191 Peachtree Property is located in the Atlanta, Georgia office market. As of the second quarter in 2016, the Atlanta office market contained 138,959,209 SF of office space, with a market vacancy of 16.0% and asking rents of $23.07 per SF. Vacancy and asking rents for Class A office buildings in the Atlanta office market were 16.0% and $27.11 per SF, respectively. The 191 Peachtree Property is located in the Downtown office submarket within the Atlanta Central Business District. As of the second quarter in 2016, the Downtown office submarket contained 15,101,772 SF of
This is not a research report and was not prepared by any Underwriter’s research department. Please see additional important information and qualifications at the end of this Term Sheet.
T-41
| MSC 2016-UBS12 | 191 Peachtree |
office space, with a submarket vacancy of 22.5% and asking rents of $22.94 per SF. Vacancy and asking rents for Class A office buildings in the Downtown office submarket were 16.5% and $24.24 per SF, respectively.
According to the appraisal, approximately 3.1 million SF of new office product is being constructed in Atlanta, of which approximately 60% has been pre-leased. However, none of the new construction is taking place in the Downtown office submarket where the 191 Peachtree Property is located.
The estimated 2015 population within a one-, three- and five-mile radius of the 191 Peachtree Property is 25,731, 170,887 and 344,811, respectively, according to the appraisal. The estimated 2015 average household income within a one-, three- and five-mile radius of the 191 Peachtree Property is $55,204, $79,228 and $81,152, respectively. The 2015 average household income for the greater city of Atlanta was $82,479.
The following table presents recent leasing data at competitive office buildings with respect to the 191 Peachtree Property:
| Competitive Property Summary | |||||||||
| Property Name/Address | Year Built | Class | Size (SF) | Tenant Name | Lease Size (SF) | Lease Date | Lease Term (Yrs.) | Initial Rent/SF | Rent Steps/SF |
1100 Peachtree 1100 Peachtree Street NE Atlanta, GA | 1991 | A | 570,004 | Confidential | 22,144 | 2Q 2016 | 10.0 | $20.00 | 2.75% |
One Atlantic Center 1201 West Peachtree Street NW Atlanta, GA | 1987 | A | 1,100,312 | Confidential | 44,696 | 2Q 2016 | 15.0 | $18.75 | 2.75% |
Ten 10th Street 10 10th Street NW Atlanta, GA | 2001 | A | 421,417 | Mandarin Oriental Management | 12,655 | 2Q 2016 | 3.0 | $35.00 | 3.0% |
999 Peachtree 999 Peachtree Street NE Atlanta, GA | 1987 | A | 621,946 | Available | 22,643 | 4Q 2016 | 10.0 | $35.00 | 3.0% |
Bank of America Plaza 600 Peachtree Street NE Atlanta, GA | 1992 | A | 1,312,980 | Available | 25,000 | 4Q 2016 | 5-10 | $30.00 | Negotiable |
SunTrust Plaza 303 Peachtree Street NE Atlanta, GA | 1992 | A | 1,249,022 | Available | 15,872 | 4Q 2016 | 5.0 | $30.00 | 3.0% |
Source:Appraisal
Operating History and Underwritten Net Cash Flow.The following table presents certain information relating to the historical operating performance and the Underwritten Net Cash Flow at the 191 Peachtree Property:
| Cash Flow Analysis | ||||||
| 2013 | 2014 | 2015 | 9/30/2016 TTM | UW | UW PSF | |
| Gross Potential Rent(1) | $17,776,623 | $18,176,040 | $17,811,762 | $17,722,426 | $21,047,334 | $17.22 |
| Total Recoveries | $8,794,528 | $9,420,005 | $9,934,060 | $10,208,281 | $10,755,655 | $8.80 |
| Total Other Income(2) | $3,877,795 | $4,240,638 | $4,250,652 | $4,401,483 | $4,250,652 | $3.48 |
| Less Vacancy & Credit Loss(3) | $0 | $0 | $0 | $0 | $0 | $0.00 |
| Effective Gross Income | $30,448,946 | $31,836,683 | $31,996,474 | $32,332,190 | $36,053,641 | $29.50 |
| Total Operating Expenses | $13,420,494 | $13,942,784 | $14,217,230 | $14,196,590 | $15,817,308 | $12.94 |
| Net Operating Income | $17,028,452 | $17,893,899 | $17,779,244 | $18,135,599 | $20,236,332 | $16.56 |
| Capital Expenditures | $0 | $0 | $0 | $0 | $305,536 | $0.25 |
| TI/LC | $0 | $0 | $0 | $0 | $2,096,099 | $1.72 |
| Net Cash Flow | $17,028,452 | $17,893,899 | $17,779,244 | $18,135,599 | $17,834,697 | $14.59 |
| Occupancy % | 84.7% | 85.5% | 89.3% | 88.8% | 88.8% | |
| NOI DSCR(4) | 2.56x | 2.69x | 2.68x | 2.73x | 3.05x | |
| NCF DSCR(4) | 2.56x | 2.69x | 2.68x | 2.73x | 2.69x | |
| NOI Debt Yield(4) | 9.7% | 10.2% | 10.1% | 10.3% | 11.5% | |
| NCF Debt Yield(4) | 9.7% | 10.2% | 10.1% | 10.3% | 10.2% | |
| (1) | Gross Potential Rent has been underwritten based on the September 1, 2016 rent roll and includes rent steps of $702,066 through September 1, 2017, as well as three new leases that began or will begin in November and December 2016 totaling $966,728. |
| (2) | Other income includes storage income, roof/antenna revenue, parking income and other miscellaneous income. Parking income constitutes approximately 10.2% of Effective Gross Income. |
| (3) | Underwritten occupancy is based on in place occupancy as of the rent roll dated September 1, 2016. |
| (4) | Debt service coverage ratios and debt yields are based on the 191 Peachtree Whole Loan. |
Escrows and Reserves. The 191 Peachtree Whole Loan documents provide for upfront reserves in the amount of $616,031 for real estate taxes, $5,386,285 for existing tenant improvements and leasing commissions owed to ten tenants, including the fifth largest tenant, Morgan & Morgan, and $2,391,456 for free rent for 14 tenants, including Morgan & Morgan (to be disbursed monthly in each month in which a free rent period applies in lieu of the rent that would have been due absent such free rent period). The 191 Peachtree Borrower is required to escrow monthly: (i) 1/12th of the annual estimated real estate taxes; (ii) from and after the expiration of the insurance policies in effect on the origination date, 1/12th of the annual estimated
This is not a research report and was not prepared by any Underwriter’s research department. Please see additional important information and qualifications at the end of this Term Sheet.
T-42
| MSC 2016-UBS12 | 191 Peachtree |
insurance premiums (unless (A) the 191 Peachtree Borrower maintains an acceptable blanket policy or (B) amounts sufficient to pay all insurance premiums have been deposited with the property manager pursuant to the property management agreement and the lender receives reasonably acceptable evidence of such deposits). The 191 Peachtree Borrower is required to deposit monthly $25,461 into an escrow for replacements and repairs, provided that the obligation to make such deposits is suspended during any period that the amounts in such escrow equal or exceed $1,222,142. The 191 Peachtree Borrower is required to deposit monthly $101,845 into an escrow for future tenant improvements and leasing commissions (the “Rollover Reserve”), provided that the obligation to make such deposits is suspended during any period that the amount in the Rollover Reserve is equal to, or exceeds $6,110,710, which does not include the upfront reserve amount.
From and after the occurrence of a Deloitte Vacancy Event (as defined below), the 191 Peachtree Borrower is required to deposit on each monthly payment date all excess cash flow into an escrow (the “Deloitte Vacancy Reserve”) for tenant improvements, tenant allowances and leasing commissions that may be incurred with respect to the retenanting of the Deloitte Space (as defined below) or of the Closing Date Vacant Space (as defined below) until an aggregate amount equal to $50 per leasable square foot of the Deloitte Space has been so deposited. In addition, to the extent there are not sufficient funds in the Rollover Reserve, the 191 Peachtree Borrower is permitted to utilize Deloitte Vacancy Reserve Funds for payment of up to 65% of the cost of tenant improvements, tenant improvement allowances and/or leasing commissions with respect to leases for space other than the Deloitte Space or Closing Date Vacant Space.
A “Deloitte Vacancy Event” will commence on the earliest to occur of (i) Deloitte LLP failing to either (A) renew its lease for all or substantially all of the Deloitte Space for its initial five year renewal term pursuant to the provisions of its lease or (B) enter into a new lease with a minimum five year term, a minimum base rent of $15.00 per SF, and in compliance with certain other requirements set forth in the 191 Peachtree Whole Loan documents, which new lease may reduce the rented space by 75,000 SF relative to the leased space on the origination date (either of (A) and (B), a “Deloitte Renewal Event”) on or before May 31, 2022, (ii) certain bankruptcy events with respect to Deloitte LLP, or (iii) the termination or cancellation of Deloitte LLP’s lease prior to May 31, 2022 without payment to the 191 Peachtree Borrower of the lease termination fee specified in such lease or a monetary default is continuing under such lease for at least 90 days, and will end upon (w) the occurrence of a Deloitte Renewal Event, (x) the execution of new leases in accordance with the terms of the 191 Peachtree Whole Loan documents with initial terms of at least five years and which are otherwise reasonably acceptable to the lender and in the aggregate demise at least 75% of the Deloitte Space, (y) with respect to a bankruptcy event only, Deloitte LLP has assumed its lease in connection with the bankruptcy event or the bankruptcy event has been discharged or dismissed, or (z) with respect to a continuing monetary default under Deloitte LLP’s lease, the cure of all such monetary defaults.
“Deloitte Space” means the space leased to Deloitte LLP pursuant to its lease as of the origination date.
“Closing Date Vacant Space” means 89,132 SF of space identified in the 191 Peachtree Whole Loan documents that was vacant as of the origination date and has not been subsequently leased as of the date of determination.
Lockbox and Cash Management.A hard lockbox is in place with respect to the 191 Peachtree Whole Loan. The 191 Peachtree Whole Loan has in place cash management. All funds in the lockbox account are required to be swept on each business day to a cash management account controlled by the lender, and applied, provided that no event of default is continuing under the 191 Peachtree Whole Loan, on each monthly payment date to pay debt service on the 191 Peachtree Whole Loan, to fund the required reserves deposits as described above under “Escrows and Reserves”, to disburse, if a Cash Trap Period (as defined below) or Deloitte Vacancy Period is continuing, the monthly operating expenses referenced in the approved annual budget and extraordinary expenses approved (if more than 5% in excess of the corresponding line item in the approved annual budget) by the lender, and to disburse the remainder (i) if a Deloitte Vacancy Period is continuing, into the Deloitte Vacancy Account until an aggregate amount equal to $50 per leasable square foot of the Deloitte Space has been so deposited, (ii) if a Cash Trap Period is continuing and no Deloitte Vacancy Reserve Period is continuing, into an account to be held by the lender as additional security for the 191 Peachtree Whole Loan during the continuance of such Cash Trap Period and (iii) if no Cash Trap Period or event of default under the 191 Peachtree Whole Loan is continuing, to the 191 Peachtree Borrower.
A “Cash Trap Period” means the period of time commencing after the cash management bank has received notice from the lender that a Trigger Period (as defined below) has commenced and continuing until the cash management bank has received notice from the lender that such Trigger Period has ceased and terminated.
A “Trigger Period” means the period:
(i) commencing upon an event of default under the 191 Peachtree Whole Loan documents and ending upon the date that such event of default is cured or waived, or
(ii) commencing on the date upon which the combined debt service coverage ratio on the 191 Peachtree Whole Loan and any related mezzanine loan is less than 1.40x for any calendar quarter, and ending on the date the combined debt service coverage ratio on the 191 Peachtree Whole Loan and any related mezzanine loan equals or exceeds 1.45x for two consecutive calendar quarters.
Additional Secured Indebtedness (not including trade debts).The 191 Peachtree Property also secures the 191 Peachtree ServicedPari Passu Companion Loans, which have a Cut-off Date principal balance of $95,500,000 and are currently held by Morgan Stanley Bank, N.A. or an affiliate thereof and expected to be contributed to one or more future securitization trusts. The 191 Peachtree ServicedPari Passu Companion Loans accrue interest at the same rate as the 191 Peachtree Mortgage Loan. The 191 Peachtree Mortgage Loan is entitled to payments of principal and interest on apro rata andpari passu basis with the 191 Peachtree ServicedPari Passu Companion Loans. The holders of the 191 Peachtree Mortgage Loan and the 191 Peachtree ServicedPari Passu Companion Loans have entered into a co-lender agreement which sets forth the allocation of collections on the 191 Peachtree Whole Loan. See “Description of the Mortgage Pool—The Whole Loans— The Serviced Pari Passu Whole Loans”in the Preliminary Prospectus.
Mezzanine Loan and Preferred Equity.The 191 Peachtree Borrower is permitted to allow the owners of the 191 Peachtree Borrower to borrow a mezzanine loan secured by 100% of the ownership interests in the 191 Peachtree Borrower, provided that the following conditions, among others, are satisfied: (i) as of the date the mezzanine loan is made, the aggregate loan to value ratio of the 191 Peachtree Whole Loan and such mezzanine loan is not more than 65%, (ii) as of the date the mezzanine loan is made, the aggregate debt yield of the 191 Peachtree Whole Loan and such mezzanine loan is not less than 11.0%, (iii) the mezzanine loan has an initial maturity not earlier than the maturity date of the 191 Peachtree Whole Loan and all other terms and conditions thereof are reasonably acceptable to the lender under the 191 Peachtree Whole Loan, (iv) the mezzanine lender entering into a customary intercreditor agreement in form acceptable to the lender under the 191 Peachtree Whole Loan in its reasonable discretion, (v) the mezzanine
This is not a research report and was not prepared by any Underwriter’s research department. Please see additional important information and qualifications at the end of this Term Sheet.
T-43
| MSC 2016-UBS12 | 191 Peachtree |
loan shall be a fixed rate loan or a floating rate loan (in which case the mezzanine borrower shall be required to purchase an interest rate cap at a strike price reasonably acceptable to the lender under the 191 Peachtree Whole Loan), and (vi) receipt of a rating agency confirmation.
Release of Property.The 191 Peachtree Borrower may make transfers of immaterial portions of the 191 Peachtree Property as described in the Preliminary Prospectus. See “Description of the Mortgage Pool—Certain Terms of the Mortgage Loans—Partial Releases”.
Terrorism Insurance.The 191 Peachtree Whole Loan documents require that the “all risk” insurance policy required to be maintained by the 191 Peachtree Borrower provide coverage for terrorism in an amount equal to the full replacement cost of the 191 Peachtree Property and eighteen months of business interruption insurance, provided that if the Terrorism Risk Insurance Program Reauthorization Act of 2015 or extension thereof or substantially similar program (“TRIPRA”) is in effect and continues to cover both foreign and domestic acts of terrorism, the lender is required to accept terrorism insurance with coverage against “covered acts” within the meaning of TRIPRA.
This is not a research report and was not prepared by any Underwriter’s research department. Please see additional important information and qualifications at the end of this Term Sheet.
T-44
(THIS PAGE INTENTIONALLY LEFT BLANK)
This is not a research report and was not prepared by any Underwriter’s research department. Please see additional important information and qualifications at the end of this Term Sheet.
T-45
| MSC 2016-UBS12 | Wolfchase Galleria |
Mortgage Loan No. 3 – Wolfchase Galleria
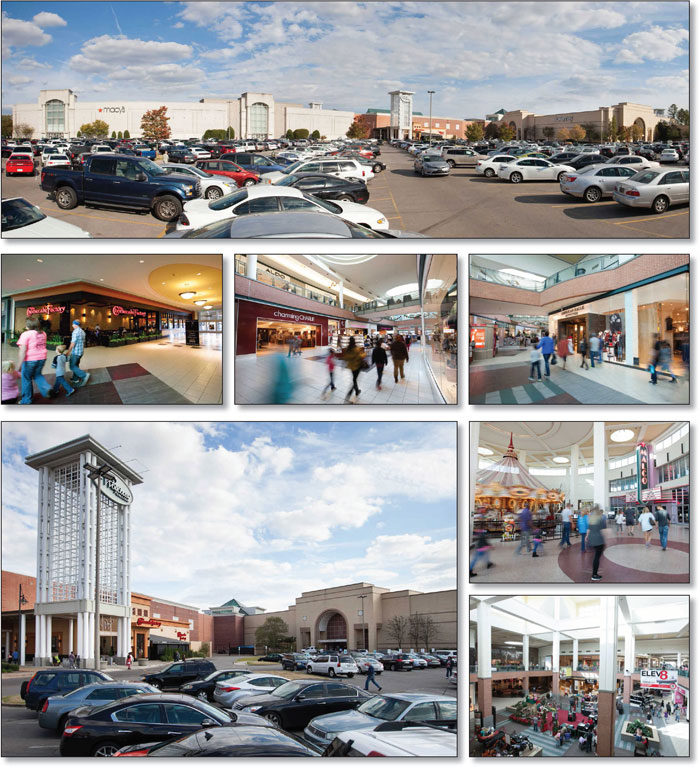
This is not a research report and was not prepared by any Underwriter’s research department. Please see additional important information and qualifications at the end of this Term Sheet.
T-46
| MSC 2016-UBS12 | Wolfchase Galleria |
Mortgage Loan No. 3 – Wolfchase Galleria
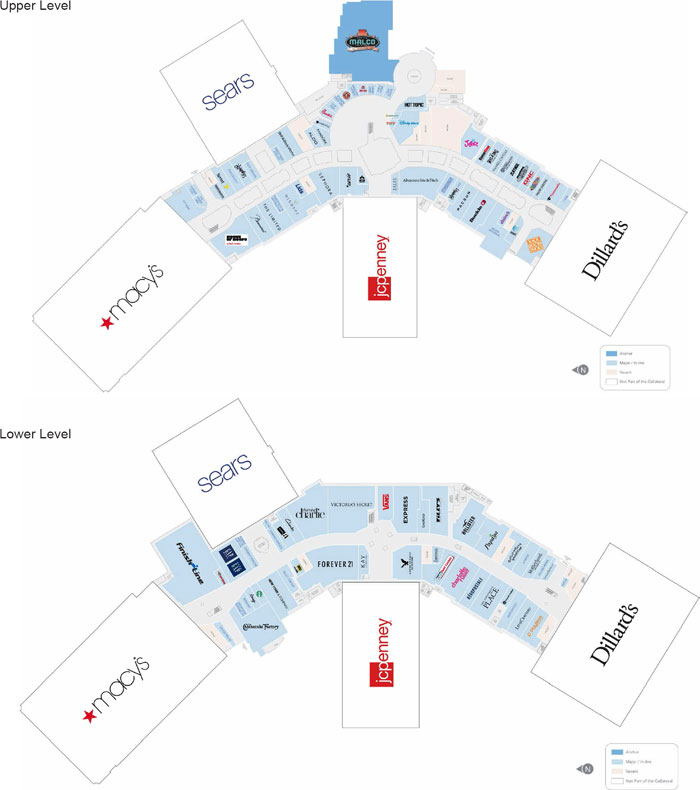
This is not a research report and was not prepared by any Underwriter’s research department. Please see additional important information and qualifications at the end of this Term Sheet.
T-47
| MSC 2016-UBS12 | Wolfchase Galleria |
Mortgage Loan No. 3 – Wolfchase Galleria
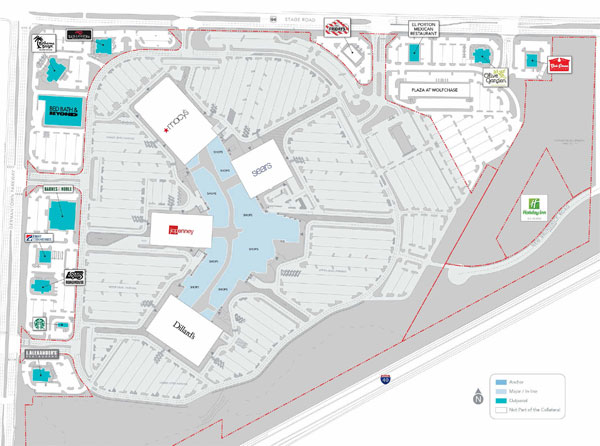
This is not a research report and was not prepared by any Underwriter’s research department. Please see additional important information and qualifications at the end of this Term Sheet.
T-48
| MSC 2016-UBS12 | Wolfchase Galleria |
Mortgage Loan No. 3 – Wolfchase Galleria
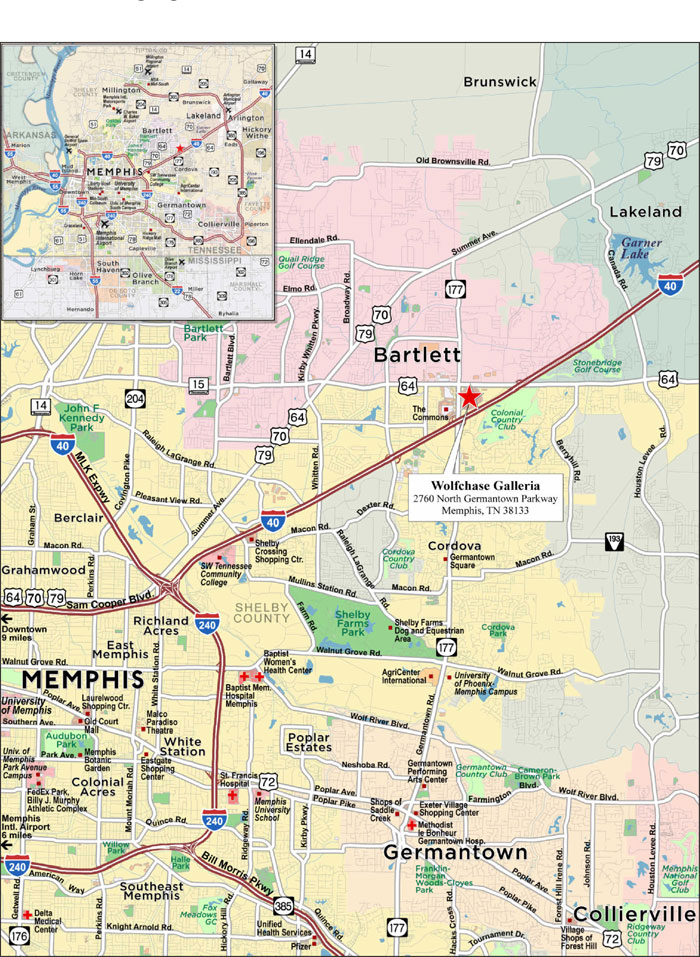
This is not a research report and was not prepared by any Underwriter’s research department. Please see additional important information and qualifications at the end of this Term Sheet.
T-49
| MSC 2016-UBS12 | Wolfchase Galleria |
| Mortgage Loan No. 3 – Wolfchase Galleria |
| Mortgage Loan Information | Property Information | ||||||
| Mortgage Loan Seller: | MSMCH / UBS AG | Single Asset/Portfolio: | Single Asset | ||||
| Original Balance(1): | $70,000,000 | Location: | Memphis, TN 38133 | ||||
| Cut-off Date Balance(1): | $69,901,741 | General Property Type: | Retail | ||||
| % of Initial Pool Balance: | 8.5% | Detailed Property Type: | Regional Mall | ||||
| Loan Purpose: | Refinance | Title Vesting: | Fee | ||||
| Sponsor: | Simon Property Group, L.P. | Year Built/Renovated: | 1997/N/A | ||||
| Mortgage Rate: | 4.1460% | Size(5): | 391,862 SF | ||||
| Note Date: | 10/26/2016 | Cut-off Date Balance per SF(1): | $420 | ||||
| First Payment Date: | 12/1/2016 | Maturity Date Balance per SF(1): | $337 | ||||
| Maturity Date: | 11/1/2026 | Property Manager: | Simon Management Associates, LLC (borrower-related) | ||||
| Original Term to Maturity: | 120 months | ||||||
| Original Amortization Term: | 360 months | Underwriting and Financial Information | |||||
| IO Period: | 0 months | UW NOI: | $17,678,128 | ||||
| Seasoning: | 1 month | UW NOI Debt Yield(1): | 10.7% | ||||
| Prepayment Provisions(2): | LO (25); DEF (88); O (7) | UW NOI Debt Yield at Maturity(1): | 13.4% | ||||
| Lockbox/Cash Mgmt Status: | Hard/Springing | UW NCF DSCR(1): | 1.72x | ||||
| Additional Debt Type(1)(3): | Pari Passu | Most Recent NOI: | $17,306,615 (8/31/2016 TTM) | ||||
| Additional Debt Balance(1)(3): | $94,866,648 | 2nd Most Recent NOI: | $17,180,445 (12/31/2015) | ||||
| Future Debt Permitted (Type): | No (N/A) | 3rd Most Recent NOI: | $17,289,809 (12/31/2014) | ||||
| Reserves(4) | Most Recent Occupancy(6): | 90.1% (9/28/2016) | |||||
| Type | Initial | Monthly | Cap | 2nd Most Recent Occupancy: | 92.2% (12/31/2015) | ||
| RE Tax: | $0 | Springing | N/A | 3rd Most Recent Occupancy: | 95.3% (12/31/2014) | ||
| Insurance: | $0 | Springing | N/A | Appraised Value (as of): | $254,000,000 (9/26/2016) | ||
| Recurring Replacements: | $0 | Springing | N/A | Cut-off Date LTV Ratio(1): | 64.9% | ||
| TI/LC: | $0 | Springing | N/A | Maturity Date LTV Ratio(1): | 52.0% | ||
| Sources and Uses | ||||||
| Sources | Proceeds | % of Total | Uses | Proceeds | % of Total | |
| Loan Amount(1): | $165,000,000 | 72.8% | Loan Payoff: | $226,094,022 | 99.7% | |
| Borrower’s Equity: | $61,688,908 | 27.2% | Closing Costs: | $594,886 | 0.3% | |
| Total Sources: | $226,688,908 | 100.0% | Total Uses: | $226,688,908 | 100.0% | |
| (1) | The Wolfchase Galleria Mortgage Loan is part of the Wolfchase Galleria Whole Loan, which is comprised of eightpari passupromissory notes. The eight Wolfchase Galleriapari passupromissory notes have a combined original principal balance of $165,000,000. The Cut-off Date Balance per SF, Maturity Date Balance per SF, UW NCF DSCR, UW NOI Debt Yield, UW NOI Debt Yield at Maturity, Cut-off Date LTV Ratio and Maturity Date LTV Ratio numbers presented above are based on the eight senior notes totaling $165,000,000. |
| (2) | Defeasance is permitted at any time after the earlier of (i) June 1, 2020, or (ii) two years from the closing date of the securitization of the last Wolfchase Galleria Whole Loan promissory note to be securitized. |
| (3) | See “—The Mortgage Loan” and “—Additional Secured Indebtedness (not including trade debt)” below for further discussion of additional debt. |
| (4) | See “—Escrows and Reserves” below for further discussion of reserve requirements. |
| (5) | The Wolfchase Galleria Property is part of a shopping center with a total of 1,267,857 SF, which includes non-collateral anchor tenants, Macy’s (252,720 SF), Dillard’s, Inc. (“Dillard’s”) (203,943 SF), Sears (160,885 SF) and J.C. Penney (144,047 SF). |
| (6) | Most recent occupancy information is calculated based on the collateral SF of 391,862, and excludes two tenants currently in occupancy that are expected to vacate (Love Culture – 9,713 SF and Tempur Pedic – 1,020 SF). Three tenants totaling 14,321 SF have executed leases but are currently not in occupancy (Footlocker / House of Hoops, Cinnabon and Papaya) and underwritten as occupied. The occupancy including the non-collateral anchors is 96.9%. |
The Mortgage Loan. The third largest mortgage loan (the “Wolfchase Galleria Mortgage Loan”) is part of a whole loan (the “Wolfchase Galleria Whole Loan”) evidenced by eightpari passu promissory notes in the aggregate original principal amount of $165,000,000, all of which are secured by a first priority fee mortgage encumbering a regional mall known as Wolfchase Galleria (the “Wolfchase Galleria Property”). Promissory Note A-1-1 contributed by MSMCH and Promissory Note A-3 contributed by UBS AG, in the aggregate original principal amount of $70,000,000, represent the Wolfchase Galleria Mortgage Loan, and will be included in the MSC 2016-UBS12 Trust. Promissory Notes A-1-2, A-2, A-4, A-5, A-6 and A-7, in the aggregate original principal amount of $95,000,000, collectively represent serviced companion loans (the “Wolfchase Galleria ServicedPari Passu Companion Loans”). The Wolfchase Galleria ServicedPari Passu Companion Loans, which are represented by Promissory Note A-1-2 in the original principal amount of $5,000,000 and Promissory Note A-2 in the original principal amount of $50,000,000, are currently held by Morgan Stanley Bank, N.A. or an affiliate thereof on the closing date of this transaction and are expected to be contributed to one or more future securitization transactions or may be otherwise transferred at any time. The Wolfchase Galleria ServicedPari Passu Companion Loans, which are represented by Promissory Note A-4 in the original principal amount of $5,000,000, Promissory Note A-5 in the original principal amount of $5,000,000, Promissory Note A-6 in the original principal amount of $20,000,000 and Promissory Note A-7 in the original principal amount of $10,000,000, are expected to be held by UBS AG, by and through its branch office at 1285 Avenue of the Americas, New York, New York, or an affiliate thereof on the closing date of this transaction and are expected to be contributed to one or more future securitization transactions or may be otherwise transferred at any time. The Wolfchase Galleria Whole Loan will be
This is not a research report and was not prepared by any Underwriter’s research department. Please see additional important information and qualifications at the end of this Term Sheet.
T-50
| MSC 2016-UBS12 | Wolfchase Galleria |
serviced pursuant to the pooling and servicing agreement for the MSC 2016-UBS12 trust. See “Description of the Mortgage Pool—The Whole Loans— The Serviced Pari Passu Whole Loans” and “Pooling and Servicing Agreement” in the Preliminary Prospectus.
The proceeds of the Wolfchase Galleria Whole Loan together with $61,688,908 of borrower equity were used to refinance a previous loan with an original balance of approximately $225,000,000 secured by the Wolfchase Galleria Property and pay closing costs. The previous mortgage loan secured by the Wolfchase Galleria Property was included in the GECMC 2007-C1 transaction.
The Borrower and the Sponsor. The borrower is Galleria at Wolfchase, LLC (the “Wolfchase Galleria Borrower”), a single-purpose Delaware limited liability company with two independent directors. The Wolfchase Galleria Borrower is controlled by and 94.5% owned by entities controlled by Simon Property Group, L.P. (the “Wolfchase Galleria Sponsor”). The Wolfchase Galleria Sponsor is the non-recourse carveout guarantor of the Wolfchase Galleria Whole Loan.
For so long as the Wolfchase Galleria Sponsor is the non-recourse carveout guarantor, the liability of the non-recourse carveout guarantor or a replacement guarantor under the non-recourse carveout guaranty (which also covers environmental provisions in the Wolfchase Galleria Whole Loan documents) shall not exceed $33,000,000, in the aggregate, plus all of the reasonable out-of-pocket costs and expenses (including court costs and reasonable attorneys’ fees) incurred by the lender in the enforcement of such guaranty or the preservation of the lender’s rights thereunder.
The Wolfchase Galleria Sponsor is also a sponsor of the borrower under the mortgage loan identified on Annex A-1 to the Preliminary Prospectus as The Falls.
The Wolfchase Galleria Sponsor is the operating partnership of Simon Property Group, Inc. (“Simon”). Simon is a publicly traded self-administered and self-managed real estate investment trust (NYSE: SPG) focused on retail property ownership and management. Simon is one of the largest publicly traded owners, operators and developers of retail assets in the United States. As of December 31, 2015, Simon operated 209 properties, consisting of 108 malls, 71 Premium Outlet-branded centers, fourteen Mills-branded centers, four lifestyle centers, and twelve other retail properties located in 37 states and Puerto Rico containing an aggregate of approximately 184 million SF.
The Property.The Wolfchase Galleria Property consists of 391,862 SF contained in a two-story regional mall and anchored by four non-collateral anchor stores that include Macy’s, Dillard’s, Sears and J.C. Penney, and is surrounded by several non-collateral outparcels that include Bed Bath & Beyond, Barnes & Noble, Bahama Breeze, Olive Garden, Logan’s Roadhouse and First Tennessee Bank, among others. Included in the collateral are 5,605 parking spaces. The Wolfchase Galleria Property was 90.1% leased as of September 28, 2016 to a mix of 105 national retail and restaurant tenants. Including non-collateral anchors, the Wolfchase Galleria Mall is 96.9% occupied. The three largest tenants by NRA include Malco Theatres, The Finish Line and Victoria’s Secret, with no other tenant occupying more than 3.3% of NRA or representing more than 4.0% of base rent. The five largest tenants total 22.6% of collateral NRA and 15.5% of underwritten rent. Other tenants include: Express/Express Men, New York & Company, Pandora, Bath & Body Works, GameStop and Sephora.
As of September 28, 2016, the Wolfchase Galleria Property was 90.1% occupied. Historical occupancy at the Wolfchase Galleria Property has averaged 96.9% from 2010 to 2015. Total inline sales at the Wolfchase Galleria Property for the trailing 12 months ending August 31, 2016 were approximately $78.9 million with an average of $393 PSF, resulting in an occupancy cost of 18.0%. Recent leasing at the Wolfchase Galleria Property includes eight tenants totaling 30,794 SF that have signed new leases or renewed existing leases at the Wolfchase Galleria Property in 2016, and includes Bath & Body Works, City Gear, Gap Kids/Baby Gap, Gould’s Salon, Kids Footlocker, Lovestick, Supreme Cuts and Papaya.
The Wolfchase Galleria Property is accessible via North Germantown Parkway and State Road 64, each a primary arterial through the submarket. Interstate-40, the primary east-west regional thoroughfare for the greater Memphis market and the state of Tennessee, borders the Wolfchase Galleria Property to the southeast, and intersects North Germantown Parkway and State Road 64 on the east and west side of the Wolfchase Galleria Property, respectively.
The following table presents a summary of historical comparable in-line sales and occupancy costs and total mall sales at the Wolfchase Galleria Property.
| Historical Sales Summary(1) | |||||
| Year | Occupancy(2) | Comparable In-Line Tenant Sales PSF | Comparable In-line Tenant Occupancy Cost(3) | Total Comparable In-line Sales | Total Mall Sales(4) |
| 2013 | 95.2% | $395 | 17.2% | $81,336,870 | $95,655,352 |
| 2014 | 98.7% | $383 | 17.9% | $90,602,608 | $105,041,718 |
| 2015 | 97.5% | $399 | 17.6% | $91,523,486 | $106,376,248 |
| 8/31/2016 TTM | 98.4%(5) | $393(6) | 17.6%(6) | $90,976,629 | $124,655,752 |
| (1) | Comparable In-line tenant sales are based on tenants (<10,000 SF) who have been open and operating continuously from the beginning of the prior calendar year and are provided by Simon. |
| (2) | Occupancy excludes non-collateral anchor tenants and includes temporary tenants. Excluding temporary tenants, the historical occupancy is 92.4%, 95.3%, 92.2% and 93.5% for 2013, 2014, 2015 and the August 31, 2016 TTM, respectively. |
| (3) | Occupancy Cost % calculations are based on UW Total Rent (base rent, recoveries, % rent in lieu and overage rent) per SF for all tenants <10,000 SF divided by the comparable in-line sales for tenants who have been open and operating continuously from the beginning of the prior calendar year. |
| (4) | Total Mall Sales exclude non-collateral anchors and outparcels. |
| (5) | Includes two tenants totaling 10,733 SF (Love Culture and Tempur Pedic) that are currently in occupancy, but are expected to vacate. These tenants were underwritten as vacant. |
| (6) | Comparable In-Line Sales PSF and Occupancy Cost for the August 31, 2016 TTM are based on the underwritten rent roll as of September 28, 2016. |
Major Tenants.
Malco Theatres (30,000 SF, 7.7% of NRA, 2.2% of underwritten base rent). Malco Theatres leases 30,000 SF at the Wolfchase Galleria Property and operates the space as an eight-screen movie theater. The lease commenced February 26, 1997 and has an expiration date of December 31, 2021. Malco Theatres is a movie theater chain that has remained family owned and operated for over nine decades. The company has 326 screens across 33 locations in five states including Arkansas, Kentucky, Mississippi, Missouri and Tennessee.
This is not a research report and was not prepared by any Underwriter’s research department. Please see additional important information and qualifications at the end of this Term Sheet.
T-51
| MSC 2016-UBS12 | Wolfchase Galleria |
Malco Theatres agreed to extend their lease at the Wolfchase Galleria Property for a five year term with three additional five-year extension options. The lease extension requires Malco Theatres to invest at least $500,000 in renovating the theater by November 2017 to include new signage, flooring, seating and restrooms. In conjunction with the lease extension and renovations, Malco Theatres has agreed to attempt to sell their Stage Cinema movie theater located approximately 1.3 miles from the Wolfchase Galleria Property, to a non-theater operator for redevelopment.
The Finish Line (21,899 SF, 5.6% of NRA, 3.3% of underwritten base rent). The Finish Line leases 21,899 SF at the Wolfchase Galleria Property. The lease commenced March 1, 2012 and has an expiration date of February 28, 2022. The Finish Line is a U.S.-based specialty retailer of athletic footwear, apparel and accessories. As of April 2, 2016, the company operated 589 Finish Line stores across 44 states and Puerto Rico.
Victoria’s Secret (13,330 SF, 3.4% of NRA, 3.8% of underwritten base rent). Victoria’s Secret leases 13,330 SF at the Wolfchase Galleria Property. The lease commenced October 1, 2007 and has a lease expiration date of January 31, 2018. Victoria’s Secret Stores, LLC, a subsidiary of Retail Store Operations, Inc., is a specialty retailer of apparel, lingerie, footwear and accessories for women.
Forever 21 (12,986 SF, 3.3% of NRA, 4.0% of underwritten base rent). Forever 21 leases 12,986 SF at the Wolfchase Galleria Property. The lease commenced June 13, 2014 and has a lease expiration date of June 30, 2024. Forever 21, based in Los Angeles, California, is a national fashion retailer of women’s, men’s and kids clothing, accessories and footwear.
Charming Charlie (10,413 SF, 2.7% of NRA, 2.2% of underwritten base rent). Charming Charlie leases 10,413 SF at the Wolfchase Galleria Property. The lease commenced June 1, 2010 and has a lease expiration date of May 31, 2020. Charming Charlie, founded in 2004 and based in Houston, Texas, is a specialty retailer offering an assortment of women’s jewelry, accessories and clothing. The company operates stores across 32 states in the United States.
This is not a research report and was not prepared by any Underwriter’s research department. Please see additional important information and qualifications at the end of this Term Sheet.
T-52
| MSC 2016-UBS12 | Wolfchase Galleria |
The following table presents certain information relating to the anchor tenants and major tenants.
| Tenant Summary | ||||||||||
| Tenant Name | Credit Rating (Moody’s/S&P/Fitch)(1) | Tenant SF | % of Collateral SF | Annual UW Rent(2) | % of Annual UW | Annual UW Rent PSF(3) | Sales (TTM 8/31/2016)(4) | Occ. Cost %(4) | Lease Expiration | |
| $ | PSF(3)) | |||||||||
| Anchors | ||||||||||
| Macy’s (Non-Collateral) | Baa2/BBB/BBB | 252,720 | N/A | N/A | N/A | N/A | 41,951,520 | $166 | N/A | N/A |
| Dillard’s (Non-Collateral) | Baa3/BBB-/BBB- | 203,943 | N/A | N/A | N/A | N/A | 28,755,963 | $141 | N/A | N/A |
| Sears (Non-Collateral) | Caa1/CCC+/CC | 160,885 | N/A | N/A | N/A | N/A | 13,996,995 | $87 | N/A | N/A |
| J.C. Penney (Non-Collateral) | B1/B/B+ | 144,047 | N/A | N/A | N/A | N/A | 26,504,648 | $184 | N/A | N/A |
| Subtotal/Wtd. Avg. | 761,595 | N/A | N/A | N/A | N/A | $111,209,126 | $146 | N/A | ||
| Major > 10,000 SF | ||||||||||
| Malco Theatres(5) | NR/NR/NR | 30,000 | 7.7% | $300,000 | 2.2% | $10.00 | $567,265 | $70,908 | 59.5% | 12/31/2021 |
| The Finish Line | NR/NR/NR | 21,899 | 5.6% | $460,317 | 3.3% | $21.02 | $6,748,239 | $308 | 14.9% | 2/28/2022 |
| Victoria’s Secret | NR/NR/NR | 13,330 | 3.4% | $533,200 | 3.8% | $40.00 | $7,013,223 | $526 | 14.3% | 1/31/2018 |
| Forever 21 | NR/NR/NR | 12,986 | 3.3% | $557,587 | 4.0% | $42.94 | $3,739,968 | $288 | 18.7% | 6/30/2024 |
| Charming Charlie | NR/NR/NR | 10,413 | 2.7% | $310,145 | 2.2% | $29.78 | $1,045,569 | $100 | 29.9% | 5/31/2020 |
| Cheesecake Factory | NR/NR/NR | 10,147 | 2.6% | $337,388 | 2.4% | $33.25 | $10,552,815 | $1,040 | 6.2% | 1/31/2036 |
| Subtotal/Wtd. Avg.(6) | 98,775 | 25.2% | $2,498,637 | 17.9% | $25.30 | $29,667,079 | $300 | 13.5% | ||
| 10 Largest In-Line | ||||||||||
| Abercrombie & Fitch | NR/BB-/NR | 8,575 | 2.2% | $175,000 | 1.3% | $20.41 | $1,174,069 | 137 | 15.3% | 1/31/2019 |
| Footlocker / House of Hoops(7) | Ba1/BB+/NR | 8,331 | 2.1% | $333,240 | 2.4% | $40.00 | NAV | NAV | N/A | 6/1/2026 |
| Express/Express Men | NR/NR/NR | 7,796 | 2.0% | $265,064 | 1.9% | $34.00 | $1,977,222 | 254 | 27.3% | 1/31/2018 |
| Milano Menswear | NR/NR/NR | 7,376 | 1.9% | $81,800 | 0.6% | $11.09 | $1,254,674 | 170 | 10.4% | 1/31/2019 |
| Hollister Co. | NR/NR/NR | 6,850 | 1.7% | $202,041 | 1.5% | $29.50 | $1,511,316 | 221 | 18.2% | 1/31/2019 |
| New York & Company | NR/NR/NR | 6,720 | 1.7% | $316,200 | 2.3% | $47.05 | $1,679,959 | 250 | 20.2% | 2/28/2019 |
| Tilly’s | NR/NR/NR | 6,691 | 1.7% | $125,835 | 0.9% | $18.81 | $1,011,545 | 151 | 31.9% | 1/31/2025 |
| Gap Kids/Baby Gap | Baa2/BB+/BB+ | 6,541 | 1.7% | $268,874 | 1.9% | $41.11 | $1,527,414 | 234 | 22.6% | 1/31/2021 |
| Charlotte Russe | NR/NR/NR | 6,498 | 1.7% | $241,418 | 1.7% | $37.15 | $2,090,547 | 322 | 20.7% | 1/31/2021 |
| American Eagle Outfitter | NR/NR/NR | 6,361 | 1.6% | $283,496 | 2.0% | $44.57 | $2,635,108 | 414 | 19.5% | 1/31/2024 |
| Subtotal/Wtd. Avg.(6) | 71,739 | 18.3% | $2,292,969 | 16.5% | $31.96 | $14,861,853 | $207 | 20.7% | ||
| All other Tenants < 10,000 SF | 182,672 | 46.6% | $9,130,395 | 65.6% | $49.98 | $80,126,819 | ||||
| Total Occupied SF | 353,186 | 90.1% | $13,922,001 | 100.0% | $39.42 | $124,655,752 | ||||
| Vacant(8) | 38,676 | 9.9% | ||||||||
| Total Property SF | 391,862 | 100.0% | ||||||||
| (1) | Certain ratings are those of the parent company whether or not the parent company guarantees the lease. |
| (2) | Annual UW Rent includes contractual rent steps equal to $207,732 through September 30, 2017, as well as $459,146 of rent associated with three tenants which have signed leases but are not yet in occupancy (Footlocker/House of Hoops, Cinnabon and Papaya, which in aggregate represent 3.7% of square footage). Annual UW Rent does not include percentage rent in lieu and overage rent totaling $403,204 as of the September 28, 2016 rent roll. |
| (3) | PSF figures exclude vacant space. |
| (4) | Occ. Cost % calculations are based on UW Total Rent (UW base rent, recoveries, % rent in lieu and overage rent), divided by TTM 8/31/2016 Sales. |
| (5) | Sales PSF for Malco Theatres are based on 8 screens. |
| (6) | For purposes of calculating subtotals for Sales PSF and Occ. Cost %, amounts are based on tenants that reports sales on a per square feet basis. Wtd. Avg. is based on Tenant SF. |
| (7) | Footlocker / House of Hoops has a lease for 8,331 SF that is currently occupied by fye through February 28, 2017. Footlocker / House of Hoops lease starts June 1, 2017. |
| (8) | Vacancy includes two tenants totaling 10,733 SF (Love Culture and Tempur Pedic) that are currently in occupancy but are expected to vacate. |
This is not a research report and was not prepared by any Underwriter’s research department. Please see additional important information and qualifications at the end of this Term Sheet.
T-53
| MSC 2016-UBS12 | Wolfchase Galleria |
The following table presents certain information relating to the lease rollover schedule at the Wolfchase Galleria Property:
| Lease Rollover Schedule(1)(2) | ||||||||
| Year | # of Leases Rolling | SF Rolling | % of Total SF Rolling | Cumulative % of Total SF Rolling | Total UW Rent Rolling(3) | UW Rent PSF Rolling(4) | % of Total Rent Rolling | Cumulative % of Total Rent Rolling |
| 2016 | 1 | 1,263 | 0.3% | 0.3% | 94,333 | 74.69 | 0.7% | 0.7% |
| 2017 | 26 | 49,609 | 12.7% | 13.0% | 3,281,864 | 66.15 | 23.6% | 24.3% |
| 2018 | 15 | 49,741 | 12.7% | 25.7% | 2,168,110 | 43.59 | 15.6% | 39.8% |
| 2019 | 7 | 32,937 | 8.4% | 34.1% | 929,761 | 28.23 | 6.7% | 46.5% |
| 2020 | 8 | 18,449 | 4.7% | 38.8% | 696,838 | 37.77 | 5.0% | 51.5% |
| 2021 | 11 | 60,953 | 15.6% | 54.3% | 1,671,761 | 27.43 | 12.0% | 63.5% |
| 2022 | 10 | 37,971 | 9.7% | 64.0% | 1,220,309 | 32.14 | 8.8% | 72.3% |
| 2023 | 8 | 17,838 | 4.6% | 68.6% | 615,031 | 34.48 | 4.4% | 76.7% |
| 2024 | 8 | 30,452 | 7.8% | 76.4% | 1,365,450 | 44.84 | 9.8% | 86.5% |
| 2025 | 3 | 13,032 | 3.3% | 79.7% | 332,943 | 25.55 | 2.4% | 88.9% |
| 2026 | 5 | 23,755 | 6.1% | 85.7% | 898,305 | 37.82 | 6.5% | 95.4% |
| 2027 and Beyond | 6 | 17,186 | 4.4% | 90.1% | 647,294 | 37.66 | 4.6% | 100.0% |
| Vacant | 0 | 38,676 | 9.9% | 100.0% | $0 | $0 | 0.0% | 100.0% |
| Total/Wtd. Avg. | 108 | 391,862 | 100.0% | $13,922,001 | $39.42 | 100.0% | ||
| (1) | Information is based on the underwritten rent roll. |
| (2) | Certain tenants may have lease termination options that are exercisable prior to the originally stated expiration date of the subject and that are not considered in the lease rollover schedule. |
| (3) | Total UW Rent Rolling includes contractual rent steps equal to $207,732 through September 30, 2017 and excludes allocated overage rent and percent rent in lieu. |
| (4) | UW Rent PSF Rolling excludes vacant space. |
The Market.The Wolfchase Galleria Property is located in the northeastern portion of the Memphis CBSA, approximately 17.5 miles east of Downtown Memphis, Tennessee. The Wolfchase Galleria Property is situated at the southeast corner of the North Germantown Parkway and State Road 64 intersection, anchoring a primary retail corridor directly off of the heavily trafficked Interstate-40. Interstate-40 serves as a primary regional thoroughfare running east-west through the state of Tennessee, connecting Memphis to the southwest and Nashville to the northeast. The immediate area surrounding the Wolfchase Galleria Property is characterized by residential development, with commercial and retail development primarily extending along State Road 64 to the east of the Wolfchase Galleria Property and along North Germantown Parkway south of the Wolfchase Galleria Property, and includes the Colonial Country Club and golf course located adjacent to the Wolfchase Galleria Property, on the opposite side of Interstate-40. Per the appraisal, the Wolfchase Galleria Property is the largest regional mall in the Memphis retail market.
According to the appraisal, the Wolfchase Galleria Property is located in the Raleigh/Bartlett submarket of the Memphis metro area, encompassing approximately 32.0% of the region’s retail inventory. As of the second quarter of 2016, the Memphis retail market had a vacancy rate of 11.3% and the Raleigh/Bartlett submarket had a vacancy rate of 10.8%. In the same period, asking rents in the Memphis retail market were $13.92 PSF and asking rents in the Raleigh/Bartlett submarket were $12.18 PSF.
The appraiser concluded a primary trade area of 10 miles surrounding the Wolfchase Galleria Property and a secondary trade area of up to 25 miles surrounding the Wolfchase Galleria Property. According to the appraisal, over the period from 2000 through 2015, the compound annual population growth rates within a 5-, 10- and 25-mile radius of the Wolfchase Galleria Property were 1.93%, 1.27% and 0.75%, respectively. Within a 5-, 10- and 25-mile radius of the Wolfchase Galleria Property, the 2015 annual average household income levels were estimated at $84,163, $89,993 and $71,048, respectively, and exceed the corresponding average for the Memphis CBSA and the state of Tennessee, which were estimated at $69,579 and $65,306, respectively.
This is not a research report and was not prepared by any Underwriter’s research department. Please see additional important information and qualifications at the end of this Term Sheet.
T-54
| MSC 2016-UBS12 | Wolfchase Galleria |
A summary of demographics in the primary and secondary trade areas compared to the Memphis CBSA and the state of Tennessee is presented below.
| Demographic Summary | |||||
| Statistic | 5-mile Radius | 10-mile Radius | 25-mile Radius | Memphis CBSA | State of Tennessee |
| Population | |||||
| 2000 | 124,072 | 354,257 | 1,092,449 | 1,213,206 | 5,689,220 |
| 2015 | 165,164 | 427,947 | 1,221,581 | 1,358,701 | 6,607,383 |
| 2020 (projected) | 179,369 | 454,339 | 1,274,958 | 1,418,805 | 6,902,854 |
| % Increase 2000-2015 | 1.93% | 1.27% | 0.75% | 0.76% | 1.00% |
| % Increase 2015-2020 (projected) | 1.66% | 1.20% | 0.86% | 0.87% | 0.88% |
| Average Household Income | |||||
| 2000 | $67,249 | $70,147 | $53,933 | $52,933 | $48,717 |
| 2015 | $84,163 | $89,993 | $71,048 | $69,579 | $65,306 |
| 2020 (projected) | $98,684 | $105,882 | $85,054 | $83,047 | $77,116 |
| % Increase 2000-2015 | 1.51% | 1.67% | 1.85% | 1.84% | 1.97% |
| % Increase 2015-2020 (projected) | 3.23% | 3.31% | 3.66% | 3.60% | 3.38% |
| Number of Households | |||||
| 2000 | 46,393 | 136,021 | 408,337 | 451,465 | 2,232,881 |
| 2015 | 63,118 | 162,915 | 458,698 | 508,606 | 2,598,520 |
| 2020 (projected) | 69,149 | 173,716 | 481,680 | 534,419 | 2,730,599 |
| % Increase 2000-2015 | 2.07% | 1.21% | 0.78% | 0.80% | 1.02% |
| % Increase 2015-2020 (projected) | 1.84% | 1.29% | 0.98% | 1.00% | 1.00% |
Source: Appraisal
The following table presents certain competitive retail properties to the Wolfchase Galleria Property:
| Competitive Property Summary | ||||||||
| Property Name | Center Type | Proximity | Total GLA | Year Built | Year Renovated | Anchor Tenants | Occupancy | In-line Sales PSF |
| Wolfchase Galleria | Super Regional | N/A | 1,267,857 (including non-collateral anchors and out-parcels) | 1997 | N/A | Macy’s Dillard’s, Sears, J.C. Penney, Malco Theatres | 96.9% (including non-collateral anchors and out-parcels)(1) | $393 |
| Primary Competition | ||||||||
| Oak Court Mall | Super Regional | 9.2 miles | 849,068 | 1988 | 1995 | Macy’s, Dillard’s Women’s, Dillard’s Kid’s, Housewares, Men’s | 99% | $300 |
| Carriage Crossing | Lifestyle Center | 12.8 miles | 712,017 | 2005 | N/A | Dillard’s, Macy’s, Bed Bath & Beyond, Barnes & Noble | 90% | $475 |
| The Shops of Saddle Creek | Lifestyle Center | 7.4 miles | 143,585 | 1987 | N/A | Unanchored | 100% | $550 |
| Secondary Competition | ||||||||
| Southaven Towne Center | Lifestyle Center | 20.6 miles | 567,640 | 2005 | N/A | Dillard’s, JC Penney, Gordman’s, HH Gregg, Bed Bath & Beyond, Jo-Ann, Books-A-Million | 100% | $300 |
| Tanger Outlet Southaven | Outlet Center | 21.6 miles | 320,000 | 2015 | N/A | Unanchored | 100% | N/A |
Source: Appraisal is the source for all information other than the Wolfchase Galleria Property GLA, Occupancy, and In-line Sales PSF, which are based on information in the underwritten rent roll.
| (1) | Excluding the non-collateral anchors and temporary tenants, the Wolfchase Galleria Property has an underwritten occupancy rate of 90.1% based on the September 28, 2016 rent roll. |
This is not a research report and was not prepared by any Underwriter’s research department. Please see additional important information and qualifications at the end of this Term Sheet.
T-55
| MSC 2016-UBS12 | Wolfchase Galleria |
Operating History and Underwritten Net Cash Flow.The following table presents certain information relating to the historical operating performance and the Underwritten Net Cash Flow at the Wolfchase Galleria Property:
| Cash Flow Analysis | ||||||||||||||||
| 2013 | 2014 | 2015 | 8/31/2016 TTM | UW | UW PSF | |||||||||||
| Base Rental Revenue | $13,864,681 | $14,158,254 | $13,950,699 | $14,187,408 | $13,922,001 | (1) | $35.53 | |||||||||
| Temporary Tenant Rent(2) | $2,118,799 | $1,662,768 | (3) | $1,709,417 | (3) | $1,645,952 | $1,777,441 | $4.54 | ||||||||
| Other Rents | $191,628 | $188,725 | $187,590 | $175,378 | $192,612 | $0.49 | ||||||||||
| Total Minimum Rent | $16,175,108 | $16,009,747 | $15,847,706 | $16,008,738 | $15,892,053 | $40.56 | ||||||||||
| Overage Rent | $150,629 | $151,811 | $209,629 | $354,924 | $360,764 | $0.92 | ||||||||||
| Expense Reimbursements | $8,652,357 | $9,228,531 | $9,213,072 | $9,244,935 | $9,074,259 | $23.16 | ||||||||||
| Other Income | $528,608 | $477,980 | $481,491 | $422,373 | $585,820 | $1.49 | ||||||||||
| Total Gross Income | $25,506,702 | $25,868,069 | $25,751,898 | $26,030,970 | $25,912,897 | $66.13 | ||||||||||
| Vacancy and Credit Loss | $0 | $0 | $0 | $0 | $0 | $0.00 | ||||||||||
| Effective Gross Income | $25,506,702 | $25,868,069 | $25,751,898 | $26,030,970 | $25,912,897 | $66.13 | ||||||||||
| Total Expenses | $8,303,072 | $8,578,260 | $8,571,453 | $8,724,355 | $8,234,769 | $21.01 | ||||||||||
| Net Operating Income | $17,203,630 | $17,289,809 | $17,180,445 | $17,306,615 | $17,678,128 | $45.11 | ||||||||||
| Capital Reserves | $0 | $0 | $0 | $0 | $97,435 | $0.25 | ||||||||||
| Tenant Improvements | $0 | $0 | $0 | $0 | $409,846 | $1.05 | ||||||||||
| Leasing Commissions | $0 | $0 | $0 | $0 | $607,200 | $1.55 | ||||||||||
| Net Cash Flow | $17,203,630 | $17,289,809 | $17,180,445 | $17,306,615 | $16,563,648 | $42.27 | ||||||||||
| Occupancy %(4) | 92.4% | 95.3% | 92.2% | 93.5% | 90.1% | (5) | ||||||||||
| NOI DSCR(6) | 1.79x | 1.80x | 1.79x | 1.80x | 1.84x | |||||||||||
| NCF DSCR(6) | 1.79x | 1.80x | 1.79x | 1.80x | 1.72x | |||||||||||
| NOI Debt Yield(6) | 10.4% | 10.5% | 10.4% | 10.5% | 10.7% | |||||||||||
| NCF Debt Yield(6) | 10.4% | 10.5% | 10.4% | 10.5% | 10.1% | |||||||||||
| (1) | UW Base Rental Revenue is based on the rent roll as of September 28, 2016 and includes rent steps totaling $207,732 taken through September 30, 2017 and $459,146 of rent associated with three tenants which have signed leases but are not yet in occupancy (Footlocker/House of Hoops, Cinnabon, Papaya). Footlocker / House of Hoops has an executed lease for 8,331 SF that is currently occupied by FYE through February 28, 2017. FYE’s current annual rent is $152,739. Underwritten rent reflects Footlocker / House of Hoops contractual rent of $333,240. Love Culture (9,713 SF) and Tempur Pedic (1,020 SF) are currently in occupancy, but are expected to vacate, and have been excluded from underwritten rent. |
| (2) | Temporary Tenant Rent includes temporary tenant income, percentage rent in-lieu, cart income, kiosk income, local even income, seasonal income and vending income. |
| (3) | Includes ($16,269) of deferred rent in 2014 and $4,067 of deferred rent in 2015. |
| (4) | Occupancy excludes non-collateral anchors, outparcels, and temporary tenants. Including temporary tenants, occupancy is 95.2%, 98.7%, 97.5% and 98.4% for 2013, 2014, 2015 and 8/31/2016 TTM, respectively. |
| (5) | UW Occupancy is based on square footage of 391,862 (based on September 28, 2016 rent roll) and reflects in place occupancy excluding two tenants that are expected to vacate (Love Culture – 9,713 SF and Tempur Pedic – 1,020 SF). UW Occupancy includes Footlocker / House of Hoops, Cinnabon and Papaya (in aggregate representing 3.7% of SF), which have executed leases but have not yet taken occupancy. |
| (6) | Debt service coverage ratios and debt yields are based on the Wolfchase Galleria Whole Loan. |
Escrows and Reserves. During the continuance of a Lockbox Event Period (defined below), or if the Wolfchase Galleria Borrower has failed to pay real estate taxes as required by the Wolfchase Galleria Whole Loan documents, the Wolfchase Galleria Borrower is required to escrow monthly 1/12th of the annual estimated tax payments. During the continuance of a Lockbox Event Period, the Wolfchase Galleria Borrower is required to escrow monthly 1/12th of the annual estimated insurance premiums (unless the Wolfchase Galleria Borrower maintains an acceptable blanket policy). During the continuance of a Lockbox Event Period, the Wolfchase Galleria Borrower is required to make monthly deposits equal to $8,164.00 into an escrow account for replacements and repairs on each monthly payment date on which the balance on deposit in such escrow account is less than $195,931.00. During the continuance of a Lockbox Event Period, the Wolfchase Galleria Borrower is required to make monthly deposits equal to $48,983.00 into an escrow account for tenant improvements and leasing commissions on each monthly payment date on which the balance on deposit in such escrow account is less than $1,175,586.00.
Lockbox and Cash Management. A hard lockbox is in place with respect to the Wolfchase Galleria Whole Loan, and, within 30 days after the loan closing date and thereafter, the Wolfchase Galleria Borrower is required to direct all tenants to pay rent directly into such lockbox. The Wolfchase Galleria Whole Loan has springing cash management (i.e., the Wolfchase Galleria Whole Loan has cash management only after the initial occurrence and during the continuance of a Lockbox Event Period). Provided a Lockbox Event Period is not continuing, funds in the lockbox account are required to be swept to an account designated by the Wolfchase Galleria Borrower. Upon the occurrence of a Lockbox Event Period, the Wolfchase Galleria Borrower is required to establish and maintain a cash management account controlled by the lender, and, during the continuance of a Lockbox Event Period, funds in the lockbox account are required to be transferred weekly to the cash management account. During the continuance of a Lockbox Event Period arising solely in connection with a DSCR Trigger Event (as defined below), funds in the cash management account are required to be applied on each monthly payment date to pay debt service on the Wolfchase Galleria Whole Loan, to fund the required reserves deposits as described above under “Escrows and Reserves”, to disburse the monthly operating expenses and capital expenditures referenced in the approved annual budget (or if no approved annual budget is available because review is pending or not required, in the existing annual budget) and extraordinary operating expenses or capital expenses approved (except in the case of emergency expenses) by the lender, and to disburse the remainder (i) if a Sweep Event Period (as defined below) is continuing, into an account to be held by the lender as additional security for the Wolfchase Galleria Whole Loan during the continuance of such Sweep Event Period and (ii) otherwise, to the Wolfchase Galleria Borrower. The annual budget is required to be approved by the lender only if both (A) either (x) a Lockbox Event Period caused by an event of default under the Wolfchase Galleria Whole Loan exists or (y) any other Lockbox Event Period exists and one or more of Simon Property Group, L.P. and Simon Property Group, Inc. does not own at least 50% of, or does not
This is not a research report and was not prepared by any Underwriter’s research department. Please see additional important information and qualifications at the end of this Term Sheet.
T-56
| MSC 2016-UBS12 | Wolfchase Galleria |
control, the Wolfchase Galleria Borrower, and (B) there is (x) more than a 5% deviation from the prior fiscal year’s annual budget or (y) an increase in fees or other payments made to an affiliate of the Wolfchase Galleria Borrower.
A “Lockbox Event Period” means the period:
(i) commencing upon an event of default under the Wolfchase Galleria Whole Loan and ending upon the acceptance by the lender, in its sole discretion, of a cure of such event of default, or
(ii) commencing on the date upon which the debt service coverage ratio on the Wolfchase Galleria Whole Loan for the immediately preceding four calendar quarters is less than 1.40x for two consecutive calendar quarters (a “DSCR Trigger Event”), and ending on the date the debt service coverage ratio on the Wolfchase Galleria Whole Loan for the immediately preceding four calendar quarters equals or exceeds 1.40x for two consecutive calendar quarters.
A “Sweep Event Period” means the period commencing on the date upon which the debt service coverage ratio on the Wolfchase Galleria Whole Loan for the immediately preceding four calendar quarters is less than 1.30x for two consecutive calendar quarters, and ending on the date the debt service coverage ratio on the Wolfchase Galleria Whole Loan for the immediately preceding four calendar quarters equals or exceeds 1.30x for two consecutive calendar quarters.
Additional Secured Indebtedness (not including trade debts). The Wolfchase Galleria Property also secures the Wolfchase Galleria ServicedPari Passu Companion Loans, which have an aggregate Cut-off Date principal balance of $94,866,648. The Wolfchase Galleria ServicedPari Passu Companion Loans accrue interest at the same rate as the Wolfchase Galleria Mortgage Loan. The Wolfchase Galleria Mortgage Loan is entitled to payments of principal and interest on a pro rata andpari passu basis with the Wolfchase Galleria ServicedPari Passu Companion Loans. The holders of the Wolfchase Galleria Mortgage Loan and the Wolfchase Galleria ServicedPari Passu Companion Loans have entered into a co-lender agreement which sets forth the allocation of collections on the Wolfchase Galleria Whole Loan. See “Description of the Mortgage Pool—The Whole Loans—The Serviced Pari Passu Whole Loans” in the Preliminary Prospectus.
Mezzanine Loan and Preferred Equity. Not permitted.
Release of Property. The Wolfchase Galleria Borrower may transfer (including to an affiliate) all or any portion of an approximately 12.57 acre unimproved parcel, which was not included in the underwriting of the Wolfchase Galleria Whole Loan (the “Wolfchase Galleria Unimproved Parcel”), without payment to the lender (except to the extent, if any, required by REMIC regulations), upon satisfaction of certain conditions set forth in the Wolfchase Galleria Whole Loan documents, and may relocate tenants at the Wolfchase Galleria Property to the Wolfchase Galleria Unimproved Parcel after such transfer, provided that the Wolfchase Galleria Borrower delivers an officer’s certificate to the lender certifying that such tenant relocation will not cause a material diminution in the annual gross revenue generated from the operation of the Wolfchase Galleria Property In addition, the Wolfchase Galleria Borrower may make transfers of non-income producing portions of the Wolfchase Galleria Property as described in the Preliminary Prospectus. See “—Description of the Mortgage Pool—Certain Terms of the Mortgage Loans—Partial Releases”.
Terrorism Insurance. The Wolfchase Galleria Borrower is required to obtain insurance against acts of terrorism to the extent such insurance is available; provided, that if the Terrorism Risk Insurance Program Reauthorization Act of 2015 (as the same may be amended, restated, supplemented or otherwise modified from time to time) is not in effect (A) the Wolfchase Galleria Borrower is not required to pay insurance premiums with respect to such terrorism insurance in excess of the Terrorism Cap (defined below) and (B) any such policy may have a deductible that is reasonable with respect to properties similar to the Wolfchase Galleria Property and for the geographic region where the Wolfchase Galleria Property is located, so long as in no event may such deductible exceed $5,000,000. “Terrorism Cap” means two times the amount of the then-current annual insurance premiums payable by the Wolfchase Galleria Borrower for the policies insuring only the Wolfchase Galleria Property (excluding the wind, flood and earthquake components of such insurance premiums) on a stand-alone basis.
This is not a research report and was not prepared by any Underwriter’s research department. Please see additional important information and qualifications at the end of this Term Sheet.
T-57
| MSC 2016-UBS12 | The Orchard |
Mortgage Loan No. 4 – The Orchard
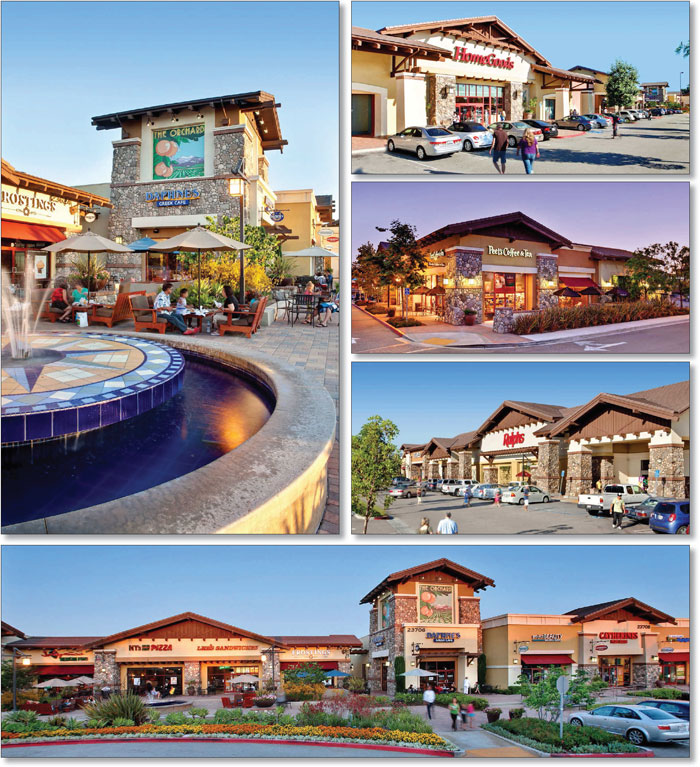
This is not a research report and was not prepared by any Underwriter’s research department. Please see additional important information and qualifications at the end of this Term Sheet.
T-58
| MSC 2016-UBS12 | The Orchard |
Mortgage Loan No. 4 – The Orchard
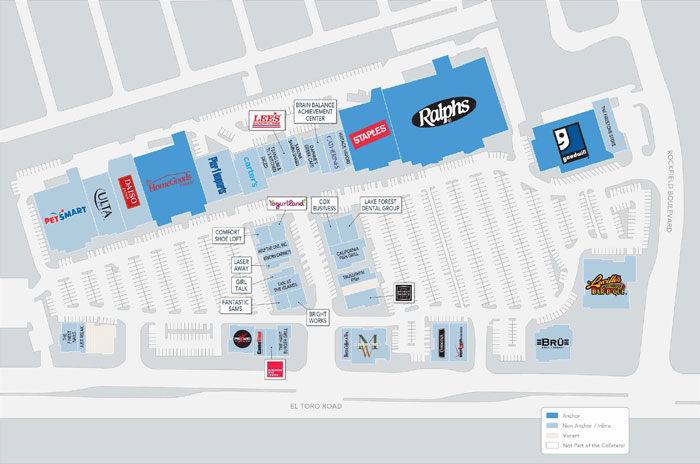
This is not a research report and was not prepared by any Underwriter’s research department. Please see additional important information and qualifications at the end of this Term Sheet.
T-59
| MSC 2016-UBS12 | The Orchard |
Mortgage Loan No. 4 – The Orchard
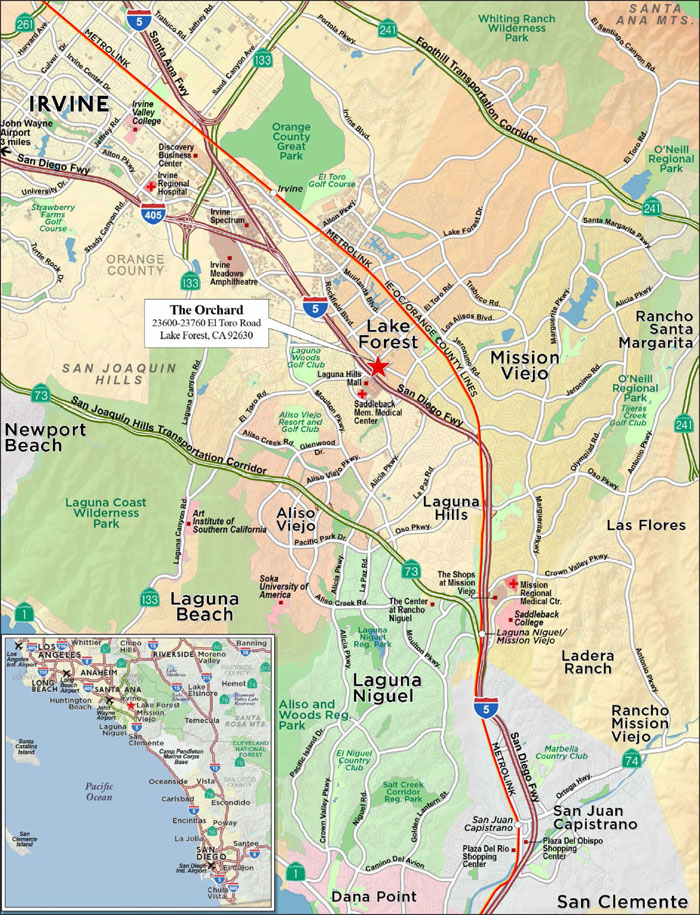
This is not a research report and was not prepared by any Underwriter’s research department. Please see additional important information and qualifications at the end of this Term Sheet.
T-60
| MSC 2016-UBS12 | The Orchard |
| Mortgage Loan No. 4 – The Orchard |
| Mortgage Loan Information | Mortgaged Property Information | ||||||
| Mortgage Loan Seller: | MSMCH | Single Asset/Portfolio: | Single Asset | ||||
| Original Balance(1): | $61,000,000 | Location: | Lake Forest, CA 92630 | ||||
| Cut-off Date Balance(1): | $60,911,639 | General Property Type: | Retail | ||||
| % of Initial Pool Balance: | 7.4% | Detailed Property Type: | Anchored | ||||
| Loan Purpose: | Refinance | Title Vesting: | Fee | ||||
| Sponsor: | Schottenstein Realty LLC | Year Built/Renovated: | 1972, 2006 / N/A | ||||
| Mortgage Rate: | 3.9700% | Size: | 280,644 SF | ||||
| Note Date: | 10/17/2016 | Cut-off Date Balance per SF(1): | $359 | ||||
| First Payment Date: | 12/1/2016 | Maturity Date Balance per SF(1): | $286 | ||||
| Maturity Date: | 11/1/2026 | Property Manager: | Schottenstein Property Group LLC | ||||
| Original Term to Maturity | 120 months | ||||||
| Original Amortization Term: | 360 months | Underwriting and Financial Information | |||||
| IO Period: | 0 months | UW NOI(4): | $8,093,342 | ||||
| Seasoning: | 1 month | UW NOI Debt Yield(1): | 8.0% | ||||
| Prepayment Provisions: | LO (24); YM1 (89); O (7) | UW NOI Debt Yield at Maturity(1): | 10.1% | ||||
| Lockbox/Cash Mgmt Status: | Hard/Springing | UW NCF DSCR(1): | 1.35x | ||||
| Additional Debt Type(2): | Pari Passu | Most Recent NOI: | $7,827,767 (6/30/2016 TTM) | ||||
| Additional Debt Balance(2): | $39,942,058 | 2nd Most Recent NOI: | $7,857,115 (12/31/2015) | ||||
| Future Debt Permitted (Type): | No (N/A) | 3rd Most Recent NOI: | $7,487,711 (12/31/2014) | ||||
| Reserves(3) | Most Recent Occupancy(5): | 97.6% (8/24/2016) | |||||
| Type | Initial | Monthly | Cap | 2nd Most Recent Occupancy: | 98.0% (12/31/2015) | ||
| RE Tax: | $0 | Springing | N/A | 3rd Most Recent Occupancy: | 99.8% (12/31/2014) | ||
| Insurance: | $0 | Springing | N/A | Appraised Value (as of): | $148,000,000 (9/1/2016) | ||
| Recurring Replacements: | $0 | $3,508 | $84,193 | Cut-off Date LTV Ratio(1): | 68.1% | ||
| TI/LC: | $0 | $14,734 | $353,611 | Maturity Date LTV Ratio(1): | 54.3% | ||
| Environmental Escrow | $420,000 | Springing | N/A | ||||
| Sources and Uses | |||||||
| Sources | Proceeds | % of Total | Uses | Proceeds | % of Total | ||
| Loan Amount(1): | $101,000,000 | 99.8% | Loan Payoff: | $100,000,000 | 98.8% | ||
| Borrower Equity: | $250,693 | 0.2% | Closing Costs: | $830,693 | 0.8% | ||
| Reserves: | $420,000 | 0.4% | |||||
| Total Sources: | $101,250,693 | 100.0% | Total Uses: | $101,250,693 | 100.0% | ||
| (1) | The Orchard Mortgage Loan is part of The Orchard Whole Loan, which is comprised of threepari passu promissory notes with an aggregate principal balance of $101,000,000. The Cut-off Date Balance per SF, Maturity Date Balance per SF, UW NCF DSCR, UW NOI Debt Yield, UW NOI Debt Yield at Maturity, Cut-off Date LTV Ratio and Maturity Date LTV Ratio numbers presented above are based on the aggregate principal balance of the promissory notes comprising The Orchard Whole Loan. |
| (2) | See “—The Mortgage Loan” and “—Additional Secured Indebtedness (not including trade debts)” below for further discussion of additional debt. |
| (3) | See “—Escrows and Reserves” below for further discussion of reserve requirements. |
| (4) | UW NOI reflects rent steps through September 30, 2017 totaling $398,706, as well as 9,722 SF leased to three new tenants in 2016 that include Carter’s, Diced and Fantastic Sam’s. |
| (5) | Most Recent Occupancy as of August 24, 2016 includes 1,568 SF of space leased to Vintage Vapors. The Vintage Vapors lease expired July 14, 2016, but the tenant remained in occupancy on a month-to-month basis. Vintage Vapors has been underwritten as vacant. The occupancy exclusive of the Vintage Vapors space is 97.0% |
The Mortgage Loan.The fourth largest mortgage loan (the “The Orchard Mortgage Loan”) is part of a whole loan (the “The Orchard Whole Loan”) evidenced by threepari passu promissory notes in the aggregate original principal amount of $101,000,000, all of which are secured by a first priority fee mortgage encumbering an anchored retail property known as The Orchard (the “The Orchard Property”). Promissory Note A-1, with an original principal balance of $61,000,000 represents The Orchard Mortgage Loan, and will be included in the MSC 2016-UBS12 Trust. Promissory Note A-2 and Promissory Note A-3, in the aggregate original principal balance of $40,000,000 (“The Orchard ServicedPari Passu Companion Loan”) is expected to be included in the MSC 2016-BNK2 Trust. The Orchard Whole Loan will initially be serviced pursuant to the pooling and servicing agreement for the MSC 2016-BNK2 Trust, and from and after the closing of the MSC 2016-UBS12 transaction, will be serviced pursuant to the pooling and servicing agreement for the MSC 2016-UBS12 Trust. See “Description of the Mortgage Pool—The Whole Loans—The Serviced Pari Passu Whole Loans” and “Pooling and Servicing Agreement” in the Preliminary Prospectus.
The proceeds of The Orchard Whole Loan were primarily used to refinance a previous loan of approximately $100,000,000, pay closing costs and fund upfront reserves. The previous mortgage loan secured by The Orchard Property was included in the JPMCC 2007-LDPX transaction.
The Borrower and the Sponsors. The borrower is Orchard Lake Forest CA LP, a California limited partnership (the “The Orchard Borrower”). It is owned 99% by Schottenstein Realty LLC, as limited partner, and 1% by Orchard Lake Forest CA SRL LLC, its general partner. Both the general and limited partners are Delaware limited liability companies, and the general partner has two independent directors. Legal counsel to The Orchard Borrower delivered a non-consolidation opinion in connection with the origination of The Orchard Whole Loan. Orchard Lake Forest CA SRL LLC is owned 100%
This is not a research report and was not prepared by any Underwriter’s research department. Please see additional important information and qualifications at the end of this Term Sheet.
T-61
| MSC 2016-UBS12 | The Orchard |
by Schottenstein Realty LLC. Schottenstein Realty LLC is owned 6.6% by various members of the Schottenstein family, 68.25% by various trusts for the benefit of members of the Schottenstein family of which Jay L. Schottenstein is currently the trustee, and 25.15% by various trusts for the benefit of the Schottenstein family with other persons or entities as trustee. Schottenstein Realty LLC is the non-recourse carveout guarantor for The Orchard Whole Loan.
Schottenstein Realty LLC is an owner, operator, acquirer and redeveloper of community and neighborhood shopping centers throughout the United States predominantly anchored by national retailers. The Chairman and Chief Executive Officer, Jay L. Schottenstein, has led the Schottenstein companies since 1993 and has more than 30 years of experience in the retail and real estate industries.
As of June 30, 2016, Schottenstein Realty LLC owns interests in 90 operating properties in 24 states with approximately 11.7 million SF of GLA, which are 96.4% occupied. It owns 81 consolidated retail properties with approximately 9.9 million SF of GLA and joint venture interests in 8 unconsolidated retail properties with approximately 1 million SF of GLA.
The Property.The Orchard Property is a 280,644 SF anchored retail center located in Lake Forest, California, within Orange County, approximately 10 miles south of Irvine, California. Built in 1972 and 2006, The Orchard Property consists of 23 single-story buildings, is situated on a 22-acre site along El Toro Road and features 1,366 parking spaces (4.9 spaces per 1,000 SF). As of August 24, 2016, The Orchard Property was 97.6% leased by a mix of 45 national and local retail and restaurant tenants. The Orchard Property is anchored by Ralphs Grocery (55,105 SF), HomeGoods (25,000 SF), Staples (20,000 SF), PetSmart (20,000 SF) and Goodwill (18,800 SF), which comprise 49.5% of total NRA. Other major tenants include Pier 1 Imports, Ulta Beauty and Carter’s, as well as a mix of local and regional restaurant tenants. Outside of the top five tenants, no other individual tenant comprises more than 4.4% of NRA or 6.1% of underwritten rent.
Major Tenants.
Ralphs Grocery (55,105 SF, 19.6% of NRA, 17.2% ofunderwritten rent). Ralphs Grocery occupies 55,105 SF under a lease that commenced June 22, 2007 and expires June 30, 2027, with four 5-year extension options and no termination options. Ralphs Grocery is a subsidiary of The Kroger Co., a Cincinnati-based regional grocery chain. As of January 30, 2016, Kroger operated 2,778 retail food stores, 1,387 fuel centers, 784 convenience stores and 323 fine jewelry stores.
HomeGoods(25,000 SF 8.9% of NRA, 5.0% of underwritten rent). HomeGoods occupies 25,000 SF under a lease that commenced October 16, 2005, and expires October 31, 2020 with three five-year extension options and no termination options. HomeGoods is a retailer of an array of home fashions, including home basics, giftware, accent furniture, lamps, rugs, wall décor, seasonal items and decorative accessories. HomeGoods is a division of TJX Companies, Inc. TJX is a retailer of apparel and home fashions. The company operates approximately 2,587 stores in the U.S. and internationally under a number of different names including HomeGoods, T.J. Maxx, Marshalls, and Sierra Trading Post. TJX operates 526 HomeGoods stores.
Staples(20,000 SF, 7.1% of NRA, 6.5% of underwritten rent).Staples occupies 20,000 SF under a lease that commenced November 18, 2006 and expires November 30, 2021 with three, five-year extension options and no termination options. Staples is an office supply retailer, offering supplies, technology, business services and business to business deliveries. As of January 30, 2016, Staples operated approximately 1,302 retail stores in the U.S. and 305 stores in Canada.
PetSmart(20,000 SF, 7.1% of NRA, 6.2% of underwritten rent).PetSmart occupies 20,000 SF under a lease that commenced October 17, 2005 and expires October 31, 2020 with three, five-year extension options and no termination options. PetSmart is a specialty retailer offering pet-related products and services. As of October 20, 2016, it operated 1,477 pet stores and 203 in-store PetSmart PetsHotel dog and cat boarding facilities in the United States, Canada, and Puerto Rico.
This is not a research report and was not prepared by any Underwriter’s research department. Please see additional important information and qualifications at the end of this Term Sheet.
T-62
| MSC 2016-UBS12 | The Orchard |
The following table presents a summary regarding the largest tenants at The Orchard Property.
| Tenant Summary(1) | ||||||||||
| Tenant Name | Credit Rating (Fitch/Moody’s/S&P)(2) | Tenant SF | % of Collateral SF | Annual UW Rent | % of Annual UW Rent | Annual UW Rent PSF(3) | Most Recently Reported Sales | Occ. Cost %(4) | Lease Expiration | |
| $ | PSF | |||||||||
| Anchor/Major Tenants | ||||||||||
| Ralphs Grocery(5) | BBB/Baa1/BBB | 55,105 | 19.6% | $1,466,895 | 17.2% | $26.62 | $23,098,676 | $419 | 7.0% | 6/30/2027 |
| HomeGoods(6) | NR/A2/A+ | 25,000 | 8.9% | $430,000 | 5.0% | $17.20 | $10,610,850 | $424 | 6.0% | 10/31/2020 |
| Staples(7) | BB+/Baa2/BBB- | 20,000 | 7.1% | $556,600 | 6.5% | $27.83 | N/A | N/A | N/A | 11/30/2021 |
| PetSmart(8) | NR/B3/B+ | 20,000 | 7.1% | $532,400 | 6.2% | $26.62 | $6,543,693 | $327 | 10.7% | 10/31/2020 |
| Goodwill(9) | NR/NR/NR | 18,800 | 6.7% | $398,372 | 4.7% | $21.19 | $3,740,010 | $199 | 14.4% | 6/30/2019 |
| Anchor/Major Tenants | 138,905 | 49.5% | $3,384,267 | 39.7% | $24.36 | |||||
| Other Tenants | 133,359 | 47.5% | $5,137,812 | 60.3% | $38.53 | |||||
| Vacant Space | 8,380 | 3.0% | $0 | 0.0% | $0.00 | |||||
| Total/Wtd. Avg. | 280,644 | 100.0% | $8,522,079 | 100.0% | $31.30 | |||||
| (1) | Information is based on the underwritten rent roll. |
| (2) | Certain ratings are those of the parent company whether or not the parent guarantees the lease. |
| (3) | Wtd. Avg. Annual UW Rent PSF excludes vacant space. |
| (4) | Occ Cost % is based on the contractual rent as of the August 24, 2016 rent roll and Underwritten Reimbursements divided by most recently reported sales. |
| (5) | Most Recently Reported Sales reflect the 12 month period ending December 31, 2015. |
| (6) | Most Recently Reported Sales reflect the 12 month period ending January 31, 2016. |
| (7) | Staples does not report sales. |
| (8) | Most Recently Reported Sales reflect the 12 month period ending January 31, 2015. |
| (9) | Most Recently Reported Sales and Occupancy Cost are as of Goodwill’s fiscal year end of September 30, 2016 and reflect annualized 10 months’ sales data. |
The following table presents historical sales information for the anchor tenants at The Orchard Property:
| Historical Sales Summary(1) | |||||||||||||||
| 3rdMost Recent Reported Sales | 2nd Most Recent Reported Sales | Most Recent Reported Sales | |||||||||||||
| Tenant | Sales ($) | Sales (PSF) | Occ. Cost(2) | Sales ($) | Sales (PSF) | Occ. Cost(2) | Sales ($) | Sales (PSF) | Occ. Cost(2) | ||||||
| Ralphs Grocery(3) | $20,101,294 | $365 | 8.0% | $21,322,624 | $387 | 7.5% | $23,098,676 | $419 | 7.0% | ||||||
| HomeGoods(4) | $8,468,619 | $339 | 7.5% | $9,661,833 | $386 | 6.6% | $10,610,850 | $424 | 6.0% | ||||||
| Staples(5) | N/A | N/A | N/A | N/A | N/A | N/A | N/A | N/A | N/A | ||||||
| PetSmart(6) | $5,815,153 | $291 | 12.1% | $5,966,921 | $298 | 11.8% | $6,543,693 | $327 | 10.7% | ||||||
| Goodwill(7) | $3,766,192 | $200 | 14.3% | $3,867,192 | $206 | 14.0% | $3,740,010 | $199 | 14.4% | ||||||
| Total/Wtd. Avg.(8) | $38,151,258 | $321 | 9.6% | $40,818,570 | $343 | 9.1% | $43,993,229 | $370 | 8.6% | ||||||
| (1) | Information is based on the underwritten rent roll. |
| (2) | Occ Cost % is based on the contractual rent as of the August 24, 2016 rent roll and Underwritten Reimbursements divided by the respective year’s reported sales. |
| (3) | With respect to Ralphs Grocery, tenant sales information represents 12 month periods ending December 31, 2013, 2014 and 2015, respectively. |
| (4) | With respect to HomeGoods, tenant sales information represents 12 month periods ending January 31, 2014, 2015 and 2016, respectively. |
| (5) | Staples does not report sales |
| (6) | With respect to PetSmart, tenant sales information represents 12 month periods ending January 31, 2013, 2014 and 2015, respectively. |
| (7) | With respect to Goodwill, tenant sales information represents 12 month periods ending September 30, 2014 and 2015. Most Recently Reported Sales reflects annualized 10 months’ sales data. |
| (8) | Total and Wtd. Avg. Sales, Sales PSF and Occupancy Cost exclude Staples. |
This is not a research report and was not prepared by any Underwriter’s research department. Please see additional important information and qualifications at the end of this Term Sheet.
T-63
| MSC 2016-UBS12 | The Orchard |
The following table presents certain information relating to the lease rollover at The Orchard Property:
| Lease Rollover Schedule(1)(2) | ||||||||
| Year | # of Leases Rolling | SF Rolling | Approx. % of Total SF Rolling | Approx. Cumulative % of SF Rolling | Total UW Rent Rolling | Annual UW Rent PSF Rolling(3) | Approx. % of Total Rent Rolling | Approx. Cumulative % of Total Rent Rolling |
| 2016 | 1 | 1,499 | 0.5% | 0.5% | $100,845 | $67.28 | 1.2% | 1.2% |
| 2017 | 9 | 19,469 | 6.9% | 7.5% | $1,021,566 | $52.47 | 12.0% | 13.2% |
| 2018 | 4 | 6,678 | 2.4% | 9.9% | $305,182 | $45.70 | 3.6% | 16.8% |
| 2019 | 6 | 32,350 | 11.5% | 21.4% | $758,875 | $23.46 | 8.9% | 25.7% |
| 2020 | 6 | 64,098 | 22.8% | 44.2% | $1,517,562 | $23.68 | 17.8% | 43.5% |
| 2021 | 5 | 32,031 | 11.4% | 55.6% | $1,244,722 | $38.86 | 14.6% | 58.1% |
| 2022 | 4 | 36,123 | 12.9% | 68.5% | $1,278,169 | $35.38 | 15.0% | 73.1% |
| 2023 | 1 | 1,725 | 0.6% | 69.1% | $73,520 | $42.62 | 0.9% | 73.9% |
| 2024 | 1 | 1,301 | 0.5% | 69.6% | $57,413 | $44.13 | 0.7% | 74.6% |
| 2025 | 2 | 3,863 | 1.4% | 71.0% | $146,046 | $37.81 | 1.7% | 76.3% |
| 2026 | 3 | 9,722 | 3.5% | 74.4% | $357,683 | $36.79 | 4.2% | 80.5% |
| 2027 & Beyond | 2 | 63,405 | 22.6% | 97.0% | $1,660,495 | $26.19 | 19.5% | 100.0% |
| Vacant | 0 | 8,380 | 3.0% | 100.0% | $0 | $0.00 | 0.0% | 100.0% |
| Total/Wtd. Avg. | 44 | 280,644 | 100.0% | $8,522,079 | $31.30 | 100.0% | ||
| (1) | Information is based on the underwritten rent roll. |
| (2) | Certain tenants may have lease termination options that are exercisable prior to the stated expiration date of the subject lease or leases which are not considered in the lease rollover schedule. |
| (3) | Wtd. Avg. Annual UW Rent PSF Rolling excludes vacant space. |
The Market. The Orchard Property is situated at the southeast corner of El Toro Road and Rockfield Boulevard in the city of Lake Forest, California, approximately 10 miles southeast of Irvine, California and approximately 45 miles southeast of downtown Los Angeles. The Orchard Property is part of a large retail center located at the intersection of El Toro Road and Rockfield Boulevard. The Orchard Property is located approximately one half mile east of Interstate 5, the primary north/south arterial through Orange County, providing access to Los Angeles to the north and San Diego to the south. Interstate 5 intersects with El Toro Road, which serves as a primary east/west arterial through the South Orange County submarket. According to the appraisal, the El Toro Road-Rockfield Boulevard intersection experiences average daily traffic counts of 135,000 and Interstate 5 has average daily traffic counts of 366,000.
The neighborhood surrounding The Orchard Property is comprised of a mix of commercial and retail development along El Toro Road and is surrounded by residential and multifamily development. According to a third party market research report, The Orchard Property is located in the South Orange County retail submarket. As of the second quarter of 2016, the South Orange County retail submarket had an overall vacancy rate of 4.3% and an average asking annual lease rate of $37.81 PSF compared to the overall Orange County retail market with an overall vacancy rate of 5.1% and an average asking annual lease rate of $32.84 PSF. According to a third party market research report, the South Orange County retail submarket contains approximately 9.4 million square feet of inventory, accounting for approximately 23.1% of the overall Orange County retail market.
This is not a research report and was not prepared by any Underwriter’s research department. Please see additional important information and qualifications at the end of this Term Sheet.
T-64
| MSC 2016-UBS12 | The Orchard |
The appraisal identified a primary trade area of up to a three-mile radius around The Orchard Property and a secondary trade area up to a five-mile radius around The Orchard Property. A summary of demographics in the primary and secondary trade areas compared to Orange County is presented below.
| Statistic | 1-mile Radius | 3-mile Radius | 5-mile Radius | Orange County |
| Population | ||||
| 2000 | 21.968 | 146,187 | 266,593 | 2,846,233 |
| 2015 | 23,488 | 153,706 | 304,967 | 3,188,896 |
| 2020 (projected) | 23,594 | 154,292 | 312,834 | 3,269,307 |
| % Increase 2000-2015 | 0.45% | 0.33% | 0.90% | 0.76% |
| % Increase 2015-2020 (projected) | 0.09% | 0.08% | 0.51% | 0.50% |
| Average Household Income | ||||
| 2015 | $80,625 | 104,860 | 119,487 | 108,987 |
| 2020 (projected) | $95,224 | 121,200 | 138,183 | 126,917 |
| % Increase 2015-2020 (projected) | 3.38% | 2.94% | 2.95% | 3.09% |
| Number of Households | ||||
| 2000 | 8,577 | 56,398 | 100,993 | 935,113 |
| 2015 | 9,044 | 59,435 | 117,180 | 1,062,559 |
| 2020 (projected) | 9,106 | 59,650 | 120,582 | 1,094,494 |
| % Increase 2000-2015 | 0.35% | 0.35% | 1.00% | 0.86% |
| % Increase 2015-2020 (projected) | 0.14% | 0.07% | 0.57% | 0.59% |
Source: Appraisal
The following table presents competitive retail properties with respect to The Orchard Property:
| Competitive Property Summary | ||||||
| Property Name | Type | Year Built/Renovated | Size (SF) | Total Occupancy | Anchor Tenants | Distance to Subject |
| The Orchard | Anchored Retail | 1972,2006/N/A | 280,644 | 97.6%(1) | Ralphs Grocery, HomeGoods, Staples, PetSmart, Goodwill | N/A |
| Twin Peaks Plaza | Neighborhood Center | 1999/2004 | 265,000 | 98.0% | Smart & Final, Crunch Fitness, Bevmo | 1 Block |
| The Arbor | Neighborhood Center | 2001/N/A | 182,509 | 96.0% | Home Depot | 1 Block |
| Hunter Court | Neighborhood Center | 1997/N/A | 122,540 | 98.0% | Petco, Ross, CVS | 1 Block |
| Lake Forest Marketplace | Neighborhood Center | 1967/1998 | 110,448 | 97.0% | 99 Cent Store, Guitar Center | 2 Blocks |
| Oakbrook Village | Neighborhood Center | 1980/2015 | 106,386 | 97.0% | Marshalls, Trader Joes, Woody’s Diner, El Torito | 0.8 miles |
| Total/Wtd. Avg. | 1,067,527 | 97.0% | ||||
Source: Appraisal
| (1) | Information is based on the underwritten rent roll. |
This is not a research report and was not prepared by any Underwriter’s research department. Please see additional important information and qualifications at the end of this Term Sheet.
T-65
| MSC 2016-UBS12 | The Orchard |
Operating History and Underwritten Net Cash Flow. The following table presents certain information relating to the historical operating performance and the Underwritten Net Cash Flow at The Orchard Property:
| Cash Flow Analysis | ||||||
| 2013 | 2014 | 2015 | 6/30/2016 TTM | UW | UW PSF | |
| Base Rent | $7,888,225 | $8,004,253 | $8,241,187 | $8,155,540 | $8,895,008(1) | $31.69 |
| Total Recoveries | $1,906,108 | $1,929,710 | $2,032,092 | $2,210,170 | $2,248,488 | $8.01 |
| Other Income | $13,795 | $12,354 | $7,324 | $3,626 | $0 | $0.00 |
| Less Vacancy & Credit Loss | $5,554 | ($20,122) | ($36,806) | ($68,645) | ($557,175) | ($1.99) |
| Effective Gross Income | $9,813,682 | $9,926,195 | $10,243,797 | $10,300,691 | $10,586,321 | $37.72 |
| Total Expenses | $2,456,956 | $2,438,484 | $2,386,682 | $2,472,924 | $2,492,979 | $8.88 |
| Net Operating Income | $7,356,726 | $7,487,711 | $7,857,115 | $7,827,767 | $8,093,342 | $28.84 |
| Capital Expenditures | $0 | $0 | $0 | $0 | $56,129 | 0.20 |
| TI/LC | $0 | $0 | $0 | $0 | $263,020 | $0.94 |
| Net Cash Flow | $7,356,726 | $7,487,711 | $7,857,115 | $7,827,767 | $7,774,194 | $27.70 |
| Occupancy % | 98.9% | 99.8% | 98.0% | 96.6% | 95.0%(2) | |
| NOI DSCR(3) | 1.28x | 1.30x | 1.36x | 1.36x | 1.40x | |
| NCF DSCR(3) | 1.28x | 1.30x | 1.36x | 1.36x | 1.35x | |
| NOI Debt Yield(3) | 7.3% | 7.4% | 7.8% | 7.8% | 8.0% | |
| NCF Debt Yield(3) | 7.3% | 7.4% | 7.8% | 7.8% | 7.7% | |
| (1) | Underwritten Rent is based on the rent roll dated August 24, 2016 and includes rent steps through September 30, 2017 totaling $398,706. |
| (2) | The Underwritten Occupancy of 95.0% is below the current occupancy of 97.6%, as of the August 24, 2016 rent roll, and below the occupancy of 97.0% per the underwritten rent roll, which excludes 1,568 SF leased to Vintage Vapors. |
| (3) | Debt service coverage ratios and debt yields are based on The Orchard Whole Loan. |
Escrows and Reserves. The Orchard Whole Loan documents provide for upfront reserves in the amount of $420,000 in connection with the costs of continued remedial activities related to (i) seeking environmental compliance and case closure regarding a site formerly leased to a dry cleaner tenant and (ii) continued subsurface assessments of the current and former in-ground hoists located at a site defined in the Orchard Whole Loan documents as the Firestone Facility (together the “Remedial Actions”). If The Orchard Borrower has not completed the Remedial Actions by the fifth anniversary of the loan closing date, The Orchard Borrower is required to deposit into such reserve the estimated cost to complete the Remedial Actions during the remaining loan term.
During the continuance of a Tax Trigger Period (defined below), The Orchard Borrower is required to escrow monthly 1/12th of the annual estimated real estate tax payments. During the continuance of an Insurance Trigger Period, The Orchard Borrower is required to escrow monthly 1/12th of the annual estimated insurance premiums (unless The Orchard Borrower maintains an acceptable blanket policy). On each payment date, The Orchard Borrower is required to make monthly deposits equal to $3,508.05 into an escrow for replacements and repairs; provided that no such deposit is required to be made to the extent it would cause the amount on deposit in such escrow to exceed $84,193. On each payment date, The Orchard Borrower is required to make monthly deposits equal to $14,733.81 into an escrow account for tenant improvements and leasing commissions (the “Rollover Reserve”); provided that no such deposit is required to be made to the extent it would cause the amount on deposit in the Rollover Reserve to exceed $353,611.
A “Tax Trigger Period” is a period (i) commencing upon (A) the failure of the Schottenstein Condition to remain satisfied, (B) the commencement of a Cash Sweep Event Period (as defined below), (C) the failure of any real estate taxes to be paid on or prior to the date the same are due (unless then being contested in accordance with the terms of The Orchard Whole Loan documents), (D) The Orchard Borrower fails to provide evidence of payment of real estate taxes within ten days following the date due, or (E) the occurrence of a monetary event of default under The Orchard Whole Loan; and (ii) ending (v) upon the full repayment of The Orchard Whole Loan, (w) if commenced under clause (B), the expiration of all Cash Sweep Event Periods, (x) if commenced under clause (C), such taxes are paid in full within ten days following written notice from the lender, (y) if commenced under clause (D), such evidence is provided to the lender within ten days following written notice from the lender, and (z) if commenced under clause (E), the cure of such monetary event of default is accepted by the lender in its sole discretion.
An “Insurance Trigger Period” is a period (i) commencing upon (A) the failure of the Schottenstein Condition to remain satisfied, (B) the commencement of a Cash Sweep Event Period, (C) the failure of any insurance premiums to be paid on or prior to the date the same are due or The Orchard Borrower fails to provide the lender with evidence of payment of such premiums and copies of the required ACORD certificates evidencing the insurance policies as required under The Orchard Whole Loan documents, (D) any insurance policy fails to satisfy the terms and conditions of The Orchard Whole Loan documents, or (E) the occurrence of a monetary event of default under The Orchard Whole Loan; and (ii) ending (w) upon the full repayment of The Orchard Whole Loan, (x) if commenced under clause (B), the expiration of all Cash Sweep Event Periods, (y) if commenced under clause (C) or (D), delivery to the lender of evidence of payment of the applicable insurance premiums, certificates evidencing the applicable insurance policies, or evidence that all insurance policies comply with the relevant terms and conditions of The Orchard Whole Loan documents (as applicable) within ten days following written notice from the lender, and (z) if commenced under clause (E), the cure of such monetary event of default is accepted by the lender in its sole discretion.
The Orchard Whole Loan documents provide that cures under clauses (ii) (x) or (y) of the definition of Tax Trigger Period and under clause (ii) (y) of the definition of Insurance Trigger Period may not occur (in the aggregate) more than four times during the term of The Orchard Whole Loan.
The “Schottenstein Condition” means that the Schottenstein Family owns, directly or indirectly, at least 51% of The Orchard Borrower and controls The Orchard Borrower and the general partner or managing member of The Orchard Borrower.
This is not a research report and was not prepared by any Underwriter’s research department. Please see additional important information and qualifications at the end of this Term Sheet.
T-66
| MSC 2016-UBS12 | The Orchard |
The “Schottenstein Family” means any of: (i) Jay L. Schottenstein, Joseph Schottenstein, Jonathan Schottenstein, Jeffrey Schottenstein, Susan S. Diamond or Ann S. Deshe, or their respective spouses and lineal descendants, including their children or grandchildren; (ii) any trusts or entities of which any of such persons are the sole beneficiaries or which are entirely owned or controlled (directly or indirectly) by any such persons (or majority-owned and controlled, so long as the persons set forth in clauses (i) and (ii) above continue to own directly or indirectly 51% or more of, and control, The Orchard Borrower) or (iii) a private or public real estate investment trust sponsored and controlled by one or more of the persons set forth in clauses (i) and (ii) above.
A “Cash Sweep Event Period” means the period:
(i) commencing upon a monetary event of default under The Orchard Whole Loan and ending upon the acceptance by the lender, in its sole discretion, of a cure of such monetary event of default, or
(ii) commencing upon a voluntary bankruptcy of The Orchard Borrower and/or the non-recourse carveout guarantor that has not been dismissed, settled or cured within 180 days, or if a voluntary bankruptcy of the guarantor, the guarantor is not replaced with a guarantor meeting the requirements of The Orchard Whole Loan documents and reasonably satisfactory to the lender within 30 days of written demand, and ending upon any voluntary bankruptcy of The Orchard Borrower and/or guarantor, as applicable, being settled and cured and The Orchard Borrower and/or guarantor, as applicable, has emerged from bankruptcy, or
(iii) commencing upon (except as described below) the debt service coverage ratio on The Orchard Whole Loan being less than 1.15 to 1.00 for twelve consecutive calendar months and ending on the date that the debt service coverage ratio on The Orchard Whole Loan equals or exceeds 1.20 to 1.00 for the immediately preceding twelve consecutive calendar months, or
(iv) commencing upon (except as described below) the downgrade of The Kroger Company (“Kroger”) (the parent company of Ralphs Grocery Company (“Ralph’s Grocery”)) to a non-investment grade rating by any nationally recognized credit rating agency and ending upon the credit rating of Kroger being reaffirmed to be at least investment grade or higher by the national credit rating agency which had downgraded Kroger, and Ralph’s Grocery is in occupancy of its space, open for business and paying full contractual rent under its lease.
(v) commencing if The Orchard Borrower has failed to deposit with the lender either cash or a letter of credit in the amount of $551,050 within 10 business days following written notice at such time as Ralph’s Grocery has ceased paying rent beyond any applicable offset, grace or cure periods allowed under its lease and ending upon either (1) Ralph’s Grocery has commenced payment of rent in accordance with its lease, (2) 80% or more of the Ralph’s Grocery space has been re-leased at then market rents (as reasonably determined by The Orchard Borrower) and the related tenants are in occupancy, open for business and paying full contractual rent, or (3) the amount of funds which have been swept into the Rollover Reserve as a result of the foregoing event equals $551,050 (reduced by funds in the Cash Sweep Reserve, so long as no Cash Sweep Event Period exists other than under this clause (v)) (the “Ralphs Rent Reserve Cap”). The Orchard Borrower may avoid a Cash Sweep Event Period under this clause (v) by posting cash or a letter of credit in the amount of $551,050.
Notwithstanding the above, The Orchard Whole Loan documents provide that no Cash Sweep Event Period will commence under clause (iii) or clause (iv) above so long as The Orchard Property is majority owned and controlled by the Schottenstein Family and the non-recourse carveout guarantor is either Schottenstein Realty LLC or an acceptable replacement guarantor meeting the requirements of The Orchard Whole Loan documents that is majority owned and controlled by the Schottenstein Family.
Lockbox and Cash Management. A hard lockbox is in place with respect to The Orchard Whole Loan. The Orchard Whole Loan has springing cash management (i.e., The Orchard Whole Loan has cash management only after the initial occurrence and during the continuance of a Cash Sweep Event Period). Provided a Cash Sweep Event Period is not continuing, funds in the lockbox account are required to be swept to an account designated by The Orchard Borrower. Upon the occurrence of a Cash Sweep Event Period, The Orchard Borrower is required to cooperate to establish and maintain a cash management account, and, during the continuance of a Cash Sweep Event Period, funds in the lockbox account are required to be transferred on each business day to the cash management account. During the continuance of a Cash Sweep Event Period, funds in the cash management account are required to be applied on each monthly payment date to pay debt service on The Orchard Whole Loan, to fund the required reserves deposits as described above under “Escrows and Reserves”, to disburse the monthly operating expenses referenced in the approved annual budget in accordance with the approved annual budget, if any, and extraordinary operating expenses approved by the lender, and to disburse the remainder (i) if a Cash Sweep Event Period is in effect under clause (v) of the definition of “Cash Sweep Event Period” above, into an account to be held by the lender as additional security for The Orchard Whole Loan during the continuance of a Cash Sweep Event Period (the “Cash Sweep Reserve”) until the funds therein equal the Ralphs Rent Reserve Cap, and (ii) any remainder into the Cash Sweep Reserve.
During a Cash Sweep Event Period, provided no monetary event of default is then continuing under The Orchard Whole Loan, The Orchard Borrower is permitted to use funds on deposit in the Cash Sweep Reserve for re-leasing expenses, tenant improvements, leasing commissions, capital expenditures, operating expenses and debt service payments.
Additional Secured Indebtedness (not including trade debts). The Orchard Property also secures The Orchard ServicedPari Passu Companion Loan, which has a Cut-off Date principal balance of $39,942,058 and is expected to be included in the MSC 2016-BNK2 Trust. The Orchard ServicedPari Passu Companion Loan accrues interest at the same rate as The Orchard Mortgage Loan. The Orchard Mortgage Loan is entitled to payments of principal and interest on a pro rata andpari passu basis with The Orchard Serviced Pari Passu Companion Loan. The holders of The Orchard Mortgage Loan and The Orchard Serviced Pari Passu Companion Loan have entered into a co-lender agreement which sets forth the allocation of collections on The Orchard Whole Loan. See “Description of the Mortgage Pool—The Whole Loans—The Serviced Pari Passu Whole Loans” in the Preliminary Prospectus.
Mezzanine Loan and Preferred Equity. Not permitted.
Release of Property. Not permitted.
Terrorism Insurance. The Orchard Borrower is required to obtain all risk and business income insurance against acts of terrorism to the extent such insurance is available in an amount determined by the lender but in no event more than the full replacement cost of The Orchard Property and twelve months of business interruption insurance; provided that if the Terrorism Risk Insurance Program Reauthorization Act of 2015 or subsequent statute, extension or reauthorization thereof (“TRIPRA”) is in effect and continues to cover both foreign and domestic acts of terrorism, the lender is required to accept terrorism insurance with coverage against “covered acts” within the meaning of TRIPRA. If TRIPRA is not in effect, The Orchard Borrower is not
This is not a research report and was not prepared by any Underwriter’s research department. Please see additional important information and qualifications at the end of this Term Sheet.
T-67
| MSC 2016-UBS12 | The Orchard |
required to pay insurance premiums with respect to such terrorism insurance in excess of the Terrorism Cap (defined below), and if the cost of terrorism insurance exceeds the Terrorism Cap, The Orchard Borrower is required to purchase the maximum amount of terrorism insurance available with funds equal to the Terrorism Cap. “Terrorism Cap” means two times the amount of the then-current annual insurance premiums payable by The Orchard Borrower for the all risk and business income insurance required under The Orchard Whole Loan documents (excluding the terrorism components of such insurance premiums).
This is not a research report and was not prepared by any Underwriter’s research department. Please see additional important information and qualifications at the end of this Term Sheet.
T-68
(THIS PAGE INTENTIONALLY LEFT BLANK)
This is not a research report and was not prepared by any Underwriter’s research department. Please see additional important information and qualifications at the end of this Term Sheet.
T-69
| MSC 2016-UBS12 | The Falls |
Mortgage Loan No. 5 – The Falls
This is not a research report and was not prepared by any Underwriter’s research department. Please see additional important information and qualifications at the end of this Term Sheet.
T-70
| MSC 2016-UBS12 | The Falls |
Mortgage Loan No. 5 – The Falls
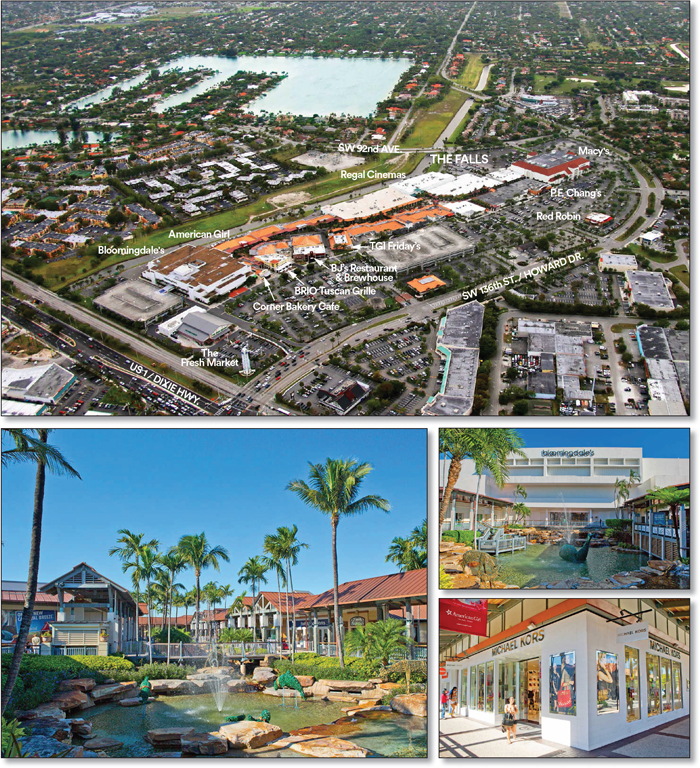
This is not a research report and was not prepared by any Underwriter’s research department. Please see additional important information and qualifications at the end of this Term Sheet.
T-71
| MSC 2016-UBS12 | The Falls |
Mortgage Loan No. 5 – The Falls
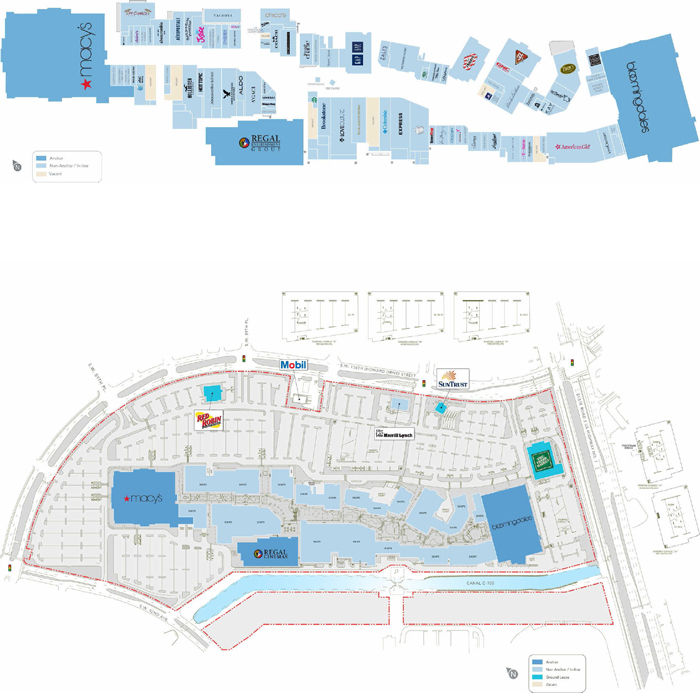
This is not a research report and was not prepared by any Underwriter’s research department. Please see additional important information and qualifications at the end of this Term Sheet.
T-72
| MSC 2016-UBS12 | The Falls |
Mortgage Loan No. 5 – The Falls
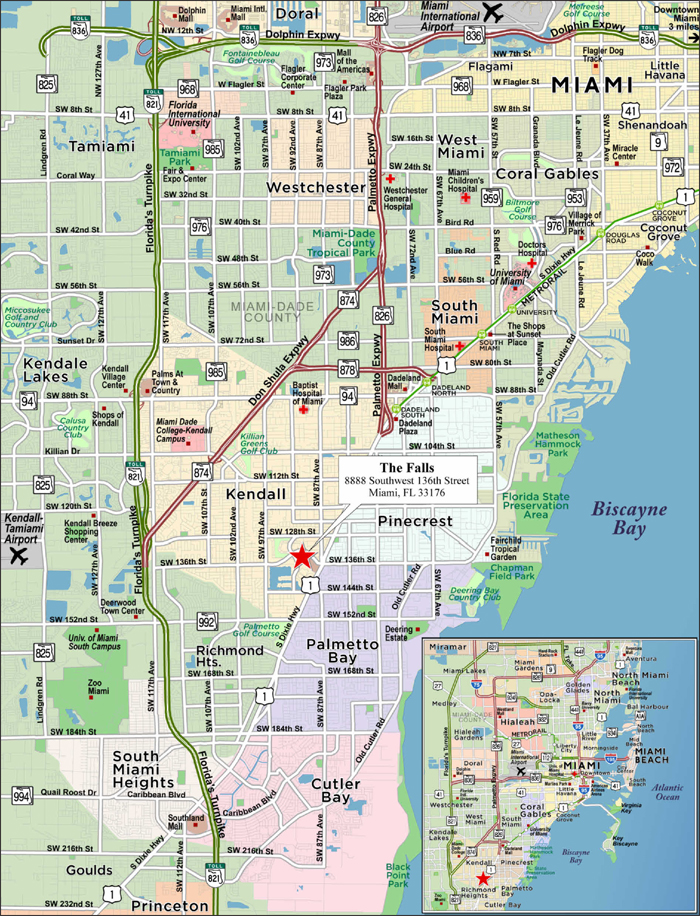
This is not a research report and was not prepared by any Underwriter’s research department. Please see additional important information and qualifications at the end of this Term Sheet.
T-73
| MSC 2016-UBS12 | The Falls |
| Mortgage Loan No. 5 – The Falls |
| Mortgage Loan Information | Property Information | ||||||
| Mortgage Loan Seller: | UBS AG | Single Asset/Portfolio: | Single Asset | ||||
| Original Balance(1): | $45,500,000 | Location: | Miami, FL 33176 | ||||
| Cut-off Date Balance(1): | $45,500,000 | General Property Type: | Retail | ||||
| % of Initial Pool Balance: | 5.5% | Detailed Property Type: | Regional Lifestyle Center | ||||
| Loan Purpose: | Refinance | Title Vesting: | Fee | ||||
| Sponsor: | Simon Property Group, L.P. | Year Built/Renovated: | 1980/1996 | ||||
| Mortgage Rate: | 3.4500% | Size: | 839,507 SF | ||||
| Note Date: | 8/15/2016 | Cut-off Date Balance per SF(1): | $179 | ||||
| First Payment Date: | 10/1/2016 | Maturity Date Balance per SF(1): | $179 | ||||
| Maturity Date: | 9/1/2026 | Property Manager: | Simon Management Associates II, LLC (borrower-related) | ||||
| Original Term to Maturity: | 120 months | ||||||
| Original Amortization Term: | 0 months | Underwriting and Financial Information | |||||
| IO Period: | 120 months | UW NOI(5): | $18,425,787 | ||||
| Seasoning: | 3 months | UW NOI Debt Yield(1): | 12.3% | ||||
| Prepayment Provisions(2): | LO (27); DEF (86); O (7) | UW NOI Debt Yield at Maturity(1): | 12.3% | ||||
| Lockbox/Cash Mgmt Status: | Hard/Springing | UW NCF DSCR(1): | 3.36x | ||||
| Additional Debt Type(3): | Pari Passu | Most Recent NOI: | $18,892,960 (5/31/2016 TTM) | ||||
| Additional Debt Balance(3): | $104,500,000 | 2nd Most Recent NOI: | $18,760,813 (12/31/2015) | ||||
| Future Debt Permitted (Type): | No (N/A) | 3rd Most Recent NOI: | $18,192,092 (12/31/2014) | ||||
| Reserves(4) | Most Recent Occupancy(5): | 97.5% (6/30/2016) | |||||
| Type | Initial | Monthly | Cap | 2nd Most Recent Occupancy: | 96.8% (12/31/2015) | ||
| RE Tax: | $0 | Springing | N/A | 3rd Most Recent Occupancy: | 96.9% (12/31/2014) | ||
| Insurance: | $0 | Springing | N/A | Appraised Value (as of): | $305,000,000 (7/14/2016) | ||
| Recurring Replacements: | $0 | Springing | $335,803 | Cut-off Date LTV Ratio(1): | 49.2% | ||
| TI/LC: | $0 | Springing | $2,098,768 | Maturity Date LTV Ratio(1): | 49.2% | ||
| Sources and Uses | ||||||
| Sources | Proceeds | % of Total | Uses | Proceeds | % of Total | |
| Loan Amount(1): | $150,000,000 | 100.0% | Loan Payoff: | $102,791,929 | 68.5% | |
| Closing Costs: | $983,418 | 0.7% | ||||
| Return of Equity: | $46,224,653 | 30.8% | ||||
| Total Sources: | $150,000,000 | 100.0% | Total Uses: | $150,000,000 | 100.0% | |
| (1) | The Falls Mortgage Loan is part of The Falls Whole Loan, which is comprised of fourpari passu promissory notes with an aggregate principal balance of $150,000,000. The Cut-off Date Balance per SF, Maturity Date Balance per SF, UW NOI Debt Yield, UW NOI Debt Yield at Maturity, UW NCF DSCR, Cut-off Date LTV Ratio and Maturity Date LTV Ratio numbers presented above are based on the aggregate principal balance of the promissory notes comprising The Falls Whole Loan. |
| (2) | Defeasance is permitted at any time after the earlier to occur of (a) the end of the two-year period commencing on the closing date of the securitization of the last The Falls Whole Loan promissory note to be securitized and (b) October 1, 2019. |
| (3) | See “—The Mortgage Loan” and “—Additional Secured Indebtedness (not including trade debts)” below for further discussion of additional debt. |
| (4) | See “—Escrows and Reserves” below for further discussion of reserve requirements. |
| (5) | Includes A’Gaci (7,559 SF), which has a lease out for signature. We cannot assure you that A’Gaci will take occupancy or begin paying rent as anticipated. Occupancy excluding A’Gaci is 96.6%. |
The Mortgage Loan. The fifth largest mortgage loan (“The Falls Mortgage Loan”) is part of a whole loan (“The Falls Whole Loan”) evidenced by fourpari passu promissory notes in the aggregate original principal amount of $150,000,000, all of which are secured by a first priority fee mortgage encumbering an 839,507 SF regional lifestyle center known as The Falls in Miami, Florida (“The Falls Property”). Promissory Note A-1, in the original principal amount of $45,500,000, represents The Falls Mortgage Loan and will be included in the MSC 2016-UBS12 Trust. Promissory Notes A-2, A-3 and A-4, in the aggregate original principal amount of $104,500,000, collectively represent the serviced companion loans (“The Falls ServicedPari Passu Companion Loans”). The Falls ServicedPari Passu Companion Loans, represented by Promissory Note A-2 and Promissory Note A-3, in the aggregate original principal amount of $34,500,000, are currently held by the WFCM 2016-NXS6 securitization trust. The Falls ServicedPari Passu Companion Loan, represented by Promissory Note A-4, in the original principal amount of $70,000,000, is currently held by the GSMS 2016-GS3 securitization trust. The Falls Whole Loan is currently being serviced pursuant to the Pooling and Servicing Agreement for the WFCM 2016-NXS6 transaction, and from and after the closing of the MSC 2016-UBS12 transaction will be serviced pursuant to the pooling and servicing agreement for the MSC 2016-UBS12 transaction. See “Description of the Mortgage Pool—The Whole Loans—The Serviced Pari Passu Whole Loans” and “Pooling and Servicing Agreement” in the Preliminary Prospectus.
The proceeds of The Falls Whole Loan were primarily used to refinance a previous mortgage loan secured by The Falls Property in the principal amount of $102,791,929, to pay closing costs and to return equity to the sponsor.
This is not a research report and was not prepared by any Underwriter’s research department. Please see additional important information and qualifications at the end of this Term Sheet.
T-74
| MSC 2016-UBS12 | The Falls |
The Borrower and the Sponsor. The borrower is The Falls Shopping Center Associates LLC (“The Falls Borrower”), a single-purpose Delaware limited liability company structured to be bankruptcy-remote, with two independent directors. The sponsor and the nonrecourse carve-out guarantor of The Falls Whole Loan is Simon Property Group, L.P. (“The Falls Sponsor”). Simon Property Group, L.P. the operating partnership of Simon Property Group, Inc. (“Simon”), is a publicly traded (S&P 100; NYSE: SPG) real estate investment trust headquartered in Indianapolis, Indiana focused on retail real estate ownership, management and development. As of June 30, 2016, Simon owned or held an interest in 207 properties in the United States, including 108 malls, 71 premium outlets, 14 mills, four lifestyle centers and 10 other retail properties within 37 states and Puerto Rico. Internationally, as of June 30, 2016, Simon has ownership interests in nine Premium Outlets in Japan, three Premium Outlets in South Korea, two Premium Outlets in Canada, one Premium Outlet in Mexico and one Premium Outlet in Malaysia. According to Simon’s 2015 Annual Report, Simon reported total assets of approximately $30.7 billion, equity of approximately $5.2 billion and liquidity of approximately $701.1 million. Simon has an investment grade credit rating of A/A3/A by Fitch, Moody’s and S&P Global Rating Services, respectively.
The Falls Whole Loan will be recourse to The Falls Sponsor pursuant to standard carve-outs. However, the guaranty and the environmental indemnity agreement provide that The Falls Sponsor’s liability may not exceed $30.0 million in the aggregate, plus all reasonable out-of-pocket costs and expenses (including court costs and reasonable attorneys’ fees) incurred by the lender in the enforcement of the guaranty and the environmental indemnity agreement or the preservation of the lender’s rights thereunder. The Falls Sponsor is also a sponsor of the borrower under the mortgage loan identified on Annex A-1 to the Preliminary Prospectus as Wolfchase Galleria.
The Property. The Falls Property consists of The Falls Borrower’s fee interest in an open-air, single-story, regional lifestyle center situated on a 61.6-acre site located in Miami, Florida. The Falls Property is located off US Highway 1 (Dixie Highway), approximately 2.8 miles east of the Florida Turnpike and approximately 13.0 miles southwest of the Miami central business district. Built in 1980, The Falls Property contains approximately 839,507 SF of retail space and is considered one of the largest open-air shopping centers in the United States. The Falls Property contains covered walkways surrounded by a one-million-gallon waterscape and lush tropical foliage. Amenities at The Falls Property include mobile device charging stations, a Ticketmaster booth at guest services, valet parking and free Wi-Fi.
Anchor tenants at The Falls Property include Macy’s (230,000 SF), Bloomingdale’s (225,000 SF) and Regal Cinemas (12 screens). The collateral includes three outparcels, which are ground leased to The Fresh Market (21,720 SF), Red Robin Gourmet Burgers (6,223 SF) and Sun Bank of Miami (1 SF). The Falls Property features approximately 94 tenants, including a diverse mix of national retailers such as American Girl, Love Culture, The Gap/Gap Kids, Apple Store, Express, Victoria’s Secret, Brooks Brothers, Hollister Co., Abercrombie & Fitch, American Eagle Outfitters and Williams Sonoma, as well as several restaurants including BJ’s Restaurant and Brewhouse, P.F. Chang’s China Bistro, BRIO Tuscan Grille and T.G.I. Fridays.
As of the trailing 12-month period ending June 2016, total reported sales were approximately $208.0 million. The Falls Property’s comparable inline sales (<10,000 SF) are $617 PSF, with an occupancy cost of 12.8%. As of the trailing 12-month period ending June 2016, Apple Store reported $4,432 sales PSF and total sales of approximately $37.0 million. Excluding Apple Store, The Falls Property generated comparable inline sales of $460 PSF, with occupancy costs of 17.3%. The Apple Store lease expires January 31, 2017. Apple Store has a renewal lease out for signature with an expiration date of January 31, 2022. We cannot assure you that Apple Store will renew its lease.
The Falls Property has added nine new tenants in 2016 totaling 34,234 SF, including A’Gaci (7,559 SF), which has a lease out for signature. As of June 30, 2016, The Falls Property was approximately 97.5% leased including all anchor tenants, temporary tenants and tenants with a lease out for signature that are not yet open and operating. Excluding A’Gaci, The Falls Property is 96.6% occupied.
This is not a research report and was not prepared by any Underwriter’s research department. Please see additional important information and qualifications at the end of this Term Sheet.
T-75
| MSC 2016-UBS12 | The Falls |
The following table presents certain information relating to the historical sales and occupancy costs at The Falls Property:
| Historical Sales (PSF) and Occupancy Costs(1) | |||||
| Tenant | 2013 | 2014 | 2015 | TTM June 2016 | TTM June 2016 Occupancy Cost |
| Anchors | |||||
| Macy’s | $153 | $146 | $142 | $140 | 2.5% |
| Bloomingdale’s | $129 | $115 | $103 | $92 | 1.2% |
| Regal Cinemas(2) | $499,149 | $469,077 | $505,116 | $495,336 | 15.0% |
| Top 15 Non-Anchor Tenants | |||||
| American Girl | $803 | $675 | $526 | $455 | 12.4% |
| Love Culture | $189 | $130 | $108 | $105 | 25.2% |
| The Gap/Gap Kids | $408 | $344 | $290 | $283 | 25.8% |
| Express | $359 | $277 | $276 | $268 | 22.3% |
| Victoria’s Secret | $853 | $772 | $745 | $723 | 12.9% |
| Brooks Brothers | $431 | $416 | $337 | $290 | 20.5% |
| BJ’s Restaurant and Brewhouse | $642 | $535 | $558 | $571 | 8.0% |
| Apple Store(3) | $5,361 | $5,013 | $4,553 | $4,432 | 1.6% |
| P.F. Chang’s China Bistro | $836 | $767 | $781 | $769 | 8.0% |
| BRIO Tuscan Grille | $705 | $587 | $592 | $587 | 8.3% |
| T.G.I. Fridays | $506 | $478 | $475 | $464 | 10.7% |
| Hollister Co. | $529 | $434 | $317 | $276 | 25.5% |
| Abercrombie & Fitch | $591 | $419 | $317 | $303 | 29.7% |
| American Eagle Outfitters(4) | NAV | $225 | $265 | $267 | 27.6% |
| Williams-Sonoma | $296 | $295 | $277 | $276 | 23.4% |
| Total Comparable Inline | $700(5) | $666 | $631 | $617 | 12.8% |
| Total Comparable Inline (Excluding Apple) | $508(5) | $487 | $469 | $460 | 17.3% |
| (1) | Historical Sales (PSF) and Occupancy Costs were provided by The Falls Borrower and reflect those tenants who reported sales for three consecutive years. Historical Sales (PSF) are based on leased SF during each given period as some tenants listed may have expanded or contracted their leased SF during such given time period. |
| (2) | Historical Sales (PSF) for Regal Cinemas reflect the sales per screen based on 12 screens. |
| (3) | A possible contributing factor to the drop in Sales PSF between 2014 to 2015 and 2015 to TTM June 2016 is the result of Apple Store amending its sales accounting methodology. Apple amended the way in which the company accounted for bulk purchases to resellers and ceased to report these bulk sales. |
| (4) | American Eagle Outfitters took occupancy of its space in 2014. |
| (5) | 2013 Historical Sales (PSF) excludes American Eagle Outfitters, Kay Jewelers and L’OCCITANE, as each took occupancy of their respective space in 2014. |
This is not a research report and was not prepared by any Underwriter’s research department. Please see additional important information and qualifications at the end of this Term Sheet.
T-76
| MSC 2016-UBS12 | The Falls |
The following table presents certain information relating to the leases at The Falls Property:
| Tenant Summary(1) | |||||||||
| Tenant Name | Credit Rating (Fitch/Moody’s/S&P)(2) | Tenant SF | Approximate % of SF | Annual UW Rent | Annual UW Rent PSF(3) | Sales (TTM 6/30/2016)(4) | Occ. Cost % | Lease Expiration | |
| $ | PSF | ||||||||
| Anchor Tenants | |||||||||
| Regal Cinemas | B+/B1/B+ | 39,746 | 4.7% | $554,854 | $13.96 | $5,944,028 | $495,336(5) | 15.0% | 1/31/2019(6) |
| Macy’s | NR/Baa2/BBB | 230,000 | 27.4% | $525,000 | $2.28 | $32,193,100 | $140 | 2.5% | 7/31/2027(7) |
| Bloomingdale’s | NR/Baa2/BBB | 225,000 | 26.8% | $0(8) | $0.00(8) | $20,756,250 | $92 | 1.2% | 1/28/2022(9) |
| Subtotal/Wtd. Avg. | 494,746 | 58.9% | $1,079,854 | $2.18 | $58,893,378 | $129(4) | 3.3% | ||
| Major Tenants (>10,000 SF) | |||||||||
| American Girl | BBB+/Baa1/BBB | 15,840 | 1.9% | $891,475 | $56.28 | $7,205,933 | $455 | 12.4% | 2/28/2023(10) |
| The Gap/Gap Kids | BB+/Baa2/BB+ | 11,365 | 1.4% | $511,425 | $45.00 | $3,212,570 | $283 | 25.8% | 1/31/2018 |
| Love Culture | NR/NR/NR | 12,152 | 1.4% | $320,972 | $26.41 | $1,273,165 | $105 | 25.2% | 6/30/2022 |
| Subtotal/Wtd. Avg. | 39,357 | 4.7% | $1,723,872 | $43.80 | $11,691,668 | $297 | 17.5% | ||
| Other Tenants(11) | 284,330 | 33.9% | $13,487,118 | $46.81 | |||||
| Vacant Space | 21,074 | 2.5% | $0 | $0.00 | |||||
| Total/Wtd. Avg. | 839,507 | 100.0% | $16,290,844 | $19.69 | |||||
| (1) | Information is based on the underwritten rent roll. |
| (2) | Certain ratings are those of the parent company whether or not the parent guarantees the lease. |
| (3) | Wtd. Avg. Annual UW Rent PSF excludes vacant space. |
| (4) | Sales $ and Sales PSF represent trailing 12 months ending June 30, 2016, as provided by The Falls Borrower. |
| (5) | Sales PSF for Regal Cinemas is based on 12 screens. |
| (6) | Regal Cinemas has one five-year renewal option. |
| (7) | Macy’s has five 10-year renewal options. |
| (8) | Bloomingdale’s pays percentage rent at 2.7% of sales, but only for sales above a $30.0 million breakpoint. Bloomingdale’s 2015 sales were $23,100,750. |
| (9) | Bloomingdale’s has the right to terminate its lease at any time with 18 months’ notice; provided, however, that if the termination date falls within the period of October 1 of any year through February 1 of the following year, and Bloomingdale’s is open and operating on the foregoing October 1, then the termination date shall be extended to February 1 of such following year. Further, upon the date Bloomingdale’s exercises its right to terminate, it shall be released from the operating covenant and shall no longer be required to continuously operate all or any part of its premises. If Bloomingdale’s is no longer continuously operating, from the date of such closure and for the balance of the term, Bloomingdale’s is obligated to pay annual base rent ($300,000 annually prorated through the termination date) if they discontinue operations after giving notice of exercising its termination right. |
| (10) | American Girl has one five-year renewal option. |
| (11) | Other Tenants Annual UW Rent PSF excludes Sun Bank of Miami, which is a ground lease tenant; however, its rent and SF is included in the Annual UW Rent and Tenant SF. Sun Bank of Miami represents 1 SF of the Tenant SF and Annual UW Rent of $177,100. Other Tenants includes an outparcel ground leased to The Fresh Market (21,720 SF), an outparcel leased to Merrill Lynch (12,000 SF) and A’Gaci (7,559 SF), which has a lease out for signature. We cannot assure you that A’Gaci will take occupancy or begin paying rent as anticipated. |
This is not a research report and was not prepared by any Underwriter’s research department. Please see additional important information and qualifications at the end of this Term Sheet.
T-77
| MSC 2016-UBS12 | The Falls |
The following table presents certain information relating to the lease rollover schedule at The Falls Property:
Lease Rollover Schedule(1)(2)
| ||||||||
| Year | # of Leases Rolling | SF Rolling | Annual UW Rent PSF Rolling(3) | Approx. % of Total SF Rolling | Approx. Cumulative % of SF Rolling | Total UW Rent Rolling | Approx. % of Total Rent Rolling | Approx. Cumulative % of Total Rent Rolling |
| MTM | 0 | 0 | $0.00 | 0.0% | 0.0% | $0 | 0.0% | 0.0% |
| 2016 | 3 | 4,795 | $66.16 | 0.6% | 0.6% | $317,249 | 1.9% | 1.9% |
| 2017 | 11 | 39,576 | $51.04 | 4.7% | 5.3% | $2,020,023 | 12.4% | 14.3% |
| 2018 | 9 | 30,338 | $53.63 | 3.6% | 8.9% | $1,627,043 | 10.0% | 24.3% |
| 2019 | 14 | 66,092 | $29.11 | 7.9% | 16.8% | $1,923,999 | 11.8% | 36.1% |
| 2020 | 8 | 18,673 | $50.31(4) | 2.2% | 19.0% | $1,116,523 | 6.9% | 43.0% |
| 2021 | 2 | 2,386 | $40.73 | 0.3% | 19.3% | $97,191 | 0.6% | 43.6% |
| 2022(5) | 15 | 294,276 | $7.79 | 35.1% | 54.3% | $2,292,456 | 14.1% | 57.7% |
| 2023 | 11 | 48,381 | $49.98 | 5.8% | 60.1% | $2,418,071 | 14.8% | 72.5% |
| 2024 | 8 | 29,682 | $49.18 | 3.5% | 63.6% | $1,459,860 | 9.0% | 81.5% |
| 2025 | 3 | 10,921 | $58.70 | 1.3% | 64.9% | $641,085 | 3.9% | 85.4% |
| 2026 | 3 | 10,366 | $42.76 | 1.2% | 66.2% | $443,248 | 2.7% | 88.1% |
| 2027 & Beyond(6) | 7 | 262,947 | $7.36 | 31.3% | 97.5% | $1,934,096 | 11.9% | 100.0% |
| Vacant | 0 | 21,074 | $0.00 | 2.5% | 100.0% | $0 | 0.0% | 100.0% |
| Total/Wtd. Avg. | 94 | 839,507 | $19.69 | 100.0% | $16,290,844 | 100.0% | ||
| (1) | Information is based on the underwritten rent roll. |
| (2) | Certain tenants may have lease termination options that are exercisable prior to the originally stated expiration date of the subject lease and that are not considered in the lease rollover schedule. |
| (3) | Wtd. Avg. Annual UW Rent PSF Rolling excludes vacant space. |
| (4) | Annual UW Base Rent PSF excludes Sun Bank of Miami, which is a ground lease tenant; however, its rent is included in the Annual UW Base Rent. Sun Bank of Miami represents 1 SF of the Expiring NRSF and Annual UW Base Rent of $177,100. |
| (5) | Includes Apple Store (8,349 SF). The Apple Store lease expires January 31, 2017. Apple Store has a renewal lease out for signature with an expiration date of January 31, 2022. We cannot assure you that Apple Store will renew its lease. For purposes of this table, it was assumed the Apple Store lease expires January 31, 2022. |
| (6) | Includes A’Gaci (7,559 SF), which has a lease out for signature. We cannot assure you that A’Gaci will take occupancy or begin paying rent as anticipated. The estimated rent commencement date is August 1, 2017, with a lease expiration date of July 31, 2027. |
The Market. The Falls Property is located in Miami-Dade County, within the Miami-Fort Lauderdale-West Palm Beach metropolitan statistical area (“South Florida MSA”). The Falls Property is approximately 13.7 miles southwest of downtown Miami, 15.1 miles south of Miami International Airport and 43.8 miles southwest of Fort Lauderdale. The South Florida MSA spans across the southeastern portion of Florida and encompasses the Palm Beach, Broward, and Miami-Dade counties. With a current population of more than 6.0 million, the South Florida MSA accounts for roughly 30.0% of Florida’s population. The South Florida MSA population grew at a compounded annual rate of 1.9% between 2005 and 2015. According to a third party research firm, the 2016 estimated population within a one-, three- and five-mile radius of The Falls Property is 11,202, 100,367 and 279,212, respectively, with projected annual increases from 2016 to 2021 of 1.19%, 0.85% and 1.07%, respectively. According to the federal government labor statistics bureau, unemployment in the South Florida MSA was reported at 4.8% as of April 2016, which was lower than the national unemployment rate of 5.0% at that time. According to the appraisal, the largest employment sectors within the South Florida MSA are trade, transportation and utilities. The South Florida MSA is home to six Fortune 500 companies, spanning the healthcare, retail and technology industries.
The Falls Property is located at the intersection of US Highway 1 and SW 136th Street. According to a third party research firm, the average annual household income within a one-, three- and five-mile radius of The Falls Property is $101,985, $108,152 and $93,906, respectively. The Falls Property benefits from high traffic counts on US Highway 1 at its intersection with SW 136th Street of 93,223 vehicles per day. There are numerous retail centers along US Highway 1, including Dadeland Mall, which is also owned by The Falls Sponsor.
According to the appraisal, The Falls Property’s primary competitors include Dadeland Mall, The Village at Merrick Park and Southland Mall. Dadeland Mall is located 3.6 miles northeast of The Falls Property and was built, expanded and renovated in 1962, 2004, and 2014, respectively. Anchored by JC Penney, Macy’s and Nordstrom, Dadeland Mall is also owned and leased by The Falls Sponsor, which allows for cross-shopping promotion at the two shopping centers.
Anchored by Nordstrom and Neiman Marcus, The Village at Merrick Park, is located approximately 8.3 miles northeast of The Falls Property and was built in 2002 and renovated in 2008. Similar to The Falls Property, The Village at Merrick Park is an open-air shopping center focused on upscale niche markets. Anchored by Nordstrom and Neiman Marcus, The Village at Merrick Park is a three-level mall.
Southland Mall is a super-regional mall located approximately 5.0 miles southwest of The Falls Property, and the only major shopping center located south of The Falls Property. Anchored by JC Penney, Macy’s, Sears and Regal Cinemas, Southland Mall’s tenant mix focuses on moderate or discount retailers. According to the appraisal, at 79.0% occupancy, a high percentage of tenants which lease space at Southland Mall is under a specialty leasing program and not on long-term leases. According to the appraisal, average mall shop sales at Southland Mall are the lowest in the Miami-Dade County.
This is not a research report and was not prepared by any Underwriter’s research department. Please see additional important information and qualifications at the end of this Term Sheet.
T-78
| MSC 2016-UBS12 | The Falls |
The following table presents leasing data at certain retail competitive properties with respect to The Falls Property:
| Competitive Property Summary | ||||||
| Property Name | Type | Year Built/Renovated | Size (SF) | Total Occupancy | Anchor Tenants | Distance to Subject (mi.) |
| The Falls Property | Regional Lifestyle Center | 1980/1996 | 839,507(1) | 97.5%(1) | Macy’s, Bloomingdale’s, Regal Cinemas | N/A |
| Dadeland Mall | Super Regional Mall | 1962/2014 | 1,488,000 | 94.0% | JCPenney, Macy’s, Nordstrom, Saks Fifth Avenue | 3.6 |
| The Village at Merrick Park | Regional Mall | 2002/2008 | 858,000 | 93.0% | Nordstrom, Neiman Marcus | 8.3 |
| Southland Mall | Super Regional Mall | 1972/2005 | 985,000 | 79.0% | JCPenney, Macy’s, Sears, Regal Cinemas | 5.0 |
| Total/Wtd. Avg.(2) | 3,331,000 | 89.3% | ||||
Source:Appraisal
| (1) | Information is based on the underwritten rent roll. Includes A’Gaci (7,559 SF) with a lease out for signature. We cannot assure you that A’Gaci will take occupancy or begin paying rent as anticipated. Occupancy excluding A’Gaci is 96.6%. |
| (2) | Total/Wtd. Avg. excludes The Falls Property. |
Operating History and Underwritten Net Cash Flow.The following table presents certain information relating to the historical operating performance and the Underwritten Net Cash Flow at The Falls Property:
| Cash Flow Analysis | |||||||
| 2013 | 2014 | 2015 | 5/31/2016 TTM | UW | UW PSF | ||
| Base Rent(1) | $16,346,347 | $16,255,743 | $16,397,615 | $16,547,724 | $17,509,054 | $20.86 | |
| Total Recoveries | $8,160,975 | $8,865,228 | $9,080,068 | $8,919,103 | $8,845,637 | $10.54 | |
| Other Income | $1,111,114 | $1,200,768 | $1,135,747 | $1,083,681 | $1,021,003 | $1.22 | |
| Less Vacancy & Credit Loss | ($4,771) | ($15,498) | ($21,281) | ($172,862) | ($1,317,735) | ($1.57) | |
| Effective Gross Income | $25,613,665 | $26,306,241 | $26,592,149 | $26,377,646 | $26,057,960 | $31.04 | |
| Total Operating Expenses | $7,571,426 | $8,114,149 | $7,831,336 | $7,484,686 | $7,632,172 | $9.09 | |
| Net Operating Income | $18,042,239 | $18,192,092 | $18,760,813 | $18,892,960 | $18,425,787 | $21.95 | |
| Capital Expenditures | $0 | $0 | $0 | $0 | $176,296 | $0.21 | |
| TI/LC | $0 | $0 | $0 | $0 | $618,885 | $0.74 | |
| Net Cash Flow | $18,042,239 | $18,192,092 | $18,760,813 | $18,892,960 | $17,630,606 | $21.00 | |
| Occupancy % | 98.0% | 96.9% | 96.8% | 97.5%(2) | 95.0%(3) | ||
| NOI DSCR(4) | 3.44x | 3.47x | 3.58x | 3.60x | 3.51x | ||
| NCF DSCR(4) | 3.44x | 3.47x | 3.58x | 3.60x | 3.36x | ||
| NOI Debt Yield(4) | 12.0% | 12.1% | 12.5% | 12.6% | 12.3% | ||
| NCF Debt Yield(4) | 12.0% | 12.1% | 12.5% | 12.6% | 11.8% | ||
| (1) | UW Base Rent is grossed up for vacant space and includes (i) approximately $118,299 of straight line average contractual rent steps for investment grade rated tenants, including American Girl ($72,533), AT&T Mobility ($6,757), Coach ($2,394), Haagen Dazs ($14,982), Origins ($12,656), Teavana ($2,054) and Starbucks Coffee Company ($6,924), (ii) approximately $133,861 of percentage rent underwritten to in-place breakpoints and percentage rents based on sales for the trailing 12-month period ending June 2016, and (iii) approximately $217,973 of additional contractual rent steps through April 2017 for non-investment grade tenants and August 2017 for investment grade tenants. |
| (2) | Occupancy as of June 30, 2016. Includes A’Gaci (7,559 SF) with a lease out for signature. We cannot assure you that A’Gaci will take occupancy or begin paying rent as anticipated. Occupancy excluding A’Gaci is 96.6%. |
| (3) | UW Occupancy % is based on underwritten economic occupancy. |
| (4) | Debt service coverage ratios and debt yields are based on The Falls Whole Loan. |
Escrows and Reserves. During the continuance of a Cash Sweep Period (as defined below), The Falls Borrower is required to escrow monthly (i) 1/12 of the estimated annual real estate taxes, (ii) 1/12 of the annual estimated insurance premiums (unless insurance is maintained under a blanket policy), (iii) $13,992 for replacement reserves provided that such monthly deposits are not required if the funds on deposit in such replacement reserve account exceed $335,803 (24 monthly payments) and (iv) $87,449 for TI/LC reserves provided that such monthly deposits are not required if the funds on deposit in such TI/LC reserve account exceed $2,098,768 (24 monthly payments).
A “Cash Sweep Period” will commence upon (i) an event of default, (ii) any bankruptcy action of the guarantor or the property manager, provided the guarantor or the property manager is not replaced within 60 days with a replacement guarantor or a qualified manager, or (iii) the debt service coverage ratio for the immediately preceding four calendar quarters is less than 1.40x for two consecutive calendar quarters. A Cash Sweep Period will end, with respect to clause (i), upon the lender accepting the cure of such event of default, with respect to clause (ii), when The Falls Borrower replaces the guarantor with a replacement guarantor or the property manager with an acceptable replacement property manager within 60 days, or with respect to clause (iii), when the debt service coverage ratio for the immediately preceding four calendar quarters is at least equal to 1.40x for two consecutive quarters.
Lockbox and Cash Management. The Falls Whole Loan is structured with a hard lockbox and springing cash management. The related loan documents require The Falls Borrower to direct tenants to pay rent directly to a lender-controlled lockbox account and that all amounts received by the borrower or the property manager with respect to The Falls Property be deposited into such lockbox account within two business days of receipt. So long as no Cash Sweep Period is continuing, all funds in the lockbox account will be swept on a specified business day of each week (or if not a business
This is not a research report and was not prepared by any Underwriter’s research department. Please see additional important information and qualifications at the end of this Term Sheet.
T-79
| MSC 2016-UBS12 | The Falls |
day, the prior business day) to a borrower controlled operating account. Upon the occurrence and during the continuance of a Cash Sweep Period, The Falls Borrower will have no further access to the funds in the lockbox account and such funds (less a $25,000 minimum balance required under the lockbox account agreement) will be swept on a specified business day of each week (or if not a business day, the prior business day) into the lender controlled cash management account. On each due date during the continuance of a Cash Sweep Period, the related loan documents require that all amounts on deposit in the cash management account after payment of debt service, required reserves and operating expenses be reserved in an excess cash flow reserve account.
Additional Secured Indebtedness (not including trade debts). The Falls Property also secures The Falls ServicedPari PassuCompanion Loans, which have an aggregate cut-off date balance of $104,500,000. The Falls ServicedPari PassuCompanion Loans, represented by Promissory Note A-2 and Note A-3, in the aggregate original principal amount of $34,500,000, are currently held by the WFCM 2016-NXS6 securitization trust. The Falls ServicedPari PassuCompanion Loan, represented by Promissory Note A-4, in the original principal amount of $70,000,000, is currently held by the GSMS 2016-GS3 securitization trust. Each of The Falls ServicedPari PassuCompanion Loans accrues interest at the same rate as The Falls Mortgage Loan. The Falls Mortgage Loan is entitled to payments of principal and interest on apro rataandpari passubasis with The Falls ServicedPari PassuCompanion Loans. The holders of The Falls Mortgage Loan and The Falls ServicedPari PassuCompanion Loans have entered into a co-lender agreement that sets forth the allocation of collections on The Falls Whole Loan. See“—Description of the Mortgage Pool—The Whole Loans—The Serviced Pari Passu Whole Loans”in the Preliminary Prospectus.
Mezzanine Loan and Preferred Equity. Not permitted.
Release of Property.The Falls Borrower may make transfers of non-income producing portions of The Falls Property as described in the Preliminary Prospectus. See “—Description of the Mortgage Pool—Certain Terms of the Mortgage Loans—Partial Releases”.
Terrorism Insurance. The Falls Whole Loan documents require that the “all risk” insurance policy required to be maintained by The Falls Borrower provide coverage for terrorism in an amount equal to the full replacement cost of The Falls Property, or if the terrorism risk insurance program reauthorization act is no longer in effect and such policies contain an exclusion for acts of terrorism, The Falls Borrower will be required to obtain, to the extent available, a stand-alone policy that provides the same coverage as the policies would have if such exclusion did not exist; provided, however, (i) in such event The Falls Borrower will not be required to pay annual premiums in excess of the Terrorism Cap (as defined below) in order to obtain the terrorism coverage, and (ii) that such stand-alone policy may have a deductible that is reasonable for such stand-alone policies with respect to properties similar to The Falls Property and reasonable for the geographic region where The Falls Property is located, so long as in no event may such deductible exceed $5,000,000.
“Terrorism Cap” means an amount equal to two times the then-current annual insurance premiums payable by The Falls Borrower for the policies insuring only The Falls Property (excluding the wind and flood components of such insurance premiums) on a stand-alone basis.
This is not a research report and was not prepared by any Underwriter’s research department. Please see additional important information and qualifications at the end of this Term Sheet.
T-80
(THIS PAGE INTENTIONALLY LEFT BLANK)
This is not a research report and was not prepared by any Underwriter’s research department. Please see additional important information and qualifications at the end of this Term Sheet.
T-81
| MSC 2016-UBS12 | Vintage Park |
Mortgage Loan No. 6 – Vintage Park
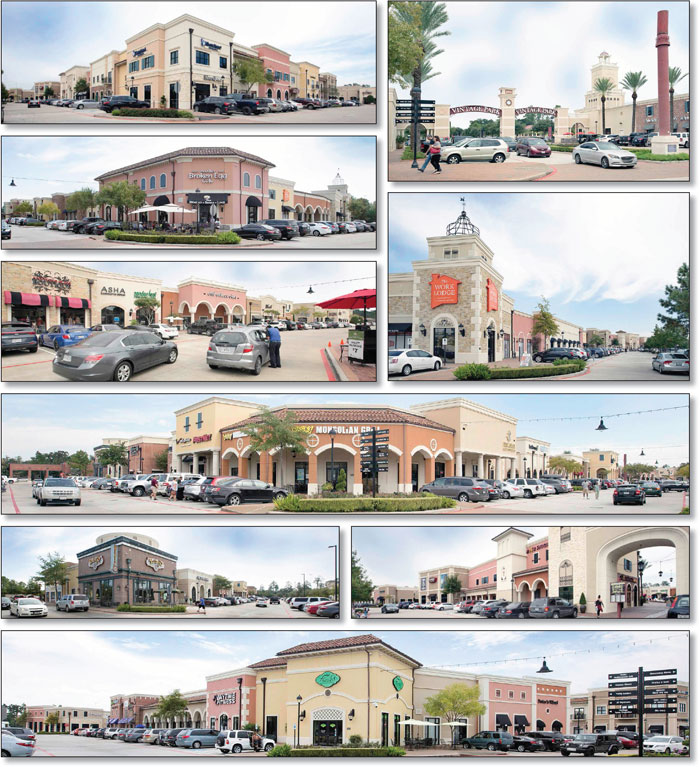
This is not a research report and was not prepared by any Underwriter’s research department. Please see additional important information and qualifications at the end of this Term Sheet.
T-82
| MSC 2016-UBS12 | Vintage Park |
Mortgage Loan No. 6 – Vintage Park
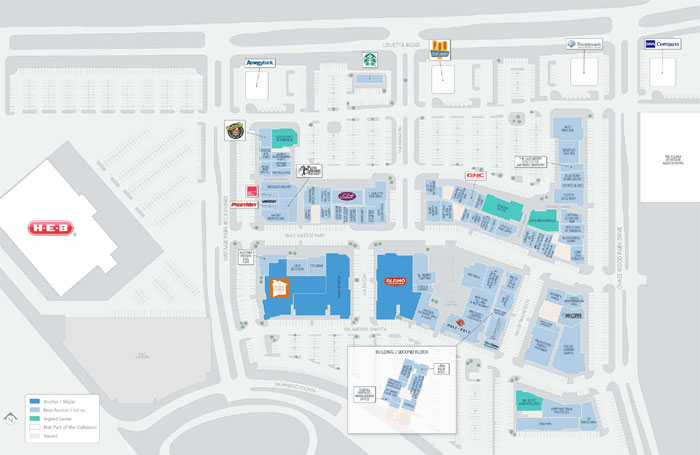
This is not a research report and was not prepared by any Underwriter’s research department. Please see additional important information and qualifications at the end of this Term Sheet.
T-83
| MSC 2016-UBS12 | Vintage Park |
Mortgage Loan No. 6 – Vintage Park
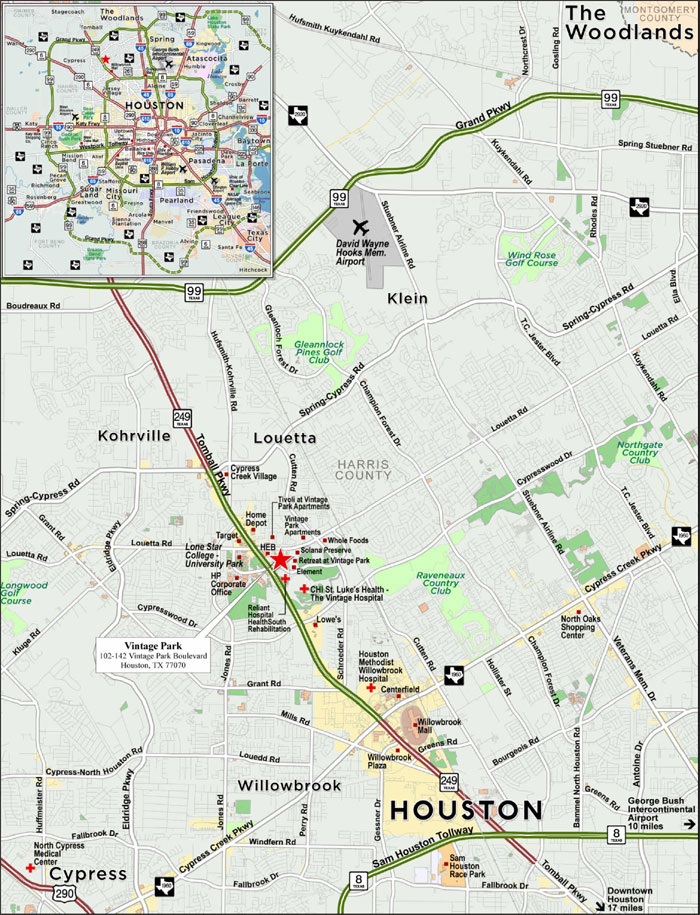
This is not a research report and was not prepared by any Underwriter’s research department. Please see additional important information and qualifications at the end of this Term Sheet.
T-84
| MSC 2016-UBS12 | Vintage Park |
| Mortgage Loan No. 6 – Vintage Park |
| Mortgage Loan Information | Property Information | ||||||
| Mortgage Loan Seller: | UBS AG | Single Asset/Portfolio: | Single Asset | ||||
| Original Balance(1): | $39,000,000 | Location: | Houston, TX 77070 | ||||
| Cut-off Date Balance(1): | $39,000,000 | General Property Type: | Retail | ||||
| % of Initial Pool Balance: | 4.7% | Detailed Property Type: | Regional Lifestyle Center | ||||
| Loan Purpose: | Refinance | Title Vesting: | Fee | ||||
| Sponsor: | William L. Hutchinson | Year Built/Renovated: | 2007/N/A | ||||
| Mortgage Rate: | 4.9870% | Size: | 341,107 SF | ||||
| Note Date: | 10/7/2016 | Cut-off Date Balance per SF(1): | $246 | ||||
| First Payment Date: | 11/6/2016 | Maturity Date Balance per SF(1): | $215 | ||||
| Maturity Date: | 10/6/2026 | Property Manager: | Dunhill Property Management Services, Inc. (borrower-related) | ||||
| Original Term to Maturity: | 120 months | ||||||
| Original Amortization Term: | 360 months | ||||||
| IO Period: | 27 months | Underwriting and Financial Information | |||||
| Seasoning: | 2 months | UW NOI(5): | $7,398,527 | ||||
| Prepayment Provisions(2): | LO (26); DEF (90); O (4) | UW NOI Debt Yield(1): | 8.8% | ||||
| Lockbox/Cash Mgmt Status: | Hard/Springing | UW NOI Debt Yield at Maturity(1): | 10.1% | ||||
| Additional Debt Type(3): | Pari Passu | UW NCF DSCR(1): | 1.69x (IO) 1.33x (P&I) | ||||
| Additional Debt Balance(3): | $45,000,000 | Most Recent NOI(5): | $6,316,553 (7/31/2016 TTM) | ||||
| Future Debt Permitted (Type): | No (N/A) | 2nd Most Recent NOI: | $4,739,719 (12/31/2015) | ||||
| Reserves(4) | 3rd Most Recent NOI: | $4,629,373 (12/31/2014) | |||||
| Type | Initial | Monthly | Cap | Most Recent Occupancy(6): | 94.1% (10/6/2016) | ||
| RE Tax: | $2,082,355 | $196,449 | N/A | 2nd Most Recent Occupancy: | 94.5% (12/31/2015) | ||
| Insurance: | $162,810 | $16,959 | N/A | 3rd Most Recent Occupancy: | 78.6% (12/31/2014) | ||
| Recurring Replacements: | $0 | $5,685 | N/A | Appraised Value (as of): | $119,760,000 (8/8/2016) | ||
| TI/LC: | $3,250,000 | Springing | $1,200,000 | Cut-off Date LTV Ratio(1): | 70.1% | ||
| Other: | $2,034,479 | $0 | N/A | Maturity Date LTV Ratio(1): | 61.1% | ||
| Sources and Uses | ||||||
| Sources | Proceeds | % of Total | Uses | Proceeds | % of Total | |
| Loan Amount(1): | $84,000,000 | 100.0% | Loan Payoff(7): | $67,271,418 | 80.1% | |
| Reserves: | $7,529,644 | 9.0% | ||||
| Closing Costs: | $1,188,146 | 1.4% | ||||
| Return of Equity: | $8,010,792 | 9.5% | ||||
| Total Sources: | $84,000,000 | 100.0% | Total Uses: | $84,000,000 | 100.0% | |
| (1) | The Vintage Park Mortgage Loan is part of the Vintage Park Whole Loan, which is comprised of fourpari passu promissory notes with an aggregate principal balance of $84,000,000. The Cut-off Date Balance per SF, Maturity Date Balance per SF, UW NOI Debt Yield, UW NOI Debt Yield at Maturity, UW NCF DSCR, Cut-off Date LTV Ratio and Maturity Date LTV Ratio numbers presented above are based on the aggregate principal balance of the promissory notes comprising the Vintage Park Whole Loan. |
| (2) | Defeasance is permitted at any time after the end of the two-year period commencing on the closing date of the securitization of the last Vintage Park Whole Loan promissory note to be securitized. |
| (3) | See “—The Mortgage Loan” and “—Additional Secured Indebtedness (not including trade debts)” below for further discussion of additional debt. |
| (4) | See “—Escrows and Reserves” below for further discussion of reserve requirements. |
| (5) | The increase in UW NOI over Most Recent NOI is largely due to recent leasing activity relating to the leases for Guacho Do Sul (7,192 SF, $251,720 of UW Base Rent), Dunhill Partners Management Services, Inc. (1,634 SF, $40,850 of UW Base Rent), Ceviches Mariscos (4,873 SF, $170,555 of UW Base Rent), Hopdoddy’s Burger Bar (4,000 SF, $148,000 of UW Base Rent) and Dr. Scott Andersen, DDS (3,400 SF, $91,800 of UW Base Rent). Ceviches Mariscos, Hopdoddy’s Burger Bar and Dr. Scott Andersen, DDS have not yet taken occupancy or commenced paying rent. Their estimated rent commencement dates are November 1, 2017, July 1, 2017 and July 1, 2017, respectively. The Vintage Park Borrower funded $350,405 into a lender-controlled reserve account at loan origination to bridge UW Base Rent to the tenants’ estimated rent commencement dates. |
| (6) | Includes 12,273 SF recently leased to Ceviches Mariscos (4,873 SF), Hopdoddy’s Burger Bar (4,000 SF) and Dr. Scott Andersen, DDS (3,400 SF) as occupied spaces. Ceviches Mariscos, Hopdoddy’s Burger Bar and Dr. Scott Andersen, DDS have not yet taken occupancy. Excluding these tenants, physical occupancy of the Vintage Park Property is 90.5%. |
| (7) | Loan proceeds were used to pay off an existing senior loan in the principal amount of approximately $54,944,344 and an existing mezzanine loan in the principal amount of approximately $12,327,074. |
The Mortgage Loan. The sixth largest mortgage loan (the “Vintage Park Mortgage Loan”) is part of a whole loan (the “Vintage Park Whole Loan”) evidenced by fourpari passu promissory notes in the aggregate original principal amount of $84,000,000, all of which are secured by a first priority fee mortgage encumbering a 341,107 SF regional lifestyle center known as Vintage Park in Houston, Texas (the “Vintage Park Property”). Promissory Note A-1, in the original principal amount of $4,000,000, and Promissory Note A-4, in the original principal amount of $35,000,000, represent the Vintage Park Mortgage Loan in the aggregate original principal amount of $39,000,000 and will be included in the MSC 2016-UBS12 Trust. Promissory Notes A-2 and Note A-3, in the aggregate original principal amount of $45,000,000, collectively represent the non-serviced companion loans (the “Vintage Park Non-ServicedPari Passu Companion Loans”). The Vintage Park Non-ServicedPari Passu Companion Loans were contributed to the MSBAM 2016-C31 securitization trust. The Vintage Park Mortgage Loan is serviced pursuant to the pooling and servicing agreement for the MSBAM 2016-C31
This is not a research report and was not prepared by any Underwriter’s research department. Please see additional important information and qualifications at the end of this Term Sheet.
T-85
| MSC 2016-UBS12 | Vintage Park |
securitization trust. See “Description of the Mortgage Pool—The Whole Loans—The Non-Serviced Pari Passu Whole Loans” and “Pooling and Servicing Agreement—Servicing of the Non-Serviced Mortgage Loans” in the Preliminary Prospectus.
The proceeds of the Vintage Park Whole Loan were primarily used to refinance existing debt on the Vintage Park Property consisting of approximately $54.9 million of senior debt and approximately $12.3 million of mezzanine debt, fund upfront reserves, pay closing costs, and return equity to the sponsor. The most recent prior financing of the Vintage Park Property was included in the GSMS 2014-GSFL transaction.
The Borrower and the Sponsor. The borrower is Vintage Dunhill LLC (the “Vintage Park Borrower”), a single-purpose Delaware limited liability company structured to be bankruptcy-remote, with two independent directors. The sponsor and the nonrecourse carve-out guarantor of the Vintage Park Whole Loan is William L. Hutchinson. The Vintage Park Borrower is wholly owned indirectly by Vintage Park Dunhill Investors LLC. Vintage Park Dunhill Investors LLC is comprised of Class A members and Class B members. The Class A members wholly own Vintage Park Dunhill Investors LLC while the Class B members participate in revenue through a promote structure. The Class A members are composed of 41 entities or individuals, none of whom owns more than 14.55% of the Class A membership directly. The Class B membership is wholly owned by Dunhill Advisors LLC. Dunhill Advisors LLC is owned by William L. Hutchinson (65.0%), Micah L. Ashford (15.0%), Anderson Crosland (10.0%) and Timothy Denker (10.0%).
William L. Hutchinson is the founder and president of Dunhill Partners. Mr. Hutchinson holds a B.B.A. from Southern Methodist University, and began his professional career as a real estate broker. Dunhill Partners is a commercial real estate investment firm founded in 1984, with over 4.5 million SF of investments in Texas, Oklahoma, California and Hawaii. Headquartered in Dallas, Texas, Dunhill Partners focuses on acquiring, investing in, leasing up and managing commercial real estate properties.
The Property. The Vintage Park Property is a 341,107 SF outdoor regional lifestyle center located in Houston, Texas, approximately 25.1 miles northwest of the Houston Central Business District (“CBD”). Built in 2007, the Vintage Park Property consists of 12 buildings and is situated on a 34.4-acre site with approximately 1,986 (5.8 per 1,000 of total SF) parking spaces. The Vintage Park Property includes a piazza and nearly one acre of pedestrian area featuring a series of fountains and landscaping. Shadow anchored by H-E-B, a supermarket chain headquartered in San Antonio, Texas, the Vintage Park Property consists of 317,657 SF of retail space and 23,450 SF of office space with no tenant comprising more than 7.0% of NRA or 5.7% of underwritten rent. Comparable inline sales PSF were $471 PSF in 2014, $498 PSF in 2015 and $494 PSF for the trailing twelve-month period ending August 31, 2016, or with respect to seven tenants, the latest trailing twelve-month period in which sales were reported. The three largest tenants at the Vintage Park Property are The Work Lodge (7.0% of NRA, 2.5% of underwritten rent), Alamo Drafthouse (“Alamo Drafthouse Cinema”) (6.9% of NRA, 5.7% underwritten rent) and Salon Development d/b/a Salon Boutique (“Salon Boutique”) (6.0% of NRA, 4.2% of underwritten rent). Collectively, the top three tenants lease 19.9% of NRA and represent 12.4% of underwritten rent, with no other tenant at the Vintage Park Property leasing more than 3.2% of NRA or representing more than 3.2% of underwritten rent.
The Vintage Park Property is 94.1% leased as of October 6, 2016 by a diverse mix of 87 national and local tenants and 90.5% physically occupied. Since purchasing the Vintage Park Property in March 2012, the sponsor has invested approximately $19.9 million in capital improvements and soft costs and has increased occupancy from 38.6% at the time of purchase, to 94.5% as of year-end 2015. Recent leasing activity at the Vintage Park Property includes Guacho Do Sul (7,192 SF), Ceviches Mariscos (4,873 SF), Hopdoddy’s Burger Bar (4,000 SF), Dr. Scott Andersen, DDS (3,400 SF), Cycle Bar (2,533 SF) and Eme Fittings (1,704 SF).
Major Tenants.
The Work Lodge (23,823 SF, 7.0% of NRA, 2.5% of underwritten rent). The Work Lodge provides turnkey private office space with access to meeting rooms, event hosting rooms and office amenities to tenants on a monthly or annual basis. The Work Lodge caters to entrepreneurs, small businesses and corporate clients who would like office amenities without overhead expenses by providing office suites for occupancy by 1 to 5 people per suite as well as co-working space. Membership with The Work Lodge provides furniture, hookups for phones and high speed Internet, access to high speed Wi-Fi, utilities, use of conference rooms, guest reception and concierge service, security, common area, weekly happy hour and support services. The Work Lodge leases 23,823 SF expiring in June 2025 and pays a current rental rate of $8.09 PSF on a triple net basis, which will increase to $12.14 PSF in July 2018. The Work Lodge has two five-year renewal options remaining and no termination options.
Alamo Drafthouse Cinema (23,388 SF, 6.9% of NRA, 5.7% of underwritten rent).Alamo Drafthouse Cinema is an American cinema chain offering new release movies, family and independent films, repertory programming, online seat reservation and full service in-theater food and drinks. Founded in Austin, Texas in 1997, Alamo Drafthouse Cinema is located in 22 cities nationwide with three locations in the Houston area. Alamo Drafthouse Cinema leases 23,388 SF at the Vintage Park Property as a seven screen-theater. Each auditorium is equipped with high quality 4k digital projection, high-frame-rate and 3D presentations, bi-amplified digital audio systems and two auditoriums are also equipped with 35mm projector systems. The Alamo Drafthouse Cinema lease began in February 2013, and expires in February 2023 and requires current contractual rent of $19.00 PSF on a triple net basis, which will increase to $21.00 PSF in March 2018. In addition, Alamo Drafthouse Cinema is required to pay percentage rent of 6.0% of gross sales over the breakpoint of $7,406,200. Alamo Drafthouse Cinema has four five-year renewal options remaining and no termination options.
Salon Development d/b/a Salon Boutique (20,587 SF, 6.0% of NRA, 4.2% of underwritten rent). Salon Boutique provides salon suites for independent salon professionals, offering salon professionals the opportunity to own and operate a business without the expense of facility management, maintenance costs and construction costs. Salon Boutique suites provide salon professionals with designated spaces for skincare and massage therapy, security systems, a break room, an on-site laundry facility and complimentary wireless internet access. Salon Boutique has eight locations in Texas and 10 locations in Arizona. Salon Boutique leases 20,587 SF expiring in October 2024 and pays current rent of $16.00 PSF on a triple net basis, which will increase to $17.00 PSF in November 2018. Salon Boutique has two five-year renewal options remaining and no termination options.
This is not a research report and was not prepared by any Underwriter’s research department. Please see additional important information and qualifications at the end of this Term Sheet.
T-86
| MSC 2016-UBS12 | Vintage Park |
The following table presents certain information relating to the leases at the Vintage Park Property:
| Tenant Summary(1) | ||||||||||
| Tenant Name | Credit Rating (Fitch/ Moody’s/ S&P)(2) | Tenant SF | % of Collateral SF | Annual UW Rent | % Annual UW Rent | Annual UW Rent PSF(3) | 8/31/16 TTM Sales $(4) | 8/31/16 TTM Sales PSF(4) | Occ. Cost % | Lease Expiration |
| The Work Lodge | NR/NR/NR | 23,823 | 7.0% | $192,665 | 2.5% | $8.09 | N/A | N/A | N/A | 6/30/2025 |
| Alamo Drafthouse Cinema(5) | NR/NR/NR | 23,388 | 6.9% | $444,372 | 5.7% | $19.00 | $5,003,671 | $714,810 | 13.9% | 2/28/2023 |
| Salon Boutique | NR/NR/NR | 20,587 | 6.0% | $329,392 | 4.2% | $16.00 | N/A | N/A | N/A | 10/31/2024 |
| Young Leaders Campus Houston | NR/NR/NR | 10,775 | 3.2% | $199,950 | 2.6% | $18.56 | N/A | N/A | N/A | 10/31/2022 |
| Treadstone Energy | NR/NR/NR | 9,245 | 2.7% | $231,125 | 3.0% | $25.00 | N/A | N/A | N/A | 4/30/2020 |
| Dialyspa II, LLC | NR/NR/NR | 8,059 | 2.4% | $153,121 | 2.0% | $19.00 | N/A | N/A | N/A | 1/31/2023 |
| Peli Peli Vintage Park., LP. | NR/NR/NR | 7,484 | 2.2% | $230,384 | 3.0% | $30.78 | $5,299,097 | $708 | 7.3% | 8/31/2020 |
| Guacho Do Sul | NR/NR/NR | 7,192 | 2.1% | $251,720 | 3.2% | $35.00 | N/A | N/A | N/A | 1/31/2027 |
| MO’s Irish Grill | NR/NR/NR | 6,186 | 1.8% | $212,022 | 2.7% | $34.27 | $4,566,136 | $738 | 7.2% | 1/31/2025 |
| T. Carolyn, LLC | NR/NR/NR | 6,163 | 1.8% | $132,505 | 1.7% | $21.50 | N/A | N/A | N/A | 2/28/2021 |
| Subtotal/Wtd. Avg. | 122,902 | 36.0% | $2,377,256 | 30.5% | $19.34 | |||||
| Other Tenants(6) | 198,221 | 58.1% | $5,424,600 | 69.5% | $27.37 | |||||
| Vacant | 19,984 | 5.9% | $0 | 0.0% | $0.00 | |||||
| Total/Wtd. Avg. | 341,107 | 100.0% | $7,801,856 | 100.0% | $24.30 | |||||
| (1) | Information is based on the underwritten rent roll. |
| (2) | Certain ratings are those of the parent company whether or not the parent guarantees the lease. |
| (3) | Wtd. Avg. Annual UW Rent PSF excludes vacant space. |
| (4) | Sales $ and Sales PSF represent trailing 12 months ending August 31, 2016, as provided by the sponsor. |
| (5) | Sales PSF for Alamo Drafthouse Cinema is based on seven screens. |
| (6) | Includes as occupied space 12,273 SF recently leased to Ceviches Mariscos (4,873 SF), Hopdoddy’s Burger Bar (4,000 SF) and Dr. Scott Andersen, DDS (3,400 SF). Ceviches Mariscos, Hopdoddy’s Burger Bar and Dr. Scott Andersen, DDS have not yet taken occupancy. The estimated rent commencement dates are November 1, 2017, July 1, 2017 and July 1, 2017, respectively. |
The following table presents certain information relating to the lease rollover schedule at the Vintage Park Property:
| Lease Rollover Schedule(1)(2) | ||||||||
| Year | # of Leases Rolling | SF Rolling | Annual UW Rent PSF Rolling(3) | Approx. % of Total SF Rolling | Approx. Cumulative % of SF Rolling | Total UW Rent Rolling | Approx. % of Total Rent Rolling | Approx. Cumulative % of Total Rent Rolling |
| MTM | 0 | 0 | $0.00 | 0.0% | 0.0% | $0 | 0.0% | 0.0% |
| 2016 | 0 | 0 | $0.00 | 0.0% | 0.0% | $0 | 0.0% | 0.0% |
| 2017 | 7 | 19,058 | $23.17 | 5.6% | 5.6% | $441,484 | 5.7% | 5.7% |
| 2018 | 19 | 47,205 | $28.56 | 13.8% | 19.4% | $1,348,119 | 17.3% | 22.9% |
| 2019 | 19 | 50,278 | $26.77 | 14.7% | 34.2% | $1,346,120 | 17.3% | 40.2% |
| 2020 | 8 | 28,234 | $28.62 | 8.3% | 42.4% | $808,141 | 10.4% | 50.6% |
| 2021 | 7 | 18,394 | $24.15 | 5.4% | 47.8% | $444,166 | 5.7% | 56.2% |
| 2022 | 4 | 16,440 | $21.77 | 4.8% | 52.7% | $357,926 | 4.6% | 60.8% |
| 2023 | 9 | 53,435 | $21.32 | 15.7% | 68.3% | $1,138,999 | 14.6% | 75.4% |
| 2024 | 2 | 24,704 | $17.08 | 7.2% | 75.6% | $422,025 | 5.4% | 80.8% |
| 2025 | 6 | 39,743 | $17.89 | 11.7% | 87.2% | $710,895 | 9.1% | 90.0% |
| 2026 | 2 | 4,167 | $29.26 | 1.2% | 88.4% | $121,906 | 1.6% | 91.5% |
| 2027 & Beyond(4) | 4 | 19,465 | $34.01 | 5.7% | 94.1% | $662,075 | 8.5% | 100.0% |
| Vacant | 0 | 19,984 | $0.00 | 5.9% | 100.0% | $0 | 0.0% | 100.0% |
| Total/Wtd. Avg. | 87 | 341,107 | $24.30 | 100.0% | $7,801,856 | 100.0% | ||
| (1) | Information is based on the underwritten rent roll. |
| (2) | Certain tenants may have lease termination options that are exercisable prior to the originally stated expiration date of the subject lease and that are not considered in the lease rollover schedule. |
| (3) | Wtd. Avg. Annual UW Rent PSF Rolling excludes vacant space. |
| (4) | Includes Ceviches Mariscos (4,873 SF, $170,555 of UW Base Rent), Hopdoddy’s Burger Bar (4,000 SF, $148,000 of UW Base Rent) and Dr. Scott Andersen, DDS (3,400 SF, $91,800 of UW Base Rent), which have executed leases, but not yet taken occupancy or commenced paying rent. The estimated rent commencement dates are November 1, 2017, July 1, 2017 and July 1, 2017, respectively with lease expiration dates in 2027. |
The Market. The Vintage Park Property is located in Houston, Harris County, Texas, approximately 25.1 miles northwest of the Houston CBD. The Vintage Park Property is situated approximately 5.3 miles south of the Grand Parkway, 6.3 miles northwest of the Sam Houston Parkway/Beltway 8, and
This is not a research report and was not prepared by any Underwriter’s research department. Please see additional important information and qualifications at the end of this Term Sheet.
T-87
| MSC 2016-UBS12 | Vintage Park |
20.6 miles west of the George Bush International Airport. The Vintage Park Property is part of The Vintage development, a 630-acre master planned community on a site sold to developers in 2004/2005. The Vintage development represents an investment of more than $1.0 billion and comprises over 1,600 upscale single-family homes, two apartment communities comprised of 1,500 units, senior-living, restaurants and entertainment, a variety of retail outlets and multiple healthcare facilities, as well as an 80-acre office campus development for Hewlett-Packard within The Vintage development. The office campus is occupied by Hewlett-Packard, Noble Energy and Lone Star College.
According to a third party market research report, the estimated 2016 population within a one-, three- and five-mile radius of the Vintage Park Property is 8,115, 108,923 and 262,131, respectively. The estimated 2016 average household income within a one-, three- and five-mile radius of the Vintage Park Property is $110,081, $108,904 and $105,986, respectively. Comparatively, the estimated 2016 average household income for Harris County, the MSA, and the state of Texas are $83,338, $88,764 and $77,652, respectively. In 2016, consumer expenditures within a one-, three- and five-mile radius were approximately $96.2 million, $1.1 billion and $2.6 billion, respectively, according to the appraisal. Furthermore, these figures are projected to grow at annual rates of 4.7%, 3.2% and 3.3%, respectively.
According to a third party market research report, the Vintage Park Property is located in the Cypresswood Drive retail submarket. As of the second quarter of 2016, the Cypresswood Drive retail submarket had an overall vacancy rate of 4.5% and an average asking annual lease rate of $21.24 PSF compared to the overall Houston retail market with an overall vacancy rate of 5.0% and an average asking annual lease rate of $15.77 PSF. According to a third party market research report, the Cypresswood Drive retail submarket contains 280 buildings accounting for 5.4 million SF of retail space.
The following table presents leasing data at certain retail competitive properties with respect to the Vintage Park Property:
| Competitive Property Summary | ||||||
| Property Name | Type | Year Built/Renovated | Size (SF) | Total Occupancy | Anchor Tenants | Distance to Subject (mi.) |
| Vintage Park Property | Regional Lifestyle Center | 2007/N/A | 341,107(1) | 94.1%(1) | The Work Lodge, Alamo Drafthouse Cinema | N/A |
| HEB Vintage Market | Lifestyle Center | 2007/N/A | 129,350 | 100.0% | HEB | 0.2 |
| Vintage Marketplace | Community Center | 2014/N/A | 70,000 | 96.4% | Whole Foods, Orange Theory | 0.8 |
| The Vintage Center | Unanchored Retail | 2013/N/A | 12,533 | 100.0% | Mattress Firm, Serenity Dental Care | 0.6 |
| LaCenterra at Cinco Ranch Phase I | Lifestyle Center | 2007/N/A | 368,525 | 95.0% | Trader Joe’s, Talbots, White House Black Market, J. Jill, Eddie Bauer | 34.4 |
| Sugar Land Town Square | Lifestyle Center | 2008/N/A | 807,000 | 92.1% | Jos A. Bank, Ann Taylor LOFT | 33.2 |
| CityCentre | Lifestyle Center | 2008/N/A | 305,975 | 98.0% | West Elm, Anthropologie, Urban Outfitters | 18.7 |
| Total/Wtd. Avg.(2) | 1,693,383 | 94.6% | ||||
Source:Appraisal
| (1) | Information is based on the underwritten rent roll. Includes as occupied space 12,273 SF recently leased to Ceviches Mariscos (4,873 SF), Hopdoddy’s Burger Bar (4,000 SF) and Dr. Scott Andersen, DDS (3,400 SF). Ceviches Mariscos, Hopdoddy’s Burger Bar and Dr. Scott Andersen, DDS have not yet taken occupancy. The estimated rent commencement dates are November 1, 2017, July 1, 2017 and July 1, 2017, respectively. Excluding these tenants, physical occupancy of the Vintage Park Property is 90.5%. |
| (2) | Total/Wtd. Avg. excludes the Vintage Park Property. |
This is not a research report and was not prepared by any Underwriter’s research department. Please see additional important information and qualifications at the end of this Term Sheet.
T-88
| MSC 2016-UBS12 | Vintage Park |
Operating History and Underwritten Net Cash Flow.The following table presents certain information relating to the historical operating performance and the Underwritten Net Cash Flow at the Vintage Park Property:
| Cash Flow Analysis | |||||||
| 2013(1) | 2014(1) | 2015 | 7/31/2016 TTM | UW | UW PSF | ||
| Base Rent(2) | $4,275,126 | $5,762,659 | $6,560,006 | $7,273,873 | $8,504,644 | $24.93 | |
| Total Recoveries | $1,579,713 | $2,308,869 | $2,366,679 | $3,278,815 | $4,119,415 | $12.08 | |
| Other Income | $118,079 | $151,727 | $168,260 | $178,818 | $237,506 | $0.70 | |
| Less Vacancy & Credit Loss | ($35,741) | ($171,644) | ($110,329) | ($247,712) | ($820,650) | ($2.41) | |
| Effective Gross Income | $5,937,176 | $8,051,610 | $8,984,616 | $10,483,793 | $12,040,915 | $35.30 | |
| Total Operating Expenses | $3,026,619 | $3,422,237 | $4,244,897 | $4,167,240 | $4,642,388 | $13.61 | |
| Net Operating Income | $2,910,557 | $4,629,373 | $4,739,719 | $6,316,553 | $7,398,527 | $21.69 | |
| Capital Expenditures | $0 | $0 | $0 | $0 | $51,166 | $0.15 | |
| TI/LC | $0 | $0 | $0 | $0 | $161,802 | $0.47 | |
| Net Cash Flow | $2,910,557 | $4,629,373 | $4,739,719 | $6,316,553 | $7,185,559 | $21.07 | |
| Occupancy %(3) | 73.4% | 78.6% | 94.5% | 94.1% | 93.5% | ||
| NOI DSCR (P&I)(4) | 0.54x | 0.86x | 0.88x | 1.17x | 1.37x | ||
| NOI DSCR (IO)(4) | 0.69x | 1.09x | 1.12x | 1.49x | 1.74x | ||
| NCF DSCR (P&I)(4) | 0.54x | 0.86x | 0.88x | 1.17x | 1.33x | ||
| NCF DSCR (IO)(4) | 0.69x | 1.09x | 1.12x | 1.49x | 1.69x | ||
| NOI Debt Yield(4) | 3.5% | 5.5% | 5.6% | 7.5% | 8.8% | ||
| NCF Debt Yield(4) | 3.5% | 5.5% | 5.6% | 7.5% | 8.6% | ||
| (1) | The sponsor purchased the Vintage Park Property in March 2012 when it was 38.6% leased. Subsequent leasing activity increased occupancy to 61.0% as of year-end 2012 and 73.4% as of year-end 2013. The increase in Base Rent from 2013 to 2014 is largely attributed to the timing of lease execution and rent commencement of the 16 new leases executed in 2013, accounting for 82,819 SF (24.3% of NRA) and UW Base Rent of $1,727,223. |
| (2) | The increase in UW Base Rent over 7/31/2016 TTM Base Rent is primarily attributed to approximately $132,190 of contractual rent steps effective October 1, 2017, $562,057 of vacancy gross up and recent leasing activity to Guacho Do Sul (7,192 SF, $251,720 of UW Base Rent), Dunhill Partners Management Services, Inc. (1,634 SF, $40,850 of UW Base Rent), Ceviches Mariscos (4,873 SF, $170,555 of UW Base Rent), Hopdoddy’s Burger Bar (4,000 SF, $148,000 of UW Base Rent) and Dr. Scott Andersen, DDS (3,400 SF, $91,800 of UW Base Rent). Ceviches Mariscos, Hopdoddy’s Burger Bar and Dr. Scott Andersen, DDS have not yet taken occupancy or commenced paying rent. The estimated rent commencement dates are November 1, 2017, July 1, 2017 and July 1, 2017, respectively. We cannot assure you that Ceviches Mariscos, Hopdoddy’s Burger Bar and Dr. Scott Andersen, DDS will take occupancy or begin paying rent as anticipated. The Vintage Park Borrower funded $350,405 into a lender-controlled reserve account at closing to bridge UW Base Rent to the tenants’ estimated rent commencement dates. 7/31/2016 TTM Base Rent includes $388,378 of percentage rent which includes collections for percentage rent attributable to prior periods and UW Base Rent includes $140,731 of percentage rent, based on tenant reported sales for 8/31/2016 TTM. |
| (3) | Occupancy % for 2013, 2014 and 2015 represents physical occupancy as of December 31 of each respective year. 7/31/2016 TTM Occupancy % equates to leased occupancy as of October 6, 2016 and includes as occupied space 12,273 SF recently leased to Ceviches Mariscos (4,873 SF), Hopdoddy’s Burger Bar (4,000 SF) and Dr. Scott Andersen, DDS (3,400 SF). Ceviches Mariscos, Hopdoddy’s Burger Bar and Dr. Scott Andersen, DDS have not yet taken occupancy. We cannot assure you that Ceviches Mariscos, Hopdoddy’s Burger Bar and Dr. Scott Andersen, DDS will take occupancy or begin paying rent as anticipated. Excluding these tenants, physical occupancy of the Vintage Park Property is 90.5%. UW Occupancy % is based on underwritten economic occupancy. |
| (4) | Debt service coverage ratios and debt yields are based on the Vintage Park Whole Loan. |
Escrows and Reserves. At origination of the Vintage Park Whole Loan, the Vintage Park Borrower deposited (i) $2,082,355 into a reserve for real estate taxes and $162,810 into a reserve for insurance premiums, and is required to escrow monthly (a) 1/12 of the annual estimated real estate tax payments (unless the tenants are paying any monthly real estate taxes directly to the applicable governmental authorities, among other conditions in the loan documents) and (b) 1/12 of the annual estimated insurance premiums; (ii) $3,250,000 in escrow for TI/LC reserves and is required to make monthly deposits of $28,426 for TI/LC reserves if the funds on deposit in such TI/LC reserve account fall below $1,200,000; and (iii) $2,034,479 in escrow for unfunded tenant obligations for free rent relating to four individual tenants ($458,165), any unpaid and outstanding tenant allowances, tenant improvements and leasing commissions relating to five individual tenants ($1,496,159) and/or landlord work relating to two individual tenants ($80,155). The Vintage Park Borrower is required to escrow monthly $5,685 for replacement reserves.
During the continuance of a Material Tenant Trigger Event (as defined below), on each monthly payment date, all excess cash flow is required to be deposited into a reserve (the “Material Tenant Rollover Reserve”) to be held by the lender as additional security for the Vintage Park Whole Loan. So long as no event of default exists, funds held in the Material Tenant Rollover Reserve are required to be used in connection with tenant improvements and leasing commissions incurred by the Vintage Park Borrower upon the occurrence of (i) an extension or renewal of the Material Tenant’s (as defined below) lease or (ii) the leasing of all or a portion of the space formerly demised to the Material Tenant to one or more replacement tenants approved by the lender for a term of no less than five years.
A “Material Tenant Trigger Event” will commence upon the earlier of (i) if the Material Tenant fails to extend or renew its lease upon terms and conditions set forth in the Material Tenant’s lease (or as otherwise acceptable to the lender) on or prior to the earlier of (a) the date required for such notice period pursuant to the Material Tenant’s lease and (b) the date that is at least 12 months prior to the then-applicable expiration date of the Material Tenant’s lease, (ii) if an event of default under the Material Tenant’s lease has occurred, (iii) the Material Tenant or lease guarantor of the Material Tenant’s lease becomes insolvent or a debtor in any bankruptcy action, (iv) if the Material Tenant’s lease is terminated or no longer in full force or effect, (v) if the Material Tenant “goes dark,” vacates, ceases to occupy or discontinues its operations at the Vintage Park Property, or (vi) the decline in rating of any Material Tenant or any lease guarantor for the Material Tenant below investment grade by any of the applicable rating agencies. A Material Tenant Trigger Event will continue until, in regard to clause (i) above, the Material Tenant has entered into a renewal of all of its leased premises in accordance with the requirements of the loan documents or certain re-leasing conditions have been satisfied with respect to the Material Tenant space, in regard to clause (ii) above, the applicable event of default has been cured, in regard to clause (iii) above, the Material Tenant’s lease is unconditionally affirmed in the applicable bankruptcy and the Material Tenant is paying full unabated rent or, if applicable, the guarantor bankruptcy has been discharged or dismissed with no material adverse effect on the guarantor’s ability to perform under the lease guaranty, in regard to clause (iv) above, certain re-leasing
This is not a research report and was not prepared by any Underwriter’s research department. Please see additional important information and qualifications at the end of this Term Sheet.
T-89
| MSC 2016-UBS12 | Vintage Park |
conditions have been satisfied with respect to the Material Tenant space, in regard to clause (v) above, the applicable Material Tenant re-commences its operations at its leased premises and is paying full unabated rent, or in regard to clause (vi) above, the rating is raised so that such rating is no lower than investment grade by each applicable rating agency.
“Material Tenant” means any tenant, guarantor, or replacement that, together with its affiliates, leases space comprising 20% or more of either (a) the total rentable SF at the Vintage Park Property or (b) the total in-place base rent at the Vintage Park Property.
Lockbox and Cash Management. A hard lockbox is in place with respect to the Vintage Park Whole Loan. The Vintage Park Whole Loan has springing cash management (i.e., the Vintage Park Whole Loan has cash management only after the initial occurrence of a Trigger Period (as defined below)). During the continuance of a Trigger Period for the Vintage Park Whole Loan, funds in the lockbox account are required to be applied on each monthly payment date to pay debt service on the Vintage Park Whole Loan, to fund the required reserves deposits as described above under “—Escrows and Reserves,” to disburse, provided no event of default has occurred and is continuing, to the Vintage Park Borrower the monthly amount payable for operating expenses not otherwise paid or reserved for as described above under “—Escrows and Reserves” and referenced in the annual budget approved by the lender together with other amounts incurred by the Vintage Park Borrower in connection with the operation and maintenance of the Vintage Park Property reasonably approved by the lender, and to disburse the remainder to the Vintage Park Borrower (or, during the continuance of a Cash Sweep Period (as defined below), provided no Material Tenant Trigger Event has occurred, to an account to be held by the lender as additional security for the Vintage Park Whole Loan). During the continuance of a Material Tenant Trigger Event, on each monthly payment date, all excess cash flow is required to be deposited into the Material Tenant Rollover Reserve to be held by the lender as additional security for the Vintage Park Whole Loan.
A “Trigger Period” will occur upon (i) an event of default, (ii) any bankruptcy action involving the Vintage Park Borrower, the guarantor or the property manager, (iii) the debt service coverage ratio based on the trailing six-month period falling below 1.20x, (iv) a Material Tenant Trigger Event, or (v) any indictment for fraud or misappropriation of funds by the Vintage Park Borrower, the guarantor or the property manager or any director or officer of the Vintage Park Borrower, the guarantor or the property manager. A Trigger Period will continue until, in regard to clause (i) above, the cure of such event of default and acceptance of such cure by the lender, in regard to clause (ii) above, upon the filing being discharged, stayed or dismissed within 60 days for the Vintage Park Borrower or the guarantor, or within 120 days for the property manager, and the lender’s determination that such filing does not materially affect the Vintage Park Borrower’s, the guarantor’s, or the property manager’s monetary obligations, in regard to clause (iii) above, upon the date the debt service coverage ratio based on the trailing six-month period is greater than 1.25x for two consecutive calendar quarters, in regard to clause (iv) above, the Material Tenant Trigger Event is cured, or in regard to clause (v) above, solely with respect to the property manager, when the Vintage Park Borrower replaces the property manager with a qualified manager.
A “Cash Sweep Period” will occur upon (i) an event of default, (ii) any bankruptcy action involving the Vintage Park Borrower, the guarantor or the property manager, (iii) the debt service coverage ratio based on the trailing six-month period falling below 1.20x, or (iv) any indictment for fraud or misappropriation of funds by the Vintage Park Borrower, the guarantor or the property manager or any director or officer of the Vintage Park Borrower, the guarantor or the property manager. A Cash Sweep Period will continue until, in regard to clause (i) above, the cure of such event of default and acceptance of such cure by the lender, in regard to clause (ii) above, upon the filing being discharged, stayed or dismissed within 60 days for the Vintage Park Borrower or the guarantor, or within 120 days for the property manager, and the lender’s determination that such filing does not materially affect the Vintage Park Borrower’s, the guarantor’s, or the property manager’s monetary obligations, in regard to clause (iii) above, upon the date the debt service coverage ratio based on the trailing six-month period is greater than 1.25x for two consecutive calendar quarters, or in regard to clause (iv) above, solely with respect to the property manager, when the Vintage Park Borrower replaces the property manager with a qualified manager.
Additional Secured Indebtedness (not including trade debts).The Vintage Park Property also secures the Vintage Park Non-ServicedPari Passu Companion Loans, which have an aggregate cut-off date balance of $45,000,000 and expected to be held by the MSBAM 2016-C31 securitization trust as of the closing of this transaction. Each of the Vintage Park Non-ServicedPari Passu Companion Loans accrues interest at the same rate as the Vintage Park Mortgage Loan. The Vintage Park Mortgage Loan is entitled to payments of principal and interest on apro rata andpari passubasis with the Vintage Park Non-ServicedPari PassuCompanion Loans. The holders of the Vintage Park Mortgage Loan and the Vintage Park Non-ServicedPari PassuCompanion Loans have entered into a co-lender agreement that sets forth the allocation of collections on the Vintage Park Whole Loan. See“Description of the Mortgage Pool—The Whole Loans—The Non-Serviced Pari Passu Whole Loans” in the Preliminary Prospectus.
Mezzanine Loan and Preferred Equity. Not permitted.
Release of Property.Not permitted.
Terrorism Insurance. The Vintage Park Borrower is required to obtain and maintain property insurance, commercial general liability insurance and business income or rental loss insurance that covers perils of terrorism and acts of terrorism, both foreign and domestic.
This is not a research report and was not prepared by any Underwriter’s research department. Please see additional important information and qualifications at the end of this Term Sheet.
T-90
(THIS PAGE INTENTIONALLY LEFT BLANK)
This is not a research report and was not prepared by any Underwriter’s research department. Please see additional important information and qualifications at the end of this Term Sheet.
T-91
| MSC 2016-UBS12 | 101 Hudson Street |
Mortgage Loan No. 7 – 101 Hudson Street
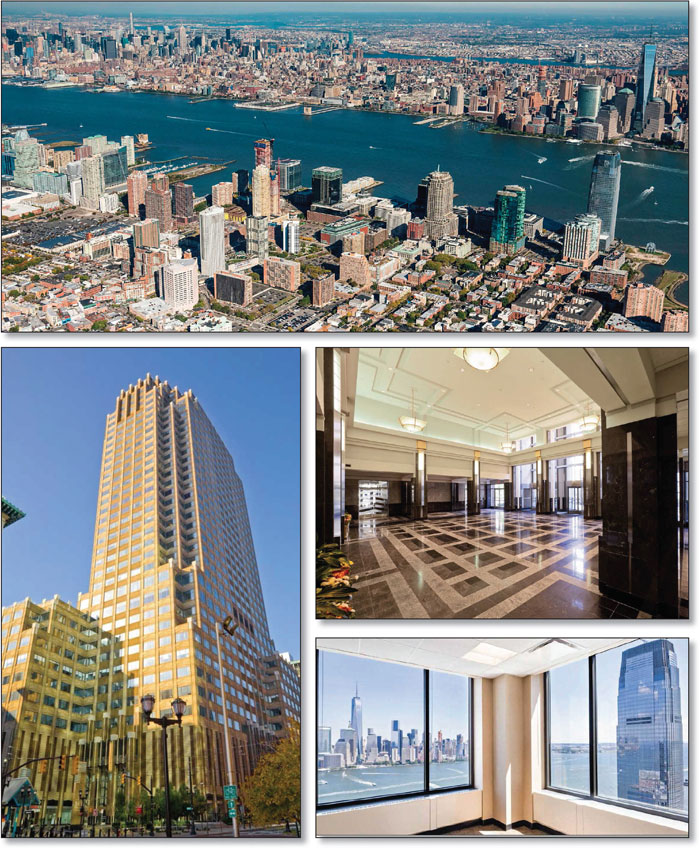
This is not a research report and was not prepared by any Underwriter’s research department. Please see additional important information and qualifications at the end of this Term Sheet.
T-92
| MSC 2016-UBS12 | 101 Hudson Street |
Mortgage Loan No. 7 – 101 Hudson Street
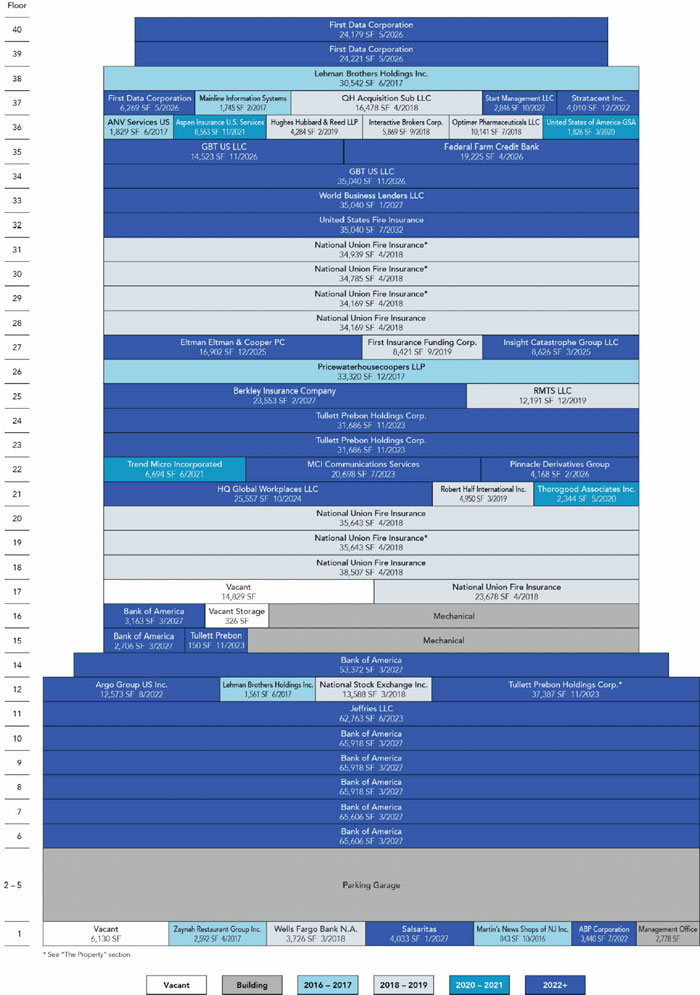
This is not a research report and was not prepared by any Underwriter’s research department. Please see additional important information and qualifications at the end of this Term Sheet.
T-93
| MSC 2016-UBS12 | 101 Hudson Street |
Mortgage Loan No. 7 – 101 Hudson Street
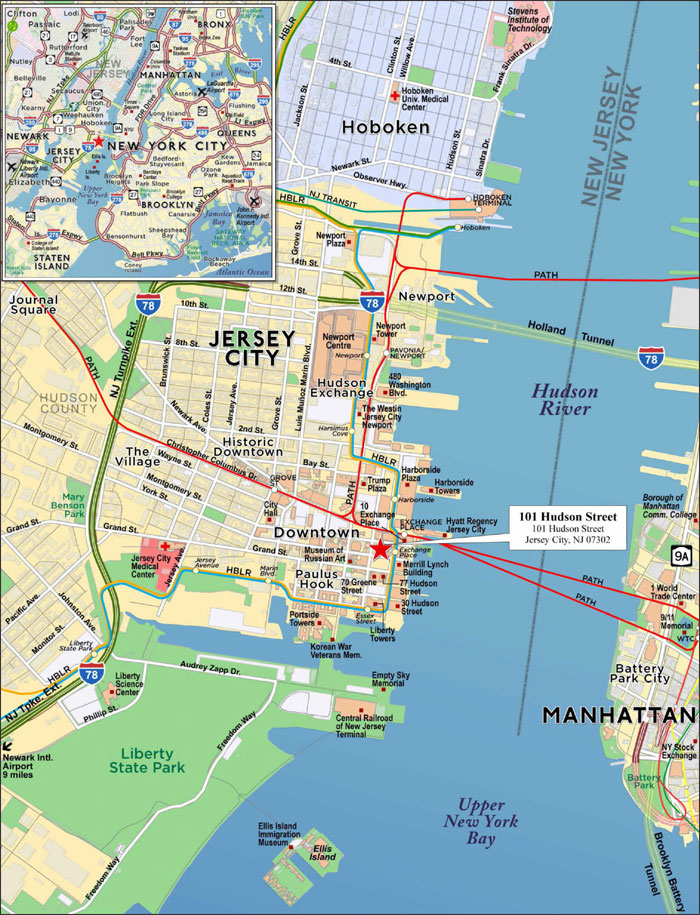
This is not a research report and was not prepared by any Underwriter’s research department. Please see additional important information and qualifications at the end of this Term Sheet.
T-94
| MSC 2016-UBS12 | 101 Hudson Street |
| Mortgage Loan No. 7 – 101 Hudson Street |
| Mortgage Loan Information | Mortgaged Property Information | ||||||
| Mortgage Loan Seller: | BANA | Single Asset/Portfolio: | Single Asset | ||||
| Original Balance(1): | $37,250,000 | Location: | Jersey City, NJ 07302 | ||||
| Cut-off Date Balance(1): | $37,250,000 | General Property Type: | Office | ||||
| % of Initial Pool Balance: | 4.5% | Detailed Property Type: | CBD | ||||
| Loan Purpose: | Refinance | Title Vesting: | Fee | ||||
| Sponsor: | Mack-Cali Realty, L.P. | Year Built/Renovated: | 1992/2015 | ||||
| Mortgage Rate: | 3.1170% | Size: | 1,341,649 SF | ||||
| Note Date: | 9/30/2016 | Cut-off Date Balance per SF(1): | $186 | ||||
| First Payment Date: | 11/11/2016 | Maturity Date Balance per SF(1): | $186 | ||||
| Maturity Date: | 10/11/2026 | Property Manager: | Mack-Cali Realty, L.P. (borrower-related) | ||||
| Original Term to Maturity: | 120 months | ||||||
| Original Amortization Term: | 0 months | ||||||
| IO Period: | 120 months | Underwriting and Financial Information | |||||
| Seasoning: | 2 months | UW NOI(4): | $32,128,921 | ||||
| Prepayment Provisions: | LO (26); YM1 (87); O (7) | UW NOI Debt Yield(1): | 12.9% | ||||
| Lockbox/Cash Mgmt Status: | Hard/Springing | UW NOI Debt Yield at Maturity(1): | 12.9% | ||||
| Additional Debt Type(2): | Pari Passu | UW NCF DSCR(1): | 3.68x | ||||
| Additional Debt Balance(2): | $212,750,000 | Most Recent NOI: | $23,104,804 (7/31/2016 TTM) | ||||
| Future Debt Permitted (Type): | No (N/A) | 2nd Most Recent NOI: | $21,296,669 (12/31/2015) | ||||
| Reserves(3) | 3rd Most Recent NOI: | $20,587,281 (12/31/2014) | |||||
| Type | Initial | Monthly | Cap | Most Recent Occupancy(5): | 98.3% (9/21/2016) | ||
| RE Tax: | $0 | Springing | N/A | 2nd Most Recent Occupancy: | 90.2% (12/31/2015) | ||
| Insurance: | $0 | Springing | N/A | 3rd Most Recent Occupancy: | 87.0% (12/31/2014) | ||
| Recurring Replacements: | $0 | Springing | N/A | Appraised Value (as of): | $482,500,000 (9/6/2016) | ||
| TI/LC: | $0 | Springing | N/A | Cut-off Date LTV Ratio(1): | 51.8% | ||
| Deferred Maintenance: | $104,000 | $0 | N/A | Maturity Date LTV Ratio(1): | 51.8% | ||
| Outstanding TI/LC Reserve: | $16,270,684 | $0 | N/A | ||||
| Rent Concession Reserve: | $2,779,153 | $0 | N/A | ||||
| Sources and Uses | ||||||
| Sources | Proceeds | % of Total | Uses | Proceeds | % of Total | |
| Loan Amount: | $250,000,000 | 100.0% | Loan Payoff(6): | $0 | 0.0% | |
| Reserves: | $19,153,837 | 7.7% | ||||
| Closing Costs: | $1,733,229 | 0.7% | ||||
| Return of Equity | $229,112,934 | 91.6% | ||||
| Total Sources: | $250,000,000 | 100.0% | Total Uses: | $250,000,000 | 100.0% | |
| (1) | The 101 Hudson Street Mortgage Loan is part of the 101 Hudson Street Whole Loan, which is comprised of sixpari passupromissory notes with an aggregate principal balance of $250,000,000. The Cut-off Date Balance per SF, Maturity Date Balance per SF, UW NOI Debt Yield, UW NOI Debt Yield at Maturity, UW NCF DSCR, Cut-off Date LTV Ratio and Maturity Date LTV Ratio numbers presented above are based on the aggregate balance of the promissory notes comprising the 101 Hudson Street Whole Loan. |
| (2) | See“—The Mortgage Loan” and “—Additional Secured Indebtedness (not including trade debt)” below for further discussion of additional debt. |
| (3) | See “—Escrows and Reserves” below for further discussion of reserve requirements. |
| (4) | The increase in UW NOI is as a result of the increase in base rent and effective gross income from 2013 through U/W due to continued increases in occupancy from 83.4% as of December 31, 2013 to 98.3% as of September 21, 2016, along with free rent burn-off and the Bank of America expansion, among others. |
| (5) | As of September 21, 2016, two tenants are partially dark and not currently in occupancy of 176,923 SF (13.2% of net rentable area). Most recent occupancy excluding this space is 85.1%. See “The Property” and “Cash Flow Analysis” sections. |
| (6) | The 101 Hudson Street Property was previously unencumbered by debt. |
The Mortgage Loan. The seventh largest mortgage loan (the “101 Hudson Street Mortgage Loan”) is part of a whole loan (the “101 Hudson Street Whole Loan”) evidenced by sixpari passupromissory notes in the aggregate original principal amount of $250,000,000 which are secured by a first priority fee mortgage encumbering a 1,341,649 SF office building located in Jersey City, New Jersey (the “101 Hudson Street Property”). Promissory Note A-3, in the original aggregate principal amount of $37,250,000, represents the 101 Hudson Street Mortgage Loan. Promissory Notes A-1-1, A-1-2, A-2, A-4 and A-5, in the aggregate original principal amount of $212,750,000, collectively represent companion loans (the “101 Hudson Street Non-ServicedPari Passu Companion Loans”). Two of the 101 Hudson Street Non-ServicedPari Passu Companion Loans, represented by Promissory Notes A-1-1 (the lead note) and A-4 in the original principal amounts of $53,500,000 and $19,000,000, are currently expected to be contributed to the MSC 2016-BNK2 securitization trust. In addition, the 101 Hudson Street Non-ServicedPari Passu Companion Loan represented by Promissory Note A-1-2 in the original principal amount of $16,500,000, is currently held by Wells Fargo Bank, National Association or an affiliate thereof on the closing date of this transaction and may be contributed to one or more future securitization transactions or otherwise transferred at any time. In addition, the 101 Hudson
This is not a research report and was not prepared by any Underwriter’s research department. Please see additional important information and qualifications at the end of this Term Sheet.
T-95
| MSC 2016-UBS12 | 101 Hudson Street |
Street Non-ServicedPari Passu Companion Loan, represented by Promissory Note A-2 in the original principal amount of $67,500,000, was contributed to the WFCM 2016-C36 securitization trust. Finally, the 101 Hudson Street Non-ServicedPari Passu Companion Loan represented by Promissory Note A-5 in the original principal amount of $56,250,000 is currently expected to be contributed to the CGCMT 2016-C3 securitization trust.
The 101 Hudson Street Whole Loan will initially be serviced pursuant to the pooling and servicing agreement for the WFCM 2016-C36 securitization trust, and from and after the closing of the MSC 2016-BNK2 transaction, the 101 Hudson Street Whole Loan will be serviced pursuant to the pooling and servicing agreement for the MSC 2016-BNK2 Trust. See “Description of the Mortgage Pool—The Whole Loans—The Non-Serviced Pari Passu Whole Loans” and “Pooling and Servicing Agreement—Servicing of the Non-Serviced Mortgage Loans” in the Preliminary Prospectus. The proceeds of the 101 Hudson Street Whole Loan were used to fund reserves, pay closing costs and return equity to the 101 Hudson Street Borrower (as defined below).
The Borrower and the Sponsor.The borrower is 101 Hudson Realty L.L.C. (the “101 Hudson Street Borrower”), a Delaware limited liability company and single purpose entity with two independent directors. Legal counsel to the borrower delivered a non-consolidation opinion in connection with the origination of the 101 Hudson Street Whole Loan. Mack-Cali Realty, L.P. is the guarantor of certain nonrecourse carveouts under the 101 Hudson Street Whole Loan.
The sponsor is Mack-Cali Realty, L.P. (“Mack-Cali”). As of June 30, 2016, Mack-Cali (NYSE: CLI, rated BB+/Ba1/BB+ by Fitch, Moody’s and S&P) owned or had interests in 269 properties, including 142 office and 109 flex properties, totaling approximately 29.1 million SF, leased to approximately 1,700 commercial tenants, and 18 multifamily rental properties containing 5,434 residential units.
The Property.The 101 Hudson Street Property is a 42-story, class A office tower totaling approximately 1,341,649 SF located in Jersey City, New Jersey within the center of Jersey City’s Waterfront district. The 101 Hudson Street Property is the second tallest office building in Jersey City and features views of the New York City Harbor and Manhattan skyline, 17-foot ceiling heights, ground floor retail, a landscaped courtyard area and an attached 900-space parking garage resulting in a parking ratio of 0.7 spaces per 1,000 feet of rentable area. Additionally, the 101 Hudson Street Property is Wired Certified Platinum, a certification awarded to buildings with the fastest, most reliable internet connections and telecom infrastructures. Built in 1992 and renovated in 2015, the 101 Hudson Street Property features investment-grade tenancy that accounts for approximately 58.1% of net rentable area and approximately 53.0% of in-place underwritten base rent. The 101 Hudson Street Property features a diverse tenant roster comprising 39 tenants with the largest tenant, Bank of America (rated A/Baa1/BBB+ by Fitch, Moody’s and S&P), representing 28.9% of the net rentable area and 21.8% of the underwritten base rent. Bank of America executed a 10-year lease renewal in March 2016, extending their lease through March 2027. In addition to the lease extension, Bank of America expanded into an additional 53,372 SF (4.0% of net rentable area). The 101 Hudson Street Property has benefited from recent leasing activity with approximately 359,225 SF (26.8% of net rentable area) having signed a new lease or renewal since 2015. Over the past eleven years, the 101 Hudson Street Property has averaged 92.9% occupancy and as of September 21, 2016, the 101 Hudson Street Property was 98.3% occupied by 39 tenants subject to 57 leases. National Union Fire Insurance is not currently in occupancy of 139,536 SF (10.4% of net rentable area) and Tullett Prebon Holdings Corp. is not currently in occupancy of 37,387 SF (2.8% of net rentable area). Current occupancy excluding these spaces is 85.1%.
This is not a research report and was not prepared by any Underwriter’s research department. Please see additional important information and qualifications at the end of this Term Sheet.
T-96
| MSC 2016-UBS12 | 101 Hudson Street |
The following table presents a summary regarding major tenants at the 101 Hudson Street Property:
| Tenant Summary(1) | |||||||
| Tenant Name | Credit Rating (Fitch/Moody’s/S&P)(2) | Tenant SF | Approximate % of SF | Annual UW Rent(3) | % of Total Annual UW Rent | Annual UW Rent PSF(3) | Lease Expiration |
| Major Tenants | |||||||
| Bank of America | A/Baa1/BBB+ | 388,207 | 28.9% | $8,641,488(4) | 21.8% | $22.26(4) | 3/31/2027 |
| National Union Fire Insurance | NR/A2/A+ | 271,533(5) | 20.2% | $8,145,990 | 20.5% | $30.00 | 4/30/2018 |
| Tullett Prebon Holdings Corp. | BBB-/Ba1/NR | 100,909(6) | 7.5% | $3,132,809(4) | 7.9% | $31.05(4) | 11/30/2023 |
| Jeffries LLC | BBB-/Baa3/BBB- | 62,763 | 4.7% | $2,133,942 | 5.4% | $34.00 | 6/30/2023 |
| First Data Corporation | CCC+/B3/B+ | 54,669 | 4.1% | $1,921,135 | 4.8% | $35.14 | 5/31/2026(7) |
| GBT US LLC | NR/NR/NR | 49,563 | 3.7% | $1,920,566 | 4.8% | $38.75 | 11/30/2026 |
| United States Fire Insurance | NR/Baa1/A- | 35,040 | 2.6% | $1,331,520 | 3.4% | $38.00 | 7/31/2032 |
| World Business Lenders LLC | NR/NR/NR | 35,040 | 2.6% | $1,296,480 | 3.3% | $37.00 | 1/31/2027 |
| Total Major Tenants | 997,724 | 74.4% | $28,523,930 | 71.8% | $28.59 | ||
| Other Tenants | 321,566(8) | 24.0% | $11,197,678 | 28.2% | $34.82(8) | ||
| Total Occupied Space | 1,319,290(8) | 98.3% | $39,721,608 | 100.0% | $30.11(8) | ||
| Vacant Space | 22,359 | 1.7% | |||||
| Total/Wtd. Avg. | 1,341,649 | 100.0% | |||||
| (1) | Information is based on the underwritten rent roll. |
| (2) | Certain ratings are those of the parent company whether or not the parent guarantees the lease. |
| (3) | Annual UW Rent and Annual UW Rent PSF include contractual rent steps through October 2017 totaling $1,648,952. |
| (4) | Annual U/W Base Rent is a triple-net rent. |
| (5) | National Union Fire Insurance is not currently in occupancy of 139,536 SF (10.4% of net rentable area). See “Cash Flow Analysis” section. |
| (6) | Tullett Prebon Holdings Corp. is not currently in occupancy of 37,387 SF (2.8% of net rentable area). See “Cash Flow Analysis” section. |
| (7) | First Data Corporation has the option to terminate its lease effective December 31, 2023 with required notice by June 30, 2022 and a termination fee of approximately $2,107,496. |
| (8) | Includes two units occupied as a management office (2,778 SF) and management storage (1,650 SF), each with no attributed underwritten base rent. The Other Tenants Annual U/W Base Rent PSF and Occupied Collateral Total Annual U/W Base Rent PSF excluding these spaces are $35.31 per SF and $30.21 per SF, respectively. |
Major Tenants.
Bank of America (388,207 SF, 28.9% of NRA, 21.8% of underwritten base rent). Bank of America leases 388,207 SF at the 101 Hudson Street Property. The lease began on April 1, 1992 and Bank of America expanded by 53,372 SF in March 2016 and has a current expiration date of March 31, 2027 for the entirety of its space, with two five-year lease renewal options. Bank of America (NYSE: BAC) is a financial institution, serving individual consumers, small and middle-market businesses and large corporations with a range of banking, investing, asset management and other financial and risk management products and services.
National Union Fire Insurance (271,533 SF, 20.2% of NRA, 20.5% of underwritten base rent). National Union Fire Insurance leases 271,533 SF at the 101 Hudson Street Property. The lease began on June 1, 2004 and has a current expiration date of April 30, 2018, with two five-year lease renewal options for 133,471 SF. National Union Fire Insurance operates as a subsidiary of American International Group, Inc. (“AIG”) (NYSE: AIG), a global insurance organization.As of December 31, 2015, AIG reported total annual revenues of approximately $58.3 billion with total assets of approximately $496.9 billion. As of September 21, 2016, National Union Fire Insurance is not currently in occupancy of 139,536 SF (10.4% of net rentable area).
Tullett Prebon Holdings Corp. (100,909 SF, 7.5% of NRA, 7.9% of underwritten base rent). Tullett Prebon Holdings Corp. (“Tullett Prebon”)leases 100,909 SF at the 101 Hudson Street Property. The lease began on November 26, 1993 and has a current expiration date of November 30, 2023, with one five-year lease renewal option. Tullett Prebon (LSE: TLPR) is an interdealer broker operating as an intermediary in the wholesale financial and energy sectors with product areas including Fixed Income Securities and derivatives, Interest Rate Derivatives, Treasury products, Equities and Commodities. As of December 31, 2015, Tullett Prebon has offices in 24 countries and reported annual revenues of approximately £796.0 million. As of September 21, 2016, Tullett Prebon Holdings Corp. is not currently in occupancy of 37,387 SF (2.8% of net rentable area).
This is not a research report and was not prepared by any Underwriter’s research department. Please see additional important information and qualifications at the end of this Term Sheet.
T-97
| MSC 2016-UBS12 | 101 Hudson Street |
The following table presents certain information relating to the lease rollover schedule at the 101 Hudson Street Property:
| Lease Rollover Schedule(1)(2) | |||||||||
| Year | # of Leases Rolling | SF Rolling | UW Rent PSF Rolling(3) | Approx. % of Total SF Rolling | Approx. Cumulative % of SF Rolling | Total UW Rent Rolling | Approx. % of Total Rent Rolling | Approx. Cumulative % of Total Rent Rolling | |
| MTM(4) | 3 | 5,271 | $7.36 | 0.4% | 0.4% | $38,778 | 0.1% | 0.1% | |
| 2016 | 0 | 0 | $0.00 | 0.0% | 0.4% | $0 | 0.0% | 0.1% | |
| 2017 | 6 | 71,589 | $37.01 | 5.3% | 5.7% | $2,649,476 | 6.7% | 6.8% | |
| 2018 | 14 | 321,335 | $31.52 | 24.0% | 29.7% | $10,127,523 | 25.5% | 32.3% | |
| 2019 | 4 | 29,846 | $36.00 | 2.2% | 31.9% | $1,074,568 | 2.7% | 35.0% | |
| 2020 | 2 | 4,170 | $38.06 | 0.3% | 32.2% | $158,719 | 0.4% | 35.4% | |
| 2021 | 2 | 15,257 | $36.16 | 1.1% | 33.4% | $551,665 | 1.4% | 36.8% | |
| 2022 | 5 | 22,869 | $38.18 | 1.7% | 35.1% | $873,064 | 2.2% | 39.0% | |
| 2023 | 6 | 184,370 | $32.53 | 13.7% | 48.8% | $5,997,183 | 15.1% | 54.1% | |
| 2024 | 2 | 25,557 | $20.10 | 1.9% | 50.7% | $513,696 | 1.3% | 55.3% | |
| 2025 | 2 | 25,528 | $34.00 | 1.9% | 52.6% | $867,952 | 2.2% | 57.5% | |
| 2026 | 7 | 127,625 | $36.35 | 9.5% | 62.1% | $4,639,147 | 11.7% | 69.2% | |
| 2027 & Beyond | 6 | 485,873 | $25.17 | 36.2% | 98.3% | $12,229,837 | 30.8% | 100.0% | |
| Vacant | 0 | 22,359 | $0.00 | 1.7% | 100.0% | $0 | 0.0% | 100.0% | |
| Total/Wtd. Avg. | 59 | 1,341,649 | $30.11 | 100.0% | $39,721,608 | 100.0% | |||
| (1) | Information is based on the underwritten rent roll. |
| (2) | Certain tenants may have lease termination options that are exercisable prior to the originally stated expiration date of the related lease and are not considered in the rollover schedule. |
| (3) | Weighted average UW Rent PSF Rolling excludes vacant space. |
| (4) | Includes two units occupied as a management office (2,778 SF) and management storage (1,650 SF), each with no attributed underwritten base rent. The Total Annual U/W Base Rent PSF excluding these spaces is $30.21 per SF. |
The Market. The 101 Hudson Street Property is located in Jersey City’s Waterfront District, situated on the west side of the Hudson River across from Manhattan, New York. The Waterfront District is comprised of a number of high-rise office buildings as well as new residential developments. According to the appraisal, there are currently 18 residential developments under construction in the Waterfront District that, if completed, are expected to bring more than 5,900 units to market by the end of 2018. The 101 Hudson Street Property is located in the ongoing development known as the Colgate Center, a 42-acre, mixed-use development. Currently, there are 3.5 million SF of office space in the Colgate Center in four office towers, plus 1,733 residential units within four properties. The 2016 population and average household income within a one-mile radius of the 101 Hudson Street Property was 48,701 and $153,350, respectively.
The Port Authority Trans-Hudson (“PATH”) system provides subway and train lines to New York City, and maintains three of its seven New Jersey train stations within the Waterfront District including the Exchange Place Station, which is located one block from the 101 Hudson Street Property. The PATH encompasses a total of 13.9 miles of rail lines and currently serves over 200,000 passengers daily. Additionally, the Hudson-Bergen Light Rail Transit System, Hudson County’s 34.1-mile light rail system, has a station directly adjacent to the 101 Hudson Street Property.
According to the appraisal, the 101 Hudson Street Property is located in the Waterfront submarket of the New Jersey office market, which is defined as the area along the Hudson River that extends from Jersey City to the George Washington Bridge. As of the second quarter of 2016, the Waterfront submarket contained approximately 19.3 million SF (12.3% of the New Jersey office market) and reported a vacancy rate of 8.7%. For that same period, the Waterfront submarket reported positive net absorption of 121,013 SF and an average asking rent of $35.33 per SF, gross.
This is not a research report and was not prepared by any Underwriter’s research department. Please see additional important information and qualifications at the end of this Term Sheet.
T-98
| MSC 2016-UBS12 | 101 Hudson Street |
The following table reflects comparable office properties with respect to the 101 Hudson Street Property:
| Competitive Property Summary | |||||||||
| Property Name/Location | Year Built/ Renovated | Total Occupancy | Size (SF) | Tenant Name | Lease Area (SF) | Lease Date | Lease Term (Yrs.) | Rent PSF | Lease Type |
Waterfront Corporate Center III Hoboken, NJ | 2014/NAP | 100% | 507,781 | Jet.com | 39,900 | March 2016 | 12.0 | $51.50 | MG |
Waterfront Corporate Center III Hoboken, NJ | 2014/NAP | 100% | 507,781 | Newell Rubbermaid | 99,960 | March 2016 | 10.5 | $51.00 | MG |
Waterfront Corporate Center III Hoboken, NJ | 2014/NAP | 100% | 507,781 | NICE Systems | 59,990 | October 2015 | 11.0 | $44.00 | MG |
Exchange Place Centre Jersey City, NJ | 1988/NAP | 86% | 748,005 | Confidential | 17,840 | May 2017 | 10.0 | $39.00 | MG |
Exchange Place Centre Jersey City, NJ | 1988/NAP | 86% | 748,005 | Confidential | 12,960 | May 2017 | 10.0 | $39.00 | MG |
Exchange Place Centre Jersey City, NJ | 1988/NAP | 86% | 748,005 | Confidential | 20,221 | April 2017 | 10.8 | $37.50 | MG |
Harborside Financial Center 5 Jersey City, NJ | 2002/NAP | 94% | 977,225 | Ishi Systems, Inc. | 12,365 | March 2013 | 10.6 | $37.00 | MG |
Harborside Plaza Two Jersey City, NJ | 1930/1990 | 63% | 900,000 | Zurich Insurance | 64,414 | August 2016 | 15.0 | $41.00 | MG |
Harborside Plaza Two Jersey City, NJ | 1930/1990 | 63% | 900,000 | Cardinia Real Estate | 79,771 | July 2016 | 15.0 | $37.50 | MG |
Newport Office Tower Jersey City, NJ | 1990/NAP | 77% | 1,099,768 | FX Direct Dealer LLC | 15,912 | March 2016 | 10.7 | $35.00 | MG |
Newport Office Tower Jersey City, NJ | 1990/NAP | 77% | 1,099,768 | Golden Pear Funding | 3,842 | April 2016 | 6.3 | $38.00 | MG |
Source:Appraisal and a third-party market report.
This is not a research report and was not prepared by any Underwriter’s research department. Please see additional important information and qualifications at the end of this Term Sheet.
T-99
| MSC 2016-UBS12 | 101 Hudson Street |
Operating History and Underwritten Net Cash Flow. The following table presents certain information relating to the historical operating performance and Underwritten Net Cash Flow at the 101 Hudson Street Property:
| Cash Flow Analysis | ||||||
| 2013(1) | 2014(1) | 2015(1) | 7/31/2016 TTM(1) | UW(1)(2) | UW PSF | |
| Base Rent | $28,311,298 | $29,284,205 | $30,453,201 | $31,975,694 | $38,568,810(3) | $28.75 |
| Grossed Up Vacant Space | $0 | $0 | $0 | $0 | $2,098,929 | $1.56 |
| Straight Line Average Rent | $0 | $0 | $0 | $0 | $1,106,341(4) | $0.82 |
| Percentage Rent | $381,069 | $154,426 | $209,962 | $139,808 | $204,500 | $0.15 |
| Free Rent Adjustment | ($4,153,515) | ($319,825) | ($822,438) | ($1,383,837) | $0 | $0.00 |
| Total Reimbursables | $7,856,996 | $8,407,351 | $7,696,085 | $7,964,296 | $9,584,061 | $7.14 |
| Other Income | $805,904 | $702,221 | $1,034,201 | $1,264,812 | $1,346,861 | $1.00 |
| Less Vacancy & Credit Loss | $0 | $0 | $0 | $0 | ($2,098,929)(5) | ($1.56) |
| Effective Gross Income | $33,201,752 | $38,228,378 | $38,571,011 | $39,960,773 | $50,810,573 | $37.87 |
| Total Operating Expenses | $16,691,035 | $17,641,097 | $17,274,342 | $16,855,969 | $18,681,652 | $13.92 |
| Net Operating Income | $16,510,717 | $20,587,281 | $21,296,669 | $23,104,804 | $32,128,921 | $23.95 |
| TI/LC | $0 | $0 | $0 | $0 | $2,771,771 | $2.07 |
| Capital Expenditures | $0 | $0 | $0 | $0 | $281,746 | $0.21 |
| Net Cash Flow | $16,510,717 | $20,587,281 | $21,296,669 | $23,104,804 | $29,075,403 | $21.67 |
| Occupancy | 83.4% | 87.0% | 90.2% | 98.3%(5)(6) | 95.0% | |
| NOI DSCR(7) | 2.09x | 2.61x | 2.70x | 2.92x | 4.07x | |
| NCF DSCR(7) | 2.09x | 2.61x | 2.70x | 2.92x | 3.68x | |
| NOI Debt Yield(7) | 6.6% | 8.2% | 8.5% | 9.2% | 12.9% | |
| NCF Debt Yield(7) | 6.6% | 8.2% | 8.5% | 9.2% | 11.6% | |
| (1) | The increase in Base Rent and Effective Gross Income from 2013 through U/W was due to continued increases in occupancy from 83.4% as of December 31, 2013 to 98.3% as of September 21, 2016, along with free rent burn-off and the Bank of America expansion, among others. |
| (2) | National Union Fire Insurance is not currently in occupancy of 139,536 SF (10.4% of net rentable area). Additionally, Tullett Prebon Holdings Corp. is not currently in occupancy of 37,387 SF (2.8% of net rentable area). Current occupancy excluding these spaces is 85.1%, and the U/W NOI DSCR and U/W NCF DSCR are 3.47x and 3.12x, respectively, and the U/W NOI DY and U/W NCF DY are 11.0% and 9.9%, respectively. |
| (3) | UW Base Rent includes contractual rent steps through October 2017 totaling $1,648,952. |
| (4) | U/W Straight Line Average Rent represents the average rent over the lease term in excess of the U/W Base Rent for the following tenants, all of which are rated investment grade by Fitch, Moody’s and/or S&P: Federal Farm Credit Banks, United States Fire Insurance, Berkley Insurance Company, MCI Communications Services, Jeffries LLC and Bank of America. |
| (5) | The underwritten economic vacancy is 5.0%. The 101 Hudson Street Property was 98.3% leased as of September 21, 2016. |
| (6) | Occupancy as of September 21, 2016. |
| (7) | The debt service coverage ratios and debt yields shown are based on the 101 Hudson Street Whole Loan. |
Escrows and Reserves. The loan documents provide for an upfront escrow at closing in the amount of $104,000 for deferred maintenance, $16,270,684 for tenant improvements and leasing commissions (“TI/LCs”) associated with eleven tenants, and $2,779,153 for rent concessions related to six tenants. The loan documents allow for the borrower to post a $19,049,837 upfront letter of credit, which encompasses the combined amount of the aforementioned reserves in lieu of any cash deposits, which is expected to happen after the 101 Hudson Street Whole Loan origination. The loan documents do not require monthly deposits for real estate taxes, TI/LCs and replacement reserves as long as (i) no event of default has occurred and is continuing and (ii) the debt service coverage ratio is at least 1.25x. The loan documents do not require monthly deposits for insurance premiums as long as (i) no event of default has occurred and is continuing; (ii) the debt service coverage ratio is at least 1.25x; (iii) the 101 Hudson Street Property is insured via an acceptable blanket insurance policy; and (iv) the borrower provides the lender with timely proof of payment of insurance premiums and renewals.
Lockbox and Cash Management. The 101 Hudson Street Whole Loan requires a lender-controlled lockbox account, which is already in place, and that the borrower directs all tenants to pay their rents directly to such lockbox account. The loan documents also require that all rents received by the borrower or the property manager be deposited into the lockbox account within one business days of receipt. Prior to the occurrence of a Cash Trap Event Period (as defined below), all funds are required to be distributed to the borrower. During a Cash Trap Event Period, all excess cash flow is required to be swept to a lender-controlled cash management account.
A “Cash Trap Event Period” will commence upon the earlier of (i) the occurrence and continuance of an event of default or (ii) the debt service coverage ratio being less than 1.25x. A Cash Trap Event Period will end, with respect to clause (i), upon the cure of such event of default; or, with respect to clause (ii), upon the debt service coverage ratio being at least 1.25x for two consecutive calendar quarters.
Additional Secured Indebtedness (not including trade debts). The 101 Hudson Street Property also secures the 101 Hudson Street Non-ServicedPari Passu Companion Loans, which have an aggregate Cut-off Date principal balance of $212,750,000. The promissory notes evidencing the 101 Hudson Street Non-ServicedPari Passu Companion Loans include Promissory Notes A-1-1 and A-4 in the original principal amounts of $53,500,000 and $19,000,000, which are expected to be contributed to the MSC 2016-BNK2 securitization trust, Promissory Note A-1-2 in the original principal amount of $16,500,000, which is currently held by Wells Fargo Bank, National Association, or an affiliate thereof, and expected to be contributed to one or more future securitization trusts or may be otherwise transferred at any time, Promissory Note A-2 in the original principal amount of $67,500,000 which was contributed to the WFCM 2016-C36 transaction, and Promissory Note A-5 in the original principal amount of $56,250,000, which is expected to be contributed to the CGCMT 2016-C3 securitization trust. The 101 Hudson Street Non-ServicedPari Passu Companion Loans accrue interest at the same rate as the 101 Hudson Street Mortgage Loan. The 101 Hudson Street Mortgage Loan is entitled to payments of interest and principal on apro rata andpari passu basis with the 101 Hudson Street Non-ServicedPari Passu Companion Loans. The holders of the 101 Hudson Street Mortgage
This is not a research report and was not prepared by any Underwriter’s research department. Please see additional important information and qualifications at the end of this Term Sheet.
T-100
| MSC 2016-UBS12 | 101 Hudson Street |
Loan and the 101 Hudson Street Non-ServicedPari Passu Companion Loans have entered into a co-lender agreement which sets forth the allocation of collections on the 101 Hudson Street Whole Loan. See “Description of the Mortgage Pool—The Whole Loans—The Non-Serviced Pari Passu Whole Loans” in the Preliminary Prospectus.
Mezzanine Loan and Preferred Equity. Not permitted.
Release of Property. Not permitted.
Terrorism Insurance.The 101 Hudson Street Whole Loan documents require that the “all risk” insurance policy required to be maintained by the borrower provide coverage for terrorism in an amount equal to the full replacement cost of the 101 Hudson Street Property, as well as business interruption insurance covering no less than the 18-month period following the occurrence of a casualty event, together with a six-month extended period of indemnity and subject to a cap equal to two times the premium for the “Special Form” or “All Risks” property insurance required under the 101 Hudson Street Whole Loan documents on a stand-alone basis.
This is not a research report and was not prepared by any Underwriter’s research department. Please see additional important information and qualifications at the end of this Term Sheet.
T-101
| MSC 2016-UBS12 | U-Haul AREC 23 Portfolio |
Mortgage Loan No. 8 – U-Haul AREC 23 Portfolio
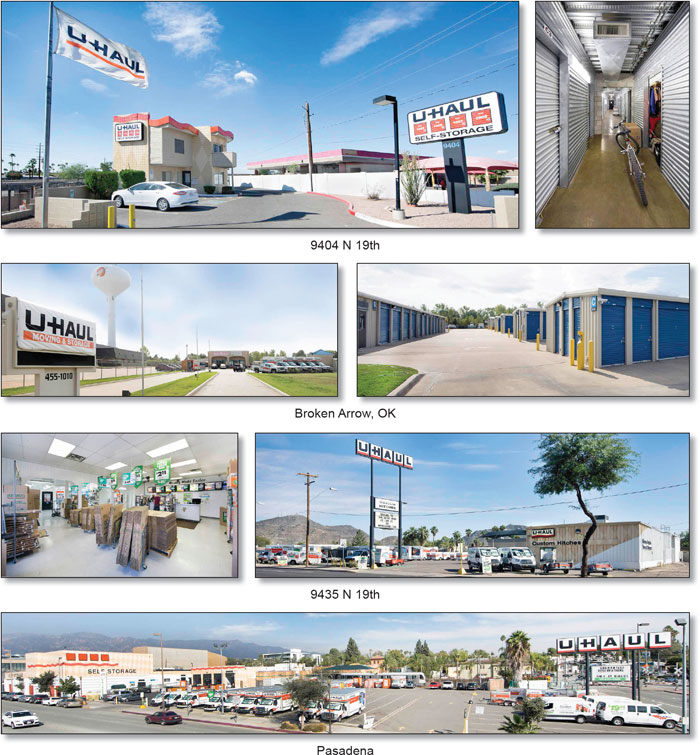
This is not a research report and was not prepared by any Underwriter’s research department. Please see additional important information and qualifications at the end of this Term Sheet.
T-102
| MSC 2016-UBS12 | U-Haul AREC 23 Portfolio |
Mortgage Loan No. 8 – U-Haul AREC 23 Portfolio

This is not a research report and was not prepared by any Underwriter’s research department. Please see additional important information and qualifications at the end of this Term Sheet.
T-103
| MSC 2016-UBS12 | U-Haul AREC 23 Portfolio |
| Mortgage Loan No. 8 – U-Haul AREC 23 Portfolio |
| Mortgage Loan Information | Property Information(4) | ||||||
| Mortgage Loan Seller: | UBS AG | Single Asset/Portfolio: | Portfolio | ||||
| Original Balance: | $36,240,000 | Location: | Various | ||||
| Cut-off Date Balance: | $36,167,377 | General Property Type: | Self Storage | ||||
| % of Initial Pool Balance: | 4.4% | Detailed Property Type: | Self Storage | ||||
| Loan Purpose(1): | Recapitalization | Title Vesting: | Fee | ||||
| Sponsor: | AMERCO | Year Built/Renovated: | Various | ||||
| Mortgage Rate(2): | 3.7929% | Size: | 509,124 SF 4,649 Units | ||||
| Note Date: | 10/21/2016 | Cut-off Date Balance per SF/Unit: | $71 $7,780 | ||||
| First Payment Date: | 12/6/2016 | Maturity Date or ARD Balance per SF/Unit: | $51 $5,587 | ||||
| Anticipated Repayment Date: | 11/6/2026 | Property Manager(5): | Various (borrower-related) | ||||
| Maturity Date: | 11/6/2041 | ||||||
| Original Term to ARD: | 120 months | ||||||
| Original Amortization Term: | 300 months | Underwriting and Financial Information(4) | |||||
| IO Period: | 0 months | UW NOI: | $3,905,211 | ||||
| Seasoning: | 1 month | UW NOI Debt Yield: | 10.8% | ||||
| Prepayment Provisions: | LO (25); DEF/YM1 (91); O (4) | UW NOI Debt Yield at Maturity or ARD: | 15.0% | ||||
| Lockbox/Cash Mgmt Status: | Soft/Springing | UW NCF DSCR: | 1.72x | ||||
| Additional Debt Type: | N/A | Most Recent NOI: | $4,147,703 (8/31/2016 TTM) | ||||
| Additional Debt Balance: | N/A | 2nd Most Recent NOI: | $3,958,354 (3/31/2016 TTM) | ||||
| Future Debt Permitted (Type): | No (N/A) | 3rd Most Recent NOI(6): | $1,969,794 (3/31/2015 TTM) | ||||
| Reserves(3) | Most Recent Occupancy(7): | 91.8% (10/17/2016) | |||||
| Type | Initial | Monthly | Cap | 2nd Most Recent Occupancy(7): | 89.4% (3/31/2016 TTM) | ||
| RE Tax: | $264,482 | Springing | N/A | 3rd Most Recent Occupancy(6)(7): | 86.6% (3/31/2015 TTM) | ||
| Insurance: | $0 | Springing | N/A | Appraised Value (as of)(8): | $67,830,000 (Various) | ||
| Deferred Maintenance: | $172,714 | $0 | N/A | Cut-off Date LTV Ratio(8): | 53.3% | ||
| Recurring Replacements: | $38,188 | Springing | $38,188 | LTV Ratio at Maturity Date or ARD(8): | 38.3% | ||
| Sources and Uses | ||||||
| Sources | Proceeds | % of Total | Uses | Proceeds | % of Total | |
| Loan Amount: | $36,240,000 | 100.0% | Reserves: | $475,384 | 1.3% | |
| Closing Costs: | $853,430 | 2.4% | ||||
| Return of Equity(1): | $34,911,187 | 96.3% | ||||
| Total Sources: | $36,240,000 | 100.0% | Total Uses: | $36,240,000 | 100.0% | |
| (1) | At the time of the U-Haul Portfolio Mortgage Loan origination, the U-Haul Portfolio Borrowers had no outstanding mortgage debt associated with the U-Haul Portfolio Properties. |
| (2) | The U-Haul Portfolio Mortgage Loan has an anticipated repayment date of November 6, 2026 and a maturity date of November 6, 2041. Beginning on the anticipated repayment date through the maturity date, the U-Haul Portfolio Mortgage Loan will accrue interest at aper annum note rate equal to the greater of (a) 3.0000% above the initial interest rate and (b) 3.0000% above the 10-year treasury yield as of the ARD plus 1.8300%, provided that in no event will the interest rate exceed 8.7929%. See “—The Mortgage Loan” below for further discussion. |
| (3) | See “—Escrows and Reserves” below for further discussion of reserve requirements. |
| (4) | Property Information and Underwriting and Financial Information are based on the combination or sum of all 10 self storage facilities that comprise the U-Haul Portfolio Properties. |
| (5) | U-Haul Co. of Arizona; U-Haul Co. of California; U-Haul Co. of Florida; U-Haul Co. of Georgia; U-Haul Co. of Hawaii, Inc.; U-Haul Co. of Iowa, Inc.; U-Haul Co. of Michigan; U-Haul Co. of Oklahoma, Inc.; U-Haul Co. of Tennessee. |
| (6) | The U-Haul Moving & Storage of Kakaako (33,672 SF), U-Haul at 19th Ave (75,890 SF), U-Haul Moving & Storage on Highway 64 (75,990 SF), U-Haul Moving & Storage of Broken Arrow (46,500 SF), U-Haul Moving & Storage of Houghton (110,020 SF) and U-Haul Storage of Spring Hill on Mariner (20,050 SF) properties were acquired in December 2014, June 2014, February 2015, October 2014, September 2014 and March 2013, respectively. As such, historical operating performance is not available for these U-Haul Portfolio Properties. |
| (7) | Occupancy rates are based on number of units. Based on SF, most recent occupancy is 93.4% as of October 17, 2016. |
| (8) | The Appraised Value (as of) represents the “as-is portfolio value” conclusion. The sum of the “as-is” appraised values on a stand-alone basis is $62,230,000. The Cut-off Date LTV Ratio and Maturity Date LTV Ratio based on the stand-alone appraised “as-is” value are 58.1% and 41.7%, respectively. |
The Mortgage Loan. The eighth largest mortgage loan (the “U-Haul Portfolio Mortgage Loan”) is evidenced by a promissory note in the original principal amount of $36,240,000 that is secured by a first priority fee mortgage encumbering 10 self storage facilities, comprising 4,649 units, 120 recreational vehicle (“RV”) parking spaces, and 50 U-Box units located across nine states (collectively, the “U-Haul Portfolio Properties”). The proceeds of the U-Haul Portfolio Mortgage Loan were used to fund reserves, pay closing costs, and return equity to the U-Haul Portfolio Borrowers. The self storage facilities were purchased by the U-Haul Portfolio Borrowers, or their affiliates, on various dates from 1977 to 2015, for a total purchase price of approximately $25.7 million. The most recent prior financings of the U-Haul Moving & Storage of Kakaako, U-Haul Moving & Storage on Highway 64 and U-Haul Moving & Storage of Waterfalls properties were included in the GECMC 2006-C1, LBUBS 2006-C7 and MLCFC 2007-7 transactions, respectively. The most recent prior financing of the U-Haul at 19th Ave property was included in the CSFB 2005-C4 transaction and the JPMCC 2008-C2 transaction.
This is not a research report and was not prepared by any Underwriter’s research department. Please see additional important information and qualifications at the end of this Term Sheet.
T-104
| MSC 2016-UBS12 | U-Haul AREC 23 Portfolio |
The U-Haul Portfolio Mortgage Loan has an anticipated repayment date of November 6, 2026 (the “ARD”) and final maturity date of November 6, 2041. Prior to the ARD, the U-Haul Portfolio Mortgage Loan accrues interest at a fixed rate of 3.7929% (the “Initial Interest Rate”) and requires payments of principal and interest in a set monthly amount (“Regular Monthly Debt Service Payment Amount”). In the event the U-Haul Portfolio Mortgage Loan is not repaid in full on or before the ARD, interest accrues on the outstanding principal balance at the Adjusted Interest Rate. The “Adjusted Interest Rate” is equal to the greater of (i) 3.0000% above the 10-year treasury yield as of the ARD plus 1.8300%, provided that in no event will the interest rate exceed 8.7929% and (ii) 3.0000% above the Initial Interest Rate. Following the ARD, the U-Haul Portfolio Borrowers are required to continue to make payments of interest and principal in the Regular Monthly Debt Service Payment Amount on each monthly payment date thereafter up to and including the maturity date. Interest accrued at the excess of the Adjusted Interest Rate over the Initial Interest Rate and not paid will remain an obligation of the U-Haul Portfolio Borrowers, but will be deferred (such accrued interest, the “Accrued Interest”) and is required to be paid on the maturity date to the extent not sooner paid pursuant to the loan documents. If the U-Haul Portfolio Mortgage Loan is not repaid in full on or prior to the ARD, from and after the occurrence of the ARD and provided no event of default under the U-Haul Portfolio Mortgage Loan has occurred and is continuing, all excess cash flow is required to be applied to reduce the outstanding principal balance of the U-Haul Portfolio Mortgage Loan, with any remaining amounts to be applied towards Accrued Interest.
The Borrowers and the Sponsor. The borrowers are U-Haul Co. of Florida 23, LLC, UHIL 23, LLC and AREC 23, LLC (collectively, the “U-Haul Portfolio Borrowers”), each of which is a single-purpose Delaware limited liability company structured to be bankruptcy-remote, each with two independent directors. The U-Haul Portfolio Borrowers are 100% owned by AMERCO, a Nevada Corporation (NASDAQ: UHAL), which serves as the holding company for U-Haul International, Inc. (“U-Haul”) and is the sponsor and nonrecourse carve-out guarantor. AMERCO is a do-it-yourself moving company with a network of approximately 1,700 company-operated retail moving stores and 19,500 independent U-Haul dealers throughout North America. U-Haul is one of the largest North American operators of self storage facilities and has been serving do-it-yourself movers since its founding in 1945. According to its annual report for the fiscal year ending March 31, 2016, AMERCO’s U-Haul segment reported self storage revenue of approximately $247.9 million in fiscal year 2016, an increase of 17.4% from fiscal year 2015’s reported self storage revenue of approximately $211.1 million. U-Haul operates more than 536,000 self storage units, comprising approximately 47.9 million SF of storage space with approximately 1,360 locations in 49 U.S. states and 10 Canadian provinces as of March 31, 2016. U-Haul locations provide customers with a variety of moving and storage supplies including self storage, packing supplies and truck and trailer rentals with a rental fleet of approximately 139,000 trucks, 108,000 trailers and 38,000 towing devices as of March 31, 2016. An affiliate of the sponsor is currently subject to litigation. See “—Description of the Mortgage Pool—Litigation and Other Considerations” in the Preliminary Prospectus.
The Properties.The U-Haul Portfolio Properties are comprised of 10 self storage facilities located across nine states with a total of 4,649 units and 120 RV parking spaces totaling approximately 509,124 SF of space (excluding space associated with the 120 RV parking spaces). The U-Haul Portfolio Properties also contain 50 U-Box units, portable storage containers that are used for moving and storage. The U-Haul Portfolio Properties were constructed between 1926 and 2014 and, as of October 17, 2016, were 93.4% occupied based on SF. The top five states by Cut-off Date allocated loan amount include Hawaii (26.3%), Arizona (13.7%), Georgia (11.4%), Tennessee (9.7%) and Oklahoma (9.1%).
The five largest self storage facilities comprising the U-Haul Portfolio Properties by Cut-off Date allocated loan amount are described below:
U-Haul Moving & Storage of Kakaako. The U-Haul Moving & Storage of Kakaako property is a 33,672 SF, 902-unit Class B+ self storage facility consisting of one two-story building located in Honolulu, Honolulu County, Hawaii, approximately 1.1 miles southeast of the Honolulu central business district (“CBD”). Situated on a 0.68-acre site, improvements were originally constructed in 1932 and converted to self storage use in 1999. Of the 902 units at the property, 894 units are climate-controlled and eight units are non-climate controlled. The property is an all-enclosed facility with amenities that include 24-hour video surveillance, keypad access, tall/slim lockers for surf board storage and on-site management. According to a third party market research report, the trade area consisting of a one-, three- and five-mile radius of the property contained a population of 42,719, 210,477 and 321,785, respectively, with an estimated average household income of $77,108, $78,723 and $86,801, respectively, as of 2016.
U-Haul at 19th Ave. The U-Haul at 19th Ave property is a 75,890 SF, 616-unit Class B+ self storage facility with 8 U-Box units and consists of 17 one- and two-story buildings located in Phoenix, Maricopa County, Arizona, approximately 10.3 miles north of the Phoenix CBD. The U-Haul at 19th Ave property is located on two non-contiguous sites within a quarter mile of each other, along the same street; the storage facility and a leasing office with a manager apartment. Situated on a 4.69-acre site, the improvements were constructed in stages in 1972, 1973 and 1989. Of the 616 units at the property, 575 units are non-climate controlled and 41 units are climate-controlled. Amenities at the property include gated entry, electronic keypad access, video surveillance, onsite management and exterior site lighting. According to a third party market research report, the trade area within a one-, three- and five-mile radius of the property contained a population of 20,094, 149,882 and 407,040, respectively, with an estimated average household income of $43,409, $56,688 and $60,946, respectively, as of 2016.
U-Haul Moving & Storage on Highway 64. The U-Haul Moving & Storage on Highway 64 property is a 75,990 SF, 510-unit Class B self storage facility with 65 RV parking spaces and is located in Memphis, Shelby County, Tennessee, approximately 16.6 miles northeast of the Memphis CBD. The property consists of 11 one-story buildings and has an additional 17,746 SF for the leasing office and other common areas. Situated on a 6.05-acre site, the improvements were originally constructed in 1999. Of the 510 units at the property, 418 units are non-climate controlled and 92 units are climate-controlled. Amenities at the property include climate controlled units, 24-hour surveillance, on-site manager, motion detectors and individually alarmed units linked to gate access codes. According to a third party market research report, the trade area within a one-, three- and five-mile radius of the property contained a population of 8,587, 66,289 and 174,439, respectively, with an estimated average household income of $62,088, $75,487 and $79,793, respectively, as of 2016.
U-Haul Moving & Storage of Broken Arrow. The U-Haul Moving & Storage of Broken Arrow property is a 46,500 SF, 409-unit Class A self storage facility with 50 RV parking spaces and is located in Broken Arrow, Tulsa County, Oklahoma, approximately 17.3 miles southeast of the Tulsa CBD. The property consists of nine one-story buildings and has an additional 2,322 SF leasing office and a manager apartment. Situated on a 3.99-acre site (with an additional 0.87 acres of excess land to the north and 8.54 acres of surplus land to the south, totaling 13.40 acres), the improvements were originally constructed in 2005. Of the 409 units at the property, 279 units are non-climate controlled and 130 units are climate-controlled. Amenities of the property include 24-hour surveillance, on-site manager, boxes and moving supplies, perimeter fencing and gate access codes. According to a third party market research report, the trade area within a one-, three- and five-mile radius of the property contained a population of 12,629, 56,192 and 123,247, respectively, with an estimated average household income of $72,315, $78,877 and $82,087, respectively, as of 2016.
U-Haul Moving & Storage of Pasadena. The U-Haul Moving & Storage of Pasadena property is a 9,222 SF, 182-unit Class B self storage facility with 21 U-Box units and is located in Pasadena, Los Angeles County, California, approximately 9.7 miles northeast of the Los Angeles CBD. The property consists of one two-story building and two one-story buildings and has an additional 800 SF leasing office and 750 SF manager apartment. Situated on a
This is not a research report and was not prepared by any Underwriter’s research department. Please see additional important information and qualifications at the end of this Term Sheet.
T-105
| MSC 2016-UBS12 | U-Haul AREC 23 Portfolio |
1.41-acre site, the improvements were originally constructed in 1926 and 1951 and converted to self storage in 1992. Of the 182 units at the property, 156 units are non-climate controlled and 26 units are climate-controlled. Amenities at the property include exterior lighting, controlled access by on-site management, and video surveillance. According to a third party market research report, the trade area within a one-, three- and five-mile radius of the property contained a population of 26,754, 221,285 and 584,009, respectively, with an estimated average household income of $112,686, $102,067 and $95,478, respectively, as of 2016.
The following tables present certain information relating to the U-Haul Portfolio Properties:
Property History
| |||||
| Property Name | Location | Cut-off Date ALA | Acquisition Date | Purchase Price | Capital Expenditures |
| UHMS of Kakaako | Honolulu, HI | $9,500,922 | Dec 2014 | $4,559,546 | $163,254 |
| UH at 19th Avenue | Phoenix, AZ | $4,940,080 | Jun 2014 | $3,826,421 | $85,777 |
| UHMS on Highway 64 | Memphis, TN | $3,512,946 | Feb 2015 | $3,858,750 | $69,892 |
| UHMS of Broken Arrow | Broken Arrow, OK | $3,303,367 | Oct 2014 | $3,050,000 | $64,772 |
| UHMS of Pasadena | Pasadena, CA | $2,934,108 | Jan 1977 | $1,181,245 | NAV |
| UHMS of Houghton | Various, MI(1) | $2,744,489 | Sep 2014 | $3,064,000 | $115,675 |
| UHMS of Waterfalls | Various, IA(2) | $2,574,830 | Jun 1983 & Jun 2014 | $2,165,153 | $963,528 |
| UHS of Spring Hill on Mariner | Spring Hill, FL | $2,524,930 | Mar 2013 | $1,553,298 | $127,259 |
| UHMS of Oakwood | Oakwood, GA | $2,445,090 | Aug 2012 | $1,450,000 | $683,415 |
| UHMS of Augusta West | Augusta, GA | $1,686,613 | Oct 2012 | $1,040,000 | $142,414 |
| Total/Wtd. Avg. | $36,167,377 | $25,748,414 | $2,415,985 | ||
| (1) | UHMS of Houghton is located at five different sites in Houghton, Hancock, Calumet, Dodgeville and Lake Linden, Michigan. |
| (2) | UHMS of Waterfalls is located at two different sites in Waterloo and Cedar Falls, Iowa. |
| Property Summary | ||||||||||
| Property Name | Location | Year Built/ Renovated | % of Cut-off | Self Storage Units(1)(2) | Climate- Controlled Units %(1) | RV Parking | U-Box Storage Units | GLA (SF)(1)(2) | Occ. Based | % of Total NOI(4) |
| UHMS of Kakaako | Honolulu, HI | 1932/1999 | 26.3% | 902 | 99.1% | 0 | 0 | 33,672 | 85.5% | 22.7% |
| UH at 19th Avenue | Phoenix, AZ | 1972;1973;1989/N/A | 13.7% | 616 | 6.7% | 0 | 8 | 75,890 | 97.1% | 12.5% |
| UHMS on Highway 64 | Memphis, TN | 1999/N/A | 9.7% | 510 | 18.0% | 65 | 0 | 75,990 | 96.1% | 10.4% |
| UHMS of Broken Arrow | Broken Arrow, OK | 2005/N/A | 9.1% | 409 | 31.8% | 50 | 0 | 46,500 | 94.9% | 9.9% |
| UHMS of Pasadena | Pasadena, CA | 1926;1951/1992 | 8.1% | 182 | 14.3% | 0 | 21 | 9,222 | 94.6% | 8.6% |
| UHMS of Houghton | Various, MI(5) | 1991/2013 | 7.6% | 648 | 8.3% | 0 | 0 | 110,020 | 87.6% | 9.1% |
| UHMS of Waterfalls | Various, IA(6) | 1961;1977;2014/N/A | 7.1% | 615 | 0.0% | 0 | 10 | 75,511 | 94.1% | 7.9% |
| UHS of Spring Hill on Mariner | Spring Hill, FL | 2004/N/A | 7.0% | 192 | 75.0% | 5 | 0 | 20,050 | 98.8% | 6.8% |
| UHMS of Oakwood | Oakwood, GA | 2007/N/A | 6.8% | 320 | 100.0% | 0 | 11 | 28,019 | 97.0% | 6.9% |
| UHMS of Augusta West | Augusta, GA | 2007/N/A | 4.7% | 255 | 20.4% | 0 | 0 | 34,250 | 95.8% | 5.1% |
| Total/Wtd. Avg. | 100.0% | 4,649 | 37.7% | 120 | 50 | 509,124 | 93.4% | 100.0% | ||
| (1) | Information is based on the underwritten rent roll. |
| (2) | Self Storage Units and GLA (SF) exclude retail space, U-Box storage units and RV parking spaces. |
| (3) | Occ. Based on Total SF is as of October 17, 2016 and is based on SF. Based on number of units, occupancy is 91.8%. |
| (4) | % of Total NOI is based on 8/31/2016 TTM. |
| (5) | UHMS of Houghton is located at five different sites in Houghton, Hancock, Calumet, Dodgeville and Lake Linden, Michigan. |
| (6) | UHMS of Waterfalls is located at two different sites in Waterloo and Cedar Falls, Iowa. |
This is not a research report and was not prepared by any Underwriter’s research department. Please see additional important information and qualifications at the end of this Term Sheet.
T-106
| MSC 2016-UBS12 | U-Haul AREC 23 Portfolio |
| Property Summary by State | |||||||||||
| State | Cut-off Date Mortgage Loan Balance | % of Cut-off | Appraised Value | Number of Properties | Self Storage Units(1)(2) | Climate- Controlled Units %(1) | RV Parking | U-Box Storage Units | Occ. Based on Total SF(1)(3) | GLA (SF)(1)(2) | % of Total NOI(4) |
| Hawaii | $9,500,922 | 26.3% | 16,350,000 | 1 | 902 | 99.1% | 0 | 0 | 85.5% | 33,672 | 22.7% |
| Arizona | $4,940,080 | 13.7% | 8,500,000 | 1 | 616 | 6.7% | 0 | 8 | 97.1% | 75,890 | 12.5% |
| Georgia | $4,131,704 | 11.4% | 7,100,000 | 2 | 575 | 64.7% | 0 | 11 | 96.3% | 62,269 | 12.0% |
| Tennessee | $3,512,946 | 9.7% | 6,040,000 | 1 | 510 | 18.0% | 65 | 0 | 96.1% | 75,990 | 10.4% |
| Oklahoma | $3,303,367 | 9.1% | 5,680,000 | 1 | 409 | 31.8% | 50 | 0 | 94.9% | 46,500 | 9.9% |
| California | $2,934,108 | 8.1% | 5,050,000 | 1 | 182 | 14.3% | 0 | 21 | 94.6% | 9,222 | 8.6% |
| Michigan | $2,744,489 | 7.6% | 4,720,000 | 1 | 648 | 8.3% | 0 | 0 | 87.6% | 110,020 | 9.1% |
| Iowa | $2,574,830 | 7.1% | 4,440,000 | 1 | 615 | 0.0% | 0 | 10 | 94.1% | 75,511 | 7.9% |
| Florida | $2,524,930 | 7.0% | 4,350,000 | 1 | 192 | 75.0% | 5 | 0 | 98.8% | 20,050 | 6.8% |
| Total/Wtd. Avg. | $36,167,377 | 100.0% | $67,830,000(5) | 10 | 4,649 | 37.7% | 120 | 50 | 93.4% | 509,124 | 100.0% |
| (1) | Information is based on the underwritten rent roll. |
| (2) | Self Storage Units and GLA (SF) exclude retail space, U-Box storage units and RV parking spaces. |
| (3) | Occ. Based on Total SF is as of October 17, 2016 and is based on SF. Based on number of units, occupancy is 91.8%. |
| (4) | % of Total NOI is based on 8/31/2016 TTM. |
| (5) | The Total Appraised Value represents the “as-is portfolio value” conclusion. The sum of the “as-is” values on a stand-alone basis is $62,230,000. |
The Market. According to a third party market research report, in 2015 the United States self storage market encompassed approximately 51,476 self storage facilities, totaling approximately 2.6 billion SF and approximately 24.6 million units. U-Haul is the third largest self storage operator according to a third party market research report. The customer base for self storage is broken down into four categories: residential (70.0%), commercial (17.5%), student (6.3%) and military (6.2%). The average occupancy rate of all self storage facilities in the U.S. was 89.1% in 2014, the second highest reported average over the last 17 years, with the highest occupancy rate of 89.9% reported in 1994. The below table depicts market information compared to the U-Haul Portfolio Properties and local demographics.
The following table presents certain market information relating to the U-Haul Portfolio Properties:
| Market and Portfolio Demographic Profile | ||||||||
| Market Comparables(1) | 5-Mile Radius(2) | |||||||
| Property Name | Monthly Rent Per Unit(3)(4) | Monthly Rent PSF(3) | Occupancy(3) | Monthly Rent Per Unit(4) | Monthly Rent PSF | Economic Occupancy | 2016 Population | Average Household Income |
| UHMS of Kakaako | $121 | $3.17 | 85.5% | $122 | $3.18 | 85.0% | 321,785 | $86,801 |
| UH at 19th Avenue | $96 | $0.78 | 97.1% | $96 | $0.79 | 95.0% | 407,040 | $60,946 |
| UHMS on Highway 64 | $98 | $0.66 | 96.1% | $94 | $0.63 | 94.0% | 174,439 | $79,793 |
| UHMS of Broken Arrow | $100 | $0.87 | 94.9% | $100 | $0.87 | 95.0% | 123,247 | $82,087 |
| UHMS of Pasadena | $136 | $2.69 | 94.6% | $136 | $2.69 | 93.0% | 584,009 | $95,478 |
| UHMS of Houghton | $95 | $0.55 | 87.6% | $93 | $0.55 | 85.0% | 18,994(5) | $55,268(5) |
| UHMS of Waterfalls | $78 | $0.62 | 94.1% | $72 | $0.58 | 93.0% | 100,744(6) | $57,294(6) |
| UHS of Spring Hill on Mariner | $115 | $1.10 | 98.8% | $118 | $1.13 | 92.0% | 113,651 | $51,231 |
| UHMS of Oakwood | $71 | $0.81 | 97.0% | $70 | $0.81 | 93.0% | 63,726 | $58,280 |
| UHMS of Augusta West | $96 | $0.72 | 95.8% | $97 | $0.73 | 93.0% | 149,549 | $62,402 |
| Total/Wtd. Avg.(7) | $100 | $0.90 | 93.4% | $98 | $0.89 | 90.8% | 202,466 | $69,462 |
| (1) | Information is based on the appraisals dated August 23, 2016 to September 8, 2016. |
| (2) | Information is based on third party market research reports. |
| (3) | Information based on the underwritten rent roll. Occupancy is based on SF. Based on number of units, occupancy is 91.8%. |
| (4) | Monthly Rent Per Unit excludes retail space, U-Box storage units and RV parking spaces. |
| (5) | 2016 Population and Average Household income is based on the 46705 State Highway M26, Houghton, Michigan site. |
| (6) | 2016 Population and Average Household income is based on the 3633 University Avenue, Waterloo, Iowa site. |
| (7) | Wtd. Avg. is based on total units or total SF, as applicable, at each property. |
This is not a research report and was not prepared by any Underwriter’s research department. Please see additional important information and qualifications at the end of this Term Sheet.
T-107
| MSC 2016-UBS12 | U-Haul AREC 23 Portfolio |
Operating History and Underwritten Net Cash Flow. The following table presents certain information relating to the combined historical operating performance and the Underwritten Net Cash Flow at the U-Haul Portfolio Properties:
| Cash Flow Analysis | ||||||||||||
| 3/31/2014 TTM(1) | 3/31/2015 TTM(1) | 3/31/2016 TTM | 8/31/2016 TTM | UW | UW PSF(2) | |||||||
| Base Rent | $996,801 | $2,635,023 | $4,851,346 | $5,041,987 | $5,850,958 | $11.49 | ||||||
| Other Income | $256,025 | $271,060 | $350,922 | $376,625 | $376,625 | $0.74 | ||||||
| Less Vacancy & Credit Loss | $0 | $0 | $0 | $0 | ($808,971) | ($1.59) | ||||||
| Effective Gross Income | $1,252,826 | $2,906,084 | $5,202,268 | $5,418,612 | $5,418,612 | $10.64 | ||||||
| Total Operating Expenses | $740,327 | $936,289 | $1,243,914 | $1,270,909 | $1,513,401 | $2.97 | ||||||
| Net Operating Income | $512,499 | $1,969,794 | $3,958,354 | $4,147,703 | $3,905,211 | $7.67 | ||||||
| Capital Expenditures | $0 | $0 | $0 | $0 | $51,394 | $0.10 | ||||||
| Net Cash Flow | $512,499 | $1,969,794 | $3,958,354 | $4,147,703 | $3,853,817 | $7.57 | ||||||
| Occupancy %(3) | NAV | 86.6% | 89.4% | 91.8% | 86.2% | |||||||
| NOI DSCR | 0.23x | 0.88x | 1.76x | 1.85x | 1.74x | |||||||
| NCF DSCR | 0.23x | 0.88x | 1.76x | 1.85x | 1.72x | |||||||
| NOI Debt Yield | 1.4% | 5.4% | 10.9% | 11.5% | 10.8% | |||||||
| NCF Debt Yield | 1.4% | 5.4% | 10.9% | 11.5% | 10.7% | |||||||
| (1) | The U-Haul Moving & Storage of Kakaako (33,672 SF), U-Haul at 19th Ave (75,890 SF), U-Haul Moving & Storage on Highway 64 (75,990 SF), U-Haul Moving & Storage of Broken Arrow (46,500 SF), U-Haul Moving & Storage of Houghton (110,020 SF) and U-Haul Storage of Spring Hill on Mariner (20,050 SF) properties were acquired in December 2014, June 2014, February 2015, October 2014, September 2014 and March 2013, respectively. As such, historical operating performance is not available for these U-Haul Portfolio Properties. |
| (2) | UW PSF excludes retail space, U-Box storage units and RV parking spaces. |
| (3) | Occupancy % figures are based on number of units. 8/31/2016 TTM Occupancy % is as of October 17, 2016. UW Occupancy is based on underwritten economic occupancy. |
Escrows and Reserves.The U-Haul Portfolio Borrowers deposited $264,482 (an amount equal to six months of real estate taxes) in escrow for annual real estate taxes at loan origination and are required to escrow monthly (i) 1/12 of the annual estimated tax payments (unless an amount sufficient to pay taxes for six months is deposited into the real estate taxes and insurance reserve) and (ii) 1/12 of the annual insurance premiums (unless (a) the U-Haul Portfolio Borrowers maintain insurance under an acceptable blanket insurance policy or (b) an amount sufficient to pay insurance premiums for six months is deposited into the real estate taxes and insurance reserve, if the U-Haul Portfolio Properties are not covered by a blanket insurance policy). As of the date of loan origination, both the required (i) monthly tax escrow (due to the deposit of six months of real estate taxes) and (ii) monthly insurance escrow (due to the U-Haul Portfolio Properties being covered by a blanket insurance policy) are suspended. The U-Haul Portfolio Borrowers deposited $172,714 in escrow at loan origination for deferred maintenance. The U-Haul Portfolio Borrowers deposited $38,188 in escrow at loan origination for replacement reserves and are required to make monthly deposits of $6,365 for replacement reserves; provided, however, such monthly deposits are not required if the funds in such replacement reserve exceed $38,188.
Lockbox and Cash Management. A soft lockbox is in place with respect to the U-Haul Portfolio Mortgage Loan (i.e., the U-Haul Portfolio Borrowers and/or the property manager collect all rents, revenues, charges and other consideration and cause such amounts to be deposited into the lockbox account within one business day after the receipt thereof). The U-Haul Portfolio Mortgage Loan has springing cash management (i.e., the U-Haul Portfolio Mortgage Loan has cash management only after the initial occurrence of a Cash Sweep Period (as defined below)). Provided a Cash Sweep Period is not continuing, funds in the lockbox account are swept daily to an account designated by the U-Haul Portfolio Borrowers. Upon the occurrence and during the continuance of a Cash Sweep Period, funds in the lockbox account are transferred to the cash management account and applied on each monthly payment date in the order set forth in the U-Haul Portfolio Mortgage Loan agreement to pay debt service on the U-Haul Portfolio Mortgage Loan, to fund the required reserves deposits as described above under“—Escrows and Reserves,”to pay monthly operating expenses referenced in the annual budget (which is required to be approved by the lender during any Cash Sweep Period) and pay extraordinary operating expenses or capital expenses, in each case, greater than $25,000 not referenced in the annual budget and approved by the lender, and to disburse the remainder to an account to be held by the lender as additional security for the U-Haul Portfolio Mortgage Loan during the continuance of such Cash Sweep Period.
A “Cash Sweep Period” will occur upon (i) an event of default, (ii) any bankruptcy action involving, or insolvency of, the property manager, (iii) the debt service coverage ratio based on the trailing 12-month period falling below 1.15x for two consecutive calendar quarters, (iv) the U-Haul Portfolio Borrowers fail to provide timely evidence of payment of taxes or that the U-Haul Portfolio Properties are insured, or (v) the payment date that is three payment dates prior to the ARD, if the U-Haul Portfolio Mortgage Loan has not been repaid in full. A Cash Sweep Period will continue until, in regard to clause (i) above, the cure of such event of default and acceptance of such cure by the lender, in regard to clause (ii) above, the property manager is replaced with a qualified manager, in regard to clause (iii) above, the date the debt service coverage ratio based on the trailing 12-month period is at least 1.20x for four consecutive calendar quarters, or in regard to clause (iv) above, the U-Haul Portfolio Borrowers provide evidence of payment of taxes or that the U-Haul Portfolio Properties are insured.
Additional Secured Indebtedness (not including trade debts). Not permitted.
Mezzanine Loan and Preferred Equity.Not permitted.
Release of Property. If the portion of the U-Haul Moving & Storage of Houghton property located in Dodgeville, Michigan, can no longer be operated as it was as of the origination date because the use is no longer legal nonconforming or legal conforming, (i) the U-Haul Portfolio Borrowers are required to obtain the release of the U-Haul Moving & Storage of Houghton property located in Dodgeville, Michigan by paying an amount equal to (a) 110% of the allocated loan amount with respect to the Dodgeville, Michigan portion of the U-Haul Moving & Storage of Houghton property in an amount of approximately $295,944, plus (b) the pro rata amount of any accrued and unpaid interest on the U-Haul Portfolio Mortgage Loan, plus (c) the yield maintenance premium, less (d) any applicable net proceeds derived from the portion of the U-Haul Moving & Storage of Houghton property located in Dodgeville, Michigan and (ii) if the loan-to-value ratio immediately following the release is greater than 125%, (a) the principal balance of the U-Haul Portfolio Mortgage Loan must be paid down or (b) the lender must receive a REMIC opinion.
This is not a research report and was not prepared by any Underwriter’s research department. Please see additional important information and qualifications at the end of this Term Sheet.
T-108
| MSC 2016-UBS12 | U-Haul AREC 23 Portfolio |
Terrorism Insurance.The U-Haul Portfolio Borrowers are required to obtain insurance against acts of terrorism for loss resulting from perils and acts of terrorism in amounts and with terms and conditions applicable to commercial property, general liability, business income and umbrella liability insurance required pursuant to the U-Haul Portfolio Mortgage Loan documents.
This is not a research report and was not prepared by any Underwriter’s research department. Please see additional important information and qualifications at the end of this Term Sheet.
T-109
| MSC 2016-UBS12 | Greenwich Office Park |
Mortgage Loan No. 9 – Greenwich Office Park

This is not a research report and was not prepared by any Underwriter’s research department. Please see additional important information and qualifications at the end of this Term Sheet.
T-110
| MSC 2016-UBS12 | Greenwich Office Park |
Mortgage Loan No. 9 – Greenwich Office Park
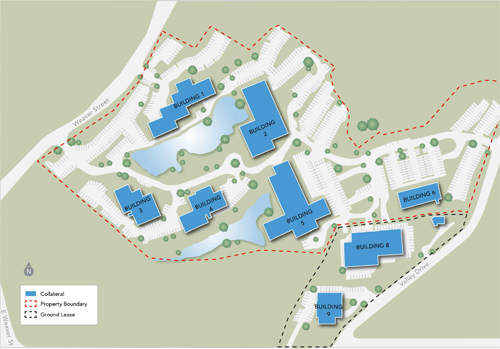
This is not a research report and was not prepared by any Underwriter’s research department. Please see additional important information and qualifications at the end of this Term Sheet.
T-111
| MSC 2016-UBS12 | Greenwich Office Park |
Mortgage Loan No. 9 – Greenwich Office Park
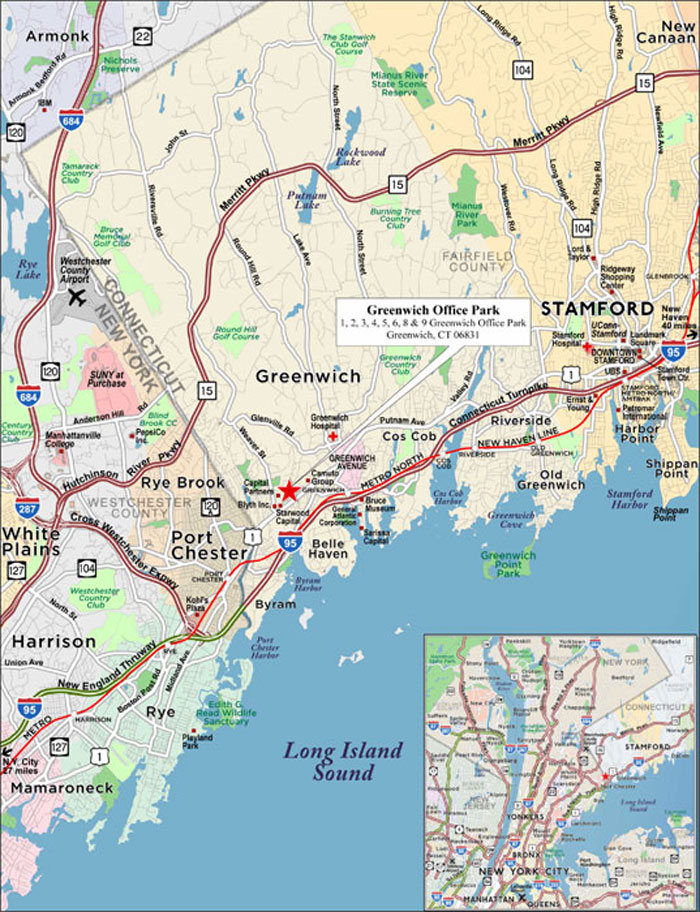
This is not a research report and was not prepared by any Underwriter’s research department. Please see additional important information and qualifications at the end of this Term Sheet.
T-112
| MSC 2016-UBS12 | Greenwich Office Park |
| Mortgage Loan No. 9 – Greenwich Office Park |
| Mortgage Loan Information | Property Information | ||||||
| Mortgage Loan Seller: | Natixis | Single Asset/Portfolio: | Single Asset | ||||
| Original Balance(1): | $33,000,000 | Location: | Greenwich, CT 06831 | ||||
| Cut-off Date Balance(1): | $33,000,000 | General Property Type: | Office | ||||
| % of Initial Pool Balance: | 4.0% | Detailed Property Type: | Suburban | ||||
| Loan Purpose: | Acquisition | Title Vesting: | Fee / Leasehold | ||||
| Sponsor: | John J. Fareri | Year Built/Renovated: | 1970-1978/2010-2016 | ||||
| Mortgage Rate: | 4.5540% | Size: | 379,861 SF | ||||
| Note Date: | 11/4/2016 | Cut-off Date Balance per SF(1): | $230 | ||||
| First Payment Date: | 12/5/2016 | Maturity Date Balance per SF(1): | $230 | ||||
| Maturity Date: | 11/5/2021 | Property Manager: | Greenwich Premier Services, Inc. (borrower-related) | ||||
| Original Term to Maturity: | 60 months | ||||||
| Original Amortization Term: | 0 months | ||||||
| IO Period: | 60 months | Underwriting and Financial Information | |||||
| Seasoning: | 1 month | UW NOI(7): | $8,477,914 | ||||
| Prepayment Provisions(2): | LO (25), DEF (32), O (3) | UW NOI Debt Yield(1): | 9.7% | ||||
| Lockbox/Cash Mgmt Status: | Hard/In Place | UW NOI Debt Yield at Maturity(1): | 9.7% | ||||
| Additional Debt Type(3): | Pari Passu/Mezzanine | UW NCF DSCR(1): | 1.94x | ||||
| Additional Debt Balance(3): | $54,500,000/$10,000,000 | Most Recent NOI(7): | $7,763,545 (8/31/2016 TTM) | ||||
| Future Debt Permitted (Type): | No (N/A) | 2nd Most Recent NOI: | $6,655,583 (12/31/2015) | ||||
| 3rd Most Recent NOI: | $6,318,478 (12/31/2014) | ||||||
| Reserves(4) | Most Recent Occupancy(5): | 82.9% (9/30/2016) | |||||
| Type | Initial | Monthly | Cap | 2nd Most Recent Occupancy: | 74.1% (12/31/2015) | ||
| RE Tax: | $611,180 | $126,663 | N/A | 3rd Most Recent Occupancy(6): | 76.1% (12/31/2014) | ||
| Insurance: | $116,110 | $12,901 | N/A | Appraised Value (as of): | $134,000,000 (9/6/2016) | ||
| Recurring Replacement: | $0 | $5,130 | N/A | Cut-off Date LTV Ratio(1): | 65.3% | ||
| TI/LC: | $0 | $47,483 | $2,848,958 | LTV Ratio at Maturity Date(1): | 65.3% | ||
| Deferred Maintenance: | $342,500 | $0 | N/A | ||||
| Ground Rent: | $17,699 | Springing | N/A | ||||
| Primary Tenant: | $0 | Springing | N/A | ||||
| Free Rent: | $375,089 | $0 | N/A | ||||
| Sources and Uses | ||||||
| Sources | Proceeds | % of Total | Uses | Proceeds | % of Total | |
| Loan Amount: | $87,500,000 | 66.1% | Purchase Price | $130,000,000 | 98.3% | |
| Mezzanine Loan: | $10,000,000 | 7.6% | Total Reserves | $1,462,578 | 1.1% | |
| Borrower Equity | $34,808,906 | 26.3% | Closing Costs: | $846,328 | 0.6% | |
| Total Sources: | $132,308,906 | 100.0% | Total Uses: | 132,308,906 | 100.0% | |
| (1) | The Greenwich Office Park Mortgage Loan is part of the Greenwich Office Park Whole Loan, which is comprised of twopari passu promissory notes with an aggregate principal balance of $87,500,000. The Cut-off Date Balance per SF, Maturity Date Balance per SF, UW NOI Debt Yield, UW NOI Debt Yield at Maturity, UW NCF DSCR, Cut-off Date LTV Ratio and LTV Ratio at Maturity Date numbers presented above are based on the aggregate principal balance of the promissory notes comprising the Greenwich Office Park Whole Loan. The Cut-off Date Balance per SF, Cut-off Date LTV Ratio, UW NCF DSCR, UW NOI Debt Yield and UW NOI Debt Yield at Maturity based on the combined Greenwich Office Park Whole Loan and Greenwich Office Park Mezzanine Loan (as defined below) aggregate principal balance of $97,500,000 are $256.67, 72.8%, 1.58x, 8.7% and 8.7%, respectively. |
| (2) | Defeasance is permitted any time after the earlier of the (i) fourth anniversary of the note date, or (ii) on or after the end of the two year period commencing on the closing date of the securitization of the last Greenwich Office Park promissory note to be securitized. |
| (3) | See “—The Mortgage Loan,” “—Additional Secured Indebtedness (not including trade debt)”and “Mezzanine Loan and Preferred Equity” below for further discussion of additional debt. |
| (4) | See “—Escrows and Reserves” below for further discussion of reserve requirements. |
| (5) | Since June 2015, 21 leases and renewals have been signed at the Greenwich Office Park Property, accounting for 33.8% of the total square footage and 39.2% of total base rent. Among the new leases are four renewals and two expansions, including IBG, LLC, which increased its presence at the building by 12.8% from 37,404 sf to 42,196 SF. |
| (6) | 2014 occupancy figures exclude building 1, totaling 40,826 SF, as it was offline due to a gut renovation spanning 2010 to 2016. The building was offline starting at the end of 2012 and was completely offline from 2013- 2014. |
| (7) | UW NOI of $8,477,914 increased from Most Recent NOI of $7,763,545 as of August 31, 2016 primarily due to the expiration of free rent for 11 tenants across 12 leases for a total of $999,677 during 2015. |
This is not a research report and was not prepared by any Underwriter’s research department. Please see additional important information and qualifications at the end of this Term Sheet.
T-113
| MSC 2016-UBS12 | Greenwich Office Park |
The Mortgage Loan. The ninth largest mortgage loan (the “Greenwich Office Park Mortgage Loan”) is part of a whole loan (the “Greenwich Office Park Whole Loan”) evidenced by twopari passu promissory notes (Note A-1 and Note A-2) in the aggregate original principal amount of $87,500,000, both of which are secured by a first priority fee and leasehold mortgage encumbering an eight-building office complex totaling 379,861 SF in Greenwich, Connecticut (the “Greenwich Office Park Property”). Promissory Note A-1 in the original principal of $33,000,000 represents the Greenwich Office Park Mortgage Loan. Promissory Note A-2 in the original principal amount of $54,500,000 (the “Greenwich Office ParkPari Passu Companion Loan”) is currently held by Natixis and is expected to be contributed to one or more future securitization trusts or may be otherwise transferred at any time. The Greenwich Office Park Whole Loan will be serviced pursuant to the pooling and servicing agreement for the MSC 2016-UBS 12 Trust until the securitization of the Greenwich Office ParkPari Passu Companion Loan represented by Note A-2, at which time the Greenwich Office Park Whole Loan will be serviced pursuant to the pooling and servicing agreement for such securitization trust. See “Description of the Mortgage Pool—The Whole Loans—The Serviced Pari Passu Whole Loans”, “The Non-Serviced Pari Passu Whole Loans” and “Pooling and Servicing Agreement” in the Preliminary Prospectus.
The proceeds of the Greenwich Office Park Whole Loan, along with the Greenwich Office Park Mezzanine Loan and borrower equity, were used to acquire the Greenwich Office Park Property for the approximate purchase price of $130,000,000, fund reserves and pay closing costs.
The Borrower and the Sponsor. The borrower is Greenwich Park LLC (the “Greenwich Office Park Borrower”), a single-purpose Delaware limited liability company structured to be bankruptcy-remote, with two independent directors. The sponsor and the nonrecourse carve-out guarantor of the Greenwich Office Park Borrower is John J. Fareri.
John J. Fareri is the founder and CEO of Fareri Associates LLP, a regional real estate firm based in Greenwich, Connecticut, primarily engaged in acquisition, management and development of commercial real estate assets in Westchester County and the Lower Hudson Valley in New York as well as Fairfield County in Connecticut. Mr. Fareri and his affiliated companies have developed, repositioned and/or acquired a portfolio of real estate holdings of approximately 5 million SF. Fareri Associates’ previous experience includes conversion of a Greenwich Avenue cinema into an Apple Store in Greenwich, Connecticut, the conversion of a former motel to a luxury boutique hotel and the redevelopment of three Greenwich sites to mixed-use properties including commercial, retail and residential space.
The Property. The Greenwich Office Park Property consists of the fee and leasehold interests in eight, Class A, low-rise buildings, located in a 20.86 acre park-like site in Greenwich, Connecticut. Eight buildings in the office park were originally developed in the 1970’s and range in height from 2 to 4 stories and in size from 23,540 to 106,293 SF with a combined net rentable area of 379,861 SF, offering flexible floor plates and plans for tenants’ needs. Six buildings (Buildings 1 through 6) are owned in fee simple and two buildings (Buildings 8 and 9) are owned in leasehold interest, each of which consists of a 99-year ground lease expiring in 2076. The Greenwich Office Park Property was owned by Clarion Partners since 1997. During Clarion Partner’s ownership, the Greenwich Office Park Property had an institutional maintenance program which included the recently completed $15.5 million capital improvements ($41 PSF) such as lobby renovations, common area upgrades, HVAC and BMS improvements, roof replacement/repairs and various restroom renovations, as well as a full gut-renovation of Building 1.
The Greenwich Office Park Property features an amenity package that includes a fitness center with personal trainers, a full-service café with catering services, a door-to-train shuttle service, complimentary partially covered parking, specialty services such as shoe repair and a notary, storage space and a tenant conference room. The property contains a total of 1,749 parking spaces, some of which are located in covered garages within the buildings, for a parking ratio of 4.60 per 1,000 SF. The Greenwich Office Park Borrower’s interest in each of Building 8 and Building 9, is held under separate 99-year ground leases that expire in 2076. The Building 8 ground rent resets at 20 year intervals, with the next reset scheduled to occur in December 2018. Under the Building 8 ground lease, the new annual ground rent is calculated as the original ground rent ($50,000 per annum) plus 25% of any increase in office tenant rental income (excluding recoveries) over the same three years after the certificate of occupancy was issued. Based on information from an estoppel certificate for historical rent together with information from current leases, the Greenwich Office Park Borrower estimated such rent to be $392,421 per annum. The Building 9 ground rent is scheduled to increase from $34,385 per annum to $39,543 per annum for the 10-year period in 2023. Under the ground lease for Building 9, all future escalations will be determined by agreement by and between the ground lessor and the borrower incorporating commercially reasonable escalators to become effective at commercially reasonable intervals.
As of September 30, 2016, the Greenwich Office Park Property is 82.9% occupied.
Major Tenants.
IBG LLC (dba Interactive Brokers Group) (42,196 SF, 11.1% of NRA, 14.6% of underwritten base rent).Interactive Brokers Group an automated global electronic broker and market maker that services accounts for hedge and mutual funds, registered investment advisors, proprietary trading groups, introducing brokers and individual investors. Interactive Brokers Group conducts business in the United States primarily from the Interactive Brokers Group headquarters at the Greenwich Office Park Property and from Chicago, Illinois and its overseas business from offices in Canada, England, Switzerland, Estonia, India, China and Japan. Interactive Brokers Group is listed with NASDAQ under the ticker symbol “IBKR” and is rated BBB+ by S&P. Interactive Brokers Group has leased 30,311 SF in Building 8 since June 2008 and expanded by 7,093 SF in 2009 and 4,752 SF in December 2015 with conterminous expirations in January 2019 with two five-year extension options remaining. Interactive Brokers Group has the right to terminate its lease with eight months’ written notice effective on August 1, 2017 and payment of a termination fee. The current termination fee effective August 1, 2017 is $1,626,919. The termination fee decreases by approximately $26,000 per month with the last termination option having an effective date of December 1, 2018 with payment of a termination fee of $1,205,743. The Interactive Brokers Group leases requires an annual base rent of $48.00 PSF on 30,311 SF of its space, which increases to $50.00 PSF in February 2017; on 7,093 SF of its space, it requires $41.25 PSF which increases to $43.00 PSF in March 2017; and on 4,792 SF of its space, it requires $30.00 PSF, which increases to $31.00 PSF in December 2016, $32.00 PSF in December 2017, and $33.00 PSF in December 2018.
Orthopaedic & Neurology Surgery Specialists P.C. (dba ONS) (31,305 SF,8.2% of NRA, 11.7% of underwritten base rent). Orthopaedic & Neurology Surgery Specialists is a medical network that specializes in orthopedic surgery, neurosurgery, sports medicine and physical medicine/rehabilitation. ONS has 22 sub-specialty trained physicians, all of whom are board certified by the American Board of Orthopaedic Surgery, the American Board of Neurological Surgery or the American Board of Physical Medicine and Rehabilitation. The tenant leases the entire Building 6 (25,690 sq. ft.) which is its main medical facility, and two suites in Building 9 (5,615 SF) which serves as its administration office. The Orthopedic & Neurology Surgery Specialists lease requires an annual base rent of $50.09 PSF, expires in 2019 and provides for one five-year renewal option.
Starwood Capital Operations, LLC (dba Starwood Energy Group) (28,764 SF, 7.6% of NRA, 6.1% of underwritten base rent). Starwood Energy Group was founded in 2005 and is a subsidiary of Starwood Capital Group – the 25-year-old multinational private investment firm with a focus on global real
This is not a research report and was not prepared by any Underwriter’s research department. Please see additional important information and qualifications at the end of this Term Sheet.
T-114
| MSC 2016-UBS12 | Greenwich Office Park |
estate and more than $51.0 billion assets under management. Starwood Energy Group specializes in energy infrastructure and utilities investments. Starwood Energy Group currently occupies 28,764 SF under leases expiring in July 2019 and February 2022, with one five-year renewal option. The lease requires an annual base rent of $36.00 PSF on 9,950 SF of its space and $27.00 on 14,077 SF of its space.
Stark Office Suites of Greenwich LLC (14,752 SF, 3.9% of NRA, 5.2% of underwritten base rent).Stark Office Suites is an independent provider of turn-key office space, virtual offices and amenities for professionals and entrepreneurs. Stark Office Suites currently occupies 14,752 SF under a lease expiring in September 2024 with one one-year and a subsequent five-year renewal option. The lease requires an annual base rent of $47.50 PSF.
Performance Equity Management LLC (12,988 SF, 3.4% of NRA, 3.5% of underwritten base rent).Performance Equity Management LLC is a private equity firm. Performance Equity Management LLC currently occupies 12,988 SF under a lease expiring in March 2027, with one five-year renewal option. The tenant has a one-time termination option effective the end of March 2023 with at least 12 months prior written notice and is required to pay a termination fee equal to the unamortized portion of the construction allowance, free rent and leasing commissions with 8% annual interest. The lease currently requires an annual base rent of $36.00 PSF.
The following table presents certain information relating to the leases at the Greenwich Office Park Property:
| Tenant Summary(1) | |||||||
| Tenant Name | Credit Rating (Fitch/Moody’s/ S&P)(2) | Tenant SF | Approximate % of SF | Annual UW Rent | % of Total Annual UW Rent | Annual UW Rent PSF(3) | Lease Expiration |
| Major Tenant | |||||||
| Interactive Brokers Group | NR/NR/BBB+ | 42,196 | 11.1% | $1,969,101 | 14.6% | $46.67 | 1/31/2019(4) |
| ONS | NR/NR/NR | 31,305 | 8.2% | $1,568,198 | 11.7% | $50.09 | 7/31/2019(5) |
| Starwood Energy Group(6) | NR/NR/NR | 28,764 | 7.6% | $819,290 | 6.1% | $28.48 | 7/31/2019 & 2/28/2023(7) |
| Stark Office Suites of Greenwich LLC | NR/NR/NR | 14,752 | 3.9% | $700,720 | 5.2% | $47.50 | 9/30/2024(8) |
| Performance Equity Management LLC | NR/NR/NR | 12,988 | 3.4% | $467,568 | 3.5% | $36.00 | 3/31/2027(9) |
| Subtotal/Wtd. Avg. | 130,005 | 34.2% | $5,524,877 | 41.1% | $42.50 | ||
| Other Tenants | 185,060 | 48.7% | $7,926,334 | 58.9% | $42.83 | ||
| Vacant Space | 64,796 | 17.1% | $0 | 0.0% | $0.00 | ||
| Total/Wtd. Avg. | 379,861 | 100.0% | $13,451,211 | 100.0% | $42.69 | ||
| (1) | Information is based on the underwritten rent roll. |
| (2) | Certain ratings are those of the parent company whether or not the parent guarantees the lease. |
| (3) | Wtd. Avg. Annual UW Rent PSF excludes vacant space. |
| (4) | Interactive Brokers Group has two 5-year lease extension options remaining on each of its three leases at the fair market value rental. Interactive Brokers Group may terminate its lease upon providing written notice of at least eight months. The tenant must pay a termination fee that decreases by approximately $26,000 each month. The current termination fee, for a termination effective August 1, 2017, is $1,626,919. The last termination option, for a termination effective date December 1, 2018, requires a termination fee of $1,205,743. Interactive Brokers Group requires an annual base rent of $48.00 PSF on 30,311 SF of its space, $41.25 PSF on 7,093 SF of its space, and $30.00 PSF on 4,792 of its space. |
| (5) | ONS has one 5-year lease extension option remaining at the fair market rental rate. |
| (6) | Starwood Energy Group space includes 18,814 sq. ft. of space subleased from Freepoint Commodities LLC. |
| (7) | Starwood Energy Group has 4,737 SF expiring on July 31, 2019 with the remaining 24,027 SF expiring on February 28, 2023. The lease requires an annual base rent of $36.00 PSF on 9,950 SF of its space and $27.00 on 14,077 SF of its space. Starwood Energy Group has one 5-year lease extension option at the greater of the fair market value rental value rate and the previous rental rate. |
| (8) | Stark Office Suites of Greenwich LLC has one one-year lease extension option at $55.50 annual rent PSF and a subsequent five-year lease extension at the greater of the fair market value rental rate and the previous rental rate remaining. |
| (9) | Performance Equity Management LLC has one 5-year lease extension option at the fair market rental rate. Performance Equity Management has a one-time right to terminate its lease in March 2023 with at least 12 months prior written notice and a termination fee equal to the unamortized portion of the construction allowance, free rent, and leasing commissions with 8% annual interest. |
This is not a research report and was not prepared by any Underwriter’s research department. Please see additional important information and qualifications at the end of this Term Sheet.
T-115
| MSC 2016-UBS12 | Greenwich Office Park |
The following table presents certain information relating to the lease rollover schedule at the Greenwich Office Park Property:
| Lease Rollover Schedule(1)(2) | ||||||||
| Year | # of Leases Rolling | SF Rolling | Annual UW Rent PSF Rolling(3) | Approx. % of Total SF Rolling | Approx. Cumulative % of SF Rolling | Total UW Rent Rolling | Approx. % of Total Rent Rolling | Approx. Cumulative % of Total Rent Rolling |
| MTM | 0 | 0 | $0.00 | 0.0% | 0.0% | $0 | 0.0% | 0.0% |
| 2016 | 2 | 4,188 | $45.42 | 1.1% | 1.1% | $190,236 | 1.4% | 1.4% |
| 2017 | 5 | 30,594 | $46.85 | 8.1% | 9.2% | $1,433,219 | 10.7% | 12.1% |
| 2018 | 5 | 31,266 | $44.74 | 8.2% | 17.4% | $1,398,930 | 10.4% | 22.5% |
| 2019 | 11 | 92,665 | $46.02 | 24.4% | 41.8% | $4,264,076 | 31.7% | 54.2% |
| 2020 | 4 | 22,751 | $45.33 | 6.0% | 47.8% | $1,031,287 | 7.7% | 61.8% |
| 2021 | 4 | 15,077 | $37.30 | 4.0% | 51.7% | $562,422 | 4.2% | 66.0% |
| 2022 | 3 | 14,445 | $47.16 | 3.8% | 55.5% | $681,212 | 5.1% | 71.1% |
| 2023 | 3 | 29,916 | $35.25 | 7.9% | 63.4% | $1,054,463 | 7.8% | 78.9% |
| 2024 | 2 | 25,416 | $44.77 | 6.7% | 70.1% | $1,137,944 | 8.5% | 87.4% |
| 2025 | 0 | 0 | $0.00 | 0.0% | 70.1% | $0 | 0.0% | 87.4% |
| 2026 | 2 | 14,086 | $49.22 | 3.7% | 73.8% | $693,304 | 5.2% | 92.5% |
| 2027 & Beyond | 5 | 34,661 | $28.97 | 9.1% | 82.9% | $1,004,118 | 7.5% | 100.0% |
| Vacant | 0 | 64,796 | $0.00 | 17.1% | 100.0% | $0.00 | 0.0% | 100.0% |
| Total/Wtd. Avg. | 46 | 379,861 | $42.69 | 100.0% | $13,451,211 | 100.0% | ||
| (1) | Information is based on the underwritten rent roll. |
| (2) | Certain tenants may have lease termination options that are exercisable prior to the originally stated expiration date of the subject lease and that are not considered in the lease rollover schedule. |
| (3) | Wtd. Avg. Annual UW Rent PSF Rolling excludes vacant space. |
The Market.The Greenwich Office Park Property is located in Greenwich, Connecticut, approximately 30 miles northeast of Manhattan, New York. According to the appraisal, Greenwich, Connecticut has an average household income of $190,000, which is approximately 2.5 times the national average. The Town of Greenwich has an estimated population of about 60,000 and a median household income of about $135,000, compared to $70,000 for the State of Connecticut. The Greenwich Office Park Property is situated 1.5 miles from the Greenwich Metro-North train station, which provides a 42-minute commute to New York City’s Grand Central Station. The Greenwich Office Park Property also has nearby access to numerous highway junctions and arterial roads including Interstate 95, located approximately 1.5 miles to the east.
According to the appraisal, the Greenwich Office Park Property is located in the Greenwich office submarket, which contains 6.5 million SF of office space, and is part of the greater Fairfield County office market, which included 41.5 million SF as of the second quarter 2016. There has been no new construction since 1991 in Greenwich. According to the appraisal, the Greenwich office submarket exhibited a vacancy rate of 10.6% with asking rents of $63.70 PSF.
The following table presents leasing data at certain competitive office properties with respect to the Greenwich Office Park Property:
| Competitive Property Summary | ||||||
| Comparable Name | Address | Original Year Built | Size (SF) | Rent PSF | Total Occupancy | Class |
| Greenwich Office Park Property | Various | 1970-1978 | 379,861(1) | $42.69(1)(2) | 82.9%(1) | A |
| Office Comp #1 | 10 Glenville Street | 1976 | 65,000 | $45.00-$48.50 | NAV | A |
| Office Comp #2 | 8 Sound Shore Dr | 1980 | 80,000 | $51.80 | NAV | A |
| Office Comp #3 | 75 Holly Hill Lane | 1979 | 102,224 | $38.00-$45.00 | NAV | A |
| Office Comp #4 | 1700 East Putnam Ave | 1920 | 186,725 | $40.50 | NAV | A |
| Office Comp #5 | 500 West Putnam Ave | 1975 | 121,000 | $40.00 | NAV | A |
| Office Comp #6 | 777 West Putnam Ave | 1978 | 130,000 | $43.00 | NAV | A |
| Total/Range/Wtd. Avg.(3) | 684,949 | $38.00-$51.80 | NAV | |||
Source: Appraisal
| (1) | Information is based on the underwritten rent roll. |
| (2) | Rent PSF excludes vacant space. |
| (3) | Total/Range/Wtd. Avg. excludes the Greenwich Office Park Property. |
This is not a research report and was not prepared by any Underwriter’s research department. Please see additional important information and qualifications at the end of this Term Sheet.
T-116
| MSC 2016-UBS12 | Greenwich Office Park |
Operating History and Underwritten Net Cash Flow.The following table presents certain information relating to the historical operating performance and the Underwritten Net Cash Flow at the Greenwich Office Park Property:
| Cash Flow Analysis | ||||||||||||
| 2013 | 2014 | 2015 | 8/31/2016 TTM | UW(1) | UW PSF | |||||||
| Base Rent(2) | $13,666,070 | $11,929,425 | $12,071,078 | $13,074,611 | $13,451,211(3) | $35.41 | ||||||
| Grossed Up Vacant Space | $0 | $0 | $0 | $0 | $2,849,504 | $7.50 | ||||||
| Total Recoveries | $2,104,447 | $1,816,167 | $2,110,133 | $2,301,149 | $1,857,671 | $4.89 | ||||||
| Other Income | $69,844 | $36,607 | $102,196 | $70,267 | $70,267 | $0.18 | ||||||
| Less Vacancy & Free Rent(4) | ($856,633) | ($1,546,640) | ($999,677) | ($1,061,192) | ($2,849,504)(4) | ($7.50) | ||||||
| Effective Gross Income | $14,983,728 | $12,235,559 | $13,283,730 | $14,384,835 | $15,379,150 | $40.49 | ||||||
| Total Operating Expenses(5) | $5,914,718 | $5,917,082 | $6,628,147 | $6,621,290 | $6,901,235 | $18.17 | ||||||
| Net Operating Income | $9,069,010 | $6,318,478 | $6,655,583 | $7,763,545 | $8,477,914 | $22.32 | ||||||
| Capital Expenditures | $0 | $0 | $0 | $0 | $61,564 | $0.16 | ||||||
| TI/LC | $0 | $0 | $0 | $0 | $569,792 | $1.50 | ||||||
| Net Cash Flow | $9,069,010 | $6,318,478 | $6,655,583 | $7,763,545 | $7,846,559 | $20.66 | ||||||
| Occupancy % | 70.1% | 76.1% | 74.1% | 82.9% | 84.4% | |||||||
| NOI DSCR(6) | 2.24x | 1.56x | 1.65x | 1.92x | 2.10x | |||||||
| NCF DSCR(6) | 2.24x | 1.56x | 1.65x | 1.92x | 1.94x | |||||||
| NOI Debt Yield(6) | 10.4% | 7.2% | 7.6% | 8.9% | 9.7% | |||||||
| NCF Debt Yield(6) | 10.4% | 7.2% | 7.6% | 8.9% | 9.0% | |||||||
| (1) | The underwritten base rent is based on in-place leases with vacant space grossed up using appraiser’s market rent assumptions and rent steps through September 2017, totaling $156,430. All subleases, totaling 32,060 SF and annual rents of $914,929, are treated as direct leases with respect to rents, recovery stops, and expiration dates. |
| (2) | Historical base rent figures are net of vacancy. The underwritten base rent decline in 2014 is due to United Rentals, which occupied 42,000 SF, vacating the Greenwich Office Park Property. Additionally, Building 1 was offline during 2013 and 2014 due to a gut renovation. |
| (3) | Free rent totaled $793,789 from eleven tenants with eleven leases in 2013, $1,546,640 from seven tenants with nine leases in 2014, and $999,677 from 11 tenants with 12 total leases in 2015. Free rent has continued to decrease since 2015, as total outstanding free rent is $375,089 from two tenants. Such free rent is not included in the underwriting but was reserved at closing. |
| (4) | The underwritten economic vacancy is 15.6%. The Greenwich Office Park Property was 82.9% physically occupied as of September 30, 2016. |
| (5) | Total Operating Expenses include ground rent of $426,806, which includes $392,241 for Building 8 and $34,385 for Building 9. For Building 8, the next increase occurs on December 14, 2018. The lease language is subject to interpretation as rent increases are based upon change in the rental income of the building dating back to the early 1980’s. The rent for the current 20 year period ending in December 2018 was disputed, with a negotiated rent of $178,000 per annum. The Greenwich Office Park Borrower relied on information from an estoppel certificate for historical rent together with information from current leases to estimate the ground rent for the next 20 year period to be $392,421 per annum. |
| (6) | Debt service coverage ratios and debt yields are based on the Greenwich Office Park Whole Loan. |
Escrows and Reserves. The loan documents provide for upfront reserves in the amount of $611,180 for real estate taxes, $116,110 for insurance premiums, $342,500 for deferred maintenance, $375,089 for free rent and $17,699 for ground rent payments. Performance Equity Management is due a total of $151,527 in free rent through March 2017. Additionally, the loan documents require monthly deposits of an amount equal to one-twelfth of the estimated annual real estate taxes (currently equates to $126,663), an amount equal to one-twelfth of the annual insurance premiums (currently equates to $12,901), $5,130 for replacement reserves, $47,483 for TI/LC, and an amount equal to one-twelfth of the annual ground rent (currently equates to $17,699). The TI/LC reserve is subject to a cap of $2,848,958 and a minimum balance of $1,424,479. If, at any time during the Greenwich Office Park Mortgage Loan term, the balance of the TI/LC reserve falls below $1,424,479, monthly deposits are required to resume until the cap is met. The loan documents have waived the ground rent reserve monthly deposits, provided (i) no event of default or Cash Trap Period (as defined below) has occurred and is continuing; and (ii) the Greenwich Office Park Borrower has paid all ground rent directly to the appropriate ground lessor and has provided the lender with evidence of payment at least five business days prior to the applicable delinquency.
Lockbox and Cash Management. The Greenwich Office Park Whole Loan has a lender-controlled hard lockbox account. Funds deposited into the lockbox account are required to be swept on a daily basis into a cash management account controlled by the lender and applied and disbursed in accordance with the loan documents. Following the occurrence of a Cash Trap Period, excess cash will be held as additional collateral for the Greenwich Office Park Whole Loan. Upon the termination of any Cash Trap Period, excess cash will no longer be held by the lender and, provided that no event of default has occurred and is continuing (and no other Cash Trap Period is then in effect), all amounts then on deposit in the lockbox account will be disbursed to the Greenwich Office Park Borrower.
A “Cash Trap Period” will commence upon the earlier of: (i) the occurrence of an event of default under the loan documents; (ii) the combined amortizing debt service coverage ratio falling below 1.10x at the end of any calendar quarter; and (iii) the commencement of a Primary Tenant Sweep Period (as defined below). A Cash Trap Period will end with respect to clause (ii), if for six consecutive months (a) no default or event of default has occurred; (b) no event that would trigger another Cash Trap Period has occurred; and (c) the combined amortizing debt service coverage ratio is at least 1.15x for six consecutive months; and, with respect to clause (iii), such Primary Tenant Sweep Period has ended (and no other Cash Trap Period is then continuing).
A “Primary Tenant Sweep Period” will commence upon (i) any termination of, or receipt by the Greenwich Office Park Borrower of a notice to terminate the Primary Tenant (as defined below) lease; (ii) the Primary Tenant becoming the subject of a bankruptcy; (iii) the Primary Tenant “going dark” in a majority of its premises; (iv) the occurrence of any monetary or material non-monetary default under the Primary Tenant lease; or (v) the date that is the earlier of six months prior to (a) any lease extension date set forth in the Primary Tenant lease or (b) the expiration date of such Primary Tenant lease unless, in the case of this clause (v) such Primary Tenant lease has been extended with a term that expires no earlier than three years after the maturity date of the Greenwich Office Park Whole Loan, provided however, that the continuance of a Primary Tenant Sweep Period is suspended (but will not be deemed to have been terminated) for so long as (x) no event of default has occurred and is continuing, (y) no other Cash Trap Period has commenced and is continuing, and (z) the amount on deposit in the Primary Tenant reserve is equal to or exceeds $13,295,135.
This is not a research report and was not prepared by any Underwriter’s research department. Please see additional important information and qualifications at the end of this Term Sheet.
T-117
| MSC 2016-UBS12 | Greenwich Office Park |
A Primary Tenant Sweep Period will end upon, the occurrence of a “Primary Tenant Replacement Event” (as defined below) and with respect to clause (ii) above, the bankruptcy is dismissed; with respect to clause (iii) above, the Primary Tenant re-opens for business in the majority of the Primary Tenant Premises for a continuous period of no less than six months; or with respect to clause (iv) above, the monetary or non-monetary event of default is cured.
A “Primary Tenant Replacement Event” means the termination of any Primary Tenant lease and the Greenwich Office Park Borrower entering into one or more new leases for all or substantially all of such Primary Tenant premises with acceptable replacement tenants and upon such terms and conditions as are reasonably acceptable to the lender in all material respects.
A “Primary Tenant” means the Interactive Broker Group tenant or any acceptable replacement tenant thereafter occupying the Primary Tenant premises.
Additional Secured Indebtedness (not including trade debt). The Greenwich Office Park Property also secures the Greenwich Office Park Pari Passu Companion Loan, which has a Cut-off Date balance of $54,500,000, is held by Natixis Real Estate Capital, LLC and is expected to be contributed to a future securitization trust. The Greenwich Office ParkPari Passu Companion Loan accrues interest at the same rate as Greenwich Office Park Mortgage Loan. The Greenwich Office Park Mortgage Loan is entitled to payments of principal and interest on apro rata andpari passu basis with the Greenwich Office ParkPari Passu Companion Loan. The holders of the Greenwich Office Park Mortgage Loan and Greenwich Office ParkPari Passu Companion Loan have entered into a co-lender agreement which sets forth the allocation of collections on the Greenwich Office Park Whole Loan. See“Description of the Mortgage Pool—The Whole Loans—The Serviced Pari Passu Whole Loans” and the “The Non-Serviced Pari Passu Whole Loans”in the Preliminary Prospectus.
Mezzanine Loan and Preferred Equity. The Greenwich Office Park Mezzanine Loan refers to a loan in the original principal amount of $10,000,000 made to Greenwich Park Mezz LLC by Natixis Real Estate Capital LLC, secured by 100% of the direct or indirect equity interest in the Greenwich Office Park Borrower put in place simultaneously with the origination of the Greenwich Office Park Whole Loan. The Greenwich Office Park Mezzanine Loan and the Greenwich Office Park Whole Loan are subject to an intercreditor agreement between the Greenwich Office Park Mezzanine Loan lender and the Greenwich Office Park Whole Loan lender. The Greenwich Office Park Mezzanine Loan may be transferred at any time subject to the requirements and limitations set forth in the related mezzanine intercreditor agreement.
The following table presents certain information relating to the Greenwich Office Park Mezzanine Loan:
| Mezzanine Debt Summary | |||||||
| Mezzanine Debt Cut-off Date Principal Balance | Mezzanine Debt Interest Rate | Original Term to Maturity (mos.) | Original Amort. Term (mos.) | Original IO Term (mos.) | Total Debt UW NCF DSCR | Total Debt UW NOI Debt Yield | Total Debt Cut- off Date LTV |
| $10,000,000 | 9.0000% | 60 | None | 60 | 1.58x | 8.7% | 72.8% |
Release of Property. The borrower has the right to cause to be released from the lien of the mortgage portions of the Greenwich Office Park Property as requested by the Greenwich Office Park Borrower (the “Free Release Parcel”) as approved by the lender in its sole and absolute discretion, provided the conditions in the loan documents are met including, among others: (i) no event of default has occurred and is continuing; (ii) following the release, the remaining Greenwich Office Park Property will be in compliance with applicable legal requirements and all provisions of any leases of any portion of the Greenwich Office Park Property that are then in effect (including, without limitation, as to required parking spaces, restrictions on development, access and similar matters), and the Free Release Parcel will be subject to a restrictive covenant prohibiting the use or development thereof in any manner that violates any provision of any then-existing lease of the remaining Greenwich Office Park Property; (iii) the remaining property maintains a minimum combined debt service coverage ratio equal of the greater of (a) a combined debt service coverage ratio of 1.58x or (b) a combined debt service coverage ratio for the twelve full calendar months immediately prior to the release; (iv) the remaining property maintains a maximum combined loan to value ratio equal to the lesser of (a) the combined loan to value ratio of 72.8% or (b) the combined loan to value ratio immediately prior to the release; and (v) compliance with REMIC requirements. No value was attributed to the Free Release Parcel in the appraisal. The Greenwich Office Park Borrower is only permitted to construct multi-family improvements with ancillary retail on that portion of unimproved land that is eligible to be released.
Partial Defeasance. The Greenwich Office Park Borrower has the right to obtain the release and partial defeasance of a portion of the principal balance of the Greenwich Office Park Property (a “Partial Defeasance”) in connection with a third-party sale of a portion of the Greenwich Office Park Property (the “Release Property” as defined below) provided the conditions in the loan documents are met including: (i) no event of default has occurred and is continuing; and (ii) the Release Property and all improvements thereon, and the remaining property and all improvements thereon, comply with all applicable zoning, land use and similar laws, rules, regulations and ordinances of all applicable governmental authorities, and all other applicable laws, with each such determination assuming the separate ownership and operation of each parcel. The amount required to be released is the greater of (i) 100% of the net sale proceeds from the sale of the Release Property, (ii) 125% of the allocated loan amount with respect to the Release Property; (iii) an amount such that after the release, the undefeased loan, based on the income of the remaining Greenwich Office Park Property, will have (a) a combined debt service coverage ratio no less than the maximum of (x) a combined debt service coverage ratio of 1.58x or (y) a combined debt service coverage ratio for the twelve full calendar months immediately prior to the partial defeasance and (b) a maximum combined loan to value ratio equal to the lesser (x) a combined loan to value ratio of 72.8% or (y) the combined loan to value ratio immediately prior to the partial defeasance; and (iv) the lender receives a rating comfort letter from each applicable rating agency with respect to a Partial Defeasance.
This is not a research report and was not prepared by any Underwriter’s research department. Please see additional important information and qualifications at the end of this Term Sheet.
T-118
| MSC 2016-UBS12 | Greenwich Office Park |
The Release Property means any of each of the footprints of buildings 1 through 6 and each of the ground leases of buildings 8 and 9. Allocated Loan Amounts are as follows:
| Release Property | Allocated Loan Amount |
| Release Property 1 | $10,791,445 |
| Release Property 2 | $21,581,538 |
| Release Property 3 | $9,217,115 |
| Release Property 4 | $8,168,013 |
| Release Property 5 | $16,758,032 |
| Release Property 6 | $7,868,269 |
| Release Property 8 | $8,127,942 |
| Release Property 9 | $4,987,644 |
Condominium Conversion.The Greenwich Office Park Borrower has the right to convert the entire Greenwich Office Park Property to a commercial condominium form of ownership (the “Condominium Conversion”) as approved by the lender in its sole and absolute discretion, provided the conditions in the Greenwich Office Park Whole Loan documents are met including, among others: (i) no event of default has occurred and is continuing; (ii) following the Condominium Conversion, the condominium, the condominium documents, the units, the common area and the Greenwich Office Property will comply with all legal requirements upon filing with and approved by all applicable governmental authorities; (iii) the value and the cash flow of the Greenwich Office Property will not be reduced or otherwise negatively impacted by the Condominium Conversion and the Condominium Conversion will have no adverse effect on the borrower, the property, or the borrower’s ability to pay the total debt service ;(iv) compliance with REMIC requirements; and (v) the lender receives a ratings comfort letter from each applicable rating agency with respect to Condominium Conversion and the implementation of the terms and conditions of the Condominium Conversion,.
Terrorism Insurance. The loan documents require that the “all risk” insurance policy required to be maintained by the Greenwich Office Park Borrower provide coverage for terrorism in an amount equal to the full replacement cost of the Greenwich Office Park Property. The loan documents also require business interruption insurance covering no less than the 18-month period following the occurrence of a casualty event, together with a six-month extended period of indemnity.
This is not a research report and was not prepared by any Underwriter’s research department. Please see additional important information and qualifications at the end of this Term Sheet.
T-119
| MSC 2016-UBS12 | The Shores Resort & Spa |
Mortgage Loan No. 10 – The Shores Resort & Spa
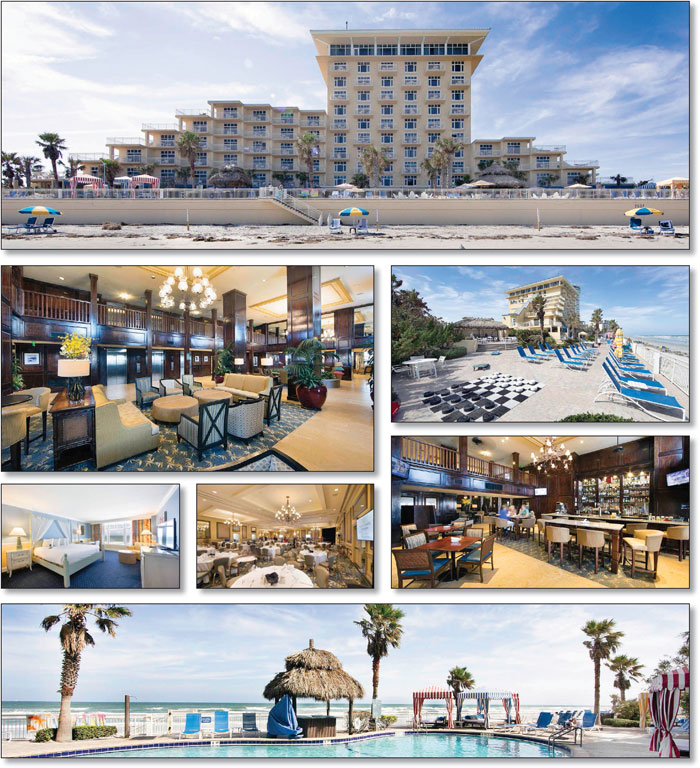
This is not a research report and was not prepared by any Underwriter’s research department. Please see additional important information and qualifications at the end of this Term Sheet.
T-120
| MSC 2016-UBS12 | The Shores Resort & Spa |
Mortgage Loan No. 10 – The Shores Resort & Spa
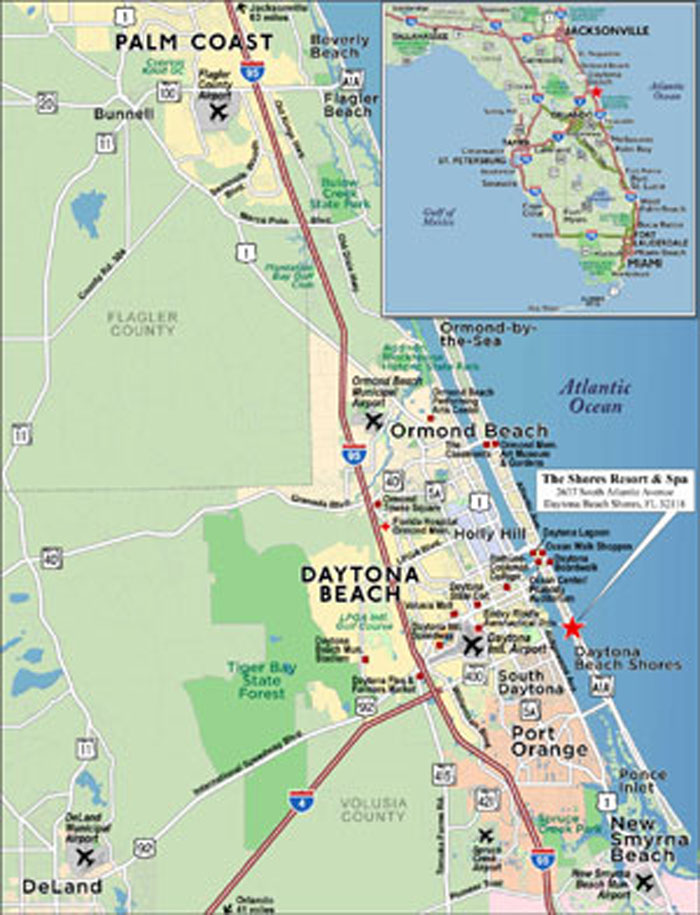
This is not a research report and was not prepared by any Underwriter’s research department. Please see additional important information and qualifications at the end of this Term Sheet.
T-121
| MSC 2016-UBS12 | The Shores Resort & Spa |
| Mortgage Loan No. 10 – The Shores Resort & Spa |
| Mortgage Loan Information | Property Information | ||||||
| Mortgage Loan Seller: | UBS AG | Single Asset/Portfolio: | Single Asset | ||||
| Original Balance: | $33,000,000 | Location: | Daytona Beach Shores, FL 32118 | ||||
| Cut-off Date Balance: | $32,958,565 | General Property Type: | Hospitality | ||||
| % of Initial Pool Balance: | 4.0% | Detailed Property Type: | Full Service | ||||
| Loan Purpose: | Acquisition | Title Vesting: | Fee | ||||
| Sponsors: | Uhon, Inc.; Rushan Wu | Year Built/Renovated: | 1974/2014-2015 | ||||
| Mortgage Rate: | 4.7610% | Size: | 212 Rooms | ||||
| Note Date: | 11/1/2016 | Cut-off Date Balance per Room: | $155,465 | ||||
| First Payment Date: | 12/6/2016 | Maturity Date Balance per Room: | $127,238 | ||||
| Maturity Date: | 11/6/2026 | Property Manager: | Pyramid Daytona Shores Management LLC | ||||
| Original Term to Maturity: | 120 months | ||||||
| Original Amortization Term: | 360 months | Underwriting and Financial Information | |||||
| IO Period: | 0 months | UW NOI(2): | $6,123,782 | ||||
| Seasoning: | 1 month | UW NOI Debt Yield: | 18.6% | ||||
| Prepayment Provisions: | LO (25); DEF (90); O (5) | UW NOI Debt Yield at Maturity: | 22.7% | ||||
| Lockbox/Cash Mgmt Status: | Hard/Springing | UW NCF DSCR: | 2.63x | ||||
| Additional Debt Type: | N/A | Most Recent NOI(2): | $5,721,438 (8/31/2016 TTM) | ||||
| Additional Debt Balance: | N/A | 2nd Most Recent NOI: | $5,596,726 (12/31/2015) | ||||
| Future Debt Permitted (Type): | Yes (Mezzanine) | 3rd Most Recent NOI: | $4,687,732 (12/31/2014) | ||||
| Reserves(1) | Most Recent Occupancy: | 69.6% (8/31/2016) | |||||
| Type | Initial | Monthly | Cap | 2nd Most Recent Occupancy: | 71.4% (12/31/2015) | ||
| RE Tax: | $42,153 | $42,153 | N/A | 3rd Most Recent Occupancy: | 68.9% (12/31/2014) | ||
| Insurance: | $27,270 | $5,049 | N/A | Appraised Value (as of)(3): | $54,500,000 (8/1/2017) | ||
| Deferred Maintenance: | $333,675 | $0 | N/A | Cut-off Date LTV Ratio: | 60.5% | ||
| Recurring Replacements: | $1,500,000 | $56,817 | N/A | Maturity Date LTV Ratio: | 49.5% | ||
| Seasonality: | $0 | Springing | N/A | ||||
| Sources and Uses | ||||||
| Sources | Proceeds | % of Total | Uses | Proceeds | % of Total | |
| Loan Amount: | $33,000,000 | 59.3% | Purchase Price: | $52,500,000 | 94.3% | |
| Borrower Equity: | $22,688,298 | 40.7% | Reserves: | $1,903,097 | 3.4% | |
| Closing Costs: | $1,285,200 | 2.3% | ||||
| Total Sources: | $55,688,298 | 100.0% | Total Uses: | $55,688,298 | 100.0% | |
| (1) | See“—Escrows and Reserves” below for further discussion of reserve requirements. |
| (2) | See“—Operating History and Underwritten Net Cash Flow” below for discussion of the increase in UW NOI over Most Recent NOI. |
| (3) | The appraiser concluded an “as is” value as of August 1, 2016 of $53,000,000 and an “as complete” value as of August 1, 2017 of $54,500,000 based on the completion of the $1.0 million planned capital expenditures at The Shores Resort & Spa Property, for which $1.5 million was reserved at loan origination. All calculations contained herein are based on the “as complete” appraised value of $54,500,000. |
The Mortgage Loan. The tenth largest mortgage loan (“The Shores Resort & Spa Mortgage Loan”) is evidenced by a promissory note in the original principal amount of $33,000,000 and secured by a first priority fee mortgage encumbering a full service hospitality property known as The Shores Resort & Spa in Daytona Beach Shores, Florida (“The Shores Resort & Spa Property”). The proceeds of The Shores Resort & Spa Mortgage Loan were used to acquire The Shores Resort & Spa Property, fund upfront reserves and pay closing costs.
The Borrower and the Sponsor. The borrower is Uhon Daytona Shores Resort Fee Owner, LLC(“The Shores Resort & Spa Borrower”),a Delaware limited liability company, structured to be bankruptcy remote with two independent directors. The Shores Resort & Spa Borrower is wholly owned by Uhon Daytona Shores Resort, LLC. Uhon Daytona Shores Resorts, LLC is collectively held by Uhon, Inc. (69.6%), four individuals (29.4%), none of which have more than a 10% ownership and Uhon Management, LLC (1.0%), a subsidiary of Uhon, Inc. with Rushan Wu as manager. Uhon, Inc. and Rushan Wu are the sponsors and non-recourse carve-out guarantors of The Shores Resort & Spa Mortgage Loan.
Uhon, Inc. is a real estate development and investment company located in California and founded in August 2015 with a focus in Canada and the U.S. Uhon, Inc. has a 50.00% ownership interests in a 232-unit multifamily property in Canyon County, California, a 32.24% interest in a 564-unit multifamily property in Denver, Colorado and a 50.00% interest in a 254-unit mixed use apartment development that is under construction in Reseda, California. Rushan Wu is the President, Secretary and Treasurer of Uhon, Inc.
The Property. The Shores Resort & Spa Property consists of an 11-story, 212-room beachfront full service hotel located at the southwest corner of South Atlantic Avenue and Florida Shores Boulevard in Daytona Beach Shores, Florida, approximately 4.3 miles southeast of the Daytona Beach Central Business District (“CBD”) and approximately 7.8 miles southeast of the Daytona Beach International Airport. The Shores Resort & Spa Property is situated on two parcels, a hotel parcel and a parking lot parcel connected by an elevated covered walkway, totaling 6.72 acres located on either side of South Atlantic Avenue with approximately 390 feet fronting the Atlantic Ocean. Built in 1974 as a Hilton, The Shores Resort & Spa Property was converted to a boutique hotel in 2005 after undergoing a major renovation. The most recent renovation at The Shores Resort & Spa Property occurred in 2014 and 2015 and included approximately $2.3 million in renovations ($10,816/key).
This is not a research report and was not prepared by any Underwriter’s research department. Please see additional important information and qualifications at the end of this Term Sheet.
T-122
| MSC 2016-UBS12 | The Shores Resort & Spa |
The Shores Resort & Spa Property’s guestroom configuration consists of 140 king rooms, 70 double queen rooms and two suites. The Imperial Suite and Presidential Suite are located on the ninth and tenth floors, respectively. Of the total guestrooms, there are 123 guestrooms with ocean views, 103 with balconies, eight with private terraces and 14 with private cabanas. The guestrooms feature a 42-inch LCD flat screen television, desk, chair, nightstand, three-drawer dresser, sofa chair, iron and ironing board, in-room safe, mini-refrigerator and coffee maker. Premium rooms, such as the oceanfront guestrooms, feature upgraded bathrooms with glass showers, while standard non-view guestrooms feature tub/shower combinations. All guestrooms feature complimentary wired and wireless internet. The Shores Resort & Spa Property includes 258 parking spaces (1.22 spaces per key).
With approximately 252,735 SF of gross building area, The Shores Resort & Spa Property features the Azure Restaurant & Bar, the Tiki Bar, poolside cabana dining, 24-hour room service, eight meeting and banquet spaces totaling approximately 20,289 SF, valet laundry services, a business center, valet parking, a gift shop and free Wi-Fi. Recreational facilities at The Shores Resort & Spa Property include a heated outdoor saltwater swimming pool with two whirlpools, beachfront cabanas, beachside fire pits, a 2,500 SF full-service spa with six treatment rooms and a Vichy shower room, Shores Kid’s Club activity programs and a fitness center.
Since 2010, approximately $4.5 million ($21,056/key) has been spent at The Shores Resort & Spa Property in capital expenditures. Additionally, the sponsor has planned for approximately $1.0 million of capital expenditures, including upgrades to guestrooms, corridors, meeting rooms, public restrooms, building exterior, pool, spa, fitness center, restaurant and technology, for which $1.5 million was reserved at loan origination.
According to the appraisal, The Shores Resort & Spa Property generates approximately 68% of its room revenue from transient demand which includes both commercial and leisure transient business and 32% from meeting and group demand.
More specific information about The Shores Resort & Spa Property and the related competitive set is set forth in the following table:
| Historical Occupancy, ADR, RevPAR(1) | |||||||||
Competitive Set | The Shores Resort & Spa Property(2) | Penetration Factor | |||||||
| Year | Occupancy | ADR | RevPAR | Occupancy | ADR | RevPAR | Occupancy | ADR | RevPAR |
| 2010 | 52.6% | $109.90 | $57.85 | 58.4% | $144.01 | $84.12 | 110.9% | 131.0% | 145.4% |
| 2011 | 53.5% | $111.68 | $59.73 | 65.3% | $144.64 | $94.39 | 122.0% | 129.5% | 158.0% |
| 2012 | 55.5% | $112.27 | $62.32 | 64.5% | $151.96 | $98.08 | 116.3% | 135.4% | 157.4% |
| 2013 | 57.4% | $122.25 | $70.14 | 68.9% | $155.74 | $107.27 | 120.1% | 127.4% | 153.0% |
| 2014 | 61.6% | $122.32 | $75.40 | 68.4% | $156.93 | $107.37 | 111.0% | 128.3% | 142.4% |
| 2015 | 63.8% | $129.26 | $82.46 | 71.4% | $164.07 | $117.11 | 111.9% | 126.9% | 142.0% |
| 8/31/2016 TTM | 65.4% | $132.16 | $86.46 | 69.6% | $170.28 | $118.56 | 106.4% | 128.8% | 137.1% |
Source:Industry Report
| (1) | The competitive set includes Daytona Beach Resort & Conference Center, Hampton Inn Daytona Beach Shores Oceanfront, Holiday Inn Resort Daytona Beach Oceanfront, Plaza Resort & Spa, Hilton Daytona Beach Resort Ocean Walk, El Caribe Resort & Conference Center, Holiday Inn & Suites Daytona Beach On The Ocean and Hyatt Place Daytona Beach Oceanfront. |
| (2) | The minor variances between the underwriting, the appraisal and the industry report data with respect to Occupancy, ADR and RevPAR at The Shores Resort & Spa Property are attributable to variances in reporting methodologies and/or timing differences. |
The Market. The Shores Resort & Spa Property is located in Daytona Beach Shores, Volusia County, Florida, approximately 10.1 miles east of Interstate 95, which provides direct access north to Jacksonville and south to Miami, extending along the east coast of the United States to Canada, and approximately 10.2 miles east of Interstate 4 which provides direct access southwest to Orlando and Tampa. Daytona Beach draws tourists through its beaches, sports teams and Daytona Beach International Speedway. According to the appraisal, Daytona Beach International Speedway is a 480-acre motorsport complex that hosts eight major weekends of racing activity a year, car shows, production vehicle testing and civic and social gatherings, generating an economic impact of approximately $2 billion annually and employing approximately 35,000 in Daytona Beach. The speedway, located approximately 7.3 miles west of The Shores Resort & Spa Property, has been home to the Daytona 500, a NASCAR auto race with viewership of 11.4 million in 2016. Ocean Center, located 3.6 miles north of The Shores Resort & Spa Property, is a 200,000 SF convention facility that hosts approximately 100 events annually including, trade shows, concerts and sporting events.
The Shores Resort & Spa Property is a beachfront hotel overlooking the Atlantic Ocean. Located on a barrier island that consists of Daytona Beach, Daytona Beach Shores, Ormond Beach and other smaller towns, access to The Shores Resort & Spa Property from the mainland is provided by three main bridges, namely the Main Street Bridge, the Broadway Bridge (International Speedway Bridge) and the Port Orange Bridge (Dunlawton Bridge).
According to a third party market research report, the estimated 2016 population within a one-, three- and five-mile radius ofThe Shores Resort & Spa Propertyis 3,097, 34,777 and 98,249, respectively. Estimated 2016 average household income within a one-, three- and five-mile radius ofThe Shores Resort & Spa Propertyis $58,579, $43,536 and $42,865, respectively.
According to an industry report as of August 2016, The Shores Resort & Spa Property is located in the Daytona Beach hospitality market, which consists of 179 hotel properties with a total of 13,492 rooms. The Daytona Beach market had a weighted average occupancy, ADR, and RevPAR of 60.9%, $108.00, and $65.81, respectively over the trailing 12-month period. There has been a growth in occupancy and in ADR of 5.1% and 5.6%, respectively, resulting in an increase of 11.0% in RevPAR over the trailing 12-month period within the Daytona Beach Market.The Shores Resort & Spa Property had an occupancy, ADR and RevPAR of 69.6%, $170.28 and $118.56, respectively over the trailing 12-month period.
This is not a research report and was not prepared by any Underwriter’s research department. Please see additional important information and qualifications at the end of this Term Sheet.
T-123
| MSC 2016-UBS12 | The Shores Resort & Spa |
Primary competitive properties toThe Shores Resort & Spa Property are shown in the table below:
| Competitive Property Summary | ||||||
| Property Name | No. of Rooms | Transient Demand | Meeting & Group Demand | 2015 Occupancy | 2015 ADR | 2015 RevPAR |
| The Shores Resort & Spa Property(1) | 212 | 68% | 32% | 71.4% | $163.94 | $117.02 |
| Plaza Resort & Spa | 322 | 65% | 35% | 55.0% | $130.00 | $71.50 |
| Hilton Daytona Beach Resort/Ocean Walk Village | 744 | 52% | 48% | 74.0% | $136.00 | $100.64 |
| Holiday Inn & Suites Daytona Beach On the Ocean | 123 | 80% | 20% | 61.0% | $128.00 | $78.08 |
| Holiday Inn Resort Daytona Beach Oceanfront | 187 | 75% | 25% | 63.0% | $132.00 | $83.16 |
| Hyatt Place Daytona Beach Oceanfront | 143 | 85% | 15% | 72.0% | $136.00 | $97.92 |
| Hilton Garden Inn Daytona Beach Ocean Front | 141 | 85% | 15% | 23.0% | $130.00 | $29.90 |
| Residence Inn Daytona Beach Oceanfront | 105 | 85% | 15% | 70.0% | $153.00 | $107.10 |
| El Caribe Resort & Conference Center | 110 | 90% | 10% | 78.0% | $70.00 | $54.60 |
| Total/Wtd. Avg. | 1,875 | 67% | 33% | 64.8% | $130.67 | $84.55 |
Source:Appraisal
| (1) | The minor variances between the underwriting, the appraisal and industry report data with respect to Occupancy, ADR and RevPAR at The Shores Resort & Spa Property are attributable to variances in reporting methodologies and/or timing differences. |
Operating History and Underwritten Net Cash Flow. The following table presents certain information relating to the historical operating performance and the Underwritten Net Cash Flow at The Shores Resort & Spa Property:
| Cash Flow Analysis | ||||||
| 2013 | 2014 | 2015 | 8/31/2016 TTM | UW | UW per Room | |
| Occupancy(1) | 68.9% | 68.9% | 71.4% | 69.6% | 69.6% | |
| ADR(1) | $155.71 | $155.70 | $163.94 | $171.22 | $171.22 | |
| RevPAR(1) | $107.26 | $107.20 | $117.02 | $119.17 | $119.17 | |
| Rooms Revenue | $8,299,686 | $8,294,976 | $9,055,068 | $9,246,439 | $9,221,176 | $43,496 |
| Food & Beverage | $5,050,356 | $5,703,037 | $5,997,517 | $5,963,053 | $5,946,761 | $28,051 |
| Other Income(2) | $1,702,200 | $1,607,946 | $1,788,398 | $1,869,149 | $1,864,042 | $8,793 |
| Total Revenue | $15,052,242 | $15,605,959 | $16,840,983 | $17,078,641 | $17,031,978 | $80,340 |
| Total Expenses | $10,293,479 | $10,918,227 | $11,244,258 | $11,357,203 | $10,908,196 | $51,454 |
| Net Operating Income(3) | $4,758,763 | $4,687,732 | $5,596,726 | $5,721,438 | $6,123,782 | $28,886 |
| FF&E | $602,090 | $624,238 | $674,162 | $683,675 | $681,279 | $3,214 |
| Net Cash Flow | $4,156,673 | $4,063,494 | $4,922,563 | $5,037,763 | $5,442,503 | $25,672 |
| NOI DSCR | 2.30x | 2.27x | 2.71x | 2.77x | 2.96x | |
| NCF DSCR | 2.01x | 1.96x | 2.38x | 2.44x | 2.63x | |
| NOI Debt Yield | 14.4% | 14.2% | 17.0% | 17.4% | 18.6% | |
| NCF Debt Yield | 12.6% | 12.3% | 14.9% | 15.3% | 16.5% | |
| (1) | Occupancy, ADR and RevPAR figures have been taken from financial statements provided by The Shores Resort & Spa Borrower. The minor variances between the underwriting, the appraisal and industry report data with respect to Occupancy, ADR and RevPAR at The Shores Resort & Spa Property are attributable to variances in reporting methodologies and/or timing differences. |
| (2) | Other Income includes parking, spa, guest laundry, telephone, pay television, kids club fees and merchandise, resort fees, pet fees and other miscellaneous revenue. |
| (3) | The increase in UW Net Operating Income over 8/31/2016 TTM Net Operating Income is primarily attributed to lower annual insurance premiums going forward (UW: $60,589) due to The Shores Resort & Spa Borrower moving it to a blanket policy, receiving a substantial discount to the previous amount paid (8/31/2016 TTM: $411,127). |
Escrows and Reserves.The Shores Resort & Spa Borrower deposited in escrow $42,153 for real estate taxes and $27,270 for insurance premiums at loan origination and is required to escrow monthly 1/12 of the annual estimated tax payments and 1/12 of the annual estimated insurance premiums. The Shores Resort & Spa Borrower deposited in escrow $1,500,000 for capital expenditures and $333,675 for deferred maintenance at loan origination and is required to deposit monthly for furniture, fixtures and equipment the greater of (i) 1/12 of an amount equal to 4% of annual gross income from the prior fiscal year and (ii) the aggregate amount, if any, to be reserved under the management and franchise agreements (if any), currently estimated at $56,817 (the “FF&E Reserve”). On each monthly payment date during the calendar months of March through July, The Shores Resort & Spa Borrower is required to deposit with the lender an amount equal to the Seasonality Monthly Escrow Amount (as defined below) (“Seasonality Reserve Account”). If at any point in time during the loan term, The Shores Resort & Spa Borrower enters into a franchise agreement with the lender’s written approval, at such point in time, The Shores Resort & Spa Borrower will be required to escrow an amount equal to 125% of the estimated cost to perform its obligations with respect to any property improvement plan, capital improvement, or expenditure plan as required by the franchisor (the “New Franchise Agreement PIP Reserve”). During the continuance of a Future PIP Trigger Event (as defined below) or renewal of a new or replacement franchise agreement, all excess cash flow is required to be deposited in a PIP reserve (“Future PIP Reserve”).
A “Seasonality Monthly Escrow Amount” is, with respect to any twelve-month period commencing on February 1 of the preceding calendar year and continuing through January 31 of the calendar year in which such determination is being made, the aggregate amount of Monthly Net Cash Flow Shortfall (as defined below) less the funds on deposit in the Seasonality Reserve Account, divided by five.
This is not a research report and was not prepared by any Underwriter’s research department. Please see additional important information and qualifications at the end of this Term Sheet.
T-124
| MSC 2016-UBS12 | The Shores Resort & Spa |
A “Monthly Net Cash Flow Shortfall” is, with respect to any calendar month during the loan term, an amount equal to the product of (a) the gross income from operations less (i) the sum of operating expenses, (ii) 125% of the debt service payable for such calendar month, (iii) the deposits required to be made by The Shores Resort & Spa Borrower for reserves (other than the Seasonality Reserve Account) described above in this“—Escrows and Reserves” section and (iv) any other amounts due for such calendar month under the loan documents (“Monthly Net Cash Flow”) and (b) minus 1 (-1); provided that if the Monthly Net Cash Flow is not less than $0, then $0.
A “Future PIP Trigger Event” will commence upon the earlier of (i) the date upon which the franchisor or The Shores Resort & Spa Borrower gives notice of its intention to terminate or cancel or not extend or renew any existing franchise agreement; (ii) the date which is twelve months prior to the then-applicable franchise agreement expiration date; (iii) an event of default under any franchise agreement; (iv) any bankruptcy action of any franchisor; and (v) the franchisor gives notice to The Shores Spa & Resort Borrower of any requirement or request to make improvements and/or replacement of furniture, fixtures and equipment. A Future PIP Trigger Event will continue until, in regard to clauses (i), (ii), (iii), and (iv) above, The Shores Resort & Spa Borrower enters into either (a) a renewal franchise agreement or (b) a replacement franchise that extends not less than five years beyond the maturity date of The Shores Resort & Spa Loan; and in regard to clause (v) above, all improvements and/or replacements required by the franchisor have been completed, among others under the loan agreement.
Lockbox and Cash Management. The Shores Resort & Spa Mortgage Loan provides for a hard lockbox and springing cash management. During the continuance of a Cash Management Trigger Event (as defined below) for The Shores Resort & Spa Mortgage Loan, funds in the lockbox account are required to be transferred to the cash management account once every business day. All funds in the cash management account are required to be applied on each monthly payment date to pay debt service on The Shores Resort & Spa Mortgage Loan, to fund the required reserves deposits as described above under “—Escrows and Reserves,” to pay for any extraordinary expenses approved by the lender, and during the continuance of a Cash Sweep Event (as defined below), to deposit the remainder (i) first, and only to the extent a Cash Sweep Event exists on account of a Future PIP Trigger Event, into the Future PIP Reserve, and (ii) second, into an account to be held by the lender as additional security for The Shores Resort & Spa Mortgage Loan. Provided no event of default has occurred or is continuing under The Shores Resort & Spa Mortgage Loan and no Cash Sweep Event is continuing, the remainder is required to be disbursed to The Shores Resort & Spa Borrower.
A “Cash Management Trigger Event” will occur upon (i) an event of default under The Shores Resort & Spa Mortgage Loan, (ii) any bankruptcy action involving The Shores Resort & Spa Borrower, the guarantor, or the property manager, (iii) the debt service coverage ratio based on the trailing 12-month period falling below 1.25x, (iv) a Future PIP Trigger Event, or (v) if (a) The Shores Resort & Spa Property is self-managed by The Shores Resort & Spa Borrower or any of its affiliates, any fraud or misappropriation of funds or felony indictment of the guarantor, The Shores Resort & Spa Borrower, or affiliated member; or (b) The Shores Resort & Spa Property is managed by a third party property manager, any fraud or misappropriation of funds or felony indictment of the property manager or director or officer of the property manager. A Cash Management Trigger Event will continue until, in regard to clause (i) above, the cure of such event of default and acceptance of such cure by the lender, in regard to clause (ii) above, the filing being discharged, stayed or dismissed within 60 days for The Shores Resort & Spa Borrower or the guarantor, or within 120 days for the property manager, and the lender’s determination that such filing does not materially affect The Shores Resort & Spa Borrower’s, the guarantor’s, or the property manager’s monetary obligations, in regard to clause (iii) above, the date the debt service coverage ratio based on the trailing 12-month period is greater than or equal to 1.30x for two consecutive calendar quarters, in regard to clause (iv) above, The Shores Resort & Spa Borrower enters into either (a) a renewal franchise agreement or (b) a replacement franchise that extends not less than five years beyond the maturity date of The Shores Resort & Spa Loan, or in regard to clause (v) above, The Shores Resort & Spa Borrower engages a qualified manager pursuant to a management agreement or replaces the property manager with a qualified manager.
A “Cash Sweep Event” will occur upon (i) an event of default, (ii) any bankruptcy action involving The Shores Resort & Spa Borrower, the guarantor, or the property manager, (iii) the debt service coverage ratio based on the trailing 12-month period falling below 1.20x, or (iv) a Future PIP Trigger Event. A Cash Sweep Event will continue until, in regard to clause (i) above, the cure of such event of default and acceptance of such cure by the lender, in regard to clause (ii) above, the filing being discharged, stayed or dismissed within 60 days for The Shores Resort & Spa Borrower or the guarantor, or within 120 days for the property manager, and lender’s determination that such filing does not materially affect The Shores Resort & Spa Borrower’s, the guarantor’s, or the property manager’s monetary obligations, in regard to clause (iii) above, the date the debt service coverage ratio based on the trailing 12-month period is greater than or equal to 1.25x for two consecutive calendar quarters, or in regard to clause (iv) above, The Shores Resort & Spa Borrower enters into either (a) a renewal franchise agreement or (b) a replacement franchise that extends not less than five years beyond the maturity date of The Shores Resort & Spa Loan.
Additional Secured Indebtedness (not including trade debts). Not permitted.
Mezzanine Loan and Preferred Equity. The Shores Resort & Spa Mortgage Loan documents permit The Shores Resort & Spa Mortgage Loan sponsor to incur future mezzanine debt that is secured by 100% of the direct or indirect equity interest in The Shores Resort & Spa Borrower subject to, among other conditions: (i) no event of default is continuing under The Shores Resort & Spa Mortgage Loan, (ii) aggregate maximum loan-to-value ratio is not greater than loan-to-value ratio as of the Closing Date, (iii) minimum combined debt service coverage ratio is not less than the debt service coverage ratio as of the Closing Date, (iv) minimum combined total debt yield is not less than the debt yield as of the Closing Date, (v) execution of an intercreditor agreement between The Shores Resort & Spa Mortgage Loan lender and The Shores Resort & Spa mezzanine loan lender and (vi) following a securitization, The Shores Resort & Spa Borrower will deliver a Rating Agency Confirmation to the lender with respect to the future mezzanine debt.
Release of Property. The Shores Resort & Spa Mortgage Loan permits the release of two parcels that are improved by a parking lot and a sky bridge between the hotel and such parking lot (the “Release Parcels”), without payment of a release price, provided no event of default has occurred and is continuing and upon satisfaction of the following conditions, among others: (i) both parcels are released, (ii) The Shores Resort & Spa Borrower delivers a rating agency confirmation and a REMIC opinion with respect to such release, (iii) the deed of such released parcels must contain a restrictive covenant prohibiting such parcels to be developed as any type of hospitality property, (iv) evidence that the Release Parcels and the remaining The Shores Resort & Spa Property are fully compliant with all zoning requirements, including minimum parking requirements, (v) the Release Parcels will constitute a separate tax lot, (vi) the debt service coverage ratio for the remaining The Shores Resort & Spa Property will not be less than the debt service coverage ratio as of the origination date; (vii) the loan-to-value ratio for the remaining The Shores Resort & Spa Property will not be greater than the loan-to-value ratio as of the origination date; and (viii) an officer’s certificate certifying that all requirements for release have been satisfied.
Terrorism Insurance.The Shores Resort & Spa Borrower is required to obtain and maintain property insurance, commercial general liability insurance, and business income or rental loss insurance that covers perils of terrorism and acts of terrorism, both foreign and domestic.
This is not a research report and was not prepared by any Underwriter’s research department. Please see additional important information and qualifications at the end of this Term Sheet.
T-125
| MSC 2016-UBS12 | Federal Way Crossings I & II |
| Mortgage Loan No. 11 – Federal Way Crossings I & II |
| Mortgage Loan Information | Property Information | ||||||
| Mortgage Loan Seller: | UBS AG | Single Asset/Portfolio: | Single Asset | ||||
| Original Balance(1): | $32,500,000 | Location: | Federal Way, WA 98003 | ||||
| Cut-off Date Balance(1): | $32,457,888 | General Property Type: | Retail | ||||
| % of Initial Pool Balance: | 3.9% | Detailed Property Type: | Anchored | ||||
| Loan Purpose: | Refinance | Title Vesting: | Fee | ||||
| Sponsor: | Firoz Lalji; Altaf Habib Jiwani | Year Built/Renovated: | 2006-2007/N/A | ||||
| Mortgage Rate: | 4.5888% | Size: | 207,686 SF | ||||
| Note Date: | 10/28/2016 | Cut-off Date Balance per SF(1): | $279 | ||||
| First Payment Date: | 12/6/2016 | Maturity Date Balance per SF(1): | $227 | ||||
| Maturity Date: | 11/6/2026 | Property Manager: | Self-Managed | ||||
| Original Term to Maturity: | 120 months | ||||||
| Original Amortization Term: | 360 months | ||||||
| IO Period: | 0 months | Underwriting and Financial Information | |||||
| Seasoning: | 1 month | UW NOI: | $5,014,986 | ||||
| Prepayment Provisions(2): | LO (25); DEF (90); O (5) | UW NOI Debt Yield(1): | 8.7% | ||||
| Lockbox/Cash Mgmt Status: | Springing/Springing | UW NOI Debt Yield at Maturity(1): | 10.6% | ||||
| Additional Debt Type(3): | Pari Passu | UW NCF DSCR(1): | 1.36x | ||||
| Additional Debt Balance(3): | $25,466,958 | Most Recent NOI: | $4,922,040 (7/31/2016 TTM) | ||||
| Future Debt Permitted (Type): | No (N/A) | 2nd Most Recent NOI: | $5,137,215 (12/31/2015) | ||||
| Reserves | 3rd Most Recent NOI: | $4,856,498 (12/31/2014) | |||||
| Type | Initial | Monthly | Cap | Most Recent Occupancy: | 98.7% (8/1/2016) | ||
| RE Tax: | $206,875 | $57,465 | N/A | 2nd Most Recent Occupancy: | 99.1% (12/31/2015) | ||
| Insurance: | $45,386 | $4,282 | N/A | 3rd Most Recent Occupancy: | 99.5% (12/31/2014) | ||
| Recurring Replacements: | $0 | $2,596 | N/A | Appraised Value (as of): | $83,100,000 (8/17/2016) | ||
| TI/LC: | $680,000 | Springing | $680,000 | Cut-off Date LTV Ratio(1): | 69.7% | ||
| Other: | $22,500 | Springing | N/A | Maturity Date LTV Ratio(1): | 56.7% | ||
| Sources and Uses | ||||||
| Sources | Proceeds | % of Total | Uses | Proceeds | % of Total | |
| Loan Amount(1): | $58,000,000 | 100.0% | Loan Payoff: | $48,466,796 | 83.6% | |
| Reserves: | $954,760 | 1.6% | ||||
| Closing Costs: | $514,526 | 0.9% | ||||
| Return of Equity: | $8,063,917 | 13.9% | ||||
| Total Sources: | $58,000,000 | 100.0% | Total Uses: | $58,000,000 | 100.0% | |
| (1) | The Federal Way Crossings Mortgage Loan is part of the Federal Way Crossings Whole Loan, which is comprised of fivepari passu promissory notes with an aggregate original principal balance of $58,000,000. The Cut-off Date Balance per SF, Maturity Date Balance per SF, UW NOI Debt Yield, UW NOI Debt Yield at Maturity, UW NCF DSCR, Cut-off Date LTV Ratio and Maturity Date LTV Ratio numbers presented above are based on the aggregate principal balance of the promissory notes comprising the Federal Way Crossings Whole Loan. |
| (2) | Defeasance is permitted at any time after the end of the two-year period commencing on the closing date of the securitization of the last Federal Way Crossings Whole Loan promissory note to be securitized. |
| (3) | See “—The Mortgage Loan” below for further discussion of additional debt. |
The Mortgage Loan. The eleventh largest mortgage loan (the “Federal Way Crossings Mortgage Loan”) is part of a whole loan (the “Federal Way Crossings Whole Loan”) evidenced by fivepari passu promissory notes in the aggregate original principal amount of $58,000,000, all of which are secured by a first priority fee mortgage encumbering a 207,686 SF anchored retail center located in Federal Way, Washington (the “Federal Way Crossings Property”). Promissory Note A-1, Promissory Note A-3 and Promissory Note A-4, in the aggregate original principal amount of $32,500,000, represent the Federal Way Crossings Mortgage Loan and will be included in the MSC 2016-UBS12 Trust. Promissory Note A-2 and Promissory Note A-5, in the aggregate original principal amount of $25,500,000, represent the serviced companion loans (the “Federal Way Crossings ServicedPari Passu Companion Loans”). The Federal Way Crossings ServicedPari Passu Companion Loans are currently held by UBS AG, by and through its branch office at 1285 Avenue of the Americas, New York, New York (“UBS AG, New York Branch”), or an affiliate thereof, and may be contributed to one or more future securitization transactions or otherwise transferred at any time. The Federal Way Crossings Mortgage Loan will be serviced pursuant to the pooling and servicing agreement for the MSC 2016-UBS12 Trust. See “—Description of the Mortgage Pool—The Whole Loans—The Serviced Pari Passu Whole Loans” and “Pooling and Servicing Agreement” in the Preliminary Prospectus.
The proceeds of the Federal Way Crossings Whole Loan were primarily used to refinance existing debt on the Federal Way Crossings Property, fund upfront reserves, pay closing costs and return equity to the sponsor. The most recent prior financing of the Federal Way Crossings Property was included in the MLCFC 2006-4 transaction and the MLCFC 2007-8 transaction.
The Borrower and the Sponsor. The borrowers are Federal Way Crossings Owner LLC and Trimark FWC Owner LLC (collectively, the “Federal Way Crossings Borrowers” and individually each a “Federal Way Crossings Borrower”), each a single-purpose Delaware limited liability company structured to be bankruptcy-remote, with two independent directors. The Federal Way Crossings Borrowers own the Federal Way Crossings Property as tenants-
This is not a research report and was not prepared by any Underwriter’s research department. Please see additional important information and qualifications at the end of this Term Sheet.
T-126
| MSC 2016-UBS12 | Federal Way Crossings I & II |
in-common. The Federal Way Crossings Mortgage Loan sponsors and the nonrecourse carve-out guarantors are Firoz Lalji and Altaf Habib Jiwani. Firoz Lalji is the Founder and Chief Executive Officer of the Fana Group of Companies, a privately owned real estate investment and development company with a diversified portfolio in the United States, Canada, and the Caribbean. The Fana Group of Companies currently owns and operates in excess of 1.5 million SF of commercial and hospitality properties. Mr. Lalji is also the Founder and Chief Executive Officer of Zones Inc. Zones Inc. is a privately held national provider of information technology products and solutions to businesses and the public sector. Altaf Habib Jiwani is the developer, owner and manager of commercial and multifamily properties at Trimark Property Group, LLC, with a focus on commercial, office and/or multifamily properties in Washington State and British Columbia.
The Property.The Federal Way Crossings Property is a 207,686 SF anchored retail center located in Federal Way, Washington, approximately 3.0 miles south of the Federal Way Central Business District (“CBD”). The Federal Way Crossings Property consists of 14 buildings built in 2006 and 2007. Situated on a 19.4-acre site, the Federal Way Crossings Property has approximately 1,001 surface parking spaces (4.8 per 1,000 SF). The Federal Way Crossings Property is occupied by a diverse mix of national and local tenants including Sportsman’s Warehouse, Fitness International, LLC (“LA Fitness”), Office Depot, Inc. (“Office Depot”), Starbucks Corporation, Jamba Juice Company and GNC. Anchor and major tenants at the Federal Way Crossings Property include Sportsman’s Warehouse (23.6% of NRA, 14.5% of underwritten rent), LA Fitness (21.7% of NRA, 20.1% underwritten rent), Trampoline Nation (8.9% of NRA, 4.4% of underwritten rent) and Office Depot (8.8% of NRA, 5.9% of underwritten rent). No other tenant at the Federal Way Crossings Property leases more than 3.0% of NRA or represents more than 5.4% of underwritten rent.
The Federal Way Crossings Property is 98.7% occupied as of August 1, 2016 by 31 tenants excluding Taco Del Mar (1,440 SF) and 99 Bottles, LLC (1,345 SF) both of which have vacated or are vacating on September 30, 2016 and December 31, 2016, respectively. The Federal Way Crossings Property was developed by the sponsors in two phases over 2006 (four buildings) and 2007 (10 buildings) with a total cost basis of approximately $70.9 million. Since 2008, the Federal Way Crossings Property has had an average occupancy of 97.9%.
Major Tenants.
Sportsman’s Warehouse (49,009 SF, 23.6% of NRA, 14.5% of underwritten rent). Founded in 1986 as a single retail store in Midvale, Utah, Sportsman’s Warehouse is an outdoor sporting goods retailer currently operating 66 stores across 20 states in the U.S. totaling approximately 2.8 million SF as of January 30, 2016. Its stores range from 15,000 to 65,000 SF, with an average size of approximately 44,000 SF. Sportsman’s Warehouse sells apparel, footwear and gear which caters to sportsmen and sportswomen with interests in hunting, shooting, reloading, camping, fishing and other outdoor recreational activities. Sportsman’s Warehouse has been at the Federal Way Crossings Property since June 2006 and currently occupies 49,009 SF under a lease expiring in June 2021. The lease requires a current rental rate of $15.50 PSF on a triple net basis. Sportsman’s Warehouse has five five-year renewal options remaining and no termination options.
Fitness International, LLC (LA Fitness) (45,000 SF, 21.7% of NRA, 20.1% of underwritten rent).Founded in 1984, LA Fitness is an Irvine, California-based American health club chain. The privately owned company currently operates over 800 clubs across the U.S. and Canada. LA Fitness is open seven days a week at the Federal Way Crossings Property with facilities including equipment and cardio area, basketball, racquetball, indoor pool, whirlpool spa, sauna, group fitness classes, indoor cycling, “kids klub”, personal training, a juice bar and Wi-Fi. LA Fitness has been at the Federal Way Crossings Property since June 2006 and currently occupies 45,000 SF under a lease expiring in June 2021. The lease requires a current rental rate of $23.41 PSF on a triple net basis. LA Fitness has three five-year renewal options remaining and no termination options.
Trampoline Nation (18,510 SF, 8.9% of NRA, 4.4% of underwritten rent). Founded in 2011, Trampoline Nation has over 12,000 SF of trampolines consisting of 5,000 SF of trampolines arranged together, high performance trampoline beds, a dodgeball zone and two big high performance trampolines. Trampoline Nation occupies 18,510 SF under a lease expiring in August 2018 and pays a current rental rate of $12.00 PSF on a triple net basis, which will increase to $12.50 PSF in September 2017. Trampoline Nation has two three-year renewal options remaining and no termination options.
Office Depot, Inc. (18,191 SF, 8.8% of NRA, 5.9% of underwritten rent). Founded in 1986, Office Depot (NASDAQ: ODP) (Moody’s/S&P: B1/B-) is an office supply company headquartered in Boca Raton, Florida. Office Depot’s products include technology, office supplies, facilities products, furniture and school essentials and it provides a variety of services including copy and print, technical services, mailing and shipping. As of year-end 2015, Office Depot had approximately 1,711 retail stores and 49,000 employees worldwide, operating under several banner brands including Office Depot, OfficeMax, OfficeMax Grand & Toy, Reliable and Viking. Office Depot has been at the Federal Way Crossings Property since June 2006 and currently occupies 18,191 SF under a lease expiring in June 2023. The lease requires a current rental rate of $17.00 PSF on a triple net basis, which will increase to $17.68 PSF in July 2021. Office Depot has four five-year renewal options remaining and no termination options.
This is not a research report and was not prepared by any Underwriter’s research department. Please see additional important information and qualifications at the end of this Term Sheet.
T-127
| MSC 2016-UBS12 | Federal Way Crossings I & II |
The following table presents certain information relating to the leases at the Federal Way Crossings Property:
| Tenant Summary(1) | |||||||
| Tenant Name | Credit Rating (Fitch/ Moody’s/ S&P)(2) | Tenant SF | Approximate % of SF | Annual UW Rent | % of Total Annual UW Rent | Annual UW Rent PSF(3) | Lease Expiration |
| Anchor/Major Tenants | |||||||
| Sportsman’s Warehouse | NR/NR/NR | 49,009 | 23.6% | $759,640 | 14.5% | $15.50 | 6/30/2021 |
| LA Fitness | NR/NR/NR | 45,000 | 21.7% | $1,053,633 | 20.1% | $23.41 | 6/29/2021 |
| Trampoline Nation | NR/NR/NR | 18,510 | 8.9% | $231,375 | 4.4% | $12.50 | 8/31/2018 |
| Office Depot | NR/B1/B- | 18,191 | 8.8% | $309,247 | 5.9% | $17.00 | 6/30/2023 |
| Subtotal/Wtd. Avg. | 130,710 | 62.9% | $2,353,894 | 44.9% | $18.01 | ||
| Other Tenants(4) | 74,191 | 35.7% | $2,891,815 | 55.1% | $38.98 | ||
| Vacant | 2,785 | 1.3% | $0 | 0.0% | $0.00 | ||
| Total/Wtd. Avg. | 207,686 | 100.0% | $5,245,709 | 100.0% | $25.60 | ||
| (1) | Information is based on the underwritten rent roll. |
| (2) | Certain ratings are those of the parent company whether or not the parent guarantees the lease. |
| (3) | Wtd. Avg. Annual UW Rent PSF excludes vacant space. |
| (4) | Excludes McDonald’s and Verizon Wireless, both of which own their own improvements and are not part of the collateral. McDonald’s and Verizon Wireless pay a small amount of operating expense recoveries. |
The following table presents certain information relating to the lease rollover schedule at the Federal Way Crossings Property:
Lease Rollover Schedule(1)(2)
| ||||||||
| Year | # of Leases Rolling | SF Rolling | Annual UW Rent PSF Rolling(3) | Approx. % of Total SF Rolling | Approx. Cumulative % of SF Rolling | Total UW Rent Rolling | Approx. % of Total Rent Rolling | Approx. Cumulative % of Total Rent Rolling |
| MTM | 2 | 3,446 | $40.71 | 1.7% | 1.7% | $140,286 | 2.7% | 2.7% |
| 2016 | 1 | 5,094 | $31.90 | 2.5% | 4.1% | $162,498 | 3.1% | 5.8% |
| 2017 | 5 | 17,355 | $38.77 | 8.4% | 12.5% | $672,846 | 12.8% | 18.6% |
| 2018 | 2 | 21,529 | $15.09 | 10.4% | 22.8% | $324,964 | 6.2% | 24.8% |
| 2019 | 3 | 8,632 | $36.22 | 4.2% | 27.0% | $312,670 | 6.0% | 30.8% |
| 2020 | 2 | 5,948 | $30.05 | 2.9% | 29.9% | $178,746 | 3.4% | 34.2% |
| 2021 | 9 | 105,504 | $21.53 | 50.8% | 80.7% | $2,271,249 | 43.3% | 77.5% |
| 2022 | 2 | 5,397 | $44.89 | 2.6% | 83.3% | $242,263 | 4.6% | 82.1% |
| 2023 | 1 | 18,191 | $17.00 | 8.8% | 92.0% | $309,247 | 5.9% | 88.0% |
| 2024 | 1 | 3,402 | $42.50 | 1.6% | 93.7% | $144,585 | 2.8% | 90.7% |
| 2025 | 0 | 0 | $0.00 | 0.0% | 93.7% | $0 | 0.0% | 90.7% |
| 2026 | 2 | 4,217 | $48.33 | 2.0% | 95.7% | $203,820 | 3.9% | 94.6% |
| 2027 & Beyond | 1 | 6,186 | $45.67 | 3.0% | 98.7% | $282,535 | 5.4% | 100.0% |
| Vacant | 0 | 2,785 | $0.00 | 1.3% | 100.0% | $0 | 0.0% | 100.0% |
| Total/Wtd. Avg. | 31 | 207,686 | $25.60 | 100.0% | $5,245,709 | 100.0% | ||
| (1) | Information is based on the underwritten rent roll. |
| (2) | Certain tenants may have lease termination options that are exercisable prior to the originally stated expiration date of the subject lease and that are not considered in the lease rollover schedule. |
| (3) | Wtd. Avg. Annual UW Rent PSF Rolling excludes vacant space. |
The Market. The Federal Way Crossings Property is located in Federal Way, King County, Washington, approximately 3.0 miles south of the Federal Way CBD and between the major employment centers of Seattle, approximately 25.0 miles north of the Federal Way Crossing Property, and Tacoma, approximately 10.8 miles southwest of the Federal Way Crossings Property. Primary access to the Federal Way Crossings Property’s neighborhood is provided by Pacific Highway South and South 348th Street/State Route 18. The intersection at Pacific Highway South and South 348th Street/State Route 18 experiences traffic counts of 38,095 vehicles daily, according to a third party market research report.
The Commons at Federal Way, an approximately 775,000 SF regional mall originally opened in 1975, is approximately 2.3 miles north of the Federal Way Crossings Property. Anchor tenants include Macy’s, Dick’s Sporting Goods, Target, Sears, Kohl’s and Century Theaters with freestanding restaurants including McGrath’s Fish House, Applebee’s, Azteca, Red Robin and Buffalo Wild Wings. To the south of the Federal Way Crossings Property, is a Lowes Home Improvement Warehouse built in 2007. Also along Pacific Highway and north of South 348th Street is a Walmart Supercenter built in 2005. To the east of the Federal Way Crossings Property is West Campus Square, an older center anchored by Hobby Lobby, Costco and Home Depot. Seattle Children’s also took over the former Circuit City space at West Campus Square. In addition, the 318,000 SF Christian Faith Center is located 1.1 miles northeast of the Federal Way Crossings Property, with a congregation of approximately 7,500.
According to a third party market research report, the estimated 2016 population within a one-, three- and five-mile radius of the Federal Way Crossings Property is 4,461, 87,561 and 207,801, respectively. The radii have shown moderate growth since 2000 and are projected to grow at average annual
This is not a research report and was not prepared by any Underwriter’s research department. Please see additional important information and qualifications at the end of this Term Sheet.
T-128
| MSC 2016-UBS12 | Federal Way Crossings I & II |
rates of 1.4%, 1.2% and 1.2%, respectively, through 2021. The estimated 2016 average household income within a one-, three- and five-mile radius of the Federal Way Crossings Property is $78,436, $76,029 and $77,769, respectively.
According to a third party market research report, the Federal Way Crossings Property is located in the Federal Way/Auburn retail submarket. As of the second quarter of 2016, the Federal Way/Auburn retail submarket had an overall vacancy rate of 4.9% and an average asking annual lease rate of $16.20 PSF. According to a third party market research report, the Federal Way/Auburn retail submarket contains 704 buildings accounting for approximately 10.5 million SF of retail space.
The following table presents leasing data at certain retail competitive properties with respect to the Federal Way Crossings Property:
| Competitive Property Summary | |||||||
| Property Location | Year Built | Tenant | Lease Area (SF) | Lease Date | Lease Term | Base Rent PSF | Lease Type |
3235 NW Plaza Road Silverdale, WA | 1996 | Pier 1 Imports | 10,000 | Mar-2015 | 10.0 yrs | $17.40 | NNN |
4801 Rainier Avenue South Seattle, WA | 2015 | PCC Natural Grocer | 25,105 | 2015 | 20.0 yrs | $22.00 | NNN |
Confidential Puget Sound Location | 2005 | Petco | 12,500 | Feb-15 | 11.0 yrs | $18.50 | NNN |
301 East Wallace-Kneeland Blvd Shelton, WA | 1994 | Shelton Fred Meyer | 68,000 | Nov-14 | 10.0 yrs | $12.08 | NNN |
Confidential Puget Sound Location | 2005 | Sports Authority | 36,487 | Oct-14 | 10.0 yrs | $15.50 | NNN |
1500 South Burlington Boulevard Burlington, WA | 1990 | Burlington Coat Factory | 58,400 | Mar-14 | 10.0 yrs | $12.00 | NNN |
4701 Point Fosdick Drive NW Gig Harbor, WA | 2007 | Home Goods | 20,500 | Aug-14 | 10.0 yrs | $12.95 | NNN |
Confidential Address Seattle, WA | 1994 | Confidential Safeway Renewal | 64,186 | Jul-14 | 10.0 yrs | $17.27 | NNN |
120 31st Avenue Southeast Puyallup, WA | 1995 | Total Wine and More | 32,383 | Feb-14 | 10.0 yrs | $11.90 | NNN |
1800 South 320th Street Federal Way, WA | 1979 | Home Goods | 22,698 | Jun-13 | 10.0 yrs | $10.93 | NNN |
35020 Enchanted Parkway South Federal Way, WA | 1995 | Hobby Lobby | 55,000 | Feb-13 | 10.0 yrs | $6.00 | NNN |
Source:Appraisal
Operating History and Underwritten Net Cash Flow.The following table presents certain information relating to the historical operating performance and the Underwritten Net Cash Flow at the Federal Way Crossings Property:
| Cash Flow Analysis | |||||||
| 2013 | 2014 | 2015 | 7/31/2016 TTM | UW | UW PSF | ||
| Base Rent(1) | $5,063,677 | $5,114,164 | $5,175,815 | $5,206,433 | $5,367,242 | $25.84 | |
| Total Recoveries(2) | $1,516,034 | $1,582,048 | $1,650,291 | $1,637,465 | $1,661,867 | $8.00 | |
| Other Income | $33,309 | $32,954 | $39,346 | $69,068 | $39,300 | $0.19 | |
| Less Vacancy & Credit Loss | ($208,625) | ($160,606) | ($46,206) | ($25,786) | ($351,455) | ($1.69) | |
| Effective Gross Income | $6,404,395 | $6,568,560 | $6,819,246 | $6,887,181 | $6,716,953 | $32.34 | |
| Total Operating Expenses | $1,612,034 | $1,712,062 | $1,682,031 | $1,965,141 | $1,701,967 | $8.19 | |
| Net Operating Income | $4,792,362 | $4,856,498 | $5,137,215 | $4,922,040 | $5,014,986 | $24.15 | |
| Capital Expenditures | $0 | $0 | $0 | $0 | $31,153 | $0.15 | |
| TI/LC | $0 | $0 | $0 | $0 | $148,387 | $0.71 | |
| Net Cash Flow | $4,792,362 | $4,856,498 | $5,137,215 | $4,922,040 | $4,835,446 | $23.28 | |
| Occupancy %(3) | 96.2% | 99.5% | 99.1% | 98.7% | 95.0% | ||
| NOI DSCR(4) | 1.34x | 1.36x | 1.44x | 1.38x | 1.41x | ||
| NCF DSCR(4) | 1.34x | 1.36x | 1.44x | 1.38x | 1.36x | ||
| NOI Debt Yield(4) | 8.3% | 8.4% | 8.9% | 8.5% | 8.7% | ||
| NCF Debt Yield(4) | 8.3% | 8.4% | 8.9% | 8.5% | 8.3% | ||
| (1) | UW Base Rent is grossed up for vacant space and includes (i) approximately $8,192 of straight line average contractual rent steps for investment grade tenant Starbucks Corporation, (ii) approximately $15,865 of percentage rent for Puerto Vallarta, underwritten to its in-place breakpoint of $1.08 million and percentage rent of 10% based on sales for the trailing 12-month period ending July 2016, and (iii) approximately $92,250 of additional contractual rent steps through November 2017. |
| (2) | Includes McDonald’s and Verizon Wireless, both of which own their own improvements and are not part of the collateral. McDonald’s and Verizon Wireless pay a small amount of operating expense recoveries. |
| (3) | 7/31/2016 TTM Occupancy % as of August 1, 2016. UW Occupancy % is based on underwritten economic occupancy. |
| (4) | Debt service coverage ratios and debt yields are based on the Federal Way Crossings Whole Loan. |
This is not a research report and was not prepared by any Underwriter’s research department. Please see additional important information and qualifications at the end of this Term Sheet.
T-129
| MSC 2016-UBS12 | Novo Nordisk |
| Mortgage Loan No. 12 – Novo Nordisk |
| Mortgage Loan Information | Property Information | |||||||
| Mortgage Loan Seller: | Natixis | Single Asset/Portfolio: | Single Asset | |||||
| Original Balance(1): | $20,000,000 | Location: | Plainsboro, NJ 08536 | |||||
| Cut-off Date Balance(1): | $20,000,000 | General Property Type: | Office | |||||
| % of Initial Pool Balance: | 2.4% | Detailed Property Type: | Suburban | |||||
| Loan Purpose: | Acquisition | Title Vesting: | Fee | |||||
| Sponsor: | Princeton HD Owner LLC | Year Built/Renovated: | 1985/2013 | |||||
| Mortgage Rate: | 3.4820% | Size: | 761,824 SF | |||||
| Note Date: | 8/11/2016 | Cut-off Date Balance per SF(1): | $221 | |||||
| Anticipated Repayment Date: | 9/5/2021 | Maturity Date or ARD Balance per SF(1): | $221 | |||||
| Maturity Date: | 4/30/2031 | Property Manager: | Ivy Realty Services, LLC | |||||
| First Payment Date: | 10/5/2016 | |||||||
| Effective Maturity Date(2): | 9/5/2021 | |||||||
| Original Term to ARD: | 60 months | |||||||
| Original Amortization Term: | 0 months | Underwriting and Financial Information | ||||||
| IO Period: | 60 months | UW NOI: | $17,714,312 | |||||
| Seasoning: | 3 months | UW NOI Debt Yield(1): | 10.5% | |||||
| Prepayment Provisions: | LO (27); DEF (30); O (3) | UW NOI Debt Yield at Maturity or ARD(1): | 10.5% | |||||
| Lockbox/Cash Mgmt Status: | Hard/In Place | UW NCF DSCR(1): | 2.97x | |||||
| Additional Debt Type: | Pari Passu | Most Recent NOI: | $14,687,857 (5/31/2016 TTM) | |||||
| Additional Debt Balance: | $148,300,000 | 2nd Most Recent NOI: | $14,399,114 (12/31/2015) | |||||
| Future Debt Permitted (Type): | No (N/A) | 3rd Most Recent NOI: | $14,476,650 (12/31/2014) | |||||
| Reserves(3) | Most Recent Occupancy: | 78.0% (11/1/2016) | ||||||
| Type | Initial | Monthly | Cap | 2nd Most Recent Occupancy(5): | 69.4% (12/31/2015) | |||
| RE Tax: | $931,323 | $465,662 | N/A | 3rd Most Recent Occupancy(5): | 69.4% (12/31/2014) | |||
| Insurance(4): | $39,186 | $19,593 | N/A | Appraised Value (as of): | $319,900,000 (6/1/2016) | |||
| Recurring Replacements: | $0 | $3,656 | N/A | Cut-off Date LTV Ratio(1): | 52.6% | |||
| LTV Ratio at Maturity Date or ARD(1): | 52.6% | |||||||
| Sources and Uses | ||||||
| Sources | Proceeds | % of Total | Uses | Proceeds | % of Total | |
| Loan Amount(3): | $168,300,000 | 47.4% | Purchase Price: | $305,000,000 | 85.9% | |
| Expansion Space TI/LC Advance(3): | $16,580,000 | 4.7% | Expansion Space TI/LC Advance(3): | $16,580,000 | 4.7% | |
| Earnout Advance(3): | $23,000,000 | 6.5% | Earnout Advance(3): | $23,000,000 | 6.5% | |
| Borrower Equity: | $147,128,537 | 41.4% | Reserves: | $970,510 | 0.3% | |
| Closing Costs: | $9,458,027 | 2.7% | ||||
| Total Sources: | $355,008,537 | 100.0% | Total Uses: | $355,008,537 | 100.0% | |
| (1) | The Novo Nordisk Mortgage Loan is a part of the Novo Nordisk Whole Loan, which is comprised of 13pari passunotes with an aggregate original principal balance of $168,300,000 and maximum principal balance of $207,880,000. The Cut-off Date Balance per SF, Maturity Date or ARD Balance per SF, UW NCF DSCR, UW NOI Debt Yield, UW NOI Debt Yield at Maturity or ARD, Cut-off Date LTV Ratio and Maturity Date or ARD LTV Ratio numbers presented above are based on the Novo Nordisk Whole Loan. Based on the maximum principal balance of the Novo Nordisk Whole Loan, the “as-expanded” appraised value and the fully funded Underwritten Net Cash Flow, the Cut-off Date Balance per SF, Maturity Date or ARD Balance per SF, UW NOI Debt Yield, UW NOI Debt Yield at Maturity or ARD, Cut-off Date LTV Ratio and LTV Ratio at Maturity Date or ARD are $272.87, $272.87, 10.6%, 10.6%, 60.7% and 60.7%, respectively. The initial fully funded NCF debt service coverage ratio is 2.71x. There is no assurance as to whether or not the maximum principal balance will be funded. |
| (2) | The Novo Nordisk Whole Loan has an anticipated repayment date (“ARD”) of September 5, 2021 and a stated maturity date of April 30, 2031. In the event the Novo Nordisk Whole Loan is not repaid in full by the ARD, the interest rate will increase to an amount equal to the sum of (i) the initial interest rate of 3.4820% and (ii) 3.0000% plus the amount (if any) by which the five-year treasury rate exceeds 2.5000% (the “Adjusted Interest Rate”). Interest at the Adjusted Interest Rate is required to be paid currently. After the ARD and provided no event of default has occurred and is continuing under the Novo Nordisk Whole Loan documents, all excess cash flow with respect to the Novo Nordisk Property is required to be applied to pay down the principal of the Novo Nordisk Mortgage Loan. Such excess cash flow is paid after payment of interest on the Novo Nordisk Whole Loan at the Adjusted Interest Rate. |
| (3) | The Novo Nordisk Whole Loan maximum principal loan balance is $207,880,000. Note A-2 (with a maximum principal of $39,580,000) is unfunded at the time of this term sheet; however, the holder of Note A-2 is required to make advances available for (i) approved tenant improvements and leasing commissions (estimated to be $16,580,000) (“Expansion Space TI/LC Advance”) in connection with the exercise of Novo Nordisk Inc.’s right under its lease to take expansion space (the “Expansion Space”) at the Novo Nordisk Property, which right may be exercised at any time during the lease term and (ii) earnout funds (estimated to be $23,000,000) (the “Earnout Advance”). One or more Earnout Advances will be available to be drawn and released to the seller of the Novo Nordisk Property at such time or times as Novo Nordisk Inc. accepts all or a portion of the Expansion Space under its lease and commences paying rent for such space. Notwithstanding the foregoing, in the event that the Earnout Advances have not been fully drawn on or prior to October 5, 2019, then, on such date, $4,000,000 of the remaining Earnout Advance will be irrevocably waived. The Expansion Space TI/LC Advance will be available at any time prior to July 5, 2021 during the Novo Nordisk Whole Loan term. |
| (4) | The tenant related insurance reserve is waived so long as (i) the Novo Nordisk Inc. (“Novo”) lease is in full force and effect and Novo is the sole tenant at the Novo Nordisk Property; (ii) Novo is obligated to pay the insurance premiums directly pursuant to the terms of the Novo lease and the insurance requirements and coverages set forth under the Novo lease have not been modified and are acceptable to the servicer; (iii) there is no event of default under the Novo Nordisk Whole Loan; (iv) there is no monetary default or material nonmonetary default under the Novo lease, (v) Novo Lease Guarantor maintains a long-term unsecured credit rating by S&P or Moody’s of at least BBB- or the equivalent rating; and (vi) the Novo Nordisk Borrower provides acceptable evidence of timely payment of such insurance premiums. |
| (5) | Historical occupancy obtained from the Novo lease and underwritten rent roll. As of November 1, 2016, the Novo Nordisk Property was 69.4% occupied and 78.0% leased by Novo. UW NOI increased from the most recent NOI as UW Base Rent includes increases from 5/31/2016 TTM as it includes rent on the first mandatory expansion of 65,174 square feet, totaling $2,049,592 and rent averaging through September 5, 2021, totaling $973,363, and a vacancy gross up of $4,723,992. |
This is not a research report and was not prepared by any Underwriter’s research department. Please see additional important information and qualifications at the end of this Term Sheet.
T-130
| MSC 2016-UBS12 | Novo Nordisk |
The Mortgage Loan. The twelfth largest mortgage loan (the “Novo Nordisk Mortgage Loan”) is part of a whole loan (the “Novo Nordisk Whole Loan”) evidenced by 13pari passu promissory notes in the aggregate original principal amount of $168,300,000 and maximum principal balance of $207,880,000 which are secured by a first priority fee mortgage encumbering nine interconnected Class A office buildings totaling 761,824 SF known as Novo Nordisk North American Headquarters located in Plainsboro, New Jersey (the “Novo Nordisk Property”). Promissory Note A-6 in the original principal balance of $20,000,000 represents the Novo Nordisk Mortgage Loan. Promissory Notes A-1, A-2, A-3, A-4, A-5, A-7, A-8, A-9, A-10, A-11, A-12, and A-13, in the aggregate original principal balance of $148,300,000 and maximum principal balance of $187,880,000 represent pari passu companion loans (collectively, the “Novo Nordisk Companion Loans”). Promissory Notes A-3, A-4, A-5, A-11 and A-12, with an aggregate original principal amount of $73,300,000, were contributed to the WFCM 2016-NXS6 securitization trust. Controlling Promissory Note A-1 and non-controlling Promissory Notes A-7, A-8, A-9, A-10 and A-13, with an aggregate original principal balance of $75,000,000 are currently held by Natixis Real Estate Capital LLC and may be contributed to future securitizations or otherwise transferred at any time. The non-controlling promissory Note A-2 (unfunded as of the date of this term sheet) has a maximum principal balance of $39,580,000 and will be held by Natixis Real Estate Capital, LLC. The obligation to fund Note A-2 will be the sole responsibility of the holder of Note A-2 (currently Natixis Real Estate Capital LLC), and will not be the responsibility of the trust. The Novo Nordisk Whole Loan is being serviced pursuant to the pooling and servicing agreement for the WFCM 2016-NXS6 securitization trust until the controlling promissory note is sold into a securitization trust, at which time the Novo Nordisk Whole Loan will be serviced pursuant to the pooling and servicing agreement for the securitization trust into which such controlling promissory note is deposited. See “—Description of the Mortgage Pool—The Whole Loans—The Non-Serviced Pari Passu Whole Loans” and “Pooling and Servicing Agreement—Servicing of the Non-Serviced Mortgage Loans” in the Preliminary Prospectus. Proceeds from the Novo Nordisk Whole Loan, together with an equity contribution of over $147 million from the Novo Nordisk Mortgage Loan sponsor were used to purchase the Novo Nordisk Property, fund reserves and pay closing costs.
The Novo Nordisk Whole Loan has an anticipated repayment date of September 5, 2021 (the “ARD”) and a final maturity date of April 30, 2031. Prior to the ARD, the Novo Nordisk Whole Loan accrues interest at a fixed rate of 3.482% (the “Initial Interest Rate”) and requires monthly payments of interest. In the event the Novo Nordisk Whole Loan is not repaid in full on or before the ARD, interest accrues on the outstanding principal balance at the Adjusted Interest Rate (as defined herein), which interest at the Adjusted Interest Rate is payable currently. The Adjusted Interest Rate is equal to the sum of (i) the initial interest rate of 3.4820%, plus (ii) 3.0000% plus the amount (if any) by which the five-year treasury rate exceeds 2.5000%. If the Novo Nordisk Whole Loan is not repaid in full on or prior to the ARD, from and after the occurrence of the ARD and provided no event of default under the Novo Nordisk Whole Loan has occurred and is continuing, all excess cash flow is required to be applied to reduce the outstanding principal balance of the Novo Nordisk Whole Loan. Such excess cash flow is paid after payment of interest on the Novo Nordisk Whole Loan at the Adjusted Interest Rate.
The Borrower and the Sponsor. The borrower is Princeton HD Owner LLC (“The Novo Nordisk Borrower”), a Delaware limited liability company and single-purpose entity with two independent directors. Legal counsel to the borrower delivered a non-consolidation opinion in connection with the origination of the Novo Nordisk Whole Loan. The Novo Nordisk Whole Loan is not structured with a warm-body / warm-entity non-recourse carveout guarantor or indemnitor. The Novo Nordisk Borrower is the sole party liable for any breach or violation of the non-recourse provisions in the loan documents. The Novo Nordisk Borrower purchased a $15.0 million environmental insurance policy for a term of eight years, which is three years after the ARD.
Princeton HD Owner LLC is indirectly owned by a joint venture between Hana Financial Investment (“Hana”) (33.3%), HMC Investment Securities (“HMC”) (27.8%) and Mirae Asset Daewoo (“Mirae”) (38.9%) (collectively “The Novo Nordisk Sponsor”). Established in 2006, Hana is a wholly owned subsidiary of Hana Financial Group Inc. and was Korea’s first asset management company to specialize in real estate. With an operating size of $3.9 billion, Hana Asset Management has created a diverse investment portfolio and contributes to the development of the real estate fund and other alternative investment markets. Based in Seoul, South Korea, HMC provides securities services, including stock brokerage and advisory services. HMC offers structured financing, asset securitization, portfolio management and real estate sales. HMC operates a network of 40 branches in South Korea and one branch internationally. HMC generated $56.5 million of operating income in 2015 and had $147.8 million in cash and deposits. Mirae is the product of a merger between South Korea’s Mirae Asset Securities and Daewoo Securities. Founded in 1999 and headquartered in Seoul, South Korea, Mirae provides a comprehensive range of services in wealth management, brokerage, investment banking and overseas business. As of June 2016, Mirae had $92.7 billion of assets under management and is the largest stock brokerage and investment banking firm by market capitalization in South Korea.
The Property.The Novo Nordisk Property is comprised of nine interconnected Class A office buildings located in Plainsboro, New Jersey, totaling 761,824 SF. The Novo Nordisk Property sits on a 58.6 acre parcel on Scudders Mill Road and just off State Route 1, a highway that averages more than 75,000 daily vehicles. Originally built in 1985, the Novo Nordisk Property was gut renovated in 2013 at a cost of approximately $215.0 million. The Novo Nordisk Property is LEED Silver certified and features modern technology and energy efficient systems. The new façade with 10 foot high windows offers ample natural light. The emphasis on light and views continues through the 30-foot high atrium lobby with floor-to-ceiling glass walls. Building amenities include a fully renovated 267-seat cafeteria, executive dining area, grab and go café, fully-equipped fitness center, 2,214 parking spaces including 493 covered spaces and 1,721 spaces in open lots (2.9 parking spaces per 1,000 square feet of rentable area), 4,000 square foot roof-top terrace with outdoor dining patios and a full-service concierge. As of November 1, 2016, the Novo Nordisk Property was 69.4% occupied and 78.0% leased by Novo Nordisk Inc. and serves as its North American headquarters.
Expansion Option. Novo has an exclusive option which may be exercised at any time during the term of its lease to expand in all or any portion of the remaining 167,815 SF of rentable area at the Novo Nordisk Property. The rent for the option space square footage is set in the lease at the square footage leased times the fixed rent per square foot in effect as of the option space rent commencement date. The rent on the option space is increased by 2% per annum (in the same manner as the fixed rent for the initial premises). Novo also receives a tenant allowance for the expansion space calculated as the product of the rentable square feet times the tenant allowance amount per square foot that is applicable to the target option date. The borrower may, at the time of tenant acceptance of expansion space, request part or all of the $23.0 million Earnout Advance based on the pro rata share of the expansion space to the total remaining 167,815 SF of rentable area. The Earnout Advance is required to be paid to the property seller pursuant to the purchase and sale agreement for the Novo Nordisk Property. The holder of the Note A-2 is obligated to fund the Expansion Space TI/LC Advance and the Earnout Advances.
Major Tenant.
Novo Nordisk Inc. (594,009 SF, 78.0% of NRA, 100% of underwritten base rent).Novo Nordisk Inc. occupies 594,009 SF including 30,720 SF of storage space, under an initial lease dated July 29, 2011 expiring April 30, 2031, with one ten-year renewal option, provided that the tenant has not sublet more
This is not a research report and was not prepared by any Underwriter’s research department. Please see additional important information and qualifications at the end of this Term Sheet.
T-131
| MSC 2016-UBS12 | Novo Nordisk |
than 200,000 SF of its space. Novo Nordisk Inc. initially leased 528,835 SF (69.4% of NRA) and recently took occupancy of a mandatory expansion of 65,174 SF. Novo Nordisk Inc. has no termination options and its lease includes rent increases at a 2.0% annual rate. Novo Nordisk Inc. is the U.S. subsidiary of Novo Nordisk A/S (S&P: AA- / Moody’s A1), which guarantees the lease (the “Novo Lease Guarantor”). The Novo Nordisk Property serves as the North American Headquarters for Novo Lease Guarantor, which employs approximately 1,300 people at the Novo Nordisk Property. The Novo Lease Guarantor is a global pharmaceutical company and concentrates in the diabetes industry that markets products in 180 countries around the world. The Novo Lease Guarantor, which is headquartered in Denmark, has offices or affiliates in 75 countries and employs over 40,000 people. In 2015, The Novo Lease Guarantor reported net income of 32.9 billion DKK ($4.9 billion) on revenues of 107.9 DKK billion ($16.3 billion), which was a 21.5% increase year-over-year in local currency. Novo Nordisk’s North American business, of which the tenant comprises 90% of sales, generated 2015 revenue of $8.6 billion USD.
The following table presents certain information relating to the leases at the Novo Nordisk Property:
| Tenant Summary(1) | |||||||
| Tenant Name | Credit Rating (Fitch/ Moody’s/S&P)(2) | Tenant SF | Approx. % of SF | Annual UW Rent(3) | % of Total Annual UW Rent | Annual UW Rent PSF(3) | Lease Expiration |
| Novo Nordisk Inc. | NR/A1/AA- | 563,289 | 73.9% | $17,714,312 | 100.0% | $31.45 | 4/30/2031(4) |
| Novo Nordisk Inc. (Storage) | NR/A1/AA- | 30,720 | 4.0% | $0 | 0.0% | $0.00 | 4/30/2031 |
| Vacant | 167,815 | 22.0% | $0 | 0.0% | $0.00 | ||
| Total/Wtd. Avg. | 761,824 | 100.0% | $17,714,312 | 100.0% | $29.82 | ||
| (1) | Information is based on the underwritten rent roll. |
| (2) | Certain ratings are those of the parent company whether or not the parent guarantees the lease. |
| (3) | Annual U/W Base Rent PSF and Annual U/W Base Rent include rent averaging through September 5, 2021, totaling $973,363. |
| (4) | Novo has one 10-year extension option, provided that no more than 200,000 square feet is sublet. |
The following table presents certain information relating to the lease rollover schedule at the Novo Nordisk Property:
| Lease Rollover Schedule(1) | ||||||||
| Year | # of Leases Rolling | SF Rolling | UW Rent PSF Rolling(2) | Approx. % of Total SF Rolling | Approx. Cumulative % of SF Rolling | Total UW Rent Rolling | Approx. % of Total Rent Rolling | Approx. Cumulative % of Total Rent Rolling |
| 2016 | 0 | 0 | $0.00 | 0.0% | 0.0% | $0 | 0.0% | 0.0% |
| 2017 | 0 | 0 | $0.00 | 0.0% | 0.0% | $0 | 0.0% | 0.0% |
| 2018 | 0 | 0 | $0.00 | 0.0% | 0.0% | $0 | 0.0% | 0.0% |
| 2019 | 0 | 0 | $0.00 | 0.0% | 0.0% | $0 | 0.0% | 0.0% |
| 2020 | 0 | 0 | $0.00 | 0.0% | 0.0% | $0 | 0.0% | 0.0% |
| 2021 | 0 | 0 | $0.00 | 0.0% | 0.0% | $0 | 0.0% | 0.0% |
| 2022 | 0 | 0 | $0.00 | 0.0% | 0.0% | $0 | 0.0% | 0.0% |
| 2023 | 0 | 0 | $0.00 | 0.0% | 0.0% | $0 | 0.0% | 0.0% |
| 2024 | 0 | 0 | $0.00 | 0.0% | 0.0% | $0 | 0.0% | 0.0% |
| 2025 | 0 | 0 | $0.00 | 0.0% | 0.0% | $0 | 0.0% | 0.0% |
| 2026 | 0 | 0 | $0.00 | 0.0% | 0.0% | $0 | 0.0% | 0.0% |
| Thereafter(3) | 1 | 594,009 | $29.82 | 78.0% | 78.0% | $17,714,312 | 100.0% | 100.0% |
| Vacant | 0 | 167,815 | $0.00 | 22.0% | 100.0% | $0 | 0.0% | 100.0% |
| Total/Wtd. Avg. | 1 | 761,824 | $29.82 | 100.0% | $17,714,312 | 100.0% | ||
| (1) | Information is based on the underwritten rent roll. |
| (2) | Weighted Average Annual U/W Base Rent PSF excludes vacant space. |
| (3) | As of November 1, 2016, the Novo Nordisk Property was 69.4% occupied and 78.0% leased by Novo. |
The Market. The Novo Nordisk Property is located in Plainsboro, New Jersey, approximately 47.5 miles northeast of Center City Philadelphia and 51.0 miles southwest of New York City. The Novo Nordisk Property is situated directly off Route 1, in proximity to a network of highways that provide access to northern New Jersey, southern New Jersey, the New Jersey coastline and eastern Pennsylvania. The New Jersey Turnpike/Interstate-95 is located approximately 10 miles southwest from the Novo Nordisk Property. The Novo Nordisk Property is located approximately 10 minutes from the Princeton Junction Train Station that provides connections to Philadelphia, MetroPark (in Iselin), and New York City though NJ Transit service (Northeast Corridor Line) and Amtrak. The train station can be accessed by Novo employees through a shuttle service provided by Novo. The Novo Nordisk Property also benefits from a NJ Transit Bus Stop near the intersection of Scudders Mill Road and Novo Nordisk Way. Additionally, Newark Liberty International Airport is located less than 40 miles north of the Novo Nordisk Property. There is a range of lodging and retail options along Route 1, as well as the amenities in the 2,200-acre Princeton Forrestal Center Office Park and Princeton Forrestal Village. The Novo Nordisk Property has direct internal access to the adjacent 62-room Holiday Inn Express, which features a 250-seat auditorium and various meeting rooms, which are routinely utilized by Novo; as well as a connection to the 364-room Crowne Plaza Princeton Hotel and Conference Center in Princeton Forrestal Center via a connector bridge.
According to the appraisal, the 2015 estimated population within a one-, three- and five-mile radius of the Novo Nordisk Property was 2,771, 52,301, and 106,798, respectively, with an estimated 2015 average household income in the same radii of $196,127, $147,640 and $148,940, respectively.
This is not a research report and was not prepared by any Underwriter’s research department. Please see additional important information and qualifications at the end of this Term Sheet.
T-132
| MSC 2016-UBS12 | Novo Nordisk |
According to a third party market research report, the Novo Nordisk Property is located in the Class A Princeton submarket. As of the third quarter of 2016, the Class A Princeton submarket contained approximately 21.0 million square feet of office space, a vacancy rate of 10.7% and average asking rent of $27.10 per square foot on a full service gross basis. The Class A Princeton submarket is dominated by companies in the life sciences and financial services industries, including notable corporations such as Bristol-Myers Squibb, Bloomberg Financial Services, Sandoz, Otsuka and Janssen Pharmaceutical. The largest lease signings occurring in 2016 in the northern New Jersey office market included the 431,493 square-foot lease signed by Allergan at 5 Giralda Farms in the Morristown market; the 350,000 square-foot deal signed by iCIMS at Bell Works in the Monmouth East market; and the 339,178 square-foot renewal signed by Panasonic Corporation of North America at Two Riverfront Plaza in the Newark/Urban Essex market. The following table presents competitive office rental properties with respect to the Novo Nordisk Property:
| Comparable Leases Summary | ||||||||
| Property Name/Location | Year Built | Size SF | Total Occupancy | Tenant Name | Lease Date/Term | Lease Area (SF) | Annual Base Rent PSF | Lease Type |
| Subject | 1985 | 563,289 | 78% | Novo Nordisk | July 2011 / 20.0 Yrs | 498,115 | $29.82 | NNN |
14 Sylvan Way Parsippany, NJ | 2013 | 203,000 | 100% | Wyndham Worldwide | July 2014 / 15.0 Yrs | 203,000 | $25.36 | NNN |
45 Waterview Blvd Parsippany, NJ | 1997 | 106,680 | 100% | DSM Nutritional Products | Dec 2009 / 18.0 Yrs | 106,680 | $21.70 | NNN |
100 College Road West Princeton, NJ | 2000 | 154,101 | 100% | Sandoz | Oct. 2014 / 12 Yrs | 154,101 | $26.01 | NNN |
22 Sylvan Way Parsippany, NJ | 2000 | 249,409 | 100% | Wyndham Worldwide | Sept. 2011 / 15.0 Yrs | 249,409 | $23.27 | NNN |
2 Giralda Farms Madison, NJ | 2000 | 146,366 | 100% | Merck | April 2014 / 10.0 Yrs | 146,366 | $22.50 | NNN |
Source:Appraisal and underwritten rent roll and third party research report
Operating History and Underwritten Net Cash Flow.The following table presents certain information relating to the historical operating performance and underwritten net cash flow at the Novo Nordisk Property:
| Cash Flow Summary | |||||||
| 2014 | 2015 | 5/31/2016 TTM | UW(1) | Fully Funded UW | UW PSF(2) | ||
| Base Rent(2) | $14,133,182 | $14,415,448 | $14,722,897 | $22,438,305 | $23,033,680 | $29.45 | |
| Total Recoveries | $10,544,056 | $10,146,706 | $9,876,451 | $11,891,591 | $12,023,580 | $15.61 | |
| Other Income | $61,100 | $0 | $0 | $0 | $0 | $0.00 | |
| Less Vacancy & Credit Loss | $0 | $0 | $0 | ($4,723,992)(3) | ($1,051,718)(3) | ($6.20) | |
| Effective Gross Income | $24,738,338 | $24,562,154 | $24,599,348 | $29,605,904 | $34,005,542 | $38.86 | |
| Total Operating Expenses | $10,261,687 | $10,163,040 | $9,911,492 | $11,891,591 | $12,023,580 | $15.61 | |
| Net Operating Income | $14,476,650 | $14,399,114 | $14,687,857 | $17,714,312 | $21,981,962 | $23.25 | |
| Capital Expenditures | $0 | $0 | $0 | $38,091 | $38,091 | $0.05 | |
| TI/LC | $0 | $0 | $0 | $0 | $0 | $0.00 | |
| Net Cash Flow | $14,476,650 | $14,399,114 | $14,687,857 | $17,676,221 | $21,943,871 | $23.20 | |
| Occupancy % | 69.4% | 69.4% | 69.4% | 86.2% | 97.0% | ||
| NOI DSCR(4) | 2.44x | 2.42x | 2.47x | 2.98x | 2.72x(5) | ||
| NCF DSCR(4) | 2.44x | 2.42x | 2.47x | 2.97x | 2.71x(5) | ||
| NOI Debt Yield(4) | 8.6% | 8.6% | 8.7% | 10.5% | 10.6%(5) | ||
| NCF Debt Yield(4) | 8.6% | 8.6% | 8.7% | 10.5% | 10.6%(5) | ||
| (1) | UW Base Rent includes increases from 5/31/2016 TTM as it includes rent on the first mandatory expansion of 65,174 square feet, totaling $2,049,592 and rent averaging through September 5, 2021, totaling $973,363, a vacancy gross up of $4,723,992. |
| (2) | U/W $ PSF columns are reflective of the U/W column. |
| (3) | The underwritten economic vacancy is 13.8%. The Novo Nordisk Property is 78.0% leased and 69.4% occupied as of November 1, 2016. |
| (4) | NOI DSCR, NCF DSCR, NOI Debt Yield and NCF Debt Yield are based on the Novo Nordisk Whole Loan. |
| (5) | Based on the maximum principal balance and the maximum debt service of the Novo Nordisk Whole Loan. |
This is not a research report and was not prepared by any Underwriter’s research department. Please see additional important information and qualifications at the end of this Term Sheet.
T-133
| MSC 2016-UBS12 | Huntington Center |
| Mortgage Loan No. 13 – Huntington Center |
| Mortgage Loan Information | Property Information | ||||||
| Mortgage Loan Seller: | MSMCH | Single Asset/Portfolio: | Single Asset | ||||
| Original Balance(1): | $20,000,000 | Location: | Columbus, OH 43215 | ||||
| Cut-off Date Balance(1): | $20,000,000 | General Property Type: | Office | ||||
| % of Initial Pool Balance: | 2.4% | Detailed Property Type: | CBD | ||||
| Loan Purpose: | Refinance | Title Vesting: | Fee | ||||
| Sponsors: | Menashe Frankel; Yeheskel Frankel; Abraham J. Cohen; David J. Cohen; Hines Investment Management Holdings Limited Partnership | Year Built/Renovated: | 1984/N/A | ||||
| Size: | 907,010 SF | ||||||
| Cut-off Date Balance per SF(1): | $154 | ||||||
| Mortgage Rate: | 3.5300% | Maturity Date Balance per SF(1): | $139 | ||||
| Note Date: | 9/30/2016 | Property Manager: | Hines Interests Limited Partnership (borrower-related) | ||||
| First Payment Date: | 11/7/2016 | ||||||
| Maturity Date: | 10/7/2026 | ||||||
| Original Term to Maturity: | 120 months | ||||||
| Original Amortization Term: | 360 months | ||||||
| IO Period: | 60 months | Underwriting and Financial Information | |||||
| Seasoning: | 2 months | UW NOI: | $12,930,910 | ||||
| Prepayment Provisions(2): | LO (26); DEF (90); O (4) | UW NOI Debt Yield(1): | 9.2% | ||||
| Lockbox/Cash Mgmt Status: | Hard/In Place | UW NOI Debt Yield at Maturity(1): | 10.2% | ||||
| Additional Debt Type(3): | Pari Passu | UW NCF DSCR(1): | 2.32x (IO) 1.54x (P&I) | ||||
| Additional Debt Balance: | $120,000,000 | Most Recent NOI: | $13,030,807 (7/31/2016 TTM) | ||||
| Future Debt Permitted (Type): | No (N/A) | 2nd Most Recent NOI: | $13,256,029 (12/31/2015) | ||||
| Reserves | 3rd Most Recent NOI: | $14,396,831 (12/31/2014) | |||||
| Type | Initial | Monthly | Cap | Most Recent Occupancy(5): | 85.8% (8/31/2016) | ||
| RE Tax: | $1,994,693 | $332,449 | N/A | 2nd Most Recent Occupancy: | 83.8% (12/31/2015) | ||
| Insurance: | $0 | Springing | N/A | 3rd Most Recent Occupancy: | 86.3% (12/31/2014) | ||
| Recurring Replacements: | $0 | $18,896 | N/A | Appraised Value (as of): | $186,600,000 (8/22/2016) | ||
| TI/LC: | $0 | $75,584 | $2,721,030 | Cut-off Date LTV Ratio(1): | 75.0% | ||
| Other(4): | $4,594,385 | $0 | N/A | Maturity Date LTV Ratio(1): | 67.7% | ||
| Sources and Uses | ||||||
| Sources | Proceeds | % of Total | Uses | Proceeds | % of Total | |
| Loan Amount(1): | $140,000,000 | 100.0% | Loan Payoff: | $109,892,399 | 78.5% | |
| Reserves: | $6,589,078 | 4.7% | ||||
| Closing Costs: | $2,843,713 | 2.0% | ||||
| Return of Equity: | $20,674,809 | 14.8% | ||||
| Total Sources: | $140,000,000 | 100.0% | Total Uses: | $140,000,000 | 100.0% | |
| (1) | The Huntington Center Mortgage Loan is part of the Huntington Center Whole Loan, which is comprised of threepari passupromissory notes with an aggregate original principal balance of $140,000,000. The Cut-off Date Balance per SF, Maturity Date Balance per SF, UW NOI Debt Yield, UW NOI Debt Yield at Maturity, UW NCF DSCR, Cut-off Date LTV Ratio and Maturity Date LTV Ratio numbers presented above are based on the aggregate principal balance of the promissory notes comprising the Huntington Center Whole Loan. |
| (2) | Defeasance is permitted at any time after the earlier of (i) the third anniversary of the first payment date, or (ii) two years from the closing date of the securitization of the last Huntington Center Whole Loan promissory note to be securitized. |
| (3) | See “—The Mortgage Loan” below for further discussion of additional debt. |
| (4) | At closing, the Huntington Center Mortgage Borrower deposited $1,442,959 for rent abatements for nine tenants, including Porter Wright, the second largest tenant, (as to a portion of its space), and $3,151,426 for tenant improvements and leasing commissions payable under existing leases. |
| (5) | Includes a total of 37,218 SF that is leased to five tenants that have given notice to vacate. These tenants include Schneider Downs & Co., Inc., Wells Fargo Advisors LLC, The Bank of New York Mellon, Intellisource LLC and The Marlenko Group, Inc. These tenants were underwritten as vacant. Considering these tenants vacant, Most Recent Occupancy would be 81.7%. |
The Mortgage Loan. The thirteenth largest mortgage loan (the “Huntington Center Mortgage Loan”) is part of a whole loan (the “Huntington Center Whole Loan”) evidenced by threepari passu promissory notes in the aggregate original principal amount of $140,000,000, all of which are secured by a first priority fee mortgage encumbering a 907,010 SF office property known as Huntington Center in Columbus, Ohio (the “Huntington Center Property”). Promissory Note A-3, in the original principal amount of $20,000,000, represents the Huntington Center Mortgage Loan and will be included in the MSC 2016-UBS12 Trust. Promissory Note A-1 with an original principal balance of $80,000,000 is expected to be contributed to the MSBAM 2016-C31 Trust. Promissory Note A-2 with an original principal balance of $40,000,000 is expected to be to be contributed to the MSC 2016-BNK2 Trust. Promissory Notes A-2 and A-3 collectively represent non-serviced companion loans (“the “Huntington Center Non-ServicedPari Passu Companion Loans”). The Huntington Center Whole Loan is expected to be serviced pursuant to the pooling and servicing agreement for the MSBAM 2016-C31 Trust. See “—Description of the Mortgage Pool—The Whole Loans—The Non-Serviced Pari Passu Whole Loans” and “The Pooling and Servicing Agreement” in the Preliminary Prospectus.
This is not a research report and was not prepared by any Underwriter’s research department. Please see additional important information and qualifications at the end of this Term Sheet.
T-134
| MSC 2016-UBS12 | Huntington Center |
The proceeds of the Huntington Center Whole Loan were used to refinance a previous loan with a principal balance of $109,892,399, fund upfront reserves, pay closing costs of and return equity to the Huntington Center Borrower.
The Borrower and the Sponsors. The borrower is Huntington Center Owner LLC (the “Huntington Center Borrower”), a single-purpose Delaware limited liability company. The loan sponsors and non-recourse carveout guarantors are Menashe Frankel, Yeheskel Frankel, Abraham J. Cohen, David J. Cohen, and Hines Investment Management Holdings Limited Partnership.
The Huntington Center Borrower is 100.0% owned by Huntington Center Associates, an Ohio general partnership, whose board of directors includes C. Kevin Shannahan, Richard Machinski and David J. Cohen. Huntington Center Associates is 27.0% owned by HDG-Columbus, Ltd. (which in turn is 56.0% owned by funds controlled by the Hines family and 44.0% by The Huntington National Bank (which is the largest tenant at the Huntington Center Property), 66.5% owned by High Street Partner LLC (which in turn is owned by a joint venture owned 50.0% by entities controlled by David J. Cohen and Abraham J. Cohen and 50.0% by Huntington Center Investment LLC, an entity controlled by Menashe Frankel and Yeheskel Frankel and owned approximately 60.0% by pension fund and insurance company entities owned by The Phoenix Holdings Ltd., an Israeli public company) and 6.5% owned by 41 South High Ltd. (which in turn is owned by The Huntington National Bank).
The Property. The Huntington Center Property consists of a 37-story, Class A, multi-tenant office building totaling 907,010 SF and an adjacent five-story parking garage connected to the office building. There is a Doubletree Hotel and a Capital Club (a fitness and dining club) situated above the parking garage, both of which were constructed pursuant to air rights lease agreements, that are not included as part of the collateral; however, the collateral does include income generated pursuant to the air rights lease agreements.
The Huntington Center Property is located at 41 South High Street / 50 South Front Street, mid-block between West Broad Street to the north and West State Street to the south, and within the Capitol Square area of the Columbus, Ohio Central Business District (“CBD”). Capitol Square is anchored by the Ohio Statehouse which is located directly across the street from the Huntington Center Property on South High Street. South High Street is a primary roadway through the Columbus CBD, running north through the Columbus CBD to Ohio State University’s main campus and south through the areas commonly known as German Village and the Brewery District. Broad Street is the primary east/west roadway within the Columbus CBD and bisects the broader Columbus metropolitan statistical area.
The Huntington Center Property’s local area is composed primarily of public service buildings such as courthouses, parking garages, government buildings, street front retail with upper level living spaces, as well as downtown high rise office buildings, entertainment venues, parks and open spaces. 17 South High Street, an older high-rise office building also anchored and owned by The Huntington National Bank is located adjacent to the Huntington Center Property to the north. Columbus City Hall, the Battelle Riverfront Park and the Scioto River are located to the west of the Huntington Center Property. Uses to the south of the Huntington Center Property vary and include a variety of mid to high-rise office towers.
The Huntington Center sponsors have spent $1,935,660 in capital improvements from 2011 through 2016, including garage deck upgrades, upgrading the restroom fixtures and drinking fountains, renovations to the common corridor for floors 12-13, 14-15 and 33, elevator design and tenant signage.
Additionally, the Huntington Center Borrower has informed the lender that it currently intends to make renovations estimated to cost approximately $10,000,000 over the next three years, the scope of which includes elevator modernization ($6,500,000), roof replacement ($500,000) and amenity and lobby upgrades ($3,000,000). Such renovations are not required under the Huntington Center Whole Loan documents, and no reserves have been required under the Huntington Center Whole Loan for such renovations. Accordingly, there can be no assurance as to whether any such renovations will occur.
Major Tenants.
The Huntington National Bank. (199,240 SF, 22.0% of NRA, 31.7% of underwritten rent). The Huntington National Bank (“Huntington Bank”) is a subsidiary of Huntington Bancshares Incorporated (“Huntington”), a diversified regional bank holding company that provides full-service commercial, small business, consumer and mortgage banking services, as well as automobile financing, equipment leasing, investment management, trust services, brokerage services, insurance programs and other financial products and services.
On January 26, 2016, Huntington announced the signing of a definitive merger agreement with Ohio-based FirstMerit Corporation, the parent company of FirstMerit Bank. According to the Huntington Bank website, FirstMerit Bank is now part of The Huntington National Bank but will continue to operate independently until systems integration occurs. Pursuant to its lease, Huntington Bank has the right to terminate its lease beginning March 1, 2024 and subject to a minimum 18 months’ notice period if it enters into a merger, or in the event of a major acquisition, in any such case that leads to a closure and termination of its Columbus, Ohio headquarters office operation. Huntington Bank has provided a letter addressed to the loan seller and its successors and assignees and to Huntington Center Associates (the original landlord under the lease and 100% direct owner of the Huntington Center Borrower) and its successors and assignees, stating that in connection with its acquisition of FirstMerit Bank, Huntington Bank will not exercise its option to terminate its lease. Huntington Bank has been in occupancy since 1985, has a lease expiration of February 28, 2030 and has six five-year renewal options.
Huntington Bank owns an approximately 18.4% interest in the Huntington Center Borrower. Huntington Bank also owns an office property that is adjacent to the Huntington Center Property, in which it occupies 43,000 SF, and an office property located around the corner from the Huntington Center Property, in which it occupies 40,000 SF.
Porter, Wright, Morris & Arthur (127,239 SF, 14.0% of NRA, 14.3% of underwritten rent).Porter, Wright, Morris & Arthur (“Porter Wright”), a tenant at the Huntington Center Property since 1985, is a law firm with six offices located in Ohio, Washington, D.C. and Florida. Porter Wright has a lease expiration of May 31, 2028 and has two five-year renewal options. Porter Wright is permitted to terminate up to 18,693 SF on floor 32 effective as of June 1, 2017, by written notice delivered prior to May 1, 2017, and also has a rent abatement with respect to 18,693 SF from November 1, 2016 through May 31, 2017.
Squire Patton Boggs LLP (81,693 SF, 9.0% of NRA, 10.7% of underwritten rent). Squire Patton Boggs LLP is a law firm with offices in 21 countries on five continents as well as working relationships with independent firms in Europe and Latin America. Squire Patton Boggs LLP has been in occupancy since 2008, has a lease expiration of February 28, 2025 and has two five-year renewal options.
Thompson Hine LLP (38,139 SF, 4.2% of NRA, 5.0% of underwritten rent). Thompson Hine LLP is a law firm with seven offices in three states and Washington, D.C. Thompson Hine has been in occupancy since 2008, has a lease expiration of August 31, 2018 and has two five-year options.
This is not a research report and was not prepared by any Underwriter’s research department. Please see additional important information and qualifications at the end of this Term Sheet.
T-135
| MSC 2016-UBS12 | Huntington Center |
Benesch, Friedlander, Coplan & Aronoff LLP (26,921 SF, 3.0% of NRA, 3.6% of underwritten rent). Benesch, Friedlander, Coplan & Aronoff LLP is a business law firm with offices in Cleveland, Columbus, Chicago, Hackensack, Indianapolis, Shanghai and Wilmington. Benesch, Friedlander, Coplan & Aronoff LLP has been in occupancy since 2007, has a lease expiration of February 29, 2020 and has two five-year renewal options.
The following table presents certain information relating to the leases at the Huntington Center Property:
| Tenant Summary(1) | |||||||
| Tenant Name | Credit Rating (Fitch/Moody’s/S&P)(2) | Tenant SF | Approximate % of SF | Annual UW Rent | % of Total Annual UW Rent | Annual UW Rent PSF(3) | Lease Expiration |
| Tenants | |||||||
| The Huntington National Bank | A-/Baa1/BBB | 199,240 | 22.0% | $3,962,438 | 31.7% | $19.89 | 2/28/2030(4) |
| Porter, Wright, Morris & Arthur | NR/NR/NR | 127,239 | 14.0% | $1,781,346 | 14.3% | $14.00 | 5/31/2028(5) |
| Squire Patton Boggs LLP | NR/NR/NR | 81,693 | 9.0% | $1,337,540 | 10.7% | $16.37 | 2/28/2025 |
| Thompson Hine LLP | NR/NR/NR | 38,139 | 4.2% | $629,294 | 5.0% | $16.50 | 8/31/2018 |
| Benesch, Friedlander, Coplan & Aronoff LLP | NR/NR/NR | 26,921 | 3.0% | $444,197 | 3.6% | $16.50 | 2/29/2020 |
| Subtotal/Wtd. Avg. | 473,232 | 52.2% | $8,154,814 | 65.2% | $17.23 | ||
| Other Tenants | 268,092 | 29.6% | $4,344,321 | 34.8% | $16.20 | ||
| Vacant Space | 165,686 | 18.3% | $0 | 0.0% | $0.00 | ||
| Total/Wtd. Avg. | 907,010 | 100.0% | $12,499,135 | 100.0% | $16.86 | ||
| (1) | Information is based on the underwritten rent roll. |
| (2) | Certain ratings are those of the parent company whether or not the parent guarantees the lease. |
| (3) | Wtd. Avg. Annual UW Rent PSF excludes vacant space. |
| (4) | Pursuant to its lease, Huntington Bank has the right to terminate its lease beginning March 1, 2024 and subject to a minimum 18 months’ notice period if it enters into a merger, or in the event of a major acquisition, in any such case that leads to a closure and termination of its Columbus, Ohio headquarters office operation. Huntington Bank has provided a letter to the lender stating that in connection with its acquisition of FirstMerit Bank, Huntington Bank will not exercise its option to terminate its lease. |
| (5) | Porter Wright is permitted to terminate up to 18,693 SF on floor 32 effective as of June 1, 2017, by written notice delivered prior to May 1, 2017 and also has a rent abatement with respect to 18,693 SF from November 1, 2016 through May 31, 2017. |
The following table presents certain information relating to the lease rollover schedule at the Huntington Center Property:
| Lease Rollover Schedule(1)(2) | ||||||||
| Year | # of Leases Rolling | SF Rolling | UW Rent PSF Rolling(3) | Approx. % of Total SF Rolling | Approx. Cumulative % of SF Rolling | Total UW Rent Rolling(3) | Approx. % of Total Rent Rolling | Approx. Cumulative % of Total Rent Rolling |
| 2016 | 0 | 0 | $0.00 | 0.0% | 0.0% | $0 | 0.0% | 0.0% |
| 2017 | 2 | 6,388 | $14.15 | 0.7% | 0.7% | $90,377 | 0.7% | 0.7% |
| 2018 | 8 | 56,586 | $16.70 | 6.2% | 6.9% | $945,214 | 7.6% | 8.3% |
| 2019 | 7 | 24,199 | $16.37 | 2.7% | 9.6% | $396,057 | 3.2% | 11.5% |
| 2020 | 7 | 49,582 | $16.25 | 5.5% | 15.1% | $805,533 | 6.4% | 17.9% |
| 2021 | 8 | 35,994 | $16.51 | 4.0% | 19.0% | $594,392 | 4.8% | 22.7% |
| 2022 | 10 | 67,596 | $15.91 | 7.5% | 26.5% | $1,075,706 | 8.6% | 31.3% |
| 2023 | 1 | 2,083 | $16.00 | 0.2% | 26.7% | $33,328 | 0.3% | 31.5% |
| 2024 | 2 | 15,343 | $15.96 | 1.7% | 28.4% | $244,811 | 2.0% | 33.5% |
| 2025 | 9 | 96,861 | $16.36 | 10.7% | 39.1% | $1,584,872 | 12.7% | 46.2% |
| 2026 | 4 | 34,290 | $16.25 | 3.8% | 42.9% | $557,331 | 4.5% | 50.6% |
| 2027 | 0 | 0 | $0.00 | 0.0% | 42.9% | $0 | 0.0% | 50.6% |
| 2028 | 6 | 127,239 | $14.00 | 14.0% | 56.9% | $1,781,346 | 14.3% | 64.9% |
| 2029 & Beyond | 11 | 225,163 | $19.50 | 24.8% | 81.7% | $4,390,168 | 35.1% | 100.0% |
| Vacant(4) | 0 | 165,686 | $0.00 | 18.3% | 100.0% | $0 | 0.0% | 100.0% |
| Total/Wtd. Avg. | 75 | 907,010 | $16.86 | 100.0% | $12,499,135 | 100.0% | ||
| (1) | Information is based on the underwritten rent roll. |
| (2) | Certain tenants may have lease termination options that are exercisable prior to the originally stated expiration date of the subject lease and that are not considered in the lease rollover schedule. |
| (3) | UW Rent PSF Rolling and Total UW Rent Rolling exclude vacant and occupied space that has been underwritten as vacant. |
| (4) | Includes a total of 37,218 SF that is leased to five tenants that have given notice to vacate. These include Schneider Downs & Co., Inc., Wells Fargo Advisors LLC, The Bank of New York Mellon, Intellisource LLC and The Marlenko Group, Inc. |
This is not a research report and was not prepared by any Underwriter’s research department. Please see additional important information and qualifications at the end of this Term Sheet.
T-136
| MSC 2016-UBS12 | Huntington Center |
The Market. The Huntington Center Property is located in Columbus, Ohio, situated within the Lower Downtown submarket and directly across from the capitol building. The subject is considered a class A property and is located on the west side of South High Street, mid-block between West Broad Street to the north and West State Street to the south. The Columbus, Ohio office market contains 32,222,000 SF of office space. According to the appraisal the Lower Downtown office submarket contains 4,369,000 SF and represents 13.6% of the office inventory in Columbus, Ohio.
Regional access is provided by Interstate 71, the primary north-south highway through the Columbus CBD, providing access to Cleveland to the north and Cincinnati to the south. Interstate 71 connects to other central Ohio transportation routes such as Interstates 70, 270 and 670 as well as State Route 161 and US Route 33. Located a short distance south of the Huntington Center Property is Interstate 70, a primary east/west highway providing greater regional access to Dayton and St. Louis to the west and Baltimore to the east.
According to the appraisal for the Huntington Center Property, as of the second quarter of 2016, the overall vacancy rate for the Columbus, Ohio office market was 17.6% and the vacancy for the Lower Downtown office submarket was 13.9%. For the same period the average asking rental rate for both class A, class B and class C space within the Columbus, Ohio office market was $18.81 per SF, and within the Lower Downtown office market was $21.72 per SF. Class A buildings constitute 49.3% of existing inventory within the Columbus, Ohio office market and are exhibiting a lower vacancy rate (15.5%) than class B/C buildings (19.6%) and higher average rents of $21.25 versus $16.37 per SF.
The estimated 2015 population within a one-, three- and five-mile radius of the Huntington Center Property was 10,039, 134,897 and 337,978, respectively, according to the appraisal. The estimated 2015 average household income within a one-, three- and five-mile radius of the Huntington Center Property was $69,828, $51,749 and $56,554, respectively. The 2015 average household income for the greater city of Columbus was $61,614. Over the next five years, population is projected to increase within a one-mile radius but is expected to decline or remain flat within a three-mile radius and five-mile radius.
The following table presents recent leasing data at competitive office buildings with respect to the Huntington Center Property:
| Competitive Property Summary | |||||||||
| Property Name/Address | Year Built | Class | Size (SF) | Tenant Name | Lease Size (SF) | Lease Date | Lease Term (Yrs.) | Initial Rent/SF | Rent Steps/SF |
Confidential CBD Office Building Confidential Columbus, Ohio | 2001 | A | 242,009 | Confidential | 6,885 | Feb 2016 | 3.0 | $13.50 | Up to $15.00 |
Confidential Office Property Confidential Columbus, Ohio | 1989 | A | 142,315 | Confidential | 2,301 | Oct 2015 | 5.0 | $10.25 | Up to $11.25 |
Confidential CBD Building Confidential Columbus, Ohio | 1985 | A | 407,472 | Confidential | 2,644 | Aug 2015 | 5.0 | $12.00 | Up to $14.00 |
Confidential Grandview Yard Building Confidential Columbus, Ohio | 2014 | A | 75,000 | Confidential | 17,500 | Jun 2015 | 10.3 | $15.50 | 1.75% annual Increases
|
Confidential Building Confidential Columbus, Ohio | 1928 | A | 330,000 | Confidential | 16,536 | Jan 2015 | 7.0 | $13.50 | Up to $14.75 |
Source:Appraisal
This is not a research report and was not prepared by any Underwriter’s research department. Please see additional important information and qualifications at the end of this Term Sheet.
T-137
| MSC 2016-UBS12 | Huntington Center |
Operating History and Underwritten Net Cash Flow.The following table presents certain information relating to the historical operating performance and the Underwritten Net Cash Flow at the Huntington Center Property:
| Cash Flow Analysis | |||||||||||||
| 2013 | 2014 | 2015 | 7/31/2016 TTM | UW | UW PSF | ||||||||
| Gross Potential Rent(1) | $13,242,716 | $12,879,986 | $12,118,245 | $11,917,120 | $15,003,594(2) | $16.54 | |||||||
| Total Recoveries | $8,786,557 | $8,671,489 | $8,304,612 | $8,465,896 | $8,817,093 | $9.72 | |||||||
| Total Other Income(3) | $3,101,569 | $3,165,360 | $3,479,005 | $3,212,370 | $3,212,370 | $3.54 | |||||||
| Less Vacancy & Credit Loss(4) | $0 | $0 | $0 | $0 | ($2,866,257) | ($3.16) | |||||||
| Effective Gross Income | $25,130,842 | $24,716,835 | $23,901,862 | $23,595,386 | $24,166,800 | $26.64 | |||||||
| Total Operating Expenses | $10,202,636 | $10,320,004 | $10,645,833 | $10,564,579 | $11,235,890 | $12.39 | |||||||
| Net Operating Income | $14,928,206 | $14,396,831 | $13,256,029 | $13,030,807 | $12,930,910 | $14.26 | |||||||
| Capital Expenditures | $0 | $0 | $0 | $0 | $181,402 | $0.20 | |||||||
| TI/LC | $0 | $0 | $0 | $0 | $1,124,692 | $1.24 | |||||||
| Net Cash Flow | $14,928,206 | $14,396,831 | $13,256,029 | $13,030,807 | $11,624,816 | $12.82 | |||||||
| Occupancy % | 86.8% | 86.3% | 83.8% | 85.8% | 83.3%(5) | ||||||||
| NOI DSCR (P&I)(6) | 1.97x | 1.90x | 1.75x | 1.72x | 1.71x | ||||||||
| NOI DSCR (IO)(6) | 2.98x | 2.87x | 2.65x | 2.60x | 2.58x | ||||||||
| NCF DSCR (P&I)(6) | 1.97x | 1.90x | 1.75x | 1.72x | 1.54x | ||||||||
| NCF DSCR (IO)(6) | 2.98x | 2.87x | 2.65x | 2.60x | 2.32x | ||||||||
| NOI Debt Yield(6) | 10.7% | 10.3% | 9.5% | 9.3% | 9.2% | ||||||||
| NCF Debt Yield(6) | 10.7% | 10.3% | 9.5% | 9.3% | 8.3% | ||||||||
| (1) | Gross Potential Rent has been underwritten based on the August 31, 2016 rent roll. |
| (2) | UW Gross Potential Rent includes vacant space grossed up to market rent. The straight line average rent throughout the loan term ($19.89 PSF on a weighted average basis) has been underwritten for Huntington Bank and is above the concluded market rent of $15.00 PSF set forth in the appraisal. No mark to market adjustment has been made for Huntington Bank given the investment grade rating and the long term lease of the tenant. A contractual rent decrease to $14.00 PSF for Porter Wright totaling $699,815, which is effective October 1, 2017, has been underwritten. In addition, UW Gross Potential Rent includes contractual rent increases through October 1, 2017 totaling $430,245. A mark-to-market adjustment was applied to any tenants (other than Huntington Bank) whose contractual rent is in excess of 110% of market. Income associated with Hines Interests Limited Partnership has been underwritten, however, Hines Interests Limited Partnership is not obligated to pay rent as long as it serves as the property manager. |
| (3) | Other income includes percentage rent, parking rent, roof/antenna revenue, storage rent, telecom/riser revenue, air rights rent and other income. Parking Rent constitutes approximately 11.9% of Effective Gross Income. |
| (4) | Includes a total of 37,218 SF that is leased to five tenants that have given notice to vacate. These tenants include Schneider Downs & Co, Inc., Wells Fargo Advisors LLC, The Bank of New York Mellon, Intellisource LLC and The Marlenko Group, Inc. These tenants were underwritten as vacant. |
| (5) | UW Occupancy is based on the August 31, 2016 rent roll, and excludes five tenants totaling 37,218 SF that have given notice to vacate. |
| (6) | Debt service coverage ratios and debt yields are based on the Huntington Center Whole Loan. |
This is not a research report and was not prepared by any Underwriter’s research department. Please see additional important information and qualifications at the end of this Term Sheet.
T-138
(THIS PAGE INTENTIONALLY LEFT BLANK)
This is not a research report and was not prepared by any Underwriter’s research department. Please see additional important information and qualifications at the end of this Term Sheet.
T-139
| MSC 2016-UBS12 | Fairfield Inn CT Portfolio |
| Mortgage Loan No. 14 – Fairfield Inn CT Portfolio |
| Mortgage Loan Information | Mortgaged Property Information(1) | ||||||
| Mortgage Loan Seller: | MSMCH | Single Asset/Portfolio: | Portfolio | ||||
| Original Balance: | $18,500,000 | Location: | Various, CT | ||||
| Cut-off Date Balance: | $18,500,000 | General Property Type: | Hospitality | ||||
| % of Initial Pool Balance: | 2.2% | Detailed Property Type: | Select Service | ||||
| Loan Purpose: | Refinance | Title Vesting: | Fee | ||||
| Sponsor: | Navika Capital Group, LLC | Year Built/Renovated: | Various/2009 | ||||
| Mortgage Rate: | 4.5170% | Size: | 228 Rooms | ||||
| Note Date: | 11/8/2016 | Cut-off Date Balance per Room: | $81,140 | ||||
| First Payment Date: | 1/1/2017 | Maturity Date Balance per Room: | $65,796 | ||||
| Maturity Date: | 12/1/2026 | Property Manager: | Yashodhar Management Co., LLC | ||||
| Original Term to Maturity: | 120 months | ||||||
| Original Amortization Term: | 360 months | Underwriting and Financial Information(1) | |||||
| IO Period: | 0 months | UW NOI: | $2,474,881 | ||||
| Seasoning: | 0 months | UW NOI Debt Yield: | 13.4% | ||||
| Prepayment Provisions: | LO (24); DEF (92); O (4) | UW NOI Debt Yield at Maturity: | 16.5% | ||||
| Lockbox/Cash Mgmt Status: | Springing/Springing | UW NCF DSCR: | 1.96x | ||||
| Additional Debt Type: | N/A | Most Recent NOI: | $2,690,044 (9/30/2016) | ||||
| Additional Debt Balance: | N/A | 2ndMost Recent NOI: | $2,856,918 (12/31/2015) | ||||
| Future Debt Permitted (Type): | No (N/A) | 3rdMost Recent NOI: | $2,373,063 (12/31/2014) | ||||
| Reserves | Most Recent Occupancy: | 74.0% (9/30/2016 TTM) | |||||
| Type | Initial | Monthly | Cap | 2ndMost Recent Occupancy: | 74.2% (12/31/2015) | ||
| RE Tax: | $22,904 | $11,452 | N/A | 3rdMost Recent Occupancy: | 71.7% (12/31/2014) | ||
| Insurance: | $0 | Springing | N/A | Appraised Value (as of): | $28,500,000 (8/29/2016) | ||
| Recurring Replacements: | $0 | $22,186 | N/A | Cut-off Date LTV Ratio: | 64.9% | ||
| PIP Reserve: | $1,500,000 | Springing | N/A | Maturity Date LTV Ratio: | 52.6% | ||
| Sources and Uses | ||||||
| Sources | Proceeds | % of Total | Uses | Proceeds | % of Total | |
| Loan Amount: | $18,500,000 | 100.0% | Loan Payoff: | $13,537,431 | 73.2% | |
| Reserves: | $1,522,904 | 8.2% | ||||
| Closing Costs: | $266,238 | 1.4% | ||||
| Return of Equity | $3,173,427 | 17.2% | ||||
| Total Sources: | $18,500,000 | 100.0% | Total Uses: | $18,500,000 | 100.0% | |
| (1) | Mortgaged Property Information and Underwriting and Financial Information are based on a combination or sum of the two hospitality properties that comprise the Fairfield Inn CT Portfolio Property. Following the lockout expiration date, the individual properties may be separately released upon defeasance of 110% of the related allocated loan amount subject to certain conditions including (i) no event of default has occurred and is continuing, (ii) the loan-to-value ratio with respect to the remaining property will be no greater than the lesser of 64.91% and the loan-to-value ratio immediately prior to the release, (iii) the debt service coverage ratio with respect to the remaining property will be greater than the greater of 1.96x and the debt service coverage ratio immediately prior to the release, and (iv) the debt yield with respect to the remaining property will be greater than the greater of 11.94% and the debt yield immediately prior to the release. |
The Mortgage Loan.The fourteenth largest mortgage loan (the “Fairfield Inn CT Portfolio Mortgage Loan”) is evidenced by a promissory note in the original principal amount of $18,500,000, secured by first priority fee mortgages encumbering two hospitality properties located in Plainville, Connecticut and Windsor Locks, Connecticut (collectively, the “Fairfield Inn CT Portfolio Property”) under the Fairfield Inn & Suites by Marriott flag. The proceeds of the Fairfield Inn CT Portfolio Mortgage Loan were used to refinance the existing loan, fund upfront reserves, pay for closing costs and return $3,173,427 of equity to the borrower.
The Borrowers and the Sponsor.The borrowers are Rishabh, LLC and Jin Hospitality, LLC (collectively, the “Fairfield Inn CT Portfolio Borrowers” and individually each, a “Fairfield Inn CT Portfolio Borrower”), each a single-purpose Connecticut limited liability company. The Fairfield Inn CT Portfolio Borrowers are each 60% owned by Navika Capital Group Phase II LLC. Mr. Dilip Patel, president of Jamsan Hotel Management, is the second largest shareholder of the Fairfield Inn CT Portfolio Borrowers, with 20% of Rishabh LLC and 18.0% of Jin Hospitality, LLC. Navika Capital Group Phase II LLC is 18.97% owned by Sunil Jain and Neelam Jain, and no other person owns more than 10% of either borrowing entity. Navika Capital Group II LLC is one of three holding company subsidiaries of the Navika Group of Companies that acquired 60% interests in the two properties comprising the Fairfield Inn CT Portfolio Property on September 3, 2010, after they had both been extensively renovated.
Navika Capital Group LLC is managed by CEO and President Naveen Shah, who serves as the carve-out guarantor for the Fairfield Inn CT Portfolio Mortgage Loan. Navika Capital Group was founded in 2005 to acquire, own and manage income generating real estate nationwide, with a current portfolio consisting of 38 full- and limited-service hotels under various Marriott, Hilton, IHG, Wyndham, and Best Western flags and nine office buildings, shopping complexes, and recreational assets.
This is not a research report and was not prepared by any Underwriter’s research department. Please see additional important information and qualifications at the end of this Term Sheet.
T-140
| MSC 2016-UBS12 | Fairfield Inn CT Portfolio |
The Properties.
The following table presents each property comprising the Fairfield Inn CT Portfolio Property by descending Allocated Cut-off Date Loan Amount:
| Property Summary | ||||||||||
| Property | Location | No. of Rooms | Property Sub-type | Allocated Cut-off Date Loan Amount | % of Allocated Loan Amount | Year Built/ Renovated | Appraised Value | UW NOI | Cut-off Date LTV(1) | |
| Fairfield Inn & Suites Plainville | Plainville, CT | 107 | Select Service | $9,477,000 | 51.2% | 1974/2009 | $14,600,000 | $1,205,737 | 64.9% | |
| Fairfield Inn & Suites Hartford Airport | Windsor Locks, CT | 121 | Select Service | $9,023,000 | 48.8% | 1990/2009 | $13,900,000 | $1,269,144 | 64.9% | |
| Total/Wtd. Avg. | 228 | $18,500,000 | $28,500,000 | |||||||
| (1) | Cut-off Date LTV and UW NCF DSCR for each individual property are based on the Fairfield Inn CT Portfolio Mortgage Loan. |
The Fairfield Inn & Suites Plainville property was developed in 1974 and redeveloped in 2009. The property is a 107-room, four-story, limited-service hotel operating under a Marriott franchise that expires November 25, 2029, and offers an indoor swimming pool, fitness center, business center, complimentary hot breakfast, as well as an attached restaurant leased to a third party that was added in 2014. Guestrooms are equipped with flat-screen televisions, premium cable options, desk workspace and sleeper sofas in select guestrooms. The Fairfield Inn & Suites Plainville property is required to undergo a $633,900 ($5,924 per room) renovation in accordance with its franchisor-required property improvement plan, which will include soft-goods in guestrooms and guest bathrooms, and miscellaneous soft-goods in public spaces.
The Fairfield Inn & Suites Hartford Airport property was developed in 1990 and renovated in 2009. The property is a 121-room, three-story, limited-service hotel operating under a Marriott franchise that expires April 26, 2021, and offers an indoor swimming pool, fitness center, business center, and complimentary hot breakfast. The Fairfield Inn & Suites Hartford Airport property is required to undergo a $739,600 ($6,112 per room) renovation in accordance with its franchisor-required property improvement plan, which will include soft-goods in the guestrooms and guest bathrooms, and miscellaneous soft-goods in public spaces.
| Fairfield Inn & Suites Plainville Market Historical Occupancy, ADR, RevPAR(1) | |||||||||
| Competitive Set(1) | Fairfield Inn & Suites Plainville(2) | Penetration Factor | |||||||
| Year | Occupancy | ADR | RevPAR | Occupancy | ADR | RevPAR | Occupancy | ADR | RevPAR |
| 2014 | 65.1% | $101.73 | $66.22 | 69.5% | $99.43 | $69.12 | 106.8% | 97.7% | 104.4% |
| 2015 | 65.0% | $104.27 | $67.78 | 69.5% | $106.30 | $73.84 | 106.9% | 102.0% | 108.9% |
| 9/30/2016 TTM | 63.0% | $109.94 | $69.26 | 72.9% | $106.84 | $77.90 | 115.7% | 97.2% | 112.5% |
| (1) | Based on industry reports. Fairfield Inn & Suites Plainville’s competitive set includes: Red Roof Inn New Britain Farmington, Holiday Inn Express Southington, Courtyard Hartford Farmington, Hampton Inn Suites Hartford Farmington. |
| (2) | Based on historical cash flows. |
| Fairfield Inn & Suites Hartford Airport Market Historical Occupancy, ADR, RevPAR(1) | |||||||||
| Competitive Set(1) | Fairfield Inn & Suites Hartford Airport(2) | Penetration Factor | |||||||
| Year | Occupancy | ADR | RevPAR | Occupancy | ADR | RevPAR | Occupancy | ADR | RevPAR |
| 2014 | 67.9% | $99.50 | $67.53 | 73.6% | $91.76 | $67.58 | 108.5% | 92.2% | 100.1% |
| 2015 | 74.8% | $102.46 | $76.62 | 78.4% | $100.59 | $78.87 | 104.9% | 98.2% | 102.9% |
| 9/30/2016 TTM | 66.8% | $109.34 | $73.09 | 75.0% | $101.08 | $75.81 | 112.2% | 92.4% | 103.7% |
| (1) | Based on industry reports. Fairfield Inn & Suites Hartford Airport’s competitive set includes: La Quinta Inns & Suites Hartford Bradley Airport, Hampton Inn Hartford Airport, Holiday Inn Express Bradley Airport, Springhill Suites Hartford Airport Windsor Locks. |
| (2) | Based on historical cash flows. |
The Market. The Fairfield Inn CT Portfolio Property consists of two hotels that are located in Hartford County, within the Hartford-West Hartford-East Hartford, Connecticut MSA. The Fairfield Inn & Suites Plainville property is located less than one half mile from the Interstate-84/State Route 72 interchange, approximately ten miles southwest of downtown Hartford, Connecticut. The immediate area surrounding the Fairfield Inn & Suites Plainville property consists of commercial and residential development. Connecticut Commons, an anchored retail center, adjacent to the Fairfield Inn & Suites Plainville property, includes tenants such as Kohls, a Dick’s Sporting Goods, a Lowe’s and AMC Theatres. Additionally, the ESPN campus is less than five miles from the property as is United Technologies and Stanley, Black & Decker. The Fairfield Inn & Suites Hartford Airport property is situated adjacent to the Bradley International Airport, approximately 12.2 miles north of downtown Hartford, Connecticut. The property is located less than three miles off of Interstate-91, a major north-south arterial providing access to New York to the south and western Massachusetts to the north. The immediate area surrounding the Fairfield Inn & Suites Hartford Airport property consists of commercial development surrounding the Bradley International Airport and residential development. According to the appraisal, Hartford’s economy is strongly associated with the insurance industry, with several national insurance agencies, including Aetna, Cigna Corp., The Travelers Companies, and The Hartford Financial Services Group. The primary employers in the Hartford MSA range across the financial services, aerospace and healthcare industries.
This is not a research report and was not prepared by any Underwriter’s research department. Please see additional important information and qualifications at the end of this Term Sheet.
T-141
| MSC 2016-UBS12 | Fairfield Inn CT Portfolio |
Competitive properties to the Fairfield Inn CT Portfolio – Fairfield Inn & Suites Plainville property are shown in the tables below:
| Competitive Hotel Supply – Occupancy and Average Rate Comparison (Estimated) | |||||||||||
| Property | Rooms | Year Opened | 2014 Occ. | 2014 Average ADR | 2014 RevPAR | 2015 | 2015 Average ADR | 2015 RevPAR | % Change Occ. | % Change Average ADR | % Change RevPAR |
| Fairfield Inn & Suites Plainville(1) | 107 | 1974 | 69.5% | $99.43 | $69.12 | 69.5% | $106.30 | $73.84 | -0.07% | 6.91% | 6.83% |
| DoubleTree Hotel Bristol | 141 | 1988 | 62% | $142.00 | $88.04 | 68% | $145.00 | $98.60 | 9.68% | 2.11% | 11.99% |
| Courtyard Hartford Farmington | 119 | 2005 | 75% | $125.00 | $93.75 | 72% | $134.00 | $96.48 | -4.00% | 7.20% | 2.91% |
| Hampton Inn Suites Hartford Farmington | 124 | 2009 | 73% | $119.00 | $86.87 | 75% | $120.00 | $90.00 | 2.74% | 0.84% | 3.60% |
| Holiday Inn Express Southington Cheshire | 122 | 1987 | 64% | $88.00 | $56.32 | 64% | $87.00 | $55.68 | 0.00% | -1.14% | -1.14% |
| Comfort Suites Southington Cheshire | 79 | 2007 | 55% | $90.00 | $49.50 | 56% | $93.00 | $52.08 | 1.82% | 3.33% | 5.21% |
Source: Appraisal.
| (1) | Based on the underwritten operating statements. |
Competitive properties to the Fairfield Inn CT Portfolio – Fairfield Inn & Suites Hartford Airport property are shown in the tables below:
| Competitive Hotel Supply – Occupancy and Average Rate Comparison (Estimated) | |||||||||||
| Property | Rooms | Year Opened | 2014 Occ. | 2014 Average ADR | 2014 RevPAR | 2015 Occ. | 2015 Average ADR | 2015 RevPAR | % Change Occ. | % Change Average ADR | % Change RevPAR |
| Fairfield Inn & Suites Hartford Airport(1) | 121 | 1990 | 73.6% | $91.76 | $67.58 | 78.4% | $100.59 | $78.87 | 6.47% | 9.62% | 16.71% |
| Hampton Inn Hartford Airport | 110 | 2002 | 73% | $115.00 | $83.95 | 78% | $120.00 | $93.60 | 6.85% | 4.35% | 11.49% |
| Holiday Inn Express Bradley Airport | 107 | 2006 | 68% | $104.00 | $70.72 | 73% | $110.00 | $80.30 | 7.35% | 5.77% | 13.55% |
| Springhill Suites Hartford Airport Windsor Locks | 119 | 2008 | 76% | $97.00 | $73.72 | 83% | $99.00 | $82.17 | 9.21% | 2.06% | 11.46% |
| La Quinta Inns & Suites Hartford Bradley Airport | 102 | 1991 | 56% | $79.00 | $44.24 | 64% | $81.00 | $51.84 | 14.29% | 2.53% | 17.18% |
Source: Appraisal.
| (1) | Based on underwritten operating statements. |
Demand segments for the competitive properties to the Fairfield Inn CT Portfolio – Fairfield Inn & Suites Plainville property are shown in the tables below:
| Competitive Hotel Supply – Demand Segments | ||
| Property Name | Transient % | Meeting and Group% |
| Fairfield Inn & Suites Plainville | 70% | 30% |
| DoubleTree Hotel Bristol | 70% | 30% |
| Courtyard Hartford Farmington | 80% | 20% |
| Hampton Inn Suites Hartford Farmington | 80% | 20% |
| Holiday Inn Express Southington Cheshire | 85% | 15% |
| Comfort Suites Southington Cheshire | 90% | 10% |
Source: Appraisal.
Demand segments for the competitive properties to the Fairfield Inn CT Portfolio – Fairfield Inn & Suites Hartford Airport property are shown in the tables below:
| Competitive Hotel Supply – Demand Segments | ||
| Property Name | Transient % | Meeting and Group% |
| Fairfield Inn & Suites Hartford Airport | 85% | 15% |
| Hampton Inn Hartford Airport | 85% | 15% |
| Holiday Inn Express Bradley Airport | 85% | 15% |
| Springhill Suites Hartford Airport Windsor Locks | 80% | 20% |
| La Quinta Inns & Suites Hartford Bradley Airport | 90% | 10% |
Source: Appraisal.
This is not a research report and was not prepared by any Underwriter’s research department. Please see additional important information and qualifications at the end of this Term Sheet.
T-142
| MSC 2016-UBS12 | Fairfield Inn CT Portfolio |
Operating History and Underwritten Net Cash Flow.The following tables present certain information relating to the individual and combined historical operating performance and the Underwritten Net Cash Flow at the Fairfield Inn CT Portfolio Property.
| Fairfield Inn & Suites Plainville | |||||||
| 2012 | 2013 | 2014 | 2015 | 9/30/2016 TTM | UW | ||
| Occupancy | 64.3% | 66.8% | 69.5% | 69.5% | 72.9% | 72.9% | |
| ADR | $96.11 | $99.00 | $99.43 | $106.30 | $106.84 | $106.84 | |
| RevPAR | $61.83 | $66.09 | $69.12 | $73.84 | $77.90 | $77.90 | |
| Fairfield Inn & Suites Hartford Airport | |||||||
| 2012 | 2013 | 2014 | 2015 | 9/30/2016 TTM | UW | ||
| Occupancy | 70.1% | 74.1% | 73.6% | 78.4% | 75.0% | 75.0% | |
| ADR | $94.73 | $91.91 | $91.76 | $100.59 | $101.08 | $101.08 | |
| RevPAR | $66.38 | $68.13 | $67.58 | $78.87 | $75.81 | $75.81 | |
| Cash Flow Analysis(1) | |||||||
| 2012 | 2013 | 2014 | 2015 | 9/30/2016 TTM | UW | UW per Room | |
| Rooms Revenue | $5,361,084 | $5,590,473 | $5,683,976 | $6,367,111 | $6,407,917 | $6,390,560 | $28,029 |
| Food & Beverage | $0 | $0 | $0 | $0 | $0 | $0 | $0 |
| Other Income | $75,799 | $387,122 | $115,579 | $243,930 | $265,822 | $265,099 | $1,163 |
| Total Revenue | $5,436,883 | $5,977,595 | $5,799,555 | $6,611,041 | $6,673,739 | $6,655,659 | $29,191 |
| Total Expenses | $3,423,696 | $3,587,774 | $3,426,492 | $3,754,123 | $3,983,695 | $4,180,778 | $18,337 |
| Net Op. Income | $2,013,187 | $2,389,821 | $2,373,063 | $2,856,918 | $2,690,044 | $2,474,881 | $10,855 |
| FF&E | $217,475 | $239,104 | $231,982 | $264,442 | $266,950 | $266,226 | $1,168 |
| Net Cash Flow | $1,795,712 | $2,150,717 | $2,141,081 | $2,592,476 | $2,423,094 | $2,208,655 | $9,687 |
| NOI DSCR | 1.79x | 2.12x | 2.11x | 2.53x | 2.39x | 2.20x | |
| NCF DSCR | 1.59x | 1.91x | 1.90x | 2.30x | 2.15x | 1.96x | |
| NOI Debt Yield | 10.9% | 12.9% | 12.8% | 15.4% | 14.5% | 13.4% | |
| NCF Debt Yield | 9.7% | 11.6% | 11.6% | 14.0% | 13.1% | 11.9% | |
| (1) | Cash Flow Analysis reflects the combined historical and underwritten for the Fairfield Inn & Suites Plainville property and the Fairfield Inn & Suites Hartford Airport property.. |
This is not a research report and was not prepared by any Underwriter’s research department. Please see additional important information and qualifications at the end of this Term Sheet.
T-143
| MSC 2016-UBS12 | Arkansas Multifamily Portfolio |
| Mortgage Loan No. 15 – Arkansas Multifamily Portfolio |
| Mortgage Loan Information | Property Information | |||||||
| Mortgage Loan Seller: | UBS AG | Single Asset/Portfolio: | Portfolio | |||||
| Original Balance: | $18,500,000 | Location: | Various | |||||
| Cut-off Date Balance: | $18,476,703 | General Property Type: | Multifamily | |||||
| % of Initial Pool Balance: | 2.2% | Detailed Property Type: | Garden | |||||
| Loan Purpose: | Refinance | Title Vesting: | Fee | |||||
| Sponsor: | Chaim Puretz | Year Built/Renovated: | Various / N/A | |||||
| Mortgage Rate: | 4.7450% | Size: | 480 Units | |||||
| Note Date: | 10/31/2016 | Cut-off Date Balance per Unit: | $38,493 | |||||
| First Payment Date: | 12/6/2016 | Maturity Date Balance per Unit: | $31,488 | |||||
| Maturity Date: | 11/6/2026 | Property Manager: | United Properties Management, Inc. | |||||
| Original Term to Maturity: | 120 months | |||||||
| Original Amortization Term: | 360 months | Underwriting and Financial Information | ||||||
| IO Period: | 0 months | UW NOI: | $1,935,673 | |||||
| Seasoning: | 1 month | UW NOI Debt Yield: | 10.5% | |||||
| Prepayment Provisions(1): | LO (25); DEF (91); O (4) | UW NOI Debt Yield at Maturity: | 12.8% | |||||
| Lockbox/Cash Mgmt Status: | Soft/In Place | UW NCF DSCR: | 1.57x | |||||
| Additional Debt Type: | N/A | Most Recent NOI: | $2,037,659 (7/31/2016 TTM) | |||||
| Additional Debt Balance: | N/A | 2nd Most Recent NOI: | $2,081,563 (12/31/2015) | |||||
| Future Debt Permitted (Type): | No (N/A) | 3rd Most Recent NOI(2): | NAV | |||||
| Reserves | Most Recent Occupancy: | 94.8% (7/20/2016) | ||||||
| Type | Initial | Monthly | Cap | 2nd Most Recent Occupancy: | 96.2% (12/31/2015) | |||
| RE Tax: | $39,323 | $15,124 | N/A | 3rd Most Recent Occupancy(2): | NAV | |||
| Insurance: | $70,616 | $10,699 | N/A | Appraised Value (as of): | $28,350,000 (7/11/2016-7/12/2016) | |||
| Deferred Maintenance: | $231,149 | $0 | N/A | Cut-off Date LTV Ratio: | 65.2% | |||
| Recurring Replacements: | $300,000 | $12,000 | N/A | Maturity Date LTV Ratio: | 53.3% | |||
| Sources and Uses | ||||||
| Sources | Proceeds | % of Total | Uses | Proceeds | % of Total | |
| Loan Amount: | $18,500,000 | 100.0% | Loan Payoff(3): | $14,768,834 | 79.8% | |
| Reserves: | $641,088 | 3.5% | ||||
| Closing Costs: | $527,039 | 2.8% | ||||
| Return of Equity: | $2,563,040 | 13.9% | ||||
| Total Sources: | $18,500,000 | 100.0% | Total Uses: | $18,500,000 | 100.0% | |
| (1) | Following the lockout period, the Arkansas Multifamily Portfolio Borrowers are permitted to partially release any of the Arkansas Multifamily Portfolio Properties, subject to certain conditions including (i) no event of default has occurred and is continuing, (ii) partially defeasing an amount equal to 115% of the released property’s allocated loan balance for the legal non-conforming use individual properties (Terrace Green Apartments and Northwest Acres Apartments) or 125% for any other released property, (iii) the loan-to-value ratio with respect to the remaining properties will be no greater than the lesser of the loan to value ratio at loan closing and the loan-to-value ratio immediately prior to the release, (iv) the debt service coverage ratio with respect to the remaining properties will be no less than the greater of the debt service coverage ratio at loan closing and the debt service coverage ratio immediately prior to the release, and (v) the debt yield with respect to the remaining properties will be no less than the greater of the debt yield at loan closing and the debt yield immediately prior to the release. |
| (2) | Historical operating data and occupancy data are not available as the sponsor purchased the Arkansas Multifamily Portfolio Properties in July 2014. |
| (3) | Loan Payoff includes approximately $1.9 million in prepayment penalties. |
The Mortgage Loan. The fifteenth largest mortgage loan (the “Arkansas Multifamily Portfolio Mortgage Loan”) is evidenced by a promissory note in the original principal amount of $18,500,000, which is secured by a first priority fee mortgage encumbering a 480-unit, four property portfolio of garden style multifamily properties located in Fort Smith, Little Rock, North Little Rock and Springdale, Arkansas (the “Arkansas Multifamily Portfolio Properties”). The proceeds of the Arkansas Multifamily Portfolio Mortgage Loan were used primarily to prepay existing debt (including prepayment penalties of approximately $1.9 million) secured by the Arkansas Multifamily Portfolio Properties, fund reserves, pay closing costs and return equity to the sponsor. The most recent prior financing of the Allied Garden Apartments property was included in the FNA 2014-M12 transaction.
The Borrower and the Sponsor. The borrowers are PF Allied Gardens LLC, PF Jefferson Manor LLC, PF Northwest Acres LLC and PF Terrace Green LLC (collectively, the “Arkansas Multifamily Portfolio Borrowers”), each of which is a single-purpose Arkansas limited liability company structured to be bankruptcy-remote with two independent directors. The Arkansas Multifamily Portfolio Borrowers are wholly-owned by PF Arkansas Portfolio LLC. PF Arkansas Portfolio LLC is owned by Pure Little Rock LLC (7.17%), Pure Springdale LLC (55.44%), Pure El Dorado LLC (21.74%), PF Arkansas Holding LLC (6.5%), Shilo Arkansas LLC (3.72%) and Pure Fort Smith LLC (5.43%), each of which is 50.00% owned by Pure PF Arkansas, LLC which is 100.00% owned by Chaim Puretz, the sponsor and nonrecourse carve-out guarantor of the Arkansas Multifamily Portfolio Mortgage Loan.
Chaim Puretz has over 15 years of experience in the real estate industry with a focus on the acquisition of multifamily, Department of Housing and Urban Development (“HUD”) properties. Chaim Puretz has an ownership interest in 49 commercial properties, including 47 multifamily properties totaling 6,223 units and two mixed-use properties totaling 600 units.
This is not a research report and was not prepared by any Underwriter’s research department. Please see additional important information and qualifications at the end of this Term Sheet.
T-144
| MSC 2016-UBS12 | Arkansas Multifamily Portfolio |
The Properties. The Arkansas Multifamily Portfolio Properties consists of four, garden style multifamily properties totaling 480 units located in Fort Smith, Little Rock, North Little Rock and Springdale, Arkansas. The Arkansas Multifamily Portfolio Properties were constructed between 1970 and 1980. As of July 20, 2016, the Arkansas Multifamily Portfolio Properties were 94.8% occupied. In July 2014, the sponsor purchased the Arkansas Multifamily Portfolio Properties for a purchase price of approximately $16.3 million. The Arkansas Multifamily Portfolio Borrower has since invested approximately $869,508 in capital expenditures and soft costs for a total cost basis of approximately $17.1 million. Terrace Green Apartments and Northwest Acres Apartments properties are each identified in the related zoning report as being a legal non-conforming use of the related land. See “—Risks Related to Zoning Non-Compliance and Use Restrictions”in the Preliminary Prospectus.
The Arkansas Multifamily Portfolio Properties contain 401 units (83.5% of total units) subject to income and rent restrictions under a Housing Assistance Payments Section 8 (“HAP”) contract in place. The HAP contract requires the 401 units be leased to low income tenants that qualify for the Section 8 HAP voucher program in which the tenants pay 30% of their income and the subsidy pays the difference. To qualify, a tenant must earn 50% or less of the area median income. The HAP contracts at the Arkansas Multifamily Portfolio were renewed in 2014 for 20-year terms with 401 of the 480 total units being designated as Section 8 HAP units at initial contract rental rates.
| Property Summary | |||||||||
| Property Name - Location | No. of Units | Occupancy(1) | Allocated Cut-off Date Loan Amount | % of Allocated Loan Amount | Cut-off Date Balance Per Unit | Year Built/ Renovated | Appraised Value | UW NOI | Cut-off Date LTV |
| Allied Garden Apartments - Fort Smith, AR | 160 | 95.6% | $6,088,971 | 33.0% | $38,056 | 1970/NAP | $9,420,000 | $638,352 | 64.6% |
| Terrace Green Apartments - Little Rock, AR | 100 | 96.0% | $4,792,366 | 25.9% | $47,924 | 1971/NAP | $6,260,000 | $495,937 | 76.6% |
| Jefferson Manor Apartments - North Little Rock, AR | 140 | 92.1% | $4,633,732 | 25.1% | $33,098 | 1975/NAP | $7,970,000 | $490,349 | 58.1% |
| Northwest Acres Apartments - Springdale, AR | 80 | 96.3% | $2,961,634 | 16.0% | $37,020 | 1980/NAP | $4,700,000 | $311,034 | 63.0% |
| Total/Wtd. Avg. | 480 | 94.8% | $18,476,703 | 100.0% | $38,493 | $28,350,000 | $1,935,673 | 65.2% | |
| (1) | Information is based on the underwritten rent roll. |
The Allied Garden Apartments property consists of 26 two-story apartment buildings with a total of 160 units, of which 156 units are designated Section 8 HAP. Situated on a 14.1-acre site, the Allied Garden Apartments improvements were constructed in 1970 and feature 242 surface parking spaces (1.5 per unit). As of July 20, 2016, the Allied Garden Apartments property was 95.6% occupied. Unit amenities include a gas oven and range, refrigerator and air conditioning. Community amenities include a playground and laundry facility for use by tenants.
| Allied Garden Apartments Unit Mix(1) | ||||||||||
| Avg. Monthly Rental Rate Per Unit | ||||||||||
| Unit Type | Number of Total Units | % of Total | Number of HAP Units | Occupied Total Units | Occupied HAP Units | Total Occupancy | Avg. Unit Size (SF) | Non-HAP Units | HAP Units | Total Units |
| 1 Bedroom | 48 | 30.0% | 48 | 47 | 47 | 97.9% | 700 | NAP | $590 | $590 |
| 2 Bedroom | 64 | 40.0% | 63 | 61 | 60 | 95.3% | 860 | $600 | $649 | $648 |
| 3 Bedroom | 32 | 20.0% | 30 | 30 | 28 | 93.8% | 1,100 | $700 | $786 | $780 |
| 4 Bedroom | 16 | 10.0% | 15 | 15 | 14 | 93.8% | 1,150 | $848 | $861 | $860 |
| Total/Wtd. Avg. | 160 | 100.0% | 156 | 153 | 149 | 95.6% | 889 | $712 | $676 | $677 |
| (1) | Information is based on the underwritten rent roll. |
The Terrace Green Apartments property consists of 11 one- and two-story apartment buildings with 100 units, of which 99 units are designated Section 8 HAP. Situated on a 5.9-acre site, the Terrace Green Apartments improvements were constructed in 1971 and feature 147 surface parking spaces (1.5 per unit). As of July 20, 2016, the Terrace Green Apartments property was 96.0% occupied. Unit amenities include an electric oven and range, dishwasher, microwave, refrigerator and air conditioning. Community amenities include a playground, meeting room and laundry facility for use by tenants.
| Terrace Green Apartments Unit Mix(1) | ||||||||||
| Avg. Monthly Rental Rate Per Unit | ||||||||||
| Unit Type | Number of Total Units | % of Total | Number of HAP Units | Occupied Total Units | Occupied HAP Units | Total Occupancy | Avg. Unit Size (SF) | Non-HAP Units | HAP Units | Total Units |
| 1 Bedroom | 20 | 20.0% | 20 | 20 | 20 | 100.0% | 560 | NAP | $753 | $753 |
| 2 Bedroom | 48 | 48.0% | 48 | 45 | 45 | 93.8% | 736 | NAP | $849 | $849 |
| 3 Bedroom | 24 | 24.0% | 24 | 23 | 23 | 95.8% | 880 | NAP | $928 | $928 |
| 4 Bedroom | 8 | 8.0% | 7 | 8 | 7 | 100.0% | 1,056 | $1,000 | $981 | $983 |
| Total/Wtd. Avg. | 100 | 100.0% | 99 | 96 | 95 | 96.0% | 761 | $1,000 | $858 | $859 |
| (1) | Information is based on the underwritten rent roll. |
The Jefferson Manor Apartments property consists of 16 one- and two-story apartment buildings with 140 units, of which 68 units are designated Section 8 HAP. Situated on a 9.4-acre site, the Jefferson Manor Apartments improvements were constructed in 1975 and feature 181 surface parking spaces (1.3 per unit). As of July 20, 2016, the Jefferson Manor Apartments property was 92.1% occupied. Unit amenities include an electric oven and range, dishwasher, microwave, refrigerator and air conditioning. Community amenities include a playground, meeting room and laundry facility for use by tenants.
This is not a research report and was not prepared by any Underwriter’s research department. Please see additional important information and qualifications at the end of this Term Sheet.
T-145
| MSC 2016-UBS12 | Arkansas Multifamily Portfolio |
| Jefferson Manor Apartments Unit Mix(1) | ||||||||||
| Avg. Monthly Rental Rate Per Unit | ||||||||||
| Unit Type | Number of Total Units | % of Total | Number of HAP Units | Occupied Total Units | Occupied HAP Units | Total Occupancy | Avg. Unit Size (SF) | Non-HAP Units | HAP Units | Total Units |
| 1 Bedroom | 32 | 22.9% | 17 | 31 | 16 | 96.9% | 708 | $602 | $713 | $659 |
| 2 Bedroom | 84 | 60.0% | 43 | 80 | 39 | 95.2% | 993 | $662 | $817 | $737 |
| 3 Bedroom | 24 | 17.1% | 8 | 18 | 7 | 75.0% | 1,059 | $711 | $949 | $803 |
| Total/Wtd. Avg. | 140 | 100.0% | 68 | 129 | 62 | 92.1% | 939 | $656 | $805 | $728 |
| (1) | Information is based on the underwritten rent roll. |
The Northwest Acres Apartments property consists of 10 two-story apartment buildings with 80 units, of which 78 units are designated Section 8 HAP. Situated on a 6.4-acre site, the Northwest Acres Apartments improvements were constructed in 1980 and feature 114 surface parking spaces (1.4 per unit). As of July 20, 2016, the Northwest Acres Apartments property was 96.3% occupied. Unit amenities include a gas oven and range, refrigerator and air conditioning. Community amenities include a playground and laundry facility for use by tenants.
| Northwest Acres Apartments Unit Mix(1) | ||||||||||
| Avg. Monthly Rental Rate Per Unit | ||||||||||
| Unit Type | Number of Total Units | % of Total | Number of HAP Units | Occupied Total Units | Occupied HAP Units | Total Occupancy | Avg. Unit Size (SF) | Non-HAP Units | HAP Units | Total Units |
| 1 Bedroom | 16 | 20.0% | 16 | 15 | 15 | 93.8% | 500 | NAP | $599 | $599 |
| 2 Bedroom | 48 | 60.0% | 48 | 47 | 47 | 97.9% | 691 | NAP | $701 | $701 |
| 3 Bedroom | 16 | 20.0% | 14 | 15 | 13 | 93.8% | 802 | $695 | $818 | $802 |
| Total/Wtd. Avg. | 80 | 100.0% | 78 | 77 | 75 | 96.3% | 675 | $695 | $701 | $701 |
| (1) | Information is based on the underwritten rent roll. |
The Market. The Arkansas Multifamily Portfolio Properties are located in Fort Smith, Little Rock, North Little Rock and Springdale, Arkansas. According to the appraisals, the Arkansas Multifamily Portfolio Properties are located within four Arkansas multifamily submarkets.
According to the appraisal, the Allied Garden Apartments property is located within the Fort Smith Northside multifamily submarket. As of the second quarter of 2016, the Fort Smith Northside multifamily submarket had an overall vacancy rate of 3.0% and an average asking rent of $706, $950 and $1,404 per unit for one-, two- and three-bedroom apartments, respectively. According to the appraisal, the Fort Smith Northside multifamily submarket contains 2,706 units.
According to the appraisal, the Terrace Green Apartments property is located within the Upper Baseline multifamily submarket. As of the second quarter of 2016, the Upper Baseline multifamily submarket had an overall vacancy rate of 21.2% and an average asking rent of $432, $580 and $773 per unit for one-, two- and three-bedroom apartments, respectively. According to the appraisal, the Upper Baseline multifamily submarket contains 912 units.
According to the appraisal, the Jefferson Manor Apartments property is located within the North Little Rock multifamily submarket. As of the second quarter of 2016, the North Little Rock multifamily submarket had an overall vacancy rate of 6.6% and an average asking rent of $371, $625, $742 and $776 per unit for studio, one-, two- and three-bedroom apartments, respectively. According to the appraisal, the North Little Rock multifamily submarket contains 7,146 units.
According to the appraisal, the Northwest Acres Apartments property is located within the Outer Northeast Washington County multifamily submarket. As of the second quarter of 2016, the Outer Northeast Washington County multifamily submarket had an overall vacancy rate of 2.7% and an average asking rent of $465, $474, $591 and $769 per unit for studio, one-, two- and three-bedroom apartments, respectively. According to the appraisal, the Outer Northeast Washington County multifamily submarket contains 5,913 units.
The following table presents certain market information relating to the Arkansas Multifamily Portfolio Properties:
| Market Comparison | ||||||
| In-Place(1) | Competitive Set Conclusion | 5-Mile Radius(2) | ||||
| Property Name - Location | Avg. Monthly Rental Rate Per Unit | Occupancy | Asking Rents | Occupancy | Population | Average Household Income |
| Allied Garden Apartments - Fort Smith, AR | $677 | 95.6% | $414 - $873 | 99.8% | 86,001 | $51,206 |
| Terrace Green Apartments - Little Rock, AR | $859 | 96.0% | $433 - $1,160 | 97.0% | 85,012 | $41,845 |
| Jefferson Manor Apartments - North Little Rock, AR | $728 | 92.1% | $415 - $765 | 91.9% | 26,069 | $45,449 |
| Northwest Acres Apartments - Springdale, AR | $701 | 96.3% | $386 - $799 | 97.5% | 99,212 | $67,859 |
| Total/Wtd. Avg.(3) | $734 | 94.8% | $386 - $1,160 | 96.5% | 70,517 | $50,352 |
Source:Appraisal
| (1) | Information is based on the underwritten rent rolls. |
| (2) | Information is based on third party market research reports. |
| (3) | Wtd. Avg. is based on total units at each property. |
This is not a research report and was not prepared by any Underwriter’s research department. Please see additional important information and qualifications at the end of this Term Sheet.
T-146
| MSC 2016-UBS12 | Arkansas Multifamily Portfolio |
Operating History and Underwritten Net Cash Flow. The following table presents certain information relating to the historical operating performance and the Underwritten Net Cash Flow at the Arkansas Multifamily Portfolio Properties:
| Cash Flow Analysis | ||||||
| 2013(1) | 2014(1) | 2015 | 7/30/2016 TTM | UW | UW per Unit | |
| Gross Potential Rent(2) | N/A | N/A | $4,066,789 | $3,959,704 | $4,240,284 | $8,834 |
| Total Other Income | N/A | N/A | $87,630 | $84,829 | $84,829 | $177 |
| Less Vacancy & Concessions | N/A | N/A | ($377) | ($714) | ($294,336) | ($613) |
| Effective Gross Income | N/A | N/A | $4,154,042 | $4,043,819 | $4,030,777 | $8,397 |
| Total Operating Expenses | N/A | N/A | $2,072,479 | $2,006,160 | $2,095,104 | $4,365 |
| Net Operating Income | N/A | N/A | $2,081,563 | $2,037,659 | $1,935,673 | $4,033 |
| Capital Expenditures | N/A | N/A | $0 | $0 | $120,000 | $250 |
| Net Cash Flow | N/A | N/A | $2,081,563 | $2,037,659 | $1,815,673 | $3,783 |
| Occupancy %(3) | N/A | N/A | 96.2% | 94.8% | 93.1% | |
| NOI DSCR | N/A | N/A | 1.80x | 1.76x | 1.67x | |
| NCF DSCR | N/A | N/A | 1.80x | 1.76x | 1.57x | |
| NOI Debt Yield | N/A | N/A | 11.3% | 11.0% | 10.5% | |
| NCF Debt Yield | N/A | N/A | 11.3% | 11.0% | 9.8% | |
| (1) | Historical operating data is not available as the sponsor purchased the Arkansas Multifamily Portfolio Properties in July 2014. |
| (2) | UW Gross Potential Rent is grossed up for vacant space and is based on the underwritten rent rolls. |
| (3) | 7/30/2016 TTM Occupancy % as of July 20, 2016. UW Occupancy % is based on underwritten economic occupancy. |
This is not a research report and was not prepared by any Underwriter’s research department. Please see additional important information and qualifications at the end of this Term Sheet.
T-147
| MSC 2016-UBS12 |
This material was prepared by sales, trading, banking or other non-research personnel of one of the following: Morgan Stanley & Co. LLC, Morgan Stanley & Co. International Limited, Morgan Stanley Japan Limited and/or Morgan Stanley Dean Witter Asia Limited (together with their affiliates, hereinafter “Morgan Stanley”), UBS Securities LLC (together with its affiliates, “UBS Securities”), Merrill Lynch, Pierce, Fenner & Smith Incorporated (together with its affiliates, “BofA Merrill Lynch”), Natixis Securities Americas LLC (together with its affiliates, “Natixis”), Citigroup Global Markets Inc. (together with its affiliates, “Citigroup”) and Academy Securities, Inc. (together with its affiliates, “Academy”, and collectively with Morgan Stanley, UBS Securities, BofA Merrill Lynch, Natixis and Citigroup, the “Underwriters”). This material was not produced by an Underwriter’s research analyst, although it may refer to an Underwriter’s research analyst or research report. Unless otherwise indicated, these views (if any) are the author’s and may differ from those of the fixed income or equity research departments of the Underwriters or others in those firms.
This material may have been prepared by or in conjunction with the respective trading desks of the Underwriters that may deal as principal in or own or act as market maker or liquidity provider for the securities/instruments (or related derivatives) mentioned herein. The trading desk may have accumulated a position in the subject securities/instruments based on the information contained herein. Trading desk materials are not independent of the proprietary interests of the Underwriters, which may conflict with your interests. Each of the Underwriters may also perform or seek to perform investment banking services for the issuers of the securities and instruments mentioned herein.
The information contained in this material is subject to change, completion or amendment from time to time, and the information in this material supersedes information in any other communication relating to the securities referred to in this material. This material is not a solicitation to participate in any trading strategy, and is not an offer to sell any security or instrument or a solicitation of an offer to buy or sell any security or instrument in any jurisdiction where an offer, solicitation or sale is not permitted. Unless otherwise set forth in this material, any securities referred to in this material may not have been registered under the U.S. Securities Act of 1933, as amended, and, if not, may not be offered or sold absent an exemption therefrom. Recipients are required to comply with any legal or contractual restrictions on their purchase, holding, sale, exercise of rights or performance of obligations under any securities/instruments transaction.
The securities/instruments discussed in this material may not be suitable for all investors. This material has been prepared and issued by the Underwriters for intended distribution to market professionals and institutional investor clients. Other recipients should seek independent investment advice prior to making any investment decision based on this material. This material does not provide individually tailored investment advice or offer tax, regulatory, accounting or legal advice. Prior to entering into any proposed transaction, recipients should determine, in consultation with their own investment, legal, tax, regulatory and accounting advisors, the economic risks and merits, as well as the legal, tax, regulatory and accounting characteristics and consequences, of the transaction. You should consider this material as only a single factor in making an investment decision.
The value of and income from investments may vary because of changes in interest rates, foreign exchange rates, default rates, prepayment rates, securities/instruments prices, market indexes, operational or financial conditions of companies or other factors. There may be time limitations on the exercise of options or other rights in securities/instruments transactions. Past performance is not necessarily a guide to future performance. Estimates of future performance are based on assumptions that may not be realized. Actual events may differ from those assumed and changes to any assumptions may have a material impact on any projections or estimates. Other events not taken into account may occur and may significantly affect the projections or estimates. Certain assumptions may have been made for modeling purposes only to simplify the presentation and/or calculation of any projections or estimates, and the Underwriters do not represent that any such assumptions will reflect actual future events. Accordingly, there can be no assurance that estimated returns or projections will be realized or that actual returns or performance results will not materially differ from those estimated herein. Some of the information contained in this document may be aggregated data of transactions in securities or other financial instruments executed by an Underwriter that has been compiled so as not to identify the underlying transactions of any particular customer.
Notwithstanding anything herein to the contrary, the Underwriters and each recipient hereof (and their employees, representatives, and other agents) may disclose to any and all persons, without limitation of any kind from the commencement of discussions, the U.S. federal and state income tax treatment and tax structure of the transaction and all materials of any kind (including opinions or other tax analyses) that are provided to it relating to the tax treatment and tax structure (as such terms are defined in Treasury Regulation 1.6011-4). For this purpose, “tax structure” is limited to facts relevant to the U.S. federal and state income tax treatment of the transaction and does not include information relating to the identity of the parties, their affiliates, agents or advisors. This authorization of tax disclosure is retroactively effective to the commencement of discussions with prospective investors regarding the transactions contemplated herein.
THE DISTRIBUTION OF THIS MATERIAL (A) IF MADE BY A PERSON WHO IS NOT AN AUTHORIZED PERSON UNDER THE FINANCIAL SERVICES AND MARKETS ACT 2000 (“FSMA”), IS BEING MADE ONLY TO, OR DIRECTED ONLY AT, PERSONS WHO (I) ARE OUTSIDE THE UNITED KINGDOM, OR (II) HAVE PROFESSIONAL EXPERIENCE IN MATTERS RELATING TO INVESTMENTS AND QUALIFY AS INVESTMENT PROFESSIONALS IN ACCORDANCE WITH ARTICLE 19(5) OF THE FINANCIAL SERVICES AND MARKETS ACT 2000 (FINANCIAL PROMOTION) ORDER 2005 (THE “FINANCIAL PROMOTION ORDER”), OR (III) ARE PERSONS FALLING WITHIN ARTICLE 49(2)(A) THROUGH (D) (HIGH NET WORTH COMPANIES, UNINCORPORATED ASSOCIATIONS, ETC.) OF THE FINANCIAL PROMOTION ORDER; AND (B) IF MADE BY A PERSON WHO IS AN AUTHORIZED PERSON UNDER THE FSMA, IS BEING MADE ONLY TO, OR DIRECTED ONLY AT, PERSONS WHO (I) ARE OUTSIDE THE UNITED KINGDOM, OR (II) HAVE PROFESSIONAL EXPERIENCE IN MATTERS RELATING TO INVESTMENTS AND QUALIFY AS INVESTMENT PROFESSIONALS IN ACCORDANCE WITH ARTICLE 14(5) OF THE FINANCIAL SERVICES AND MARKETS ACT 2000 (PROMOTION OF COLLECTIVE INVESTMENT SCHEMES) (EXEMPTIONS) ORDER 2001 (THE “PROMOTION OF COLLECTIVE INVESTMENT SCHEMES EXEMPTIONS ORDER”), OR (III) ARE PERSONS FALLING WITHIN ARTICLE 22(2)(A) THROUGH (D) (“HIGH NET WORTH COMPANIES, UNINCORPORATED ASSOCIATIONS, ETC.”) OF THE PROMOTION OF COLLECTIVE INVESTMENT SCHEMES EXEMPTIONS ORDER, OR (IV) ARE PERSONS TO WHOM THE ISSUING ENTITY MAY LAWFULLY BE PROMOTED IN ACCORDANCE WITH CHAPTER
4.12 OF THE UK FINANCIAL CONDUCT AUTHORITY’S CONDUCT OF BUSINESS SOURCEBOOK.
THE OFFERED CERTIFICATES HAVE NOT BEEN AND WILL NOT BE REGISTERED UNDER THE FINANCIAL INSTRUMENTS EXCHANGE ACT OF JAPAN (LAW NO. 25 OF 1948, AS AMENDED (THE “FIEL”)), AND EACH OF MORGAN STANLEY & CO. LLC, UBS SECURITIES LLC, MERRILL LYNCH, PIERCE, FENNER & SMITH INCORPORATED, NATIXIS SECURITIES AMERICAS LLC, CITIGROUP GLOBAL MARKETS INC. AND ACADEMY SECURITIES, INC. HAS AGREED THAT IT WILL NOT OFFER OR SELL ANY OFFERED CERTIFICATES, DIRECTLY OR INDIRECTLY, IN JAPAN OR TO, OR FOR THE BENEFIT OF, ANY JAPANESE PERSON, OR TO OTHERS FOR RE-OFFERING OR RESALE, DIRECTLY OR INDIRECTLY, IN JAPAN OR TO ANY JAPANESE PERSON, EXCEPT PURSUANT TO AN EXEMPTION FROM THE REGISTRATION REQUIREMENTS OF, AND OTHERWISE IN COMPLIANCE WITH, THE FIEL AND ANY OTHER APPLICABLE LAWS AND REGULATIONS. FOR THE PURPOSES OF THIS PARAGRAPH, “JAPANESE PERSON” SHALL MEAN ANY PERSON RESIDENT IN JAPAN, INCLUDING ANY CORPORATION OR OTHER ENTITY ORGANIZED UNDER THE LAWS AND REGULATIONS OF JAPAN.
© 2016 Morgan Stanley