| FREE WRITING PROSPECTUS | ||
| FILED PURSUANT TO RULE 433 | ||
| REGISTRATION FILE NO.: 333-206582-11 | ||
 |  |  |
BANK 2017-BNK5
Free Writing Prospectus
Structural and Collateral Term Sheet
$1,231,288,365
(Approximate Total Mortgage Pool Balance)
$1,055,675,000
(Approximate Offered Certificates)
Morgan Stanley Capital I Inc.
as Depositor
Wells Fargo Bank, National Association
Bank of America, National Association
Morgan Stanley Mortgage Capital Holdings LLC
National Cooperative Bank, N.A.
as Sponsors and Mortgage Loan Sellers
Commercial Mortgage Pass-Through Certificates
Series 2017-BNK5
June 9, 2017
MORGAN STANLEY Co-Lead Bookrunning Manager | BofA MERRILL LYNCH Co-Lead Bookrunning Manager | WELLS FARGO SECURITIES Co-Lead Bookrunning Manager |
Drexel Hamilton Co-Manager | ||
STATEMENT REGARDING THIS FREE WRITING PROSPECTUS
The depositor has filed a registration statement (including a prospectus) with the SEC (File No. 333-206582) for the offering to which this communication relates. Before you invest, you should read the prospectus in that registration statement and other documents the depositor has filed with the SEC for more complete information about the depositor, the issuing entity and this offering. You may get these documents for free by visiting EDGAR on the SEC web site atwww.sec.gov. Alternatively, the depositor or any underwriter or any dealer participating in the offering will arrange to send you the prospectus if you request it by calling toll free 1-866-718-1649 or by email toprospectus@ms.com.
This is not a research report and was not prepared by any Underwriter’s research department. It was prepared by the Underwriters’ sales, trading, banking or other non-research personnel. Please see additional important information and qualifications at the end of this Term Sheet.
Neither this Term Sheet nor anything contained herein shall form the basis for any contract or commitment whatsoever.The information contained herein is preliminary as of the date hereof.This Term Sheet is subject to change, completion or amendment from time to time.The information contained herein will be superseded by similar information delivered to you as part of the Preliminary Prospectus.The information contained herein supersedes any such information previously delivered.The information contained herein should be reviewed only in conjunction with the entire Preliminary Prospectus.All of the information contained herein is subject to the same limitations and qualifications contained in the Preliminary Prospectus.The information contained herein does not contain all relevant information relating to the underlying mortgage loans or mortgaged properties.Such information is described in the Preliminary Prospectus.The information contained herein will be more fully described in the Preliminary Prospectus.The information contained herein should not be viewed as projections, forecasts, predictions or opinions with respect to value.Prior to making any investment decision, prospective investors are strongly urged to read the Preliminary Prospectus in its entirety.Neither the Securities and Exchange Commission nor any state securities commission has approved or disapproved of these securities or determined if this Term Sheet is truthful or complete.Any representation to the contrary is a criminal offense.
IMPORTANT NOTICE RELATING TO AUTOMATICALLY GENERATED EMAIL DISCLAIMERS
Any legends, disclaimers or other notices that may appear at the bottom of, or attached to, the email communication to which this Term Sheet may have been attached are not applicable to this Term Sheet and should be disregarded. Such legends, disclaimers or other notices have been automatically generated as a result of this Term Sheet having been sent via Bloomberg or another email system.
IMPORTANT NOTICE REGARDING THE CONDITIONS FOR THIS OFFERING OF ASSET-BACKED SECURITIES
THE ASSET-BACKED SECURITIES REFERRED TO IN THIS TERM SHEET ARE BEING OFFERED WHEN, AS AND IF ISSUED. IN PARTICULAR, YOU ARE ADVISED THAT THE ASSET-BACKED SECURITIES, AND THE ASSET POOL BACKING THEM, ARE SUBJECT TO MODIFICATION OR REVISION (INCLUDING, AMONG OTHER THINGS, THE POSSIBILITY THAT ONE OR MORE CLASSES OF SECURITIES MAY BE SPLIT, COMBINED OR ELIMINATED), AT ANY TIME PRIOR TO ISSUANCE OR AVAILABILITY OF A FINAL PROSPECTUS. AS A RESULT, YOU MAY COMMIT TO PURCHASE SECURITIES THAT HAVE CHARACTERISTICS THAT MAY CHANGE, AND YOU ARE ADVISED THAT ALL OR A PORTION OF THE SECURITIES MAY NOT BE ISSUED THAT HAVE THE CHARACTERISTICS DESCRIBED IN THIS TERM SHEET. OUR OBLIGATION TO SELL SECURITIES TO YOU IS CONDITIONED ON THE SECURITIES AND THE UNDERLYING TRANSACTION HAVING THE CHARACTERISTICS DESCRIBED IN THIS TERM SHEET. IF WE DETERMINE THAT THE FOREGOING CONDITION IS NOT SATISFIED IN ANY MATERIAL RESPECT, WE WILL NOTIFY YOU, AND NEITHER THE ISSUING ENTITY NOR ANY UNDERWRITER WILL HAVE ANY OBLIGATION TO YOU TO DELIVER ALL OR ANY PORTION OF THE SECURITIES WHICH YOU HAVE COMMITTED TO PURCHASE, AND THERE WILL BE NO LIABILITY BETWEEN US AS A CONSEQUENCE OF THE NON-DELIVERY.
This is not a research report and was not prepared by any Underwriter’s research department. Please see additional important information and qualifications at the end of this Term Sheet.
| T-1 |
| BANK 2017-BNK5 | Structural Overview |
Offered Certificates
| Class | Expected Ratings (Moody’s/Fitch/DBRS)(1) | Approximate Initial Certificate Balance or Notional Amount(2) | Approximate Initial Credit Support(3) | Pass-Through Rate Description | Expected Weighted Average Life (Years)(4) | Expected Principal Window (Months)(4) | Certificate Principal UW NOI Debt Yield(5) | Certificate Principal to Value Ratio(6) | |||||||||
| Class A-1 | Aaa(sf)/AAAsf/AAA(sf) | $37,200,000 | 30.000% | (7) | 2.73 | 1 – 57 | 19.6% | 37.4% | |||||||||
| Class A-2 | Aaa(sf)/AAAsf/AAA(sf) | $98,300,000 | 30.000% | (7) | 4.90 | 57 – 60 | 19.6% | 37.4% | |||||||||
| Class A-SB | Aaa(sf)/AAAsf/AAA(sf) | $52,700,000 | 30.000% | (7) | 7.31 | 60 – 115 | 19.6% | 37.4% | |||||||||
| Class A-3 | Aaa(sf)/AAAsf/AAA(sf) | $52,700,000 | 30.000% | (7) | 6.95 | 83 – 84 | 19.6% | 37.4% | |||||||||
| Class A-4 | Aaa(sf)/AAAsf/AAA(sf) | $270,000,000 | 30.000% | (7) | 9.78 | 115 – 119 | 19.6% | 37.4% | |||||||||
| Class A-5 | Aaa(sf)/AAAsf/AAA(sf) | $307,906,000 | 30.000% | (7) | 9.89 | 119 – 120 | 19.6% | 37.4% | |||||||||
| Class X-A | Aaa(sf)/AAAsf/AAA(sf) | $818,806,000 | (8) | N/A | Variable IO(9) | N/A | N/A | N/A | N/A | ||||||||
| Class X-B | NR/A-sf/AA(sf) | $236,869,000 | (8) | N/A | Variable IO(9) | N/A | N/A | N/A | N/A | ||||||||
| Class A-S | Aa3(sf)/AAAsf/AAA(sf) | $140,367,000 | 18.000% | (7) | 9.96 | 120 – 120 | 16.7% | 43.9% | |||||||||
| Class B | NR/AA-sf/AA(high)(sf) | $55,562,000 | 13.250% | (7) | 9.96 | 120 – 120 | 15.8% | 46.4% | |||||||||
| Class C | NR/A-sf/AA(low)(sf) | $40,940,000 | 9.750% | (7) | 9.96 | 120 – 120 | 15.2% | 48.3% | |||||||||
Privately Offered Certificates(10)
| Class | Expected Ratings (Moody’s/Fitch/DBRS)(1) | Approximate Initial Certificate Balance or Notional Amount(2) | Approximate Initial Credit Support(3) | Pass-Through Rate Description | Expected Weighted Average Life (Years)(4) | Expected Principal Window (Months)(4) | Certificate Principal UW NOI Debt Yield(5) | Certificate Principal to Value Ratio(6) | |||||||||
| Class X-D | NR/BBB-sf/A(low)(sf) | $42,403,000 | (8) | N/A | Variable IO(9) | N/A | N/A | N/A | N/A | ||||||||
| Class D | NR/BBB-sf/BBB(high)(sf) | $42,403,000 | 6.125% | (7) | 9.96 | 120 – 120 | 14.6% | 50.2% | |||||||||
| Class E | NR/BB-sf/BB(high)(sf) | $24,856,000 | 4.000% | (7) | 9.99 | 120 – 121 | 14.3% | 51.4% | |||||||||
| Class F | NR/B-sf/BB(low)(sf) | $11,698,000 | 3.000% | (7) | 10.04 | 121 – 121 | 14.1% | 51.9% | |||||||||
| Class G | NR/NR/B(low)(sf) | $14,621,000 | 1.750% | (7) | 10.04 | 121 – 121 | 13.9% | 52.6% | |||||||||
| Class H | NR/NR/NR | $20,470,946 | 0.000% | (7) | 10.04 | 121 – 121 | 13.7% | 53.5% | |||||||||
Non-Offered Eligible Vertical Interest(10)
| Class | Expected Ratings (Moody’s/Fitch/DBRS)(1) | Approximate Initial Certificate Balance or Notional Amount(2) | Approximate Initial Credit Support(3) | Pass-Through Rate Description | Expected Weighted Average Life (Years)(4) | Expected Principal Window (Months)(4) | Certificate Principal UW NOI Debt Yield | Certificate Principal to Value Ratio) | ||||||||
| RR Interest | NR/NR/NR | $61,564,418.24 | N/A | WAC(11) | 8.99 | 1 – 121 | N/A | N/A |
| (1) | Ratings shown are those of Moody’s Investors Service, Inc. (“Moody’s”), Fitch Ratings, Inc. (“Fitch”) and DBRS, Inc. (“DBRS”). Certain nationally recognized statistical rating organizations that were not hired by the depositor may use information they receive pursuant to Rule 17g-5 under the Securities Exchange Act of 1934, as amended, or otherwise to rate the certificates. There can be no assurance as to what ratings a non-hired nationally recognized statistical rating organization would assign. See “Risk Factors—Other Risks Relating to the Certificates—Nationally Recognized Statistical Rating Organizations May Assign Different Ratings to the Certificates; Ratings of the Certificates Reflect Only the Views of the Applicable Rating Agencies as of the Dates Such Ratings Were Issued; Ratings May Affect ERISA Eligibility; Ratings May Be Downgraded” and “Ratings” in the Preliminary Prospectus, expected to be dated June 12, 2017 (the “Preliminary Prospectus”). Capitalized terms used but not defined herein have the meanings assigned to such terms in the Preliminary Prospectus. |
| (2) | Approximate, subject to a permitted variance of plus or minus 5%. In addition, the notional amounts of the Class X-A, Class X-B and Class X-D certificates may vary depending upon the final pricing of the classes of principal balance certificates whose certificate balances comprise such notional amounts, and, if as a result of such pricing the pass-through rate of any class of the Class X-A, Class X-B or Class X-D certificates, as applicable, would be equal to zero at all times, such class of certificates will not be issued on the closing date of this securitization. |
| (3) | The approximate initial credit support percentages set forth for the certificates are approximate and, for the Class A-1, Class A-2, Class A-SB, Class A-3, Class A-4 and Class A-5 certificates, are represented in the aggregate. The RR Interest provides credit support only to the limited extent that it is allocated a portion of any losses incurred on the underlying mortgage loans, which such losses are allocated between it, on the one hand, and to the Offered Certificates and the Non-Offered Certificates, on the other hand,pro ratain accordance with their respective Percentage Allocation Entitlements (as defined below). See “Credit Risk Retention” in the Preliminary Prospectus. |
| (4) | The Expected Weighted Average Life and Expected Principal Window during which distributions of principal would be received as set forth in the foregoing table with respect to each class of certificates having a certificate balance are based on the assumptions set forth under “Yield and Maturity Considerations—Weighted Average Life” in the Preliminary Prospectus and on the assumptions that there are no prepayments, modifications or losses in respect of the mortgage loans and that there are no extensions or forbearances of maturity dates or anticipated repayment dates of the mortgage loans. |
| (5) | Certificate Principal UW NOI Debt Yield for any class of principal balance certificates (other than the RR Interest) is calculated as the product of (a) the weighted average UW NOI Debt Yield for the mortgage pool, multiplied by (b) a fraction, the numerator of which is the total initial certificate balance of all the principal balance certificates (other than the RR Interest), and the denominator of which is the total initial certificate balance of the subject class of principal |
This is not a research report and was not prepared by any Underwriter’s research department. Please see additional important information and qualifications at the end of this Term Sheet.
| T-2 |
| BANK 2017-BNK5 | Structural Overview |
| balance certificates and all other classes of principal balance certificates (other than the RR Interest), if any, that are senior to such class (without regard to the RR Interest). The Certificate Principal UW NOI Debt Yields of the Class A-1, Class A-2, Class A-SB, Class A-3, Class A-4 and Class A-5 certificates are calculated in the aggregate for those classes as if they were a single class. |
| (6) | Certificate Principal to Value Ratio for any class of principal balance certificates (other than the RR Interest) is calculated as the product of (a) the weighted average Cut-off Date LTV Ratio of the mortgage pool, multiplied by (b) a fraction, the numerator of which is the total initial certificate balance of the subject class of principal balance certificates and all other classes of principal balance certificates (other than the RR Interest), if any, that are senior to such class, and the denominator of which is the total initial certificate balance of all the principal balance certificates (other than the RR Interest). The Certificate Principal to Value Ratios of the Class A-1, Class A-2, Class A-SB, Class A-3, Class A-4 and Class A-5 certificates are calculated in the aggregate for those classes as if they were a single class. |
| (7) | The pass-through rate for each class of the Class A-1, Class A-2, Class A-SB, Class A-3, Class A-4, Class A-5, Class A-S, Class B, Class C, Class D, Class E, Class F, Class G and Class H certificates (which, together with the RR Interest, are referred to as the “principal balance certificates”) will be one of the following: (i) a fixed rateper annum, (ii) a variable rateper annum equal to the weighted average of the net mortgage interest rates on the mortgage loans for the related distribution date, (iii) a variable rateper annum equal to the lesser of (a) a fixed rate and (b) the weighted average of the net mortgage interest rates on the mortgage loans for the related distribution date or (iv) a variable rateper annum equal to the weighted average of the net mortgage interest rates on the mortgage loans for the related distribution date minus a specified percentage. For purposes of the calculation of the weighted average of the net mortgage interest rates on the mortgage loans for each distribution date, the net mortgage interest rates will be adjusted as necessary to a 30/360 basis. |
| (8) | The Class X-A, Class X-B and Class X-D certificates (collectively referred to as the “Class X certificates”) are notional amount certificates and will not be entitled to distributions of principal. The notional amount of the Class X-A certificates will be equal to the aggregate certificate balance of the Class A-1, Class A-2, Class A-SB, Class A-3, Class A-4 and Class A-5 certificates. The notional amount of the Class X-B certificates will be equal to the aggregate certificate balance of the Class A-S, Class B and Class C certificates. The notional amount of the Class X-D certificates will be equal to the certificate balance of the Class D certificates. |
| (9) | The pass-through rate for the Class X-A certificates for any distribution date will be aper annumrate equal to the excess, if any, of (a) the weighted average of the net mortgage interest rates on the mortgage loans for the related distribution date, over (b) the weighted average of the pass-through rates on the Class A-1, Class A-2, Class A-SB, Class A-3, Class A-4 and Class A-5 certificates for the related distribution date, weighted on the basis of their respective certificate balances outstanding immediately prior to that distribution date. The pass-through rate for the Class X-B certificates for any distribution date will be aper annum rate equal to the excess, if any, of (a) the weighted average of the net mortgage interest rates on the mortgage loans for the related distribution date, over (b) the weighted average of the pass-through rates on the Class A-S, Class B and Class C certificates for the related distribution date, weighted on the basis of their respective certificate balances outstanding immediately prior to that distribution date. The pass-through rate for the Class X-D certificates for any distribution date will be aper annum rate equal to the excess, if any, of (a) the weighted average of the net mortgage interest rates on the mortgage loans for the related distribution date, over (b) the pass-through rate on the Class D certificates for the related distribution date. For purposes of the calculation of the weighted average of the net mortgage interest rates on the mortgage loans for each distribution date, the net mortgage interest rates will be adjusted as necessary to a 30/360 basis. |
| (10) | Not offered pursuant to the Preliminary Prospectus or this Term Sheet. Information provided in this Term Sheet regarding the characteristics of these certificates is provided only to enhance your understanding of the offered certificates. The privately offered certificates also include the Class V and Class R certificates, which do not have a certificate balance, notional amount, credit support, pass-through rate, rating, assumed final distribution date or rated final distribution date, and which are not shown in the chart. The Class V certificates represent a beneficial ownership interest held through the grantor trust in a specified percentage of certain excess interest in respect of mortgage loans having anticipated repayment dates, if any. The Class R certificates represent the beneficial ownership of the residual interest in each of the real estate mortgage investment conduits, as further described in the Preliminary Prospectus. |
| (11) | Although it does not have a specified pass-through rate (other than for tax reporting purposes), the effective pass-through rate for the RR Interest will be a variable rateper annumequal to the weighted average of the net mortgage interest rates on the mortgage loans for the related distribution date (in each case adjusted, if necessary, to accrue on the basis of a 360-day year consisting of twelve 30-day months). |
This is not a research report and was not prepared by any Underwriter’s research department. Please see additional important information and qualifications at the end of this Term Sheet.
| T-3 |
| BANK 2017-BNK5 | Structural Overview |
Issue Characteristics
| Offered Certificates: | $1,055,675,000 (approximate) monthly pay, multi-class, commercial mortgage pass-through certificates, consisting of nine principal balance classes (Class A-1, Class A-2, Class A-SB, Class A-3, Class A-4, Class A-5, Class A-S, Class B and Class C) and two interest-only classes (Class X-A and Class X-B) | |
| Co-Lead Managers and Joint Bookrunners: | Morgan Stanley & Co. LLC, Wells Fargo Securities, LLC and Merrill Lynch, Pierce, Fenner & Smith Incorporated | |
| Co-Manager: | Drexel Hamilton, LLC | |
| Mortgage Loan Sellers: | Wells Fargo Bank, National Association, Bank of America, National Association, Morgan Stanley Mortgage Capital Holdings LLC and National Cooperative Bank, N.A. | |
| Rating Agencies: | Moody’s Investors Service, Inc., Fitch Ratings, Inc. and DBRS, Inc. | |
| Master Servicers: | Wells Fargo Bank, National Association and National Cooperative Bank, N.A. | |
| Special Servicers: | CWCapital Asset Management LLC and National Cooperative Bank, N.A. | |
| Certificate Administrator/ Certificate Registrar/Custodian: | Wells Fargo Bank, National Association | |
| Trustee: | Wilmington Trust, National Association | |
| Operating Advisor: | Park Bridge Lender Services LLC | |
| Asset Representations Reviewer: | Park Bridge Lender Services LLC | |
| Initial Directing Certificateholder: | Eightfold Real Estate Capital Fund V, L.P. or an affiliate thereof | |
| Risk Retention Consultation Party: | Morgan Stanley Mortgage Capital Holdings LLC | |
| U.S. Credit Risk Retention: | For a discussion on the manner in which the U.S. credit risk retention requirements will be addressed by Morgan Stanley Mortgage Capital Holdings LLC, as the retaining sponsor, see “Credit Risk Retention” in the Preliminary Prospectus. | |
| EU Risk Retention: | None of the sponsors, the depositor or the issuing entity intends to retain a material net economic interest in the securitization constituted by the issue of the Offered Certificates in accordance with the EU risk retention and due diligence requirements or to take any other action which may be required by EEA-regulated investors for the purposes of their compliance with the EU risk retention and due diligence requirements or similar requirements. | |
| Cut-off Date: | The mortgage loans will be considered part of the trust fund as of their respective cut-off dates. The cut-off date with respect to each mortgage loan is the respective due date for the monthly debt service payment that is due in June 2017 (or, in the case of any mortgage loan that has its first due date after June 2017, the date that would have been its due date in June 2017 under the terms of that mortgage loan if a monthly debt service payment were scheduled to be due in that month). | |
| Expected Pricing Date: | Week of June 12, 2017 | |
| Expected Closing Date: | Week of June 29, 2017 | |
| Determination Dates: | The 11th day of each month or, if the 11th day is not a business day, then the business day immediately following such 11th day. | |
| Distribution Dates: | The 4th business day following each determination date. The first distribution date will be in July 2017. | |
| Rated Final Distribution Date: | �� | The distribution date in June 2060 |
| Interest Accrual Period: | Preceding calendar month | |
| Payment Structure: | Sequential pay | |
| Tax Treatment: | REMIC | |
| Optional Termination: | 1.00% clean-up call | |
| Minimum Denominations: | $10,000 for each class of Offered Certificates (other than Class X-A and Class X-B certificates); $1,000,000 for the Class X-A and Class X-B certificates | |
| Settlement Terms: | DTC, Euroclear and Clearstream | |
| Legal/Regulatory Status: | Each class of Offered Certificates is expected to be eligible for exemptive relief under ERISA. No class of Offered Certificates is SMMEA eligible. | |
| Analytics: | The certificate administrator is expected to make available all distribution date statements, CREFC® reports and supplemental notices received by it to certain modeling financial services as described in the Preliminary Prospectus. |
This is not a research report and was not prepared by any Underwriter’s research department. Please see additional important information and qualifications at the end of this Term Sheet.
| T-4 |
| BANK 2017-BNK5 | Structural Overview |
| Bloomberg Ticker: | BANK 2017-BNK5<MTGE><GO> | |
| Risk Factors: | THE CERTIFICATES INVOLVE CERTAIN RISKS AND MAY NOT BE SUITABLE FOR ALL INVESTORS. SEE THE “RISK FACTORS” SECTION OF THE PRELIMINARY PROSPECTUS. |
This is not a research report and was not prepared by any Underwriter’s research department. Please see additional important information and qualifications at the end of this Term Sheet.
| T-5 |
| BANK 2017-BNK5 | Structural Overview |
Structural Overview
| Allocation Between the RR Interest and the Non-Retained Certificates: | The aggregate amount available for distributions to the holders of the Certificates (including the RR Interest) on each distribution date (net of specified expenses of the issuing entity, including fees payable to, and costs and expenses reimbursable to, the master servicers, any primary servicers, the special servicers, the certificate administrator, the trustee, the operating advisor, the asset representations reviewer and CREFC®) will be allocated between amounts available for distribution to the holders of the RR Interest, on the one hand, and to all other Certificates, referred to herein as the “Non-Retained Certificates”, on the other hand. The portion of such amount allocable to (a) the RR Interest will at all times be the product of such amount multiplied by 5% and (b) the Non-Retained Certificates will at all times be the product of such amount multiplied by the difference between 100% and the percentage set forth in clause (a) (each, the respective “Percentage Allocation Entitlement”). | |
| Accrual: | Each class of Offered Certificates will accrue interest on a 30/360 basis. | |
| Amount and Order of Distributions: | On each distribution date, the Non-Retained Certificates’ Percentage Allocation Entitlement of funds available for distribution from the mortgage loans, net of (i) any yield maintenance charges and prepayment premiums and (ii) any excess interest, will be distributed in the following amounts and order of priority:
First, to the Class A-1, Class A-2, Class A-SB, Class A-3, Class A-4, Class A-5, Class X-A, Class X-B and Class X-D certificates, in respect of interest, up to an amount equal to, andpro rata in accordance with, the interest entitlements for those classes;
Second, to the Class A-1, Class A-2, Class A-SB, Class A-3, Class A-4 and Class A-5 certificates as follows, to the extent of applicable available funds allocated to principal: either (i)(a)first, to principal on the Class A-SB certificates, until the certificate balance of the Class A-SB certificates is reduced to the planned principal balance for the related distribution date set forth in Annex E to the Preliminary Prospectus, and (b)second, to principal on each class of the Class A-1, Class A-2, Class A-3, Class A-4, Class A-5 and Class A-SB certificates, in that order, in each case until the certificate balance of such class of certificates has been reduced to zero, or (ii) if the certificate balance of each class of principal balance certificates other than the Class A-1, Class A-2, Class A-SB, Class A-3, Class A-4 and Class A-5 certificates and the RR Interest has been reduced to zero as a result of the allocation of losses on the mortgage loans to those certificates, to principal on the Class A-1, Class A-2, Class A-SB, Class A-3, Class A-4 and Class A-5 certificates,pro rata, without regard to the distribution priorities described above or the planned principal balance of the Class A-SB certificates;
Third, to the Class A-1, Class A-2, Class A-SB, Class A-3, Class A-4 and Class A-5 certificates, up to an amount equal to, andpro rata based on, any previously unreimbursed losses (plus interest thereon) on the mortgage loans allocable to principal that were previously borne by each such class;
Fourth, to each class of the Class A-S, Class B and Class C certificates, in that order, as follows: (a) to interest on such class of certificates in the amount of its interest entitlement; (b) to the extent of applicable available funds allocable to principal remaining after distributions in respect of principal to each class with a higher priority (as set forth in this clause or prior enumerated clauses set forth above), to principal on such class of certificates until its certificate balance has been reduced to zero; and (c) to reimburse such class of certificates, for any previously unreimbursed losses on the mortgage loans (plus interest thereon) that were previously allocated to those certificates;
Fifth, to the Non-Offered Certificates (other than the Class X-D, Class V and Class R certificates) in the amounts and order of priority described in “Description of the Certificates—Distributions” in the Preliminary Prospectus; and
Sixth, to the Class R certificates, any remaining amounts. | |
| Interest and Principal Entitlements: | The interest entitlement of each class of Offered Certificates on each distribution date generally will be the interest accrued during the related interest accrual period on the related certificate balance or notional amount at the related pass-through rate, net of any prepayment interest shortfalls allocated to that class for such distribution date as described below. If prepayment interest shortfalls arise from voluntary prepayments on serviced mortgage loans during any collection period, the applicable master servicer is required to make a limited compensating interest payment to offset those shortfalls. See “Description of the Certificates—Prepayment Interest Shortfalls” in the Preliminary Prospectus. The remaining amount of prepayment interest shortfalls will be allocated between the RR Interest, on one hand, and the Non-Retained Certificates, on the other hand, in accordance with their respective Percentage Allocation Entitlements. The prepayment interest shortfalls allocated to the Non-Retained Certificates (other than the Class V and Class R Certificates) will be allocated among such classes of certificates entitled to interest, on apro rata basis, based on their respective amounts of accrued interest for the related distribution date, to reduce the interest entitlement on each such class of certificates. If a class receives less than the entirety of its interest entitlement on any distribution date, then the shortfall (excluding any shortfall due to prepayment interest shortfalls), together with interest thereon, will be added to its interest entitlement for the next succeeding distribution date.
The aggregate principal distribution amount for each distribution date generally will be the aggregate amount of principal received or advanced in respect of the mortgage loans, net of any non-recoverable advances and interest thereon and any workout-delayed reimbursement amounts that are reimbursed to the applicable master servicer or the trustee during the related collection period. Non-recoverable advances and interest thereon are reimbursable from principal collections before reimbursement from other amounts. Workout-delayed reimbursement amounts will be reimbursable from principal collections. The Non-Retained Certificates and the RR Interest will be entitled to their respective Percentage Allocation Entitlements of theaggregate principal distribution amount. |
This is not a research report and was not prepared by any Underwriter’s research department. Please see additional important information and qualifications at the end of this Term Sheet.
| T-6 |
| BANK 2017-BNK5 | Structural Overview |
| Special Servicer Compensation: | The principal compensation to be paid to a special servicer in respect of its special servicing activities will be the special servicing fee, the workout fee and the liquidation fee.
The special servicing fee for each distribution date is calculated based on the outstanding principal balance of each serviced mortgage loan that is a specially serviced mortgage loan (and any related serviced companion loan) or as to which the related mortgaged property has become an REO property at the special servicing fee rate, which will be a rate equal to (i) with respect to CWCapital Asset Management LLC, the greater of 0.25% and theper annum rate that would result in a special servicing fee of $3,500 for the related month and (ii) with respect to National Cooperative Bank, N.A., the greater of 0.25% and theper annum rate that would result in a special servicing fee of $1,000 for the related month. The special servicing fee will be payable monthly,first, from liquidation proceeds, insurance and condemnation proceeds, and other collections in respect of the related specially serviced mortgage loan or REO property and,then, from general collections on all the mortgage loans and any REO properties.
Each special servicer will also be entitled to (i) liquidation fees generally equal to 1.0% (or, if such rate would result in an aggregate liquidation fee less than $25,000, then the liquidation fee rate will be equal to the lesser of (i) 3.0% and (ii) such lower rate as would result in an aggregate liquidation fee equal to $25,000) of liquidation proceeds and certain other collections in respect of a specially serviced mortgage loan (and any related serviced companion loan) or related REO property and of amounts received in respect of mortgage loan repurchases by the related mortgage loan sellers and (ii) workout fees generally equal to 1.0% of interest (other than post-ARD excess interest on mortgage loans with anticipated repayment dates and other than default interest) and principal payments made in respect of a rehabilitated mortgage loan (and any related serviced companion loan), subject to a floor of $25,000 with respect to any mortgage loan, whole loan or related REO property, and in the case of each of clause (i) and (ii), subject to certain adjustments and exceptions as described in the Preliminary Prospectus under “Pooling and Servicing Agreement—Servicing and Other Compensation and Payment of Expenses—Special Servicing Compensation”.
With respect to any non-serviced mortgage loan, the related special servicer under the related other pooling and servicing agreement pursuant to which such mortgage loan is being serviced will be entitled to similar compensation as that described above with respect to such non-serviced mortgage loan under such other pooling and servicing agreement as further described in the Preliminary Prospectus, although any related fees may accrue at a different rate and there may be a higher (or no) cap on liquidation and workout fees. | |
| Prepayment Premiums/Yield Maintenance Charges: | If any yield maintenance charge or prepayment premium is collected during any collection period with respect to any mortgage loan, then on the immediately succeeding distribution date, the certificate administrator will pay: (i)(a) to the holders of each class of the Class A-1, Class A-2, Class A-SB, Class A-3, Class A-4, Class A-5, Class A-S, Class B, Class C and Class D certificates, the product of (x) the Non-Retained Certificates’ Percentage Allocation Entitlement of such yield maintenance charge or prepayment premium, (y) the related Base Interest Fraction for such class and the applicable principal prepayment, and (z) a fraction, the numerator of which is equal to the amount of principal distributed to such class for that distribution date, and the denominator of which is the total amount of principal distributed to the Class A-1, Class A-2, Class A-SB, Class A-3, Class A-4, Class A-5, Class A-S, Class B, Class C and Class D certificates for that distribution date, (b) to the holders of the Class X-A certificates, the excess, if any, of (x) the product of (1) the Non-Retained Certificates’ Percentage Allocation Entitlement of such yield maintenance charge or prepayment premium and (2) a fraction, the numerator of which is equal to the amount of principal distributed to the Class A-1, Class A-2, Class A-SB, Class A-3, Class A-4 and Class A-5 certificates for that distribution date, and the denominator of which is the total amount of principal distributed to the Class A-1, Class A-2, Class A-SB, Class A-3, Class A-4, Class A-5, Class A-S, Class B, Class C and Class D certificates for that distribution date, over (y) the amount of such yield maintenance charge or prepayment premium distributed to the Class A-1, Class A-2, Class A-SB, Class A-3, Class A-4 and Class A-5 certificates as described above, (c) to the holders of the Class X-B certificates, the excess, if any, of (x) the product of (1) the Non-Retained Certificates’ Percentage Allocation Entitlement of such yield maintenance charge or prepayment premium and (2) a fraction, the numerator of which is equal to the amount of principal distributed to the Class A-S, Class B and Class C certificates for that distribution date, and the denominator of which is the total amount of principal distributed to the Class A-1, Class A-2, Class A-SB, Class A-3, Class A-4, Class A-5, Class A-S, Class B, Class C and Class D certificates for that distribution date, over (y) the amount of such yield maintenance charge or prepayment premium distributed to the Class A-S, Class B and Class C certificates as described above, and (d) to the holders of the Class X-D certificates, any remaining portion of the Non-Retained Certificates’ Percentage Allocation Entitlement of such yield maintenance charge or prepayment premium not distributed as described above, and (ii) to the RR Interest, its Percentage Allocation Entitlement of such yield maintenance charge or prepayment premium. No prepayment premiums or yield maintenance charges will be distributed to the holders of the Class E, Class F, Class G, Class H, Class V or Class R Certificates. “Base Interest Fraction” means, with respect to any principal prepayment of any mortgage loan that provides for the payment of a yield maintenance charge or prepayment premium, and with respect to any class of principal balance certificates (other than the RR Interest), a fraction (A) the numerator of which is the greater of (x) zero and (y) the difference between (i) the pass-through rate on that class, and (ii) the applicable discount rate and (B) the denominator of which is the difference between (i) the mortgage interest rate on the related mortgage loan and (ii) the applicable discount rate; provided, that: under no circumstances will the Base Interest Fraction be greater than one; if the discount rate referred to above is greater than or equal to both the mortgage interest rate on the related mortgage loan and the pass-through rate on that class, then the Base Interest Fraction will equal zero; and if the discount rate referred to above is greater than or equal to the mortgage interest rate on the related mortgage loan and is less than the pass-through rate on that class, thenthe Base Interest Fraction will be equal to 1.0. |
This is not a research report and was not prepared by any Underwriter’s research department. Please see additional important information and qualifications at the end of this Term Sheet.
| T-7 |
| BANK 2017-BNK5 | Structural Overview |
| Consistent with the foregoing, the Base Interest Fraction is equal to: | ||||
| (Pass-Through Rate – Discount Rate) | ||||
| (Mortgage Rate – Discount Rate) | ||||
| Realized Losses: | On each distribution date, immediately following the distributions to be made to the certificateholders on that date, the certificate administrator is required to calculate the amount, if any, by which (i) the aggregate stated principal balance of the mortgage loans, including any successor REO loans, expected to be outstanding immediately following that distribution date is less than (ii) the then aggregate certificate balance of the principal balance certificates after giving effect to distributions of principal on that distribution date. The Non-Retained Certificates’ Percentage Allocation Entitlement of such amount will be applied to the Class H, Class G, Class F, Class E, Class D, Class C, Class B and Class A-S certificates, in that order, in each case until the related certificate balance has been reduced to zero, and then to the Class A-1, Class A-2, Class A-SB, Class A-3, Class A-4 and Class A-5 certificates,pro rata based upon their respective certificate balances, until their respective certificate balances have been reduced to zero. The RR Interest’s Percentage Allocation Entitlement of such amount will be applied to the RR Interest until the related RR Interest balance has been reduced to zero. | |||
| Serviced Whole Loans: | Each of the following mortgaged properties secures a mortgage loan and one or morepari passu promissory notes (each, a “servicedpari passu companion loan”) that will be serviced pursuant to the related intercreditor agreement and the pooling and servicing agreement for this transaction: Westchester One, Market Street – The Woodlands and Crossgates Commons. With respect to each such mortgaged property, the related mortgage loan, together with the related servicedpari passu companion loan(s), is referred to herein (for so long as it is serviced under the pooling and servicing agreement for this transaction) as a “servicedpari passu whole loan.” Each servicedpari passu companion loan is not part of the mortgage pool and may be contributed to one or more future securitization transactions (if not already securitized) or may be otherwise transferred at any time, subject to compliance with the related intercreditor agreement. See the table below entitled “Mortgage Loans with Pari Passu Companion Loans,” as well as “Description of the Mortgage Pool—The Whole Loans” in the Preliminary Prospectus, for additional information regarding each such whole loan. | |||
| Non-Serviced Whole Loans: | Each of the following mortgaged properties secures a mortgage loan (each, a “non-serviced mortgage loan”), one or morepari passu promissory notes and, in some cases, one or more generally subordinate promissory notes (each such promissory note, a “non-serviced companion loan”) that will be serviced pursuant to the related intercreditor agreement and the pooling and servicing agreement or trust and servicing agreement (referred to herein as a related “pooling and servicing agreement”) for another securitization transaction: Del Amo Fashion Center, Starwood Capital Group Hotel Portfolio, Olympic Tower, iStar Leased Fee Portfolio and Gateway Net Lease Portfolio. With respect to each such mortgaged property, the related mortgage loan, together with the related non-serviced companion loan(s), is referred to herein (for so long as it is serviced under the pooling and servicing agreement for another securitization transaction) as a “non-serviced whole loan.” Each non-serviced companion loan is not part of the mortgage pool and may be contributed to one or more future securitization transactions (if not already securitized) or may be otherwise transferred at any time, subject to compliance with the related intercreditor agreement. Servicing of each non-serviced whole loan will generally be directed by the holder of the related control note (or, if such control note is included in a securitization, the directing certificateholder thereunder (or other party designated to exercise the rights of such control note)), and such holder will have the right to replace the special servicer with respect to the related whole loan with or without cause. See the tables below entitled “Mortgage Loans with Pari Passu Companion Loans” and“Mortgage Loans with Subordinate Debt,” as well as “Description of the Mortgage Pool—The Whole Loans” in the Preliminary Prospectus, for additional information regarding each such whole loan. | |||
| Directing Certificateholder/Controlling Class: | The “Directing Certificateholder” will be (i) with respect to a servicing shift mortgage loan, the related Loan-Specific Directing Certificateholder, and (ii) with respect to each other mortgage loan, the Controlling Class Certificateholder (or its representative) selected by more than 50% (by certificate balance) of the Controlling Class Certificateholders;provided, that (1) absent that selection, (2) until a Directing Certificateholder is so selected or (3) upon receipt of a notice from a majority of the Controlling Class Certificateholders (by certificate balance) that a Directing Certificateholder is no longer designated, the Controlling Class Certificateholder that owns the largest aggregate certificate balance of the Controlling Class (or its representative) will be the Directing Certificateholder;provided, that (a) in the case of clause (3), if no one holder owns the largest aggregate certificate balance of the Controlling Class, then there will be no Directing Certificateholder until appointed in accordance with the terms of the pooling and servicing agreement, and (b) the certificate administrator and the other parties to the pooling and servicing agreement will be entitled to assume that the identity of the Directing Certificateholder has not changed until such parties receive written notice of a replacement of the Directing Certificateholder from a party holding the requisite interest in the Controlling Class (as confirmed by the certificate registrar), or the resignation of the then current Directing Certificateholder.
The “Loan-Specific Directing Certificateholder” with respect to a servicing shift mortgage loan is the “controlling holder”, the “directing certificateholder”, the “directing holder”, “directing lender” or any analogous concept under the related intercreditor agreement. Prior to the securitization of the related control note, the Loan-Specific Directing Certificateholder with respect to a servicing shift mortgage loan will be the holder of the related control note. On and after the securitization of the related control note, there will be no Loan-Specific Directing Certificateholder with respect to such servicing shift mortgage loan.
There will be no servicing shift mortgage loans related to the trust as of the Closing Date. | |||
This is not a research report and was not prepared by any Underwriter’s research department. Please see additional important information and qualifications at the end of this Term Sheet.
| T-8 |
| BANK 2017-BNK5 | Structural Overview |
| The “Controlling Class” will be, as of any time of determination, the most subordinate class of Control Eligible Certificates then outstanding that has an aggregate certificate balance (as notionally reduced by any Cumulative Appraisal Reduction Amounts (as defined below) allocable to such class) at least equal to 25% of the initial certificate balance of that class; provided, that if at any time the certificate balances of the certificates other than the Control Eligible Certificates and the RR Interest have been reduced to zero as a result of principal payments on the mortgage loans, then the Controlling Class will be the most subordinate class of Control Eligible Certificates that has a certificate balance greater than zero without regard to any Cumulative Appraisal Reduction Amounts. The Controlling Class as of the closing date will be the Class H certificates. The “Control Eligible Certificates” will be any of the Class E, Class F, Class G and | ||||
| Control Rights: | Prior to a Control Termination Event, the Directing Certificateholder will have certain consent and consultation rights under the pooling and servicing agreement with respect to certain major decisions and other matters. A “Control Termination Event” will occur when (i) the Class E certificates have a certificate balance (taking into account the application of the allocable portion of any Cumulative Appraisal Reduction Amounts to notionally reduce the certificate balance thereof) of less than 25% of the initial certificate balance of that class; or (ii) a holder of the Class E certificates is the majority controlling class certificateholder and has irrevocably waived its right, in writing, to exercise any of the rights of the controlling class certificateholder and such rights have not been reinstated to a successor controlling class certificateholder; provided that no Control Termination Event may occur with respect to the Loan-Specific Directing Certificateholder, and the term “Control Termination Event” will not be applicable to the Loan-Specific Directing Certificateholder; provided, further, that a Control Termination Event will be deemed not continuing in the event that the certificate balances of the principal balance certificates other than the Control Eligible Certificates and the RR Interest have been reduced to zero as a result of principal payments on the mortgage loans.
After the occurrence of a Control Termination Event but prior to the occurrence of a Consultation Termination Event, the Directing Certificateholder will not have any consent rights, but the Directing Certificateholder will have certain non-binding consultation rights under the pooling and servicing agreement with respect to certain major decisions and other matters. A “Consultation Termination Event” will occur when (i) no class of Control Eligible Certificates has a certificate balance (without regard to the application of the allocable portion of any Cumulative Appraisal Reduction Amounts) at least equal to 25% of the initial certificate balance of that class; or (ii) a holder of a majority of the Class E certificates is the majority controlling class certificateholder and has irrevocably waived its right, in writing, to exercise any of the rights of the controlling class certificateholder and such rights have not been reinstated to a successor controlling class certificateholder (provided that no Consultation Termination Event resulting solely from the operation of clause (ii) will be deemed to have existed or be in continuance with respect to a successor holder of the Class E certificates that has not irrevocably waived its right to exercise any of the rights of the controlling class certificateholder); provided that no Control Termination Event may occur with respect to the Loan-Specific Directing Certificateholder, and the term “Control Termination Event” will not be applicable to the Loan-Specific Directing Certificateholder; provided, further, that a Control Termination Event will be deemed not continuing in the event that the certificate balances of the principal balance certificates other than the Control Eligible Certificates and the RR Interest have been reduced to zero as a result of principal payments on the mortgage loans.
After the occurrence of a Consultation Termination Event, the Directing Certificateholder will not have any consent or consultation rights, except with respect to any rights expressly set forth in the pooling and servicing agreement, and the operating advisor will retain certain non-binding consultation rights under the pooling and servicing agreement with respect to certain major decisions and other matters.
Notwithstanding the proviso to the definitions of “Control Termination Event” and “Consultation Termination Event”, a Control Termination Event and a Consultation Termination Event will each be deemed to have occurred with respect to any Excluded Loan with respect to the Directing Certificateholder or the holder of the majority of the Controlling Class, and neither the Directing Certificateholder nor any Controlling Class Certificateholder will have any consent or consultation rights with respect to the servicing of such Excluded Loan.
An “Excluded Loan” means (a) with respect to the Directing Certificateholder or the holder of the majority of the Controlling Class, a mortgage loan or whole loan with respect to which, as of any date of determination, the Directing Certificateholder or the holder of the majority of the Controlling Class is a Borrower Party or (b) with respect to the Risk Retention Consultation Party or the holder of the majority of the RR Interest, a mortgage loan or whole loan with respect to which, as of any date of determination, the Risk Retention Consultation Party or the holder of the majority of the RR Interest is a Borrower Party. It is expected that there will be no Excluded Loans with respect to this securitization on the Closing Date.
“Borrower Party” means a borrower, a mortgagor, a manager of a mortgaged property, the holder of a mezzanine loan that has been accelerated or as to which foreclosure or enforcement proceedings have been commenced against the equity collateral pledged to secure the related mezzanine loan, or any Borrower Party Affiliate. With respect to a mortgage loan secured by a residential cooperative property, a person will not be considered a “Borrower Party” solely by reason of such person holding one or more cooperative unit loans that are secured by direct equity interests in the related borrower or owning one or more residential cooperative units comprising the related mortgaged property as a result of any foreclosure, transfer in lieu of foreclosure or other exercise of remedies with respect to any such unit loan(s).
“Borrower Party Affiliate” means, with respect to a borrower, a mortgagor, a manager of a mortgaged property or the holder of a mezzanine loan that has been accelerated or as to which foreclosure or enforcement proceedings have been commenced against the equity collateral pledged to secure the related mezzanineloan, (a) any other person controlling or controlled by or under common control with such borrower, mortgagor, manager or mezzanine lender, as applicable, or (b) any other person owning, directly or indirectly, | |||
This is not a research report and was not prepared by any Underwriter’s research department. Please see additional important information and qualifications at the end of this Term Sheet.
| T-9 |
| BANK 2017-BNK5 | Structural Overview |
25% or more of the beneficial interests in such borrower, mortgagor, manager or mezzanine lender, as applicable. For the purposes of this definition, “control” when used with respect to any specified person means the power to direct the management and policies of such person, directly or indirectly, whether through the ownership of voting securities, by contract or otherwise and the terms “controlling” and “controlled” have meanings correlative to the foregoing. | ||||
| Appraisal Reduction Amounts and Collateral Deficiency Amounts: | An “Appraisal Reduction Amount” generally will be created in the amount, if any, by which the principal balance of a required appraisal loan (which is a mortgage loan with respect to which certain defaults, modifications or insolvency events have occurred as further described in the Preliminary Prospectus) plus other amounts overdue or advanced in connection with such mortgage loan exceeds 90% of the appraised value of the related mortgaged property plus certain escrows and reserves (including letters of credit) held with respect to the mortgage loan.
A mortgage loan will cease to be subject to an Appraisal Reduction Amount when it has been brought current for at least three consecutive months, no additional event of default is foreseeable in the reasonable judgment of the applicable special servicer and no other circumstances exist that would cause such mortgage loan or any related companion loan to be a specially serviced loan; however, a “Collateral Deficiency Amount” may exist with respect to any mortgage loan that is modified into an AB loan structure (an “AB Modified Loan”) and remains a corrected mortgage loan and, if so, will generally equal the excess of (i) the stated principal balance of such AB Modified Loan (taking into account the related junior note(s) and anypari passu notes included therein), over (ii) the sum of (in the case of a whole loan, solely to the extent allocable to the subject mortgage loan) (x) the most recent appraised value for the related mortgaged property or mortgaged properties, plus (y) solely to the extent not reflected or taken into account in such appraised value (or in the calculation of any related Appraisal Reduction Amount) and to the extent on deposit with, or otherwise under the control of, the lender as of the date of such determination, any capital or additional collateral contributed by the related borrower at the time the mortgage loan became (and as part of the modification related thereto) such AB Modified Loan for the benefit of the related mortgaged property or mortgaged properties (provided that in the case of an non-serviced mortgage loan, the amounts set forth in this clause (y) will be taken into account solely to the extent relevant information is received by the applicable master servicer), plus (z) any other escrows or reserves (in addition to any amounts set forth in the immediately preceding clause (y) and solely to the extent not reflected or taken into account in the calculation of any related Appraisal Reduction Amount) held by the lender in respect of such AB Modified Loan as of the date of such determination, which such excess, for the avoidance of doubt, will be determined separately from and exclude any related Appraisal Reduction Amounts.
As used herein, a “Cumulative Appraisal Reduction Amount” will be the sum of any Appraisal Reduction Amounts and any Collateral Deficiency Amounts.
Any Appraisal Reduction Amount in respect of any non-serviced mortgage loan generally will be calculated in accordance with the other servicing agreement pursuant to which such mortgage loan is being serviced, which calculations are expected to be generally similar to those provided for in the pooling and servicing agreement for this transaction.
If any mortgage loan is part of a whole loan, any Appraisal Reduction Amount or Collateral Deficiency Amount will (or effectively will) be calculated in respect of such whole loan taken as a whole and allocated, to the extent provided in the related intercreditor agreement and the related pooling and servicing agreement,first, to any related subordinate companion loan, andsecond, to the related mortgage loan and anypari passu companion loan on apro rata basis by unpaid principal balance.
Appraisal Reduction Amounts will proportionately reduce the interest portion of debt service advances required to be made in respect of the related mortgage loan. Appraisal Reduction Amounts and Collateral Deficiency Amounts (to the extent of the Non-Retained Certificates’ Percentage Allocation Entitlement thereof) will be taken into account in determining the identity of the controlling class entitled to appoint the Directing Certificateholder, the existence of a Control Termination Event and the allocation and/or exercise of voting rights for certain purposes (see“—Directing Certificateholder/Controlling Class” above). | |||
| Appraised-Out Class: | An “Appraised-Out Class” is any class of Control Eligible Certificates, the certificate balance of which (taking into account the application of the Non-Retained Certificates’ Percentage Allocation Entitlement of any Appraisal Reduction Amounts or Collateral Deficiency Amounts to notionally reduce the certificate balance of such class) has been reduced to less than 25% of its initial certificate balance. Any Appraised-Out Class may not exercise any direction, control, consent and/or similar rights of the Controlling Class until such time, if any, as such class is reinstated as the Controlling Class, and the rights of the Controlling Class will be exercised by the next most senior class of Control Eligible Certificates that is not an Appraised-Out Class, if any, duringsuch period. | |||
This is not a research report and was not prepared by any Underwriter’s research department. Please see additional important information and qualifications at the end of this Term Sheet.
| T-10 |
| BANK 2017-BNK5 | Structural Overview |
| Appraisal Remedy: | The holders of the majority (by certificate balance) of an Appraised-Out Class (such holders, the “Requesting Holders”) will have the right, at their sole expense, to require the applicable special servicer to order (or, with respect to a non-serviced mortgage loan, require the applicable master servicer to request from the applicable non-serviced special servicer) a second appraisal of any mortgage loan (or serviced whole loan) for which an appraisal reduction event has occurred or as to which there exists a Collateral Deficiency Amount. With respect to any serviced mortgage loan, such special servicer will be required to use its reasonable efforts to ensure that such appraisal is delivered within 30 days from receipt of the Requesting Holders’ written request and will be required to ensure that such appraisal is prepared on an “as-is” basis by an MAI appraiser. With respect to any such non-serviced mortgage loan, the applicable master servicer will be required to use commercially reasonable efforts to obtain such second appraisal from the applicable non-serviced special servicer and to forward such second appraisal to the applicable special servicer. Upon receipt of such supplemental appraisal, the applicable master servicer (for Collateral Deficiency Amounts on non-serviced mortgage loans), the non-serviced special servicer (for Appraisal Reduction Amounts on non-serviced mortgage loans to the extent provided for in the applicable non-serviced pooling and servicing agreement and applicable intercreditor agreement) and the applicable special servicer (for any serviced mortgage loan) will be required to determine, in accordance with the Servicing Standard, whether, based on its assessment of such supplemental appraisal, any recalculation of the applicable Appraisal Reduction Amount or Collateral Deficiency Amount is warranted and, if so warranted, such person will be required to recalculate such Appraisal Reduction Amount or Collateral Deficiency Amount, as applicable, based upon such supplemental appraisal and (for any serviced mortgage loan) receipt of information requested by such special servicer from the applicable master servicer. If required by any such recalculation, the applicable Appraised-Out Class will be reinstated as the Controlling Class and each Appraised-Out Class will, if applicable, have its related certificate balance notionally restored to the extent required by such recalculation of the Appraisal Reduction Amount or Collateral Deficiency Amount, if applicable. | |||
| Sale of Defaulted Loans: | Under certain circumstances the applicable special servicer may be required to use reasonable efforts to solicit offers for a defaulted serviced mortgage loan (and any related companion loan (to the extent provided under the related intercreditor agreement) and/or related REO properties).
The Directing Certificateholder will not have a right of first refusal to purchase a defaulted loan.
If the applicable special servicer does not receive an offer at least equal to the outstanding principal balance plus all accrued and unpaid interest and outstanding costs and expenses and certain other amounts specified in the pooling and servicing agreement (the “Par Purchase Price”), the applicable special servicer may purchase the defaulted loan or REO property at the Par Purchase Price or may accept the first cash offer received from any person that is determined to be a fair price for such defaulted loan or REO property. If multiple offers are received during the period designated by the applicable special servicer for receipt of offers, such special servicer is generally required to select the highest offer. The applicable special servicer will be required to determine whether any cash offer constitutes a fair price for any defaulted loan or REO property if the highest offeror is a person other than a party to the pooling and servicing agreement for this transaction (the “PSA”), the Directing Certificateholder, the Risk Retention Consultation Party, any sponsor, any Borrower Party, any independent contractor engaged by a special servicer, a holder of any related companion loan or mezzanine loan, the depositor, the applicable master servicer, the applicable special servicer (or any independent contractor engaged by such special servicer), or the trustee for the securitization of a companion loan or any known affiliate of any of the preceding entities (each, an “Interested Person”). If an offer is made by an Interested Person, the trustee will be required to determine (based upon the most recent appraisal conducted in accordance with the terms of the PSA) whether the offer constitutes a fair price for the defaulted loan or REO property unless (i) the offer is equal to or greater than the applicable Par Purchase Price and (ii) the offer is the highest offer received. Absent an offer at least equal to the Par Purchase Price, no offer from an Interested Person will constitute a fair price unless (x) it is the highest offer received and (y) at least two other offers are received from independent third parties, and the trustee will be entitled to rely on the opinion of an independent appraiser or other independent expert retained by the trustee in connection with making such determination. Neither the trustee nor any of its affiliates may make an offer for or purchase any specially serviced loan or REO property.
Notwithstanding any of the foregoing to the contrary, the applicable special servicer is not required to accept the highest offer and may accept a lower offer for a defaulted loan or REO property if such special servicer determines (with respect to (i) any mortgage loan other than an Excluded Loan with respect to the Directing Certificateholder or the holder of the majority of the Controlling Class, in consultation with the Directing Certificateholder (unless a Consultation Termination Event exists), (ii) any mortgage loan other than an Excluded Loan with respect to the Risk Retention Consultation Party or the holder of the majority of the RR Interest, in consultation with the Risk Retention Consultation Party and (iii) a serviced whole loan or an REO property related to a serviced whole loan, in consultation with the related companion loan holder(s)), in accordance with the Servicing Standard (and subject to the requirements of any related intercreditor agreement), that a rejection of such offer would be in the best interests of the certificateholders and any related companion loan holders as a collective whole as if they constituted a single lender (and with respect to a serviced A/B whole loan, taking into account the subordinate nature of any related subordinate companion loan), so long as such lower offer was not made by such special servicer or any of its affiliates.
If title to any mortgaged property is acquired by the trust fund, the applicable special servicer will be required to sell such mortgaged property prior to the close of the third calendar year beginning after the year of acquisition, unless (a) the IRS grants or has not denied an extension of time to sell such mortgaged property or (b) such special servicer, the trustee and the certificate administrator receive an opinion of independent counsel to the effect that the holding of the property by the trust longer than the above-referenced three-year period will not result in the imposition of a tax on any REMIC of the trust fund or cause any REMIC of the trustfund to fail to qualify as a REMIC. | |||
This is not a research report and was not prepared by any Underwriter’s research department. Please see additional important information and qualifications at the end of this Term Sheet.
| T-11 |
| BANK 2017-BNK5 | Structural Overview |
The foregoing applies to mortgage loans serviced under the PSA. With respect to any non-serviced whole loan, if the special servicer under the applicable pooling and servicing agreement determines to sell the related controlling companion loan if it becomes a defaulted loan, then the applicable special servicer will be required to sell the related whole loan, including the related mortgage loan included in the BANK 2017-BNK5 securitization trust and the relatedpari passucompanion loan(s) and, under certain circumstances, any subordinate companion loan(s), as a single loan. In connection with any such sale, the special servicer under the applicable pooling and servicing agreement will be required to follow procedures substantially similar to those set forth above.
| ||||
| Risk Retention Consultation Party: | A risk retention consultation party may be appointed by the holder or holders of more than 50% of the RR Interest, by certificate balance. The majority RR Interest holder will have a continuing right to appoint, remove or replace the risk retention consultation party in its sole discretion. This right may be exercised at any time and from time to time. Except with respect to an Excluded Loan as to such party, the risk retention consultation party will be entitled to consult with the applicable special servicer, upon request of the risk retention consultation party, with respect to certain material servicing actions proposed by such special servicer; provided, that prior to the occurrence and continuance of a Consultation Termination Event, such mortgage loan must also be a specially serviced mortgage loan. | |||
| Appointment and Replacement of Special Servicer: | The Directing Certificateholder will appoint the initial special servicers as of the closing date. Prior to the occurrence and continuance of a Control Termination Event, either special servicer may generally be replaced by the Directing Certificateholder with or without cause at any time.
After the occurrence and during the continuance of a Control Termination Event and upon (a) the written direction of holders of principal balance certificates evidencing not less than 25% of the voting rights of all classes of certificates (other than the RR Interest) entitled to principal (taking into account the application of Appraisal Reduction Amounts to notionally reduce the certificate balances of classes to which such Appraisal Reduction Amounts are allocable) requesting a vote to replace the applicable special servicer with a replacement special servicer, (b) payment by such requesting holders to the certificate administrator of all reasonable fees and expenses to be incurred by the certificate administrator in connection with administering such vote and (c) delivery by such holders of a rating agency confirmation from each applicable rating agency, the certificate administrator will be required to promptly post such notice on its internet website and by mail and conduct the solicitation of votes of all certificates in such regard, which requisite affirmative votes must be received within 180 days of the posting of such notice. Upon the written direction of holders of at least 66 2/3% of a Certificateholder Quorum, the trustee will be required to immediately replace the applicable special servicer with a qualified replacement special servicer designated by such holders of certificates.
After the occurrence and during the continuance of a Consultation Termination Event, if the operating advisor determines that the applicable special servicer is not performing its duties as required under the pooling and servicing agreement or is otherwise not acting in accordance with the Servicing Standard, the operating advisor may also recommend the replacement of such special servicer. The operating advisor’s recommendation to replace such special servicer must be confirmed by an affirmative vote of holders of principal balance certificates evidencing at least a majority of the aggregate voting rights (taking into account the application of any Appraisal Reduction Amounts to notionally reduce the respective certificate balances) of all principal balance certificates on an aggregate basis.
A “Certificateholder Quorum” means, in connection with any solicitation of votes in connection with the replacement of a special servicer or the asset representations reviewer, the holders of certificates evidencing at least 50% of the aggregate voting rights (taking into account the application of realized losses and, other than with respect to the termination of the asset representations reviewer, any Appraisal Reduction Amounts to notionally reduce the certificate balance of the certificates) of all classes of certificates entitled to principal (other than the RR Interest) on an aggregate basis.
With respect to each serviced whole loan, any holder of a relatedpari passu companion loan, following a servicer termination event with respect to the applicable special servicer that affects such holder, will be entitled to direct the trustee (and the trustee will be required) to terminate such special servicer solely with respect to such serviced whole loan. A replacement special servicer will be selected by the trustee or, prior to a Control Termination Event, by the Directing Certificateholder;provided, that any successor special servicer appointed to replace the special servicer with respect to such whole loan can generally not be the entity (or its affiliate) that was terminated at the direction of the holder of the relatedpari passucompanion loan.
Notwithstanding any of the foregoing to the contrary, with respect to each servicing shift whole loan and any serviced A/B whole loans as to which a subordinate companion loan holder is the related controlling note holder, the holder of the related control note will be entitled to replace the applicable special servicer with respect to such whole loan at any time, with or without cause, and while it is a serviced whole loan, no other party may replace the applicable special servicer for such whole loan unless there is a servicer termination event with respect thereto.
With respect to any non-serviced whole loan, the BANK 2017-BNK5 trust, as holder of the related mortgage loan, has the right to terminate the special servicer under the related pooling and servicing agreement if a servicer termination event occurs, with respect to such special servicer that affects the trust in its capacity as such holder. Such rights may be exercised by the Directing Certificateholder prior to a Control Termination Event (or the applicable special servicer (consistent with the Servicing Standard), following the occurrence and during the continuance of a Control Termination Event). The successor special servicer will be selected pursuant to the applicable pooling and servicing agreement by the related directing holder prior to a control termination event under such pooling and servicing agreement. | |||
| Servicing Standard: | Each master servicer and each special servicer is obligated to service and administer the mortgage loans | |||
This is not a research report and was not prepared by any Underwriter’s research department. Please see additional important information and qualifications at the end of this Term Sheet.
| T-12 |
| BANK 2017-BNK5 | Structural Overview |
| (and, if applicable, the serviced companion loans) in accordance with the definition of the “Servicing Standard” described in the Preliminary Prospectus and the terms of the pooling and servicing agreement, provided that each non-serviced mortgage loan, if any, will be serviced by another master servicer or special servicer under the pooling and servicing agreement with respect to the securitization of the related companion loan, which entities will be obligated to service and administer such non-serviced mortgage loan pursuant to a similar standard set forth in the related pooling and servicing agreement. | ||||
| Excluded Special Servicer: | If a special servicer obtains knowledge that it has become a Borrower Party with respect to any mortgage loan (an “Excluded Special Servicer Loan”), such special servicer will be required to resign as special servicer of that Excluded Special Servicer Loan. Prior to the occurrence of a Control Termination Event, the Directing Certificateholder will be required to appoint (and may remove and replace with or without cause) a separate special servicer that is not a Borrower Party (an “Excluded Special Servicer”) with respect to any Excluded Special Servicer Loan, unless such Excluded Special Servicer Loan is also an Excluded Loan with respect to the Directing Certificateholder or the holder of the majority of the Controlling Class. After the occurrence and during the continuance of a Control Termination Event, if at any time the applicable Excluded Special Servicer Loan is also an Excluded Loan with respect to the Directing Certificateholder or the holder of the majority of the Controlling Class or if the Directing Certificateholder is entitled to appoint the Excluded Special Servicer but does not so appoint within 30 days of notice of such resignation, the resigning special servicer will be required to use reasonable efforts to select the related Excluded Special Servicer. Any Excluded Special Servicer will be required to perform all of the obligations of the applicable special servicer and will be entitled to all special servicing compensation with respect to such Excluded Special Servicer Loan earned while the related mortgage loan is an Excluded Special Servicer Loan. | |||
| Liquidated Loan Waterfall: | On liquidation of any mortgage loan, all net liquidation proceeds related to the mortgage loan (but not any related companion loan) will be applied so that amounts allocated as a recovery of accrued and unpaid interest will not, in the first instance, include any delinquent interest that was not advanced as a result of Appraisal Reduction Amounts or accrued on the portion of the stated principal balance thereof equal to any related Collateral Deficiency Amount in effect from time to time and as to which no advance was made. After the adjusted interest amount is so allocated, any remaining liquidation proceeds will be allocated to offset certain advances and to pay principal on the mortgage loan until the unpaid principal amount of the mortgage loan has been reduced to zero. Any remaining liquidation proceeds will then be allocated to pay delinquent interest that was not advanced as a result of Appraisal Reduction Amounts or that accrued on the portion of the stated principal balance thereof equal to any related Collateral Deficiency Amount in effect from time to time and as to which no advance was made. | |||
| Operating Advisor: | The operating advisor will be required to perform certain review duties if a Control Termination Event has occurred and is continuing, which will generally include a limited annual review of, and the preparation of a report regarding, certain actions of the applicable special servicer with respect to the resolution and/or liquidation of specially serviced loans. The review and report generally will be based on any asset status reports and additional information delivered to the operating advisor by such special servicer. In addition, if a Control Termination Event has occurred and is continuing, the applicable special servicer must consult with the operating advisor (in addition to the Directing Certificateholder if no Consultation Termination Event has occurred and is continuing) in connection with major decisions with respect to mortgage loans. Furthermore, under certain circumstances, but only if a Consultation Termination Event has occurred and is continuing, the operating advisor may recommend the replacement of the applicable special servicer as described above under “—Appointment and Replacement of Special Servicer”; however, the operating advisor will not have any rights or obligations with respect to a non-serviced whole loan.
If a Consultation Termination Event has occurred and is continuing, the operating advisor may be removed and replaced without cause upon the affirmative direction of certificates owners holding not less than 75% of the voting rights of all certificates (taking into account the application of Appraisal Reduction Amounts), following a proposal from certificate owners holding not less than 25% of the voting rights of all certificates (taking into account the application of Appraisal Reduction Amounts). The certificateholders who initiate a vote on a termination and replacement of the operating advisor without cause must cause the payment of the fees and expenses incurred in the replacement. In addition, in the event there are no classes of certificates outstanding other than the Control Eligible Certificates, the RR Interest and the Class V and Class R certificates, then all of the rights and obligations of the operating advisor under the PSA will terminate without payment of any penalty or termination fee (other than any rights or obligations that accrued prior to the date of such termination (including accrued and unpaid compensation) and other than indemnification rights arising out of events occurring prior to such termination). See “Pooling and Servicing Agreement—The Operating Advisor—Termination of the Operating Advisor Without Cause” in the Preliminary Prospectus. | |||
| Operating Advisor Expenses: | In addition to the Operating Advisor Fee and the Operating Advisor Consulting Fee, the operating advisor will be entitled to reimbursement of Operating Advisor Expenses in accordance with the terms of the PSA. “Operating Advisor Expenses” for each distribution date will equal any unreimbursed indemnification amounts or additional trust fund expenses payable to the operating advisor pursuant to the PSA (other than the Operating Advisor Fee and the Operating Advisor Consulting Fee). | |||
| Asset Representations Reviewer: | The asset representations reviewer will be required to review certain delinquent mortgage loans after a specified delinquency threshold has been met and the required percentage of certificateholders vote to direct a review as described below. The asset representations reviewer will be entitled to the Asset Representations Reviewer Fee with respect to such review. See “Pooling and Servicing Agreement—The Asset Representations Reviewer” in the Preliminary Prospectus.
The certificate administrator will be required to notify certificateholders if the specified delinquency threshold | |||
This is not a research report and was not prepared by any Underwriter’s research department. Please see additional important information and qualifications at the end of this Term Sheet.
| T-13 |
| BANK 2017-BNK5 | Structural Overview |
has been met as described in the Preliminary Prospectus under “—The Asset Representations Reviewer”.
If certificateholders evidencing not less than 5.0% of the voting rights request a vote to commence an asset review, and if subsequently (i) a majority of those certificateholders who cast votes and (ii) a majority of an Asset Review Quorum authorizes an asset review within 150 days of the request for a vote, the asset representations reviewer will be required to conduct an asset review of delinquent loans.
The asset representations reviewer may be terminated and replaced without cause. Upon (i) the written direction of certificateholders evidencing not less than 25% of the voting rights (without regard to the application of any Appraisal Reduction Amounts) requesting a vote to terminate and replace the asset representations reviewer with a proposed successor asset representations reviewer that is an eligible asset representations reviewer, and (ii) payment by such holders to the certificate administrator of the reasonable fees and expenses to be incurred by the certificate administrator in connection with administering such vote, the certificate administrator will be required to promptly provide notice to all certificateholders and the asset representations reviewer of such request by posting such notice on its internet website, and by mailing such notice to all certificateholders and the asset representations reviewer. Upon the written direction of certificateholders evidencing at least 75% of a Certificateholder Quorum (without regard to the application of any Appraisal Reduction Amounts), the trustee will be required to terminate all of the rights and obligations of the asset representations reviewer under the pooling and servicing agreement (other than any rights or obligations that accrued prior to the date of such termination and other than indemnification rights arising out of events occurring prior to such termination) by written notice to the asset representations reviewer, and the proposed successor asset representations reviewer will be appointed. See “Pooling and Servicing Agreement—The Asset Representations Reviewer” in the Preliminary Prospectus.
An “Asset Review Quorum” means, in connection with any solicitation of votes to authorize an Asset Review as described above, the holders of certificates evidencing at least 5.0% of the aggregate voting rights represented by all certificates that have voting rights. | ||||
| Dispute Resolution Provisions: | The mortgage loan sellers will be subject to the dispute resolution provisions set forth in the PSA to the extent those provisions are triggered with respect to any mortgage loan sold to the depositor by a mortgage loan seller, and such mortgage loan seller will be obligated under the related mortgage loan purchase agreement to comply with all applicable provisions and to take part in any mediation or arbitration proceedings that may result. Generally, in the event that a Repurchase Request is not “Resolved” within 180 days after the related mortgage loan seller receives such Repurchase Request, then the enforcing servicer will be required to send a notice to the first certificateholder (or beneficial owner) to deliver a certificateholder repurchase request with respect to the mortgage loan (the “Initial Requesting Certificateholder”) (if any) and to the certificate administrator (which will be required to make such notice available to certificateholders via the certificate administrator’s website) indicating the enforcing servicer’s intended course of action with respect to the Repurchase Request. If (a) the enforcing servicer’s intended course of action with respect to the Repurchase Request does not involve pursuing further action to exercise rights against the related mortgage loan seller with respect to the Repurchase Request and the Initial Requesting Certificateholder, if any, or any other certificateholder or certificate owner wishes to exercise its right to refer the matter to mediation (including nonbinding arbitration) or arbitration, or (b) the enforcing servicer’s intended course of action is to pursue further action to exercise rights against the related mortgage loan seller with respect to the Repurchase Request but the Initial Requesting Certificateholder, if any, or any other certificateholder or certificate owner does not agree with the dispute resolution method selected by the enforcing servicer, then the Initial Requesting Certificateholder, if any, or such other certificateholder or certificate owner may deliver a written notice to the enforcing servicer indicating its intent to exercise its right to refer the matter to either mediation or arbitration.
“Resolved” means, with respect to a Repurchase Request, (i) that the related material defect or breach has been cured, (ii) the related mortgage loan has been repurchased in accordance with the related mortgage loan purchase agreement, (iii) a mortgage loan has been substituted for the related mortgage loan in accordance with the related mortgage loan purchase agreement, (iv) the applicable mortgage loan seller has made a loss of value payment, (v) a contractually binding agreement has been entered into between the enforcing servicer, on behalf of the issuing entity, and the related mortgage loan seller that settles the related mortgage loan seller’s obligations under the related mortgage loan purchase agreement, or (vi) the related mortgage loan is no longer property of the issuing entity as a result of a sale or other disposition in accordance with the pooling and servicing agreement. See “Pooling and Servicing Agreement—Dispute Resolution Provisions” in the Preliminary Prospectus. | |||
| Investor Communications: | The certificate administrator is required to include on any Form 10-D any request received from a certificateholder to communicate with other certificateholders related to certificateholders exercising their rights under the terms of the PSA. Any certificateholder wishing to communicate with other certificateholders regarding the exercise of its rights under the terms of the PSA will be able to deliver a written request signed by an authorized representative of the requesting investor to the certificate administrator. | |||
| Deal Website: | The certificate administrator will be required to maintain a deal website which will include, among other items: (a) summaries of asset status reports prepared by a special servicer, (b) inspection reports, (c) appraisals, (d) various “special notices” described in the Preliminary Prospectus, (e) the “Investor Q&A Forum” and (f) a voluntary “Investor Registry”. Investors may access the deal website following execution of a certification and confidentiality agreement. | |||
This is not a research report and was not prepared by any Underwriter’s research department. Please see additional important information and qualifications at the end of this Term Sheet.
| T-14 |
| BANK 2017-BNK5 | Collateral Overview |
| Mortgage Loan Sellers | No. of Mortgage Loans | No. of Mortgaged Properties | Aggregate Cut-off Date Balance | % of Pool(1) |
| Wells Fargo Bank, National Association | 28 | 36 | $428,853,759 | 34.8% |
| Bank of America, National Association | 20 | 136 | $355,638,808 | 28.9% |
| Morgan Stanley Mortgage Capital Holdings LLC | 9 | 9 | $201,800,000 | 16.4% |
| Bank of America, National Association/Wells Fargo Bank, National Association(2) | 1 | 1 | $90,000,000 | 7.3% |
| National Cooperative Bank, N. A.(3) | 28 | 28 | $89,995,798 | 7.3% |
| Morgan Stanley Mortgage Capital Holdings LLC/Wells Fargo Bank, National Association(4) | 1 | 1 | $65,000,000 | 5.3% |
| Total: | 87 | 211 | $1,231,288,365 | 100.0% |
Pool Statistics
| Aggregate Cut-off Date Balance: | $1,231,288,365 |
| Number of Mortgage Loans: | 87 |
| Average Cut-off Date Balance per Mortgage Loan: | $14,152,740 |
| Number of Mortgaged Properties: | 211 |
| Average Cut-off Date Balance per Mortgaged Property: | $5,835,490 |
| Weighted Average Mortgage Rate: | 4.2792% |
| % of Pool Secured by 5 Largest Mortgage Loans: | 28.5% |
| % of Pool Secured by 10 Largest Mortgage Loans: | 48.2% |
| % of Pool Secured by ARD Loans(5): | 8.2% |
| Weighted Average Original Term to Maturity (months)(5): | 113 |
| Weighted Average Remaining Term to Maturity (months)(5): | 112 |
| Weighted Average Seasoning (months): | 1 |
| % of Pool Secured by Single Tenant Mortgaged Properties: | 10.6% |
| % of Pool Secured by Refinance Loans: | 72.7% |
| % of Pool Secured by Acquisition Loans: | 23.7% |
| % of Pool Secured by Recapitalization Loans: | 3.7% |
Additional Debt
| % of Pool withPari Passu Mortgage Debt: | 37.5% |
| % of Pool with Subordinate Mortgage Debt(6): | 21.4% |
| % of Pool with Mezzanine Debt: | 4.5% |
Credit Statistics(7)(8)
| Weighted Average UW NOI DSCR: | 2.71x |
| Weighted Average UW NOI Debt Yield(9): | 13.7% |
| Weighted Average UW NCF DSCR: | 2.57x |
| Weighted Average UW NCF Debt Yield(9): | 13.0% |
| Weighted Average Cut-off Date LTV Ratio(9)(10): | 53.5% |
| Weighted Average Maturity Date LTV Ratio(5)(9)(10): | 49.2% |
Footnotes are set forth on the following page.
This is not a research report and was not prepared by any Underwriter’s research department. Please see additional important information and qualifications at the end of this Term Sheet.
| T-15 |
| BANK 2017-BNK5 | Collateral Overview |
Amortization
| Weighted Average Original Amortization Term (months)(11): | 358 |
| Weighted Average Remaining Amortization Term (months)(11): | 358 |
| % of Pool Interest Only through Maturity: | 38.4% |
| % of Pool Amortizing Balloon: | 29.2% |
| % of Pool Interest Only followed by Amortizing Balloon: | 24.2% |
| % of Pool Interest Only followed by Amortizing Balloon at ARD and Maturity(12): | 4.5% |
| % of Pool Interest Only through ARD and Maturity: | 3.7% |
Lockboxes
| % of Pool with Hard Lockboxes: | 38.5% |
| % of Pool with Springing Lockboxes: | 37.6% |
| % of Pool with No Lockboxes: | 12.5% |
| % of Pool with Soft Lockboxes: | 11.4% |
Reserves
| % of Pool Requiring Tax Reserves: | 56.0% |
| % of Pool Requiring Insurance Reserves: | 25.1% |
| % of Pool Requiring Replacement Reserves: | 62.2% |
| % of Pool Requiring TI/LC Reserves(13): | 53.2% |
Call Protection
| % of Pool with lockout period, followed by defeasance until open period: | 77.0% |
| % of Pool with lockout period, followed by the greater of a prepayment premium and yield maintenance until open period: | 11.6% |
| % of Pool with no lockout period. Greater of a prepayment premium and yield maintenance followed by prepayment premium until open period: | 7.3% |
| % of Pool with lockout period, followed by defeasance or the greater of a prepayment premium and yield maintenance until open period: | 4.1% |
| (1) | Unless otherwise indicated, all references to “% of Pool” in this Term Sheet reflect a percentage of the aggregate principal balance of the mortgage pool as of the Cut-off Date, after application of all payments of principal due during or prior to June 2017. |
| (2) | The Del Amo Fashion Center mortgage loan was co-originated by Bank of America, National Association and Wells Fargo Bank, National Association. Such mortgage loan is evidenced by four promissory notes: (i) note A-1-2 and note B-1-2, with an aggregate outstanding principal balance of $45,000,000 as of the Cut-off Date, as to which Bank of America, National Association is acting as mortgage loan seller; and (ii) note A-4-2 and note B-4-2, with an aggregate outstanding principal balance of $45,000,000 as of the Cut-off Date, as to which Wells Fargo Bank, National Association is acting as mortgage loan seller. |
| (3) | Twenty Six (26) of the twenty eight (28) mortgage loans for which National Cooperative Bank, N.A. is the mortgage loan seller were originated by its parent company, National Consumer Cooperative Bank, and transferred to National Cooperative Bank, N.A. Each such mortgage loan originated by National Consumer Cooperative Bank was underwritten pursuant to National Cooperative Bank, N.A.’s underwriting guidelines. |
| (4) | The Market Street – The Woodlands mortgage loan was co-originated by Morgan Stanley Mortgage Capital Holdings LLC and Wells Fargo Bank, National Association. Such mortgage loan is evidenced by two promissory notes: (i) note A-2, with an outstanding principal balance of $22,500,000 as of the Cut-off Date, as to which Morgan Stanley Mortgage Capital Holdings LLC is acting as mortgage loan seller; and (ii) note A-3, with an outstanding principal balance of $42,500,000 as of the Cut-off Date, as to which Wells Fargo Bank, National Association is acting as mortgage loan seller. |
| (5) | With respect to any ARD Loan, unless otherwise indicated, references in this Term Sheet to the applicable “maturity date” or “maturity” refer to the applicable anticipated repayment date with respect to such ARD Loan, and such applicable anticipated repayment date is treated as its maturity date for all purposes hereof. |
| (6) | Twenty-Five (25) of the mortgage loans, each of which is secured by a residential cooperative property, currently have in place subordinate secured lines of credit to the related mortgage borrowers that permit future advances (such loans, collectively, the “Subordinate Coop LOCs”). The percentage figure expressed as “% of Pool with Subordinate Mortgage Debt” is determined as a percentage of the initial pool balance and does not take into account any future subordinate debt (whether or not secured by the mortgaged property), if any, that may be permitted under the terms of any mortgage loan or the pooling and servicing agreement. See “Description of the Mortgage Pool—Additional Indebtedness—Other Secured Indebtedness” and “Description of the Mortgage Pool—Additional Debt Financing for Mortgage Loans Secured by Residential Cooperatives” in the Preliminary Prospectus. |
| (7) | With respect to any mortgage loan that is part of a whole loan, unless otherwise indicated, all LTV, DSCR and Debt Yield calculations in this Term Sheet include any relatedpari passucompanion loans and exclude any subordinate companion loans, as applicable. Additionally, LTV, DSCR and Debt Yield figures in this Term Sheet are calculated for mortgage loans without regard to any additional indebtedness that may be incurred at a future date. For mortgaged properties securing residential cooperative mortgage loans all LTV, DSCR and Debt Yield calculations do not take into account any subordinate debt (whether or not secured by the related mortgaged property), that currently exists or is allowed under the terms of any mortgage loan. With respect to any leased fee loans, the SF/Units and Balance per SF/Unit figures in this Term Sheet are based on the size of the non-collateral improvements. |
| (8) | For mortgaged properties securing residential cooperative mortgage loans, all DSCR and Debt Yield calculations for each such mortgaged property is calculated using underwritten net operating Income or underwritten net cash flow, as applicable, for the related residential cooperative property which is the projected net operating income or net cash flow, as applicable, reflected in the most recent appraisal obtained by or otherwise in the possession of the related mortgage loan seller as of the Cut-off Date. AllLTV ratio calculations are based upon the appraised value of the residential cooperative property determined as if such residential cooperative property is operated as a residential cooperative, inclusive of the amount of the underlying debt encumbering such residential cooperative property with the exception of Bywater Mutual Homes, Inc. In the case of the residential cooperative property securing the Bywater Mutual Homes, Inc. mortgage loan the LTV ratio calculations for such mortgage loan are determined as if such residential cooperative property is operated as a market rate multifamily rental property. |
This is not a research report and was not prepared by any Underwriter’s research department. Please see additional important information and qualifications at the end of this Term Sheet.
| T-16 |
| BANK 2017-BNK5 | Collateral Overview |
| (9) | With respect to certain mortgage loans, debt yields and LTVs (such as, for example, UW NOI Debt Yield, UW NCF Debt Yield or Cut-off Date LTV Ratio) have been calculated based on a principal balance that is net of a holdback or earnout reserve. Such mortgage loans are identified under the definitions of “Underwritten NOI Debt Yield”, “Underwritten NCF Debt Yield” and “Cut-off Date LTV Ratio” set forth under “Description of the Mortgage Pool—Certain Calculations and Definitions” in the Preliminary Prospectus. |
| (10) | The LTV ratios set forth in this Term Sheet are generally based on the “as-is” values of the related mortgaged properties; provided that the “as-is” value for a portfolio of mortgaged properties may include a premium relating to the valuation of the mortgaged properties as a whole rather than as the sum of individually valued mortgaged properties; provided, further, that such LTV ratios may be based on “as-stabilized”, “as complete” or other contingent values in certain cases in which reserves have been established at origination for the applicable condition or circumstance that is expected to result in stabilization provided, further, that such LTV ratios may have been calculated based on a principal balance that is net of a holdback or earnout reserve. See the definition of “Appraised Value” under“Description of the Mortgage Pool—Certain Calculations and Definitions”in the Preliminary Prospectus. |
| (11) | Excludes mortgage loans that provide for payments of interest only through the related maturity date or anticipated repayment date, as applicable. |
| (12) | The Sprouts Farmers Market mortgage loan requires interest only payments during the first 36 payment periods, followed by payments of principal and interest based on a 30-year amortization schedule from payment periods 37 to 99 and then interest only payments from payment period 100 through ARD. |
| (13) | Excludes hospitality, multifamily, manufactured housing, other (leased fee and net lease) and self storage properties. |
This is not a research report and was not prepared by any Underwriter’s research department. Please see additional important information and qualifications at the end of this Term Sheet.
| T-17 |
| BANK 2017-BNK5 | Characteristics of the Mortgage Loans |
| Top 10 Mortgage Loans or Groups of Cross-Collateralized Mortgage Loans(1) | |||||||||||||
| Loan No. | Mortgage Loan Seller | Property Name | City | State | Property Type | Cut-off Date Balance | % of Pool | SF/Units | Cut-off Date Balance per SF/Unit | UW NCF DSCR | UW NOI Debt Yield | Cut-off Date LTV | Maturity Date LTV |
| 1 | BANA/WFB | Del Amo Fashion Center | Torrance | CA | Retail | $90,000,000 | 7.3% | 1,769,525 | $259.56 | 3.34x | 12.9% | 39.8% | 39.8% |
| 2 | BANA | Starwood Capital Group Hotel Portfolio | Various | Various | Hospitality | $72,500,000 | 5.9% | 6,366 | $90,680.18 | 2.72x | 12.4% | 60.4% | 60.4% |
| 3 | MSMCH | Westchester One | White Plains | NY | Office | $67,500,000 | 5.5% | 907,436 | $121.22 | 1.64x | 10.5% | 63.6% | 55.2% |
| 4 | MSMCH/WFB | Market Street - The Woodlands | The Woodlands | TX | Retail | $65,000,000 | 5.3% | 492,082 | $355.63 | 2.04x | 9.1% | 53.6% | 53.6% |
| 5 | MSMCH | Olympic Tower | New York | NY | Mixed Use | $56,000,000 | 4.5% | 525,372 | $1,162.99 | 2.70x | 11.2% | 32.2% | 32.2% |
| 6 | WFB | Sprouts Farmers Market | San Jose | CA | Retail | $56,000,000 | 4.5% | 143,479 | $390.30 | 1.47x | 8.8% | 52.0% | 46.9% |
| 7 | BANA | 270 Corporate Center | Germantown | MD | Office | $52,500,000 | 4.3% | 449,443 | $116.81 | 1.61x | 11.5% | 73.4% | 71.4% |
| 8 | BANA | iStar Leased Fee Portfolio | Various | Various | Leased Fee | $45,400,000 | 3.7% | Various | N/A | 2.12x | 8.2% | 65.6% | 65.6% |
| 9 | BANA | Gateway Net Lease Portfolio | Various | Various | Industrial/Office | $45,000,000 | 3.7% | 5,296,943 | $66.64 | 3.54x | 14.1% | 45.0% | 45.0% |
| 10 | WFB | 200 Center Anaheim | Anaheim | CA | Office | $43,500,000 | 3.5% | 191,556 | $227.09 | 1.57x | 9.9% | 68.6% | 62.6% |
| Total/Wtd. Avg. | $593,400,000 | 48.2% | 2.33x | 11.0% | 54.4% | 52.4% | |||||||
| (1) | With respect to any mortgage loan that is part of a whole loan, unless otherwise indicated, all LTV, DSCR, Debt Yield and Balance per SF/Unit calculations in this Term Sheet include any relatedpari passu companion loans and exclude any subordinate companion loans, as applicable. Additionally, LTV, DSCR, Debt Yield and Balance per SF/Unit figures in this Term Sheet are calculated for mortgage loans without regard to any additional indebtedness that may be incurred at a future date. With respect to any leased fee loans, the SF/Units and Balance per SF/Unit figures in this Term Sheet are based on the size of the non-collateral improvements. |
This is not a research report and was not prepared by any Underwriter’s research department. Please see additional important information and qualifications at the end of this Term Sheet.
| T-18 |
| BANK 2017-BNK5 | Characteristics of the Mortgage Loans |
| Mortgage Loans with Pari Passu Companion Loans | ||||||||||||
| Loan No. | Mortgage | Property Name | Mortgage Loan Cut-off Date Balance | Aggregate Pari Passu Companion Loan Cut-off Date Balance | Combined Cut-off Date Balance | Lead Servicing Agreement | Master Servicer | Special Servicer | Control Rights | Combined UW NCF DSCR(1) | Combined UW NOI Debt Yield(1) | Combined Cut-off Date LTV(1) |
| 1 | BANA/WFB | Del Amo Fashion Center | $90,000,000 | $369,300,000 | $459,300,000 | DAFC 2017-AMO | KeyBank | Cohen | DAFC 2017-AMO | 3.34x | 12.9% | 39.8% |
| 2 | BANA | Starwood Capital Group Hotel Portfolio | $72,500,000 | $504,770,000 | $577,270,000 | BANK 2017-BNK5(2) | Wells Fargo(2) | CW Capital(2) | (2) | 2.72x | 12.4% | 60.4% |
| 3 | MSMCH | Westchester One | $67,500,000 | $42,500,000 | $110,000,000 | BANK 2017-BNK5 | Wells Fargo | CW Capital | BANK 2017-BNK5 | 1.64x | 10.5% | 63.6% |
| 4 | MSMCH/WFB | Market Street - The Woodlands | $65,000,000 | $110,000,000 | $175,000,000 | BANK 2017-BNK5 | Wells Fargo | CW Capital | BANK 2017-BNK5 | 2.04x | 9.1% | 53.6% |
| 5 | MSMCH | Olympic Tower | $56,000,000 | $555,000,000 | $611,000,000 | Olympic Tower 2017-OT | KeyBank | KeyBank | Olympic Tower 2017-OT | 2.70x | 11.2% | 32.2% |
| 8 | BANA | iStar Leased Fee Portfolio | $45,400,000 | $181,600,000 | $227,000,000 | MSC 2017-H1 | Midland | LNR | MSC 2017-H1 | 2.12x | 8.2% | 65.6% |
| 9 | BANA | Gateway Net Lease Portfolio | $45,000,000 | $308,000,000 | $353,000,000 | BANK 2017-BNK5(3) | Wells Fargo(3) | CW Capital(3) | (3) | 3.54x | 14.1% | 45.0% |
| 18 | BANA | Crossgates Commons | $19,976,914 | $12,485,571 | $32,462,485 | BANK 2017-BNK5 | Wells Fargo | CW Capital | BANK 2017-BNK5 | 1.66x | 11.4% | 58.2% |
| (1) | DSCR, Debt Yield and LTV calculations include any relatedpari passu companion loans and exclude any subordinate companion loans, as applicable. |
| (2) | The Starwood Capital Group Hotel Portfolio controllingpari passu companion loan is currently held by JP Morgan Chase Bank, N.A. and is expected to be contributed to the DBJPM 2017-C6 securitization transaction. The DBJPM 2017-C6 securitization transaction is expected to close on the closing date for this transaction and the related pooling and servicing agreement is expected to govern the servicing of the related whole loan; however, if the closing date of the DBJPM 2017-C6 securitization transaction does not occur as scheduled, the Starwood Capital Group Hotel Portfolio whole loan will be serviced pursuant to the BANK 2017-BNK5 pooling and servicing agreement until the securitization of the related control note. |
| (3) | The Gateway Net Lease Portfolio lead securitizationpari passu companion loan is currently held by JP Morgan Chase Bank, N.A. and is expected to be contributed to the DBJPM 2017-C6 securitization transaction. The DBJPM 2017-C6 securitization transaction is expected to close on the closing date for this transaction and the related pooling and servicing agreement is expected to govern the servicing of the related whole loan; however, if the closing date of the DBJPM 2017-C6 securitization transaction does not occur as scheduled, the Gateway Net Lease Portfolio whole loan will be serviced pursuant to the BANK 2017-BNK5 pooling and servicing agreement until the securitization of the related control note. |
This is not a research report and was not prepared by any Underwriter’s research department. Please see additional important information and qualifications at the end of this Term Sheet.
| T-19 |
| BANK 2017-BNK5 | Characteristics of the Mortgage Loans |
| Mortgage Loans with Subordinate Debt(3) | |||||||||||
| Loan No. | Mortgage Loan Seller | Property Name | Mortgage Loan Cut-off Date Balance | Cut-off Date Balance per Unit/SF | Subordinate Debt Cut-off Date Balance | UW NCF DSCR | UW NOI Debt Yield | Cut-off Date LTV | Total Debt UW NCF DSCR(1) | Total Debt UW NOI Debt Yield(1) | Total Debt Cut-off Date LTV(1) |
| 1 | BANA/WFB | Del Amo Fashion Center | $90,000,000 | $259.56 | $125,700,000 | 3.34x | 12.9% | 39.8% | 2.63x | 10.1% | 50.6% |
| 5 | MSMCH | Olympic Tower | $56,000,000 | $1,162.99 | $149,000,000(2) | 2.70x | 11.2% | 32.2% | 1.55x | 6.8% | 52.6% |
| 9 | BANA | Gateway Net Lease Portfolio | $45,000,000 | $66.64 | $170,000,000 | 3.54x | 14.1% | 45.0% | 2.04x | 9.5% | 66.6% |
| (1) | Total Debt UW NCF DSCR, Total Debt UW NOI Debt Yield and Total Debt Cut-off Date LTV figures shown above are calculated based on any relatedpari passu notes and any related subordinate note(s) and the mezzanine debt. |
| (2) | Excludes $240,000,000 of mezzanine debt. |
| (3) | In addition, twenty five (25) of the mortgage loans, each of which is secured by a residential cooperative property, currently have in place Subordinate Coop LOCs that permit future advances. See “Description of the Mortgage Pool—Additional Indebtedness—Other Secured Indebtedness” and “Description of the Mortgage Pool—Additional Debt Financing for Mortgage Loans Secured by Residential Cooperatives” in the Preliminary Prospectus. |
| Mortgage Loans with Mezzanine Debt | |||||||||||
| Loan No. | Mortgage Loan Seller | Property Name | Mortgage Loan Cut-off Date Balance | Cut-off Date Balance per Unit/SF | Mezzanine Debt Cut-off Date Balance | UW NCF DSCR | UW NOI Debt Yield | Cut-off Date LTV | Total Debt UW NCF DSCR(1) | Total Debt UW NOI Debt Yield(1) | Total Debt Cut-off Date LTV(1) |
| 5 | MSMCH | Olympic Tower | $56,000,000 | $1,162.99 | $240,000,000 | 2.70x | 11.2% | 32.2% | 1.55x | 6.8% | 52.6% |
| (1) | Total Debt UW NCF DSCR, Total Debt UW NOI Debt Yield and Total Debt Cut-off Date LTV figures shown above are calculated based on any relatedpari passu notes, any related subordinate note(s) and the mezzanine debt. |
This is not a research report and was not prepared by any Underwriter’s research department. Please see additional important information and qualifications at the end of this Term Sheet.
| T-20 |
| BANK 2017-BNK5 | Characteristics of the Mortgage Loans |
| Prior Securitization History(1) | ||||||||||||||
| Loan No. | Mortgage Loan Seller | Property Name | City | State | Property Type | Cut-off Date Balance | % of Pool | SF/Units | Cut-off Date Balance per SF/Unit | UW NCF DSCR(3) | UW NOI Debt Yield(3) | Cut-off Date LTV(3) | Maturity Date LTV(3) | Prior Securitization |
| 2 | BANA | Starwood Capital Group Hotel Portfolio | Various | Various | Hospitality | $72,500,000 | 5.9% | 6,366 | $90,680.18 | 2.72x | 12.4% | 60.4% | 60.4% | (2) |
| 4 | MSMCH/WFB | Market Street - The Woodlands | The Woodlands | TX | Retail | $65,000,000 | 5.3% | 492,082 | $355.63 | 2.04x | 9.1% | 53.6% | 53.6% | COMM 2007-C9 |
| 7 | BANA | 270 Corporate Center | Germantown | MD | Office | $52,500,000 | 4.3% | 449,443 | $116.81 | 1.61x | 11.5% | 73.4% | 71.4% | LBUBS 2005-C5 |
| 11.04 | WFB | Stor-It Downey | Downey | CA | Self Storage | $4,427,000 | 0.4% | 66,962 | $92.88 | 4.32x | 18.3% | 33.3% | 33.3% | BSCMS-2007-PW18 |
| 13 | WFB | Charlotte Southpark Marriott | Charlotte | NC | Hospitality | $24,942,077 | 2.0% | 199 | $125,337.07 | 1.95x | 14.8% | 53.5% | 44.1% | BSCMS 2007-PW15 |
| 14 | BANA | 36 East 14th Street | New York | NY | Retail | $23,000,000 | 1.9% | 5,066 | $4,540.07 | 1.58x | 7.1% | 56.5% | 56.5% | MSC 2007-IQ16 |
| 15 | WFB | Capital Bank Plaza | Raleigh | NC | Office | $23,000,000 | 1.9% | 148,142 | $155.26 | 1.48x | 10.1% | 71.9% | 61.8% | CMLT 2008-LS1 |
| 18 | BANA | Crossgates Commons | Albany | NY | Retail | $19,976,914 | 1.6% | 437,286 | $74.24 | 1.66x | 11.4% | 58.2% | 53.6% | COMM 2005-FL11 |
| 20 | WFB | Jacksonville Hilton Hotels | Jacksonville | FL | Hospitality | $17,943,307 | 1.5% | 221 | $81,191.43 | 1.92x | 14.8% | 71.8% | 66.8% | RSO 2014-CRE2 |
| 22 | WFB | Park Oaks Shopping Center | San Antonio | TX | Retail | $16,580,743 | 1.3% | 184,238 | $90.00 | 1.46x | 9.9% | 69.7% | 56.8% | JPMCC 2007-LD11 |
| 26 | WFB | Lawndale Plaza | Lawndale | CA | Retail | $15,085,000 | 1.2% | 84,141 | $179.28 | 2.09x | 10.2% | 52.6% | 52.6% | LBUBS 2007-C2 |
| 28 | WFB | Comfort Inn Hotel Circle | San Diego | CA | Hospitality | $14,500,000 | 1.2% | 199 | $72,864.32 | 2.31x | 18.1% | 54.9% | 48.9% | JPMCC 2007-LD12 |
| 36 | WFB | Stor-It Costa Mesa & Long Beach | Various | CA | Self Storage | $9,750,000 | 0.8% | 146,571 | $66.52 | 4.68x | 19.8% | 29.6% | 29.6% | BSCMS -2007-PW18 |
| 38 | NCB | Bywater Mutual Homes, Inc. | Annapolis | MD | Multifamily | $8,447,171 | 0.7% | 304 | $27,786.75 | 4.12x | 27.9% | 22.2% | 18.3% | MSC 2007-IQ13 |
| 40 | BANA | Oceanside Self Storage | Oceanside | CA | Self Storage | $6,250,000 | 0.5% | 418 | $14,952.15 | 1.44x | 9.1% | 60.7% | 55.9% | MSC 2007-IQ16 |
| 41 | MSMCH | West Bench Plaza | Magna | UT | Retail | $6,150,000 | 0.5% | 46,357 | $132.67 | 1.44x | 10.0% | 69.3% | 58.3% | CGCMT 2007-C6 |
| 44 | WFB | Shasta Executive Plaza | Redding | CA | Office | $5,675,000 | 0.5% | 56,937 | $99.67 | 1.97x | 13.1% | 57.9% | 49.5% | BSCMS 2007-PW16 |
| 52 | WFB | Pleasant Hill Station | Duluth | GA | Retail | $4,983,760 | 0.4% | 24,500 | $203.42 | 1.57x | 10.5% | 69.9% | 58.1% | CSMC 2007-C4 |
| 70 | BANA | 149 Spring Street | New York | NY | Mixed Use | $2,500,000 | 0.2% | 17,600 | $142.05 | 5.99x | 25.8% | 10.4% | 10.4% | COMM 2007-C9 |
| 72 | NCB | 52 Riverside Drive Owners Corp. | New York | NY | Multifamily | $2,494,446 | 0.2% | 42 | $59,391.56 | 18.34x | 95.1% | 3.8% | 3.4% | CSFB 2005-C3 |
| Total | $395,705,417 | 32.1% | ||||||||||||
| (1) | Includes mortgage loans for which all or a portion of the previously existing debt was most recently securitized in conduit securitizations, based on information provided by the related borrower or obtained through searches of a third-party database. The information has not otherwise been confirmed by the mortgage loan sellers. With respect to any mortgage loan that is part of a whole loan, unless otherwise indicated, all LTV, DSCR, Debt Yield and Cut-off Date Balance per SF/Unit calculations include any relatedpari passu companion loans and exclude any related subordinate companion loans, as applicable. |
| (2) | The outstanding debt of the portfolio is primarily securitized in the following: WFRBS 2012-C10, WFCM 2012-LC5, GSMS 2012-GCJ9, WFRBS 2013-C11 and COMM 2013-CRE6. |
| (3) | For mortgaged properties securing residential cooperative mortgage loans, the UW NCF DSCR and UW NOI Debt Yield for each such mortgaged property is calculated using underwritten net operating income or underwritten net cash flow, as applicable, for the related residential cooperative property which is the projected net operating income or net cash flow, as applicable, reflected in the most recent appraisal obtained by or otherwise in the possession of the related mortgage loan seller as of the Cut-off Date. LTV calculations are based upon the appraised value of the residential cooperative property determined as if such residential cooperative property is operated as a residential cooperative, inclusive of the amount of the underlying debt encumbering such residential cooperative property with the exception of Bywater Mutual Homes, Inc. In the case of the residential cooperative property securing the Bywater Mutual Homes, Inc. mortgage loan the LTV calculations for such mortgage loan are determined as if such residential cooperative property is operated as a market rate multifamily rental property. The UW NCF DSCR, UW NOI Debt Yield and LTV calculations do not take into account any subordinate debt (whether or not secured by the related mortgaged property), that currently exists or is allowed under the terms of any mortgage loan. |
This is not a research report and was not prepared by any Underwriter’s research department. Please see additional important information and qualifications at the end of this Term Sheet.
| T-21 |
| BANK 2017-BNK5 | Characteristics of the Mortgage Loans |
Mortgage Loans with Scheduled Balloon Payments and Related Classes(1)
| Class A-2 ($98,300,000) | ||||||||||||||||||||||
| Loan No. | Mortgage Loan Seller | Property Name | State | Property Type | Cut-off Date Balance | % of Pool | Maturity Date Balance | % of Class A-2 Certificate Principal Balance | SF/ Units | Cut-off Date Balance per SF/Unit(2) | UW NCF DSCR(2) | UW NOI Debt Yield(2) | Cut-off Date LTV(2) | Maturity Date LTV(2)) | Rem. IO Period (mos.) | Rem. Term to Maturity (mos.) | ||||||
| 7 | BANA | 270 Corporate Center | MD | Office | $52,500,000 | 4.3% | $51,025,572 | 51.9% | 449,443 | $116.81 | 1.61x | 11.5% | 73.4% | 71.4% | 36 | 60 | ||||||
| 18 | BANA | Crossgates Commons | NY | Retail | $19,976,914 | 1.6% | $18,375,631 | 18.7% | 437,286 | $74.24 | 1.66x | 11.4% | 58.2% | 53.6% | 0 | 59 | ||||||
| 20 | WFB | Jacksonville Hilton Hotels | FL | Hospitality | $17,943,307 | 1.5% | $16,699,143 | 17.0% | 221 | $81,191.43 | 1.92x | 14.8% | 71.8% | 66.8% | 0 | 57 | ||||||
| 28 | WFB | Comfort Inn Hotel Circle | CA | Hospitality | $14,500,000 | 1.2% | $12,899,602 | 13.1% | 199 | $72,864.32 | 2.31x | 18.1% | 54.9% | 48.9% | 0 | 60 | ||||||
| 75 | WFB | Budget Self Storage of Mesa | AZ | Self Storage | $1,993,960 | 0.2% | $1,795,090 | 1.8% | 66,275 | $30.09 | 1.66x | 12.7% | 48.8% | 43.9% | 0 | 58 | ||||||
| Total/Wtd. Avg. | $106,914,181 | 8.7% | $100,795,038 | 102.5% | 1.77x | 13.0% | 67.3% | 63.7% | 18 | 59 | ||||||||||||
| (1) | The table above reflects the mortgage loans whose balloon payments will be applied to pay down the Class A-2 certificates, assuming (i) that none of the mortgage loans experience prepayments, defaults or losses; (ii) there are no extensions of maturity dates; and (iii) each mortgage loan is paid in full on its stated maturity date or, in the case of any mortgage loan with an anticipated repayment date, on such anticipated repayment date. The table above is otherwise based on the Structuring Assumptions set forth under “Yield and Maturity Considerations—Weighted Average Life” in the Preliminary Prospectus. |
| (2) | With respect to any mortgage loan that is part of a whole loan, unless otherwise indicated, all LTV, DSCR, Debt Yield and Cut-off Date Balance per SF/Unit calculations include any relatedpari passu companion loans and exclude any related subordinate companion loans, as applicable. |
This is not a research report and was not prepared by any Underwriter’s research department. Please see additional important information and qualifications at the end of this Term Sheet.
| T-22 |
| BANK 2017-BNK5 | Characteristics of the Mortgage Loans |
Mortgage Loans with Scheduled Balloon Payments and Related Classes(1)
| Class A-3 ($52,700,000) | ||||||||||||||||||||
| Loan No. | Mortgage Loan Seller | Property Name | State | Property Type | Cut-off Date Balance | % of Pool | Maturity Date Balance | % of Class A-3 Certificate Principal Balance | SF/ Units | Cut-off Date Balance per SF/Unit | UW NCF DSCR(2) | UW NOI Debt Yield(2) | Cut-off Date LTV(2) | Maturity Date LTV(2) | Rem. IO Period (mos.) | Rem. Term to Maturity (mos.) | ||||
| 9 | BANA | Gateway Net Lease Portfolio | Various | Industrial/Office | $45,000,000 | 3.7% | $45,000,000 | 85.4% | 5,296,943 | $66.64 | 3.54x | 14.1% | 45.0% | 45.0% | 84 | 84 | ||||
| 32 | BANA | Temescal Village Plaza | CA | Retail | $11,000,000 | 0.9% | $10,505,494 | 19.9% | 117,670 | $93.48 | 1.52x | 10.3% | 64.7% | 61.8% | 47 | 83 | ||||
| Total/Wtd. Avg. | $56,000,000 | 4.5% | $55,505,494 | 105.3% | 3.14x | 13.4% | 48.9% | 48.3% | 77 | 84 | ||||||||||
| (1) | The table above reflects the mortgage loans whose balloon payments will be applied to pay down the Class A-3 certificates, assuming (i) that none of the mortgage loans experience prepayments, defaults or losses; (ii) there are no extensions of maturity dates; and (iii) each mortgage loan is paid in full on its stated maturity date or, in the case of any mortgage loan with an anticipated repayment date, on such anticipated repayment date. The table above is otherwise based on the Structuring Assumptions set forth under “Yield and Maturity Considerations—Weighted Average Life” in the Preliminary Prospectus. |
| (2) | With respect to any mortgage loan that is part of a whole loan, unless otherwise indicated, all LTV, DSCR, Debt Yield and Cut-off Date Balance per SF/Unit calculations include any relatedpari passu companion loans and exclude any related subordinate companion loans, as applicable. |
This is not a research report and was not prepared by any Underwriter’s research department. Please see additional important information and qualifications at the end of this Term Sheet.
| T-23 |
| BANK 2017-BNK5 | Characteristics of the Mortgage Loans |
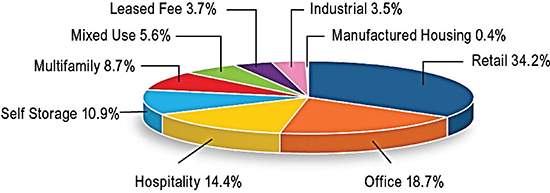
| Property Type Distribution(1) | ||||||||||||||||
| Property Type | Number of Mortgaged Properties | Aggregate Cut-off Date Balance | % of Pool | Wtd. Avg. Mortgage Rate | Wtd. Avg. UW NCF DSCR | Wtd. Avg. UW NOI Debt Yield | Wtd. Avg. Cut-off Date LTV | Wtd. Avg. Maturity Date LTV | ||||||||
| Retail | 22 | $420,638,564 | 34.2% | 4.1874% | 2.08x | 10.4% | 53.8% | 49.8% | ||||||||
| Anchored | 7 | $148,141,361 | 12.0% | 4.2501% | 1.66x | 9.9% | 57.8% | 51.3% | ||||||||
| Super Regional Mall | 1 | $90,000,000 | 7.3% | 3.6575% | 3.34x | 12.9% | 39.8% | 39.8% | ||||||||
| Lifestyle Center | 1 | $65,000,000 | 5.3% | 4.0850% | 2.04x | 9.1% | 53.6% | 53.6% | ||||||||
| Unanchored | 5 | $32,375,051 | 2.6% | 4.4797% | 1.86x | 9.9% | 55.0% | 49.1% | ||||||||
| Shadow Anchored | 5 | $28,841,894 | 2.3% | 4.6845% | 1.53x | 10.3% | 66.2% | 58.3% | ||||||||
| Single Tenant | 1 | $23,000,000 | 1.9% | 4.4200% | 1.58x | 7.1% | 56.5% | 56.5% | ||||||||
| Power Center | 1 | $19,976,914 | 1.6% | 4.6420% | 1.66x | 11.4% | 58.2% | 53.6% | ||||||||
| Movie Theater | 1 | $13,303,344 | 1.1% | 4.7000% | 1.72x | 12.6% | 62.8% | 46.7% | ||||||||
| Office | 23 | $230,792,017 | 18.7% | 4.3678% | 1.74x | 11.4% | 65.7% | 59.2% | ||||||||
| Suburban | 14 | $137,327,868 | 11.2% | 4.4763% | 1.80x | 12.0% | 66.1% | 61.0% | ||||||||
| CBD | 2 | $90,500,000 | 7.4% | 4.2295% | 1.60x | 10.4% | 65.7% | 56.9% | ||||||||
| Medical | 7 | $2,964,149 | 0.2% | 3.5628% | 3.54x | 14.1% | 45.0% | 45.0% | ||||||||
| Hospitality | 70 | $177,022,207 | 14.4% | 4.7097% | 2.34x | 14.3% | 62.2% | 56.6% | ||||||||
| Full Service | 7 | $93,652,077 | 7.6% | 4.8509% | 2.06x | 15.1% | 64.6% | 54.9% | ||||||||
| Limited Service | 41 | $47,336,737 | 3.8% | 4.6006% | 2.59x | 14.1% | 58.7% | 56.9% | ||||||||
| Extended Stay | 22 | $36,033,393 | 2.9% | 4.4860% | 2.72x | 12.4% | 60.4% | 60.4% | ||||||||
| Self Storage | 23 | $134,118,768 | 10.9% | 4.3639% | 2.67x | 12.9% | 50.9% | 46.5% | ||||||||
| Self Storage | 23 | $134,118,768 | 10.9% | 4.3639% | 2.67x | 12.9% | 50.9% | 46.5% | ||||||||
| Multifamily | 29 | $106,795,798 | 8.7% | 4.1133% | 6.47x | 35.6% | 25.2% | 21.6% | ||||||||
| Cooperative | 28 | $89,995,798 | 7.3% | 4.0038% | 7.44x | 40.7% | 17.5% | 14.2% | ||||||||
| Garden | 1 | $16,800,000 | 1.4% | 4.7000% | 1.27x | 8.3% | 66.4% | 61.1% | ||||||||
| Mixed Use | 3 | $68,688,028 | 5.6% | 4.1023% | 2.63x | 11.6% | 34.0% | 32.7% | ||||||||
| Office/Retail | 1 | $56,000,000 | 4.5% | 3.9539% | 2.70x | 11.2% | 32.2% | 32.2% | ||||||||
| Retail/Office/Multifamily | 1 | $10,188,028 | 0.8% | 4.8900% | 1.41x | 10.0% | 49.8% | 41.1% | ||||||||
| Multifamily/Retail | 1 | $2,500,000 | 0.2% | 4.2140% | 5.99x | 25.8% | 10.4% | 10.4% | ||||||||
| Leased Fee | 12 | $45,400,000 | 3.7% | 3.7950% | 2.12x | 8.2% | 65.6% | 65.6% | ||||||||
| Leased Fee | 12 | $45,400,000 | 3.7% | 3.7950% | 2.12x | 8.2% | 65.6% | 65.6% | ||||||||
| Industrial | 28 | $43,332,983 | 3.5% | 3.8879% | 2.99x | 13.4% | 49.7% | 47.2% | ||||||||
| Warehouse Distribution | 16 | $18,011,185 | 1.5% | 3.5628% | 3.54x | 14.1% | 45.0% | 45.0% | ||||||||
| Flex | 7 | $16,073,136 | 1.3% | 4.4392% | 2.07x | 12.1% | 57.7% | 51.1% | ||||||||
| Manufacturing | 5 | $9,248,662 | 0.8% | 3.5628% | 3.54x | 14.1% | 45.0% | 45.0% | ||||||||
| Manufactured Housing | 1 | $4,500,000 | 0.4% | 4.1500% | 4.12x | 17.6% | 29.2% | 29.2% | ||||||||
| Manufactured Housing | 1 | $4,500,000 | 0.4% | 4.1500% | 4.12x | 17.6% | 29.2% | 29.2% | ||||||||
| Total/Wtd. Avg. | 211 | $1,231,288,365 | 100.0% | 4.2792% | 2.57x | 13.7% | 53.5% | 49.2% | ||||||||
| (1) | All numerical information concerning the mortgage loans is approximate and, in the case of mortgage loans secured by multiple properties, is based on allocated loan amounts with respect to such properties. All weighted average information regarding the mortgage loans reflects the weighting of the mortgage loans based on their outstanding principal balances as of the Cut-off Date or, in the case of mortgage loans secured by multiple properties, allocated loan amounts. The sum of numbers and percentages in columns may not match the “Total” due to rounding. With respect to any mortgage loan that is part of a whole loan, unless otherwise indicated, all LTV, DSCR and Debt Yield calculations include any relatedpari passu companion loans and exclude any related subordinate companion loans, as applicable. For mortgaged properties securing residential cooperative mortgage loans, the UW NCF DSCR and UW NOI Debt Yield for each such mortgaged property is calculated using underwritten net operating income or underwritten net cash flow, as applicable, for the related residential cooperative property which is the projected net operating income or net cash flow, as applicable, reflected in the most recent appraisal obtained by or otherwise in the possession of the related mortgage loan seller as of the Cut-off Date. LTV calculations are based upon the appraised value of the residential cooperative property determined as if such residential cooperative property is operated as a residential cooperative, inclusive of the amount of the underlying debt encumbering such residential cooperative property with the exception of Bywater Mutual Homes, Inc. In the case of the residential cooperative property securing the Bywater Mutual Homes, Inc. mortgage loan the LTV calculations for such mortgage loan are determined as if such residential cooperative property is operated as a market rate multifamily rental property. The UW NCF DSCR, UW NOI Debt Yield and LTV calculations do not take into account any subordinate debt (whether or not secured by the related mortgaged property), that currently exists or is allowed under the terms of any mortgage loan. |
This is not a research report and was not prepared by any Underwriter’s research department. Please see additional important information and qualifications at the end of this Term Sheet.
| T-24 |
| BANK 2017-BNK5 | Characteristics of the Mortgage Loans |

| Geographic Distribution(1) | ||||||||||||||||
| State or Other Jurisdiction | Number of Mortgaged Properties | Aggregate Cut-off Date Balance | % of Pool | Wtd. Avg. Mortgage Rate | Wtd. Avg. UW NCF DSCR | Wtd. Avg. UW NOI Debt Yield | Wtd. Avg. Cut-off Date LTV | Wtd. Avg. Maturity Date LTV | ||||||||
| California | 35 | $385,647,362 | 31.3% | 4.1724% | 2.46x | 12.3% | 51.0% | 47.5% | ||||||||
| California – Southern(2) | 19 | $270,176,800 | 21.9% | 4.1223% | 2.75x | 13.2% | 49.0% | 46.5% | ||||||||
| California – Northern(2) | 16 | $115,470,562 | 9.4% | 4.2899% | 1.79x | 10.4% | 55.6% | 49.8% | ||||||||
| New York | 33 | $266,525,541 | 21.6% | 4.0662% | 3.81x | 20.1% | 40.2% | 36.7% | ||||||||
| Texas | 38 | $147,447,172 | 12.0% | 4.2975% | 2.01x | 10.1% | 59.1% | 55.2% | ||||||||
| Maryland | 5 | $66,080,939 | 5.4% | 4.8317% | 2.05x | 13.7% | 65.2% | 63.1% | ||||||||
| North Carolina | 5 | $54,268,128 | 4.4% | 4.7352% | 1.76x | 12.4% | 62.4% | 52.7% | ||||||||
| Missouri | 5 | $31,124,952 | 2.5% | 4.4807% | 1.71x | 9.2% | 63.8% | 60.9% | ||||||||
| Virginia | 5 | $30,013,902 | 2.4% | 4.4233% | 2.33x | 14.8% | 63.0% | 52.7% | ||||||||
| Connecticut | 3 | $26,808,377 | 2.2% | 4.0545% | 1.94x | 10.9% | 61.4% | 50.7% | ||||||||
| Minnesota | 6 | $25,792,729 | 2.1% | 4.7765% | 2.22x | 15.7% | 68.9% | 58.3% | ||||||||
| Alabama | 3 | $20,322,467 | 1.7% | 4.3362% | 1.65x | 10.7% | 65.3% | 57.4% | ||||||||
| Florida | 5 | $20,155,448 | 1.6% | 5.0826% | 2.10x | 14.7% | 68.9% | 64.4% | ||||||||
| Utah | 2 | $17,212,400 | 1.4% | 4.1612% | 1.88x | 8.8% | 66.9% | 63.0% | ||||||||
| Illinois | 5 | $16,929,454 | 1.4% | 4.6998% | 1.86x | 11.7% | 55.3% | 47.1% | ||||||||
| Washington | 4 | $16,417,303 | 1.3% | 4.0572% | 2.81x | 11.8% | 54.4% | 54.4% | ||||||||
| Tennessee | 4 | $16,329,808 | 1.3% | 4.3400% | 1.94x | 11.9% | 51.7% | 41.7% | ||||||||
| Michigan | 7 | $14,994,739 | 1.2% | 3.8949% | 2.73x | 11.2% | 57.7% | 57.7% | ||||||||
| Colorado | 3 | $14,320,800 | 1.2% | 4.0024% | 2.48x | 10.3% | 58.0% | 58.0% | ||||||||
| Indiana | 7 | $11,377,982 | 0.9% | 3.9773% | 3.17x | 13.3% | 51.9% | 51.9% | ||||||||
| Arizona | 4 | $10,518,676 | 0.9% | 4.6599% | 2.22x | 12.2% | 56.3% | 53.0% | ||||||||
| South Carolina | 3 | $7,603,844 | 0.6% | 4.6141% | 1.58x | 10.0% | 70.6% | 58.2% | ||||||||
| Ohio | 6 | $6,708,770 | 0.5% | 4.3456% | 2.61x | 13.5% | 51.5% | 47.1% | ||||||||
| Georgia | 2 | $6,499,160 | 0.5% | 4.8187% | 1.70x | 10.0% | 68.9% | 59.8% | ||||||||
| Oklahoma | 4 | $4,521,628 | 0.4% | 4.5657% | 1.84x | 10.1% | 69.3% | 60.7% | ||||||||
| Wisconsin | 5 | $4,085,779 | 0.3% | 3.7544% | 3.15x | 12.8% | 51.2% | 51.2% | ||||||||
| Pennsylvania | 4 | $3,087,602 | 0.3% | 4.2774% | 2.91x | 12.8% | 56.9% | 56.9% | ||||||||
| Oregon | 1 | $1,658,900 | 0.1% | 4.4860% | 2.72x | 12.4% | 60.4% | 60.4% | ||||||||
| Kentucky | 1 | $1,355,042 | 0.1% | 4.4860% | 2.72x | 12.4% | 60.4% | 60.4% | ||||||||
| New Jersey | 1 | $1,330,405 | 0.1% | 4.4860% | 2.72x | 12.4% | 60.4% | 60.4% | ||||||||
| Wyoming | 1 | $771,963 | 0.1% | 4.4860% | 2.72x | 12.4% | 60.4% | 60.4% | ||||||||
| Nevada | 1 | $424,187 | 0.0% | 3.5628% | 3.54x | 14.1% | 45.0% | 45.0% | ||||||||
| Iowa | 1 | $378,585 | 0.0% | 3.5628% | 3.54x | 14.1% | 45.0% | 45.0% | ||||||||
| Louisiana | 1 | $312,333 | 0.0% | 3.5628% | 3.54x | 14.1% | 45.0% | 45.0% | ||||||||
| Arkansas | 1 | $261,988 | 0.0% | 4.4860% | 2.72x | 12.4% | 60.4% | 60.4% | ||||||||
| Total: | 211 | $1,231,288,365 | 100.0% | 4.2792% | 2.57x | 13.7% | 53.5% | 49.2% | ||||||||
| (1) | All numerical information concerning the mortgage loans is approximate and, in the case of mortgage loans secured by multiple properties, is based on allocated loan amounts with respect to such properties. All weighted average information regarding the mortgage loans reflects the weighting of the mortgage loans based on their outstanding principal balances as of the Cut-off Date or, in the case of mortgage loans secured by multiple properties, allocated loan amounts. The sum of numbers and percentages in columns may not match the “Total” due to rounding. With respect to any mortgage loan that is part of a whole loan, unless otherwise indicated, all LTV, DSCR and Debt Yield calculations include any relatedpari passu companion loans and exclude any related subordinate companion loans, as applicable. For mortgaged properties securing residential cooperative mortgage loans, the UW NCF DSCR and UW NOI Debt Yield for each such mortgaged property is calculated using underwritten net operating income or underwritten net cash flow, as applicable, for the related residential cooperative property which is the projected net operating income or net cash flow, as applicable, reflected in the most recent appraisal obtained by or otherwise in the possession of the related mortgage loan seller as of the Cut-off Date. LTV calculations are based upon the appraised value of the residential cooperative property determined as if such residential cooperative property is operated as a residential cooperative, inclusive of the amount of the underlying debt encumbering such residential cooperative property with the exception of Bywater Mutual Homes, Inc. In the case of the residential cooperative property securing the Bywater Mutual Homes, Inc. mortgage loan the LTV calculations for such mortgage loan are determined as if such residential cooperative property is operated as a market rate multifamily rental property. The UW NCF DSCR, UW NOI Debt Yield and LTV calculations do not take into account any subordinate debt (whether or not secured by the related mortgaged property), that currently exists or is allowed under the terms of any mortgage loan. |
| (2) | “California – Northern” includes zip codes above 93600, and “California – Southern” includes zip codes at or below 93600. |
This is not a research report and was not prepared by any Underwriter’s research department. Please see additional important information and qualifications at the end of this Term Sheet.
| T-25 |
| BANK 2017-BNK5 | Collateral Statistics |
Collateral Statistics(1)
Cut-off Date Balance ($)
| No. of Mortgage Loans | Aggregate Cut-off Date Balance ($) | % of Pool | |
| 798,968 - 5,000,000 | 38 | $109,179,096 | 8.9 |
| 5,000,001 - 10,000,000 | 14 | $90,752,189 | 7.4 |
| 10,000,001 - 15,000,000 | 9 | $111,012,408 | 9.0 |
| 15,000,001 - 25,000,000 | 14 | $268,358,651 | 21.8 |
| 25,000,001 - 35,000,000 | 2 | $58,586,021 | 4.8 |
| 35,000,001 - 45,000,000 | 2 | $88,500,000 | 7.2 |
| 45,000,001 - 90,000,000 | 8 | $504,900,000 | 41.0 |
| Total: | 87 | $1,231,288,365 | 100.0% |
Min: $798,968 Max: $90,000,000 Avg: $14,152,740 | |||
State or Other Jurisdiction(2)
| No. of Mortgaged Properties | Aggregate Cut-off Date Balance ($) | % of Pool | |
| California | 35 | $385,647,362 | 31.3 |
| California – Southern(3) | 19 | $270,176,800 | 21.9 |
| California – Northern(3) | 16 | $115,470,562 | 9.4 |
| New York | 33 | $266,525,541 | 21.6 |
| Texas | 38 | $147,447,172 | 12.0 |
| Maryland | 5 | $66,080,939 | 5.4 |
| North Carolina | 5 | $54,268,128 | 4.4 |
| Missouri | 5 | $31,124,952 | 2.5 |
| Virginia | 5 | $30,013,902 | 2.4 |
| Connecticut | 3 | $26,808,377 | 2.2 |
| Minnesota | 6 | $25,792,729 | 2.1 |
| Alabama | 3 | $20,322,467 | 1.7 |
| Florida | 5 | $20,155,448 | 1.6 |
| Utah | 2 | $17,212,400 | 1.4 |
| Illinois | 5 | $16,929,454 | 1.4 |
| Washington | 4 | $16,417,303 | 1.3 |
| Tennessee | 4 | $16,329,808 | 1.3 |
| Michigan | 7 | $14,994,739 | 1.2 |
| Colorado | 3 | $14,320,800 | 1.2 |
| Indiana | 7 | $11,377,982 | 0.9 |
| Arizona | 4 | $10,518,676 | 0.9 |
| South Carolina | 3 | $7,603,844 | 0.6 |
| Ohio | 6 | $6,708,770 | 0.5 |
| Georgia | 2 | $6,499,160 | 0.5 |
| Oklahoma | 4 | $4,521,628 | 0.4 |
| Wisconsin | 5 | $4,085,779 | 0.3 |
| Pennsylvania | 4 | $3,087,602 | 0.3 |
| Oregon | 1 | $1,658,900 | 0.1 |
| Kentucky | 1 | $1,355,042 | 0.1 |
| New Jersey | 1 | $1,330,405 | 0.1 |
| Wyoming | 1 | $771,963 | 0.1 |
| Nevada | 1 | $424,187 | 0.0 |
| Iowa | 1 | $378,585 | 0.0 |
| Louisiana | 1 | $312,333 | 0.0 |
| Arkansas | 1 | $261,988 | 0.0 |
| Total. | 211 | $1,231,288,365 | 100.0% |
Property Type(2)
| No. of Mortgaged Properties | Aggregate Cut-off Date Balance ($) | % of Pool | |
| Retail | 22 | $420,638,564 | 34.2 |
| Anchored | 7 | $148,141,361 | 12.0 |
| Super Regional Mall | 1 | $90,000,000 | 7.3 |
| Lifestyle Center | 1 | $65,000,000 | 5.3 |
| Unanchored | 5 | $32,375,051 | 2.6 |
| Shadow Anchored | 5 | $28,841,894 | 2.3 |
| Single Tenant | 1 | $23,000,000 | 1.9 |
| Power Center | 1 | $19,976,914 | 1.6 |
| Movie Theater | 1 | $13,303,344 | 1.1 |
| Office | 23 | $230,792,017 | 18.7 |
| Suburban | 14 | $137,327,868 | 11.2 |
| CBD | 2 | $90,500,000 | 7.4 |
| Medical | 7 | $2,964,149 | 0.2 |
| Hospitality | 70 | $177,022,207 | 14.4 |
| Full Service | 7 | $93,652,077 | 7.6 |
| Limited Service | 41 | $47,336,737 | 3.8 |
| Extended Stay | 22 | $36,033,393 | 2.9 |
| Self Storage | 23 | $134,118,768 | 10.9 |
| Self Storage | 23 | $134,118,768 | 10.9 |
| Multifamily | 29 | $106,795,798 | 8.7 |
| Cooperative | 28 | $89,995,798 | 7.3 |
| Garden | 1 | $16,800,000 | 1.4 |
| Mixed Use | 3 | $68,688,028 | 5.6 |
| Office/Retail | 1 | $56,000,000 | 4.5 |
| Retail/Office/Multifamily | 1 | $10,188,028 | 0.8 |
| Multifamily/Retail | 1 | $2,500,000 | 0.2 |
| Leased Fee | 12 | $45,400,000 | 3.7 |
| Leased Fee | 12 | $45,400,000 | 3.7 |
| Industrial | 28 | $43,332,983 | 3.5 |
| Warehouse Distribution | 16 | $18,011,185 | 1.5 |
| Flex | 7 | $16,073,136 | 1.3 |
| Manufacturing | 5 | $9,248,662 | 0.8 |
| Manufactured Housing | 1 | $4,500,000 | 0.4 |
| Manufactured Housing | 1 | $4,500,000 | 0.4 |
| Total | 211 | $1,231,288,365 | 100.0% |
Mortgage Rate (%)
| No. of Mortgage Loans | Aggregate Cut-off Date Balance ($) | % of Pool | |
| 3.56283 - 4.49990 | 56 | 876,710,180 | 71.2 |
| 4.50000 - 4.99990 | 27 | 324,907,158 | 26.4 |
| 5.00000 - 5.40000 | 4 | 29,671,027 | 2.4 |
| Total: | 87 | $1,231,288,365 | 100.0% |
| Min: 3.56283% Max: 5.40000% Wtd Avg: 4.27920% | |||
Original Term to Maturity or ARD (mos.)
| No. of Mortgage Loans | Aggregate Cut-off Date Balance ($) | % of Pool | |
| 60 - 60 | 5 | 106,914,181 | 8.7 |
| 84 - 84 | 2 | 56,000,000 | 4.5 |
| 120 - 120 | 79 | 1,000,874,184 | 81.3 |
| 121 - 121 | 1 | 67,500,000 | 5.5 |
| Total: | 87 | $1,231,288,365 | 100.0% |
| Min: 60 mos. Max: 121 mos. Wtd Avg: 113 mos. | |||
Remaining Term to Maturity or ARD (mos.)
| No. of Mortgage Loans | Aggregate Cut-off Date Balance ($) | % of Pool | |
| 57 - 60 | 5 | 106,914,181 | 8.7 |
| 82 - 84 | 2 | 56,000,000 | 4.5 |
| 113 - 116 | 2 | 15,188,028 | 1.2 |
| 117 - 121 | 78 | 1,053,186,155 | 85.5 |
| Total: | 87 | $1,231,288,365 | 100.0% |
| Min: 57 mos. Max: 121 mos. Wtd Avg: 112 mos. | |||
Original Amortization Term (mos.)
| No. of Mortgage Loans | Aggregate Cut-off Date Balance ($) | % of Pool | |
| Interest Only | 18 | 518,085,000 | 42.1 |
| 120 | 1 | 5,100,000 | 0.4 |
| 300 | 5 | 46,363,446 | 3.8 |
| 360 | 55 | 637,288,115 | 51.8 |
| 480 | 8 | 24,451,804 | 2.0 |
| Total: | 87 | $1,231,288,365 | 100.0% |
| Min: 120 mos. Max: 480 mos. Wtd Avg: 358 mos. | |||
Remaining Amortization Term (mos.)
| No. of Mortgage Loans | Aggregate Cut-off Date Balance ($) | % of Pool | |
| Interest Only | 18 | 518,085,000 | 42.1 |
| 120 - 300 | 6 | 51,463,446 | 4.2 |
| 301 - 480 | 63 | 661,739,919 | 53.7 |
| Total: | 87 | $1,231,288,365 | 100.0% |
| Min: 120 mos. Max: 480 mos. Wtd Avg: 358 mos. | |||
Mortgage Loan Sellers
| No. of Mortgage Loans | Aggregate Cut-off Date Balance ($) | % of Pool | |
| WFB | 28 | 428,853,759 | 34.8 |
| BANA | 20 | 355,638,808 | 28.9 |
| MSMCH | 9 | 201,800,000 | 16.4 |
| BANA/WFB | 1 | 90,000,000 | 7.3 |
| NCB | 28 | 89,995,798 | 7.3 |
| MSMCH/WFB | 1 | 65,000,000 | 5.3 |
| Total: | 87 | $1,231,288,365 | 100.0% |
Amortization Type
| No. of Mortgage Loans | Aggregate Cut-off Date Balance ($) | % of Pool | |
| Interest Only | 17 | 472,685,000 | 38.4 |
| Amortizing Balloon | 50 | 359,003,365 | 29.2 |
| Partial Interest Only | 18 | 298,200,000 | 24.2 |
| Partial Interest Only ARD | 1 | 56,000,000 | 4.5 |
| Interest Only ARD | 1 | 45,400,000 | 3.7 |
| Total: | 87 | 1,231,288,365 | 100.0% |
Cut-off Date LTV Ratio (%)
| No. of Mortgage Loans | Aggregate Cut-off Date Balance ($) | % of Pool | |
| 1.6 - 50.0 | 40 | 371,474,130 | 30.2 |
| 50.1 - 55.0 | 9 | 208,481,885 | 16.9 |
| 55.1 - 60.0 | 9 | 91,801,914 | 7.5 |
| 60.1 - 65.0 | 11 | 256,039,364 | 20.8 |
| 65.1 – 74.0 | 18 | 303,491,072 | 24.6 |
| Total: | 87 | $1,231,288,365 | 100.0% |
| Min: 1.6% Max: 74.0% Wtd Avg: 53.5% | |||
Maturity Date or ARD LTV Ratio (%)
| No. of Mortgage Loans | Aggregate Cut-off Date Balance ($) | % of Pool | |
| 0.4 - 40.0 | 37 | 303,792,141 | 24.7 |
| 40.1 - 45.0 | 5 | 98,453,873 | 8.0 |
| 45.1 - 50.0 | 8 | 125,703,344 | 10.2 |
| 50.1 - 55.0 | 10 | 171,497,935 | 13.9 |
| 55.1 - 60.0 | 16 | 228,047,765 | 18.5 |
| 60.1 - 71.4 | 11 | 303,793,307 | 24.7 |
| Total: | 87 | $1,231,288,365 | 100.0% |
| Min: 0.4% Max: 71.4% Wtd Avg: 49.2% | |||
UW DSCR (x)
| No. of Mortgage Loans | Aggregate Cut-off Date Balance ($) | % of Pool | |
| 1.27 - 1.40 | 4 | 33,470,000 | 2.7 |
| 1.41 - 1.50 | 10 | 143,760,665 | 11.7 |
| 1.51 - 1.60 | 6 | 104,983,760 | 8.5 |
| 1.61 - 1.80 | 10 | 201,670,403 | 16.4 |
| 1.81 - 2.00 | 8 | 94,565,191 | 7.7 |
| 2.01 - 2.25 | 8 | 203,742,548 | 16.5 |
| 2.26 - 2.50 | 2 | 29,500,000 | 2.4 |
| 2.51 - 48.08 | 39 | 419,595,798 | 34.1 |
| Total: | 87 | $1,231,288,365 | 100.0% |
| Min: 1.27x Max: 48.08x Wtd Avg: 2.57x | |||
UW NOI Debt Yield (%)
| No. of Mortgage Loans | Aggregate Cut-off Date Balance ($) | % of Pool | |
| 7.1 - 8.9 | 9 | 184,370,000 | 15.0 |
| 9.0 - 9.9 | 9 | 173,922,636 | 14.1 |
| 10.0 - 10.9 | 12 | 191,927,354 | 15.6 |
| 11.0 - 11.9 | 10 | 190,682,340 | 15.5 |
| 12.0 - 12.9 | 5 | 182,922,304 | 14.9 |
| 13.0 - 13.9 | 2 | 10,225,000 | 0.8 |
| 14.0 - 14.9 | 4 | 90,506,109 | 7.4 |
| 15.0 - 15.9 | 1 | 25,336,021 | 2.1 |
| 16.0 - 195.8 | 35 | 181,396,601 | 14.7 |
| Total: | 87 | $1,231,288,365 | 100.0% |
| Min: 7.1% Max: 195.8% Wtd Avg: 13.7% | |||
This is not a research report and was not prepared by any Underwriter’s research department. Please see additional important information and qualifications at the end of this Term Sheet.
| T-26 |
| BANK 2017-BNK5 | Collateral Statistics |
| (1) | All numerical information concerning the mortgage loans is approximate. All weighted average information regarding the mortgage loans reflects the weighting of the mortgage loans based on their outstanding principal balances as of the Cut-off Date. The sum of numbers and percentages in columns may not match the “Total” due to rounding. With respect to any mortgage loan that is part of a whole loan, unless otherwise indicated, all LTV, DSCR and Debt Yield calculations include any relatedpari passu companion loans and exclude any related subordinate companion loans, as applicable. For mortgaged properties securing residential cooperative mortgage loans, the UW DSCR and UW NOI Debt Yield for each such mortgaged property is calculated using underwritten net operating income or underwritten net cash flow, as applicable, for the related residential cooperative property which is the projected net operating income or net cash flow, as applicable, reflected in the most recent appraisal obtained by or otherwise in the possession of the related mortgage loan seller as of the Cut-off Date. LTV Ratio calculations are based upon the appraised value of the residential cooperative property determined as if such residential cooperative property is operated as a residential cooperative, inclusive of the amount of the underlying debt encumbering such residential cooperative property In the case of the residential cooperative property with the exception of Bywater Mutual Homes, Inc. In the case of the residential cooperative property securing the Bywater Mutual Homes, Inc. mortgage loan the LTV calculations for such mortgage loan are determined as if such residential cooperative property is operated as a market rate multifamily rental property. The UW DSCR, UW NOI Debt Yield and LTV Ratio calculations do not take into account any subordinate debt (whether or not secured by the related mortgaged property), that currently exists or is allowed under the terms of any mortgage loan. |
| (2) | In the case of mortgage loans secured by multiple properties, cut-off date balance information is based on allocated loan amounts with respect to such properties. |
| (3) | “California – Northern” includes zip codes above 93600, and “California – Southern” includes zip codes at or below 93600. |
This is not a research report and was not prepared by any Underwriter’s research department. Please see additional important information and qualifications at the end of this Term Sheet.
| T-27 |
| BANK 2017-BNK5 | Del Amo Fashion Center |
Mortgage Loan No. 1 – Del Amo Fashion Center

This is not a research report and was not prepared by any Underwriter’s research department. Please see additional important information and qualifications at the end of this Term Sheet.
| T-28 |
| BANK 2017-BNK5 | Del Amo Fashion Center |
Mortgage Loan No. 1 – Del Amo Fashion Center
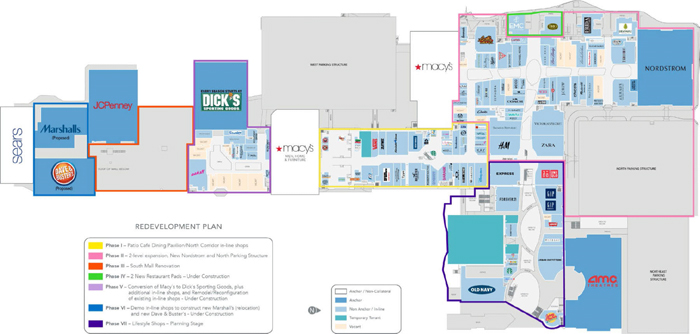
This is not a research report and was not prepared by any Underwriter’s research department. Please see additional important information and qualifications at the end of this Term Sheet.
| T-29 |
| BANK 2017-BNK5 | Del Amo Fashion Center |
Mortgage Loan No. 1 – Del Amo Fashion Center
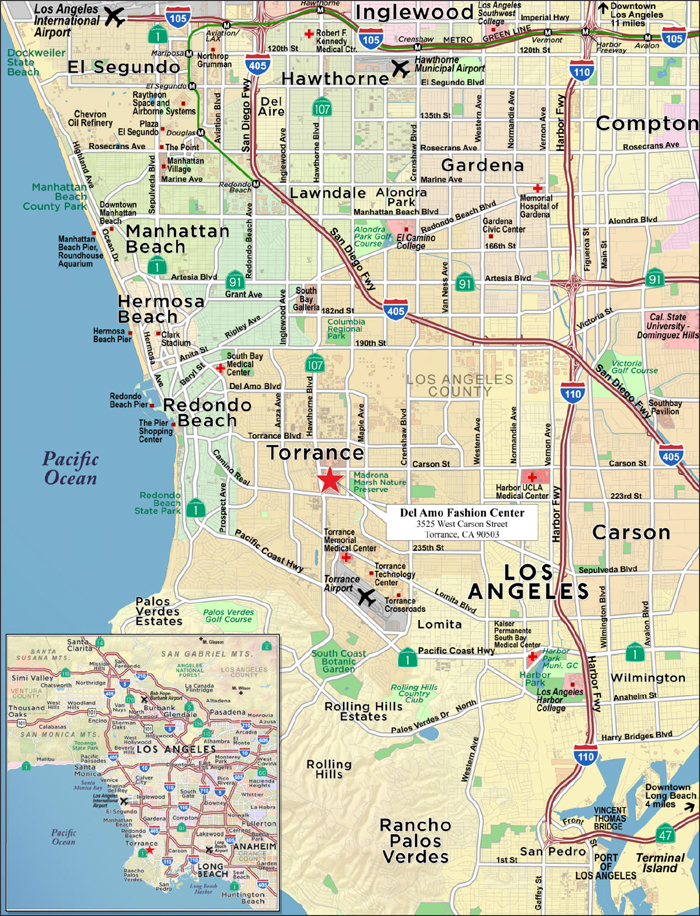
This is not a research report and was not prepared by any Underwriter’s research department. Please see additional important information and qualifications at the end of this Term Sheet.
| T-30 |
| BANK 2017-BNK5 | Del Amo Fashion Center |
| Mortgage Loan No. 1 – Del Amo Fashion Center |
| Mortgage Loan Information | Property Information | |||||
| Credit Assessment (DBRS/Fitch/Moodys): | A (low)/AA-sf/Baa1 | Single Asset/Portfolio: | Single Asset | |||
| Mortgage Loan Seller: | BANA/WFB | Location: | Torrance, CA 90503 | |||
| Original Balance(1): | $90,000,000 | General Property Type: | Retail | |||
| Cut-off Date Balance(1): | $90,000,000 | Detailed Property Type: | Super Regional Mall | |||
| % of Initial Pool Balance: | 7.3% | Title Vesting: | Fee | |||
| Loan Purpose: | Refinance | Year Built/Renovated: | 1961/2017 | |||
| Sponsor: | Simon Property Group, L.P.; Commingled Pension Trust Fund (Strategic Property) of JPMorgan Chase Bank, N.A. | Size: | 1,769,525 SF | |||
| Mortgage Rate: | 3.6575% | Cut-off Date Balance per SF(1): | $260 | |||
| Note Date: | 5/12/2017 | Maturity Date Balance per SF(1): | $260 | |||
| First Payment Date: | 7/1/2017 | Property Manager: | Simon Management Associates II, LLC (borrower-related) | |||
| Maturity Date: | 6/1/2027 | |||||
| Original Term to Maturity: | 120 months | |||||
| Original Amortization Term: | 0 months | Underwriting and Financial Information | ||||
| IO Period: | 120 months | UW NOI: | $59,343,892 | |||
| Seasoning: | 0 months | UW NOI Debt Yield(1): | 12.9% | |||
| Prepayment Provisions(2): | LO (24); DEF (89); O (7) | UW NOI Debt Yield at Maturity(1): | 12.9% | |||
| Lockbox/Cash Mgmt Status: | Hard/Springing | UW NCF DSCR(1): | 3.34x | |||
| Additional Debt Type(1)(3): | Pari Passu/Subordinate Debt | Most Recent NOI: | $53,218,707 (3/31/2017 TTM) | |||
| Additional Debt Balance(1)(3): | $369,300,000/$125,700,000 | 2nd Most Recent NOI: | $51,101,092 (12/31/2016) | |||
| Future Debt Permitted (Type): | No (N/A) | 3rd Most Recent NOI: | $35,039,436 (12/31/2015) | |||
| Reserves(4) | Most Recent Occupancy(5): | 85.2% (5/15/2017) | ||||
| Type | Initial | Monthly | Cap | 2nd Most Recent Occupancy: | 91.5% (12/31/2016) | |
| RE Tax: | $0 | Springing | N/A | 3rd Most Recent Occupancy: | 86.1% (12/31/2015) | |
| Insurance: | $0 | Springing | N/A | Appraised Value (as of): | $1,155,000,000 (4/23/2017) | |
| Recurring Replacements: | $0 | Springing | $446,400 | Cut-off Date LTV Ratio(1): | 39.8% | |
| TI/LC: | $0 | Springing | $6,465,600 | Maturity Date LTV Ratio(1): | 39.8% | |
| Other: | $8,071,240 | $0 | N/A | |||
| Sources and Uses | ||||||
| Sources | Proceeds | % of Total | Uses | Proceeds | % of Total | |
| Loan Amount(1): | $585,000,000 | 100.0% | Loan Payoff: | $511,127,344 | 87.4% | |
| Closing Costs: | $3,288,487 | 0.6% | ||||
| Return of Equity: | $70,584,168 | 12.1% | ||||
| Total Sources: | $585,000,000 | 100.0% | Total Uses: | $585,000,000 | 100.0% | |
| (1) | The Del Amo Fashion Center Mortgage Loan is part of the Del Amo Fashion Center Whole Loan, which is comprised of sixteen promissory A-Notes (which arepari passu with each other) with an aggregate principal balance of $375,800,000, sixteen promissory B-Notes (which are subordinate to the A-Notes andpari passu with each other) with an aggregate principal balance of $83,500,000 (together, the “Del Amo Fashion Center Senior Loan”), and twelve subordinate mortgage notes with an aggregate principal balance of $125,700,000 (together, the “Del Amo Fashion Center Subordinate Loan”). The Cut-off Date Balance per SF, Maturity Date Balance per SF, UW NOI Debt Yield, UW NOI Debt Yield at Maturity, UW NCF DSCR, Cut-off Date LTV Ratio and Maturity Date LTV Ratio numbers presented above are based on the aggregate principal balance of the promissory notes comprising the Del Amo Fashion Center Senior Loan. The Cut-off Date Balance per SF, Maturity Date Balance per SF, UW NOI Debt Yield, UW NOI Debt Yield at Maturity, UW NCF DSCR, Cut-off Date LTV Ratio and Maturity Date LTV Ratio numbers based on the combined principal balance of the promissory notes comprising the Del Amo Fashion Center Senior Loan and the Del Amo Fashion Center Subordinate Loan are $331, $331, 10.1%, 10.1%, 2.63x, 50.6% and 50.6%, respectively. |
| (2) | Defeasance is permitted at any time after the earlier to occur of (a) the end of the two-year period commencing on the closing date of the securitization of the last Del Amo Fashion Center Whole Loan promissory note to be securitized and (b) May 2, 2020. The assumed lockout period of 24 payments is based on the closing date of this transaction in June 2017. |
| (3) | See “The Mortgage Loan” and “Additional Secured Indebtedness (not including trade debts)” below for further discussion of additional debt. |
| (4) | See “Escrows and Reserves” below for further discussion of reserve requirements. |
| (5) | Most Recent Occupancy includes ten tenants (1.7% of NRA and 2.5% of underwritten rent) with signed leases with future commencement dates (June 13, 2017 to January 1, 2018). Most Recent Occupancy also includes three tenants (4.5% of NRA and 5.3% of underwritten rent) with signed leases not yet in occupancy: Dave & Buster’s (expected lease commencement date of May 2018), Marshalls (expected lease commencement date of May 2018) and EMC Seafood & Raw Bar (expected lease commencement date of January 2018), for which a ten-year master lease was signed by the Del Amo Fashion Center Whole Loan guarantor which provides for annual rent equivalent to the tenants’ combined annual rent. |
This is not a research report and was not prepared by any Underwriter’s research department. Please see additional important information and qualifications at the end of this Term Sheet.
| T-31 |
| BANK 2017-BNK5 | Del Amo Fashion Center |
The Mortgage Loan. The largest mortgage loan (the “Del Amo Fashion Center Mortgage Loan”) is part of a whole loan (the “Del Amo Fashion Center Whole Loan”) evidenced by sixteen promissory A-Notes in the aggregate original principal amount of $375,800,000, which arepari passu with each other, sixteen promissory B-Notes in the aggregate original amount of $83,500,000, which are subordinate to the A-Notes andpari passu with each other (such A-Notes and B-Notes, collectively, the “Del Amo Fashion Center Senior Loan”) and twelve subordinate promissory notes in the aggregate original principal amount of $125,700,000, which are evidenced by four notes from each of three tranches (C-Notes, D-Notes and E-Notes, each of which is subordinate to the Del Amo Fashion Center Senior Loan and to each other such tranche with a prior alphabetical designation (collectively, the “Del Amo Fashion Center Subordinate Loan”), which are secured by a first priority fee mortgage encumbering 1,769,525 SF of a super regional mall in Torrance, California (the “Del Amo Fashion Center Property”). Promissory Notes A-1-2 and B-1-2 (contributed by Bank of America, N.A.) and A-4-2 and B-4-2 (contributed by Wells Fargo Bank, N.A.), in the aggregate principal amount of $90,000,000, are from each of the two A and B tranches ofpari passu components that comprise the Del Amo Fashion Center Senior Loan and represent the Del Amo Fashion Center Mortgage Loan and will be included in the BANK 2017-BNK5 securitization trust.
The following table presents a summary of the promissory notes comprising the Del Amo Fashion Center Whole Loan. The Del Amo Fashion Center Whole Loan is expected to be serviced pursuant to the trust and servicing agreement for the DAFC 2017-AMO transaction. See “Description of the Mortgage Pool—The Whole Loans—The Del Amo Fashion Center Pari Passu-A/B Whole Loan” in the Preliminary Prospectus.
| Del Amo Fashion Center Whole Loan Summary | ||||
| Note(1) | Original Balance | Cut-off Date Balance | Note Holder(2) | Controlling Piece |
| A-1-1 | $12,125,000 | $12,125,000 | DAFC 2017-AMO | Yes |
| A-1-2 | $36,821,000 | $36,821,000 | BANK 2017-BNK5 | No |
| A-1-3 | $24,547,000 | $24,547,000 | Bank of America, NA | No |
| A-1-4 | $20,457,000 | $20,457,000 | Bank of America, NA | No |
| A-2-1 | $12,125,000 | $12,125,000 | DAFC 2017-AMO | No |
| A-2-2 | $36,821,000 | $36,821,000 | Barclays Bank PLC | No |
| A-2-3 | $24,547,000 | $24,547,000 | Barclays Bank PLC | No |
| A-2-4 | $20,457,000 | $20,457,000 | Barclays Bank PLC | No |
| A-3-1 | $12,125,000 | $12,125,000 | DAFC 2017-AMO | No |
| A-3-2 | $32,730,000 | $32,730,000 | Société Générale | No |
| A-3-3 | $28,638,000 | $28,638,000 | Société Générale | No |
| A-3-4 | $20,457,000 | $20,457,000 | Société Générale | No |
| A-4-1 | $12,125,000 | $12,125,000 | DAFC 2017-AMO | No |
| A-4-2 | $36,821,000 | $36,821,000 | BANK 2017-BNK5 | No |
| A-4-3 | $24,547,000 | $24,547,000 | Wells Fargo Bank, NA | No |
| A-4-4 | $20,457,000 | $20,457,000 | Wells Fargo Bank, NA | No |
| B-1-1 | $2,700,000 | $2,700,000 | DAFC 2017-AMO | No |
| B-1-2 | $8,179,000 | $8,179,000 | BANK 2017-BNK5 | No |
| B-1-3 | $5,453,000 | $5,453,000 | Bank of America, NA | No |
| B-1-4 | $4,543,000 | $4,543,000 | Bank of America, NA | No |
| B-2-1 | $2,700,000 | $2,700,000 | DAFC 2017-AMO | No |
| B-2-2 | $8,179,000 | $8,179,000 | Barclays Bank PLC | No |
| B-2-3 | $5,453,000 | $5,453,000 | Barclays Bank PLC | No |
| B-2-4 | $4,543,000 | $4,543,000 | Barclays Bank PLC | No |
| B-3-1 | $2,700,000 | $2,700,000 | DAFC 2017-AMO | No |
| B-3-2 | $7,270,000 | $7,270,000 | Société Générale | No |
| B-3-3 | $6,362,000 | $6,362,000 | Société Générale | No |
| B-3-4 | $4,543,000 | $4,543,000 | Société Générale | No |
| B-4-1 | $2,700,000 | $2,700,000 | DAFC 2017-AMO | No |
| B-4-2 | $8,179,000 | $8,179,000 | BANK 2017-BNK5 | No |
| B-4-3 | $5,453,000 | $5,453,000 | Wells Fargo Bank, NA | No |
| B-4-4 | $4,543,000 | $4,543,000 | Wells Fargo Bank, NA | No |
| Del Amo Fashion Center Subordinate Loan | $125,700,000 | $125,700,000 | DAFC 2017-AMO | No |
| Total Del Amo Fashion Center Whole Loan | $585,000,000 | $585,000,000 | ||
| (1) | The B-Notes are subordinate to the A-Notes. |
| (2) | The promissory notes currently held by Bank of America, N.A., Barclays Bank, PLC, Societe Generale and Wells Fargo Bank, NA are expected to be contributed to future securitization transactions or may be otherwise transferred at any time. |
This is not a research report and was not prepared by any Underwriter’s research department. Please see additional important information and qualifications at the end of this Term Sheet.
| T-32 |
| BANK 2017-BNK5 | Del Amo Fashion Center |
The Del Amo Fashion Center Whole Loan was co-originated by Bank of America, N.A., Wells Fargo Bank, N.A., Barclays Bank, PLC and Société Générale. The proceeds of the Del Amo Fashion Center Whole Loan were used to pay off previous mortgage debt, pay closing costs and to return equity to the borrower sponsor. Based on the total cost basis in the Del Amo Fashion Center Property, the borrower sponsor has over $350 million in equity invested in the asset.
The Borrower and the Sponsor. The borrower is Del Amo Fashion Center Operating Company, L.L.C. (the “Del Amo Fashion Center Borrower”), a single-purpose Delaware limited liability company structured to be bankruptcy-remote, with at least two independent directors. Simon Property Group, L.P. is the non-recourse carveout guarantor. The Del Amo Fashion Center Whole Loan will be recourse to the guarantor pursuant to standard non-recourse carveouts, however, the non-recourse carveout guaranty and the environmental indemnity agreement provide that so long as Simon Property Group, L.P. is the guarantor (or SPF (as defined below) or certain affiliates of SPF should it be a replacement guarantor), its liability may not exceed $117,000,000 plus all reasonable out-of-pocket costs and expenses incurred by the lender in the enforcement of the guaranty and the environmental indemnity agreement or the preservation of the lender’s rights thereunder.
The sponsor is a 50/50 joint venture between subsidiaries of Simon Property Group, L.P. and Commingled Pension Trust Fund (Strategic Property) of J.P. Morgan Chase Bank, N.A. (“SPF”).
Simon Property Group, L.P. is the operating partnership of Simon Property Group, Inc. (“Simon”) (NYSE: SPG). Simon is a publicly-traded, self-administered and self-managed real estate investment trust focused on retail property ownership and management. Simon is one of the largest publicly-traded owners, operators and developers of retail assets in the United States. As of March 31, 2017, Simon owned or had an interest in 206 properties consisting of 108 malls, 67 Premium Outlet-branded centers, 14 Mills-branded centers, four lifestyle centers and thirteen other retail properties in 37 states and Puerto Rico, as well as redevelopment and expansion projects underway at 25 properties in the United States, Canada and Europe.
SPF is a JPMorgan Asset Management fund with a reported net asset value of approximately $30.9 billion and a gross asset value of approximately $41.7 billion as of March 31, 2017. SPF’s investment portfolio focuses on office, retail, residential and industrial investments.
The Property. The Del Amo Fashion Center Property consists of 1,769,525 SF of traditional mall, open air lifestyle and entertainment space which together with the non-collateral Macy’s and Sears anchors comprise the 2.51 million SF Del Amo Fashion Center mall, the largest shopping center in the western United States. The Del Amo Fashion Center Property is located in the suburban community of Torrance, California, at the intersection of Hawthorne and Sepulveda Boulevards. Hawthorne Boulevard is a ten-lane arterial providing access to the Pacific Coast Highway to the south and I-105 to the north. Sepulveda Boulevard is an eight-lane thoroughfare that provides access between Redondo Beach and I-110.
The Del Amo Fashion Center Property is a two-level super regional mall with a diverse tenancy including large chain stores such as Dick’s Sporting Goods, H&M, XXI Forever and Crate & Barrel, restaurants including P.F. Chang’s China Bistro, Lazy Dog Cafe, Great Maple and Din Tai Fung (a Michelin-starred restaurant), entertainment options including the 18-screen AMC Theatres and Dave & Buster’s (not yet open), as well as over 100 in-line retailers and brands including 25 first-to-market brands including Arhaus Furniture, Kate Spade New York, Hugo Boss, J. Crew, Lululemon and Michael Kors. Collateral anchors include J.C. Penney and Nordstrom. Included in the collateral are 11,892 parking spaces (approximately 6.7 spaces per 1,000 SF).
The Del Amo Fashion Center Property is currently undergoing a $423 million redevelopment that started in 2013. The multi-phased project includes (i) the renovation of the north mall area and creation of the new Patio Café Dining Pavilion which opened in 2014 and includes ten eateries, seating for 700, floor to ceiling living plant walls, skylights and lounge areas with complimentary Wi-Fi, (ii) the addition of approximately 350,000 SF of in-line shops, the Nordstrom anchor and a multi-level parking deck, delivered in 2015, (iii) the renovation of the south mall area, completed in November 2016, (iv) the construction of the Dick’s Sporting Goods store, which opened in June 2017, and additional adjacent in-line stores and renovation of neighboring in-line stores, which construction and renovation was expected to have been completed in May 2017, (v) the build-out of two restaurant pads, BRIO Tuscan Grille and EMC Seafood & Raw Bar (which is expected to be completed in 2017), and (vi) the construction of the Marshalls and Dave & Buster’s which is expected to be completed in May 2018. The remaining cost of the redevelopment has not been reserved for under the Del Amo Fashion Center Whole Loan documents and such redevelopment is not required to be completed by the Del Amo Fashion Center Borrower.
The Del Amo Fashion Center Property was 85.2% leased as of May 15, 2017 to 208 retail and restaurant tenants. The following table presents a summary of the historical in-line occupancy at the Del Amo Fashion Center Property:
| Historical In-Line Occupancy | ||||
| Historical Occupancy | 2013 | 2014 | 2015 | 2016 |
| In-Line (including temporary tenants) | 80.1% | 92.8% | 88.5% | 93.8% |
| In-Line (excluding temporary tenants) | 75.2% | 85.7% | 79.7% | 86.6% |
This is not a research report and was not prepared by any Underwriter’s research department. Please see additional important information and qualifications at the end of this Term Sheet.
| T-33 |
| BANK 2017-BNK5 | Del Amo Fashion Center |
The 2016 estimated total gross sales for the Del Amo Fashion Center Property were approximately $543.4 million. The following table presents a summary of historical anchor sales at the Del Amo Fashion Center Property.
| Anchor Sales Summary | ||||
| Tenant | 2014 | 2015 | 2016 | Sales PSF(1) |
| Macy’s (non-collateral)(2)(3) | $75,100,000 | $62,000,000 | $73,895,000 | $175 |
| Sears (non-collateral)(2)(4) | $32,500,000 | $30,200,000 | NAV(5) | $96 |
| Nordstrom(6) | N/A | N/A | $51,480,000 | $373 |
| J.C. Penney | $23,689,000 | $24,372,000 | $21,061,000 | $129 |
| AMC Theaters(7) | $17,979,000 | $18,114,000 | $17,307,000 | $961,500 |
| (1) | Sales PSF reflects most recent year-end sales figures available. |
| (2) | Sales figures reflect estimates for non-collateral anchors. |
| (3) | Macy’s currently operates two stores at the Del Amo Fashion Center, totaling 423,307 SF. Sales figures are representative of both stores. 2014 sales represent three Macy’s stores. |
| (4) | Sears occupies 313,495 SF, with approximately two levels being used for merchandizing and one level being used for office space. When excluding the office space, the adjusted estimated Sales PSF are approximately $144 PSF. |
| (5) | 2016 sales data not yet available. |
| (6) | Nordstrom opened in October 2015. |
| (7) | AMC Theaters Sales PSF reflects sales per screen. |
As of the trailing-twelve-month period ended March 31, 2017, the Del Amo Fashion Center Property had total comparable in-line sales of $124.3 million, with average in-line sales of $611 PSF and an occupancy cost of 13.7%. While the renovations and redevelopment have been ongoing at the Del Amo Fashion Center Property since 2013, in-line sales PSF have grown from $441 PSF to $611 PSF, representing a 39% increase from 2013 to the trailing twelve month period ended March 31, 2017.
The following table presents a summary of historical comparable in-line sales at the Del Amo Fashion Center Property.
| Comparable In-Line Sales Summary(1) | |||||
| 2013 | 2014 | 2015 | 2016 | 3/31/2017 TTM | |
| In-Line Sales PSF | $441 | $449 | $499 | $560 | $611 |
| Occupancy Cost | 14.3% | 14.7% | 15.9% | 14.4% | 13.7% |
| (1) | Information as provided by the borrower sponsor and only include tenants reporting comparable sales. |
This is not a research report and was not prepared by any Underwriter’s research department. Please see additional important information and qualifications at the end of this Term Sheet.
| T-34 |
| BANK 2017-BNK5 | Del Amo Fashion Center |
The following table presents certain information relating to the major tenants at the Del Amo Fashion Center Property.
Tenant Summary(1) | ||||||||||
| Tenant Name | Credit Rating (Fitch/Moody’s/S&P)(2) | Tenant SF | Approx. % of SF | Annual UW Rent | Annual UW Rent PSF(3) | Most Recent Sales(4) | Occ. Cost % | Lease Expiration | ||
| % of Annual UW Rent | $ | PSF | ||||||||
| Anchor Tenants | ||||||||||
| J.C. Penney | B+/B1/B+ | 163,346 | 9.2% | $457,325 | 0.9% | $2.80 | 21,061,000 | $129 | N/A | 12/31/2018 |
| Nordstrom | BBB+/Baa1/BBB+ | 138,000 | 7.8% | $0(5) | 0.0%(5) | $0(5) | 51,480,000 | $373 | N/A | 2/28/2031 |
| AMC Theaters | NR/B1/NR | 76,800 | 4.3% | $3,066,624 | 6.1% | $39.93 | $17,307,000 | $961,500(7) | 17.7% | 9/30/2021 |
| Major Tenants(6) | ||||||||||
| LA Fitness | NR/NR/NR | 47,137 | 2.7% | $1,792,237 | 3.6% | $38.02 | N/A | N/A | N/A | 1/31/2022 |
| Dave & Buster’s(8) | NR/NR/NR | 42,336 | 2.4% | $1,439,424 | 2.9% | $34.00 | N/A | N/A | N/A | 4/30/2033 |
| Dick’s Sporting Goods | NR/NR/NR | 83,210 | 4.7% | $1,352,163 | 2.7% | $16.25 | N/A | N/A | N/A | 4/30/2027 |
| H&M | NR/NR/NR | 25,086 | 1.4% | $1,076,189 | 2.1% | $42.90 | N/A | N/A | N/A | 1/31/2026 |
| Zara | NR/NR/NR | 26,802 | 1.5% | $1,050,625 | 2.1% | $39.20 | $8,791,000 | $328 | 12.0% | 10/31/2027 |
| Burlington Coat Factory(9) | NR/NR/NR | 60,000 | 3.4% | $840,000 | 1.7% | $14.00 | N/A | N/A | N/A | 1/31/2025 |
| Marshalls(8) | NR/A2/A+ | 30,716 | 1.7% | $752,542 | 1.5% | $24.50 | N/A | N/A | N/A | 2/29/2028 |
| Express | NR/NR/NR | 11,208 | 0.6% | $741,858 | 1.5% | $66.19 | N/A | N/A | N/A | 1/31/2026 |
| Old Navy | BB+/Baa2/BB+ | 17,990 | 1.0% | $712,799 | 1.4% | $39.62 | $7,784,000 | $433 | 9.7% | 1/31/2024 |
| XXI Forever | NR/NR/NR | 20,217 | 1.1% | $707,595 | 1.4% | $35.00 | $7,613,000 | $377 | 13.4% | 1/31/2018 |
| Subtotal/Wtd. Avg. | 742,848 | 42.0% | $13,989,380 | 27.8% | $18.83 | |||||
| Other Retail Tenants(10) | 764,810 | 43.2% | $36,415,851 | 72.2% | $47.61 | |||||
| Vacant Space | 261,867 | 14.8% | ||||||||
| Total/Wtd. Avg. | 1,769,525 | 100.0% | $50,405,231 | $33.43 | ||||||
| (1) | Information is based on the underwritten rent roll. |
| (2) | Certain ratings are those of the parent company whether or not the parent guarantees the lease. |
| (3) | Wtd. Avg. Annual UW Rent PSF excludes vacant space. |
| (4) | Most Recent Sales $ and PSF represent trailing 12 months ending March 31, 2017 information for Old Navy and XXI Forever, and 2016 information for all other tenants. |
| (5) | Nordstrom opened in October 2015 and does not pay base rent but pays percentage rent equivalent to 2% of sales over a $60.0 million breakpoint. |
| (6) | Major Tenants are ordered by Annual UW Rent. |
| (7) | Most Recent Sales PSF represents Sales per screen. |
| (8) | Dave & Buster’s and Marshalls have executed leases with expected May 2018 commencement dates. The Del Amo Fashion Center Whole Loan guarantor has signed a ten-year master lease which provides for the annual rent obligations for these tenants. |
| (9) | Burlington Coat Factory has the option to terminate its lease at any time upon at least 270 days’ prior written notice. |
| (10) | Other Retail Tenants includes eleven tenants (2.1% of NRA and 2.9% of underwritten rent) with signed leases with future commencement dates (June 13, 2017 to January 1, 2018). |
This is not a research report and was not prepared by any Underwriter’s research department. Please see additional important information and qualifications at the end of this Term Sheet.
| T-35 |
| BANK 2017-BNK5 | Del Amo Fashion Center |
The following table presents certain information relating to the lease rollover at the Del Amo Fashion Center Property:
| Lease Rollover Schedule(1)(2) | ||||||||
| Year | # of Leases Rolling | SF Rolling | Annual UW Rent PSF Rolling(3) | Approx. % of Total SF Rolling | Approx. Cumulative % of SF Rolling | Total UW Rent Rolling | Approx. % of Total Rent Rolling | Approx. Cumulative % of Total Rent Rolling |
| MTM/2017 | 8 | 26,342 | $39.50 | 1.5% | 1.5% | $1,040,552 | 2.1% | 2.1% |
| 2018 | 11 | 204,233 | $10.06 | 11.5% | 13.0% | $2,054,097 | 4.1% | 6.1% |
| 2019 | 16 | 45,696 | $44.89 | 2.6% | 15.6% | $2,051,118 | 4.1% | 10.2% |
| 2020 | 12 | 88,993 | $24.44 | 5.0% | 20.6% | $2,174,566 | 4.3% | 14.5% |
| 2021 | 10 | 115,598 | $39.74 | 6.5% | 27.2% | $4,593,303 | 9.1% | 23.6% |
| 2022 | 11 | 67,982 | $47.71 | 3.8% | 31.0% | $3,243,680 | 6.4% | 30.1% |
| 2023 | 4 | 75,763 | $18.02 | 4.3% | 35.3% | $1,365,309 | 2.7% | 32.8% |
| 2024 | 17 | 51,974 | $69.18 | 2.9% | 38.2% | $3,595,680 | 7.1% | 39.9% |
| 2025 | 44 | 176,862 | $50.40 | 10.0% | 48.2% | $8,913,244 | 17.7% | 57.6% |
| 2026 | 56 | 222,472 | $51.91 | 12.6% | 60.8% | $11,548,229 | 22.9% | 80.5% |
| 2027 | 22 | 202,821 | $33.39 | 11.5% | 72.3% | $6,772,847 | 13.4% | 93.9% |
| 2028 & Beyond | 6 | 228,922 | $13.33 | 12.9% | 85.2% | $3,052,606 | 6.1% | 100.0% |
| Vacant | 0 | 261,867 | $0.00 | 14.8% | 100.0% | $0 | 0.0% | 100.0% |
| Total/Wtd. Avg. | 217 | 1,769,525 | $33.43 | 100.0% | $50,405,231 | 100.0% | ||
| (1) | Information is based on the underwritten rent roll and includes ten tenants (1.7% of NRA and 2.5% of underwritten rent) with signed leases with future commencement dates (June 13, 2017 to January 1, 2018) and three tenants (4.5% of NRA and 5.3% of underwritten rent) with signed leases not yet in occupancy: Dave & Buster’s (expected lease commencement date of May 2018), Marshalls (expected lease commencement date of May 2018) and EMC Seafood & Raw Bar (expected lease commencement date of January 2018), for which a ten-year master lease was signed by the Del Amo Fashion Center Whole Loan guarantor which provides for annual rent equivalent to the tenants’ combined annual rent. |
| (2) | Certain tenants may have lease termination options that are exercisable prior to the originally stated expiration date of the subject lease and that are not considered in the lease rollover schedule. |
| (3) | Wtd. Avg. Annual UW Rent PSF Rolling excludes vacant space. |
The Market. The Del Amo Fashion Center Property is located in Torrance, California, in the coastal area of Los Angeles’ South Bay. Family-friendly destinations such as Disneyland Resort and Santa Catalina Island as well as the numerous local beaches provide tourist attractions within a short distance of Torrance. Torrance is also the U.S. home base for the Japanese corporations Honda, Mitsuwa and All Nippon Airways, as well as Honeywell and Robinson Helicopters.
According to the appraisal, the Del Amo Fashion Center Property is located within 4.5 miles of the Kings Harbor Marina, within 10.5 miles of the Los Angeles Airport (LAX), in close proximity to I-110 and I-405, and near high income demographic areas including Palos Verdes Peninsula, Redondo Beach, Hermosa and Manhattan Beach. Demographics surrounding the Del Amo Fashion Center Property include a 5-mile radius population of 504,851 with an average household income of $112,287 as of December 2016.
The Del Amo Fashion Center Property is located in the South Bay/Torrance submarket of Los Angeles, which as of year-end 2016 contained 6,154,000 SF (9.1% of the broader Los Angeles retail market inventory) with a vacancy rate of 3.9% and average asking rents of $35.43 PSF, as compared to the Los Angeles retail market which had a vacancy rate of 6.2% and average asking rents of $32.00 PSF. According to the appraisal, there is no proposed new competitive supply within the submarket and none of the proposed supply within the broader Los Angeles market would be competitive with the Del Amo Fashion Center Property.
This is not a research report and was not prepared by any Underwriter’s research department. Please see additional important information and qualifications at the end of this Term Sheet.
| T-36 |
| BANK 2017-BNK5 | Del Amo Fashion Center |
The following table presents certain competitive retail properties to the Del Amo Fashion Center Property:
| Competitive Property Summary | |||||||
| Property, Location | Type | Year Built/ Renovated | Size (SF) | Occupancy | Comparable In-line Sales PSF | Anchor Tenants | Distance to Subject (mi.) |
Del Amo Fashion Center Torrance, CA | Super Regional Mall | 1961/2017 | 1,769,525 | 85.2%(1) | $611(2) | Macy’s (non-collateral), Sears (non- collateral), Nordstrom, J.C. Penney | N/A |
South Bay Galleria Redondo Beach, CA | Super Regional Mall | 1984/2014 | 960,200 | 84.9% | $435-$445 | Macy’s, Kohl’s, Cinemas | 3.5 |
Promenade on the Peninsula Rancho Palos Verdes, CA | Regional Center | 1981/N/A | 374,186 | 80.6% | $350-$375 | Equinox Fitness, Cinemas | 5.4 |
Manhattan Village Manhattan Beach, CA | Super Regional Mall | 1981/N/A | 620,008 | 99.4% | $450-$475 | Macy’s, Fry’s Electronics, Ralph’s/CVS | 7.5 |
South Bay Pavilion Carson, CA | Super Regional Mall | 1973/ N/A | 1,016,554 | 82.2% | N/A | J.C. Penney, Target, IKEA, 24-Hour Fitness, Cinemas | 8.5 |
Source:Appraisal
| (1) | Occupancy as of May 15, 2017 which includes ten tenants (1.7% of NRA and 2.5% of underwritten rent) with signed leases with future commencement dates (June 13, 2017 to January 1, 2018) and three tenants (4.5% of NRA and 5.3% of underwritten rent) with signed leases not yet in occupancy: Dave & Buster’s (expected lease commencement date of May 2018), Marshalls (expected lease commencement date of May 2018) and EMC Seafood & Raw Bar (expected lease commencement date of January 2018), for which a ten-year master lease was signed by the Del Amo Fashion Center Whole Loan guarantor which provides for annual rent equivalent to the tenants’ combined annual rent. |
| (2) | Comparable in-line sales shown as of March 31, 2017. |
Operating History and Underwritten Net Cash Flow.The following table presents certain information relating to the historical operating performance and the Underwritten Net Cash Flow at the Del Amo Fashion Center Property:
| Cash Flow Analysis | ||||||||||||
| 2014 | 2015 | 2016 | 3/31/2017 TTM | UW | UW PSF | |||||||
| Base Rent(1)(2) | $29,467,993 | $33,241,859 | $45,831,077 | $46,804,573 | $51,545,895 | $29.13 | ||||||
| Vacant Space | $0 | $0 | $0 | $0 | $11,430,694 | $6.46 | ||||||
| Total Recoveries | $12,142,979 | $15,224,540 | $25,514,526 | $26,374,801 | $25,211,150 | $14.25 | ||||||
| Specialty Leasing | $1,960,645 | $2,348,117 | $3,373,175 | $3,266,342 | $3,366,899 | $1.90 | ||||||
| Other Income(3) | $584,173 | $964,983 | $1,396,597 | $1,359,783 | $1,135,576 | $0.64 | ||||||
| Less Vacancy | ($316,274) | ($134,368) | ($441,700) | ($630,344) | ($11,430,694) | (13.0%) | ||||||
| Effective Gross Income | $43,839,516 | $51,645,131 | $75,673,675 | $77,175,155 | $81,259,520 | $45.92 | ||||||
| Total Operating Expenses | $14,855,360 | $16,605,695 | $24,572,583 | $23,956,448 | $21,915,628 | $12.39 | ||||||
| Net Operating Income | $28,984,156 | $35,039,436 | $51,101,092 | $53,218,707 | $59,343,892 | $33.54 | ||||||
| Capital Expenditures | $0 | $0 | $0 | $0 | $223,460 | $0.13 | ||||||
| TI/LC | $0 | $0 | $0 | $0 | $2,154,999 | $1.22 | ||||||
| Net Cash Flow | $28,984,156 | $35,039,436 | $51,101,092 | $53,218,707 | $56,965,434 | $32.19 | ||||||
| Occupancy % | 93.5% | 86.1% | 91.5% | 85.2%(2) | 87.0% | |||||||
| NOI DSCR(4) | 1.70x | 2.06x | 3.00x | 3.12x | 3.48x | |||||||
| NCF DSCR(4) | 1.70x | 2.06x | 3.00x | 3.12x | 3.34x | |||||||
| NOI Debt Yield(4) | 6.3% | 7.6% | 11.1% | 11.6% | 12.9% | |||||||
| NCF Debt Yield(4) | 6.3% | 7.6% | 11.1% | 11.6% | 12.4% | |||||||
| (1) | UW Base Rent is based on the May 15, 2017 underwritten rent roll and includes contractual rent steps through July 1, 2018. |
| (2) | Occupancy as of May 15, 2017. The May 15, 2017 underwritten rent roll includes ten tenants (1.7% of NRA and 2.5% of underwritten rent) with signed leases with future commencement dates (June 13, 2017 to January 1, 2018) and three tenants (4.5% of NRA and 5.3% of underwritten rent) with signed leases not yet in occupancy: Dave & Buster’s (expected lease commencement date of May 2018), Marshalls (expected lease commencement date of May 2018) and EMC Seafood & Raw Bar (expected lease commencement date of January 2018), for which a ten-year master lease was signed by the Del Amo Fashion Center Whole Loan guarantor which provides for annual rent equivalent to the tenants’ combined annual rent. |
| (3) | Other income includes income from storage, stroller rentals, ATMs and other miscellaneous rental income. |
| (4) | Debt service coverage ratios and debt yields are based on the Del Amo Fashion Center Senior Loan and exclude the Del Amo Fashion Center Subordinate Loan. |
This is not a research report and was not prepared by any Underwriter’s research department. Please see additional important information and qualifications at the end of this Term Sheet.
| T-37 |
| BANK 2017-BNK5 | Del Amo Fashion Center |
Escrows and Reserves. During either an event of default or a DSCR Reserve Trigger Period (as defined below), the Del Amo Fashion Center Borrower is required to deposit monthly escrows for real estate taxes, insurance premiums (unless the Del Amo Fashion Center Property is insured under an acceptable blanket insurance policy), $18,600 for replacement reserves, capped at $446,400, and $179,600 for tenant improvement and leasing commissions, capped at $6,465,600. The Del Amo Fashion Center Borrower will additionally be required to deposit monthly escrows for real estate taxes if the Del Amo Fashion Center Borrower fails to provide evidence that the real estate taxes have been paid prior to the assessment of any penalty for late charges.
At loan origination, the Del Amo Fashion Center Whole Loan guarantor provided guarantees in the amount of $7,242,346 for outstanding landlord obligations relating to fourteen tenants and $828,894 for abated rent periods relating to eleven tenants which continue through as late as February 1, 2018.
A “DSCR Reserve Trigger Period” will commence upon the debt service coverage ratio for the Del Amo Fashion Center Whole Loan being less than 1.50x for two consecutive quarters based on the trailing four quarters and will end (provided no event of default has occurred and is continuing) upon the debt service coverage ratio for the Del Amo Fashion Center Whole Loan being equal to or greater than 1.50x for two consecutive quarters based on the trailing four quarters.
Lockbox and Cash Management. A hard lockbox is in place with respect to the Del Amo Fashion Center Whole Loan. Upon the occurrence of a Lockbox Event (as defined below), the Del Amo Fashion Center Borrower is required to establish a lender-controlled cash management account to which all amounts in the lockbox account are required to be automatically transferred weekly for the payment of, among other things, debt service, monthly escrows and operating expenses pursuant to an approved annual budget, with all excess cash being deposited to an excess cash reserve to be held as additional collateral for the Del Amo Fashion Center Whole Loan until the Lockbox Event ends.
A “Lockbox Event” will occur upon (i) an event of default, (ii) a bankruptcy action involving the Del Amo Fashion Center Borrower, (iii) a bankruptcy action involving Simon Management Associates II, LLC (or a borrower-affiliated manager) without the manager being replaced within 60 days, (iv) a DSCR Trigger Period, or (v) a Nordstrom Trigger Event (as defined below).
A Lockbox Event will end, provided no event of default shall be continuing, upon, as applicable, (i) the lender’s acceptance of a cure of the event of default, (ii) Simon Management Associates II, LLC (or a borrower-affiliated manager) being replaced with a qualified manager or the bankruptcy involving the manager being discharged or dismissed, (iii) the end of a DSCR Trigger Period, or (iv) the end of a Nordstrom Trigger Event. A Lockbox Event may not be cured if triggered by a bankruptcy action of the Del Amo Fashion Center Borrower.
A “DSCR Trigger Period” will commence upon the debt service coverage ratio for the Del Amo Fashion Center Whole Loan being less than 1.40x for two consecutive quarters based on the trailing four quarters and will end upon the debt service coverage ratio for the Del Amo Fashion Center Whole Loan being equal to or greater than 1.40x for two consecutive quarters based on the trailing four quarters.
A “Nordstrom Trigger Event” will occur upon Nordstrom (i) vacating or terminating or giving notice to vacate or terminate its lease or (ii) commencing to exercise remedies pursuant to its lease in connection with the Del Amo Fashion Center Borrower’s failure to complete the removal of the former TJ Maxx/Marshalls space from the Del Amo Fashion Center Property, and will end upon the earlier of (i) at least 75% of Nordstrom’s leased space being re-leased to one or more replacement tenants, which tenant(s) are in occupancy, open for business and paying full unabated rent with no outstanding landlord obligations, or (ii) the balance collected to the excess cash flow reserve during the Nordstrom Trigger Event being equal to or greater than $1,380,000.
Additional Secured Indebtedness (not including trade debts). The Del Amo Fashion Center Property also secures fourteen seniorpari passu promissory A-Notes with an aggregate principal balance of $302,158,000 (which arepari passu with each other and the A-Notes included in the Del Amo Fashion Center Mortgage Loan) and fourteen senior promissory B-Notes (which arepari passu with each other and the B-Notes included in the Del Amo Fashion Center Mortgage Loan) with an aggregate principal balance of $67,142,000 (the “Del Amo Fashion Center Non-ServicedPari Passu Companion Loans”) as well as the Del Amo Fashion Center Subordinate Loan, which includes twelve subordinate mortgage notes, comprised of four notes from each of three tranches (C-Notes, D-Notes and E-Notes, each of which is subordinate to the Del Amo Fashion Center Senior Loan and to each other such tranche with a prior alphabetical designation), with an aggregate principal balance of $125,700,000. The Del Amo Fashion Center Non-ServicedPari Passu Companion Loans and the Del Amo Fashion Center Subordinate Loan accrue interest at the same rate as the Del Amo Fashion Center Mortgage Loan. The Del Amo Fashion Center Mortgage Loan is entitled to payments of principal (if applicable) and interest on a pro rata andpari passu basis with the Del Amo Fashion Center Non-ServicedPari Passu Companion Loans (provided that all A-Notes are entitled to payments of principal (if applicable) and interest prior to all B-Notes) before payments of principal (if applicable) and interest to the Del Amo Fashion Center Subordinate Loan.
The holders of the Del Amo Fashion Center Mortgage Loan, the Del Amo Fashion Center Non-ServicedPari PassuCompanion Loans and the Del Amo Fashion Center Subordinate Loan have entered into a co-lender agreement which sets forth the allocation of collections on the Del Amo Fashion Center Whole Loan.See “Description of the Mortgage Pool—The Whole Loans—The Del Amo Fashion Center Pari Passu-A/B Whole Loan” in the Preliminary Prospectus.
Mezzanine Loan and Preferred Equity. Not permitted.
Release of Property.No material releases permitted.
Terrorism Insurance.The Del Amo Fashion Center Borrower is required to obtain and maintain property insurance, public liability insurance and rental loss and/or business interruption insurance that covers perils of terrorism and acts of terrorism, provided that the Del Amo Fashion Center Whole Loan documents provide for an annual terrorism premium cap of two times the cost of the premiums for property insurance required under the related Del Amo Fashion Center Whole Loan documents (on a stand-alone basis), but excluding the wind and flood components of such premiums.
This is not a research report and was not prepared by any Underwriter’s research department. Please see additional important information and qualifications at the end of this Term Sheet.
| T-38 |
(THIS PAGE INTENTIONALLY LEFT BLANK)
This is not a research report and was not prepared by any Underwriter’s research department. Please see additional important information and qualifications at the end of this Term Sheet.
| T-39 |
BANK 2017-BNK5 | Starwood Capital Group Hotel Portfolio |
Mortgage Loan No. 2 – Starwood Capital Group Hotel Portfolio
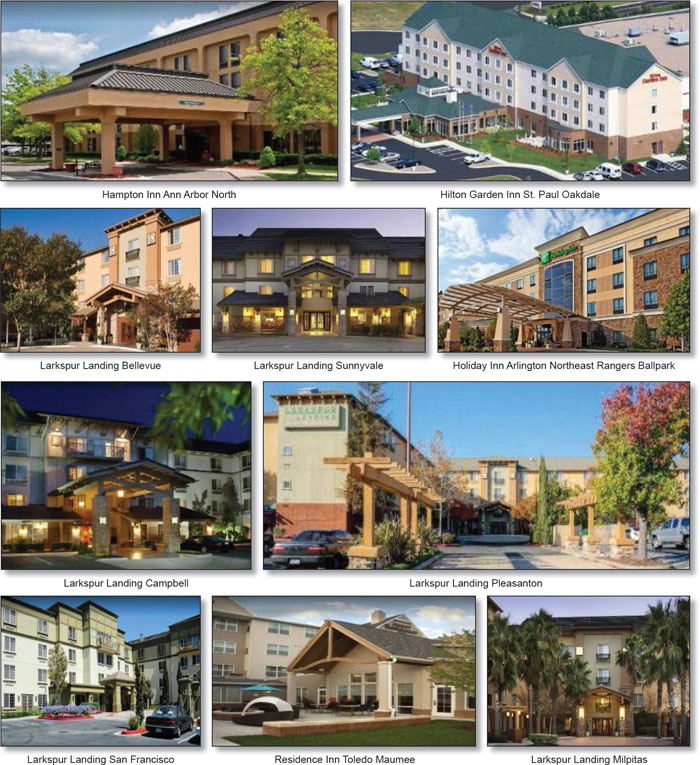
This is not a research report and was not prepared by any Underwriter’s research department. Please see additional important information and qualifications at the end of this Term Sheet.
| T-40 |
BANK 2017-BNK5 | Starwood Capital Group Hotel Portfolio |
Mortgage Loan No. 2 – Starwood Capital Group Hotel Portfolio
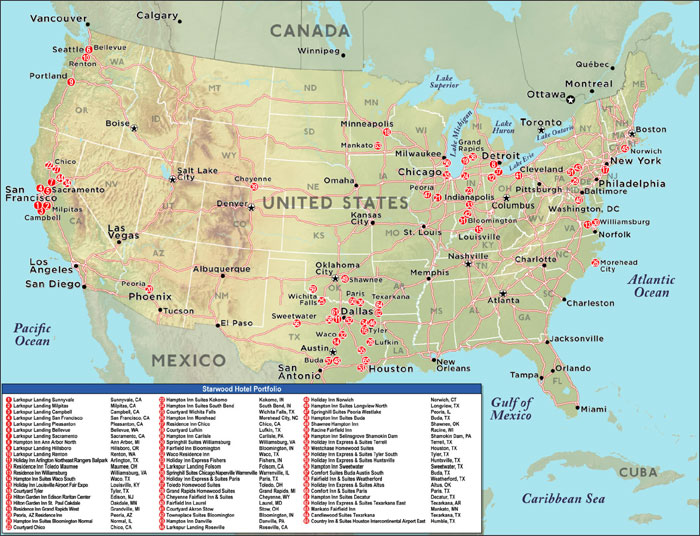
This is not a research report and was not prepared by any Underwriter’s research department. Please see additional important information and qualifications at the end of this Term Sheet.
| T-41 |
BANK 2017-BNK5 | Starwood Capital Group Hotel Portfolio |
| Mortgage Loan No. 2 – Starwood Capital Group Hotel Portfolio |
| Mortgage Loan Information | Property Information | ||||||
| Mortgage Loan Seller: | BANA | Single Asset/Portfolio: | Portfolio | ||||
| Original Balance(1): | $72,500,000 | Location: | Various | ||||
| Cut-off Date Balance(1): | $72,500,000 | General Property Type: | Hospitality | ||||
| % of Initial Pool Balance: | 5.9% | Detailed Property Type: | Various | ||||
| Loan Purpose: | Refinance | Title Vesting(4): | Fee / Leasehold | ||||
| Sponsor: | Starwood Capital Group Global, L.P.; | Year Built/Renovated: | Various / Various | ||||
| Starwood Capital Group Global II, L.P.; | Size: | 6,366 Rooms | |||||
| Starwood Capital Group Global I, | Cut-off Date Balance Per Room(1): | $90,680 | |||||
| L.L.C. | Maturity Date Balance Per Room(1): | $90,680 | |||||
| Mortgage Rate: | 4.4860% | Property Manager(5): | Various | ||||
| Note Date: | 5/24/2017 | ||||||
| First Payment Date: | 7/1/2017 | ||||||
| Maturity Date: | 6/1/2027 | ||||||
| Original Term: | 120 months | ||||||
| Original Amortization Term: | 0 months | ||||||
| IO Period: | 120 months | Underwriting and Financial Information | |||||
| Seasoning: | 0 months | UW NOI: | $71,329,392 | ||||
| Prepayment Provisions: | LO (12); YM1 (105); O(3) | UW NOI Debt Yield: | 12.4% | ||||
| Lockbox/Cash Mgmt Status: | Soft/Springing | UW NOI Debt Yield at Maturity: | 12.4% | ||||
| Additional Debt Type(2): | Pari Passu | UW NCF DSCR: | 2.72x | ||||
| Additional Debt Balance(2): | $504,770,000 | Most Recent NOI: | $72,574,924 (3/31/2017 TTM) | ||||
| Future Debt Permitted (Type)(2): | Yes (Mezzanine) | 2nd Most Recent NOI: | $74,469,397 (12/31/2016) | ||||
| Reserves(3) | 3rd Most Recent NOI: | $74,006,639 (12/31/2015) | |||||
| Type | Initial | Monthly | Cap | Most Recent Occupancy: | 74.6% (3/31/2017) | ||
| RE Tax: | $0 | Springing | N/A | 2nd Most Recent Occupancy: | 74.7% (12/31/2016) | ||
| Insurance: | $0 | Springing | N/A | 3rd Most Recent Occupancy: | 74.8% (12/31/2015) | ||
| Recurring Replacements: | $0 | Springing(3) | N/A | Appraised Value (as of)(6): | $956,000,000 (4/23/2017) | ||
| Other: | $12,268,991 | Springing | N/A | Cut-off Date LTV Ratio(1): | 60.4% | ||
| Maturity Date LTV Ratio(1): | 60.4% | ||||||
| Sources and Uses | ||||||
| Sources | Proceeds | % of Total | Uses | Proceeds | % of Total | |
| Loan Amount(1): | $577,270,000 | 100.0% | Loan Payoff: | $425,033,863 | 73.6% | |
| Closing Costs: | $8,975,399 | 1.6% | ||||
| Reserves: | $12,268,991 | 2.1% | ||||
| Return of Equity: | $130,991,748 | 22.7% | ||||
| Total Sources: | $577,270,000 | 100.0% | Total Uses: | $577,270,000 | 100.0% | |
| (1) | The Starwood Capital Group Hotel Portfolio Mortgage Loan is part of the Starwood Capital Group Hotel Portfolio Whole Loan, which is comprised of seventeen pari passu promissory notes with an aggregate principal balance of $577,270,000. The Cut-off Date Balance Per Room, Maturity Date Balance Per Room, UW NOI Debt Yield, UW NOI Debt Yield at Maturity, UW NCF DSCR, Cut-off Date LTV Ratio and Maturity Date LTV Ratio numbers presented above are based on the aggregate principal balance of the promissory notes comprising the Starwood Capital Group Hotel Portfolio Whole Loan. |
| (2) | See “The Mortgage Loan”, and “Additional Secured Indebtedness (not including trade debts)” and “Mezzanine Loan and Preferred Equity” for a discussion of the additional debt. |
| (3) | See “Escrows and Reserves” below for further discussion of reserve requirements. |
| (4) | Hilton Garden Inn Edison Raritan Center (1.8% of allocated loan amounts) is subject to a ground lease. See “Ground Leases” below for further details. |
| (5) | The Property Managers include: Hersha Hospitality Management L.P. (“Hersha”), First Hospitality Group, Inc. (“First Hospitality”), TMI Property Management, L.L.C. (“TMI”), Schulte Hospitality Group, Inc. (“Schulte”) and Pillar Hotels and Resorts, LLC (“Pillar”). |
| (6) | The “As Portfolio” Appraised Value of $956.0 million reflects an 8.1% premium attributed to the aggregate “As-is” value of the Starwood Capital Group Hotel Portfolio Properties as a whole. The sum of the value of the “As-is” and “As-renovated” values, as applicable, for each of the Starwood Capital Group Hotel Portfolio Properties on an individual basis is $889.2 million, which represents a Cut-off Date LTV Ratio and Maturity Date LTV Ratio of 64.9%. Additionally, the aggregate “As-is” value for each individual property as of April 23, 2017 is $884.7 million, which results in a Cut-off Date LTV Ratio and Maturity Date LTV Ratio of 65.3%. |
The Mortgage Loan. The second largest mortgage loan (the “Starwood Capital Group Hotel Portfolio Mortgage Loan”) is part of a whole loan (the “Starwood Capital Group Hotel Portfolio Whole Loan”) evidenced by seventeenpari passupromissory notes in the aggregate original principal amount of $577,270,000. The Starwood Capital Group Hotel Portfolio Whole Loan is secured by the fee simple, leasehold and operating leasehold interests in a hospitality portfolio consisting of 65 properties and 6,366 rooms located across 21 states throughout the continental United States (the “Starwood Capital Group Hotel Portfolio Properties”). The Starwood Capital Group Hotel Portfolio Whole Loan was co-originated by Bank of America, N.A., Barclays Bank, PLC, Deutsche Bank, AG, New York Branch and JP Morgan Chase Bank, N.A. Promissory Note A-3, in the original principal amount of $72,500,000, represents the Starwood Capital Group Hotel Portfolio Mortgage Loan, and will be included in the BANK 2017-BNK5 securitization trust.
This is not a research report and was not prepared by any Underwriter’s research department. Please see additional important information and qualifications at the end of this Term Sheet.
| T-42 |
BANK 2017-BNK5 | Starwood Capital Group Hotel Portfolio |
The following table presents a summary of the notes comprising the Starwood Capital Group Hotel Portfolio Whole Loan. The promissory notes identified below, other than the Starwood Capital Group Hotel Portfolio Mortgage Loan (such promissory notes, the “Starwood Capital Group Hotel PortfolioPari PassuCompanion Loans”) are expected to be contributed to future securitization transactions or may be otherwise transferred at any time. The Starwood Capital Group Hotel Portfolio Mortgage Loan will be serviced pursuant to the pooling and servicing agreement for the DBJPM 2017-C6 securitization transaction. See “Description of the Mortgage Pool—The Whole Loans—the Non-Serviced Whole Loans” and “Pooling and Servicing Agreement-Servicing of the Non-Serviced Mortgage Loans” in the Preliminary Prospectus.
| Starwood Capital Group Hotel Portfolio Whole Loan Summary | ||||
| Note | Original Balance | Cut-off Date Balance | Note Holder(1) | Controlling Piece |
| Note A-1 | $40,000,000 | $40,000,000 | DBJPM 2017-C6 | Yes |
| Note A-2 | $60,000,000 | $60,000,000 | JP Morgan Chase Bank, N.A. | No |
| Note A-3 | $72,500,000 | $72,500,000 | BANK 2017-BNK5 | No |
| Note A-4 | $59,317,500 | $59,317,500 | Bank of America, N.A. | No |
| Note A-5 | $50,000,000 | $50,000,000 | Barclays Bank, PLC | No |
| Note A-6 | $50,000,000 | $50,000,000 | Barclays Bank, PLC | No |
| Note A-7 | $40,000,000 | $40,000,000 | DBJPM 2017-C6 | No |
| Note A-8 | $20,000,000 | $20,000,000 | Deutsche Bank AG, New York Branch | No |
| Note A-9 | $20,000,000 | $20,000,000 | JP Morgan Chase Bank, N.A. | No |
| Note A-10 | $20,000,000 | $20,000,000 | Deutsche Bank AG, New York Branch | No |
| Note A-11 | $15,000,000 | $15,000,000 | Deutsche Bank AG, New York Branch | No |
| Note A-12 | $15,000,000 | $15,000,000 | Deutsche Bank AG, New York Branch | No |
| Note A-13 | $21,817,500 | $21,817,500 | Deutsche Bank AG, New York Branch | No |
| Note A-14 | $11,817,500 | $11,817,500 | JP Morgan Chase Bank, N.A. | No |
| Note A-15 | $25,000,000 | $25,000,000 | Starwood Capital Group, L.P.(2) | No |
| Note A-16 | $25,000,000 | $25,000,000 | Starwood Capital Group, L.P.(2) | No |
| Note A-17 | $31,817,500 | $31,817,500 | Barclays Bank, PLC | No |
| Total Starwood Capital Group Hotel Portfolio Whole Loan | $577,270,000 | $577,270,000 | ||
| (1) | The promissory notes (other than Note A-3) are expected to be contributed to future securitization transactions or may be otherwise transferred at any time. |
| (2) | Starwood Capital Group, L.P. is an affiliate of the Starwood Capital Group Hotel Portfolio Borrowers. The related co-lender agreement provides that Starwood Capital Group, L.P. will have no non-controlling noteholder rights. |
The Borrowers and the Sponsor. The borrowers consist of 92 single-purpose Delaware limited liability companies and 36 single-purpose Delaware limited partnerships, each structured to be bankruptcy remote, with two independent directors in its organizational structure (the “Starwood Capital Group Hotel Portfolio Borrowers”). There are two borrowers with respect to each of the Starwood Capital Group Portfolio Properties, the property owner
borrower and the operating lessee borrower.
The sponsors are any of Starwood Capital Group Global, L.P., Starwood Capital Group Global II, L.P. and Starwood Capital Group Global I, L.L.C. The non-recourse carve-out guarantor is SCG Hotel Investors Holdings, L.P., an affiliate of Starwood Capital Group, L.P. (“SCG”). The aggregate recourse to the guarantor related to bankruptcy or insolvency actions may not exceed an amount equal to 20% of the principal balance of the SCG Hotel Portfolio Whole Loan outstanding at the time of the occurrence of such event, plus reasonable third-party costs incurred by the lender in connection with the enforcement of its rights. See “Description of the Mortgage Pool–Non-Recourse Carveout Limitations” in the Preliminary Prospectus.
SCG is a private alternative investment firm with a primary focus on global real estate. Since its inception in 1991, SCG has raised over $40 billion of equity capital and currently manages over $51 billion in assets. Over the past 26 years, SCG has acquired over $86.5 billion of assets across various real estate asset classes, geographies and positions in the capital stack. SCG directly employs over 2,200 professionals and approximately 16,000 additional employees through various portfolio operating companies with offices in Atlanta, Chicago, Greenwich, Hong Kong, London, Los Angeles, Luxembourg, Miami, San Francisco and Washington, D.C.
The Properties. The Starwood Capital Group Hotel Portfolio Properties are comprised of 65 hotels offering a range of amenities, spanning the limited service, full service and extended stay varieties. The hotels range in size from 56 to 147 rooms, with an average count of 98 rooms. The Starwood Capital Group Hotel Portfolio Properties benefit from geographic and brand diversity. No individual portfolio property accounts for greater than 2.3% of total rooms or 5.8% of underwritten net cash flow. The top 10 properties based on allocated loan amount account for only 19.4% of total rooms and 35.1% of underwritten net cash flow. The hotels range in age from seven to 42 years old, with an average age of approximately 16 years, and 59.0% of the Starwood Capital Group Hotel Portfolio Properties based on underwritten net cash flow have been renovated since 2012.
This is not a research report and was not prepared by any Underwriter’s research department. Please see additional important information and qualifications at the end of this Term Sheet.
| T-43 |
BANK 2017-BNK5 | Starwood Capital Group Hotel Portfolio |
A summary detailing the composition of the portfolio by property sub-type is provided below:
| Starwood Capital Group Hotel Portfolio Sub-Property Types | ||||||||
| Property Sub-Type | # Hotels | #Rooms | % of Total Rooms | UW NCF | % of Total UW NCF | Appraised Value(1) | Appraised Value Per Room | TTM RevPAR Penetration(2) |
| Extended Stay | 22 | 2,244 | 35.2% | $35,078,267 | 49.2% | $441,700,000 | $196,836 | 112.5% |
| Limited Service | 40 | 3,734 | 58.7% | $32,572,979 | 45.7% | $403,300,000 | $108,007 | 131.5% |
| Full Service | 3 | 388 | 6.1% | $3,678,146 | 5.2% | $44,200,000 | $113,918 | 106.5% |
| Total / Weighted Average | 65 | 6,366 | 100.0% | $71,329,392 | 100.0% | $956,000,000 | $150,173 | 123.3% |
| (1) | The “As Portfolio” Appraised Value of $956.0 million reflects an 8.1% premium attributed to the aggregate “As-is” value of the Starwood Capital Group Hotel Portfolio Properties as a whole. The sum of the value of the “As-is” and “As-Renovated” values, as applicable, for each of the Starwood Capital Group Hotel Portfolio Properties on an individual basis is $889.2 million. Additionally, the aggregate “As-is” value for each individual property as of April 23, 2017 is $884.7 million. |
All 65 hotels in the Starwood Capital Group Hotel Portfolio are operated pursuant to management agreements with one of Hersha (39 hotels), First Hospitality (nine hotels), TMI (nine hotels), Schulte (six hotels) or Pillar (two hotels), as detailed in the below summary:
| Starwood Capital Group Hotel Management Company Summary | |||||||
| Management Company | # Hotels | #Rooms | % of Total Rooms | UW NCF | % of Total UW NCF | Appraised Value(1) | Appraised Value Per Room |
| Hersha | 39 | 3,859 | 60.6% | $44,857,243 | 62.9% | $565,900,000 | $146,644 |
| First Hospitality | 9 | 981 | 15.4% | $12,107,023 | 17.0% | $137,400,000 | $140,061 |
| TMI | 9 | 666 | 10.5% | $6,259,518 | 8.8% | $87,600,000 | $131,532 |
| Schulte | 6 | 692 | 10.9% | $5,458,243 | 7.7% | $69,700,000 | $100,723 |
| Pillar | 2 | 168 | 2.6% | $2,647,365 | 3.7% | $28,600,000 | $170,238 |
| Total | 65 | 6,366 | 100.0% | $71,329,392 | 100.0% | $956,000,000 | $150,078 |
| (1) | The “As Portfolio” Appraised Value of $956.0 million reflects an 8.1% premium attributed to the aggregate “As-is” value of the Starwood Capital Group Hotel Portfolio Properties as a whole. The sum of the value of the “As-is” and “As-if” values, as applicable, for each of the Starwood Capital Group Hotel Portfolio Properties on an individual basis is $889.2 million. Additionally, the aggregate “As-is” value for each individual property as of April 23, 2017 is $884.7 million. |
This is not a research report and was not prepared by any Underwriter’s research department. Please see additional important information and qualifications at the end of this Term Sheet.
| T-44 |
BANK 2017-BNK5 | Starwood Capital Group Hotel Portfolio |
A summary of the individual Starwood Capital Group Hotel Portfolio Properties is provided below:
| Starwood Capital Group Hotel Portfolio Property Summary | ||||||||||
| Property Name | City / State | Rooms | Year Built / Renovated | Allocated Loan Amount (“ALA”) | % of ALA | Appraised Value(1) | UW NCF | % of UW NCF | TTM Occupancy | TTM RevPAR Penetration(2) |
| Larkspur Landing Sunnyvale | Sunnyvale, CA | 126 | 2000 / NAP | $34,068,063 | 5.9% | $52,100,000 | $4,171,961 | 5.8% | 83.8% | 105.3% |
| Larkspur Landing Milpitas | Milpitas, CA | 124 | 1998 / NAP | 28,706,103 | 5.0% | 43,900,000 | 3,562,157 | 5.0% | 85.7% | 111.6% |
| Larkspur Landing Campbell | Campbell, CA | 117 | 2000 / NAP | 25,240,446 | 4.4% | 38,600,000 | 3,199,426 | 4.5% | 84.3% | 93.3% |
| Larkspur Landing San Francisco | S. San Francisco, CA | 111 | 1999 / NAP | 20,793,943 | 3.6% | 31,800,000 | 2,426,585 | 3.4% | 84.9% | 83.6% |
| Larkspur Landing Pleasanton | Pleasanton, CA | 124 | 1997 / NAP | 20,336,214 | 3.5% | 31,100,000 | 2,438,362 | 3.4% | 82.9% | 87.8% |
| Larkspur Landing Bellevue | Bellevue, WA | 126 | 1998 / NAP | 18,112,963 | 3.1% | 27,700,000 | 2,173,526 | 3.0% | 78.8% | 108.6% |
| Larkspur Landing Sacramento | Sacramento, CA | 124 | 1998 / NAP | 13,535,680 | 2.3% | 20,700,000 | 1,816,912 | 2.5% | 83.0% | 110.0% |
| Hampton Inn Ann Arbor North | Ann Arbor, MI | 129 | 1988 / 2015 | 13,208,731 | 2.3% | 20,200,000 | 1,836,126 | 2.6% | 73.9% | 123.7% |
| Larkspur Landing Hillsboro | Hillsboro, OR | 124 | 1997 / NAP | 13,208,731 | 2.3% | 20,200,000 | 1,708,763 | 2.4% | 74.1% | 77.6% |
| Larkspur Landing Renton | Renton, WA | 127 | 1998 / NAP | 13,077,951 | 2.3% | 20,000,000 | 1,694,132 | 2.4% | 80.3% | 103.3% |
| Holiday Inn Arlington NE Rangers Ballpark | Arlington, TX | 147 | 2008 / 2013 | 12,554,833 | 2.2% | 19,200,000 | 1,537,247 | 2.2% | 78.3% | 100.5% |
| Residence Inn Toledo Maumee | Maumee, OH | 108 | 2008 / 2016 | 12,424,054 | 2.2% | 19,000,000 | 1,468,871 | 2.1% | 81.7% | 142.7% |
| Residence Inn Williamsburg | Williamsburg, VA | 108 | 1999 / 2012 | 11,900,936 | 2.1% | 18,200,000 | 1,358,744 | 1.9% | 73.0% | 158.8% |
| Hampton Inn Suites Waco South | Waco, TX | 123 | 2008 / 2013 | 10,985,479 | 1.9% | 16,800,000 | 1,414,791 | 2.0% | 77.7% | 116.2% |
| Holiday Inn Louisville Airport Fair Expo | Louisville, KY | 106 | 2008 / NAP | 10,789,310 | 1.9% | 16,500,000 | 1,388,767 | 1.9% | 72.9% | 102.1% |
| Courtyard Tyler | Tyler, TX | 121 | 2010 / 2016 | 10,593,141 | 1.8% | 16,200,000 | 1,253,360 | 1.8% | 58.8% | 125.6% |
| Hilton Garden Inn Edison Raritan Center(3) | Edison, NJ | 132 | 2002 / 2014 | 10,593,141 | 1.8% | 16,200,000 | 1,317,397 | 1.8% | 78.1% | 135.7% |
| Hilton Garden Inn St Paul Oakdale | Oakdale, MN | 116 | 2005 / 2013 | 10,462,361 | 1.8% | 16,000,000 | 1,689,847 | 2.4% | 80.0% | 141.9% |
| Residence Inn Grand Rapids West | Grandville, MI | 90 | 2000 / 2017 | 10,331,582 | 1.8% | 15,800,000(5) | 1,106,127 | 1.6% | 72.6% | 115.2% |
| Peoria, AZ Residence Inn | Peoria, AZ | 90 | 1998 / 2013 | 10,266,192 | 1.8% | 15,700,000(5) | 1,158,027 | 1.6% | 80.8% | 145.9% |
| Hampton Inn Suites Bloomington Normal | Normal, IL | 128 | 2007 / 2015 | 10,200,802 | 1.8% | 15,600,000 | 1,396,943 | 2.0% | 70.8% | 123.5% |
| Courtyard Chico | Chico, CA | 90 | 2005 / 2015 | 10,004,633 | 1.7% | 15,300,000(5) | 1,439,185 | 2.0% | 84.6% | 157.5% |
| Hampton Inn Suites Kokomo | Kokomo, IN | 105 | 1997 / 2013 | 9,677,684 | 1.7% | 14,800,000 | 1,255,566 | 1.8% | 77.9% | 158.5% |
| Hampton Inn Suites South Bend | South Bend, IN | 117 | 1997 / 2014 | 9,677,684 | 1.7% | 14,800,000 | 1,232,210 | 1.7% | 69.9% | 113.2% |
| Courtyard Wichita Falls | Wichita Falls, TX | 93 | 2009 / 2017 | 9,219,956 | 1.6% | 14,100,000 | 1,095,610 | 1.5% | 77.4% | 106.0% |
| Hampton Inn Morehead | Morehead City, NC | 118 | 1991 / 2017 | 8,958,397 | 1.6% | 13,700,000(5) | 1,094,065 | 1.5% | 66.6% | 139.7% |
| Residence Inn Chico | Chico, CA | 78 | 2005 / 2014 | 8,696,838 | 1.5% | 13,300,000 | 1,208,180 | 1.7% | 88.0% | 166.0% |
| Courtyard Lufkin | Lufkin, TX | 101 | 2009 / 2017 | 8,304,499 | 1.4% | 12,700,000(5) | 738,285 | 1.0% | 64.9% | 105.9% |
| Hampton Inn Carlisle | Carlisle, PA | 97 | 1997 / 2014 | 8,239,109 | 1.4% | 12,600,000 | 1,116,905 | 1.6% | 76.1% | 175.6% |
| Springhill Suites Williamsburg | Williamsburg, VA | 120 | 2002 / 2012 | 8,239,109 | 1.4% | 12,600,000 | 876,108 | 1.2% | 71.7% | 106.8% |
| Fairfield Inn Bloomington | Bloomington, IN | 105 | 1995 / 2015 | 8,173,720 | 1.4% | 12,500,000 | 1,271,230 | 1.8% | 87.1% | 106.3% |
| Waco Residence Inn | Waco, TX | 78 | 1997 / 2012 | 7,977,550 | 1.4% | 12,200,000(5) | 912,234 | 1.3% | 82.0% | 112.5% |
| Holiday Inn Express Fishers | Fishers, IN | 115 | 2000 / 2012 | 7,454,432 | 1.3% | 11,400,000 | 951,428 | 1.3% | 67.1% | 90.5% |
| Larkspur Landing Folsom | Folsom, CA | 84 | 2000 / NAP | 7,258,263 | 1.3% | 11,100,000 | 858,864 | 1.2% | 86.4% | 98.1% |
| Springhill Suites Chi. Naperville Warrenville | Warrenville, IL | 128 | 1997 / 2013 | 6,865,924 | 1.2% | 10,500,000 | 667,822 | 0.9% | 67.1% | 96.1% |
| Holiday Inn Express & Suites Paris | Paris, TX | 84 | 2009 / NAP | 6,800,535 | 1.2% | 10,400,000 | 798,480 | 1.1% | 72.6% | 126.5% |
| Toledo Homewood Suites | Maumee, OH | 78 | 1997 / 2014 | 6,800,535 | 1.2% | 10,400,000(5) | 944,205 | 1.3% | 82.2% | 123.0% |
| Grand Rapids Homewood Suites | Grand Rapids, MI | 78 | 1997 / 2013 | 6,604,365 | 1.1% | 10,100,000(5) | 739,572 | 1.0% | 84.1% | 113.7% |
| Cheyenne Fairfield Inn and Suites | Cheyenne, WY | 60 | 1994 / 2013 | 6,146,637 | 1.1% | 9,400,000(5) | 753,591 | 1.1% | 74.6% | 117.6% |
| Fairfield Inn Laurel | Laurel, MD | 109 | 1988 / 2013 | 6,146,637 | 1.1% | 9,400,000 | 657,471 | 0.9% | 79.9% | 139.2% |
| Courtyard Akron Stow | Stow, OH | 101 | 2005 / 2014 | 6,015,858 | 1.0% | 9,200,000 | 886,115 | 1.2% | 65.9% | 98.4% |
| Larkspur Landing Roseville | Roseville, CA | 90 | 1999 / NAP | 5,688,909 | 1.0% | 8,700,000 | 786,149 | 1.1% | 79.5% | 96.9% |
| Towneplace Suites Bloomington | Bloomington, IN | 83 | 2000 / 2013 | 5,688,909 | 1.0% | 8,700,000 | 850,105 | 1.2% | 89.1% | 101.3% |
| Hampton Inn Danville | Danville, PA | 71 | 1998 / 2013 | 5,623,519 | 1.0% | 8,600,000 | 728,609 | 1.0% | 80.0% | 222.0% |
| Holiday Inn Norwich | Norwich, CT | 135 | 1975 / 2013 | 5,558,129 | 1.0% | 8,500,000 | 752,132 | 1.1% | 56.7% | 116.3% |
| Hampton Inn Suites Longview North | Longview, TX | 91 | 2008 / 2013 | 5,492,740 | 1.0% | 8,400,000 | 650,443 | 0.9% | 63.8% | 129.8% |
| Springhill Suites Peoria Westlake | Peoria, IL | 124 | 2000 / 2013 | 5,492,740 | 1.0% | 8,400,000 | 470,046 | 0.7% | 63.3% | 89.1% |
| Hampton Inn Suites Buda | Buda, TX | 74 | 2008 / NAP | 5,427,350 | 0.9% | 8,300,000 | 853,603 | 1.2% | 74.5% | 139.5% |
| Shawnee Hampton Inn | Shawnee, OK | 63 | 1996 / 2013 | 5,427,350 | 0.9% | 8,300,000(5) | 618,775 | 0.9% | 77.6% | 146.0% |
| Racine Fairfield Inn | Racine, WI | 62 | 1991 / 2016 | 5,296,570 | 0.9% | 8,100,000(5) | 603,823 | 0.8% | 68.6% | 154.1% |
| HI Selinsgrove Shamokin Dam | Shamokin Dam, PA | 75 | 1996 / 2013 | 5,165,791 | 0.9% | 7,900,000 | 687,279 | 1.0% | 75.6% | 184.0% |
| Holiday Inn Express & Suites Terrell | Terrell, TX | 68 | 2007 / 2013 | 4,904,232 | 0.8% | 7,500,000 | 605,485 | 0.8% | 84.0% | 183.4% |
| Westchase Homewood Suites | Houston, TX | 96 | 1998 / 2016 | 4,746,774 | 0.8% | 9,800,000(5) | 379,742 | 0.5% | 63.4% | 142.9% |
| HIE & Suites Tyler South | Tyler, TX | 88 | 2000 / 2015 | 4,708,062 | 0.8% | 7,200,000 | 599,880 | 0.8% | 65.9% | 132.5% |
| HIE & Suites Huntsville | Huntsville, TX | 87 | 2008 / 2013 | 4,511,893 | 0.8% | 6,900,000 | 689,387 | 1.0% | 65.5% | 243.3% |
| Hampton Inn Sweetwater | Sweetwater, TX | 72 | 2009 / NAP | 4,119,555 | 0.7% | 6,300,000 | 400,369 | 0.6% | 62.9% | 132.2% |
| Comfort Suites Buda Austin South | Buda, TX | 72 | 2009 / NAP | 3,465,657 | 0.6% | 5,300,000 | 541,569 | 0.8% | 76.8% | 109.7% |
| Fairfield Inn & Suites Weatherford | Weatherford, TX | 86 | 2009 / 2016 | 3,269,488 | 0.6% | 5,000,000 | 311,718 | 0.4% | 63.4% | 91.1% |
| Holiday Inn Express & Suites Altus | Altus, OK | 68 | 2008 / 2013 | 2,649,352 | 0.5% | 4,600,000 | 211,948 | 0.3% | 67.4% | 151.2% |
| Comfort Inn & Suites Paris | Paris, TX | 56 | 2009 / NAP | 2,354,031 | 0.4% | 3,600,000 | 251,060 | 0.4% | 67.4% | 146.2% |
| Hampton Inn Suites Decatur | Decatur, TX | 74 | 2008 / 2013 | 2,252,646 | 0.4% | 3,600,000 | 180,212 | 0.3% | 64.6% | 228.4% |
| Holiday Inn Express & Suites Texarkana E. | Texarkana, AR | 88 | 2009 / NAP | 2,086,036 | 0.4% | 4,100,000 | 166,883 | 0.2% | 66.5% | 100.5% |
| Mankato Fairfield Inn | Mankato, MN | 61 | 1997 / 2016 | 1,869,354 | 0.3% | 3,600,000 | 149,548 | 0.2% | 58.0% | 100.2% |
| Candlewood Suites Texarkana | Texarkana, TX | 80 | 2009 / 2014 | 1,445,301 | 0.3% | 2,600,000 | 115,624 | 0.2% | 75.0% | 110.1% |
| Country Inn & Suites Houston IC Airport E. | Humble, TX | 62 | 2001 / 2017 | 1,372,592 | 0.2% | 3,200,000 | 109,807 | 0.2% | 54.1% | 86.8% |
| Total / Weighted Average | 6,366 | $577,270,000 | 100.0% | $889,200,000 | $71,329,392 | 100.0% | 74.6% | 123.3% | ||
| Total with Portfolio Premium | $956,000,000 | |||||||||
| (1) | The “As Portfolio” Appraised Value of $956.0 million reflects an 8.1% premium attributed to the aggregate “As-is” value of the Starwood Capital Group Hotel Portfolio Properties as a whole. The sum of the value of the “As-is” and “As-Renovated” values, as applicable, for each of the Starwood Capital Group Hotel Portfolio Properties on an individual basis is $889.2 million. Additionally, the aggregate “As-is” value for each individual property as of April 23, 2017 is $884.7 million. |
| (2) | TTM RevPAR Penetration is based on operating statements as of March 31, 2017 provided by the Starwood Capital Group Hotel Portfolio Borrowers and competitive set data provided from a third-party hospitality research report. The SCG Hotel Portfolio weighted average is weighted based on total room count. |
| (3) | Hilton Garden Inn Edison Raritan Center is subject to a ground lease, which commenced in September 2001 for a term of 75 years, with current annual ground rent of $275,517. |
| (4) | Country Inn & Suites Houston Intercontinental Airport East was out of service from May 2016 through January 2017 due to flood damage. The Starwood Capital Group Hotel Portfolio Borrowers used insurance proceeds of nearly $1.1 million to renovate the property, which is now back online. |
| (5) | “As-Renovated” appraised values are shown for twelve properties, which values assume the completion of certain property improvements, for which the lender has fully reserved. |
This is not a research report and was not prepared by any Underwriter’s research department. Please see additional important information and qualifications at the end of this Term Sheet.
| T-45 |
BANK 2017-BNK5 | Starwood Capital Group Hotel Portfolio |
The Starwood Capital Group Hotel Portfolio Properties benefit from well-known brand and flag affiliations, as well as related customer loyalty programs. Approximately 60.2% based on room count and 53.0% based on underwritten net cash flow of the portfolio is associated with Marriott or Hilton flags, providing the portfolio with institutional brand affiliations across the majority of the Starwood Capital Group Hotel Portfolio Properties. Approximately 20.1% based on room count and 34.8% by underwritten net cash flow of the portfolio is associated with the Larkspur Landing brand, all of which are located on the west coast. Larkspur Landing is an upscale select service and extended stay brand. The Larkspur Landing properties operate pursuant to a licensing agreement between the related operating companies (as licensee) and an affiliate of Starwood Capital Group (as licensor), which owns the licensing rights to the Larkspur Landing brand/flag. The Larkspur Landing licensing agreement for each applicable individual property calls for an annual license fee in the amount of $10 and may be terminated upon 60 days’ notice of termination by either the licensor or the licensee. Per the terms of the Starwood Capital Group Hotel Portfolio Whole Loan documents, the Larkspur Landing licensing agreements may not be terminated by the borrowers unless the borrowers replace the Larkspur Landing flag with a qualified franchisor.
In the event of any franchise or license agreement expiration, termination or cancellation in violation of the Starwood Capital Group Whole Loan documents, an excess cash flow sweep will be triggered (see “Lockbox and Cash Management”). Additionally, there is a recourse carve-out for any material amendment, modification, expiration, cancellation or termination of any franchise or Larkspur Landing license agreement without the prior written consent of the lender, in violation of the Starwood Capital Group Hotel Portfolio Whole Loan documents.
The Starwood Capital Group Hotel Portfolio Properties are operated under six brands and fourteen flags, a summary of which is provided below:
| Starwood Capital Group Hotel Portfolio Brand Summary | |||||||||
| Brand | # Hotels | # Rooms | % of Rooms | Allocated Loan Amount ($) | Allocated Loan Amount ($)/Room | Appraised Value(1) | LTV(1) | UW NCF | % UW NCF |
| Larkspur Landing(2)(3) | |||||||||
| Larkspur Landing | 11 | 1,277 | 20.1% | $200,027,266 | $156,638 | $305,900,000 | 65.4% | $24,836,836 | 34.8% |
| Total Larkspur Landing | 11 | 1,277 | 20.1% | $200,027,266 | $156,638 | $305,900,000 | 65.4% | $24,836,836 | 34.8% |
| Marriott(2) | |||||||||
| Residence Inn | 6 | 552 | 8.7% | $61,597,152 | $111,589 | $94,200,000 | 65.4% | $7,212,183 | 10.1% |
| Courtyard | 5 | 506 | 7.9% | $44,138,087 | $87,229 | $67,500,000 | 65.4% | $5,412,556 | 7.6% |
| Fairfield Inn & Suites | 6 | 483 | 7.6% | $30,902,406 | $63,980 | $48,000,000 | 64.4% | $3,747,382 | 5.3% |
| SpringHill Suites | 3 | 372 | 5.8% | $20,597,773 | $55,370 | $31,500,000 | 65.4% | $2,013,975 | 2.8% |
| TownePlace Suites | 1 | 83 | 1.3% | $5,688,909 | $68,541 | $8,700,000 | 65.4% | $850,105 | 1.2% |
| Total Marriot | 21 | 1,996 | 31.4% | $162,924,327 | $81,625 | $249,900,000 | 65.2% | $19,236,201 | 27.0% |
| Hilton | |||||||||
| Hampton Inn & Suites | 14 | 1,337 | 21.0% | $104,456,837 | $78,128 | $159,900,000 | 65.3% | $13,465,895 | 18.9% |
| Hilton Garden Inn | 2 | 248 | 3.9% | $21,055,502 | $84,901 | $32,200,000 | 65.4% | $3,007,244 | 4.2% |
| Homewood Suites | 3 | 252 | 4.0% | $18,151,674 | $72,030 | $30,300,000 | 59.9% | $2,063,519 | 2.9% |
| Total Hilton | 19 | 1,837 | 28.9% | $143,664,013 | $78,206 | $222,400,000 | 64.6% | $18,536,658 | 26.0% |
| IHG | |||||||||
| Holiday Inn Express | 7 | 598 | 9.4% | $33,114,542 | $55,375 | $52,100,000 | 63.6% | $4,023,491 | 5.6% |
| Holiday Inn | 3 | 388 | 6.1% | $28,902,272 | $74,490 | $44,200,000 | 65.4% | $3,678,146 | 5.2% |
| Candlewood | 1 | 80 | 1.3% | $1,445,301 | $18,066 | $2,600,000 | 55.6% | $115,624 | 0.2% |
| Total IHG | 11 | 1,066 | 16.7% | $63,462,115 | $59,533 | $98,900,000 | 64.2% | $7,817,261 | 11.0% |
| Choice | |||||||||
| Comfort Inn | 2 | 128 | 2.0% | $5,819,688 | $45,466 | $8,900,000 | 65.4% | $792,628 | 1.1% |
| Total Choice | 2 | 128 | 2.0% | $5,819,688 | $45,466 | $8,900,000 | 65.4% | $792,628 | 1.1% |
| Carlson | |||||||||
| Country Inn & Suites | 1 | 62 | 1.0% | $1,372,592 | $22,139 | $3,200,000 | 42.9% | $109,807 | 0.2% |
| Total Carlson | 1 | 62 | 1.0% | $1,372,592 | $22,139 | $3,200,000 | 42.9% | $109,807 | 0.2% |
| Total | 65 | 6,366 | 100.0% | $577,270,000 | $90,680 | $956,000,000 | 60.4% | $71,329,392 | 100.0% |
| (1) | The “As Portfolio” Appraised Value of $956.0 million reflects an 8.1% premium attributed to the aggregate “As-is” value of the Starwood Capital Group Hotel Portfolio Properties as a whole. The sum of the value of the “As-is” and “As-Renovated” values, as applicable, for each of the properties on an individual basis is $889.2 million. Additionally, the aggregate “As-is” value for each individual property as of April 23, 2017 is $884.7 million. |
| (2) | The Marriott and Larkspur Landing brand/flag are affiliated with Starwood Capital Group, L.P. |
| (3) | The Larkspur Landing individual properties operate pursuant to licensing agreements with an affiliate of the borrower sponsor, which may be terminated upon 60 days’ notice. There is a recourse carve-out for any material amendment, modification, expiration, cancellation or termination of any franchise or Larkspur Landing license agreement without the prior written consent of the lender in violation of the Starwood Capital Group Hotel Portfolio Whole Loan documents. Per the terms of the Starwood Capital Group Hotel Portfolio Whole Loan documents, the Larkspur Landing licensing agreements may not be terminated by the borrower unless the borrowers replace the Larkspur Landing flag with a qualified franchisor. |
This is not a research report and was not prepared by any Underwriter’s research department. Please see additional important information and qualifications at the end of this Term Sheet.
| T-46 |
BANK 2017-BNK5 | Starwood Capital Group Hotel Portfolio |
A summary of franchise agreement expirations within the Starwood Capital Group Hotel Portfolio is provided below:
| Starwood Capital Group Hotel Portfolio Franchise Expiration Schedule(1)(2) | ||||||||||
| Year | # Hotels | #Rooms | % of Total Rooms | UW NCF | % of Total UW NCF | Cumulative Rooms Expiring | Cumulative % of Rooms Expiring | Cumulative UW NCF Expiring | Cumulative % of UW NCF Expiring | |
| 2017 | 0 | 0 | 0.0% | $0 | 0.0% | 0 | 0.0% | $0 | 0.0% | |
| 2018 | 1 | 90 | 1.8% | $1,158,027 | 2.5% | 90 | 1.8% | $1,158,027 | 2.5% | |
| 2019 | 3 | 337 | 6.6% | $2,892,322 | 6.2% | 427 | 8.4% | $4,050,349 | 8.7% | |
| 2020 | 0 | 0 | 0.0% | $0 | 0.0% | 427 | 8.4% | $4,050,349 | 8.7% | |
| 2021 | 1 | 62 | 1.2% | $603,823 | 1.3% | 489 | 9.6% | $4,654,173 | 10.0% | |
| 2022 | 21 | 2,025 | 39.8% | $18,055,211 | 38.8% | 2,514 | 49.4% | $22,709,384 | 48.8% | |
| 2023 | 0 | 0 | 0.0% | $0 | 0.0% | 2,514 | 49.4% | $22,709,384 | 48.8% | |
| 2024 | 0 | 0 | 0.0% | $0 | 0.0% | 2,514 | 49.4% | $22,709,384 | 48.8% | |
| 2025 | 4 | 378 | 7.4% | $4,634,247 | 10.0% | 2,892 | 56.8% | $27,343,631 | 58.8% | |
| 2026 | 1 | 128 | 2.5% | $1,396,943 | 3.0% | 3,020 | 59.3% | $28,740,574 | 61.8% | |
| 2027 | 2 | 140 | 2.8% | $1,022,042 | 2.2% | 3,160 | 62.1% | $29,762,616 | 64.0% | |
| 2028 & Beyond | 21 | 1,929 | 37.9% | $16,729,941 | 36.0% | 5,089 | 100.0% | $46,492,556 | 100.0% | |
| Total(1) | 54 | 5,089 | 100.0% | $46,492,556 | 100.0% | |||||
| (1) | The information presented is exclusive of the Larkspur Landing properties, which operate pursuant to a licensing agreement with an affiliate of the borrower sponsor. The Larkspur Landing brand/flag is owned by an affiliate of Starwood Capital Group. |
| (2) | For individual lease expirations, see “Description of the Mortgage Pool—Mortgage Pool Characteristics—Property Types—Hospitality Properties” in the Preliminary Prospectus. |
Approximately $84.8 million ($13,319 per room) of capital expenditures have been made since 2012 in order to update the Starwood Capital Group Hotel Portfolio Properties. Going forward, the Starwood Capital Group Hotel Portfolio Borrowers have budgeted for approximately $28.8 million ($4,519 per room) in capital expenditures through 2019, of which approximately $5.9 million ($924 per room) is related to brand-mandated property improvement plans. At origination, the Starwood Capital Group Hotel Portfolio Borrowers reserved the approximately $5.9 million in capital expenditures related to a brand-mandated property improvement plan. Additionally, at loan origination, the Starwood Capital Group Hotel Portfolio Borrowers reserved approximately $6.4 million ($5,000 per Larkspur Landing-branded room) for any future capital work or FF&E associated with the Larkspur Landing properties. The remaining budgeted capital expenditures have not been reserved for and the Starwood Capital Group Hotel Portfolio Borrower is not required under the Starwood Capital Group Hotel Portfolio Whole Loan to complete the related capital improvements.
A summary of the historical and capital expenditures at the Starwood Capital Group Hotel Portfolio Properties is provided below:
| Starwood Capital Group Hotel Portfolio Historical Capital Expenditures | |||||
| 2012 | 2013 | 2014 | 2015 | 2016 | |
| Total | $15,974,481 | $28,295,183 | $14,870,099 | $10,258,955 | $15,388,521 |
| Per Room | $2,509 | $4,445 | $2,336 | $1,612 | $2,417 |
Historically, the Starwood Capital Group Hotel Portfolio Properties as a whole have outperformed their competitive set with occupancy, ADR and RevPAR penetration rates all in excess of 100.0% for 2014 through the trailing 12-month period ended March 31, 2017. The Starwood Capital Group Hotel Portfolio Properties have generally also outperformed on an individual basis, with 80.1% of the portfolio based on room count having achieved a RevPAR penetration in excess of 100.0% for the trailing 12-month period ended March 31, 2017.
A summary of the Starwood Capital Group Hotel Portfolio’s historical performance is provided below:
| Starwood Capital Group Hotel Portfolio Historical Occupancy, ADR, RevPAR(1) | |||||||||
| Year | Starwood Capital Group Hotel Portfolio | Competitive Set | Penetration Factor | ||||||
| Occupancy(2) | ADR(2) | RevPAR(2) | Occupancy(3) | ADR(3) | RevPAR(3) | Occupancy(4) | ADR(4) | RevPAR(4) | |
| 2014 | 73.7% | $112.28 | $82.80 | 66.0% | $103.25 | $67.56 | 111.7% | 108.7% | 122.6% |
| 2015 | 74.8% | $116.76 | $87.29 | 66.6% | $108.28 | $71.42 | 112.2% | 107.8% | 122.2% |
| 2016 | 74.7% | $119.48 | $89.23 | 65.9% | $110.28 | $71.95 | 113.4% | 108.3% | 124.0% |
| 3/31/2017 TTM | 74.6% | $119.07 | $88.81 | 65.9% | $110.31 | $72.05 | 113.1% | 107.9% | 123.3% |
| (1) | The variances between the underwriting, the hospitality research report and the above table with respect to Occupancy, ADR and RevPAR at the Starwood Capital Group Hotel Portfolio are attributable to variances in reporting methodologies and/or timing differences. |
| (2) | Based on operating statements provided by the borrower sponsor and weighted based on available rooms and occupied rooms, as applicable. |
| (3) | Competitive Set data for each individual property obtained from a third party hospitality research report. |
| (4) | Penetration Factor data for each individual property is based on operating statements provided by the borrower sponsor and competitive set data obtained from a third party hospitality research report. Portfolio level statistics are weighted based on total room count. |
This is not a research report and was not prepared by any Underwriter’s research department. Please see additional important information and qualifications at the end of this Term Sheet.
| T-47 |
BANK 2017-BNK5 | Starwood Capital Group Hotel Portfolio |
The Markets. The Starwood Capital Group Hotel Portfolio Properties have broad exposure across the United States with properties located across 21 states and 55 cities, with no individual state accounting for more than 16.8% of total rooms or 30.7% of underwritten net cash flow.
A summary of the regional representation of the Starwood Capital Group Hotel Portfolio Properties is provided below:
| Starwood Capital Group Hotel Portfolio Regional Summary | |||||||||
| Region | # Hotels | # Rooms | % of Total Rooms | TTM Occupancy(1) | TTM ADR(1) | TTM RevPAR(1) | TTM RevPAR Penetration(1) | UW NCF | % of UW NCF |
| California | 10 | 1,068 | 16.8% | 84.2% | $145.56 | $122.72 | 108.5% | $21,907,781 | 30.7% |
| Texas | 20 | 1,753 | 27.5% | 69.9% | $104.82 | $73.59 | 131.2% | $13,438,906 | 18.8% |
| Indiana | 5 | 525 | 8.2% | 77.4% | $109.06 | $83.34 | 114.0% | $5,560,538 | 7.8% |
| Washington | 2 | 253 | 4.0% | 79.6% | $122.67 | $97.56 | 105.9% | $3,867,658 | 5.4% |
| Michigan | 3 | 297 | 4.7% | 76.2% | $131.21 | $99.84 | 118.5% | $3,681,825 | 5.2% |
| Ohio | 3 | 287 | 4.5% | 76.3% | $121.58 | $92.95 | 121.8% | $3,299,191 | 4.6% |
| Illinois | 3 | 380 | 6.0% | 67.1% | $104.93 | $70.56 | 103.1% | $2,534,810 | 3.6% |
| Pennsylvania | 3 | 243 | 3.8% | 77.1% | $123.01 | $94.83 | 191.7% | $2,532,793 | 3.6% |
| Virginia | 2 | 228 | 3.6% | 72.3% | $118.96 | $86.15 | 131.4% | $2,234,852 | 3.1% |
| Minnesota | 2 | 177 | 2.8% | 72.4% | $120.21 | $89.03 | 127.6% | $1,839,395 | 2.6% |
| Oregon | 1 | 124 | 1.9% | 74.1% | $115.72 | $85.79 | 77.6% | $1,708,763 | 2.4% |
| Kentucky | 1 | 106 | 1.7% | 72.9% | $135.94 | $99.11 | 102.1% | $1,388,767 | 1.9% |
| New Jersey | 1 | 132 | 2.1% | 78.1% | $126.40 | $98.76 | 135.7% | $1,317,397 | 1.8% |
| Arizona | 1 | 90 | 1.4% | 80.8% | $120.72 | $97.54 | 145.9% | $1,158,027 | 1.6% |
| North Carolina | 1 | 118 | 1.9% | 66.6% | $108.23 | $72.10 | 139.7% | $1,094,065 | 1.5% |
| Oklahoma | 2 | 131 | 2.1% | 72.3% | $94.31 | $68.74 | 148.7% | $830,723 | 1.2% |
| Wyoming | 1 | 60 | 0.9% | 74.6% | $118.88 | $88.74 | 117.6% | $753,591 | 1.1% |
| Connecticut | 1 | 135 | 2.1% | 56.7% | $131.41 | $74.49 | 116.3% | $752,132 | 1.1% |
| Maryland | 1 | 109 | 1.7% | 79.9% | $97.48 | $77.87 | 139.2% | $657,471 | 0.9% |
| Wisconsin | 1 | 62 | 1.0% | 68.6% | $115.68 | $79.34 | 154.1% | $603,823 | 0.8% |
| Arkansas | 1 | 88 | 1.4% | 66.5% | $75.50 | $50.18 | 100.5% | $166,883 | 0.2% |
| Total / Wtd. Avg. | 65 | 6,366 | 100.0% | 74.6% | $119.07 | $88.81 | 123.3% | $71,329,392 | 100.0% |
| (1) | TTM Occupancy, TTM ADR and TTM RevPAR are based on borrower sponsor provided operating statements dated as of March 31, 2017, and weighted based on available rooms and occupied rooms, as applicable. TTM RevPAR Penetration is calculated based on operating statements provided by the borrowers and competitive set data provided by a third-party hospitality research report, and weighted based on total rooms. The minor variances between the underwriting, the hospitality research report and the above table with respect to Occupancy, ADR and RevPAR at the Starwood Capital Group Hotel Portfolio Properties are attributable to variances in reporting methodologies and/or timing differences. |
This is not a research report and was not prepared by any Underwriter’s research department. Please see additional important information and qualifications at the end of this Term Sheet.
| T-48 |
BANK 2017-BNK5 | Starwood Capital Group Hotel Portfolio |
Operating History and Underwritten Net Cash Flow.The following table presents certain information relating to the historical operating performance and the Underwritten Net Cash Flow at the Starwood Capital Group Hotel Portfolio Properties:
| Cash Flow Analysis | |||||||||||||
| 2014 | 2015 | 2016 | 3/31/2017 TTM | U/W | U/W per Room(1) | ||||||||
| Occupancy | 73.7% | 74.8% | 74.7% | 74.6% | 74.6% | ||||||||
| ADR | $112.28 | $116.76 | $119.48 | $119.07 | $118.83 | ||||||||
| RevPAR | $82.80 | $87.29 | $89.23 | $88.81 | $88.68 | ||||||||
| Room Revenue | $192,509,535 | $202,927,905 | $206,707,091 | $205,120,564 | $206,046,538 | $32,367 | |||||||
| F&B Revenue | 4,481,265 | 5,413,425 | 5,367,185 | 5,436,865 | 5,449,118 | 856 | |||||||
| Other Revenue | 2,518,145 | 1,839,946 | 2,161,754 | 2,093,187 | 2,104,554 | 331 | |||||||
| Total Revenue | $199,508,945 | $210,181,276 | $214,236,030 | $212,650,616 | $213,600,210 | $33,553 | |||||||
| Room Expense | $43,419,428 | $44,601,150 | $46,539,452 | $46,836,463 | $47,702,619 | $7,493 | |||||||
| F&B Expense | 3,731,961 | 4,181,990 | 3,877,875 | 3,826,532 | 3,826,294 | 601 | |||||||
| Other Departmental Expenses | 2,076,802 | 754,103 | 883,759 | 857,468 | 857,390 | 135 | |||||||
| Departmental Expenses | $49,228,191 | $49,537,243 | $51,301,086 | $51,520,462 | $52,386,303 | $8,229 | |||||||
| Departmental Profit | $150,280,754 | $160,644,033 | $162,934,944 | $161,130,154 | $161,213,908 | $25,324 | |||||||
| Operating Expenses | $56,768,412 | $60,404,169 | $61,876,151 | $62,127,172 | $62,263,971 | $9,781 | |||||||
| Gross Operating Profit | $93,512,342 | $100,239,865 | $101,058,793 | $99,002,982 | $98,949,936 | $15,544 | |||||||
| Management Fee | $6,387,948 | $6,809,293 | $6,853,190 | $6,818,728 | $7,967,134 | $1,252 | |||||||
| Property Taxes | 8,481,331 | 8,752,425 | 8,874,165 | 8,811,094 | 8,818,912 | 1,385 | |||||||
| Property Insurance | 1,772,892 | 1,800,134 | 1,821,444 | 1,812,439 | 1,809,568 | 284 | |||||||
| Ground Lease Expense | 261,733 | 287,860 | 284,102 | 292,098 | 292,098 | 46 | |||||||
| Other Expenses | 76,316 | 0 | 0 | 0 | 0 | 0 | |||||||
| FF&E | 7,980,358 | 8,583,513 | 8,756,495 | 8,693,699 | 8,732,831 | 1,372 | |||||||
| Total Other Expenses | $24,960,579 | $26,233,225 | $26,589,396 | $26,428,058 | $27,620,544 | $4,339 | |||||||
| Net Operating Income | $68,551,763 | $74,006,639 | $74,469,397 | $72,574,924 | $71,329,392 | $11,205 | |||||||
| Net Cash Flow | $68,551,763 | $74,006,639 | $74,469,397 | $72,574,924 | $71,329,392 | $11,205 | |||||||
| NOI DSCR(2) | 2.61x | 2.82x | 2.84x | 2.76x | 2.72x | ||||||||
| NCF DSCR(2) | 2.61x | 2.82x | 2.84x | 2.76x | 2.72x | ||||||||
| NOI Debt Yield(2) | 11.9% | 12.8% | 12.9% | 12.6% | 12.4% | ||||||||
| NCF Debt Yield(2) | 11.9% | 12.8% | 12.9% | 12.6% | 12.4% | ||||||||
| (1) | U/W per Room is based on a total of 6,366 rooms. |
| (2) | Debt service coverage ratios and debt yields are based on the Starwood Capital Group Hotel Portfolio Whole Loan. |
Escrows and Reserves.At loan origination, the Starwood Capital Group Hotel Portfolio Borrowers established a (i) $6,385,000 Larkspur Landing FF&E capital work reserve to be used towards capital work and FF&E expenditures only at the Larkspur Landing flagged properties and (ii) $5,883,991 existing capital work reserve to be used towards existing capital improvement and property improvement plan work as described in the Starwood Capital Group Hotel Portfolio Whole Loan documents.
Commencing in July 2017, the Starwood Capital Group Hotel Portfolio Borrowers are required to make monthly deposits equal to 1/12th of the greater of (a) 4.0% of gross revenues for the calendar month two months prior and (b) the amount required under the related franchise agreements for FF&E work. For any future capital work required under any franchise agreement, the Starwood Capital Group Hotel Portfolio Borrowers are required to deposit into a future capital work reserve account an amount equal to (x) 100.0% of any future capital work required pursuant to a replacement franchise agreement mandated property improvement plan less (y) any amounts then on deposit in the FF&E reserve account (provided that a capital work guaranty or a letter of credit may be provided by the Starwood Capital Group Hotel Portfolio guarantor in lieu of such deposit).
Upon the occurrence and during the continuance of a Trigger Period (as defined below), on a monthly basis, the Starwood Capital Group Hotel Portfolio Borrowers are required to make deposits of (i) 1/12 of the required annual taxes, (ii) 1/12 of the annual insurance premiums (unless an acceptable blanket policy is in place) and (iii) 1/12 of the ground rent due under the ground lease encumbering the single leasehold property.
A “Trigger Period” will occur upon (i) an event of default under the Starwood Capital Group Hotel Portfolio Whole Loan, (ii) any bankruptcy or insolvency action of the Starwood Capital Group Hotel Portfolio Borrowers or property managers, (iii) any termination, expiration or cancellation of a franchise agreement or Larkspur Landing license agreement in violation of the Starwood Capital Group Hotel Portfolio Whole Loan documents or (iv) the debt service coverage ratio for the Starwood Capital Group Hotel Portfolio Whole Loan being below 1.75x.
This is not a research report and was not prepared by any Underwriter’s research department. Please see additional important information and qualifications at the end of this Term Sheet.
| T-49 |
BANK 2017-BNK5 | Starwood Capital Group Hotel Portfolio |
A Trigger Period will end upon: (a) with respect to clause (i) above, a cure of the event of default; (b) with respect to clause (ii) above, only with respect to a bankruptcy or insolvency action of the Starwood Capital Group Hotel Portfolio Borrowers, the Starwood Capital Group Hotel Portfolio Borrowers’ bankruptcy or insolvency action being discharged, stayed or dismissed; (c) with respect to clause (ii) above, only with respect to a bankruptcy or insolvency action of a property manager, the Starwood Capital Group Hotel Portfolio Borrowers entering into a replacement management agreement with a qualified manager within 60 days of the initial bankruptcy or insolvency action; (d) with respect to clause (iii) above, the Starwood Capital Group Hotel Portfolio Borrowers entering into a replacement franchise agreement with a qualified franchisor within 60 days of the existing franchise agreement expiration, cancellation or termination; and (e) with respect to clause (iv) above, the debt service coverage ratio being equal to or greater than 1.75x for two consecutive calendar quarters, which may be achieved (provided such prepayment is to be accompanied by applicable yield maintenance premium) by a prepayment of principal or deposit of cash in an amount such that the debt service coverage ratio is at least 1.75x for two consecutive calendar quarters. In addition, a Trigger Period related to one individual property can be cured by the release of that individual property in accordance with the conditions set forth below under “Release of Property”.
Lockbox and Cash Management.At loan origination the Starwood Capital Group Hotel Portfolio Borrowers were required to establish seven lender-controlled lockbox accounts. Upon the occurrence and during the continuance of a Cash Management Trigger Period (as defined below), all rents and payments (including credit card receivables) are required to be deposited directly into the applicable lender-controlled lockbox account and swept each business day into the applicable borrower operating account, unless a Trigger Period has occurred and is continuing, in which case such funds are required to be swept each business day into the applicable lender-controlled cash management account and disbursed on each payment date in accordance with the Starwood Capital Group Hotel Portfolio Whole Loan documents. Upon the occurrence and during the continuance of a Trigger Period, all excess cash flow is required to be swept into the applicable cash management account and held by the lender as additional collateral for the Starwood Capital Group Hotel Portfolio Whole Loan.
A “Cash Management Trigger Period” will occur upon the debt service coverage ratio for the Starwood Capital Group Hotel Portfolio Whole Loan being below 2.00x and will end upon the debt service coverage ratio being equal to or greater than 2.00x for two consecutive calendar quarters.
Additional Secured Indebtedness (not including trade debts). The Starwood Capital Group Hotel Portfolio Properties also secure sixteenparipassu promissory notes (the “Starwood Capital Group Hotel PortfolioPari Passu Companion Loans”), with an aggregate cut-off date balance of $504,770,000. The Starwood Capital Group Hotel PortfolioPari Passu Companion Loans accrue interest at the same rate as the Starwood Capital Group Hotel Portfolio Mortgage Loan. The Starwood Capital Group Hotel Portfolio Mortgage Loan is entitled to payments of principal and interest on apro rata andpari passu basis with the Starwood Capital Group Hotel PortfolioPari Passu Companion Loans. The holders of the Starwood Capital Group Hotel Portfolio Mortgage Loan and the Starwood Capital Group Hotel PortfolioPari Passu Companion Loans have entered into a co-lender agreement that sets forth the allocation of collections on the Starwood Capital Group Hotel Portfolio Whole Loan. See“Description of the Mortgage Pool—The Whole Loans” in the Preliminary Prospectus.
Mezzanine Loan and Preferred Equity.After the earlier of (i) May 24, 2018 and (ii) the date that the last Starwood Capital Group Hotel Portfolio Non-ServicedPari Passu Companion Loan has been securitized, certain direct and indirect owners of the Starwood Capital Group Hotel Portfolio Borrowers are permitted to obtain a mezzanine loan secured by the direct or indirect ownership interests in the Starwood Capital Group Hotel Portfolio Borrowers upon satisfaction of certain terms and conditions including, among others, (i) no event of default has occurred and is continuing, (ii) the combined loan-to-value ratio (including the principal amount of the mezzanine loan) does not exceed 64.9%, (iii) the combined debt service coverage ratio (calculated for the Starwood Capital Group Hotel Portfolio Whole Loan and the mezzanine loan) is not less than 2.65x, (iv) in the event that the mezzanine loan bears a floating rate of interest, an interest rate cap agreement is obtained containing a strike rate that provides for a debt service coverage ratio (calculated for the Starwood Capital Group Hotel Portfolio Whole Loan and the mezzanine loan) of not less than 1.75x, (v) the mortgage and mezzanine lenders enter into an intercreditor agreement and (vi) delivery of a rating agency confirmation.
Release of Property.After June 1, 2018, the Starwood Capital Group Hotel Portfolio Borrower may obtain the release of an individual property or properties subject to, among other conditions: (i) no monetary event of default has occurred and is continuing under the Starwood Capital Group Hotel Portfolio Whole Loan, (ii) the remaining Starwood Capital Group Hotel Portfolio Properties have a debt service coverage ratio no less than the greater of (a) 2.65x and (b) the debt service coverage ratio for the remaining properties immediately prior to the release (which may be satisfied with an additional prepayment of principal with the related yield maintenance premium, as applicable, or a cash deposit with lender to meet such test), (iii) prepayment of the Starwood Capital Group Hotel Portfolio Whole Loan in an amount equal to the Release Price (as defined below) together with the related yield maintenance premium associated with the Release Price and (iv) satisfaction of customary REMIC requirements.
In addition, with respect to the Holiday Inn Express & Suites Terrell property, pursuant to a recorded declaration, Tanger Properties Limited Partnership, the developer of the property, together with its successors and assigns, has the right to purchase the property in the event, among other things, either the improvements are abandoned or permanently closed or the borrower fails to use the property for its intended use for 60 days or more (other than due to a casualty or remodeling) or otherwise violates the declaration. In the event that such purchase option is exercised, the purchase price is equal to the sum of the price paid by the prior owner of the property (i.e. the initial transferee from the developer) and the costs of the improvements (as described in the declaration), and the applicable borrower is required to promptly cause the release of the property in compliance with the release provisions described above (except that the applicable borrower may release the property during the lockout period with payment of the applicable yield maintenance premium). The Starwood Capital Group Hotel Portfolio Whole Loan documents require that any release of such property in connection with the exercise of the purchase option be in compliance with the release provisions described above (except that the release may occur on or prior to June 1, 2018 with payment of the applicable yield maintenance premium). The Starwood Capital Group Hotel Portfolio Hotel Portfolio Whole Loan is recourse to the guarantor for any losses suffered by the lender if and when the purchase option is exercised.
The “Release Price” means an amount equal to (a) if less than $57,727,000 has been prepaid to date, 105% of the allocated loan amount of each such individual property, (b) if less than $86,590,500 has been prepaid to date, 110% of the allocated loan amount of each such individual property, (c) if less than $115,454,000 has been prepaid to date, 115% of the allocated loan amount of each such individual property and (d) (x) for all amounts prepaid in excess of $115,454,000 or (y) if any such released individual property is to be conveyed to an affiliate of the Starwood Capital Group Hotel Portfolio Borrowers, principals, operating companies or guarantors, 120% of the allocated loan amount of each such individual property.
This is not a research report and was not prepared by any Underwriter’s research department. Please see additional important information and qualifications at the end of this Term Sheet.
| T-50 |
BANK 2017-BNK5 | Starwood Capital Group Hotel Portfolio |
Ground Leases.The Hilton Garden Inn Edison Raritan Center property is subject to a ground lease, which expires on September 30, 2076 with no extension options. The ground lease requires a current annual rent of $275,517 and is subject to annual rent increases every five years during the term of the ground lease. See “Description of the Mortgage Pool—Fee & Leasehold Estates; Ground Leases”, in the Preliminary Prospectus.
Terrorism Insurance.The Starwood Capital Group Hotel Portfolio Borrowers are required to obtain insurance against acts of terrorism or other similar acts or events to the extent such insurance is available in form and substance reasonably satisfactory to the lender.
This is not a research report and was not prepared by any Underwriter’s research department. Please see additional important information and qualifications at the end of this Term Sheet.
| T-51 |
| BANK 2017-BNK5 | Westchester One |
Mortgage Loan No. 3 – Westchester One
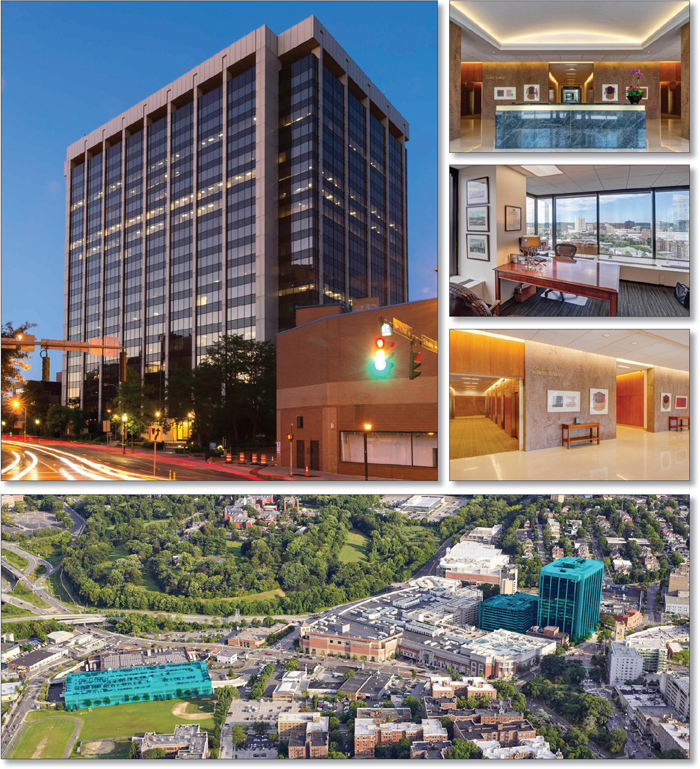
This is not a research report and was not prepared by any Underwriter’s research department. Please see additional important information and qualifications at the end of this Term Sheet.
| T-52 |
| BANK 2017-BNK5 | Westchester One |
Mortgage Loan No. 3 – Westchester One
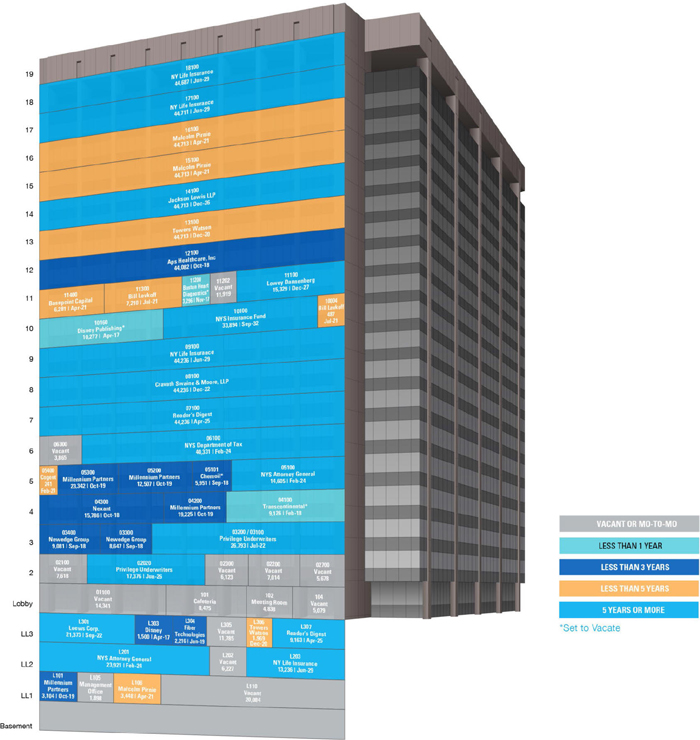
This is not a research report and was not prepared by any Underwriter’s research department. Please see additional important information and qualifications at the end of this Term Sheet.
| T-53 |
| BANK 2017-BNK5 | Westchester One |
Mortgage Loan No. 3 – Westchester One
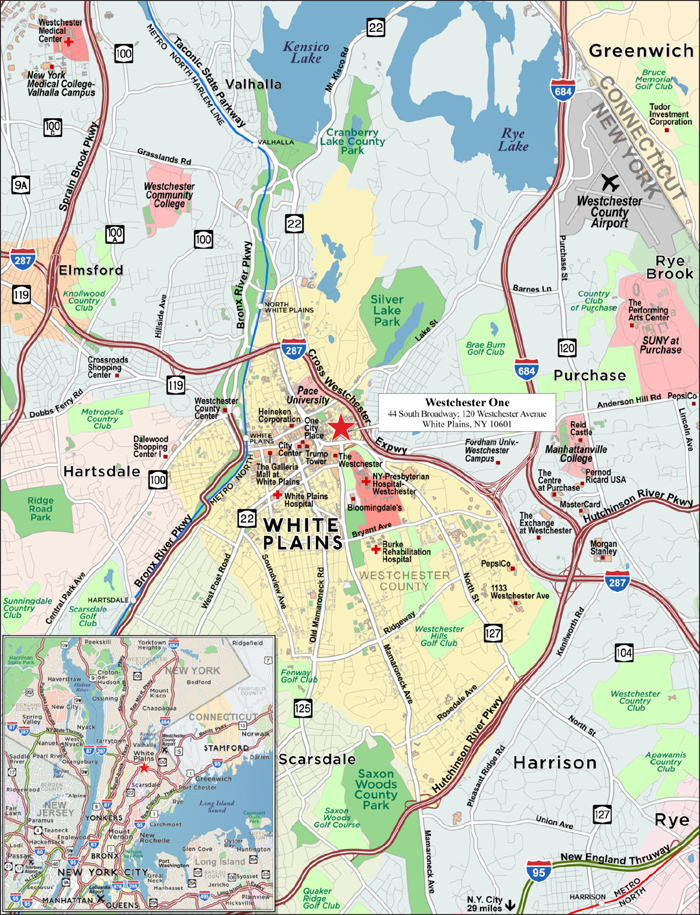
This is not a research report and was not prepared by any Underwriter’s research department. Please see additional important information and qualifications at the end of this Term Sheet.
| T-54 |
| BANK 2017-BNK5 | Westchester One |
| Mortgage Loan No. 3 – Westchester One |
| Mortgage Loan Information | Property Information | ||||||
| Mortgage Loan Seller: | MSMCH | Single Asset/Portfolio: | Single Asset | ||||
| Original Balance(1): | $67,500,000 | Location: | White Plains, NY 10601 | ||||
| Cut-off Date Balance(1): | $67,500,000 | General Property Type: | Office | ||||
| % of Initial Pool Balance: | 5.5% | Detailed Property Type: | CBD | ||||
| Loan Purpose: | Acquisition | Title Vesting: | Fee | ||||
| Sponsors: | Andrew Penson; Aryeh Ginzberg; Leibel Lederman | Year Built/Renovated: | 1976/2016 | ||||
| Size: | 907,436 SF | ||||||
| Mortgage Rate: | 4.0760% | Cut-off Date Balance per SF(1): | $121 | ||||
| Note Date: | 6/8/2017 | Maturity Date Balance per SF(1): | $105 | ||||
| First Payment Date: | 7/1/2017 | Property Manager: | Cushman & Wakefield U.S., Inc. | ||||
| Maturity Date: | 7/1/2027 | ||||||
| Original Term to Maturity: | 121 months | ||||||
| Original Amortization Term: | 360 months | ||||||
| IO Period: | 37 months | Underwriting and Financial Information | |||||
| Seasoning: | 0 months | UW NOI(5): | $11,568,250 | ||||
| Prepayment Provisions(2): | LO (24); DEF (91); O (6) | UW NOI Debt Yield(1): | 10.5% | ||||
| Lockbox/Cash Mgmt Status: | Soft/Springing | UW NOI Debt Yield at Maturity(1): | 12.1% | ||||
| Additional Debt Type(3): | Pari Passu | UW NCF DSCR(1): | 2.29x (IO) 1.64x (P&I) | ||||
| Additional Debt Balance(3): | $42,500,000 | Most Recent NOI: | $10,724,767 (3/31/2017 TTM) | ||||
| Future Debt Permitted (Type): | No (N/A) | 2nd Most Recent NOI: | $10,948,376 (12/31/2016) | ||||
| Reserves(4) | 3rd Most Recent NOI: | $11,281,176 (12/31/2015) | |||||
| Type | Initial | Monthly | Cap | Most Recent Occupancy(6): | 87.8% (6/1/2017) | ||
| RE Tax: | $2,094,346 | $349,058 | N/A | 2nd Most Recent Occupancy: | 79.2% (12/31/2016) | ||
| Insurance: | $43,221 | Springing | N/A | 3rd Most Recent Occupancy: | 77.3% (12/31/2015) | ||
| Recurring Replacements: | $7,000,000 | $0 | N/A | Appraised Value (as of): | $173,000,000 (4/19/2017) | ||
| TI/LC: | $13,000,000 | Springing | $5,000,000 | Cut-off Date LTV Ratio(1): | 63.6% | ||
| Other: | $8,602,652 | $0 | N/A | Maturity Date LTV Ratio(1): | 55.2% | ||
| Sources and Uses | ||||||
| Sources | Proceeds | % of Total | Uses | Proceeds | % of Total | |
| Loan Amount: | $110,000,000 | 64.4% | Net Purchase Price(7): | $128,695,179 | 75.3% | |
| Borrower Equity: | $51,215,156 | 35.6% | Reserves: | $30,740,219 | 23.7% | |
| Closing Costs: | $1,779,758 | 1.0% | ||||
| Total Sources: | $161,215,156 | 100.00% | Total Uses: | $161,215,156 | 100.00% | |
| (1) | The Westchester One Mortgage Loan is part of the Westchester One Whole Loan, which is comprised of twopari passu promissory notes with an aggregate original principal balance of $110,000,000. The Cut-off Date Balance per SF, Maturity Date Balance per SF, UW NOI Debt Yield, UW NOI Debt Yield at Maturity, UW NCF DSCR, Cut-off Date LTV Ratio and Maturity Date LTV Ratio numbers presented above are based on the aggregate principal balance of the promissory notes comprising the Westchester One Whole Loan. |
| (2) | Defeasance is permitted at any time after the earlier of (i) January 1, 2021, or (ii) two years from the closing date of the securitization of the last Westchester One Whole Loan promissory note to be securitized. The assumed lockout period of 24 payments is based on the closing date of this transaction in June 2017. |
| (3) | See “The Mortgage Loan” and “Additional Secured Indebtedness (not including trade debts)” for further discussion of additional debt. |
| (4) | See “—Escrows and Reserves” below for further discussion of reserve requirements. |
| (5) | UW NOI includes UW Gross Potential Rent which has been underwritten based on the June 1, 2017 rent roll and includes rent steps of $53,099 through May 31, 2018, a downward mark to market adjustment totaling $802,909 for multiple tenants and straight line rent underwritten for New York Life Insurance in the amount of $271,506. |
| (6) | Most recent occupancy includes two tenants (30,234 SF) that are dark, but paying rent, and one tenant (3,296 SF) expected to vacate upon lease expiration on November 30, 2017. |
| (7) | The borrower is acquiring the property for a contract purchase price of $147,000,000, less a seller credit of $18,304,82 which represents the balance of outstanding tenant improvement obligations, leasing commissions and free rent owed to existing tenants, resulting in a Net Purchase Price of $128,695,179. The seller credit is made up of $8,602,652 for outstanding TI/LC and rent concessions, which was reserved for at origination, and $9,702,169 for outstanding tenant improvements, which is expected to be held outside of the Westchester One Whole Loan pursuant to an escrow agreement among the title company, the seller and the lender to be entered into post-closing. |
The Mortgage Loan. The third largest mortgage loan (the “Westchester One Mortgage Loan”) is part of a whole loan (the “Westchester One Whole Loan”) evidenced by threepari passu promissory notes in the aggregate original principal amount of $110,000,000, all of which are secured by a first priority fee mortgage encumbering a 907,436 SF office property known as Westchester One located in White Plains, New York (the “Westchester One Property”). Promissory Note A-1, in the original principal amount of $67,500,000, represents the Westchester One Mortgage Loan and will be included in the BANK 2017-BNK5 securitization trust. Promissory Note A-2 and Promissory Note A-3, in the aggregate original principal amount of $42,500,000 (the “Westchester One ServicedPari Passu Companion Loans”) are expected to be held by Morgan Stanley Bank, N.A. or an affiliate thereof on the closing date of this transaction, and are expected to be contributed to one or more future securitization transactions or may be otherwise transferred at any time. The Westchester One Whole Loan will be serviced pursuant to the pooling and servicing agreement for the BANK 2017-BNK5 securitization trust. See “Description of the Mortgage Pool—The Whole Loans—The Serviced Pari Passu Whole Loans” and “The Pooling and Servicing Agreement” in the Preliminary Prospectus.
This is not a research report and was not prepared by any Underwriter’s research department. Please see additional important information and qualifications at the end of this Term Sheet.
| T-55 |
| BANK 2017-BNK5 | Westchester One |
The proceeds of the Westchester One Whole Loan, together with $60,916,725 of borrower equity, were used to acquire the Westchester One Property, fund reserves and pay closing costs.
The Borrower and the Sponsors. The borrower is 44 South Broadway Owner LLC (the “Westchester One Borrower”), a single-purpose Delaware limited liability company with two independent directors. The borrower sponsors and non-recourse carveout guarantors are Andrew Penson, Aryeh Ginzberg and Leibel Lederman.
Andrew Penson founded Argent Ventures LLC (“Argent”), a private real estate developer and real estate operator based in New York City which has purchased over $2.5 billion in real estate assets and debt instruments in New York and other markets in the United States. Andrew Penson oversees all property development activities at Argent and has participated in the repositioning of New York properties such as the Manhattan Mall, One Park Avenue, and 633 Third Avenue. He was also involved in Argent’s 2006 acquisition of Grand Central Terminal.
Aryeh Ginzberg has over 35 years of real estate experience. His organizational experience includes the management of portfolios of multifamily properties throughout the tri-state area. Aryeh Ginzberg has overseen the management and rehabilitation of several thousand HUD & HPD units. Aryeh Ginzburg is currently a partner at E&M Associates (“E&M”), which is a privately-held, vertically-integrated real estate company that acquires, owns and manages over 3000 apartments in the New York metropolitan area.
Leibel Lederman’s first exposure to the real estate industry came in 1973 as a managing agent for a boutique real estate firm in Greenpoint, Brooklyn. Between 1976 and 1985, Leibel Lederman and several partners purchased over 65 buildings in Brooklyn, The Bronx, and Manhattan, totaling 4,000 units. From 1985 to 1989, Leibel Lederman purchased shopping centers and office complexes in Pittsburgh and Philadelphia. In 1994, Lederman joined E&M, where he is currently a partner.
The Property. The Westchester One Property consists of a 20-story, Class A, multi-tenant office building totaling 907,436 SF (the “Office Tower”), an adjacent 1,800 space 10-story parking garage (the “Adjacent Garage”) and a 750 space four-story parking garage located a few blocks from the Office Tower (the “Off-Site Garage”). Amenities at the Westchester One Property include an on-site full service cafeteria and a shuttle service to the White Plains Metro North train service, which is one mile from the Westchester One Property. The Westchester One Property was built in 1976 and has undergone a variety of renovations in recent years. According to the borrower sponsors, approximately $12.8 million in capital expenditures was spent by the prior owner between 2006 and 2016, which included a comprehensive lobby renovation, cooling tower upgrades, roof replacements, cafeteria and meeting room renovations and the purchase of a new generator, among other items. The borrower sponsors’ business plan includes a capital expenditure budget of $7,007,000 for property improvements over the next 12 months. Planned expenditures include installation of new HVAC chillers ($750,000), elevator modernization ($2,182,000), renovation of the Adjacent Garage ($3,665,000) and lobby and cafeteria upgrades ($410,000). The Westchester One Borrower reserved $7,000,000 for recurring replacements, to be used in connection with the borrower sponsors’ business plan, at origination.
The Westchester One Property is centrally located in the White Plains central business district (“White Plains CBD”) of Westchester County, New York, in close proximity to numerous vehicular arteries. The immediate area surrounding the Westchester One Property is characterized by a variety of restaurants, bars, entertainment venues, residential and commercial buildings and retail properties. Directly to the south of the Westchester One Property sits an approximately 890,000 SF Neiman Marcus and Nordstrom anchored mall owned by Simon Property Group. A 24-story mixed use residential tower with over 700 units, approximately 90,000 SF of retail space, underground parking, outdoor dining areas and open public space is currently being developed within blocks of the Westchester One Property.
Major Tenants.
New York Life Insurance (192,060 SF, 21.2% of NRA, 24.4% of underwritten rent).New York Life Insurance (“New York Life”), America’s largest mutual life insurance company, recently signed a lease and is in the process of moving its Westchester headquarters to the Westchester One Property. New York Life provides insurance, investment, and retirement solutions and guidance. According to its 2016 annual report, as of December 31, 2016, New York Life reported $957 billion of individual life insurance in force, $538 billion of assets under management and $230 billion of total cash and invested assets. New York Life has approximately 20,000 employees and agents across approximately 120 offices in the United States. According to the borrower sponsors, New York Life is expected to move 500 employees to its location at the Westchester One Property over two phases. Phase I is expected to include 102,634 SF of space on the lower level, 17th and 18th floors and the phase II is expected to include 89,426 SF located on the 15th and 16th floors. New York Life is expected to move into phase I during the summer of 2017 and into phase II prior to the end of 2017. The lease commencement date for phase I and phase II is January 9, 2017 and May 1, 2017, respectively. New York Life has free rent until July 2018 for the phase I space, November 2018 for the 16th floor space and October 2019 for the 15th floor space. 100% of this free rent is being reserved for, which amount was offset against the purchase price paid by the Westchester One Borrower to the previous owner of the Westchester One Property.
Reader’s Digest (53,399 SF, 5.9% of NRA, 6.2% of underwritten rent). Reader’s Digest is a general-interest family magazine that is published ten times annually. The magazine was founded in 1922 and was a best-selling consumer magazine in the United States. Today, the magazine has a global circulation of 10.5 million which makes it the largest paid circulation magazine in the world. Reader’s Digest has been in occupancy since 2010 and has a lease expiration of April 30, 2025. Reader’s Digest may reduce its space by 2,540 SF at any time, provided that written notice is delivered 10 months prior to such space reduction.
PURE (49,463 SF, 5.5% of NRA, 6.0% of underwritten rent). PURE is a policyholder-owned insurer that provides coverage for high value homes, vehicles, jewelry, art, personal umbrella liability, watercraft, and flood insurance. PURE has been in occupancy since 2011 and has a lease expiration of June 30, 2026. PURE has a termination option for all but 5,294 SF of its space, effective June 14, 2023, provided that written notice is delivered 12 months prior to such termination. The termination payment is (i) three months of rent and (ii) the unamortized costs in connection with the delivery of the lease and the preparation of the premises for PURE’s initial occupancy. PURE originally leased 26,793 SF of the Westchester One Property and has expanded twice into its current footprint of 49,463 SF.
This is not a research report and was not prepared by any Underwriter’s research department. Please see additional important information and qualifications at the end of this Term Sheet.
| T-56 |
| BANK 2017-BNK5 | Westchester One |
The following table presents certain information relating to the leases at the Westchester One Property:
| Tenant Summary(1) | |||||||
| Tenant Name | Credit Rating (Fitch/Moody’s/S&P)(2) | Tenant SF | Approximate % of SF | Annual UW Rent | % of Total Annual UW Rent | Annual UW Rent PSF(3) | Lease Expiration |
| Tenants | |||||||
| New York Life Insurance(4) | NR/NR/NR | 192,060 | 21.2% | $5,248,586 | 24.4% | $27.33 | 3/31/2030 |
| Reader’s Digest(5) | NR/NR/NR | 53,399 | 5.9% | $1,327,236 | 6.2% | $24.86 | 4/30/2025 |
| PURE(6) | NR/NR/NR | 49,463 | 5.5% | $1,289,847 | 6.0% | $26.08 | 6/30/2026 |
| Towers Watson(7) | NR/NR/NR | 46,682 | 5.1% | $1,400,460 | 6.5% | $30.00 | 12/31/2020 |
| Millennium Partners | NR/NR/NR | 45,671 | 5.0% | $1,370,130 | 6.4% | $30.00 | 10/31/2019 |
| Subtotal/Wtd. Avg. | 387,275 | 42.7% | $10,636,259 | 49.4% | $27.46 | ||
| Other Tenants(8) | 409,793 | 45.2% | $10,894,290 | 50.6% | $26.58 | ||
| Vacant Space | 110,368 | 12.2% | $0 | 0.0% | $0.00 | ||
| Total/Wtd. Avg. | 907,436 | 100.0% | $21,530,549 | 100.0% | $27.53 | ||
| (1) | Information is based on the underwritten rent roll. |
| (2) | Certain ratings are those of the parent company whether or not the parent guarantees the lease. |
| (3) | Wtd. Avg. Annual UW Rent PSF excludes vacant space and 15,011 SF associated with cafeteria, meeting room and management office space. |
| (4) | New York Life is expected to take occupancy at the Westchester One Property during the summer of 2017 with respect to 102,634 SF (phase I) and prior to the end of 2017 with respect to 89,426 SF (phase II). New York Life has free rent until July 2018 for the phase I space, November 2018 for the 16th floor space and October 2019 for the 15th floor space. |
| (5) | Reader’s Digest may reduce its space by 2,540 SF of its space, provided that written notice is delivered 10 months prior to such space reduction. |
| (6) | PURE has a termination option for all but 5,294 SF effective June 14, 2023 provided that written notice is delivered 12 months prior to such termination. The termination payment is (i) three months of rent and (ii) the unamortized costs in connection with the delivery of the lease and the preparation of the premises for PURE’s initial occupancy. |
| (7) | Towers Watson has a termination option effective January 1, 2018 if (i) three or more floors of the Westchester One Property are leased to the government or a school, or (ii) Hewitt Associates, Mercer Consultants or Watson Wyatt Worldwide signs a lease at the Westchester One Property. |
| (8) | Other Tenants includes Chemoil (6,108 SF) and Cravath Swaine & Moore (24,126 SF), which are dark, but paying rent. Other Tenants also includes Boston Hearts Diagnostics (3,296 SF), which is in occupancy but expected to vacate upon lease expiration on November 30, 2017. |
The following table presents certain information relating to the lease rollover schedule at the Westchester One Property:
| Lease Rollover Schedule(1)(2) | ||||||||
| Year | # of Leases Rolling | SF Rolling | Approx. % of Total SF Rolling | Approx. Cumulative % of SF Rolling | UW Base Rent PSF Rolling(3) | Total UW Base Rent Rolling(3) | Approx. % of Total Rent Rolling | Approx. Cumulative % of Total Rent Rolling |
| MTM | 0 | 0 | 0.0% | 0.0% | $0.00 | $0 | 0.0% | 0.0% |
| 2017(4) | 1 | 3,296 | 0.4% | 0.4% | $30.00 | $98,880 | 0.5% | 0.5% |
| 2018(5) | 5 | 92,830 | 10.2% | 10.6% | $29.69 | $2,756,335 | 12.8% | 13.3% |
| 2019 | 2 | 47,887 | 5.3% | 15.9% | $30.00 | $1,436,610 | 6.7% | 19.9% |
| 2020 | 1 | 46,682 | 5.1% | 21.0% | $30.00 | $1,400,460 | 6.5% | 26.4% |
| 2021 | 4 | 58,455 | 6.4% | 27.5% | $33.69 | $1,969,461 | 9.1% | 35.6% |
| 2022(6) | 3 | 65,609 | 7.2% | 34.7% | $26.12 | $1,713,760 | 8.0% | 43.5% |
| 2023 | 0 | 0 | 0.0% | 34.7% | $0.00 | $0 | 0.0% | 43.5% |
| 2024 | 2 | 78,857 | 8.7% | 43.4% | $24.04 | $1,895,844 | 8.8% | 52.4% |
| 2025 | 1 | 53,399 | 5.9% | 49.3% | $24.86 | $1,327,236 | 6.2% | 58.5% |
| 2026 | 2 | 94,176 | 10.4% | 59.6% | $26.04 | $2,452,385 | 11.4% | 69.9% |
| 2027 | 1 | 14,912 | 1.6% | 61.3% | $28.00 | $417,536 | 1.9% | 71.8% |
| 2028 & Beyond | 2 | 240,965 | 26.6% | 87.8% | $25.16 | $6,062,042 | 28.2% | 100.0% |
| Vacant | 0 | 110,368 | 12.2% | 100.0% | $0.00 | $0 | 0.0% | 100.0% |
| Total/Wtd. Avg. | 24 | 907,436 | 100.0% | $27.53 | $21,530,549 | 100.0% | ||
| (1) | Information is based on the underwritten rent roll. |
| (2) | Certain tenants may have lease termination options that are exercisable prior to the originally stated expiration date of the subject lease and that are not considered in the lease rollover schedule. |
| (3) | UW Total Rent PSF Rolling and Total UW Rent Rolling exclude vacant space and 15,011 SF associated with cafeteria, meeting room and management office space. |
| (4) | 2017 includes Boston Hearts Diagnostics (3,296 SF), which is in occupancy but expected to vacate upon lease expiration on November 30, 2017. |
| (5) | 2018 includes Chemoil (6,108 SF and $181,670 of underwritten rent), which is dark, but paying rent. |
| (6) | 2022 includes Cravath Swaine & Moore (24,126 SF and $723,780 of underwritten rent), which is dark, but paying rent. |
This is not a research report and was not prepared by any Underwriter’s research department. Please see additional important information and qualifications at the end of this Term Sheet.
| T-57 |
| BANK 2017-BNK5 | Westchester One |
The Market. The Westchester One Property is located approximately 30 miles north of Midtown Manhattan, in the White Plains CBD sub-market of Westchester County, New York. According to the appraisal, Westchester County’s transportation system and quality of life have attracted a commuter population and the corporate headquarters of over 170 businesses. At the height of the recession in 2009, Westchester County experienced only a 1.8% drop in its gross metropolitan product (GMP) and 4.8 percent cut in total non-farm payroll before entering its recovery. No traditional ground-up office construction has been delivered within Westchester County since 2006.
According to the appraisal, for the fourth quarter in 2016, the Westchester County office market contained 28,903,251 SF of office space, with a direct vacancy of 19.3% and direct average Class A rent of $30.31 PSF. For the fourth quarter in 2016, the White Plains CBD office sub-market contained 6,207,675 SF of office space, with a direct vacancy of 18.0% and direct average Class A rent of $33.69 PSF.
The estimated 2015 population within White Plains, Westchester County and the state of New York is 58,927, 975,229 and 19,845,348 respectively, according to the appraisal. The estimated 2015 average household income within White Plains, Westchester County and the state of New York is $122,879, $135,073 and $87,081, respectively.
The following table presents information relating to comparable office property sales for the Westchester One Property:
| Comparable Property Sales | |||||||
| Property Name/Location | Sale Date | Year Built | Total NRA (SF) | Total Occupancy | Sale Price | Sale Price PSF | Cap Rate |
Westchester One (subject) White Plains, NY | Mar-2017 | 1976 | 907,436(1) | 87.8%(1) | $147,000,000 | 161.99 | 7.75% |
140 & 150 Grand Street White Plains, NY | Dec-2015 | 1926 | 217,416 | 84.0% | $32,000,000 | $147.18 | 8.50% |
399 Knollwood Road White Plains, NY | Jun-2015 | 1985 | 145,943 | 93.0% | $24,500,000 | $167.87 | 8.00% |
1 Pepsi Way Somers, NY | Mar-2015 | 1987 | 522,800 | 100.0% | $87,000,000 | $166.41 | 9.00% |
1111-1129 Westchester Avenue White Plains, NY | Dec-2014 | 1985 | 366,460 | 100.0% | $56,629,210 | $154.53 | N/A |
| 555 Theodore Fremd Avenue Rye, NY | Nov-2014 | 1990 | 180,000 | 98.0% | $39,500,000 | $219.44 | 7.35% |
411 Theodore Fremd Avenue Rye, NY | Sep-2016 | 1982 | 118,129 | 100.0% | $25,200,000 | $213.33 | 6.89% |
Source:Appraisal
| (1) | Total NRA (SF) and Total Occupancy for the Westchester One Property are based on the underwritten rent roll. |
The following table presents recent leasing data at comparable office buildings with respect to the Westchester One Property:
| Comparable Lease Summary | |||||||||
| Property Name/Address | Year Built | Class | Total NRA (SF) | Tenant Name | Lease Area (SF) | Lease Date | Lease Term (Yrs.) | Initial Rent/SF | Reimbursements |
81 Main Street 81 Main Street White Plains, NY | 1988 | A | 150,000 | Carl Bloom | 4,116 | Apr-2016 | 5.0 | $31.00 | Modified Gross |
Gateway Plaza 1 North Lexington Avenue White Plains, NY | 1985 | A | 530,000 | Osaka Gas | 9,118 | May-2016 | 10.6 | $32.00 | Modified Gross |
10 Bank Street 10 Bank Street White Plains, NY | 1988 | A | 220,000 | Mitsui & CO (USA) | 11,994 | Oct-2016 | 7.7 | $33.00 | Modified Gross |
White Plains Plaza 1 North Broadway White Plains, NY | 1971 | A | 396,000 | Little Big Brands | 8,289 | May-2016 | 7.7 | $25.16 | Modified Gross |
50 Main Street 50 Main Street White Plains, NY | 1984 | A | 310,000 | Wells Fargo | 22,500 | Apr-2016 | 4.0 | $34.26 | Modified Gross |
Courthouse Square 140 Grand Street White Plains, NY | 1990 | A | 120,000 | Belowich & Walsh | 4,763 | Apr-2016 | 10.8 | $28.50 | Modified Gross |
White Plains Plaza 445 Hamilton Avenue White Plains, NY | 1968 | A | 340,000 | Cuddy & Feder | 26,356 | Apr-2016 | 10.4 | $25.50 | Modified Gross |
Source:Appraisal
This is not a research report and was not prepared by any Underwriter’s research department. Please see additional important information and qualifications at the end of this Term Sheet.
| T-58 |
| BANK 2017-BNK5 | Westchester One |
Operating History and Underwritten Net Cash Flow.The following table presents certain information relating to the historical operating performance and the Underwritten Net Cash Flow at Westchester One Property:
| Cash Flow Analysis | ||||||
| 2014 | 2015 | 2016 | 3/31/2017 TTM | UW | UW PSF | |
| Gross Potential Rent(1) | $18,305,050 | $19,623,691 | $19,711,849 | $19,578,751 | $24,200,533 | $26.67 |
| Total Recoveries | $2,251,329 | $2,838,801 | $2,205,054 | $2,122,177 | $2,361,625 | $2.60 |
| Total Other Income(2) | $1,569,792 | $1,619,744 | $1,625,218 | $1,630,865 | $1,691,577 | $1.86 |
| Less Vacancy & Credit Loss(3) | $0 | $0 | $0 | $0 | ($3,867,925) | ($4.26) |
| Effective Gross Income | $22,126,171 | $24,082,236 | $23,542,121 | $23,331,793 | $24,385,810 | $26.87 |
| Total Operating Expenses | $10,112,698 | $12,801,059 | $12,593,744 | $12,607,026 | $12,817,560 | $14.13 |
| Net Operating Income | $12,013,473 | $11,281,176 | $10,948,376 | $10,724,767 | $11,568,250 | $12.75 |
| Capital Expenditures | $0 | $0 | $0 | $0 | $226,859 | $0.25 |
| TI/LC | $0 | $0 | $0 | $0 | $914,144 | $1.01 |
| Net Cash Flow | $12,013,473 | $11,281,176 | $10,948,376 | $10,724,767 | $10,427,247 | $11.49 |
| Occupancy % | 78.8% | 77.3% | 79.2% | 87.8%(3) | 84.4% | |
| NOI DSCR (IO)(4) | 2.64x | 2.48x | 2.41x | 2.36x | 2.54x | |
| NOI DSCR(4) | 1.89x | 1.77x | 1.72x | 1.69x | 1.82x | |
| NCF DSCR (IO)(4) | 2.64x | 2.48x | 2.41x | 2.36x | 2.29x | |
| NCF DSCR(4) | 1.89x | 1.77x | 1.72x | 1.69x | 1.64x | |
| NOI Debt Yield(4) | 10.9% | 10.3% | 10.0% | 9.7% | 10.5% | |
| NCF Debt Yield(4) | 10.9% | 10.3% | 10.0% | 9.7% | 9.5% | |
| (1) | Gross Potential Rent has been underwritten based on the June 1, 2017 rent roll and includes rent steps of $53,099 through May 31, 2018, a downward mark to market adjustment totaling $802,909 for multiple tenants and straight line rent underwritten for New York Life Insurance in the amount of $271,506. The increase in UW Gross Potential Rent can be attributed to the recent lease signing of New York Life, |
| (2) | Total Other Income is primarily comprised of parking income. |
| (3) | 3/31/2016 TTM Occupancy % is based on occupancy as of June 1, 2017 and includes Chemoil (6,108 SF) and Cravath Swaine & Moore (24,126 SF), which are dark, but paying rent, and Boston Hearts Diagnostics (3,296 SF), which is in occupancy but expected to vacate upon lease expiration on November 30, 2017. |
| (4) | Debt service coverage ratios and debt yields are based on the Westchester One Whole Loan. |
Escrows and Reserves. The Westchester One Whole Loan documents provide for upfront reserves in the amount of $13,000,000 for tenant improvements and leasing commissions that may be incurred in future (the “Future TILC Reserve”), $7,000,000 for capital expenditures in accordance with a budget set forth in the Westchester One Whole Loan loan agreement and with the Westchester One Borrower’s business plan (as described above under “--The Property”), and $8,602,652 for tenant improvements and leasing commissions due under existing leases and rent concessions owed to tenants (to be disbursed monthly in each month in which a free rent period applies in lieu of the rent that would have been due absent such free rent period). The Westchester One Borrower is required to escrow monthly: (i) 1/12th of the annual estimated real estate taxes and (ii) 1/12th of the annual estimated insurance premiums (unless the Westchester One Borrower maintains an acceptable blanket policy). The Westchester One Borrower is required to deposit monthly $113,430 into the Future TILC Reserve; provided that the Westchester One Borrower will not be required to make such monthly deposits unless the amount on deposit in the Future TILC Reserve equals less than $5,000,000 (the “TILC Cap”), at which time the Westchester One Borrower is required to make such monthly deposits until the amount on deposit in the Future TILC Reserve equals the TILC Cap.
In addition, $9,702,169 is required to be escrowed post-closing by the seller of the Westchester One Property for outstanding tenant improvements, which will be held outside of the Westchester One Whole Loan documents pursuant to an escrow agreement between the title company, the seller and the lender. The lender will not have control over the funds therein, in the way that it would have if such funds had been escrowed under the Westchester One Whole Loan, and will not be permitted to apply such funds to repay the Westchester One Whole Loan following an event of default.
Lockbox and Cash Management.A lockbox is in place with respect to the Westchester One Whole Loan. Prior to the occurrence of a Cash Sweep Event Period (as defined below), the Westchester One Borrower and the property manager are required to deposit all rents into the lockbox account within two business days of receipt. Upon the occurrence of a Cash Sweep Event Period, the Westchester One Borrower is required to direct all tenants to deposit rents directly into the lockbox account. The Westchester One Whole Loan has springing cash management. If no Cash Sweep Event Period (as defined below) is continuing, all funds in the lockbox account are required to be disbursed to the Westchester One Borrower. Upon the first occurrence of a Cash Sweep Event Period, the Westchester One Borrower is required to cooperate with the lender to establish a cash management account controlled by the lender, and during the continuance of a Cash Sweep Event Period, all funds on deposit in the lockbox account are required to be swept to such cash management account on each business day, and, provided that no event of default is continuing under the Westchester One Whole Loan, applied on each monthly payment date to pay debt service on the Westchester One Whole Loan, to fund the required reserves deposits as described above under “Escrows and Reserves”, to disburse the monthly operating expenses referenced in the approved annual budget and extraordinary expenses approved by the lender and to disburse the remainder into an account to be held by the lender as additional security for the Westchester One Whole Loan during the continuance of such Cash Sweep Event Period.
A “Cash Sweep Event Period” means the period:
(i) commencing upon an event of default under the Westchester One Whole Loan documents and ending upon the date that such event of default is cured or waived, or
This is not a research report and was not prepared by any Underwriter’s research department. Please see additional important information and qualifications at the end of this Term Sheet.
| T-59 |
| BANK 2017-BNK5 | Westchester One |
(ii) commencing on the date upon which the amortizing debt service coverage ratio on the Westchester One Whole Loan is less than 1.15x for nine consecutive calendar months, and ending on the date the amortizing debt service coverage ratio equals or exceeds 1.15x for six consecutive calendar months, or
(iii) commencing upon the date that New York Life (or a replacement tenant for all or a portion of the space leased by New York Life) (in either case, a “Major Tenant”) is subject to a bankruptcy or insolvency event and ending upon either (1) such Major Tenant’s lease has been affirmed in bankruptcy and the lender receives a tenant estoppel certificate stating that such Major Tenant is in occupancy of its space, open for business and paying full contractual rent, or (2) the entirety of such Major Tenant’s space has been re-let to one or more replacement tenant(s) acceptable to the lender pursuant to replacement lease(s) acceptable to the lender and the lender receives a tenant estoppel certificate(s) from each such replacement tenant(s) stating that such tenant(s) is/are in occupancy of such Major Tenant’s space, open for business and paying full contractual rent (a “Replacement Tenant Cure”), or
(iv) commencing upon (a) any Major Tenant not renewing or extending such Major Tenant’s lease by the day which is 12 months prior to the expiration of its lease, (b) any Major Tenant giving notice to vacate or exercising any termination option under its lease, or (iii) any Major Tenant canceling or terminating its lease and ending upon either (1) such Major Tenant renews or extends its lease on terms and conditions acceptable to the lender, and the lender receives a tenant estoppel certificate stating that such Major Tenant is in occupancy of its space, open for business and paying full contractual rent or (2) a Replacement Tenant Cure, or
(v) commencing upon the date any Major Tenant (or its respective subtenant(s) or assignee(s)) has, for all or substantially all of its leased space, “gone dark”, vacated its space, not opened for business or terminated its lease (or given written notice of its intention to do so), other than certain temporary closures, and ending upon either (1) such Major Tenant is in occupancy of the entirety of its space, and the lender receives a tenant estoppel certificate stating that such Major Tenant is in occupancy of its space, open for business and paying full contractual rent or (2) a Replacement Tenant Cure.
Additional Secured Indebtedness (not including trade debts).The Westchester One Property also secures the Westchester One ServicedPari Passu Companion Loans, which have an aggregate Cut-off Date principal balance of $42,500,000 and are currently held by Morgan Stanley Bank, N.A. or an affiliate thereof and expected to be contributed to one or more future securitization trusts. The Westchester One ServicedPari Passu Companion Loans accrue interest at the same rate as the Westchester One Mortgage Loan. The Westchester One Mortgage Loan is entitled to payments of principal and interest on apro rata andpari passu basis with the Westchester One ServicedPari Passu Companion Loans. The holders of the Westchester One Mortgage Loan and the Westchester One ServicedPari Passu Companion Loans have entered into a co-lender agreement which sets forth the allocation of collections on the Westchester One Whole Loan. See “Description of the Mortgage Pool—The Whole Loans— The Serviced Pari Passu Whole Loans”in the Preliminary Prospectus.
Mezzanine Loan and Preferred Equity.Not permitted.
Release of Property.Not permitted.
Terrorism Insurance.The Westchester One Whole Loan documents require that the “all risk” insurance policy required to be maintained by Westchester One Borrower provide coverage for terrorism in an amount equal to the full replacement cost of the Westchester One Property and eighteen months of business interruption insurance, provided that if the Terrorism Risk Insurance Program Reauthorization Act of 2015 or extension thereof or substantially similar program (“TRIPRA”) is in effect and continues to cover both foreign and domestic acts of terrorism, the lender is required to accept terrorism insurance with coverage against “covered acts” within the meaning of TRIPRA.
This is not a research report and was not prepared by any Underwriter’s research department. Please see additional important information and qualifications at the end of this Term Sheet.
| T-60 |
(THIS PAGE INTENTIONALLY LEFT BLANK)
This is not a research report and was not prepared by any Underwriter’s research department. Please see additional important information and qualifications at the end of this Term Sheet.
| T-61 |
| BANK 2017-BNK5 | Market Street – The Woodlands |
Mortgage Loan No. 4 – Market Street – The Woodlands

This is not a research report and was not prepared by any Underwriter’s research department. Please see additional important information and qualifications at the end of this Term Sheet.
| T-62 |
| BANK 2017-BNK5 | Market Street – The Woodlands |
Mortgage Loan No. 4 – Market Street – The Woodlands
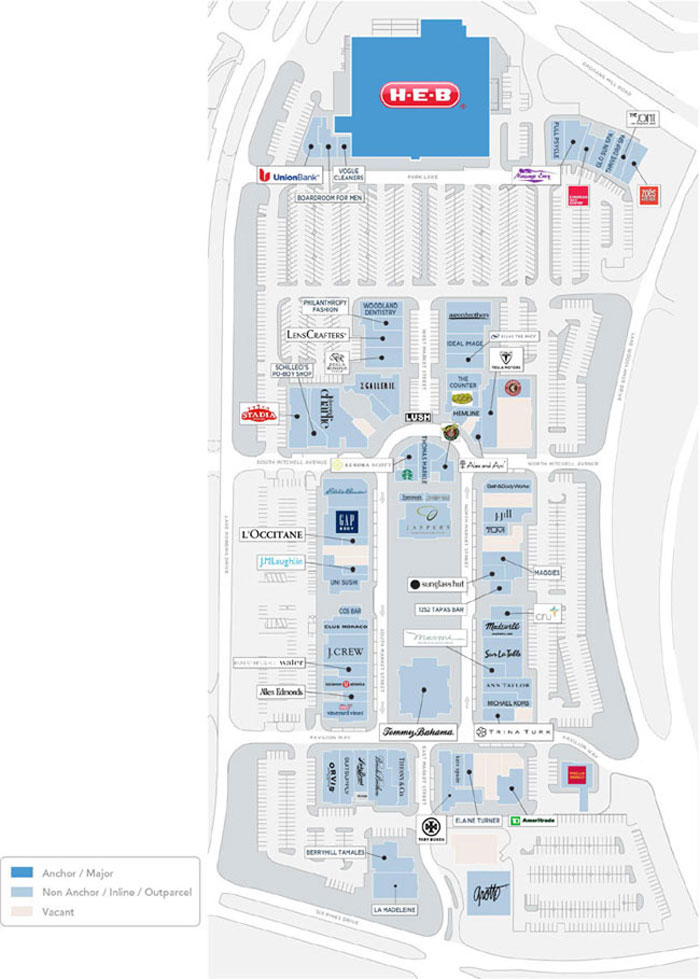
This is not a research report and was not prepared by any Underwriter’s research department. Please see additional important information and qualifications at the end of this Term Sheet.
| T-63 |
| BANK 2017-BNK5 | Market Street – The Woodlands |
Mortgage Loan No. 4 – Market Street – The Woodlands
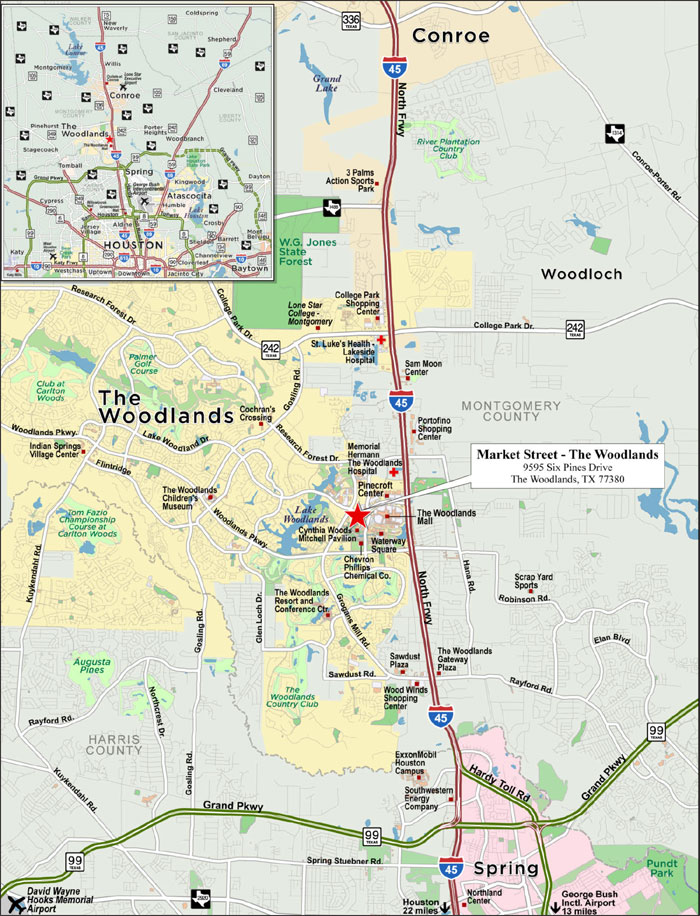
This is not a research report and was not prepared by any Underwriter’s research department. Please see additional important information and qualifications at the end of this Term Sheet.
| T-64 |
| BANK 2017-BNK5 | Market Street – The Woodlands |
| Mortgage Loan No. 4 – Market Street – The Woodlands |
| Mortgage Loan Information | Mortgaged Property Information | ||||||
| Mortgage Loan Seller: | MSMCH/WFB | Single Asset/Portfolio: | Single Asset | ||||
| Original Balance(1): | $65,000,000 | Location: | The Woodlands, TX 77380 | ||||
| Cut-off Date Balance(1): | $65,000,000 | General Property Type: | Retail | ||||
| % of Initial Pool Balance: | 5.3% | Detailed Property Type: | Lifestyle Center | ||||
| Loan Purpose: | Refinance | Title Vesting: | Fee | ||||
| Sponsor: | Institutional Mall Investors LLC | Year Built/Renovated: | 2004 / 2012 | ||||
| Mortgage Rate: | 4.0850% | Size: | 492,082 SF | ||||
| Note Date: | 5/3/2017 | Cut-off Date Balance per SF(1): | $356 | ||||
| First Payment Date: | 7/1/2017 | Maturity Date Balance per SF(1): | $356 | ||||
| Maturity Date: | 6/1/2027 | Property Manager: | Trademark Management, Ltd. | ||||
| Original Term to Maturity | 120 months | ||||||
| Original Amortization Term: | 0 months | Underwriting and Financial Information | |||||
| IO Period: | 120 months | UW NOI: | $15,951,889 | ||||
| Seasoning: | 0 months | UW NOI Debt Yield(1): | 9.1% | ||||
| Prepayment Provisions(2): | LO (24); DEF (89); O (7) | UW NOI Debt Yield at Maturity(1): | 9.1% | ||||
| Lockbox/Cash Mgmt Status: | Hard/Springing | UW NCF DSCR(1): | 2.04x | ||||
| Additional Debt Type(3): | Pari Passu | Most Recent NOI: | $15,219,024 (12/31/2016) | ||||
| Additional Debt Balance(3): | $110,000,000 | 2nd Most Recent NOI: | $14,612,463 (12/31/2015) | ||||
| Future Debt Permitted (Type): | No (N/A) | 3rd Most Recent NOI: | $14,525,710 (12/31/2014) | ||||
| Reserves(4) | Most Recent Occupancy(6): | 92.5% (5/1/2017) | |||||
| Type | Initial | Monthly | Cap | 2nd Most Recent Occupancy: | 93.8% (12/31/2015) | ||
| RE Tax: | $0 | Springing | N/A | 3rd Most Recent Occupancy: | 95.3% (12/31/2014) | ||
| Insurance: | $0 | Springing | N/A | Appraised Value (as of)(7): | $326,190,000 (4/11/2017) | ||
| Recurring Replacements: | $0 | Springing | $143,136 | Cut-off Date LTV Ratio(1)(7): | 53.6% | ||
| TI/LC(5): | $0 | Springing | $1,192,896 | Maturity Date LTV Ratio(1)(7): | 53.6% | ||
| Free Rent(5): | $0 | $0 | N/A | ||||
| Sources and Uses | ||||||
| Sources | Proceeds | % of Total | Uses | Proceeds | % of Total | |
| Loan Amount(1): | $175,000,000 | 100.0% | Loan Payoff: | $102,042,655 | 58.3% | |
| Closing Costs: | $2,222,861 | 1.3% | ||||
| Return of Equity: | $70,734,484 | 40.4% | ||||
| Total Sources: | $175,000,000 | 100.0% | Total Uses: | $175,000,000 | 100.0% | |
| (1) | The Market Street - The Woodlands Mortgage Loan is part of the Market Street - The Woodlands Whole Loan, which is comprised of fourpari passu promissory notes with an aggregate principal balance of $175,000,000. The Cut-off Date Balance per SF, Maturity Date Balance per SF, UW NOI Debt Yield, UW NOI Debt Yield at Maturity, UW NCF DSCR, Cut-off Date LTV Ratio and Maturity Date LTV Ratio numbers presented above are based on the aggregate principal balance of the promissory notes comprising the Market Street - The Woodlands Whole Loan. |
| (2) | Defeasance of the Market Street - The Woodlands Whole Loan is permitted at any time after the earlier of (i) July 1, 2020, or (ii) two years from the closing date of the securitization that includes the lastpari passunote of the Market Street - The Woodlands Whole Loan to be securitized. The assumed lockout period of 24 payments is based on the closing date of this transaction in June 2017. |
| (3) | See “—The Mortgage Loan” and “—Additional Secured Indebtedness (not including trade debts)” below for further discussion of additional debt. |
| (4) | See “—Escrows and Reserves” below for further discussion of reserve requirements. |
| (5) | The Market Street – The Woodlands sponsor has provided a guaranty for outstanding free rent and outstanding TI/LC obligations. |
| (6) | Most Recent Occupancy includes six new tenants with executed leases totaling 2.5% of NRA, that will not be in occupancy of the Market Street - The Woodlands Property as of June 2017. |
| (7) | Appraised Value represents, and Cut-off Date LTV Ratio and Maturity Date LTV Ratio are calculated based upon, an “As Is Plus PV of TCID Revenue” value of $326,190,000 as of April 11, 2017, which includes the “as is” value of $315,930,000 and the “Present Value of TCID Revenue” of $10,260,000. The “as-is” appraised value of $315,930,000 as of April 11, 2017 results in a Cut-off Date LTV Ratio and Maturity Date LTV Ratio for the Market Street - The Woodlands Whole Loan of 55.4% and 55.4%, respectively. See “The Property” below for a discussion of TCID (Town Center Improvement District) related revenue. |
The Mortgage Loan.The fourth largest mortgage loan (the “Market Street - The Woodlands Mortgage Loan”) is part of a whole loan (the “Market Street - The Woodlands Whole Loan”) evidenced by fourpari passu promissory notes in the aggregate original principal amount of $175,000,000, all of which are secured by a first priority fee mortgage encumbering a lifestyle center with a second and third floor office component known as Market Street - The Woodlands (the “Market Street - The Woodlands Property”). The Market Street - The Woodlands Whole Loan was co-originated by Morgan Stanley Bank, N.A. and Wells Fargo Bank, National Association (“WFB”). Promissory Note A-2, which is being contributed by Morgan Stanley Mortgage Capital Holdings LLC (“MSMCH”), in the original principal amount of $22,500,000 and Promissory Note A-3, which is being contributed by WFB, in the original principal amount of $42,500,000, represent the Market Street - The Woodlands Mortgage Loan, and will be included in the BANK 2017-BNK5 securitization trust. Promissory Note A-1, with an original principal balance of $65,000,000 is expected to be contributed to the MSC 2017-H1 securitization trust. Promissory Note A-4, in the original principal balance of $45,000,000 is currently being held by WFB, or an affiliate thereof, and may be contributed to one or more future securitization transactions or may be otherwise transferred at any time. Promissory Notes A-1 and A-4 represent thepari passucompanion loans (the “Market Street - The Woodlands ServicedPari PassuCompanion Loans”). The Market Street - The Woodlands Whole Loan will initially be serviced pursuant to the pooling and servicing agreement for the MSC 2017-H1 securitization trust and, from and after the
This is not a research report and was not prepared by any Underwriter’s research department. Please see additional important information and qualifications at the end of this Term Sheet.
| T-65 |
| BANK 2017-BNK5 | Market Street – The Woodlands |
closing of the BANK 2017-BNK5 securitization transaction, will be serviced pursuant to the pooling and servicing agreement for the BANK 2017-BNK5 securitization trust. See “Description of the Mortgage Pool—The Whole Loans—The Serviced Pari Passu Whole Loans” and “Pooling and Servicing Agreement” in the Preliminary Prospectus.
The proceeds of the Market Street - The Woodlands Whole Loan were primarily used to refinance a previous loan of approximately $102.0 million, pay closing costs of approximately $2.2 million and return equity of approximately $70.7 million to the Market Street – The Woodlands sponsor. The Market Street - The Woodlands Property was previously securitized in the COMM 2007-C9 transaction.
The Borrower and the Sponsors. The borrower is IMI MSW LLC (the “Market Street - The Woodlands Borrower”), a single-purpose Delaware limited liability company, with two independent directors. The Market Street - The Woodlands Borrower is 95.25% owned by entities controlled by Institutional Mall Investors LLC (“IMI”). IMI is the sponsor and non-recourse carveout guarantor of the Market Street - The Woodlands Whole Loan. IMI is owned 99.0% by the California Public Employees Retirement System (“CalPERS”) and 1.0% by MCA Mall Investors LLC, and is managed by Miller Capital Advisory, Inc.
IMI is an investment platform focused on fashion oriented retail properties. As of March 2017, IMI’s portfolio included approximately 19.9 million SF of retail space and over 0.9 million SF of office space.
The liability of IMI under the non-recourse carveout guaranty (which also covers environmental matters) is capped with respect to full recourse items at $100.0 million, plus the reasonable out-of-pocket costs and expenses (including court costs and reasonable attorneys’ fees) incurred by the lender in the enforcement of such guaranty or the preservation of the lender’s rights thereunder.
The Property.The Market Street - The Woodlands Property is a 492,082 SF grocery-anchored outdoor lifestyle center with a second and third floor office component located in The Woodlands, Texas, a master-planned community comprised of residential villages, commercial developments, schools, churches and parks approximately 35 miles north of downtown Houston, Texas. The Market Street – The Woodlands Property sits within the Town Center, a retail center within the community that also includes The Woodlands Mall, located adjacent to the Market Street – The Woodlands Property.
Built in 2004, the Market Street - The Woodlands Property sits on 34.5 acres and is comprised of 377,112 SF of retail space and 114,970 SF of second and third floor office space and contains a total of 2,019 parking spaces (4.11 spaces per 1,000 SF of NRA). As of May 1, 2017, the Market Street - The Woodlands Property was 92.5% leased by a mix of 94 national and local retail, office and restaurant tenants including Cinemark, Tommy Bahama, Tiffany & Co., Michael Kors, Tesla, Kendra Scott, Lululemon, J. Crew, Vineyard Vines, Suitsupply, Trina Turk and Jasper’s. H-E-B Woodlands Market serves as the anchor tenant and accounts for 16.8% of NRA and 8.4% of underwritten rent. No other tenant represents more than 4.8% of NRA or 5.4% of underwritten rent. H-E-B Woodlands Market reported sales of approximately $77.0 million ($934 PSF) as of December 2016. Retail tenants excluding H-E-B Woodlands Market and Cinemark had combined sales of over $118.5 million ($575 PSF) during the same period. Of the Market Street – The Woodlands Property’s 64 retail tenants that reported sales in 2016, 35 had sales of at least $500 PSF, and ten had sales of over $900 PSF in 2016. 31 tenants totaling 213,329 SF (43.4% of NRA) have either taken occupancy or renewed at the Market Street - The Woodlands Property since 2016. The largest office tenants include Merrill Lynch and Regus, which have exercised extension options in 2016 and 2017, respectively.
The Market Street – The Woodlands Property is shadow anchored by the 70-key Hyatt Centric boutique hotel. The Hyatt Centric hotel is one unit of a two unit condominium, in which the other unit is a single 23,934 SF building included in the Market Street - The Woodlands Property in which five tenants are located including Charming Charlie (9,237 SF). Such building in the Market Street - The Woodlands Property has a 28.1% interest in the condominium, and does not have control over the condominium board.
The Market Street – The Woodlands Borrower is entitled to receive payments related to a tax increment financing known as Town Center Improvement District (“TCID”), pursuant to which the Market Street – The Woodlands Borrower, as successor to the developer of the Mortgaged Property, is entitled to receive a portion of a tax assessed for the purpose of reimbursing the TCID and the developer for the cost of developing a parking garage and central plaza. The “As Is Plus PV of TCID Revenue” appraised value of the Mortgaged Property includes $10,260,000, which is equal to the present value of projected revenue in connection with such reimbursement through 2027, as projected in the appraisal. There is no assurance that such revenue will be received in such amount or in any particular amount. In addition, the tax assessment may terminate prior to the full reimbursement of the reimbursable amount. See “Description of the Mortgage Pool—Real Estate and Other Tax Considerations” in the Preliminary Prospectus.
Major Retail Tenants.
H-E-B Woodlands Market (82,525 SF, 16.8% of NRA, 8.4% ofunderwritten rent). H-E-B Woodlands Market (“H-E-B”), a tenant at the Market Street – The Woodlands Property since 2004, is a supermarket chain with over 100,000 employees at more than 380 stores, primarily in Texas (332 stores) and Mexico (56 Stores). H-E-B has extended its lease three times, has a lease expiration of July 1, 2024 and has four five-year renewal options. In 2016, H-E-B had sales of approximately $77.0 million at the Market Street - The Woodlands Property with an average of $934 PSF.
Cinemark(20,664 SF, 4.2% of NRA, 3.1% of underwritten rent). Cinemark leases 20,664 SF at the Market Street – The Woodlands Property and operates the space as a five-screen movie theatre. Cinemark has 4,541 screens across 337 locations in 41 states in the United States and has 1,353 screens across 188 locations in 15 countries throughout Latin America. Cinemark’s lease commenced May 1, 2005 and has an expiration date of May 1, 2020, with four five-year renewal options. In 2016, Cinemark had sales of approximately $2.4 million at the Market Street - The Woodlands Property with an average of $487,337 per screen.
Tommy Bahama(12,358 SF, 2.5% of NRA, 3.3% of underwritten rent).Tommy Bahama operates as a restaurant and bar, with a retail store at the Market Street – The Woodlands Property. The restaurant offers live music events and a private dining room for events. The restaurant features tropical cuisine featuring popular seafood offerings. The clothing portion offers customers island-themed apparel for both men and women. Tommy Bahama’s lease commenced March 16, 2005 and has an expiration date of March 1, 2020, with two five-year renewal options, and an expiration date of November 30, 2019 for 372 SF of storage space. In 2016, Tommy Bahama had sales of approximately $10.7 million at the Market Street - The Woodlands Property with an average of $870 PSF.
This is not a research report and was not prepared by any Underwriter’s research department. Please see additional important information and qualifications at the end of this Term Sheet.
| T-66 |
| BANK 2017-BNK5 | Market Street – The Woodlands |
The following table presents a summary regarding the largest tenants at the Market Street - The Woodlands Property:
| Tenant Summary(1) | ||||||||||
| Tenant Name | Credit Rating (Fitch/Moody’s/S&P)(2) | Tenant SF | % of Collateral SF | Annual UW Rent(3) | % of Annual UW Rent | Annual UW Rent PSF(4) | 2016 Sales | Occ. Cost %(5) | Lease Expiration | |
| $ | PSF | |||||||||
| Major Retail Tenants | ||||||||||
| H-E-B Woodlands Market | NR/NR/NR | 82,525 | 16.8% | $1,325,352 | 8.4% | $16.06 | $77,040,960 | $934 | 2.8% | 7/1/2024 |
| Cinemark(6) | NR/NR/NR | 20,664 | 4.2% | $485,604 | 3.1% | $23.50 | $2,436,685 | $487,337 | 20.6% | 5/1/2020 |
| Tommy Bahama | NR/NR/NR | 12,358 | 2.5% | $524,510 | 3.3% | $42.44 | $10,748,103 | $870 | 6.1% | 3/1/2020 |
| Jasper’s | NR/NR/NR | 10,041 | 2.0% | $316,994 | 2.0% | $31.57 | $5,043,310 | $502 | 10.1% | 10/1/2020 |
| Charming Charlie | NR/NR/NR | 9,237 | 1.9% | $359,966 | 2.3% | $38.97 | $1,592,854 | $172 | 22.6% | 7/1/2020 |
| Subtotal/Wtd. Avg.(7) | 134,825 | 27.4% | $3,012,426 | 19.1% | $22.34 | $96,861,911 | $827 | 3.9% | ||
| Other Retail Tenants | 208,930 | 42.5% | $8,877,118 | 56.3% | $42.49 | $101,122,270 | $580 | 11.0% | ||
| Vacant Retail Space | 33,357 | 6.8% | $0 | 0.0% | $0.00 | |||||
| Retail Subtotal/Wtd. Avg.(7) | 377,112 | 76.6% | $11,889,544 | 75.4% | $34.59 | $197,984,181 | $678 | 7.6% | ||
| Major Office Tenants | ||||||||||
| Merrill Lynch | A/Baa1/BBB+ | 23,682 | 4.8% | $849,237 | 5.4% | $35.86 | 1/1/2020 | |||
| Regus(8)(9) | NR/NR/NR | 23,495 | 4.8% | $810,578 | 5.1% | $34.50 | 3/1/2027 | |||
| Spartan | NR/NR/NR | 12,222 | 2.5% | $458,325 | 2.9% | $37.50 | 6/1/2021 | |||
| Cherry Creek Mortgage | NR/NR/NR | 8,292 | 1.7% | $269,138 | 1.7% | $32.46 | 6/1/2024 | |||
| Jefferson Refinery | NR/NR/NR | 6,798 | 1.4% | $261,723 | 1.7% | $38.50 | 12/1/2018 | |||
| Subtotal/Wtd. Avg. | 74,489 | 15.1% | $2,649,000 | 16.8% | $35.56 | |||||
| Other Office Tenants | 37,126 | 7.5% | $1,231,859 | 7.8% | $33.18 | |||||
| Vacant Office Space | 3,355 | 0.7% | $0 | 0.0% | $0.00 | |||||
| Office Subtotal/Wtd. Avg. | 114,970 | 23.4% | $3,880,859 | 24.6% | $34.77 | |||||
| Total/Wtd. Avg. | 492,082 | 100.0% | $15,770,403 | 100.0% | $34.63 | |||||
| (1) | Information is based on the underwritten rent roll as of May 1, 2017. |
| (2) | Certain ratings are those of the parent company whether or not the parent guarantees the lease. |
| (3) | Annual UW Rent includes contractual rent steps equal to $749,934 through May 31, 2018. |
| (4) | Wtd. Avg. Annual UW Rent PSF excludes vacant space. |
| (5) | Occ. Cost % is based on the underwritten rent as of the May 1, 2017 rent roll and Underwritten Reimbursements divided by most recently reported sales. |
| (6) | Sales PSF for Cinemark is based on 5 screens. |
| (7) | For purposes of calculating Major Retail Tenants subtotals for 2016 Sales PSF and Occ. Cost %, amounts exclude Cinemark and tenants that do not report sales. Wtd. Avg. is based on Tenant SF for 2016 Sales PSF and by 2016 Sales $ for Occ. Cost %. |
| (8) | Regus has a termination option at any time on or after March 1, 2025 upon 6 months’ notice. |
| (9) | Actual Rent PSF for Regus is $17.25 through March 31, 2018, as Regus has a partial rent abatement through that date. See “—Escrows and Reserves” below. |
The following table presents historical sales information for the anchor tenants at the Market Street - The Woodlands Property:
| Historical Sales Summary(1) | |||||||||
| 2014 Sales | 2015 Sales | 2016 Sales | |||||||
| Tenant | Sales ($) | Sales (PSF) | Occ. Cost %(2) | Sales ($) | Sales (PSF) | Occ. Cost %(2) | Sales ($) | Sales (PSF) | Occ. Cost %(2) |
| H-E-B Woodlands Market | $74,409,768 | $902 | 2.9% | $79,449,680 | $963 | 2.7% | $77,040,960 | $934 | 2.8% |
| Cinemark(3) | $2,973,625 | $594,725 | 16.9% | $2,637,060 | $527,412 | 19.0% | $2,436,685 | $487,337 | 20.6% |
| Tommy Bahama | $11,739,121 | $950 | 5.6% | $11,444,621 | $926 | 5.7% | $10,748,103 | $870 | 6.1% |
| Jasper’s | $6,676,568 | $665 | 7.6% | $5,989,473 | $597 | 8.5% | $5,043,310 | $502 | 10.1% |
| Charming Charlie | $2,193,196 | $237 | 16.4% | $1,847,910 | $200 | 19.5% | $1,592,854 | $172 | 22.6% |
| Subtotal/Wtd. Avg.(4) | $97,992,278 | $832 | 3.9% | $101,368,744 | $865 | 3.7% | $96,861,911 | $827 | 3.9% |
| Other Retail Tenants | $99,327,606 | $588 | 10.7% | $103,117,033 | $606 | 10.4% | $101,122,270 | $580 | 11.0% |
| Total/Wtd. Avg.(4) | $197,319,884 | $687 | 7.3% | $204,485,777 | $710 | 7.1% | $197,984,181 | $678 | 7.6% |
| (1) | Information is based on the underwritten rent roll as of May 1, 2017. |
| (2) | 2014, 2015 and 2016 Occ. Cost % is based on the underwritten rent as of the May 1, 2017 rent roll and Underwritten Reimbursements divided by the respective year’s reported sales. |
| (3) | Sales PSF for Cinemark is based on 5 screens. |
| (4) | Subtotal/Wtd. Avg. and Total/Wtd. Avg. 2016 Sales (PSF) and Occ. Cost % exclude Cinemark and tenants that do not report sales. Wtd. Avg. is based on Tenant SF for Sales (PSF) and by Sales ($) for Occ. Cost.%. |
This is not a research report and was not prepared by any Underwriter’s research department. Please see additional important information and qualifications at the end of this Term Sheet.
| T-67 |
| BANK 2017-BNK5 | Market Street – The Woodlands |
The following table presents certain information relating to the lease rollover at Market Street - The Woodlands Property:
| Lease Rollover Schedule(1)(2) | ||||||||
| Year | # of Leases Rolling | SF Rolling | Approx. % of Total SF Rolling | Approx. Cumulative % of SF Rolling | Total UW Rent Rolling(3) | Annual UW Rent PSF Rolling(4) | Approx. % of Total Rent Rolling | Approx. Cumulative % of Total Rent Rolling |
| MTM | 1 | 3,602 | 0.7% | 0.7% | $179,560 | $49.85 | 1.1% | 1.1% |
| 2017 | 3 | 6,875 | 1.4% | 2.1% | $301,594 | $43.87 | 1.9% | 3.1% |
| 2018 | 8 | 26,415 | 5.4% | 7.5% | $964,475 | $36.51 | 6.1% | 9.2% |
| 2019 | 10 | 36,080 | 7.3% | 14.8% | $1,226,410 | $33.99 | 7.8% | 16.9% |
| 2020 | 19 | 120,147 | 24.4% | 39.2% | $4,101,653 | $34.14 | 26.0% | 43.0% |
| 2021 | 15 | 52,800 | 10.7% | 50.0% | $2,094,556 | $39.67 | 13.3% | 56.2% |
| 2022 | 15 | 41,394 | 8.4% | 58.4% | $1,655,678 | $40.00 | 10.5% | 66.7% |
| 2023 | 4 | 9,875 | 2.0% | 60.4% | $443,964 | $44.96 | 2.8% | 69.5% |
| 2024 | 10 | 108,440 | 22.0% | 82.4% | $2,534,314 | $23.37 | 16.1% | 85.6% |
| 2025 | 3 | 6,102 | 1.2% | 83.7% | $527,560 | $86.46 | 3.3% | 89.0% |
| 2026 | 1 | 2,379 | 0.5% | 84.2% | $84,455 | $35.50 | 0.5% | 89.5% |
| 2027 | 6 | 36,670 | 7.5% | 91.6% | $1,530,196 | $41.73 | 9.7% | 99.2% |
| 2028 & Beyond | 1 | 4,591 | 0.9% | 92.5% | $125,990 | $27.44 | 0.8% | 100.0% |
| Vacant | 0 | 36,712 | 7.5% | 100.0% | $0 | $0.00 | 0.0% | 100.0% |
| Total/Wtd. Avg. | 96 | 492,082 | 100.0% | $15,770,403 | $34.63 | 100.0% | ||
| (1) | Information is based on the underwritten rent roll as of May 1, 2017. |
| (2) | Certain tenants may have lease termination options that are exercisable prior to the stated expiration date of the subject lease or leases which are not considered in the lease rollover schedule. |
| (3) | Total UW Rent Rolling includes contractual rent steps equal to $749,934 through May 31, 2018. |
| (4) | Wtd. Avg. Annual UW Rent PSF Rolling excludes vacant space. |
The Market.The Market Street - The Woodlands Property is located in a densely developed part of The Woodlands, a master planned community 35 miles north of Houston. The area surrounding the Market Street - The Woodlands Property is comprised of a mix of commercial, retail and multifamily development which includes The Woodlands Mall (1.4 million SF) directly to the east, The Cynthia Woods Mitchell Pavilion, an outdoor amphitheater with a capacity of over 16,000 directly to the south, a 24 Hour Fitness directly to the north and approximately 8.3 million SF of office space and 2,200 multifamily units within a one-mile radius. According to the appraisal, The Woodlands is a closed market and the owner, Howard Hughes Corporation, retains most of the available land; accordingly, if Howard Hughes Corporation does not approve of an intended use, it does not get developed.
The Market Street - The Woodlands Property is located in the north retail submarket of Houston, Texas. According to the appraisal, over the past two years, retail occupancy levels in the overall Houston market have ranged from 94.8% to 95.3%, while retail occupancy levels in the north retail submarket have ranged from 94.7% to 95.0%. For the first quarter of 2017, the north retail submarket had an average occupancy of 94.9% and average rent PSF of $15.17.
The Market Street - The Woodlands Property is located in the Woodlands office submarket of Houston, Texas. According to the appraisal, over the past two years, office occupancy levels in the overall Houston market have ranged from 84.2% to 89.2%, while office occupancy levels in the Woodlands office submarket have ranged from 88.6% to 94.0%. For the first quarter of 2017, the Woodlands office submarket had an average occupancy of 89.1% and average rent PSF of $29.76.
The estimated 2016 population within a one-, three- and five-mile radius of the Market Street - The Woodlands Property is 4,208, 60,130 and 149,260, respectively, according to the appraisal. The estimated 2016 average household income within a one-, three- and five-mile radius of the Market Street - The Woodlands Property is $143,741, $108,174 and $118,199, respectively.
This is not a research report and was not prepared by any Underwriter’s research department. Please see additional important information and qualifications at the end of this Term Sheet.
| T-68 |
| BANK 2017-BNK5 | Market Street – The Woodlands |
The appraisal identified a primary trade area of a three to five mile radius around the Market Street - The Woodlands Property. A summary of demographics in the primary trade area is presented below.
| Statistic | 1-mile Radius | 3-mile Radius | 5-mile Radius |
| Population | |||
| 2021 Total Population (projected) | 4,927 | 67,111 | 171,294 |
| 2016 Total Population | 4,208 | 60,130 | 149,260 |
| 2010 Total Population | 3,203 | 53,961 | 125,312 |
| 2000 Total Population | 2,227 | 46,547 | 88,290 |
| Annual Growth 2016-2021 (projected) | 3.21% | 2.22% | 2.79% |
| Annual Growth 2010-2016 | 4.65% | 1.82% | 2.96% |
| Annual Growth 2000-2010 | 3.70% | 1.49% | 3.56% |
| Households | |||
| 2021 Total Households (projected) | 2,790 | 27,993 | 64,696 |
| 2016 Total Households | 2,367 | 25,063 | 56,607 |
| 2010 Total Households | 1,760 | 22,387 | 47,969 |
| 2000 Total Households | 1,092 | 17,683 | 31,140 |
| Annual Growth 2016-2021 (projected) | 3.34% | 2.24% | 2.71% |
| Annual Growth 2010-2016 | 5.06% | 1.90% | 2.80% |
| Annual Growth 2000-2010 | 4.89% | 2.39% | 4.42% |
| Household Income | |||
| 2016 Median Household Income | $89,662 | $75,336 | $87,349 |
| 2016 Average Household Income | $143,741 | $108,174 | $118,199 |
| 2016 Per Capita Income | $75,967 | $45,299 | $44,737 |
Source: Appraisal
The following table presents comparable retail properties with respect to the Market Street - The Woodlands Property:
| Competitive Property Summary | ||||||
| Property Name | Type | Year Built/Renovated | Size (SF) | Total Occupancy | Anchor Tenants | Distance to Subject |
| Market Street - The Woodlands Property | Lifestyle Center | 2004/2012 | 492,082(1) | 92.5%(1) | H-E-B Woodlands Market, Cinemark, Tommy Bahama | N/A |
| Sterling Ridge Village Center | Anchored Retail | 2001/N/A | 128,639 | 100.0% | Kroger, CVS | 4.6 miles |
| Indian Springs Village Center | Anchored Retail | 2004/N/A | 136,625 | 100.0% | H-E-B | 4.6 miles |
| Alden Bridge Village Center | Anchored Retail | 1998/N/A | 138,953 | 100.0% | Kroger, Walgreens | 5.0 miles |
| Total/Wtd. Avg.(2) | 404,217 | 100.0% | ||||
Source: Appraisal
| (1) | Information is based on the underwritten rent roll as of May 1, 2017. |
| (2) | Total/Wtd. Avg. excludes the Market Street - The Woodlands Property. |
The adjacent The Woodlands Mall, as well as two other nearby retail developments, Hughes Center and Pinecroft Center, constitute competing retail centers with respect to the Market Street - The Woodlands Property.
This is not a research report and was not prepared by any Underwriter’s research department. Please see additional important information and qualifications at the end of this Term Sheet.
| T-69 |
| BANK 2017-BNK5 | Market Street – The Woodlands |
Operating History and Underwritten Net Cash Flow. The following table presents certain information relating to the historical operating performance and the Underwritten Net Cash Flow at the Market Street - The Woodlands Property:
| Cash Flow Analysis | |||||||||||||
| 2013 | 2014 | 2015 | 2016 | UW(1) | UW PSF | ||||||||
| Base Rent | $13,785,725 | $15,222,078 | $15,308,117 | $15,720,727 | $16,939,379 | $34.42 | |||||||
| Total Recoveries | $5,031,532 | $5,524,058 | $5,854,619 | $6,062,079 | $5,975,447 | $12.14 | |||||||
| Other Income(2) | $1,839,025 | $1,867,424 | $1,878,713 | $2,267,769 | $1,864,652 | $3.79 | |||||||
| Less Vacancy | $0 | $0 | $0 | $0 | $0 | $0.00 | |||||||
| Effective Gross Income | $20,656,282 | $22,613,560 | $23,041,449 | $24,050,575 | $24,779,479 | $50.36 | |||||||
| Total Expenses | $7,677,682 | $8,087,850 | $8,428,986 | $8,831,551 | $8,827,590 | $17.94 | |||||||
| Net Operating Income | $12,978,600 | $14,525,710 | $14,612,463 | $15,219,024 | $15,951,889 | $32.42 | |||||||
| Capital Expenditures | $0 | $0 | $0 | $0 | $78,733 | $0.16 | |||||||
| TI/LC | $0 | $0 | $0 | $0 | $1,120,268 | $2.28 | |||||||
| Net Cash Flow | $12,978,600 | $14,525,710 | $14,612,463 | $15,219,024 | $14,752,888 | $29.98 | |||||||
| Occupancy % | 95.4% | 95.3% | 93.8% | N/A(3) | 92.5%(4) | ||||||||
| NOI DSCR(5) | 1.79x | 2.00x | 2.02x | 2.10x | 2.20x | ||||||||
| NCF DSCR(5) | 1.79x | 2.00x | 2.02x | 2.10x | 2.04x | ||||||||
| NOI Debt Yield(5) | 7.4% | 8.3% | 8.3% | 8.7% | 9.1% | ||||||||
| NCF Debt Yield(5) | 7.4% | 8.3% | 8.3% | 8.7% | 8.4% | ||||||||
| (1) | Underwritten Rent is based on the rent roll dated May 1, 2017 and includes rent steps through May 31, 2018 totaling $749,934. |
| (2) | Other Income is comprised of merchant association fees, parking income, income related to the TCID, event income, sponsorship income, sign income and various other incomes. |
| (3) | 2016 Occupancy % was not provided. The Market Street - The Woodlands Property was 92.5% leased as of May 1, 2017. |
| (4) | UW Occupancy % includes six new tenants with executed leases totaling 2.5% of NRA, that will not be in occupancy of the Market Street - The Woodlands Property as of June 2017. |
| (5) | Debt service coverage ratios and debt yields are based on the Market Street - The Woodlands Whole Loan. |
Escrows and Reserves. At loan closing, the Market Street - The Woodlands Borrower delivered to the lender guaranties from Institutional Mall Investors LLC of the Market Street - The Woodlands Borrower’s obligations (i) to deposit with the lender the amount of $399,264 in respect of free rent for the tenants Regus and Tory Burch, to be reduced by the amount pertaining to each such tenant at such time as it has begun paying full unabated rent, and (ii) to deposit with the lender the amount of $2,433,834 in respect of tenant allowances and leasing commissions owed to Regus and Tory Burch, less, on a dollar for dollar basis, any tenant improvements, tenant allowances, landlord work and/or leasing commissions actually paid by or on behalf of the Market Street - The Woodlands Borrower, in each case in lieu of depositing upfront reserves for such amounts.
During a Collection Reserve Trigger Period (defined below), or at any time (x) all real estate taxes are not paid by the Market Street - The Woodlands Borrower prior to the assessment of any penalty for late payment and prior to the date they become delinquent (unless contested in accordance with the terms of the Market Street - The Woodlands Whole Loan documents), (y) the Market Street - The Woodlands Borrower fails to promptly provide evidence that such taxes have been paid prior to the assessment of any penalty for late payment and prior to the date they become delinquent (unless contested in accordance with the terms of the Market Street - The Woodlands Whole Loan documents) or (z) an event of default exists under the Market Street - The Woodlands Whole Loan, the Market Street - The Woodlands Borrower is required to escrow monthly 1/12th of the annual estimated real estate tax payments. During a Collection Reserve Trigger Period or the existence of an event of default under the Market Street - The Woodlands Whole Loan, if the Market Street - The Woodlands Borrower has not provided satisfactory evidence to the lender that the Market Street - The Woodlands Property is covered by a reasonably acceptable blanket insurance policy, the Market Street - The Woodlands Borrower is required to escrow monthly 1/12th of the annual estimated insurance premiums.
During a Collection Reserve Trigger Period or the existence of an event of default under the Market Street - The Woodlands Whole Loan, the Market Street - The Woodlands Borrower is required to deposit monthly the amount of $5,964 into a replacement reserve; provided that such deposits are not required to be made to the extent such deposits would cause the aggregate amount of such replacement reserve to exceed $143,136 on any monthly payment date. In addition, during the continuance of a Collection Reserve Trigger Period or an event of default under the Market Street - The Woodlands Whole Loan, the Market Street - The Woodlands Borrower is required to deposit monthly the amount $49,704 into a reserve for future tenant improvements and leasing commissions (the “Rollover Reserve”); provided that such deposits are not required to be made to the extent such deposits would cause the aggregate amount of the Rollover Reserve to exceed $1,192,896 (the “Rollover Reserve Cap”) on any monthly payment date; and provided further, that so long as no DSCR Trigger Period (as defined below) exists, in lieu of making deposits to the Rollover Reserve, the Market Street - The Woodlands Borrower may deliver a letter of credit in the amount of such deposits or a guaranty from Institutional Mall Investors LLC or a replacement guarantor meeting the requirements of the Market Street - The Woodlands Whole Loan documents, of the obligation to make such deposits. The liability of any such guarantor under any such guaranty will not exceed the Rollover Reserve Cap.
A “Collection Reserve Trigger Period” means the period (i) commencing as of the date the debt service coverage ratio of the Market Street - The Woodlands Whole Loan based on the trailing four calendar quarters preceding the date of determination is less than 1.35x for two consecutive calendar quarters, and (ii) ending on the date the debt service coverage ratio of the Market Street - The Woodlands Whole Loan based on the trailing four calendar quarters preceding the date of determination is 1.35x or greater for two consecutive calendar quarters.
A “DSCR Trigger Period” means the period (i) commencing as of the date the debt service coverage ratio of the Market Street - The Woodlands Whole Loan based on the trailing four calendar quarters preceding the date of determination is less than 1.25x for two consecutive calendar quarters, and (ii) ending on the date the debt service coverage ratio of the Market Street - The Woodlands Whole Loan based on the trailing four calendar quarters preceding the date of determination is 1.25x or greater for two consecutive calendar quarters.
This is not a research report and was not prepared by any Underwriter’s research department. Please see additional important information and qualifications at the end of this Term Sheet.
| T-70 |
| BANK 2017-BNK5 | Market Street – The Woodlands |
Lockbox and Cash Management. A hard lockbox is in place with respect to the Market Street - The Woodlands Whole Loan. Within 30 days after the loan origination date, the Market Street - The Woodlands Borrower is required to notify and advise each tenant to send rent payments directly to the lockbox account. The Market Street - The Woodlands Whole Loan has springing cash management (i.e., the Market Street - The Woodlands Whole Loan has cash management only after the initial occurrence and during the continuance of a Lockbox Event Period). Provided a Lockbox Event Period is not continuing, funds in the lockbox account are required to be swept daily to an account designated by the Market Street - The Woodlands Borrower. Upon the occurrence of a Lockbox Event Period, the Market Street - The Woodlands Borrower is required to establish and maintain a lender-controlled cash management account, and, during the continuance of a Lockbox Event Period, funds in the lockbox account are required to be transferred weekly to the cash management account. During the continuance of a Lockbox Event Period, funds in the cash management account are required to be applied on each monthly payment date to pay debt service on the Market Street - The Woodlands Whole Loan, to fund the required reserves deposits as described above under “Escrows and Reserves���, to disburse the monthly operating expenses in accordance with the approved annual budget, if any or, if no approved annual budget is available for such period because review is pending or not required, in accordance with the existing annual budget (as increased to reflect actual increases in expenses outside the control of the Market Street - The Woodlands Borrower), and extraordinary operating expenses approved by the lender (or necessary for emergency expenses), and to disburse the remainder into an account to be held by the lender as additional security for the Market Street - The Woodlands Whole Loan during the continuance of such Lockbox Event Period.
A “Lockbox Event Period” means the period:
(i) commencing upon an event of default under the Market Street - The Woodlands Whole Loan and ending upon the acceptance by the lender, in its sole discretion, of a cure of such event of default, or (ii) commencing upon the occurrence of a voluntary or involuntary bankruptcy of the Market Street - The Woodlands Borrower and continuing thereafter, or (iii) commencing upon a voluntary or involuntary bankruptcy of the property manager, if it is an affiliate of the Market Street - The Woodlands Borrower, and ending if the property manager is replaced within 60 days with a Qualified Manager (as defined below) pursuant to a replacement management agreement in substantially the form and substance of the original management agreement or otherwise reasonably approved by the lender, or the bankruptcy is discharged or dismissed within 90 days without any adverse consequences to the Market Street - The Woodlands Property or the Market Street - The Woodlands Whole Loan, or (iv) during the continuance of a DSCR Trigger Period.
“Qualified Manager” means MCA Management Associates or an affiliate, Trademark Management, Ltd. or an affiliate, Institutional Mall Investors LLC, CalPERS or their affiliates, a manager meeting certain experience and/or financial requirements or an affiliate thereof, or a manager otherwise reasonably approved by the lender.
Additional Secured Indebtedness (not including trade debts). The Market Street - The Woodlands Property also secures the Market Street - The Woodlands ServicedPari Passu Companion Loans, which have a Cut-off Date principal balance of $110,000,000. The Market Street - The Woodlands ServicedPari Passu Companion Loans accrue interest at the same rate as the Market Street - The Woodlands Mortgage Loan. The Market Street - The Woodlands Mortgage Loan is entitled to payments of principal and interest on a pro rata andpari passu basis with the Market Street - The Woodlands ServicedPari Passu Companion Loans. The holders of the Market Street - The Woodlands Mortgage Loan and the Market Street - The Woodlands ServicedPari Passu Companion Loans have entered into a co-lender agreement which sets forth the allocation of collections on the Market Street - The Woodlands Whole Loan. See “Description of the Mortgage Pool—The Whole Loans—The Serviced Pari Passu Whole Loans” in the Preliminary Prospectus.
Mezzanine Loan and Preferred Equity. Not permitted.
Release of Property. The Market Street - The Woodlands Whole Loan permits the release of an unimproved release parcel, without payment or defeasance of a release amount, upon satisfaction of the following conditions (among others); (i) transfer of the parcel to a third party or an affiliate of the Market Street - The Woodlands Borrower in connection with expansion or other development, (ii) delivery of an officer’s certificate certifying that the release parcel constitutes or will constitute a separate tax lot, has been legally subdivided from the remainder of the Market Street - The Woodlands Property, and that after such subdivision both such release parcel and the remaining Market Street - The Woodlands Property comply with zoning, parking and other legal requirements, (iii) compliance with any requirements relating to such release in any lease or reciprocal easement agreement and (iv) compliance with REMIC requirements. In addition, the Market Street - The Woodlands Whole Loan generally permits the release of immaterial or non-income producing parcels, subject to certain conditions.
Terrorism Insurance. The Market Street - The Woodlands Borrower is required to obtain all risk and business income insurance against acts of terrorism to the extent such insurance is available; provided that if the Terrorism Risk Insurance Program Reauthorization Act of 2015, as the same may be amended, restated, supplemented or otherwise modified is not in effect, the Market Street - The Woodlands Borrower is not required to pay insurance premiums with respect to such terrorism insurance in excess of the Terrorism Cap (defined below). “Terrorism Cap” means two times the amount of the then-current annual insurance premiums payable by the Market Street - The Woodlands Borrower for the insurance policies required under the Market Street - The Woodlands Whole Loan documents (excluding the wind, flood and earthquake components of such insurance premiums) on a stand-alone basis. Such stand-alone terrorism policy may have a deductible that is reasonable for such stand-alone policies with respect to properties similar to the Market Street - The Woodlands Property and reasonable for the geographic region where the Market Street - The Woodlands Property is located, provided that such deductible shall not exceed $500,000 (the “Required Deductible”) or such higher deductible if the Market Street - The Woodlands Borrower provides the lender with cash or a letter of credit in an amount equal to the difference between the actual deductible and the Required Deductible. See “Risk Factors—Terrorism Insurance May Not Be Available for All Mortgaged Properties” in the Preliminary Prospectus.
This is not a research report and was not prepared by any Underwriter’s research department. Please see additional important information and qualifications at the end of this Term Sheet.
| T-71 |
| BANK 2017-BNK5 | Olympic Tower |
Mortgage Loan No. 5 – Olympic Tower
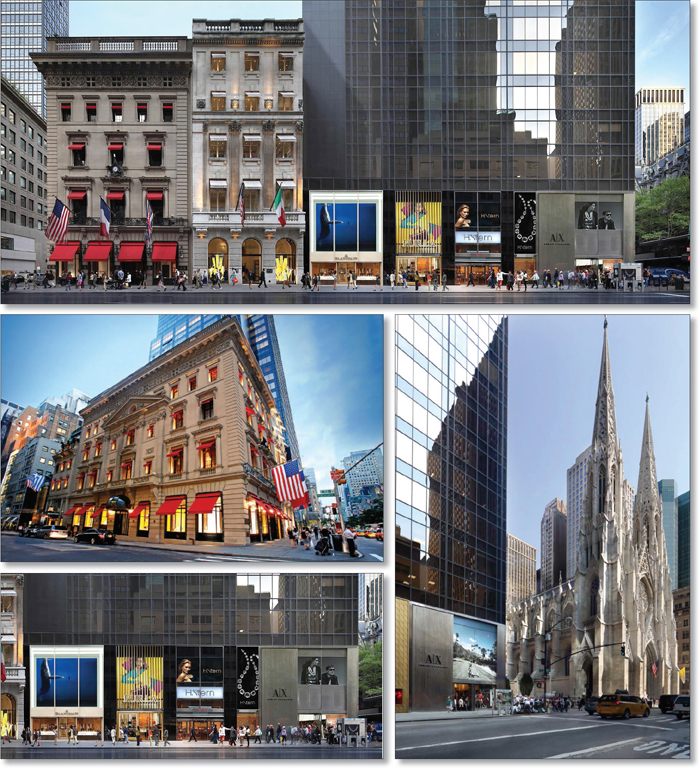
This is not a research report and was not prepared by any Underwriter’s research department. Please see additional important information and qualifications at the end of this Term Sheet.
| T-72 |
| BANK 2017-BNK5 | Olympic Tower |
Mortgage Loan No. 5 – Olympic Tower
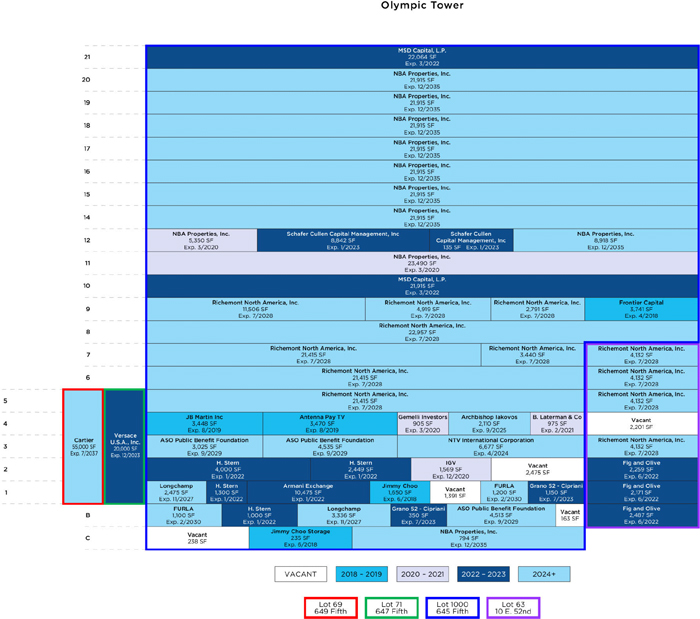
This is not a research report and was not prepared by any Underwriter’s research department. Please see additional important information and qualifications at the end of this Term Sheet.
| T-73 |
| BANK 2017-BNK5 | Olympic Tower |
Mortgage Loan No. 5 – Olympic Tower
This is not a research report and was not prepared by any Underwriter’s research department. Please see additional important information and qualifications at the end of this Term Sheet.
| T-74 |
| BANK 2017-BNK5 | Olympic Tower |
| Mortgage Loan No. 5 – Olympic Tower |
| Mortgage Loan Information | Property Information | ||||||
| Credit Assessment (DBRS/Fitch/Moody’s): | A(low)/AAAsf/Baa2 | Single Asset/Portfolio: | Single Asset | ||||
| Mortgage Loan Seller: | MSMCH | Location: | New York, NY 10022 | ||||
| Original Balance(1): | $56,000,000 | General Property Type: | Mixed Use | ||||
| Cut-off Date Balance(1): | $56,000,000 | Detailed Property Type: | Office/Retail | ||||
| % of Initial Pool Balance: | 4.5% | Title Vesting: | Leasehold | ||||
| Loan Purpose: | Refinance | Year Built/Renovated: | 1905, 1930, 1973/2017 | ||||
| Sponsor: | OMERS Administration Corporation; Crown Olympic Partners LLC | Size: | 525,372 SF | ||||
| Mortgage Rate: | 3.95394737% | Cut-off Date Balance per SF(1): | $1,163 | ||||
| Note Date: | 5/1/2017 | Maturity Date Balance per SF(1): | $1,163 | ||||
| First Payment Date: | 6/6/2017 | Property Manager: | Oxford I Asset Management USA Inc. (borrower-related) | ||||
| Maturity Date: | 5/6/2027 | ||||||
| Original Term to Maturity: | 120 months | ||||||
| Original Amortization Term: | 0 months | ||||||
| IO Period: | 120 months | Underwriting and Financial Information | |||||
| Seasoning: | 1 month | UW NOI: | $68,280,932 | ||||
| Prepayment Provisions(2): | LO (25); DEF (88); O (7) | UW NOI Debt Yield(1): | 11.2% | ||||
| Lockbox/Cash Mgmt Status: | Hard/In Place | UW NOI Debt Yield at Maturity(1): | 11.2% | ||||
| Additional Debt Type(3): | Pari Passu/B-Note / Mezzanine Debt | UW NCF DSCR(1): | 2.70x | ||||
| Additional Debt Balance(3): | $555,000,000 / $149,000,000 / $240,000,000 | Most Recent NOI: | $60,636,578 (12/31/2016) | ||||
| Future Debt Permitted (Type): | No (N/A) | 2nd Most Recent NOI: | $58,082,957 (12/31/2015) | ||||
| Reserves(4) | 3rd Most Recent NOI: | $49,983,991 (12/31/2014) | |||||
| Type | Initial | Monthly | Cap | Most Recent Occupancy: | 98.8% (4/27/2017) | ||
| RE Tax: | $0 | Springing | N/A | 2nd Most Recent Occupancy: | 95.5% (12/31/2016) | ||
| Insurance: | $298,431 | Springing | N/A | 3rd Most Recent Occupancy: | 95.5% (12/31/2015) | ||
| Recurring Replacements: | $25,989,597 | Springing | N/A | Appraised Value (as of): | $1,900,000,000 (4/1/2017) | ||
| TI/LC: | $21,357,936 | Springing | N/A | Cut-off Date LTV Ratio(1): | 32.2% | ||
| Other: | $13,997,581 | $153,680 | N/A | Maturity Date LTV Ratio(1): | 32.2% | ||
| Sources and Uses | ||||||
| Sources | Proceeds | % of Total | Uses | Proceeds | % of Total | |
| Loan Amount: | $760,000,000 | 76.0% | Loan Payoff: | $249,903,892 | 25.0% | |
| Mezzanine Loan: | $240,000,000 | 24.0% | Reserves: | $61,643,545 | 6.2% | |
| Closing Costs: | $22,652,548 | 2.3% | ||||
| Return of Equity: | $665,800,015 | 66.6% | ||||
| Total Sources: | $1,000,000,000 | 100.0% | Total Uses: | $1,000,000,000 | 100.0% | |
| (1) | The Olympic Tower Mortgage Loan is part of the Olympic Tower Whole Loan (as defined below), which is comprised of elevenpari passusenior promissory notes with an aggregate principal balance of $611,000,000 and threepari passujunior promissory notes with an aggregate principal balance of $149,000,000. The Cut-off Date Balance per SF, Maturity Date Balance per SF, UW NOI Debt Yield, UW NOI Debt Yield at Maturity, UW NCF DSCR, Cut-off Date LTV Ratio and Maturity Date LTV Ratio numbers presented above are based on the aggregate principal balance of the promissory notes comprising Olympic Tower Senior Loan (as defined below), without regard to the Olympic Tower Subordinate Companion Loan (as defined below). The Cut-off Date Balance per SF, Maturity Date Balance per SF, UW NOI Debt Yield, UW NOI Debt Yield at Maturity, UW NCF DSCR, Cut-off Date LTV Ratio and Maturity Date LTV Ratio numbers based on the entire $760,000,000 Olympic Tower Whole Loan are $1,447, $1,447, 9.0%, 9.0%, 2.17x, 40.0% and 40.0%, respectively. The Cut-off Date Balance per SF, Maturity Date Balance per SF, UW NOI Debt Yield, UW NOI Debt Yield at Maturity, UW NCF DSCR, Cut-off Date LTV Ratio and Maturity Date LTV Ratio numbers based on the combined balance of the Olympic Tower Whole Loan and mezzanine loan are $1,903, $1,903, 6.8%, 6.8%, 1.55x, 52.6% and 52.6%, respectively. |
| (2) | Defeasance of the Olympic Tower Whole Loan is permitted at any time after the earlier of (i) May 1, 2020, or (ii) two years from the closing date of the securitization that includes the lastpari passu note of the Olympic Tower Whole Loan to be securitized. The assumed lockout period of 25 payments is based on the closing date of this transaction in June 2017. |
| (3) | See “The Mortgage Loan,” “Additional Secured Indebtedness (not including trade debts)” and “Mezzanine Loan and Preferred Equity” below for further discussion of additional debt. |
| (4) | See “Escrows and Reserves” below for further discussion of reserve requirements. |
The Mortgage Loan.The fifth largest mortgage loan (the “Olympic Tower Mortgage Loan”) is part of a whole loan (the “Olympic Tower Whole Loan”) in the total original principal amount of $760,000,000. The Olympic Tower Whole Loan is secured by a first priority leasehold mortgage encumbering a mixed use property in New York, New York (the “Olympic Tower Property”). The Olympic Tower Whole Loan was co-originated by Deutsche Bank AG, New York Branch (“DBNY”), Goldman Sachs Mortgage Company (“GSMC”) and Morgan Stanley Bank, N.A. The Olympic Tower Whole Loan is comprised of (i) a senior loan, comprised of eleven senior notes, that arepari passu with each other, with an outstanding principal balance of $611,000,000 (collectively, the “Olympic Tower Senior Loan”) and (ii) a subordinate companion loan, comprised of three subordinate notes, that arepari
This is not a research report and was not prepared by any Underwriter’s research department. Please see additional important information and qualifications at the end of this Term Sheet.
| T-75 |
| BANK 2017-BNK5 | Olympic Tower |
passuwith each other, with an outstanding principal balance of $149,000,000 (collectively, the “Olympic Tower Subordinate Companion Loan”), each as described below. Promissory Note A-3-C in the original principal amount of $56,000,000 represents the Olympic Tower Mortgage Loan and will be included in the BANK 2017-BNK5 securitization trust. Of the remaining seniorpari passuPromissory Notes (collectively, the “Olympic Tower Non-ServicedPari PassuCompanion Loans”), the Olympic Tower Non-ServicedPari PassuCompanion Loans evidenced by Promissory Notes A-1-S, A-2-S and A-3-S, in the aggregate original principal balance of $331,000,000 and the entire Olympic Tower Subordinate Companion Loan were contributed to the Olympic Tower 2017-OT securitization trust. The Olympic Tower Whole Loan will be serviced pursuant to the trust and servicing agreement for the Olympic Tower 2017-OT securitization trust. The remaining Olympic Tower Non-ServicedPari PassuCompanion Loans are held by DBNY and GSMC, or affiliates thereof, and are expected to be contributed to one or more future securitization transactions or may be otherwise transferred at any time. See“Description of the Mortgage Pool—The Whole Loans—The Olympic Tower Pari Passu A/B Whole Loan”and“Pooling and Servicing Agreement—Servicing of the Non-Serviced Mortgage Loans”in the Preliminary Prospectus.
| Notes | Original Balance | Note Holder | Controlling Interest | |
| A-1-S | $165,500,000 | Olympic Tower 2017-OT | No | |
| A-2-S | $99,300,000 | Olympic Tower 2017-OT | No | |
| A-3-S | $66,200,000 | Olympic Tower 2017-OT | No | |
| A-1-C1 | $50,000,000 | Deutsche Bank AG, New York Branch | No | |
| A-1-C2 | $40,000,000 | Deutsche Bank AG, New York Branch | No | |
| A-1-C3 | $20,000,000 | Deutsche Bank AG, New York Branch | No | |
| A-1-C4 | $20,000,000 | Deutsche Bank AG, New York Branch | No | |
| A-1-C5 | $10,000,000 | Deutsche Bank AG, New York Branch | No | |
| A-2-C1 | $42,000,000 | Goldman Sachs Mortgage Company | No | |
| A-2-C2 | $42,000,000 | Goldman Sachs Mortgage Company | No | |
| A-3-C | $56,000,000 | BANK 2017 BNK5 | No | |
| B-1 | $74,500,000 | Olympic Tower 2017-OT | Yes | |
| B-2 | $44,700,000 | Olympic Tower 2017-OT | Yes | |
| B-3 | $29,800,000 | Olympic Tower 2017-OT | Yes | |
| Total | $760,000,000 |
The proceeds of the Olympic Tower Whole Loan were used to refinance a previous loan of $249,903,892 secured by the Olympic Tower Property, return equity of approximately $665,800,015 to the Olympic Tower Borrowers, pay closing costs of $22,652,548 and fund upfront reserves of $61,643,545.
The Borrower and the Sponsor. The Borrower is OT Real Estate Owner LLC (the “Olympic Tower Borrower”), a single-purpose Delaware limited liability company with two independent directors. The Olympic Tower Whole Loan sponsors are OMERS Administration Corporation (“OMERS”) and Crown Olympic Partners LLC and the non-recourse carveout guarantors are OPG Investment Holdings (US), LLC, Crown Retail Services LLC, Centurian Management Corporation and Crown 600 Broadway LLC, on a joint and several basis. Oxford Properties Group (“Oxford”) is the real estate investment arm of and a subsidiary of OMERS. Crown Olympic Partners LLC is an affiliate of Crown Acquisitions (“Crown”). The Olympic Tower Whole Loan recourse does not cover the typical nonrecourse carve-outs. It will cover certain acts of the related borrower and/or its principals specified in the related Olympic Tower Whole Loan documents, including certain voluntary or collusive bankruptcy-related events, provided, however, that any recourse with respect to bankruptcy-related events is capped at an amount equal to 10% of the original principal balance of the Olympic Tower Whole Loan, plus all reasonable, out-of-pocket costs and expenses (including court costs and reasonable, out-of-pocket attorneys’ fees) incurred by the lender in the enforcement of the guaranty or the preservation of the lender’s rights thereunder. Notwithstanding the foregoing, there is no limitation on guarantor recourse liability if any such bankruptcy-related event in any way results in a termination, surrender or rejection of the Olympicgold Ground Lease (as defined below), or an amendment or modification of the Olympicgold Ground Lease in a manner adverse to the lender without the lender’s prior written consent.
OMERS is one of Canada’s largest pension funds with over $85.2 billion of net assets as of year-end 2016, according to its 2016 annual report. Oxford is the global real estate investment arm of OMERS. Established in 1960, Oxford manages real estate for itself and on behalf of its co-owners and investment partners with offices across Canada and in New York, Washington, Boston, London and Luxembourg. Oxford’s approximately $41.0 billion real estate portfolio consists of approximately 60 million SF and over 150 properties that total approximately 3,600 hotel rooms and over 9,500 residential units located across Canada, Western Europe and the United States. Recently completed development projects include 600 Massachusetts Avenue and MNP Tower totaling 670,000 SF in Washington, DC and Vancouver, respectively, as well as the Leadenhall Building, a 600,000 SF office development located in London. Other Oxford investments include 900 New York Avenue in Washington, DC, One Memorial Drive in Cambridge, Massachusetts, retail units on New Bond Street in London and the Hudson Yards development in New York City. Crown’s portfolio of ownership interests includes over 50 assets in markets such as New York, Chicago, San Francisco, Las Vegas, and Miami.
The Property. The Olympic Tower Property is located between 51st Street and 52nd Street on Fifth Avenue in New York, New York and is comprised of four buildings, including (i) a commercial condominium unit that is part of a 52-story Class A mixed-use tower, such commercial condominium consisting of 388,170 SF of office space across floors 3 - 21 and 36,556 SF of retail space across floors 1 - 2 and two sublevel floors (the “Olympic Tower”), (ii) a five-story adjoining building totaling approximately 55,000 SF of ground and upper floor retail space occupied by Cartier (the “Cartier Building”), (iii) a five-story adjoining building totaling approximately 20,000 SF of ground and upper level luxury retail space occupied by Versace U.S.A., Inc. (the “Versace Building”), and (iv) a 25,646 SF seven story Class A office building (“10 East 52nd Street”). Located at the Olympic Tower is an approximately 230-unit residential condominium located directly above the commercial condominium portion of the mixed use tower on floors 22 – 52 (the “Residential
This is not a research report and was not prepared by any Underwriter’s research department. Please see additional important information and qualifications at the end of this Term Sheet.
| T-76 |
| BANK 2017-BNK5 | Olympic Tower |
Condominium Unit”). The Residential Condominium Unit is not collateral for the Olympic Tower Whole Loan. The condominium comprised of the Olympic Tower commercial condominium unit and the Residential Condominium Unit is governed by a board of managers that is currently composed of nine members. The Olympic Tower commercial condominium unit owner has the right to designate not less than four members of the board, and the Residential Condominium Unit owners have the right to designate the remaining members; accordingly the Olympic Tower Borrower does not control the condominium.
The Olympic Tower Property has an eight year average historical occupancy of 97.2%. The five largest tenants at the Olympic Tower Property comprise 437,322 SF, representing 83.2% of the NRA and 72.1% of underwritten gross rent. The Olympic Tower Property is a flag ship location for Cartier, the New York headquarters for the NBA Properties, the North American headquarters for Richemont and the corporate headquarters for MSD Capital.
The Ground Leases. Olympic Tower is subject to a ground lease that commenced on September 30, 1975 and expires on September 30, 2074 (the “Olympicgold Ground Lease”) and in which Olympicgold, L.L.C. is the landlord (the “Ground Lessor”) and the Olympic Tower Borrower is the tenant (the “Ground Lessee”). Olympicgold, L.L.C. is the successor-in-interest under the Ground Lease to The Equitable Life Assurance Society of the United States. The Ground Lessor is the fee owner of substantially all of the land underlying the building that is the collateral for the Olympic Tower Mortgage Loan, and the Charles Pochari Estate, Ellen Gradt, Thomas R. Pochari, Sr. and Violet A. Curley (the “Pochari Family”) is the fee owner of a 2,211 SF portion of the land underlying a portion of the building (i.e. a part of the Olympic Tower) that is the collateral for the Olympic Tower Mortgage Loan (the “Pochari Parcel”). The Pochari Family leases the Pochari Parcel to the Ground Lessor pursuant to a ground lease (the “Pochari Ground Lease”), such that the Olympicgold Ground Lease demises both Olympicgold, L.L.C.’s leasehold interest in the Pochari Parcel and Olympicgold, L.L.C.’s fee simple interest in the remaining portion of the land. Thus, the Olympicgold Ground Lease (the leasehold estate which is the collateral for the Olympic Tower Mortgage Loan) is partially a sublease with respect to the Pochari Parcel. The Ground Lessor is not required to enter into a new lease with a leasehold mortgagee in the event that the Olympicgold Ground Lease is terminated (whether in the Ground Lessee’s bankruptcy, for the Ground Lessee’s default, or otherwise).
The Olympicgold Ground Lease rent is equal to $1.75 million per year, with no contractual increases or future resets. The Pochari Ground Lease commenced January 23, 1968 and expires on January 22, 2067. At the commencement of the Pochari Ground Lease term, the Pochari Ground Lease rent was equal to $26,000 per year and is subject to a cost of living increase; the rent is currently equal to $94,160 in 2017.
Major Tenants.
The following table presents certain information relating to the leases at the Olympic Tower Property:
| Tenant Summary(1) | |||||||
| Tenant Name | Credit Rating (Fitch/Moody’s/S&P)(2) | Tenant SF | Approximate % of SF | Annual UW Rent | Annual UW Rent PSF(3) | % of Total Annual UW Rent | Lease Expiration |
| Major Tenants | |||||||
| NBA(4)(5) | NR/NR/NR | 191,957 | 36.5% | $16,115,256 | $83.95 | 17.4% | 12/1/2035 |
| Richemont(6) | NR/NR/NR | 126,386 | 24.1% | $9,952,132 | $78.74 | 10.7% | 7/1/2028 |
| Cartier(7) | NR/NR/NR | 55,000 | 10.5% | $23,077,964 | $419.60 | 24.9% | 7/31/2037 |
| MSD | NR/NR/NR | 43,979 | 8.4% | $3,955,892 | $89.95 | 4.3% | 3/31/2022 |
| Versace(7) | NR/NR/NR | 20,000 | 3.8% | $13,704,210 | $685.21 | 14.8% | 12/31/2023 |
| Subtotal/Wtd. Avg. | 437,322 | 83.2% | $66,805,454 | $152.76 | 72.1% | ||
| Other Tenants(8) | 81,582 | 15.5% | $25,887,623 | $317.32 | 27.9% | ||
| Vacant Office Space | 6,468 | 1.2% | $0 | 0.0% | |||
| Total/Wtd. Avg. | 525,372 | 100.0% | $92,693,077 | $178.63 | 100.0% | ||
| (1) | Information is based on the underwritten rent roll as of April 27, 2017. |
| (2) | Certain ratings are those of the parent company whether or not the parent guarantees the lease. |
| (3) | Wtd. Avg. Annual UW Rent PSF excludes vacant space. |
| (4) | The NBA has the one-time right, before July 1, 2018, to terminate (a) all of each of its space on the 12th floor, 12A, 12B and 12C or (b) the entire twentieth floor of the Olympic Tower upon written notice. The NBA also has the one-time right to terminate either (i) the uppermost floor of office space or (i) the entire space leased to the NBA on the lowermost floor of office space after January 1, 2026 subject to payment of a termination fee. The NBA also has the one-time right to vacate or surrender all or a portion of the Swing Space upon 180 days’ prior written notice. The NBA can expand to include the Swing Space for the full term of the lease upon 180 days’ written notice. Upon exercising their expansion option to include all or a portion of the Swing Space under its lease, the NBA will be granted an additional eight months of free rent on the Swing Space, which has not been reserved for. In addition, the NBA was granted a free rent period from July 2018 through December 2018, which was reserved for at loan closing. |
| (5) | The NBA leases 163,117 SF of space, including 794 SF of storage space, with an expiration date of December 31, 2035. The NBA leases 28,840 SF of space as “Swing Space”. The NBA was granted 12 months of free rent on the Swing Space, five months of which were reserved upfront at loan closing. Unless the NBA exercises its option to include the Swing Space for the full term of the lease, the 28,840 SF of space currently leased as Swing Space will expire on April 6, 2020. |
| (6) | Richemont is entitled to free rent on a single suite (Suite 902—2,791 SF) of its space through December 2017. |
| (7) | Tenant SF for Cartier and Versace are an approximation based on the total building SF of the Cartier Building and Versace Building, respectively. |
| (8) | Longchamp (1.1% of NRA, 6.8% of Annual UW rent) is not yet in occupancy and has not yet begun paying rent. Longchamp recently executed a lease, estimated to commence on December 1, 2017, to backfill the space to be vacated by Swatch, which exercised an early termination option. The Olympic Tower Borrower reserved $1,041,666 in gap rent at loan origination for the transition of the space. |
This is not a research report and was not prepared by any Underwriter’s research department. Please see additional important information and qualifications at the end of this Term Sheet.
| T-77 |
| BANK 2017-BNK5 | Olympic Tower |
The following table presents certain information relating to the lease rollover schedule at the Olympic Tower Property:
| Lease Rollover Schedule(1)(2) | ||||||||
| Year | # of Leases Rolling | SF Rolling | % of Total SF Rolling | Cumulative % of Total SF Rolling | Total UW Rent Rolling | UW Rent PSF Rolling(3) | % of Total Rent Rolling | Cumulative % of Total Rent Rolling |
| MTM | 0 | 0 | 0.0% | 0.0% | $0 | $0.00 | 0.0% | 0.0% |
| 2017 | 0 | 0 | 0.0% | 0.0% | $0 | $0.00 | 0.0% | 0.0% |
| 2018 | 2 | 5,626 | 1.1% | 1.1% | $660,229 | $117.35 | 0.7% | 0.7% |
| 2019 | 2 | 6,918 | 1.3% | 2.4% | $655,859 | $94.80 | 0.7% | 1.4% |
| 2020 | 3 | 31,314 | 6.0% | 8.3% | $1,691,304 | $54.01 | 1.8% | 3.2% |
| 2021 | 1 | 975 | 0.2% | 8.5% | $97,255 | $99.75 | 0.1% | 3.3% |
| 2022 | 4 | 70,120 | 13.3% | 21.9% | $16,208,547 | $231.15 | 17.5% | 20.8% |
| 2023 | 3 | 30,477 | 5.8% | 27.7% | $14,513,600 | $476.21 | 15.7% | 36.5% |
| 2024 | 1 | 6,677 | 1.3% | 29.0% | $538,434 | $80.64 | 0.6% | 37.1% |
| 2025 | 1 | 2,110 | 0.4% | 29.4% | $179,536 | $85.09 | 0.2% | 37.3% |
| 2026 | 0 | 0 | 0.0% | 29.4% | $0 | $0.00 | 0.0% | 37.3% |
| 2027 | 1 | 5,811 | 1.1% | 30.5% | $6,263,334 | $1,077.84 | 6.8% | 44.0% |
| Thereafter | 5 | 358,876 | 68.3% | 98.8% | $51,884,980 | $144.58 | 56.0% | 100.0% |
| Vacant | 0 | 6,468 | 1.2% | 100.0% | $0 | $0.00 | 0.0% | 100.0% |
| Total/Wtd. Avg. | 23 | 525,372 | 100.0% | $92,693,077 | $178.63 | 100.0% | ||
| (1) | Information is based on the underwritten rent roll as of April 27, 2017. |
| (2) | Certain tenants may have lease termination options that are exercisable prior to the stated expiration date of the subject lease or leases which are not considered in the lease rollover schedule. |
| (3) | Wtd. Avg. Annual UW Rent PSF Rolling excludes vacant space. |
The Market. The Olympic Tower Property is located on Fifth Avenue between East 51st Street and East 52nd Street. This area of Midtown Manhattan is known as the Madison/Fifth Avenue subdistrict within the Plaza Office District, and is considered one of Manhattan’s premier office locations according to the appraisal. The Olympic Tower Property is surrounded by many well-known New York landmarks, restaurants, hotels, retail shops and tourist attractions, made accessible by the presence of several transportation options.
Historically, the Plaza District has evidenced the highest rents in Midtown due to the demand generated by its location and quality space according to the appraisal. The Plaza District contains 81.8 million SF of Class A office space, 4.9 million SF of Class B office space and 368,885 SF of Class C office space. As of the fourth quarter of 2016, the Class A office space in the Plaza Office District had a direct vacancy rate of 8.9% and average asking rents of $98.53 PSF, above the direct primary Midtown Class A average of $87.14 PSF. As of the fourth quarter of 2016, the Madison/Fifth Avenue subdistrict consisted of approximately 21.1 million SF of Class A office space and had a direct vacancy rate of 10.6% and overall direct weighted average asking rents of $107.68 PSF. According to the appraisal, Class A overall vacancy in the Madison/Fifth Avenue subdistrict dropped 1.5% during the quarter to 11.5%, its lowest level in almost eight years.
The following table presents certain information relating to comparable leases for the Olympic Tower Property:
| Comparable Lease Summary | |||||||
| Property Address | Year Built | Total GLA (SF) | Tenant Name | Lease Date/Term | Lease Area (SF) | Annual Base Rent PSF | Reimbursements |
| 437 Madison Avenue | 1968 | 712,117 | Lighthouse Investment Partners | Feb-2017 / 10.0 Yrs. | 17,750 | $81.00 | Gross |
| 630 Fifth Avenue | 1935 | 948,572 | Hudson Housing Capital | Jan-2017 / 10.0 Yrs. | 8,112 | $85.00 | Gross |
| 600 Fifth Avenue | 1952 | 350,000 | HIG | Feb-2017 / 5.0 Yrs. | 7,979 | $85.00 | Gross |
| 535 Madison Avenue | 1982 | 415,000 | Aquiline Capital | Jan-2017 / 10.0 Yrs. | 13,389 | $90.50 | Gross |
| 65 East 55th Street | 1986/2016 | 518,011 | ICM Partners | Nov-2016 / 15.0 Yrs. | 35,283 | $95.00 | Gross |
| 55 West 46th Street | 2013 | 321,000 | Comcast | Oct-2016 / 10.0 Yrs. | 45,045 | $105.00 | Gross |
| 55 West 46th Street | 2013 | 321,000 | Nixon Peabody | Oct-2016 / 15.0 Yrs. | 66,297 | $83.00 | Gross |
| 500 Park Avenue | 1960 | 180,000 | The Georgetown Company | Sept-2016 / 12.0 Yrs. | 18,795 | $86.50 | Gross |
| 600 Fifth Avenue | 1952 | 350,000 | China Renaissance | Aug-2016 / 7.0 Yrs. | 7,981 | $77.00 | Gross |
| 712 Fifth Avenue | 1990 | 457,281 | Unifund | Aug-2016 / 10.0 Yrs. | 31,000 | $78.33 | Gross |
Source:Appraisal.
This is not a research report and was not prepared by any Underwriter’s research department. Please see additional important information and qualifications at the end of this Term Sheet.
| T-78 |
| BANK 2017-BNK5 | Olympic Tower |
The following table presents certain information relating to competitive office properties with respect to the Olympic Tower Property:
| Competitive Property Summary | |||||||
| Direct | Sublease | % | % | Direct | |||
| Office Area | Available | Available | Occupied | Occupied | Asking Rent | ||
| Property Address | (SF) | SF | SF | (Direct) | (Total) | Low | High |
| Olympic Tower Property(1) | 406,899 | 2,201 | 0 | 99.46% | 99.46% | ||
| 650 Fifth Avenue | 327,570 | 48,525 | 0 | 85.19% | 85.19% | $75.00 | $90.00 |
| 712 Fifth Avenue | 457,281 | 31,408 | 9,813 | 93.13% | 90.99% | $85.00 | $140.00 |
| 717 Fifth Avenue | 405,192 | 13,718 | 0 | 96.61% | 96.61% | $110.00 | $110.00 |
| 725 Fifth Avenue | 190,000 | 14,900 | 0 | 92.16% | 92.16% | $100.00 | $100.00 |
| 535 Madison Avenue | 415,000 | 14,765 | 0 | 96.44% | 96.44% | $105.00 | $105.00 |
| 540 Madison Avenue | 258,511 | 19,112 | 10,900 | 92.61% | 88.39% | $85.00 | $107.00 |
| Total/Wtd. Avg.(2) | 2,053,554 | 142,428 | 20,713 | 93.06% | 92.06% | ||
Source:Appraisal.
| (1) | Based on the rent roll dated April 27, 2017. |
| (2) | Total/ Wtd. Avg. does not include the Olympic Tower Property. |
Operating History and Underwritten Net Cash Flow.The following table presents certain information relating to the historical operating performance and the Underwritten Net Cash Flow at the Olympic Tower Property:
| Cash Flow Analysis | ||||||||||
| 2014 | 2015 | 2016 | UW(1) | UW PSF | ||||||
| Base Rent | $67,699,023 | $76,002,330 | $79,607,342 | $85,478,957 | $162.70 | |||||
| NPV Rent Credit(2) | $0 | $0 | $0 | $2,682,845 | $5.11 | |||||
| Rent Steps(3) | $0 | $0 | $0 | $1,807,706 | $3.44 | |||||
| CAM / Other Recoveries | $1,928,140 | $3,510,841 | $5,419,802 | $8,176,679 | $15.56 | |||||
| Other Income | $1,478,130 | $1,620,636 | $401,486 | $114,528 | $0.22 | |||||
| Less Vacancy & Credit Loss | $0 | $0 | $0 | ($3,355,761) | ($6.39) | |||||
| Effective Gross Income | $71,105,293 | $81,133,807 | $85,428,630 | $94,904,955 | $180.64 | |||||
| Total Operating Expenses | $21,121,302 | $23,050,850 | $24,792,052 | $26,624,023 | $50.68 | |||||
| Net Operating Income | $49,983,991 | $58,082,957 | $60,636,578 | $68,280,932 | $129.97 | |||||
| Capital Expenditures | $0 | $0 | $0 | $131,343 | $0.25 | |||||
| TI/LC | $0 | $0 | $0 | $2,012,895 | $3.83 | |||||
| Net Cash Flow | $49,983,991 | $58,082,957 | $60,636,578 | $66,136,694 | $125.89 | |||||
| Occupancy % | 100.0% | 95.5% | 95.5% | 98.8%(4) | ||||||
| NOI DSCR(5) | 2.04x | 2.37x | 2.48x | 2.79x | ||||||
| NCF DSCR(5) | 2.04x | 2.37x | 2.48x | 2.70x | ||||||
| NOI Debt Yield(5) | 8.2% | 9.5% | 9.9% | 11.2% | ||||||
| NCF Debt Yield(5) | 8.2% | 9.5% | 9.9% | 10.8% | ||||||
| (1) | UW Base Rent reflects contractual rents as of April 27, 2017. |
| (2) | Based on net present value of future contractual rent steps after April 1, 2018 for the NBA, Richemont and Cartier through the earlier of the lease expiration or maturity of the Olympic Tower Whole loan, using a discount rate of 7.0%. |
| (3) | Includes contractual rent steps through April 1, 2018 for all tenants. |
| (4) | Occupancy as of April 27, 2017. UW Occupancy % includes one new tenant with an executed lease that is not expected to be in occupancy at the Olympic Tower Property until December 1, 2017. |
| (5) | The debt service coverage ratios and debt yields are based on the Olympic Tower Senior Loan, and exclude the Olympic Tower Subordinate Companion Loan. |
Escrows and Reserves. The Olympic Tower Whole Loan requires upfront reserves in the amount of (i) $11,843,236 for free rent for four tenants, including the largest tenant, NBA, and the second largest tenant, Richemont, (ii) $25,989,597 for lobby renovations, (iii) $21,357,936 for tenant allowances under existing leases for four tenants, including NBA and Richemont, (iv) $1,846,985 (one year’s ground rent) for a ground rent reserve and (v) $298,431 on account of outstanding insurance premiums. In addition, at origination, the Olympic Tower Borrower was required to deposit into a ground rent reserve $307,360 in respect of the ground rent due in May and June 2017, and on each monthly payment date commencing in June 2017 (other than the last 12 monthly payment dates), the Olympic Tower Borrower is required to deposit into the ground rent reserve an amount equal to the ground rent for the month immediately following the month in which such monthly payment date occurs.
On each monthly payment date during the continuance of an Olympic Tower Trigger Period (as defined below), the Olympic Tower Borrower is required to fund (i) a tax and insurance reserve in an amount equal to one-twelfth of the amount that the lender reasonably estimates will be necessary to pay taxes and insurance premiums over the then succeeding 12-month period, unless in the case of insurance premiums, the Olympic Tower Borrower is
This is not a research report and was not prepared by any Underwriter’s research department. Please see additional important information and qualifications at the end of this Term Sheet.
| T-79 |
| BANK 2017-BNK5 | Olympic Tower |
maintaining a blanket policy in accordance with the related loan documents, and excluding any insurance premiums for insurance policies permitted to be maintained by the condominium board for the condominium included in the Olympic Tower Property or by a tenant, in lieu of the Olympic Tower Borrower maintaining such insurance policies, (ii) a capital expenditure reserve in an amount equal to $8,700, (iii) a tenant improvements and leasing commissions reserve in an amount equal to $65,253 and (iv) a condominium common charges reserve in an amount equal to one-twelfth of the amount that the lender reasonably estimates will be necessary to pay condominium common charges over the then succeeding 12-month period.
Lockbox and Cash Management. The Olympic Tower Whole Loan is structured with a hard lockbox and in-place cash management. The related loan documents require the Olympic Tower Borrower to direct tenants to pay rent directly to a lender-controlled lockbox account and require all other money received by the Olympic Tower Borrower or the property manager with respect to the Olympic Tower Property to be deposited into such lockbox account by the end of the second business day following receipt. All funds in the lockbox account are required to be swept on a daily basis into a lender-controlled cash management account. Amounts on deposit in the cash management account are required to be used to fund the required reserves deposits described above under “Escrows and Reserves,” to pay debt service on the Olympic Tower Whole Loan, to disburse monthly operating expenses as set forth in the annual budget (which is required to be approved by the lender only during an Olympic Tower Trigger Period) and extraordinary expenses reasonably approved by the lender, to pay, provided no event of default is continuing under the Olympic Tower Whole Loan, debt service on the Olympic Tower Mezzanine Loan (as defined below), to pay, during an Olympic Tower Trigger Period (and provided no event of default is continuing under the Olympic Tower Whole Loan), leasing expenses approved by the lender or incurred on commercially reasonable terms in connection with leases which do not require the lender’s approval, to the extent that funds in the tenant improvements and leasing commissions account are insufficient, to pay (provided no event of default is continuing under the Olympic Tower Whole Loan and no notice of a default under the Olympic Tower Mezzanine Loan is in effect), funds sufficient to make REIT Distributions (as defined below) in an aggregate amount not to exceed $100,000 for each calendar year and to disburse the remainder, (i) during the continuance of an Olympic Tower Trigger Period, into an account to be held as additional security for the Olympic Tower Whole Loan during such Olympic Tower Trigger Period, or (ii) otherwise, to the Olympic Tower Borrower. “REIT Distributions” means distributions by borrower to its member so that such member or its owners can make distributions required for such member or its owners to continue to qualify as a real estate investment trust and avoid income and/or excise taxes.
An “Olympic Tower Trigger Period” commences upon (i) the occurrence of an event of default under the Olympic Tower Whole Loan, (ii) the occurrence of an event of default under the Olympic Tower Mezzanine Loan, as evidenced by notice from the mezzanine lender, or (iii) the commencement of a Low Debt Yield Period (as defined below); and ends if, (A) with respect to an Olympic Tower Trigger Period continuing due to clause (i), the lender has accepted a cure of the related event of default, (B) with respect to an Olympic Tower Trigger Period continuing due to clause (ii), receipt by the lender from the mezzanine lender of a notice revoking its notice of an event of default under the Olympic Tower Mezzanine Loan, or (C) with respect to an Olympic Tower Trigger Period continuing due to clause (iii), the Low Debt Yield Period has ended pursuant to the terms thereof.
A “Low Debt Yield Period” commences if, as of the end of any calendar quarter, either the debt yield on the Olympic Tower Whole Loan is less than 6.842% or the aggregate debt yield on the Olympic Tower Whole Loan and the Olympic Tower Mezzanine Loan is less than 5.200%; and ends if, as of the end of any calendar quarter, both the debt yield on the Olympic Tower Whole Loan is at least 6.842% and the aggregate debt yield on the Olympic Tower Whole Loan and the Olympic Tower Mezzanine Loan is at least 5.200%.
Additional Secured Indebtedness (not including trade debts). In addition to the Olympic Tower Mortgage Loan, the Olympic Tower Property also secures the Olympic Tower Non-ServicedPari Passu Companion Loans, which have an aggregate Cut-off Date principal balance of $555,000,000 and the Olympic Tower Subordinate Companion Loans, which have an aggregate Cut-off Date principal balance of $149,000,000. The Olympic Tower Non-ServicedPari Passu Companion Loans and the Olympic Tower Subordinate Companion Loans all accrue interest at the same rate as the Olympic Tower Mortgage Loan. The Olympic Tower Mortgage Loan is entitled to payments of interest and principal on apro rata andpari passu basis with the Olympic Tower Non-ServicedPari Passu Companion Loans. Payment of principal and interest on the Olympic Tower Subordinate Companion Loans is generally subordinate to payment of principal and interest on the Olympic Tower Mortgage Loan and the Olympic Tower Non-ServicedPari Passu Companion Loans. The holders of the Olympic Tower Mortgage Loan, the Olympic Tower Non-ServicedPari Passu Companion Loans and the Olympic Tower Subordinate Companion Loans have entered into a co-lender agreement which sets forth the allocation of collections on the Olympic Tower Whole Loan. See “Description of the Mortgage Pool—The Whole Loans—The Olympic Tower Pari Passu A/B Whole Loan” in the Preliminary Prospectus.
Mezzanine Loan and Preferred Equity. The “Olympic Tower Mezzanine Loan” refers to a loan in the original principal amount of $240,000,000 made to OT Real Estate Mezz A LLC, a Delaware limited liability company, by DBNY, GSMC and MSMCH, secured by 100% of the direct equity interest in the Olympic Tower Borrower and put in place simultaneously with the origination of the Olympic Tower Whole Loan. The Olympic Tower Mezzanine Loan and the Olympic Tower Whole Loan are subject to an intercreditor agreement between the Olympic Tower Whole Loan lender and the related mezzanine lender. As of May 19, 2017, the mezzanine loan was transferred 51% to Teachers Insurance and Annuity Association of America, and 49% to Mirae Asset Maps US Professional Investment Private Real Estate Investment Trust 10.
The following table presents certain information relating to the Olympic Tower Mezzanine Loan:
| Mezzanine Debt Summary | |||||||
| Mezzanine Debt Original Principal Balance | Mezzanine Debt Interest Rate | Original Term to Maturity (mos.) | Original Amort. Term (mos.) | Original IO Term (mos.) | Total Debt UW NCF DSCR | Total Debt UW NOI Debt Yield | Total Debt Cut- off Date LTV |
| $240,000,000 | 5.0% | 120 | 0 | 120 | 1.55x | 6.8% | 52.6% |
This is not a research report and was not prepared by any Underwriter’s research department. Please see additional important information and qualifications at the end of this Term Sheet.
| T-80 |
| BANK 2017-BNK5 | Olympic Tower |
Release of Property. Not permitted.
Terrorism Insurance. So long as the Terrorism Risk Insurance Program Reauthorization Act of 2015 or any replacement, reauthorization or extension thereof (“TRIPRA”) is in effect, the Olympic Tower Borrower is required to maintain terrorism insurance in an amount equal to the full replacement cost of the Olympic Tower Property (plus 36 months of business interruption coverage), provided that so long as TRIPRA is in effect and continues to cover both foreign and domestic acts, the lender is required to accept terrorism insurance with coverage against acts which are “certified” within the meaning of TRIPRA. If TRIPRA is not in effect, then provided that terrorism insurance is commercially available, the Olympic Tower Borrower is required to carry terrorism insurance throughout the term of the Olympic Tower Whole Loan as described in the preceding sentence, but in that event the Olympic Tower Borrower is not required to spend more than two times the amount of the insurance premium that is payable at that time in respect of the property insurance required under the related loan documents (without giving effect to the cost of the terrorism components of such property insurance), and if the cost of terrorism insurance exceeds such amount, then the lender may, at its option (1) purchase such terrorism policy, with the Olympic Tower Borrower paying such portion of the insurance premiums equal to such amount and the lender paying the remainder or (2) modify the deductible amounts, policy limits and other required policy terms to reduce the insurance premiums with respect to such policy to such amount. See “Risk Factors— Risks Relating to the Mortgage Loans—Terrorism Insurance May Not Be Available for All Mortgaged Properties” in the Preliminary Prospectus.
This is not a research report and was not prepared by any Underwriter’s research department. Please see additional important information and qualifications at the end of this Term Sheet.
| T-81 |
| BANK 2017-BNK5 | Sprouts Farmers Market |
Mortgage Loan No. 6 – Sprouts Farmers Market
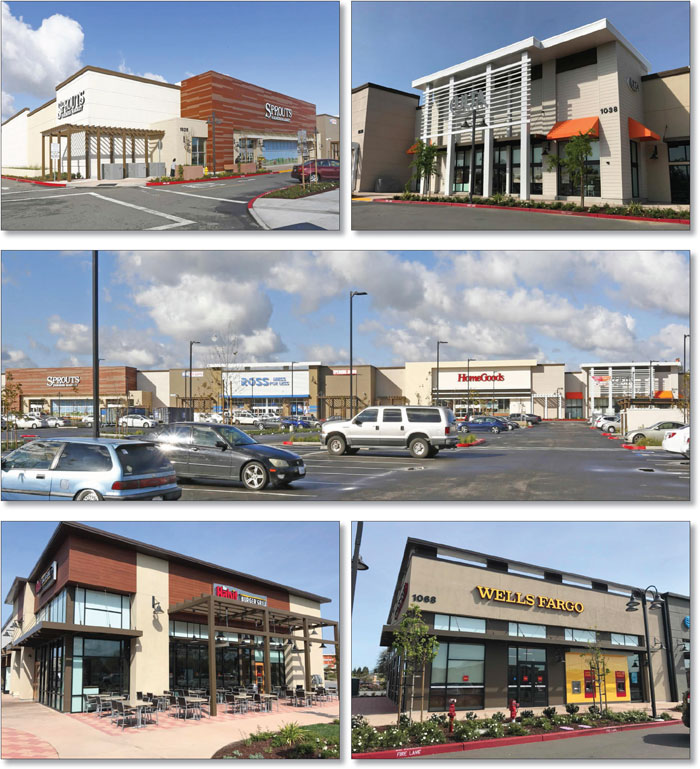
This is not a research report and was not prepared by any Underwriter’s research department. Please see additional important information and qualifications at the end of this Term Sheet.
| T-82 |
| BANK 2017-BNK5 | Sprouts Farmers Market |
Mortgage Loan No. 6 – Sprouts Farmers Market
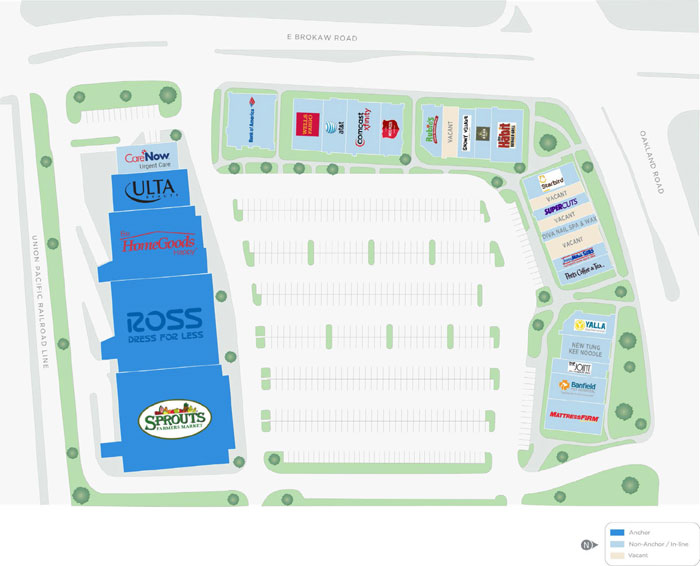
This is not a research report and was not prepared by any Underwriter’s research department. Please see additional important information and qualifications at the end of this Term Sheet.
| T-83 |
| BANK 2017-BNK5 | Sprouts Farmers Market |
Mortgage Loan No. 6 – Sprouts Farmers Market

This is not a research report and was not prepared by any Underwriter’s research department. Please see additional important information and qualifications at the end of this Term Sheet.
| T-84 |
| BANK 2017-BNK5 | Sprouts Farmers Market |
| Mortgage Loan No. 6 – Sprouts Farmers Market |
| Mortgage Loan Information | Property Information | |||||||
| Mortgage Loan Seller: | WFB | Single Asset/Portfolio: | Single Asset | |||||
| Original Balance: | $56,000,000 | Location: | San Jose, CA 95131 | |||||
| Cut-off Date Balance: | $56,000,000 | General Property Type: | Retail | |||||
| % of Initial Pool Balance: | 4.5% | Detailed Property Type: | Anchored | |||||
| Loan Purpose: | Refinance | Title Vesting: | Fee | |||||
| Sponsors: | David B. Dollinger | Year Built/Renovated: | 2016/N/A | |||||
| Mortgage Rate(1): | 3.9700% | Size: | 143,479 SF | |||||
| Note Date: | 5/4/2017 | Cut-off Date Balance per SF: | $390 | |||||
| First Payment Date: | 6/11/2017 | Maturity Date Balance per SF: | $352 | |||||
| Anticipated Repayment Date(1): | 5/11/2027 | Property Manager: | DPM Property Management, Inc. (borrower-related) | |||||
| Final Maturity Date(1): | 5/11/2029 | |||||||
| Original Term to ARD: | 120 months | |||||||
| Original Amortization Term: | 360 months | |||||||
| IO Period(2): | 57 months | |||||||
| Seasoning: | 1 months | |||||||
| Prepayment Provisions: | LO (25); DEF (88); O (7) | |||||||
| Lockbox/Cash Mgmt Status: | Springing/Springing | |||||||
| Additional Debt Type: | N/A | |||||||
| Additional Debt Balance: | N/A | Underwriting and Financial Information | ||||||
| Future Debt Permitted (Type)(3): | Yes (Unsecured) | UW NOI: | $4,901,111 | |||||
| Reserves(4) | UW NOI Debt Yield: | 8.8% | ||||||
| Type | Initial | Monthly | Cap | UW NOI Debt Yield at Maturity or ARD: | 9.7% | |||
| RE Tax: | $0 | $58,272 | N/A | UW NCF DSCR: | 2.08x (IO) 1.47x (P&I) | |||
| Insurance: | $0 | Springing | N/A | Most Recent NOI(5): | N/A | |||
| Recurring Replacements: | $0 | $2,400 | $57,000 | 2nd Most Recent NOI(5): | N/A | |||
| Rent Concession: | $116,249 | $0 | N/A | 3rd Most Recent NOI(5): | N/A | |||
| Sprouts Rent: | $0 | Springing | N/A | Most Recent Occupancy(6): | 95.3% (4/1/2017) | |||
| Existing TI/LC: | $443,080 | $0 | N/A | 2nd Most Recent Occupancy(5): | N/A | |||
| TI/LC: | $0 | Springing | (4) | 3rd Most Recent Occupancy(5): | N/A | |||
| Home Goods TI/LC: | $0 | Springing | (4) | Appraised Value (as of): | $107,600,000 (4/10/2017) | |||
| Ross TI/LC: | $0 | Springing | (4) | Cut-off Date LTV Ratio: | 52.0% | |||
| Sprouts TI/LC: | $0 | Springing | (4) | LTV Ratio at Maturity or ARD: | 46.9% | |||
| Sources and Uses | ||||||
| Sources | Proceeds | % of Total | Uses | Proceeds | % of Total | |
| Loan Amount: | $56,000,000 | 100.0% | Loan Payoff: | $47,738,259 | 85.2% | |
| Reserves: | $559,329 | 1.0% | ||||
| Closing Costs: | $125,621 | 0.2% | ||||
| Return of Equity: | $7,576,791 | 13.5% | ||||
| Total Sources: | $56,000,000 | 100.0% | Total Uses: | $56,000,000 | 100.0% | |
| (1) | The Sprouts Farmers Market Mortgage Loan (as defined below) has an anticipated repayment date of May 11, 2027 (the “ARD”) and a final maturity date of May 11, 2029. In the event that the Sprouts Farmers Market Mortgage Loan is not repaid in full by the ARD, the interest rate will increase from the initial interest rate of 3.9700% (the “Initial Interest Rate”) to 6.9700% (the “Adjusted Interest Rate”). After the ARD, the Sprouts Farmers Market Mortgage Borrower is required to pay a monthly payment equal to interest at the Adjusted Interest Rate; however, interest at the excess of the Adjusted Interest Rate over the Initial Interest Rate is required to be applied to principal. References herein to “maturity” and “maturity date”, unless specified otherwise, refer to the ARD. |
| (2) | The Sprouts Farmers Market Mortgage Loan requires interest only payments during the first 36 payment periods, followed by payments of principal and interest based on a 30-year amortization schedule from payment periods 37 to 99 and then interest only payments from payment period 100 through ARD. |
| (3) | See “—Mezzanine Loan and Preferred Equity” below for further discussion of permitted future unsecured debt. |
| (4) | See “—Escrows and Reserves” below for further discussion of reserve requirements. |
| (5) | Historical information is not available, as the Sprouts Farmers Market Property was built in 2016. |
| (6) | Most Recent Occupancy of 95.3% includes tenants with executed leases but not yet in occupancy. Café Snowy Village (1,450 SF, 1.0% of NRA) is expected to be open for business by June 15, 2017, Comcast Xfinity Wireless (3,864 SF, 2.7% of NRA) is expected to be open for business by August 1, 2017 and Yalla Mediterranean (2,301 SF, 1.6% of NRA) is expected to be open for business by September 15, 2017. Excluding these tenants, the occupancy of the Sprouts Farmers Market Property is 90.0%. All future rent credits or abatements have been reserved for at origination. |
This is not a research report and was not prepared by any Underwriter’s research department. Please see additional important information and qualifications at the end of this Term Sheet.
| T-85 |
| BANK 2017-BNK5 | Sprouts Farmers Market |
The Mortgage Loan. The sixth largest mortgage loan (the “Sprouts Farmers Market Mortgage Loan”) is evidenced by a promissory note in the original principal amount of $56,000,000 and is secured by a first priority fee mortgage encumbering an anchored retail property located in San Jose, California (the “Sprouts Farmers Market Property”).
The Sprouts Farmers Market Mortgage Loan has an anticipated repayment date of May 11, 2027 and final maturity date of May 11, 2029. Prior to the ARD, the Sprouts Farmers Market Mortgage Loan accrues interest at a fixed rate of 3.9700% (the “Initial Interest Rate”) and requires payments of interest only for the first 36 payment periods; beginning June 11, 2020, the Sprouts Farmers Market Mortgage Loan requires payments of principal and interest based on a 30-year amortization schedule; and on September 11, 2025, the Sprouts Farmers Market Mortgage Loan reverts back to interest only payments through the ARD. In the event the Sprouts Farmers Market Mortgage Loan is not repaid in full on or before the ARD, the interest rate will increase to a rate equal to 6.9700% (the “Adjusted Interest Rate”). If the Sprouts Farmers Market Mortgage Loan is not repaid in full on or prior to the ARD, after the occurrence of the ARD, the Sprouts Farmers Market Mortgage Borrower is required to pay a monthly payment equal to interest at the Adjusted Interest Rate; however, interest at the excess of the Adjusted Interest Rate over the Initial Interest Rate is required to be applied to principal. In addition, after the ARD, all excess cash flow, after payment of the required monthly payment and payment of all reserve accounts and operating expenses, is required to be applied to repay the principal balance of the Sprouts Farmers Market Mortgage Loan, and then to pay interest accrued at the excess of the Adjusted Interest Rate over the Initial Interest Rate.
The proceeds of the Sprouts Farmers Market Mortgage Loan were primarily used to refinance existing debt on the Sprouts Farmers Market Property, fund reserves, pay closing costs and return equity to the Sprouts Farmers Market Borrower (as defined below).
The Borrower and the Sponsor.The borrower is Sprouts @ Brokaw Center LLC (the “Sprouts Farmers Market Borrower”), a single-purpose Delaware limited liability company with one independent director. Legal counsel to the borrower delivered a non-consolidation opinion in connection with the origination of the Sprouts Farmers Market Mortgage Loan. The sponsor of the Sprouts Farmers Market Mortgage Loan is David B. Dollinger (the “Sprouts Farmers Market Sponsor”), who, along with The David Dollinger Living Trust, also serves as the non-recourse carveout guarantor with respect to the Sprouts Farmers Market Mortgage Loan.
David B. Dollinger is a principal at Dollinger Properties, LLC, a family-owned business focused on the acquisition, through construction or purchase, of multi-tenant R&D/industrial flex and retail properties. Headquartered in Redwood City, California, Dollinger Properties, LLC owns and manages over 60 properties in California representing more than 4.0 million SF.
The Property.The Sprouts Farmers Market Property comprises a 143,479 SF anchored retail center built in 2016 and located in San Jose, California, approximately 4.3 miles north of downtown San Jose. The Sprouts Farmers Market Sponsor purchased the 13.9-acre site in November 2014 for $23.0 million and subsequently began the demolition of the previous industrial complex and development of the Sprouts Farmers Market Property. Totaling six separate buildings, the Sprouts Farmers Market Property is anchored by Sprouts Farmers Market, Ross Dress for Less, HomeGoods and Ulta, representing an aggregate 60.0% of NRA and 41.0% of underwritten base rent. The remaining Sprouts Farmers Market Property rent roll is comprised of 20 tenants representing a mix of lifestyle and restaurant tenants. The Sprouts Farmers Market Property contains 669 surface parking spaces, resulting in a parking ratio of 4.7 spaces per 1,000 square feet of rentable area. As of April 1, 2017, the Sprouts Farmers Market Property was 95.3% leased to 24 tenants.
Major Tenants.
Sprouts Farmers Market (29,986 SF, 20.9% of NRA, 13.8% of underwritten base rent). The Sprouts Farmers Market (“Sprouts”) lease commenced September 7, 2016 and has an expiration date of September 30, 2026 with four five-year renewal options. Sprouts (NASDAQ: SFM) is a grocery store operator that offers natural and organic food household items catering to consumers’ interest in health and wellness. As of February 23, 2017, Sprouts operated 256 stores in 14 states.
Ross Dress for Less (25,000 SF, 17.4% of NRA, 11.3% of underwritten base rent). The Ross Dress for Less (“Ross”) lease commenced February 13, 2017 and has an expiration date of January 31, 2028 with four five-year renewal options. Ross (NASDAQ: ROST) is an off-price apparel and home fashion chain store in the United States with 1,340 locations in 36 states, as of January 28, 2017.
HomeGoods (21,021 SF, 14.7% of NRA, 9.3% of underwritten base rent). The HomeGoods lease commenced October 23, 2016 and has an expiration date of October 31, 2026 with four five-year renewal options. HomeGoods, a subsidiary of TJX Companies, Inc. (NYSE: TJX), is an off-price retailer of home fashions in the United States. Through its 579 stores, as of January 28, 2017, HomeGoods offers an array of home fashions, including home basics, giftware, accent furniture, lamps, rugs, wall decor, seasonal items, decorative accessories from around the world and other merchandise.
Ulta (10,046 SF, 7.0% of NRA, 6.6% of underwritten base rent). The Ulta lease commenced February 17, 2017 and has an expiration date of February 28, 2027 with two five-year renewal options. Ulta (NASDAQ:ULTA) is a beauty retailer offering cosmetics, fragrance, skin and hair care products and salon services comprising approximately 20,000 products from over 500 brands. As of March 9, 2017, Ulta operated 970 retail locations in 48 states.
Bank of America (5,000 SF, 3.5% of NRA, 6.3% of underwritten base rent). The Bank of America lease commenced March 4, 2017 and has an expiration date of March 31, 2027 with two five-year renewal options. Bank of America (NYSE:BAC) is a bank and financial holding company with a range of banking, investing, asset management and other financial and risk management products and services. According to a federal bank regulatory agency, Bank of America is the third-largest bank in the United States by total assets as of February 2017.
This is not a research report and was not prepared by any Underwriter’s research department. Please see additional important information and qualifications at the end of this Term Sheet.
| T-86 |
| BANK 2017-BNK5 | Sprouts Farmers Market |
The following table presents certain information relating to the anchor tenants and major tenants at the Sprouts Farmers Market Property. Certain tenants may have co-tenancy provisions permitting the early termination of their leases based on sales performance and/or occupancy at the Sprouts Farmers Market Property.
| Tenant Summary | ||||||||
| Tenant Name | Credit Rating (Moody’s/S&P/Fitch)(1) | Tenant SF | % of Collateral SF | Annual UW Rent | % of Annual UW | Annual UW Rent PSF | Lease Expiration | |
| Anchor/Major Tenants | ||||||||
| Sprouts | NR/NR/NR | 29,986 | 20.9% | $719,664 | 13.8% | $24.00 | 9/30/2026 | |
| Ross | A3/A-/NR | 25,000 | 17.4% | $588,250 | 11.3% | $23.53 | 1/31/2028 | |
| HomeGoods | A2/A+/NR | 21,021 | 14.7% | $483,483 | 9.3% | $23.00 | 10/31/2026 | |
| Ulta | NR/NR/NR | 10,046 | 7.0% | $341,564 | 6.6% | $34.00 | 2/28/2027 | |
| Bank of America | Baa1/BBB+/A | 5,000 | 3.5% | $325,200 | 6.3% | $65.04 | 3/31/2027 | |
| Subtotal/Wtd. Avg. | 91,053 | 63.5% | $2,458,161 | 47.3% | $27.00 | |||
| Other Tenants(2) | 45,680 | 31.8% | $2,740,196 | 52.7% | $59.99 | |||
| Vacant Space | 6,746 | 4.7% | ||||||
| Total/Wtd. Avg. | 143,479 | 100.0% | $5,198,357 | 100.0% | $38.02 | |||
| (1) | Certain ratings are those of the parent company whether or not the parent company guarantees the lease. |
| (2) | Includes tenants with executed leases but not yet in occupancy. Café Snowy Village (1,450 SF, 1.0% of NRA) is expected to be open for business by June 15, 2017, Comcast Xfinity Wireless (3,864 SF, 2.7% of NRA) is expected to be open for business by August 1, 2017 and Yalla Mediterranean (2,301 SF, 1.6% of NRA) is expected to be open for business by September 15, 2017. Excluding these tenants, the occupancy of the Sprouts Farmers Market Property is 90.0%. All future rent credits or abatements have been reserved for at origination. |
The following table presents certain information relating to the lease rollover schedule at the Sprouts Farmers Market Property:
| Lease Rollover Schedule(1)(2) | ||||||||
| Year | # of Leases Rolling | SF Rolling | % of Total SF Rolling | Cumulative % of Total SF Rolling | UW Rent PSF Rolling(3) | Total UW Rent Rolling | % of Total Rent Rolling | Cumulative % of Total Rent Rolling |
| MTM | 0 | 0 | 0.0% | 0.0% | $0.00 | $0 | 0.0% | 0.0% |
| 2017 | 0 | 0 | 0.0% | 0.0% | $0.00 | $0 | 0.0% | 0.0% |
| 2018 | 0 | 0 | 0.0% | 0.0% | $0.00 | $0 | 0.0% | 0.0% |
| 2019 | 0 | 0 | 0.0% | 0.0% | $0.00 | $0 | 0.0% | 0.0% |
| 2020 | 0 | 0 | 0.0% | 0.0% | $0.00 | $0 | 0.0% | 0.0% |
| 2021 | 1 | 1,862 | 1.3% | 1.3% | $60.00 | $111,720 | 2.1% | 2.1% |
| 2022 | 3 | 3,417 | 2.4% | 3.7% | $60.81 | $207,783 | 4.0% | 6.1% |
| 2023 | 0 | 0 | 0.0% | 3.7% | $0.00 | $0 | 0.0% | 6.1% |
| 2024 | 2 | 5,082 | 3.5% | 7.2% | $64.32 | $326,880 | 6.3% | 12.4% |
| 2025 | 0 | 0 | 0.0% | 7.2% | $0.00 | $0 | 0.0% | 12.4% |
| 2026 | 5 | 60,534 | 42.2% | 49.4% | $28.72 | $1,738,717 | 33.4% | 45.9% |
| 2027 | 12 | 40,838 | 28.5% | 77.9% | $54.48 | $2,225,007 | 42.8% | 88.7% |
| 2028 and Beyond | 1 | 25,000 | 17.4% | 95.3% | $23.53 | $588,250 | 11.3% | 100.0% |
| Vacant | 0 | 6,746 | 4.7% | 100.0% | $0.00 | $0 | 0.0% | 100.0% |
| Total/Wtd. Avg. | 24 | 143,479 | 100.0% | $38.02 | $5,198,357 | 100.0% | ||
| (1) | Information is based on the underwritten rent roll. |
| (2) | Certain tenants may have lease termination options that are exercisable prior to the originally stated expiration date of the subject lease and that are not considered in the lease rollover schedule. |
| (3) | UW Rent PSF Rolling excludes vacant space. |
This is not a research report and was not prepared by any Underwriter’s research department. Please see additional important information and qualifications at the end of this Term Sheet.
| T-87 |
| BANK 2017-BNK5 | Sprouts Farmers Market |
The Market. The Sprouts Farmers Market Property is situated at the southwest corner of the intersection of Oakland Road and East Brokaw Road in San Jose, California, approximately 4.3 miles north of downtown San Jose and approximately 0.3 miles from Interstate 880, which connects San Jose with the east Bay Area. According to a third party market report, the signalized Oakland Road and East Brokaw Road intersection is highly commercialized with retail and office developments and has an average daily traffic count of 68,793 vehicles. Across East Brokaw Road from the Sprouts Farmers Market Property is an approximately 102,216 SF fitness center-anchored retail center, and across Oakland Road is an approximately 264,181 SF seven-building office park with a current vacancy rate of 2.2% and a five-year average vacancy rate of 2.3%. Immediately south of the Sprouts Farmers Market Property is Orchard Park, a 15.9-acre development containing 239 single-family attached residences. Approximately 0.5 miles west of the Sprouts Farmers Market Property is Super Micro Computer’s (NASDAQ: SMCI; Fortune 1,000 Company) approximately 1.7 million SF headquarters campus. The campus recently expanded by 182,000 SF with the construction of a new fuel cell-powered manufacturing facility. The Bay Area Rapid Transit (“BART”), the fifth largest heavy rail transit system in the United States with approximately 135.3 million passengers in 2016, is undergoing a 16-mile, six-station extension into Silicon Valley and San Jose. Phase I of the BART extension will encompass two stations (Milpitas and Berryessa), both of which will be within 2.5 miles of the Sprouts Farmers Market Property. BART’s Phase I extension stations are expected to commence passenger service in 2018 and will both include a bus transit center, parking garage and bicycle storage. According to the appraisal, as of 2016, the estimated population within a one-, three- and five-mile radius of the Sprouts Farmers Market Property was 12,626, 175,985 and 525,764, respectively, and the average household income within the same radii was $132,441, $115,815 and $101,458, respectively.
According to a third-party market research report, the Sprouts Farmers Market Property is located within the San Jose, IBP East submarket, which accounts for approximately 3.6% of the overall South Bay/San Jose retail market. As of the first quarter of 2017, the submarket reported total inventory of 187 retail properties totaling approximately 2.8 million square feet with an 8.7% vacancy rate. The appraisal determined the following market rents for the Sprouts Farmers Market Property, all on a triple-net basis: $25.00 PSF for the Sprouts, Ross and HomeGoods spaces; $35.00 PSF for the Ulta space; $55.00 PSF for the Care Now space; $60.00 PSF for typical inline space; $62.00 PSF for restaurant inline and bank branch space; and $65.00 PSF for restaurant end cap space. In aggregate, the appraiser concluded that the in-place rents at the Sprouts Farmers Market Property are approximately 3.5% below market rent.
The following table presents recent leasing data at comparable retail properties with respect to the Sprouts Farmers Market Property:
| Comparable Lease Summary | |||||||||
Property Address | Year Built/ Renovated | Size (SF) | Tenant Name | Lease Size (SF) | Lease Date | Lease Term (Yrs.) | Rent/SF | Lease Type | |
1028, 32, 36, 38, 58, 68, 78, 88, 98 E. Brokaw Road, San Jose, CA | 2016/N/A | 143,479 | Sprouts | 29,986 | September 2016 | 10.0 | $24.00 | Triple Net | |
760 East El Camino Real, Sunnyvale, CA | 2005/N/A | 30,071 | New Leaf Grocery | 30,071 | January 2016 | 10.0 | $36.00 | Triple Net | |
1010 N Rengstorff Ave., Mountain View, CA | 1994/N/A | 18,320 | Total Wine | 18,320 | June 2016 | 10.0 | $30.00 | Triple Net | |
2400-2470 Charleston Road, Mountain View, CA | 2006/N/A | 132,590 | REI | 30,500 | September 2016 | 5.0 | $33.32 | Triple Net | |
2685 Augustine Drive, Santa Clara, CA | 2016/N/A | 117,435 | Whole Foods Market | 50,000 | July 2016 | 20.0 | $22.50 | Triple Net | |
Source: Appraisal
This is not a research report and was not prepared by any Underwriter’s research department. Please see additional important information and qualifications at the end of this Term Sheet.
| T-88 |
| BANK 2017-BNK5 | Sprouts Farmers Market |
Underwritten Net Cash Flow.The following table presents certain information relating to the Underwritten Net Cash Flow at the Sprouts Farmers Market Property:
| Cash Flow Analysis | |||||
| 2014(1) | 2015(1) | 2016(1) | UW | UW PSF | |
| Base Rent | N/A | N/A | N/A | $5,198,357 | $36.23 |
| Grossed Up Vacant Space | N/A | N/A | N/A | $404,760 | $2.82 |
| Total Recoveries | N/A | N/A | N/A | $978,538 | $6.82 |
| Other Income | N/A | N/A | N/A | $0 | $0.00 |
| Less Vacancy & Credit Loss | N/A | N/A | N/A | ($404,760)(3) | ($2.82) |
| Effective Gross Income | N/A | N/A | N/A | $6,176,895 | $43.05 |
| Total Operating Expenses | N/A | N/A | N/A | $1,275,785 | $8.89 |
| Net Operating Income | N/A | N/A | N/A | $4,901,111 | $34.16 |
| Capital Expenditures | N/A | N/A | N/A | $28,696 | $0.20 |
| TI/LC | N/A | N/A | N/A | $188,526 | $1.31 |
| Net Cash Flow | N/A | N/A | N/A | $4,683,889 | $32.65 |
| Occupancy | N/A | N/A | 95.3%(2) | 92.8%(3) | |
| NOI DSCR (IO) | N/A | N/A | N/A | 2.17x | |
| NOI DSCR (P&I) | N/A | N/A | N/A | 1.53x | |
| NOI DSCR(IO) | N/A | N/A | N/A | 2.08x | |
| NCF DSCR (P&I) | N/A | N/A | N/A | 1.47x | |
| NOI Debt Yield | N/A | N/A | N/A | 8.8% | |
| NCF Debt Yield | N/A | N/A | N/A | 8.4% | |
| (1) | Historical information is not available, as the Sprouts Farmers Market Property was built in 2016. |
| (2) | Most Recent Occupancy of 95.3% includes tenants with executed leases but not yet in occupancy. Café Snowy Village (1,450 SF, 1.0% of NRA) is expected to be open for business by June 15, 2017, Comcast Xfinity Wireless (3,864 SF, 2.7% of NRA) is expected to be open for business by August 1, 2017 and Yalla Mediterranean (2,301 SF, 1.6% of NRA) is expected to be open for business by September 15, 2017. Excluding these tenants, the occupancy of the Sprouts Farmers Market Property is 90.0%. All future rent credits or abatements have been reserved for at origination. |
| (3) | Underwritten vacancy of 7.2% is based on the actual economic vacancy as of April 1, 2017. As of the same date, the physical vacancy was 4.7%. |
Escrows and Reserves. At origination, the Sprouts Farmers Market Borrower deposited $116,249 for future rent credits or abatements under four existing leases (Comcast ($47,296); New Tung Kee ($21,038); Starbird ($38,193); and Supercuts ($9,722)) and $443,080 for tenant improvements and leasing commissions (TI/LCs) obligations under existing leases (Comcast ($135,240); Café Snowy Village ($36,250); New Tung Kee ($76,770); Starbird ($100,200); Supercuts ($25,590); and Yalla Mediterranean ($69,030)). The Sprouts Farmers Market Borrower is required to escrow monthly an amount equal to (i) 1/12 of the estimated annual real estate tax payment (currently $58,272); (ii) $2,400 for replacement reserves (subject to a cap of $57,000); (iii) commencing in October 2025, $50,000 for general TI/LCs (“General TI/LC Reserve”); (iv) commencing upon the earlier of (a) October 1, 2025 or (b) 12 months prior to the Sprouts lease expiration (September 30, 2026), $50,000 for TI/LCs that may be incurred in connection with the Sprouts space (“Sprouts TI/LC Reserve”); (v) commencing upon the earlier of (a) November 1, 2025 or (b) 12 months prior to the HomeGoods lease expiration (October 31, 2026), $50,000 for TI/LCs that may be incurred in connection with the HomeGoods space (“HomeGoods TI/LC Reserve”); (vi) commencing upon the earlier of (a) (1) if David B. Dollinger is the Sprouts Farmers Market Sponsor, February 1, 2027 or (2) if David B. Dollinger is not the Sprouts Farmers Market Sponsor, February 1, 2026 or (b) 12 months prior to the Ross lease expiration (January 31, 2028), $50,000 for TI/LCs that may be incurred in connection with the Ross space (“Ross TI/LC Reserve”). The monthly springing escrows for the General TI/LC Reserve, Sprouts TI/LC Reserve, HomeGoods TI/LC Reserve and Ross TI/LC Reserve are subject to an aggregate cap of $2,400,000 for all four escrow accounts.
The Sprouts Farmers Market Borrower is required to escrow an amount equal to $935,000 for TI/LCs (“Sprouts Rent Reserve”) that may be incurred in connection with the Sprouts space within 15 days of a Sprouts Rent Reserve Period (as defined below).
The Sprouts Farmers Market Borrower is not required to escrow monthly for insurance premiums as long as (i) no event of default exists; (ii) the Sprouts Farmers Market Borrower provides satisfactory evidence that the Sprouts Farmers Market Property is insured under an acceptable blanket policy; and (iii) the Sprouts Farmers Market Borrower provides the lender with evidence of renewal of the insurance policies and timely proof of payment of insurance premiums.
A “Sprouts Rent Reserve Period” means the period commencing upon the date (i) a monetary or material non-monetary default occurs under the Sprouts lease; (ii) Sprouts files, or becomes involved in, a bankruptcy or similar insolvency proceeding; (iii) Sprouts goes dark, vacates, fails to continuously occupy its entire space or fails to be open for business during customary hours, or gives notice of its intent to commence any of the foregoing; or (iv) Sprouts terminates or cancels its lease, or gives notice of any of the foregoing. A Sprouts Rent Reserve Period will be cured, with regard to clauses (i), (ii), (iii) or (iv), if a Sprouts Re-Tenanting Event (as defined below) has occurred; or with regard to clause (i), if the default is cured and there is no other occurrence and continuance of a default under the Sprouts lease for two consecutive calendar quarters; with regard to clause (ii), if the bankruptcy or insolvency proceeding has terminated or the Sprouts lease is affirmed in such proceeding; with regard to clause (iii), if Sprouts has resumed its normal business operations in its entire space and is open during customary hours for two consecutive calendar quarters; and with regard to
This is not a research report and was not prepared by any Underwriter’s research department. Please see additional important information and qualifications at the end of this Term Sheet.
| T-89 |
| BANK 2017-BNK5 | Sprouts Farmers Market |
clause (iv), if the lender has received evidence that any applicable default has been cured and the Sprouts lease has been in full force and effect for two consecutive calendar quarters.
A “Sprouts Re-Tenanting Event” means all of the Sprouts space is leased and fully occupied, with a satisfactory replacement tenant being open for business and paying full unabated rent (or the Sprouts Farmers Market Borrower has escrowed the full amount of any future rent credits or abatements), and that all TI/LCs provided to the replacement tenant(s) have been paid (or the Sprouts Farmers Market Borrower has escrowed the full amount of all such TI/LCs, or the amount in the Sprouts Rent Reserve escrow and/or Sprouts TI/LC Reserve escrow on deposit is equal to or greater than the full amount of all such TI/LCs).
Lockbox and Cash Management. The Sprouts Farmers Market Mortgage Loan has a springing lockbox with springing cash management upon the commencement and during the continuance of a Cash Trap Event Period (as defined below). Also during the continuation of a Cash Trap Event Period, the Sprouts Farmers Market Borrower will be required to deposit all excess cash with respect to the Sprouts Farmers Market Mortgage Loan into an account to be held by the lender as additional security for the Sprouts Farmers Market Mortgage Loan.
A “Cash Trap Event Period” will commence upon any of the following: (i) the occurrence and continuance of an event of default under the Sprouts Farmers Market Mortgage Loan; (ii) the amortizing net cash flow debt service coverage ratio falling below 1.20x (tested quarterly); (iii) the net cash flow debt yield falling below 7.5%; (iv) if the Sprouts Farmers Market Borrower fails to make payments into required reserve accounts; or (v) the occurrence of the ARD. A Cash Trap Event Period will be cured, with regard to clause (i), upon the cure of such event of default; with regard to clause (ii), upon the amortizing net cash flow debt service coverage ratio being equal to or greater than 1.20x for two consecutive calendar quarters; with regard to clause (iii), upon the debt yield being equal to or greater than 7.5% for two consecutive calendar quarters; and with regard to clause (iv), upon the Sprouts Farmers Market Borrower depositing all required payments into the reserve accounts. No cure of a Cash Trap Event Period with regard to clause (v) is permitted.
Additional Secured Indebtedness.Not permitted.
Mezzanine Loan and Preferred Equity. Provided no event of default is continuing under the Sprouts Farmers Market Mortgage Loan, the Sprouts Farmers Market Borrower or a Sprouts Farmers Market Borrower affiliate is permitted to incur non-recourse unsecured subordinate debt, provided certain conditions are satisfied, including among others, the aggregate amount is no greater than $560,000.
Release of Property. Not permitted.
Terrorism Insurance.The Sprouts Farmers Market Mortgage Loan documents require that the “all risk” insurance policy required to be maintained by the Sprouts Farmers Market Borrower provide coverage for terrorism in an amount equal to the full replacement cost of the Sprouts Farmers Market Property, as well as business interruption insurance covering no less than the 12-month period following the occurrence of a casualty event, together with a six-month extended period of indemnity.
This is not a research report and was not prepared by any Underwriter’s research department. Please see additional important information and qualifications at the end of this Term Sheet.
| T-90 |
(THIS PAGE INTENTIONALLY LEFT BLANK)
This is not a research report and was not prepared by any Underwriter’s research department. Please see additional important information and qualifications at the end of this Term Sheet.
| T-91 |
| BANK 2017-BNK5 | 270 Corporate Center |
Mortgage Loan No. 7 – 270 Corporate Center

This is not a research report and was not prepared by any Underwriter’s research department. Please see additional important information and qualifications at the end of this Term Sheet.
| T-92 |
| BANK 2017-BNK5 | 270 Corporate Center |
Mortgage Loan No. 7 – 270 Corporate Center

This is not a research report and was not prepared by any Underwriter’s research department. Please see additional important information and qualifications at the end of this Term Sheet.
| T-93 |
| BANK 2017-BNK5 | 270 Corporate Center |
| Mortgage Loan No. 7 – 270 Corporate Center |
| Mortgage Loan Information | Property Information | ||||||
| Mortgage Loan Seller: | BANA | Single Asset/Portfolio: | Single Asset | ||||
| Original Balance: | $52,500,000 | Location: | Germantown, MD 20874 | ||||
| Cut-off Date Balance: | $52,500,000 | General Property Type: | Office | ||||
| % of Initial Pool Balance: | 4.3% | Detailed Property Type: | Suburban | ||||
| Loan Purpose: | Refinance | Title Vesting: | Fee | ||||
| Sponsors: | Mark C. Matan; T. Richard Butera | Year Built/Renovated: | 1983/2014 | ||||
| Size: | 449,443 SF | ||||||
| Mortgage Rate: | 4.9170% | Cut-off Date Balance per SF: | $117 | ||||
| Note Date: | 5/11/2017 | Maturity Date Balance per SF: | $114 | ||||
| First Payment Date: | 7/1/2017 | Property Manager: | Matan Companies, LLLP (borrower-related) | ||||
| Maturity Date: | 6/1/2022 | ||||||
| Original Term to Maturity: | 60 months | ||||||
| Original Amortization Term: | 360 months | ||||||
| IO Period: | 36 months | Underwriting and Financial Information | |||||
| Seasoning: | 0 months | UW NOI: | $6,012,410 | ||||
| Prepayment Provisions: | LO (24); DEF (32); O (4) | UW NOI Debt Yield: | 11.5% | ||||
| Lockbox/Cash Mgmt Status: | Hard/Springing | UW NOI Debt Yield at Maturity: | 11.8% | ||||
| Additional Debt Type: | N/A | UW NCF DSCR: | 2.06x (IO) 1.61x (P&I) | ||||
| Additional Debt Balance: | N/A | Most Recent NOI: | $4,932,967 (12/31/2016) | ||||
| Future Debt Permitted (Type): | No (N/A) | 2nd Most Recent NOI: | $4,681,089 (12/31/2015) | ||||
| Reserves(1) | 3rd Most Recent NOI: | $3,719,077 (12/31/2014) | |||||
| Type | Initial | Monthly | Cap | Most Recent Occupancy: | 87.8% (5/11/2017) | ||
| RE Tax: | $658,667 | $65,867 | N/A | 2nd Most Recent Occupancy: | 84.0% (12/31/2016) | ||
| Insurance: | $0 | Springing | N/A | 3rd Most Recent Occupancy: | 79.1% (12/31/2015) | ||
| Recurring Replacements: | $0 | $7,491 | N/A | Appraised Value (as of): | $71,500,000 (1/26/2017) | ||
| TI/LC: | $0 | $44,944 | N/A | Cut-off Date LTV Ratio: | 73.4% | ||
| Other: | $440,785 | $0 | N/A | Maturity Date LTV Ratio: | 71.4% | ||
| Sources and Uses | ||||||
| Sources | Proceeds | % of Total | Uses | Proceeds | % of Total | |
| Loan Amount: | $52,500,000 | 95.2% | Loan Payoff(2): | $53,177,617 | 96.4% | |
| Borrower Equity: | $2,671,202 | 4.8% | Reserves: | $1,099,452 | 2.0% | |
| Closing Costs: | $894,132 | 1.6% | ||||
| Total Sources: | $55,171,202 | 100.0% | Total Uses: | $55,171,202 | 100.0% | |
| (1) | See “Escrows and Reserves” below for further discussion of reserve requirements. |
| (2) | The 270 Corporate Center Property previously secured a commercial mortgage-backed securities loan in the original principal amount of $74,000,000. In January 2014, the previous loan was bifurcated into a $52,500,000 A-Note and an $17,199,000 B-Note. The Loan Payoff amount includes repayment of the A-Note. The B-Note was forgiven by the previous lender. |
The Mortgage Loan. The seventh largest mortgage loan (the “270 Corporate Center Mortgage Loan”) is evidenced by a promissory note in the original principal amount of $52,500,000, and secured by a first priority fee mortgage encumbering a four-building suburban office property known as 270 Corporate Center in Germantown, Maryland (the “270 Corporate Center Property”). The 270 Corporate Center Property was previously securitized in the LBUBS 2005-C5 transaction. The proceeds of the 270 Corporate Center Mortgage Loan, together with $2,671,202 of borrower equity, were used to pay off $53,177,617 of previous debt (with $17,093,843 forgiven by the previous lender, as more fully described under “Loan Purpose; Default History, Bankruptcy Issues and Other Proceedings” in the Preliminary Prospectus), to fund approximately $1.1 million of reserves and pay closing costs.
The Borrower and the Sponsors. The borrowers are 270 B, LLC, 270 M, LLC and BP 270, LLC, tenants-in-common, and 270 B II, LLC, 270 M II, LLC and BP 270 II, LLC, tenants-in-common (together, the “270 Corporate Center Borrower”), each a single purpose entity with two independent directors. The 270 Corporate Center Borrower is majority owned by Mark C. Matan and T. Richard Butera, the borrower sponsors and non-recourse carveout guarantors.
Mark C. Matan is the Managing Partner of Matan Companies. Matan Companies, headquartered in suburban Maryland, is a Maryland/Washington, D.C.-area regional commercial real estate services and development firm founded over 35 years ago. The firm’s current portfolio consists of over six million SF of office and industrial assets, three million SF of entitled space in the development pipeline, several active residential developments, and a separate portfolio of multifamily units. The firm delivers a range of services to its real estate investors and tenants including asset and property management, leasing and tenant services.
This is not a research report and was not prepared by any Underwriter’s research department. Please see additional important information and qualifications at the end of this Term Sheet.
| T-94 |
| BANK 2017-BNK5 | 270 Corporate Center |
T. Richard Butera is a real estate investor and philanthropist, having built the Hilton Head Racquet Club in South Carolina, and owned the Aspen Club, Hotel Jerome and Woodstone Inn in Colorado. T. Richard Butera was a founder of the Sidney Kimmel Foundation for Cancer Research and has served as a director of the Johns Hopkins Medical Advisory Board, James Cancer Hospital at Ohio State and Aspen Cancer Conference.
The Property. The 270 Corporate Center Property consists of four office buildings located at 20201, 20250, 20251 and 20300 Century Boulevard in Germantown, Maryland on a 21.4-acre parcel. The total rentable area at the 270 Corporate Center Property is 449,443 SF. Two of the buildings have five stories: 20250 Century Boulevard, constructed in 1995 and consisting of 106,794 SF, and 20300 Century Boulevard, constructed in 1991 and consisting of 133,499 SF. Two of the buildings have four stories: 20201 Century Boulevard, constructed in 1987 and consisting of 103,137 SF, and 20251 Century Boulevard, constructed in 1983 and consisting of 106,013 SF.
The 270 Corporate Center Property’s amenities include landscaped courtyards between the buildings, a 36-seat conference center, fitness center with yoga studio and locker rooms, 3,777 SF of storage space and a 1,270 SF cafe. The 270 Corporate Center Property includes 1,440 surface parking spaces (approximately 3.2 spaces per 1,000 SF).
The 270 Corporate Center sponsors acquired the 270 Corporate Center Property in 2005 and have invested a total of $80,769,996 in the 270 Corporate Center Property between the purchase price, capital improvements and tenant improvements and leasing commissions. Since January 2014, the 270 Corporate Center sponsors have invested $5,438,277 of capital improvements in the 270 Corporate Center Property.
The 270 Corporate Center Property was 87.8% occupied as of May 11, 2017 to 35 tenants. The largest tenants are Department of Energy, Viavi, Herrick, ActioNet and Amarex. No other tenant occupies more than 4.3% of NRA or represents more than 5.0% of underwritten rent.
Major Tenants.
Department of Energy (90,203 SF, 20.1% of NRA, 23.2% of underwritten rent). The U.S. Department of Energy (“DOE”) occupies 90,203 SF at 20300 Century Boulevard under a lease that was amended on May 12, 2017 which extended its lease expiration to November 30, 2024 and effective November 30, 2019 reduces its leased area to 87,396 SF and increases its annual rental rate to $2,942,064. DOE is a General Services Administration tenant. The DOE leads the nation in the research, development, demonstration, and deployment of clean energy and efficiency technologies, supporting the President’s Climate Action Plan and an energy strategy to combat climate change. DOE also continues to address the clean-up of legacy nuclear waste and contamination and is modernizing our nuclear security infrastructure. DOE’s 2017 budget provides $32.5 billion in total funding, including $30.2 billion in discretionary funding and $2.3 billion in new direct spending authority. DOE has a 109-acre headquarter campus across from the 270 Corporate Center Property, situated on the southwest quadrant of I-270 and Route 118.
Viavi(49,246 SF, 11.0% of NRA, 12.3% of underwritten rent). Viavi Solutions Inc. (“Viavi”) occupies a total of 49,246 SF at 20250 Century Boulevard under three leases, each expiring on December 31, 2021. Viavi has two five-year renewal options for any and all of its leases upon ten months’ prior written notice. Viavi has a one-time termination right on any and all of its leases as of December 31, 2019 upon 180 days’ prior notice and payment of a termination fee of $463,510 for Suite 500 (24,211 SF), $411,896 for Suite 400 (21,515 SF) and $39,605 for Suite 100 (3,520 SF). Viavi (NASDAQ: VIAV) is comprised of two publicly-traded companies: Lumentum Holdings Inc., an optical components and commercial lasers company providing security, safety and performance solutions to anti-counterfeiting, consumer and industrial, government and healthcare markets, and Viavi, a network and service enablement and optical coatings company that deploys, maintains and optimizes performance of physical, virtual and hybrid networks to communications service providers and enterprise clients. Viavi reported 2016 annual revenue of $906.3 million and employs approximately 3,200 employees across 45 global offices.
Herrick (36,531 SF, 8.1% of NRA, 9.1% of underwritten rent).Herrick Technology Laboratories, Inc. (“Herrick”) occupies a total of 36,531 SF at 20201 Century Boulevard. In April 2017, Herrick extended its lease to December 31, 2022 and expanded by 13,586 SF (for which space Herrick is entitled to six remaining months of abated rent, for which lender has fully reserved (see “Escrows and Reserves”).Herrick has a one-time termination right on the expansion space, upon notice by July 2018, which if exercised would be effective as of December 31, 2018. Founded in 2000, Herrick develops receiver/processor systems for the Department of Defense and intelligence community, focusing on a range of engineering domains including radio frequency and printed-circuit board design, field-programmable gate array development, embedded and user-interface software development and antenna design.
ActioNet (26,826 SF, 6.0% of NRA, 7.8% of underwritten rent).ActioNet occupies 26,826 SF under a lease at 20300 Century Boulevard that expires February 29, 2020 with one five-year renewal option upon 180 days’ prior notice. ActioNet was founded in 1998, and provides software engineering and program management support, cloud based cyber monitoring, data storage assessment, centralized service desk and mobility management. ActioNet’s clients include the Department of Transportation, Department of Energy, Department of Health and Human Services, Army, Navy, Air Force, Department of Commerce, Department of State, Department of the Treasury, Department of Housing and Urban Development, Department of Justice and Department of Education.
Amarex (26,375 SF, 5.9% of NRA, 6.4% of underwritten rent). Amarex Clinical Research (“Amarex”) occupies a total of 26,375 SF at 20201 Century Boulevard under three leases, each expiring on July 31, 2025. Amarex was established in 1998 and is based at the 270 Corporate Center Property. Amarex is a full-service clinical research organization assisting clients through the process of successful development of FDA approved medical products. Amarex’s leadership team has expertise in biomedical research, standardization of data management protocols, oversight of clinical trial operations, and trial management and has been involved in executing over 300 clinical research projects in over 35 countries.
This is not a research report and was not prepared by any Underwriter’s research department. Please see additional important information and qualifications at the end of this Term Sheet.
| T-95 |
| BANK 2017-BNK5 | 270 Corporate Center |
The following table presents certain information relating to the major tenants at the 270 Corporate Center Property:
| Tenant Summary(1) | |||||||
| Tenant Name | Credit Rating (Fitch/Moody’s/S&P)(2) | Tenant SF | Approximate % of SF | Annual UW Rent | % of Total Annual UW Rent | Annual UW Rent PSF(3) | Lease Expiration |
| Department of Energy | AAA/Aaa/AA+ | 90,203 | 20.1% | $2,179,946 | 23.2% | $24.17 | 11/30/2024 |
| Viavi(4) | NR/NR/NR | 49,246 | 11.0% | $1,149,336 | 12.3% | $23.34 | 12/31/2021 |
| Herrick(5) | NR/NR/NR | 36,531 | 8.1% | $849,252 | 9.1% | $23.25 | 12/31/2022 |
| ActioNet | NR/NR/NR | 26,826 | 6.0% | $732,178 | 7.8% | $27.29 | 2/29/2020 |
| Amarex | NR/NR/NR | 26,375 | 5.9% | $598,681 | 6.4% | $22.70 | 7/31/2025 |
| Subtotal/Wtd. Avg. | 229,181 | 51.0% | $5,509,393 | 58.8% | $24.04 | ||
| Other Tenants | 165,354 | 36.8% | $3,867,826 | 41.2% | $23.39 | ||
| Vacant Space | 54,908 | 12.2% | $0 | 0.0% | $0.00 | ||
| Total/Wtd. Avg. | 449,443 | 100.0% | $9,377,219 | 100.0% | $23.77 | ||
| (1) | Information is based on the underwritten rent roll. |
| (2) | Certain ratings are those of the parent company (or in the case of Department of Energy, the United States) whether or not the parent guarantees the lease. |
| (3) | Wtd. Avg. Annual UW Rent PSF excludes vacant space. |
| (4) | Viavi has a one-time termination right on any and all of its suites as of December 31, 2019 upon 180 days’ prior notice and payment of a termination fee of $463,510 for Suite 500 (24,211 SF), $411,896 for Suite 400 (21,515 SF) and $39,605 for Suite 100 (3,520 SF). |
| (5) | Herrick expanded by 13,586 SF and is entitled to six remaining months of abated rent, for which lender has fully reserved (see “Escrows and Reserves”). Herrick has a one-time termination right on the expansion space, upon notice by July 2018, which if exercised would be effective as of December 31, 2018. |
The following table presents certain information relating to the lease rollover at the 270 Corporate Center Property:
| Lease Rollover Schedule(1)(2) | ||||||||
| Year | # of Leases Rolling | SF Rolling | Approx. % of Total SF Rolling | Approx. Cumulative % of SF Rolling | UW Base Rent PSF Rolling(3) | Total UW Base Rent Rolling | Approx. % of Total Rent Rolling | Approx. Cumulative % of Total Rent Rolling |
| 2017 | 5 | 13,036 | 2.9% | 2.9% | $10.81 | $140,863 | 1.5% | 1.5% |
| 2018 | 5 | 16,037 | 3.6% | 6.5% | $25.17 | $403,674 | 4.3% | 5.8% |
| 2019 | 2 | 6,768 | 1.5% | 8.0% | $24.79 | $167,804 | 1.8% | 7.6% |
| 2020 | 6 | 48,637 | 10.8% | 18.8% | $26.04 | $1,266,702 | 13.5% | 21.1% |
| 2021 | 11 | 73,947 | 16.5% | 35.2% | $23.71 | $1,753,419 | 18.7% | 39.8% |
| 2022 | 9 | 64,705 | 14.4% | 49.6% | $23.88 | $1,545,028 | 16.5% | 56.3% |
| 2023 | 7 | 46,281 | 10.3% | 59.9% | $24.14 | $1,117,358 | 11.9% | 68.2% |
| 2024 | 1 | 90,203 | 20.1% | 80.0% | $24.17 | $2,179,946 | 23.2% | 91.4% |
| 2025 | 4 | 29,926 | 6.7% | 86.7% | $22.79 | $682,096 | 7.3% | 98.7% |
| 2026 | 0 | 0 | 0.0% | 86.7% | $0.00 | $0 | 0.0% | 98.7% |
| 2027 | 1 | 4,995 | 1.1% | 87.8% | $24.09 | $120,330 | 1.3% | 100.0% |
| 2028 & Beyond | 0 | 0 | 0.0% | 87.8% | $0.00 | $0 | 0.0% | 100.0% |
| Vacant | 0 | 54,908 | 12.2% | 100.0% | $0.00 | $0 | 0.0% | 100.0% |
| Total/Wtd. Avg. | 51 | 449,443 | 100.0% | $23.77 | $9,377,219 | 100.0% | ||
| (1) | Information is based on the underwritten rent roll. |
| (2) | Certain tenants may have lease termination options that are exercisable prior to the originally stated expiration date of the related lease and that are not considered in the lease rollover schedule. |
| (3) | Wtd. Avg. UW Base Rent PSF Rolling excludes vacant space. |
The Market. The 270 Corporate Center Property is located along Interstate-270 in Germantown, Maryland, approximately 25 miles northwest of downtown Washington, D.C. Access to the immediate area is provided by I-270, the primary north-south highway extending from the Capital Beltway (I-495) northwestward to Frederick, Maryland. The I-270 Corridor is developed with office and industrial parks clustering around major interchanges extending from Bethesda north through Rockville, Gaithersburg, Germantown, and Clarksville. Much of the development has been driven by technology and biotech companies and a large number of government agencies such as the National Institute of Standards & Technology and the Department of Energy.
According to the appraisal, the 2016 estimated population within a one-, three- and five-mile radius of the 270 Corporate Center Property was 15,897, 106,117 and 213,459, respectively. The population within a five-mile radius has grown 2.15% for the period 2000-2010 and another 1.56% for the period 2010-2016. The 2016 estimated average household income within a one-, three- and five-mile radius of the 270 Corporate Center Property was $83,399, $107,127 and $111,690, respectively.
This is not a research report and was not prepared by any Underwriter’s research department. Please see additional important information and qualifications at the end of this Term Sheet.
| T-96 |
| BANK 2017-BNK5 | 270 Corporate Center |
The 270 Corporate Center Property is located within the -270/Gaithersburg-Germantown submarket. According to a market report, as of the fourth quarter of 2016, the I-270/Gaithersburg-Germantown submarket was comprised of 5.1 million SF with an average vacancy rate of 11.2% and average asking rents of $24.33 PSF. The appraisal noted no anticipated new supply in the Germantown submarket or within the I-270 Corridor.
The following table presents recent leasing data at competitive office buildings with respect to the 270 Corporate Center Property:
| Competitive Property Summary | |||||||||
| Property Name/Address | Occ. | Year Built/ Renov | Size (SF) | Tenant Name | Lease Size (SF) | Lease Date/Term (Yrs.) | Initial Rent/SF | Tenant Improv/SF | Rent Steps |
1801 & 1803 Research Blvd 1801 & 1803 Research Blvd Rockville, MD | 60% | 1981/1995 | 274,320 | Glotech ESAC C-Management AFLAC | 7,446 8,025 15,120 4,121 | Dec 16 / 5.4 Dec 16 / 5.5 Dec 16 / 12.0 Feb 16 / 5.5 | $23.50 $23.50 $23.00 $22.50 | $11.00 $32.00 $47.00 $29.65 | 2.75% 2.75% 2.50% 3.00% |
Metro Executive Park 15800 & 15850 Crabbs Branch Way Rockville, MD | 66% | 1985/2006 | 123,825 | AACPM Advanced Nursing Specialties TechGlobal | 2,867 2,474 1,850 3,048 | Aug 16 / 11.3 Jun 16 / 7.5 Apr 16 / 2.0 Apr 16 / 5.6 | $21.25 $21.00 $23.50 $21.50 | $3.00 $2.00 $0.00 $25.00 | 2.75% 2.75% 3.00% 2.75% |
Park Plaza 1 2101 Gaither Road Rockville, MD | 83% | 1991/2014 | 131,336 | Raymond James & Assoc. Pinnacle Financial Group Northrup Grumman HomeBridge Financial | 1,275 4,640 12,507 6,353 | Feb 16 / 5.3 Jan 16 / 11.0 Nov 15 / 3.0 Nov 15 / 5.3 | $27.75 $26.75 $26.50 $29.00 | $0.00 $65.00 $7.50 $50.00 | 2.75% 2.50% 2.50% 2.50% |
Woodmont Place 1451 Rockville Pike Rockville, MD | 98% | 1983/NA | 105,733 | GSA – FDA Encompass, LLC American Assoc. of Immunoligists Motionsoft, Inc | 45,052 6,337 12,418 20,127 | Jan 16 / 5.0 Nov 15 / 7.0 Oct 15 / 11.0 Jun 15 / 11.0 | $32.50 $26.50 $27.00 $26.50 | $20.00 $65.00 $60.00 $60.00 | Flat 3.00% 3.00% 3.00% |
Montgomery Office Building 656 Quince Orchard Road Gaithersburg, MD | 88% | 1979/NA | 107,284 | Digital Infusion | 30,116 | May 15 / 10.1 | $20.50 | $35.00 | 2.50% |
Cloverleaf Center Bldg 2 20440 Century Blvd Germantown, MD
| 66% | 2000/NA | 52,500 | The Mgmt Group Assoc. | 10,288 | Jul 15 / 7.0 | $23.75 | $19.44 | 2.75% |
Source:Appraisal
This is not a research report and was not prepared by any Underwriter’s research department. Please see additional important information and qualifications at the end of this Term Sheet.
| T-97 |
| BANK 2017-BNK5 | 270 Corporate Center |
Operating History and Underwritten Net Cash Flow.The following table presents certain information relating to the historical operating performance and the Underwritten Net Cash Flow at the 270 Corporate Center Property:
| Cash Flow Analysis | |||||||||||||
| 2013 | 2014 | 2015 | 2016 | UW | UW PSF | ||||||||
| Gross Potential Rent(1) | $10,021,902 | $9,974,589 | $9,933,048 | $10,120,092 | $10,624,122 | $23.64 | |||||||
| Total Recoveries | $710,385 | $671,611 | $831,635 | $843,582 | $895,923 | $1.99 | |||||||
| Other Income | $10,190 | $3,809 | $33,211 | $41,521 | $6,500 | $0.01 | |||||||
| Less Vacancy & Credit Loss | ($3,767,526) | ($3,221,731) | ($2,295,086) | ($1,926,769) | ($1,246,903) | (10.8%) | |||||||
| Effective Gross Income | $6,974,951 | $7,428,278 | $8,502,808 | $9,078,426 | $10,279,642 | $22.87 | |||||||
| Total Operating Expenses | $2,665,469 | $3,709,201 | $3,821,719 | $4,145,459 | $4,267,232 | $9.49 | |||||||
| Net Operating Income | $4,309,482 | $3,719,077 | $4,681,089 | $4,932,967 | $6,012,410 | $13.38 | |||||||
| Capital Expenditures | $0 | $0 | $0 | $0 | $89,889 | $0.20 | |||||||
| TI/LC | $0 | $0 | $0 | $0 | $543,465 | $1.21 | |||||||
| Net Cash Flow | $4,309,482 | $3,719,077 | $4,681,089 | $4,932,967 | $5,379,056 | $11.97 | |||||||
| Occupancy % | 64.7%(2) | 76.5% | 79.1% | 87.8%(3) | 89.2% | ||||||||
| NOI DSCR (P&I) | 1.29x | 1.11x | 1.40x | 1.47x | 1.79x | ||||||||
| NOI DSCR (IO) | 1.65x | 1.42x | 1.79x | 1.88x | 2.30x | ||||||||
| NCF DSCR (P&I) | 1.29x | 1.11x | 1.40x | 1.47x | 1.61x | ||||||||
| NCF DSCR (IO) | 1.65x | 1.42x | 1.79x | 1.88x | 2.06x | ||||||||
| NOI Debt Yield | 8.2% | 7.1% | 8.9% | 9.4% | 11.5% | ||||||||
| NCF Debt Yield | 8.2% | 7.1% | 8.9% | 9.4% | 10.2% | ||||||||
| (1) | Gross Potential Rent has been underwritten based on the May 1, 2017 rent roll and includes rent steps of $90,891 through December 1, 2017 and assumes the average rent for Department of Energy through the loan term. |
| (2) | The 20250 Century Boulevard building had historically been 100% occupied by DRT, Inc. which vacated in the fall of 2012 due to the company’s acquisition by Boeing. The 2013 Occupancy % is reflective of the 20250 Century Boulevard building being vacant for renovations. |
| (3) | Occupancy as of May 11, 2017. |
Escrows and Reserves. The 270 Corporate Center Mortgage Loan documents require monthly reserves for (i) real estate taxes, (ii) insurance premiums (unless an acceptable blanket policy is in place), (iii) replacement reserves in the amount of $7,491 and (iv) tenant improvements and leasing commissions in the amount of $44,944 through June 1, 2019 and $74,907 thereafter. The 270 Corporate Center Mortgage Loan documents require upfront reserves of $658,667 for real estate taxes, upfront reserves of $244,974 for free rent periods through December 1, 2017 relating to the tenants Herrick, Project Enhancement and Vanguard and upfront reserves of $195,811 for tenant improvements and leasing commissions relating to the tenant Herrick.
Lockbox and Cash Management.The 270 Corporate Center Mortgage Loan documents require a hard lockbox with springing cash management. Upon the occurrence of and during the continuance of a Cash Sweep Period (as defined below), funds in the lockbox account are required to be transferred on each business day to the lender-controlled cash management account and applied on each monthly payment date to pay debt service on the 270 Corporate Center Mortgage Loan and to fund the required reserves deposits, with the excess cash flow held by lender as additional security for the 270 Corporate Center Mortgage Loan.
A “Cash Sweep Period” will occur during either (i) an event of default under the 270 Corporate Center Mortgage Loan until the cure of the event of default and, (ii) the debt service coverage ratio being less than 1.10x for three consecutive calendar months until the debt service coverage ratio is equal to or greater than 1.15x for three consecutive calendar months.
Additional Secured Indebtedness (not including trade debts).Not permitted
Mezzanine Loan and Preferred Equity.Not permitted.
Release of Property.Not permitted.
Terrorism Insurance.The 270 Corporate Center Mortgage Loan documents require that the “all risk” insurance policy required to be maintained by the 270 Corporate Center Borrower provides coverage for terrorism in an amount equal to the full replacement cost of the 270 Corporate Center Property and eighteen months of business interruption insurance with a six-month extended period of indemnity.
This is not a research report and was not prepared by any Underwriter’s research department. Please see additional important information and qualifications at the end of this Term Sheet.
| T-98 |
(THIS PAGE INTENTIONALLY LEFT BLANK)
This is not a research report and was not prepared by any Underwriter’s research department. Please see additional important information and qualifications at the end of this Term Sheet.
| T-99 |
| BANK 2017-BNK5 | iStar Leased Fee Portfolio |
Mortgage Loan No. 8 – iStar Leased Fee Portfolio
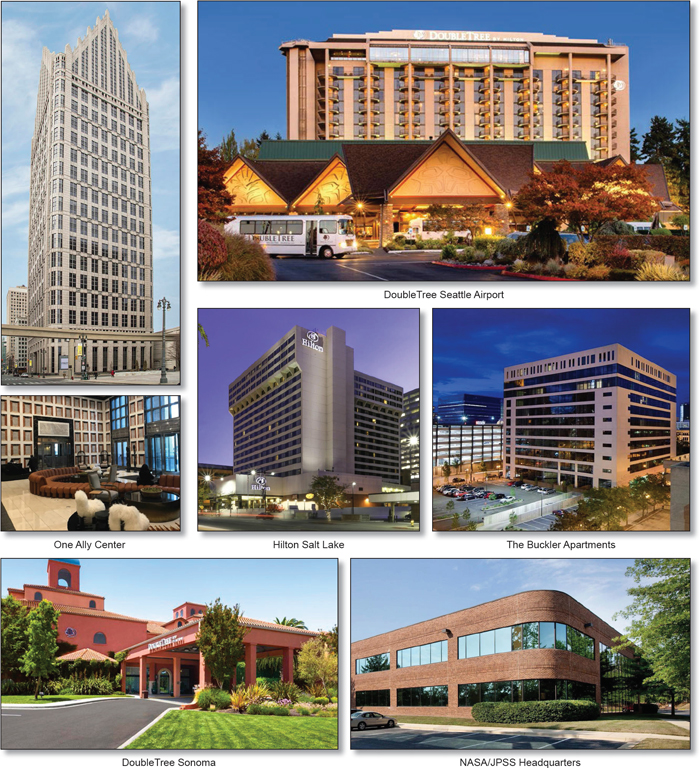
This is not a research report and was not prepared by any Underwriter’s research department. Please see additional important information and qualifications at the end of this Term Sheet.
| T-100 |
| BANK 2017-BNK5 | iStar Leased Fee Portfolio |
Mortgage Loan No. 8 – iStar Leased Fee Portfolio
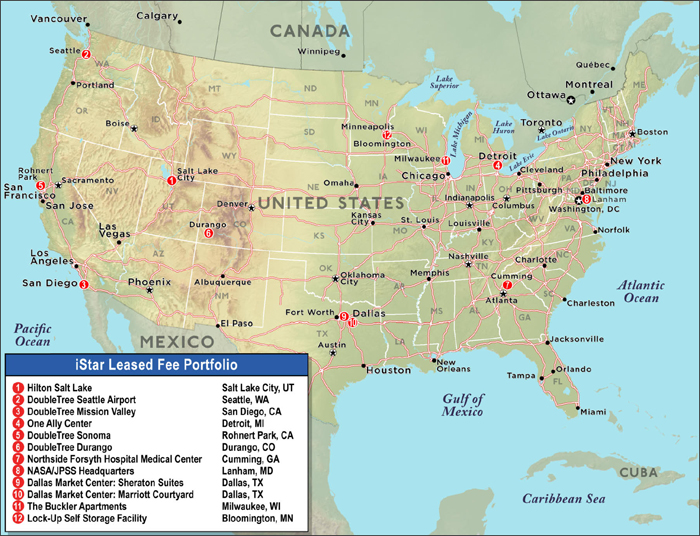
This is not a research report and was not prepared by any Underwriter’s research department. Please see additional important information and qualifications at the end of this Term Sheet.
| T-101 |
| BANK 2017-BNK5 | iStar Leased Fee Portfolio |
| Mortgage Loan No. 8 – iStar Leased Fee Portfolio |
| Mortgage Loan Information | Property Information | ||||||
| Mortgage Loan Seller: | BANA | Single Asset/Portfolio: | Portfolio | ||||
| Original Balance(1): | $45,400,000 | Location: | Various | ||||
| Cut-off Date Balance(1): | $45,400,000 | General Property Type: | Leased Fee | ||||
| % of Initial Pool Balance: | 3.7% | Detailed Property Type: | Leased Fee | ||||
| Loan Purpose(2): | Recapitalization | Title Vesting: | Various | ||||
| Sponsor: | iStar Inc. | Year Built/Renovated: | Various / Various | ||||
| Mortgage Rate: | 3.7950% | Size: | Various | ||||
| Note Date: | 3/30/2017 | Cut-off Date Balance PSF: | N/A | ||||
| First Payment Date: | 5/6/2017 | Maturity Date or ARD Balance PSF: | N/A | ||||
| Anticipated Repayment Date(3): | 4/6/2027 | Property Manager: | N/A | ||||
| Maturity Date(3): | 4/6/2028 | ||||||
| Original Term to ARD(3): | 120 months | ||||||
| Original Amortization Term: | 0 months | Underwriting and Financial Information | |||||
| IO Period: | 120 months | UW NOI(6): | $18,511,396 | ||||
| Seasoning: | 2 months | UW NOI Debt Yield(6)(7): | 8.2% | ||||
| Prepayment Provisions(4): | LO (26); DEF/YM1 (89); O (5) | UW NOI Debt Yield at Maturity or ARD(6): | 8.2% | ||||
| Lockbox/Cash Mgmt Status: | Hard/Springing | UW NCF DSCR(6)(7): | 2.12x | ||||
| Additional Debt Type: | Pari Passu | Most Recent NOI(6): | N/A | ||||
| Additional Debt Balance: | $181,600,000 | 2nd Most Recent NOI(6): | N/A | ||||
| Future Debt Permitted (Type): | No (N/A) | 3rd Most Recent NOI(6): | N/A | ||||
| Reserves(5) | Most Recent Occupancy(6): | N/A | |||||
| Type | Initial | Monthly | Cap | 2nd Most Recent Occupancy(6): | N/A | ||
| RE Tax: | $0 | Springing | N/A | 3rd Most Recent Occupancy(6): | N/A | ||
| Insurance: | $0 | Springing | N/A | Appraised Value (as of): | $346,160,000 (Various) | ||
| Recurring Replacements: | $0 | N/A | N/A | Cut-off Date LTV Ratio(1)(8): | 65.6% | ||
| TI/LC: | $0 | N/A | N/A | Maturity Date or ARD LTV Ratio(1): | 65.6% | ||
| Other: | $0 | Springing | N/A | ||||
| Sources and Uses | ||||||
| Sources | Proceeds | % of Total | Uses | Proceeds | % of Total | |
| Loan Amount(1): | $227,000,000 | 100.0% | Closing Costs: | $5,242,871 | 2.3% | |
| Return of Equity(2): | $221,757,129 | 97.7% | ||||
| Total Sources: | $227,000,000 | 100.0% | Total Uses: | $227,000,000 | 100.0% | |
| (1) | The iStar Leased Fee Portfolio Mortgage Loan is part of the iStar Leased Fee Portfolio Whole Loan, which is comprised of fivepari passu promissory notes with an aggregate principal balance of $227,000,000. The UW NOI Debt Yield, UW NOI Debt Yield at Maturity or ARD, UW NCF DSCR, Cut-off Date LTV Ratio and Maturity Date or ARD LTV Ratio numbers presented above are based on the aggregate principal balance of the promissory notes comprising the iStar Leased Fee Portfolio Whole Loan. |
| (2) | Immediately prior to the iStar Leased Fee Portfolio Whole Loan origination, the borrower sponsor had no outstanding mortgage debt associated with the iStar Leased Fee Portfolio Properties. Immediately after loan origination, 51.0% of the equity interest in the borrowers was sold to two entities, GIC (Realty) Private Limited and Lubert-Adler, L.P. in two separate transactions, for an aggregate purchase price of $57.5 million or an implied value of the iStar Leased Fee Portfolio Properties of approximately $339.7 million which would result in a Cut-off Date LTV Ratio of 66.8% and a Maturity Date or ARD LTV Ratio of 66.8%. |
| (3) | The iStar Leased Fee Portfolio Whole Loan has an anticipated repayment date of April 6, 2027 (the “ARD”) and a stated maturity date of April 6, 2028. In the event the iStar Leased Fee Portfolio Whole Loan is not repaid in full by the ARD, the interest rate will increase from the initial interest rate of 3.7950% to the greater of (a) 3.0% above the interpolated U.S. treasury swap rate, (b) 3.0% above the interpolated U.S. treasury rate and (c) 6.7950%. See “The Mortgage Loan” below. |
| (4) | Defeasance is permitted in whole or in part at any time after the earlier to occur of (i) the end of the two-year period commencing on the closing date of the securitization of the last iStar Leased Fee Portfolio Whole Loan promissory note to be securitized and (ii) March 30, 2020 (the “REMIC Prohibition Period”). The assumed lockout period of 26 payments is based on the closing date of this transaction in June 2017. In addition, after the expiration of the REMIC Prohibition Period, the iStar Leased Fee Portfolio Borrowers are permitted to obtain the release of any one or more individual iStar Leased Fee Portfolio Properties with the payment of the sum of a release price equal to 120% of the allocated loan amount with respect to such individual property and the yield maintenance premium. See“Release of Property”below. If the iStar Leased Fee Portfolio Borrowers have not previously elected to defease the iStar Leased Fee Portfolio Whole Loan in whole or in part and/or obtain a partial release, the iStar Leased Fee Portfolio Borrowers are also permitted to prepay the iStar Leased Fee Portfolio Whole Loan in whole after the expiration of the REMIC Prohibition Period with the payment of a yield maintenance premium. |
| (5) | See“Escrows and Reserves” below for further discussion of reserve requirements. |
| (6) | Underwriting and financial information is based on the current annual ground lease payments due under the ground leases described under“The Properties”below. Historical NOI and occupancy data are not available. |
| (7) | The estimated “Look Through” DSCR and “Look Through” Debt Yield based on the UW estimated NOI of the non-collateral improvements on the iStar Leased Fee Portfolio Properties (not taking into account other debt for which the non-collateral improvements may be collateral) is approximately 7.26x and 27.9% respectively. |
| (8) | The estimated “Look Through” Cut-off Date LTV Ratio for the estimated fee simple value of $714,450,000 (i.e. assuming that iStar Leased Fee Portfolio Properties were unencumbered by the ground leases) is 31.8%. |
This is not a research report and was not prepared by any Underwriter’s research department. Please see additional important information and qualifications at the end of this Term Sheet.
| T-102 |
| BANK 2017-BNK5 | iStar Leased Fee Portfolio |
The Mortgage Loan. The eighth largest mortgage loan (the “iStar Leased Fee Portfolio Mortgage Loan”) is part of a whole loan (the “iStar Leased Fee Portfolio Whole Loan”) evidenced by fivepari passu promissory notes in the aggregate original principal amount of $227,000,000. The iStar Leased Fee Portfolio Whole Loan is secured by (a) a first priority fee mortgage encumbering the land under seven hotel properties, three office properties, one multifamily property and one self-storage property and (b) a first priority fee and leasehold mortgage encumbering a leasehold interest and a portion of the fee interest in the land under one hotel site, all of which land is encumbered by ground leases (collectively, the “iStar Leased Fee Portfolio Properties”). The iStar Leased Fee Portfolio Whole Loan was co-originated by Bank of America, N.A., Barclays Bank, PLC and JP Morgan Chase Bank, N.A. Promissory Note A-3, in the original principal amount of $45,400,000, represents the iStar Leased Fee Portfolio Mortgage Loan, and will be included in the BANK 2017-BNK5 securitization trust. Promissory Notes A-1-1, A-1-2, A-1-3 and A-2, in the aggregate original principal amount of $181,600,000, collectively represent the companion loans (the “iStar Leased Fee Portfolio Non-ServicedPari Passu Companion Loans”).
The following table presents a summary of the notes comprising the iStar Leased Fee Portfolio Whole Loan. The iStar Leased Fee Portfolio Whole Loan is expected to be serviced pursuant to the pooling and servicing agreement for the MSC 2017-H1 transaction. See “Description of the Mortgage Pool—The Whole Loans—The Non-Serviced Whole Loans—The iStar Leased Fee Portfolio Whole Loan” and “Pooling and Servicing Agreement-Servicing of the Non-Serviced Mortgage Loans” in the Preliminary Prospectus.
| iStar Leased Fee Portfolio Whole Loan Summary | ||||
| Note | Original Balance | Cut-off Date Balance | Note Holder(1) | Controlling Piece |
| A-1-1 | $55,000,000 | $55,000,000 | MSC 2017-H1 | Yes |
| A-1-2 | $40,600,000 | $40,600,000 | Barclays Bank, PLC | No |
| A-1-3 | $40,600,000 | $40,600,000 | Barclays Bank, PLC | No |
| A-2 | $45,400,000 | $45,400,000 | JPMorgan Chase Bank, N.A. | No |
| A-3 | $45,400,000 | $45,400,000 | BANK 2017-BNK5 | No |
| Total iStar Leased Fee Portfolio Whole Loan | $227,000,000 | $227,000,000 | ||
| (1) | The promissory notes (other than Note A-1-1 and Note A-3) are expected to be contributed to future securitization transactions or may be otherwise transferred at any time. |
The iStar Leased Fee Portfolio Whole Loan has an anticipated repayment date of April 6, 2027 (the “ARD”) and final maturity date of April 6, 2028. Prior to the ARD, the iStar Leased Fee Portfolio Whole Loan accrues interest at a fixed rate of 3.7950% (the “Initial Interest Rate”) and requires payments of interest only. In the event the iStar Leased Fee Portfolio Whole Loan is not repaid in full on or before the ARD, the interest rate will increase to a rate (the “Adjusted Interest Rate”) equal to the greater of (a) 3.0% above the interpolated U.S. Treasury Swap Rate with a maturity date most nearly approximating the maturity date of the iStar Leased Fee Portfolio Whole Loan, (b) 3.0% above the interpolated U.S. Treasury Rate with a maturity date most nearly approximating the maturity date of the iStar Leased Fee Portfolio Whole Loan and (c) 6.7950%. In the event that the iStar Leased Fee Portfolio Whole Loan is not repaid in full on or prior to the ARD, interest accrued at the excess of the Adjusted Interest Rate over the Initial Interest Rate (the “Accrued Interest”) will be deferred. Provided no event of default has occurred and is continuing, from and after the ARD, all excess cash flow from the iStar Leased Fee Portfolio Properties after the payment of reserves, interest calculated at the Initial Interest Rate and operating expenses will be applied (a)firstto repay the principal balance of the iStar Leased Fee Portfolio Whole Loan until repaid in full and (b)second to the payment of Accrued Interest.
The Borrowers and the Sponsor. The borrowers are RLH Partnership II LP, 500 Woodward LLC, Hubble Drive Lanham LLC, iStar North Old Atlanta Road LLC, iStar Dallas GL LP, 401 W Michigan Street – Milwaukee LLC and 221 American Boulevard – Bloomington LLC, (the “iStar Leased Fee Portfolio Borrowers”), each a single-purpose Delaware limited liability company or limited partnership structured to be bankruptcy-remote, with at least two independent directors. The iStar Leased Fee Portfolio Borrowers are currently owned by Safety, Income and Growth Inc. (“SFTY”). The sponsor and the nonrecourse carve-out guarantor of the iStar Leased Fee Portfolio Whole Loan is iStar Inc. SFTY was formerly 100.0% owned by iStar, Inc., but is currently 49.0% owned by iStar Inc. and the remaining equity is owned by GIC (Realty) Private Limited and Lubert-Adler, L.P. iStar Inc. is a public commercial real estate finance and investment company which as of December 31, 2016, had total assets of approximately $4.8 billion and 196 employees in its New York City headquarters and its seven regional offices across the United States.
In April 2017, SFTY filed a preliminary prospectus to sell shares of its common stock and has received clearance to apply to have the common stock listed on the New York Stock Exchange with the intent to elect and qualify to be taxed as a real estate investment trust. SFTY will be externally managed by a wholly-owned subsidiary of iStar Inc. According to the preliminary S-11 offering documents filed by iStar, upon completion of the common stock initial public offering, it is anticipated that iStar Inc. will purchase shares of SFTY’s common stock having an aggregate value of $45.0 million. Upon the completion of SFTY becoming a public vehicle, the loan documents provide for SFTY to become the non-recourse carveout guarantor under the iStar Leased Fee Portfolio Whole Loan in lieu of iStar Inc., provided that SFTY has a market capitalization in excess of $500,000,000 or net worth in excess of $250,000,000. See “Description of the Mortgage Pool-Non Recourse Carveout Limitations” in the Preliminary Prospectus. There can be no assurance as to whether, or when, any of these transactions will occur.
The Properties. The iStar Leased Fee Portfolio Properties are located in ten different states and underlie improvements consisting of seven hotels (2,488 keys, 78.1% of allocated loan amounts), three offices (1,169,928 SF, 19.7% of allocated loan amounts), one multifamily complex (207 units, 1.6% of allocated loan amounts) and one self-storage facility (104,000 SF, 0.6% of allocated loan amounts). Five of the properties (74.6% of the allocated loan amounts) (the “Hilton Properties”) are leased under a unitary lease to HLT Operate DTWC LLC. Park Intermediate Holdings LLC is the guarantor of the master lease from borrower to HLT Operate DTWC LLC. Park Intermediate Holdings LLC is a subsidiary of Park Hotels & Resorts Inc. and one of two Hilton Worldwide Holdings Inc. spin-offs. The Hilton Properties each have initial lease expiration dates in eight years on December 31, 2025, which can each be extended for two additional five-year periods. One Ally Center (14.1% of allocated loan amounts) is ground leased to 500 Webward LLC with an initial lease expiration date in March 2114 with two 30-year extension options. No other leasehold owner accounts for more than 3.3% of allocated loan amounts. The iStar Leased Fee Portfolio Properties have a weighted average age of approximately 17 years and a remaining initial ground lease term of approximately 29 years, or approximately 48 years when fully extended.
This is not a research report and was not prepared by any Underwriter’s research department. Please see additional important information and qualifications at the end of this Term Sheet.
| T-103 |
| BANK 2017-BNK5 | iStar Leased Fee Portfolio |
The following table presents certain information relating to the iStar Leased Fee Portfolio Properties:
| iStar Leased Fee Portfolio Properties | |||||||
| Property Name | Whole Loan Cut-off Date Allocated Loan Amount | Ownership Interest | Leasehold Owner | Initial Leasehold Expiration | Final Leasehold Expiration | Leased Fee NOI | Leased Fee Appraised Value |
| Hilton Salt Lake | $55,312,000 | Fee | HLT Operate DTWC LLC | 12/31/2025(1) | 12/31/2035 | $3,300,706 | $79,900,000 |
| DoubleTree Seattle Airport | $40,000,000 | Fee/Leasehold(2) | HLT Operate DTWC LLC | 12/31/2025(1) | 12/31/2035 | $5,374,280 | $75,700,000 |
| DoubleTree Mission Valley | $38,084,000 | Fee | HLT Operate DTWC LLC | 12/31/2025(1) | 12/31/2035 | $1,776,034 | $55,000,000 |
| One Ally Center | $31,961,000 | Fee | 500 Webward LLC | 3/31/2114(3) | 3/31/2174 | $3,353,970 | $46,140,000 |
| DoubleTree Sonoma | $19,300,000 | Fee | HLT Operate DTWC LLC | 12/31/2025(1) | 12/31/2035 | $1,157,870 | $27,700,000 |
| DoubleTree Durango | $16,604,000 | Fee | HLT Operate DTWC LLC | 12/31/2025(1) | 12/31/2035 | $1,155,514 | $24,400,000 |
| Northside Forsyth Hospital Medical Center | $7,577,000 | Fee | Forsyth Physicians Center SPE1, LLC | 4/25/2115(4) | 4/25/2175 | $654,595 | $11,000,000 |
| NASA/JPSS Headquarters | $5,190,000 | Fee | DRV Greentec LLC | 10/31/2075(5) | 10/31/2105 | $472,292 | $7,550,000 |
| Dallas Market Center: Sheraton Suites | $4,151,000 | Fee | Dallas Suites RE LLC | 9/30/2114 | 9/30/2114 | $524,334 | $6,000,000 |
| Dallas Market Center: Marriott Courtyard | $3,736,000 | Fee | ARC Hospitality Portfolio I DLGL Owner, LP | 1/2/2026(6) | 1/2/2066 | $297,000 | $5,400,000 |
| The Buckler Apartments | $3,633,000 | Fee | CA / Phoenix 401 Property Owner, LLC | 11/30/2112 | 11/30/2112 | $312,186 | $5,300,000 |
| Lock-Up Self Storage Facility | $1,452,000 | Fee | Lock-Up Evergreen Development Series LLC | 9/30/2037 | 9/30/2037 | $132,615 | $2,070,000 |
| Total | $18,511,396 | $346,160,000 | |||||
| (1) | HLT Operate DTWC LLC has two five-year extension options. |
| (2) | The DoubleTree Seattle Airport collateral is comprised of both a portion of the fee interest and a leasehold interest in the fee portion that is not collateral, which together are leased to HLT Operate DTWC LLC which operates the hotel. The leasehold interest is owned in fee by a third party, and underlies the majority of the DoubleTree Seattle hotel’s improvements. The fee collateral includes approximately a third of the hotel parking and one wing of rooms which total 180 rooms and the leasehold collateral includes the remainder of the property. The current ground rent for the DoubleTree Seattle Airport site totals $391,128 annually which is required to be directly paid for by HLT Operate DTWC LLC, which is responsible for all property related expenses under their NNN ground lease from the iStar Leased Fee Portfolio Borrowers. The iStar Leased Fee Portfolio Borrowers’ ground lease from the fee owner expires in January 2044. |
| (3) | 500 Webward LLC has two 30-year extension options. |
| (4) | Forsyth Physicians Center SPE1, LLC has two 30-year extension options. |
| (5) | DRV Greentec LLC has two 15-year extension options. |
| (6) | ARC Hospitality Portfolio I DLGL Owner, LP has four 10-year extension options. |
The following table presents certain information relating to the non-collateral improvements to the iStar Leased Fee Portfolio Properties:
| iStar Leased Fee Portfolio Non-collateral Improvements | |||||||
| Property Name | Location | Property Type | Year Built / Renovated | Look- Through NOI | Units (SF or Rooms) | Look Through Most Recent Occupancy(1) | Fee Simple Appraised Value(2) |
| Hilton Salt Lake | Salt Lake City, UT | Hotel | 1983 / 2012 | $9,778,443 | 499 | 72.0% | $105,100,000 |
| DoubleTree Seattle Airport | Seattle, WA | Hotel | 1969 / 2011 | $14,682,914 | 850 | 85.0% | $140,000,000 |
| DoubleTree Mission Valley | San Diego, CA | Hotel | 1991 / 2012 | $7,804,702 | 300 | 87.0% | $82,000,000 |
| One Ally Center | Detroit, MI | Office | 1992 / N/A | $13,920,739 | 957,355 | 100.0% | $174,620,000 |
| DoubleTree Sonoma | Rohnert Park, CA | Hotel | 1987 / 2016 | $4,153,633 | 245 | 75.0% | $41,600,000 |
| DoubleTree Durango | Durango, CO | Hotel | 1986 / 2009 | $3,379,284 | 159 | 79.0% | $36,400,000 |
| Northside Forsyth Hospital Medical Center | Cumming, GA | Office | 2017 / N/A | $901,501 | 92,573 | 95.0% | $15,730,000 |
| NASA/JPSS Headquarters | Lanham, MD | Office | 1994 / N/A | $1,221,724 | 120,000 | 100.0% | $17,100,000 |
| Dallas Market Center: Sheraton Suites | Dallas, TX | Hotel | 1989 / 2017 | $2,438,398 | 251 | 79.0% | $20,900,000 |
| Dallas Market Center: Marriott Courtyard | Dallas, TX | Hotel | 1989 / 2015 | $2,254,686 | 184 | 72.0% | $27,300,000 |
| The Buckler Apartments | Milwaukee, WI | Multifamily | 1977 / 2016 | $2,103,422 | 207 | 75.0% | $39,900,000 |
| Lock-Up Self Storage Facility | Bloomington, MN | Self Storage | 2008 / N/A | $754,685 | 104,000 | 84.0% | $13,800,000 |
| Total | $63,394,131 | $714,450,000 | |||||
| (1) | The hotel occupancy rates shown are the average occupancy rates of the hotels for the 12 months ending December 31, 2016. Construction at Northside Forsyth Hospital Medical Center was recently completed and occupancy reflects pre-leased percentage as of December 31, 2016. The occupancy rate of Buckler Apartments is as of March 15, 2017. The occupancy rate of Lock-Up Self Storage Facility is as of June 30, 2016. |
| (2) | The Fee Simple Appraised Value assumes the properties are unencumbered by the ground leases. |
This is not a research report and was not prepared by any Underwriter’s research department. Please see additional important information and qualifications at the end of this Term Sheet.
| T-104 |
| BANK 2017-BNK5 | iStar Leased Fee Portfolio |
Major Properties (by allocated loan amount)
Hilton Salt Lake (499 keys, 24.4% of portfolio allocated loan amount, 17.8% of portfolio leased fee NOI).Hilton Salt Lake, built in 1983 and renovated in 2012, is a 16-story full service hotel consisting of 499 keys and located in Salt Lake City, Utah. Hilton Salt Lake features 24,000 SF of meeting space, two restaurants, a Starbucks, an indoor pool and jacuzzi, a fitness center, business center, gift shop and on-site car rental services. Hilton Salt Lake is located across the street from the Salt Palace Convention Center and is one block from a Trax Light Rail stop which offers access to the surrounding Salt Lake City metropolitan statistical area.
DoubleTree Seattle Airport (850 keys, 17.6% of portfolio allocated loan amount, 29.0% of portfolio leased fee NOI).DoubleTree Seattle Airport, built in 1969 and renovated in 2011, is a full service hotel consisting of 850 keys and located on a 24.4 acre site in Seattle, Washington. According to the appraisal, DoubleTree Seattle Airport is the third largest hotel property in the Pacific Northwest and is located at the busiest intersection in the SeaTac International Airport area. DoubleTree Seattle Airport features 26 meeting and event rooms totaling 36,000 SF that accommodate up to 1,200 guests, a complimentary 24-hour airport shuttle, two restaurants, a cafe, an outdoor seasonal pool, two fitness centers and a business center. DoubleTree Seattle Airport is located less than a mile from the SeaTac International Airport.
The DoubleTree Seattle Airport collateral is comprised of both a portion of the fee interest and a leasehold interest in the fee portion that is not collateral, which together are leased to HLT Operate DTWC LLC which operates the hotel. The portion of the collateral which consists of a leasehold interest is owned in fee by a third party and underlies the majority of the DoubleTree Seattle Airport hotel’s improvements. The fee collateral includes approximately a third of the hotel parking and one wing of rooms which contains a total of 180 rooms and the leasehold collateral includes the remainder of the property. The current ground rent for the DoubleTree Seattle Airport ground leased site totals $391,128 annually, which is required to be directly paid for by HLT Operate DTWC LLC, which is responsible for all property related expenses under their NNN ground lease from the iStar Leased Fee Portfolio Borrower. The iStar Leased Fee Portfolio Borrower’s ground lease from the third party fee owner expires in January 2044.
DoubleTree Mission Valley (300 keys, 16.8% of portfolio allocated loan amount, 9.6% of portfolio leased fee NOI).DoubleTree Mission Valley, built in 1991 and renovated in 2012, is an 11-story full service hotel consisting of 300 keys and located in San Diego, California. DoubleTree Mission Valley features 25,000 SF of meeting space, a cafe, an indoor and outdoor pool and a fitness center. DoubleTree Mission Valley is attached via a pedestrian bridge to San Diego’s Fashion Valley Mall, which is anchored by Neiman Marcus, Nordstrom, Bloomingdales and Macy’s, and is within walking distance of San Diego’s retail corridor.
One Ally Center (957,355 SF, 14.1% of portfolio allocated loan amount, 18.1% of portfolio leased fee NOI).One Ally Center, built in 1992, is a 43-story Class A office building consisting of 957,355 SF and located in Detroit, Michigan. One Ally Center is the tallest office building in the state of Michigan, featuring 360-degree views, and is occupied by a diverse tenant roster. The largest tenant, Ally Financial, occupies 13 floors of space and has over 1,500 Ally Financial employees onsite. Other notable tenants include Pricewaterhouse Coopers LLP, several law firms including Clark Hill, Dickinson Wright, Foley & Lardner, Kerr, Russel and Webber, and the Police and Fire and General Retirement Systems of the City of Detroit. One Ally Center offers amenities such as a 10,000 SF fitness center, a cafe and bistro and on-site parking with valet service.
DoubleTree Sonoma (245 keys, 8.5% of portfolio allocated loan amount, 6.3% of portfolio leased fee NOI).DoubleTree Sonoma, built in 1987 and renovated in 2016, is a full service hotel consisting of 245 keys and located on a 12.5 acre site in Rohnert Park, California. DoubleTree Sonoma is located adjacent to the U.S. 101 Freeway in Sonoma Wine Country and features 18,000 SF of indoor space and 32,000 SF of exterior space including a large divisible ballroom that can accommodate meetings for 10-500 people. Additionally, DoubleTree Sonoma features an airport shuttle to San Francisco and Oakland International Airports, Bacchus Restaurant & Wine Bar, a heated outdoor pool, tennis/sport court and fitness center. DoubleTree Sonoma is adjacent to two championship golf courses and is accessible to over 400 of Sonoma’s wineries from downtown Sonoma to Healdsburg.
The Markets. The iStar Leased Fee Portfolio is comprised of twelve properties located in ten states and eleven distinct markets, listed below by descending allocated loan amount.
| iStar Leased Fee Portfolio Demographic Information | |||
| Property Name | Address | Estimated 2016 Population (five- mile radius) | Estimated Average 2016 Household Income (five- mile radius) |
| Hilton Salt Lake | 255 South West Temple, Salt Lake City, UT | 230,805 | $69,217 |
| DoubleTree Seattle Airport | 18740 International Boulevard, Seattle, WA | 219,802 | $70,608 |
| DoubleTree Mission Valley | 7450 Hazard Center Drive, San Diego, CA | 520,204 | $75,313 |
| One Ally Center | 500 Woodward Avenue, Detroit, MI | 189,959 | $36,581 |
| DoubleTree Sonoma | 1 DoubleTree Drive, Rohnert Park, CA | 118,400 | $74,918 |
| DoubleTree Durango | 501 Camino Del Rio, Durango, CO | 23,216 | $72,938 |
| Northside Forsyth Hospital Medical Center | 4150 Deputy Bill Cantell Memorial Road, Cumming, GA | 98,372 | $113,511 |
| NASA/JPSS Headquarters | 7700 and 7720 Hubble Drive, Lanham, MD | 170,176 | $101,951 |
| Dallas Market Center: Sheraton Suites | 2101 Stemmons Freeway, Dallas, TX | 351,125 | $94,722 |
| Dallas Market Center: Marriott Courtyard | 2150 Market Center Boulevard, Dallas, TX | 351,125 | $94,722 |
| The Buckler Apartments | 401 W Michigan Street, Milwaukee, WI | 457,329 | $53,318 |
| Lock-Up Self Storage Facility | 221 American Boulevard West, Bloomington, MN | 232,507 | $97,793 |
This is not a research report and was not prepared by any Underwriter’s research department. Please see additional important information and qualifications at the end of this Term Sheet.
| T-105 |
| BANK 2017-BNK5 | iStar Leased Fee Portfolio |
Underwritten Net Operating Income.The following table presents certain information relating to the Underwritten Net Operating Income at the iStar Leased Fee Portfolio Properties:
| Property Name | UW Base Rent(1) | Overage Rent(2) | UW NOI | % of UW NOI | UW NOI DSCR | “Look Through” Fee Simple UW NOI | “Look Through” Fee Simple UW NOI DSCR | |
| Hilton Salt Lake | $2,687,691 | $613,015 | $3,300,706 | 17.8% | 1.55x | $9,778,443 | 4.59x | |
| DoubleTree Seattle Airport | $4,503,580 | $870,700 | $5,374,280 | 29.0% | 3.49x | $14,682,914 | 9.54x | |
| DoubleTree Mission Valley | $1,122,198 | $653,836 | $1,776,034 | 9.6% | 1.21x | $7,804,702 | 5.33x | |
| One Ally Center | $3,353,970 | $0 | $3,353,970 | 18.1% | 2.73x | $13,920,739 | 11.32x | |
| DoubleTree Sonoma | $733,106 | $424,764 | $1,157,870 | 6.3% | 1.56x | $4,153,633 | 5.59x | |
| DoubleTree Durango | $860,668 | $294,846 | $1,155,514 | 6.2% | 1.81x | $3,379,284 | 5.29x | |
| Northside Forsyth Hospital Medical Center | $654,595 | $0 | $654,595 | 3.5% | 2.25x | $901,501 | 3.09x | |
| NASA/JPSS Headquarters | $472,292 | $0 | $472,292 | 2.6% | 2.37x | $1,221,724 | 6.12x | |
| Dallas Market Center: Sheraton Suites | $524,334 | $0 | $524,334 | 2.8% | 3.28x | $2,438,398 | 15.27x | |
| Dallas Market Center: Marriott Courtyard | $125,000 | $172,000 | $297,000 | 1.6% | 2.07x | $2,254,686 | 15.68x | |
| The Buckler Apartments | $312,186 | $0 | $312,186 | 1.7% | 2.23x | $2,103,422 | 15.05x | |
| Lock-Up Self Storage Facility | $132,615 | $0 | $132,615 | 0.7% | 2.37x | $754,685 | 13.51x | |
| Total | $15,482,235 | $3,029,161 | $18,511,396 | 100.0% | 2.12x | $63,394,131 | 7.26x | |
| (1) | UW Base Rent is inclusive of approximately $1,256,456 of straight-line rent representing the present value of contractual rent increases through the term of each respective ground lease based on a 6.0% discount rate. |
| (2) | Overage Rent is based on 7.5% of gross sales over a breakpoint of $32,979,294 for DoubleTree Seattle Airport, $20,688,611 for Hilton Salt Lake, $12,392,794 for DoubleTree Mission Valley, $9,293,520 for DoubleTree Sonoma and $6,037,795 for DoubleTree Durango. Overage Rent for Dallas Market Center: Marriott Courtyard is calculated as 5.0% of gross room sales in excess of $125,000. |
Escrows and Reserves. During the continuance of a Trigger Period (as defined below) (and to the extent that a Borrower Reserve Period (as defined below) caused by a Tax Reserve Trigger Event (as defined below) or a Ground Lease Termination Event (as defined below), is continuing) the iStar Leased Fee Portfolio Borrowers are required to escrow monthly 1/12th of the annual estimated tax payments with respect to each individual property for which a Borrower Reserve Period caused by a Tax Reserve Trigger Event or a Ground Lease Termination Event is continuing.
During the continuance of a Trigger Period (and to the extent that a Borrower Reserve Period caused by an Insurance Reserve Trigger Event (as defined below) or a Ground Lease Termination Event is continuing), the iStar Leased Fee Portfolio Borrowers are required to escrow monthly 1/12th of the annual estimated insurance premiums (unless the iStar Leased Fee Portfolio Borrowers maintain an acceptable blanket policy) with respect to each individual property for which a Borrower Reserve Period caused by an Insurance Reserve Trigger Event or a Ground Lease Termination Event is continuing.
During the continuance of a Trigger Period (and to the extent that a Borrower Reserve Period caused by a Ground Rent Reserve Trigger Event or a Ground Lease Termination Event is continuing), the iStar Leased Fee Portfolio Borrowers are required to escrow monthly 1/12th of the amount that would be sufficient to pay the ground rent payable during the next 12 months with respect to each individual property for which a Borrower Reserve Period caused by a Ground Rent Reserve Trigger Event or a Ground Lease Termination Event is continuing.
A “Trigger Period” will commence upon the earlier of (i) the occurrence and continuance of an event of default under the iStar Leased Fee Portfolio Whole Loan; (ii) the debt service coverage ratio for the immediately preceding four calendar quarters being less than 1.50x for two consecutive calendar quarters (a “DSCR Trigger Event”); (iii) the monthly payment date in October 2025 (unless on or prior to such date, cash or a letter of credit has been delivered to the lender in an amount equal to $12,000,000 to be held as additional collateral for the iStar Leased Fee Portfolio Whole Loan (the “Loan Term Cash Collateral”)); and (iv) the iStar Leased Fee Portfolio Borrowers’ failure to repay the iStar Leased Fee Portfolio Whole Loan before the ARD. A Trigger Period will expire, with regard to clause (i), upon the cure of such event of default; with regard to clause (ii), upon the earlier of (a) the debt service coverage ratio for the immediately preceding four calendar quarters being equal to or greater than 1.55x for two consecutive calendar quarters or (b) the date that the iStar Leased Fee Portfolio Borrowers have deposited cash or a letter of credit to lender in an amount equal to the amount that, if applied to the reduction of the outstanding principal balance of the iStar Leased Fee Portfolio Whole Loan, would result in a debt service coverage ratio for the immediately preceding four calendar quarters equal to or greater than 1.55x; and with regard to clause (iii) the delivery of the Loan Term Cash Collateral.
A “Borrower Reserve Period” will commence upon the earlier of (i) the date that, as to any of the iStar Leased Fee Portfolio Properties, the applicable ground lease is no longer in effect or the title to or possession of all or any of the leasehold or subleasehold, as applicable, interest has been returned to the iStar Leased Fee Portfolio Borrowers (a “Ground Lease Termination Event”); and (ii) the date on which the tenant under the applicable ground lease at any of the iStar Leased Fee Portfolio Properties shall have failed to pay (a) all taxes and other charges under such lease when the same are due and payable (a “Tax Reserve Trigger Event”), (b) all insurance premiums under such lease when the same are due and payable (an “Insurance Reserve Trigger Event”) or (c) all ground rent under such lease when the same are due and payable (a “Ground Rent Reserve Trigger Event”). A Borrower Reserve Period will expire upon the iStar Leased Fee Portfolio Borrowers entering into an approved replacement triple net leased fee lease with respect to such property which caused a Ground Lease Termination Event, a Tax Reserve Trigger Event, an Insurance Reserve Trigger Event or a Ground Rent Reserve Trigger Event.
Lockbox and Cash Management. A hard lockbox is in place with respect to the iStar Leased Fee Portfolio Whole Loan with springing cash management upon the occurrence of a Trigger Period. Upon the occurrence of a Trigger Period, the iStar Leased Fee Portfolio Borrowers are required to establish and maintain a cash management account controlled by the lender, and, during the continuance of a Trigger Period, funds in the lockbox account are required to be transferred on each business day to the cash management account to be applied on each monthly payment date to pay debt
This is not a research report and was not prepared by any Underwriter’s research department. Please see additional important information and qualifications at the end of this Term Sheet.
| T-106 |
| BANK 2017-BNK5 | iStar Leased Fee Portfolio |
service on the iStar Leased Fee Portfolio Whole Loan, to fund the required reserve deposits, to disburse the monthly operating expenses and capital expenditures referenced in the annual budget, to disburse extraordinary operating expenses or capital expenses approved by the lender, and to disburse the remainder into an excess cash flow account to be held as additional collateral for the iStar Leased Fee Portfolio Whole Loan. If no Trigger Period is continuing, funds in the lockbox account are disbursed to the iStar Leased Fee Portfolio Borrower. Provided no event of default has occurred and is continuing, on each monthly payment date occurring after the ARD, all funds in the excess cash flow account are required to be applied first to reduce the outstanding principal balance of the iStar Leased Fee Portfolio Whole Loan with any remaining amounts to be applied toward the accrued interest. Provided no event of default has occurred and is continuing, any excess cash flow funds remaining in the excess cash flow account will be disbursed to the iStar Leased Fee Portfolio Borrowers upon the expiration of any Trigger Period.
Additional Secured Indebtedness (not including trade debts). The iStar Leased Fee Portfolio Properties also secure the iStar Leased Fee Portfolio Non-ServicedPari Passu Companion Loans, with an aggregate cut-off date balance of $181,600,000. The promissory notes evidencing the iStar Leased Fee Portfolio Non-ServicedPari Passu Companion Loans accrue interest at the same rate as the iStar Leased Fee Portfolio Mortgage Loan. The iStar Leased Fee Portfolio Mortgage Loan is entitled to payments of principal and interest on apro rata andpari passu basis with the iStar Leased Fee Portfolio Non-ServicedPari Passu Companion Loans. The holders of the iStar Leased Fee Portfolio Mortgage Loan and the iStar Leased Fee Portfolio Non-ServicedPari Passu Companion Loans have entered into a co-lender agreement that sets forth the allocation of collections on the iStar Leased Fee Portfolio Whole Loan. See“Description of the Mortgage Pool—The Whole Loans—The Non-Serviced Pari Passu Whole Loans” in the Preliminary Prospectus.
Mezzanine Loan and Preferred Equity. Not permitted.
Release of Property.Following the lockout period and prior to April 6, 2027, the iStar Leased Fee Portfolio Borrowers are permitted to obtain the release of any iStar Leased Fee Portfolio individual property in connection with a partial release with the payment of the sum of 120% of the allocated loan amount with respect to such individual property (the “Release Price”) and the yield maintenance premium (a “Prepayment Partial Release”), subject to certain conditions, including (i) no event of default has occurred and is continuing (unless such event of default relates solely to the individual property being released); (ii) the loan-to-value with respect to the remaining iStar Leased Fee Portfolio Properties will be no greater than the lesser of 65.6% or the loan-to-value ratio immediately prior to the release (but in no event, less than 63.0%); (iii) the amortizing debt service coverage ratio with respect to the remaining iStar Leased Fee Portfolio Properties will be no less than the greater of 2.41x and the debt service coverage ratio immediately prior to the release (but in no event, greater than 2.43x); (iv) the debt yield (as calculated under the iStar Leased Fee Portfolio Whole Loan documents) with respect to the remaining properties will be no less than the greater of 9.2% and the debt yield immediately prior to the release (but in no event, greater than 9.35%), (v) if required by lender, the lender receives rating agency confirmation from each rating agency rating the BANK 2017-BNK5 Certificates and (vi) satisfaction of REMIC requirements (collectively, the “Release Conditions”). Additionally, provided that the iStar Leased Fee Portfolio Borrowers have not previously obtained a Prepayment Partial Release, following the lockout period and prior to December 6, 2026, the iStar Leased Fee Portfolio Borrowers are permitted to partially defease the iStar Leased Fee Portfolio Whole Loan by delivering defeasance collateral equal to the Release Price and satisfying the Release Conditions.
At any time prior to the ARD and provided no event of default has occurred and is continuing and the Northside Forsyth Hospital Medical Center leased fee lease is still in effect, the iStar Leased Fee Portfolio Borrowers may obtain the partial release of an undeveloped portion of the Northside Forsyth Hospital Medical Center defined in the related lease (the “Forsyth Partial Release Property”), without prepayment or defeasance, upon the satisfaction of the following conditions: (i) the Forsyth Partial Release Property is conveyed to a person other than the iStar Leased Fee Portfolio Borrowers, (ii) the iStar Leased Fee Portfolio Borrowers provide 20 days prior written notice of the proposed release, (iii) a separate tax identification number has been issued (or applied for) with respect to the Forsyth Partial Release Property, (iv) satisfaction of REMIC requirements, (v) a rating agency confirmation if reasonably required by the lender (provided rating agency confirmation will not be required if the tenant of the Forsyth Partial Release Property, following the conveyance, has agreed that it will not solicit subtenants of the Northside Forsyth Hospital Medical Center property to relocate to the Forsyth Partial Release Property and, in connection with such relocation, terminate their subleases or refuse to extend to renew such sublease), and (vi) satisfaction of any other requirements set forth in the iStar Leased Fee Portfolio Whole Loan documents.
Terrorism Insurance.The iStar Leased Fee Portfolio Borrowers are required to obtain insurance against acts of terrorism or other similar acts or events to the extent such insurance is available in form and substance reasonably satisfactory to the lender in an amount equal to 100.0% of the full replacement cost subject to a loss limit of $150,000,000 per occurrence.
With respect to One Ally Center, Northside Forsyth Hospital Medical Center, NASA/JPSS Headquarters, Dallas Market Center: Sheraton Suites, Dallas Market Center: Marriott Courtyard, Buckler Apartments and Lock-Up Self-Storage Facility, the iStar Leased Fee Portfolio Borrowers’ obligation to maintain the insurance coverage with respect to such properties shall be suspended for so long as (i) no ground lease termination period as defined in the iStar Leased Fee Portfolio Whole Loan documents has occurred and is continuing with respect to such property and (ii) the iStar Leased Fee Portfolio Borrowers will cause the tenants at each such properties to maintain the insurance required by the ground lease. See“Risk Factors-Terrorism Insurance May Not Be Available for All Mortgaged Properties” in the Preliminary Prospectus.
This is not a research report and was not prepared by any Underwriter’s research department. Please see additional important information and qualifications at the end of this Term Sheet.
| T-107 |
| BANK 2017-BNK5 | Gateway Net Lease Portfolio |
Mortgage Loan No. 9 – Gateway Net Lease Portfolio
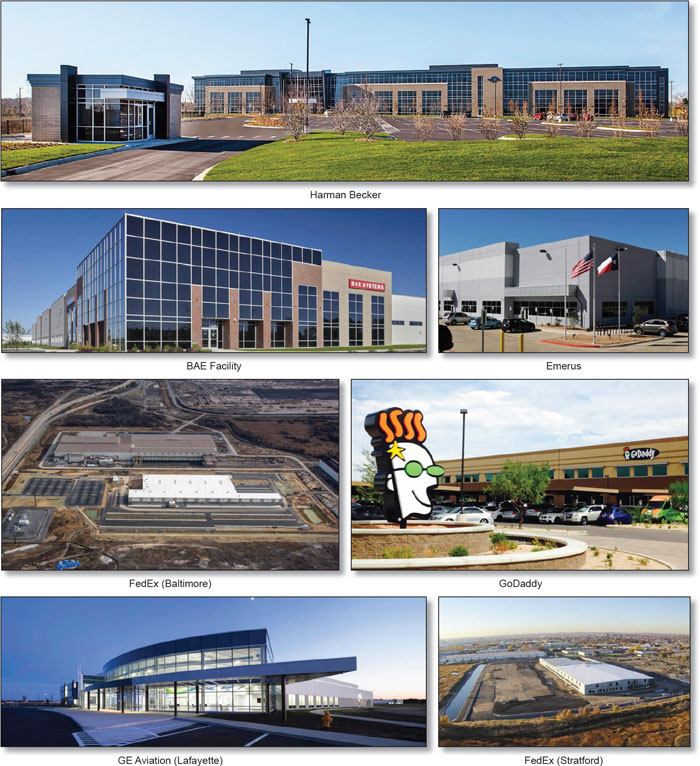
This is not a research report and was not prepared by any Underwriter’s research department. Please see additional important information and qualifications at the end of this Term Sheet.
| T-108 |
| BANK 2017-BNK5 | Gateway Net Lease Portfolio |
Mortgage Loan No. 9 – Gateway Net Lease Portfolio
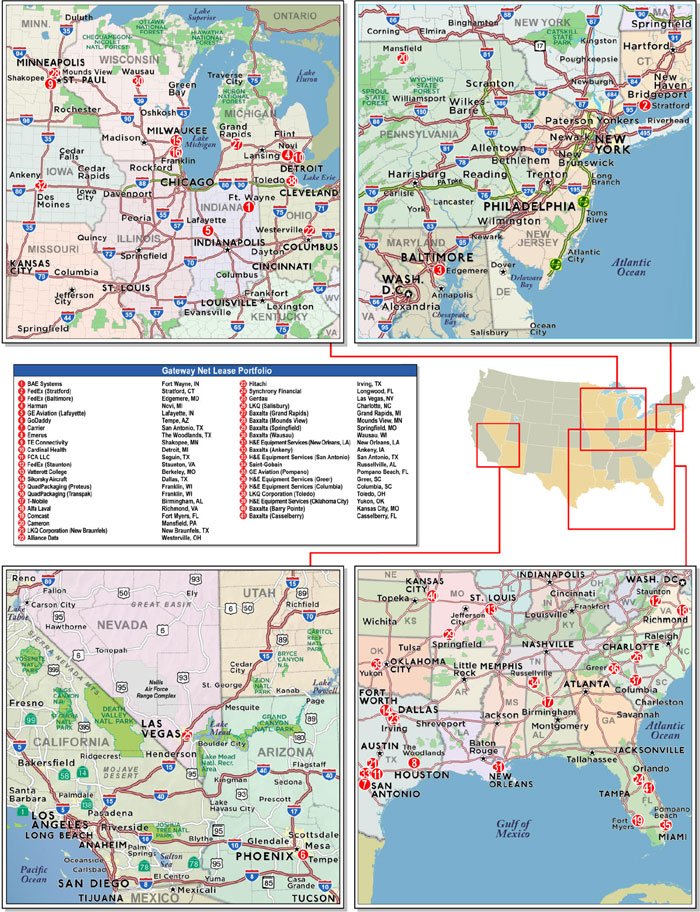
This is not a research report and was not prepared by any Underwriter’s research department. Please see additional important information and qualifications at the end of this Term Sheet.
| T-109 |
| BANK 2017-BNK5 | Gateway Net Lease Portfolio |
| Mortgage Loan No. 9 – Gateway Net Lease Portfolio |
| Mortgage Loan Information | Property Information | ||||||
| Credit Assessment (DBRS/Fitch/Moody’s): | BBB(high)/NR/NR | ||||||
| Mortgage Loan Seller: | BANA | Single Asset/Portfolio: | Portfolio | ||||
| Original Balance(1): | $45,000,000 | Location: | Various | ||||
| Cut-off Date Balance(1): | $45,000,000 | General Property Type: | Various | ||||
| % of Initial Pool Balance: | 3.7% | Detailed Property Type: | Various | ||||
| Loan Purpose: | Acquisition | Title Vesting(5): | Fee / Leasehold | ||||
| Sponsor: | ETCL Venture LP | Year Built/Renovated: | Various/Various | ||||
| Mortgage Rate: | 3.56283% | Size(6): | 5,296,943 SF | ||||
| Note Date: | 5/19/2017 | Cut-off Date Balance PSF(1): | $67 | ||||
| First Payment Date: | 7/5/2017 | Maturity Date Balance PSF(1): | $67 | ||||
| Property Manager(7): | Various | ||||||
| Maturity Date: | 6/5/2024 | ||||||
| Original Term: | 84 months | ||||||
| Original Amortization Term: | 0 months | Underwriting and Financial Information | |||||
| IO Period: | 84 months | UW NOI(8): | $49,772,586 | ||||
| Seasoning: | 0 months | UW NOI Debt Yield(1): | 14.1% | ||||
| Prepayment Provisions(2): | LO (24); DEF (56); O (4) | UW NOI Debt Yield at Maturity(1): | 14.1% | ||||
| Lockbox/Cash Mgmt Status: | Hard/Springing | UW NCF DSCR(1): | 3.54x | ||||
| Additional Debt Type(3): | Pari Passu/Subordinate Debt | Most Recent NOI(8): | N/A | ||||
| Additional Debt Balance(3): | $308,000,000/$170,000,000 | 2nd Most Recent NOI(9): | N/A | ||||
| Future Debt Permitted (Type): | No (N/A) | 3rd Most Recent NOI(9): | N/A | ||||
| Reserves(4) | Most Recent Occupancy(6): | 100.0% (6/1/2017) | |||||
| Type | Initial | Monthly | Cap | 2nd Most Recent Occupancy(9): | N/A | ||
| RE Tax: | $0 | Springing | N/A | 3rd Most Recent Occupancy(9): | N/A | ||
| Insurance: | $0 | Springing | N/A | Appraised Value (as of)(10): | $785,215,000 (Various) | ||
| Recurring Replacements: | $0 | Springing | N/A | Cut-off Date LTV Ratio(1): | 45.0% | ||
| TI/LC: | $0 | Springing | N/A | Maturity Date LTV Ratio(1): | 45.0% | ||
| Other: | $10,720,000 | Springing | N/A | ||||
| Sources and Uses | ||||||
| Sources | Proceeds | % of Total | Uses | Proceeds | % of Total | |
| Loan Amount(1): | $523,000,000 | 53.0% | Purchase Price: | $818,097,509 | 98.6% | |
| Borrower Sponsor Equity: | $307,050,139 | 37.0% | Closing Costs: | $1,232,630 | 0.1% | |
| Reserves: | $10,720,000 | 1.3% | ||||
| Total Sources: | $830,050,139 | 100.0% | Total Uses: | $830,050,139 | 100.0% | |
| (1) | The Gateway Net Lease Portfolio Mortgage Loan is part of the Gateway Net Lease Portfolio Whole Loan, which is comprised of seven senior promissory notes with an aggregate principal balance of $353,000,000, that arepari passu with each other (the “Gateway Net Lease Portfolio Senior Loan”) and ten subordinatepari passu promissory notes with an aggregate principal balance of $170,000,000, that are subordinate to the Gateway Net Lease Portfolio Senior Loan andpari passu with each other. The Cut-off Date Balance PSF, Maturity Date Balance PSF, UW NOI Debt Yield, UW NOI Debt Yield at Maturity, UW NCF DSCR, Cut-off Date LTV Ratio and Maturity Date LTV Ratio numbers presented above are based on the aggregate principal balance of the promissory notes comprising the Gateway Net Lease Portfolio Senior Loan. The Cut-off Date Balance PSF, Maturity Date Balance PSF, UW NOI Debt Yield, UW NOI Debt Yield at Maturity, UW NCF DSCR, Cut-off Date LTV Ratio and Maturity Date LTV Ratio numbers based on the Gateway Net Lease Portfolio Whole Loan are $99, $99, 9.5%, 9.5%, 2.04x, 66.6% and 66.6%, respectively. |
| (2) | Defeasance is permitted at any time after the earlier to occur of (i) the end of the two-year period commencing on the closing date of the securitization of the last Gateway Net Lease Portfolio Whole Loan promissory note to be securitized and (ii) May 19, 2020. The assumed lockout period of 24 payments is based on the closing date of this transaction in June 2017. After June 5, 2019, the Gateway Net Lease Portfolio Borrowers are permitted to obtain the release of any individual property with the payment of a release price equal to 110.0% of the allocated loan amount with respect to such individual property (including a payment of the yield maintenance premium, if applicable). See “Release of Property” below. |
| (3) | See “The Mortgage Loan” and “Additional Secured Indebtedness (not including trade debts)” for a discussion of additional debt. |
| (4) | See “Escrows and Reserves” below for further discussion of reserve requirements. |
| (5) | The FedEx (Baltimore), GoDaddy, Sikorsky Aircraft R&D Facility and Hitachi properties are secured by a leasehold interest. See “Ground Leases” below. |
| (6) | Size and Most Recent Occupancy include Baxalta (Barry Pointe) (16,686 SF) and Baxalta (Casselberry) (16,694 SF), which are currently under construction and will be added to the collateral upon distribution of the Earnout Reserve (see “Escrows and Reserves”), provided that certain conditions for such distribution and addition of collateral are satisfied. |
| (7) | The Property Managers are Elm Tree Funds, LLC (borrower-related), SW Management & Realty, LLC, Ryan Companies US, Inc. and Northern Equities Management Company, |
| (8) | Most Recent NOI represents the in-place NOI based on in-place leases including Baxalta (Barry Pointe) (16,686 SF) and Baxalta (Casselberry) (16,694 SF), which are currently under construction and will be added to the collateral upon distribution of the Earnout Reserve (see “Escrows and Reserves”), provided that certain conditions for such distribution and addition of collateral are satisfied. |
| (9) | The Gateway Net Lease Portfolio consists of 41 single tenant properties, many of which are recently constructed build-to-suit projects, each leased on a triple net basis. Historical financials and historical occupancy are unavailable. |
| (10) | The Appraised Value represents the aggregate “As Is” values for each of the properties except with respect to Baxalta (Barry Pointe) and Baxalta (Casselberry), which are currently under construction and will be added to the collateral upon distribution of the Earnout Reserve (see “Escrows and Reserves”), provided that certain conditions for such distribution and addition of collateral are satisfied, for which the “As Stabilized” and “As Complete” values, respectively, were used. The “As Stabilized” and “As Complete” values assume each property is 100.0% leased upon completion of the construction. According to the borrower sponsor, both Baxalta (Barry Pointe) and Baxalta (Casselberry) are expected to open in the fourth quarter of 2017. Both the Cut-off Date LTV Ratio and Maturity Date LTV Ratio, based on the $769.115 million “As is” value, which excludes Baxalta (Barry Pointe) and Baxalta (Casselberry), are 45.9%. |
This is not a research report and was not prepared by any Underwriter’s research department. Please see additional important information and qualifications at the end of this Term Sheet.
| T-110 |
| BANK 2017-BNK5 | Gateway Net Lease Portfolio |
The Mortgage Loan. The ninth largest mortgage loan (the “Gateway Net Lease Portfolio Mortgage Loan”) is part of a whole loan (the “Gateway Net Lease Portfolio Whole Loan”) evidenced by seven senior promissory notes in the aggregate original principal amount of $353,000,000, that arepari passu with each other (the “Gateway Net Lease Portfolio Senior Loan”) and ten subordinate promissory notes in the aggregate original principal amount of $170,000,000, that are subordinate to the Gateway Net Lease Portfolio Senior Loan andpari passuwith each other (the “Gateway Net Lease Portfolio Subordinate Loan”). The Gateway Net Lease Portfolio Whole Loan is secured by the fee simple and leasehold interests in a portfolio of 41 single tenant industrial and office properties located across 20 states, totaling 5,296,943 SF (the “Gateway Net Lease Portfolio Properties”). The Gateway Net Lease Portfolio Whole Loan was co-originated by Bank of America, N.A. and JP Morgan Chase Bank, N.A. Promissory Note A-2-1, in the original principal amount of $45,000,000, represents the Gateway Net Lease Portfolio Mortgage Loan, and will be included in the BANK 2017-BNK5 securitization trust. Promissory Notes A-1-1, A-1-2, A-1-3, A-1-4, A-2-2 and A-2-3, in the aggregate original principal amount of $308,000,000, collectively represent thepari passu companion loans (the “Gateway Net Lease PortfolioPari Passu Companion Loans”).
The following table presents a summary of the promissory notes comprising the Gateway Net Lease Portfolio Whole Loan. The Gateway Net Lease Portfolio Whole Loan will be serviced pursuant to the pooling and servicing agreement for the DBJPM 2017-C6 transaction. See “Description of the Mortgage Pool—The Whole Loans—The Gateway Net Lease Portfolio Pari Passu A/B Whole Loan” and “Pooling and Servicing Agreement-Servicing of the Non-Serviced Mortgage Loans” in the Preliminary Prospectus.
| Gateway Net Lease Portfolio Whole Loan Summary | ||||
| Note | Original Balance | Cut-off Date Balance | Note Holder(1) | Controlling Piece |
| A-1-1 | $85,000,000 | $85,000,000 | DBJPM 2017-C6 | No(2) |
| A-1-2 | 85,000,000 | 85,000,000 | JP Morgan Chase Bank, N.A. | No |
| A-1-3 | 50,000,000 | 50,000,000 | JP Morgan Chase Bank, N.A. | No |
| A-1-4 | 27,100,000 | 27,100,000 | JP Morgan Chase Bank, N.A. | No |
| A-2-1 | 45,000,000 | 45,000,000 | BANK 2017-BNK5 | No |
| A-2-2 | 45,000,000 | 45,000,000 | Bank of America, N.A. | No |
| A-2-3 | 15,900,000 | 15,900,000 | Bank of America, N.A. | No |
| Gateway Net Lease Portfolio Subordinate Loan | 170,000,000 | 170,000,000 | Apollo(3) | Yes(2) |
| Total Gateway Net Lease Portfolio Whole Loan | $523,000,000 | $523,000,000 | ||
| (1) | The promissory notes (other than Note A-1-1 and Note A-2-1 and the Gateway Net Lease Portfolio Subordinate Loan) are expected to be contributed to future securitization transactions or may be otherwise transferred at any time. |
| (2) | The initial controlling noteholder for the Gateway Net Lease Portfolio Whole Loan is the holder of the Gateway Net Lease Portfolio Subordinate Loan evidenced in part by promissory note B-1-1. If the outstanding principal amount of the Gateway Net Lease Portfolio Subordinate Loan, as reduced by any appraisal reduction amounts or realized losses allocated to such Gateway Net Lease Portfolio Subordinate Loan, is less than 25% of the initial principal amount of such Gateway Net Lease Portfolio Subordinate Loan, the controlling noteholder will be the controlling class representative of the securitization to which Note A-1-1 is contributed. At all other times, the controlling noteholder for the Gateway Net Lease Portfolio Whole Loan will be the holder of the Gateway Net Lease Portfolio Subordinate Loan evidenced in part by promissory note B-1-1. |
| (3) | The Gateway Net Lease Portfolio Subordinate Loan is held by Athene Annuity and Life Company, Athene Annuity & Life Assurance Company, American Equity Investment Life Insurance Company, Midland National Life Insurance Company and American Equity Investment Life Insurance Company, affiliates of Apollo. |
Proceeds from the Gateway Net Lease Portfolio Whole Loan, along with approximately $307.1 million of equity from the sponsor, were used to acquire the Gateway Net Lease Portfolio Properties for a purchase price of approximately $818.1 million, fund an upfront reserve of $10.72 million in connection with two individual properties under construction, and pay closing costs of approximately $1.2 million.
The Borrowers and the Sponsor. The borrowers consist of 40 single-purpose Delaware limited liability companies, each structured to be bankruptcy-remote with at least two independent directors (the “Gateway Net Lease Portfolio Borrowers”). Upon distribution of the Earnout Reserve (see “Escrows and Reserves”), ETCL Barry Pointe Plasma, LLC and ETCL Casselberry Plasma, LLC (individually and jointly the “Construction Borrower”) are required to deliver a joinder agreement, which will provide that the Construction Borrower is added to and bound by the Gateway Net Lease Portfolio Whole Loan documents.
The sponsor, ETCL Venture LP, is a joint venture between China Life Insurance (Overseas) Company Limited (“China Life”) (94.6%) and ET II-CL 2016, LLC and ElmTree Managing Member II, LLC (collectively, “ElmTree”) (5.4%). At origination, China Life purchased 94.6% of ElmTree’s stake in the portfolio. There is no nonrecourse carve-out guarantor for the Gateway Net Lease Portfolio Whole Loan and the borrowers are the sole parties liable for any breach or violation of the nonrecourse carve-out provisions in the Gateway Net Lease Portfolio Whole Loan documents or the related environmental indemnity. Headquartered in Beijing, China, China Life and its subsidiaries comprise the largest commercial insurance group in mainland China with over 130,000 employees and approximately $361.6 billion in assets under management as of June 20, 2016. As of May 24, 2017, China Life had a market capitalization of approximately $111.6 billion and is the first insurance company to be triple-listed on the New York, Hong Kong and Shanghai exchanges. ElmTree is a real estate investment firm focusing primarily on commercial real estate net lease, sale-leaseback and build-to-suit opportunities and has completed in excess of $4.0 billion in commercial real estate transactions.
The Properties. The Gateway Net Lease Portfolio Properties are comprised of 41 single tenant industrial and office properties totaling approximately 5.3 million SF (inclusive of two properties currently under construction and expected to open in the fourth quarter of 2017, Baxalta (Barry Pointe) and Baxalta (Casselberry), which will be added to the collateral upon distribution of the allocated loan proceeds that were withheld at closing in the Earnout Reserve (see “Escrows and Reserves”), provided that certain conditions for such distribution of the Earnout Reserve and addition of collateral are satisfied. The Gateway Net Lease Portfolio Properties are located across 20 states, with the largest concentration of properties in Texas (23.8% of NRA), Indiana (12.1% of NRA) and Michigan (9.1% of NRA). The properties were built between 1960 and 2017 and 24 of the properties (58.3% of NRA) were built-to-suit for the respective tenants (including the two properties currently under construction). According to the borrower sponsor, approximately $249.9 million has been spent at the build-to-suit properties in addition to the landlord provided tenant improvements. The Gateway Net Lease Portfolio Properties are all leased on a triple net basis and range in size from approximately 16,686 SF to 517,000 SF. The weighted average remaining lease term for the portfolio is approximately 9.1 years. The Gateway Net Lease Portfolio Properties consist of 25 industrial properties (approximately 81.0% of NRA), nine suburban office properties (16.8% of NRA) and seven medical office properties (2.2% of NRA). The Gateway Net Lease Portfolio Properties are 100.0% leased to 26 individual tenants.
This is not a research report and was not prepared by any Underwriter’s research department. Please see additional important information and qualifications at the end of this Term Sheet.
| T-111 |
| BANK 2017-BNK5 | Gateway Net Lease Portfolio |
The following table presents detailed information with respect to each of the Gateway Net Lease Portfolio Properties.
| Gateway Net Lease Portfolio Properties Summary | |||||||
| Property Name | Location | SF | Year Built / Renovated | Allocated Loan Amount | % of Allocated | Appraised Value | % of Appraised Value |
| BAE Facility | Fort Wayne, IN | 333,750 | 2015 / NAP | $29,400,918 | 8.3% | $65,400,000 | 8.3% |
| FedEx Ground (Stratford) | Stratford, CT | 225,198 | 2016 / NAP | $28,320,994 | 8.0% | $63,000,000 | 8.0% |
| FedEx (Baltimore) | Edgemere, MD | 306,016 | 2016 / NAP | $26,073,403 | 7.4% | $58,000,000 | 7.4% |
| Harman Becker | Novi, MI | 188,042 | 2015 / NAP | $20,768,279 | 5.9% | $46,200,000 | 5.9% |
| GE Aviation (Lafayette) | Lafayette, IN | 306,406 | 2015 / NAP | $19,782,849 | 5.6% | $44,000,000 | 5.6% |
| GoDaddy | Tempe, AZ | 150,000 | 2014 / NAP | $17,535,258 | 5.0% | $39,000,000 | 5.0% |
| Carrier | San Antonio, TX | 517,000 | 2014 / NAP | $17,305,774 | 4.9% | $38,500,000 | 4.9% |
| Emerus | The Woodlands, TX | 95,640 | 2000 / NAP | $14,072,753 | 4.0% | $31,300,000 | 4.0% |
| Cardinal Health(1) | Detroit, MI | 275,951 | 2015 / NAP | $13,688,031 | 3.9% | $30,450,000 | 3.9% |
| Tyco Electronics | Shakopee, MN | 176,648 | 2014 / NAP | $13,553,040 | 3.8% | $30,150,000 | 3.8% |
| FCA/Caterpillar | Seguin, TX | 300,000 | 2012 / NAP | $12,770,096 | 3.6% | $28,400,000 | 3.6% |
| FedEx Ground (Staunton) | Staunton, VA | 225,198 | 2016 / NAP | $10,745,239 | 3.0% | $23,900,000 | 3.0% |
| Quad Packaging (Proteus)(2) | Franklin, WI | 205,000 | 2006 / NAP | $8,990,363 | 2.5% | $20,000,000 | 2.5% |
| Quad Packaging (Transpak) | Franklin, WI | 218,000 | 2006 / NAP | $8,902,620 | 2.5% | $19,800,000 | 2.5% |
| T-Mobile Call Center | Birmingham, AL | 66,500 | 1996 / 2014 | $8,308,662 | 2.4% | $18,475,000 | 2.4% |
| Sikorsky Aircraft R&D Facility(3) | Dallas, TX | 150,975 | 2008 / NAP | $8,045,430 | 2.3% | $17,900,000 | 2.3% |
| Vatterott College | Berkeley, MO | 90,000 | 2007 / NAP | $7,464,971 | 2.1% | $16,600,000 | 2.1% |
| Comcast | Fort Myers, FL | 57,260 | 2008 / NAP | $6,695,526 | 1.9% | $14,900,000 | 1.9% |
| Alfa Laval Plant | Richmond, VA | 180,252 | 1990 / 2005 | $6,108,317 | 1.7% | $13,600,000 | 1.7% |
| LKQ (New Braunfels) | New Braunfels, TX | 98,771 | 2016 / NAP | $6,027,323 | 1.7% | $13,400,000 | 1.7% |
| Hitachi | Irving, TX | 72,056 | 2000 / 2012 | $5,757,342 | 1.6% | $12,800,000 | 1.6% |
| Cameron International | Mansfield, PA | 75,000 | 2013 / NAP | $5,473,862 | 1.6% | $12,175,000 | 1.6% |
| Alliance Data Systems Office | Westerville, OH | 100,800 | 1990 / 2005 | $5,190,382 | 1.5% | $11,550,000 | 1.5% |
| Synchrony Financial | Longwood, FL | 67,775 | 1983 / NAP | $4,832,658 | 1.4% | $10,750,000 | 1.4% |
| Baxalta (Barry Pointe)(4) | Kansas City, MO | 16,686 | 2017 / NAP | $3,705,488 | 1.0% | $8,250,000 | 1.1% |
| Baxalta (Casselberry)(4) | Casselberry, FL | 16,694 | 2017 / NAP | $3,530,000 | 1.0% | $7,850,000 | 1.0% |
| Baxalta (Mounds View) | Mounds View, MN | 16,694 | 2015 / NAP | $3,334,264 | 0.9% | $7,420,000 | 0.9% |
| Baxalta (Grand Rapids) | Grand Rapids, MI | 16,694 | 2014 / NAP | $3,327,514 | 0.9% | $7,400,000 | 0.9% |
| Gerdau | Las Vegas, NV | 46,976 | 1986 / 2015 | $3,327,514 | 0.9% | $7,400,000 | 0.9% |
| Baxalta (Wausau) | Wausau, WI | 16,694 | 2015 / NAP | $3,239,771 | 0.9% | $7,200,000 | 0.9% |
| Baxalta (Springfield) | Springfield, MO | 16,694 | 2015 / NAP | $3,145,277 | 0.9% | $7,000,000 | 0.9% |
| LKQ (Salisbury) | Charlotte, NC | 205,100 | 1960 / 2005 | $3,145,277 | 0.9% | $7,000,000 | 0.9% |
| Baxalta (Ankeny) | Ankeny, IA | 16,694 | 2015 / NAP | $2,969,790 | 0.8% | $6,600,000 | 0.8% |
| H&E Equipment Services (San Antonio) | San Antonio, TX | 26,535 | 2015 / NAP | $2,605,315 | 0.7% | $5,800,000 | 0.7% |
| H&E Equipment Services (New Orleans) | New Orleans, LA | 18,808 | 2015 / NAP | $2,450,077 | 0.7% | $5,450,000 | 0.7% |
| GE Aviation (Pompano) | Pompano Beach, FL | 30,892 | 1985 / 2012 | $2,294,837 | 0.7% | $5,100,000 | 0.6% |
| Saint-Gobain Warehouse | Russellville, AL | 102,950 | 2009, 2014 / NAP | $2,065,354 | 0.6% | $4,600,000 | 0.6% |
| H&E Equipment Services (Columbia) | Columbia, SC | 19,380 | 2015 / NAP | $2,045,105 | 0.6% | $4,550,000 | 0.6% |
| H&E Equipment Services (Yukon) | Yukon, OK | 19,608 | 2015 / NAP | $2,018,107 | 0.6% | $4,490,000 | 0.6% |
| LKQ (Toledo) | Toledo, OH | 207,998 | 1975, 2012 / 2013 | $2,011,358 | 0.6% | $4,475,000 | 0.6% |
| H&E Equipment Services (Greer) | Greer, SC | 19,608 | 2015 / NAP | $1,970,860 | 0.6% | $4,380,000 | 0.6% |
| Total | 5,296,943 | $353,000,000 | 100.0% | $785,215,000 | 100.0% | ||
| (1) | Cardinal Health is currently planning to exercise its option to construct an additional 40,000-70,000 SF on the existing property. Upon completion, the Cardinal Health lease will be extended to 15 years. The tenant is estimated to spend $4.9 million on the construction which is expected to begin by the end of 2018. |
| (2) | Quad Packaging (Proteus) is currently planning to construct an additional 200,000 SF on the existing property. Upon completion, the Quad Packaging (Proteus) lease will be extended to 15 years. The tenant is estimated to spend $16.0 million on the construction which is expected begin by the end of 2017. |
| (3) | Sikorsky Aircraft R&D Facility is currently planning to construct an additional 30,000 SF on the existing property. Upon completion, the Sikorsky Aircraft R&D Facility lease will be extended to 10-12 years. The tenant is estimated to spend $3.0 million on the construction which is expected begin by mid-2018. |
| (4) | “As Stabilized” and “As Complete” values were used for Baxalta (Barry Pointe) and Baxalta (Casselberry), respectively. Both properties are expected to open in the fourth quarter of 2017 and will be added to the collateral upon distribution of the Earnout Reserve, provided that certain conditions for such distribution of the Earnout Reserve and addition of collateral are satisfied. See “Escrows and Reserves.” |
This is not a research report and was not prepared by any Underwriter’s research department. Please see additional important information and qualifications at the end of this Term Sheet.
| T-112 |
| BANK 2017-BNK5 | Gateway Net Lease Portfolio |
Major Properties (by allocated loan amount)
BAE Facility. The largest property by allocated loan amount is BAE Facility, a 333,750 SF manufacturing facility situated on approximately 39.2 acres and located in Fort Wayne, Indiana. BAE Facility was constructed in 2015 on a build-to-suit basis and consists of an approximately 86.5% manufacturing component and an approximately 13.5% office component. The manufacturing component of the property features 24-foot ceilings, two dock doors, LED lighting and air conditioning throughout approximately 93.6% of the area. The office component features a café, full commercial grade kitchen and an employee gym. The property contains 948 parking spaces (approximately 2.8 spaces per 1,000 SF.)
BAE Facility is currently 100.0% leased to BAE Systems Controls, Inc. (“BAE Systems”) on a triple net basis through August 2025 with four remaining five-year extension options. BAE Systems is a subsidiary of Bay Systems PLC, a British multinational defense, security and aerospace company headquartered in London, United Kingdom and traded publicly on the London Stock Exchange (LSE:BA). BAE Systems uses the property for electronics manufacturing for the commercial aviation and defense industries. BAE Systems accounts for approximately 6.3% and 8.6% of the net rentable area and underwritten base rent, respectively, of the Gateway Net Lease Portfolio Properties.
BAE Facility is located in Fort Wayne, Indiana and is approximately 6.6 miles southwest of the Fort Wayne central business district. Access is provided via Ardmore Avenue to the east and Airport Expressway to the south as well as Interstate 69 and Interstate 469, which are located approximately 5.0 miles east and 4.5 miles south, respectively of BAE Facility. BAE Facility is located in the Fort Wayne industrial market which according to a market report, as of year-end 2016 consisted of approximately 20.8 million SF with an overall vacancy rate of 4.7%. The average age of the industrial properties identified was approximately 44.4 years as compared to BAE Facility which was constructed in 2015. BAE Facility is one of 76 industrial facilities over 100,000 SF in the Fort Wayne industrial market. The appraisal identified six comparable single tenant industrial facilities ranging in size from 81,578 SF to 393,817 SF and constructed between 2000 and 2016. Base rents for the comparable triple-net leases ranged from $6.89 PSF to $13.73 PSF, with a weighted average of approximately $8.97 PSF, as compared to BAE Facility’s underwritten rent of $13.90 PSF. The appraisal did not identify any properties currently under construction that would compete with BAE Facility, however noted the large inventory of available development land in the subject neighborhood.
FedEx Ground (Stratford). The second largest property by allocated loan amount is FedEx Ground (Stratford), a 225,198 SF warehouse and distribution facility situated on approximately 28.2 acres in Stratford, Connecticut. FedEx Ground (Stratford) was constructed in 2016 on a build-to-suit basis and consists of an approximately 88.8% warehouse component and an approximately 11.2% office component. The distribution-warehouse component of the property features a clear height of approximately 26 feet, 61 loading docks and seven overhead drive-in steel doors, accommodates the turning radius of 18-wheel semi-trucks, and has additional areas for equipment trailer storage and truck parking. FedEx Ground (Stratford) contains 230 parking spaces (approximately 1.0 space per 1,000 SF).
FedEx Ground (Stratford) is currently 100.0% leased to FedEx Ground Package System, Inc. on a triple net basis through June 2026 with two remaining five-year extension options. FedEx Ground Package System, Inc. is a division of FedEx Corporation (“FedEx”). FedEx provides transportation, e-commerce and business services in the United States and internationally, serving more than 220 countries and territories with over 400,000 employees and 2016 fiscal year revenue of $50.4 billion. FedEx Ground Package System, Inc. provides small-package ground delivery in North America. FedEx Ground (Stratford) accounts for approximately 4.3% and 6.8% of the net rentable area and underwritten base rent, respectively, of the Gateway Net Lease Portfolio Properties.
FedEx Ground (Stratford) is located in Stratford, Connecticut within Fairfield County. Access is provided via Interstate 95 to the north and west, U.S. Route 1 and Route 130, which are approximately 2.9 and 2.3 miles north, respectively, and Route 113 approximately 1.6 miles east of FedEx Ground (Stratford). Interstate 95 provides access to New England to the east and north and New York to the west. FedEx Ground (Stratford) is less than five miles from the Metro North Stratford Center Rail station and the Bridgeport Transit Center, which provide train access to New York City (approximately 48.9 miles southwest) and to Stamford and New Haven, Connecticut. FedEx Ground (Stratford) is located in the Stratford industrial market which according to a market report consists of approximately 9.4 million SF of industrial space (207 buildings) with an overall vacancy rate of 19.2%. The appraisal identified six comparable triple net lease rentals at industrial facilities ranging in size from 50,000 SF to 362,474 SF and constructed between 1970 and 2016, concluding to a market rent of $16.00 PSF, as compared to FedEx Ground (Stratford)’s underwritten rent of $16.31 PSF. These comparable rentals were either located in Fairfield County or were similar leases to FedEx in the tri-state area. The appraisal did not identify any properties currently under construction that would compete with FedEx Ground (Stratford).
FedEx (Baltimore). The third largest property by allocated loan amount is FedEx (Baltimore), a 306,016 SF warehouse and distribution facility situated on approximately 47.4 acres and located in Edgemere, Maryland. FedEx (Baltimore) was constructed in 2016 and consists of an approximately 95.7% warehouse component and an approximately 4.3% office component. The distribution-warehouse component of the property features a clear height of approximately 32 feet and is a sorting facility that can accommodate up to 450 trucks on-site, with an additional service center which can accommodate five trucks. FedEx (Baltimore) contains 631 parking spaces (approximately 2.1 spaces per 1,000 SF).
FedEx (Baltimore) is currently 100.0% leased to FedEx Ground Package System, Inc. on a triple net basis through December 2031 with two remaining five-year extension options. FedEx (Baltimore) accounts for approximately 5.8% and 6.8% of the net rentable area and underwritten base rent, respectively, of the Gateway Net Lease Portfolio Properties.
FedEx (Baltimore) is located in Edgemere, Maryland in the Sparrows Point area of Baltimore County, approximately 10.0 miles southeast of the Baltimore central business district. Access is provided via the Baltimore Beltway (Interstate 695), which crosses the Baltimore Harbor less than 1.0 mile west of FedEx (Baltimore). Sparrows Point includes the Sparrows Point Peninsula with more than 3,000 acres of newly industrially zoned land. According to the appraisal, FedEx (Baltimore) is located in the Baltimore County East submarket of the Baltimore industrial market. As of the fourth quarter of 2016, the Baltimore County East warehouse market consisted of approximately 14.3 million SF of industrial space (140 buildings) with an overall vacancy rate of approximately 9.9%. The appraisal identified five comparable triple net lease rentals at industrial facilities ranging in size from 11,957 SF to 371,778 SF and constructed between 1970 and 2017, concluding to a market rent of $16.00 PSF, as compared to FedEx Ground (Baltimore)’s underwritten rent of $11.99 PSF. The appraisal identified approximately 1,402,144 SF of warehouse space currently under construction in the Baltimore industrial market that would compete with FedEx (Baltimore).
This is not a research report and was not prepared by any Underwriter’s research department. Please see additional important information and qualifications at the end of this Term Sheet.
| T-113 |
| BANK 2017-BNK5 | Gateway Net Lease Portfolio |
The following table presents detailed information with respect to the tenancy of the Gateway Net Lease Portfolio Properties.
| Gateway Net Lease Portfolio Tenant Summary | |||||||
| Property Name | Ratings(1) Fitch/Moody’s/S&P | SF | % of Total SF | Base Rent PSF | % of Total Base Rent | Lease Expiration Date | |
| BAE Facility | BBB/Baa2/BBB | 333,750 | 6.3% | $13.90 | 8.6% | 8/31/2025 | |
| FedEx Ground (Stratford) | NR/Baa2/BBB | 225,198 | 4.3% | $16.31 | 6.8% | 6/30/2026 | |
| FedEx (Baltimore) | NR/Baa2/BBB | 306,016 | 5.8% | $11.99 | 6.8% | 12/31/2031 | |
| Harman Becker | A+/A1/A+ | 188,042 | 3.6% | $19.56 | 6.8% | 10/31/2030 | |
| GE Aviation (Lafayette) | AA-/A1/AA- | 306,406 | 5.8% | $9.49 | 5.4% | 9/13/2030 | |
| GoDaddy | NR/NR/NR | 150,000 | 2.8% | $17.64 | 4.9% | 5/31/2025 | |
| Carrier(2) | A-/A3/A- | 517,000 | 9.8% | $4.58 | 4.4% | 9/30/2026 | |
| Emerus | NR/NR/NR | 95,640 | 1.8% | $24.25 | 4.3% | 12/31/2026 | |
| Cardinal Health | NR/NR/NR | 275,951 | 5.2% | $6.90 | 3.5% | 4/30/2030 | |
| Tyco Electronics(3) | NR/NR/A- | 176,648 | 3.3% | $11.33 | 3.7% | 4/30/2024 | |
| FCA/Caterpillar(4) | NR/NR/NR | 300,000 | 5.7% | $6.25 | 3.5% | 8/31/2022 | |
| FedEx Ground (Staunton) | NR/Baa2/BBB | 225,198 | 4.3% | $6.64 | 2.8% | 3/31/2026 | |
| Quad Packaging (Proteus) | NR/NR/NR | 205,000 | 3.9% | $6.04 | 2.3% | 12/16/2021 | |
| Quad Packaging (Transpak) | NR/NR/NR | 218,000 | 4.1% | $5.63 | 2.3% | 12/16/2021 | |
| T-Mobile Call Center | BBB+/Baa1/BBB+ | 66,500 | 1.3% | $18.50 | 2.3% | 2/28/2025 | |
| Sikorsky Aircraft R&D Facility(5) | BBB+/Baa1/BBB+ | 150,975 | 2.9% | $8.40 | 2.4% | 1/31/2019 | |
| Vatterott College | NR/NR/NR | 90,000 | 1.7% | $16.14 | 2.7% | 12/31/2024 | |
| Comcast | A-/A3/A- | 57,260 | 1.1% | $19.87 | 2.1% | 6/30/2020 | |
| Alfa Laval Plant | NR/NR/BBB+ | 180,252 | 3.4% | $6.48 | 2.2% | 12/31/2021 | |
| LKQ (New Braunfels) | NR/Ba2/BB | 98,771 | 1.9% | $10.01 | 1.8% | 8/31/2033 | |
| Hitachi | NR/NR/NR | 72,056 | 1.4% | $12.99 | 1.7% | 4/30/2022 | |
| Cameron International | NR/NR/AA- | 75,000 | 1.4% | $14.74 | 2.0% | 12/14/2023 | |
| Alliance Data Systems Office | NR/NR/NR | 100,800 | 1.9% | $9.45 | 1.8% | 7/31/2024 | |
| Synchrony Financial | BBB-/NR/BBB- | 67,775 | 1.3% | $11.01 | 1.4% | 5/31/2025 | |
| Baxalta (Barry Pointe)(6) | NR/NR/BBB- | 16,686 | 0.3% | $29.66 | 0.9% | 8/31/2032 | |
| Baxalta (Casselberry)(6) | NR/NR/BBB- | 16,694 | 0.3% | $29.86 | 0.9% | 10/31/2032 | |
| Baxalta (Mounds View) | NR/NR/BBB- | 16,694 | 0.3% | $28.83 | 0.9% | 11/30/2030 | |
| Baxalta (Grand Rapids) | NR/NR/BBB- | 16,694 | 0.3% | $28.91 | 0.9% | 11/30/2030 | |
| Gerdau | NR/NR/BBB- | 46,976 | 0.9% | $13.31 | 1.2% | 3/31/2025 | |
| Baxalta (Wausau) | NR/NR/BBB- | 16,694 | 0.3% | $26.81 | 0.8% | 10/31/2030 | |
| Baxalta (Springfield) | NR/NR/BBB- | 16,694 | 0.3% | $27.03 | 0.8% | 11/30/2030 | |
| LKQ (Salisbury) | NR/Ba2/BB | 205,100 | 3.9% | $2.33 | 0.9% | 8/6/2030 | |
| Baxalta (Ankeny) | NR/NR/BBB- | 16,694 | 0.3% | $25.41 | 0.8% | 11/30/2030 | |
| H&E Equipment Services (San Antonio) | NR/B3/BB- | 26,535 | 0.5% | $15.81 | 0.8% | 11/30/2030 | |
| H&E Equipment Services (New Orleans) | NR/B3/BB- | 18,808 | 0.4% | $22.41 | 0.8% | 12/31/2030 | |
| GE Aviation (Pompano) | AA-/A1/AA- | 30,892 | 0.6% | $12.36 | 0.7% | 8/14/2022 | |
| Saint-Gobain Warehouse(7) | BBB/Baa2/BBB | 102,950 | 1.9% | $3.73 | 0.7% | 9/1/2024 | |
| H&E Equipment Services (Columbia) | NR/B3/BB- | 19,380 | 0.4% | $17.10 | 0.6% | 12/31/2030 | |
| H&E Equipment Services (Yukon) | NR/B3/BB- | 19,608 | 0.4% | $16.53 | 0.6% | 6/30/2030 | |
| LKQ (Toledo) | NR/Ba2/BB | 207,998 | 3.9% | $1.56 | 0.6% | 6/17/2027 | |
| H&E Equipment Services (Greer) | NR/B3/BB- | 19,608 | 0.4% | $17.06 | 0.6% | 11/30/2030 | |
| Total / Wtd. Avg. | 5,296,943 | 100.0% | $10.18 | 100.0% | |||
| (1) | Certain ratings are those of the parent company whether or not the parent company guarantees the lease. |
| (2) | Carrier has the right to terminate its lease on October 1, 2019 or October 1, 2021, with six months’ notice. |
| (3) | Tyco Electronics has the right to terminate its lease if either landlord’s removal of hazardous materials or defects covered by construction warranty cause a business interruption lasting more than 90 days. |
| (4) | FCA/Caterpillar has the right to terminate its lease if the related service agreement between FCA LLC and Caterpillar Inc. with respect to contracting services performed by FCA for Caterpillar at the property is terminated and not assumed by a transferee permitted under the related lease, with the payment of a termination fee. |
| (5) | Sikorsky Aircraft R&D Facility has the right to terminate its lease with 12 months’ notice and the payment of a termination fee. |
| (6) | Cameron International has the right to terminate its lease as of March 31, 2019, with 12 months’ notice and the payment of a termination fee. |
| (7) | Baxalta (Barry Pointe) and Baxalta (Casselberry) are currently under construction, expected to open in the fourth quarter of 2017 and will be added to the collateral upon distribution of the Earnout Reserve, provided that certain conditions for such distribution of the Earnout Reserve and addition of collateral are satisfied. See “Escrows and Reserves.” |
| (8) | Saint-Gobain Warehouse has the right to terminate its lease any time after August 4, 2017, if the tenant’s annual sales have fallen by at least 20.0% compared to the annual sales for the first 12 months of the lease term. |
This is not a research report and was not prepared by any Underwriter’s research department. Please see additional important information and qualifications at the end of this Term Sheet.
| T-114 |
| BANK 2017-BNK5 | Gateway Net Lease Portfolio |
The following table presents certain information with respect to the lease rollover at the Gateway Net Lease Portfolio Properties.
Lease Rollover Schedule(1)(2) | ||||||||
| Year | # of Leases Expiring | Total Expiring SF | % of Total SF Expiring | Cumulative SF Expiring | Cumulative % of SF Expiring | Annual U/W PSF | % U/W Rolling | Cumulative % of U/W Base Rent |
| 2017 | 0 | 0 | 0.0% | 0 | 0.0% | $0.00 | 0.0% | 0.0% |
| 2018 | 0 | 0 | 0.0% | 0 | 0.0% | $0.00 | 0.0% | 0.0% |
| 2019 | 1 | 150,975 | 2.9% | 150,975 | 2.9% | $8.40 | 2.4% | 2.4% |
| 2020 | 1 | 57,260 | 1.1% | 208,235 | 3.9% | $19.87 | 2.1% | 4.5% |
| 2021 | 3 | 603,252 | 11.4% | 811,487 | 15.3% | $6.03 | 6.7% | 11.2% |
| 2022 | 3 | 402,948 | 7.6% | 1,214,435 | 22.9% | $7.93 | 5.9% | 17.1% |
| 2023 | 1 | 75,000 | 1.4% | 1,289,435 | 24.3% | $14.74 | 2.0% | 19.2% |
| 2024 | 4 | 470,398 | 8.9% | 1,759,833 | 33.2% | $10.18 | 8.9% | 28.1% |
| 2025 | 5 | 665,001 | 12.6% | 2,424,834 | 45.8% | $14.87 | 18.3% | 46.4% |
| 2026 | 4 | 1,063,036 | 20.1% | 3,487,870 | 65.8% | $9.27 | 18.3% | 64.7% |
| 2027 | 1 | 207,998 | 3.9% | 3,695,868 | 69.8% | $1.56 | 0.6% | 65.3% |
| 2028 & Beyond | 18 | 1,601,075 | 30.2% | 5,296,943 | 100.0% | $11.70 | 34.7% | 100.0% |
| Vacant | 0 | 0 | 0.0% | 5,296,943 | 100.0% | $0.00 | 0.0% | 100.0% |
| Total / Wtd. Avg. | 41 | 5,296,943 | 100.0% | $10.18 | 100.0% | |||
| (1) | Based on each tenant’s lease. |
| (2) | Certain tenants may have lease termination options that may become exercisable prior to the originally stated expiration date of the tenant lease that are not considered in the lease rollover schedule. |
Ground Leases.Four of the Gateway Net Lease Portfolio Properties are subject to ground leases: (i) FedEx (Baltimore), which has a current annual base rent of $1,324,400 with a lease expiration on July 31, 2021, with 17 five-year extension options; (ii) GoDaddy, which has a current annual base rent of approximately $568,222 with a lease expiration on December 31, 2101, with no renewal options; (iii) Sikorsky Aircraft R&D Facility, which has a current annual base rent of approximately $275,748 with a lease expiration on February 21, 2049, with no renewal options; and (iv) Hitachi, which has a current annual base rent of approximately $93,455 with a lease expiration on April 13, 2040, with no renewal options. Please see “Description of the Mortgage Pool—Fee & Leasehold Estates; Ground Leases”,in the Preliminary Prospectus.
The Markets. The Gateway Net Lease Portfolio Properties are geographically diverse, located in 39 different cities across 20 states. The Gateway Net Lease Portfolio Properties are located in Texas (23.8% of NRA), Indiana (12.1% of NRA), Michigan (9.1% of NRA), Wisconsin (8.3% of NRA), Virginia (7.7% of NRA), Ohio (5.8% of NRA) and Maryland (5.8% of NRA) with 27.5% of net rentable area located across an additional 13 other states.
This is not a research report and was not prepared by any Underwriter’s research department. Please see additional important information and qualifications at the end of this Term Sheet.
| T-115 |
| BANK 2017-BNK5 | Gateway Net Lease Portfolio |
Underwritten Net Cash Flow.The following table presents certain information relating to the Underwritten Net Cash Flow at the Gateway Net Lease Portfolio Properties:
| Cash Flow Analysis(1) | ||||
| In-Place | U/W | U/W PSF | ||
| Base Rent(2)(3) | $51,948,929 | $53,930,697 | $ 10.18 | |
| Vacant Income | 0 | 0 | 0.00 | |
| Gross Potential Rent | $51,948,929 | $53,930,697 | $10.18 | |
| Total Recoveries | 0 | 29,231,519 | 5.51 | |
| Less: Vacancy/Bad Debt | 0 | (4,158,111) | (5.0%) | |
| Effective Gross Income | $51,948,929 | $79,004,104 | $14.92 | |
| Total Operating Expenses(4) | 0 | 29,231,519 | 5.52 | |
| Net Operating Income | $51,948,929 | $49,772,586 | $9.40 | |
| TI/LC | 0 | 3,909,520 | 0.74 | |
| Capital Expenditures | 0 | 781,904 | 0.15 | |
| Net Cash Flow | $51,948,929 | $45,081,162 | $8.51 | |
| Occupancy % | 100.0% | 95.0% | ||
| NOI DSCR(5) | 4.07x | 3.90x | ||
| NCF DSCR(5) | 4.07x | 3.54x | ||
| NOI Debt Yield(5) | 14.7% | 14.1% | ||
| NCF Debt Yield(5) | 14.7% | 12.8% | ||
| (1) | The Gateway Net Lease Portfolio consists of 41 single tenant properties, many of which are recently constructed build-to-suit projects, each leased on a triple net basis. Historical financials and historical occupancy are unavailable. | |
| (2) | In-Place Base Rents based on each tenant’s lease. |
| (3) | UW Base Rent includes contractual rent underwritten through April 2017 for non-investment grade tenants and the straight-line average rent through the sooner of lease expiration and the end of the loan term for investment grade tenants. UW Base Rent also includes income from Baxalta (Barry Pointe) and Baxalta (Casselberry), which are under construction and are expected to open in the fourth quarter of 2017 and will be added to the collateral upon distribution of the Earnout Reserve, provided that certain conditions for such distribution of the Earnout Reserve and addition of collateral are satisfied. See “Escrows and Reserves.” |
| (4) | All leases are triple net. U/W Total Recoveries and U/W Total Operating Expenses are shown for illustrative purposes. |
| (5) | Debt service coverage ratios and debt yields are based on the Gateway Net Lease Portfolio Senior Loan and exclude the Gateway Net Lease Portfolio Subordinate Loan. |
Escrows and Reserves. At loan origination, the Gateway Net Lease Portfolio Borrowers established a $10,720,000 reserve (the “Earnout Reserve”) in connection with the two properties under construction, Baxalta (Barry Pointe) and Baxalta (Casselberry). Under the Gateway Net Lease Portfolio Whole Loan documents, the Gateway Net Lease Portfolio Borrowers are entitled to disbursements from this reserve upon satisfaction of the following terms and conditions, among others: (i) no event of default has occurred and is continuing on either the date of the request or the date of the advance; (ii) the net operating income for each of the two properties under construction provides for a debt yield of at least 9.8% based on the outstanding principal balance of the allocated Gateway Net Lease Portfolio Whole Loan amount for such property (including the amount requested for disbursement from the reserve); (iii) the owners of the properties deliver a joinder to the Gateway Net Lease Portfolio Whole Loan documents; (iv) the loan-to-value ratio based on the allocated loan amount for each property is not greater than 65.5%; and (v) the applicable property is 100.0% occupied by tenants paying full and unabated rent pursuant to one or more leases approved by the lender in accordance with the Gateway Net Lease Portfolio Whole Loan documents.
Upon the occurrence of a Cash Sweep Period (as defined below), the Gateway Net Lease Portfolio Borrowers are required to deposit monthly reserves of (i) 1/12 of the estimated annual real estate taxes, (ii) 1/12 of the estimated annual insurance premiums, (iii) $110,353 for replacement reserves (subject to a cap of $2,648,472 ($0.50 PSF)), (iv) $331,059 for tenant improvement and leasing commissions (subject to a cap of $7,945,415 ($1.50 PSF)), and (v) 1/12 of ground rent due under each ground lease.
Each of the foregoing monthly deposit requirements is waived to the extent (a) no Cash Sweep Period is continuing, (b) provided that no event of default is continuing, the Gateway Net Lease Portfolio Borrowers provide to the lender satisfactory evidence that such required amounts are being paid directly by one or more tenants and such tenants are not in default under the terms of their respective leases, or (c) solely with respect to clause (ii) above, the Gateway Net Lease Portfolio Borrowers provide satisfactory evidence that the property is insured under an acceptable blanket policy.
A “Cash Sweep Period” will commence upon (i) an event of default under the Gateway Net Lease Portfolio Whole Loan; (ii) any bankruptcy or insolvency action of a borrower or an affiliated manager or (iii) the debt yield (as calculated based on the Gateway Net Lease Portfolio Whole Loan less the amount of the Earnout Reserve not yet released) being less than 8.5% for one calendar quarter based on the trailing three-month period (a “Debt Yield Trigger Event”). A Cash Sweep Period will end (i) if caused solely by an event of default, the acceptance by the lender of a cure of such event of default, (ii) if caused solely by a bankruptcy action of an affiliated manager, provided no event of default is continuing, if the property manager is replaced with a qualified property manager, or (iii) if caused solely by the occurrence of a Debt Yield Trigger Event, provided no event of default is continuing, upon the debt yield being 8.5% or greater for one calendar quarter based upon the trailing three month period. A Cash Sweep Period cannot be cured if caused by a bankruptcy action of a borrower.
Lockbox and Cash Management. A hard lockbox is in place with respect to the Gateway Net Lease Portfolio Whole Loan, with springing cash management upon the occurrence of a Cash Sweep Period. During a Cash Sweep Period, all funds are required to be swept each business day to a lender-controlled cash management account and disbursed in accordance with the Gateway Net Lease Portfolio Whole Loan documents with all excess cash flow required to be held in the excess cash flow subaccount as additional security for the Gateway Net Lease Portfolio Whole Loan.
This is not a research report and was not prepared by any Underwriter’s research department. Please see additional important information and qualifications at the end of this Term Sheet.
| T-116 |
| BANK 2017-BNK5 | Gateway Net Lease Portfolio |
Additional Secured Indebtedness (not including trade debts). The Gateway Net Lease Portfolio Properties also secure the Gateway Net Lease PortfolioPari Passu Companion Loans, with an aggregate cut-off date principal balance of $308,000,000. The promissory notes evidencing the Gateway Net Lease PortfolioPari Passu Companion Loans accrue interest at the same rate as the Gateway Net Lease Portfolio Mortgage Loan. The Gateway Net Lease Portfolio Mortgage Loan is entitled to payments of principal and interest on apro rata andpari passu basis with the Gateway Net Lease PortfolioPari Passu Companion Loans.
The Gateway Net Lease Portfolio Properties also secure the Gateway Net Lease Portfolio Subordinate Loan, with an aggregate cut-off date balance of $170,000,000, held by Athene Annuity and Life Company, Athene Annuity & Life Assurance Company, American Equity Investment Life Insurance Company, Midland National Life Insurance Company and American Equity Investment Life Insurance Company and which carries an interest rate of 5.40%per annum. The Gateway Net Lease Portfolio Subordinate Loan is co-terminous with the Gateway Net Lease Portfolio Mortgage Loan and the Gateway Net Lease PortfolioPari Passu Companion Loans and is also interest-only for the full term. Prior to the occurrence of certain events of default under the Gateway Net Lease Portfolio Whole Loan, the Gateway Net Lease Portfolio Subordinate Loan will be entitled to receive scheduled payments of principal and interest under the Gateway Net Lease Portfolio Whole Loan.
The holders of the Gateway Net Lease Portfolio Mortgage Loan, the Gateway Net Lease PortfolioPari Passu Companion Loans and the Gateway Net Lease Portfolio Subordinate Loan have entered into a co-lender agreement that sets forth the allocation of collections on the Gateway Net Lease Portfolio Whole Loan. See“Description of the Mortgage Pool—The Whole Loans—The Gateway Net Lease Portfolio Pari Passu-A/B Whole Loan”in the Preliminary Prospectus.
Mezzanine Loan and Preferred Equity. Not permitted.
Release of Property.After June 5, 2019 the Gateway Net Lease Portfolio Borrowers are permitted to obtain the release of individual properties, provided, among other things, (a) no event of default has occurred and is continuing under the Gateway Net Lease Portfolio Whole Loan; (b) the Gateway Net Lease Portfolio Borrowers prepay the Gateway Net Lease Portfolio Whole Loan by an amount equal to 110.0% of the individual property’s allocated loan amount (including payment of the yield maintenance premium, if applicable); and (c) after giving effect to the release of such individual property, the debt yield for the then remaining properties is equal to or greater than (i) the greater of (A) the debt yield for all the properties then remaining immediately prior to giving effect to the release or (B) 10.0% or (ii) 14.0% (collectively, the “Release Debt Yield”), provided that the Gateway Net Lease Portfolio Borrowers are permitted to prepay a portion of the Gateway Net Lease Portfolio Whole Loan in order to satisfy the Release Debt Yield requirements.
Terrorism Insurance.The Gateway Net Lease Portfolio Borrowers are required to obtain and maintain property insurance, public liability insurance and rental loss and/or business interruption insurance that covers perils of terrorism or other similar acts, provided that the Gateway Net Lease Portfolio Whole Loan documents provide for an annual terrorism premium cap of two times the cost of the property and business interruption insurance premiums (on a stand-alone basis) but excluding the windstorm and flood components of such premiums.
This is not a research report and was not prepared by any Underwriter’s research department. Please see additional important information and qualifications at the end of this Term Sheet.
| T-117 |
| BANK 2017-BNK5 | 200 Center Anaheim |
Mortgage Loan No. 10 – 200 Center Anaheim
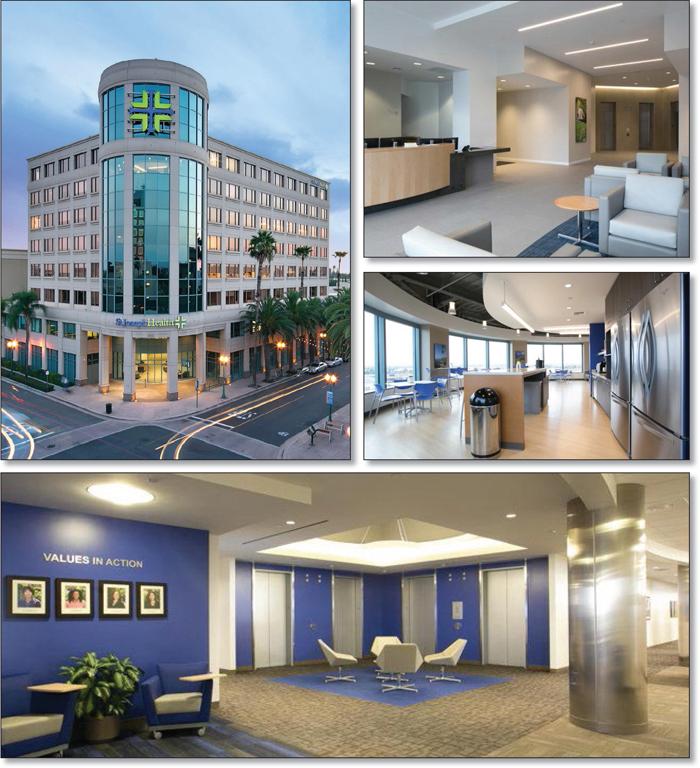
This is not a research report and was not prepared by any Underwriter’s research department. Please see additional important information and qualifications at the end of this Term Sheet.
| T-118 |
| BANK 2017-BNK5 | 200 Center Anaheim |
Mortgage Loan No. 10 – 200 Center Anaheim
This is not a research report and was not prepared by any Underwriter’s research department. Please see additional important information and qualifications at the end of this Term Sheet.
| T-119 |
| BANK 2017-BNK5 | 200 Center Anaheim |
| Mortgage Loan No. 10 – 200 Center Anaheim |
| Mortgage Loan Information | Property Information | ||||||
| Mortgage Loan Seller: | WFB | Single Asset/Portfolio: | Single Asset | ||||
| Original Balance: | $43,500,000 | Location: | Anaheim, CA 92805 | ||||
| Cut-off Date Balance: | $43,500,000 | General Property Type: | Office | ||||
| % of Initial Pool Balance: | 3.5% | Detailed Property Type: | Suburban | ||||
| Loan Purpose: | Acquisition | Title Vesting: | Fee | ||||
| Sponsors: | Jeffrey S. Mayer; David Tevelde; Anne Sconberg; Les Barkley; Scott Workman | Year Built/Renovated: | 1991/2015 | ||||
| Mortgage Rate: | 4.19500% | Size: | 191,556 SF | ||||
| Note Date: | 5/25/2017 | Cut-off Date Balance per SF : | $227 | ||||
| First Payment Date: | 7/11/2017 | Maturity Date Balance per SF: | $207 | ||||
| Maturity Date: | 6/11/2027 | Property Manager: | Greenlaw Management, Inc. (borrower-related) | ||||
| Original Term to Maturity: | 120 months | ||||||
| Original Amortization Term: | 360 months | ||||||
| IO Period: | 60 months | ||||||
| Seasoning: | 0 months | ||||||
| Prepayment Provisions: | LO (24); DEF (92); O (4) | Underwriting and Financial Information | |||||
| Lockbox/Cash Mgmt Status: | Hard/In Place | UW NOI(3): | $4,284,959 | ||||
| Additional Debt Type: | N/A | UW NOI Debt Yield(3): | 9.9% | ||||
| Additional Debt Balance: | N/A | UW NOI Debt Yield at Maturity(3): | 10.9% | ||||
| Future Debt Permitted (Type)(1): | Yes (Mezzanine) | UW NCF DSCR: | 2.17x (IO); 1.57x (P&I) | ||||
| Most Recent NOI(3): | ($423,075) (2/28/2017 TTM) | ||||||
| Reserves(2) | 2nd Most Recent NOI(3): | ($624,066) (12/31/2016) | |||||
| Type | Initial | Monthly | Cap | 3rd Most Recent NOI(4): | N/A | ||
| RE Tax: | $80,709 | $26,903 | N/A | Most Recent Occupancy: | 100.0% (6/1/2017) | ||
| Insurance: | $0 | Springing | N/A | 2nd Most Recent Occupancy: | 100.0% (12/31/2016) | ||
| Recurring Replacements: | $0 | $3,991 | $95,778 | 3rd Most Recent Occupancy: | 100.0% (12/31/2015) | ||
| TI/LC: | $0 | $0 | N/A | Appraised Value (as of): | $63,400,000 (7/1/2017) | ||
| Elevator Renovation: | $950,000 | $0 | N/A | Cut-off Date LTV Ratio: | 68.6% | ||
| Rent Concession Reserve: | $390,774 | $0 | N/A | Maturity Date LTV Ratio: | 62.6% | ||
| Sources and Uses | ||||||
| Sources | Proceeds | % of Total | Uses | Proceeds | % of Total | |
| Loan Amount: | $43,500,000 | 69.9% | Purchase Price | $58,900,000 | 94.6% | |
| Borrower Equity: | $18,765,825 | 30.1% | Reserves | $1,421,483 | 2.3% | |
| Closing Costs: | $1,944,342 | 3.1% | ||||
| Total Sources: | $62,265,825 | 100.0% | Total Uses: | $62,265,825 | 100.0% | |
| (1) | See “—Mezzanine Loan and Preferred Equity” below for further discussion of additional debt. |
| (2) | See “—Escrows and Reserves” below for further discussion of reserve requirements. |
| (3) | 2nd Most Recent NOI and Most Recent NOI were negative due to St. Joseph Heritage Healthcare receiving full rent abatement for the first 17 months of its lease and partial rent abatement for the following seven months of its lease. The abatement expired in May 2017 and St. Joseph Heritage Healthcare is now paying full unabated rent. See “—Operating History and Underwritten Net Cash Flow” below. UW NOI includes the average St. Joseph Heritage Healthcare rent over the remaining lease term due to the investment grade nature of the tenant. |
| (4) | 3rd Most Recent NOI is not available as financials prior to 2016 were not provided by the seller. |
The Mortgage Loan. The tenth largest mortgage loan (the “200 Center Anaheim Mortgage Loan”) is evidenced by a promissory note in the original principal amount of $43,500,000, secured by a first priority fee mortgage encumbering a 191,556 SF, class A single tenant office building located in Anaheim, California (the “200 Center Anaheim Property”).
The proceeds of the 200 Center Anaheim Mortgage Loan, along with borrower equity of approximately $18.8 million, were used to acquire the 200 Center Anaheim Property, fund reserves, and pay closing costs.
This is not a research report and was not prepared by any Underwriter’s research department. Please see additional important information and qualifications at the end of this Term Sheet.
| T-120 |
| BANK 2017-BNK5 | 200 Center Anaheim |
The Borrower and the Sponsor. The borrower comprises five tenants in common: 200 Center Alton, LLC; 200 Center Barkley, LLC; 200 Center Oceanside, LLC; 200 Center Tevelde, LLC; and 200 Center Workman, LLC (collectively, the “200 Center Anaheim Borrower”), each a single-purpose Delaware limited liability company and single purpose entity with at least one independent director. The sponsors of the 200 Center Anaheim Borrower are Jeffrey S. Mayer, David Tevelde, Anne Sconberg, Les Barkley, and Scott Workman. The nonrecourse carve-out guarantor is Jeffrey S. Mayer, who manages 200 Center Alton, LLC, which has been designated as the sole contact and notice party to interact with the lender on behalf of the 200 Center Anaheim Borrower.
Mr. Mayer has more than 30 years of experience owning, acquiring, and managing commercial real estate properties. Mr. Mayer’s current real estate portfolio includes four office assets totaling 249,076 square feet, two retail assets totaling 93,779 square feet, and four multifamily assets totaling 313 units, as well as 252 acres of farmland primarily located in California.
The Property. The 200 Center Anaheim Property consists of the fee interest in an eight-story, class A office building totaling 191,556 square feet located in downtown Anaheim, California. The 200 Center Anaheim Property was previously owned and 100% occupied by AT&T since 2006, until AT&T vacated and sold the 200 Center Anaheim Property to PRES Companies (“PRES”) in 2014. PRES significantly renovated the 200 Center Anaheim Property, spending approximately $2.1 million to develop a brand new lobby, renovate the common areas, refurbish the elevator cabs, and replace the HVAC system. PRES was then approached by St. Joseph Heritage Healthcare (“SJH”) to lease the entire 200 Center Anaheim Property, signing a lease in October 2014 with lease commencement occurring in June 2015. An additional $17.5 million ($92 PSF) was spent building out SJH’s space, of which $7.0 million ($36 PSF) was contributed by the tenant.
The 200 Center Anaheim Property features open ceilings, collaborative work spaces, modern conference rooms, a fitness center with showers, attractive employee lunch rooms, a small game area for employees with a pool table, ping pong table, and pinball machine, outdoor seating areas, and an expansive banquet and training room that can be partitioned off into three separate rooms with coordinated audio visual capabilities. The 200 Center Anaheim Property also includes ample parking in a four-story parking structure adjacent to the 200 Center Anaheim Property, which has 955 parking spaces (resulting in a parking ratio of 5.0 spaces per 1,000 square feet of net rentable area).
Established in 1982, SJH (rated AA-/Aa3/AA- by Fitch/Moody’s/S&P, respectively) is a not-for-profit, integrated Catholic health care delivery system sponsored by the St. Joseph Health Ministry. SJH provides a full range of care facilities including 16 acute care hospitals, home health agencies, hospice care, outpatient services, skilled nursing facilities, community clinics, and physician groups. Based in Irvine, California, SJH serves 10 distinct communities within three general regions – Northern California, Southern California, and Texas - and has more than 24,000 employees. SJH consolidated various office spaces and employees from 9 prior locations within Orange County to the 200 Center Anaheim Property in order to centralize SJH’s shared services. SJH uses the 200 Center Anaheim Property as its main office for shared company services across the health network, including administrative, billing, finance, information technology, facilities, claims, care integration, and human resources departments which support approximately 150 non-acute care locations across California.
In July 2016, SJH merged with Providence Health & Services to form Providence St. Joseph Health (“PSJH”), becoming the third largest nonprofit health system in the country. PSJH now has more than 111,000 employees serving in 50 hospitals, 829 clinics, and a comprehensive range of services across Alaska, California, Montana, Oregon, Texas, and Washington. The PSJH family includes Providence Health & Services, SJH, Covenant Health in West Texas, Facey Medical Foundation in Los Angeles, Hoag Memorial Presbyterian in Orange County, Kadlec in Southeast Washington, Pacific Medical Centers in Seattle, and Swedish Health Services in Seattle. The newly combined company is rated AA-/Aa3/AA- by Fitch/Moody’s/S&P, respectively, as SJH was prior to the merger, and reports total net worth of $13.8 billion as of December 31, 2016.
The following table presents certain information relating to the leases at the 200 Center Anaheim Property:
| Tenant Summary(1) | |||||||
| Tenant Name | Credit Rating (Fitch/Moody’s/S&P)(2) | Tenant SF | Approximate % of SF | Annual UW Rent(3) | % of Total Annual UW Rent | Annual UW Rent PSF(3) | Lease Expiration |
| Major Tenant | |||||||
| St. Joseph Heritage Healthcare | AA-/Aa3/AA- | 191,556 | 100.0% | $5,574,280 | 100.0% | $29.10 | 5/31/2027(4) |
| Subtotal/Wtd. Avg. | 191,556 | 100.0% | $5,574,280 | 100.0% | $29.10 | ||
| Vacant Space | 0 | 0.0% | $0 | 0.0% | $0.00 | ||
| Total/Wtd. Avg. | 191,556 | 100.0% | $5,574,280 | 100.0% | $29.10 | ||
| (1) | Information is based on the underwritten rent roll. |
| (2) | The ratings shown are those of the parent company, PSJH. The tenant under the lease is St. Jude Hospital Yorba Linda doing business as SJH. The lease is guaranteed by SJH (which after the merger became a subsidiary of PSJH), which held the same credit ratings as PSJH prior to the merger. SJH’s guaranty liability is capped at $24 million and, beginning June 2017 will decrease by $200,000 each month until, after 70 adjustment dates (ending April 2023), the guaranty liability will be reduced to $10 million for the remainder of the SJH lease term. |
| (3) | Annual UW Rent and Annual UW Rent PSF represent the average SJH rent over the remaining lease term due to the investment grade nature of the tenant. SJH’s current annual in-place rental rate is $24.72 PSF. |
| (4) | SJH has three five-year lease extension options remaining. |
This is not a research report and was not prepared by any Underwriter’s research department. Please see additional important information and qualifications at the end of this Term Sheet.
| T-121 |
| BANK 2017-BNK5 | 200 Center Anaheim |
The following table presents certain information relating to the lease rollover schedule at the 200 Center Anaheim Property:
| Lease Rollover Schedule(1) | ||||||||
| Year | # of Leases Rolling | SF Rolling | Annual UW Rent PSF Rolling(3) | Approx. % of Total SF Rolling | Approx. Cumulative % of SF Rolling | Total UW Rent Rolling | Approx. % of Total Rent Rolling | Approx. Cumulative % of Total Rent Rolling |
| MTM | 0 | 0 | $0.00 | 0.0% | 0.0% | $0 | 0.0% | 0.0% |
| 2017 | 0 | 0 | $0.00 | 0.0% | 0.0% | $0 | 0.0% | 0.0% |
| 2018 | 0 | 0 | $0.00 | 0.0% | 0.0% | $0 | 0.0% | 0.0% |
| 2019 | 0 | 0 | $0.00 | 0.0% | 0.0% | $0 | 0.0% | 0.0% |
| 2020 | 0 | 0 | $0.00 | 0.0% | 0.0% | $0 | 0.0% | 0.0% |
| 2021 | 0 | 0 | $0.00 | 0.0% | 0.0% | $0 | 0.0% | 0.0% |
| 2022 | 0 | 0 | $0.00 | 0.0% | 0.0% | $0 | 0.0% | 0.0% |
| 2023 | 0 | 0 | $0.00 | 0.0% | 0.0% | $0 | 0.0% | 0.0% |
| 2024 | 0 | 0 | $0.00 | 0.0% | 0.0% | $0 | 0.0% | 0.0% |
| 2025 | 0 | 0 | $0.00 | 0.0% | 0.0% | $0 | 0.0% | 0.0% |
| 2026 | 0 | 0 | $0.00 | 0.0% | 0.0% | $0 | 0.0% | 0.0% |
| 2027 | 1 | 191,556 | $29.10 | 100.0% | 100.0% | $5,574,280 | 100.0% | 100.0% |
| Vacant | 0 | 0 | $0.00 | 0.0% | 100.0% | $0 | 0.0% | 100.0% |
| Total/Wtd. Avg. | 1 | 191,556 | $29.10 | 100.0% | $5,574,280 | 100.0% | ||
| (1) | Information is based on the underwritten rent roll. |
The Market. The 200 Center Anaheim Property is well located along Center Street Promenade within the revitalized historic downtown area of Anaheim, California, which has many shops, restaurants, entertainment amenities, personal services, and residential units nearby. Within one block of the 200 Center Anaheim Property there are four new loft-style apartment projects totaling approximately 276 units, as well as a CVS and Vons grocery store. Additional attractions within walking distance of the 200 Center Anaheim Property include The Rinks (a public ice skating venue which also serves as the official training facility of the Anaheim Ducks National Hockey team), Muzeo Museum (an art and cultural museum featuring a variety of changing exhibitions, special events, and weekend festivals), the weekly Downtown Anaheim Farmers Park, and the Packing House (a two-level food hall modeled after the public food markets of Europe and South America). Additional attractions within four miles of the 200 Center Anaheim Property include Disneyland, Angel Stadium (home of the Los Angeles Angels of Anaheim), Honda Center (home of the Anaheim Ducks), and the Anaheim Convention Center. With convenient access to Interstate 5, the 91 Freeway, and the State Route 57, the 200 Center Anaheim Property benefits from direct commutes from outlying areas of Orange County, as well as the John Wayne Airport, which is located approximately 14.2 miles southwest.
According to a third party market report, the 2016 estimated population within a one-, three-, and five-mile radius of the 200 Center Anaheim Property was 46,005, 271,190 and 664,613, respectively and the 2016 average household income within the same radii was $60,774, $69,010 and $78,127, respectively. The 200 Center Anaheim Property is located in the North & East Anaheim office submarket. As of the first quarter of 2017, the submarket reported an inventory of 6.9 million square feet of office space, a 5.3% vacancy rate and an asking rental rate of $24.54 per square foot gross. The Class A office submarket reported an inventory of 1.1 million square feet with a 6.1% vacancy rate and an asking rent of $25.85 per square foot gross. Additionally, the Class A office submarket has exhibited stable historical trends with a 10-year average vacancy rate of 9.3%, a 15-year average vacancy rate of 9.8%, and a 20-year average vacancy rate of 9.6%.
The following table presents certain information relating to comparable office leases to the 200 Center Anaheim Property:
| Comparable Leases Summary | ||||||||
| Property Name/Location | Year Built / Renovated | Size SF | Total Occupancy | Tenant Name | Lease Date/Term | Lease Area (SF) | Annual In Place Rent PSF | Lease Type |
| Subject | 1991 / 2015 | 191,556 | 100.0% | St. Joseph Heritage Healthcare | June 2015 / 12.0 Yrs | 191,556 | $24.72(1) | FSG |
3100 Lake Center Dr. Santa Ana, CA | 1986 / NAV | 60,462 | 100.0% | OC 405 Partners | Feb. 2017 / 7.0 Yrs | 60,462 | $15.60 | NNN |
2121 Towne Centre Pl Anaheim, CA | 1982 / NAV | 302,605 | 60.0% | OC Register | Feb. 2017 / 7.0 Yrs | 31,066 | $30.48 | FSG |
3333 Susan Costa Mesa, CA | 2003 / NAV | 101,831 | 100.0% | The Los Angeles Chargers | Jan. 2017 / 10.0 Yrs | 101,831 | $19.44 | NNN |
1750 4th Street Santa Ana, CA | 1994 / NAV | 244,865 | 100.0% | CalTrans | Aug. 2016 / 10.0 Yrs | 130,288 | $24.72 | FSG |
1600 E Saint Andrew Pl Santa Ana, CA | 1992 / NAV | 187,875 | 80.0% | National Mortgage | June 2016 / 7.0 Yrs | 152,827 | $19.92 | NNN |
2401 N Glassell St Orange, CA | 1984 / NAV | 191,127 | 100.0% | Volt Information Sciences | March 2016 / 15.0 Yrs | 191,127 | $15.00 | NNN |
Source:Appraisal and underwritten rent roll
| (1) | SJH’s annual underwritten base rent is $29.10 PSF, which represents its average rent over the remaining lease term due to the investment grade nature of the tenant. |
This is not a research report and was not prepared by any Underwriter’s research department. Please see additional important information and qualifications at the end of this Term Sheet.
| T-122 |
| BANK 2017-BNK5 | 200 Center Anaheim |
Operating History and Underwritten Net Cash Flow.The following table presents certain information relating to the historical operating performance and the Underwritten Net Cash Flow at the 200 Center Anaheim Property:
| Cash Flow Analysis | ||||
| 2016 | 2/28/2017 TTM | UW | UW PSF | |
| Base Rent(1) | $4,735,264 | $4,735,265 | $5,574,280 | $29.10 |
| Total Recoveries | $453,210 | $404,436 | $805,352 | $4.20 |
| Parking Income(2) | $66,557 | $103,905 | $326,055 | $1.70 |
| Other Income(3) | $1,652 | $2,903 | $37,004 | $0.19 |
| Less Free Rent(4) | ($4,467,086) | ($4,198,908) | $0 | $0.00 |
| Less Vacancy & Credit Loss | $0 | $0 | ($278,714) | ($1.46) |
| Effective Gross Income | $789,597 | $1,047,601 | $6,463,976 | $33.74 |
| Total Operating Expenses | $1,413,663 | $1,470,676 | $2,179,017 | $11.38 |
| Net Operating Income(4) | ($624,066) | ($423,075) | $4,284,959 | $22.37 |
| Capital Expenditures | $0 | $0 | $43,036 | $0.22 |
| TI/LC | $0 | $0 | $226,199 | $1.18 |
| Net Cash Flow(4) | ($624,066) | ($423,075) | $4,015,725 | $20.96 |
| Occupancy % | 100.0% | 100.0% | 95.0% | |
| NOI DSCR (IO)(4) | (0.34x) | (0.23x) | 2.32x | |
| NOI DSCR (P&I)(4) | (0.24x) | (0.17x) | 1.68x | |
| NCF DSCR (IO)(4) | (0.34x) | (0.23x) | 2.17x | |
| NCF DSCR (P&I)(4) | (0.24x) | (0.17x) | 1.57x | |
| NOI Debt Yield(4) | (1.4%) | (1.0%) | 9.9% | |
| NCF Debt Yield(4) | (1.4%) | (1.0%) | 9.2% | |
| (1) | The increase in UW Base Rent from 2/28/2017 TTM is based on underwriting the average SJH rent over the remaining lease term due to the investment grade nature of the tenant. |
| (2) | The increase in UW Parking Income from TTM 2/28/2017 is based on the 200 Center Anaheim Borrower’s 2017 budget, which includes new monthly contracts with various businesses in the surrounding buildings, as well as projected parking income derived from adjacent retail and residential tenants and transient visitors. |
| (3) | The increase in UW Other Income from TTM 2/28/2017 is based on the 200 Center Anaheim Borrower’s 2017 budget, which includes income from the rooftop antenna lease at the parking garage and storage income at the parking garage from the adjacent Anaheim ice skating rink. |
| (4) | Net Operating Income and Net Cash Flow were negative during 2016 and 2/28/2017 TTM due to SJH receiving full rent abatement for the first 17 months of its lease and partial rent abatement for the following seven months of its lease. The abatement expired in May 2017 and SJH is now paying full, unabated rent. |
Escrows and Reserves. The 200 Center Anaheim Mortgage Loan documents provide for an upfront escrow at closing in the amount of $80,709 for real estate taxes, $950,000 for elevator modifications and $390,774 for rent concessions. The 200 Center Anaheim Mortgage Loan documents provide for ongoing monthly escrows of $26,903 for real estate taxes and $3,991 for replacement reserves (subject to a cap of $95,778). The 200 Center Anaheim Mortgage Loan documents do not require monthly deposits for insurance premiums as long as (i) no event of default has occurred and is continuing; (ii) the 200 Center Anaheim Property is insured via an acceptable blanket insurance policy; and (iii) the 200 Center Anaheim Borrower provides the lender with timely evidence of renewal and proof of payment of insurance premiums.
Lockbox and Cash Management. The 200 Center Anaheim Mortgage Loan is structured with a lender-controlled lockbox, which is already in place, and requires the 200 Center Anaheim Borrower to direct all tenants to pay rent directly into such lockbox account. The 200 Center Anaheim Mortgage Loan documents also require that all rents received by the 200 Center Anaheim Borrower or the property manager be deposited into the lockbox account within one business day of receipt. The 200 Center Anaheim Mortgage Loan has in place cash management. Prior to the occurrence of a Cash Trap Event Period (as defined below), all excess cash flow is required to be distributed to the 200 Center Anaheim Borrower. During a Cash Trap Event Period, all excess cash flow is required to be swept to a lender-controlled cash management account.
A “Cash Trap Event Period” will commence upon the earlier of (i) the occurrence and continuance of an event of default under the 200 Center Anaheim Mortgage Loan, (ii) the amortizing debt service coverage ratio being less than 1.20x, (iii) the occurrence of a Major Tenant Event Period (as defined below), or (iv) commencement of a Supplemental Tax Cash Trap Event Period (as defined below). A Cash Trap Event Period will end with respect to clause (i), upon the cure of such event of default; with respect to clause (ii), upon the amortizing debt service coverage ratio being at least 1.25x for two consecutive calendar quarters; with respect to clause (iii) upon the termination of such Major Tenant Event Period and provided no other Major Tenant Event Period is then continuing; and with respect to clause (iv), upon the termination of the Supplemental Tax Cash Trap Event Period.
A “Major Tenant” means SJH, its successors and assigns, and any replacement tenant that enters into a lease at the 200 Center Anaheim Property which (i) either (A) accounts for 20% or more of the total rental income of the 200 Center Anaheim Property, or (B) comprises 20% or more of the 200 Center Anaheim Property’s gross leasable area; (ii) contains any option, offer, right of first refusal or other similar entitlement to acquire all or any portion of the 200 Center Anaheim Property; and (iii) any instrument guaranteeing or providing credit support for any lease meeting the requirements of clause (i) and/or (ii).
A “Major Tenant Event Period” means (i) any monetary default or material non-monetary default by the 200 Center Anaheim Borrower under any lease to a Major Tenant; (ii) a default by a Major Tenant under its lease; (iii) a Major Tenant going dark, vacating, or failing to occupy and be open for business in at least 65% of its space for a period of 180 consecutive days; (iv) a Major Tenant filing bankruptcy or similar insolvency proceeding; (v) a Major Tenant failing to renew or extend the term of its lease 12 months prior to the earlier of (A) the scheduled lease expiration date, and (B) the 200 Center Anaheim Mortgage Loan maturity date; or (vi) the long-term debt rating for each of (I) SJH (or any successor guarantor of the lease to St. Jude) and (II) the direct parent of the entity in clause (I) is downgraded below “BBB-” by S&P (or the equivalent Fitch or Moody’s rating).
This is not a research report and was not prepared by any Underwriter’s research department. Please see additional important information and qualifications at the end of this Term Sheet.
| T-123 |
| BANK 2017-BNK5 | 200 Center Anaheim |
A Major Tenant Event Period will end with respect to clause (i), upon the cure of such event of default; with respect to clauses (ii), (iii), (iv), (v), and (vi) either (A) the Major Tenant space has been leased to one or more satisfactory replacement Major Tenants and each Major Tenant is fully occupying its space, paying full, unabated rent and all tenant improvement allowances and leasing commissions provided to such Major Tenant have been paid or (B) the amount of the major tenant reserve is and remains equal to the cap of $7,662,240; or with respect to clause (ii), the cure of such Major Tenant default; or with respect to clause (iii), such Major Tenant has resumed occupancy and normal business operations in at least 65% of its space and is open for business for two consecutive calendar quarters; with respect to clause (iv), the bankruptcy or similar insolvency proceeding has terminated and the Major Tenant lease has been affirmed; or with respect to clause (v), the Major Tenant renews or extends the term of its lease; or with respect to clause (vi), the long-term credit rating for each of (I) SJH (or any successor guarantor of the lease to St. Jude) or (II) the direct parent of the entity in clause (I) is upgraded to “BBB-” or higher by S&P (or the equivalent Fitch or Moody’s rating).
A “Supplemental Tax Cash Trap Event Period” means a period commencing upon the earlier of (i) SJH filing for bankruptcy or similar insolvency proceeding by August 24, 2017, which is within 91 days of the payment of the tax reassessment purchase price amount of $2,824,019; or (ii) SJH claiming it is not responsible for, or does not actually pay, the portion of any increase in real estate taxes attributed to a reassessment of the 200 Center Anaheim Property by the appropriate governmental authority pursuant to the terms of Proposition 13, as a result of filing for bankruptcy or similar insolvency proceeding. A Supplemental Tax Cash Trap Event Period will end upon the earlier of (x) the amount of Supplemental Tax Reserve Funds on deposit with the lender is equal to or greater than $3,800,000 or (y) SJH acknowledging that it is responsible for paying the tax increase and actually makes at least one tax payment which includes the tax increase.
Additional Secured Indebtedness (not including trade debts). Not permitted.
Mezzanine Loan and Preferred Equity. The loan documents permit the incurrence of mezzanine financing solely in connection with a bona fide sale of the 200 Center Anaheim Property to a third party and the related assumption of the 200 Center Anaheim Mortgage Loan, to be secured by the direct ownership interest in the 200 Center Anaheim Borrower, subject to the satisfaction of certain conditions, including, but not limited to (i) the lender receives 60 days’ prior written notice, (ii) the aggregate sum of the mezzanine loan and the 200 Center Anaheim Mortgage Loan will result in (A) a combined loan-to-value ratio (based upon a then-current appraisal obtained by the 200 Center Anaheim Borrower from a nationally recognized MAI appraiser) of no more than 65.0%, (B) a combined debt service coverage ratio (utilizing the amortizing debt service of both the 200 Center Anaheim Mortgage Loan and the mezzanine loan) of not less than 1.59x, and (C) a combined debt yield (based on adjusted net cash flow and the combined amount of the 200 Center Anaheim Mortgage Loan and the mezzanine loan) of not less than 9.3%, (iii) the mezzanine loan being coterminous with the 200 Center Anaheim Mortgage Loan, (iv) the lender of the mezzanine loan is acceptable to lender, (v) execution of an intercreditor and standstill agreement reasonably satisfactory to lender (vi) the related mezzanine loan being junior and subordinate to the 200 Center Anaheim Mortgage Loan in all respects, and (vii) delivery of a rating agency confirmation with respect to the mezzanine loan.
Release of Property. Not permitted.
Terrorism Insurance.The 200 Center Anaheim Borrower is required to obtain insurance against acts of terrorism or other similar acts or events to the extent such insurance is available in form and substance reasonably satisfactory to lender (and in an amount not less than the sum of 100% of full replacement cost and 12 months of business interruption insurance, together with a 6-month extended period of indemnity). Notwithstanding the foregoing, for so long as the Terrorism Risk Insurance Act of 2002, as extended and modified by the Terrorism Risk Insurance Program Reauthorization Act of 2015 (or any extension thereof or other federal government program with substantially similar protection) is in effect, the 200 Center Anaheim Borrower is required to maintain, and the lender is required to accept, terrorism insurance which covers “covered acts” (as defined by such statute or other program), as full compliance as it relates to the risks required to be covered pursuant to the preceding sentence, so long as such statute or other program covers both domestic and foreign acts of terrorism.
This is not a research report and was not prepared by any Underwriter’s research department. Please see additional important information and qualifications at the end of this Term Sheet.
| T-124 |
(THIS PAGE INTENTIONALLY LEFT BLANK)
This is not a research report and was not prepared by any Underwriter’s research department. Please see additional important information and qualifications at the end of this Term Sheet.
| T-125 |
| BANK 2017-BNK5 | Stor-It Southern California Portfolio |
| Mortgage Loan No. 11 – Stor-It Southern California Portfolio |
| Mortgage Loan Information | Property Information | ||||||
| Mortgage Loan Seller: | WFB | Single Asset/Portfolio: | Portfolio | ||||
| Original Balance: | $33,250,000 | Location: | Various | ||||
| Cut-off Date Balance: | $33,250,000 | General Property Type: | Self Storage | ||||
| % of Initial Pool Balance: | 2.7% | Detailed Property Type: | Self Storage | ||||
| Loan Purpose: | Refinance | Title Vesting: | Fee | ||||
| Sponsor: | Craig N. Lyons | Year Built/Renovated: | Various/N/A | ||||
| Mortgage Rate: | 4.1000% | Size: | 357,999 SF | ||||
| Note Date: | 4/3/2017 | Cut-off Date Balance per SF: | $93 | ||||
| First Payment Date: | 6/1/2017 | Maturity Date Balance per SF: | $93 | ||||
| Maturity Date: | 5/1/2027 | Property Manager: | Self-Managed | ||||
| Original Term to Maturity: | 120 months | ||||||
| Original Amortization Term: | 0 months | Underwriting and Financial Information | |||||
| IO Period: | 120 months | UW NOI: | $6,096,550 | ||||
| Seasoning: | 1 months | UW NOI Debt Yield: | 18.3% | ||||
| Prepayment Provisions: | LO (25); DEF (91); O (4) | UW NOI Debt Yield at Maturity: | 18.3% | ||||
| Lockbox/Cash Mgmt Status: | Springing/Springing | UW NCF DSCR: | 4.32x | ||||
| Additional Debt Type: | N/A | Most Recent NOI: | $6,103,105 (12/31/2016) | ||||
| Additional Debt Balance: | N/A | 2nd Most Recent NOI: | $5,686,677 (12/31/2015) | ||||
| Future Debt Permitted (Type): | No (N/A) | 3rd Most Recent NOI: | $5,525,583 (12/31/2014) | ||||
| Reserves | Most Recent Occupancy: | 91.6% (3/26/2017) | |||||
| Type | Initial | Monthly | Cap | 2nd Most Recent Occupancy: | 92.4% (12/31/2016) | ||
| RE Tax: | $0 | Springing | N/A | 3rd Most Recent Occupancy: | 88.9% (12/31/2015) | ||
| Insurance: | $0 | Springing | N/A | Appraised Value (as of): | $100,000,000 (Various) | ||
| Recurring Replacements: | $0 | Springing | N/A | Cut-off Date LTV Ratio: | 33.3% | ||
| Maturity Date LTV Ratio: | 33.3% | ||||||
| Sources and Uses | ||||||
| Sources | Proceeds | % of Total | Uses | Proceeds | % of Total | |
| Loan Amount: | $33,250,000 | 99.8% | Loan Payoff(1): | $32,969,340 | 98.9% | |
| Borrower Equity: | $77,478 | 0.2% | Closing Costs: | $358,138 | 1.1% | |
| Total Sources: | $33,327,478 | 100.0% | Total Uses: | $33,327,478 | 100.0% | |
(1) One of the Stor-It Southern California Portfolio Properties (as defined below) was securitized in the BSCMS 2007-PW18 transaction.
The Mortgage Loan. The eleventh largest mortgage loan (the “Stor-It Southern California Portfolio Mortgage Loan”) is evidenced by a promissory note in the original principal amount of $33,250,000, and is secured by a first priority fee mortgage encumbering a portfolio of five self storage facilities totaling 357,999 rentable SF in California (the “Stor-It Southern California Portfolio Properties”). The proceeds of the Stor-It Southern California Portfolio Mortgage Loan were used to refinance previous mortgage loans secured by the Stor-It Southern California Portfolio Properties and pay closing costs. The previous mortgage loan for one of the Stor-It Southern California Portfolio Properties was securitized in the BSCMS 2007-PW18 transaction.
The Borrowers and the Sponsor. The borrowers are Stor-It Properties, LLC and Lyons Development Company, LLC (the “Stor-It Southern California Portfolio Borrowers”), each a single-purpose California limited liability company structured to be bankruptcy-remote, each ultimately controlled by the Stor-It Southern California Portfolio Guarantor (as defined below). The Stor-It Southern California Portfolio Guarantor owns 94.6% interest in Stor-It Properties, LLC and 100.0% interest in Lyons Development Company, LLC. Craig N. Lyons and Craig N. Lyons and Gretchen S. Lyons as trustees of the C. and G. Lyons Revocable Trust (collectively the “Stor-It Southern California Portfolio Guarantor”) are the Stor-It Southern California Portfolio Mortgage Loan non-recourse carveout guarantors.
Craig N. Lyons has over 30 years of experience in real estate development, financing and marketing specifically relating to self storage properties. Craig N. Lyons is the CEO of Stor-it Self Storage, a family-owned owner/operator of self storage properties in California. Stor-it Self Storage currently owns 13 self storage facilities: four in Los Angeles County, seven in Orange County and two in Northern California.
The Property. The Stor-It Southern California Portfolio Mortgage Loan is secured by the fee interest in a portfolio of five self storage properties totaling 357,999 rentable SF or 4,242 units (including 36 parking/RV spaces) located in southern California. The Stor-It Southern California Portfolio Properties comprise a total of 18 buildings, from one to three stories, across 10.9 total acres. Each of the Stor-It Southern California Portfolio Properties has an on-site leasing office and manager’s apartment and offers security features which include code-operated entry gates, perimeter fencing and security
This is not a research report and was not prepared by any Underwriter’s research department. Please see additional important information and qualifications at the end of this Term Sheet.
| T-126 |
| BANK 2017-BNK5 | Stor-It Southern California Portfolio |
cameras. The Stor-It Southern California Portfolio Properties range in size from 58,431 SF to 87,410 SF and were built between 1987 and 2000. As of March 26, 2017, the Stor-It Southern California Portfolio Properties were 91.6% occupied.
The following table presents certain information relating to the Stor-It Southern California Portfolio Properties:
| Property Summary | |||||||||
| Property Name – Location | Allocated Cut-off Date Loan Amount | % of Allocated Loan Amount | Occupancy | Year Built/ Renovated | Net Rentable Area (SF) | Annual UW Net Operating Income | Appraised Value | Allocated Cut- off Date LTV | |
| Stor-It Marina Del Rey – Los Angeles, CA | $12,403,000 | 37.3% | 88.9% | 1988/N/A | 87,410 | $2,258,299 | $36,800,000 | 33.7% | |
| Stor-It Aliso Viejo – Aliso Viejo, CA | $6,866,000 | 20.6% | 92.0% | 1990/N/A | 76,781 | $1,268,849 | $20,900,000 | 32.9% | |
| Stor-It Mission Viejo – Mission Viejo, CA | $5,160,000 | 15.5% | 90.4% | 1987/N/A | 68,415 | $951,732 | $15,500,000 | 33.3% | |
| Stor-It Downey – Downey, CA | $4,427,000 | 13.3% | 94.1% | 2000/N/A | 66,962 | $815,145 | $14,300,000 | 31.0% | |
| Stor-It San Juan Capistrano – San Juan Capistrano, CA | $4,394,000 | 13.2% | 93.4% | 1989/N/A | 58,431 | $802,525 | $12,500,000 | 35.2% | |
| Total/Wtd. Avg. | $33,250,000 | 100.0% | 91.6% | 357,999 | $6,096,550 | $100,000,000 | 33.3% | ||
Source:Underwritten rent roll.
The Market. The Stor-It Southern California Portfolio Properties are located in Orange County (Stor-It Aliso Viejo, Stor-It Mission Viejo and Stor-It San Juan Capistrano) and Los Angeles County (Stor-It Marina Del Rey and Stor-It Downey), California. According to a third party market research report, the Orange County market’s first quarter 2017 vacancy rate was 10.3%, while the average asking rent for a 100-SF non-climate controlled unit was $168.25 per unit. The Orange County market’s five-year quarterly average vacancy rate and average asking rent for a 100-SF non-climate controlled unit is 11.2% and $159.12 per unit, respectively. The Los Angeles market’s first quarter 2017 vacancy rate was 6.9%, while the average asking rent for a 100-SF non-climate controlled unit was $186.62 per unit. The Los Angeles market’s five-year quarterly average vacancy rate and average asking rent for a 100-SF non-climate controlled unit is 10.0% and $168.59 per unit, respectively.
The appraisal concluded to a primary trade area of a 2- to 3-mile radius around the Stor-It Southern California Portfolio Properties. A summary of estimated 2017 demographics in the 2- to 3-mile radius primary trade area is presented below.
| Demographics Summary | ||||
| Property Name – Radius | Primary Trade Area Radius | Population | Median Household Hold Income | Number of Households |
| Stor-It Marina Del Rey – Los Angeles, CA | 2 miles | 119,045 | $87,204 | 57,094 |
| Stor-It Aliso Viejo – Aliso Viejo, CA | 3 miles | 132,334 | $81,662 | 52,726 |
| Stor-It Mission Viejo – Mission Viejo, CA | 3 miles | 164,626 | $88,534 | 59,955 |
| Stor-It Downey – Downey, CA | 3 miles | 293,804 | $57,885 | 84,770 |
| Stor-It San Juan Capistrano – San Juan Capistrano, CA | 3 miles | 95,655 | $89,148 | 36,770 |
Source:Appraisal
This is not a research report and was not prepared by any Underwriter’s research department. Please see additional important information and qualifications at the end of this Term Sheet.
| T-127 |
| BANK 2017-BNK5 | Stor-It Southern California Portfolio |
Operating History and Underwritten Net Cash Flow.The following table presents certain information relating to the historical operating performance and the Underwritten Net Cash Flow at the Stor-It Southern California Portfolio Properties:
| Cash Flow Analysis | |||||
| 2014 | 2015 | 2016 | UW | UW PSF | |
| Base Rent | $7,073,189 | $7,324,127 | $7,822,959 | $7,833,856 | $21.88 |
| Grossed Up Vacancy | $0 | $0 | $0 | $1,081,444 | $3.02 |
| Merchandise Income | $19,574 | $17,245 | $17,238 | $18,019 | $0.05 |
| Other Income(1) | $203,855 | $230,354 | $234,622 | $222,944 | $0.62 |
| Less Vacancy | $0 | $0 | $0 | ($1,081,444)(2) | ($3.02) |
| Effective Gross Income | $7,296,618 | $7,571,726 | $8,074,819 | $8,074,819 | $22.56 |
| Total Operating Expenses | $1,771,035 | $1,885,049 | $1,971,714 | $1,978,269 | $5.53 |
| Net Operating Income | $5,525,583 | $5,686,677 | $6,103,105 | $6,096,550 | $17.03 |
| Capital Expenditures | $0 | $0 | $0 | $122,938 | $0.34 |
| Net Cash Flow | $5,525,583 | $5,686,677 | $6,103,105 | $5,973,612 | $16.69 |
| Occupancy % | 90.0% | 88.9% | 92.4% | 91.6%(2) | |
| NOI DSCR | 4.00x | 4.11x | 4.42x | 4.41x | |
| NCF DSCR | 4.00x | 4.11x | 4.42x | 4.32x | |
| NOI Debt Yield | 16.6% | 17.1% | 18.4% | 18.3% | |
| NCF Debt Yield | 16.6% | 17.1% | 18.4% | 18.0% | |
(1) Other Income includes administrative fees (late charges and forfeited deposits), move-in fees, and auction proceeds.
(2) The UW economic vacancy is 12.1%. The Stor-It Southern California Portfolio Properties were 91.6% occupied as of March 26, 2017.
This is not a research report and was not prepared by any Underwriter’s research department. Please see additional important information and qualifications at the end of this Term Sheet.
| T-128 |
(THIS PAGE INTENTIONALLY LEFT BLANK)
This is not a research report and was not prepared by any Underwriter’s research department. Please see additional important information and qualifications at the end of this Term Sheet.
| T-129 |
| BANK 2017-BNK5 | Richmond Marriott Short Pump |
| Mortgage Loan No. 12 – Richmond Marriott Short Pump |
| Mortgage Loan Information | Mortgaged Property Information | ||||||
| Mortgage Loan Seller: | WFB | Single Asset/Portfolio: | Single Asset | ||||
| Original Balance: | $25,400,000 | Location: | Glen Allen, VA 23060 | ||||
| Cut-off Date Balance: | $25,336,021 | General Property Type: | Hospitality | ||||
| % of Initial Pool Balance: | 2.1% | Detailed Property Type: | Full Service | ||||
| Loan Purpose: | Acquisition | Title Vesting: | Fee | ||||
| Sponsors: | J. Ryan Lingerfelt; Alan T. Lingerfelt; Four Plus Corporation | Year Built/Renovated: | 2001/2015 | ||||
| Mortgage Rate: | 4.4900% | Size: | 243 Rooms | ||||
| Note Date: | 4/7/2017 | Cut-off Date Balance per Room: | $104,263 | ||||
| First Payment Date: | 5/11/2017 | Maturity Date Balance per Room: | $84,679 | ||||
| Maturity Date: | 4/11/2027 | Property Manager: | Commonwealth Lodging Management, LLC | ||||
| Original Term to Maturity: | 120 months | ||||||
| Original Amortization Term: | 360 months | Underwriting and Financial Information | |||||
| IO Period: | 0 months | UW NOI: | $3,827,973 | ||||
| Seasoning: | 2 months | UW NOI Debt Yield: | 15.1% | ||||
| Prepayment Provisions: | LO (26); DEF (90); O (4) | UW NOI Debt Yield at Maturity: | 18.6% | ||||
| Lockbox/Cash Mgmt Status: | Springing/Springing | UW NCF DSCR: | 2.19x | ||||
| Additional Debt Type: | N/A | Most Recent NOI: | $3,804,115 (4/30/2017 TTM) | ||||
| Additional Debt Balance: | N/A | 2nd Most Recent NOI: | $3,582,315 (12/31/2016) | ||||
| Future Debt Permitted (Type): | No (N/A) | 3rd Most Recent NOI: | $1,367,209 (12/31/2015) | ||||
| Reserves | Most Recent Occupancy: | 69.3% (4/30/2017 TTM) | |||||
| Type | Initial | Monthly | Cap | 2nd Most Recent Occupancy: | 69.9% (12/31/2016) | ||
| RE Tax: | $96,103 | $19,221 | N/A | 3rd Most Recent Occupancy: | 62.8% (12/31/2015) | ||
| Insurance: | $0 | Springing | N/A | Appraised Value (as of): | $39,100,000 (3/3/2017) | ||
| Recurring Replacements(1): | $0 | $36,914 | N/A | Cut-off Date LTV Ratio: | 64.8% | ||
| Maturity Date LTV Ratio: | 52.6% | ||||||
| �� | |||||||
| Sources and Uses | ||||||
| Sources | Proceeds | % of Total | Uses | Proceeds | % of Total | |
| Loan Amount: | $25,400,000 | 65.2% | Purchase Price: | $38,500,000 | 98.8% | |
| Borrower Equity | $13,559,707 | 34.8% | Reserves: | $96,103 | 0.2% | |
| Closing Costs: | $363,604 | 0.9% | ||||
| Total Sources: | $38,959,707 | 100.0% | Total Uses: | $38,959,707 | 100.0% | |
| (1) | Monthly Recurring Replacements are initially calculated as $36,914, however, the lender may adjust the monthly recurring replacements based on the annual operating statements for the Richmond Marriott Short Pump Property (as defined below) to the greater of (x) the then-existing monthly recurring replacements or (y) one-twelfth of 4.0% of the underwritten total revenue for the prior fiscal year. |
The Mortgage Loan. The twelfth largest mortgage loan (the “Richmond Marriott Short Pump Mortgage Loan”) is secured by a first mortgage encumbering a full service hospitality property known as Richmond Marriott Short Pump in Glen Allen, Virginia (the “Richmond Marriott Short Pump Property”). The proceeds of the Richmond Marriott Short Pump Mortgage Loan, together with $13.6 million cash equity from the Richmond Marriott Short Pump Borrower (as defined below), were used to acquire the Richmond Marriott Short Pump Property, fund upfront reserves and pay closing costs.
The Borrower and the Sponsor. The borrower is FPLC Richmond Sub, LLC (the “Richmond Marriott Short Pump Borrower”), a special-purpose Delaware limited liability company. The Richmond Marriott Short Pump Borrower is controlled by Lingerfelt Commonwealth Partners and its affiliates, the managing partner (30% ownership), and Four Plus Corporation and affiliates (70% ownership). Lingerfelt Commonwealth Partners is managed by J. Ryan Lingerfelt. Established in 1957, Lingerfelt Commonwealth Partners is a full service real estate company that will also manage the Richmond Marriott Short Pump Property. Lingerfelt Commonwealth Partners is locally based in Richmond, Virginia with additional offices in Nashville, Tennessee, Jacksonville, Florida, Tampa, Florida, Greensboro, North Carolina and Virginia Beach, Virginia. Four Plus Corporation was incorporated in 1935 to own and manage inherited assets of the Appleby Family. Four Plus Corporation owns commercial real estate in New York City and the Southeast United States.
The non-recourse carveout guarantors for the Richmond Marriott Short Pump Mortgage Loan are Alan T. Lingerfelt, J. Ryan Lingerfelt, and the Four Plus Corporation.
This is not a research report and was not prepared by any Underwriter’s research department. Please see additional important information and qualifications at the end of this Term Sheet.
| T-130 |
| BANK 2017-BNK5 | Richmond Marriott Short Pump |
The Property. The Richmond Marriott Short Pump Property is a six-story, 243-room full service hotel, located on a 6.7-acre site in the Innsbrook submarket of Richmond, Virginia, within the Innsbrook Business Park. The guestroom configuration consists of 150 single king rooms, 84 double queen rooms, and 9 king suites. The guest rooms include a 55” flat screen television, new pillow-top mattresses with plush duvets, mini refrigerators, individual climate control, modern plug-in panel that includes a USB port, complimentary WiFi and an iron with ironing board. The Richmond Marriott Short Pump Property features a full-service restaurant, two lounges, 7,114 SF of meeting/event space, an indoor pool, whirlpool, fitness center, business center, a 24/7 convenience store, and guest laundry.
The Richmond Marriott Short Pump Property was built in 2001 and received a property improvement plan (“PIP”) renovation in 2015. The previous owner completed the PIP at an estimated cost of approximately $11.0MM ($45,267 per room), which upgraded corridors, elevators, stairwells, exterior, business centers, lobby, public restrooms, recreation facilities, lounge and guestrooms.
The Richmond Marriott Short Pump Property is currently subject to a management agreement with Commonwealth Lodging, a subsidiary of Lingerfelt Commonwealth Partners. Additionally, the Richmond Marriott Short Pump Property benefits from a long-term 20-year franchise agreement with Marriott International which expires in March 2037, 10 years beyond the Richmond Marriott Short Pump Mortgage Loan maturity date.
The Richmond Marriott Short Pump Property generates approximately 60% of its room nights from commercial demand, 30% from meeting and group demand and 10% from leisure demand.
| Historical Occupancy, ADR, RevPAR(1)(2) | |||||||||
Competitive Set | Richmond Marriott Short Pump | Penetration Factor | |||||||
| Year | Occupancy | ADR | RevPAR | Occupancy | ADR | RevPAR | Occupancy | ADR | RevPAR |
| 2011 | 60.3% | $102.77 | $61.97 | 55.0% | $115.11 | $63.30 | 91.2% | 112.0% | 102.1% |
| 2012 | 61.5% | $104.04 | $63.97 | 54.3% | $118.59 | $64.43 | 88.3% | 114.0% | 100.7% |
| 2013 | 64.7% | $106.77 | $69.10 | 56.0% | $121.72 | $68.17 | 86.6% | 114.0% | 98.7% |
| 2014 | 69.4% | $108.32 | $75.12 | 59.1% | $115.69 | $68.36 | 85.2% | 106.8% | 91.0% |
| 2015 | 70.2% | $112.71 | $79.14 | 50.2% | $125.46 | $62.96 | 71.5% | 111.3% | 79.6% |
| 2016 | 70.0% | $127.45 | $89.28 | 69.8% | $132.05 | $92.11 | 99.6% | 103.6% | 103.2% |
| 4/30/2017 TTM | 68.4% | $128.53 | $87.96 | 69.3% | $136.69 | $94.73 | 101.3% | 106.3% | 107.7% |
Source:Industry Report and Underwritten Operating Statements.
| (1) | The competitive set includes Embassy Suites Richmond The Commerce Center, Hyatt Place Richmond Innsbrook, Comfort Suites Innsbrook, Hilton Garden Inn Richmond Innsbrook, Westin Richmond, Hilton Richmond Hotel & Spa Short Pump and Wyndham VA Crossings Conference Center. |
| (2) | Variances between the underwriting, the appraisal and the above table with respect to Occupancy, ADR and RevPAR at the Richmond Marriott Short Pump Property are attributable to variances in reporting methodologies and/or timing differences. |
The Market. Richmond Marriott Short Pump Property is located in Glen Allen, Virginia, within the Richmond Metropolitan Statistical Area (“MSA”). Richmond is one of the political, financial and cultural centers in the Southeastern United States and serves as the state capital for Virginia. Richmond is located in the center of Eastern Virginia and consists of 13 counties and four independent cities. With a population of approximately 1.3 million people, the Richmond MSA is among the 50 largest metro areas in the United States.
Richmond has a diverse corporate presence with eight companies listed on the Fortune 500 headquartered within the MSA, including Owens and Minor, CarMax, Genworth Financial, Dominion Resources, WestRock, Performance Food Group, Markel, and Altria Group. The largest employer in Richmond is Capital One Financial with 11,262 employees. The estimated 2016 population and average household income within a one-, three-, and five-mile radius of the Richmond Marriott Short Pump Property was 6,521, 82,737, and 173,166, and $121,463, $105,855 and $98,439, respectively.
According to the appraisal, the Richmond MSA includes a total supply of 21,604 hotel rooms. The Richmond market RevPAR peaked in 2007 at $50.18 for the overall market, but then declined to a low of $37.70 by 2009 due to the recession. In 2011, the Richmond market began a sustained recovery that continues today. Since 2013, Richmond has experienced significant growth, with RevPAR up 32.0% through the forecasted 2016 year-end RevPAR of $57.68. According to the appraisal, supply remained flat in the competitive set from 2013 to 2016, with no rooms added in that time period. Additionally, the appraisal did not reveal any directly competitive properties under construction in the market.
This is not a research report and was not prepared by any Underwriter’s research department. Please see additional important information and qualifications at the end of this Term Sheet.
| T-131 |
| BANK 2017-BNK5 | Richmond Marriott Short Pump |
Competitive properties to the Richmond Marriott Short Pump Property are shown in the table below:
| Competitive Property Summary | ||||||||
| Property Name | Year Opened | No. of Rooms | Commercial Demand | Meeting & Group Demand | Leisure Demand | 2016 Occ. | 2016 ADR | 2016 RevPAR |
| Richmond Marriott Short Pump(1) | 2001 | 243 | 60% | 30% | 10% | 70% | $132 | $92 |
| Embassy Suites Richmond The Commerce Center | 1986 | 224 | 55% | 25% | 20% | 66% | $120 | $79 |
| Hyatt Place Richmond Innsbrook | 1991 | 124 | 60% | 10% | 30% | 69% | $115 | $79 |
| Comfort Suites Insbrook | 1998 | 125 | 55% | 10% | 35% | 68% | $111 | $75 |
| Hilton Garden Inn Richmond Innsbrook | 2000 | 155 | 65% | 15% | 20% | 70% | $118 | $83 |
| Westin Richmond | 2008 | 250 | 60% | 30% | 10% | 71% | $145 | $103 |
| Hilton Richmond Hotel & Spa Short Pump | 2009 | 254 | 60% | 30% | 10% | 73% | $148 | $108 |
| Wyndham VA Crossings Conference Center | 2008 | 183 | 50% | 40% | 10% | 68% | $116 | $79 |
| Total/Weighted Average | 1,558 | 70% | $129 | $90 | ||||
Source:Appraisal
| (1) | Variances between the underwriting, the appraisal and the Historical Occupancy, ADR and RevPAR table with respect to Occupancy, ADR and RevPAR at the Richmond Marriott Short Pump Property are attributable to variances in reporting methodologies and/or timing differences. |
Operating History and Underwritten Net Cash Flow. The following table presents certain information relating to the historical operating performance and the Underwritten Net Cash Flow at the Richmond Marriott Short Pump:
| Cash Flow Analysis(1) | ||||||
| 2014 | 2015 | 2016 | 4/30/2017 TTM | UW | UW per Room | |
| Occupancy | 58.8% | 50.1% | 69.9% | 69.3% | 69.3% | |
| ADR | $115.69 | $125.46 | $132.36 | $137.01 | $137.01 | |
| RevPAR | $68.04 | $62.82 | $92.58 | $94.96 | $94.96 | |
| Rooms Revenue | $6,035,193 | $5,571,382 | $8,211,482 | $8,422,539 | $8,422,539 | $34,661 |
| Food & Beverage | 1,801,291 | 1,596,380 | 2,667,880 | 2,854,213 | 2,854,213 | 11,746 |
| Other Income(2) | 71,622 | 53,126 | 91,122 | 81,356 | 81,356 | 335 |
| Total Revenue | $7,908,106 | $7,220,888 | $10,970,485 | $11,358,108 | $11,358,108 | $46,741 |
| Total Expenses | 6,210,764 | 5,853,679 | 7,388,170 | 7,553,993 | 7,530,135 | 30,988 |
| Net Op. Income | $1,697,342 | $1,367,209 | $3,582,315 | $3,804,115 | $3,827,973 | $15,753 |
| FF&E | 0 | 0 | 0 | 0 | 454,324 | 1,870 |
| Net Cash Flow | $1,697,342 | $1,367,209 | $3,582,315 | $3,804,115 | $3,373,648 | $13,883 |
| NOI DSCR | 1.10x | 0.89x | 2.32x | 2.47x | 2.48x | |
| NCF DSCR | 1.10x | 0.89x | 2.32x | 2.47x | 2.19x | |
| NOI Debt Yield | 6.7% | 5.4% | 14.1% | 15.0% | 15.1% | |
| NCF Debt Yield | 6.7% | 5.4% | 14.1% | 15.0% | 13.3% | |
| (1) | Occupancy, ADR and RevPAR figures are based on the underwriting, which have been taken from financial statements provided by the Richmond Marriott Short Pump Borrower. Variances between the underwriting, the appraisal and the Historical Occupancy, ADR, RevPAR table with respect to Occupancy, ADR and RevPAR at the Richmond Marriott Short Pump Property are attributable to variances in reporting methodologies and/or timing differences. |
| (2) | Other Income includes Gift Shop revenue, Valet/Guest Laundry, and Vending. |
This is not a research report and was not prepared by any Underwriter’s research department. Please see additional important information and qualifications at the end of this Term Sheet.
| T-132 |
(THIS PAGE INTENTIONALLY LEFT BLANK)
This is not a research report and was not prepared by any Underwriter’s research department. Please see additional important information and qualifications at the end of this Term Sheet.
| T-133 |
| BANK 2017-BNK5 | Charlotte Southpark Marriott |
| Mortgage Loan No. 13 – Charlotte Southpark Marriott |
| Mortgage Loan Information | Mortgaged Property Information | ||||||
| Mortgage Loan Seller: | WFB | Single Asset/Portfolio: | Single Asset | ||||
| Original Balance: | $25,000,000 | Location: | Charlotte, NC 28211 | ||||
| Cut-off Date Balance: | $24,942,077 | General Property Type: | Hospitality | ||||
| % of Initial Pool Balance: | 2.0% | Detailed Property Type: | Full Service | ||||
| Loan Purpose: | Refinance | Title Vesting: | Fee | ||||
| Sponsor: | Thomas Point Ventures, L.P. | Year Built/Renovated: | 1984/2017 | ||||
| Mortgage Rate: | 4.9000% | Size: | 199 Rooms | ||||
| Note Date: | 3/30/2017 | Cut-off Date Balance per Room: | $125,337 | ||||
| First Payment Date: | 5/11/2017 | Maturity Date Balance per Room: | $103,176 | ||||
| Maturity Date: | 4/11/2027 | Property Manager: | Marriott Hotel Services, Inc. | ||||
| Original Term to Maturity: | 120 months | ||||||
| Original Amortization Term: | 360 months | Underwriting and Financial Information | |||||
| IO Period: | 0 months | UW NOI: | $3,687,398 | ||||
| Seasoning: | 2 month | UW NOI Debt Yield: | 14.8% | ||||
| Prepayment Provisions: | LO (26); DEF (90); O (4) | UW NOI Debt Yield at Maturity: | 18.0% | ||||
| Lockbox/Cash Mgmt Status: | Springing/Springing | UW NCF DSCR: | 1.95x | ||||
| Additional Debt Type: | N/A | Most Recent NOI: | $2,821,265 (2/28/2017 TTM) | ||||
| Additional Debt Balance: | N/A | 2nd Most Recent NOI: | $3,581,631 (12/31/2016) | ||||
| Future Debt Permitted (Type): | No (N/A) | 3rd Most Recent NOI: | $4,351,240 (12/31/2015) | ||||
| Reserves | Most Recent Occupancy: | 75.6% (2/28/2017 TTM) | |||||
| Type | Initial | Monthly | Cap | 2nd Most Recent Occupancy: | 75.0% (12/31/2016) | ||
| RE Tax: | $0 | Springing | N/A | 3rd Most Recent Occupancy: | 76.2% (12/31/2015) | ||
| Insurance: | $0 | Springing | N/A | Appraised Value (as of): | $46,600,000 (3/31/2017) | ||
| Recurring Replacements: | $0 | Springing | N/A | Cut-off Date LTV Ratio: | 53.5% | ||
| Maturity Date LTV Ratio: | 44.1% | ||||||
| Sources and Uses | ||||||
| Sources | Proceeds | % of Total | Uses | Proceeds | % of Total | |
| Loan Amount: | $25,000,000 | 100.0% | Return of Equity: | $24,687,476 | 98.7% | |
| Closing Costs: | $312,524 | 1.3% | ||||
| Total Sources: | $25,000,000 | 100.0% | Total Uses: | $25,000,000 | 100.0% | |
The Mortgage Loan. The thirteenth largest mortgage loan (the “Charlotte Southpark Marriott Mortgage Loan”) is secured by a first mortgage encumbering a full service hospitality property in Charlotte, North Carolina (the “Charlotte Southpark Marriott Property”). The proceeds of the Charlotte Southpark Marriott Mortgage Loan were used to encumber the property, pay closing costs and return equity to the sponsor. The Charlotte Southpark Marriott Mortgage Loan was previously securitized in the BSCMS 2007-PW15 transaction.
The Borrower and the Sponsor. The borrower is South Park Real Estate, LLC (the “Charlotte Southpark Marriott Borrower”), a special-purpose Delaware limited liability company with one independent director. The Charlotte Southpark Marriott Borrower is majority owned and controlled by Thomas Point Ventures, L.P., the sponsor of the Charlotte Southpark Marriott Mortgage Loan. JWM Family Enterprises, L.P. is the general partner of Thomas Point Ventures, L.P., which is also majority owned by six trusts for the benefit of the Marriott family. Established in 1993, JWM Family Enterprises, L.P. owns 16 hotels in four states that are operated by Marriott International.
The non-recourse carveout guarantor for the Charlotte Southpark Marriott Mortgage Loan is the sponsor, Thomas Point Ventures, L.P.. The guarantor has no environmental liability, and the recourse liability under the non-recourse carveout guaranty is capped at 110% of the amount outstanding. A $5.0 million environmental insurance policy was obtained.
The Property. The Charlotte Southpark Marriott Property is a 6-story, 199-room full service hotel, located on the corner of Rexford and Roxborough Road, in Charlotte, North Carolina, less than a quarter mile from the South Park Mall, a 1.3 million square foot regional shopping center and numerous low and mid rise office buildings. The guestroom configuration consists of 71 club level king rooms, 56 king rooms, 36 club floor queen rooms, 34 standard queen rooms and 2 presidential suites. The Charlotte Southpark Marriott Property is in the process of expanding its room count from 195 to 199, by reducing the number of suites offered and reducing the size of the 2 presidential suites. All guestrooms feature flat-panel televisions with premium channels, desks and lounge chairs. The Charlotte Southpark Marriott Property features a full service restaurant serving three meals daily, approximately 8,142 SF of meeting space on the first floor, a fully-equipped fitness center and access to a private club, a lounge featuring complimentary breakfast and wireless internet.
This is not a research report and was not prepared by any Underwriter’s research department. Please see additional important information and qualifications at the end of this Term Sheet.
| T-134 |
| BANK 2017-BNK5 | Charlotte Southpark Marriott |
The Charlotte Southpark Marriott Property was built in 1984 and was purchased by the sponsor in 2007. At acquisition, the sponsor completed an approximate $9.8 million ($49,246 per room) property improvement plan. From 2016 to 2017 the sponsor spent approximately $5.0 million ($25,220 per room) to complete guest room renovations, including increasing the room count from 195 to 199 and $508,320 ($2,554 per room) to renovate the club lounge.
The Charlotte Southpark Marriott Property is currently subject to a management agreement with Marriott Hotel Services, Inc. and is operating under the Marriott brand. The management agreement is currently set to expire on December 25, 2026 with one ten-year extension option.
The Charlotte Southpark Marriott Property generates approximately 80% of its room nights from transient demand and 20% from meeting and group demand.
| Historical Occupancy, ADR, RevPAR(1)(2) | |||||||||||
Competitive Set | Charlotte Southpark Marriott | Penetration Factor | |||||||||
| Year | Occupancy | ADR | RevPAR | Occupancy | ADR | RevPAR | Occupancy | ADR | RevPAR | ||
| 2/28/2015 TTM | 68.0% | $149.75 | $101.82 | 75.6% | $169.37 | $127.99 | 111.1% | 113.1% | 125.7% | ||
| 2/29/2016 TTM | 73.0% | $156.99 | $114.66 | 76.1% | $182.07 | $138.61 | 104.2% | 116.0% | 120.9% | ||
| 2/28/2017 TTM | 73.3% | $162.33 | $119.06 | 62.4% | $179.89 | $112.21 | 85.0% | 110.8% | 94.2% | ||
Source:Industry Report
| (1) | The competitive set includes Crowne Plaza Charlotte Executive Park, DoubleTree Suites Hotel Charlotte Southpark, Hampton Inn Suites Charlotte South Park @ Phillips Place, and Luxury Collection The Ballantyne Hotel Charlotte. |
| (2) | Variances between the underwriting, the appraisal and the above table with respect to Occupancy, ADR and RevPAR at the Charlotte Southpark Marriott Property are attributable to variances in reporting methodologies and/or timing differences. In addition, the competitive set used in the Competitive Property Summary table from the appraisal set forth below is different from the competitive set used in this table. |
The Market.The Charlotte Southpark Marriott Property is located in in the Charlotte-Concord-Gastonia Metropolitan Statistical Area (“MSA”). According to the appraisal, the population of the MSA is approximately 2.5 million and has grown at an annual growth rate of 2.3% from 2005 to 2015. Commercial demand in the Charlotte Southpark Marriott Property market area is generated by a diverse base of corporate tenants in the surrounding area, including Carolinas Healthcare System, Wells Fargo & Co. Walmart and Sam’s Club Stores and American Airlines. In addition, leisure demand is generated from a number of sports attractions such as the Charlotte Motor Speedway, NASCAR Hall of Fame, Carolina Panthers football team and Charlotte Hornets basketball team.
Access to the MSA is provided by the Charlotte Douglas International Airport, approximately eight miles northwest of the Charlotte Southpark Marriott Property’s neighborhood. The Charlotte Southpark Marriott Property is 4.5 miles east of Interstate 77, the primary commuter artery in the Charlotte area, providing access to Interstates 85 and 485. In addition, the Charlotte Area Transit System operates buses, shuttles, vanpools, carpools and specialized transportation services.
According to a third party market report, the estimated 2016 population and average household income within a one-, three-, and five-mile radius of the Charlotte Southpark Marriott Property was 9,099, 88,744, and 245,869 respectively, and $135,770, $124,320 and $95,600, respectively.
According to a third party market report, the Charlotte market includes a total supply of 34,516 hotel rooms. For the trailing twelve months ending February 28, 2017, there was an increase in supply of 1.5% and an increase in demand of 2.5%. In addition, there has been an overall 3.5% average increase in ADR for the trailing twelve month period ending February 28, 2017. According to the appraisal, supply remained flat in the competitive set from 2011 to 2016, with only four rooms added in that time period. The appraisal noted 270 rooms currently under construction, which will only be partially competitive with the Charlotte Southpark Marriott Property.
Competitive properties to the Charlotte Southpark Marriott Property are shown in the table below:
| Competitive Property Summary | |||||||
| Property Name | Year Opened | No. of Rooms | Transient Demand | Meeting & Group Demand | 2016 Occ.(1) | 2016 ADR(1) | 2016 RevPAR(1) |
| Charlotte Southpark Marriott(1) | 1984 | 195(2) | 80% | 20% | 69% | $179 | $123 |
| DoubleTree Suites Hotel Charlotte Southpark | 1985 | 208 | 75% | 25% | 77% | $164 | $126 |
| Hampton Inn Suites Charlotte South Park @ Phillips Place | 1998 | 124 | 90% | 10% | 80% | $174 | $139 |
| Renaissance Charlotte South Park Hotel | 1989 | 264 | 80% | 20% | 76% | $174 | $132 |
| Courtyard Charlotte South Park | 1989 | 149 | 90% | 10% | 76% | $139 | $106 |
| Crowne Plaza Charlotte Executive Park | 1983 | 300 | 65% | 35% | 76% | $106 | $81 |
| Total/Weighted Average | 1,240 | 75% | $152 | $115 | |||
Source:Appraisal
| (1) | Variances between the underwriting, the appraisal and the Historical Occupancy, ADR, RevPAR table with respect to Occupancy, ADR and RevPAR at the Charlotte Southpark Marriott Property are attributable to variances in reporting methodologies and/or timing differences. In addition, the competitive set used in the Historical Occupancy, ADR, RevPAR table is different from the competitive set used in this table. |
| (2) | Number of Rooms was increased to 199 during the $5.0 million renovations, which took place from November 2016 through March 2017. |
This is not a research report and was not prepared by any Underwriter’s research department. Please see additional important information and qualifications at the end of this Term Sheet.
| T-135 |
| BANK 2017-BNK5 | Charlotte Southpark Marriott |
Operating History and Underwritten Net Cash Flow. The following table presents certain information relating to the historical operating performance and the Underwritten Net Cash Flow at the Charlotte Southpark Marriott Property:
| Cash Flow Analysis(1) | |||||||||||||
| 2014 | 2015 | 2016 | 2/28/2017 TTM | UW | UW per Room | ||||||||
| Occupancy | 76.4% | 76.2% | 75.0% | 75.6% | 68.3% | ||||||||
| ADR | $166.39 | $179.28 | $179.29 | $181.49 | $181.49 | ||||||||
| RevPAR | $127.31 | $136.91 | $134.69 | $135.96 | $123.87 | ||||||||
| Rooms Revenue | $9,061,544 | $9,744,454 | $8,775,661 | $7,986,762 | $8,997,596 | $45,214 | |||||||
| Food & Beverage | 2,709,545 | 2,829,836 | 2,638,890 | 2,305,417 | 2,638,890 | 13,261 | |||||||
| Other Income(2) | 64,908 | 169,501 | 142,734 | 125,461 | 142,734 | 717 | |||||||
| Total Revenue | $11,835,997 | $12,743,791 | $11,557,285 | $10,417,640 | $11,779,220 | $59,192 | |||||||
| Total Expenses | 8,075,739 | 8,392,551 | 7,975,654 | 7,596,375 | 8,091,822 | 40,662 | |||||||
| Net Operating Income(3) | $3,760,258 | $4,351,240 | $3,581,631 | $2,821,265 | $3,687,398 | $18,530 | |||||||
| FF&E | 0 | 0 | 0 | 0 | 588,961 | 2,960 | |||||||
| Net Cash Flow | $3,760,258 | $4,351,240 | $3,581,631 | $2,821,265 | $3,098,437 | $15,570 | |||||||
| NOI DSCR | 2.36x | 2.73x | 2.25x | 1.77x | 2.32x | ||||||||
| NCF DSCR | 2.36x | 2.73x | 2.25x | 1.77x | 1.95x | ||||||||
| NOI Debt Yield | 15.1% | 17.4% | 14.4% | 11.3% | 14.8% | ||||||||
| NCF Debt Yield | 15.1% | 17.4% | 14.4% | 11.3% | 12.4% | ||||||||
| (1) | Occupancy, ADR and RevPAR figures are based on the underwriting, which have been taken from financial statements provided by the Charlotte Southpark Marriott Borrower. Variances between the underwriting, the appraisal and the Historical Occupancy, ADR, RevPAR table with respect to Occupancy, ADR and RevPAR at the Charlotte Southpark Marrtiott Property are attributable to variances in reporting methodologies and/or timing differences. |
| (2) | Other Income includes telephone, internet, gift shop and other miscellaneous revenue |
| (3) | Net Operating Income declined in 2016 and 2/28/2017 TTM due to a $5.0 million guest room renovation that took place from November 2016 through March 2017, which took numerous rooms offline during that time in order to complete the room upgrades. |
This is not a research report and was not prepared by any Underwriter’s research department. Please see additional important information and qualifications at the end of this Term Sheet.
| T-136 |
(THIS PAGE INTENTIONALLY LEFT BLANK)
This is not a research report and was not prepared by any Underwriter’s research department. Please see additional important information and qualifications at the end of this Term Sheet.
| T-137 |
| BANK 2017-BNK5 | 36 East 14th Street |
| Mortgage Loan No. 14 – 36 East 14th Street |
| Mortgage Loan Information | Property Information | ||||||
| Mortgage Loan Seller: | BANA | Single Asset/Portfolio: | Single Asset | ||||
| Original Balance: | $23,000,000 | Location: | New York, NY 10003 | ||||
| Cut-off Date Balance: | $23,000,000 | General Property Type: | Retail | ||||
| % of Initial Pool Balance: | 1.9% | Detailed Property Type: | Single Tenant | ||||
| Loan Purpose: | Refinance | Title Vesting: | Fee | ||||
| Sponsor: | The Feil Organization | Year Built/Renovated: | 2006/N/A | ||||
| Mortgage Rate: | 4.4200% | Size: | 5,066 SF | ||||
| Note Date: | 5/1/2017 | Cut-off Date Balance per SF: | $4,540 | ||||
| First Payment Date: | 6/1/2017 | Maturity Date Balance per SF: | $4,540 | ||||
| Maturity Date: | 5/1/2027 | Property Manager: | BLDG Management Co, Inc. | ||||
| Original Term to Maturity: | 120 months | ||||||
| Original Amortization Term: | 0 months | ||||||
| IO Period: | 120 months | Underwriting and Financial Information | |||||
| Seasoning: | 1 month | UW NOI: | $1,636,394 | ||||
| Prepayment Provisions: | LO (25); DEF (91); O (4) | UW NOI Debt Yield: | 7.1% | ||||
| Lockbox/Cash Mgmt Status: | Hard/Springing | UW NOI Debt Yield at Maturity: | 7.1% | ||||
| Additional Debt Type: | N/A | UW NCF DSCR: | 1.58x | ||||
| Additional Debt Balance: | N/A | Most Recent NOI: | $1,513,398 (12/31/2016) | ||||
| Future Debt Permitted (Type): | No (N/A) | 2nd Most Recent NOI: | $1,515,178 (12/31/2015) | ||||
| Reserves | 3rd Most Recent NOI: | $1,515,772 (12/31/2014) | |||||
| Type | Initial | Monthly | Cap | Most Recent Occupancy: | 100.0% (6/1/2017) | ||
| RE Tax: | $51,523 | $10,305 | N/A | 2nd Most Recent Occupancy: | 100.0% (12/31/2016) | ||
| Insurance: | $0 | Springing | N/A | 3rd Most Recent Occupancy: | 100.0% (12/31/2015) | ||
| Recurring Replacements: | $0 | Springing | N/A | Appraised Value (as of): | $40,700,000 (3/17/2017) | ||
| TI/LC: | $0 | Springing | N/A | Cut-off Date LTV Ratio: | 56.5% | ||
| Maturity Date LTV Ratio: | 56.5% | ||||||
| Sources and Uses | ||||||
| Sources | Proceeds | % of Total | Uses | Proceeds | % of Total | |
| Loan Amount: | $23,000,000 | 100.0% | Loan Payoff: | $16,876,191 | 73.4% | |
| Closing Costs: | $592,211 | 2.6% | ||||
| Reserves: | $51,523 | 0.2% | ||||
| Return of Equity: | $5,480,075 | 23.8% | ||||
| Total Sources: | $23,000,000 | 100.00% | Total Uses: | $23,000,000 | 100.00% | |
The Mortgage Loan. The fourteenth largest mortgage loan (the “36 East 14th Street Mortgage Loan”) is evidenced by a promissory note in the original principal amount of $23,000,000, secured by a first priority fee mortgage encumbering a single tenant retail condominium comprised of 5,066 SF located in New York, New York (the “36 East 14th Street Property”). The proceeds of the 36 East 14th Street Mortgage Loan were used to refinance a previous loan of approximately $16,876,191, fund upfront reserves, pay closing costs and return equity to the 36 East 14th Street Borrower. The previous mortgage loan was securitized in the MSC 2007-IQ16 transaction.
The Borrower and the Sponsor. The borrower is 36 East 14th Owner LLC (the “36 East 14th Street Borrower”), a recycled single-purpose Delaware limited liability company, with one independent director. Jeffrey Feil, Lloyd Goldman, Stanley Chera and Ralph Braha are the non-recourse carve-out guarantors.
Jeffrey Feil is the President and Chief Executive Officer of The Feil Organization, the 36 East 14th Street Mortgage Loan sponsor. The Feil Organization is a New York based real estate investment, development and management firm that owns and has developed and managed over 26 million SF of retail, commercial and industrial properties, over 5,000 residential rental units and hundreds of net leased properties. Mr. Feil is a founding partner of the real estate lending platform RCG Longview, and also serves on the Board of Governors of the New York Real Estate Board and as President of The Feil Family Foundation.
Lloyd Goldman is the President of BLDG Management Co., Inc., the 36 East 14th Street Property manager. BLDG Management Co., Inc. and its affiliates own and manage a national real estate portfolio of in excess of 400 properties, including over 7,000 residential units and over 20 million SF of commercial properties. BLDG Management Co., Inc. and its affiliates employ over 80 people for property management, leasing and support and over 750 people for the operation and maintenance of its properties.
This is not a research report and was not prepared by any Underwriter’s research department. Please see additional important information and qualifications at the end of this Term Sheet.
| T-138 |
| BANK 2017-BNK5 | 36 East 14th Street |
The Property. The 36 East 14th Street Property is a 5,066 SF retail condominium comprised of grade and basement levels located at 36 East 14th Street, on the southwest corner of University Place, in the Union Square neighborhood of Manhattan. The 36 East 14th Street Property contains 3,025 SF on the grade level and 2,041 SF of selling space on the lower level. The whole site is improved with a 15-story residential tower and retail condominium known as Claremont Square Condominium (the “Condominium”). The Board of Managers of Claremont Square Condominium has been organized to provide for the administration of the Condominium. There are currently seven members of the Board, one of which was appointed by the 36 East 14th Street Borrower. The 36 East 14th Street Borrower does not have control of the Condominium. In general, the condominium association maintains and repairs the common elements of the Condominium, the structural elements of the building and all components of life safety, fire alarm and sprinkler systems serving the building and levies assessments. The 36 East 14th Street Borrower, as the commercial unit owner, is afforded certain rights under the condominium documents. Specifically, the condominium documents may not be amended in any way that adversely affects the 36 East 14th Street Borrower’s rights or obligations without first obtaining their consent to such amendment.
Major Tenant.The 36 East 14th Street Property is 100% occupied by Bank of America, N.A. (“BofA”), which is also the originator and mortgage loan seller. BofA’s lease commenced May 2007 and currently expires July 2027 with two five-year extension options. The lease is modified gross and has no termination options. The lease provides for current yearly rent of $1,694,000 or $334.39 PSF. BofA (rated A+, A1 and A+ by Fitch, Moodys and S&P, respectively) is the consumer banking subsidiary of Bank of America Corporation (NYSE:BAC).
As of March 31, 2017, Bank of America Corporation has reported total assets of $2.248 trillion with total customer deposits of $1.272 trillion. BofA offers traditional and money market savings accounts, CDs and IRAs, noninterest- and interest-bearing checking accounts, and investment accounts and products, as well as credit and debit cards, residential mortgages and home equity loans, and direct and indirect loans. This segment provides its products and services through approximately 4,600 financial centers, 15,900 ATMs, call centers, and online and mobile platforms. Bank of America Corporation was founded in 1874 in Charlotte, North Carolina.
The following table presents certain information relating to the lease at the 36 East 14th Street Property:
| Tenant Summary(1) | |||||||
| Tenant Name | Credit Rating (Fitch/Moody’s/S&P)(2) | Tenant SF | Approximate % of SF | Annual UW Rent(1) | % of Total Annual UW Rent | Annual UW Rent PSF | Lease Expiration |
| Tenant | |||||||
| Bank of America, N.A. | A+/A1/A+ | 5,066 | 100.0% | $1,778,700 | 100.0% | $351.11 | 7/31/2027 |
| Subtotal/Wtd. Avg. | 5,066 | 100.0% | $1,778,700 | 100.0% | $351.11 | ||
| Vacant Space | 0 | 0.0% | $0 | 0.0% | $0.00 | ||
| Total/Wtd. Avg. | 5,066 | 100.0% | $1,778,700 | 100.0% | $351.11 | ||
| (1) | Information is based on the underwritten rent roll. Annual UW Rent is equal to the current rent for BofA plus straight-line rent of $84,680. |
| (2) | Certain ratings are those of the parent company whether or not the parent guarantees the lease. |
The following table presents certain information relating to the lease rollover schedule at the 36 East 14th Street Property:
| Lease Rollover Schedule(1) | ||||||||
| Year | # of Leases Rolling | SF Rolling | % of Total SF Rolling | Cumulative % of Total SF Rolling | Total UW Rent Rolling | UW Rent PSF Rolling | % of Total Rent Rolling | Cumulative % of Total Rent Rolling |
| MTM | 0 | 0 | 0.0% | 0.0% | $0 | $0.00 | 0.0% | 0.0% |
| 2017 | 0 | 0 | 0.0% | 0.0% | $0 | $0.00 | 0.0% | 0.0% |
| 2018 | 0 | 0 | 0.0% | 0.0% | $0 | $0.00 | 0.0% | 0.0% |
| 2019 | 0 | 0 | 0.0% | 0.0% | $0 | $0.00 | 0.0% | 0.0% |
| 2020 | 0 | 0 | 0.0% | 0.0% | $0 | $0.00 | 0.0% | 0.0% |
| 2021 | 0 | 0 | 0.0% | 0.0% | $0 | $0.00 | 0.0% | 0.0% |
| 2022 | 0 | 0 | 0.0% | 0.0% | $0 | $0.00 | 0.0% | 0.0% |
| 2023 | 0 | 0 | 0.0% | 0.0% | $0 | $0.00 | 0.0% | 0.0% |
| 2024 | 0 | 0 | 0.0% | 0.0% | $0 | $0.00 | 0.0% | 0.0% |
| 2025 | 0 | 0 | 0.0% | 0.0% | $0 | $0.00 | 0.0% | 0.0% |
| 2026 | 0 | 0 | 0.0% | 0.0% | $0 | $0.00 | 0.0% | 0.0% |
| 2027 | 1 | 5,066 | 100.0% | 100.0% | $1,778,700 | $351.11 | 100.0% | 100.0% |
| Thereafter | 0 | 0 | 0.0% | 100.0% | $0 | $0.00 | 0.0% | 100.0% |
| Vacant | 0 | 0 | 0.0% | 100.0% | $0 | $0.00 | 0.0% | 100.0% |
| Total/Wtd. Avg. | 1 | 5,066 | 100.0% | $1,778,700 | $351.11 | 100.0% | ||
| (1) | Information is based on the underwritten rent roll. Total UW Rent Rolling is equal to the current rent for BofA plus straight-line rent of $84,700. |
This is not a research report and was not prepared by any Underwriter’s research department. Please see additional important information and qualifications at the end of this Term Sheet.
| T-139 |
| BANK 2017-BNK5 | 36 East 14th Street |
The Market. The 36 East 14th Street Property is located at 36 East 14th Street, on the southwest corner of University Place, in the Union Square neighborhood of Manhattan. The Union Square neighborhood is a popular destination for tourists and local residents alike. There is a significant retail presence surrounding the park, including boutiques, restaurants, and big-box stores including Whole Foods, Nordstrom Rack, and Best Buy. Major retail thoroughfares include Broadway, Union Square West, Union Square East, and 14th Street. The area also has a number of office and residential buildings, as well as buildings associated with both the NYU and New School campuses. At the northeast end of the park is the upscale W New York – Union Square hotel.
According to the appraisal, the estimated 2016 population within the 36 East 14th Street Property’s 10003 zip code is 58,816. The estimated 2016 average household income within the 36 East 14th Street Property’s 10003 zip code is $145,125.
According to the appraisal, the 36 East 14th Street Property is located within the Gramercy Park retail submarket of Manhattan, which as of year-end 2016 had a total retail inventory of 2,271,167 SF and a vacancy rate of 1.1%. According to a third party market research report, the average asking rental rate in the fall of 2016 for ground floor retail space along Fifth Avenue between 14th and 23rd Streets was between $300 and $480 PSF with an average rent of $390 PSF.
The following table presents recent leasing data at comparable retail properties with respect to the 36 East 14th Street Property:
| Comparable Lease Summary | |||||||
| Property Name/Address | Corner | Tenant Name | Lease Size (SF) | Lease Date | Lease Term (Yrs.) |
Rent/SF(1) | Lease Type |
36 East 14th Street New York, NY | Yes | Bank of America, N.A | 5,066 | 5/16/2007(1) | 15.0 | $334.39(1) | Modified Gross |
41 Union Square West New York, NY | No | NYX Cosmetics | 4,300 | 5/1/2016 | NAV | $372.09 | Modified Gross |
97 Fifth Avenue New York, NY | Yes | Aldo | 2,800 | 8/1/2016 | NAV | $400.00 | Modified Gross |
105 Fifth Avenue New York, NY | Yes | Banana Republic | 29,000 | 1/1/2015 | NAV | $120.69 | Modified Gross |
114 Fifth Avenue New York, NY | Yes | Lululemon | 14,853 | 12/1/2014 | NAV | $205.35 | Modified Gross |
33 Union Square West New York, NY | No | Dylan’s Candy Bar | 5,100 | 9/1/2014 | NAV | $254.90 | Modified Gross |
872 Broadway New York, NY | Yes | Fresh Market | 2,000 | 7/1/2014 | NAV | $318.00 | Modified Gross |
Source:Appraisal
| (1) | BofA recently exercised their first, five-year renewal option, extending their lease expiration from July 2022 to July 2027. Rent/SF shown for the 36 East 14th Street Property is based on the current rent for BofA. |
Operating History and Underwritten Net Cash Flow.The following table presents certain information relating to the historical operating performance and Underwritten Net Cash Flow at the 36 East 14th Street Property:
| Cash Flow Analysis | |||||
| 2014 | 2015 | 2016 | UW | UW PSF | |
| Base Rent(1) | $1,540,000 | $1,540,000 | $1,540,000 | $1,778,700 | $351.11 |
| Total Recoveries | $2,799 | $2,799 | $2,799 | $0 | $0.00 |
| Less Vacancy & Credit Loss | $0 | $0 | $0 | ($88,935) | (5.0%) |
| Effective Gross Income | $1,542,799 | $1,542,799 | $1,542,799 | $1,689,765 | $333.55 |
| Total Operating Expenses | ($27,027) | ($27,621) | ($29,401) | ($53,371) | ($10.54) |
| Net Operating Income | $1,515,772 | $1,515,178 | $1,513,398 | $1,636,394 | $323.02 |
| Capital Expenditures | $0 | $0 | $0 | $1,013 | $0.20 |
| TI/LC | $0 | $0 | $0 | $5,057 | $1.00 |
| Net Cash Flow | $1,515,772 | $1,515,178 | $1,513,398 | $1,630,324 | $321.82 |
| Occupancy %(2) | 100.0% | 100.0% | 100.0% | 95.0% | |
| NOI DSCR | 1.47x | 1.47x | 1.47x | 1.59x | |
| NCF DSCR | 1.47x | 1.47x | 1.47x | 1.58x | |
| NOI Debt Yield | 6.6% | 6.6% | 6.6% | 7.1% | |
| NCF Debt Yield | 6.6% | 6.6% | 6.6% | 7.1% | |
| (1) | UW Base Rent is equal to the current rent for BofA plus straight-line rent of $84,700. |
| (2) | UW Occupancy % represents economic occupancy. As of June 1, 2017, the 36 East 14th Street Property is 100.0% physically occupied. |
This is not a research report and was not prepared by any Underwriter’s research department. Please see additional important information and qualifications at the end of this Term Sheet.
| T-140 |
(THIS PAGE INTENTIONALLY LEFT BLANK)
This is not a research report and was not prepared by any Underwriter’s research department. Please see additional important information and qualifications at the end of this Term Sheet.
| T-141 |
| BANK 2017-BNK5 | Capital Bank Plaza |
| Mortgage Loan No. 15 – Capital Bank Plaza |
| Mortgage Loan Information | Mortgaged Property Information | |||||
| Mortgage Loan Seller: | WFB | Single Asset/Portfolio: | Single Asset | |||
| Original Balance: | $23,000,000 | Location: | Raleigh, NC 27601 | |||
| Cut-off Date Balance: | $23,000,000 | General Property Type: | Office | |||
| % of Initial Pool Balance: | 1.9% | Detailed Property Type: | CBD | |||
| Loan Purpose: | Refinance | Title Vesting: | Fee | |||
| Sponsor: | Bobby R. Lewis; Donald F. Carter | Year Built/Renovated: | 1965/2002 | |||
| Mortgage Rate: | 4.6800% | Size: | 148,142 SF | |||
| Note Date: | 5/1/2017 | Cut-off Date Balance per SF: | $155 | |||
| First Payment Date: | 6/11/2017 | Maturity Date Balance per SF): | $134 | |||
| Maturity Date: | 5/11/2027 | Property Manager: | RDC Property Management, LLC (borrower-related) | |||
| Original Term to Maturity: | 120 months | |||||
| Original Amortization Term: | 360 months | Underwriting and Financial Information | ||||
| IO Period: | 24 months | UW NOI: | $2,322,245 | |||
| Seasoning: | 1 month | UW NOI Debt Yield: | 10.1% | |||
| Prepayment Provisions: | LO (25); DEF (91); O (4) | UW NOI Debt Yield at Maturity: | 11.7% | |||
| Lockbox/Cash Mgmt Status: | Springing/Springing | UW NCF DSCR: | 1.94x (IO) 1.48x (P&I) | |||
| Additional Debt Type: | N/A | Most Recent NOI: | $2,168,552 (12/31/2016) | |||
| Additional Debt Balance: | N/A | 2nd Most Recent NOI: | $2,181,064 (12/31/2015) | |||
| Future Debt Permitted (Type): | No (N/A) | 3rd Most Recent NOI: | $1,914,520 (12/31/2014) | |||
| Reserves | Most Recent Occupancy: | 95.7% (4/24/2017) | ||||
| Type | Initial | Monthly | Cap | 2nd Most Recent Occupancy: | 94.0% (12/31/2016) | |
| RE Tax: | $48,745 | $9,749 | N/A | 3rd Most Recent Occupancy: | 99.0% (12/31/2015) | |
| Insurance: | $11,233 | $2,247 | N/A | Appraised Value (as of): | $32,000,000 (3/7/2017) | |
| Recurring Replacements: | $0 | $2,469 | $112,500(1) | Cut-off Date LTV Ratio: | 71.9% | |
| TI/LC: | $0 | $25,075 | $1,137,500(2) | Maturity Date LTV Ratio: | 61.7% | |
| Rent Concession: | $77,000 | $0 | N/A | |||
| Sources and Uses | ||||||
| Sources | Proceeds | % of Total | Uses | Proceeds | % of Total | |
| Loan Amount: | 23,000,000 | 100.0% | Loan Payoff: | $18,488,773 | 80.4% | |
| Reserves: | $136,978 | 0.6% | ||||
| Closing Costs: | $202,168 | 0.9% | ||||
| Return of Equity: | $4,172,081 | 18.1% | ||||
| Total Sources: | $23,000,000 | 100.0% | Total Uses: | $23,000,000 | 100.0% | |
| (1) | The Recurring Replacements reserve is capped at $112,500; however, may be reduced to $54,000, as long as there is no event of default, the lender determines the Capital Bank Plaza Borrower (as defined below) is properly maintaining the Capital Bank Plaza Property (as defined below), and upon written request from the Capital Bank Plaza Borrower with satisfaction of the following conditions between July 1 and October 1, 2022: (i) Capital Bank and Clark Nexsen (or replacement tenants acceptable to the lender): (a) renew or extend their leases on terms and conditions acceptable to the lender; and (b) are in occupancy, open for business, paying full unabated rent and all tenant improvements and leasing commissions (“TI/LCs”) have been paid; (ii) the economic occupancy at the Capital Bank Plaza Property is at least 95%; and (iii) the net operating income debt yield is at least 8.5% |
| (2) | The TI/LC reserve is capped at $1,137,500; however, it may be reduced to $546,000, as long as there is no event of default, the lender determines the Capital Bank Plaza Borrower is properly maintaining the Capital Bank Plaza Property, and upon written request from the Capital Bank Plaza Borrower with satisfaction of the following conditions between July 1 and October 1, 2022: (i) Capital Bank and Clark Nexsen (or replacement tenants acceptable to the lender): (a) renew or extend their leases on terms and conditions acceptable to the lender; and (b) are in occupancy, open for business, paying full unabated rent and all TI/LCs have been paid; (ii) the economic occupancy at the Capital Bank Plaza Property is at least 95%; and (iii) the net operating income debt yield is at least 8.5% |
The Mortgage Loan. The fifteenth largest mortgage loan (the “Capital Bank Plaza Mortgage Loan”) is evidenced by a promissory note in the original principal amount of $23,000,000 and is secured by a first priority fee mortgage encumbering an office property located in Raleigh, North Carolina (the “Capital Bank Plaza Center Property”). The proceeds of the Capital Bank Plaza Mortgage Loan were primarily used to refinance existing debt (previously securitized in CMLT 2008-LS1) on the Capital Bank Plaza Property, fund reserves, pay closing costs and return equity to the Capital Bank Plaza Borrower (as defined below).
The Borrower and the Sponsors.The borrower is 333 Ventures, LLC (the “Capital Bank Plaza Borrower”), a single-purpose North Carolina limited liability company. The borrower sponsors and non-recourse carve-out guarantors are Bobby R. Lewis and Donald F. Carter, co-founders of Raleigh Development Company (“RDC”). Founded in 2003, RDC is a real estate development, building, leasing and property management company with projects throughout North Carolina.
This is not a research report and was not prepared by any Underwriter’s research department. Please see additional important information and qualifications at the end of this Term Sheet.
| T-142 |
| BANK 2017-BNK5 | Capital Bank Plaza |
The Property.The Capital Bank Plaza Property is a 148,142 SF, 15-story, Class A office building located in the central business district (“CBD”) of Raleigh, North Carolina. Built in 1965 and situated on a 0.3-acre parcel, the Capital Bank Plaza Property was acquired in 2004 by the Capital Bank Plaza Borrower, which has since invested approximately $7.0 million ($48.90 per SF) of capital improvements to renovate and modernize the Capital Bank Plaza Property.
As of April 24, 2017, the Capital Bank Plaza Property was 95.7% leased to 26 tenants with the largest tenant being Capital Bank Financial Corp. (“Capital Bank”) (44.1% of total NRA and 46.9% of the total underwritten base rent). On May 4, 2017, Capital Bank agreed to be sold to First Horizon National Corp. (“First Horizon”) (rated BBB-/Baa3/BBB- by Fitch/ Moody’s/S&P, respectively); however, the $2.2 billion acquisition still needs approval from regulators and shareholders of both companies. Assuming the acquisition succeeds, it is expected to close in the fourth quarter of 2017. First Horizon has announced that it plans to continue using the Capital Bank brand outside of Tennessee.
Capital Bank, which has been in occupancy at the Capital Bank Plaza Property since April 2006, currently operates a Capital Bank retail branch in the lobby which represents Capital Bank’s largest branch by deposits ($665.3 million) accounting for approximately 11.2% of Capital Bank’s total deposits. In addition to the 2,400 SF lobby bank branch, Capital Bank has signage on the building, also leasing 59,616 SF (40.2% of total NRA) of office space and 3,314 SF (2.2% of total NRA) of storage space. Leases representing approximately 54.2% of the total NRA and 55.3% of the total underwritten base rent have been in-place for over 10 years. The Capital Bank Plaza Property has averaged 94.0% occupancy since 2006.
The following table presents certain information relating to the leases at the Capital Bank Plaza Property:
| Tenant Summary(1) | |||||||
| Tenant Name | Credit Rating (Fitch/Moody’s/S&P) | Tenant SF | Approx. % of SF | Annual UW Rent | % of Total Annual UW Rent | Annual UW Rent PSF(2) | Lease Expiration |
| Major Tenants | |||||||
| Capital Bank(3)(4) | NR/NR/NR | 65,330 | 44.1% | $1,616,518 | 46.9% | $24.74 | Various |
| Clark Nexsen(5) | NR/NR/NR | 29,689 | 20.0% | $683,685 | 19.8% | $23.03 | Various |
| Sfl+a Architects(6) | NR/NR/NR | 6,088 | 4.1% | $154,333 | 4.5% | $25.35 | Various |
| Jacob’s (FKA KingStubbins) | NR/NR/NR | 6,362 | 4.3% | $147,353 | 4.3% | $23.16 | 1/31/2018 |
| DeMent Askew(7) | NR/NR/NR | 6,008 | 4.1% | $134,876 | 3.9% | $22.45 | Various |
| Subtotal/Wtd. Avg. | 113,477 | 76.6% | $2,736,765 | 79.3% | $24.12 | ||
| Other Tenants(8) | 28,228 | 19.1% | $712,610 | 20.7% | $25.24 | ||
| Vacant Space | 6,437 | 4.3% | $0 | 0% | $0.00 | ||
| Total/Wtd. Avg.(8) | 148,142 | 100.0% | $3,449,375 | 100% | $24.34 | ||
| (1) | Information is based on the underwritten rent roll. |
| (2) | Wtd. Avg. Annual UW Rent PSF excludes vacant space. |
| (3) | Capital Bank leases 62,016 SF of office and bank branch space for a weighted average annual underwritten rent of $25.80 per SF expiring March 31, 2021 and 3,314 square feet of storage space with an annual underwritten rent of $5.00 per SF on a month-to-month basis. |
| (4) | Capital Bank has entered into a sublease commencing July 1, 2017 of 10,955 SF (7.4% of the NRA) to FilterEasy, Inc., expiring in March 19, 2019. The Capital Bank SF and Annual U/W Rent presented above reflect all space leased to Capital Bank. |
| (5) | Clark Nexsen leases 29,499 SF of office space for an annual underwritten rent of $23.15 per SF expiring June 30, 2022 and 190 SF of storage space with an annual underwritten rent of $5.00 per SF on a month-to-month basis. |
| (6) | Sfl+a Architects leases 6,024 SF of office space for an annual underwritten rent of $25.53 per SF expiring July 31, 2019 and 540 SF of storage space with an annual underwritten rent of $8.44 per SF on a month-to-month basis. |
| (7) | DeMent Askew leases 5,443 SF of office space for an annual underwritten rent of $24.43 per SF expiring March 15, 2018 and 565 SF of storage space with an annual underwritten rent of $3.37 per SF on a month-to-month basis. |
| (8) | Includes one unit occupied as a conference room (1,328 SF), with no attributed underwritten base rent. The Other Tenants Annual UW Base Rent PSF and Total Annual UW Base Rent PSF excluding this space are $26.49 PSF and $23.49 PSF, respectively. |
This is not a research report and was not prepared by any Underwriter’s research department. Please see additional important information and qualifications at the end of this Term Sheet.
| T-143 |
| BANK 2017-BNK5 | Capital Bank Plaza |
The following table presents certain information relating to the lease rollover schedule at the Capital Bank Plaza Property:
| Lease Rollover Schedule(1)(2) | ||||||||
| Year | # of Leases Rolling | SF | UW Rent PSF Rolling | Approx. | Approx. | Total UW Rent Rolling | Approx. % of Total Rent Rolling | Approx. Cumulative % of Total Rent Rolling |
| MTM(3) | 10 | 6,377 | $6.61 | 4.3% | 4.3% | $42,133 | 1.2% | 1.2% |
| 2017 | 10 | 3,695 | $27.20 | 2.5% | 6.8% | $100,486 | 2.9% | 4.1% |
| 2018 | 8 | 16,803 | $26.73 | 11.3% | 18.1% | $449,139 | 13.0% | 17.2% |
| 2019 | 4 | 14,477 | $24.87 | 9.8% | 27.9% | $360,091 | 10.4% | 27.6% |
| 2020 | 2 | 2,384 | $22.37 | 1.6% | 29.5% | $53,322 | 1.5% | 29.1% |
| 2021 | 11 | 63,634 | $25.80 | 43.0% | 72.5% | $1,641,612 | 47.6% | 76.7% |
| 2022 | 4 | 29,499 | $23.15 | 19.9% | 92.4% | $682,902 | 19.8% | 96.5% |
| 2023 | 0 | 0 | $0.00 | 0.0% | 92.4% | $0 | 0.0% | 96.5% |
| 2024 | 1 | 4,836 | $24.75 | 3.3% | 95.7% | $119,691 | 3.5% | 100.0% |
| 2025 | 0 | 0 | $0.00 | 0.0% | 95.7% | $0 | 0.0% | 100.0% |
| 2026 | 0 | 0 | $0.00 | 0.0% | 95.7% | $0 | 0.0% | 100.0% |
| 2027 | 0 | 0 | $0.00 | 0.0% | 95.7% | $0 | 0.0% | 100.0% |
| 2028 and Beyond | 0 | 0 | $0.00 | 0.0% | 95.7% | $0 | 0.0% | 100.0% |
| Vacant | 0 | 6,437 | $0.00 | 4.3% | 100.0% | $0 | 0.0% | 100.0% |
| Total/Wtd. Avg.(3) | 50 | 148,142 | $24.34 | 100.0% | $3,449,375 | 100.0% | ||
| (1) | Information is based on the underwritten rent roll. |
| (2) | Certain tenants may have lease termination options that are exercisable prior to the originally stated expiration date of the subject lease and that are not considered in the lease rollover schedule. |
| (3) | Includes one unit occupied as a conference room (1,328 SF), with no attributed underwritten base rent. The Total Annual UW Base Rent PSF excluding this space is $23.49 PSF. |
The Market.The Capital Bank Plaza Property is located in the Raleigh, North Carolina CBD, bounded by East Davies Street to the south, Fayetteville Street to the west and South Wilmington Street to the east. The Capital Bank Plaza Property is located within two blocks of the Wake County Courthouse, the Raleigh Convention Center, five Triangle Transit bus stations and 12 separate parking garages. According to the appraisal, as of 2016, the estimated population within a one-, three- and five-mile radius of the Capital Bank Plaza Property was 16,390, 99,648 and 202,530, respectively, and the average household income within the same radii was $49,526, $63,765 and $66,839, respectively.
According to a third-party market research report, the Capital Bank Plaza Property is located within the Downtown Raleigh submarket, which accounts for approximately 8.0% of the overall Raleigh/Durham office market. As of the first quarter of 2017, the submarket reported total inventory of 162 office properties totaling approximately 7.7 million SF with a 5.7% vacancy rate. The appraisal concluded to the following market rents for the Capital Bank Plaza Property: $25.00 PSF with a base year stop lease type for the office space and $5.00 PSF with a full service gross lease type for the storage space.
This is not a research report and was not prepared by any Underwriter’s research department. Please see additional important information and qualifications at the end of this Term Sheet.
| T-144 |
| BANK 2017-BNK5 | Capital Bank Plaza |
The following table presents recent leasing data at comparable office properties with respect to the Capital Bank Plaza Property:
| Comparable Lease Summary | ||||||||
Property Name/Address | Year Built/ Renovated |
Size (SF) |
Tenant Name | Lease Size (SF) |
Lease Date | Lease Term (Yrs.) |
Rent/SF |
Lease Type |
Capital Bank Plaza 333 Fayetteville Street Raleigh, North Carolina | 1965/2002 | 148,142 | Capital Bank(1) | 65,330 | April 2016 | 5.0 | $24.74 | Base Year Stop |
Two Hanover Square 434 Fayetteville Street Mall, Raleigh, NC | 1991/1996 | 435,259 | Yates McLamb | 13,000 | March 2015
| 7.0 | $23.50 | Base Year Stop |
227 Fayetteville 227 Fayetteville Street Raleigh, NC | 1964/N/A | 111,451 | Cohera Medica | 16,745 | February 2016
| 7.4 | $28.00 | Base Year Stop |
One City Plaza 421 Fayetteville Street Raleigh, NC | 1986/2008 | 395,539 | Morningstar | 11,700 | January 2017 | 7.3 | $26.25 | Base Year Stop |
One City Plaza 421 Fayetteville Street Raleigh, NC | 1986/2008 | 395,539 | BDO | 18,000 | June 2016
| 10.5 | $26.75 | Base Year Stop |
Charter Square 555 Fayetteville Street Raleigh, NC | 2015/N/A | 243,106 | Alston & Bird, LLP | 17,500 | December 2016
| 11.2 | $32.50 | Base Year Stop |
Charter Square 555 Fayetteville Street Raleigh, NC | 2015/N/A | 243,106 | Distil Networks Inc | 7,727 | April 2016
| 6.3 | $29.95 | Base Year Stop |
Source:Appraisal and underwritten rent roll.
| (1) | Capital Bank leases 62,016 SF of office and bank branch space for a weighted average annual underwritten rent of $25.80 per SF expiring March 31, 2021 and 3,314 square feet of storage space with an annual underwritten rent of $5.00 per SF on a month-to-month basis. |
Operating History and Underwritten Net Cash Flow.The following table presents certain information relating to the operating history and underwritten net cash flow at the Capital Bank Plaza Property:
| Cash Flow Analysis | ||||||
| 2013 | 2014 | 2015 | 2016 | UW | UW PSF | |
| Base Rent | $2,989,899 | $2,894,602 | $3,264,949 | $3,121,368 | $3,605,960(1) | $24.34 |
| Total Recoveries | $7,918 | ($10,954) | $8,704 | $91,167 | $56,301 | $0.38 |
| Other Income | $127,769 | $300,572 | $337,134 | $330,391 | $327,912 | $2.21 |
| Vacancy | ($0) | ($0) | ($0) | ($0) | ($252,417)(2) | (6.8%) |
| Effective Gross Income | $3,125,586 | $3,184,220 | $3,610,787 | $3,542,926 | $3,737,756 | $25.23 |
| Total Operating Expenses | $1,086,246 | $1,269,700 | $1,429,723 | $1,374,375 | $1,415,511 | $9.56 |
| Net Operating Income | $2,039,340 | $1,914,520 | $2,181,064 | $2,168,552 | $2,322,245 | $15.68 |
| Capital Expenditures | $0 | $0 | $0 | $0 | $29,628 | $0.20 |
| TI/LC | $0 | $0 | $0 | $0 | $175,896 | $1.19 |
| Net Cash Flow | $2,039,340 | $1,914,520 | $2,181,064 | $2,168,552 | $2,116,720 | $14.29 |
| Occupancy % | 99.0% | 99.0% | 99.0% | 94.0% | 93.0%(2) | |
| NOI DSCR (IO) | 1.87x | 1.75x | 2.00x | 1.99x | 2.13x | |
| NOI DSCR (P&I) | 1.43x | 1.34x | 1.53x | 1.52x | 1.63x | |
| NCF DSCR (IO) | 1.87x | 1.75x | 2.00x | 1.99x | 1.94x | |
| NCF DSCR (P&I) | 1.43x | 1.34x | 1.53x | 1.52x | 1.48x | |
| NOI Debt Yield | 8.9% | 8.3% | 9.5% | 9.4% | 10.1% | |
| NCF Debt Yield | 8.9% | 8.3% | 9.5% | 9.4% | 9.2% | |
| (1) | UW Base Rent includes gross up of vacant space and rent steps through September 2017. |
| (2) | Underwritten vacancy is 7.0%. As of April 24, 2017, the Capital Bank Plaza Property was 95.7% physically and economically occupied. The underwritten vacancy is based on the actual economic vacancy as of April 24, 2017. As of the same date, the physical vacancy was 4.3%. |
This is not a research report and was not prepared by any Underwriter’s research department. Please see additional important information and qualifications at the end of this Term Sheet.
| T-145 |
| BANK 2017-BNK5 |
This material was prepared by sales, trading, banking or other non-research personnel of one of the following: Morgan Stanley & Co. LLC, Morgan Stanley & Co. International Limited, Morgan Stanley Japan Limited and/or Morgan Stanley Dean Witter Asia Limited (together with their affiliates, hereinafter “Morgan Stanley”), Wells Fargo Securities, LLC (together with its affiliates, “Wells Fargo”) and Merrill Lynch, Pierce, Fenner & Smith Incorporated (together with its affiliates, “BofA Merrill Lynch”, and collectively with Morgan Stanley and Wells Fargo, the “Underwriters”). This material was not produced by an Underwriter’s research analyst, although it may refer to an Underwriter’s research analyst or research report. Unless otherwise indicated, these views (if any) are the author’s and may differ from those of the fixed income or equity research departments of the Underwriters or others in those firms.
This material may have been prepared by or in conjunction with the respective trading desks of the Underwriters that may deal as principal in or own or act as market maker or liquidity provider for the securities/instruments (or related derivatives) mentioned herein. The trading desk may have accumulated a position in the subject securities/instruments based on the information contained herein. Trading desk materials are not independent of the proprietary interests of the Underwriters, which may conflict with your interests. Each of the Underwriters may also perform or seek to perform investment banking services for the issuers of the securities and instruments mentioned herein.
The information contained in this material is subject to change, completion or amendment from time to time, and the information in this material supersedes information in any other communication relating to the securities referred to in this material. This material is not a solicitation to participate in any trading strategy, and is not an offer to sell any security or instrument or a solicitation of an offer to buy or sell any security or instrument in any jurisdiction where an offer, solicitation or sale is not permitted. Unless otherwise set forth in this material, any securities referred to in this material may not have been registered under the U.S. Securities Act of 1933, as amended, and, if not, may not be offered or sold absent an exemption therefrom. Recipients are required to comply with any legal or contractual restrictions on their purchase, holding, sale, exercise of rights or performance of obligations under any securities/instruments transaction.
The securities/instruments discussed in this material may not be suitable for all investors. This material has been prepared and issued by the Underwriters for intended distribution to market professionals and institutional investor clients. Other recipients should seek independent investment advice prior to making any investment decision based on this material. This material does not provide individually tailored investment advice or offer tax, regulatory, accounting or legal advice. Prior to entering into any proposed transaction, recipients should determine, in consultation with their own investment, legal, tax, regulatory and accounting advisors, the economic risks and merits, as well as the legal, tax, regulatory and accounting characteristics and consequences, of the transaction. You should consider this material as only a single factor in making an investment decision.
The value of and income from investments may vary because of changes in interest rates, foreign exchange rates, default rates, prepayment rates, securities/instruments prices, market indexes, operational or financial conditions of companies or other factors. There may be time limitations on the exercise of options or other rights in securities/instruments transactions. Past performance is not necessarily a guide to future performance. Estimates of future performance are based on assumptions that may not be realized. Actual events may differ from those assumed and changes to any assumptions may have a material impact on any projections or estimates. Other events not taken into account may occur and may significantly affect the projections or estimates. Certain assumptions may have been made for modeling purposes only to simplify the presentation and/or calculation of any projections or estimates, and the Underwriters do not represent that any such assumptions will reflect actual future events. Accordingly, there can be no assurance that estimated returns or projections will be realized or that actual returns or performance results will not materially differ from those estimated herein. Some of the information contained in this document may be aggregated data of transactions in securities or other financial instruments executed by an Underwriter that has been compiled so as not to identify the underlying transactions of any particular customer.
Notwithstanding anything herein to the contrary, the Underwriters and each recipient hereof (and their employees, representatives, and other agents) may disclose to any and all persons, without limitation of any kind from the commencement of discussions, the U.S. federal and state income tax treatment and tax structure of the transaction and all materials of any kind (including opinions or other tax analyses) that are provided to it relating to the tax treatment and tax structure (as such terms are defined in Treasury Regulation 1.6011-4). For this purpose, “tax structure” is limited to facts relevant to the U.S. federal and state income tax treatment of the transaction and does not include information relating to the identity of the parties, their affiliates, agents or advisors. This authorization of tax disclosure is retroactively effective to the commencement of discussions with prospective investors regarding the transactions contemplated herein.
THE DISTRIBUTION OF THIS MATERIAL (A) IF MADE BY A PERSON WHO IS NOT AN AUTHORIZED PERSON UNDER THE FINANCIAL SERVICES AND MARKETS ACT 2000 (“FSMA”), IS BEING MADE ONLY TO, OR DIRECTED ONLY AT, PERSONS WHO (I) ARE OUTSIDE THE UNITED KINGDOM, OR (II) HAVE PROFESSIONAL EXPERIENCE IN MATTERS RELATING TO INVESTMENTS AND QUALIFY AS INVESTMENT PROFESSIONALS IN ACCORDANCE WITH ARTICLE 19(5) OF THE FINANCIAL SERVICES AND MARKETS ACT 2000 (FINANCIAL PROMOTION) ORDER 2005 (THE “FINANCIAL PROMOTION ORDER”), OR (III) ARE PERSONS FALLING WITHIN ARTICLE 49(2)(A) THROUGH (D) (HIGH NET WORTH COMPANIES, UNINCORPORATED ASSOCIATIONS, ETC.) OF THE FINANCIAL PROMOTION ORDER; AND (B) IF MADE BY A PERSON WHO IS AN AUTHORIZED PERSON UNDER THE FSMA, IS BEING MADE ONLY TO, OR DIRECTED ONLY AT, PERSONS WHO (I) ARE OUTSIDE THE UNITED KINGDOM, OR (II) HAVE PROFESSIONAL EXPERIENCE IN MATTERS RELATING TO INVESTMENTS AND QUALIFY AS INVESTMENT PROFESSIONALS IN ACCORDANCE WITH ARTICLE 14(5) OF THE FINANCIAL SERVICES AND MARKETS ACT 2000 (PROMOTION OF COLLECTIVE INVESTMENT SCHEMES) (EXEMPTIONS) ORDER 2001 (THE “PROMOTION OF COLLECTIVE INVESTMENT SCHEMES EXEMPTIONS ORDER”), OR (III) ARE PERSONS FALLING WITHIN ARTICLE 22(2)(A) THROUGH (D) (“HIGH NET WORTH COMPANIES, UNINCORPORATED ASSOCIATIONS, ETC.”) OF THE PROMOTION OF COLLECTIVE INVESTMENT SCHEMES EXEMPTIONS ORDER, OR (IV) ARE PERSONS TO WHOM THE ISSUING ENTITY MAY LAWFULLY BE PROMOTED IN ACCORDANCE WITH CHAPTER 4.12 OF THE UK FINANCIAL CONDUCT AUTHORITY’S CONDUCT OF BUSINESS SOURCEBOOK.
THE OFFERED CERTIFICATES HAVE NOT BEEN AND WILL NOT BE REGISTERED UNDER THE FINANCIAL INSTRUMENTS EXCHANGE ACT OF JAPAN (LAW NO. 25 OF 1948, AS AMENDED (THE “FIEL”)), AND EACH OF MORGAN STANLEY & CO. LLC, WELLS FARGO SECURITIES, LLC AND MERRILL LYNCH, PIERCE, FENNER & SMITH INCORPORATED HAS AGREED THAT IT WILL NOT OFFER OR SELL ANY OFFERED CERTIFICATES, DIRECTLY OR INDIRECTLY, IN JAPAN OR TO, OR FOR THE BENEFIT OF, ANY JAPANESE PERSON, OR TO OTHERS FOR RE-OFFERING OR RESALE, DIRECTLY OR INDIRECTLY, IN JAPAN OR TO ANY JAPANESE PERSON, EXCEPT PURSUANT TO AN EXEMPTION FROM THE REGISTRATION REQUIREMENTS OF, AND OTHERWISE IN COMPLIANCE WITH, THE FIEL AND ANY OTHER APPLICABLE LAWS AND REGULATIONS. FOR THE PURPOSES OF THIS PARAGRAPH, “JAPANESE PERSON” SHALL MEAN ANY PERSON RESIDENT IN JAPAN, INCLUDING ANY CORPORATION OR OTHER ENTITY ORGANIZED UNDER THE LAWS AND REGULATIONS OF JAPAN.
© 2017 Morgan Stanley
This is not a research report and was not prepared by any Underwriter’s research department. Please see additional important information and qualifications at the end of this Term Sheet.
| T-146 |