| FREE WRITING PROSPECTUS | ||
| FILED PURSUANT TO RULE 433 | ||
| REGISTRATION FILE NO.: 333-206582-13 | ||
 |  |
MSC 2017-HR2
Free Writing Prospectus
Structural and Collateral Term Sheet
$942,737,075
(Approximate Total Mortgage Pool Balance)
$815,467,000
(Approximate Offered Certificates)
Morgan Stanley Capital I Inc.
as Depositor
Morgan Stanley Mortgage Capital Holdings LLC
Citi Real Estate Funding Inc.
Starwood Mortgage Funding III LLC
Argentic Real Estate Finance LLC
as Sponsors and Mortgage Loan Sellers
Commercial Mortgage Pass-Through Certificates
Series 2017-HR2
December 6, 2017
| MORGAN STANLEY Co-Lead Bookrunning Manager | Citigroup Co-Lead Bookrunning Manager | |
| The Williams Capital Group, L.P. | ||
| Co-Manager | ||
STATEMENT REGARDING THIS FREE WRITING PROSPECTUS
The depositor has filed a registration statement (including a prospectus) with the SEC (File No. 333-206582) for the offering to which this communication relates. Before you invest, you should read the prospectus in that registration statement and other documents the depositor has filed with the SEC for more complete information about the depositor, the issuing entity and this offering. You may get these documents for free by visiting EDGAR on the SEC web site atwww.sec.gov. Alternatively, the depositor or any underwriter or any dealer participating in the offering will arrange to send you the prospectus if you request it by calling toll free 1-866-718-1649 or by email toprospectus@ms.com.
| This is not a research report and was not prepared by any Underwriter’s research department. It was prepared by the Underwriters’ sales, trading, banking or other non-research personnel. Please see additional important information and qualifications at the end of this Term Sheet. |
Neither this Term Sheet nor anything contained herein shall form the basis for any contract or commitment whatsoever.The information contained herein is preliminary as of the date hereof.This Term Sheet is subject to change, completion or amendment from time to time.The information contained herein will be superseded by similar information delivered to you as part of the Preliminary Prospectus.The information contained herein supersedes any such information previously delivered.The information contained herein should be reviewed only in conjunction with the entire Preliminary Prospectus.All of the information contained herein is subject to the same limitations and qualifications contained in the Preliminary Prospectus.The information contained herein does not contain all relevant information relating to the underlying mortgage loans or mortgaged properties.Such information is described in the Preliminary Prospectus.The information contained herein will be more fully described in the Preliminary Prospectus.The information contained herein should not be viewed as projections, forecasts, predictions or opinions with respect to value.Prior to making any investment decision, prospective investors are strongly urged to read the Preliminary Prospectus in its entirety.Neither the Securities and Exchange Commission nor any state securities commission has approved or disapproved of these securities or determined if this Term Sheet is truthful or complete.Any representation to the contrary is a criminal offense.
IMPORTANT NOTICE RELATING TO AUTOMATICALLY GENERATED EMAIL DISCLAIMERS
Any legends, disclaimers or other notices that may appear at the bottom of, or attached to, the email communication to which this Term Sheet may have been attached are not applicable to this Term Sheet and should be disregarded. Such legends, disclaimers or other notices have been automatically generated as a result of this Term Sheet having been sent via Bloomberg or another email system.
IMPORTANT NOTICE REGARDING THE CONDITIONS FOR THIS OFFERING OF ASSET-BACKED SECURITIES
THE ASSET-BACKED SECURITIES REFERRED TO IN THIS TERM SHEET ARE BEING OFFERED WHEN, AS AND IF ISSUED. IN PARTICULAR, YOU ARE ADVISED THAT THE ASSET-BACKED SECURITIES, AND THE ASSET POOL BACKING THEM, ARE SUBJECT TO MODIFICATION OR REVISION (INCLUDING, AMONG OTHER THINGS, THE POSSIBILITY THAT ONE OR MORE CLASSES OF SECURITIES MAY BE SPLIT, COMBINED OR ELIMINATED), AT ANY TIME PRIOR TO ISSUANCE OR AVAILABILITY OF A FINAL PROSPECTUS. AS A RESULT, YOU MAY COMMIT TO PURCHASE SECURITIES THAT HAVE CHARACTERISTICS THAT MAY CHANGE, AND YOU ARE ADVISED THAT ALL OR A PORTION OF THE SECURITIES MAY NOT BE ISSUED THAT HAVE THE CHARACTERISTICS DESCRIBED IN THIS TERM SHEET. OUR OBLIGATION TO SELL SECURITIES TO YOU IS CONDITIONED ON THE SECURITIES AND THE UNDERLYING TRANSACTION HAVING THE CHARACTERISTICS DESCRIBED IN THIS TERM SHEET. IF WE DETERMINE THAT THE FOREGOING CONDITION IS NOT SATISFIED IN ANY MATERIAL RESPECT, WE WILL NOTIFY YOU, AND NEITHER THE ISSUING ENTITY NOR ANY UNDERWRITER WILL HAVE ANY OBLIGATION TO YOU TO DELIVER ALL OR ANY PORTION OF THE SECURITIES WHICH YOU HAVE COMMITTED TO PURCHASE, AND THERE WILL BE NO LIABILITY BETWEEN US AS A CONSEQUENCE OF THE NON-DELIVERY.
This is not a research report and was not prepared by any Underwriter’s research department. Please see additional important information and qualifications at the end of this Term Sheet. |
T-2
| MSC 2017-HR2 | Structural Overview |
Offered Certificates
| Class | Expected Ratings (DBRS/Fitch/Moody’s)(1) | Approximate Initial Certificate Principal Balance or Notional Amount(2) | Approximate Initial Credit Support(3) | Pass-Through Rate Description | Expected Weighted Average Life (Years)(4) | Expected Principal Window (Months)(4) | Certificate Principal UW NOI Debt Yield(5) | Certificate Principal to Value Ratio(6) | ||||||||
| Class A-1 | AAA(sf)/AAAsf/Aaa(sf) | $15,000,000 | 30.000% | (7) | 2.88 | 1 – 60 | 15.7% | 40.5% | ||||||||
| Class A-2 | AAA(sf)/AAAsf/Aaa(sf) | $114,600,000 | 30.000% | (7) | 4.98 | 60 – 60 | 15.7% | 40.5% | ||||||||
| Class A-SB | AAA(sf)/AAAsf/Aaa(sf) | $26,300,000 | 30.000% | (7) | 7.47 | 60 – 117 | 15.7% | 40.5% | ||||||||
| Class A-3 | AAA(sf)/AAAsf/Aaa(sf) | $235,000,000 | 30.000% | (7) | 9.91 | 117 – 120 | 15.7% | 40.5% | ||||||||
| Class A-4 | AAA(sf)/AAAsf/Aaa(sf) | $269,015,000 | 30.000% | (7) | 9.98 | 120 – 120 | 15.7% | 40.5% | ||||||||
| Class X-A | AAA(sf)/AAAsf/Aaa(sf) | $659,915,000(8) | N/A | Variable IO(9) | N/A | N/A | N/A | N/A | ||||||||
| Class X-B | A (sf)/A-sf/NR | $155,552,000(8) | N/A | Variable IO(9) | N/A | N/A | N/A | N/A | ||||||||
| Class A-S | AAA(sf)/AAAsf/Aa2(sf) | $58,922,000 | 23.750% | (7) | 9.98 | 120 – 120 | 14.4% | 44.1% | ||||||||
| Class B | AA(sf)/AA-sf/NR | $48,315,000 | 18.625% | (7) | 9.98 | 120 – 120 | 13.5% | 47.0% | ||||||||
| Class C | A(low)(sf)/A-sf/NR | $48,315,000 | 13.500% | (7) | 9.98 | 120 – 120 | 12.7% | 50.0% |
Privately Offered Certificates(10)
| Class | Expected Ratings (DBRS/Fitch/Moody’s)(1) | Approximate Initial Certificate Principal Balance or Notional Amount(2) | Approximate Initial Credit Support(3) | Pass-Through Rate Description | Expected Weighted Average Life (Years)(4) | Expected Principal Window (Months)(4) | Certificate Principal UW NOI Debt Yield(5) | Certificate Principal to Value Ratio(6) | ||||||||
| Class X-D(11) | A(low)(sf)/BBBsf/NR | $32,053,000(8) | N/A | Variable IO(9) | N/A | N/A | N/A | N/A | ||||||||
| Class D(11) | BBB(high)(sf)/BBB-sf/NR | $32,053,000 | 10.100% | (7) | 9.98 | 120 – 120 | 12.2% | 52.0% | ||||||||
| Class E-RR(11) | BBB(low)(sf)/BBB-sf/NR | $22,154,000 | 7.750% | (7) | 9.98 | 120 – 120 | 11.9% | 53.3% | ||||||||
| Class F-RR | BB(high)(sf)/BB+sf/NR | $15,320,000 | 6.125% | (7) | 9.98 | 120 – 120 | 11.7% | 54.3% | ||||||||
| Class G-RR | BB(low)(sf)/BB-sf/NR | $11,784,000 | 4.875% | (7) | 9.98 | 120 – 120 | 11.6% | 55.0% | ||||||||
| Class H-RR | B(sf)/B-sf/NR | $10,606,000 | 3.750% | (7) | 9.98 | 120 – 120 | 11.4% | 55.6% | ||||||||
| Class J-RR | NR/NR/NR | $35,353,074 | 0.000% | (7) | 9.98 | 120 – 120 | 11.0% | 57.8% |
| (1) | Ratings shown are those of DBRS, Inc. (“DBRS”), Fitch Ratings, Inc. (“Fitch”) and Moody’s Investors Service, Inc. (“Moody’s”). Certain nationally recognized statistical rating organizations that were not hired by the depositor may use information they receive pursuant to Rule 17g-5 under the Securities Exchange Act of 1934, as amended, or otherwise to rate the certificates. There can be no assurance as to what ratings a non-hired nationally recognized statistical rating organization would assign. See “Risk Factors—Other Risks Relating to the Certificates—Nationally Recognized Statistical Rating Organizations May Assign Different Ratings to the Certificates; Ratings of the Certificates Reflect Only the Views of the Applicable Rating Agencies as of the Dates Such Ratings Were Issued; Ratings May Affect ERISA Eligibility; Ratings May Be Downgraded” and “Ratings” in the Preliminary Prospectus, expected to be dated the date hereof (the “Preliminary Prospectus”). Capitalized terms used but not defined herein have the meanings assigned to such terms in the Preliminary Prospectus. |
| (2) | Approximate, subject to a permitted variance of plus or minus 5% or, in the case of the Class X-D, Class D and Class E-RR certificates, such greater percentages as is contemplated by footnote (11) below. In addition, the notional amounts of the Class X-A, Class X-B and Class X-D certificates may vary depending upon the final pricing of the classes of principal balance certificates whose certificate balances comprise such notional amounts, and, if as a result of such pricing the pass-through rate of any class of the Class X-A, Class X-B or Class X-D certificates, as applicable, would be equal to zero at all times, such class of certificates will not be issued on the closing date of this securitization. |
| (3) | The approximate initial credit support percentages set forth for the certificates are approximate and, for the Class A-1, Class A-2, Class A-SB, Class A-3 and Class A-4 certificates, are represented in the aggregate. |
| (4) | The Expected Weighted Average Life and Expected Principal Window during which distributions of principal would be received as set forth in the foregoing table with respect to each class of certificates having a certificate balance are based on the assumptions set forth under “Yield and Maturity Considerations—Weighted Average Life” in the Preliminary Prospectus and on the assumptions that there are no prepayments, modifications or losses in respect of the mortgage loans and that there are no extensions or forbearances of maturity dates or anticipated repayment dates of the mortgage loans. |
| (5) | Certificate Principal UW NOI Debt Yield for any class of principal balance certificates is calculated as the product of (a) the weighted average UW NOI Debt Yield for the mortgage pool, multiplied by (b) a fraction, the numerator of which is the total initial certificate balance of all the principal balance certificates, and the denominator of which is the total initial certificate balance of the subject class of principal balance certificates and all other classes of principal balance certificates, if any, that are senior to such class. The Certificate Principal UW NOI Debt Yields of the Class A-1, Class A-2, Class A-SB, Class A-3 and Class A-4 certificates are calculated in the aggregate for those classes as if they were a single class. |
| (6) | Certificate Principal to Value Ratio for any class of principal balance certificates is calculated as the product of (a) the weighted average Cut-off Date LTV Ratio of the mortgage pool, multiplied by (b) a fraction, the numerator of which is the total initial certificate balance of the subject class of principal balance certificates and all other classes of principal balance certificates, if any, that are senior to such class, and the denominator of which is the total initial certificate balance of all the principal balance certificates. The Certificate Principal to Value Ratios of the Class A-1, Class A-2, Class A-SB, Class A-3 and Class A-4 certificates are calculated in the aggregate for those classes as if they were a single class. |
This is not a research report and was not prepared by any Underwriter’s research department. Please see additional important information and qualifications at the end of this Term Sheet. |
T-3
| MSC 2017-HR2 | Structural Overview |
| (7) | The pass-through rate for each class of the Class A-1, Class A-2, Class A-SB, Class A-3, Class A-4, Class A-S, Class B, Class C, Class D, Class E-RR, Class F-RR, Class G-RR, Class H-RR and Class J-RR certificates (collectively referred to as the “principal balance certificates”) will be one of the following: (i) a fixed rateper annum, (ii) a variable rateper annum equal to the weighted average of the net mortgage interest rates on the mortgage loans for the related distribution date, (iii) a variable rateper annumequal to the lesser of (a) a fixed rate and (b) the weighted average of the net mortgage interest rates on the mortgage loans for the related distribution date or (iv) a variable rateper annum equal to the weighted average of the net mortgage interest rates on the mortgage loans for the related distribution date minus a specified percentage. For purposes of the calculation of the weighted average of the net mortgage interest rates on the mortgage loans for each distribution date, the net mortgage interest rates will be adjusted as necessary to a 30/360 basis. |
| (8) | The Class X-A, Class X-B and Class X-D certificates (collectively referred to as the “Class X certificates”) are notional amount certificates and will not be entitled to distributions of principal. The notional amount of the Class X-A certificates will be equal to the aggregate certificate balance of the Class A-1, Class A-2, Class A-SB, Class A-3 and Class A-4 certificates. The notional amount of the Class X-B certificates will be equal to the aggregate certificate balance of the Class A-S, Class B and Class C certificates. The notional amount of the Class X-D certificates will be equal to the certificate balance of the Class D certificates. |
| (9) | The pass-through rate for the Class X-A certificates for any distribution date will be aper annumrate equal to the excess, if any, of (a) the weighted average of the net mortgage interest rates on the mortgage loans for the related distribution date, over (b) the weighted average of the pass-through rates on the Class A-1, Class A-2, Class A-SB, Class A-3 and Class A-4 certificates for the related distribution date, weighted on the basis of their respective certificate balances outstanding immediately prior to that distribution date. The pass-through rate for the Class X-B certificates for any distribution date will be aper annum rate equal to the excess, if any, of (a) the weighted average of the net mortgage interest rates on the mortgage loans for the related distribution date, over (b) the weighted average of the pass-through rates on the Class A-S, Class B and Class C certificates for the related distribution date, weighted on the basis of their respective certificate balances outstanding immediately prior to that distribution date. The pass-through rate for the Class X-D certificates for any distribution date will be aper annum rate equal to the excess, if any, of (a) the weighted average of the net mortgage interest rates on the mortgage loans for the related distribution date, over (b) the pass-through rate on the Class D certificates for the related distribution date. For purposes of the calculation of the weighted average of the net mortgage interest rates on the mortgage loans for each distribution date, the net mortgage interest rates will be adjusted as necessary to a 30/360 basis. |
| (10) | Not offered pursuant to the Preliminary Prospectus or this Term Sheet. Information provided in this Term Sheet regarding the characteristics of these certificates is provided only to enhance your understanding of the offered certificates. The privately offered certificates also include the Class V and Class R certificates, which do not have a certificate balance, notional amount, pass-through rate, rating or rated final distribution date, and which are not shown in the chart. The Class V certificates represent a beneficial ownership interest held through the grantor trust in certain excess interest in respect of mortgage loans having anticipated repayment dates, if any. The Class R certificates represent the beneficial ownership of the residual interest in each of the real estate mortgage investment conduits, as further described in the Preliminary Prospectus. |
| (11) | The initial certificate balance of each of the Class D and Class E-RR certificates and the initial notional amount of the Class X-D certificates are subject to change based on final pricing of all certificates and the final determination of the fair market value of the Class E-RR, Class F-RR, Class G-RR, Class H-RR and Class J-RR certificates (collectively, the “RR Certificates”), which will be retained by Argentic Real Estate Finance LLC, as “retaining sponsor”, or its “majority owned affiliate” (in each case as defined under Regulation RR) or other permitted transferee in satisfaction of the risk retention requirements. For more information regarding the methodology and key inputs and assumptions used to determine the sizing of the RR Certificates, see “Credit Risk Retention” in the Preliminary Prospectus. |
This is not a research report and was not prepared by any Underwriter’s research department. Please see additional important information and qualifications at the end of this Term Sheet. |
T-4
| MSC 2017-HR2 | Structural Overview |
Issue Characteristics
| Offered Certificates: | $815,467,000 (approximate) monthly pay, multi-class, commercial mortgage pass-through certificates, consisting of eight principal balance classes (Class A-1, Class A-2, Class A-SB, Class A-3, Class A-4, Class A-S, Class B and Class C) and two interest-only classes (Class X-A and Class X-B) | |
| Co-Lead Bookrunning Managers: | Morgan Stanley & Co. LLC and Citigroup Global Markets Inc. | |
| Mortgage Loan Sellers: | Morgan Stanley Mortgage Capital Holdings LLC, Citi Real Estate Funding Inc., Starwood Mortgage Funding III LLC and Argentic Real Estate Finance LLC | |
| Co-Manager: | The Williams Capital Group, L.P. | |
| Rating Agencies: | DBRS, Inc., Fitch Ratings, Inc. and Moody’s Investors Service, Inc. | |
| Master Servicer: | Wells Fargo Bank, National Association | |
| Special Servicer: | LNR Partners, LLC | |
| Trustee: | Wilmington Trust, National Association | |
| Certificate Administrator/ Certificate Registrar/Custodian: | Wells Fargo Bank, National Association | |
| Operating Advisor: | Park Bridge Lender Services LLC | |
| Asset Representations Reviewer: | Park Bridge Lender Services LLC | |
| Initial Directing Certificateholder: | Argentic Securities Income USA LLC or an affiliate thereof | |
| Credit Risk Retention: | Eligible horizontal residual interest | |
| Cut-off Date: | The mortgage loans will be considered part of the trust fund as of their respective cut-off dates. The cut-off date with respect to each mortgage loan is the respective due date for the monthly debt service payment that is due in December 2017 (or, in the case of any mortgage loan that has its first due date after December 2017, the date that would have been its due date in December 2017 under the terms of that mortgage loan if a monthly debt service payment were scheduled to be due in that month). | |
| Expected Pricing Date: | Week of December 11, 2017 | |
| Expected Closing Date: | On or about December 22, 2017 | |
| Determination Dates: | The 11th day of each month or, if the 11th day is not a business day, then the business day immediately following such 11th day. | |
| Distribution Dates: | The 4th business day following each determination date. The first distribution date will be in January 2018. | |
| Rated Final Distribution Date: | The distribution date in December 2050 | |
| Interest Accrual Period: | Preceding calendar month | |
| Payment Structure: | Sequential pay | |
| Tax Treatment: | REMIC | |
| Optional Termination: | 1.00% clean-up call | |
| Minimum Denominations: | $10,000 for each class of Offered Certificates (other than Class X-A and Class X-B certificates); $1,000,000 for the Class X-A and Class X-B certificates | |
| Settlement Terms: | DTC, Euroclear and Clearstream | |
| Legal/Regulatory Status: | Each class of Offered Certificates is expected to be eligible for exemptive relief under ERISA. No class of Offered Certificates is SMMEA eligible. | |
| Analytics: | The certificate administrator is expected to make available all distribution date statements, CREFC® reports and supplemental notices received by it to certain modeling financial services as described in the Preliminary Prospectus. | |
| Bloomberg Ticker: | MSC 2017-HR2<MTGE><GO> | |
| Risk Factors: | THE OFFERED CERTIFICATES INVOLVE CERTAIN RISKS AND MAY NOT BE SUITABLE FOR ALL INVESTORS. SEE THE “RISK FACTORS” SECTION OF THE PRELIMINARY PROSPECTUS. |
This is not a research report and was not prepared by any Underwriter’s research department. Please see additional important information and qualifications at the end of this Term Sheet. |
T-5
| MSC 2017-HR2 | Structural Overview |
Structural Overview
| Accrual: | Each class of Offered Certificates will accrue interest on a 30/360 basis. | |
| Amount and Order of Distributions: | On each distribution date, funds available for distribution from the mortgage loans, net of (i) specified expenses of the issuing entity, including fees payable to, and advances, costs and expenses reimbursable to, the master servicer, any primary servicer, the special servicer, the certificate administrator, the trustee, the operating advisor, the asset representations reviewer and CREFC®, (ii) any yield maintenance charges and prepayment premiums and (iii) any excess interest distributable to the Class V certificates, will be distributed in the following amounts and order of priority:
Girst, to the Class A-1, Class A-2, Class A-SB, Class A-3, Class A-4, Class X-A, Class X-B and Class X-D certificates, in respect of interest, up to an amount equal to, andpro rata in accordance with, the interest entitlements for those classes;
Second, to the Class A-1, Class A-2, Class A-SB, Class A-3 and Class A-4 certificates as follows, to the extent of funds allocated to principal and available for distribution: either (i)(a)first, to principal on the Class A-SB certificates, until the certificate balance of the Class A-SB certificates is reduced to the planned principal balance for the related distribution date set forth in Annex E to the Preliminary Prospectus, and (b)second, to principal on each class of the Class A-1, Class A-2, Class A-3, Class A-4 and Class A-SB certificates, in that order, in each case until the certificate balance of such class of certificates has been reduced to zero, or (ii) if the certificate balance of each class of principal balance certificates other than the Class A-1, Class A-2, Class A-SB, Class A-3 and Class A-4 certificates has been reduced to zero as a result of the allocation of losses on the mortgage loans to those certificates, to principal on the Class A-1, Class A-2, Class A-SB, Class A-3 and Class A-4 certificates,pro rata, without regard to the distribution priorities described above or the planned principal balance of the Class A-SB certificates;
Third, to the Class A-1, Class A-2, Class A-SB, Class A-3 and Class A-4 certificates: (a)first, up to an amount equal to, andpro rata based on, any previously unreimbursed losses on the mortgage loans allocable to principal that were previously borne by each such class, and (b)second, up to an amount equal to, andpro rata based on, interest on such unreimbursed losses previously allocated to each such class at the pass-through rate for such class from the date the related loss was allocated to such class;
Fourth, to each class of the Class A-S, Class B and Class C certificates, in that order, as follows: (a) to interest on such class of certificates in the amount of its interest entitlement; (b) to the extent of funds allocable to principal and available for distribution that remain after distributions in respect of principal to each class with a higher priority (as set forth in this clause or prior enumerated clauses set forth above), to principal on such class of certificates until its certificate balance has been reduced to zero; and (c) to reimburse such class of certificates,first, for any previously unreimbursed losses on the mortgage loans that were previously allocated to those certificates, andsecond, for interest on such unreimbursed losses at the pass-through rate for such class from the date the related loss was allocated to such class;
Fifth, to the Class D, Class E-RR, Class F-RR, Class G-RR, Class H-RR and Class J-RR certificates in the amounts and order of priority described in “Description of the Certificates—Distributions” in the Preliminary Prospectus; and
Sixth, to the Class R certificates, any remaining amounts.
| |
| Interest and Principal Entitlements: | The interest entitlement of each class of Offered Certificates on each distribution date generally will be the interest accrued during the related interest accrual period on the related certificate balance or notional amount at the related pass-through rate, net of any prepayment interest shortfalls allocated to that class for such distribution date as described below. If prepayment interest shortfalls arise from voluntary prepayments on serviced mortgage loans during any collection period, the master servicer is required to make a limited compensating interest payment to offset those shortfalls. See “Description of the Certificates—Prepayment Interest Shortfalls” in the Preliminary Prospectus. The remaining amount of prepayment interest shortfalls will be allocated to reduce the interest entitlement on all classes of certificates (other than the Class V and Class R certificates),pro rata, based on their respective amounts of accrued interest for the related distribution date. If a class receives less than the entirety of its interest entitlement on any distribution date, then the shortfall (excluding any shortfall due to prepayment interest shortfalls), together with the interest thereon, will be added to its interest entitlement for the next succeeding distribution date.
The principal distribution amount for each distribution date generally will be the aggregate amount of principal received or advanced in respect of the mortgage loans, net of any non-recoverable advances and interest thereon and any workout-delayed reimbursement amounts that are reimbursed to the master servicer or the trustee during the related collection period. Non-recoverable advances and interest thereon are reimbursable from principal collections before reimbursement from other amounts. Workout-delayed reimbursement amounts will be reimbursable from principal collections.
| |
| Special Servicer Compensation: | The principal compensation to be paid to the special servicer in respect of its special servicing activities will be the special servicing fee, the workout fee and the liquidation fee.
The special servicing fee for each distribution date is calculated at the special servicing fee rate based on the outstanding principal balance of each mortgage loan (and any related companion loan) that is serviced under the pooling and servicing agreement for this securitization (a “serviced mortgage loan” and “serviced companion loan”, respectively) that is being specially serviced or as to which the related mortgaged property has become an REO property. The special servicing fee rate will be a rate equal to the greater of 0.25%per annum and theper annum rate that would result in a special servicing fee of $3,500 for the related month. The special servicing fee will be payable monthly,first, from liquidation proceeds, insurance and condemnation proceeds, and other |
This is not a research report and was not prepared by any Underwriter’s research department. Please see additional important information and qualifications at the end of this Term Sheet. |
T-6
| MSC 2017-HR2 | Structural Overview |
collections in respect of the related specially serviced mortgage loan or REO property and,then, from general collections on all the mortgage loans and any REO properties.
The special servicer will also be entitled to (i) liquidation fees generally equal to 1.0% of liquidation proceeds and certain other collections in respect of a specially serviced mortgage loan (and any related serviced companion loan) or related REO property and of amounts received in respect of mortgage loan repurchases by the related mortgage loan sellers and (ii) workout fees generally equal to 1.0% of interest (other than post-ARD excess interest on mortgage loans with anticipated repayment dates and other than default interest) and principal payments made in respect of a rehabilitated mortgage loan (and any related serviced companion loan), in the case of each of clause (i) and (ii), subject to a cap of $1,000,000 and a floor of $25,000 with respect to any mortgage loan, whole loan or related REO property and subject to certain adjustments and exceptions as described in the Preliminary Prospectus under “Pooling and Servicing Agreement—Servicing and Other Compensation and Payment of Expenses—Special Servicer Compensation”.
With respect to any non-serviced mortgage loan, the related special servicer under the related other pooling and servicing agreement pursuant to which such mortgage loan is being serviced will be entitled to similar compensation as that described above with respect to such non-serviced mortgage loan under such other pooling and servicing agreement as further described in the Preliminary Prospectus, although any related fees may accrue at a different rate and there may be a higher (or no) cap on liquidation and workout fees.
| ||
| Prepayment Premiums/Yield Maintenance Charges: | If any yield maintenance charge or prepayment premium is collected during any collection period with respect to any mortgage loan, then on the immediately succeeding distribution date, the certificate administrator will pay to the holders of each class of the Class A-1, Class A-2, Class A-SB, Class A-3, Class A-4, Class A-S, Class B, Class C and Class D certificates the product of (a) the amount of such yield maintenance charge or prepayment premium, (b) the related Base Interest Fraction for such class and the applicable principal prepayment, and (c) a fraction, the numerator of which is equal to the amount of principal distributed to such class for that distribution date, and the denominator of which is the total amount of principal distributed to all principal balance certificates (other than the Control Eligible Certificates) for that distribution date. Any portion of the yield maintenance charge or prepayment premium that is collected during any collection period with respect to any mortgage loan and remaining after the distributions in the preceding sentence (as to the applicable distribution date, the “Class X YM Distribution Amount”) will be distributed to the holders of the Class X Certificates as follows: (1) first, to the Class X-A and Class X-B certificates, in each case in an amount equal to the product of (i) a fraction, the numerator of which is equal to the amount of principal distributed on the applicable distribution date with respect to the class(es) of principal balance certificates whose certificate balance(s) comprise the notional amount of the applicable class of Class X certificates, and the denominator of which is the total amount of principal distributed on the applicable distribution date with respect to the principal balance certificates, multiplied by (ii) the Class X YM Distribution Amount for the applicable distribution date, and (2) second, to the Class X-D certificates, in an amount equal to the portion of the Class X YM Distribution Amount remaining after the distributions to the holders of the Class X-A and Class X-B certificates. Notwithstanding any of the foregoing to the contrary, if at any time the certificate balances of the principal balance certificates (other than the Control Eligible Certificates) have been reduced to zero as a result of the allocation of principal payments on the mortgage loans, the certificate administrator will pay to the holders of each class of remaining principal balance certificates then entitled to distributions of principal on any distribution date the product of (a) any yield maintenance charge or prepayment premium that is collected during the related collection period with respect to any mortgage loan and (b) a fraction, the numerator of which is equal to the amount of principal distributed to such class for that distribution date, and the denominator of which is the total amount of principal distributed to all principal balance certificates for that distribution date. “Base Interest Fraction” means, with respect to any principal prepayment of any mortgage loan that provides for the payment of a yield maintenance charge or prepayment premium, and with respect to any class of principal balance certificates, a fraction (A) the numerator of which is the greater of (x) zero and (y) the difference between (i) the pass-through rate on that class, and (ii) the applicable discount rate and (B) the denominator of which is the difference between (i) the mortgage interest rate on the related mortgage loan and (ii) the applicable discount rate; provided, that: under no circumstances will the Base Interest Fraction be greater than one; if the discount rate referred to above is greater than or equal to both the mortgage interest rate on the related mortgage loan and the pass-through rate on that class, then the Base Interest Fraction will equal zero; and if the discount rate referred to above is greater than or equal to the mortgage interest rate on the related mortgage loan and is less than the pass-through rate on that class, then the Base Interest Fraction will be equal to 1.0. Consistent with the foregoing, the Base Interest Fraction is equal to: |
| (Pass-Through Rate – Discount Rate) | ||
| (Mortgage Rate – Discount Rate) |
| Realized Losses: | On each distribution date, immediately following the distributions to be made to the certificateholders on that date, the certificate administrator is required to calculate the amount, if any, by which (i) the aggregate stated principal balance of the mortgage loans, including any successor REO loans expected to be outstanding immediately following that distribution date is less than (ii) the then aggregate certificate balance of the principal balance certificates after giving effect to distributions of principal on that distribution date (any such deficit, a “Realized Loss”), which amount will be applied to reduce the certificate balances of the Class J-RR, Class H-RR, Class G-RR, Class F-RR, Class E-RR, Class D, Class C, Class B and Class A-S certificates, in that order, in each case until the related certificate balance has been reduced to zero, and then to the Class A-1, Class A-2, Class A-SB, Class A-3 and Class A-4 certificates,pro rata, based upon their respective certificate balances, until their respective certificate balances have been reduced to zero. |
This is not a research report and was not prepared by any Underwriter’s research department. Please see additional important information and qualifications at the end of this Term Sheet. |
T-7
| MSC 2017-HR2 | Structural Overview |
| Serviced Whole Loans: | Each of the following mortgaged properties or portfolio of mortgaged properties secures a mortgage loan and one or morepari passu promissory notes (each, a “servicedpari passu companion loan” and also a “serviced companion loan”) that will be serviced pursuant to the related intercreditor agreement and (subject to the discussion in the next paragraph) the pooling and servicing agreement for this transaction: Extra Space Self Storage Portfolio, The Woods, Baybrook Lifestyle and Power Center and 150 West Jefferson. With respect to each such mortgaged property, the related mortgage loan, together with the related servicedpari passu companion loan(s), is referred to herein (for so long as it is serviced under the pooling and servicing agreement for this transaction) as a “servicedpari passu whole loan” and also a “serviced whole loan.” Each servicedpari passu companion loan is not part of the mortgage pool and may be contributed to one or more future securitization transactions (if not already securitized) or may be otherwise transferred at any time, subject to compliance with the related intercreditor agreement. See the table below entitled “Mortgage Loans with Pari Passu Companion Loans” and “Description of the Mortgage Pool—The Whole Loans” in the Preliminary Prospectus, for additional information regarding each such whole loan.
With respect to the Kirkwood Plaza whole loan (a “servicing shift whole loan”), the pooling and servicing agreement for this transaction will govern servicing of such whole loan until the securitization of the related control note; however, servicing of such whole loan will generally be directed by the holder of the related control note (which is not included in this securitization), and such holder will have the right to replace the special servicer with respect to the related whole loan with or without cause. After the securitization of the related control note, the servicing shift whole loan will cease to be a serviced whole loan and will be serviced pursuant to the pooling and servicing agreement for another securitization transaction (see “Non-Serviced Whole Loans” below).
| |
| Non-Serviced Whole Loans: | Each of the following mortgaged properties secures a mortgage loan (each, a “non-serviced mortgage loan”) and one or morepari passu promissory notes (each suchpari passu promissory note, a “non-serviced companion loan”) that will be serviced pursuant to the related intercreditor agreement and the pooling and servicing agreement or trust and servicing agreement (referred to herein as a related “pooling and servicing agreement”) for another securitization transaction: Harmon Corner, One Ally Center, The View at Marlton and, following the securitization of the related control note, Kirkwood Plaza. With respect to each such mortgaged property, the related mortgage loan, together with the related non-serviced companion loan(s), is referred to herein (for so long as it is serviced under the pooling and servicing agreement for another securitization transaction) as a “non-serviced whole loan.” Each non-serviced companion loan is not part of the mortgage pool and may be contributed to one or more future securitization transactions (if not already securitized) or may be otherwise transferred at any time, subject to compliance with the related intercreditor agreement. Servicing of each non-serviced whole loan will generally be directed by the holder of the related control note (or, if such control note is included in a securitization, the directing certificateholder thereunder (or other party designated to exercise the rights of such control note)), and such holder will have the right to replace the special servicer with respect to the related whole loan with or without cause. See the table below entitled “Mortgage Loans with Pari Passu Companion Loans” and “Description of the Mortgage Pool—The Whole Loans” in the Preliminary Prospectus for additional information regarding each such whole loan. | |
| Directing Certificateholder/ Controlling Class: | The initial Directing Certificateholder is expected to be Argentic Securities Income USA LLC or an affiliate thereof.
The “Directing Certificateholder” will be the Controlling Class Certificateholder (or its representative) selected by more than 50% (by certificate balance) of the Controlling Class Certificateholders;provided, that (1) absent that selection, (2) until a Directing Certificateholder is so selected or (3) upon receipt of a notice from a majority of the Controlling Class Certificateholders (by certificate balance) that a Directing Certificateholder is no longer designated, the Controlling Class Certificateholder that owns the largest aggregate certificate balance of the Controlling Class (or its representative) will be the Directing Certificateholder;provided, that (i) if such holder elects or has elected to not be the Directing Certificateholder, the holder of the next largest aggregate certificate balance of the Controlling Class will be the Directing Certificateholder, (ii) in the event no one holder owns the largest aggregate certificate balance of the Controlling Class, then there will be no Directing Certificateholder until appointed in accordance with the terms of the pooling and servicing agreement, and (iii) the certificate administrator and the other parties to the pooling and servicing agreement will be entitled to assume that the identity of the Directing Certificateholder has not changed until such parties receive written notice of a replacement of the Directing Certificateholder from a party holding the requisite interest in the Controlling Class (as confirmed by the certificate registrar), or the resignation of the then current Directing Certificateholder.
The “Controlling Class” will be, as of any time of determination, the most subordinate class of Control Eligible Certificates then outstanding that has an aggregate certificate balance (as notionally reduced by any Cumulative Appraisal Reduction Amounts (as defined below)) at least equal to 25% of the initial certificate balance thereof; provided, that if at any time the certificate balances of the principal balance certificates other than the Control Eligible Certificates have been reduced to zero as a result of principal payments on the mortgage loans, then the Controlling Class will be the most subordinate class of Control Eligible Certificates that has a certificate balance greater than zero without regard to the application of any Cumulative Appraisal Reduction Amounts. The Controlling Class as of the closing date will be the Class J-RR certificates.
The “Control Eligible Certificates” will be any of the Class E-RR, Class F-RR, Class G-RR, Class H-RR and Class J-RR certificates.
| |
Control Rights: | Prior to a Control Termination Event, the Directing Certificateholder will have certain consent and consultation rights under the pooling and servicing agreement with respect to certain major decisions and other matters. A “Control Termination Event” will occur when the most senior class of Control Eligible Certificates has a certificate balance (taking into account the application of any Cumulative Appraisal Reduction Amounts to notionally |
This is not a research report and was not prepared by any Underwriter’s research department. Please see additional important information and qualifications at the end of this Term Sheet. |
T-8
| MSC 2017-HR2 | Structural Overview |
reduce the certificate balance thereof) of less than 25% of the initial certificate balance thereof; provided, that a Control Termination Event will be deemed not continuing in the event that the certificate balances of the principal balance certificates other than the Control Eligible Certificates have been reduced to zero as a result of principal payments on the mortgage loans.
After the occurrence of a Control Termination Event but prior to the occurrence of a Consultation Termination Event, the Directing Certificateholder will not have any consent rights, but the Directing Certificateholder will have certain non-binding consultation rights under the pooling and servicing agreement with respect to certain major decisions and other matters. A “Consultation Termination Event” will occur when there is no class of Control Eligible Certificates that has a then outstanding certificate balance at least equal to 25% of the initial certificate balance of that class, in each case, without regard to the application of any Cumulative Appraisal Reduction Amounts; provided, that a Consultation Termination Event will be deemed not continuing in the event that the certificate balances of the principal balance certificates other than the Control Eligible Certificates have been reduced to zero as a result of principal payments on the mortgage loans.
After the occurrence of a Consultation Termination Event, the Directing Certificateholder will not have any consent or consultation rights, except with respect to any rights expressly set forth in the pooling and servicing agreement.
Notwithstanding any proviso to, or other contrary provision in, the definitions of “Control Termination Event,” “Consultation Termination Event” and “Operating Advisor Consultation Event,” a Control Termination Event, a Consultation Termination Event and an Operating Advisor Consultation Event will be deemed to have occurred with respect to any Excluded DCH Loan, and neither the Directing Certificateholder nor any Controlling Class Certificateholder will have any consent or consultation rights with respect to the servicing of such Excluded DCH Loan.
An “Excluded DCH Loan” is a mortgage loan or whole loan with respect to which the Directing Certificateholder or the holder of the majority of the Controlling Class is a Borrower Party. It is expected that there will be no Excluded DCH Loans as of the closing date with respect to this securitization.
“Borrower Party” means a borrower, a mortgagor, a manager of a mortgaged property, the holder of a mezzanine loan that has been accelerated or as to which foreclosure or enforcement proceedings have been commenced against the equity collateral pledged to secure the related mezzanine loan, or any Borrower Party Affiliate.
“Borrower Party Affiliate” means, with respect to a borrower, a mortgagor, a manager of a mortgaged property or the holder of a mezzanine loan that has been accelerated or as to which foreclosure or enforcement proceedings have been commenced against the equity collateral pledged to secure the related mezzanine loan, (a) any other person controlling or controlled by or under common control with such borrower, mortgagor, manager or mezzanine lender, as applicable, or (b) any other person owning, directly or indirectly, 25% or more of the beneficial interests in such borrower, mortgagor, manager or mezzanine lender, as applicable. For the purposes of this definition, “control” when used with respect to any specified person means the power to direct the management and policies of such person, directly or indirectly, whether through the ownership of voting securities, by contract or otherwise and the terms “controlling” and “controlled” have meanings correlative to the foregoing.
Notwithstanding any of the foregoing to the contrary, if any mortgage loan is part of a whole loan, the Directing Certificateholder’s consent and/or consultation rights with respect thereto may be limited as described in the Preliminary Prospectus. In particular, with respect to each non-serviced whole loan and each servicing shift whole loan, the Directing Certificateholder will only have certain consultation rights with respect to certain major decisions and other matters related to such whole loan, in each case only prior to a Control Termination Event, and the holder of the related control note (or, if such control note has been securitized, the directing certificateholder with respect to such securitization or other designated party under the related pooling and servicing agreement) will be entitled to similar consent and/or consultation rights with respect to such whole loan. With respect to any serviced A/B whole loan, for so long as the holder of the related subordinate companion loan is the controlling note holder, the holder of such subordinate companion loan (in lieu of the Directing Certificateholder) will be entitled to exercise such consent and consultation rights with respect to such whole loan.
| ||
| Appraisal Reduction Amounts and Collateral Deficiency Amounts: | An “Appraisal Reduction Amount” generally will be created in the amount, if any, by which the principal balance of a required appraisal loan (which is a mortgage loan with respect to which certain defaults, modifications or insolvency events have occurred as further described in the Preliminary Prospectus) plus other amounts overdue or advanced in connection with such mortgage loan exceeds 90% of the appraised value of the related mortgaged property plus certain escrows and reserves (including letters of credit) held with respect to the mortgage loan.
A mortgage loan will cease to be subject to an Appraisal Reduction Amount when it has been brought current for at least three consecutive months, no additional event of default is foreseeable in the reasonable judgment of the special servicer and no other circumstances exist that would cause such mortgage loan or any related companion loan to be a specially serviced mortgage loan; however, a “Collateral Deficiency Amount” may exist with respect to any mortgage loan that is modified into an AB loan structure (an “AB Modified Loan”) and remains a rehabilitated mortgage loan and, if so, will generally equal the excess of (i) the stated principal balance of such AB Modified Loan (taking into account the related junior note(s) and anypari passu notes included therein, as well as any equity interests or other obligations senior to such junior notes), over (ii) the sum of (in the case of a whole loan, solely to the extent allocable to the subject mortgage loan) (x) the most recent appraised value for the related mortgaged property or mortgaged properties plus (y) solely to the extent not reflected or taken into account in such appraised value and to the extent on deposit with, or otherwise under the |
This is not a research report and was not prepared by any Underwriter’s research department. Please see additional important information and qualifications at the end of this Term Sheet. |
T-9
| MSC 2017-HR2 | Structural Overview |
control of, the lender (or otherwise on deposit with a party acceptable to the lender or expended for the benefit of the mortgaged property or the mortgage loan at the time the mortgage loan became subject of a workout and became (and as part of the modification related to) such AB Modified Loan) as of the date of such determination, any capital or additional collateral contributed by the related borrower at the time the mortgage loan became the subject of a workout and became (and as part of the modification related to) such AB Modified Loan for the benefit of the related mortgaged property or mortgaged properties (provided, that in the case of a non-serviced mortgage loan, the amounts set forth in this clause (y) will be taken into account solely to the extent relevant information is received by the master servicer), plus (z) certain escrows or reserves in addition to any amounts set forth in the immediately preceding clause (y) held by the lender in respect of such AB Modified Loan as of the date of such determination.
As used herein, a “Cumulative Appraisal Reduction Amount” will be the sum of any Appraisal Reduction Amounts and any Collateral Deficiency Amounts.
Any Appraisal Reduction Amount in respect of any non-serviced mortgage loan generally will be calculated in accordance with the other servicing agreement pursuant to which such mortgage loan is being serviced, which calculations are expected to be generally similar to those provided for in the pooling and servicing agreement for this transaction.
If any mortgage loan is part of a whole loan, any Appraisal Reduction Amount or Collateral Deficiency Amount will (or effectively will) be calculated in respect of such whole loan taken as a whole and allocated, to the extent provided in the related intercreditor agreement and the related pooling and servicing agreement,first, to any related subordinate companion loan, andsecond, to the related mortgage loan and anypari passu companion loan on apro rata basis by unpaid principal balance.
Appraisal Reduction Amounts in respect of, or allocable to, any mortgage loan will proportionately reduce the interest portion of debt service advances required to be made in respect of such mortgage loan. Appraisal Reduction Amounts and Collateral Deficiency Amounts will be taken into account in determining the identity of the controlling class entitled to appoint the Directing Certificateholder, the existence of a Control Termination Event and the allocation of voting rights for certain purposes (see“—Directing Certificateholder/Controlling Class” above).
| ||
| Appraised-Out Class: | An “Appraised-Out Class” is any class of Control Eligible Certificates, the certificate balance of which (taking into account the application of any Appraisal Reduction Amounts or Collateral Deficiency Amounts to notionally reduce the certificate balance of such class) has been reduced to less than 25% of its initial certificate balance. Any Appraised-Out Class may not exercise any direction, control, consent and/or similar rights of the Controlling Class until such time, if any, as such class is reinstated as the Controlling Class, and the rights of the Controlling Class will be exercised by the most subordinate class of Control Eligible Certificates that is not an Appraised-Out Class, if any, during such period. | |
| Appraisal Remedy: | The holders of the majority (by certificate balance) of an Appraised-Out Class (such holders, the “Requesting Holders”) will have the right, at their sole expense, to require the special servicer to order (or, with respect to a non-serviced mortgage loan, require the master servicer to request from the applicable outside special servicer) a second appraisal of any mortgage loan (or serviced whole loan) for which an appraisal reduction event has occurred or as to which there exists a Collateral Deficiency Amount. With respect to any serviced mortgage loan, the special servicer will be required to use its reasonable best efforts to ensure that such appraisal is delivered within 30 days from receipt of the Requesting Holders’ written request and will be required to ensure that such appraisal is prepared on an “as-is” basis by an MAI appraiser. With respect to any non-serviced mortgage loan, the master servicer will be required to use commercially reasonable efforts to obtain such second appraisal from the applicable outside special servicer and to forward such second appraisal to the special servicer. Upon receipt of such supplemental appraisal, the outside special servicer (for Appraisal Reduction Amounts on non-serviced mortgage loans, but only to the extent provided for in the applicable outside pooling and servicing agreement and applicable intercreditor agreement) and the special servicer (for Collateral Deficiency Amounts on non-serviced mortgage loans and for all Cumulative Appraisal Reduction Amounts on serviced mortgage loans) will be required to determine, in accordance with the servicing standard, whether, based on its assessment of such supplemental appraisal, any recalculation of the applicable Appraisal Reduction Amount or Collateral Deficiency Amount is warranted and, if so warranted, will be required to recalculate such Appraisal Reduction Amount or Collateral Deficiency Amount, as applicable, based upon such supplemental appraisal and receipt of information requested by the special servicer from the master servicer. If required by any such recalculation, the applicable Appraised-Out Class will be reinstated as the Controlling Class and each Appraised-Out Class will, if applicable, have its related certificate balance notionally restored to the extent required by such recalculation of the Appraisal Reduction Amount or Collateral Deficiency Amount, if applicable. | |
| Sale of Defaulted Loans: | Under certain circumstances, the special servicer may be required to use reasonable efforts to solicit offers for a defaulted serviced mortgage loan (and any relatedpari passucompanion loan (to the extent provided under the related intercreditor agreement) and/or related REO properties). If the special servicer does not receive an offer at least equal to the outstanding principal balance plus all accrued and unpaid interest and outstanding costs and expenses and certain other specified amounts (the “Par Purchase Price”), the special servicer may purchase the defaulted loan or REO property at the Par Purchase Price or may accept the highest offer received from any person that is determined to be a fair price for such defaulted loan or REO property. If multiple offers are received during the period designated by the special servicer for receipt of offers, the special servicer is generally required to select the highest offer. If the highest offer is made by an Interested Person (i.e., certain specified parties under the pooling and servicing agreement for this transaction, including the parties to such agreement, the Directing Certificateholder, any sponsor, any Borrower Party and known affiliates of the |
This is not a research report and was not prepared by any Underwriter’s research department. Please see additional important information and qualifications at the end of this Term Sheet. |
T-10
| MSC 2017-HR2 | Structural Overview |
foregoing), the trustee, rather than the special servicer, will generally be required to determine whether the offer constitutes a fair price. Absent an offer at least equal to the Par Purchase Price, no offer from an Interested Person will constitute a fair price unless (x) it is the highest offer received and (y) at least one other offer is received from an independent third party. Neither the trustee nor any of its affiliates may make an offer for or purchase any specially serviced loan or REO property. See “Pooling and Servicing Agreement—Sale of Defaulted Loans and REO Properties” in the Prospectus.
Notwithstanding any of the foregoing to the contrary, the special servicer is not required to accept the highest offer and may accept a lower offer for a defaulted loan or REO property if it determines (in consultation with the Directing Certificateholder (unless a Consultation Termination Event exists or the mortgage loan is an Excluded DCH Loan) and any related companion loan holders), in accordance with the Servicing Standard (and subject to the requirements of any related intercreditor agreement), that a rejection of such offer would be in the best interests of the certificateholders and any related companion loan holders, as a collective whole as if they constituted a single lender, so long as such lower offer was not made by the special servicer or any of its affiliates.
If title to any mortgaged property is acquired by the trust fund, the special servicer will be required to sell such mortgaged property prior to the close of the third calendar year beginning after the year of acquisition, unless (a) the IRS grants or has not denied an extension of time to sell such mortgaged property or (b) the special servicer, trustee and the certificate administrator receive an opinion of independent counsel to the effect that the holding of the property by the trust longer than the above-referenced three-year period will not result in the imposition of a tax on any REMIC of the trust fund or cause any REMIC of the trust fund to fail to qualify as a REMIC.
The Directing Certificateholder will not have a right of first refusal to purchase a defaulted loan.
The foregoing applies to mortgage loans serviced under the pooling and servicing agreement for this transaction. With respect to any non-serviced whole loan, if the special servicer under the applicable pooling and servicing agreement determines to sell the related controlling companion loan if it becomes a defaulted mortgage loan, then the applicable special servicer will be required to sell the related whole loan, including the related mortgage loan included in the MSC 2017-HR2 securitization trust and the relatedpari passu companion loan(s) and, under certain circumstances, any subordinate companion loan(s), as a single loan. In connection with any such sale, the special servicer under the applicable pooling and servicing agreement will be required to follow procedures substantially similar to those set forth above.
| ||
| Appointment and Replacement of Special Servicer: | The Directing Certificateholder will appoint the initial special servicer as of the closing date. Prior to the occurrence and continuance of a Control Termination Event, the special servicer may generally be replaced by the Directing Certificateholder with or without cause.
After the occurrence and during the continuance of a Control Termination Event and upon (a) the written direction of holders of principal balance certificates evidencing not less than 25% of the voting rights of all classes of principal balance certificates (taking into account the application of Cumulative Appraisal Reduction Amounts to notionally reduce the certificate balances of the respective classes thereof) requesting a vote to replace the special servicer with a replacement special servicer, (b) payment by such requesting holders to the certificate administrator of all reasonable fees and expenses to be incurred by the certificate administrator in connection with administering such vote and (c) delivery by such holders to each applicable rating agency of a rating agency communication, the certificate administrator will be required to post such notice on its internet website and by mail and conduct the solicitation of votes of all certificates in such regard, which such vote must occur within 180 days of the posting of such notice. Upon the written direction of holders of principal balance certificates evidencing at least 75% of the voting rights that constitute a minimum Certificateholder Quorum, the trustee will be required to immediately replace the special servicer with a qualified replacement special servicer designated by such holders of certificates.
If the operating advisor determines, in its sole discretion exercised in good faith, that (i) the special servicer is not performing its duties as required under the pooling and servicing agreement or is otherwise not acting in accordance with the servicing standard, and (ii) the replacement of the special servicer would be in the best interest of the certificateholders as a collective whole, then the operating advisor may recommend the replacement of the special servicer. The operating advisor’s recommendation to replace the special servicer must be confirmed within 180 days of the posting of such notice by an affirmative vote of holders of certificates representing a majority of the outstanding principal balance of all certificates whose holders voted on the matter, provided that the certificateholders that so voted on the matter (i) hold certificates representing at least 20% of the outstanding principal balance of all certificates on an aggregate basis and (ii) include at least three certificateholders and/or certificate owners that are not affiliated with each other.
A “Certificateholder Quorum” means, in connection with any solicitation of votes in connection with the replacement of the special servicer or the asset representations reviewer, the holders of principal balance certificates evidencing at least 75% of the aggregate voting rights allocable to all principal balance certificates (taking into account, other than with respect to the termination of the asset representations reviewer, the application of any Cumulative Appraisal Reduction Amounts to notionally reduce the certificate balances of the respective classes thereof).
With respect to each serviced whole loan, any holder of a relatedpari passu companion loan, following a servicer termination event with respect to the special servicer that affects such holder, will be entitled to direct the trustee (and the trustee will be required) to terminate the special servicer solely with respect to such serviced whole loan. A replacement special servicer will be selected by the trustee or, prior to a Control Termination Event, by the Directing Certificateholder;provided, that any successor special servicer appointed to replace the special servicer with respect to such whole loan can generally not be the entity (or its affiliate) that was terminated at the direction of the holder of the relatedpari passu companion loan. |
This is not a research report and was not prepared by any Underwriter’s research department. Please see additional important information and qualifications at the end of this Term Sheet. |
T-11
| MSC 2017-HR2 | Structural Overview |
Notwithstanding any of the foregoing to the contrary, with respect to each servicing shift whole loan and any serviced A/B whole loans as to which the subordinate companion loan holder is the related controlling note holder, the holder of the related control note will be entitled to replace the special servicer with respect to such whole loan at any time, with or without cause, and while it is a serviced whole loan, no other party may replace the special servicer for such whole loan unless there is a servicer termination event with respect thereto.
With respect to any non-serviced whole loan, the MSC 2017-HR2 trust, as holder of the related mortgage loan, has the right to terminate the special servicer under the related pooling and servicing agreement if a servicer termination event occurs with respect to such special servicer that affects the trust in its capacity as such holder. Such rights may be exercised by the Directing Certificateholder prior to a Control Termination Event (or the special servicer (consistent with the servicing standard), following the occurrence and during the continuance of a Control Termination Event). The successor special servicer will be selected pursuant to the applicable pooling and servicing agreement by the related directing holder prior to a control termination event under such pooling and servicing agreement.
| ||
| Servicing Standard: | Each of the master servicer and the special servicer is obligated to service and administer the mortgage loans (and, if applicable, the serviced companion loans) in accordance with the definition of the “Servicing Standard” described in the Preliminary Prospectus and the terms of the pooling and servicing agreement, provided that each non-serviced mortgage loan, if any, will be serviced by another master servicer or special servicer under the pooling and servicing agreement with respect to the securitization of the related companion loan, which entities will be obligated to service and administer such non-serviced mortgage loan pursuant to a similar standard set forth in the related pooling and servicing agreement. | |
| Excluded Special Servicer: | If the special servicer obtains knowledge that it has become a Borrower Party with respect to any mortgage loan (an “Excluded Special Servicer Loan”), the special servicer will be required to resign as special servicer of that Excluded Special Servicer Loan. Prior to the occurrence and continuance of a Control Termination Event, the Directing Certificateholder will be entitled to appoint (and may remove and replace with or without cause) a separate special servicer that is not a Borrower Party (an “Excluded Special Servicer”) with respect to any Excluded Special Servicer Loan, unless such Excluded Special Servicer Loan is also an Excluded DCH Loan. After the occurrence and during the continuance of a Control Termination Event, if at any time the applicable Excluded Special Servicer Loan is also an Excluded DCH Loan or if the Directing Certificateholder is entitled to appoint the Excluded Special Servicer but does not so appoint within 30 days of notice of such resignation, the resigning special servicer will be required to select the related Excluded Special Servicer. Any Excluded Special Servicer will be required to perform all of the obligations of the special servicer and will be entitled to all special servicing compensation with respect to such Excluded Special Servicer Loan earned while the related mortgage loan is an Excluded Special Servicer Loan. | |
| Liquidated Loan Waterfall: | On liquidation of any mortgage loan, all net liquidation proceeds related to the mortgage loan (but not any related companion loan) will be applied so that amounts allocated as a recovery of accrued and unpaid interest will not, in the first instance, include any delinquent interest that was not advanced as a result of Appraisal Reduction Amounts or accrued on the portion of the stated principal balance thereof equal to any related Collateral Deficiency Amount in effect from time to time and as to which no advance was made. After the adjusted interest amount is so allocated, any remaining liquidation proceeds will be allocated to offset certain advances and to pay principal on the mortgage loan until the unpaid principal amount of the mortgage loan has been reduced to zero. Any remaining liquidation proceeds will then be allocated to pay delinquent interest that was not advanced as a result of Appraisal Reduction Amounts or that accrued on the portion of the stated principal balance thereof equal to any related Collateral Deficiency Amount in effect from time to time and as to which no advance was made. | |
| Operating Advisor: | The operating advisor will have access to any final asset status report and information available with respect to the transaction on the certificate administrator’s website and will have certain monitoring responsibilities on behalf of the entire issuing entity. After the occurrence and during the continuance of an Operating Advisor Consultation Event, the operating advisor will be entitled to consult with the master servicer and the special servicer with respect to certain major decisions on behalf of the issuing entity and in the best interest of, and for the benefit of, the certificateholders, as a collective whole, as if those certificateholders constituted a single lender.
The operating advisor will be subject to termination without cause if the holders of certificates representing at least 15% of the voting rights allocable to the Non-Reduced Classes vote to terminate and replace the operating advisor and such vote is approved by the holders of certificates representing more than 50% of the voting rights allocable to the Non-Reduced Classes that exercise their right to vote, provided that the holders of certificates representing at least 50% of the voting rights allocable to the Non-Reduced Classes have exercised their right to vote. The holders initiating such vote will be responsible for the fees and expenses in connection with the vote and replacement.
An “Operating Advisor Consultation Event” will occur when either (i) the aggregate certificate balance of the RR Certificates (taking into account the application of any Cumulative Appraisal Reduction Amounts to notionally reduce the certificate balances of such classes) is 25% or less of the initial aggregate certificate balance of such classes or (ii) a Control Termination Event has occurred and is continuing.
“Non-Reduced Class” means any class of principal balance certificates then outstanding for which (a)(1) the initial certificate balance of such class of certificates minus (2) the sum (without duplication) of (x) any payments of principal (whether as principal prepayments or otherwise) distributed to the certificateholders of such class of certificates, (y) any Cumulative Appraisal Reduction Amounts allocated to such class of certificates and (z) any realized losses previously allocated to such class of certificates is equal to or greater than (b) 25% of the
|
This is not a research report and was not prepared by any Underwriter’s research department. Please see additional important information and qualifications at the end of this Term Sheet. |
T-12
| MSC 2017-HR2 | Structural Overview |
| difference between (1) the initial certificate balance of such class of certificates and (2) any payments of principal (whether as principal prepayments or otherwise) distributed to the certificateholders of such class of certificates. | ||
| Operating Advisor Expenses: | In addition to the Operating Advisor Fee and the Operating Advisor Consulting Fee, the operating advisor will be entitled to reimbursement of Operating Advisor Expenses in accordance with the terms of the pooling and servicing agreement for this transaction. “Operating Advisor Expenses” for each distribution date will equal any unreimbursed indemnification amounts or additional trust fund expenses payable to the operating advisor pursuant to the pooling and servicing agreement for this transaction (other than the Operating Advisor Fee and the Operating Advisor Consulting Fee). | |
| Asset Representations Reviewer: | The asset representations reviewer will be required to review certain delinquent mortgage loans after a specified delinquency threshold has been met and the required percentage of certificateholders vote to direct a review as described below. The asset representations reviewer will be entitled to the Asset Representations Reviewer Fee with respect to such review. See “Pooling and Servicing Agreement—The Asset Representations Reviewer” in the Preliminary Prospectus.
The certificate administrator will be required to notify certificateholders if the specified delinquency threshold has been met as described in the Preliminary Prospectus under “—The Asset Representations Reviewer”.
If certificateholders entitled to not less than 5.0% of the voting rights request a vote to commence an asset review, and if subsequently (i) a majority of the voting rights allocable to those certificateholders who cast votes and (ii) a majority of the voting rights that constitute a minimum Asset Review Quorum authorizes an asset review within 150 days of the request for a vote, the asset representations reviewer will be required to conduct an asset review of delinquent loans.
An “Asset Review Quorum” is, in connection with any solicitation of votes to authorize an asset review as described above, the holders of certificates evidencing at least 5.0% of the aggregate voting rights.
The asset representations reviewer may be terminated and replaced without cause. Upon (i) the written direction of certificateholders entitled to not less than 25% of the voting rights (without regard to the application of any Cumulative Appraisal Reduction Amounts) requesting a vote to terminate and replace the asset representations reviewer with a proposed successor asset representations reviewer that is an eligible asset representations reviewer, and (ii) payment by such holders to the certificate administrator of the reasonable fees and expenses to be incurred by the certificate administrator in connection with administering such vote, the certificate administrator will be required to promptly provide notice to all certificateholders and the asset representations reviewer of such request by posting such notice on its internet website, and by mailing such notice to all certificateholders and the asset representations reviewer. Upon the written direction of certificateholders entitled to at least 75% of the voting rights that constitute a minimum Certificateholder Quorum (without regard to the application of any Cumulative Appraisal Reduction Amounts), the trustee will be required to terminate all of the rights and obligations of the asset representations reviewer under the pooling and servicing agreement (other than any rights or obligations that accrued prior to the date of such termination and other than indemnification rights arising out of events occurring prior to such termination) by written notice to the asset representations reviewer, and the proposed successor asset representations reviewer will be appointed. See “Pooling and Servicing Agreement—The Asset Representations Reviewer” in the Preliminary Prospectus.
| |
| Dispute Resolution Provisions: | The mortgage loan sellers will be subject to the dispute resolution provisions set forth in the pooling and servicing agreement for this transaction to the extent those provisions are triggered with respect to any mortgage loan sold to the depositor by a mortgage loan seller, and such mortgage loan seller will be obligated under the related mortgage loan purchase agreement to comply with all applicable provisions and to take part in any mediation or arbitration proceedings that may result. Generally, in the event that a Repurchase Request is not “Resolved” within 180 days after the related mortgage loan seller receives such Repurchase Request, then the enforcing servicer will be required to send a notice to the first certificateholder (or beneficial owner) to deliver a certificateholder repurchase request with respect to the mortgage loan (the “Initial Requesting Certificateholder”) (if any) and to the certificate administrator (which will be required to make such notice available to certificateholders via the certificate administrator’s website) indicating the enforcing servicer’s intended course of action with respect to the Repurchase Request. If (a) the enforcing servicer’s intended course of action with respect to the Repurchase Request does not involve pursuing further action to exercise rights against the related mortgage loan seller with respect to the Repurchase Request and the Initial Requesting Certificateholder, if any, or any other certificateholder or certificate owner wishes to exercise its right to refer the matter to mediation (including nonbinding arbitration) or arbitration, or (b) the enforcing servicer’s intended course of action is to pursue further action to exercise rights against the related mortgage loan seller with respect to the Repurchase Request but the Initial Requesting Certificateholder, if any, or any other certificateholder or certificate owner does not agree with the dispute resolution method selected by the enforcing servicer, then the Initial Requesting Certificateholder, if any, or such other certificateholder or certificate owner may deliver a written notice to the special servicer indicating its intent to exercise its right to refer the matter to either mediation or arbitration.
“Resolved” means, with respect to a Repurchase Request, (i) that the related material defect or breach has been cured, (ii) the related mortgage loan has been repurchased in accordance with the related mortgage loan purchase agreement, (iii) a mortgage loan has been substituted for the related mortgage loan in accordance with the related mortgage loan purchase agreement, (iv) the applicable mortgage loan seller has made a loss of value payment, (v) a contractually binding agreement has been entered into between the enforcing servicer, on behalf of the issuing entity, and the related mortgage loan seller that settles the related mortgage loan seller’s obligations under the related mortgage loan purchase agreement, or (vi) the related mortgage loan is no longer property of the issuing entity as a result of a sale or other disposition in accordance with the pooling and |
This is not a research report and was not prepared by any Underwriter’s research department. Please see additional important information and qualifications at the end of this Term Sheet. |
T-13
| MSC 2017-HR2 | Structural Overview |
| servicing agreement. See “Pooling and Servicing Agreement—Dispute Resolution Provisions” in the Preliminary Prospectus. | ||
| Investor Communications: | The certificate administrator is required to include on any Form 10-D any request received from a certificateholder to communicate with other certificateholders related to certificateholders exercising their rights under the terms of the pooling and servicing agreement for this transaction. Any certificateholder wishing to communicate with other certificateholders regarding the exercise of its rights under the terms of the pooling and servicing agreement for this transaction will be able to deliver a written request signed by an authorized representative of the requesting investor to the certificate administrator. | |
| Deal Website: | The certificate administrator will be required to maintain a deal website which will include, among other items: (a) summaries of asset status reports prepared by the special servicer, (b) inspection reports, (c) appraisals, (d) various “special notices” described in the Preliminary Prospectus, (e) the “Investor Q&A Forum” and (f) a voluntary “Investor Registry”. Investors may access the deal website following execution of a certification and confidentiality agreement. |
This is not a research report and was not prepared by any Underwriter’s research department. Please see additional important information and qualifications at the end of this Term Sheet. |
T-14
| MSC 2017-HR2 | Collateral Overview |
| Mortgage Loan Sellers | No. of Mortgage Loans | No. of Mortgaged Properties | Aggregate Cut-off Date Balance | % of Pool(1) |
| Morgan Stanley Mortgage Capital Holdings LLC | 10 | 45 | $308,140,568 | 32.7% |
| Citi Real Estate Funding Inc. | 11 | 15 | $303,150,000 | 32.2% |
| Starwood Mortgage Funding III LLC | 11 | 11 | $173,250,000 | 18.4% |
| Argentic Real Estate Finance LLC | 10 | 11 | $158,196,507 | 16.8% |
| Total: | 42 | 82 | $942,737,075 | 100.0% |
| Pool Statistics | |
| Aggregate Cut-off Date Balance: | $942,737,075 |
| Number of Mortgage Loans: | 42 |
| Average Cut-off Date Balance per Mortgage Loan: | $22,446,121 |
| Number of Mortgaged Properties: | 82 |
| Average Cut-off Date Balance per Mortgaged Property: | $11,496,794 |
| Weighted Average Mortgage Rate: | 4.2543% |
| % of Pool Secured by 5 Largest Mortgage Loans: | 38.7% |
| % of Pool Secured by 10 Largest Mortgage Loans: | 55.5% |
| % of Pool Secured by ARD Loans(2): | 3.7% |
| Weighted Average Original Term to Maturity (months)(2): | 113 |
| Weighted Average Remaining Term to Maturity (months)(2): | 112 |
| Weighted Average Seasoning (months): | 0 |
| % of Pool Secured by Single Tenant Mortgaged Properties: | 4.3% |
| % of Pool Secured by Refinance Loans: | 63.6% |
| % of Pool Secured by Acquisition Loans: | 23.0% |
| % of Pool Secured by Recapitalization Loans: | 12.5% |
| % of Pool Secured by Refinance/Acquisition Loans: | 1.0% |
| Additional Debt | |
| % of Pool withPari Passu Mortgage Debt: | 42.7% |
| % of Pool with Subordinate Mortgage Debt: | 0.0% |
| % of Pool with Mezzanine Debt: | 0.0% |
| Credit Statistics(3) | |
| Weighted Average UW NOI DSCR: | 2.43x |
| Weighted Average UW NOI Debt Yield(4): | 11.0% |
| Weighted Average UW NCF DSCR: | 2.29x |
| Weighted Average UW NCF Debt Yield(4): | 10.3% |
| Weighted Average Cut-off Date LTV Ratio(4)(5): | 57.8% |
| Weighted Average Maturity Date LTV Ratio(2)(5): | 55.0% |
Footnotes are set forth on the following page.
This is not a research report and was not prepared by any Underwriter’s research department. Please see additional important information and qualifications at the end of this Term Sheet. |
T-15
| MSC 2017-HR2 | Collateral Overview |
Amortization
| Weighted Average Original Amortization Term (months)(6): | 354 |
| Weighted Average Remaining Amortization Term (months)(6): | 354 |
| % of Pool Interest Only through Maturity(2): | 67.2% |
| % of Pool Interest Only followed by Amortizing Balloon: | 15.0% |
| % of Pool Amortizing Balloon: | 14.1% |
| % of Pool Interest Only followed by Amortizing with Balloon at ARD: | 3.7% |
| Lockboxes | |
| % of Pool with Springing Lockboxes: | 57.5% |
| % of Pool with Hard Lockboxes: | 37.6% |
| % of Pool with Soft Lockboxes: | 4.0% |
| % of Pool with No Lockboxes: | 0.8% |
| Reserves | |
| % of Pool Requiring Tax Reserves: | 63.3% |
| % of Pool Requiring Insurance Reserves: | 53.2% |
| % of Pool Requiring Replacement Reserves: | 67.8% |
| % of Pool Requiring TI/LC Reserves(7): | 63.9% |
| Call Protection | |
| % of Pool with lockout period, followed by defeasance until open period: | 79.3% |
| % of Pool with lockout period, followed by defeasance or the greater of a prepayment premium and yield maintenance until open period: | 19.3% |
| % of Pool with lockout period, followed by the greater of a prepayment premium and yield maintenance until open period: | 1.5% |
| (1) | Unless otherwise indicated, all references to “% of Pool” in this Term Sheet reflect a percentage of the aggregate principal balance of the mortgage pool as of the Cut-off Date, after application of all payments of principal due during or prior to December 2017. |
| (2) | With respect to any ARD Loan, unless otherwise indicated, references in this Term Sheet to the applicable “maturity date” or “maturity” refer to the applicable anticipated repayment date with respect to such ARD Loan, and such applicable anticipated repayment date is treated as its maturity date for all purposes hereof. |
| (3) | With respect to any mortgage loan that is part of a whole loan, unless otherwise indicated, all LTV, DSCR and Debt Yield calculations in this Term Sheet include any relatedpari passucompanion loans and exclude any subordinate companion loans, as applicable. Additionally, LTV, DSCR and Debt Yield figures in this Term Sheet are calculated for mortgage loans without regard to any additional indebtedness that may be incurred at a future date. |
| (4) | With respect to certain mortgage loans, debt yields and LTVs (such as, for example, UW NOI Debt Yield, UW NCF Debt Yield or Cut-off Date LTV Ratio) have been calculated based on a principal balance that is net of a holdback or earnout reserve. Such mortgage loans are identified under the definitions of “Underwritten NOI Debt Yield”, “Underwritten NCF Debt Yield” and “Cut-off Date LTV Ratio” set forth under “Description of the Mortgage Pool—Certain Calculations and Definitions” in the Preliminary Prospectus. |
| (5) | The LTV ratios set forth in this Term Sheet are generally based on the “as-is” values of the related mortgaged properties; provided that the “as-is” value for a portfolio of mortgaged properties may include a premium relating to the valuation of the mortgaged properties as a whole rather than as the sum of the appraised values of the individually valued mortgaged properties; provided, further, that such LTV ratios may be based on “as-stabilized”, “as complete” or other contingent values in certain cases in which reserves have been established at origination for the applicable condition or circumstance that is expected to result in stabilization provided, further, that such LTV ratios may have been calculated based on a principal balance that is net of a holdback or earnout reserve. See the definition of “Appraised Value” under“Description of the Mortgage Pool—Certain Calculations and Definitions”in the Preliminary Prospectus. |
| (6) | Excludes mortgage loans that provide for payments of interest only through the related maturity date or anticipated repayment date, as applicable. |
| (7) | Excludes hospitality, multifamily, other (parking) and self storage properties. |
This is not a research report and was not prepared by any Underwriter’s research department. Please see additional important information and qualifications at the end of this Term Sheet. |
T-16
| MSC 2017-HR2 | Characteristics of the Mortgage Loans |
| Top 10 Mortgage Loans or Groups of Cross-Collateralized Mortgage Loans(1) | |||||||||||||
| Loan No. | Mortgage Loan Seller | Property Name | City | State | Property Type | Cut-off Date Balance | % of Pool | SF/Units | Cut-off Date Balance per SF/Unit | UW NCF DSCR | UW NOI Debt Yield | Cut-off Date LTV | Maturity Date LTV |
| 1 | MSMCH | Extra Space Self Storage Portfolio | Various | Various | Self Storage | $92,000,000 | 9.8% | 2,668,218 | $72.86 | 2.01x | 8.7% | 65.0% | 65.0% |
| 2 | CREFI | The Woods | San Jose | CA | Multifamily | $85,000,000 | 9.0% | 1,841 | $108,636.61 | 5.01x | 15.2% | 29.6% | 29.6% |
| 3 | MSMCH | Baybrook Lifestyle and Power Center | Friendswood | TX | Retail | $80,000,000 | 8.5% | 636,845 | $219.83 | 2.80x | 11.3% | 58.1% | 58.1% |
| 4 | CREFI | Harmon Corner | Las Vegas | NV | Mixed Use | $57,200,000 | 6.1% | 68,613 | $2,084.15 | 2.02x | 8.8% | 56.5% | 56.5% |
| 5 | MSMCH | Totowa Commons | Totowa | NJ | Retail | $50,800,000 | 5.4% | 271,488 | $187.12 | 1.82x | 8.5% | 57.3% | 57.3% |
| 6 | SMF III | 150 West Jefferson | Detroit | MI | Office | $35,000,000 | 3.7% | 489,786 | $137.82 | 1.75x | 12.1% | 65.5% | 60.2% |
| 7 | SMF III | 925 L Street | Sacramento | CA | Office | $32,200,000 | 3.4% | 168,850 | $190.70 | 1.63x | 10.2% | 68.1% | 62.1% |
| 8 | SMF III | One Ally Center | Detroit | MI | Office | $32,000,000 | 3.4% | 976,095 | $104.50 | 2.43x | 12.6% | 55.1% | 55.1% |
| 9 | CREFI | Bakers Centre | Philadelphia | PA | Retail | $32,000,000 | 3.4% | 236,709 | $135.19 | 2.36x | 10.1% | 60.5% | 60.5% |
| 10 | MSMCH | Sunrise Plaza San Jose | San Jose | CA | Retail | $27,000,000 | 2.9% | 112,805 | $239.35 | 2.06x | 9.5% | 61.1% | 61.1% |
| Total/Wtd. Avg. | $523,200,000 | 55.5% | 2.61x | 10.8% | 55.7% | 54.9% | |||||||
| (1) | With respect to any mortgage loan that is part of a whole loan, unless otherwise indicated, all LTV, DSCR, Debt Yield and Balance per SF/Unit calculations in this Term Sheet include any relatedpari passu companion loans and exclude any subordinate companion loans, as applicable. Additionally, LTV, DSCR, Debt Yield and Balance per SF/Unit figures in this Term Sheet are calculated for mortgage loans without regard to any additional indebtedness that may be incurred at a future date. With respect to any leased fee loans, the SF/Units and Balance per SF/Unit figures in this Term Sheet are based on the size of the non-collateral improvements. |
This is not a research report and was not prepared by any Underwriter’s research department. Please see additional important information and qualifications at the end of this Term Sheet. |
T-17
| MSC 2017-HR2 | Characteristics of the Mortgage Loans |
| Mortgage Loans with Pari Passu Companion Loans | ||||||||||||
| Loan No. | Mortgage Loan Seller | Property Name | Mortgage Loan Cut-off Date Balance | Aggregate Pari Passu Companion Loan Cut-off Date Balance | Combined Cut-off Date Balance | Lead Servicing Agreement | Master Servicer | Special Servicer | Control Rights | Combined UW NCF DSCR(1) | Combined UW NOI Debt Yield(1) | Combined Cut-off Date LTV(1) |
| 1 | MSMCH | Extra Space Self Storage Portfolio | $92,000,000 | $102,400,000 | $194,400,000 | MSC 2017-HR2 | Wells Fargo | LNR | MSC 2017 HR2 | 2.01x | 8.7% | 65.0% |
| 2 | CREFI | The Woods | $85,000,000 | $115,000,000 | $200,000,000 | MSC 2017-HR2 | Wells Fargo | LNR | MSC 2017 HR2 | 5.01x | 15.2% | 29.6% |
| 3 | MSMCH | Baybrook Lifestyle and Power Center | $80,000,000 | $60,000,000 | $140,000,000 | MSC 2017-HR2 | Wells Fargo | LNR | MSC 2017 HR2 | 2.80x | 11.3% | 58.1% |
| 4 | CREFI | Harmon Corner | $57,200,000 | $85,800,000 | $143,000,000 | UBS 2017-C6(2) | Wells Fargo(2) | Rialto(2) | UBS 2017-C6(2) | 2.02x | 8.8% | 56.5% |
| 6 | SMF III | 150 West Jefferson | $35,000,000 | $32,500,000 | $67,500,000 | MSC 2017-HR2 | Wells Fargo | LNR | MSC 2017 HR2 | 1.75x | 12.1% | 65.5% |
| 8 | SMF III | One Ally Center | $32,000,000 | $70,000,000 | $102,000,000 | WFCM 2017-C42(3) | Wells Fargo(3) | LNR(3) | WFCM 2017-C42(3) | 2.43x | 12.6% | 55.1% |
| 23 | MSMCH | Kirkwood Plaza | $14,980,568 | $23,759,181 | $38,739,749 | MSC 2017-HR2(4) | Wells Fargo(4) | LNR(4) | (4) | 1.37x | 8.8% | 69.5% |
| 39 | AREF | The View at Marlton | $6,000,000 | $20,500,000 | $26,500,000 | WFCM 2017-C41 | Wells Fargo | LNR | WFCM 2017-C41 | 1.32x | 8.6% | 72.6% |
| (1) | DSCR, Debt Yield and LTV calculations include any related pari passu companion loans and exclude any subordinate companion loans, as applicable. |
| (2) | The Harmon Corner control note is currently held by Cantor Commercial Real Estate Lending, L.P. and is expected to be contributed to the UBS 2017-C6 securitization trust on December 13, 2017. |
| (3) | The One Ally Center control note is currently held by Starwood Mortgage Funding II LLC and is expected to be contributed to the WFCM 2017-C42 securitization trust on December 21, 2017. |
| (4) | With respect to the Kirkwood Plaza whole loan, the holder of the related control note (Morgan Stanley Bank, N.A.) will be the controlling noteholder. Such control note is not currently included in this or any other securitization. Upon a securitization of such control note, servicing of the related whole loan will be governed by the pooling and servicing agreement entered into in connection with such securitization, and the representative of the controlling class under such pooling and servicing agreement is expected to have certain consent and control rights regarding servicing of the related whole loan similar to those of the MSC 2017-HR2 directing certificateholder with respect to the mortgage loans serviced under the pooling and servicing agreement for this securitization. The master servicer and the special servicer under the pooling and servicing agreement for any such future securitization of the related control note may not be the same as the entities listed above with respect to the related whole loan. See “Description of the Mortgage Loans—The Whole Loans” in the Preliminary Prospectus. |
This is not a research report and was not prepared by any Underwriter’s research department. Please see additional important information and qualifications at the end of this Term Sheet. |
T-18
| MSC 2017-HR2 | Characteristics of the Mortgage Loans |
| Prior Securitization History(1) | ||||||||||||||
| Loan No. | Mortgage Loan Seller | Property Name | City | State | Property Type | Cut-off Date Balance | % of Pool | SF/Units | Cut-off Date Balance per SF/Unit | UW NCF DSCR | UW NOI Debt Yield | Cut-off Date LTV | Maturity Date LTV | Prior Securitization |
| 4 | CREFI | Harmon Corner | Las Vegas | NV | Mixed Use | $57,200,000 | 6.1% | 68,613 | $2,084.15 | 2.02x | 8.8% | 56.5% | 56.5% | COMM 2013-LC6 & COMM 2012-CCRE5 |
| 5 | MSMCH | Totowa Commons | Totowa | NJ | Retail | $50,800,000 | 5.4% | 271,488 | $187.12 | 1.82x | 8.5% | 57.3% | 57.3% | VNO 2010-VNO |
| 10 | MSMCH | Sunrise Plaza San Jose | San Jose | CA | Retail | $27,000,000 | 2.9% | 112,805 | $239.35 | 2.06x | 9.5% | 61.1% | 61.1% | BSCMS 2006-T22 |
| 15 | SMF III | Sheraton Novi | Novi | MI | Hospitality | $23,100,000 | 2.5% | 238 | $97,058.82 | 1.87x | 13.8% | 62.4% | 51.2% | COMM 2012-CCRE5 |
| 17 | AREF | The Orchards at Dover | Toms River Township | NJ | Retail | $20,916,507 | 2.2% | 98,210 | $212.98 | 1.57x | 9.7% | 69.7% | 56.4% | BSCMS 2007-PW18 |
| 30 | CREFI | Premier Landing | Roanoke Rapids | NC | Retail | $9,500,000 | 1.0% | 127,247 | $74.66 | 1.27x | 9.3% | 61.3% | 50.6% | CD 2007-CD5 |
| Total | $188,516,507 | 20.0% | ||||||||||||
| (1) | Includes mortgage loans for which all or a portion of the previously existing debt was most recently securitized in conduit securitizations, based on information provided by the related borrower or obtained through searches of a third-party database. The information has not otherwise been confirmed by the mortgage loan sellers. With respect to any mortgage loan that is part of a whole loan, unless otherwise indicated, all LTV, DSCR, Debt Yield and Cut-off Date Balance per SF/Unit calculations include any relatedpari passu companion loans and exclude any related subordinate companion loans, as applicable. |
This is not a research report and was not prepared by any Underwriter’s research department. Please see additional important information and qualifications at the end of this Term Sheet. |
T-19
| MSC 2017-HR2 | Characteristics of the Mortgage Loans |
Mortgage Loans with Scheduled Balloon Payments and Related Classes(1)
| Class A-2 ($114,600,000) | ||||||||||||||||
| Loan No. | Mortgage Loan Seller | Property Name | State | Property Type | Cut-off Date Balance | % of Pool | Maturity Date Balance | % of Class A-2 Certificate Principal Balance | SF/ Units | Cut-off Date Balance per SF/Unit | UW NCF DSCR | UW NOI Debt Yield | Cut-off Date LTV | Maturity Date LTV | Rem. IO Period (mos.) | Rem. Term to Maturity (mos.) |
| 2 | CREFI | The Woods | CA | Multifamily | $85,000,000 | 9.0% | $85,000,000 | 74.2% | 1,841 | $108,636.61 | 5.01x | 15.2% | 29.6% | 29.6% | 60 | 60 |
| 16 | CREFI | CityLine Guardian Mixed Use | GA | Mixed Use | $21,670,000 | 2.3% | $20,752,420 | 18.1% | 234,529 | $92.40 | 1.38x | 9.2% | 67.7% | 64.9% | 24 | 60 |
| 28 | AREF | Eagle Village Apartments | IN | Multifamily | $9,580,000 | 1.0% | $8,939,296 | 7.8% | 511 | $18,747.55 | 1.38x | 10.4% | 74.6% | 69.6% | 0 | 60 |
| Total/Wtd. Avg. | $116,250,000 | 12.3% | $114,691,716 | 100.1% | 4.03x | 13.7% | 40.4% | 39.5% | 48 | 60 | ||||||
| (1) | The table above reflects the mortgage loans whose balloon payments will be applied to pay down the Class A-2 certificates, assuming (i) that none of the mortgage loans experience prepayments, defaults or losses; (ii) there are no extensions of maturity dates; and (iii) each mortgage loan is paid in full on its stated maturity date or, in the case of any mortgage loan with an anticipated repayment date, on such anticipated repayment date. The table above is otherwise based on the Structuring Assumptions set forth under “Yield and Maturity Considerations—Weighted Average Life” in the Preliminary Prospectus. |
This is not a research report and was not prepared by any Underwriter’s research department. Please see additional important information and qualifications at the end of this Term Sheet. |
T-20
| MSC 2017-HR2 | Characteristics of the Mortgage Loans |
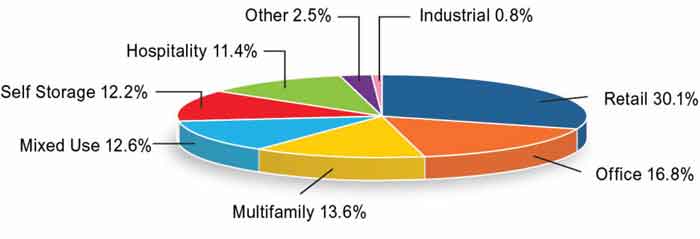
| Property Type Distribution(1) | ||||||||
| Property Type | Number of Mortgaged Properties | Aggregate Cut-off Date Balance | % of Pool | Wtd. Avg. Mortgage Rate | Wtd. Avg. UW NCF DSCR | Wtd. Avg. UW NOI Debt Yield | Wtd. Avg. Cut-off Date LTV | Wtd. Avg. Maturity Date LTV |
| Retail | 12 | $283,597,075 | 30.1% | 4.1677% | 2.15x | 10.0% | 60.3% | 57.4% |
| Anchored | 10 | $192,797,075 | 20.5% | 4.3124% | 1.90x | 9.6% | 61.6% | 57.3% |
| Lifestyle Center | 1 | $80,000,000 | 8.5% | 3.7700% | 2.80x | 11.3% | 58.1% | 58.1% |
| Single Tenant | 1 | $10,800,000 | 1.1% | 4.5300% | 1.75x | 8.3% | 54.0% | 54.0% |
| Office | 8 | $158,530,000 | 16.8% | 4.4130% | 1.97x | 11.5% | 61.0% | 57.9% |
| CBD | 3 | $99,200,000 | 10.5% | 4.4516% | 1.93x | 11.6% | 63.0% | 59.2% |
| Suburban | 5 | $59,330,000 | 6.3% | 4.3486% | 2.03x | 11.4% | 57.7% | 55.8% |
| Multifamily | 4 | $127,980,000 | 13.6% | 3.5548% | 3.81x | 13.3% | 42.0% | 39.8% |
| Garden | 4 | $127,980,000 | 13.6% | 3.5548% | 3.81x | 13.3% | 42.0% | 39.8% |
| Mixed Use | 5 | $118,970,000 | 12.6% | 4.5868% | 1.77x | 8.6% | 62.8% | 62.3% |
| Retail/Signage | 1 | $57,200,000 | 6.1% | 4.2500% | 2.02x | 8.8% | 56.5% | 56.5% |
| Industrial/Retail | 1 | $24,000,000 | 2.5% | 4.9580% | 1.51x | 7.8% | 72.7% | 72.7% |
| Self Storage/Industrial | 1 | $21,670,000 | 2.3% | 5.0600% | 1.38x | 9.2% | 67.7% | 64.9% |
| Retail/Office | 1 | $10,600,000 | 1.1% | 4.6150% | 1.88x | 9.0% | 64.2% | 64.2% |
| Retail/Multifamily | 1 | $5,500,000 | 0.6% | 4.5500% | 1.66x | 7.8% | 62.5% | 62.5% |
| Self Storage | 41 | $114,710,000 | 12.2% | 4.2916% | 1.90x | 8.7% | 64.6% | 63.8% |
| Self Storage | 41 | $114,710,000 | 12.2% | 4.2916% | 1.90x | 8.7% | 64.6% | 63.8% |
| Hospitality | 8 | $107,300,000 | 11.4% | 4.6454% | 2.40x | 14.9% | 54.0% | 46.0% |
| Limited Service | 4 | $46,450,000 | 4.9% | 4.5017% | 2.75x | 15.3% | 45.5% | 41.8% |
| Extended Stay | 2 | $23,250,000 | 2.5% | 4.7609% | 2.45x | 14.9% | 55.4% | 47.3% |
| Full Service | 1 | $23,100,000 | 2.5% | 4.8280% | 1.87x | 13.8% | 62.4% | 51.2% |
| Select Service | 1 | $14,500,000 | 1.5% | 4.6300% | 2.02x | 15.0% | 65.9% | 48.8% |
| Other | 3 | $24,000,000 | 2.5% | 4.2720% | 2.13x | 9.8% | 48.9% | 48.9% |
| Parking | 3 | $24,000,000 | 2.5% | 4.2720% | 2.13x | 9.8% | 48.9% | 48.9% |
| Industrial | 1 | $7,650,000 | 0.8% | 4.6040% | 2.00x | 13.8% | 61.4% | 55.2% |
| Flex | 1 | $7,650,000 | 0.8% | 4.6040% | 2.00x | 13.8% | 61.4% | 55.2% |
| Total/Wtd. Avg. | 82 | $942,737,075 | 100.0% | 4.2543% | 2.29x | 11.0% | 57.8% | 55.0% |
| (1) | All numerical information concerning the mortgage loans is approximate and, in the case of mortgage loans secured by multiple properties, is based on allocated loan amounts with respect to such properties. All weighted average information regarding the mortgage loans reflects the weighting of the mortgage loans based on their outstanding principal balances as of the Cut-off Date or, in the case of mortgage loans secured by multiple properties, allocated loan amounts. The sum of numbers and percentages in columns may not match the “Total” due to rounding. With respect to any mortgage loan that is part of a whole loan, unless otherwise indicated, all LTV, DSCR and Debt Yield calculations include any relatedpari passu companion loans and exclude any related subordinate companion loans, as applicable. |
This is not a research report and was not prepared by any Underwriter’s research department. Please see additional important information and qualifications at the end of this Term Sheet. |
T-21
| MSC 2017-HR2 | Characteristics of the Mortgage Loans |
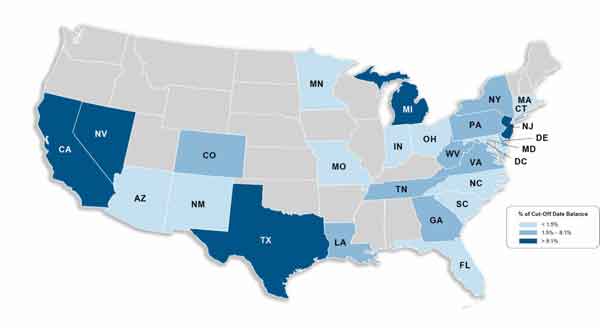
| Geographic Distribution(1) | ||||||||
| State or Other Jurisdiction | Number of Mortgaged Properties | Aggregate Cut-off Date Balance | % of Pool | Wtd. Avg. Mortgage Rate | Wtd. Avg. UW NCF DSCR | Wtd. Avg. UW NOI Debt Yield | Wtd. Avg. Cut-off Date LTV | Wtd. Avg. Maturity Date LTV |
| California | 13 | $190,043,827 | 20.2% | 3.7078% | 3.30x | 12.7% | 47.8% | 45.6% |
| California – Northern(2) | 5 | $155,100,617 | 16.5% | 3.5603% | 3.57x | 12.9% | 46.0% | 44.0% |
| California – Southern(2) | 8 | $34,943,210 | 3.7% | 4.3624% | 2.08x | 11.7% | 55.9% | 53.0% |
| Texas | 5 | $115,892,181 | 12.3% | 3.9419% | 2.54x | 11.3% | 57.8% | 57.2% |
| New Jersey | 9 | $94,975,972 | 10.1% | 4.3191% | 1.77x | 8.8% | 62.4% | 58.8% |
| Michigan | 3 | $90,100,000 | 9.6% | 4.6298% | 2.02x | 12.7% | 61.0% | 56.1% |
| Nevada | 5 | $83,673,416 | 8.9% | 4.2436% | 2.08x | 9.2% | 58.0% | 58.0% |
| New York | 8 | $72,368,930 | 7.7% | 4.5483% | 1.82x | 8.6% | 60.4% | 60.4% |
| Georgia | 5 | $49,675,761 | 5.3% | 4.8419% | 1.56x | 10.1% | 63.8% | 58.2% |
| Pennsylvania | 4 | $41,592,798 | 4.4% | 3.9957% | 2.28x | 9.8% | 61.5% | 61.5% |
| West Virginia | 2 | $33,400,000 | 3.5% | 4.5000% | 1.45x | 9.2% | 64.2% | 57.2% |
| District of Columbia | 1 | $25,500,000 | 2.7% | 4.3300% | 2.62x | 13.0% | 39.2% | 39.2% |
| Colorado | 2 | $15,000,000 | 1.6% | 4.6100% | 3.82x | 19.6% | 50.2% | 50.2% |
| Delaware | 1 | $14,980,568 | 1.6% | 4.5900% | 1.37x | 8.8% | 69.5% | 56.5% |
| Louisiana | 1 | $14,500,000 | 1.5% | 3.9000% | 2.91x | 12.2% | 48.2% | 48.2% |
| Virginia | 1 | $14,500,000 | 1.5% | 4.6300% | 2.02x | 15.0% | 65.9% | 48.8% |
| Tennessee | 7 | $13,995,679 | 1.5% | 4.6917% | 1.82x | 10.6% | 67.1% | 59.4% |
| Maryland | 1 | $10,600,000 | 1.1% | 4.6150% | 1.88x | 9.0% | 64.2% | 64.2% |
| Indiana | 1 | $9,580,000 | 1.0% | 5.7100% | 1.38x | 10.4% | 74.6% | 69.6% |
| North Carolina | 1 | $9,500,000 | 1.0% | 5.0300% | 1.27x | 9.3% | 61.3% | 50.6% |
| Ohio | 2 | $8,658,025 | 0.9% | 4.5541% | 2.00x | 13.2% | 61.8% | 56.3% |
| Florida | 2 | $8,386,955 | 0.9% | 4.5045% | 1.57x | 8.8% | 66.7% | 62.6% |
| Minnesota | 1 | $7,300,000 | 0.8% | 4.6940% | 1.54x | 11.6% | 68.9% | 59.2% |
| Connecticut | 1 | $4,595,267 | 0.5% | 4.1750% | 2.01x | 8.7% | 65.0% | 65.0% |
| New Mexico | 2 | $3,719,753 | 0.4% | 4.1750% | 2.01x | 8.7% | 65.0% | 65.0% |
| Massachusetts | 1 | $3,615,638 | 0.4% | 4.1750% | 2.01x | 8.7% | 65.0% | 65.0% |
| Arizona | 1 | $2,721,193 | 0.3% | 4.1750% | 2.01x | 8.7% | 65.0% | 65.0% |
| South Carolina | 1 | $2,200,000 | 0.2% | 5.4200% | 1.39x | 9.6% | 61.5% | 51.4% |
| Missouri | 1 | $1,661,111 | 0.2% | 4.1750% | 2.01x | 8.7% | 65.0% | 65.0% |
| Total/Wtd. Avg. | 82 | $942,737,075 | 100.0% | 4.2543% | 2.29x | 11.0% | 57.8% | 55.0% |
| (1) | All numerical information concerning the mortgage loans is approximate and, in the case of mortgage loans secured by multiple properties, is based on allocated loan amounts with respect to such properties. All weighted average information regarding the mortgage loans reflects the weighting of the mortgage loans based on their outstanding principal balances as of the Cut-off Date or, in the case of mortgage loans secured by multiple properties, allocated loan amounts. The sum of numbers and percentages in columns may not match the “Total” due to rounding. With respect to any mortgage loan that is part of a whole loan, unless otherwise indicated, all LTV, DSCR and Debt Yield calculations include any relatedpari passu companion loans and exclude any related subordinate companion loans, as applicable. |
| (2) | “California – Northern” includes zip codes above 93600, and “California – Southern” includes zip codes at or below 93600. |
This is not a research report and was not prepared by any Underwriter’s research department. Please see additional important information and qualifications at the end of this Term Sheet. |
T-22
| MSC 2017-HR2 | Collateral Statistics |
Collateral Statistics(1)
Cut-off Date Balance ($)
| No. of Mortgage Loans | Aggregate Cut-off Date Balance ($) | % of Pool | |
| 2,200,000 - 10,000,000 | 15 | 108,790,000 | 11.5 |
| 10,000,001 - 20,000,000 | 10 | 148,310,568 | 15.7 |
| 20,000,001 - 30,000,000 | 8 | 189,436,507 | 20.1 |
| 30,000,001 - 40,000,000 | 4 | 131,200,000 | 13.9 |
| 40,000,001 - 55,000,000 | 1 | 50,800,000 | 5.4 |
| 55,000,001 - 65,000,000 | 1 | 57,200,000 | 6.1 |
| 65,000,001 - 92,000,000 | 3 | 257,000,000 | 27.3 |
| Total: | 42 | $942,737,075 | 100.0% |
Min: $2,200,000 | Max: $92,000,000 Avg: $22,446,121 | ||
State or Other Jurisdiction(2)
| No. of Mortgaged Properties | Aggregate Cut-off Date Balance ($) | % of Pool | |
| California | 13 | 190,043,827 | 20.2 |
| California – Northern(3) | 5 | 155,100,617 | 16.5 |
| California – Southern(3) | 8 | 34,943,210 | 3.7 |
| Texas | 5 | 115,892,181 | 12.3 |
| New Jersey | 9 | 94,975,972 | 10.1 |
| Michigan | 3 | 90,100,000 | 9.6 |
| Nevada | 5 | 83,673,416 | 8.9 |
| New York | 8 | 72,368,930 | 7.7 |
| Georgia | 5 | 49,675,761 | 5.3 |
| Pennsylvania | 4 | 41,592,798 | 4.4 |
| West Virginia | 2 | 33,400,000 | 3.5 |
| District of Columbia | 1 | 25,500,000 | 2.7 |
| Colorado | 2 | 15,000,000 | 1.6 |
| Delaware | 1 | 14,980,568 | 1.6 |
| Louisiana | 1 | 14,500,000 | 1.5 |
| Virginia | 1 | 14,500,000 | 1.5 |
| Tennessee | 7 | 13,995,679 | 1.5 |
| Maryland | 1 | 10,600,000 | 1.1 |
| Indiana | 1 | 9,580,000 | 1.0 |
| North Carolina | 1 | 9,500,000 | 1.0 |
| Ohio | 2 | 8,658,025 | 0.9 |
| Florida | 2 | 8,386,955 | 0.9 |
| Minnesota | 1 | 7,300,000 | 0.8 |
| Connecticut | 1 | 4,595,267 | 0.5 |
| New Mexico | 2 | 3,719,753 | 0.4 |
| Massachusetts | 1 | 3,615,638 | 0.4 |
| Arizona | 1 | 2,721,193 | 0.3 |
| South Carolina | 1 | 2,200,000 | 0.2 |
| Missouri | 1 | 1,661,111 | 0.2 |
| Total: | 82 | $942,737,075 | 100.0% |
Property Type(2)
| No. of Mortgaged Properties | Aggregate Cut-off Date Balance ($) | % of Pool | |
| Retail | 12 | 283,597,075 | 30.1 |
| Anchored | 10 | 192,797,075 | 20.5 |
| Lifestyle Center | 1 | 80,000,000 | 8.5 |
| Single Tenant | 1 | 10,800,000 | 1.1 |
| Office | 8 | 158,530,000 | 16.8 |
| CBD | 3 | 99,200,000 | 10.5 |
| Suburban | 5 | 59,330,000 | 6.3 |
| Multifamily | 4 | 127,980,000 | 13.6 |
| Garden | 4 | 127,980,000 | 13.6 |
| Mixed Use | 5 | 118,970,000 | 12.6 |
| Retail/Signage | 1 | 57,200,000 | 6.1 |
| Industrial/Retail | 1 | 24,000,000 | 2.5 |
| Self Storage/Industrial | 1 | 21,670,000 | 2.3 |
| Retail/Office | 1 | 10,600,000 | 1.1 |
| Retail/Multifamily | 1 | 5,500,000 | 0.6 |
| Self Storage | 41 | 114,710,000 | 12.2 |
| Self Storage | 41 | 114,710,000 | 12.2 |
| Hospitality | 8 | 107,300,000 | 11.4 |
| Limited Service | 4 | 46,450,000 | 4.9 |
| Extended Stay | 2 | 23,250,000 | 2.5 |
| Full Service | 1 | 23,100,000 | 2.5 |
| Select Service | 1 | 14,500,000 | 1.5 |
| Other | 3 | 24,000,000 | 2.5 |
| Parking | 3 | 24,000,000 | 2.5 |
| Industrial | 1 | 7,650,000 | 0.8 |
| Flex | 1 | 7,650,000 | 0.8 |
| Total: | 82 | $942,737,075 | 100.0% |
Mortgage Rate (%)
| No. of Mortgage Loans | Aggregate Cut-off Date Balance ($) | % of Pool | |
| 2.9405 - 4.4990 | 16 | 599,596,507 | 63.6 |
| 4.5000 - 4.9990 | 21 | 293,790,568 | 31.2 |
| 5.0000 - 5.7100 | 5 | 49,350,000 | 5.2 |
| Total: | 42 | $942,737,075 | 100.0% |
| Min: 2.9405% | Max: 5.7100% Wtd Avg: 4.2543% | ||
Original Term to Maturity or ARD (mos.)
| No. of Mortgage Loans | Aggregate Cut-off Date Balance ($) | % of Pool | |
| 60 | 3 | 116,250,000 | 12.3 |
| 120 | 39 | 826,487,075 | 87.7 |
| Total: | 42 | $942,737,075 | 100.0% |
| Min: 60 mos. | Max: 120 mos. Wtd Avg: 113 mos. | ||
Remaining Term to Maturity or ARD (mos.)
| No. of Mortgage Loans | Aggregate Cut-off Date Balance ($) | % of Pool | |
| 60 – 60 | 3 | 116,250,000 | 12.3 |
| 117 – 119 | 10 | 134,477,075 | 14.3 |
| 120 – 120 | 29 | 692,010,000 | 73.4 |
| Total: | 42 | $942,737,075 | 100.0% |
| Min: 60 mos. | Max: 120 mos. Wtd Avg: 112 mos. | ||
Original Amortization Term (mos.)
| No. of Mortgage Loans | Aggregate Cut-off Date Balance ($) | % of Pool | |
| Interest Only | 19 | 633,730,000 | 67.2 |
| 300 | 2 | 20,900,000 | 2.2 |
| 330 | 1 | 15,250,000 | 1.6 |
| 360 | 20 | 272,857,075 | 28.9 |
| Total: | 42 | $942,737,075 | 100.0% |
| Min: 300 mos. | Max: 360 mos. Wtd Avg: 354 mos. | ||
Remaining Amortization Term (mos.)
| No. of Mortgage Loans | Aggregate Cut-off Date Balance ($) | % of Pool | |
| Interest Only | 19 | 633,730,000 | 67.2 |
| 300 | 2 | 20,900,000 | 2.2 |
| 330 | 1 | 15,250,000 | 1.6 |
| 357 - 360 | 20 | 272,857,075 | 28.9 |
| Total: | 42 | $942,737,075 | 100.0% |
| Min: 300 mos. | Max: 360 mos. Wtd Avg: 354 mos. | ||
Mortgage Loan Sellers
| No. of Mortgage Loans | Aggregate Cut-off Date Balance ($) | % of Pool | ||
| MSMCH | 10 | 308,140,568 | 32.7 | |
| CREFI | 11 | 303,150,000 | 32.2 | |
| SMF III | 11 | 173,250,000 | 18.4 | |
| AREF | 10 | 158,196,507 | 16.8 | |
| Total: | 42 | $942,737,075 | 100.0% | |
Amortization Type
| No. of Mortgage Loans | Aggregate Cut-off Date Balance ($) | % of Pool | |
| Interest Only | 19 | 633,730,000 | 67.2 |
| Partial Interest Only | 11 | 141,330,000 | 15.0 |
| Amortizing Balloon | 11 | 132,677,075 | 14.1 |
| Partial Interest Only ARD | 1 | 35,000,000 | 3.7 |
| Total: | 42 | 942,737,075 | 100.0% |
Cut-off Date LTV Ratio (%)
| No. of Mortgage Loans | Aggregate Cut-off Date Balance ($) | % of Pool | |
| 29.6 - 50.0 | 5 | 156,550,000 | 16.6 |
| 50.1 - 55.0 | 4 | 58,550,000 | 6.2 |
| 55.1 - 60.0 | 7 | 259,830,000 | 27.6 |
| 60.1 - 65.0 | 12 | 242,250,000 | 25.7 |
| 65.1 - 74.6 | 14 | 225,557,075 | 23.9 |
| Total: | 42 | $942,737,075 | 100.0% |
| Min: 29.6% | Max: 74.6% Wtd Avg: 57.8% | ||
Maturity Date or ARD LTV Ratio (%)
| No. of Mortgage Loans | Aggregate Cut-off Date Balance ($) | % of Pool | |
| 29.6 - 40.0 | 3 | 118,050,000 | 12.5 |
| 40.1 - 50.0 | 5 | 77,750,000 | 8.2 |
| 50.1 - 55.0 | 8 | 98,650,000 | 10.5 |
| 55.1 - 60.0 | 14 | 346,527,075 | 36.8 |
| 60.1 - 65.0 | 10 | 268,180,000 | 28.4 |
| 65.1 - 72.7 | 2 | 33,580,000 | 3.6 |
| Total: | 42 | $942,737,075 | 100.0% |
| Min: 29.6% | Max: 72.7% Wtd Avg: 55.0% | ||
UW NCF DSCR (x)
| No. of Mortgage Loans | Aggregate Cut-off Date Balance ($) | % of Pool | |
| 1.27 - 1.40 | 8 | 88,230,568 | 9.4 |
| 1.41 - 1.50 | 4 | 42,210,000 | 4.5 |
| 1.51 - 1.60 | 4 | 58,616,507 | 6.2 |
| 1.61 - 1.80 | 6 | 107,450,000 | 11.4 |
| 1.81 - 2.00 | 5 | 97,450,000 | 10.3 |
| 2.01 - 2.25 | 6 | 237,950,000 | 25.2 |
| 2.26 - 2.50 | 3 | 83,280,000 | 8.8 |
| 2.51 - 5.01 | 6 | 227,550,000 | 24.1 |
| Total: | 42 | $942,737,075 | 100.0% |
| Min: 1.27x | Max: 5.01x Wtd Avg: 2.29x | ||
UW NOI Debt Yield (%)
| No. of Mortgage Loans | Aggregate Cut-off Date Balance ($) | % of Pool | |
| 7.8 - 8.0 | 2 | 29,500,000 | 3.1 |
| 8.1 - 9.0 | 11 | 278,190,568 | 29.5 |
| 9.1.0 - 9.5 | 5 | 84,670,000 | 9.0 |
| 9.6 - 10.0 | 4 | 56,616,507 | 6.0 |
| 10.1 - 11.0 | 4 | 93,060,000 | 9.9 |
| 11.1 - 12.0 | 3 | 96,000,000 | 10.2 |
| 12.1 - 14.0 | 9 | 182,650,000 | 19.4 |
| 14.1 - 16.0 | 2 | 99,500,000 | 10.6 |
| 16.1 - 21.0 | 2 | 22,550,000 | 2.4 |
| Total: | 42 | $942,737,075 | 100.0% |
| Min: 7.8% | Max: 21.0% Wtd Avg: 11.0% | ||
| (1) | All numerical information concerning the mortgage loans is approximate. All weighted average information regarding the mortgage loans reflects the weighting of the mortgage loans based on their outstanding principal balances as of the Cut-off Date. The sum of numbers and percentages in columns may not match the “Total” due to rounding. With respect to any mortgage loan that is part of a whole loan, unless otherwise indicated, all LTV, DSCR and Debt Yield calculations include any relatedpari passu companion loans and exclude any related subordinate companion loans, as applicable. |
| (2) | In the case of mortgage loans secured by multiple properties, cut-off date balance information is based on allocated loan amounts with respect to such properties. |
| (3) | “California – Northern” includes zip codes above 93600, and “California – Southern” includes zip codes at or below 93600. |
This is not a research report and was not prepared by any Underwriter’s research departments. Please see additional important information and qualifications at the end of this Term Sheet. |
T-23
| MSC 2017-HR2 | Extra Space Self Storage Portfolio |
Mortgage Loan No. 1 – Extra Space Self Storage Portfolio

This is not a research report and was not prepared by any Underwriter’s research department. Please see additional important information and qualifications at the end of this Term Sheet. |
T-24
| MSC 2017-HR2 | Extra Space Self Storage Portfolio |
Mortgage Loan No. 1 – Extra Space Self Storage Portfolio
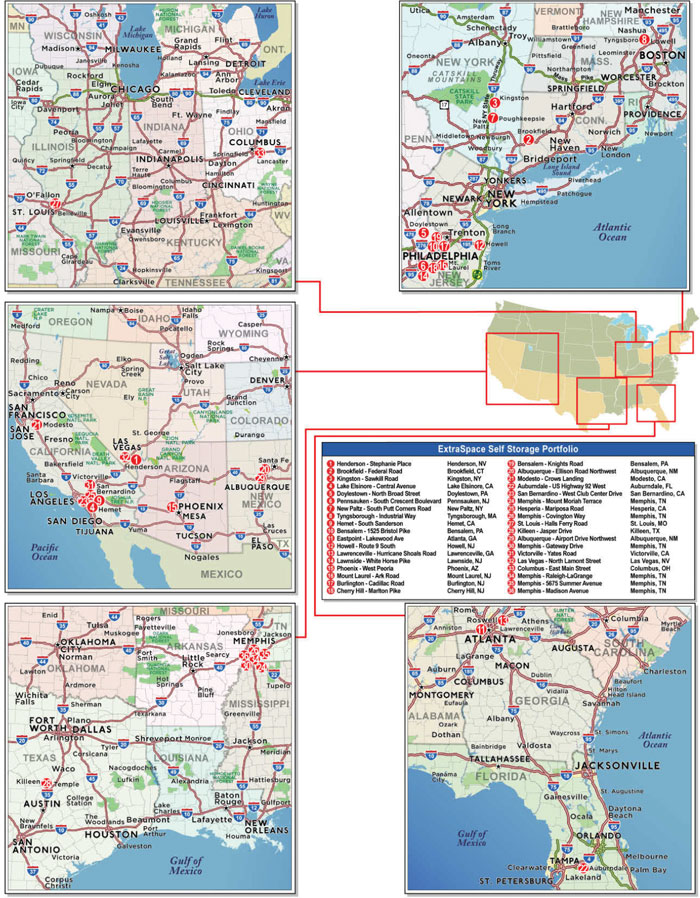
This is not a research report and was not prepared by any Underwriter’s research department. Please see additional important information and qualifications at the end of this Term Sheet. |
T-25
| MSC 2017-HR2 | Extra Space Self Storage Portfolio |
| Mortgage Loan No. 1 – Extra Space Self Storage Portfolio |
| Mortgage Loan Information | Property Information | ||||||
| Mortgage Loan Seller: | MSMCH | Single Asset/Portfolio: | Portfolio | ||||
| Original Balance(1): | $92,000,000 | Location: | Various | ||||
| Cut-off Date Balance(1): | $92,000,000 | General Property Type: | Self Storage | ||||
| % of Initial Pool Balance: | 9.8% | Detailed Property Type: | Self Storage | ||||
| Loan Purpose: | Recapitalization | Title Vesting: | Fee | ||||
| Sponsors: | ExtraSpace Storage Inc.; TH Real Estate | Year Built/Renovated: | Various/N/A | ||||
| Mortgage Rate: | 4.1750% | Size: | 2,668,218 SF | ||||
| Note Date: | 11/30/2017 | Cut-off Date Balance PSF(1): | $73 | ||||
| First Payment Date: | 1/1/2018 | Maturity Date Balance PSF(1): | $73 | ||||
| Maturity Date: | 12/1/2027 | Property Manager: | Extra Space Management, Inc. (borrower-related) | ||||
| Original Term: | 120 months | ||||||
| Original Amortization Term: | 0 months | Underwriting and Financial Information | |||||
| IO Period: | 120 months | UW NOI: | $16,972,179 | ||||
| Seasoning: | 0 month | UW NOI Debt Yield(1): | 8.7% | ||||
| Prepayment Provisions(2): | LO (24); DEF (89); O (7) | UW NOI Debt Yield at Maturity(1): | 8.7% | ||||
| Lockbox/Cash Mgmt Status: | Springing/Springing | UW NCF DSCR(1): | 2.01x | ||||
| Additional Debt Type(1)(3): | Pari Passu | Most Recent NOI: | $17,053,307 (9/30/2017 TTM) | ||||
| Additional Debt Balance(1)(3): | 102,400,000 | 2nd Most Recent NOI: | $16,099,324 (12/31/2016) | ||||
| Future Debt Permitted (Type): | No (N/A) | 3rd Most Recent NOI: | $14,649,039 (12/31/2015) | ||||
| Reserves(4) | Most Recent Occupancy: | 95.1% (9/30/2017) | |||||
| Type | Initial | Monthly | Cap | 2nd Most Recent Occupancy: | 93.6% (12/31/2016) | ||
| RE Tax: | N/A | Springing | N/A | 3rd Most Recent Occupancy: | 93.0% (12/31/2015) | ||
| Insurance: | N/A | Springing | N/A | Appraised Value (as of)(5): | $299,250,000 (Various) | ||
| Deferred Maintenance: | N/A | N/A | N/A | Cut-off Date LTV Ratio(1)(5): | 65.0% | ||
| Recurring Replacements: | N/A | N/A | N/A | Maturity LTV Ratio(1)(5): | 65.0% | ||
| Sources and Uses | ||||||
| Sources | Proceeds | % of Total | Uses | Proceeds | % of Total | |
| Loan Amount: | $194,400,000 | 65.7% | Purchase Price: | $295,000,000 | 99.7% | |
| Equity: | $101,415,237 | 34.3% | Closing Costs: | $815,237 | 0.3% | |
| Total Sources: | $295,815,237 | 100.0% | Total Uses: | $295,815,237 | 100.0% | |
| (1) | The Extra Space Self Storage Portfolio Mortgage Loan (as defined below) is part of the Extra Space Self Storage Portfolio Whole Loan (as defined below), which is comprised of threepari passu promissory notes with an aggregate principal balance of $194,400,000. The Cut-off Date Balance PSF, Maturity Date Balance PSF, UW NOI Debt Yield, UW NOI Debt Yield at Maturity, UW NCF DSCR, Cut-off Date LTV Ratio and Maturity LTV Ratio numbers presented above are based on the aggregate principal balance of the promissory notes comprising the Extra Space Self Storage Portfolio Whole Loan. |
| (2) | Defeasance of the Extra Space Self Storage Portfolio Whole Loan is permitted at any time after the earlier of (i) the third anniversary of the first monthly payment date under the Extra Space Self Storage Portfolio Whole Loan, or (ii) two years from the closing date of the securitization that includes the lastpari passunote of the Extra Space Self Storage Portfolio Whole Loan to be securitized. The assumed lockout period of 24 payments is based on the closing date of this transaction in December 2017. |
| (3) | See “The Mortgage Loan” and “Additional Secured Indebtedness (not including trade debts)”, for further discussion of additional debt. |
| (4) | See “Escrows and Reserves” below for further discussion of reserve requirements. |
| (5) | The Appraised Value represents the aggregate “as is” values for each of the individual properties ($282,650,000) plus a portfolio premium of $16,600,000. The Cut-off Date LTV Ratio and the Maturity LTV Ratio based on the aggregate of the “as is” values for each individual property without the portfolio premium are 68.8% and 68.8%, respectively. |
The Mortgage Loan. The largest mortgage loan (the “Extra Space Self Storage Portfolio Mortgage Loan”) is part of a whole loan (the “Extra Space Self Storage Portfolio Whole Loan”) evidenced by threepari passu promissory notes in the aggregate original principal amount of $194,400,000, all of which are secured by the fee interests in a portfolio of 36 self storage properties located across fifteen states and totaling 2,668,218 SF (the “Extra Space Self Storage Portfolio Properties”). Promissory Note A-1, with an original principal balance of $92,000,000 represents the Extra Space Self Storage Portfolio Mortgage Loan, and will be included in the MSC 2017-HR2 trust. Promissory Note A-2, with an original principal balance of $60,000,000, and promissory Note A-3, with an original principal balance of $42,400,000, are expected to be held by Morgan Stanley Bank, N.A. or an affiliate thereof, on the closing date of this transaction, and are expected to be contributed to one or more future securitization transactions or may be otherwise transferred at any time. Promissory Notes A-2 and A-3 represent thepari passucompanion loans (the “Extra Space Self Storage Portfolio ServicedPari PassuCompanion Loans”). The Extra Space Self Storage Portfolio Whole Loan will be serviced pursuant to the pooling and servicing agreement for the MSC 2017-HR2 securitization trust. See “Description of the Mortgage Pool—The Whole Loans—The Serviced Pari Passu Whole Loans” and “Pooling and Servicing Agreement” in the Preliminary Prospectus.
Proceeds from the Extra Space Self Storage Portfolio Whole Loan, were used to finance the acquisition of a 90% interest in the Extra Space Self Storage Portfolio Properties by TIAA Real Estate (as defined below) and pay closing costs.
The Borrower and the Sponsor. The borrower is Storage Portfolio II Subsidiary LLC (the “Extra Space Self Storage Portfolio Borrower”), a Delaware limited liability company structured to be bankruptcy-remote with at least two independent directors. The Extra Space Self Storage Portfolio Borrower is
This is not a research report and was not prepared by any Underwriter’s research department. Please see additional important information and qualifications at the end of this Term Sheet. |
T-26
| MSC 2017-HR2 | Extra Space Self Storage Portfolio |
90% indirectly owned by Teachers Insurance and Annuity Association of America (“TIAA”) for the benefit of the Separate Real Estate Account (“TIAA Real Estate”) and 10% indirectly owned by ExtraSpace Storage, Inc. (“Extra Space Storage”). A subsidiary of Extra Space Storage is the managing member of the joint venture between TIAA Real Estate and Extra Space Storage which owns the Extra Space Self Storage Portfolio Borrower. The borrower sponsors are Extra Space Storage and TH Real Estate. Extra Space Storage will serve as the non-recourse carveout guarantor of the Extra Space Self Storage Portfolio Whole Loan. If a buy/sell is triggered such that TIAA Real Estate becomes the sole indirect owner of the borrower, Teachers REA, LLC has been approved as replacement guarantor provided that it meets certain net worth and liquidity requirements set forth in the loan documents and there has been no material adverse change in its financial condition or status.TH Real Estate is an affiliate of Nuveen, LLC, an investment management arm of TIAA. TH Real Estate is a real estate investment services firm with over 530 real estate professionals located in more than 20 cities throughout the Unites States, Europe and Asia-Pacific. As of June 30, 2017, TH Real Estate had over $103 billion of assets under management globally. Extra Space Storage is headquartered in Salt Lake City, Utah and owned or operated over 1,400 self-storage locations across 38 states, Washington, D.C. and Puerto Rico as of June 30, 2017.
The Properties. The Extra Space Self Storage Portfolio Properties are comprised of 36 Extra Space branded self-storage properties containing a total of 20,890 units, comprised of approximately 77% non-climate controlled units, 17% climate controlled units and 6% recreational vehicle (“RV”) storage units. Average unit size, excluding RV storage, office, and warehouse SF, is 112 SF. The Extra Space Self Storage Portfolio Properties range in size from approximately 27,400 SF to 292,316 SF, inclusive of parking SF. The total portfolio SF is comprised of approximately 86% storage SF and 14% parking SF. While the percentage of parking SF accounts for less than 15% of total SF for 32 of the properties in the Extra Space Self Storage Portfolio, four properties including Henderson - Stephanie Place, Lake Elsinore – Central Avenue, Memphis – Covington Way and Killeen – Jasper Drive, have parking SF that accounts for greater than 15% of the individual property SF, the largest of which, Henderson – Stephanie Place, accounts for 61% of the individual property’s total SF.
The Extra Space Self Storage Portfolio Properties are located across fifteen states, with the largest presence in California (six properties, 17.8% of SF), New Jersey (six properties, 14.5% of SF), Nevada (two properties, 13.1% of SF) and Tennessee (six properties, 12.3% of SF) with the remaining 16 properties (42.3% of SF) located across 11 different states. The largest property accounts for only 6.6% of underwritten net cash flow and only two properties account for more than 5.0% of underwritten net cash flow. The five largest properties by underwritten net cash flow account for 25.0% of the portfolio’s underwritten net cash flow while the ten largest properties account for 44.5% of the portfolio’s underwritten net cash flow. The Extra Space Self Storage Portfolio Properties were built between 1940 and 2013 with a weighted average year built of 1988 and were acquired by Extra Space Storage or its affiliates between 1940 and 2013. According to the Extra Space Self Storage Portfolio Borrower, approximately $8.5 million in capital expenditures has been spent across the portfolio between 2010 and 2016. The weighted average occupancy for the Extra Space Self Storage Portfolio Properties was 95.1% by SF and 94.7% by unit, as of September 30, 2017.
This is not a research report and was not prepared by any Underwriter’s research departments. Please see additional important information and qualifications at the end of this Term Sheet. |
T-27
| MSC 2017-HR2 | Extra Space Self Storage Portfolio |
The following table presents detailed property-level information of the Extra Space Self Storage Portfolio Properties.
| Extra Space Self Storage Portfolio Properties Summary(1) | ||||||||
| Property Name | City / State | Year Built | SF(2) | Units | Allocated Loan Amount (“ALA”)(3) | % of ALA | Appraised Value | % of Appraised Value |
| Henderson - Stephanie Place | Henderson, NV | 1996 | 292,316 | 1136 | $13,010,000 | 6.7% | $18,700,000 | 6.6% |
| Brookfield - Federal Road | Brookfield, CT | 1988, 2001 | 80,250 | 699 | $9,710,000 | 5.0% | $13,800,000 | 4.9% |
| Kingston - Sawkill Road | Kingston, NY | 1986, 2001 | 85,675 | 753 | $9,330,000 | 4.8% | $12,400,000 | 4.4% |
| Lake Elsinore - Central Avenue | Lake Elsinore, CA | 2000, 2013 | 105,785 | 654 | $8,310,000 | 4.3% | $12,300,000 | 4.4% |
| Doylestown - North Broad Street | Doylestown, PA | 1988 | 71,355 | 557 | $8,130,000 | 4.2% | $11,400,000 | 4.0% |
| Pennsauken - South Crescent Boulevard | Pennsauken, NJ | 1990 | 82,810 | 738 | $7,910,000 | 4.1% | $12,300,000 | 4.4% |
| New Paltz - South Putt Corners Road | New Paltz, NY | 1989, 2001 | 76,226 | 736 | $7,720,000 | 4.0% | $10,900,000 | 3.9% |
| Tyngsborough - Industrial Way | Tyngsborough, MA | 1990 | 79,200 | 575 | $7,640,000 | 3.9% | $10,300,000 | 3.6% |
| Hemet - South Sanderson | Hemet, CA | 1985, 2002 | 90,193 | 732 | $7,280,000 | 3.7% | $11,000,000 | 3.9% |
| Bensalem - 1525 Bristol Pike | Bensalem, PA | 2000 | 71,070 | 637 | $7,160,000 | 3.7% | $10,800,000 | 3.8% |
| Eastpoint - Lakewood Avenue | Atlanta, GA | 1962, 1989, 2005 | 90,200 | 806 | $6,830,000 | 3.5% | $11,150,000 | 3.9% |
| Howell - Route 9 South | Howell, NJ | 1987 | 69,765 | 702 | $6,650,000 | 3.4% | $10,000,000 | 3.5% |
| Lawrenceville - Hurricane Shoals Road | Lawrenceville, GA | 1995 | 103,830 | 751 | $6,600,000 | 3.4% | $9,150,000 | 3.2% |
| Lawnside - White Horse Pike | Lawnside, NJ | 1977 | 64,565 | 665 | $6,400,000 | 3.3% | $10,300,000 | 3.6% |
| Phoenix - West Peoria | Phoenix, AZ | 1980, 1998 | 63,214 | 631 | $5,750,000 | 3.0% | $9,300,000 | 3.3% |
| Mount Laurel - Ark Road | Mount Laurel, NJ | 1987 | 46,145 | 409 | $5,200,000 | 2.7% | $7,700,000 | 2.7% |
| Burlington - Cadillac Road | Burlington, NJ | 1940 | 62,160 | 672 | $5,160,000 | 2.7% | $7,700,000 | 2.7% |
| Cherry Hill - Marlton Pike | Cherry Hill, NJ | 1990 | 61,140 | 492 | $5,150,000 | 2.6% | $7,500,000 | 2.7% |
| Bensalem - Knights Road | Bensalem, PA | 2004 | 48,546 | 442 | $4,980,000 | 2.6% | $7,600,000 | 2.7% |
| Albuquerque - Ellison Road Northwest | Albuquerque, NM | 1995 | 54,860 | 514 | $4,890,000 | 2.5% | $6,900,000 | 2.4% |
| Modesto - Crows Landing | Modesto, CA | 2002 | 76,350 | 570 | $4,650,000 | 2.4% | $6,000,000 | 2.1% |
| Auburndale - US Highway 92 West | Auburndale, FL | 2000 | 63,675 | 525 | $4,600,000 | 2.4% | $5,700,000 | 2.0% |
| San Bernardino - West Club Center Drive | San Bernardino, CA | 1989 | 63,578 | 513 | $4,360,000 | 2.2% | $6,300,000 | 2.2% |
| Memphis - Mount Moriah Terrace | Memphis, TN | 1982, 1997 | 84,610 | 676 | $4,200,000 | 2.2% | $5,650,000 | 2.0% |
| Hesperia - Mariposa Road | Hesperia, CA | 1999 | 77,600 | 536 | $3,870,000 | 2.0% | $5,600,000 | 2.0% |
| Memphis - Covington Way | Memphis, TN | 1984, 1997 | 78,040 | 523 | $3,820,000 | 2.0% | $5,300,000 | 1.9% |
| St Louis - Halls Ferry Road | St. Louis, MO | 1998 | 58,200 | 465 | $3,510,000 | 1.8% | $5,100,000 | 1.8% |
| Killeen - Jasper Drive | Killeen, TX | 1974, 1979, 2004 | 94,970 | 717 | $3,470,000 | 1.8% | $6,000,000 | 2.1% |
| Albuquerque - Airport Drive Northwest | Albuquerque, NM | 1987 | 53,240 | 400 | $2,970,000 | 1.5% | $4,500,000 | 1.6% |
| Memphis - Gateway Drive | Memphis, TN | 1987 | 50,300 | 387 | $2,820,000 | 1.5% | $3,650,000 | 1.3% |
| Victorville - Yates Road | Victorville, CA | 1977 | 62,125 | 519 | $2,790,000 | 1.4% | $3,800,000 | 1.3% |
| Las Vegas - North Lamont Street | Las Vegas, NV | 1988 | 56,985 | 463 | $2,190,000 | 1.1% | $3,800,000 | 1.3% |
| Columbus - East Main Street | Columbus, OH | 1988 | 33,500 | 295 | $2,130,000 | 1.1% | $2,750,000 | 1.0% |
| Memphis - Raleigh-LaGrange | Memphis, TN | 1984 | 40,395 | 349 | $1,930,000 | 1.0% | $2,700,000 | 1.0% |
| Memphis - 5675 Summer Avenue | Memphis, TN | 1985 | 47,945 | 365 | $1,760,000 | 0.9% | $2,350,000 | 0.8% |
| Memphis - Madison Avenue | Memphis, TN | 1982 | 27,400 | 286 | $1,520,000 | 0.8% | $2,250,000 | 0.8% |
| Total Portfolio | 2,668,218 | 20,890 | $194,400,000 | 100.0% | $282,650,000(4) | 100.0% | ||
| (1) | Based on information provided by the Extra Space Self Storage Portfolio Borrower. |
| (2) | Includes 3,850 SF associated with commercial space across all of the Extra Space Self Storage Portfolio Properties. |
| (3) | The allocated loan amounts are based on the 9/30/2017 TTM net operating income of the individual Extra Space Self Storage Portfolio Properties. |
| (4) | The individual “as is” appraised values are shown. The appraiser also provided a bulk portfolio value for the Extra Space Self Storage Portfolio Properties of $299,250,000, which includes a portfolio premium of $16,600,000. |
This is not a research report and was not prepared by any Underwriter’s research department. Please see additional important information and qualifications at the end of this Term Sheet. |
T-28
| MSC 2017-HR2 | Extra Space Self Storage Portfolio |
The following table presents detailed information with respect to the unit mix and net operating income of the Extra Space Self Storage Portfolio Properties.
| Extra Space Self Storage Portfolio Unit Mix and NOI Summary(1) | |||||||||
| Property Name | City / State | Date Acquired | Non- Climate Controlled | Climate Controlled | RV Units | Unit SF % | Parking SF % | 9/30/2017 TTM NOI | % of Total 9/30/2017 TTM NOI |
| Henderson - Stephanie Place | Henderson, NV | 7/1/2004 | 666 | 0 | 470 | 39.0% | 61.0% | $1,141,429 | 6.7% |
| Brookfield - Federal Road | Brookfield, CT | 7/14/2005 | 491 | 198 | 10 | 98.8% | 1.2% | $851,941 | 5.0% |
| Kingston - Sawkill Road | Kingston, NY | 7/14/2005 | 567 | 160 | 26 | 92.1% | 7.9% | $818,310 | 4.8% |
| Lake Elsinore - Central Avenue | Lake Elsinore, CA | 10/19/2011 | 477 | 21 | 156 | 59.0% | 41.0% | $728,946 | 4.3% |
| Doylestown - North Broad Street | Doylestown, PA | 1/1/2001 | 517 | 0 | 40 | 88.7% | 11.3% | $713,051 | 4.2% |
| Pennsauken - South Crescent Boulevard | Pennsauken, NJ | 12/1/2003 | 721 | 0 | 17 | 96.3% | 3.7% | $693,688 | 4.1% |
| New Paltz - South Putt Corners Road | New Paltz, NY | 7/14/2005 | 594 | 108 | 34 | 90.2% | 9.8% | $677,043 | 4.0% |
| Tyngsborough - Industrial Way | Tyngsborough, MA | 7/14/2005 | 575 | 0 | 0 | 100.0% | 0.0% | $670,119 | 3.9% |
| Hemet - South Sanderson | Hemet, CA | 7/14/2005 | 498 | 191 | 43 | 86.4% | 13.6% | $638,388 | 3.7% |
| Bensalem - 1525 Bristol Pike | Bensalem, PA | 1/1/2005 | 437 | 185 | 14 | 96.6% | 3.4% | $628,304 | 3.7% |
| Eastpoint - Lakewood Avenue | Atlanta, GA | 7/1/2004 | 693 | 83 | 30 | 93.0% | 7.0% | $598,939 | 3.5% |
| Howell - Route 9 South | Howell, NJ | 1/1/2002 | 691 | 0 | 10 | 97.1% | 2.9% | $583,122 | 3.4% |
| Lawrenceville - Hurricane Shoals Road | Lawrenceville, GA | 11/4/2013 | 438 | 257 | 56 | 87.1% | 12.9% | $579,026 | 3.4% |
| Lawnside - White Horse Pike | Lawnside, NJ | 7/1/2004 | 507 | 151 | 7 | 97.5% | 2.5% | $561,739 | 3.3% |
| Phoenix - West Peoria | Phoenix, AZ | 7/14/2005 | 408 | 223 | 0 | 100.0% | 0.0% | $504,693 | 3.0% |
| Mount Laurel - Ark Road | Mount Laurel, NJ | 7/14/2005 | 287 | 121 | 1 | 99.6% | 0.4% | $455,932 | 2.7% |
| Burlington - Cadillac Road | Burlington, NJ | 7/18/2012 | 191 | 476 | 5 | 97.9% | 2.1% | $452,735 | 2.7% |
| Cherry Hill - Marlton Pike | Cherry Hill, NJ | 7/1/2004 | 322 | 168 | 2 | 99.5% | 0.5% | $451,476 | 2.6% |
| Bensalem - Knights Road | Bensalem, PA | 4/1/2006 | 213 | 219 | 10 | 96.5% | 3.5% | $437,175 | 2.6% |
| Albuquerque - Ellison Road Northwest | Albuquerque, NM | 7/14/2005 | 514 | 0 | 0 | 100.0% | 0.0% | $429,337 | 2.5% |
| Modesto - Crows Landing | Modesto, CA | 6/1/2007 | 550 | 0 | 20 | 91.6% | 8.4% | $407,564 | 2.4% |
| Auburndale - US Highway 92 West | Auburndale, FL | 5/2/2012 | 313 | 212 | 0 | 100.0% | 0.0% | $403,848 | 2.4% |
| San Bernardino - West Club Center Drive | San Bernardino, CA | 11/1/2000 | 501 | 0 | 12 | 95.9% | 4.1% | $382,308 | 2.2% |
| Memphis - Mount Moriah Terrace | Memphis, TN | 7/14/2005 | 500 | 130 | 46 | 87.9% | 12.1% | $368,422 | 2.2% |
| Hesperia - Mariposa Road | Hesperia, CA | 10/19/2011 | 536 | 0 | 0 | 100.0% | 0.0% | $339,722 | 2.0% |
| Memphis - Covington Way | Memphis, TN | 7/14/2005 | 244 | 240 | 39 | 83.3% | 16.7% | $335,021 | 2.0% |
| St Louis - Halls Ferry Road | St. Louis, MO | 5/1/2001 | 465 | 0 | 0 | 100.0% | 0.0% | $308,298 | 1.8% |
| Killeen - Jasper Drive | Killeen, TX | 11/4/2013 | 291 | 312 | 114 | 72.3% | 27.7% | $304,105 | 1.8% |
| Albuquerque - Airport Drive Northwest | Albuquerque, NM | 7/1/2004 | 391 | 0 | 9 | 97.3% | 2.7% | $260,948 | 1.5% |
| Memphis - Gateway Drive | Memphis, TN | 7/14/2005 | 387 | 0 | 0 | 100.0% | 0.0% | $246,946 | 1.4% |
| Victorville - Yates Road | Victorville, CA | 10/19/2011 | 498 | 0 | 21 | 91.3% | 8.7% | $244,392 | 1.4% |
| Las Vegas - North Lamont Street | Las Vegas, NV | 4/1/2001 | 411 | 30 | 22 | 92.4% | 7.6% | $192,375 | 1.1% |
| Columbus - East Main Street | Columbus, OH | 7/14/2005 | 295 | 0 | 0 | 100.0% | 0.0% | $186,696 | 1.1% |
| Memphis - Raleigh-LaGrange | Memphis, TN | 7/14/2005 | 321 | 12 | 16 | 91.2% | 8.8% | $169,541 | 1.0% |
| Memphis - 5675 Summer Avenue | Memphis, TN | 7/14/2005 | 347 | 11 | 5 | 97.4% | 2.6% | $154,416 | 0.9% |
| Memphis - Madison Avenue | Memphis, TN | 7/14/2005 | 286 | 0 | 0 | 100.0% | 0.0% | $133,313 | 0.8% |
| Total/Wtd. Avg. | 16,143 | 3,508 | 1,235 | 86.3% | 13.7% | $17,053,307 | 100.0% | ||
| (1) | Based on information provided by the Extra Space Self Storage Portfolio Borrower. |
This is not a research report and was not prepared by any Underwriter’s research department. Please see additional important information and qualifications at the end of this Term Sheet. |
T-29
| MSC 2017-HR2 | Extra Space Self Storage Portfolio |
The Markets. The Extra Space Self Storage Portfolio Properties are geographically diverse, located in 15 different markets across 15 states. The greatest concentration of Extra Space Self Storage Portfolio Properties is located in California (six properties, 17.8% of SF), New Jersey (six properties, 14.5% of SF), Nevada (two properties, 13.1% of SF) and Tennessee (six properties, 12.3% of SF), with the remaining sixteen properties (42.3% of SF) located across 11 different states.
The following table presents state-level information with respect to the Extra Space Self Storage Portfolio Properties.
| Extra Space Self Storage Portfolio Properties Summary(1) | |||||||||
| State | Count | Total SF(2) | Total Units | Climate Controlled Units | Wtd Avg Occ. (SF)(3) | Wtd. Avg. Ann. Rent PSF(3) | ALA | In Place Ann. Rent(3) | % of Ann. Rent(3) |
| California | 6 | 475,631 | 3,524 | 212 | 95.5% | $8.92 | $31,260,000 | $4,243,653 | 15.4% |
| New Jersey | 6 | 386,585 | 3,678 | 916 | 95.8% | $13.83 | $36,470,000 | $5,347,017 | 19.4% |
| Nevada | 2 | 349,301 | 1,599 | 30 | 96.7% | $5.36 | $15,200,000 | $1,873,907 | 6.8% |
| Tennessee | 6 | 328,690 | 2,586 | 393 | 93.2% | $8.32 | $16,050,000 | $2,735,589 | 9.9% |
| Georgia | 2 | 194,030 | 1,557 | 340 | 95.5% | $10.25 | $13,430,000 | $1,987,912 | 7.2% |
| Pennsylvania | 3 | 190,971 | 1,636 | 404 | 95.1% | $14.46 | $20,270,000 | $2,760,958 | 10.0% |
| New York | 2 | 161,901 | 1,489 | 268 | 93.9% | $15.07 | $17,050,000 | $2,440,363 | 8.8% |
| New Mexico | 2 | 108,100 | 914 | - | 96.3% | $10.04 | $7,860,000 | $1,085,628 | 3.9% |
| Texas | 1 | 94,970 | 717 | 312 | 90.8% | $6.68 | $3,470,000 | $634,029 | 2.3% |
| Connecticut | 1 | 80,250 | 699 | 198 | 97.7% | $15.23 | $9,710,000 | $1,222,484 | 4.4% |
| Massachusetts | 1 | 79,200 | 575 | - | 94.1% | $12.14 | $7,640,000 | $961,654 | 3.5% |
| Florida | 1 | 63,675 | 525 | 212 | 95.8% | $9.46 | $4,600,000 | $602,600 | 2.2% |
| Arizona | 1 | 63,214 | 631 | 223 | 94.6% | $12.16 | $5,750,000 | $768,856 | 2.8% |
| Missouri | 1 | 58,200 | 465 | - | 91.3% | $10.32 | $3,510,000 | $600,697 | 2.2% |
| Ohio | 1 | 33,500 | 295 | - | 94.9% | $10.82 | $2,130,000 | $362,477 | 1.3% |
| Total / Wtd. Avg. | 36 | 2,668,218 | 20,890 | 3,508 | 95.1% | $10.35 | 194,400,000 | $27,627,825 | 100.0% |
| (1) | Based on information provided by the Extra Space Self Storage Portfolio Borrower. |
| (2) | Includes 3,850 SF associated with commercial space across all of the Extra Space Self Storage Portfolio Properties. |
| (3) | Occupancy and Ann. Rent are as of the September 30, 2017 trailing twelve month period. |
The following table presents demographic information with respect to the Extra Space Self Storage Portfolio Properties.
| Extra Space Self Storage Portfolio Demographic Summary(1) | |||||||||
| Market | Market | Count | Market 10x10 Non-Climate Controlled Rent | Market 10x10 Climate Controlled Rent | Market Vacancy | Population 2016 (Million) | Rentable SF per Capita | Median HH Income | Avg HH Size |
| Philadelphia | Northeast | 8 | $121.7 | $141.3 | 8.5% | 6.1 | 3.6 | $63,168 | 2.6 |
| Greater New York | Northeast | 3 | $267.3 | $303.8 | 12.6% | 20.1 | 2.7 | 69,651 | 2.7 |
| San Bernardino-Riverside | West | 5 | $104.7 | $145.4 | 8.7% | 4.5 | 5.1 | 56,571 | 3.2 |
| Memphis | Southeast | 6 | $80.4 | $125.6 | 11.6% | 1.4 | 7.0 | 48,624 | 2.6 |
| Atlanta | Southeast | 2 | $96.2 | $126.4 | 10.0% | 5.7 | 6.4 | 58,098 | 2.7 |
| Las Vegas | Southwest | 2 | $94.1 | $103.8 | 9.6% | 2.1 | 6.2 | 52,771 | 2.7 |
| Boston | Northeast | 1 | $181.0 | $152.0 | 10.7% | 4.8 | 3.9 | 76,745 | 2.5 |
| Albuquerque | Southwest | 2 | N/A | N/A | N/A | 0.9 | n/a | 49,967 | 2.5 |
| Central New Jersey | Northeast | 1 | $136.5 | $157.7 | 7.5% | 0.4 | n/a | 74,942 | 2.6 |
| Phoenix | Southwest | 1 | $108.5 | $130.3 | 11.7% | 4.6 | 4.8 | 54,976 | 2.7 |
| Central Valley | West | 1 | $119.3 | $142.6 | 6.9% | 2.3 | 7.0 | 60,907 | 2.7 |
| Tampa-St Petersburg | Southeast | 1 | $114.8 | $148.9 | 8.3% | 3.0 | 6.2 | 48,529 | 2.4 |
| Austin | Southeast | 1 | $104.9 | $149.3 | 10.8% | 2.0 | 7.6 | 65,493 | 2.6 |
| St Louis | Midwest | 1 | $93.0 | $134.5 | 10.3% | 2.8 | 5.9 | 56,375 | 2.5 |
| Columbus | Midwest | 1 | $120.6 | $90.9 | 10.0% | 2.0 | 5.8 | 56,725 | 2.5 |
| Total / Wtd. Avg. | 36 | $133.7 | $159.7 | 9.8% | 62.7 | 4.9 | $62,727 | 2.7 | |
| (1) | Based on 2016 demographic and market information as provided by third party research reports and the Extra Space Self Storage Portfolio Borrower. |
This is not a research report and was not prepared by any Underwriter’s research department. Please see additional important information and qualifications at the end of this Term Sheet. |
T-30
| MSC 2017-HR2 | Extra Space Self Storage Portfolio |
Operating History and Underwritten Net Cash Flow.The following table presents certain information relating to the historical operating performance and Underwritten Net Cash Flow at the Extra Space Self Storage Portfolio Properties:
| Cash Flow Analysis | |||||||||||||
| 2014 | 2015 | 2016 | 9/30/2017 TTM | U/W | U/W PSF | ||||||||
| Base Rent(1) | $22,697,753 | $24,564,446 | $26,226,349 | $27,627,825 | $27,627,825 | $10.35 | |||||||
| Other Income(2) | $1,540,947 | $1,640,794 | $1,714,680 | $1,720,469 | $1,720,469 | $0.64 | |||||||
| Concessions and Credit Loss | ($1,599,426) | ($1,404,249) | ($1,549,909) | ($1,703,137) | ($1,703,137) | ($0.64) | |||||||
| Effective Gross Income | $22,639,275 | $24,800,992 | $26,391,121 | $27,645,157 | $27,645,157 | $10.36 | |||||||
| Total Operating Expenses | $9,853,788 | $10,151,952 | $10,291,797 | $10,591,850 | $10,672,978 | $4.00 | |||||||
| Net Operating Income | $12,785,487 | $14,649,039 | $16,099,324 | $17,053,307 | $16,972,179 | $6.36 | |||||||
| Capital Expenditures | $0 | $0 | $0 | $0 | $412,651 | $0.15 | |||||||
| Net Cash Flow | $12,785,487 | $14,649,039 | $16,099,324 | $17,053,307 | $16,559,528 | $6.21 | |||||||
| Occupancy % | 88.7% | 93.0% | 93.6% | 95.1% | 95.1% | ||||||||
| NOI DSCR(3) | 1.56x | 1.78x | 1.96x | 2.07x | 2.06x | ||||||||
| NCF DSCR(3) | 1.56x | 1.78x | 1.96x | 2.07x | 2.01x | ||||||||
| NOI Debt Yield(3) | 6.6% | 7.5% | 8.3% | 8.8% | 8.7% | ||||||||
| NCF Debt Yield(3) | 6.6% | 7.5% | 8.3% | 8.8% | 8.5% | ||||||||
| (1) | Base Rent is net of vacancy and includes parking income, billboard income and commercial income. Parking income accounts for 4.0% of UW Base Rent. Billboard income and commercial income each account for less than 0.2% of UW Base Rent. |
| (2) | Other Income is comprised of administration fees, late fees, miscellaneous fees and merchandise sales. |
| (3) | Debt service coverage ratios and debt yields are based on the Extra Space Self Storage Portfolio Whole Loan. |
Escrows and Reserves. The Extra Space Self Storage Portfolio Borrower is required to escrow monthly 1/12th of the annual estimated real estate tax payments. Notwithstanding the foregoing, so long as Extra Space Storage Inc. is the non-recourse carve-out guarantor, the Extra Space Self Storage Portfolio Borrower will not be required to make deposits to the real estate tax escrow, provided that (i) no Cash Sweep Event Period (as defined below) is continuing and (ii) the Extra Space Self Storage Portfolio Borrower provides the lender paid receipts for taxes upon written request by no later than three business days prior to the date such taxes would be delinquent. The Extra Space Self Storage Portfolio Borrower is required to escrow monthly 1/12th of the annual estimated insurance premiums. Notwithstanding the foregoing, so long as Extra Space Storage Inc. is the non-recourse carve-out guarantor, the Extra Space Self Storage Portfolio Borrower will not be required to make deposits to the insurance reserve provided (i) no event of default is continuing and (ii) the Extra Space Self Storage Portfolio Borrower maintains an acceptable blanket insurance policy.
Lockbox and Cash Management. The Extra Space Self Storage Portfolio Whole Loan provides for a springing soft lockbox and springing cash management, in each case upon the occurrence of a Cash Sweep Event Period. Upon the first occurrence of a Cash Sweep Event Period, the Extra Space Self Storage Portfolio Borrower is required to establish (i) a lockbox account, into which, during a Cash Sweep Event Period, all rents (less costs anticipated for debits for credit and chargebacks, fees, and refunded items) are required to be deposited by the Extra Space Self Storage Portfolio Borrower and/or the property manager within five business days after receipt and (ii) a lender-controlled cash management account. During the continuance of a Cash Sweep Event Period, all funds in the lockbox account are required to be swept each day to the cash management account. Provided no event of default is continuing, funds in the cash management account are required to be applied on each monthly payment date to disburse to the Extra Space Self Storage Portfolio Borrower amounts for the payment of De Minimis Revenue (as defined below), to pay debt service on the Extra Space Self Storage Portfolio Whole Loan, to fund required reserve deposits as described above under “Escrows and Reserves,” to pay operating expenses set forth in the approved annual budget, and extraordinary expenses approved by the lender, and thereafter, to the extent (i) a Cash Sweep Event Period is continuing, to deposit any remaining cash flow into an account to be held as additional security for the Extra Space Self Storage Portfolio Whole Loan during the continuance of the Cash Sweep Event Period and (ii) no Cash Sweep Event Period exists, to disburse any remaining cash flow to the Extra Space Self Storage Portfolio Borrower. If a Cash Sweep Event Period no longer exists, the Extra Space Self Storage Portfolio Borrower and property manager will no longer be obligated to deposit rents into the lockbox account.
“De Minimis Revenue” means sums for the payment of tenant insurance premiums, sales tax, and packing supply cash receipts. De Minimis Revenue is required to be disbursed to the Extra Space Self Storage Portfolio Borrower within five business days after delivery to the lender of a budget for such expenses.
A “Cash Sweep Event Period” will commence upon the earlier of (i) an event of default or (ii) the debt service coverage ratio being less than 1.10x for 12 consecutive months and continue until; (a) in the case of clause (i), the cure of such event of default and (b) in the case of clause (ii), the debt service coverage ratio is equal to or greater than 1.25x for the immediately preceding six consecutive calendar months.
Additional Secured Indebtedness (not including trade debts). The Extra Space Self Storage Portfolio Properties also secure the Extra Space Self Storage Portfolio ServicedPari Passu Companion Loans, with an aggregate Cut-off Date principal balance of $102,400,000. The promissory notes evidencing the Extra Space Self Storage Portfolio ServicedPari Passu Companion Loans accrue interest at the same rate as the Extra Space Self Storage Portfolio Mortgage Loan. The Extra Space Self Storage Portfolio Mortgage Loan is entitled to payments of principal and interest on a pro rata andpari passu basis with the Extra Space Self Storage Portfolio ServicedPari Passu Companion Loans. The holders of the Extra Space Self Storage Portfolio Mortgage Loan and the Extra Space Self Storage Portfolio ServicedPari Passu Companion Loans have entered into a co-lender agreement that sets forth the allocation of collections on the Extra Space Self Storage Portfolio Whole Loan. See “Description of the Mortgage Pool—The Whole Loans—The Serviced Pari Passu Whole Loans” in the Preliminary Prospectus.
Mezzanine Loan and Preferred Equity.Not permitted.
This is not a research report and was not prepared by any Underwriter’s research department. Please see additional important information and qualifications at the end of this Term Sheet. |
T-31
| MSC 2017-HR2 | Extra Space Self Storage Portfolio |
Release of Property.After the Release Date (as defined below) and prior to June 1, 2027, provided no event of default has occurred and is continuing, the Extra Space Self Storage Portfolio Borrower may obtain a release of any of the individual properties comprising the Extra Space Self Storage Portfolio Properties upon defeasance of an amount equal to 125% of the allocated loan amount of such individual property; provided that the following conditions, among others, are satisfied: (i) after giving effect to the release, the debt yield with respect to the remaining properties is greater than the debt yield of all of the properties immediately prior to the related release; and (ii) the partial defeasance is permitted under REMIC requirements (and the lender receives an opinion of counsel that the partial defeasance will not cause a REMIC trust formed pursuant to a securitization of any portion of the Extra Space Self Storage Portfolio Whole Loan to fail to maintain its status as a REMIC).
“Release Date” means the earlier to occur of (i) the third anniversary of the first monthly payment date under the Extra Space Self Storage Portfolio Whole Loan and (ii) the date that is two years from the “startup day” of the REMIC trust established in connection with the last securitization involving any portion of the Extra Space Self Storage Portfolio Whole Loan.
Terrorism Insurance.The Extra Space Self Storage Portfolio Borrower is required to obtain insurance against acts of terrorism or other similar acts or events in form and substance reasonably satisfactory to the lender, including all risk insurance in an amount equal to 100% of full replacement cost and eighteen months of business interruption insurance. Notwithstanding the foregoing, for so long as the Terrorism Risk Insurance Act of 2002, as extended and modified by the Terrorism Risk Insurance Program Reauthorization Act of 2015 is in effect (or any extension thereof or other federal government program with substantially similar protection), the Extra Space Self Storage Portfolio Borrower is required to maintain, and the lender is required to accept, terrorism insurance which covers “covered acts” (as defined by such statute or other program), as full compliance as it relates to the risks required to be covered pursuant to the preceding sentence, so long as such statute or other program covers both domestic and foreign acts of terrorism. See “Risk Factors—Risks Relating to the Mortgage Loans—Terrorism Insurance May Not Be Available for All Mortgaged Properties” in the Preliminary Prospectus.
This is not a research report and was not prepared by any Underwriter’s research department. Please see additional important information and qualifications at the end of this Term Sheet. |
T-32
(THIS PAGE INTENTIONALLY LEFT BLANK)
This is not a research report and was not prepared by any Underwriter’s research department. Please see additional important information and qualifications at the end of this Term Sheet. |
T-33
| MSC 2017-HR2 | The Woods |
Mortgage Loan No. 2 – The Woods
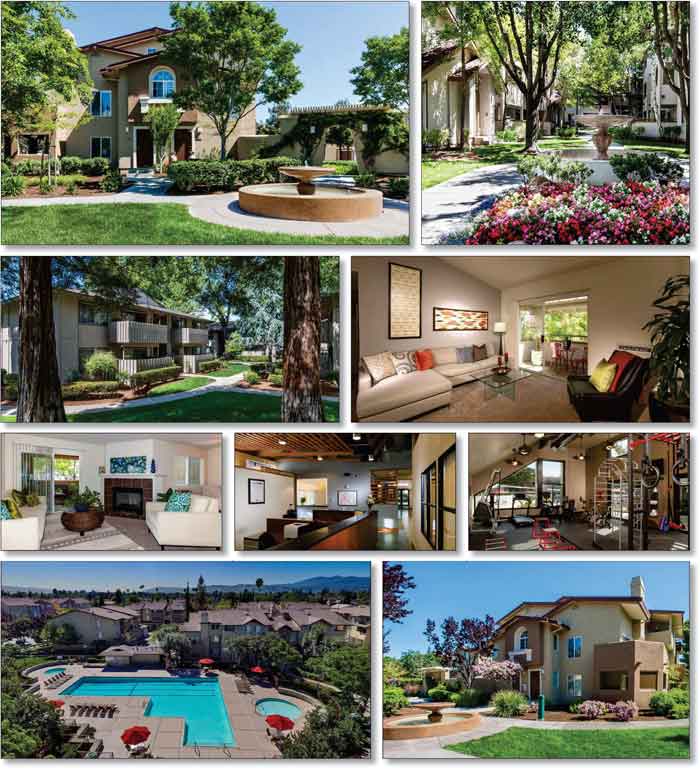
This is not a research report and was not prepared by any Underwriter’s research department. Please see additional important information and qualifications at the end of this Term Sheet. |
T-34
| MSC 2017-HR2 | The Woods |
Mortgage Loan No. 2 – The Woods
This is not a research report and was not prepared by any Underwriter’s research department. Please see additional important information and qualifications at the end of this Term Sheet. |
T-35
| MSC 2017-HR2 | The Woods |
Mortgage Loan No. 2 – The Woods
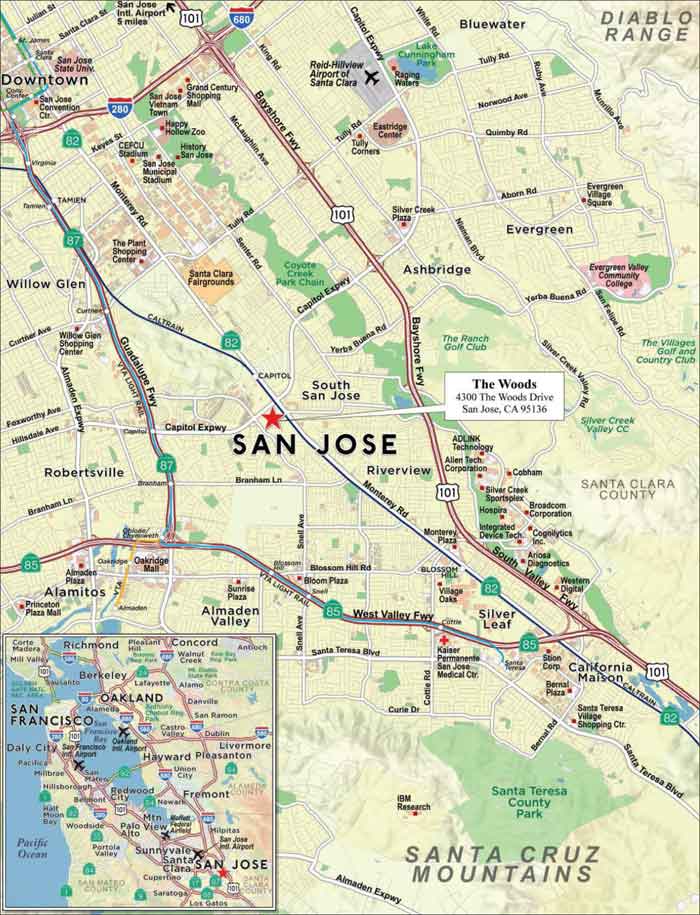
This is not a research report and was not prepared by any Underwriter’s research department. Please see additional important information and qualifications at the end of this Term Sheet. |
T-36
| MSC 2017-HR2 | The Woods |
| Mortgage Loan No. 2 – The Woods |
| Mortgage Loan Information | Property Information | ||||||
| Mortgage Loan Seller: | CREFI | Single Asset/Portfolio: | Single Asset | ||||
| Original Balance(1): | $85,000,000 | Location: | San Jose, CA 95136 | ||||
| Cut-off Date Balance(1): | $85,000,000 | General Property Type: | Multifamily | ||||
| % of Initial Pool Balance: | 9.0% | Detailed Property Type: | Garden | ||||
| Loan Purpose: | Refinance | Title Vesting: | Fee | ||||
| Sponsor: | Arcadia Development Co. | Year Built/Renovated: | 1981-2003/2013-2017 | ||||
| Mortgage Rate: | 2.9405% | Size: | 1,841 Units | ||||
| Note Date: | 12/1/2017 | Cut-off Date Balance per SF(1): | $108,637 | ||||
| First Payment Date: | 1/6/2018 | Maturity Date Balance per SF(1): | $108,637 | ||||
| Maturity Date: | 12/6/2022 | Property Manager: | Arcadia Management Services Co. (borrower-related) | ||||
| Original Term to Maturity: | 60 months | ||||||
| Original Amortization Term: | 0 months | ||||||
| IO Period: | 60 months | Underwriting and Financial Information | |||||
| Seasoning: | NAP | UW NOI: | $30,313,267 | ||||
| Prepayment Provisions(2): | LO (24); DEF/YM1 (29); O (7) | UW NOI Debt Yield(1): | 15.2% | ||||
| Lockbox/Cash Mgmt Status: | Springing/Springing | UW NOI Debt Yield at Maturity(1): | 15.2% | ||||
| Additional Debt Type(1)(3): | Pari Passu | UW NCF DSCR(1): | 5.01x | ||||
| Additional Debt Balance(1)(3): | $115,000,000 | Most Recent NOI: | $29,844,064 (9/30/2017 TTM) | ||||
| Future Debt Permitted (Type): | No (N/A) | 2nd Most Recent NOI: | $29,881,343 (12/31/2016) | ||||
| Reserves(4) | 3rd Most Recent NOI: | $27,615,634 (12/31/2015) | |||||
| Type | Initial | Monthly | Cap | Most Recent Occupancy: | 94.7% (10/1/2017) | ||
| RE Tax: | $0 | Springing | N/A | 2nd Most Recent Occupancy: | 92.4% (12/31/2016) | ||
| Insurance: | $0 | Springing | N/A | 3rd Most Recent Occupancy: | 95.2% (12/31/2015) | ||
| Recurring Replacements: | $0 | Springing | N/A | Appraised Value (as of): | $675,500,000 (10/10/2017) | ||
| Cut-off Date LTV Ratio(1): | 29.6% | ||||||
| Maturity Date LTV Ratio(1): | 29.6% | ||||||
| Sources and Uses | ||||||
| Sources | Proceeds | % of Total | Uses | Proceeds | % of Total | |
| Loan Amount(1): | $200,000,000 | 99.3% | Loan Payoff: | $200,000,000 | 99.3% | |
| Sponsor Equity(5): | $1,323,235 | 0.7% | Closing Costs: | $1,323,235 | 0.7% | |
| Total Sources: | $201,323,235 | 100.0% | Total Uses: | $201,323,235 | 100.0% | |
| (1) | The Woods Mortgage Loan (as defined below) is part of The Woods Whole Loan (as defined below), which is comprised of threepari passu promissory notes with an aggregate original principal balance of $200,000,000. The Cut-off Date Balance per SF, Maturity Date Balance per SF, UW NOI Debt Yield, UW NOI Debt Yield at Maturity, UW NCF DSCR, Cut-off Date LTV Ratio and Maturity Date LTV Ratio numbers presented above are based on the aggregate principal balance of the promissory notes comprising The Woods Whole Loan. |
| (2) | The Woods Whole Loan can be defeased or prepaid (if prior to June 6, 2022, with a yield maintenance charge or a prepayment premium) in whole or in part after the earlier to occur of (a) December 1, 2021 and (b) the date that is two years after the closing date of the securitization of the last piece of The Woods Whole Loan. The assumed lockout period of 24 payments is based on the closing date of this transaction in December 2017. |
| (3) | See “—The Mortgage Loan” and “—Additional Secured Indebtedness (not including trade debts)” below for further discussion of additional debt. |
| (4) | See “Escrows and Reserves” below for further discussion of reserve requirements. |
| (5) | The Woods Whole Loan along with $2.0 million of sponsor equity from The Woods Whole Loan sponsor was used to extinguish prior debt and pay closing costs. |
The Mortgage Loan. The second largest mortgage loan (“The Woods Mortgage Loan”) is part of a whole loan (“The Woods Whole Loan”) evidenced by threepari passu promissory notes in the aggregate original principal amount of $200,000,000, which are secured by the fee interest in a garden-style multifamily property located in San Jose, California and totaling 1,841 units (“The Woods Property”). The controlling Promissory Note A-1 in the original principal amount of $85,000,000 evidences The Woods Mortgage Loan and will be included in the MSC 2017-HR2 securitization trust. The remaining promissory notes, with an aggregate original principal amount of $115,000,000 (“The Woods ServicedPari Passu Companion Loans”) will be held by Citi Real Estate Funding Inc. and contributed to future securitization transactions or may be otherwise transferred at any time. The Woods Whole Loan will be serviced pursuant to the pooling and servicing agreement for the MSC 2017-HR2 securitization trust. See “Description of the Mortgage Pool—The Whole Loans-The Serviced Pari Passu Whole Loans” and“Pooling and Servicing Agreement” in the Preliminary Prospectus. Proceeds from The Woods Whole Loan along with $2.0 million of equity from The Woods Whole Loan sponsor were used to extinguish prior debt and pay closing costs.
The Borrower and the Sponsor. The borrower is The Woods of San Jose LLC, a Delaware limited liability company and special purpose entity with two independent directors that is indirectly 100.0% owned by Eli Reinhard and Eli Reinhard’s immediate family (“The Woods Borrower”). There is no non-recourse carveout guarantor with respect to The Woods Whole Loan. Both The Woods Borrower and the borrower sponsor, Arcadia Development Co. (“Arcadia”), delivered the related environmental indemnity. Eli Reinhard is the President and sole owner of Arcadia. Mr. Reinhard is an experienced builder in the San Jose Bay Area. Mr. Reinhard has been a developer of both single-family and multifamily housing, as well as commercial properties over the past, approximately 45 years. In addition to The Woods Property, Mr. Reinhard owns a 529-unit apartment community called Cherrywood
This is not a research report and was not prepared by any Underwriter’s research department. Please see additional important information and qualifications at the end of this Term Sheet. |
T-37
| MSC 2017-HR2 | The Woods |
approximately four miles southwest of The Woods Property. Mr. Reinhard also owns apartment communities on the East Coast, as well as several commercial properties.
Mr. Reinhard founded Arcadia in 1952 and has since built approximately 10,000 homes and apartments. Arcadia engages in the acquisition, development, building, and marketing of new home communities. The company is also involved in the management of residential and commercial properties. Arcadia’s real estate portfolio includes new home communities in California and Virginia as well as apartments in San Jose, California.
The Property.The Woods Property is comprised of six separate “villages” referred to as Amberwood, Brentwood, Cedarwood, Duramwood, Edenwood and Foxwood, totaling 1,841 units. The leasing office is in the center of The Woods Property. Units feature electric appliances including a range/oven, a frost-free refrigerator, a garbage disposal; and a dishwasher, and certain new units contain microwave ovens. According to the property manager, The Woods Property is undergoing an on-going replacement program for all appliances. All units feature private patios or balcony areas, with select units offering fireplaces and an exterior storage room. The Woods Property has 3,218 parking spaces (approximately 1.8 spaces per unit) and gate-controlled vehicular access. The parking spaces at The Woods Property are comprised of 1,072 carport spaces, 702 garage spaces, 1,181 open spaces, and 263 tandem spaces.
The Woods Property has undergone over $21.9 million ($11,900/unit) of capital improvements since 2013 by the borrower, including over $1,000/unit per year for the last six years. The Woods Property has experienced stable occupancy, with occupancy being in the mid-to-high 90.0% range over the past ten years. The 1,841 units at The Woods Property are estimated to total approximately 1,555,109 million SF which results in an average unit size of approximately 845 SF within 45 separate floor plans. The units include apartment-style residences and townhouses. The Woods Property has a variety of amenities across its six phases, with the newer units featuring in-unit laundry. The different floor plans comprising the apartments include: studios; one bedroom/one bathroom units, two bedroom/two bathroom units and three bedroom/ two bathroom units. The different floor plans comprising the townhouse units include one bedroom/1.5 bathroom units, two bedroom/two or 2.5 bathroom units and three bedroom/two bathroom units. In addition to specific village/unit amenities, all residents of The Woods Property have access to numerous amenities including a total of six swimming pools and spas located throughout the community; a resident lounge with a flat screen TV, fireplace and Wi-Fi; a lit basketball court and putting green, five high-tech fitness complexes with new cardio, aerobic and weight training equipment; children’s play areas; 24-hour on-site maintenance; professional on site management and maintenance teams; resident events; and access to the resident portal which allows tenants to make monthly rental payments on-line.
The following table presents detailed information with respect to The Woods Property:
| The Woods – Village Summary | |||||
| Phase | Year Built | Total Units | Occupied Units(1)(2) | Renovated Units | % Renovated |
| Amberwood | 1981 | 294 | 282 | 276 | 93.9% |
| Brentwood | 1984 | 262 | 252 | 245 | 93.5% |
| Cedarwood | 1985 | 228 | 217 | 204 | 89.5% |
| Duramwood | 1991 | 359 | 328 | 60 | 16.7% |
| Edenwood | 1999 | 222 | 208 | 32 | 14.4% |
| Foxwood | 2003 | 476 | 456 | 0 | 0.0% |
| Total/Wtd. Avg. | 1,841 | 1,743 | 817 | 44.4% | |
| (1) | Based on the underwritten rent roll dated October 1, 2017. |
| (2) | Occupied units treats administrative and model units as vacant, as no revenue is contributed by the units. |
The following table presents unit mix information with respect to The Woods Property:
| The Woods - Unit Mix(1) | ||||
| Unit Type | Total Units | Occupied Units | Average Unit Size (SF) | In-Place Average Rent per Month |
| Studio | 169 | 158 | 448 | $1,796 |
| 1 BR | 928 | 885 | 711 | $1,997 |
| 1 BR Townhouse | 119 | 111 | 960 | $2,292 |
| 2 BR Townhouse | 257 | 247 | 1,232 | $2,658 |
| 2 BR Townhouse | 120 | 109 | 1,295 | $2,938 |
| 2 BR Garden-style Apartment | 222 | 210 | 936 | $2,421 |
| 3 BR Garden-style Apartment | 14 | 11 | 956 | $2,747 |
| Junior 1 BR | 12 | 12 | 635 | $1,975 |
| Total/Wtd. Avg. | 1,841 | 1,743 | 1,550,397 | $2,206 |
| (1) | Based on the underwritten rent roll dated October 1, 2017. |
The Market. The Woods Property is located in San Jose, California, in central Santa Clara County, and is part of the San Jose-Sunnyvale-Santa Clara Metropolitan Statistical Area. San Jose is located at the southern end of San Francisco Bay, approximately 48 miles southeast of San Francisco. San Jose is generally bordered by the waters of San Francisco Bay and the city of Milpitas to the north, the cities of Santa Clara and Campbell to the west, the foothills of the Diablo Mountain Range to the east, and Morgan Hill to the south. The large concentration of high-technology engineering, computer, and microprocessor companies around San Jose has led the area to be known as Silicon Valley. San Jose is the largest city in Silicon Valley and is also the largest city in the San Francisco Bay Area, in terms of population. San Jose is widely known as home to many of the world’s largest technology companies including Google, Apple Inc., Intel, Cisco Systems Inc., Facebook Inc., Hewlett-Packard, Oracle, Yahoo! and eBay.
The Woods Property is located in southern San Jose, in the area generally encompassed by Capitol Expressway, Monterey Highway, and Highway 85. The Woods Property is immediately south of Capitol Expressway between Snell Avenue and Monterey Highway and is visible from these major
This is not a research report and was not prepared by any Underwriter’s research department. Please see additional important information and qualifications at the end of this Term Sheet. |
T-38
| MSC 2017-HR2 | The Woods |
thoroughfares. Primary access to the area is good, with various state routes and access routes leading through the neighborhood. Both State Highways 87 and 85 connect with Interstate 280 and US Highway 101 to the north providing access to the greater Bay Area. Access to State Highway 87 is located approximately one mile west of The Woods Property along Capitol Expressway, and access to State Highway 85 is located approximately two miles south of The Woods Property along Blossom Hill Road. The drive time to Cupertino, California (Apple’s headquarters) is less than 20 minutes away, Mountainview (Google’s headquarters) is less than 25 minutes away and Palo Alto is less than 30 minutes away.
The land uses in the immediate area consist of a mixture of residential and commercial, with retail mostly situated on Capitol Expressway and the Monterey Highway, both of which are approximately four miles from The Woods Property. According to the appraisal, the area is considered to be substantially built-out with very limited opportunities for new supply. The Woods Property is located near schools, shops and grocery stores, restaurants, parks, libraries, and other community services. The major retail development in the neighborhood is Westfield Oakridge Mall, which is located approximately three miles southwest of The Woods Property. Almaden Plaza Shopping Center, a Trader Joe’s-anchored community center, is located four miles southwest of The Woods Property. Downtown San Jose is an approximately 10 minute trip from The Woods Property. The Woods Property is in close proximity to the Highways 85, 87, 280 and 101, Capitol Expressway, Monterey Highway and light rail transit and the Cal Train with service to San Francisco. According to the appraisal, the estimated population, as of year-end 2017, within a one-, three- and five-mile radius is 34,366, 241,996 and 584,477. Additionally, per the appraisal, the estimated average household income for the same period, within a one-, three- and five-mile radius is $98,177, $106,918 and $120,520. The appraisal lists the following, top 10 employers for the area: Apple Inc., Alphabet Inc., Stanford University, Cisco Systems Inc., Kaiser Permanente, Intel Corp., Stanford University, Hospital & Clinics, Tesla Motors Inc., Facebook Inc. and University of California, Santa Cruz.
According to the appraisal, The Woods Property is part of the South San Jose multifamily submarket which is part of the greater San Jose multifamily market. As of the second quarter of 2017, the overall San Jose multifamily market had an inventory of 126,911 units and average vacancy was 2.8%. Average asking rents are reported at $2,115/unit. During the same period, the South San Jose submarket, where The Woods Property is located, had an inventory of 11,725 units. The South San Jose submarket reported a vacancy rate of 4.8% and an average asking rent of $2,162/unit. The table below shows eight multifamily properties, within the South San Jose submarket, that were identified by the appraisal as comparables to The Woods Property. Occupancy rates at the comparable properties range from 87.0% to 98.0% for a weighted average of 94.6%.
| Comparable Properties– Multifamily(1) | |||||||
| Property Name | Property Address | Distance from The Woods Property (miles) | Year Built | Total Units | Average Unit (SF) | Occupancy | Average Rent per Unit |
| The Woods Property | 4300 The Woods Drive, San Jose, CA | -- | 1981-2003 | 1,841 | 845 | 94.7%(2) | $2,206 |
| Sagemark Apartments | 3980 Ellmar Oaks Drive, San Jose, CA | 0.6 | 1986 | 432 | 908 | 87.0% | $2,662 |
| Rosewalk Apartments | 3601 Copperfield Drive, San Jose, CA | 1.0 | 1996 | 456 | 995 | 94.0% | $2,474 |
| Verde Apartments | 5322 Wong Drive, San Jose, CA | 1.4 | 1986 | 108 | 806 | 97.0% | $2,430 |
| Villa Veneto | 398 La Strada Drive, San Jose, CA | 3.0 | 1999 | 226 | 1,167 | 97.0% | $2,856 |
| Bella Villagio | 383 Vista Roma Way, San Jose, CA | 0.6 | 2004 | 231 | 992 | 99.0% | $2,519 |
| San Marino Apartments | 2175 Aborn Road, San Jose, CA | 3.0 | 1985 | 248 | 826 | 95.0% | $2,304 |
| Avana Skyway | 4501 Snell Avenue, San Jose, CA | 0.6 | 1991 | 348 | 850 | 97.0% | $2,356 |
| Almaden Lake Village | 1045 Coleman Road, San Jose, CA | 3.0 | 1998 | 250 | 921 | 98.0% | $2,441 |
| (1) | Source: Appraisal |
| (2) | Based on the underwritten rent roll dated October 1, 2017. |
Operating History and Underwritten Net Cash Flow.The following table presents certain information relating to the historical operating performance and Underwritten Net Cash Flow at The Woods Property:
This is not a research report and was not prepared by any Underwriter’s research department. Please see additional important information and qualifications at the end of this Term Sheet. |
T-39
| MSC 2017-HR2 | The Woods |
| Cash Flow Analysis | ||||||
| 2015 | 2016 | 9/30/2017 TTM | U/W | U/W Per Unit | ||
| Base Rent(1) | $43,103,435 | $46,876,612 | $48,037,645 | $46,132,248 | $25,058.26 | |
| Potential Income from Vacant Units(2) | $0 | $0 | $0 | $2,791,778 | $1,516.45 | |
| Other Income(3) | $331,813 | $463,355 | $458,597 | $458,597 | $249.10 | |
| Vacancy | ($2,084,554) | ($3,576,702) | ($3,243,631) | ($4,130,012) | ($2,243.35) | |
| Effective Gross Income | $41,350,694 | $43,763,265 | $45,252,611 | $45,252,611 | $24,580.45 | |
| Total Operating Expenses(4) | $13,735,060 | $13,881,922 | $15,408,547 | $14,939,344 | $8,114.80 | |
| Net Operating Income | $27,615,634 | $29,881,343 | $29,844,064 | $30,313,267 | $16,465.65 | |
| Replacement Reserves | $0 | $0 | $0 | $460,250 | $250.00 | |
| Net Cash Flow | $27,615,634 | $29,881,343 | $29,844,064 | $29,853,017 | $16,215.65 | |
| Occupancy % | 95.2% | 92.4% | 93.2% | 91.6% | ||
| NOI DSCR(5) | 4.63x | 5.01x | 5.01x | 5.08x | ||
| NCF DSCR(5) | 4.63x | 5.01x | 5.01x | 5.01x | ||
| NOI Debt Yield(5) | 13.8% | 14.9% | 14.9% | 15.2% | ||
| NCF Debt Yield(5) | 13.8% | 14.9% | 14.9% | 14.9% | ||
| (1) | Base Rent has been underwritten per the rent roll dated October 1, 2017, which reflects income from 1,743 occupied units (94.7% physically occupied) with an in-place average of $2,206/unit per month. The Woods Property has averaged approximately 95.4% physical occupancy since 2007. |
| (2) | Potential Income from Vacant Units has been grossed up to the appraiser’s estimated market rents of $1,893 for studio units, $2,100 for one bedroom units, $2,380 for one bedroom townhouse units, $2,145 for junior one bedroom units, $2,671 for two bedroom units and $3,123 for three bedroom units. |
| (3) | Other Income is comprised of laundry, storage, vending machine, late charges, and other miscellaneous income. |
| (4) | The difference between 9/30/2017 TTM and U/W Total Operating Expenses is attributable to the management fee being underwritten as $1,000,000. Per the management agreement, the management fee is 3.0% of the total monthly gross receipts from The Woods Property with anything above a $1,000,000 management fee only due to the extent there is sufficient cash flow following payment of amounts due under The Woods Mortgage Loan documents and other expenses of The Woods Property. |
| (5) | Debt service coverage ratios and debt yields are based on The Woods Whole Loan. |
Escrows and Reserves. The Woods Whole Loan documents do not require any reserves at origination. Following an event of default under The Woods Whole Loan documents until its cure, if applicable, The Woods Borrower is required to deposit (i) one-twelfth of an amount which would be sufficient to pay the taxes payable, or estimated by the lender to be payable, during the next ensuing twelve months, (ii) one-twelfth of an amount which would be sufficient to pay the insurance payable, or estimated by the lender to be payable, during the next ensuing twelve months and (iii) $38,355 for replacement reserves on each due date.
Lockbox and Cash Management. The Woods Whole Loan is structured with a springing lockbox and springing cash management which are put in place upon the first occurrence of an event of default under The Woods Whole Loan documents. Following an event of default under The Woods Whole Loan documents until its cure, if applicable, the lender may apply all sums in such order of priority as it may determine, or may permit funds in the lockbox account to be swept each business day to a lender-controlled cash management account and to be disbursed in accordance with The Woods Whole Loan documents. All excess cash flow will be held as additional security for The Woods Whole Loan (or otherwise applied as the lender chooses) until such event of default is cured, if applicable. Upon a cure of an event of default, the lockbox and cash management (and related) accounts are required to be closed at the request of The Woods Borrower and amounts held in such accounts are required to be disbursed to The Woods Borrower.
Additional Secured Indebtedness (not including trade debts). The Woods Property also secures The Woods ServicedPari Passu Companion Loans, which have an aggregate Cut-off Date principal balance of $115,000,000. The Woods ServicedPari Passu Companion Loans accrue interest at the same rate as The Woods Mortgage Loan. The Woods Mortgage Loan is entitled to payments of interest on a pro rata andpari passu basis with The Woods ServicedPari Passu Companion Loans. The holders of The Woods Mortgage Loan and The Woods ServicedPari Passu Companion Loans have entered into a co-lender agreement which sets forth the allocation of collections on The Woods Whole Loan. See “Description of the Mortgage Pool—The Whole Loans—The Serviced Pari Passu Whole Loans” in the Preliminary Prospectus.
Mezzanine Loan and Preferred Equity.Not permitted.
Release of Property. Not permitted.
Terrorism Insurance.The Woods Borrower is required to obtain and maintain property insurance that covers perils of terrorism and acts of terrorism in an amount equal to the full replacement cost of The Woods Property and business interruption insurance for 18 months (provided that such coverage is commercially available; if such coverage is not commercially available for a period of 18 months, The Woods Borrower is required to obtain coverage for a 12 month period), with six months of extended indemnity. See “Risk Factors—Risks Relating to the Mortgage Loans—Terrorism Insurance May Not Be Available for All Mortgaged Properties” in the Preliminary Prospectus.
This is not a research report and was not prepared by any Underwriter’s research department. Please see additional important information and qualifications at the end of this Term Sheet. |
T-40
(THIS PAGE INTENTIONALLY LEFT BLANK)
This is not a research report and was not prepared by any Underwriter’s research department. Please see additional important information and qualifications at the end of this Term Sheet. |
T-41
| MSC 2017-HR2 | Baybrook Lifestyle and Power Center |
Mortgage Loan No. 3 – Baybrook Lifestyle and Power Center
This is not a research report and was not prepared by any Underwriter’s research department. Please see additional important information and qualifications at the end of this Term Sheet. |
T-42
| MSC 2017-HR2 | Baybrook Lifestyle and Power Center |
Mortgage Loan No. 3 – Baybrook Lifestyle and Power Center

This is not a research report and was not prepared by any Underwriter’s research department. Please see additional important information and qualifications at the end of this Term Sheet. |
T-43
| MSC 2017-HR2 | Baybrook Lifestyle and Power Center |
| Mortgage Loan No. 3 – Baybrook Lifestyle and Power Center |
| Mortgage Loan Information | Mortgaged Property Information | ||||||
| Mortgage Loan Seller: | MSMCH | Single Asset/Portfolio: | Single Asset | ||||
| Original Balance(1): | $80,000,000 | Location: | Friendswood, TX 77546 | ||||
| Cut-off Date Balance(1): | $80,000,000 | General Property Type: | Retail | ||||
| % of Initial Pool Balance: | 8.5% | Detailed Property Type: | Lifestyle Center | ||||
| Loan Purpose: | Refinance | Title Vesting: | Fee | ||||
| Sponsor: | GGP Real Estate Holding I, Inc. | Year Built/Renovated: | 2015/N/A | ||||
| Mortgage Rate: | 3.7700% | Size: | 636,845 SF | ||||
| Note Date: | 11/17/2017 | Cut-off Date Balance PSF(1): | $220 | ||||
| First Payment Date: | 1/1/2018 | Maturity Date Balance PSF(1): | $220 | ||||
| Maturity Date: | 12/1/2027 | Property Manager: | General Growth Services, Inc. (borrower-related) | ||||
| Original Term to Maturity: | 120 months | ||||||
| Original Amortization Term: | 0 months | Underwriting and Financial Information | |||||
| IO Period: | 120 months | UW NOI(6): | $15,774,558 | ||||
| Seasoning: | 0 months | UW NOI Debt Yield(1)(6): | 11.3% | ||||
| Prepayment Provisions(2): | LO (24); DEF (92); O (4) | UW NOI Debt Yield at Maturity(1): | 11.3% | ||||
| Lockbox/Cash Mgmt Status: | Hard/Springing | UW NCF DSCR(1)(6): | 2.80x | ||||
| Additional Debt Type(1)(3): | Pari Passu | Most Recent NOI(7): | $12,031,676 (9/30/2017 TTM) | ||||
| Additional Debt Balance(1)(3): | $60,000,000 | 2nd Most Recent NOI: | $7,661,415 (12/31/2016) | ||||
| Future Debt Permitted (Type): | No (N/A) | 3rd Most Recent NOI: | N/A | ||||
| Reserves(4) | Most Recent Occupancy(8): | 94.1% (11/13/2017) | |||||
| Type | Initial | Monthly | Cap | 2nd Most Recent Occupancy: | 91.7% (12/31/2016) | ||
| RE Tax: | $0 | Springing | N/A | 3rd Most Recent Occupancy: | N/A | ||
| Insurance: | $0 | Springing | N/A | Appraised Value (as of)(9): | $241,000,000 (7/1/2018) | ||
| Recurring Replacements: | $0 | Springing | $159,211 | Cut-off Date LTV Ratio(1)(9): | 58.1% | ||
| TI/LC: | $0 | Springing | $636,845 | Maturity Date LTV Ratio(1)(9): | 58.1% | ||
| Life Time Fitness Reserve(5): | $22,000,000 | N/A | N/A | ||||
| Sources and Uses | ||||||
| Sources | Proceeds | % of Total | Uses | Proceeds | % of Total | |
| Loan Amount(1): | $140,000,000 | 100.0% | Loan Payoff: | $113,458,381 | 81.0% | |
| Reserves: | $22,000,000 | 15.7% | ||||
| Return of Equity: | $3,847,871 | 2.7% | ||||
| Closing Costs: | $693,748 | 0.5% | ||||
| Total Sources: | $140,000,000 | 100.0% | Total Uses: | $140,000,000 | 100.0% | |
| (1) | The Baybrook Lifestyle and Power Center Mortgage Loan (as defined below) is part of the Baybrook Lifestyle and Power Center Whole Loan (as defined below), which is comprised of fourpari passu promissory notes with an aggregate principal balance of $140,000,000. The Cut-off Date Balance PSF, Maturity Date Balance PSF, UW NOI Debt Yield, UW NOI Debt Yield at Maturity, UW NCF DSCR, Cut-off Date LTV Ratio and Maturity Date LTV Ratio numbers presented above are based on the aggregate principal balance of the promissory notes comprising the Baybrook Lifestyle and Power Center Whole Loan. |
| (2) | Defeasance of the Baybrook Lifestyle and Power Center Whole Loan is permitted at any time after the earlier of (i) November 17, 2020, or (ii) two years from the closing date of the securitization that includes the lastpari passunote of the Baybrook Lifestyle and Power Center Whole Loan to be securitized. The assumed lockout period of 24 payments is based on the closing date of this transaction in December 2017. In addition the Baybrook Lifestyle and Power Center Whole Loan may be prepaid as described in footnote (5) below. |
| (3) | See “—The Mortgage Loan” and “—Additional Secured Indebtedness (not including trade debts)” below for further discussion of additional debt. |
| (4) | See “—Escrows and Reserves” below for further discussion of reserve requirements. |
| (5) | In the event that the commencement date of the Life Time Fitness lease or a replacement lease does not occur by November 17, 2019, the lender may elect to apply the Life Time Fitness Reserve to prepay the Baybrook Lifestyle and Power Center Whole Loan and pay the related prepayment fee as described below under “Escrows and Reserves” and “Release of Property.” |
| (6) | UW base rent includes rent steps through November 30, 2018 totaling $281,476 and $1,985,000 of base rent attributable to Life Time Fitness. The Life Time Fitness building is currently under construction and the tenant is expected to take occupancy and commence paying rent in June 2018. Life Time Fitness is expected to open for business in the third quarter of 2018. Excluding the Life Time Fitness lease, UW base rent would be $13,578,600, UW NCF DSCR would be 2.46x and UW NOI Debt Yield would be 9.9% based on the $140,000,000 Baybrook Lifestyle and Power Center Whole Loan. The increase in UW NOI over the Most Recent NOI is attributable to 12 leases accounting for approximately $4.1 million in additional base rent, including Life Time Fitness. |
| (7) | The increase in Most Recent NOI is due to the majority of tenants taking occupancy in the second half of 2016. A total of 22 tenants accounting for 368,706 SF (57.9% of NRA) and $8,213,758 base rent (52.8% of UW Base Rent), including the Life Time Fitness lease had lease commencement dates after June 1, 2016. |
| (8) | Most Recent Occupancy includes the 120,000 SF Life Time Fitness building, which is currently under construction. The Life Time Fitness tenant is expected to take occupancy and commence paying rent in June 2018, and to open for business in the third quarter of 2018. |
| (9) | The Appraised Value represents the “As-Completed” Value which assumes the under construction improvements of the Life Time Fitness expansion are completed with Life Time Fitness taking occupancy. The appraiser’s “as-is” concluded value, excluding the Life Time Fitness parcel and lease, of $203,860,000 would result in a Cut-off Date LTV Ratio and Maturity Date LTV Ratio of approximately 58.9%, after accounting for the estimated pay-down based on certain assumptions of the Baybrook Lifestyle and Power Center Whole Loan, and payment of the prepayment consideration provided for in the loan documents, resulting from the $22,000,000 Life Time Fitness Reserve. The actual amount of the pay-down and the prepayment consideration may be different from the assumed amounts. |
This is not a research report and was not prepared by any Underwriter’s research department. Please see additional important information and qualifications at the end of this Term Sheet. |
T-44
| MSC 2017-HR2 | Baybrook Lifestyle and Power Center |
The Mortgage Loan.The third largest mortgage loan (the “Baybrook Lifestyle and Power Center Mortgage Loan”) is part of a whole loan (the “Baybrook Lifestyle and Power Center Whole Loan”) evidenced by fourpari passu promissory notes in the aggregate original principal amount of $140,000,000, all of which are secured by a first priority fee mortgage encumbering a lifestyle and power center known as Baybrook Lifestyle and Power Center (the “Baybrook Lifestyle and Power Center Property”). Promissory Note A-1, with an original principal balance of $50,000,000 and promissory Note A-3, with an original principal balance of $30,000,000, represent the Baybrook Lifestyle and Power Center Mortgage Loan, and will be included in the MSC 2017-HR2 trust. Promissory Note A-2, with an original principal balance of $40,000,000, and promissory Note A-4, with an original principal balance of $20,000,000, are expected to be held by Morgan Stanley Bank, N.A. or an affiliate thereof on the closing date of this transaction, and are expected to be contributed to a future securitization transaction or may be otherwise transferred at any time. Promissory Notes A-2 and A-4 represent thepari passucompanion loans (the “Baybrook Lifestyle and Power Center ServicedPari PassuCompanion Loans”). See “Description of the Mortgage Pool—The Whole Loans-The Serviced Pari Passu Whole Loans” and “Pooling and Servicing Agreement” in the Preliminary Prospectus.
The proceeds of the Baybrook Lifestyle and Power Center Whole Loan were primarily used to refinance a previous construction loan of approximately $113.5 million, pay closing costs and return equity to the Baybrook Lifestyle and Power Center Whole Loan sponsor.
The Baybrook Lifestyle and Power Center Whole Loan requires $22.0 million in loan proceeds to be held back until Life Time Fitness takes occupancy of its 120,000 SF space, which is currently under construction and expected to be completed in June 2018, with the tenant expected to take occupancy and commence paying rent in June 2018 and to open for business in fall 2018. If the tenant (or an acceptable replacement tenant) is not in-place by November 17, 2019, the lender will have the right to apply the escrowed loan proceeds to prepay the loan balance, together with prepayment consideration provided for in the loan documents. In the event that the lender applies the escrowed loan proceeds to make such a prepayment, the Life Time Fitness parcel may be released as described below under “Release of Property.”
The Borrowers and the Sponsors. The borrowers are Baybrook LPC, LLC; Baybrook LTF Owner, LLC; and Gulfbrook Services, Inc. (collectively, the “Baybrook Lifestyle and Power Center Borrowers”). Baybrook LPC, LLC and Baybrook LTF Owner, LLC each is a single-purpose Delaware limited liability company, with two independent directors and Gulfbrook Services, Inc. is a Delaware corporation with two independent directors. The Baybrook Lifestyle and Power Center Borrowers are owned by Gulfbrook Investments, Inc., a real estate investment trust (“REIT”), which is 53% indirectly owned by entities controlled by General Growth Properties, Inc. (“GGP”) and 47% indirectly owned by Gulfbrook Holding LLC, which is managed by CDC Houston Inc., an entity affiliated with Coventry Development Corporation. GGP Real Estate Holding I, Inc., a subsidiary of GGP which is in the chain of ownership of the Baybrook Lifestyle and Power Center Borrowers, is the sponsor and non-recourse carveout guarantor of the Baybrook Lifestyle and Power Center Whole Loan. Baybrook LTF Owner, LLC owns the expansion parcel for Life Time Fitness; Baybrook LPC, LLC owns the remainder of the Baybrook Lifestyle and Power Center Property, and Gulfbrook Services, Inc. operates as a taxable REIT subsidiary.
GGP is a Chicago, Illinois-based real estate company that focuses on owning, managing, leasing and the development of retail properties across the United States. GGP maintains a current portfolio of approximately 121.0 million SF across 126 retail properties located in 40 states. Coventry Development Corporation, established in 1962, is a privately held real estate development and asset management company based in New York.
The Property.The Baybrook Lifestyle and Power Center Property is a 636,845 SF lifestyle and power center comprised of 15 buildings located adjacent to the Baybrook Mall in Friendswood, Texas. Built in 2015, the Baybrook Lifestyle and Power Center Property sits on 80.9 acres and is comprised of 516,845 SF of retail space as well as a 120,000 SF expansion, consisting of the Life Time Fitness building that is currently under construction and contains a total of 2,948 parking spaces (4.63 spaces per 1,000 SF of NRA). As of November 13, 2017, the Baybrook Lifestyle and Power Center Property was 94.1% leased by a mix of 50 national and local retail and restaurant tenants. A total of seven major tenant leases have been signed during 2016 and 2017, including Dick’s Sporting Goods, Recreational Equipment, Inc. (“REI”), Total Wine & More, The Container Store, Arhaus Furniture, Anthropologie and Perry’s Steakhouse & Grille. Other major tenants include Star Cinema Grill, Dave & Buster’s, Zara and Yard House Restaurant. Apart from Life Time Fitness and Dick’s Sporting Goods, no other tenant accounts for more than 6.6% of NRA or 6.2% of underwritten rent. Inline tenants include Z Gallerie, Charming Charlie, J. Jill, Soma Intimates, Kendra Scott, Sunglass Hut and a variety of dining tenants. Comparable inline sales, represented by 14 tenants with at least one full year of sales, were $505 PSF as of the September 2017 TTM period, while six restaurant tenants with at least 12 months of operations reported sales of $503 PSF.
The Baybrook Lifestyle and Power Center Property is located directly adjacent to the Baybrook Mall, which is anchored by Dillard’s, JCPenney and Macy’s. The Baybrook Mall, owned by borrower affiliates, is the largest shopping center in southeast Houston and has averaged approximately 99% occupancy over the last five years and reported in-line sales of $770 PSF as of 2016. The lifestyle component of the Baybrook Lifestyle and Power Center Property has been integrated into the Baybrook Mall via direct access provided by entrance located in between the Dillard’s and Forever 21 boxes, and includes eight buildings surrounding an open courtyard referred to as The Lawn, a spacious grassy courtyard providing a gathering area for the community. The majority of the tenants surrounding the courtyard largely comprise entertainment and dining tenants, such as Star Cinema Grill, Dave & Busters, Perry’s Steakhouse & Grille, Yard House Restaurant, Kona Grill and Maggiano’s Little Italy. The power center portion of the Baybrook Lifestyle and Power Center Property is located to the north of the lifestyle component and is comprised of two big box buildings leased to Dick’s Sporting Goods in one building and The Container Store, REI and Total Wine & More in the other building. The building occupied by Dick’s Sporting Goods is a 105,000 SF space demised into three separate suites and occupied as a Dick’s Sporting Goods, Field & Stream and Golf Galaxy. The power center component also features two other inline buildings and two freestanding restaurants.
Life Time Fitness is expected to occupy a 120,000 SF single building that is currently under construction on a parcel adjacent to the remainder of the Baybrook Lifestyle and Power Center Property. Construction of the Life Time Fitness building is expected to be completed in June 2018, with Life Time Fitness rent commencing June 1, 2018. Life Time Fitness is expected to open for business in the third quarter of 2018. Gap rent has not been reserved for. Life Time Fitness is entitled to a $27,500,000 tenant allowance in connection with construction of its building, to be disbursed monthly, which has not been reserved for. In relation to the Life Time Fitness parcel, $22.0 million of the $140.0 million Baybrook Lifestyle and Power Center Whole Loan is held in escrow and required to be released to the Baybrook Lifestyle and Power Center Borrowers upon Life Time Fitness taking occupancy of its space. If Life Time Fitness does not take occupancy by November 17, 2019, the lender will have the right, in its sole discretion, to apply the escrow to prepay the Baybrook Lifestyle and Power Center Whole Loan, together with prepayment consideration, as described above under “The Mortgage Loan,” and the Life Time Fitness parcel is permitted to be released as described below under “Release of Property.”
Major Retail Tenants.
Life Time Fitness (120,000 SF, 18.8% of NRA, 12.8% ofunderwritten rent). Life Time Fitness, which is expected to take occupancy at the Baybrook Lifestyle and Power Center Property in 2018, is a chain of health and fitness centers with over 120 locations, totaling approximately 11.9 million SF across 27 states. Life Time Fitness has a lease that is expected to commence June 1, 2018 and expire September 1, 2038, with 4 five-year extension
This is not a research report and was not prepared by any Underwriter’s research department. Please see additional important information and qualifications at the end of this Term Sheet. |
T-45
| MSC 2017-HR2 | Baybrook Lifestyle and Power Center |
options. The Life Time Fitness building is currently under construction and is expected to be completed in June 2018, and expected to open for business in the third quarter of 2018.
Dick’s Sporting Goods (105,000 SF, 16.5% of NRA, 11.3% of underwritten rent). Dick’s Sporting Goods occupies one building at the Baybrook Lifestyle and Power Center Property, which is demised into three separate suites and occupied by Dick’s Sporting Goods, Field & Stream and Golf Galaxy. Dick’s Sporting Goods, Field & Stream and Golf Galaxy provide a variety of sporting goods equipment, apparel, footwear, accessories and other products. As of October 2017, Dick’s operated approximately 715 locations across the United States. Dick’s Sporting Goods operates the three suites under one lease that commenced October 19, 2016 and has an expiration date of January 31, 2027, with 3 five-year renewal options.
Star Cinema Grill(42,147 SF, 6.6% of NRA, 5.1% of underwritten rent).Star Cinema Grill operates a 10-screen movie theater at the Baybrook Lifestyle and Power Center Property. Star Cinema Grill is a Houston-based dine-in-theater that offers first-run film releases as well as a full service bar. Star Cinema Grill currently has five locations and plans to open two additional locations, all of which are located in Texas. Star Cinema Grill’s lease commenced December 4, 2015 and has an expiration date of December 31, 2030, with 2 five-year renewal options. As of the September 30, 2017 trailing twelve month period, Star Cinema Grill had sales of approximately $10.9 million at the Baybrook Lifestyle and Power Center Property with an average of approximately $1.1 million per screen.
Dave & Buster’s(41,996 SF, 6.6% of NRA, 6.2% of underwritten rent).Dave & Buster’s, a tenant at the Baybrook Lifestyle and Power Center Property since 2015, is an entertainment and dining venue, with 99 locations across 34 states and Canada. Dave & Buster’s lease commenced November 16, 2015 and has an expiration date of January 31, 2031, with 2 five-year renewal options. As of the September 30, 2017 trailing twelve month period, Dave & Buster’s had sales of approximately $9.4 million at the Baybrook Lifestyle and Power Center Property with an average of $223 PSF.
The following table presents a summary regarding the largest tenants at the Baybrook Lifestyle and Power Center Property:
| Tenant Summary(1) | ||||||||||
| Tenant Name | Credit Rating (Fitch/Moody’s/S&P)(2) | Tenant SF | % of Collateral SF | Annual UW Rent(3) | % of Annual UW Rent | Annual UW Rent PSF(4) | September 2017 TTM Sales | Occ. Cost %(5) | Lease Expiration | |
| $ | PSF | |||||||||
| Anchor Tenants | ||||||||||
| Life Time Fitness(6) | NR/NR/NR | 120,000 | 18.8% | $1,985,000 | 12.8% | $16.54 | N/A | N/A | N/A | 9/1/2038 |
| Dick’s Sporting Goods(7) | NR/NR/NR | 105,000 | 16.5% | $1,752,450 | 11.3% | $16.69 | N/A | N/A | N/A | 1/31/2027 |
| Subtotal/Wtd. Avg. | 225,000 | 35.3% | $3,737,450 | 24.0% | $16.61 | N/A | N/A | N/A | ||
| Tenants > 10,000 SF | ||||||||||
| Star Cinema Grill(8) | NR/NR/NR | 42,147 | 6.6% | $800,793 | 5.1% | $19.00 | $10,856,894 | $1,085,689 | 10.9% | 12/31/2030 |
| Dave & Buster’s | NR/NR/NR | 41,996 | 6.6% | $960,000 | 6.2% | $22.86 | $9,359,269 | $223 | 13.1% | 1/31/2031 |
| Zara(9) | NR/NR/NR | 36,982 | 5.8% | $210,058 | 1.3% | $5.68 | $4,314,993 | $117 | 4.9% | 12/31/2025 |
| REI(10) | NR/NR/NR | 25,000 | 3.9% | $400,000 | 2.6% | $16.00 | N/A | N/A | N/A | 2/28/2027 |
| Total Wine & More(10) | NR/NR/NR | 24,780 | 3.9% | $438,358 | 2.8% | $17.69 | N/A | N/A | N/A | 1/31/2028 |
| The Container Store(11) | NR/NR/B | 23,904 | 3.8% | $599,990 | 3.9% | $25.10 | N/A | N/A | N/A | 2/29/2032 |
| Arhaus Furniture(12) | NR/NR/NR | 13,905 | 2.2% | $486,675 | 3.1% | $35.00 | $2,673,491 | $192 | 23.4% | 4/30/2026 |
| Anthropologie(13) | NR/NR/NR | 10,111 | 1.6% | $288,164 | 1.9% | $28.50 | N/A | N/A | N/A | 1/31/2027 |
| Yard House Restaurant | NR/NR/NR | 10,082 | 1.6% | $362,952 | 2.3% | $36.00 | $5,848,964 | $580 | 9.5% | 12/31/2025 |
| Perry’s Steakhouse & Grille | NR/NR/NR | 10,021 | 1.6% | $478,803 | 3.1% | $47.78 | $8,114,560 | $810 | 7.3% | 1/31/2031 |
| Subtotal/Wtd. Avg.(14) | NR/NR/NR | 238,928 | 37.5% | $5,025,793 | 32.3% | $21.03 | 41,168,171 | $265 | 10.7% | |
| Other Retail Tenants | 135,641 | 21.3% | $6,800,356 | 43.7% | $50.13 | $45,431,450 | $335 | 19.3% | ||
| Vacant | 37,276 | 5.9% | $0 | 0.0% | $0.00 | $0 | $0 | 0.0% | ||
| Subtotal/Wtd. Avg.(14) | 172,917 | 27.2% | $6,800,356 | 43.7% | $50.13 | $45,431,450 | $335 | |||
| Total/Wtd. Avg.(14) | 636,845 | 100.0% | $15,563,600 | 100.0% | $25.96 | $86,599,621 | ||||
| (1) | Information is based on the underwritten rent roll as of November 13, 2017. |
| (2) | Certain ratings are those of the parent company whether or not the parent guarantees the lease. |
| (3) | Annual UW Rent includes contractual rent steps equal to $281,476 through November 30, 2018. |
| (4) | Wtd. Avg. Annual UW Rent PSF excludes vacant space. |
| (5) | Occ. Cost % is based on the underwritten rent as of the November 13, 2017 rent roll and underwritten reimbursements divided by most recently reported sales. |
| (6) | Life Time Fitness is expected to take occupancy upon completion of the buildout of the 120,000 SF building, which is currently under construction, with an expected completion of June 2018, and is expected to commence paying rent in June 2018 and to open for business in fall 2018. |
| (7) | Dick’s Sporting Goods, which is comprised of Dick’s Sporting Goods, Field & Stream and Golf Galaxy, reports sales on an annual basis, accordingly, updated sales were not available for the September 30, 2017 TTM period. Dick’s Sporting Goods reported gross sales of $8,746,835 as of their first reporting period ending January 2017, which reflects operations at the Baybrook Lifestyle and Power Center Property between the lease start date of October 19, 2016 and January 31, 2017. |
| (8) | Sales PSF for Star Cinema Grill is based on 10 screens. Sales PSF is $258. |
| (9) | If Zara’s net sales fail to exceed $5,000,000 beginning in the 49th calendar month and ending on the 60th calendar month, it can terminate with 365 days written notice given at any time within 120 days following December 31, 2020. |
| (10) | Tenant is not required to report sales. |
| (11) | The Container Store reports sales on an annual basis, accordingly, updated sales were not available for the September 30, 2017 TTM Period. The Container Store reported gross sales of $2,135,282 as of their first reporting period ending February 2017, which reflects operations at the Baybrook Lifestyle and Power Center Property between the lease start date of November 12, 2016 and February 28, 2017. |
| (12) | If Arhaus Furniture’s net sales fail to exceed $4,000,000 beginning in the 49th calendar month and ending on the 60th calendar month, it can terminate with 540 days’ written notice given at any time within 60 days following April 30, 2021. |
This is not a research report and was not prepared by any Underwriter’s research department. Please see additional important information and qualifications at the end of this Term Sheet. |
T-46
| MSC 2017-HR2 | Baybrook Lifestyle and Power Center |
| (13) | Anthropologie reports sales on an annual basis, accordingly, updated sales were not available for the September 30, 2017 TTM Period. Anthropologie reported gross sales of $783,717 as of their first reporting period ending January 2017, which reflects operations at the Baybrook Lifestyle and Power Center Property between the lease start date of September 23, 2016 and January 30, 2017. If Anthropologie’s gross sales fail to exceed $3,000,000 during the 12-month period from April 1, 2018 to March 31, 2019, Anthropologie can terminate its lease with written notice to the landlord on or before September 30, 2019. |
| (14) | For purposes of calculating Tenants > 10,000 SF subtotals for September 30, 2017 TTM Sales PSF and Occ. Cost %, amounts exclude tenants that do not report sales. Wtd. Avg. is based on Tenant SF for September 30, 2017 TTM Sales PSF and by September 30, 2017 TTM Sales $ for Occ. Cost %. |
The following table presents certain information relating to the lease rollover at Baybrook Lifestyle and Power Center Property:
| Lease Rollover Schedule(1)(2) | ||||||||
| Year | # of Leases Rolling | SF Rolling | Approx. % of Total SF Rolling | Approx. Cumulative % of SF Rolling | Total UW Rent Rolling(3) | Annual UW Rent PSF Rolling(4) | Approx. % of Total Rent Rolling | Approx. Cumulative % of Total Rent Rolling |
| MTM | 0 | 0 | 0.0% | 0.0% | $0 | $0.00 | 0.0% | 0.0% |
| 2017 | 0 | 0 | 0.0% | 0.0% | $0.00 | $0.00 | 0.0% | 0.0% |
| 2018 | 0 | 0 | 0.0% | 0.0% | $0.00 | $0.00 | 0.0% | 0.0% |
| 2019 | 0 | 0 | 0.0% | 0.0% | $0.00 | $0.00 | 0.0% | 0.0% |
| 2020 | 1 | 1,200 | 0.2% | 0.2% | 91,788 | 76.49 | 0.6% | 0.6% |
| 2021 | 0 | 0 | 0.0% | 0.2% | $0.00 | $0.00 | 0.0% | 0.6% |
| 2022 | 2 | 2,865 | 0.4% | 0.6% | 161,159 | 56.25 | 1.0% | 1.6% |
| 2023 | 0 | 0 | 0.0% | 0.6% | $0.00 | $0.00 | 0.0% | 1.6% |
| 2024 | 1 | 2,161 | 0.3% | 1.0% | 95,711 | 44.29 | 0.6% | 2.2% |
| 2025 | 13 | 82,869 | 13.0% | 14.0% | 2,432,640 | 29.36 | 15.6% | 17.9% |
| 2026 | 14 | 64,133 | 10.1% | 24.1% | 3,053,122 | 47.61 | 19.6% | 37.5% |
| 2027 | 11 | 170,322 | 26.7% | 50.8% | 3,915,714 | 22.99 | 25.2% | 62.6% |
| 2028 & Beyond | 8 | 276,019 | 43.3% | 94.1% | 5,813,466 | 21.06 | 37.4% | 100.0% |
| Vacant | 0 | 37,276 | 5.9% | 100.0% | $0.00 | $0.00 | 0.0% | 100.0% |
| Total/Wtd. Avg. | 50 | 636,845 | 100.0% | $15,563,600 | $25.96 | 100.0% | ||
| (1) | Information is based on the underwritten rent roll as of November 13, 2017. |
| (2) | Certain tenants may have lease termination options that are exercisable prior to the stated expiration date of the subject lease or leases which are not considered in the lease rollover schedule. |
| (3) | Total UW Rent Rolling includes contractual rent steps equal to $281,476 through November 30, 2018. |
| (4) | Wtd. Avg. Annual UW Rent PSF Rolling excludes vacant space. |
The Market. The Baybrook Lifestyle and Power Center Property is located on the northwest corner of the Gulf Freeway and Gulfbrook Drive, directly off of Interstate-45, approximately 20 miles southeast of downtown Houston, Texas. The Baybrook Lifestyle and Power Center Property represents the open air and power center expansion of the Baybrook Mall, bringing to the submarket a diverse roster of retail, dining and entertainment tenants. The immediate surroundings of the Baybrook Lifestyle and Power Center Property include retail and residential uses, with a mix of office space.
The Baybrook Lifestyle and Power Center Property is located in the Houston, Texas metropolitan area. According to the appraisal, the third quarter of 2017 overall retail vacancy rate for the Houston market was approximately 7.9%, while the market rental rate was approximately $15.83 PSF. According to the appraisal, there were 662,272 SF of retail under construction during the third quarter of 2017 in the Houston metropolitan area. The Baybrook Lifestyle and Power Center Property is located in the Southeast Outlier retail submarket, which contains approximately 3.9% of the Houston metropolitan area SF inventory. The Southeast Outlier retail submarket had a vacancy rate of 3.4% and a market rental rate of $17.44 psf. As of the third quarter 2017, the Southeast Outlier retail submarket had approximately 95,000 SF under construction, representing approximately 2.4% of the SF under-construction for the Houston metropolitan area.
The estimated 2017 population within a one-, three- and five-mile radius of the Baybrook Lifestyle and Power Center Property is 4,335, 80,693 and 205,162, respectively, according to the appraisal. The estimated 2017 average household income within a one-, three- and five-mile radius of the Baybrook Lifestyle and Power Center Property is $56,262, $64,864 and $81,926, respectively.
This is not a research report and was not prepared by any Underwriter’s research department. Please see additional important information and qualifications at the end of this Term Sheet. |
T-47
| MSC 2017-HR2 | Baybrook Lifestyle and Power Center |
A summary of demographics in the primary trade area is presented below.
Statistic | 1-mile Radius | 3-mile Radius | 5-mile Radius |
| 2010 Population | 4,061 | 74,829 | 182,798 |
| 2017 Population | 4,335 | 80,693 | 205,162 |
| 2022 Population (projected)(1) | 4,743 | 85,883 | 222,256 |
| Compound % Change 2010-2017 | 0.9% | 1.1% | 1.7% |
| Compound (projected) % Change 2017-2022(1) | 1.8% | 1.3% | 1.6% |
| 2010 Households | 1,799 | 30,699 | 69,258 |
| 2017 Households | 1,904 | 32,884 | 76,892 |
| 2022 Households (projected)(1) | 2,067 | 34,871 | 82,887 |
| Compound % Change 2010-2017 | 0.8% | 1.0% | 1.5% |
| Compound (projected) % Change 2017-2022(1) | 1.7% | 1.2% | 1.5% |
| 2017 Median Household Income | $56,262 | $64,864 | $81,926 |
Source: Appraisal
| (1) | Based on a projection in the appraisal. There is no assurance any increase in population will occur. |
The following table presents comparable rentals with respect to the Baybrook Lifestyle and Power Center Property:
| Comparable Rental Summary | |||||||
| Property Name | Year Built | Size (SF) | Total Occupancy | Rent/SF | Escalations | Lease Type | Lease Area (SF) |
| Baybrook Lifestyle & Power Center(1) | 2015 | 636,845 | 94.1% | $25.96 | Fixed Steps | Varies | 516,845 |
| LaCenterra at Cinco | 2007 | 413,593 | 88% | $33.00 | Fixed Steps | Triple Net | 2,014 |
| Sugar Land Town Square | 2008 | 807,000 | 80% | $35.00 | CPI | Triple Net | 2,500 |
| Market Street – The Woodlands | 2004 | 491,145 | 96% | $40.00 | CPI | Triple Net | 18,876 |
| CityCentre – Town & Country | 2009 | 617,135 | 91% | $45.00 | CPI | Triple Net | 1,179 |
| El Dorado Plaza | 2015 | 7,150 | 54% | $26.00 | None | Triple Net | 3,300 |
| Webster Plaza | N/A | 17,950 | 100% | $30.00 | Fixed Steps | Triple Net | 1,125 |
Source: Appraisal
| (1) | Information is based on the underwritten rent roll as of November 13, 2017. |
This is not a research report and was not prepared by any Underwriter’s research department. Please see additional important information and qualifications at the end of this Term Sheet. |
T-48
| MSC 2017-HR2 | Baybrook Lifestyle and Power Center |
Operating History and Underwritten Net Cash Flow. The following table presents certain information relating to the historical operating performance and the Underwritten Net Cash Flow at the Baybrook Lifestyle and Power Center Property:
| Cash Flow Analysis | ||||
| 2016(1) | 9/30/2017 TTM(1) | UW | UW PSF | |
| Base Rent | $7,110,062 | $11,726,097 | $15,563,600(2) | $24.44 |
| Other Rental Income(3) | $1,549,101 | $1,292,264 | $1,284,520 | $2.02 |
| Total Recoveries | $1,934,021 | $2,902,745 | $3,730,306 | $5.86 |
| Other Income(4) | $152,693 | $116,582 | $150,000 | $0.24 |
| Less Vacancy | $0 | $0 | $0 | $0 |
| Effective Gross Income | $10,745,878 | $16,037,688 | $20,728,426 | $32.55 |
| Total Expenses | $3,084,463 | $4,006,012 | $4,953,868 | $7.78 |
| Net Operating Income | $7,661,415 | $12,031,676 | $15,774,558 | $24.77 |
| Capital Expenditures | $0 | $0 | $95,527 | $0.15 |
| TI/LC | $0 | $0 | $717,130 | $1.13 |
| Net Cash Flow | $7,661,415 | $12,031,676 | $14,961,901 | $23.49 |
| Occupancy % | 91.7% | 94.1%(5) | 94.1%(6) | |
| NOI DSCR(7) | 1.43x | 2.25x | 2.95x | |
| NCF DSCR(7) | 1.43x | 2.25x | 2.80x | |
| NOI Debt Yield(7) | 5.5% | 8.6% | 11.3% | |
| NCF Debt Yield(7) | 5.5% | 8.6% | 10.7% | |
| (1) | The increase in Net Operating Income and Net Cash Flow in the September 30, 2017 TTM from 2016 is due to the majority of tenants taking occupancy in the second half of 2016. A total of 22 tenants accounting for 368,706 SF (57.9% of NRA) and $8,213,758 base rent (52.8% of UW Base Rent) had lease commencement dates after June 1, 2016. |
| (2) | UW Base Rent is based on the rent roll dated November 13, 2017 and includes rent steps through November 30, 2018 totaling $281,476. The increase in Base Rent over the September 30, 2017 TTM is attributable to 12 leases accounting for approximately $4.1 million in additional base rent, including Life Time Fitness, which accounts for $1,985,000 of base rent, which rent is expected to commence June 1, 2018. Gap rent for Life Time Fitness has not been reserved. Excluding the Life Time Fitness lease, UW base rent would be $13,578,600, UW NCF DSCR would be 2.46x and UW NOI Debt Yield would be 9.9% based on the $140,000,000 Baybrook Lifestyle and Power Center Whole Loan. |
| (3) | Other Rental Income is comprised of overage rent, specialty leasing, and trash pad rental. |
| (4) | Other Income includes parking revenue and other miscellaneous non-rental income. |
| (5) | 9/30/2017 TTM Occupancy % reflects occupancy as of November 13, 2017. |
| (6) | UW Occupancy % includes the 120,000 SF Life Time Fitness lease. The Life Time Fitness building is currently under construction and the tenant is expected to take occupancy and commence paying rent June 1, 2018 and to open for business in fall 2018. |
| (7) | Debt service coverage ratios and debt yields are based on the Baybrook Lifestyle and Power Center Whole Loan. |
Escrows and Reserves. The Baybrook Lifestyle and Power Center Whole Loan documents require an upfront reserve of $22,000,000 in respect of Life Time Fitness. Provided no event of default is continuing under the Baybrook Lifestyle and Power Center Whole Loan, such reserve is required to be released to the Baybrook Lifestyle and Power Center Borrowers upon (i) the commencement date under the Life Time Fitness lease or (ii) the commencement date of an LTF Replacement Lease (as defined below), provided that Life Time Fitness or the tenant under the LTF Replacement Lease is occupying its leased premises, open for business and paying unabated rent, and has delivered a reasonably acceptable tenant estoppel certificate. Notwithstanding the foregoing, to the extent neither of the conditions contained in clause (i) or (ii) of the preceding sentence is satisfied as of November 17, 2019, the lender may elect, in its sole discretion, to apply the funds in such reserve to prepay the Baybrook Lifestyle and Power Center Whole Loan, together with a prepayment fee equal to the greater of 1.0% of the amount prepaid and a yield maintenance premium (the “Baybrook Prepayment Fee”). If the lender elects such partial prepayment, the reserve fund is required to be allocated to principal prepayment and the Baybrook Prepayment Fee such that the prepayment plus the Baybrook Prepayment Fee equals the entire balance of the reserve fund, but does not exceed it. Upon such a prepayment, the Baybrook Lifestyle and Power Center Borrowers are entitled to obtain the release of the Life Time Fitness parcel as described below under “Release of Property.”
A “LTF Replacement Lease” means any lease or leases entered into in accordance with the loan documents (i) (A) that, in the aggregate, demise(s) substantially all of the Life Time Fitness premises, or (B) the aggregate gross rent of which lease(s) is equal to or greater than the aggregate gross rent under the Life Time Fitness lease; and (ii) for which a rating agency confirmation has been delivered to the lender.
During the continuance of a Cash Management Period (as defined below), the Baybrook Lifestyle and Power Center Borrowers are required to deposit monthly into escrow 1/12 of the annual estimated real estate tax payments and 1/12 of the annual estimated insurance premiums (unless an acceptable blanket insurance policy is in place). During the continuance of a Cash Management Period, the Baybrook Lifestyle and Power Center Borrowers are required to deposit monthly $13,268 into a capital expenditure reserve; provided that such deposit is not required at any time the amount on deposit in such reserve equals or exceeds $159,211. During the continuance of a Cash Management Period, the Baybrook Lifestyle and Power Center Borrowers are required to deposit monthly $53,070 into a tenant improvements and leasing commissions reserve; provided that such deposit is not required at any time the amount on deposit in such reserve equals or exceeds $636,845.
A “Cash Management Period” means a period (i) commencing upon an event of default under the Baybrook Lifestyle and Power Center Whole Loan and ending if such event of default is thereafter cured or waived or (ii) commencing upon a determination that the net operating income debt yield is less than 7.75% and ending upon the net operating income debt yield being equal to or in excess of 7.75% for two consecutive calendar quarters.
Lockbox and Cash Management. A hard lockbox is in place with respect to the Baybrook Lifestyle and Power Center Whole Loan. The Baybrook Lifestyle and Power Center Borrowers are required to notify and advise each tenant, other than tenants under leases or licenses having a maximum term of one year (“Seasonal Leases”), to send rent payments directly to the lockbox account. In addition, the Baybrook Lifestyle and Power Center Borrowers are required to deposit into the lockbox account all rents or other revenue received by them from the Baybrook Lifestyle and Power Center Property within two business days after receipt. The Baybrook Lifestyle and Power Center Whole Loan has springing cash management (i.e., cash
This is not a research report and was not prepared by any Underwriter’s research department. Please see additional important information and qualifications at the end of this Term Sheet. |
T-49
| MSC 2017-HR2 | Baybrook Lifestyle and Power Center |
management is required only after the initial occurrence and during the continuance of a Cash Management Period). Provided a Cash Management Period is not continuing, funds in the lockbox account are required to be transferred to an account designated by the Baybrook Lifestyle and Power Center Borrowers. During the continuance of a Cash Management Period, funds in the lockbox account are required to be transferred on each business day to a lender-controlled cash management account and applied on each monthly payment date to pay debt service on the Baybrook Lifestyle and Power Center Whole Loan, to fund the required reserves deposits as described above under “Escrows and Reserves”, and to pay any remainder (i) if no event of default or Cash Sweep Period (as defined below) is continuing, to the operating account of the Baybrook Lifestyle and Power Center Borrowers, or (ii) if no event of default is continuing for which the lender has accelerated the Baybrook Lifestyle and Power Center Whole Loan, to pay the greater of (x) operating expenses and capital expenditures set forth in the approved annual budget or (y) the actual amount of such expenses for the related calendar month (but not in excess of 110% of the budgeted amount unless reasonably approved by the lender), and following such payment, to deposit any remainder into an excess cash flow account to be held by the lender as additional security for the Baybrook Lifestyle and Power Center Whole Loan during the continuance of the Cash Sweep Period. So long as no event of default is continuing for which the lender has accelerated the Baybrook Lifestyle and Power Center Whole Loan, amounts in the excess cash flow account are required to be released to pay monthly operating expenses set forth in the approved annual budget.
Notwithstanding the preceding requirements, Non-Core Income is not required to be deposited into the lockbox account. “Non-Core Income” means (i) certain de minimis amounts of rents received directly by the Baybrook Lifestyle and Power Center Borrowers from miscellaneous revenue items such as holiday photos and change retrieved from fountains (but does not include rent from Seasonal Leases) and (ii) certain rents generated pursuant to multi-property sponsorship and advertising programs which are directly attributable to the Baybrook Lifestyle and Power Center Property.
A “Cash Sweep Period” means a period (i) commencing upon an event of default under the Baybrook Lifestyle and Power Center Whole Loan and ending if such event of default is thereafter cured or waived or (ii) commencing upon a determination that the net operating income debt yield is less than 7.00% and ending upon the net operating income debt yield being equal to or in excess of 7.00% for two consecutive calendar quarters.
Additional Secured Indebtedness (not including trade debts). The Baybrook Lifestyle and Power Center Property also secures the Baybrook Lifestyle and Power Center ServicedPari Passu Companion Loans, which have an aggregate Cut-off Date principal balance of $60,000,000. The Baybrook Lifestyle and Power Center ServicedPari Passu Companion Loans accrue interest at the same rate as the Baybrook Lifestyle and Power Center Mortgage Loan. The Baybrook Lifestyle and Power Center Mortgage Loan is entitled to payments of principal and interest on a pro rata andpari passu basis with the Baybrook Lifestyle and Power Center ServicedPari Passu Companion Loans. The holders of the Baybrook Lifestyle and Power Center Mortgage Loan and the Baybrook Lifestyle and Power Center ServicedPari Passu Companion Loans have entered into a co-lender agreement which sets forth the allocation of collections on the Baybrook Lifestyle and Power Center Whole Loan. See “Description of the Mortgage Pool—The Whole Loans—The Serviced Pari Passu Whole Loans” in the Preliminary Prospectus.
Mezzanine Loan and Preferred Equity. Not permitted.
Addition of Property.The Baybrook Lifestyle and Power Center Borrowers are permitted to acquire one or more parcels of land, together with the improvements thereon, that constitute an integral part of, adjoin to, or are proximately located near, the shopping center of which the Baybrook Lifestyle and Power Center Property is a part (each an “Expansion Parcel”); provided that the following conditions, among others, are satisfied: (i) no event of default exists, (ii) the applicable Baybrook Lifestyle and Power Center Borrowers acquire fee simple or leasehold title to the Expansion Parcel and deliver evidence of the same, (iii) the Baybrook Lifestyle and Power Center Borrowers deliver (a) an officer’s certificate, stating that, to their knowledge, certain property-related representations set forth in the loan documents are true and correct as to the Expansion Parcel (subject to title exceptions and certain other exceptions that do not have a material adverse effect), (b) a mortgage, assignment of leases and UCC-1 financing statements (or amendments to the existing such documents) (“Substitute Loan Documents”) with respect to the Expansion Parcel, and a title insurance policy or endorsement insuring the lien of the Substitute Loan Documents as a first mortgage lien, free and clear of exceptions other than permitted encumbrances and standard exceptions and exclusions, (c) a survey of the Expansion Parcel reasonably acceptable to the title insurance company that issued the original title insurance, (d) evidence of authority to complete the acquisition and of the due authorization and execution of the Substitute Loan Documents, and an opinion of counsel regarding their enforceability (provided no opinion of counsel is required for Substitute Loan Documents that amend existing loan documents), (e) if the Expansion Parcel is in a flood plain, evidence of flood insurance, (f) unless the Expansion Parcel is covered by the original environmental report, environmental reports (or a supplement to the original environmental report) with respect to the Expansion Parcel, and if the report shows the presence of any hazardous substance or the risk of contamination from any offsite hazardous substance, the cost of remediation of which is reasonably likely to exceed $8,875,000 with respect to such Expansion Parcel (the “Threshold Amount”), either a deposit of 125% of the estimated cost of remediation or an Additional Indemnity (as defined below), (g) if the Expansion Parcel is improved (other than by landscaping, surface parking or utilities), a property condition report with respect to the Expansion Parcel indicating that it is in good condition and free of damage (unless the Baybrook Lifestyle and Power Center Borrowers certify that they intend to demolish the improvements within a year after acquisition), and if the property condition report recommends any repairs, and the cost of such repairs is estimated to exceed the Threshold Amount, either a deposit of 125% of the estimated cost of repairs or an Additional Indemnity, (h) evidence that the Expansion Parcel constitutes one or more separate tax lots or that all action has been taken to have the Expansion Parcel so designated (or incorporated into a tax lot that is part of the existing property), (iv) the Baybrook Lifestyle and Power Center Borrowers pay lender’s reasonable out of pocket costs and expenses as well as all recording and filing fees in connection with the acquisition, and (v) at lender’s request, the Baybrook Lifestyle and Power Center Borrowers provide an opinion of counsel stating that the addition would not constitute a “significant modification” of the Baybrook Lifestyle and Power Center Whole Loan or otherwise cause a tax to be imposed on a “prohibited transaction” by any REMIC trust.
An “Additional Indemnity” means an indemnity for the specified costs from an indemnitor that is the non-recourse carveout guarantor, an affiliate thereof, or a qualified transferee (as defined in the loan documents), provided that in each case such indemnitor either (a) has a long term unsecured debt rating of not less than “BBB” by S&P, “BBB” by Fitch, or “Baa3” by Moody’s, or (b) has (i) liquid assets (including availability under lines of credit or revolving credit facilities that may not be revoked by the lenders thereunder in the absence of such indemnitor’s default) in an aggregate amount equal to at least 120% of the aggregate amount guaranteed by such indemnitor in connection with the Baybrook Lifestyle and Power Center Whole Loan (the “Guaranteed Amount”), (ii) has (or has a 100% equityholder that has) an equity market value (determined based on market capitalization) at least equal to five times the Guaranteed Amount and (iii) has an effective net worth at least equal to five times the Guaranteed Amount.
Substitution of Property.The Baybrook Lifestyle and Power Center Borrowers may obtain the release of one or more portions of the Baybrook Lifestyle and Power Center Property (each an “Exchange Parcel”) in exchange for the acquisition and encumbrance by the loan documents of a substitute parcel (each a “Substitute Parcel”), provided that the following conditions, among others, are satisfied: (i) the Exchange Parcel is vacant, non-income producing and unimproved or improved only by landscaping, utility facilities that are readily relocatable or surface parking, (ii) the conditions set forth in clauses (i) through (v) under “Addition of Property” above are satisfied with respect to the Substitute Parcel (provided that the separate tax parcel
This is not a research report and was not prepared by any Underwriter’s research department. Please see additional important information and qualifications at the end of this Term Sheet. |
T-50
| MSC 2017-HR2 | Baybrook Lifestyle and Power Center |
condition will also apply to the Exchange Parcel), (iii) the Exchange Parcel is conveyed to a person other than the Baybrook Lifestyle and Power Center Borrowers, (iv) the Substitute Parcel is at or adjacent to the shopping center of which the Exchange Parcel is a part and reasonably equivalent in value to the Exchange Parcel, as established by a letter of value from the appraiser which prepared the appraisal delivered in connection with origination or an appraiser of comparable experience, (v) if the Substitute Parcel is ground leased, the ground lease and estoppel satisfies all of the then-current criteria of S&P for financeable ground leases and related estoppels, (vi) rating agency confirmation is obtained, (vii) the loan to value ratio after the substitution (to be determined by the lender based on a commercially reasonable valuation method) shall be less than or equal to 125%; provided that a prepayment may be made, together with the Baybrook Prepayment Fee, in order to meet such loan to value ratio and (viii) delivery to the lender of restrictive covenants to be recorded against the Exchange Parcel to protect tenants’ exclusive use rights.
Release of Property. In the event that the lender has the right to, and elects to, apply the Life Time Fitness reserve to prepay the Baybrook Lifestyle and Power Center Whole Loan, the Baybrook Lifestyle and Power Center Borrowers are permitted to obtain the release of the parcel of land on which the Life Time Fitness center building is located, as identified in the loan documents (the “LTF Parcel”); provided that, (i) no event of default exists, (ii) any required approvals of third parties holding interests in the Baybrook Lifestyle and Power Center Property are obtained, (iii) such release is in compliance with leases and other agreements affecting the Baybrook Lifestyle and Power Center Property, (iv) restrictive covenants to be recorded against the LTF Parcel to protect tenants’ exclusive use rights are delivered to the lender, (v) the lender receives an officer’s certificate from the Baybrook Lifestyle and Power Center Borrowers stating that the release will not result in a default or breach under any material lease, reciprocal easement agreement or other material agreement, (vi) after giving effect to such release, each of the LTF Parcel and the remaining property conforms to and complies in all material respects with applicable legal requirements, and the LTF Parcel is not necessary for the remaining property to comply with any zoning, building, land use or parking or other legal requirements, or to the extent that the LTF Parcel is necessary for any such purpose, a reciprocal easement or other agreement has been recorded that would allow the owner of the remaining property to continue to use the LTF Parcel to the extent necessary for such purpose and (vii) the loan to value ratio after the release (to be determined by the lender based on a commercially reasonable valuation method) is less than or equal to 125%; provided that a prepayment may be made, together with the Baybrook Prepayment Fee, in order to meet such loan to value ratio. Upon such a release the Baybrook Lifestyle and Power Center Borrower which owns the LTF Parcel will also be released from its obligations under the loan documents.
In addition, the Baybrook Lifestyle and Power Center Borrowers may obtain the release of (x) one or more parcels (which may include “air rights” parcels) or outlots, provided that such parcels are vacant, non-income producing and unimproved or improved only by landscaping, utility facilities that are not required for the use of the remaining property (or, if required for such use, will continue to serve the remaining property in place or be readily relocatable) or surface parking, and (y) previously acquired Expansion Parcels, in each case in connection with a transfer thereof to a person other than a person owned or controlled by the Baybrook Lifestyle and Power Center Borrowers, in connection with the expansion or other development of the Baybrook Lifestyle and Power Center Property, without prepayment or defeasance, provided that the following conditions, among others, are satisfied: (i) no event of default exists, (ii) the Baybrook Lifestyle and Power Center Borrowers deliver to the lender (a) evidence that would be satisfactory to a prudent lender acting reasonably that (1) the release parcel is not necessary to the use or operation of, and may be readily separated without a material diminution in the value of, the Baybrook Lifestyle and Power Center Property, (2) the release parcel has been legally subdivided from the remaining property, (3) after giving effect to the release, each of the release parcel and the remaining property conforms in all material respects with applicable legal requirements and constitutes one or more separate tax lots, or all action has been taken to have the release parcel so designated (other than recordation of the deed to the transferee), and (4) after giving effect to such release, each of the release parcel and the remaining property conforms to and complies in all material respects with applicable legal requirements, and the release parcel is not necessary for the remaining property to comply with any zoning, building, land use or parking or other legal requirements, or, to the extent that the release parcel is necessary for any such purpose, a reciprocal easement or other agreement has been recorded that would allow the owner of the remaining property to continue to use the release parcel to the extent necessary for such purpose, (b) if the release would reasonably be expected to materially adversely affect lender’s rights under its title insurance policy as to any portion of the remaining property, a title endorsement confirming no change in the priority of the mortgage on the remaining property or in the amount of the insurance or coverage, (c) any required approvals of third parties holding interests in the Baybrook Lifestyle and Power Center Property, (d) restrictive covenants to be recorded against the release parcel to protect tenants’ exclusive use right, (e) an officer’s certificate stating that the release will not result in a default or breach under any material lease, reciprocal easement agreement or other material agreement, (f) any other information, approvals and documents which would be required by a prudent lender, acting reasonably, (iii) such release is in compliance with leases and other agreements affecting the Baybrook Lifestyle and Power Center Property, (iv) ingress to and egress from all portions of the remaining property is over physically open and fully dedicated public roads or over vehicle and pedestrian easements which (1) provide access to a physically open and fully dedicated public road, (2) are recorded in the chain of title to both the property encumbered thereby and the remaining property, and (3) are irrevocable and non-terminable without the consent of the owner of the remaining property, (v) except in the case of release of a previously acquired Expansion Parcel, rating agency confirmation is obtained, (vi) the Baybrook Lifestyle and Power Center Borrowers pay lender’s reasonable out of pocket costs and expenses, (vii) at lender’s request, the Baybrook Lifestyle and Power Center Borrowers provide an opinion of counsel stating that the release would not constitute a “significant modification” of the Baybrook Lifestyle and Power Center Whole Loan or otherwise cause a tax to be imposed on a “prohibited transaction” by any REMIC trust, and (viii) the loan to value ratio after the release (to be determined by the lender based on a commercially reasonable valuation method) is less than or equal to 125%; provided that a prepayment may be made, together with the Baybrook Prepayment Fee, in order to meet such loan to value ratio.
Terrorism Insurance. The Baybrook Lifestyle and Power Center Borrowers are required to obtain all risk and business income insurance against acts of terrorism to the extent such insurance is available in an amount determined by the lender (but in no event more than an amount equal to the sum of 100% of the full replacement cost and 18 months of business income insurance); provided that so long as the Terrorism Risk Insurance Act of 2002 (as extended and modified by the Terrorism Risk Insurance Program Reauthorization Act of 2015) (“TRIPRA”) is in effect (or any extension thereof or other federal government program with substantially similar protection), the lender is required to accept terrorism insurance which covers “covered acts” (as defined by such statute or other program), as full compliance with the foregoing, so long as such statute or other program covers both domestic and foreign acts of terrorism. If TRIPRA or such other program is not in effect, the Baybrook Lifestyle and Power Center Borrowers are not required to pay insurance premiums with respect to terrorism insurance in excess of the Terrorism Cap (defined below).
“Terrorism Cap” means two times the amount of the then-current annual insurance premiums payable by the Baybrook Lifestyle and Power Center Borrowers for the property and business income insurance policies required under the Baybrook Lifestyle and Power Center Whole Loan documents (excluding the earthquake and terrorism components of such insurance premiums) on a stand-alone basis. See “Risk Factors— Risks Relating to the Mortgage Loans—Terrorism Insurance May Not Be Available for All Mortgaged Properties” in the Preliminary Prospectus.
This is not a research report and was not prepared by any Underwriter’s research department. Please see additional important information and qualifications at the end of this Term Sheet. |
T-51
| MSC 2017-HR2 | Harmon Corner |
Mortgage Loan No. 4 – Harmon Corner
This is not a research report and was not prepared by any Underwriter’s research department. Please see additional important information and qualifications at the end of this Term Sheet. |
T-52
| MSC 2017-HR2 | Harmon Corner |
Mortgage Loan No. 4 – Harmon Corner
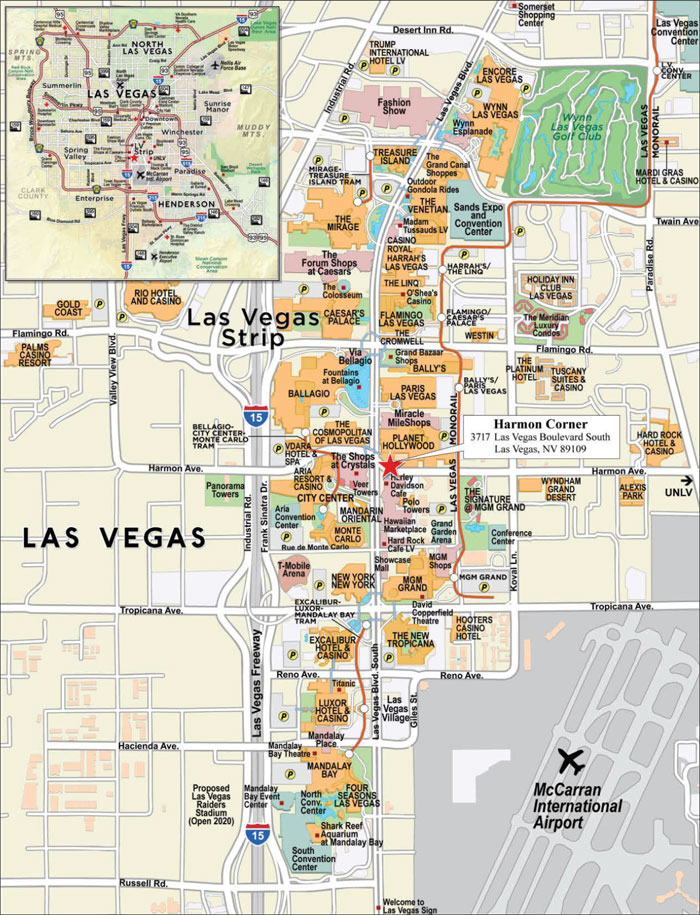
This is not a research report and was not prepared by any Underwriter’s research department. Please see additional important information and qualifications at the end of this Term Sheet. |
T-53
| MSC 2017-HR2 | Harmon Corner |
| Mortgage Loan No. 4 – Harmon Corner |
| Mortgage Loan Information | Mortgaged Property Information | ||||||
| Mortgage Loan Seller: | CREFI | Single Asset/Portfolio: | Single Asset | ||||
| Original Balance(1): | $57,200,000 | Location: | Las Vegas, NV 89109 | ||||
| Cut-off Date Balance(1): | $57,200,000 | General Property Type: | Mixed Use | ||||
| % of Initial Pool Balance: | 6.1% | Detailed Property Type: | Retail/Signage | ||||
| Loan Purpose: | Refinance | Title Vesting: | Fee | ||||
| Sponsors: | Paul Kanavos; Brett Torino; Steven J. Johnson | Year Built/Renovated: | 2012/N/A | ||||
| Size(8): | 68,613 SF | ||||||
| Mortgage Rate: | 4.2500% | Cut-off Date Balance per SF(1): | $2,084 | ||||
| Note Date: | 11/8/2017 | Maturity Date Balance per SF(1): | $2,084 | ||||
| First Payment Date: | 1/6/2018 | Property Manager: | BPS Management Services, LLC (borrower related) | ||||
| Maturity Date: | 12/6/2027 | ||||||
| Original Term to Maturity: | 120 months | ||||||
| Original Amortization Term: | 0 months | Underwriting and Financial Information | |||||
| IO Period: | 120 months | UW NOI: | $12,548,382 | ||||
| Seasoning: | 0 months | UW NOI Debt Yield(1): | 8.8% | ||||
| Prepayment Provisions(2): | LO (24); DEF (92); O (4) | UW NOI Debt Yield at Maturity(1): | 8.8% | ||||
| Lockbox/Cash Mgmt Status(3): | Hard/In Place | UW NCF DSCR(1): | 2.02x | ||||
| Additional Debt Type(1)(4): | Pari Passu | Most Recent NOI(9): | $12,028,866 (9/30/2017 TTM) | ||||
| Additional Debt Balance(1)(4): | $85,800,000 | 2nd Most Recent NOI(9): | $11,061,416 (12/31/2016) | ||||
| Future Debt Permitted (Type): | No (N/A) | 3rd Most Recent NOI: | $8,728,898 (12/31/2015) | ||||
| Reserves(5) | Most Recent Occupancy(8): | 100.0% (10/2/2017) | |||||
| Type | Initial | Monthly | Cap | 2nd Most Recent Occupancy: | 99.0% (12/31/2016) | ||
| RE Tax: | $56,250 | $18,750 | N/A | 3rd Most Recent Occupancy: | 96.1% (12/31/2015) | ||
| Insurance: | $133,000 | $11,083 | N/A | Appraised Value (as of): | $253,000,000 (6/28/2017) | ||
| Replacement: | $0 | $1,144 | N/A | Cut-off Date LTV Ratio(1): | 56.5% | ||
| TI/LC(6): | $0 | $8,333 | N/A | Maturity Date LTV Ratio(1): | 56.5% | ||
| Free Rent: | $333,333 | $0 | N/A | ||||
| Other(7): | $0 | Springing | $1,000,000 | ||||
| Sources and Uses | ||||||
| Sources | Proceeds | % of Total | Uses | Proceeds | % of Total | |
| Loan Amount(1): | $143,000,000 | 100.0% | Loan Payoff: | $137,605,253 | 96.2% | |
| Closing Costs(10): | $1,787,726 | 1.3% | ||||
| Reserves: | $522,583 | 0.4% | ||||
| Return of Equity: | $3,084,438 | 2.2% | ||||
| Total Sources: | $143,000,000 | 100.0% | Total Uses: | $143,000,000 | 100.0% | |
| (1) | The Harmon Corner Mortgage Loan (as defined below) is part of the Harmon Corner Whole Loan (as defined below), which is comprised of sixpari passu promissory notes with an aggregate original principal balance of $143,000,000. The Cut-off Date Balance per SF, Maturity Date Balance per SF, UW NOI Debt Yield, UW NOI Debt Yield at Maturity, UW NCF DSCR, Cut-off Date LTV Ratio and Maturity Date LTV Ratio presented above are based on the aggregate principal balance of the promissory notes comprising the Harmon Corner Whole Loan. |
| (2) | Defeasance is permitted at any time after the earlier of (i) the fourth anniversary of the first payment date of the Harmon Corner Whole Loan or (ii) two years from the closing date of the securitization of the last Harmon Corner Whole Loan promissory note to be securitized. The defeasance lockout period of 24 payments dates is based on the closing date of this transaction in December 2017. |
| (3) | Following origination of the Harmon Corner Whole Loan the borrower is required to (i) establish a cash management account and enter into an acceptable cash management agreement, (ii) establish a clearing account and enter into an acceptable clearing account agreement, and (iii) send tenant direction letters. |
| (4) | See “—The Mortgage Loan” and “—Additional Secured Indebtedness (not including trade debts)” below for further discussion of additional debt. |
| (5) | See “Escrows and Reserves” below for further discussion of reserve requirements. |
| (6) | The Harmon Corner Borrower (as defined below) is required to deposit $8,333 monthly into a TI/LC reserve for years 1-4 of the Harmon Corner Mortgage Loan. For years 5-10, the monthly deposit increases to $29,167. |
| (7) | In the event that any of Rainforest Café, Bubba Gump Shrimp Co. or Twin Peaks exercises its respective sales threshold termination option, the Harmon Corner Borrower will be required to deposit $83,333 per month with respect to each such tenant for the 12 months after the exercise of such termination option, subject to a cap of $1,000,000 for each such tenant. |
| (8) | The Harmon Corner Property (as defined below) also includes a 60’ high, 306’8” long LED display billboard sign attached to the side of the building. Size and Occupancy information does not include the signage. Size and Occupancy also exclude five kiosk spaces that do not have any net rentable area assigned as they occupy space within common areas. One of the five kiosk spaces is currently vacant. |
| (9) | The increase from 2nd Most Recent NOI to Most Recent NOI is primarily a result of three leases that were executed in late 2016 and the increase from Most Recent NOI to UW NOI is primarily a result of contractual rent steps being included and two leases that were executed in 2017. SeeRecent Leasing Summary below. |
| (10) | Closing Costs include a debt service reserve of $562,650. |
This is not a research report and was not prepared by any Underwriter’s research department. Please see additional important information and qualifications at the end of this Term Sheet. |
T-54
| MSC 2017-HR2 | Harmon Corner |
The Mortgage Loan.The fourth largest mortgage loan (the “Harmon Corner Mortgage Loan”) is part of a whole loan (the “Harmon Corner Whole Loan”), evidenced by sixpari passu promissory notes with an aggregate principal balance of $143,000,000, which was co-originated by Citi Real Estate Funding Inc. and Cantor Commercial Real Estate Lending, L.P (“CCRE”). The Harmon Corner Whole Loan is secured by a first priority mortgage encumbering the Harmon Corner Borrower’s fee interest in a mixed use, anchored retail building with a large digital LED billboard sign located at 3717 Las Vegas Boulevard South (the “Strip”) in Las Vegas, Nevada (the “Harmon Corner Property”). Notes A-5 and A-6, with original principal balances of $30,000,000 and $27,200,000, respectively, will be included in the MSC 2017-HR2 trust. Note A-1, with an original principal balance of $30,000,000 is currently held by CCRE, or an affiliate, and is expected to be contributed to the UBS 2017-C6 securitization transaction. Note A-3, with an original principal balance of $20,800,000, is currently held by CCRE, or an affiliate, and is expected to be contributed one or more future securitization transactions. Notes A-2 and A-4, with original principal balances of $25,000,000 and $10,000,000, respectively, were contributed to the CCUBS 2017-C1 securitization transaction. Notes A-1, A-2, A-3 and A-4, together, represent thepari passu companion loans (the “Harmon Corner Non-ServicedPari Passu Companion Loans”). The Harmon Corner Whole Loan will be serviced pursuant to the pooling and servicing agreement that governs the CCUBS 2017-C1 securitization until the securitization of the controlling Note A-1 (which is expected to be the UBS 2017-C6 securitization transaction), at which point it will be serviced pursuant to the pooling and servicing agreement for the securitization to which the controlling Note A-1 is contributed. See“Description of the Mortgage Pool—The Whole Loans—The Non-Serviced Pari Passu Whole Loans” and “Pooling and Servicing Agreement-Servicing of the Non-Serviced Mortgage Loans”in the Preliminary Prospectus. The Harmon Corner Property (excluding the LED display billboard) was previously securitized in the COMM 2012-CCRE5 and COMM 2013-LC6 transactions.
| Harmon Corner Whole Loan Summary | ||||
| Note(s) | Original Balance | Cut-off Date Balance | Note Holder | Controlling Piece |
| Harmon Corner Mortgage Loan | ||||
| A-5 & A-6 | $57,200,000 | $57,200,000 | MSC 2017-HR2 | No |
| Harmon Corner Non-ServicedPari Passu Companion Loans | ||||
| A-2 & A-4 | $35,000,000 | $35,000,000 | CCUBS 2017-C1 | No |
| A-1 | $30,000,000 | $30,000,000 | UBS 2017-C6(1) | Yes |
| A-3 | $20,800,000 | $20,800,000 | CCRE | No |
| Total | $143,000,000 | $143,000,000 | ||
| (1) | Expected to be contributed upon closing of the related securitization transaction. |
The Borrower and the Sponsors. The borrower, BPS Harmon, LLC, is a single-purpose Delaware limited liability company structured to be bankruptcy-remote, with two independent directors in its organizational structure (the “Harmon Corner Borrower”). The borrower sponsors of the Harmon Corner Borrower and the nonrecourse carve-out guarantors, jointly and severally, are Brett Torino, Paul Kanavos and Steven J. Johnson (the “Harmon Corner Borrower Sponsors”). W.P. Carey, Inc. (“W. P. Carey”) also owns a 15.0% equity interest in the Harmon Corner Borrower.
Brett Torino serves as the chief executive officer and president of Torino Companies. Brett Torino was a multifamily residential developer during the mid -1980s and 1990s across the southwest and over the last 20 years has turned his attention to the Las Vegas Strip, buying his first property in Las Vegas in 1995. Mr. Torino has participated in the development, construction and sale of commercial, residential and resort properties in California, Colorado, Nevada and Arizona.
Paul Kanavos has been the president of Circle Entertainment Inc. since August 20, 2007. Mr. Kanavos also founded Flag Luxury Property, LLC in 1996 and serves as its chief executive officer. Mr. Kanavos has developed Ritz-Carlton Hotels in South Beach, Coconut Grove and Jupiter as well as the St. Regis Resort Temenos Anguilla.
Steven J. Johnson is the principal of SJJ Development, LLC. Over the past 35 years, Mr. Johnson has developed in excess of 6.0 million SF of neighborhood shopping centers with a focus on real estate developments for retail tenants such as Walgreens, Barnes & Noble and Marshalls Department Stores. Mr. Johnson, together with a partner, has developed approximately 130 Walgreens locations throughout Arizona, New Mexico, Texas and Nevada including 27 in Las Vegas alone.
W.P. Carey Inc. is a publicly traded REIT (NYSE: WPC) that provides long-term sale-leaseback and build-to-suit financing for companies worldwide and manages an investment portfolio of approximately $13.2 billion as of September 2017. W.P. Carey is a large owner/manager of net lease assets. As of November 2017, the company reported a market capitalization of approximately $7.5 billion.
The Property. The Harmon Corner Property is located on the east side of the Strip at the intersection of Harmon Avenue in Las Vegas, Nevada. The Harmon Corner Property is located adjacent to Miracle Mile Shops at Planet Hollywood and directly across the Strip from the City Center and Cosmopolitan Hotel. The Harmon Corner Property consists of a 100.0% occupied, three-story retail building totaling 68,613 SF as well as a 60’ high, 306’8” long LED display billboard sign attached to the side of the building.
The Harmon Corner Property is part of a larger development consisting of a 110,185 SF retail center and an adjacent 156 space outdoor parking lot. The 19,900 SF ground floor portion of the Walgreens and the parking lot are excluded from the collateral for the Harmon Corner Mortgage Loan. The Walgreens ground floor is vertically subdivided from the rest of the parcel and is subject to a separate (but co-terminous) lease from the portion of the Walgreens included in the collateral. The Harmon Corner Property has the right to use such parking lot pursuant to a recorded declaration of covenants, restrictions and agreements, and such recorded declaration also obligates the Harmon Corner Borrower to (i) maintain casualty insurance on the larger retail center which includes the ground floor portion of the non-collateral Walgreens and (ii) restore such larger retail center (inclusive of the ground floor portion of the non-collateral Walgreens) in the event of a casualty. The entire Harmon Corner retail development was constructed by the Harmon Corner Borrower Sponsors in 2012 at a reported total cost basis of approximately $95.0 million.
As of October 2, 2017, the Harmon Corner Property was 100.0% occupied by 22 tenants, including 10 national tenants. The Harmon Corner Property includes five kiosk spaces that do not have any net rentable area assigned as they occupy space within common areas. One of the five kiosk spaces is currently vacant.
The three largest tenants at the Harmon Corner Property include Rainforest Café, Bubba Gump Shrimp Co. and Twin Peaks. All three of these tenants’ spaces are located adjacent to two pedestrian sky bridge entrances on the second floor. One sky bridge crosses over Harmon Avenue and the other sky
This is not a research report and was not prepared by any Underwriter’s research departments. Please see additional important information and qualifications at the end of this Term Sheet. |
T-55
| MSC 2017-HR2 | Harmon Corner |
bridge crosses over the Strip and connects with The Cosmopolitan Hotel and City Center to the west, The Mandarin Oriental, Vdara Hotel and Aria Resort & Casino. The remaining tenants at the Harmon Corner Property are a mix of restaurants, retail shops and specialized uses including a ticket retailer and souvenir shop.
National tenants, including Walgreens, Twin Peaks, Rainforest Café, Bubba Gump Shrimp Co., Taco Bell Cantina and McDonalds, collectively represent 68.9% of retail rental income and 88.2% of the net rentable area at the Harmon Corner Property.
Since 2014, total reported sales have grown from approximately $35.9 million to approximately $48.0 million as of September 2017, reflecting a compound annual growth rate of 12.3%. Sales at the Harmon Corner Property are approximately $756 PSF with the top five tenants collectively representing approximately $29.0 million of total sales.
Billboard Signage
The Harmon Corner Property features a digital LED display billboard sign, which measures 60’ in height and 306’8” in width. Constructed in 2012 and most recently renovated in October 2016, the billboard offers approximately 18,400 SF of surface area, which makes it the largest signage opportunity in Las Vegas.
The billboard is operated by Branded Cities Las Vegas, LLC (“Branded Cities”), a digital and media company operating over 2,000 billboards across North America. The Harmon Corner Borrower is party to a license agreement with Branded Cities with an initial term expiration date of July 16, 2022, which term is automatically extended to July 16, 2027 so long as Branded Cities is not in default under the terms of such license agreement. Branded Cities collects revenue on advertising contracts, deducts the commission and internal expenses and then issues an effective rent on a monthly basis to the Harmon Corner Borrower.
Top accounts as of year to date August 2017 for the billboard include Glaxo Smith Kline, Live Nation, Wynn and Taco Bell, which collectively account for approximately 35.0% of total revenue. The billboard sign had reported gross sales of $4,299,031 for 2016. As of year to date ending August 2017, the billboard sign had reported gross sales of approximately $4.1 million.
According to Branded Cities, the billboard achieves rates that are similar to properties in Times Square. According to the appraisal, the billboard’s occupancy rate is approximately 86.0%, which exceeds the industry average of 65.0%.
Major Tenants.
Rainforest Café(14,799 SF, 21.6% of NRA,11.2% of underwritten base rent). Rainforest Cafe is a rainforest-themed restaurant chain owned by Landry’s, Inc. of Houston. Each Rainforest Cafe restaurant is designed to depict some features of a tropical rainforest, including plant growth; mist; waterfalls; and animatronic animals. The first location opened in the Mall of America in Bloomington, Minnesota, on February 3, 1994. In 2000, the Rainforest Cafe was bought by Landry’s Restaurants Inc., a company specializing in dining, hospitality, entertainment, and gaming, based in Houston, Texas. Rainforest Café has 22 United States locations in 11 states as well as five international locations.
Rainforest Café executed a 10-year lease in August 2014 for space on the second and third floors at the Harmon Corner Property with a lease expiration of September 30, 2025 and three, five-year renewal options.
As of September 2017, Rainforest Café reported sales of $6.3 million for the trailing 12-month period.
The Rainforest Café lease includes a termination option exercisable any time upon 30 days’ notice in the event that gross sales for any calendar year do not exceed $10 million (or $8 million if the tenant has not opened on Sundays in the applicable year). The tenant is required to give notice within 60 days of the end of such calendar year and pay a termination fee equal to 12 months of future rent and unamortized tenant improvement and leasing commissions.
In addition to the termination payment, the Harmon Corner Whole Loan documents require a monthly cash flow sweep equal to $83,333 after the exercise of such notice, up to a cap of $1,000,000 ($67.57 PSF) or until such time the Harmon Corner Borrower re-leases the Rainforest Café space to a replacement tenant reasonably acceptable to lender.
Bubba Gump Shrimp Co. (12,794 SF, 18.6% of NRA, 12.1% of underwritten base rent).Bubba Gump Shrimp Co. is a chain of seafood restaurants which provides a casual dining environment. The first Bubba Gump Shrimp Co. restaurant and market opened in 1996 in Monterey, California and has since grown to 43 locations worldwide including Times Square New York, Universal City Walk Orlando, Victoria’s Peak Hong Kong, Santa Monica Pier, and Pier 39 in San Francisco. Bubba Gump Shrimp Co. is owned by Landry’s, which purchased Bubba Gump Shrimp Co. in 2010.
Bubba Gump Shrimp Co. has been a tenant at the Harmon Corner Property since December 2012. It has a lease expiration date of December 31, 2022 and three, five-year renewal options.
As of September 2017, Bubba Gump Shrimp Co. reported sales of $10.1 million for the trailing 12-month period.
The Bubba Gump Shrimp Co. lease includes a termination option exercisable at any time that gross sales for the trailing 12-month period do not exceed $10 million. The tenant is required to deliver notice within 60 days after such 12-month period and the lease will terminate upon the earlier of the (i) expiration of the 12th full calendar month after notice is given and (ii) the later of (x) the 48th full calendar month of the term and (y) the date that Bubba Gump Shrimp Co. vacates the premises. The tenant is required to pay a termination fee equal to 12 months of future rent or the number of months remaining in the term if there are less than 12 months remaining, which is reduced by the rent paid between the date that the landlord receives the notice and the date that the tenant vacates the premises.
In addition to the termination payment, the Harmon Corner Whole Loan documents require a monthly cash flow sweep equal to $83,333 after the exercise of such notice, up to a cap of $1,000,000 ($78.16 PSF) or until such time as the Harmon Corner Borrower re-leases the Bubba Gump Shrimp Co. space to a replacement tenant reasonably acceptable to the lender.
Twin Peaks(11,834 SF, 17.2% of NRA, 15.5% of underwritten base rent). Twin Peaks is a sports bar/restaurant chain serving comfort food across the southern United States. Twin Peaks initially opened two restaurants in Dallas in 2005 and has since expanded to 82 locations in 25 states and one location in Russia. The chain has 35 franchised stores and 45 company stores. Twin Peaks has a lease expiration date of March 31, 2023 and two, five-year renewal options.
This is not a research report and was not prepared by any Underwriter’s research department. Please see additional important information and qualifications at the end of this Term Sheet. |
T-56
| MSC 2017-HR2 | Harmon Corner |
As of September 2017, Twin Peaks reported sales of $11.3 million for the trailing 18-month period.
The Twin Peaks lease includes a termination option exercisable any time after October 1, 2017, in the event that gross sales for the trailing 18-month period do not exceed $12.0 million. The tenant is required to deliver notice within 60 days after such 18-month period and the lease will terminate upon the expiration of the 12th full calendar month after notice is given. The earliest effective date of such termination option would be October 1, 2018. In the event that Twin Peaks exercises such option, Twin Peaks is required to pay a termination payment equal to (i) the minimum base rent for the following 12 months after the termination effective date, plus (ii) the unamortized amount of the tenant improvement allowance and leasing commission paid by the Harmon Corner Borrower with respect to such lease, assuming annual straight-line amortization over the initial lease term.
In addition to the termination payment, the Harmon Corner Whole Loan documents require a monthly cash flow sweep equal to $83,333 after the exercise of such notice, up to a cap of $1,000,000 ($84.50 PSF) or until such time as the Harmon Corner Borrower re-leases the Twin Peaks space to a replacement tenant reasonably acceptable to the lender.
The following table presents certain information relating to the leases at the Harmon Corner Property by square feet:
| Tenant Summary(1) | |||||||
| Tenant Name | Credit Rating (Fitch/Moody’s/S&P) | Tenant SF | Approximate % of SF | Annual UW Base Rent | Annual UW Base Rent PSF | % of Total Annual UW Rent | Lease Expiration |
| Major Tenants | |||||||
| Rainforest Café | NR/NR/NR | 14,799 | 21.6% | $1,224,700 | $82.76 | 11.2% | 9/30/2025(2) |
| Bubba Gump Shrimp Co. | NR/NR/NR | 12,794 | 18.6% | $1,318,936 | $103.09 | 12.1% | 12/31/2022(3) |
| Twin Peaks | NR/NR/NR | 11,834 | 17.2% | $1,691,655 | $142.95 | 15.5% | 3/31/2023(4) |
| Subtotal/Wtd. Avg. | 39,427 | 57.5% | $4,235,291 | $107.42 | 38.7% | ||
| Other Tenants(5) | 29,186 | 42.5% | $6,701,143 | $229.60 | 61.3% | ||
| Vacant Space(5) | 0 | 0.0% | $0 | $0.00 | 0.0% | ||
| Total/Wtd. Avg. | 68,613 | 100.0% | $10,936,435 | $159.39 | 100.0% | ||
| (1) | Information is based on the underwritten rent roll dated October 2, 2017. Annual UW Base Rent includes rent steps through October 31, 2018. |
| (2) | Rainforest Café has three, five-year renewal options and an ongoing termination option, subject to a lease termination payment, if gross sales for any calendar year do not exceed $10.0 million (or $8 million if the tenant has not opened on Sundays in the applicable year). As of September 2017, Rainforest Café reported sales of $6.3 million for the trailing 12-month period. |
| (3) | Bubba Gump Shrimp Co. has three, five-year renewal options and an ongoing termination option, subject to a lease termination payment, if gross sales for any 12 months do not exceed $10.0 million. As of September 2017, Bubba Gump Shrimp Co. reported sales of $10.1 million for the trailing 12-month period. |
| (4) | Twin Peaks has two, five-year renewal options and an ongoing termination option, subject to a lease termination payment, if gross sales for any 18 months do not exceed $12.0 million. As of September 2017, Twin Peaks reported sales of $11.3 million for the trailing 18-month period. |
| (5) | Other Tenants includes five kiosk spaces that do not have any net rentable area assigned as they occupy space within common areas. One of the five kiosk spaces is currently vacant. The four occupied kiosk spaces represent approximately $681,000 of Annual UW Base Rent. |
The following table presents certain information relating to the most recent leasing at the Harmon Corner Property:
| Recent Leasing Summary(1) | |||||
| Tenant Name | Tenant SF | Annual UW Base Rent | Annual UW Base Rent PSF | Lease Start Date | Lease End Date |
| First Floor | |||||
| Taco Bell Cantina(2) | 4,046 | $428,917 | $106.01 | 11/14/2016 | 11/30/2026 |
| Second Floor | |||||
| Green Crush | 698 | $174,500 | $250.00 | 6/1/2017 | 5/30/2027 |
| Krispy Kreme | 1,920 | $384,000 | $200.00 | 10/11/2016 | 10/31/2026 |
| Popeye’s | 2,320 | $464,000 | $200.00 | 8/1/2016 | 7/31/2026 |
| Third Floor | |||||
| Rainforest Café | 14,799 | $1,224,700 | $82.76 | 9/2/2015 | 9/30/2025 |
| Total/Wtd. Avg. | 23,783 | $2,676,117 | $112.52 | ||
| (1) | Based on the underwritten rent roll dated October 2, 2017. |
| (2) | Taco Bell Cantina executed a lease for 3,338 SF which commenced on November 14, 2016 ($350,000 Annual UW Base Rent) and amended such lease for an additional 708 SF of expansion space ($78,917 Annual UW Base Rent) which commenced on September 1, 2017. The lease for the total 4,046 SF expires on November 30, 2026. |
This is not a research report and was not prepared by any Underwriter’s research department. Please see additional important information and qualifications at the end of this Term Sheet. |
T-57
| MSC 2017-HR2 | Harmon Corner |
The following table presents certain information relating to the lease rollover schedule at the Harmon Corner Property:
| Lease Rollover Schedule(1)(2) | ||||||||
| Year | # of Leases Rolling | SF Rolling | % of Total SF Rolling | Cumulative % of Total SF Rolling | Total UW Base Rent Rolling(3) | UW Base Rent PSF Rolling(3) | % of UW Base Rent Rolling | Cumulative % of UW Base Rent Rolling(3) |
| MTM | 0 | 0 | 0.0% | 0.0% | $0 | $0.00 | 0.0% | 0.0% |
| 2017(4) | 2 | 0 | 0.0% | 0.0% | $300,000 | $0.00 | 2.7% | 2.7% |
| 2018(4) | 1 | 0 | 0.0% | 0.0% | $156,000 | $0.00 | 1.4% | 4.2% |
| 2019 | 0 | 0 | 0.0% | 0.0% | $0 | $0.00 | 0.0% | 4.2% |
| 2020 | 0 | 0 | 0.0% | 0.0% | $0 | $0.00 | 0.0% | 4.2% |
| 2021 | 1 | 1,402 | 2.0% | 2.0% | $334,180 | $238.36 | 3.1% | 7.2% |
| 2022(4) | 10 | 24,469 | 35.7% | 37.7% | $4,375,538 | $178.82 | 40.0% | 47.2% |
| 2023 | 2 | 11,834 | 17.2% | 55.0% | $1,691,655 | $142.95 | 15.5% | 62.7% |
| 2024 | 3 | 3,092 | 4.5% | 59.5% | $922,945 | $298.49 | 8.4% | 71.1% |
| 2025 | 2 | 14,799 | 21.6% | 81.0% | $1,224,700 | $82.76 | 11.2% | 82.3% |
| 2026 | 4 | 8,286 | 12.1% | 93.1% | $1,276,917 | $154.11 | 11.7% | 94.0% |
| 2027 | 1 | 698 | 1.0% | 94.1% | $174,500 | $250.00 | 1.6% | 95.6% |
| 2028 & Beyond | 2 | 4,033 | 5.9% | 100.0% | $480,000 | $119.02 | 4.4% | 100.0% |
| Vacant | 0 | 0 | 0.0% | 100.0% | $0 | $0.00 | 0.0% | 100.0% |
| Total/Wtd. Avg. | 28 | 68,613 | 100.0% | $10,936,435 | $159.39 | 100.0% | ||
| (1) | Information is based on the underwritten rent roll dated October 2, 2017. |
| (2) | Certain tenants may have lease termination options that are exercisable prior to the originally stated expiration date of the subject lease and that are not considered in the lease rollover schedule. |
| (3) | Total UW Base Rent Rolling, UW Base Rent PSF Rolling and Cumulative % of UW Base Rent Rolling have been underwritten based on the rent roll. UW Base Rent includes five kiosk spaces that do not have any net rentable area assigned to it as it occupies space within common areas. One of the five kiosks is currently vacant. |
| (4) | Tenants expiring in 2017, 2018 and 2022 include four kiosk tenants, which do not have any rentable area assigned as they occupy space within common areas of the Harmon Corner Property. |
The Market. The Harmon Corner Property is located along the central portion of the Las Vegas Strip Resort Corridor, which consists of resort casino-hotels, business hotels, apartment complexes, commercial retail buildings, a super-regional mall and industrial buildings. The immediate area surrounding the Harmon Corner Property features The Shops at Crystal, Planet Hollywood Resort and Casino, the Bellagio Hotel and Casino and The Cosmopolitan of Las Vegas. The primary economic drivers in Las Vegas are tourism and gaming, which in turn, support the service industries, especially retail and dining.
Visitor volumes in the Las Vegas region have increased since the decline in 2008 and 2009. Visitors hit record numbers in 2014 (surpassing 40 million people for the first time) and have continued to increase, reaching a high of 42.9 million people in 2016. According to the appraisal, visitors stay an average of 3.4 nights per trip and spend, on average, $157 on shopping and $318 on dining and drinks.
According to the appraisal, vehicular traffic along the Strip averages approximately 63,000 per day, which equates to approximately 23.0 million per year. In addition, the appraisal estimated that pedestrian traffic counts along the Strip average 40,000 to 60,000 per day, which equates to approximately 20.0 million per year.
The appraisal concluded market rent for the first, second and third floor suite were $150, $220, and $100, respectively, which are in line with rents at the Harmon Corner Property.
The following table presents certain information relating to competitive properties for the Harmon Corner Property:
| Competitive Set(1) | ||||||
| Property Name | Distance from Harmon Corner | Year Built | Total NRA (SF) | Occupancy | Rent PSF | Sales PSF |
| Harmon Corner Property | - | 2012 | 68,613(2) | 100.0%(2) | $125.00 - $175.00 | $988.00(3) |
| Primary Competition | ||||||
| Miracle Mile Shops | Adjacent | 2000 | 494,000 | 94.0% | $80.00 - $100.00 | $850.00 |
| Hawaiian Marketplace | 0.2 miles | 1994 | 80,000 | 95.0% | $70.00 - $90.00 | NAV |
| The Showcase | 0.3 miles | 1997 | 347,281 | 96.0% | $70.00 - $100.00 | $525.00 |
| Secondary Competition | ||||||
| The Shops at Crystals | Adjacent | 2009 | 360,000 | 92.0% | $100.0 - $150.00 | $1,300.00 |
| Forum Shops at Caesars | 0.8 miles | 1992 | 650,000 | 100.0% | $125.00 - $150.00 | $1,500.00 |
| Grand Canal Shoppes | 1.0 miles | 1999 | 810,000 | 95.0% | $90.00 - $110.00 | $1,000.00 |
| Fashion Show Mall | 1.4 miles | 1981 | 1,875,400 | 95.0% | $75.00 - $100.00 | $835.00 |
| Mandalay Bay Place | 1.8 miles | 2003 | 90,000 | 95.0% | $70.00 - $90.00 | $525.00 |
| (1) | Source:Appraisal. |
| (2) | Based on the underwritten rent roll dated October 2, 2017. |
| (3) | Sales PSF for the Harmon Corner Property is based on comparable sales figures for the trailing 12-month period ending May 31, 2017. |
This is not a research report and was not prepared by any Underwriter’s research department. Please see additional important information and qualifications at the end of this Term Sheet. |
T-58
| MSC 2017-HR2 | Harmon Corner |
Operating History and Underwritten Net Cash Flow.The following table presents certain information relating to the historical operating performance and the Underwritten Net Cash Flow at the Harmon Corner Property:
| Cash Flow Analysis | ||||||
| 2014 | 2015 | 2016 | 9/30/2017 TTM | UW | UW PSF | |
| Gross Potential Rent(1) | $8,398,676 | $8,090,712 | $8,827,053 | $9,914,584 | $11,086,435 | $161.58 |
| Total Recoveries | $1,410,413 | $1,385,273 | $1,564,405 | $1,628,751 | $1,780,665 | $25.95 |
| Billboard Income | $1,871,381 | $1,599,519 | $2,891,023 | $3,005,780 | $3,005,780 | N/A |
| Other Income | $81,083 | $71,037 | $80,226 | $82,384 | $82,384 | $1.20 |
| Less Vacancy & Credit Loss(2) | $0 | $0 | $0 | $0 | ($570,072) | ($8.31) |
| Effective Gross Income | $11,761,553 | $11,146,541 | $13,362,707 | $14,631,499 | $15,385,192 | $224.23 |
| Total Operating Expenses | $2,400,392 | $2,417,643 | $2,301,291 | $2,602,633 | $2,836,810 | $41.35 |
| Net Operating Income(3) | $9,361,161 | $8,728,898 | $11,061,416 | $12,028,866 | $12,548,382 | $182.89 |
| Capital Expenditures | $0 | $0 | $0 | $0 | $13,723 | $0.20 |
| TI/LC | $0 | $0 | $0 | $0 | $102,920 | $1.50 |
| Net Cash Flow | $9,361,161 | $8,728,898 | $11,061,416 | $12,028,866 | $12,431,740 | $181.19 |
| Occupancy % | 97.2% | 96.1% | 99.0% | 100.0% | 96.4% | |
| NOI DSCR(4) | 1.52x | 1.42x | 1.80x | 1.95x | 2.04x | |
| NCF DSCR(4) | 1.52x | 1.42x | 1.80x | 1.95x | 2.02x | |
| NOI Debt Yield(4) | 6.5% | 6.1% | 7.7% | 8.4% | 8.8% | |
| NCF Debt Yield(4) | 6.5% | 6.1% | 7.7% | 8.4% | 8.7% | |
| (1) | UW Gross Potential Rent is based on the underwritten rent roll and includes rent steps ($271,625) through October 31, 2018. |
| (2) | UW Vacancy represents 4.4% of Gross Potential Rent and Total Recoveries, which is greater than the appraisal’s vacancy conclusion of 3.0%. |
| (3) | The increase from 2016 Net Operating Income to 9/30/2017 TTM Net Operating Income is primarily a result of three leases that were executed in late 2016 (representing $1,198,000 of UW Base Rent). The increase from 9/30/2017 TTM Net Operating Income to UW Net Operating Income is primarily a result of contractual rent steps being included in Gross Potential Rent and two leases that were executed in 2017 (representing $253,417 of UW Base Rent). See “Recent Leasing Summary” above for more detail on the recently executed leases at the Harmon Corner Property. |
| (4) | Debt service coverage ratios and debt yields are based on the Harmon Corner Whole Loan. |
Escrows and Reserves.The Harmon Corner Borrower deposited at origination of the Harmon Corner Whole Loan (i) $56,250 upfront in escrow for annual real estate taxes, (ii) $133,000 upfront in escrow for annual insurance premiums, and (iii) $333,333 upfront for free rent associated with the Rainforest Café through December 2018.
On each monthly payment date the Harmon Corner Borrower is required to pay to the lender (i) $1,144 for replacement reserves, (ii) $8,333 for tenant leasing expenses, through the monthly payment date in December 2021, and $29,167 for tenant leasing expenses beginning on the monthly payment date in January 2022 and on each monthly payment date thereafter, (iii) 1/12 of the annual estimated tax payments (initially estimated at $18,750), and (iv) 1/12 of the annual estimated insurance premiums (initially estimated at $11,083).
In addition to any termination payments collected by the Harmon Corner Borrower, in the event that any of Rainforest Café, Bubba Gump Shrimp Co. or Twin Peaks exercises its respective termination option, the Harmon Corner Borrower will be required to deposit $83,333 per month with respect to each such tenant for the 12 months after the exercise of such termination option until such time that (a) a lease with a replacement tenant is executed on terms reasonably acceptable to the lender or (b) $1,000,000 is accumulated in reserve payments from such deposits as described in this paragraph for the tenant in question. The $1,000,000 cap on collections applies separately to Rainforest Café, Bubba Gump Shrimp Co. and Twin Peaks.
Lockbox and Cash Management. The Harmon Corner Whole Loan is structured with a hard lockbox and in place cash management, each of which the borrower is required to put in place following origination, pursuant to the Harmon Corner Whole Loan documents. The Harmon Corner Borrower is required to send tenant direction letters to all tenants instructing them to deposit all rents and payments directly into the lockbox account controlled by the lender. The Harmon Corner Borrower and property manager are required to deposit any amounts received by them into the lockbox within two days of receipt. All funds in the lockbox account are required to be swept on each business day to a cash management account under the control of the lender and amounts in this account are required to be used to pay monthly debt service payments and any reserves due under the Harmon Corner Whole Loan documents with any excess amounts remaining in this account returned to the Harmon Corner Borrower in accordance with the Harmon Corner Whole Loan documents, except during the occurrence of (a) a Lease Sweep Period (as defined below), during which excess cash will be swept into a lender-controlled account or (b) any event of default, during which the lender may apply amounts in such order of priority as it may determine.
A “Lease Sweep Period” occurs if as of any monthly payment date, the gross potential rents from the Lease Sweep Leases (as defined below), when aggregated, exceed 20.0% of the gross potential rents of the Harmon Corner Property (exclusive of revenues attributable to the billboard sign). The Lease Sweep Period will end upon the earlier to occur of (i) $4,200,000 accumulating in the TI/LC reserve account, inclusive of amounts then in the account, or (ii) a Lease Sweep Tenant Leasing Event (as defined below) which results in the gross potential rents from the Lease Sweep Leases, when aggregated, falling below 20.0% of the gross potential rents of the Harmon Corner Property (exclusive of revenues attributable to the billboard sign).
A “Lease Sweep Lease” is, as of any given payment date, any lease that is due to expire or terminate within the 12-month period following such payment date (provided that any such lease will continue to be deemed a Lease Sweep Lease until such time as a Lease Sweep Tenant Leasing Event will have occurred with respect to such lease).
A “Lease Sweep Tenant Leasing Event” occurs if the lender is in receipt of evidence that a renewal or replacement tenant(s) satisfactory to the lender in its reasonable discretion and in accordance with the Harmon Corner Whole Loan documents has entered into a lease(s) for the space demised to the applicable tenant(s) causing such Lease Sweep Period.
This is not a research report and was not prepared by any Underwriter’s research department. Please see additional important information and qualifications at the end of this Term Sheet. |
T-59
| MSC 2017-HR2 | Harmon Corner |
Additional Secured Indebtedness (not including trade debts). The Harmon Corner Property also secures the Harmon Corner Non-ServicedPari Passu Companion Loans, which have an aggregate Cut-off Date principal balance of $85,800,000. The Harmon Corner Non-ServicedPari Passu Companion Loans accrue interest at the same rate as the Harmon Corner Mortgage Loan. The Harmon Corner Mortgage Loan is entitled to payments of interest on apro rataandpari passu basis with the Harmon Corner Non-ServicedPari Passu Companion Loans. The holders of the Harmon Corner Mortgage Loan and the Harmon Corner Non-ServicedPari PassuCompanion Loans have entered into a co-lender agreement which sets forth the allocation of collections on the Harmon Corner Whole Loan. See “Description of the Mortgage Pool—The Whole Loans” in the Preliminary Prospectus.
Mezzanine Loan and Preferred Equity. Not permitted.
Release of Property. Not permitted.
Terrorism Insurance.The Harmon Corner Whole Loan documents require “all risk” insurance / umbrella coverage in an amount equal to 100% of the full replacement cost and a commercial general liability insurance policy with a limit of not less than $2,000,000 in the aggregate. Terrorism coverage is required, which may be included in the property insurance policy or a stand-alone policy covering terrorist acts. The Harmon Corner Whole Loan documents require rental loss and/or business interruption insurance for eighteen months following a casualty plus up to six months of extended indemnity. See “Risk Factors—Risks Relating to the Mortgage Loans—Terrorism Insurance May Not Be Available for All Mortgaged Properties” in the Preliminary Prospectus.
This is not a research report and was not prepared by any Underwriter’s research department. Please see additional important information and qualifications at the end of this Term Sheet. |
T-60
(THIS PAGE INTENTIONALLY LEFT BLANK)
This is not a research report and was not prepared by any Underwriter’s research department. Please see additional important information and qualifications at the end of this Term Sheet. |
T-61
| MSC 2017-HR2 | Totowa Commons |
Mortgage Loan No. 5 – Totowa Commons
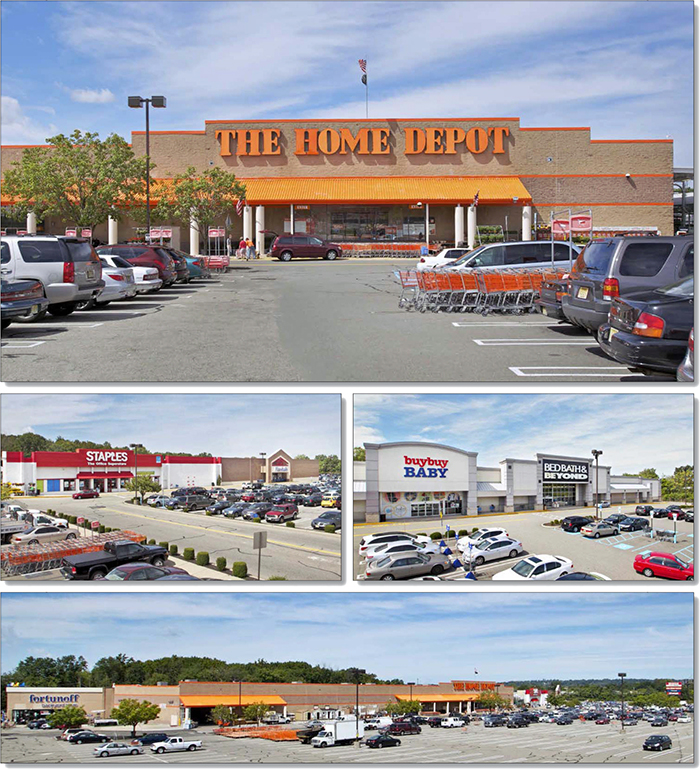
This is not a research report and was not prepared by any Underwriter’s research department. Please see additional important information and qualifications at the end of this Term Sheet. |
T-62
| MSC 2017-HR2 | Totowa Commons |
Mortgage Loan No. 5 – Totowa Commons
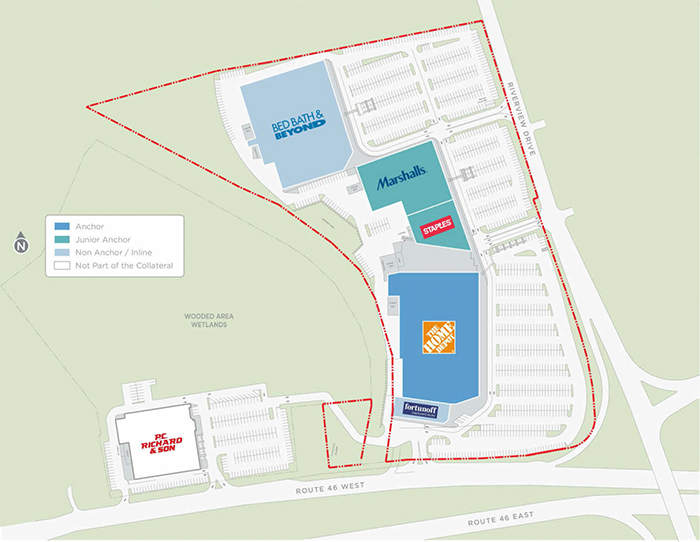
This is not a research report and was not prepared by any Underwriter’s research department. Please see additional important information and qualifications at the end of this Term Sheet. |
T-63
| MSC 2017-HR2 | Totowa Commons |
Mortgage Loan No. 5 – Totowa Commons
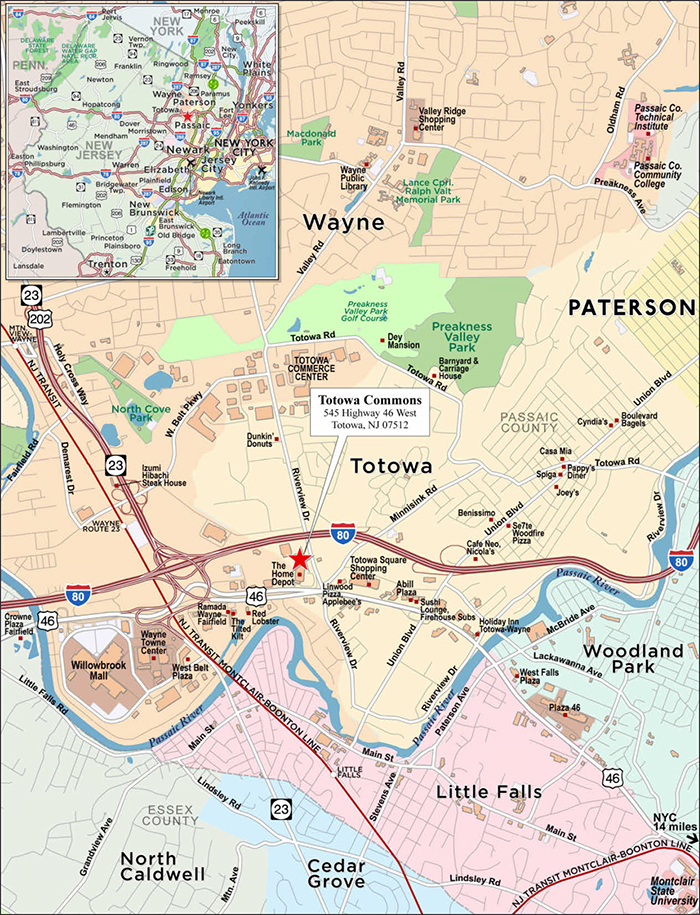
This is not a research report and was not prepared by any Underwriter’s research department. Please see additional important information and qualifications at the end of this Term Sheet. |
T-64
| MSC 2017-HR2 | Totowa Commons |
| Mortgage Loan No. 5 – Totowa Commons |
| Mortgage Loan Information | Mortgaged Property Information | ||||||
| Mortgage Loan Seller: | MSMCH | Single Asset/Portfolio: | Single Asset | ||||
| Original Balance: | $50,800,000 | Location: | Totowa, NJ 07512 | ||||
| Cut-off Date Balance: | $50,800,000 | General Property Type: | Retail | ||||
| % of Initial Pool Balance: | 5.4% | Detailed Property Type: | Anchored | ||||
| Loan Purpose: | Refinance | Title Vesting: | Fee | ||||
| Sponsor: | Urban Edge Properties | Year Built/Renovated: | 1980/N/A | ||||
| Mortgage Rate: | 4.3250% | Size: | 271,488 SF | ||||
| Note Date: | 11/15/2017 | Cut-off Date Balance PSF: | $187 | ||||
| First Payment Date: | 1/1/2018 | Maturity Date Balance PSF: | $187 | ||||
| Maturity Date: | 12/1/2027 | Property Manager: | UE Property Management LLC (borrower related) | ||||
| Original Term to Maturity: | 120 months | ||||||
| Original Amortization Term: | 0 months | Underwriting and Financial Information | |||||
| IO Period: | 120 months | UW NOI: | $4,296,607 | ||||
| Seasoning: | 0 months | UW NOI Debt Yield: | 8.5% | ||||
| Prepayment Provisions: | LO (24); DEF (89); O (7) | UW NOI Debt Yield at Maturity: | 8.5% | ||||
| Lockbox/Cash Mgmt Status: | Springing/Springing | UW NCF DSCR: | 1.82x | ||||
| Additional Debt Type: | N/A | Most Recent NOI: | $4,513,124 (9/30/2017 TTM) | ||||
| Additional Debt Balance: | N/A | 2nd Most Recent NOI: | $4,478,176 (12/31/2016) | ||||
| Future Debt Permitted (Type): | No (N/A) | 3rd Most Recent NOI: | $4,414,706 (12/31/2015) | ||||
| Reserves(1) | Most Recent Occupancy: | 100.0% (9/30/2017) | |||||
| Type | Initial | Monthly | Cap | 2nd Most Recent Occupancy: | 100.0% (12/31/2016) | ||
| RE Tax: | $0 | Springing | N/A | 3rd Most Recent Occupancy: | 100.0% (12/31/2015) | ||
| Insurance: | $0 | Springing | N/A | Appraised Value (as of): | $88,700,000 (10/10/2017) | ||
| Recurring Replacements: | $0 | $3,394 | N/A | Cut-off Date LTV Ratio: | 57.3% | ||
| TI/LC: | $0 | Springing | $325,000 | Maturity Date LTV Ratio: | 57.3% | ||
| Repair Reserve: | $57,595 | $0 | N/A | ||||
Sources and Uses
| |||||||
| Sources | Proceeds | % of Total | Uses | Proceeds | % of Total | ||
| Loan Amount: | $50,800,000 | 100.0% | Loan Payoff: | $21,674,237 | 42.7% | ||
| Closing Costs: | $746,607 | 1.5% | |||||
| Reserves: | $57,595 | 0.1% | |||||
| Return of Equity: | $28,321,561 | 55.8% | |||||
| Total Sources: | $50,800,000 | 100.0% | Total Uses: | $50,800,000 | 100.0% | ||
| (1) | See “—Escrows and Reserves” below for further discussion of reserve requirements. |
The Mortgage Loan.The fifth largest mortgage loan (the “Totowa Commons Mortgage Loan”) is evidenced by a promissory note in the original principal amount of $50,800,000 and secured by a first priority fee mortgage encumbering an anchored retail property in Totowa, New Jersey (the “Totowa Commons Property”). Proceeds of the Totowa Commons Mortgage Loan were primarily used to refinance the previous loan secured by the Totowa Commons Property, fund upfront reserves, pay closing costs and return equity to the Totowa Commons Borrower. The Totowa Commons Property was previously securitized in the VNO 2010-VNO transaction.
The Borrower and the Sponsor. The borrower is Totowa UE LLC (the “Totowa Commons Borrower”), a single-purpose New Jersey limited liability company, with two independent directors in its organizational structure. The Totowa Commons Borrower is 100.0% indirectly owned by Urban Edge Properties LP, which is in turn 89.9% owned by Urban Edge Properties. Urban Edge Properties is the borrower sponsor and Urban Edge Properties LP is the non-recourse carveout guarantor.
Urban Edge Properties is a real estate investment trust that acquires, develops, owns, manages and improves shopping centers in and on the edge of urban communities. Its portfolio comprises 16.7 million SF in 90 properties and it manages over 5.0 million SF for others. Urban Edge Properties’ core assets are concentrated in the Washington, D.C. to Boston corridor.
The Property.The Totowa Commons Property is a 271,488 SF anchored retail community center located in Totowa, New Jersey, approximately ten miles west of Midtown Manhattan, New York City. Built in 1980, the Totowa Commons Property is comprised of three buildings on 23.47 acres and contains a total of 1,122 parking spaces (4.13 spaces per 1,000 SF of NRA).
As of September 30, 2017, the Totowa Commons Property was 100.0% leased by four national tenants and one regional tenant, all of which have exercised at least one renewal option. As of November 15, 2017, the weighted average length of occupancy at the Totowa Commons Property was 18.5 years. Home Depot has served as an anchor tenant at the Totowa Commons Property since 1995 and accounts for 37.4% of NRA and 40.1% of underwritten rent. Home Depot reported sales at the Totowa Commons Property for fiscal year ending January 2015, 2016, and 2017 of approximately
This is not a research report and was not prepared by any Underwriter’s research department. Please see additional important information and qualifications at the end of this Term Sheet. |
T-65
| MSC 2017-HR2 | Totowa Commons |
$59.5 million ($586 PSF), approximately $61.3 million ($603 PSF), and approximately $62.5 million ($616 PSF), respectively. Total sales at the Totowa Commons Property have increased by 4.3% between the most recent reported annual sales and 2015.
Major Tenants.
Home Depot (101,546 SF, 37.4% of NRA, 40.1% ofunderwritten rent). Home Depot, a tenant at the Totowa Commons Property since 1995, is part of a home improvement chain with over 400,000 employees at more than 2,200 stores within the United States, Canada and Mexico. Home Depot has a lease expiration of April 30, 2020 and has one five-year renewal option. Home Depot reported sales at the Totowa Commons Property for fiscal year ending July 2015, 2016, and 2017 of approximately $59.5 million ($586 PSF), approximately $61.3 million ($603 PSF), and approximately $62.5 million ($616 PSF), respectively. According to the annual report of Home Depot’s parent company, The Home Depot Inc., The Home Depot Inc.’s national average store sales were approximately $391 PSF for fiscal year ending January 2017.
Bed, Bath & Beyond(93,613 SF, 34.5% of NRA, 20.8% of underwritten rent). Bed, Bath & Beyond, a ground tenant at the Totowa Commons Property since 2002, is a domestic merchandise and home furnishings chain with approximately 1,530 stores across the United States, Puerto Rico, Canada and Mexico. Bed, Bath & Beyond has extended its lease once, has a lease expiration of November 30, 2023 and has one five-year renewal option. In March 2002, Bed Bath & Beyond entered into a sublease agreement with Buy Buy Baby, a subsidiary of Bed Bath & Beyond, to lease 33,809 SF (12.5% of NRA) at the Totowa Commons Property, at the same rent as under the prime lease, with an initial expiration date of November 2013. Since then, Buy Buy Baby exercised its first option to extend its lease through November 30, 2023. Buy Buy Baby is a chain of stores that sells clothing, strollers and other items for use with infants and young children. Bed, Bath & Beyond and Buy Buy Baby reported combined sales at the Totowa Commons Property for fiscal year ending November 2014, 2015, and 2016 of approximately $25.3 million ($270 PSF), approximately $24.2 million ($259 PSF), and approximately $23.4 million ($250 PSF), respectively.
Marshalls(45,125 SF, 16.6% of NRA, 18.7% of underwritten rent).Marshalls, a tenant at the Totowa Commons Property since 2004, is an off-price family retailer that is a subsidiary of TJ Maxx. TJ Maxx, through its subsidiaries, has more than 3,800 stores in nine countries across three continents. Marshalls has extended its lease three times, most recently in April 2017. Marshalls has a lease expiration of March 31, 2022 and has one five-year renewal option. Marshalls reported sales at the Totowa Commons Property for fiscal year ending January 2015, 2016, and 2017 of approximately $17.7 million ($391 PSF), approximately $18.2 million ($403 PSF), and approximately $19.1 million ($424 PSF), respectively.
Staples(20,538 SF, 7.6% of NRA, 12.4% of underwritten rent).Staples, a tenant at the Totowa Commons Property since 1988, is an office supply chain with more than 1,900 stores within the United States, Canada, the United Kingdom, Australia, Brazil and presence in multiple European countries. Staples has extended its lease two times, and has a lease expiration of March 31, 2023 with no remaining renewal options. Staples reported sales at the Totowa Commons Property for fiscal year ending January 2015, 2016, and 2017 of approximately $5.4 million ($263 PSF), approximately $5.4 million ($262 PSF), and approximately $6.1 million ($298 PSF), respectively.
The following table presents a summary regarding the largest tenants at the Totowa Commons Property:
| Tenant Summary(1) | ||||||||||
| Tenant Name | Credit Rating (Fitch/Moody’s/S&P)(2) | Tenant SF | Approx. % of SF | Annual UW Rent | Annual UW Rent PSF(3) | % of Annual UW Rent |
Most Recent Sales | Occ. Cost %(4) | Lease Expiration | |
| $ | PSF | |||||||||
| Major Tenants | ||||||||||
| Home Depot | A/A2/A | 101,546 | 37.4% | $1,898,910 | $18.70 | 40.1% | $62,519,063 | $616 | 3.0% | 4/30/2020 |
| Bed, Bath & Beyond | NR/Baa1/BBB | 93,613 | 34.5% | $986,120 | $10.53 | 20.8% | $23,420,029 | $250 | 4.2% | 11/30/2023 |
| Marshalls | NR/A2/A+ | 45,125 | 16.6% | $886,655 | $19.65 | 18.7% | $19,126,778 | $424 | 4.6% | 3/31/2022 |
| Staples | NR/B3/B+ | 20,538 | 7.6% | $587,798 | $28.62 | 12.4% | $6,127,844 | $298 | 9.6% | 3/31/2023 |
| Fortunoff Backyard | NR/NR/NR | 10,666 | 3.9% | $378,643 | $35.50 | 8.0% | $4,661,686 | $437 | 8.1% | 2/29/2020 |
| Total/Wtd. Avg. | 271,488 | 100.0% | $4,738,126 | $17.45 | 100.0% | $115,855,400 | $427 | 4.1% | ||
| (1) | Information is based on the underwritten rent roll as of September 30, 2017. |
| (2) | Certain ratings are those of the parent company whether or not the parent guarantees the lease. |
| (3) | Wtd. Avg. Annual UW Rent PSF excludes vacant space. |
| (4) | Occ. Cost % is based on the underwritten rent as of the September 30, 2017 rent roll divided by most recently reported sales. |
This is not a research report and was not prepared by any Underwriter’s research department. Please see additional important information and qualifications at the end of this Term Sheet. |
T-66
| MSC 2017-HR2 | Totowa Commons |
The following table presents certain information relating to the lease rollover at Totowa Commons Property:
| Lease Rollover Schedule(1)(2) | ||||||||
| Year | # of Leases Rolling | SF Rolling | Approx. % of Total SF Rolling | Approx. Cumulative % of SF Rolling | Total UW Rent Rolling | Annual UW Rent PSF Rolling | Approx. % of Total Rent Rolling | Approx. Cumulative % of Total Rent Rolling |
| MTM | 0 | 0 | 0.0% | 0.0% | $0 | $0.00 | 0.0% | 0.0% |
| 2017 | 0 | 0 | 0.0% | 0.0% | $0 | $0.00 | 0.0% | 0.0% |
| 2018 | 0 | 0 | 0.0% | 0.0% | $0 | $0.00 | 0.0% | 0.0% |
| 2019 | 0 | 0 | 0.0% | 0.0% | $0 | $0.00 | 0.0% | 0.0% |
| 2020 | 2 | 112,212 | 41.3% | 41.3% | $2,277,553 | $20.30 | 48.1% | 48.1% |
| 2021 | 0 | 0 | 0.0% | 41.3% | $0 | $0.00 | 0.0% | 48.1% |
| 2022 | 1 | 45,125 | 16.6% | 58.0% | $886,655 | $19.65 | 18.7% | 66.8% |
| 2023 | 2 | 114,151 | 42.0% | 100.0% | $1,573,918 | $13.79 | 33.2% | 100.0% |
| 2024 | 0 | 0 | 0.0% | 100.0% | $0 | $0.00 | 0.0% | 100.0% |
| 2025 | 0 | 0 | 0.0% | 100.0% | $0 | $0.00 | 0.0% | 100.0% |
| 2026 | 0 | 0 | 0.0% | 100.0% | $0 | $0.00 | 0.0% | 100.0% |
| 2027 | 0 | 0 | 0.0% | 100.0% | $0 | $0.00 | 0.0% | 100.0% |
| 2028 & Beyond | 0 | 0 | 0.0% | 100.0% | $0 | $0.00 | 0.0% | 100.0% |
| Vacant | 0 | 0 | 0.0% | 100.0% | $0 | $0.00 | 0.0% | 100.0% |
| Total/Wtd. Avg. | 5 | 271,488 | 100.0% | $4,738,126 | $17.45(3) | 100.0% | ||
| (1) | Information is based on the underwritten rent roll as of September 30, 2017. |
| (2) | Certain tenants may have lease termination options that are exercisable prior to the stated expiration date of the subject lease or leases which are not considered in the lease rollover schedule. |
| (3) | Total/Wtd. Avg. Annual UW Rent PSF Rolling excludes vacant space. |
The Market. The Totowa Commons Property is located in the Passaic County retail submarket of the Northern New Jersey retail market. According to the appraisal, as of the second quarter of 2017, the vacancy rate in the Northern New Jersey retail market was approximately 8.6% with average asking rents of $29.42 PSF. As of the second quarter of 2017, the vacancy rate in the Passaic County retail submarket was approximately 11.7% with average asking rents of $32.05 PSF. According to the appraisal, both the Northern New Jersey retail market and the Passaic County retail submarket have seen steady increases in asking rents PSF since 2011. The Passaic County retail submarket is made up of 3,464,000 SF, 16,000 SF of which has been built since 2010.
According to the appraisal, the 2017 estimated population within a one-, three- and five-mile radius of the Totowa Commons Property is 4,555, 87,757 and 345,652, respectively. The 2017 estimated average household income within a one-, three- and five-mile radius of the Totowa Commons Property is $103,044, $114,935 and $102,005, respectively.
The following table presents recent leasing data at comparable retail properties with respect to the Totowa Commons Property:
| Comparable Lease Summary | |||||||
Property Name / Address City. State | Tenant | Lease Area (SF) | Lease Date | Base Rent PSF | Lease Term (Yrs.) | Reimbursements | |
West Falls Plaza Woodland Park, NJ | andThat! | 64,793 | Sep 2017 | $20.00 | 9.3 | NNN | |
471 Prospect Ave West Orange, NJ | LA Fitness | 48,200 | Apr 2016 | $28.00 | 15.0 | NNN | |
132-194 Passaic Avenue Kearny, NJ | BJ’s Wholesale Club | 87,788 | Aug 2015 | $17.00 | 20.0 | NNN | |
Paramus Towne Square Paramus, NJ | Golf Galaxy | 46,458 | Apr 2014 | $31.00 | 15.0 | NNN | |
Roxbury Mall Succasunna, NJ | Petco | 17,000 | Jan 2017 | $26.94 | 12.0 | NNN | |
Union 22 Plaza Union, NJ | TJ Maxx | 30,380 | Dec 2016 | $18.00 | 10.0 | NNN | |
Union 22 Plaza Union, NJ | Home Goods | 24,620 | Dec 2016 | $18.00 | 10.0 | NNN | |
South Paramus Plaza Paramus, NJ | Ashley Furniture | 18,340 | Oct 2016 | $20.00 | 15.0 | NNN | |
Columbia Park North Bergen, NJ | Party City | 16,723 | Aug 2016 | $24.95 | 10.0 | NNN | |
Source: Appraisal
This is not a research report and was not prepared by any Underwriter’s research department. Please see additional important information and qualifications at the end of this Term Sheet. |
T-67
| MSC 2017-HR2 | Totowa Commons |
Operating History and Underwritten Net Cash Flow. The following table presents certain information relating to the historical operating performance and the Underwritten Net Cash Flow at the Totowa Commons Property:
| Cash Flow Analysis | |||||||
| 2014 | 2015 | 2016 | 9/30/2017 TTM | UW | UW PSF | ||
| Base Rent | $4,415,485 | $4,572,224 | $4,645,009 | $4,673,034 | $4,692,531(1) | $17.28 | |
| Total Recoveries | $1,763,828 | $1,846,619 | $1,802,543 | $1,804,587 | $1,777,073 | $6.55 | |
| Less Vacancy | $0 | $0 | $0 | $0 | ($194,088) | ($0.71) | |
| Effective Gross Income | $6,179,313 | $6,418,843 | $6,447,552 | $6,477,621 | $6,275,516 | $23.12 | |
| Total Expenses | $1,872,100 | $2,004,137 | $1,969,376 | $1,964,496 | $1,978,908 | $7.29 | |
| Net Operating Income | $4,307,213 | $4,414,706 | $4,478,176 | $4,513,124 | $4,296,607 | $15.83 | |
| Capital Expenditures | $0 | $0 | $0 | $0 | $40,723 | $0.15 | |
| TI/LC | $0 | $0 | $0 | $0 | $200,901 | $0.74 | |
| Net Cash Flow | $4,307,213 | $4,414,706 | $4,478,176 | $4,513,124 | $4,054,983 | $14.94 | |
| Occupancy % | 100.0% | 100.0% | 100.0% | 100.0% | 97.0% | ||
| NOI DSCR | 1.93x | 1.98x | 2.01x | 2.03x | 1.93x | ||
| NCF DSCR | 1.93x | 1.98x | 2.01x | 2.03x | 1.82x | ||
| NOI Debt Yield | 8.5% | 8.7% | 8.8% | 8.9% | 8.5% | ||
| NCF Debt Yield | 8.5% | 8.7% | 8.8% | 8.9% | 8.0% | ||
| (1) | UW Base Rent is based on the rent roll dated September 30, 2017 and includes a rent step for Staples, as to which base rent increases by $53,399 in April 2018. Staples escalated rent is greater than 110.0% of the market rent as determined by the appraiser. Accordingly, a mark-to-market adjustment was applied to Staples totaling $45,595, representing the difference between its escalated rent and 110.0% of the appraiser’s market rent. |
Escrows and Reserves. At origination, the Totowa Commons Borrower deposited $57,595 with lender for immediate repairs.
The Totowa Commons Borrower is required to make monthly deposits of $13,575 for tenant improvements and leasing commissions (“TI/LC”) reserves and $3,394 for replacement reserves. The Totowa Commons Borrower will not be required to deposit the TI/LC monthly deposit if the amount then on deposit in the TI/LC reserve exceeds $325,000. The Totowa Commons Borrower is required to deposit monthly into escrow 1/12 of the annual estimated real estate tax payments and 1/12 of the annual estimated insurance premiums unless (i) no Cash Sweep Event Period (as defined below) is continuing and (ii) the lender is provided with reasonably satisfactory written evidence that such taxes or insurance premiums have been timely paid. In addition, the Totowa Commons Borrower’s obligation to make monthly deposits into the insurance escrow will be suspended so long as an acceptable blanket insurance policy is in place.
In lieu of depositing amounts into any reserve, the Totowa Commons Borrower is permitted to deposit a letter of credit meeting the requirements of the loan documents, or a guaranty from the non-recourse carve-out guarantor, Urban Edge Properties LP; provided that such guarantor has a senior unsecured credit rating of at least Baa3 from Moody’s Investors Service, Inc. and BBB from Standard & Poor’s Ratings Services, and maintains a net worth equal to at least $100,000,000 (including amounts available under undrawn lines of credit); provided that if such guaranty or all letters of credit in the aggregate exceed 10% of the outstanding principal balance of the Totowa Commons Mortgage Loan, the Totowa Commons Borrower’s right to provide any such guaranty is conditioned upon delivery of a non-consolidation opinion reasonably satisfactory to the lender addressing such guaranty.
Lockbox and Cash Management. The Totowa Commons Mortgage Loan has a springing hard lockbox and springing cash management. Upon the first occurrence of a Cash Sweep Event Period, the Totowa Commons Borrower is required to establish a lender-controlled lockbox account and direct all tenants to pay rents directly into such lockbox account and the lender has the right to establish, and the Totowa Commons Borrower is required to cooperate with a cash management bank to establish, a lender-controlled cash management account. Following the establishment of such accounts, if no Cash Sweep Event Period exists, all funds in the lockbox account are required to be disbursed to the Totowa Commons Borrower’s operating account. If a Cash Sweep Event Period exists, funds in the lockbox account are required to be swept to the cash management account, and, provided no event of default is continuing, applied on each monthly payment date to pay debt service on the Totowa Commons Mortgage Loan, to fund required reserve deposits as described above under “Escrows and Reserves,” to pay operating expenses set forth in the annual budget (which is required to be approved by the lender during a Cash Sweep Event Period) and extraordinary expenses approved by the lender, to deposit, if a Major Tenant Event exists, all remaining cash flow into the TI/LC reserve subaccount until an amount equal to $15 PSF of the space leased to the applicable Major Tenant has been deposited, and thereafter, to the extent (i) a Cash Sweep Event Period exists other than due to a Major Tenant Event, to deposit any remaining cash flow to an account to be held by the lender as additional security for the Totowa Commons Mortgage Loan during the continuance of such Cash Sweep Event Period or (ii) if the Cash Sweep Event Period exists solely due to a Major Tenant Event, to disburse any remaining cash flow to the Totowa Commons Borrower.
A “Cash Sweep Event Period” will commence upon the occurrence of (a) an event of default, (b) the debt service coverage ratio (assuming a 30 year amortization schedule) is less than 1.20x for six consecutive calendar months (a “DSCR Event”), and/or (c) a Major Tenant Event.
A “Major Tenant Event” means (i) a Major Tenant has filed for bankruptcy or become the subject of a bankruptcy filing, (ii) a Major Tenant Lease Expiration Event, or (iii) a Major Tenant has vacated or “gone dark”.
A “Major Tenant Lease Expiration Event” means the date (i) which is a specified number of months (11 months for Home Depot, 6 months for Marshalls, 18 months for Bed Bath & Beyond, and 12 months for any replacement tenant) prior to the expiration of a Major Tenant’s lease unless such Major Tenant has renewed or extended its lease pursuant to its terms or on terms acceptable to the lender; (ii) any Major Tenant gives notice to vacate or not to renew its lease; (iii) any Major Tenant exercises any termination option under its lease; or (iv) any Major Tenant cancels or terminates its lease.
A “Major Tenant” means Home Depot, Marshalls, Bed Bath & Beyond (including its subtenant Buy Buy Baby of Totowa, Inc.) and any replacement tenant occupying more than 40,000 SF pursuant to a replacement lease.
This is not a research report and was not prepared by any Underwriter’s research department. Please see additional important information and qualifications at the end of this Term Sheet. |
T-68
| MSC 2017-HR2 | Totowa Commons |
A Cash Sweep Event Period will terminate if (1) no event of default exists; (2) in the case of a DSCR Event, (a) the debt service coverage ratio (assuming a 30-year amortization schedule) is equal to or greater than 1.20x for the immediately preceding six consecutive calendar months or (b) the Totowa Commons Borrower either (i) after the lockout period expiration date but prior to the open period effectuates a partial defeasance in the minimum amount sufficient to obtain a debt service coverage ratio (assuming a 30 year amortization schedule) of at least 1.20x (the “DSCR Cure Amount”), (ii) during the open period, partially prepays the loan in the DSCR Cure Amount, or (iii) deposits cash or a letter of credit with the lender in the DSCR Cure Amount, (3) in the case of a Major Tenant Lease Expiration Event, either (a) the Major Tenant renews or extends its lease and the lender receives a reasonably acceptable estoppel or letter from the Major Tenant stating that the Major Tenant is in occupancy of the entirety of its space, open for business and paying full contractual rent or (b) the entirety of the Major Tenant’s space has been re-let to one or more replacement tenant(s) reasonably acceptable to the lender pursuant to one or more replacement lease(s) and the lender receives a reasonably acceptable estoppel or letter from each replacement tenant(s) that such replacement tenant(s) is/are in occupancy for its/their space, open for business and paying full contractual rent (a “Major Tenant Replacement Cure”), (4) in the event a Major Tenant has filed for bankruptcy or become the subject of a bankruptcy filing, either (a) the Major Tenant’s lease has been affirmed in bankruptcy and the lender receives a reasonably acceptable estoppel or letter stating that the Major Tenant is in occupancy of the entirety of its space, open for business and paying full contractual rent, or (b) there is a Major Tenant Replacement Cure, (5) in the case of a Major Tenant that has vacated or “gone dark”, either (a) the Major Tenant is in occupancy of the entirety of its space and lender receives a reasonably acceptable estoppel or letter stating that the Major Tenant is in occupancy of its space, open for business and paying full contractual rent or (b) there is a Major Tenant Replacement Cure, or (6) in the case of any Major Tenant Event, the amount of excess cash flow deposited into the TI/LC reserve (as a result of the Major Tenant Event) equals $15 PSF of the space leased to the applicable Major Tenant.
If the Totowa Commons Borrower delivers cash or a letter of credit in the DSCR Cure Amount to cure a DSCR event, such cash or letter of credit is required to be released to the Totowa Commons Borrower at any time that the debt service coverage ratio (assuming a 30-year amortization schedule) is equal to or greater than 1.20x for the immediately preceding six consecutive calendar months.
Additional Secured Indebtedness (not including trade debts). Not permitted.
Mezzanine Loan and Preferred Equity. Not permitted.
Release of Property. Not permitted.
Terrorism Insurance. The Totowa Commons Borrower is required to obtain property insurance covering perils of terrorism and acts of terrorism in an amount equal to 100% of replacement cost, together with eighteen months of business income insurance, to the extent such policies are commercially available. Notwithstanding the foregoing, for so long as the Terrorism Risk Insurance Act of 2002 (as extended and modified by the Terrorism Risk Insurance Program Reauthorization Act of 2015) is in effect (or any extension thereof or other federal government program with substantially similar protection), the lender is required to accept terrorism insurance which covers “covered acts” (as defined by such statute or other program), as full compliance as it relates to the risks required to be covered pursuant to the preceding sentence, so long as such statute or other program covers both domestic and foreign acts of terrorism. See “Risk Factors—Risks Relating to the Mortgage Loans—Terrorism Insurance May Not Be Available for All Mortgaged Properties” in the Preliminary Prospectus.
This is not a research report and was not prepared by any Underwriter’s research department. Please see additional important information and qualifications at the end of this Term Sheet. |
T-69
| MSC 2017-HR2 | 150 West Jefferson |
Mortgage Loan No. 6 – 150 West Jefferson

This is not a research report and was not prepared by any Underwriter’s research department. Please see additional important information and qualifications at the end of this Term Sheet. |
T-70
| MSC 2017-HR2 | 150 West Jefferson |
Mortgage Loan No. 6 – 150 West Jefferson

This is not a research report and was not prepared by any Underwriter’s research department. Please see additional important information and qualifications at the end of this Term Sheet. |
T-71
| MSC 2017-HR2 | 150 West Jefferson |
Mortgage Loan No. 6 – 150 West Jefferson

This is not a research report and was not prepared by any Underwriter’s research department. Please see additional important information and qualifications at the end of this Term Sheet. |
T-72
| MSC 2017-HR2 | 150 West Jefferson |
| Mortgage Loan No. 6 – 150 West Jefferson |
| Mortgage Loan Information | Property Information | ||||||
| Mortgage Loan Seller: | SMF III | Single Asset/Portfolio: | Single Asset | ||||
| Original Balance(1): | $35,000,000 | Location: | Detroit, MI 48226 | ||||
| Cut-off Date Balance(1): | $35,000,000 | General Property Type: | Office | ||||
| % of Initial Pool Balance: | 3.7% | Detailed Property Type: | CBD | ||||
| Loan Purpose: | Refinance | Title Vesting: | Fee | ||||
| Sponsor: | REDICO Properties LLC | Year Built/Renovated: | 1989/N/A | ||||
| Mortgage Rate: | 4.6030% | Size: | 489,786 SF | ||||
| Note Date: | 11/8/2017 | Cut-off Date Balance PSF(1): | $138 | ||||
| First Payment Date: | 1/6/2018 | Maturity Date or ARD Balance PSF(1): | $127 | ||||
| Anticipated Repayment Date(2): | 12/6/2027 | Property Manager: | REDICO Management, Inc. (borrower related) | ||||
| Maturity Date(2): | 12/6/2029 | ||||||
| Original Term to Maturity or ARD(2): | 120 months | ||||||
| Original Amortization Term: | 360 months | Underwriting and Financial Information | |||||
| IO Period: | 60 months | UW NOI(6): | $8,150,842 | ||||
| Seasoning: | 0 months | UW NOI Debt Yield(1): | 12.1% | ||||
| Prepayment Provisions(3): | LO (24); DEF (92); O (4) | UW NOI Debt Yield at Maturity or ARD(1): | 13.2% | ||||
| Lockbox/Cash Mgmt Status: | Hard/Springing | UW NCF DSCR(1): | 1.75x | ||||
| Additional Debt Type(1)(4): | Pari Passu | Most Recent NOI(6)(7): | $6,960,158 (8/31/2017 TTM) | ||||
| Additional Debt Balance(1)(4): | $32,500,000 | 2nd Most Recent NOI(7)(8): | $3,969,150 (12/31/2015) | ||||
| Future Debt Permitted (Type): | No (N/A) | 3rd Most Recent NOI(7): | $4,015,577 (12/31/2014) | ||||
| Reserves(5) | Most Recent Occupancy(7): | 93.7% (10/1/2017) | |||||
| Type | Initial | Monthly | Cap | 2nd Most Recent Occupancy(7): | 88.3% (12/31/2016) | ||
| RE Tax: | $211,608 | $147,803 | N/A | 3rd Most Recent Occupancy(7): | 81.9% (12/31/2015) | ||
| Insurance: | $25,723 | $6,431 | N/A | Appraised Value (as of): | $103,000,000 (8/22/2017) | ||
| Recurring Replacements: | $0 | $8,164 | N/A | Cut-off Date LTV Ratio(1): | 65.5% | ||
| TI/LC: | $0 | $40,816 | $2,250,000 | Maturity Date or ARD LTV Ratio(1): | 60.2% | ||
| Outstanding TI Reserve: | $847,672 | $0 | N/A | ||||
| Sources and Uses | ||||||
| Sources | Proceeds | % of Total | Uses | Proceeds | % of Total | |
| Loan Amount(1): | $67,500,000 | 100.0% | Loan Payoff: | $52,665,246 | 78.0% | |
| Return of Equity: | $11,659,128 | 17.3% | ||||
| Closing Costs: | $2,090,623 | 3.1% | ||||
| Reserves: | $1,085,003 | 1.6% | ||||
| Total Sources: | $67,500,000 | 100.0% | Total Uses: | $67,500,000 | 100.0% | |
| (1) | The 150 West Jefferson Mortgage Loan (as defined below) is part of the 150 West Jefferson Whole Loan (as defined below), which is comprised of twopari passu promissory notes with an aggregate principal balance of $67,500,000. The Cut-off Date Balance PSF, Maturity Date or ARD Balance PSF, UW NOI Debt Yield, UW NOI Debt Yield at Maturity or ARD, UW NCF DSCR, Cut-off Date LTV Ratio and Maturity Date or ARD LTV Ratio numbers presented above are based on the aggregate principal balance of the promissory notes comprising the 150 West Jefferson Whole Loan. |
| (2) | Interest on the 150 West Jefferson Whole Loan accrues at an interest rate of 4.6030% per annum (the “Initial Interest Rate”) through the anticipated repayment date (the “ARD”) of December 6, 2027. After the ARD, if the 150 West Jefferson Whole Loan remains outstanding, (a) all excess cash flow with respect to the 150 West Jefferson Property is required to be applied to repay the 150 West Jefferson Whole Loan and (b) the 150 West Jefferson Whole Loan will accrue interest at an interest rate equal to the sum of (x) the Initial Interest Rate plus (y) 3.0000% (the “Extended Term Interest Rate”) through the final maturity date of December 6, 2029, with all interest accrued at the excess of the Extended Term Interest Rate over the Initial Interest Rate deferred and due and payable with the repayment of the 150 West Jefferson Whole Loan in full. |
| (3) | Defeasance of the 150 West Jefferson Whole Loan is permitted any time after the earlier of (i) November 8, 2020 and (ii) two years from the closing date of the securitization that includes the lastpari passunote of the 150 West Jefferson Whole Loan to be securitized. The assumed lockout period of 24 payments is based on the closing date of this transaction in December 2017. |
| (4) | See “The Mortgage Loan”and“Additional Secured Indebtedness (not including trade debts)”,for further discussion of additional debt. |
| (5) | See “Escrows and Reserves” below for further discussion of reserve requirements. |
| (6) | The increase in NOI from Most Recent NOI to UW NOI is driven primarily by new leases signed in 2017 totaling 31,103 square feet and $803,938 in underwritten base rent, as well as approximately $188,756 in rent steps. |
| (7) | During 2013 and 2015, two of the top four tenants, Miller Canfield and Butzel Long, downsized their respective spaces resulting in higher vacancy at the 150 West Jefferson Property. Butzel Long contracted from 101,147 SF to 48,669 SF, effective July 2013, in conjunction with the execution of its 11th lease amendment. The space made available on the 11th floor was later absorbed by Lochbridge (10.0% NRA; 10.7% underwritten base rent) under a lease signed in September 2014 (with a commencement date in March 2015) and Plunkett Cooney, PC (2.7% NRA; 3.0% underwritten base rent) in its November 2015 lease (with a commencement date in February 2016). Miller Canfield contracted from 109,261 SF to 69,974 SF effective July 2015. In June 2015, 20,789 SF of the related vacant area on the 21st floor were leased to Jones Day (4.2% NRA; 5.1% underwritten base rent), with a commencement date in October 2015. In 2015, Amazon expanded by an additional 24,357 SF, adding approximately $629,000 in underwritten base rent. Within the last twelve months, Amazon has expanded and JAMS has moved to the 150 West Jefferson Property. Combined, the JAMS and Amazon expansion spaces account for 6.8% of the underwritten base rent and approximately $712,000 of additional underwritten base rent. Additionally, due to increases in occupancy and better revenue management, the borrower sponsor has been able to increase parking revenue from $1.55 million to $1.85 million from 2015 to the 8/31/2017 TTM. |
| (8) | Full year NOI for 2016 is unavailable due to the borrower sponsor acquiring the property in July 2016. |
This is not a research report and was not prepared by any Underwriter’s research department. Please see additional important information and qualifications at the end of this Term Sheet. |
T-73
| MSC 2017-HR2 | 150 West Jefferson |
The Mortgage Loan. The sixth largest mortgage loan (the “150 West Jefferson Mortgage Loan”) is part of a whole loan (the “150 West Jefferson Whole Loan”) evidenced by twopari passu promissory notes in the aggregate original principal amount of $67,500,000, both of which are secured by a first priority fee mortgage encumbering an office property located in Detroit, Michigan (the “150 West Jefferson Property”). Promissory Note A-1, in the original principal amount of $35,000,000 represents the 150 West Jefferson Mortgage Loan and will be included in the MSC 2017-HR2 securitization trust. Promissory Note A-2 in the original principal amount of $32,500,000 (the “150 West Jefferson ServicedPari Passu Companion Loan”) represents the non-controlling interest in the 150 West Jefferson Whole Loan and is expected to be contributed to the WFCM 2017-C42 securitization transaction, which is expected to close on December 21, 2017. The 150 West Jefferson Whole Loan will be serviced pursuant to the pooling and servicing agreement for the MSC 2017-HR2 trust. See “Description of the Mortgage Pool—The Whole Loans—The Serviced Pari Passu Whole Loans” and “Pooling and Servicing Agreement” in the Preliminary Prospectus.
The Borrower and the Sponsor.The borrower is 150 West Jefferson Owner LLC (the “150 West Jefferson Borrower”), a single-purpose Delaware limited liability company with two independent directors. The loan sponsor and non-recourse carveout guarantor is REDICO Properties LLC (“REDICO”). REDICO is a national real estate development, design, construction, property management and leasing company founded five decades ago and is headquartered in Southfield, Michigan. REDICO is an owner-operator of large-scale mixed-use and office developments located throughout the United States and has owned and operated a portfolio of more than 16 million SF, including the ground-up development of the One Kennedy Building in Detroit’s CBD, which it continues to own. REDICO’s current real estate portfolio encompasses approximately 5.6 million SF across multiple property types, the majority of which is managed by an affiliate, REDICO Management, Inc.
The Property. The 150 West Jefferson Property consists of a 489,786 SF Class A office building located in Detroit, Michigan at 150 West Jefferson Avenue. Serving as the main thoroughfare between the central business district (“CBD”) and the waterfront, Jefferson Avenue has direct access to the Detroit regional highway network, including the Lodge Freeway and the Detroit-Windsor Tunnel. Downtown Detroit is generally bounded by the Fisher Freeway (Interstate 75) to the north, the Detroit River to the south, the Lodge Freeway (Route 10) to the west and the Chrysler Freeway (Interstate 375) to the east. Constructed in 1989, the 150 West Jefferson Property sits on a 1.53-acre site within the Detroit CBD. Standing 25 stories tall, the 150 West Jefferson Property offers Class A office space with water and city views, and a location near Detroit’s waterfront. The 150 West Jefferson Property includes an attached six-level parking garage (526 spaces, 1.07 per 1000 SF) (the “150 West Jefferson Parking Garage”), 24-hour manned security, and tenant amenities including three restaurants, a sundries shop, a fitness center, an outdoor terrace with putting green and a Detroit People Mover station attached to the building. Tenancy at the 150 West Jefferson Property is comprised of both national and regional tenants.
The 150 West Jefferson Property is leased to 19 tenants across a diverse spectrum of industries, including marketing, automobile, technology, legal and financial industries. As of October 1, 2017, the 150 West Jefferson Property was 93.7% leased.
Major Tenants.
Miller Canfield Paddock Stone (69,974 SF, 14.3% of NRA, 16.3% of underwritten base rent). Miller Canfield Paddock Stone (“Miller Canfield”) is a large American law firm with its headquarters at the 150 West Jefferson Property, and has always been based in Detroit. As of 2017, the firm has international offices in Canada, Mexico, China, and Poland, as well as Michigan, Florida, New York and Illinois. Miller Canfield is an original tenant at the 150 West Jefferson Property, had an original lease commencement date in January 1989 and most recently renewed in July 2015. Miller Canfield has one ten-year or two five-year lease renewal options.
Starcom (62,273 SF, 12.7% of NRA, 14.8% of underwritten base rent). Starcom is a Chicago based media network firm with over 8,000 employees nationally and 110 offices worldwide. The 150 West Jefferson Property houses Starcom’s GM Planworks and DigitaLBi, a group founded in 2000 and dedicated to buying and planning General Motors media campaigns. Starcom is a subsidiary of the Paris, France based Publicis Groupe, a large international advertising agency. In 2016, Publicis Groupe’s two largest Detroit-area agencies, DigitaLBi and Leo Burnett, formed a single unit called Engage M-1 (named for the main highway in Detroit) dedicated to General Motors accounts, with both firms retaining their respective offices and staff. In early 2017, General Motors announced that after an extended review, it was retaining Engage M-1 for future marketing efforts of its GMC brand. Starcom had an original lease commencement date in September 2000 and most recently renewed in June 2010. Starcom has the right to terminate its lease should it no longer be retained by General Motors by providing 12 months’ notice and payment of all unamortized leasing costs and three months’ of total rent in accordance with its lease.
Amazon (57,636 SF, 11.8% of NRA, 14.0% of underwritten base rent). Amazon is an American electronic commerce and cloud computing company, a large internet retailer. Amazon had an original lease commencement date in August 2013 and most recently renewed in July 2017. Amazon has two five-year lease renewal options. Amazon has a one-time right to terminate 16,706 SF on its second floor space only effective September 30, 2021 with nine months’ notice and payment of a termination fee.
Lochbridge (48,915 SF, 10.0% of NRA, 10.7% of underwritten base rent). Lochbridge is a tech-service integration firm building custom tech platforms for large businesses and organizations and is known as a provider of automotive connectivity services and solutions. Los Angeles-based Marlin Equity Partners purchased Lochbridge from Compuware Corporation in January 2014, and then spun it out as a separate company. Lochbridge had an original lease commencement date in March 2015. Lochbridge has two seven-year lease renewal options. Lochbridge has agreed to sublease approximately 40,930 SF to Amazon (which sublease has not yet been signed) with a sublease rent commencement seven months after delivery of its leased space at a rate of $19.75 per SF with $0.50 per SF rent steps and an expiration date of February 29, 2024. The 150 West Jefferson Borrower anticipates rent commencement in the third quarter of 2018. Lochbridge has a one-time right to terminate its lease effective February 29, 2023 with 12 months’ notice and a termination fee equal to approximately $2,263,564.
Butzel Long (48,669 SF, 9.9% of NRA, 11.0% of underwritten base rent). Butzel Long is headquartered at the 150 West Jefferson Property and has 155 attorneys throughout Michigan, New York and Washington, D.C. Butzel Long is an original tenant at the 150 West Jefferson Property and has been in occupancy since February 1990. Butzel Long most recently renewed its lease in August 2010. Butzel Long has two five-year renewal options.
This is not a research report and was not prepared by any Underwriter’s research department. Please see additional important information and qualifications at the end of this Term Sheet. |
T-74
| MSC 2017-HR2 | 150 West Jefferson |
The following table presents a summary regarding major tenants at 150 West Jefferson Property:
| Tenant Summary(1) | |||||||
| Tenant Name | Credit Rating (Fitch/Moody’s/S&P)(2) | Tenant SF | Approximate % of SF | Annual UW Rent | % of Total Annual UW Rent | Annual UW Rent PSF(3) | Lease Expiration |
| Major Tenants | |||||||
| Miller Canfield | NR/NR/NR | 69,974 | 14.3% | $1,714,363 | 16.3% | $24.50 | 6/30/2026(4) |
| Starcom | NR/NR/NR | 62,273 | 12.7% | $1,552,976 | 14.8% | $24.94 | 5/31/2020(5) |
| Amazon | NR/Baa1/AA- | 57,636 | 11.8% | $1,466,663 | 14.0% | $25.45 | 10/31/2024(6) |
| Lochbridge(7) | NR/NR/NR | 48,915 | 10.0% | $1,125,045 | 10.7% | $23.00 | 2/28/2027(8) |
| Butzel Long | NR/NR/NR | 48,669 | 9.9% | $1,158,322 | 11.0% | $23.80 | 7/31/2022(9) |
| Subtotal/Wtd. Avg. | 287,467 | 58.7% | $7,017,370 | 66.8% | $24.41 | ||
| Other Tenants | 171,566 | 35.0% | $3,492,533 | 33.2% | $20.36 | ||
| Vacant Space | 30,753 | 6.3% | $0 | 0.0% | $0.00 | ||
| Total/Wtd. Avg. | 489,786 | 100.0% | $10,509,903 | 100.0% | $22.90 | ||
| (1) | Information is based on the underwritten rent roll dated October 1, 2017. |
| (2) | Certain ratings are those of the parent company whether or not the parent guarantees the lease. |
| (3) | Annual UW Rent PSF figures exclude vacant space. |
| (4) | Miller Canfield has one ten-year or two five-year lease renewal options. |
| (5) | Starcom has the right to terminate its lease should it no longer be retained by General Motors by providing 12 months’ notice and payment of all unamortized leasing costs and three months of total rent in accordance with its lease. |
| (6) | Amazon has two five-year lease renewal options. Amazon has a one-time right to terminate 16,706 SF on its second floor space only effective September 30, 2021 with nine months’ notice and payment of a termination fee. |
| (7) | Lochbridge has agreed to sublease approximately 40,930 SF to Amazon (which sublease has not yet been signed) with a sublease rent commencement seven months after delivery of the leased space at a rate of $19.75 PSF with $0.50 PSF rent steps and an expiration date of February 29, 2024. The 150 West Jefferson Borrower expects rent commencement in the third quarter of 2018. |
| (8) | Lochbridge has two seven-year lease renewal options. Lochbridge has a one-time right to terminate its lease effective February 28, 2023 with 12 months’ notice and a termination fee equal to approximately $2,263,564. |
| (9) | Butzel Long has two five-year lease renewal options. |
The following table presents certain information relating to the lease rollover schedule at 150 West Jefferson Property:
| Lease Rollover Schedule(1)(2) | ||||||||
| Year | # of Leases Rolling | SF Rolling | UW Rent PSF Rolling(2) | Approx. % of Total SF Rolling | Approx. Cumulative % of SF Rolling | Total UW Rent Rolling(2) | Approx. % of Total Rent Rolling | Approx. Cumulative % of Total Rent Rolling |
| MTM | 0 | 0 | $0.00 | 0.0% | 0.0% | $0 | 0.0% | 0.0% |
| 2017 | 0 | 0 | $0.00 | 0.0% | 0.0% | $0 | 0.0% | 0.0% |
| 2018 | 0 | 0 | $0.00 | 0.0% | 0.0% | $0 | 0.0% | 0.0% |
| 2019 | 2 | 17,058 | $19.67 | 3.5% | 3.5% | $335,598 | 3.2% | 3.2% |
| 2020 | 4 | 111,368 | $19.66 | 22.7% | 26.2% | $2,189,447 | 20.8% | 24.0% |
| 2021 | 2 | 40,443 | $24.83 | 8.3% | 34.5% | $1,004,351 | 9.6% | 33.6% |
| 2022(3) | 3 | 70,961 | $23.49 | 14.5% | 49.0% | $1,666,810 | 15.9% | 49.4% |
| 2023 | 2 | 19,165 | $26.14 | 3.9% | 52.9% | $500,964 | 4.8% | 54.2% |
| 2024 | 3 | 64,664 | $25.13 | 13.2% | 66.1% | $1,624,798 | 15.5% | 69.7% |
| 2025(4) | 1 | 1,256 | $0.00 | 0.3% | 66.3% | $0 | 0.0% | 69.7% |
| 2026 | 2 | 83,082 | $24.42 | 17.0% | 83.3% | $2,028,955 | 19.3% | 89.0% |
| 2027 | 2 | 51,036 | $22.71 | 10.4% | 93.7% | $1,158,981 | 11.0% | 100.0% |
| 2028 & Beyond | 0 | 0 | $0.00 | 0.0% | 93.7% | $0 | 0.0% | 100.0% |
| Vacant | 0 | 30,753 | $0.00 | 6.3% | 100.0% | $0 | 0.0% | 100.0% |
| Total/Wtd. Avg. | 21 | 489,786 | $22.90 | 100.0% | $10,509,903 | 100.0% | ||
| (1) | Information is based on the underwritten rent roll dated October 1, 2017. |
| (2) | Certain tenants may have lease termination options that are exercisable prior to the originally stated expiration date of the subject lease and that are not considered in the lease rollover schedule |
| (3) | Includes a 2,306 SF management office. |
| (4) | Includes a fitness center. |
The Market. The 150 West Jefferson Property is located in the Detroit CBD submarket of the Detroit market. According to the appraisal, as of August 2017, the Detroit CBD submarket had approximately 7.4 million SF of Class A office inventory, average asking rents of $24.46 PSF and a vacancy rate of 6.7%. Additionally, the 2017 estimated population within a one-mile radius of the 150 West Jefferson Property was 7,355, while the 2017 estimated median household income within the same radius is $34,866. Within the city of Detroit, the 2017 estimated population was 658,250, while the 2017 estimated median household income within Detroit is $27,134.
This is not a research report and was not prepared by any Underwriter’s research department. Please see additional important information and qualifications at the end of this Term Sheet. |
T-75
| MSC 2017-HR2 | 150 West Jefferson |
The following table presents rental comparables with respect to the 150 West Jefferson Property as identified in the appraisal:
| Comparable Rentals Summary | ||||||||
| Property Name/Location | Year Built | Occupancy | Tenant Name | Lease Size (SF) | Lease Date | Lease Term (Yrs.) | Rent PSF | Lease Type |
One Campus Martius Detroit, MI | 2003 | 100% | Microsoft | 43,119 | Dec-17 | 7.7 | $25.75 | Modified Gross |
One Kennedy Square Detroit, MI | 2006 | 100% | Ernst & Young | 37,277 | Oct-16 | 10.0 | $16.75 | Triple Net |
One Detroit Center Detroit, MI | 1992 | 96% | Ally | 316,997 | Apr-16 | 5.0 | $22.00 | Modified Gross |
First National Building Detroit, MI | 1921 | 99% | Honigman Miller
| 150,786 | Apr-15 | 10.7 | $22.73
| Modified Gross
|
Source:Appraisal.
Operating History and Underwritten Net Cash Flow. The following table presents certain information relating to the historical operating performance and Underwritten Net Cash Flow at the 150 West Jefferson Property:
| Cash Flow Analysis(1) | ||||||
| 2013 | 2014 | 2015 | 8/31/2017 TTM | UW | UW PSF | |
| Base Rent(2) | $5,404,731 | $5,987,498 | $6,499,196 | $9,423,459 | $11,251,290 | $22.97 |
| Total Recoveries | $2,090,290 | $1,641,442 | $936,312 | $720,220 | $802,479 | $1.64 |
| Tenant Bill Backs | $855,519 | $829,270 | $796,137 | $906,522 | $906,522 | $1.85 |
| Parking Income | $1,296,270 | $1,390,874 | $1,552,876 | $1,850,046 | $1,850,046 | $3.78 |
| Other Income(3) | $92,924 | $50,143 | $81,017 | $208,695 | $208,695 | $0.43 |
| Less Vacancy & Credit Loss | $0 | $0 | $0 | $0 | ($800,190) | ($1.63) |
| Effective Gross Income | $9,739,734 | $9,899,227 | $9,865,538 | $13,108,942 | $14,218,842 | $29.03 |
| Total Operating Expenses | $5,721,970 | $5,883,650 | $5,896,388 | $6,148,784 | $6,068,000 | $12.39 |
| Net Operating Income | $4,017,764 | $4,015,577 | $3,969,150 | $6,960,158 | $8,150,842 | $16.64 |
| Capital Expenditures | $0 | $0 | $0 | $0 | $97,957 | $0.20 |
| TI/LC | $0 | $0 | $0 | $0 | $797,463 | $1.63 |
| Net Cash Flow | $4,017,764 | $4,015,577 | $3,969,150 | $6,960,158 | $7,255,421 | $14.81 |
| Occupancy %(4) | 69.4% | 84.2% | 81.9% | 93.7% | 93.8% | |
| NOI DSCR(5) | 0.97x | 0.97x | 0.96x | 1.68x | 1.96x | |
| NCF DSCR(5) | 0.97x | 0.97x | 0.96x | 1.68x | 1.75x | |
| NOI Debt Yield(5) | 6.0% | 5.9% | 5.9% | 10.3% | 12.1% | |
| NCF Debt Yield(5) | 6.0% | 5.9% | 5.9% | 10.3% | 10.7% | |
| (1) | Full year NOI for 2016 is unavailable due to the borrower sponsor acquiring the property in July 2016. |
| (2) | During 2013 and 2015, two of the top four tenants, Miller Canfield and Butzel Long, downsized their respective spaces resulting in higher vacancy at the 150 West Jefferson Property. Butzel Long contracted from 101,147 SF to 48,669 SF effective July 2013 in conjunction with the execution of its 11th lease amendment. The space made available on the 11th floor was later absorbed by Lochbridge (10.0% NRA; 10.7% UW Base Rent) under a lease signed in September 2014 (with a commencement date in March 2015) and Plunkett Cooney, PC (2.7% NRA; 3.0% UW Base Rent) in its November 2015 lease (with a commencement date in February 2016). Miller Canfield contracted from 109,261 SF to 69,974 SF effective July 2015. In June 2015, 20,789 SF of the related vacant area on the 21st floor were leased to Jones Day (4.2% NRA; 5.1% UW Base Rent, with a commencement date in October 2015. In 2015, Amazon expanded by an additional 24,357 SF, adding approximately $629,000 in underwritten base rent. Within the last twelve months, Amazon has expanded and JAMS has moved to the 150 West Jefferson Property. Combined, the JAMS and Amazon expansion spaces account for 6.8% of the underwritten base rent and approximately $712,000 of additional underwritten base rent. Additionally, due to increases in occupancy and better revenue management, the borrower sponsor has been able to increase parking revenue from $1.55 million to $1.85 million from 2015 to the 8/31/2017 TTM. Additionally, the increase in Base Rent from 8/31/2017 TTM Base Rent to UW Base Rent is driven primarily by new leases signed in 2017 totaling 31,103 square feet and $803,938 in UW Base Rent, as well as approximately $188,756 in rent steps. |
| (3) | Other Income includes antenna income, storage income and other ancillary charges. |
| (4) | Occupancy % for 2013, 2014 and 2015 represents occupancy as of December 31 for each respective year. 8/31/2017 TTM Occupancy % equates to physical occupancy as of October 1, 2017. UW Occupancy % is based on underwritten economic occupancy. |
| (5) | Debt service coverage ratios and debt yields are based on the 150 West Jefferson Whole Loan. |
Escrows and Reserves. The 150 West Jefferson Whole Loan documents provide for upfront escrows in the amount of $211,608 for real estate taxes, $25,723 for insurance premiums and $847,672 for outstanding tenant improvements related to Amazon, Anita’s Kitchen and Auto Club. The loan documents also provide for ongoing monthly escrow deposits of $147,803 for real estate taxes, $6,431 for insurance premiums, $8,164 for replacement reserves and $40,816 for TI/LC reserves (subject to a cap of $2,250,000 so long as no Rollover Trigger Event (as defined below) exists).
Following the occurrence and during the continuance of a Rollover Trigger Event, the borrower is required to make monthly deposits of $81,632 (approximately $2.00 per SF annually) for TI/LCs and ongoing TI/LC collections will be uncapped. The borrower is also required to deposit into the TI/LC reserve any lease termination fees related to Miller Canfield or Lochbridge at the 150 West Jefferson Property.
A “Rollover Trigger Event” means that either of the tenants known as Miller Canfield or Lochbridge (i) files bankruptcy, (ii) goes into default under its lease, (iii) gives notice to terminate or terminates its lease, (iv) fails to extend the term of its lease for space at the 150 West Jefferson Property prior to the deadline for the exercise of such extension option or (v) otherwise fails to renew its lease on terms reasonably acceptable to the lender at least nine months prior to its lease maturity if no renewal options exist.
This is not a research report and was not prepared by any Underwriter’s research department. Please see additional important information and qualifications at the end of this Term Sheet. |
T-76
| MSC 2017-HR2 | 150 West Jefferson |
Such Rollover Trigger Event shall terminate: with regard to clause (i), (1) upon the lender’s receipt of evidence in form and substance reasonably satisfactory to the lender that the related lease has been irrevocably assumed by the related tenant in such proceeding and the related tenant is in occupancy of at least 85.0% of the space demised under its lease and is paying the full, unabated contract rent without offset or credit as evidenced by one or more estoppel letters acceptable to the lender or (2) the assignment to, and assumption by, an assignee reasonably acceptable to the lender of the related tenant’s lease pursuant to a final court order issued in the applicable bankruptcy action, with such assignee occupying at least 85.0% of the space demised under such tenant’s lease and paying full, unabated post-petition rent without offset or credit as evidenced by one or more estoppel letters acceptable to the lender; with regard to clause (ii), upon the related tenant curing such default; with regard to clause (iii), the date on which (X) solely with respect to a Rollover Trigger Event relating to Lochbridge, the Lochbridge termination payment is made and such deposit is in the amount of no less than $1,750,000 (and provided no other Rollover Trigger Event then exists), or (Y) the lender receives evidence in form and substance reasonably satisfactory to the lender that, as applicable, the related tenant has rescinded its notice of termination in writing and the lease is then in full force and effect or the Replacement Lease Conditions (as defined below) have been satisfied (and, in each case, provided no other Rollover Trigger Event then exists); with regard to clauses (iv) and (v), the lender receives evidence in form and substance reasonably satisfactory to the lender that the Replacement Lease Conditions have been satisfied or an approved lease extension has been entered into (and, in each case, provided no other Rollover Trigger Event then exists). In addition, such Rollover Trigger Event shall terminate with regard to clauses (i) through (v) on the date the lender receives satisfactory evidence the 150 West Jefferson Property is at least 85% occupied and the debt service coverage ratio for the then trailing 12-month period is equal to 1.40x or greater.
“Replacement Lease Conditions” means that the lender has received satisfactory evidence in the lender’s reasonable discretion that a replacement tenant reasonably satisfactory to the lender has executed a replacement lease on terms and conditions satisfactory to the lender for at least 85% of the entire space at the 150 West Jefferson Property occupied by the related tenant that triggered the Rollover Trigger Event (or such other space at the 150 West Jefferson Property, provided such space is the equivalent size of at least 85% of the space at the 150 West Jefferson Property occupied by such tenant), and that such replacement tenant is in occupancy and paying full unabated rent under such replacement lease.
Lockbox and Cash Management. The 150 West Jefferson Whole Loan is structured with a hard lockbox and springing cash management. The 150 West Jefferson Borrower was required at origination to deliver letters to all tenants at the 150 West Jefferson Property directing them to pay all rents directly into a lender-controlled lockbox account. All funds received by the borrower or manager are required to be deposited in the lockbox account within two business days following receipt. During the continuance of a Sweep Event, all funds in the lockbox account are required to be swept each business day into the cash management account controlled by the lender and disbursed on each payment date in accordance with the loan documents, with all excess cash flow to be deposited to an excess cash reserve to be held as additional security for the 150 West Jefferson Whole Loan.
A “Sweep Event” will commence upon the earlier of the following: (i) the occurrence and continuance of an event of default, (ii) the amortizing debt service coverage ratio based on the trailing 12-month period being less than 1.15x, (iii) the occurrence and continuance of a Major Tenant Trigger Period (as defined below) and (iv) the ARD.
A Sweep Event will end: (i) with regard to clause (i), upon the cure of such event of default, (ii) with regard to clause (ii), upon the debt service coverage ratio based on the trailing 12-month period being at least 1.25x for two consecutive calendar quarters, (iii) with regard to clause (iii), the related Major Tenant Trigger Period is cured, as further described below, and (iv) with regard to clause (iv), for the avoidance of doubt, there will be no cure.
A “Major Tenant Trigger Period” means the date on which Starcom or a replacement tenant (a “Major Tenant”), (i) becomes insolvent or a debtor in any bankruptcy action, (ii) defaults under its lease beyond any applicable grace, notice or cure periods, (iii) (a) terminates its respective lease or (b) the earlier of (1) in the event that the Major Tenant gives notice to terminate its respective lease and such notice of termination specifies a termination date that is more than 12 months after the date of such notice, the date that is 12 months prior to the termination date specified in such notice and (2) in the event that the Major Tenant gives notice to terminate its respective lease and such notice of termination does not specify a termination date that is more than 12 months after the date of such notice, the date that such notice is received, (iv) if prior to any respective deadline for extending the term of the Major Tenant’s lease, the Major Tenant fails to extend the term of its respective lease pursuant to the terms thereof or otherwise renew the Major Tenant’s lease on terms reasonably satisfactory to the lender, or (v) if no extension option is then remaining in the Major Tenant’s lease, that is nine months prior to the end of the term of such lease, unless, prior to such date, the term of the Major Tenant’s lease is extended or renewed or a satisfactory replacement lease is entered into with the Major Tenant, in each case, on terms reasonably satisfactory to the lender.
Such Major Tenant Trigger Period will terminate: with regard to clause (i), (1) upon the lender’s receipt of evidence in form and substance reasonably satisfactory to the lender that the related lease has been irrevocably assumed by the related tenant in such proceeding and the related tenant is in occupancy of at least 85% of the space demised under its lease and is paying the full, unabated contract rent without offset or credit as evidenced by one or more estoppel letters acceptable to the lender or (2) the assignment to, and assumption by, an assignee reasonably acceptable to the lender of related tenant’s lease pursuant to a final court order issued in the applicable bankruptcy action, with such assignee occupying at least 85% of the space demised under such tenant’s lease and paying full, unabated post-petition rent without offset or credit as evidenced by one or more estoppel letters acceptable to the lender; with regard to clause (ii), upon the related tenant curing such default; with regard to clause (iii), the date on which the lender receives evidence in form and substance reasonably satisfactory to the lender that, as applicable, the related tenant has rescinded its notice of termination in writing and the lease is then in full force and effect or the Replacement Lease Conditions have been satisfied (and, in each case, provided no other Major Tenant Trigger Period then exists); with regard to clauses (iv) and (v), the lender receives evidence in form and substance satisfactory to the lender that the related tenant has extended the term of its respective lease pursuant to the terms thereof or otherwise on terms reasonably satisfactory to the lender or the Replacement Lease Conditions have been satisfied (and, in each case, provided no other Major Tenant Trigger Period then exists). In addition, such Major Tenant Trigger Period will terminate with regard to clauses (i) through (v) on the date the lender receives satisfactory evidence the debt service coverage ratio at the 150 West Jefferson Property for the then trailing 12-month period is equal to 1.35x or greater.
This is not a research report and was not prepared by any Underwriter’s research department. Please see additional important information and qualifications at the end of this Term Sheet. |
T-77
| MSC 2017-HR2 | 150 West Jefferson |
Additional Secured Indebtedness (not including trade debts).The 150 West Jefferson Property also secures the 150 West Jefferson ServicedPari Passu Companion Loan, which has a Cut-off Date principal balance of $32,500,000. The 150 West Jefferson Serviced Pari Passu Companion Loan accrues interest at the same rate as the 150 West Jefferson Mortgage Loan. The 150 West Jefferson Mortgage Loan is entitled to payments of interest on apro rata andpari passu basis with the 150 West Jefferson Serviced Pari Passu Companion Loan. The holders of the 150 West Jefferson Mortgage Loan and the 150 West Jefferson Serviced Pari Passu Companion Loan have entered into a co-lender agreement which sets forth the allocation of collections on the 150 West Jefferson Whole Loan. See “Description of the Mortgage Pool—The Whole Loans— The Serviced Pari Passu Whole Loans” in the Preliminary Prospectus.
Mezzanine Loan and Preferred Equity. Not permitted.
Future Expansion.During the term of the 150 West Jefferson Whole Loan, the 150 West Jefferson Borrower will be permitted to expand the 150 West Jefferson Parking Garage by adding additional stories and/or building additional improvements on top of the 150 West Jefferson Parking Garage structure, provided that the construction complies with the requirements contained in the 150 West Jefferson Whole Loan documents. In connection with such construction, the 150 West Jefferson Borrower is required to convert the 150 West Jefferson Property to condominium ownership with the 150 West Jefferson Borrower’s condominium unit being comprised of the current 150 West Jefferson Property and the 150 West Jefferson Parking Garage structure and a second condominium unit being comprised of the air rights over the current 150 West Jefferson Parking Garage structure in which an affiliate of the 150 West Jefferson Borrower (or such other entity approved by the holder of the 150 West Jefferson Whole Loan) would construct the expansion, subject in either case to the compliance with the requirements contained in the 150 West Jefferson Whole Loan documents. The construction of an office property under either structure would require the prior consent of the holder of the 150 West Jefferson Whole Loan. The expansion would not be collateral for the 150 West Jefferson Whole Loan. Before converting the 150 West Jefferson Property to a condominium structure, the 150 West Jefferson Whole Loan documents require, among other conditions, a REMIC opinion, satisfaction of an LTV Ratio not greater than 125%, a rating agency confirmation and lender approval of the condominium documents.
Terrorism Insurance.The 150 West Jefferson Borrower is required to obtain terrorism insurance for domestic and foreign acts of terrorism (as defined in the Terrorism Risk Insurance Program Reauthorization Act of 2007 as amended or replaced) in an amount equal to the full replacement cost of the 150 West Jefferson Property and business interruption insurance of at least 18 months required under the 150 West Jefferson Whole Loan documents. See “Risk Factors—Risks Relating to the Mortgage Loans—Terrorism Insurance May Not Be Available for All Mortgaged Properties” in the Preliminary Prospectus.
This is not a research report and was not prepared by any Underwriter’s research department. Please see additional important information and qualifications at the end of this Term Sheet. |
T-78
(THIS PAGE INTENTIONALLY LEFT BLANK)
This is not a research report and was not prepared by any Underwriter’s research department. Please see additional important information and qualifications at the end of this Term Sheet. |
T-79
| MSC 2017-HR2 | 925 L Street |
Mortgage Loan No. 7 – 925 L Street
This is not a research report and was not prepared by any Underwriter’s research department. Please see additional important information and qualifications at the end of this Term Sheet. |
T-80
| MSC 2017-HR2 | 925 L Street |
Mortgage Loan No. 7 – 925 L Street
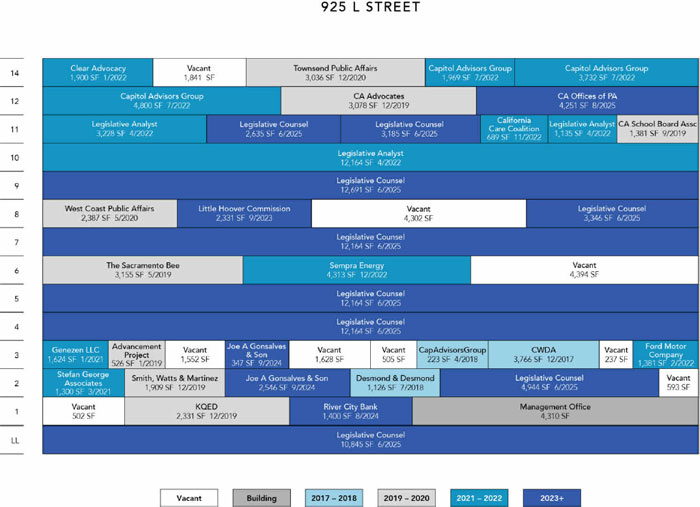
This is not a research report and was not prepared by any Underwriter’s research department. Please see additional important information and qualifications at the end of this Term Sheet. |
T-81
| MSC 2017-HR2 | 925 L Street |
Mortgage Loan No. 7 – 925 L Street

This is not a research report and was not prepared by any Underwriter’s research department. Please see additional important information and qualifications at the end of this Term Sheet. |
T-82
| MSC 2017-HR2 | 925 L Street |
| Mortgage Loan No. 7 – 925 L Street |
| Mortgage Loan Information | Property Information | ||||||
| Mortgage Loan Seller: | SMF III | Single Asset/Portfolio: | Single Asset | ||||
| Original Balance: | $32,200,000 | Location: | Sacramento, CA 95814 | ||||
| Cut-off Date Balance: | $32,200,000 | General Property Type: | Office | ||||
| % of Initial Pool Balance: | 3.4% | Detailed Property Type: | CBD | ||||
| Loan Purpose: | Acquisition | Title Vesting: | Fee | ||||
| Sponsors: | David Smith; Jordan Caspari | Year Built/Renovated: | 1972/1997 | ||||
| Mortgage Rate: | 4.2230% | Size: | 168,850 SF | ||||
| Note Date: | 11/21/2017 | Cut-off Date Balance PSF: | $191 | ||||
| First Payment Date: | 1/6/2018 | Maturity Date Balance PSF: | $174 | ||||
| Maturity Date: | 12/6/2027 | Property Manager: | Jones Lang LaSalle Americas, Inc. | ||||
| Original Term to Maturity: | 120 months | ||||||
| Original Amortization Term: | 360 months | Underwriting and Financial Information | |||||
| IO Period: | 60 months | UW NOI(2): | $3,280,800 | ||||
| Seasoning: | 0 months | UW NOI Debt Yield: | 10.2% | ||||
| Prepayment Provisions: | LO (24); DEF/YM1 (91); O (5) | UW NOI Debt Yield at Maturity: | 11.2% | ||||
| Lockbox/Cash Mgmt Status: | Springing/Springing | UW NCF DSCR: | 1.63x | ||||
| Additional Debt Type: | N/A | Most Recent NOI(3): | $2,420,072 (8/31/2017 TTM) | ||||
| Additional Debt Balance: | N/A | 2nd Most Recent NOI(4): | $2,784,579 (12/31/2016) | ||||
| Future Debt Permitted (Type)(1): | Yes (Permitted Mezzanine) | 3rd Most Recent NOI(4): | $3,414,453 (12/31/2015) | ||||
| Reserves(2) | Most Recent Occupancy: | 90.8% (11/16/2017) | |||||
| Type | Initial | Monthly | Cap | 2nd Most Recent Occupancy(5): | N/A | ||
| RE Tax: | $85,178 | $40,561 | N/A | 3rd Most Recent Occupancy(5): | N/A | ||
| Insurance: | $7,338 | $3,669 | N/A | Appraised Value (as of): | $47,300,000 (11/7/2017) | ||
| Recurring Replacements: | $0 | $2,392 | N/A | Cut-off Date LTV Ratio(6): | 68.1% | ||
| TI/LC: | $350,000 | $14,071 | N/A | Maturity Date LTV Ratio(6): | 62.1% | ||
| Other Reserve: | $4,293,771 | $0 | N/A | ||||
| Sources and Uses | ||||||
| Sources | Proceeds | % of Total | Uses | Proceeds | % of Total | |
| Loan Amount: | $32,200,000 | 63.1% | Purchase Price: | $45,500,000 | 89.2% | |
| Borrower Equity: | $14,152,229 | 27.7% | Reserves: | $4,736,286 | 9.3% | |
| Seller Credit(7): | $4,647,536 | 9.1% | Closing Costs: | $763,479 | 1.5% | |
| Total Sources: | $50,999,765 | 100.0% | Total Uses: | $50,999,765 | 100.0% | |
| (1) | See “Mezzanine Loan and Preferred Equity” below. |
| (2) | See “Escrows and Reserves” below for further discussion of reserve requirements. |
| (3) | UW NOI is higher than Most Recent NOI due to (i) four new leases with tenants that have since begun paying rent (approximately $460,000), (ii) rent abatements incurred in Most Recent NOI under the Legislative Counsel and Legislative Analyst leases have since burned off (approximately $290,000) and (iii) underwritten rent bumps (approximately $242,000). |
| (4) | The decline in NOI from 2015 to 2016 is the result of the loss of four tenants and the renewal of the Legislative Analyst tenant at a reduced rental rate. |
| (5) | Historical occupancy is not available as the previous owner did not provide historical occupancy information. |
| (6) | The appraiser concluded a “Hypothetical As-Is Market Value” of $47,300,000 with an appraisal valuation date of November 7, 2017. The “as-is” appraised value based on a hypothetical condition assumes that all outstanding tenant improvement, building improvement and free rent obligations from recently signed tenants have already been incurred. At origination of the 925 L Street Mortgage Loan (as defined below), the borrower deposited $4,293,771 for outstanding tenant improvements, building improvements and free rent. The “as-is” appraised value is $44,700,000 with a valuation date of November 7, 2017. The Cut-off Date LTV Ratio and Maturity Date LTV Ratio based on the “as-is” appraised value are 72.0% and 65.7%, respectively. |
| (7) | At origination of the 925 L Street Mortgage Loan, the seller credited the 925 L Street Borrower for all future rent abatements, tenant-specific unpaid leasing costs and capital improvements, and prepaid rent received. The 925 L Street Borrower was required to escrow the equivalent amounts at origination of the 925 L Street Mortgage Loan. |
The Mortgage Loan. The seventh largest mortgage loan (the “925 L Street Mortgage Loan”) is evidenced by a promissory note in the original principal amount of $32,200,000, secured by a first priority fee mortgage encumbering a 168,850 SF office property known as 925 L Street located in Sacramento, California (the “925 L Street Property”). The proceeds of the 925 L Street Mortgage Loan, together with $14,152,229 of borrower equity and $4,647,536 of seller credit, were used to acquire the 925 L Street Property, fund reserves and pay closing costs.
The Borrower and the Sponsors.The borrower is Timber Soma 925 L Street LP (“925 L Street Borrower”), a single-purpose Delaware limited partnership with one independent director. The borrower sponsors and non-recourse carveout guarantors are David Smith and Jordan Caspari. Mr. Smith and Mr. Caspari are the founders and key principals of Soma Capital Partners LLC (“SCP”). SCP is a privately-held real estate investment and advisory company based in San Francisco. The company manages assets on behalf of high net worth individuals, private equity, and wealth managers across the United States. Since 2011, SCP has raised and invested equity across 14 transactions totaling 1.8 million SF of commercial property and 1,300 multifamily units.
This is not a research report and was not prepared by any Underwriter’s research department. Please see additional important information and qualifications at the end of this Term Sheet. |
T-83
| MSC 2017-HR2 | 925 L Street |
The Property. The 925 L Street Property consists of a 168,850 SF, Class A office building located in Sacramento, California. The 925 L Street Property was built in 1972 and was significantly renovated in 1997. Since 2010, there have been approximately $1.7 million in capital improvements completed at the 925 L Street Property. The 925 L Street Property is located on the corner of 10th and L Streets across from the State Capitol and Capitol Park. The building offers tenants immediate access to the Capitol building while maintaining walking distance to Capitol Mall and other locations in the Government Affairs District as well as access to parking and public transportation. The 925 L Street Property is located within walking distance of the Golden 1 Center (an indoor arena) and both casual and fine dining options, as well as a number of entertainment options that surround the arena.
The arena, which is the home of the Sacramento Kings of the National Basketball Association, hosts concerts, conventions and other sporting and entertainment events. The 925 L Street Property benefits from access to Interstate 5, with an exit and entry ramp both within a few blocks of the 925 L Street Property. The 925 L Street Property also sits within close proximity of the regional commuter bus and light-rail system.
The 925 L Street Property is linked by a sky bridge to a 988-stall parking garage that is owned by the city of Sacramento. The 925 L Street Property has a license agreement which expires October 31, 2026 with the city of Sacramento providing the 925 L Street Borrower the use of up to 200 parking spaces. This serves as an amenity to its tenants given the scarcity of parking in the vicinity of the Capitol building. Since 1998, the 925 L Street Property has maintained an average occupancy of approximately 96.0%. Approximately 68% of the tenants by square footage have been in occupancy at the 925 L Street Property for over ten years and have exercised at least one renewal option. As of November 16, 2017, the 925 L Street Property was 90.8% leased to 24 tenants.
Major Tenants.
Legislative Counsel (74,138 SF, 43.9% of NRA, 53.9% of underwritten base rent). Legislative Counsel is a nonpartisan government agency that drafts legislative proposals, prepares legal opinions and provides other confidential legal services to the State of California Legislature and others. Legislative Counsel also prepares amended bills for printing, compiles and indexes the California statutes and codes and provides computer services, data networking and related customer services to the State of California Legislature. Legislative Counsel had a total annual budget of approximately $100 million for its 2015-2016 fiscal year. Legislative Counsel has been in occupancy at the 925 L Street Property since 1990 and most recently expanded by 3,346 SF in 2016. Legislative Counsel has one five-year lease renewal option.
Legislative Analyst (16,527 SF, 9.8% of NRA, 9.8% of underwritten base rent). Legislative Analyst is a nonpartisan government agency that has provided fiscal and policy advice to the State of California Legislature for over 75 years. Legislative Analyst is headquartered at the 925 L Street Property. Legislative Analyst has one five-year lease renewal option.
The following table presents a summary regarding major tenants at the 925 L Street Property:
| Tenant Summary(1) | |||||||
| Tenant Name | Credit Rating (Fitch/Moody’s/S&P)(2) | Tenant SF | Approximate % of SF | Annual UW Rent | % of Total Annual UW Rent | Annual UW Rent PSF(3) | Lease Expiration |
| Major Tenants | |||||||
| Legislative Counsel | AA-/Aa3/AA- | 74,138 | 43.9% | $2,936,812 | 53.9% | $39.61 | 6/30/2025(4) |
| Legislative Analyst | AA-/Aa3/AA- | 16,527 | 9.8% | $531,839 | 9.8% | $32.18 | 4/30/2022(5) |
| Subtotal/Wtd. Avg. | 90,665 | 53.7% | $3,468,651 | 63.7% | $38.26 | ||
| Other Tenants | 62,631 | 37.1% | $1,975,437 | 36.3% | $31.54 | ||
| Vacant Space | 15,554 | 9.2% | $0 | 0.0% | $0.00 | ||
| Total/Wtd. Avg. | 168,850 | 100.0% | $5,444,088 | 100.0% | $35.51 | ||
| (1) | Information is based on the underwritten rent roll dated November 16, 2017. |
| (2) | Certain ratings are those of the parent company or state government whether or not the parent or state government guarantees the lease. |
| (3) | Annual UW Rent PSF figures exclude vacant space. |
| (4) | Legislative Counsel has one five-year lease renewal option. |
| (5) | Legislative Analyst has one five-year lease renewal option. |
This is not a research report and was not prepared by any Underwriter’s research department. Please see additional important information and qualifications at the end of this Term Sheet. |
T-84
| MSC 2017-HR2 | 925 L Street |
The following table presents certain information relating to the lease rollover schedule at 925 L Street Property:
| Lease Rollover Schedule(1)(2) | ||||||||
| Year | # of Leases Rolling | SF Rolling | UW Rent PSF Rolling | Approx. % of Total SF Rolling | Approx. Cumulative % of SF Rolling | Total UW Rent Rolling | Approx. % of Total Rent Rolling | Approx. Cumulative % of Total Rent Rolling |
| MTM | 0 | 0 | $0.00 | 0.0% | 0.0% | $0 | 0.0% | 0.0% |
| 2017 | 1 | 3,766 | $34.78 | 2.2% | 2.2% | $130,980 | 2.4% | 2.4% |
| 2018 | 2 | 1,349 | $29.85 | 0.8% | 3.0% | $40,270 | 0.7% | 3.1% |
| 2019 | 6 | 12,380 | $35.41 | 7.3% | 10.4% | $438,371 | 8.1% | 11.2% |
| 2020 | 1 | 5,423 | $35.02 | 3.2% | 13.6% | $189,922 | 3.5% | 14.7% |
| 2021 | 2 | 2,924 | $37.14 | 1.7% | 15.3% | $108,608 | 2.0% | 16.7% |
| 2022 | 6 | 35,311 | $34.29 | 20.9% | 36.2% | $1,210,936 | 22.2% | 38.9% |
| 2023 | 1 | 2,331 | $40.01 | 1.4% | 37.6% | $93,274 | 1.7% | 40.6% |
| 2024 | 2 | 4,293 | $31.44 | 2.5% | 40.1% | $134,952 | 2.5% | 43.1% |
| 2025 | 2 | 78,389 | $39.51 | 46.4% | 86.6% | $3,096,775 | 56.9% | 100.0% |
| 2026 | 0 | 0 | $0.00 | 0.0% | 86.6% | $0 | 0.0% | 100.0% |
| 2027 | 0 | 0 | $0.00 | 0.0% | 86.6% | $0 | 0.0% | 100.0% |
| 2028 & Beyond(3) | 2 | 7,130 | $0.00 | 4.2% | 90.8% | $0 | 0.0% | 100.0% |
| Vacant | 0 | 15,554 | $0.00 | 9.2% | 100.0% | $0 | 0.0% | 100.0% |
| Total/Wtd. Avg. | 25 | 168,850 | $35.51 | 100.0% | $5,444,088 | 100.0% | ||
| (1) | Information is based on the underwritten rent roll dated November 16, 2017. |
| (2) | Certain tenants may have lease termination options that are exercisable prior to the originally stated expiration date of the subject lease and that are not considered in the lease rollover schedule. |
| (3) | Includes a 4,310 SF management office. Additionally, in December 2015, the 925 L Street Property was re-measured according to standards maintained by a building owner’s association. Tenants who have signed new leases since then have square footage based upon the re-measured area, while legacy tenants who have been in occupancy reflect the square footage pre re-measurement. As of November 16, 2017, there is a total of 2,820 SF per the re-measurement that have not been allocated to ‘legacy tenants’ suites. Going forward, as suites are re-leased to new tenants, their square footage will be updated to reflect the remeasured square feet, with the increase to be deducted from the 2,820 SF that are presently unallocated. |
The Market. The 925 L Street Property is located within the Downtown region of the greater Sacramento metro area, directly across the street from the State Capitol building and two blocks from the Sacramento Convention Center. Sacramento, the capital of California, is located in the north central part of the state, roughly 85 miles northeast of San Francisco. The Sacramento metropolitan statistical area (“MSA”) includes the counties of Sacramento, Placer, El Dorado and Yolo, with a combined population in excess of 2.25 million. Sacramento straddles two key regions of California, the Central Valley and Sierra Nevada mountains. Sacramento is the largest city in the metropolitan area, home to over 485,000 people, making it the sixth largest city in California and the 35th largest in the United States. According to a third party market report, Downtown Sacramento is the largest office submarket in the Sacramento MSA in terms of square feet, encompassing approximately 20.0 million SF. As of the third quarter of 2017, vacancy within the submarket is 7.9%. For Class A office properties in the Downtown Sacramento submarket, there is approximately 5.4 million SF of space with a vacancy rate of 13.2% and average rent of $34.07 PSF as of the end of 2016.
According to the appraisal, the estimated 2016 population within a one-, three- and five-mile radius of the 925 L Street Property was 20,990, 140,913 and 340,092, respectively. The estimated 2016 average household income within the same radii was $53,113, $72,321 and $68,554.
The following table presents rental comparables with respect to the 925 L Street Property as identified in the appraisal:
| Comparable Rentals Summary(1) | ||||||||
| Property Name/Location | Year Built | Occupancy | Tenant Name | Lease Size (SF) | Lease Date | Lease Term (Yrs.) | Rent PSF | Lease Type |
Meridian Plaza 1415 L Street Sacramento, CA | 2003 | 95% | Terraphase Engineering Inc. | 1,880 | Jan-17 | 5.0 | $34.20 | FSG |
Park Tower 980 9th Avenue Sacramento, CA | 1992 | 71% | Messing, Adam & Jasmine | 5,208 | Jan-17 | 6.0 | $31.20 | FSG |
Senator Office Building 1121-1123 L Street Sacramento, CA | 1923 | 91% | Metro SoCal Water District | 2,600 | Jan-17 | 11.0 | $37.20 | FSG |
770 L Street 770 L Street Sacramento, CA | 1984 | 92% | Mpower Communications | 3,988 | Jul-17 | 5.0 | $34.20 | FSG |
Capitol Place 915 L Street Sacramento, CA | 1988 | 95% | Quintana Gonzalez | 1,257 | Dec-16 | 5.0 | $33.00 | FSG |
US Bank Tower 621 Capitol Mall Sacramento, CA | 2008 | 96% | American Auto Assoc.
| 3,498 | Jan-17 | 10.0 | $39.60
| FSG
|
| (1) | Source:Appraisal. |
This is not a research report and was not prepared by any Underwriter’s research department. Please see additional important information and qualifications at the end of this Term Sheet. |
T-85
| MSC 2017-HR2 | 925 L Street |
Operating History and Underwritten Net Cash Flow. The following table presents certain information relating to the historical operating performance and Underwritten Net Cash Flow at the 925 L Street Property:
| Cash Flow Analysis | ||||||||||||||||||
| 2014 | 2015 | 2016 | 8/31/2017 TTM | UW | UW PSF | |||||||||||||
| Base Rent | $5,275,705 | $5,382,041 | $4,768,797 | $4,445,775 | $5,959,303 | $35.29 | ||||||||||||
| Total Recoveries | $5,945 | $9,348 | $25,692 | $33,474 | $20,764 | $0.12 | ||||||||||||
| LCB Prepayment Discount(1) | ($41,481) | ($43,196) | ($39,030) | ($35,660) | ($48,010 | ) | ($0.28 | ) | ||||||||||
| Other Income(2) | $8,139 | $4,738 | $7,520 | $7,440 | $7,440 | $0.04 | ||||||||||||
| Less Vacancy & Credit Loss | $0 | $0 | $0 | $0 | ($515,216) | ($3.05) | ||||||||||||
| Effective Gross Income | $5,248,308 | $5,352,931 | $4,762,979 | $4,451,029 | $5,424,282 | $32.12 | ||||||||||||
| Total Operating Expenses | $1,885,197 | $1,938,479 | $1,978,399 | $2,030,957 | $2,143,482 | $12.69 | ||||||||||||
| Net Operating Income(3) | $3,363,110 | $3,414,453 | $2,784,579 | $2,420,072 | $3,280,800 | $19.43 | ||||||||||||
| Capital Expenditures | $0 | $0 | $0 | $0 | $28,705 | $0.17 | ||||||||||||
| TI/LC | $0 | $0 | $0 | $0 | $168,850 | $1.00 | ||||||||||||
| Net Cash Flow | $3,363,110 | $3,414,453 | $2,784,579 | $2,420,072 | $3,083,246 | $18.26 | ||||||||||||
| Occupancy %(4) | N/A | N/A | N/A | 90.8% | 91.4% | |||||||||||||
| NOI DSCR | 1.77x | 1.80x | 1.47x | 1.28x | 1.73x | |||||||||||||
| NCF DSCR | 1.77x | 1.80x | 1.47x | 1.28x | 1.63x | |||||||||||||
| NOI Debt Yield | 10.4% | 10.6% | 8.6% | 7.5% | 10.2% | |||||||||||||
| NCF Debt Yield | 10.4% | 10.6% | 8.6% | 7.5% | 9.6% | |||||||||||||
| (1) | Pursuant to the terms of Legislative Counsel’s lease, the tenant is entitled to a discount in return for prepaying a full year’s rent, which the tenant has historically done. At origination, the 925 L Street Borrower escrowed Legislative Counsel’s prepaid rent, which is required to be released on a monthly basis when the tenant’s rent payment comes due. The 925 L Street Mortgage Loan documents require that any rent prepaid by the tenant in the future be similarly escrowed. Due to the investment grade nature of the tenant, Legislative Counsel’s rent was underwritten to the average rent over the term of the 925 L Street Mortgage Loan. As such, the underwritten prepayment discount is also based on the average rent during the term. |
| (2) | Other Income includes storage income and tenant service income. |
| (3) | The decline in Net Operating Income from 2015 to 2016 is the result of the loss of four tenants and the renewal of the Legislative Analyst tenant at a reduced rental rate. UW Net Operating Income is higher than 8/31/2017 TTM Net Operating Income due to (i) four new leases with tenants that have since begun paying rent (approximately $460,000), (ii) rent abatements incurred in 8/31/2017 TTM Net Operating Income under the Legislative Counsel and Legislative Analyst leases have since burned off (approximately $290,000) and (iii) underwritten rent bumps (approximately $242,000). |
| (4) | Occupancy % for 2014, 2015 and 2016 is not available as the previous owner did not provide historical occupancy information. 8/31/2017 TTM Occupancy % equates to physical occupancy as of November 16, 2017, as provided by the borrower sponsor. UW Occupancy % is based on underwritten economic occupancy. |
Escrows and Reserves. The 925 L Street Mortgage Loan documents provide for upfront escrows in the amount of $85,178 for real estate taxes, $7,338 for insurance premiums, $350,000 for future general tenant improvements and leasing commissions, $1,597,841 for a Legislative Counsel prepaid rent reserve, $1,186,858 for rent concessions, $967,475 for tenant improvements related to Legislative Counsel, $43,130 for tenant improvements related to Sempra, $290,889 for capital expenditures related to Legislative Counsel and $207,578 for tenant improvements related to Legislative Analyst. The 925 L Street Mortgage Loan documents also provide for ongoing monthly escrow deposits of $40,561 for real estate taxes, $3,669 for insurance premiums, $2,392 for replacement reserves and $14,071 for TI/LC reserves.
Lockbox and Cash Management. The 925 L Street Mortgage Loan is structured with a springing lockbox and springing cash management. During the occurrence and continuance of a Sweep Event (as defined below), letters are required to be delivered to all tenants at the 925 L Street Property directing them to pay all rents directly into a lender-controlled lockbox account. All funds received by the borrower or manager are required to be deposited in the lockbox account within one business day following receipt. During the continuance of a Sweep Event, all funds in the lockbox account are required to be swept each business day into the cash management account controlled by the lender and disbursed on each payment date in accordance with the 925 L Street Mortgage Loan documents, with all excess cash flow to be deposited to an excess cash reserve to be held as additional security for the 925 L Street Mortgage Loan.
A “Sweep Event” will commence upon the earlier of the following: (i) the occurrence and continuance of an event of default, (ii) the amortizing debt service coverage ratio based on the trailing 12-month period being less than 1.25x at the end of any calendar month and (iii) the occurrence and continuance of a Major Tenant Trigger Period (as defined below).
A Sweep Event will end:(i)with regard to clause (i), upon the cure of such event of default,(ii)with regard to clause (ii), upon the amortizing debt service coverage ratio based on the trailing 12-month period being at least 1.35x for two consecutive calendar quarters; and(iii)with regard to clause (iii), the related Major Tenant Trigger Period is cured, as further described below.
A “Major Tenant Trigger Period” means the date on which Legislative Counsel or a replacement tenant (a “Major Tenant”), (i) becomes insolvent or a debtor in any bankruptcy action, (ii) defaults under its lease beyond any applicable grace, notice or cure periods, (iii) terminates its respective lease or gives notice to terminate its respective lease, or (iv) the date that is nine months prior to the end of the term of the Major Tenant’s lease, unless, prior to such date, the term of the Major Tenant’s lease is extended or renewed or a satisfactory replacement lease is entered into with the Major Tenant, in each case, on terms reasonably satisfactory to the lender.
Such Major Tenant Trigger Period shall terminate: with regard to clause (i), (1) upon the lender’s receipt of evidence in form and substance reasonably satisfactory to the lender that the related lease has been irrevocably assumed by the related tenant in such proceeding and the related tenant is in occupancy of at least 80% of the space demised under its lease and is paying the full, unabated contract rent without offset or credit as evidenced by one or more estoppel letters acceptable to the lender or (2) the assignment to, and assumption by, an assignee reasonably acceptable to the lender of the related tenant’s lease pursuant to a final court order issued in the applicable bankruptcy action, with such assignee occupying at least 80% of the space demised under such tenant’s lease and paying full, unabated post-petition rent without offset or credit as evidenced by one or more estoppel letters acceptable to the lender; with regard to clause (ii), upon the related tenant curing such default; with regard to clause (iii), the date on which the lender receives evidence in form and substance reasonably satisfactory to the lender that, as applicable, the related tenant has rescinded its notice of termination in writing and the lease is then in full force and effect or the Replacement Lease Conditions (as defined below) have been satisfied (and, in
This is not a research report and was not prepared by any Underwriter’s research department. Please see additional important information and qualifications at the end of this Term Sheet. |
T-86
| MSC 2017-HR2 | 925 L Street |
each case, provided no other Major Tenant Trigger Period then exists); with regard to clause (iv), the lender receives evidence in form and substance satisfactory to the lender that the related tenant has extended the term of its respective lease on terms reasonably satisfactory to the lender or the Replacement Lease Conditions have been satisfied (and, in each case, provided no other Major Tenant Trigger Period then exists).
“Replacement Lease Conditions” means that the lender has received satisfactory evidence in the lender’s reasonable discretion that a replacement tenant reasonably satisfactory to the lender has executed a replacement lease on terms and conditions satisfactory to the lender for at least 80% of the entire space at the 925 L Street Property occupied by the related tenant that triggered the Major Tenant Trigger Period (or such other space at the 925 L Street Property, provided such space is the equivalent size of at least 80.0% of the space at the 925 L Street Property occupied by such tenant), and that such replacement tenant is in occupancy and paying full unabated rent under such replacement lease.
Additional Secured Indebtedness (not including trade debts). Not permitted.
Mezzanine Loan and Preferred Equity. From and after November 21, 2019, mezzanine debt from an acceptable mezzanine lender is permitted under the following conditions, among others: (a) minimum combined debt service coverage ratio of 1.20x, (b) aggregate maximum loan-to-value ratio of 75.0%, (c) delivery of a satisfactory intercreditor agreement and (d) rating agency confirmation.
Release of Property. Not permitted.
Terrorism Insurance.The 925 L Street Borrower is required to obtain terrorism insurance for domestic and foreign acts of terrorism (as defined in the Terrorism Risk Insurance Program Reauthorization Act of 2007 as amended or replaced) in an amount equal to the full replacement cost of the 925 L Street Property and business interruption insurance of at least 18 months required under the 925 L Street Mortgage Loan documents. See “Risk Factors—Risks Relating to the Mortgage Loans—Terrorism Insurance May Not Be Available for All Mortgaged Properties” in the Preliminary Prospectus.
This is not a research report and was not prepared by any Underwriter’s research department. Please see additional important information and qualifications at the end of this Term Sheet. |
T-87
| MSC 2017-HR2 | One Ally Center |
Mortgage Loan No. 8 – One Ally Center

This is not a research report and was not prepared by any Underwriter’s research department. Please see additional important information and qualifications at the end of this Term Sheet. |
T-88
| MSC 2017-HR2 | One Ally Center |
Mortgage Loan No. 8 – One Ally Center
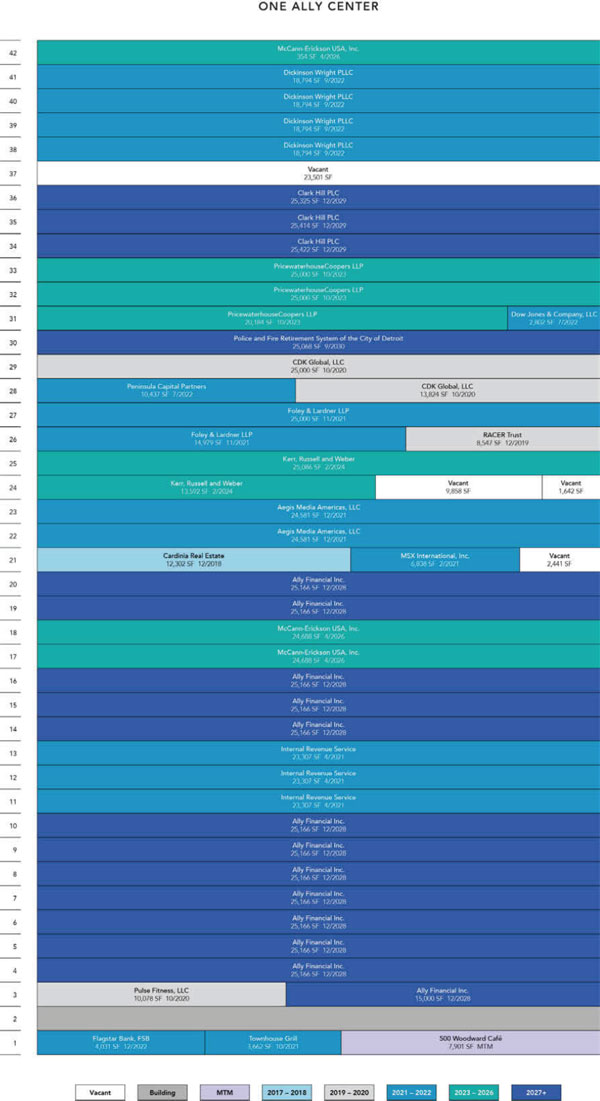
This is not a research report and was not prepared by any Underwriter’s research department. Please see additional important information and qualifications at the end of this Term Sheet. |
T-89
| MSC 2017-HR2 | One Ally Center |
Mortgage Loan No. 8 – One Ally Center

This is not a research report and was not prepared by any Underwriter’s research department. Please see additional important information and qualifications at the end of this Term Sheet. |
T-90
| MSC 2017-HR2 | One Ally Center |
| Mortgage Loan No. 8 – One Ally Center |
| Mortgage Loan Information | Property Information | ||||||
| Mortgage Loan Seller: | SMF III | Single Asset/Portfolio: | Single Asset | ||||
| Original Balance(1): | $32,000,000 | Location: | Detroit, MI 48226 | ||||
| Cut-off Date Balance(1): | $32,000,000 | General Property Type: | Office | ||||
| % of Initial Pool Balance: | 3.4% | Detailed Property Type: | CBD | ||||
| Loan Purpose: | Refinance | Title Vesting: | Leasehold | ||||
| Sponsor: | Bedrock Real Estate Services | Year Built/Renovated: | 1992/N/A | ||||
| Mortgage Rate: | 4.5160% | Size: | 976,095 SF | ||||
| Note Date: | 11/20/2017 | Cut-off Date Balance PSF(1): | $104 | ||||
| First Payment Date: | 1/6/2018 | Maturity Date Balance PSF(1): | $104 | ||||
| Maturity Date: | 12/6/2027 | Property Manager: | Bedrock Management Services LLC (borrower related) | ||||
| Original Term to Maturity: | 120 months | ||||||
| Original Amortization Term: | 0 months | Underwriting and Financial Information | |||||
| IO Period: | 120 months | UW NOI(5): | $12,847,750 | ||||
| Seasoning: | 0 months | UW NOI Debt Yield(1): | 12.6% | ||||
| Prepayment Provisions(2): | LO (24); DEF (92); O (4) | UW NOI Debt Yield at Maturity(1): | 12.6% | ||||
| Lockbox/Cash Mgmt Status: | Hard/In Place | UW NCF DSCR(1): | 2.43x | ||||
| Additional Debt Type(1)(3): | Pari Passu | Most Recent NOI(5): | $10,088,481 (9/30/2017 TTM) | ||||
| Additional Debt Balance(1)(3): | $70,000,000 | 2nd Most Recent NOI(5): | $7,207,373 (12/31/2016) | ||||
| Future Debt Permitted (Type): | No (N/A) | 3rd Most Recent NOI(6): | N/A | ||||
| Reserves(4) | Most Recent Occupancy: | 94.3% (10/18/2017) | |||||
| Type | Initial | Monthly | Cap | 2nd Most Recent Occupancy: | 96.6% (12/31/2016) | ||
| RE Tax: | $500,000 | $347,042 | N/A | 3rd Most Recent Occupancy: | 79.5% (12/31/2015) | ||
| Insurance: | $332,498 | $26,499 | N/A | Appraised Value (as of): | $185,000,000 (10/17/2017) | ||
| Recurring Replacements: | $0 | $16,325 | $500,000 | Cut-off Date LTV Ratio(1): | 55.1% | ||
| TI/LC: | $0 | Springing | N/A | Maturity Date LTV Ratio(1): | 55.1% | ||
| Deferred Maintenance: | $752,123 | $0 | N/A | ||||
| Ground Rent Reserve: | $214,630 | $214,630 | N/A | ||||
| Sources and Uses | ||||||
| Sources | Proceeds | % of Total | Uses | Proceeds | % of Total | |
| Loan Amount(1): | $102,000,000 | 99.3% | Loan Payoff: | $98,405,549 | 95.8% | |
| Borrower Sponsor Equity: | $740,401 | 0.7% | Closing Costs: | $2,535,601 | 2.5% | |
| Reserves: | $1,799,251 | 1.8% | ||||
| Total Sources: | $102,740,401 | 100.0% | Total Uses: | $102,740,401 | 100.0% | |
| (1) | The One Ally Center Mortgage Loan (as defined below) is part of the One Ally Center Whole Loan (as defined below), which is comprised of twopari passu promissory notes with an aggregate principal balance of $102,000,000. The Cut-off Date Balance PSF, Maturity Date Balance PSF, UW NOI Debt Yield, UW NOI Debt Yield at Maturity, UW NCF DSCR, Cut-off Date LTV Ratio and Maturity Date LTV Ratio numbers presented above are based on the aggregate principal balance of the promissory notes comprising the One Ally Center Whole Loan. |
| (2) | Defeasance of the One Ally Center Whole Loan is permitted any time after the earlier of (i) November 20, 2020 and (ii) two years from the closing date of the securitization that includes the lastpari passunote of the One Ally Center Whole Loan to be securitized. The assumed lockout period of 24 payments is based on the closing date of this transaction in December 2017. |
| (3) | See “The Mortgage Loan”and“Additional Secured Indebtedness (not including trade debts)”,for further discussion of additional debt. |
| (4) | See “Escrows and Reserves” below for further discussion of reserve requirements. |
| (5) | Ally Financial Inc. (“Ally”) executed a lease in 2015 for 316,997 SF and approximately $7.1 million in underwritten base rent. Ally began taking occupancy in April 2016 and took full occupancy by October 2016. Ally’s free rent period ended June 2017. |
| (6) | Full year NOI prior to 2016 is unavailable due to the borrower sponsor acquiring the property in March 2015. |
The Mortgage Loan. The eighth largest mortgage loan (the “One Ally Center Mortgage Loan”) is part of a whole loan (the “One Ally Center Whole Loan”) evidenced by twopari passu promissory notes in the aggregate original principal amount of $102,000,000, both of which are secured by a first priority leasehold mortgage encumbering an office property located in Detroit, Michigan (the “One Ally Center Property”). Promissory Note A-2 in the original principal amount of $32,000,000 represents the One Ally Center Mortgage Loan and will be included in the MSC 2017-HR2 securitization trust. Promissory Note A-1 in the original principal amount of $70,000,000 (the “One Ally Center Non-ServicedPari Passu Companion Loan”) represents the controlling interest in the One Ally Center Whole Loan and is expected to be contributed to the WFCM 2017-C42 securitization transaction, which is expected to close on December 21, 2017. The One Ally Center Whole Loan is expected to be serviced pursuant to the pooling and servicing agreement for the WFCM 2017-C42 securitization. See “Description of the Mortgage Pool—The Whole Loans—–The Non-Serviced Pari Passu Whole Loans” and “Pooling and Servicing Agreement—Servicing of the Non-Serviced Mortgage Loans” in the Preliminary Prospectus.
The Borrower and the Sponsor.The borrower is 500 Webward LLC (the “One Ally Center Borrower”), a single-purpose Michigan limited liability company with two independent directors. The loan sponsor is Bedrock Real Estate Services (“Bedrock”) and the non-recourse carveout guarantor is Zup Ventures LLC. Zup Ventures LLC and the One Ally Center Borrower are both ultimately owned by the Daniel B. Gilbert Trust UAD 12/23/96, as
This is not a research report and was not prepared by any Underwriter’s research department. Please see additional important information and qualifications at the end of this Term Sheet. |
T-91
| MSC 2017-HR2 | One Ally Center |
amended, a trust controlled by Mr. Daniel Gilbert and managed by an affiliate of Bedrock. Bedrock is the real estate investment company owned by Mr. Gilbert. Mr. Gilbert is the Chairman and founder of Quicken Loans, Inc.
Detroit-based Bedrock is a real estate firm specializing in acquiring, developing, leasing, financing, and managing commercial and residential buildings. Since its founding in 2011, Bedrock and its affiliates have acquired and developed more than 100 properties in downtown Detroit and Cleveland totaling more than 16.0 million SF. Bedrock’s current portfolio consists of more than 90 commercial properties totaling more than 15.0 million SF throughout downtown Detroit.
The Property. The One Ally Center Property consists of a ground leasehold interest in a 976,095 SF, Class A office building and adjacent seven-story parking garage (the “One Ally Center Parking Garage”) and related land located in Detroit, Michigan. The One Ally Center Property is located along Woodward Avenue in Detroit. Serving as the main thoroughfare between the central business district (“CBD”) and midtown Detroit, Woodward Avenue has direct access to the regional highway network and features a new streetcar line known as the QLine, which opened in early 2017 and stops directly in front of the One Ally Center Property. Constructed in 1992, the One Ally Center Property sits on an approximately 2.9-acre site within the Detroit CBD. The One Ally Center Property includes an adjacent seven-level parking garage (2,070 spaces, 2.12 per 1000 SF), 24-hour manned security and tenant amenities including two restaurants, a 10,078 SF Pulse Fitness, LLC fitness center and proximity to the Detroit People Mover.
As of October 18, 2017, the One Ally Center Property was 94.3% leased to 20 tenants across a variety of industries, including Ally (32.5% NRA), Clark Hill PLC (7.9% NRA), Dickinson Wright PLLC (7.7% NRA), the Internal Revenue Service (7.2% NRA), PricewaterhouseCoopers LLP (7.2% NRA), McCann-Erickson USA, Inc. (5.1% NRA) and Foley & Lardner LLP (4.1% NRA).
Major Tenants.
Ally (316,997 SF, 32.5% of NRA, 39.1% of underwritten base rent). Ally (formerly known as General Motors Acceptance Corporation) is a bank holding company founded by General Motors Corporation in 1919. The company provides financial services including auto financing, corporate financing, insurance, mortgages, stock brokerage, and online banking. Ally has been headquartered in Detroit since the company’s inception and is currently headquartered at the One Ally Center Property. Ally has consolidated approximately 1,500 employees in Southeast Michigan into the One Ally Center Property from five locations around greater Detroit, including Renaissance Center, Southfield Town Center, the Galleria Officentre in Southfield, the Auburn Hills Corporate Center and Troy Technology Park. Ally had an original lease commencement date in April 2016. Ally has three, five-year renewal options.
Clark Hill PLC (76,869 SF, 7.9% of NRA, 5.4% of underwritten base rent). Clark Hill PLC (“Clark Hill”) is a legal firm which employs over 450 attorneys and professionals across 17 offices in Arizona, Delaware, Illinois, Michigan, New Jersey, Pennsylvania, Washington, DC, and West Virginia, among other states and in Ireland, making it the second largest Michigan-based law firm according to a business publication. The firm’s practice areas include administrative and behavioral healthcare law, corporate restructuring and bankruptcy, estate planning and probate, government and public affairs, insurance and reinsurance, municipal finance, litigation, white collar criminal defense, economic development services, commercial and residential real estate finance transactions, product liability, intellectual property, and appellate. Clark Hill is headquartered at the One Ally Center Property. Clark Hill has two, five-year renewal options. Clark Hill has a one-time right to terminate its lease effective January 2025 by providing 12 months’ notice and payment of unamortized leasing costs. Additionally, Clark Hill has a one-time right to contract by 25,480 SF effective January 2025 with six months’ notice and payment of unamortized leasing costs.
Dickinson Wright PLLC (75,177 SF, 7.7% of NRA, 7.0% of underwritten base rent). Dickinson Wright PLLC (“Dickinson Wright”) is a general practice business law firm with over 425 attorneys among more than 40 practice areas and 19 industry groups and was founded in Detroit in 1878. The firm’s headquarters has been located at the One Ally Center Property since 1992. The firm has 18 offices, including six in Michigan, 11 other domestic offices, and one office in Canada. Dickinson Wright has one, ten-year lease renewal option.
PricewaterhouseCoopers LLP (70,184 SF, 7.2% of NRA, 8.5% of underwritten base rent). PricewaterhouseCoopers LLP (“PWC”) is a multinational professional services firm headquartered in London, United Kingdom. PWC’s professional services include audit and assurance, tax and consulting that covers such areas as cybersecurity privacy and human resources. The One Ally Center Property serves as PWC’s regional office for all clients in Michigan and northwest Ohio and is home to more than 700 employees. PWC relocated from a building downtown to the One Ally Center Property in 2012. PWC has two, five-year lease renewal options. PWC has a one-time right to terminate its lease effective December 2019 with ten months’ notice and payment of a termination fee equal to three months’ rent and unamortized leasing costs. Additionally, PWC has an ongoing right to contract by up to 25.0% of its leased space until January 2021 with nine months’ notice and payment of unamortized leasing costs.
Internal Revenue Service (69,920 SF, 7.2% of NRA, 5.9% of underwritten base rent). The Internal Revenue Service’s (“IRS”) office at the One Ally Center Property is the largest of six offices with public-facing services that the IRS maintains in Michigan, and the only public-facing Taxpayer Assistance Center in the Detroit metropolitan area. The IRS’ improvements to its premises at the One Ally Center Property included significant structural work to support large volume document storage as well as extensive access control and security systems. The IRS has an ongoing right to terminate its lease with three months’ notice and no termination fee.
This is not a research report and was not prepared by any Underwriter’s research department. Please see additional important information and qualifications at the end of this Term Sheet. |
T-92
| MSC 2017-HR2 | One Ally Center |
The following table presents a summary regarding major tenants at One Ally Center Property:
| Tenant Summary(1) | |||||||
| Tenant Name | Credit Rating (Fitch/Moody’s/S&P)(2) | Tenant SF | Approximate % of SF | Annual UW Rent | % of Total Annual UW Rent | Annual UW Rent PSF(3) | Lease Expiration |
| Major Tenants | |||||||
| Ally | BB+/Ba3/BB+ | 316,997 | 32.5% | $7,132,433 | 39.1% | $22.50 | 12/31/2028(4) |
| Clark Hill | NR/NR/NR | 76,869 | 7.9% | $992,355 | 5.4% | $12.91 | 12/31/2029(5) |
| Dickinson Wright | NR/NR/NR | 75,177 | 7.7% | $1,278,009 | 7.0% | $17.00 | 9/7/2022(6) |
| PWC | NR/NR/NR | 70,184 | 7.2% | $1,544,048 | 8.5% | $22.00 | 10/31/2023(7) |
| IRS | AAA/Aaa/AA+ | 69,920 | 7.2% | $1,070,705 | 5.9% | $15.31 | 4/30/2021(8) |
| Subtotal/Wtd. Avg. | 609,147 | 62.4% | $12,017,550 | 65.9% | $19.73 | ||
| Other Tenants | 311,265 | 31.9% | $6,210,595 | 34.1% | $19.95 | ||
| Vacant Space | 55,683 | 5.7% | $0 | 0.0% | $0.00 | ||
| Total/Wtd. Avg. | 976,095 | 100.0% | $18,228,145 | 100.0% | $19.80 | ||
| (1) | Information is based on the underwritten rent roll dated October 18, 2017. |
| (2) | Certain ratings are those of the parent company or federal government whether or not such parent or federal government guarantees the lease. |
| (3) | Annual UW Rent PSF figures exclude vacant space. |
| (4) | Ally has three, five-year renewal options. |
| (5) | Clark Hill has two, five-year lease renewal options. Clark Hill has a one-time right to terminate its lease effective January 2025 by providing 12 months’ notice and payment of unamortized leasing costs. Additionally, Clark Hill has a one-time right to contract by 25,480 SF effective January 2025 with six months’ notice and payment of unamortized leasing costs. |
| (6) | Dickinson Wright has one, ten-year lease renewal option. |
| (7) | PWC has two, five-year lease renewal options. PWC has a one-time right to terminate its lease effective December 2019 with ten months’ notice and payment of a termination fee equal to three months’ rent and unamortized leasing costs. Additionally, PWC has an ongoing right to contract by up to 25.0% of its lease space until January 2021 with nine months’ notice and payment of unamortized leasing costs. |
| (8) | The IRS has an ongoing right to terminate its lease with three months’ notice and no termination fee. |
The following table presents certain information relating to the lease rollover schedule at One Ally Center Property:
| Lease Rollover Schedule(1)(2) | ||||||||
| Year | # of Leases Rolling | SF Rolling | UW Rent PSF Rolling | Approx. % of Total SF Rolling | Approx. Cumulative % of SF Rolling | Total UW Rent Rolling | Approx. % of Total Rent Rolling | Approx. Cumulative % of Total Rent Rolling |
| MTM | 1 | 7,901 | $19.00 | 0.8% | 0.8% | $150,119 | 0.8% | 0.8% |
| 2017 | 0 | 0 | $0.00 | 0.0% | 0.8% | $0 | 0.0% | 0.8% |
| 2018 | 1 | 12,702 | $21.31 | 1.3% | 2.1% | $270,644 | 1.5% | 2.3% |
| 2019 | 1 | 8,547 | $22.25 | 0.9% | 3.0% | $190,171 | 1.0% | 3.4% |
| 2020 | 2 | 48,902 | $21.02 | 5.0% | 8.0% | $1,028,155 | 5.6% | 9.0% |
| 2021 | 5 | 171,505 | $17.74 | 17.6% | 25.6% | $3,042,821 | 16.7% | 25.7% |
| 2022 | 4 | 92,447 | $18.49 | 9.5% | 35.0% | $1,708,999 | 9.4% | 35.1% |
| 2023 | 1 | 70,184 | $22.00 | 7.2% | 42.2% | $1,544,048 | 8.5% | 43.5% |
| 2024 | 1 | 39,560 | $12.22 | 4.1% | 46.3% | $483,475 | 2.7% | 46.2% |
| 2025 | 0 | 0 | $0.00 | 0.0% | 46.3% | $0 | 0.0% | 46.2% |
| 2026 | 1 | 49,730 | $23.99 | 5.1% | 51.4% | $1,192,924 | 6.5% | 52.7% |
| 2027 | 0 | 0 | $0.00 | 0.0% | 51.4% | $0 | 0.0% | 52.7% |
| 2028 | 1 | 316,997 | $22.50 | 32.5% | 83.9% | $7,132,433 | 39.1% | 91.9% |
| 2029 | 1 | 76,869 | $12.91 | 7.9% | 91.7% | $992,355 | 5.4% | 97.3% |
| 2030 & Beyond | 1 | 25,068 | $19.63 | 2.6% | 94.3% | $492,001 | 2.7% | 100.0% |
| Vacant | 0 | 55,683 | $0.00 | 5.7% | 100.0% | $0 | 0.0% | 100.0% |
| Total/Wtd. Avg. | 20 | 976,095 | $19.80 | 100.0% | $18,228,145 | 100.0% | ||
| (1) | Information is based on the underwritten rent roll dated October 18, 2017. |
| (2) | Certain tenants may have lease termination options that are exercisable prior to the originally stated expiration date of the subject lease and that are not considered in the lease rollover schedule. |
The Market. The One Ally Center Property is located in the Detroit CBD submarket of the Detroit market. According to a market report, the Detroit CBD submarket has approximately 7.5 million SF of Class A office inventory as of November 2017. According to the appraisal, as of October 2017, the Detroit CBD submarket had average asking rents of $23.67 per SF and a vacancy rate of 7.5%. According to the appraisal, the 2017 estimated population within a one-mile radius of the One Ally Center Property was 7,355, while the 2017 estimated median household income within the same radius was $34,866. Within the city of Detroit, the 2017 estimated population was 658,250, while the 2017 estimated median household income was $27,134.
This is not a research report and was not prepared by any Underwriter’s research department. Please see additional important information and qualifications at the end of this Term Sheet. |
T-93
| MSC 2017-HR2 | One Ally Center |
The following table presents rental comparables with respect to the One Ally Center Property as identified in the appraisal:
| Comparable Rentals Summary | ||||||||
| Property Name/Location | Year Built | Occupancy | Tenant Name | Lease Size (SF) | Lease Date | Lease Term (Yrs.) | Rent PSF | Lease Type |
One Campus Martius Detroit, MI | 2003 | 100% | Microsoft | 43,119 | Dec-17 | 7.7 | $25.75 | Modified Gross |
One Kennedy Square Detroit, MI | 2006 | 100% | Ernst & Young | 37,277 | Oct-16 | 10.0 | $16.75 | Triple Net |
150 West Jefferson Detroit, MI | 1989 | 93% | Amazon | 20,465 | Jul-17 | 7.3 | $25.50 | Modified Gross |
150 West Jefferson Detroit, MI | 1989 | 93% | Jams, Inc.
| 6,211 | Jun-17 | 7.5 | $25.00
| Modified Gross
|
Source:Appraisal.
Operating History and Underwritten Net Cash Flow. The following table presents certain information relating to the historical operating performance and Underwritten Net Cash Flow at the One Ally Center Property:
| Cash Flow Analysis(1) | ||||
| 2016 | 9/30/2017 TTM | UW | UW PSF | |
| Base Rent(2) | $11,402,810 | $13,725,555 | $19,201,637 | $19.67 |
| Total Recoveries | $4,431,513 | $4,528,196 | $3,781,943 | $3.87 |
| Tenant Bill Backs | $881,728 | $1,329,664 | $1,329,664 | $1.36 |
| Parking Income | $7,730,698 | $8,529,329 | $7,753,829 | $7.94 |
| Other Income(3) | $93,720 | $78,181 | $78,181 | $0.08 |
| Less Vacancy & Credit Loss | $0 | $0 | ($1,430,641) | ($1.47) |
| Effective Gross Income | $24,540,469 | $28,190,925 | $30,714,612 | $31.47 |
| Total Operating Expenses | $17,333,096 | $18,102,444 | $17,866,862 | $18.30 |
| Net Operating Income | $7,207,373 | $10,088,481 | $12,847,750 | $13.16 |
| Capital Expenditures | $0 | $0 | $195,895 | $0.20 |
| TI/LC | $0 | $0 | $1,279,976 | $1.31 |
| Net Cash Flow | $7,207,373 | $10,088,481 | $11,371,879 | $11.65 |
| Occupancy %(4) | 96.6% | 94.3% | 95.5% | |
| NOI DSCR(5) | 1.54x | 2.16x | 2.75x | |
| NCF DSCR(5) | 1.54x | 2.16x | 2.43x | |
| NOI Debt Yield(5) | 7.1% | 9.9% | 12.6% | |
| NCF Debt Yield(5) | 7.1% | 9.9% | 11.1% | |
| (1) | Full year operating history prior to 2016 is unavailable due to the borrower sponsor acquiring the One Ally Center Property in March 2015. |
| (2) | Ally executed a lease for 316,997 SF and approximately $7.1 million in base rent in 2015. Ally began taking occupancy in April 2016 and took full occupancy by September 2016. Ally’s free rent period ended July 2017. The increase in UW Base Rent over 9/30/2017 TTM Base Rent is due in part to the expiration of Ally’s free rent period. |
| (3) | Other Income includes antenna income, storage income and other ancillary charges. |
| (4) | Occupancy % for 2016 represents occupancy as of December 31, 2016. 9/30/2017 TTM Occupancy % equates to physical occupancy as of October 18, 2017. UW Occupancy % is based on underwritten economic occupancy. |
| (5) | Debt service coverage ratios and debt yields are based on the One Ally Center Whole Loan. |
Escrows and Reserves. The One Ally Center Whole Loan documents provide for upfront escrows in the amount of $500,000 for real estate taxes, $332,498 for insurance premiums, $752,123 for deferred maintenance and $214,630 for a ground rent reserve. The loan documents also provide for ongoing monthly escrow deposits of $347,042 for real estate taxes, $26,499 for insurance premiums, $16,325 for replacement reserves (subject to a cap of $500,000) and $214,630 for ground rent.
If (i) an event of default occurs under the One Ally Center Whole Loan or (ii) the debt service coverage ratio at the One Ally Center Property falls below 2.00x calculated based on the trailing twelve months, the One Ally Center Borrower is required to make monthly deposits of $102,029 (approximately $1.25 per SF annually) for tenant improvements and leasing commissions (“TI/LCs”). Upon the One Ally Center Property achieving a debt service coverage ratio of 2.00x or greater calculated based on the trailing twelve months for two consecutive calendar quarters, the ongoing TI/LC reserve collections will be suspended and funds on deposit in the TI/LC reserve will be disbursed to the One Ally Center Borrower.
Lockbox and Cash Management.The One Ally Center Whole Loan is structured with a hard lockbox and in place cash management. The One Ally Center Borrower was required at origination to deliver letters to all tenants at the One Ally Center Property directing them to pay all rents directly into a lender-controlled lockbox account. All funds received by the One Ally Center Borrower or manager are required to be deposited in the lockbox account within one business day following receipt. All funds in the lockbox account are required to be swept each business day into the cash management account controlled by the lender and disbursed on each payment date in accordance with the loan documents, with all excess cash flow required to be deposited to an excess cash reserve to be held as additional security during the existence of a Sweep Event Period (as defined below) for the One Ally Center Whole Loan.
This is not a research report and was not prepared by any Underwriter’s research department. Please see additional important information and qualifications at the end of this Term Sheet. |
T-94
| MSC 2017-HR2 | One Ally Center |
A “Sweep Event Period” will commence upon the earlier of the following: (i) the occurrence and continuance of an event of default, (ii) the debt service coverage ratio based on the trailing 12-month period being less than 1.50x, (iii) the occurrence and continuance of a Tenant Trigger Period (as defined below) and (iv) June 6, 2027, unless within five business days the One Ally Center Borrower deposits with the lender either (a) $5,000,000 or (b) a $5,000,000 letter of credit.
A Sweep Event Period will end: (i) with regard to clause (i) of the definition of such term, upon the cure of such event of default, (ii) with regard to clause (ii), upon either (a) the debt service coverage ratio based on the trailing 12-month period being at least 1.55x or (b) the debt service coverage ratio based on the trailing two consecutive quarters, annualized, being at least 1.60x, (iii) with regard to clause (iii), the related Tenant Trigger Period is cured, as further described below and (iv) with regard to clause (iv), upon repayment of the One Ally Center Whole Loan in full.
A “Tenant Trigger Period” means a period commencing upon the earlier of the date upon which (i) Ally (the “Trigger Tenant”) is in monetary default or other material default under its lease, which default continues beyond any applicable notice and/or cure period, (ii) the Trigger Tenant vacates, gives notice of its intention to vacate or sublets 40.0% or more of its leased space at the One Ally Center Property (provided, however, that any sublease to one or more affiliates of the Trigger Tenant or any sublease of up to 40.0% of Trigger Tenant’s space to a non-affiliated tenant will not trigger a Tenant Trigger Period), (iii) the Trigger Tenant becomes a debtor in any bankruptcy or other insolvency proceeding, (iv) the Trigger Tenant has “gone dark,” abandoned or failed to operate, or (v) the Trigger Tenant fails to renew or extend the term of its lease, on terms and conditions reasonably acceptable to the lender, on or prior to the date that is the earlier of (A) December 31, 2027 and (B) the deadline to renew its lease, and such Tenant Trigger Period will terminate, provided that no other Tenant Trigger Period has commenced and is then continuing, (1) with regard to clause (i) above, upon the cure of the applicable default, (2) with regard to clauses (ii) and (iv) above, upon the date on which a Trigger Tenant Re-Tenanting Event occurs, (3) with regard to clause (iii) above, upon the date on which Trigger Tenant assumes its lease in, and has been discharged from, such bankruptcy or other insolvency proceeding, or (4) with respect to clause (v) above, either (x) upon the date on which a Trigger Tenant Re-Tenanting Event occurs or (y) the lender has received reasonably satisfactory evidence that the Trigger Tenant has extended the term of its lease, on terms and conditions acceptable to the lender and such evidence is to include, a tenant estoppel certificate from the applicable Trigger Tenant, confirming that all obligations of One Ally Center Borrower to such Trigger Tenant with respect to tenant improvements and leasing commissions have been satisfied in full and that such Trigger Tenant is then paying full, unabated rent pursuant to the terms of its lease.
If on the date that a Tenant Trigger Period would have otherwise been deemed to have occurred, the debt service coverage ratio, (as calculated by the lender based on the trailing 12 calendar months and excluding any revenue from Trigger Tenant (or in the case of a sublet by Trigger Tenant of at least 40.0% of its space, excluding any revenue from such sublet space)) is greater than 1.65x, no Tenant Trigger Period will be deemed to have occurred.
A “Trigger Tenant Re-Tenanting Event” means receipt of evidence reasonably satisfactory to the lender that no less than 75.0% of the space at the One Ally Center Property currently leased to the Trigger Tenant has been leased or subleased (provided that, with respect to a sublease, such Trigger Tenant has not been released from any of the obligations of its lease) to one or more reasonably satisfactory replacement tenants that, in each case, have commenced paying full, unabated rent and that are in occupancy and open for business in their leased space pursuant to one or more replacement leases entered into and on terms that are at least as favorable to One Ally Center Borrower as the lease that is being replaced, pursuant to which all tenant improvement costs and leasing commissions for which the One Ally Center Borrower is obligated with respect thereto have been paid.
Additional Secured Indebtedness (not including trade debts). The One Ally Center Property also secures the One Ally Center Non-Serviced Pari Passu Companion Loan, which has a Cut-off Date principal balance of $70,000,000. The One Ally Center Non-Serviced Pari Passu Companion Loan accrues interest at the same rate as the One Ally Center Mortgage Loan. The One Ally Center Mortgage Loan is entitled to payments of interest on a pro rata and pari passu basis with the One Ally Center Non-Serviced Pari Passu Companion Loan. The holders of the One Ally Center Mortgage Loan and the One Ally Center Non-Serviced Pari Passu Companion Loan have entered into a co-lender agreement which sets forth the allocation of collections on the One Ally Center Whole Loan. See “Description of the Mortgage Pool—The Whole Loans— The Non-Serviced Pari Passu Whole Loans” in the Preliminary Prospectus.
Mezzanine Loan and Preferred Equity. Not permitted.
Ground Lease.The One Ally Center Borrower’s interest in the One Ally Center Property is pursuant to a ground lease with an affiliate of iStar Financial Inc. as the landlord. The ground lease commenced on March 31, 2015 and has an initial lease expiration of March 31, 2114 with two, 30-year extension options at the lessee’s option, making the final expiration date March 31, 2174. The annual ground rent is currently $2.58 million and increases annually by 1.5%; however, at the end of each tenth lease year, the rent increases by the greater of (i) 1.5% over the prior year or (ii) the cumulative CPI increase over the prior ten-year period capped at 1.2x the rent paid at the beginning of the applicable 10-year period. The One Ally Center Borrower is required to make monthly deposits for ground rental payments.
Future Expansion.During the term of the One Ally Center Whole Loan, the One Ally Center Borrower will be permitted to expand the One Ally Center Parking Garage by adding additional stories and/or building additional improvements on top of the One Ally Center Parking Garage structure, provided that the construction complies with the requirements contained in the One Ally Center Whole Loan documents. The One Ally Center Borrower will have the option to structure such expansion either (a) as part of the One Ally Center Whole Loan’s collateral, or (b) by converting the One Ally Center Property to condominium ownership with the One Ally Center Borrower’s condominium unit being comprised of the current One Ally Center Property and the One Ally Center Parking Garage structure and a second condominium unit being comprised of the air rights over the current One Ally Center Parking Garage structure in which an affiliate of the One Ally Center Borrower would construct the expansion, subject in either case to the compliance with the requirements contained in the One Ally Center Whole Loan documents. The construction of an office property under either structure is not permitted under the One Ally Center Whole Loan documents. Before converting the One Ally Center Property to a condominium structure, the One Ally Center Whole Loan documents require, among other conditions, a REMIC opinion, satisfaction of an LTV Ratio not greater than 125%, a rating agency confirmation and lender approval of the condominium documents.
This is not a research report and was not prepared by any Underwriter’s research department. Please see additional important information and qualifications at the end of this Term Sheet. |
T-95
| MSC 2017-HR2 | One Ally Center |
Terrorism Insurance.The One Ally Center Borrower is required to obtain insurance for domestic and foreign acts of terrorism (as defined in the Terrorism Risk Insurance Program Reauthorization Act of 2007 as amended or replaced) in an amount equal to the full replacement cost of the One Ally Center Property and business interruption insurance of at least 18 months required under the One Ally Center Whole Loan documents; provided that, if the Terrorism Risk Insurance Program Reauthorization Act of 2007 (or a subsequent statute, extension or reauthorization) is not in effect, the One Ally Center Borrower will not be required to pay annual premiums for terrorism insurance in excess of an amount equal to two times the premium for a separate “Special Form” or “All Risks” policy or equivalent policy insuring only the One Ally Center Property on a stand-alone basis at the time that any terrorism coverage is excluded from any applicable policy (but the One Ally Center Borrower will be obligated to purchase the maximum amount of terrorism coverage available with funds equal to such amount). See “Risk Factors—Risks Relating to the Mortgage Loans—Terrorism Insurance May Not Be Available for All Mortgaged Properties” in the Preliminary Prospectus.
This is not a research report and was not prepared by any Underwriter’s research department. Please see additional important information and qualifications at the end of this Term Sheet. |
T-96
(THIS PAGE INTENTIONALLY LEFT BLANK)
This is not a research report and was not prepared by any Underwriter’s research department. Please see additional important information and qualifications at the end of this Term Sheet. |
T-97
| MSC 2017-HR2 | Bakers Centre |
Mortgage Loan No. 9 – Bakers Centre
This is not a research report and was not prepared by any Underwriter’s research department. Please see additional important information and qualifications at the end of this Term Sheet. |
T-98
| MSC 2017-HR2 | Bakers Centre |
Mortgage Loan No. 9 – Bakers Centre
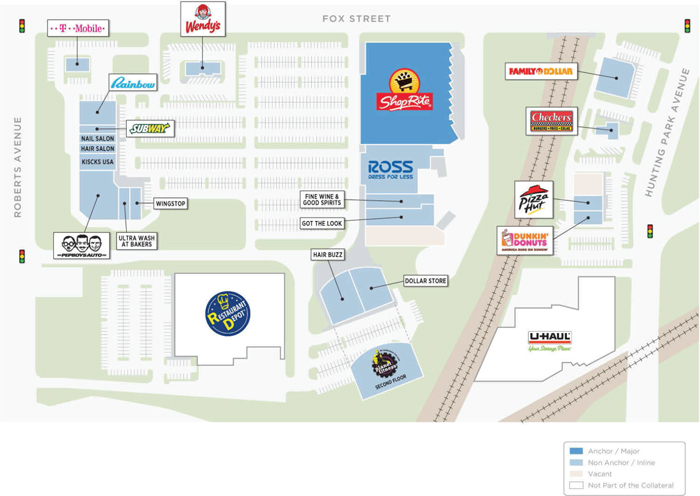
This is not a research report and was not prepared by any Underwriter’s research department. Please see additional important information and qualifications at the end of this Term Sheet. |
T-99
| MSC 2017-HR2 | Bakers Centre |
Mortgage Loan No. 9 – Bakers Centre

This is not a research report and was not prepared by any Underwriter’s research department. Please see additional important information and qualifications at the end of this Term Sheet. |
T-100
| MSC 2017-HR2 | Bakers Centre |
| Mortgage Loan No. 9 – Bakers Centre |
| Mortgage Loan Information | Property Information | ||||||
| Mortgage Loan Seller: | CREFI | Single Asset/Portfolio: | Single Asset | ||||
| Original Balance: | $32,000,000 | Location: | Philadelphia, PA 19129 | ||||
| Cut-off Date Balance: | $32,000,000 | General Property Type: | Retail | ||||
| % of Initial Pool Balance: | 3.4% | Detailed Property Type: | Anchored | ||||
| Loan Purpose(1): | Acquisition | Title Vesting: | Fee | ||||
| Sponsors: | BREIT Operating Partnership L.P.; BREIT Retail Holdings LLC | Year Built/Renovated: | 2013-2015/N/A | ||||
| Size: | 236,709 SF | ||||||
| Mortgage Rate: | 3.9420% | Cut-off Date Balance per SF: | $135 | ||||
| Note Date: | 11/1/2017 | Maturity Date Balance per SF: | $135 | ||||
| First Payment Date: | 12/1/2017 | Property Manager: | ShopCore Properties TRS Management LLC (borrower related) | ||||
| Maturity Date: | 11/1/2027 | ||||||
| Original Term to Maturity: | 120 months | ||||||
| Original Amortization Term: | 0 months | ||||||
| IO Period: | 120 months | Underwriting and Financial Information | |||||
| Seasoning: | 1 month | UW NOI: | $3,221,406 | ||||
| Prepayment Provisions: | LO (25); DEF/YM0.50% (90); O (5) | UW NOI Debt Yield: | 10.1% | ||||
| Lockbox/Cash Mgmt Status: | Hard/Springing | UW NOI Debt Yield at Maturity: | 10.1% | ||||
| Additional Debt Type: | N/A | UW NCF DSCR: | 2.36x | ||||
| Additional Debt Balance: | N/A | Most Recent NOI(3): | 2,913,812 (12/31/2016) | ||||
| Future Debt Permitted (Type): | No (N/A) | 2nd Most Recent NOI: | 2,744,468 (12/31/2015) | ||||
| Reserves(2) | 3rd Most Recent NOI: | 2,656,389 (12/31/2014) | |||||
| Type | Initial | Monthly | Cap | Most Recent Occupancy: | 92.1% (7/31/2017) | ||
| RE Tax: | $0 | Springing | N/A | 2nd Most Recent Occupancy(4): | N/A | ||
| Insurance: | $0 | Springing | N/A | 3rd Most Recent Occupancy(4): | N/A | ||
| Recurring Replacements: | $0 | Springing | $94,688 | Appraised Value (as of): | $52,900,000 (10/9/2017) | ||
| TI/LC: | $0 | Springing | $473,438 | Cut-off Date LTV Ratio: | 60.5% | ||
| Unfunded Obligations: | $54,289 | $0 | N/A | LTV Ratio at Maturity: | 60.5% | ||
| Sources and Uses(1) | ||||||
| Sources | Proceeds | % of Total | Uses | Proceeds | % of Total | |
| Loan Amount: | $32,000,000 | 60.3% | Purchase Price: | $52,400,000 | 98.7% | |
| Borrower Equity: | $21,107,814 | 39.7% | Closing Costs: | $653,525 | 1.2% | |
| Reserves: | $54,289 | 0.1% | ||||
| Total Sources: | $53,107,814 | 100.0% | Total Uses: | $53,107,814 | 100.0% | |
| (1) | The Bakers Centre Borrower (as defined below) acquired the Bakers Centre Property (as defined below) in an all cash transaction on March 30, 2017, prior to the origination of the Bakers Centre Mortgage Loan (as defined below) which occurred on November 1, 2017. Loan Purpose and Sources and Uses above are presented as an acquisition. |
| (2) | See “—Escrows and Reserves” below for further discussion of reserve requirements. |
| (3) | Historical information is not available subsequent to December 31, 2016, as the Bakers Centre Borrower acquired the Bakers Centre Property on March 30, 2017, and for purposes of the acquisition, only obtained historical financial information through December 31, 2016. Accordingly, the Bakers Centre Borrower did not obtain financial information for the period between January 1, 2017 and March 30, 2017 and as of the origination of the Bakers Centre Mortgage Loan only had partial year financial information beginning from the date of acquisition of the Bakers Centre Property. |
| (4) | Historical occupancy information was not obtained by the Bakers Centre Borrower in connection with the acquisition of the Bakers Centre Property as construction was completed in 2015. As most of the tenants were still on their initial leases at the Bakers Centre Property as of the time of the acquisition, the Bakers Centre Borrower did not obtain historical rent rolls for the Bakers Centre Property. |
The Mortgage Loan. The ninth largest mortgage loan (the “Bakers Centre Mortgage Loan”) is evidenced by a promissory note in the original principal amount of $32,000,000 and is secured by a first priority fee mortgage encumbering an anchored retail property located in Philadelphia, Pennsylvania (the “Bakers Centre Property”). The proceeds of the Bakers Centre Mortgage Loan were primarily used to recapitalize the Bakers Centre Borrower in connection with the acquisition of the Bakers Centre Property, to fund reserves, and to pay closing costs.
The Borrower and the Sponsor.The borrower is BREIT Bakers Property Owner LLC (the “Bakers Centre Borrower”), a single-purpose Delaware limited liability company with two independent directors. The sponsor and non-recourse carveout guarantor of the Bakers Centre Mortgage Loan is BREIT Operating Partnership L.P. There is no separate environmental indemnitor; accordingly, the Bakers Centre Borrower is the only entity liable under the related environmental indemnity.
BREIT Operating Partnership L.P. is a subsidiary of Blackstone Real Estate Income Trust, Inc. (“BREIT”). BREIT is a public non-traded real estate investment trust that invests in stabilized commercial real estate properties with a focus on providing current income. BREIT was designed to provide individual investors access to The Blackstone Group L.P.’s real estate investment platform and is externally managed by BX REIT Advisors L.L.C., a subsidiary of The Blackstone Group. As of September 30, 2017, The Blackstone Group, L.P. reported total assets under management of approximately $387.4 billion and total real estate assets under management of approximately $111.3 billion.
This is not a research report and was not prepared by any Underwriter’s research department. Please see additional important information and qualifications at the end of this Term Sheet. |
T-101
| MSC 2017-HR2 | Bakers Centre |
The Property.The Bakers Centre Property comprises a 236,709 SF anchored retail center built between 2013 and 2015, located in the Allegheny West area of Philadelphia, Pennsylvania, approximately 4.7 miles northwest of Center City Philadelphia and approximately 3.2 miles southeast of Manayunk, Pennsylvania. The Bakers Centre Property is located on an approximately 27.4 acre site and was 92.1% occupied by 24 tenants as of July 31, 2017. Totaling eight separate buildings, the Bakers Centre Property is anchored by a 71,036 SF ShopRite and junior anchored by a 25,000 SF Ross Dress for Less and 23,500 SF Planet Fitness. As of July 31, 2017 the weighted average remaining lease term at the Bakers Centre Property was approximately 9.4 years, with the anchor tenant, ShopRite, having 16 years remaining on its lease. The Bakers Centre Property contains 1,250 surface parking spaces, resulting in a parking ratio of approximately 5.3 spaces per 1,000 square feet of rentable area. The Bakers Centre Property is located approximately 1.9 miles east of Interstate 76, which runs east to west through Pennsylvania and connects Philadelphia to Pittsburgh and Harrisburg. The Bakers Centre Property was acquired in an all cash transaction by the Bakers Centre Borrower on March 30, 2017.
Major Tenants.
ShopRite(71,036 SF, 30.0% of NRA, 25.3% of underwritten base rent). The ShopRite lease commenced August 1, 2013 and has an expiration date of July 31, 2033 with ten, five-year renewal options. ShopRite, a brand of Wakefern Food Corporation, is a supermarket chain with locations in New Jersey, New York, Connecticut, Pennsylvania, Delaware and Maryland. Wakefern Food Corporation is the largest retailer-owner cooperative in the United States, comprising 50 member companies who independently own and operate 344 retail supermarkets and employ more than 70,000 people. According to the appraisal, ShopRite ranked number one in 2015-2016 Philadelphia market share, accounting for 24.0% of the total grocer market and since 2014, ShopRite has increased its total sales volume in Philadelphia by 26.0% via same-store sales growth and new stores openings.
Ross Dress for Less(25,000 SF, 10.6% of NRA, 9.4% of underwritten base rent, rated A3/A- by Moody’s/Fitch). The Ross Dress for Less lease commenced December 24, 2013 and has an expiration date of January 31, 2024 with four, five-year renewal options. Ross Dress for Less (NASDAQ: ROST) is the largest off-price apparel and home fashion chain store in the United States with 1,384 locations in 37 states, the District of Columbia and Guam, as of July 29, 2017. Ross Dress for Less reported total revenue and net income of $12.9 billion and $1.1 billion, respectively, for the fiscal year ended January 28, 2017 as compared to total revenues and net income of $11.9 billion and $1.0 billion, respectively for the fiscal year ended January 30, 2016.
Planet Fitness(23,500 SF, 9.9% of NRA, 7.1% of underwritten base rent, rated B1 by Moody’s). The Planet Fitness lease commenced October 15, 2013 and has an expiration date of May 31, 2024 with three, five-year renewal options and then one, four-year and eleven month renewal option. Planet Fitness (NYSE: PLNT), is a franchisor and operator of fitness centers with approximately 10.5 million members and 1,432 owned and franchised locations in 49 states, the District of Columbia, Puerto Rico, Canada and the Dominican Republic as of September 30, 2017. Planet Fitness reported total revenue and net income of $378.2 million and $71.2 million, respectively, for the year ended December 31, 2016 as compared to total revenues and net income of $330.5 million and $31.8 million for the year ended December 31, 2015.
The following table presents certain information relating to the anchor tenants and major tenants at the Bakers Centre Property.
| Tenant Summary(1) | ||||||||
| Tenant Name | Credit Rating (Moody’s/S&P/Fitch)(2) | Tenant SF | % of Collateral SF | Annual UW Rent | % of Annual UW | Annual UW Rent PSF | Lease Expiration | |
| Anchor/Major Tenants | ||||||||
| ShopRite | NR/NR/NR | 71,036 | 30.0% | $887,950 | 25.3% | $12.50 | 7/31/2033 | |
| Ross Dress for Less | A3/A-/NR | 25,000 | 10.6% | $328,750 | 9.4% | $13.15 | 1/31/2024 | |
| Planet Fitness | B1/NR/NR | 23,500 | 9.9% | $250,000 | 7.1% | $10.64 | 5/31/2024 | |
| Subtotal/Wtd. Avg. | 119,536 | 50.5% | $1,466,700 | 41.8% | $12.27 | |||
| Other Tenants | 98,523 | 41.6% | $2,038,882 | 58.2% | $20.69 | |||
| Vacant Space | 18,650 | 7.9% | $0 | 0.0% | $0.00 | |||
| Total/Wtd. Avg. | 236,709 | 100.0% | $3,505,581 | 100.0% | $16.08 | |||
| (1) | Information is based on the underwritten rent roll dated July 31, 2017. |
| (2) | Certain ratings are those of the parent company whether or not the parent guarantees the lease. |
This is not a research report and was not prepared by any Underwriter’s research department. Please see additional important information and qualifications at the end of this Term Sheet. |
T-102
| MSC 2017-HR2 | Bakers Centre |
The following table presents certain information relating to the lease rollover schedule at the Bakers Centre Property:
| Lease Rollover Schedule(1)(2) | ||||||||
| Year | # of Leases Rolling | SF Rolling | % of Total SF Rolling | Cumulative % of Total SF Rolling | UW Rent PSF Rolling(3) | Total UW Rent Rolling(3) | % of Total Rent Rolling(3) | Cumulative % of Total Rent Rolling(3) |
| MTM | 0 | 0 | 0.0% | 0.0% | $0.00 | $0 | 0.0% | 0.0% |
| 2017 | 0 | 0 | 0.0% | 0.0% | $0.00 | $0 | 0.0% | 0.0% |
| 2018 | 4 | 10,260 | 4.3% | 4.3% | $19.69 | $202,039 | 5.8% | 5.8% |
| 2019 | 1 | 1,710 | 0.7% | 5.1% | $23.00 | $39,330 | 1.1% | 6.9% |
| 2020 | 1 | 78 | 0.0% | 5.1% | $288.46 | $22,500 | 0.6% | 7.5% |
| 2021 | 1 | 1,902 | 0.8% | 5.9% | $23.00 | $43,746 | 1.2% | 8.8% |
| 2022 | 2 | 9,258 | 3.9% | 9.8% | $23.47 | $217,280 | 6.2% | 15.0% |
| 2023 | 7 | 46,189 | 19.5% | 29.3% | $20.41 | $942,689 | 26.9% | 41.9% |
| 2024 | 3 | 58,500 | 24.7% | 54.0% | $12.46 | $728,750 | 20.8% | 62.7% |
| 2025 | 1 | 1,800 | 0.8% | 54.8% | $25.00 | $45,000 | 1.3% | 63.9% |
| 2026 | 2 | 6,060 | 2.6% | 57.4% | $35.14 | $212,940 | 6.1% | 70.0% |
| 2027 | 1 | 11,266 | 4.8% | 62.1% | $14.50 | $163,357 | 4.7% | 74.7% |
| 2028 and Beyond | 1 | 71,036 | 30.0% | 92.1% | $12.50 | $887,950 | 25.3% | 100.0% |
| Vacant | 0 | 18,650 | 7.9% | 100.0% | $0.00 | $0 | 0.0% | 100.0% |
| Total/Wtd. Avg. | 24 | 236,709 | 100.0% | $16.08 | $3,505,581 | 100.0% | ||
| (1) | Information is based on the underwritten rent roll as of July 31, 2017. |
| (2) | Certain tenants may have lease termination options that are exercisable prior to the originally stated expiration date of the subject lease and that are not considered in the lease rollover schedule. |
| (3) | Total/Wtd. Avg. UW Rent Rolling includes rent steps through November 22, 2018 for six tenants totaling $59,538 and the present value of rent steps for one investment grade tenant totaling $10,713. |
The Market.
The Bakers Centre Property is located in the Allegheny West area of Philadelphia, Pennsylvania, approximately 4.7 miles northwest of Center City Philadelphia and approximately 3.2 miles southeast of Manayunk, Pennsylvania. The Philadelphia MSA is the sixth-largest metropolitan area in the United States with a population of over 6.0 million people. According to a third-party report, the Philadelphia MSA had a 2016 average household income of $89,119 which was higher than the Pennsylvania and United States average household incomes during 2016 of $74,914 and $78,425, respectively. According to a third-party report, the Philadelphia MSA had a 2016 average retail sales per household of $59,319 which was higher than the Pennsylvania and United States average retail sales per household during 2016 of $56,627 and $56,338, respectively. 2016 Population within a one-, three- and five mile radius of the Bakers Centre Property was 50,294, 397,643 and 1,039,994 people, respectively. Located north of the Bakers Centre Property is Drexel University College of Medicine, Jefferson University and Falls Centre, an office and residential complex which has undergone approximately $60.0 million in redevelopment and improvements since 2009. According to a third party market report, as of September 2017, the Northwest Philadelphia Retail Submarket, in which the Bakers Centre Property is located, had a vacancy rate and average asking rents of 3.7% and $18.07, respectively, and a neighborhood center vacancy rate and average asking rents of 9.1% and $21.56, respectively. According to a third party market report, net absorption as of September 2017 for the Northwest Philadelphia Retail Submarket was positive 83,000 SF compared to the historical average net absorption of positive 36,000 SF. The appraisal concluded to an average market rent for the Bakers Centre Property including both the anchor tenants and in-line tenants of $16.32, net, which is approximately 1.5% higher than the underwritten base rent of $16.08, net, at the Bakers Centre Property.
The following table presents competitive retail properties with respect to the Bakers Centre Property:
| Competitive Properties(1) | |||||
Property Name | Distance from Subject | Year Built/ Renovated | Size (SF) | Occupancy | Anchor Tenants |
| Bakers Centre Property | — | 2013-2015 / N/A | 236,709(2) | 92.1%(2) | ShopRite, Ross Dress for Less, Planet Fitness(2) |
| Hope Plaza | 1.4 miles | 1950 / 1999 | 58,994 | 69.0% | Save-A-Lot, Rite Aid |
| Strawberry Square | 1.7 miles | 1985 / 1994 | 72,488 | 100.0% | Save-A-Lot, Rite Aid |
| Plaza Allegheny | 2.6 miles | 2015 / N/A | 69,018 | 100.0% | Save-A-Lot |
| Shoppes at LaSalle | 2.9 miles | 2009 / N/A | 88,522 | 96.0% | The Fresh Grocer, Rite Aid |
| The Fresh Grocer Shopping Center | 2.9 miles | 1960 / N/A | 80,000 | 100.0% | The Fresh Grocer |
| Bala Cynwyd Shopping Center | 3.2 miles | 1972 / N/A | 292,189 | 95.0% | Acme Markers, Lord & Taylor |
| Progress Plaza | 3.3 miles | 1968 / 2008 | 89,694 | 91.0% | The Fresh Grocer |
| (1) | Source: Appraisal |
| (2) | Based on the underwritten rent roll dated July 31, 2017. |
This is not a research report and was not prepared by any Underwriter’s research department. Please see additional important information and qualifications at the end of this Term Sheet. |
T-103
| MSC 2017-HR2 | Bakers Centre |
Operating History and Underwritten Net Cash Flow.The following table presents certain information relating to the historical operating performance and Underwritten Net Cash Flow at the Bakers Centre Property:
| Cash Flow Analysis(1) | |||||
| 2014 | 2015 | 2016 | UW | UW PSF | |
| Base Rent(2) | $2,857,515 | $3,140,744 | $3,214,331 | $3,505,581 | $14.81 |
| Grossed Up Vacant Space | $0 | $0 | $0 | $337,886 | $1.43 |
| Total Recoveries | $572,014 | $480,277 | $596,005 | $557,957 | $2.36 |
| Other Income | $21,625 | $0 | $5,294 | $0 | $0.00 |
| Less Vacancy & Credit Loss | $0 | $0 | $0 | ($337,886) | ($1.43) |
| Effective Gross Income | $3,451,155 | $3,621,022 | $3,815,631 | $4,063,538 | $17.17 |
| Total Operating Expenses(3) | $794,766 | $876,554 | $901,819 | $842,132 | $3.56 |
| Net Operating Income | $2,656,389 | $2,744,468 | $2,913,812 | $3,221,406 | $13.61 |
| Capital Expenditures | $0 | $0 | $0 | $47,342 | $0.20 |
| TI/LC | $0 | $0 | $0 | $154,027 | $0.65 |
| Net Cash Flow | $2,656,389 | $2,744,468 | $2,913,812 | $3,020,037 | $12.76 |
| Occupancy(4) | N/A | N/A | N/A | 92.3% | |
| NOI DSCR | 2.08x | 2.15x | 2.28x | 2.52x | |
| NCF DSCR | 2.08x | 2.15x | 2.28x | 2.36x | |
| NOI Debt Yield | 8.3% | 8.6% | 9.1% | 10.1% | |
| NCF Debt Yield | 8.3% | 8.6% | 9.1% | 9.4% | |
| (1) | Historical information is not available subsequent to December 31, 2016, as the Bakers Centre Borrower acquired the property on March 30, 2017, and for purposes of the acquisition, only obtained historical financial information through December 31, 2016. Accordingly, the Bakers Centre Borrower did not obtain financial information for the period between January 1, 2017 and March 30, 2017 and as of the origination of the Bakers Centre Mortgage Loan only had partial year financial information beginning from the date of acquisition of the Bakers Centre Property. |
| (2) | Base Rent includes rent steps through November 22, 2018 for six tenants totaling $59,538 and the present value of rent steps for one investment grade tenant totaling $10,713. In addition to the aforementioned rent steps, the increase in UW Base Rent from 2016 Base Rent is primarily due to 3 new tenants executing leases at the Bakers Centre Property aggregating $196,877 in UW Base Rent during 2017. |
| (3) | The Bakers Centre Property was given a 10-year tax abatement on the value of the improvements that were built from 2013-2015, which reduces the Taxable Value of each parcel to include the land only until 2024. The combined 2018 Net Taxable Value for all subject parcels is $12,188,067, which results in an abated real estate tax expense of $170,609 or $0.72 per sf based on the 2017 tax rate of 1.3998%. Real Estate Taxes were underwritten based on the abated tax expense at $170,609 or $0.72 per sf. The taxable portion of the value may be adjusted throughout the abatement period; however, the improvements will remain exempt regardless of change in taxable value throughout the abatement period. |
| (4) | Historical occupancy information was not obtained by the Bakers Centre Borrower in connection with the acquisition of the Bakers Centre Property as construction was completed in 2015. As most of the tenants were still on their initial leases at the Bakers Centre Property as of the time of the acquisition, the Bakers Centre Borrower did not obtain historical rent rolls for the Bakers Centre Property. |
Escrows and Reserves. At origination, the Bakers Centre Borrower deposited $54,289 for unfunded obligations related to Pep Boys’ lease at the Bakers Centre Property.
During the existence of a Cash Sweep Event Period (as defined below), the loan documents require ongoing monthly escrows for (i) real estate taxes (in an amount equal to one-twelfth of the amount that the lender estimates will be necessary to pay taxes over the then succeeding 12-month period), (ii) TI/LCs (in an amount equal to $19,727, subject to a cap of $473,438) and (iii) replacement reserves (in an amount equal to $3,945, subject to a cap of $94,688); however, such reserves are waived so long as no Cash Sweep Event Period is in effect. The loan documents do not require ongoing monthly escrows for insurance premiums as long as (i) no event of default under the Bakers Centre Mortgage Loan is continuing and (ii) the Bakers Centre Borrower provides the lender with evidence that the Bakers Centre Property is insured via an acceptable blanket insurance umbrella policy and such policy is in full force and effect. Absent satisfaction of such conditions, an ongoing monthly insurance escrow is required in an amount equal to one-twelfth of the amount that the lender estimates will be necessary to pay insurance premiums over the then succeeding twelve-month period.
Lockbox and Cash Management. The Bakers Centre Mortgage Loan has a hard lockbox with springing cash management upon the commencement and during the continuance of a Cash Sweep Event Period. Also during the continuation of a Cash Sweep Event Period, the Bakers Centre Borrower will be required to deposit all excess cash with respect to the Bakers Centre Mortgage Loan into an account to be held by the lender as additional security for the Bakers Centre Mortgage Loan. So long as no event of default is continuing under the Bakers Centre Mortgage Loan documents, the Bakers Centre Borrower is entitled to receive disbursements from the excess cash reserve for certain expenses at the Bakers Centre Property, including payment of tenant improvement costs, leasing commission obligations, and vacant space preparation costs, among other permitted disbursements.
A “Cash Sweep Event Period” will commence upon any of the following: (i) the occurrence and continuance of an event of default under the Bakers Centre Mortgage Loan; (ii) any bankruptcy or similar action of the Bakers Centre Borrower; (iii) the debt yield falling below 7.5% for two consecutive quarters; or (iv) the occurrence of a Specified Tenant Trigger Period (as defined below) and end, with regard to clause (i), upon the cure of such event of default; with regard to clause (ii), in the event the bankruptcy action is an involuntary bankruptcy action that was not consented to by the Bakers Centre Borrower, such bankruptcy action being discharged, stayed or dismissed within ninety days of the filing thereof; with regard to clause (iii), upon the debt yield being equal to or greater than 7.5% for two consecutive calendar quarters, which may be achieved by the Bakers Centre Borrower prepaying the Bakers Centre Mortgage Loan in an amount which would result in the debt yield being greater than or equal to 7.5% (plus any yield maintenance or other prepayment premium required under the Bakers Centre Mortgage Loan documents); and with regard to clause (iv), upon the cure of a Specified Tenant Trigger Period.
A “Specified Tenant Trigger Period” will commence upon (i) any bankruptcy or similar insolvency of the tenant under the ShopRite lease (including any assignee permitted without the Bakers Centre Borrower’s consent under the ShopRite lease), together with any parent or affiliate thereof providing credit support or a guaranty under such lease or any replacement tenant of all or any portion of the ShopRite space approved in accordance with the Bakers Centre Mortgage Loan documents (for purposes of this definition, “ShopRite”); (ii) any termination or cancellation of ShopRite’s lease (including, without
This is not a research report and was not prepared by any Underwriter’s research department. Please see additional important information and qualifications at the end of this Term Sheet. |
T-104
| MSC 2017-HR2 | Bakers Centre |
limitation, rejection in any bankruptcy or similar insolvency proceeding) and/or ShopRite’s lease failing to otherwise be in full force and effect; (iii) ShopRite being in monetary or material non-monetary default under its lease beyond any applicable notice and/or cure periods; (iv) ShopRite failing to be in actual, physical possession of its space, failing to be open for business during customary hours, giving notice of its intent to commence any of the foregoing, or going dark (except to the extent ShopRite subleases any portion of its space and the sub-tenant is in actual, physical possession of its space and open to the public for business during customary hours); (v) ShopRite terminating or canceling all or any portion in excess of 15.0% of its lease, or gives notice of either of the foregoing, and ending upon the earlier to occur of (A) as applicable, ShopRite affirming its lease in the applicable bankruptcy proceeding, the lender’s receipt of evidence that the applicable vacant or dark space is leased, open for business and the replacement tenant is paying full unabated rent, the lender’s receipt of satisfactory evidence that the default under the ShopRite lease has been cured, or ShopRite’s revocation or rescission of all termination or cancellation notices with respect to its lease and the re-affirmation of the lease as being in full force and effect or (B) the date when an amount equal to $30.00 per square foot on all vacant or known vacating space has been transferred from the excess cash flow reserve into the TI/LC reserve.
Additional Secured Indebtedness (not including trade debts).Not permitted.
Mezzanine Loan and Preferred Equity. Not permitted.
Release of Property. Not permitted.
Terrorism Insurance.The Bakers Centre Mortgage Loan documents require that the “all risk” insurance policy required to be maintained by the Bakers Centre Borrower provide coverage for terrorism, with no deductible for terrorism in excess of $500,000, in an amount equal to the full replacement cost of the Bakers Centre Property, as well as business interruption insurance covering no less than the 18-month period following the occurrence of a casualty event. If (A) TRIPRA is not in effect, (B) TRIPRA is modified which results in a material increase in terrorism insurance premiums, or (C) there is a disruption in the terrorism insurance marketplace as the result of a terrorism event occurring on United States soil which results in a material increase in terrorism insurance premiums, then provided that terrorism insurance is commercially available, the Bakers Centre Borrower is required to carry terrorism insurance throughout the term of the Bakers Centre Mortgage Loan; provided, however, if any of the events in clauses (A) through (C) occurs, then the Bakers Centre Borrower is not required to pay annual premiums in excess of the TC Cap (defined below) in order to obtain the required terrorism insurance (but the Bakers Centre Borrower is obligated to purchase the maximum amount of terrorism insurance available with funds equal to the TC Cap).
As used above, “TC Cap” means an amount equal to two times the then-current property insurance premium that is payable at such time in respect of the Bakers Centre Property, business interruption/rental loss and liability insurance required under the Bakers Centre Mortgage Loan documents (without giving effect to the cost of the terrorism, flood, earthquake and windstorm components of such casualty and business interruption/rental loss insurance at the time that any terrorism insurance is excluded from any policy). See “Risk Factors—Risks Relating to the Mortgage Loans—Terrorism Insurance May Not Be Available for All Mortgaged Properties” in the Preliminary Prospectus.
This is not a research report and was not prepared by any Underwriter’s research department. Please see additional important information and qualifications at the end of this Term Sheet. |
T-105
| MSC 2017-HR2 | Sunrise Plaza San Jose |
Mortgage Loan No. 10 – Sunrise Plaza San Jose
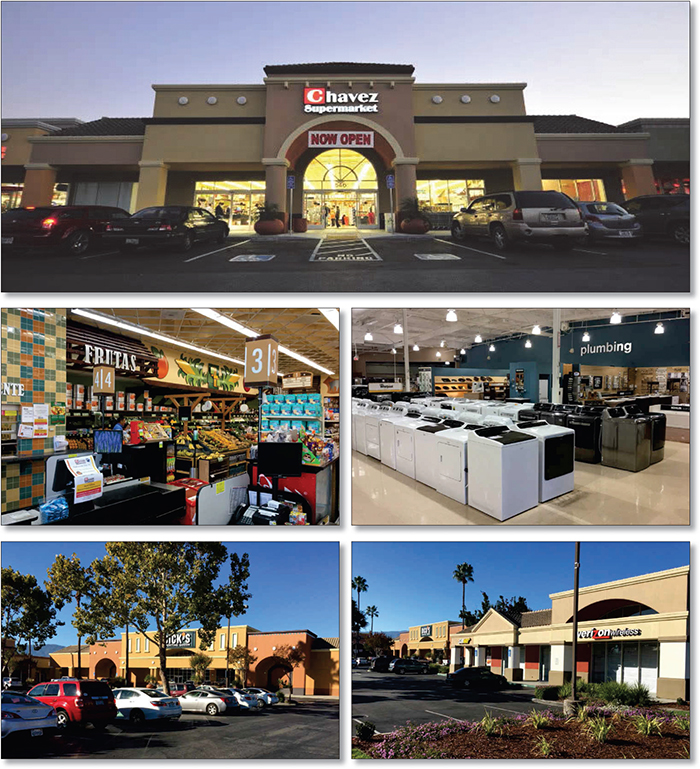
This is not a research report and was not prepared by any Underwriter’s research department. Please see additional important information and qualifications at the end of this Term Sheet. |
T-106
| MSC 2017-HR2 | Sunrise Plaza San Jose |
Mortgage Loan No. 10 – Sunrise Plaza San Jose
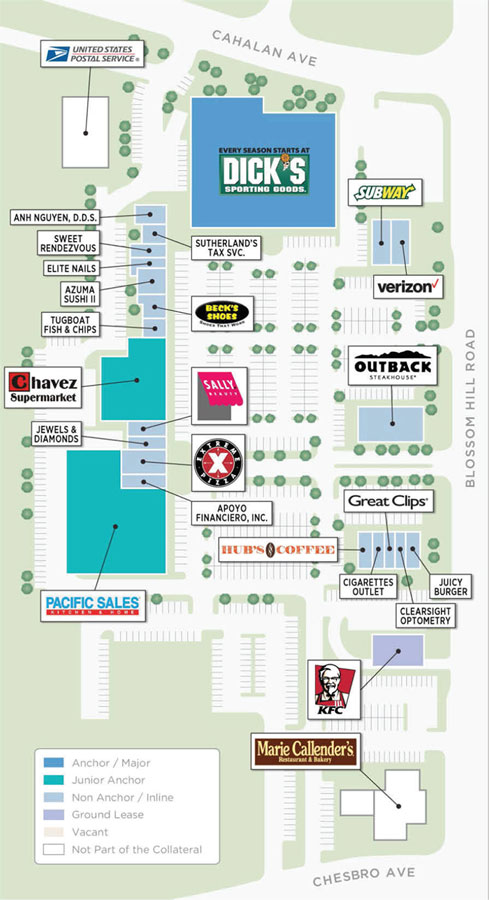
This is not a research report and was not prepared by any Underwriter’s research department. Please see additional important information and qualifications at the end of this Term Sheet. |
T-107
| MSC 2017-HR2 | Sunrise Plaza San Jose |
Mortgage Loan No. 10 – Sunrise Plaza San Jose

This is not a research report and was not prepared by any Underwriter’s research department. Please see additional important information and qualifications at the end of this Term Sheet. |
T-108
| MSC 2017-HR2 | Sunrise Plaza San Jose |
| Mortgage Loan No. 10 – Sunrise Plaza San Jose |
| Mortgage Loan Information | Mortgaged Property Information | ||||||
| Mortgage Loan Seller: | MSMCH | Single Asset/Portfolio: | Single Asset | ||||
| Original Balance: | $27,000,000 | Location: | San Jose, CA 95123 | ||||
| Cut-off Date Balance: | $27,000,000 | General Property Type: | Retail | ||||
| % of Initial Pool Balance: | 2.9% | Detailed Property Type: | Anchored | ||||
| Loan Purpose: | Refinance | Title Vesting: | Fee | ||||
| Sponsors: | Elias Tsigaris; Pete Tsigaris; Gus Tsigaris | Year Built/Renovated: | 1992/NA | ||||
| Mortgage Rate: | 4.3300% | Size: | 112,805 SF | ||||
| Note Date: | 11/21/2017 | Cut-off Date Balance PSF: | $239 | ||||
| First Payment Date: | 1/1/2018 | Maturity Date Balance PSF: | $239 | ||||
| Maturity Date: | 12/1/2027 | Property Manager: | Portfolio Realty Management, Inc. | ||||
| Original Term to Maturity: | 120 months | ||||||
| Original Amortization Term: | 0 months | Underwriting and Financial Information | |||||
| IO Period: | 120 months | ||||||
| Seasoning: | 0 months | Underwriting and Financial Information | |||||
| Prepayment Provisions: | LO (24); DEF (92); O (4) | UW NOI: | $2,575,943 | ||||
| Lockbox/Cash Mgmt Status: | Springing/Springing | UW NOI Debt Yield: | 9.5% | ||||
| Additional Debt Type: | N/A | UW NOI Debt Yield at Maturity: | 9.5% | ||||
| Additional Debt Balance: | N/A | UW NCF DSCR: | 2.06x | ||||
| Future Debt Permitted (Type): | No (N/A) | Most Recent NOI: | $2,819,318 (6/30/2017 TTM) | ||||
| Reserves(1) | 2nd Most Recent NOI: | $2,454,807 (12/31/2016) | |||||
| Type | Initial | Monthly | Cap | 3rd Most Recent NOI: | $2,369,944 (12/31/2015) | ||
| RE Tax: | $149,718 | 29,944 | N/A | Most Recent Occupancy: | 100.0% (11/14/2017) | ||
| Insurance: | $0 | Springing | N/A | 2nd Most Recent Occupancy: | 98.6% (12/31/2016) | ||
| Recurring Replacements: | $0 | $1,410 | N/A | 3rd Most Recent Occupancy: | 98.6% (12/31/2015) | ||
| TI/LC: | $500,000 | $11,751 | $350,000(2) | Appraised Value (as of): | $44,200,000 (10/24/2017) | ||
| Deferred Maintenance: | $4,375 | $0 | N/A | Cut-off Date LTV Ratio: | 61.1% | ||
| Environmental Escrow: | $312,500 | $0 | N/A | Maturity Date LTV Ratio: | 61.1% | ||
| Sources and Uses | |||||||
| Sources | Proceeds | % of Total | Uses | Proceeds | % of Total | ||
| Loan Amount: | $27,000,000 | 100.0% | Loan Payoff: | $20,177,582 | 74.7% | ||
| Closing Costs: | $1,233,156 | 4.6% | |||||
| Reserves: | $966,593 | 3.6% | |||||
| Return of Equity: | $4,622,669 | 17.1% | |||||
| Total Sources: | $27,000,000 | 100.0% | Total Uses: | $27,000,000 | 100.0% | ||
| (1) | See “Escrows and Reserves” below for further discussion of reserve requirements. |
| (2) | The TI/LC Reserve Cap of $350,000 excludes the initial deposit of $500,000. |
The Mortgage Loan.The tenth largest mortgage loan (the “Sunrise Plaza San Jose Mortgage Loan”) is evidenced by a promissory note in the original principal amount of $27,000,000 and secured by a first priority fee mortgage encumbering an anchored retail property in San Jose, California (the “Sunrise Plaza San Jose Property”). Proceeds of the Sunrise Plaza San Jose Mortgage Loan were primarily used to refinance the previous loan secured by the Sunrise Plaza San Jose Property, fund upfront reserves, pay closing costs and return equity to the Sunrise Plaza San Jose Borrower (as defined below). The Sunrise Plaza San Jose Property was previously collateral for a loan securitized in the BSCMS 2006-T22 transaction.
The Borrower and the Sponsors. The borrower is E.P. & G. Properties No. 5 LLC (the “Sunrise Plaza San Jose Borrower”), a single-purpose Delaware limited liability company, with one independent director in its organizational structure. The Sunrise Plaza San Jose Borrower is 33.3% owned by Elias Tsigaris, 33.3% owned by Pete Tsigaris and 33.3% owned by Gus Tsigaris. Elias Tsigaris, Pete Tsigaris and Gus Tsigaris are the borrower sponsors of the Sunrise Plaza San Jose Mortgage Loan, as well as the non-recourse carveout guarantors.
Collectively, Elias Tsigaris, Pete Tsigaris and Gus Tsigaris own five commercial properties (inclusive of the Sunrise Plaza San Jose Property) in the South Bay area. The Sunrise Plaza San Jose Borrower sponsors have owned the Sunrise Plaza San Jose Property since 1999—an ownership tenure of approximately 18 years.
The Property.The Sunrise Plaza San Jose Property is a 112,805 SF anchored retail center located in San Jose, California. Built in 1992, the Sunrise Plaza San Jose Property sits on 10.19 acres and contains a total of 532 parking spaces (4.72 spaces per 1,000 SF of NRA).
As of November 14, 2017, the Sunrise Plaza San Jose Property was 100.0% leased by a mix of 23 national and regional tenants, including Dick’s Sporting Goods, Pacific Sales, Chavez Supermarket, Outback Steakhouse, Verizon Wireless, KFC, Beck’s Shoes, Sally Beauty Co. and Subway. Since 2007, the Sunrise Plaza San Jose Property has had an average occupancy of 97.9%, with a ten year low of 95.5%. Dick’s Sporting Goods has served
This is not a research report and was not prepared by any Underwriter’s research department. Please see additional important information and qualifications at the end of this Term Sheet. |
T-109
| MSC 2017-HR2 | Sunrise Plaza San Jose |
as an anchor tenant at the Sunrise Plaza San Jose Property since 2016 when it assumed a lease from Sports Authority, which had previously occupied the Sunrise Plaza San Jose Property’s anchor space since 1992. According to the borrower sponsors, Dick’s Sporting Goods invested approximately $3.0 million to build out its space in 2016, following its lease assumption, and had its re-opening in May 2017.
Major Tenants.
Dick’s Sporting Goods (41,176 SF, 36.5% of NRA, 24.0% ofunderwritten rent). Dick’s Sporting Goods has been a tenant at the Sunrise Plaza San Jose Property since 2016, when it assumed a lease from Sports Authority, which had previously occupied the Sunrise Plaza San Jose Property’s anchor space since 1992. Founded in 1948, Dick’s Sporting Goods now has 675 locations and also owns and operates Golf Galaxy, Field & Stream, True Runner and Chelsea Collective specialty stores. According to the borrower sponsors, Dick’s Sporting Goods invested approximately $3.0 million to build out its space in 2016, following its lease assumption, and had its re-opening in May 2017. Dick’s Sporting Goods has a lease expiration of January 31, 2019 and has three five-year renewal options.
Pacific Sales(25,200 SF, 22.3% of NRA, 19.1% of underwritten rent). Pacific Sales, a tenant at the Sunrise Plaza San Jose Property since 1996, is a retailer that offers appliances as well as an assortment of home electronics and other home improvement products. Pacific Sales is a wholly owned subsidiary of Best Buy. Pacific Sales exercised a five-year renewal option in 2016, has a lease expiration of June 30, 2021 and has two five-year renewal options remaining.
Chavez Supermarket(11,710 SF, 10.4% of NRA, 9.2% of underwritten rent). Chavez Supermarket, a tenant at the Sunrise Plaza San Jose Property since 2010, is a full-service, family-owned grocery store chain retailer of Mexican and Latin American grocery products. Chavez Supermarket has 10 locations, all located in the San Francisco Bay Area market, including three locations within San Jose. Chavez Supermarket has a lease expiration of July 31, 2020 and has three five-year renewal options.
The following table presents a summary regarding the largest tenants at the Sunrise Plaza San Jose Property:
| Tenant Summary(1) | ||||||||||
| Tenant Name | Credit Rating (Fitch/Moody’s/S&P)(2) | Tenant SF | Approx. % of SF | Annual UW Rent | Annual UW Rent PSF | % of Annual UW Rent |
2016 Sales | Occ. Cost %(4) | Lease Expiration | |
| $ | PSF | |||||||||
| Major Tenants | ||||||||||
| Dick’s Sporting Goods | NR/NR/NR | 41,176 | 36.5% | $667,051 | $16.20 | 24.0% | NAV | NAV | NAV | 1/31/2019 |
| Pacific Sales | BBB-/Baa1/BBB- | 25,200 | 22.3% | $530,712 | $21.06 | 19.1% | NAV | NAV | NAV | 6/30/2021 |
| Chavez Supermarket | NR/NR/NR | 11,710 | 10.4% | $256,500 | $21.90 | 9.2% | NAV | NAV | NAV | 7/31/2020 |
| Outback Steakhouse | NR/NR/BB | 6,000 | 5.3% | $103,152 | $17.19 | 3.7% | $2,987,727 | $498 | 3.5% | 12/31/2019 |
| Subtotal/Wtd. Avg. | 84,086 | 74.5% | $1,557,416 | $18.52 | 56.1% | |||||
| Other Tenants | 28,719 | 25.5% | $1,220,499 | $42.50 | 43.9% | |||||
| Vacant Space | 0 | 0.0% | $0 | $0.00 | 0.0% | |||||
| Total/Wtd. Avg. | 112,805 | 100.0% | $2,777,915 | $24.63(3) | 100.0% | |||||
| (1) | Information is based on the underwritten rent roll as of November 14, 2017. |
| (2) | Certain ratings are those of the parent company whether or not the parent guarantees the lease. |
| (3) | Total/Wtd. Avg. Annual UW Rent PSF excludes vacant space. |
| (4) | Occ. Cost % is based on the underwritten rent as of the November 14, 2017 rent roll divided by the most recently reported sales. |
This is not a research report and was not prepared by any Underwriter’s research department. Please see additional important information and qualifications at the end of this Term Sheet. |
T-110
| MSC 2017-HR2 | Sunrise Plaza San Jose |
The following table presents certain information relating to the lease rollover at the Sunrise Plaza San Jose Property:
| Lease Rollover Schedule(1)(2) | ||||||||
| Year | # of Leases Rolling | SF Rolling | Approx. % of Total SF Rolling | Approx. Cumulative % of SF Rolling | Total UW Rent Rolling | Annual UW Rent PSF Rolling | Approx. % of Total Rent Rolling | Approx. Cumulative % of Total Rent Rolling |
| MTM | 0 | 0 | 0.0% | 0.0% | $0 | $0.00 | 0.0% | 0.0% |
| 2017 | 0 | 0 | 0.0% | 0.0% | $0 | $0.00 | 0.0% | 0.0% |
| 2018(4) | 4 | 3,398 | 3.0% | 3.0% | $126,196 | $37.14 | 4.5% | 4.5% |
| 2019 | 8 | 56,720 | 50.3% | 53.3% | $1,157,330 | $20.40 | 41.7% | 46.2% |
| 2020(4) | 3 | 12,645 | 11.2% | 64.5% | $318,829 | $25.21 | 11.5% | 57.7% |
| 2021 | 6 | 33,599 | 29.8% | 94.3% | $851,662 | $25.35 | 30.7% | 88.3% |
| 2022 | 2 | 2,583 | 2.3% | 96.6% | $92,586 | $35.84 | 3.3% | 91.7% |
| 2023 | 0 | 0 | 0.0% | 96.6% | $0 | $0.00 | 0.0% | 91.7% |
| 2024 | 1 | 1,560 | 1.4% | 98.0% | $39,312 | $25.20 | 1.4% | 93.1% |
| 2025 | 0 | 0 | 0.0% | 98.0% | $0 | $0.00 | 0.0% | 93.1% |
| 2026 | 1 | 2,300 | 2.0% | 100.0% | $192,000 | $83.48 | 6.9% | 100.0% |
| 2027 | 0 | 0 | 0.0% | 100.0% | $0 | $0.00 | 0.0% | 100.0% |
| 2028 & Beyond | 0 | 0 | 0.0% | 100.0% | $0 | $0.00 | 0.0% | 100.0% |
| Vacant | 0 | 0 | 0.0% | 100.0% | $0 | $0.00 | 0.0% | 100.0% |
| Total/Wtd. Avg. | 25 | 112,805 | 100.0% | $2,777,915 | $24.63(3) | 100.0% | ||
| (1) | Information is based on the underwritten rent roll as of November 14, 2017. |
| (2) | Certain tenants may have lease termination options that are exercisable prior to the stated expiration date of the subject lease or leases which are not considered in the lease rollover schedule. |
| (3) | Total/Wtd. Avg. Annual UW Rent PSF Rolling excludes vacant space. |
| (4) | 2018 includes one lease related to recycling, which makes up 0 SF and $9,363 of Total UW Rent Rolling. 2020 includes one lease related to an antenna, which makes up 0 SF and $22,138 of Total UW Rent Rolling. |
The Market. The Sunrise Plaza San Jose Property is located in the South San Jose retail submarket of the South Bay/San Jose retail market. According to the appraisal, as of the third quarter of 2017, vacancy rates in the South Bay/San Jose retail market were approximately 4.5% with average asking rents of $32.23 PSF. Since 2007, the annual vacancy rate for the South Bay/San Jose retail market has ranged from 3.5% to 5.9% and asking rent has ranged from $25.35 to $32.26.
As of the third quarter of 2017, vacancy rates in the South San Jose retail submarket were approximately 3.2% with average asking rents of $30.27 PSF. Since the fourth quarter of 2013, the quarterly vacancy rate for the South San Jose retail submarket has ranged from 2.9% to 3.8% and asking rent has ranged from $28.26 to $34.28.
According to the appraisal, the 2017 estimated population within a one-, three- and five-mile radius of the Sunrise Plaza San Jose Property is 25,586, 220,464 and 432,494, respectively. The 2017 estimated average household income within a one-, three- and five-mile radius of the Sunrise Plaza San Jose Property is $110,150, $122,115 and $130,921, respectively.
This is not a research report and was not prepared by any Underwriter’s research department. Please see additional important information and qualifications at the end of this Term Sheet. |
T-111
| MSC 2017-HR2 | Sunrise Plaza San Jose |
The following table presents recent leasing data at comparable retail properties with respect to the Sunrise Plaza San Jose Property:
| Comparable Lease Summary | |||||||||
Property Name City, State | Distance from Subject | Year Built | Occupancy | Tenant | Lease Area (SF) | Lease Date | Base Rent PSF | Lease Term (Yrs.) | Reimbursements |
Bernal Plaza San Jose, CA | 4.0 miles | 2001 | 100% | Simple Viet | 1,033 | Jan-16 | $42.00 | 5.0 | NNN |
Hacienda Gardens San Jose, CA | 4.0 miles | 1965 | 100% | Restaurant | 9,600 | Nov-16 | $30.00 | 5.0 | NNN |
1040-1080 McLaughlin Avenue San Jose, CA | 6.0 miles | 1966 | 100% | Waiyi Yu U-Tea Cafe Thien Huong | 812 1,300 980 | Jan-17 Jan-17 Sep-16 | $35.65 $30.46 $22.04 | 5.0 6.0 3.0 | NNN NNN NNN |
Bloom Plaza Shopping Center San Jose, CA | 0.7 miles | 1970 | 93% | Positive Approaches | 2,106 | Nov-14 | $19.80 | 5.0 | NNN |
Snell & Branham Plaza San Jose, CA | 1.3 miles | 1989 | 100% | Pop Up Tea | 1,299 | Jun-15 | $30.00 | 5.0 | NNN |
Hartnell Plaza Salinas, CA | 41.0 miles | 1972 | 95% | Fitness Center | 23,200 | Feb-17 | $8.40 | 10.0 | NNN |
Alamo Plaza Gilroy, CA | 22.0 miles | 1988 | 100% | Rockin’ Jump Sears Hometown Bay Furniture | 5,000 10,000 32,294 | May-17 Apr-17 Feb-17 | $18.00 $15.00 $18.00 | 5.2 10.0 10.0 | NNN NNN NNN |
Pacheco Pass Shopping Gilroy, CA | 23.0 miles | 2003 | 98% | Old Navy Tacqueria Cancun Select Comfort Starbucks | 18,800 2,528 2,431 2,058 | Apr-17 Mar-17 Aug-16 Jun-16 | $15.25 $45.00 $42.00 $45.00 | 3.0 5.0 5.6 10.2 | NNN NNN NNN NNN |
Source: Appraisal.
The following table presents certain information regarding competitive properties with respect to the Sunrise Plaza San Jose Property:
| Competitive Property Summary | ||||
| Property Address - Name | City, State | Distance from Subject | Size (SF) | Total Occupancy |
| Bernal Plaza | San Jose, CA | 4.0 miles | 139,559 | 100.0% |
| Hacienda Gardens | San Jose, CA | 4.0 miles | 85,847 | 100.0% |
| 1040-1080 McLaughlin Avenue | San Jose, CA | 6.0 miles | 16,633 | 100.0% |
| Bloom Plaza Shopping Center | San Jose, CA | 0.7 miles | 119,415 | 93.0% |
| Snell & Branham Plaza | San Jose, CA | 1.3 miles | 99,351 | 100.0% |
Source:Appraisal.
This is not a research report and was not prepared by any Underwriter’s research department. Please see additional important information and qualifications at the end of this Term Sheet. |
T-112
| MSC 2017-HR2 | Sunrise Plaza San Jose |
Operating History and Underwritten Net Cash Flow. The following table presents certain information relating to the historical operating performance and the Underwritten Net Cash Flow at the Sunrise Plaza San Jose Property:
| Cash Flow Analysis | ||||||
| 2014 | 2015 | 2016 | 6/30/2017 TTM | UW | UW PSF | |
| Base Rent(1) | $2,542,101 | $2,587,068 | $2,568,499 | $2,817,008 | $2,777,915 | $24.63 |
| Total Recoveries | $593,544 | $527,842 | $645,910 | $833,497 | $785,893 | $6.97 |
| Less Vacancy | $0 | $0 | $0 | $0 | ($178,190) | ($1.58) |
| Effective Gross Income | $3,135,645 | $3,114,911 | $3,214,409 | $3,650,504 | $3,385,618 | $30.01 |
| Total Expenses | $737,536 | $744,967 | $759,602 | $831,187 | $809,675 | $7.18 |
| Net Operating Income | $2,398,109 | $2,369,944 | $2,454,807 | $2,819,318 | $2,575,943 | $22.84 |
| Capital Expenditures | $0 | $0 | $0 | $0 | $16,291 | $0.14 |
| TI/LC | $0 | $0 | $0 | $0 | $118,445 | $1.05 |
| Net Cash Flow | $2,398,109 | $2,369,944 | $2,454,807 | $2,819,318 | $2,441,207 | $21.64 |
| Occupancy % | 99.4% | 98.6% | 98.6% | 100.0%(2) | 95.0% | |
| NOI DSCR | 2.02x | 2.00x | 2.07x | 2.38x | 2.17x | |
| NCF DSCR | 2.02x | 2.00x | 2.07x | 2.38x | 2.06x | |
| NOI Debt Yield | 8.9% | 8.8% | 9.1% | 10.4% | 9.5% | |
| NCF Debt Yield | 8.9% | 8.8% | 9.1% | 10.4% | 9.0% | |
| (1) | Underwritten Base Rent is based on the rent roll dated November 14, 2017 and includes rent steps through November 1, 2018 totaling $20,642. |
| (2) | 6/30/2017 TTM Occupancy % reflects occupancy as of November 14, 2017. |
Escrows and Reserves. The Sunrise Plaza San Jose Mortgage Loan documents require upfront reserves of $500,000 for future tenant improvement and leasing commission (“TI/LC”) obligations, $312,500 for environmental remediation (provided not more than $250,000 may be disbursed from such reserve for environmental remediation and the remainder must be retained as security for the Sunrise Plaza San Jose Mortgage Loan), $149,718 for real estate taxes, and $4,375 for required repairs. The upfront TI/LC deposit is required to be released to the Sunrise Plaza San Jose Borrower in the amounts of $300,000 and $200,000 respectively, in connection with a lease extension by Dick’s Sporting Goods, Inc. (“Dick’s”) and Pacific Sales Kitchen and Bath Centers, LLC (“Pacific Sales”), respectively, if no event of default exists and the following conditions are satisfied as to the applicable tenant: (i) the lender has received and approved written evidence that the tenant has extended its lease for its entire premises for an additional five years (expiring January 31, 2024 in the case of Dick’s and June 30, 2026 in the case of Pacific Sales) on terms acceptable to the lender, (ii) the lender has approved any lease amendment memorializing such extension, (iii) the tenant is in actual physical occupancy of, open to the public for business in, and paying full, unabated rent for, its leased space, and (iv) the lender has received an acceptable tenant estoppel.
The Sunrise Plaza San Jose Borrower is required to deposit monthly into escrow 1/12 of the annual estimated real estate tax payments and 1/12 of the annual estimated insurance premiums (unless an acceptable blanket policy is in place). The Sunrise Plaza San Jose Borrower is required to make monthly deposits of $11,751 for TI/LC reserves and $1,410 for replacement reserves. The Sunrise Plaza San Jose Borrower will not be required to make the monthly TI/LC deposit at any time the amount then on deposit in the TI/LC reserve exceeds $350,000 (excluding the TI/LC reserve deposit made at origination of the Sunrise Plaza San Jose Mortgage Loan).
Lockbox and Cash Management. The Sunrise Plaza San Jose Mortgage Loan has a springing hard lockbox and springing cash management. Within five business days after the first occurrence of a Trigger Event (as defined below), the Sunrise Plaza San Jose Borrower is required to establish a lender-controlled lockbox account and direct all tenants to pay rents directly into such lockbox account. Upon the first occurrence of a Cash Sweep Event Period (as defined below), the lender has the right to establish, and the Sunrise Plaza San Jose Borrower is required to cooperate with a cash management bank to establish, a lender-controlled cash management account. Following the establishment of such accounts, if no Cash Sweep Event Period exists, all funds in the lockbox account are required to be disbursed to the Sunrise Plaza San Jose Borrower’s operating account. If a Cash Sweep Event Period exists, funds in the lockbox account are required to be swept daily to the cash management account, and, provided no event of default is continuing, applied on each monthly payment date to pay debt service on the Sunrise Plaza San Jose Mortgage Loan, to fund required reserves as described above under “Escrows and Reserves,” to pay operating expenses set forth in the approved annual budget and extraordinary expenses approved by the lender, and to deposit any remaining cash flow to an account to be held by the lender as additional security for the Sunrise Plaza San Jose Mortgage Loan during the continuance of such Cash Sweep Event Period.
A “Cash Sweep Event Period” will commence upon the occurrence of a Trigger Event and terminate upon a Trigger Termination Event (as defined below).
A “Trigger Event” means any of (a) an event of default under the Sunrise Plaza San Jose Mortgage Loan, (b) the debt service coverage ratio is less than 1.15x for six consecutive calendar months (a “DSCR Event”), (c) a Lease Expiration Event (as defined below) and/or (d) a Tenant Credit Event (as defined below).
A “Lease Expiration Event” means (a) a Specified Tenant (as defined below) giving notice that it is vacating all or any portion of its space or otherwise not renewing its lease for all or any portion of its space or (b) a Specified Tenant failing to extend or renew its lease on or prior to the date that is 180 days prior to the expiration of its then applicable lease term in accordance with the applicable terms thereof and of the loan documents.
A “Tenant Credit Event” means any of (a) Specified Tenant failing to be in actual, physical possession of its space, failing to be open to the public for business during customary hours and/or “going dark” in its space, (b) any termination or cancellation of a Specified Tenant’s lease (including, without limitation, rejection in any bankruptcy or similar insolvency proceeding) and/or the Specified Tenant’s lease failing to otherwise be in full force and effect, or (c) the commencement of any bankruptcy or similar insolvency proceeding involving Specified Tenant or its lease.
This is not a research report and was not prepared by any Underwriter’s research department. Please see additional important information and qualifications at the end of this Term Sheet. |
T-113
| MSC 2017-HR2 | Sunrise Plaza San Jose |
“Specified Tenant” means either Dick’s or Pacific Sales.
A “Trigger Termination Event” means (1) with respect to a Trigger Event caused by an event of default, the cure of such event of default; (2) in the case of a DSCR Event, the debt service coverage ratio is equal to or greater than 1.20x for the immediately preceding six consecutive calendar months, (3) in the case of a Lease Expiration Event, either (a) the Specified Tenant renews or extends its lease on terms acceptable to the lender or (b) the entirety of the Specified Tenant’s space has been re-let under a new lease in accordance with the terms of the loan documents, and the new tenant is in occupancy of its space, open for business and paying full contractual rent (a “Specified Tenant Replacement Cure”) and the lender receives an estoppel certifying to the foregoing, or (4) in the case of a Tenant Credit Event, the earlier to occur of (a) the satisfaction of the Tenant Credit Event Cure Conditions (as defined below) and the lender’s receipt of an acceptable estoppel certificate certifying as to the Tenant Credit Event Cure Conditions and (b) a Specified Tenant Replacement Cure.
“Tenant Credit Event Cure Conditions” means each of the following: (i) the applicable Specified Tenant has cured any outstanding defaults under its lease; (ii) Specified Tenant is in actual, physical possession of all its space, open to the public for business during customary hours and not “dark” in its space; (iii) Specified Tenant has revoked or rescinded any termination or cancellation notices with respect to its lease and has re-affirmed its lease as being in full force and effect; (iv) with respect to any applicable bankruptcy or insolvency proceedings involving Specified Tenant and/or its lease, Specified Tenant is no longer insolvent or subject to any bankruptcy or insolvency proceedings and has affirmed its lease pursuant to final, non-appealable order of a court of competent jurisdiction; and (v) Specified Tenant is paying full, unabated rent under its lease.
Additional Secured Indebtedness (not including trade debts). Not permitted.
Mezzanine Loan and Preferred Equity. Not permitted.
Release of Property. Not permitted.
Terrorism Insurance. The Sunrise Plaza San Jose Borrower is required to obtain property insurance covering perils of terrorism and acts of terrorism in an amount determined by the lender, but in no event more than 100% of replacement cost, together with twelve months of business income insurance, to the extent such policies are available. Notwithstanding the foregoing, for so long as the Terrorism Risk Insurance Act of 2002 (as extended and modified by the Terrorism Risk Insurance Program Reauthorization Act of 2015) is in effect (or any extension thereof or other federal government program with substantially similar protection), the lender is required to accept terrorism insurance which covers “covered acts” (as defined by such statute or other program), as full compliance as it relates to the risks required to be covered pursuant to the preceding sentence, so long as such statute or other program covers both domestic and foreign acts of terrorism. See “Risk Factors—Risks Relating to the Mortgage Loans—Terrorism Insurance May Not Be Available for All Mortgaged Properties” in the Preliminary Prospectus.
This is not a research report and was not prepared by any Underwriter’s research department. Please see additional important information and qualifications at the end of this Term Sheet. |
T-114
(THIS PAGE INTENTIONALLY LEFT BLANK)
This is not a research report and was not prepared by any Underwriter’s research department. Please see additional important information and qualifications at the end of this Term Sheet. |
T-115
| MSC 2017-HR2 | Hampton Inn & Suites Ballpark |
| Mortgage Loan No. 11 – Hampton Inn & Suites Ballpark |
| Mortgage Loan Information | Mortgaged Property Information | ||||||
| Mortgage Loan Seller: | CREFI | Single Asset/Portfolio: | Single Asset | ||||
| Original Balance: | $25,500,000 | Location: | Washington, D.C. 20003 | ||||
| Cut-off Date Balance: | $25,500,000 | General Property Type: | Hospitality | ||||
| % of Initial Pool Balance: | 2.7% | Detailed Property Type: | Limited Service | ||||
| Loan Purpose: | Recapitalization | Title Vesting: | Fee | ||||
| Sponsor: | AIG Global Real Estate Investment Corp. | Year Built/Renovated: | 2015/N/A | ||||
| Mortgage Rate: | 4.3300% | Size: | 168 Rooms | ||||
| Note Date: | 11/10/2017 | Cut-off Date Balance per Room: | $151,786 | ||||
| First Payment Date: | 1/6/2018 | Maturity Date Balance per Room: | $151,786 | ||||
| Maturity Date: | 12/6/2027 | Property Manager(3): | Pollin/Miller Hospitality Strategies, Inc. | ||||
| Original Term to Maturity: | 120 months | ||||||
| Original Amortization Term: | 0 months | Underwriting and Financial Information | |||||
| IO Period: | 120 months | UW NOI: | $3,327,689 | ||||
| Seasoning: | 0 months | UW NOI Debt Yield: | 13.0% | ||||
| Prepayment Provisions: | LO (24); DEF (92); O (4) | UW NOI Debt Yield at Maturity: | 13.0% | ||||
| Lockbox/Cash Mgmt Status: | Hard/Springing | UW NCF DSCR: | 2.62x | ||||
| Additional Debt Type: | N/A | Most Recent NOI: | $3,355,071 (9/30/2017 TTM) | ||||
| Additional Debt Balance: | N/A | 2nd Most Recent NOI: | $2,850,631 (12/31/2016) | ||||
| Future Debt Permitted (Type): | No (N/A) | 3rd Most Recent NOI: | N/A | ||||
| Reserves | Most Recent Occupancy: | 76.8% (9/30/2017) | |||||
| Type | Initial | Monthly | Cap | 2nd Most Recent Occupancy: | 71.5% (12/31/2016) | ||
| RE Tax: | $253,967 | $63,492 | N/A | 3rd Most Recent Occupancy: | N/A | ||
| Insurance: | $56,762 | $5,676 | N/A | Appraised Value (as of): | $65,000,000 (8/28/2017) | ||
| Recurring Replacements(1): | $0 | $16,605 | N/A | Cut-off Date LTV Ratio: | 39.2% | ||
| Other(2): | $0 | Springing | N/A | Maturity Date LTV Ratio: | 39.2% | ||
| Sources and Uses | ||||||
| Sources | Proceeds | % of Total | Uses | Proceeds | % of Total | |
| Loan Amount: | $25,500,000 | 62.6% | Construction Loan Payoff: | $27,808,904 | 68.3% | |
| Borrower Equity | $15,208,792 | 37.4% | Partnership Interest Buyout: | $11,791,598 | 29.0% | |
| Closing Costs: | $797,561 | 2.0% | ||||
| Reserves: | $310,729 | 0.8% | ||||
| Total Sources: | $40,708,792 | 100.0% | Total Uses: | $40,708,792 | 100.0% | |
| (1) | Monthly Recurring Replacements are initially $16,605 for each monthly payment date in 2018, however, beginning in January 2019, the lender may adjust the monthly recurring replacements to equal the greater of (x) the then-existing monthly recurring replacements reserve required by the franchise agreement or (y) one-twelfth of (a) 2.0% for the first 13 monthly payment dates, (b) 3.0% for the 14th to 25th payment dates and (c) 4.0% for each monthly payment date thereafter of the greater of (I) the monthly gross revenues for the hotel related operations at the Hampton Inn & Suites Ballpark Property (as defined below) for the corresponding month in the immediately preceding calendar year as reasonably determined by the lender and (II) the projected monthly gross revenues for the hotel-related operations at the Hampton Inn & Suites Ballpark Property for the applicable month in which the due date occurs in the current calendar year as set forth in the approved annual budget; provided, that, if, as of any applicable date of determination, no approved annual budget exists for the applicable calendar year, the amount described in this clause (II) will be determined by the lender in its reasonable discretion. |
| (2) | The borrower must deposit into a PIP Reserve (i) 110% of the estimated costs of the PIP (as calculated pursuant to the Hampton Inn & Suites Ballpark Mortgage Loan documents) (the “PIP Deposit Amount”) prior to the date work is required to be commenced or FF&E is purchased with respect to any PIP and (ii) all excess cash flow on each monthly payment date following a cash sweep period caused solely by a Franchise Renewal Trigger Event (as defined below) up to a cap of the PIP Deposit Amount. A “Franchise Renewal Trigger Event” means the lender has not received evidence reasonably acceptable to the lender that, on or before the date that is twelve months prior to the expiration of the franchise agreement, (i) the related franchise agreement has been extended or a replacement franchise agreement has been entered into, in each case, in accordance with the applicable terms and conditions of the Hampton Inn & Suites Ballpark Mortgage Loan documents, (ii) such franchise agreement or such replacement franchise agreement, as applicable, is in full force and effect with no defaults thereunder and (iii) to the extent a PIP is required in connection with the foregoing, either (a) the corresponding PIP Deposit Amount has been deposited in the PIP reserve account in accordance with the Hampton Inn & Suites Ballpark Mortgage Loan documents or (B) the aggregate amount of deposits of excess cash flow made to the PIP reserve account solely with respect to a trigger described herein equals or exceeds the corresponding PIP Deposit Amount. |
| (3) | SP Plus Corporation, a third party operator, parks guest vehicles at two off-site facilities via a valet service agreement with the borrower. The parking management agreement was collaterally assigned to the lender at origination. |
The Mortgage Loan. The eleventh largest mortgage loan (the “Hampton Inn & Suites Ballpark Mortgage Loan”) is secured by a first mortgage encumbering a limited service hospitality property known as Hampton Inn & Suites Ballpark in Washington, D.C. (the “Hampton Inn & Suites Ballpark Property”). The proceeds of the Hampton Inn & Suites Ballpark Mortgage Loan, together with $15.2 million of cash equity from the Hampton Inn & Suites Ballpark Borrower (as defined below), were used to retire existing construction debt, acquire the remaining equity interest in the Hampton Inn & Suites Ballpark Property which was held by BPG Perseus Partners LLC (the Buccini Pollin Group), fund upfront reserves and pay closing costs.
The Borrower and the Sponsor. The borrower is Capital Riverfront Hotel LLC (the “Hampton Inn & Suites Ballpark Borrower”), a special-purpose Delaware limited liability company with one independent director. The Hampton Inn & Suites Ballpark Borrower is controlled by Capital Riverfront Hotel
This is not a research report and was not prepared by any Underwriter’s research department. Please see additional important information and qualifications at the end of this Term Sheet. |
T-116
| MSC 2017-HR2 | Hampton Inn & Suites Ballpark |
Partners XXII LLC, which is 100.0% owned, in succession, by (1) DC Ballpark JV, LLC and (2) AIGGRE DC Ballpark Investor, LLC with AIG Global Real Estate Investment Corp. (“AIG Global Real Estate”) as its non-member manager. Established in 1987, AIG Global Real Estate comprises a group of international companies within American International Group, Inc. (“AIG”) that invests in and actively manages real estate for clients and AIG member companies in several countries.
The non-recourse carveout guarantor for the Hampton Inn & Suites Ballpark Mortgage Loan is AIG Global Real Estate.
The Property. The Hampton Inn & Suites Ballpark Property is a 13-story, 168-room limited service hotel, located on a 0.21-acre site at 1265 First Street Southeast, across the street from Nationals Park, home of Major League Baseball’s Washington Nationals. The Hampton Inn & Suites Ballpark Property, which opened in December 2015, offers a seasonal rooftop patio and bar that provides views into Nationals Park, as well as a guestroom mix of 84 king rooms, 24 king suite rooms and 60 double queen rooms. Amenities at the Hampton Inn & Suites Ballpark Property include breakfast dining area, meeting space, a fitness room, a computer workstation and a guest laundry room.
The Hampton Inn & Suites Ballpark Property is currently subject to a management agreement with Pollin/Miller Hospitality Strategies, Inc. Additionally, the Hampton Inn & Suites Ballpark Property has a long-term 20-year franchise agreement with Hampton Inns Franchise, LLC, a subsidiary of Hilton Worldwide, which expires in December 2035.
The Hampton Inn & Suites Ballpark Property generates approximately 65% of its room nights from commercial demand, 25% from leisure demand and 10% from meeting and group demand.
| Historical Occupancy, ADR, RevPAR(1)(2) | |||||||||
Competitive Set | Hampton Inn & Suites Ballpark | Penetration Factor | |||||||
| Year | Occupancy | ADR | RevPAR | Occupancy | ADR | RevPAR | Occupancy | ADR | RevPAR |
| 2016 | 81.6% | $200.91 | $164.00 | 67.7% | $184.40 | $124.82 | 82.9% | 91.8% | 76.1% |
| 8/31/2017 TTM | 82.8% | $211.63 | $175.24 | 76.1% | $193.10 | $146.96 | 91.9% | 91.2% | 83.9% |
Source:Industry Report
| (1) | The competitive set includes Holiday Inn Washington Capitol, Capitol Hill Hotel, Kimpton The Hotel George, Residence Inn Washington DC Capitol, Hampton Inn Washington Downtown Convention Center, Courtyard by Marriott Washington Capitol Hill Navy Yard, Courtyard Washington DC US Capitol and the Hilton Garden Inn Washington DC US Capitol, each of which is classified as a secondary competitor by the appraisal with the exception of the Courtyard by Marriott Washington Capitol Hill Navy Yard (see Competitive Property Summary chart below). The related industry report did not provide weighted average 2016 statistics for the appraisal’s primary competitive set because Homewood Suites by Hilton Washington DC Capital Navy Yard opened in November 2016 and Residence Inn by Marriott Washington Capitol Hill Navy Yard opened in March 2017. |
| (2) | Variances between the underwriting, the appraisal and the above table with respect to Occupancy, ADR and RevPAR at the Hampton Inn & Suites Ballpark Property are attributable to variances in reporting methodologies and/or timing differences. In addition, the competitive set used in the Competitive Property Summary table below from the appraisal is different from the competitive set used in this table. |
The Market. The Hampton Inn & Suites Ballpark Property is located in Washington, D.C., along the Capitol Riverfront, within the Washington-Arlington-Alexandria Metropolitan Statistical Area (“MSA”). The government sector is the largest employer in the MSA, comprising approximately 28.6% of the workforce. Aside from government, other top employment sectors include finance, education, healthcare and scientific research. The Hampton Inn & Suites Ballpark Property is located less than one block from the Navy Yard Ballpark Metro Station which provides access to most parts of the MSA.
Washington, D.C. has a diverse corporate presence with 17 companies listed on the Fortune 500 headquartered within the MSA. The largest employer in Washington, D.C. is the United States federal government in terms of direct employees, as well as indirectly, through contracts, research grants and partnerships. Other large employers in the Washington D.C. market include MedStar Health, Inova Health, Marriott International Inc., University of Maryland, Booz Allen Hamilton, Verizon Wireless, Lockheed Martin Corporation and Deloitte.
According to the appraisal, as of year-end 2016, the Washington, D.C. market had a population and average household income of approximately 684,680 and $174,530, respectively. The estimated 2017 population and average household income within a one-, three-, and five-mile radius of the Hampton Inn & Suites Ballpark Property is 27,229, 272,949, and 763,489 and $120,442, $102,811 and $109,869, respectively.
Competitive properties to the Hampton Inn & Suites Ballpark Property are shown in the table below:
| Competitive Property Summary(1) | |||||||
| Property Name | No. of Rooms (2016) | Commercial Demand | Leisure Demand | Meeting & Group Demand | 2016 Occ. | 2016 ADR | 2016 RevPAR |
| Hampton Inn & Suites Ballpark | 168 | 65% | 25% | 10% | 71.7% | $182.38 | $130.81 |
| Primary Competitors | |||||||
| Courtyard by Marriott Washington Capitol Hill Navy Yard | 204 | 70% | 20% | 10% | 80.0 - 85.0% | $200-210 | $160-170 |
| Hyatt Place Washington DC/National Mall | 214 | 65% | 25% | 10% | 75.0 – 80.0% | $180-190 | $140-150 |
| Homewood Suites by Hilton Washington DC Capital Navy Yard | 195 | 65% | 25% | 10% | 60.0 – 65.0% | $180-190 | $115-120 |
| Residence Inn by Marriott Washington Capitol Hill Navy Yard(2) | 0 | 70% | 25% | 5% | N/A | N/A | N/A |
| Sub Total/Weighted Average | 781 | 67% | 23% | 10% | 76.3% | $190.06 | $144.93 |
| Secondary Competitors | 1,835 | 59% | 23% | 18% | 81.9% | $203.30 | $166.52 |
| Total/Weighted Average | 2,616 | 80.0% | $199.02 | $159.21 | |||
Source:Appraisal
| (1) | Variances between the underwriting, the appraisal and the Historical Occupancy, ADR, RevPAR table with respect to Occupancy, ADR and RevPAR at the Hampton Inn & Suites Ballpark Property are attributable to variances in reporting methodologies and/or timing differences. In addition, the competitive set used in the Historical Occupancy, ADR, RevPAR table above is different from the competitive set used in this table. |
| (2) | The Residence Inn by Marriott Washington Capitol Hill Navy Yard opened in March 2017. |
This is not a research report and was not prepared by any Underwriter’s research department. Please see additional important information and qualifications at the end of this Term Sheet. |
T-117
| MSC 2017-HR2 | Hampton Inn & Suites Ballpark |
Operating History and Underwritten Net Cash Flow. The following table presents certain information relating to the historical operating performance and the Underwritten Net Cash Flow at the Hampton Inn & Suites Ballpark Property:
| Cash Flow Analysis(1) | ||||
| 2016 | 9/30/2017 TTM | UW | UW per Room | |
| Occupancy | 71.5% | 76.8% | 76.8% | |
| ADR | $181.60 | $191.56 | $191.56 | |
| RevPAR | $129.90 | $147.05 | $147.05 | |
| Rooms Revenue | $7,987,059 | $9,016,953 | $9,016,953 | $53,672 |
| Food & Beverage | $406,845 | $477,167 | $477,167 | $2,840 |
| Parking(2) | $338,879 | $389,278 | $389,278 | $2,317 |
| Other Income(3) | $94,613 | $79,777 | $79,777 | $475 |
| Total Revenue | $8,827,396 | $9,963,175 | $9,963,175 | $59,305 |
| Total Expenses | $5,976,765 | $6,608,104 | $6,635,486 | $39,497 |
| Net Op. Income | $2,850,631 | $3,355,071 | $3,327,689 | $19,808 |
| FF&E | $353,096 | $398,527 | $398,527 | $2,372 |
| Net Cash Flow | $2,497,536 | $2,956,544 | $2,929,162 | $17,435 |
| NOI DSCR | 2.55x | 3.00x | 2.97x | |
| NCF DSCR | 2.23x | 2.64x | 2.62x | |
| NOI Debt Yield | 11.2% | 13.2% | 13.0% | |
| NCF Debt Yield | 9.8% | 11.6% | 11.5% | |
| (1) | Occupancy, ADR and RevPAR figures are based on the underwriting, which have been taken from financial statements provided by the Hampton Inn & Suites Ballpark Borrower. Variances between the underwriting, the appraisal and the Historical Occupancy, ADR, RevPAR table with respect to Occupancy, ADR and RevPAR at the Hampton Inn & Suites Ballpark Property are attributable to variances in reporting methodologies and/or timing differences. The Hampton Inn & Suites Ballpark Property was built in 2015, therefore historical cash flow information prior to 2016 was not available. |
| (2) | Parking revenue is derived from guest parking at two offsite facilities through a month-to-month valet service agreement with SP Plus Corporation. |
| (3) | Other Income includes gift shop revenue, cancellation and attrition fees, laundry, valet and other miscellaneous income items. |
This is not a research report and was not prepared by any Underwriter’s research department. Please see additional important information and qualifications at the end of this Term Sheet. |
T-118
(THIS PAGE INTENTIONALLY LEFT BLANK)
This is not a research report and was not prepared by any Underwriter’s research department. Please see additional important information and qualifications at the end of this Term Sheet. |
T-119
| MSC 2017-HR2 | 260-272 Meserole |
| Mortgage Loan No. 12 – 260-272 Meserole |
| Mortgage Loan Information | Mortgaged Property Information | ||||||
| Mortgage Loan Seller: | AREF | Single Asset/Portfolio: | Single Asset | ||||
| Original Balance: | $24,000,000 | Location: | Brooklyn, NY 11206 | ||||
| Cut-off Date Balance: | $24,000,000 | General Property Type: | Mixed Use | ||||
| % of Initial Pool Balance: | 2.5% | Detailed Property Type: | Industrial/Retail | ||||
| Loan Purpose: | Refinance | Title Vesting: | Fee | ||||
| Sponsors: | Solomon Eidlisz; Samuel Stern | Year Built/Renovated: | 1900/2007 | ||||
| Mortgage Rate: | 4.9580% | Size: | 70,475 SF | ||||
| Note Date: | 11/29/2017 | Cut-off Date Balance PSF: | $341 | ||||
| First Payment Date: | 1/6/2018 | Maturity Date Balance PSF: | $341 | ||||
| Maturity Date: | 12/6/2027 | Property Manager: | Grand Management, LLC | ||||
| Original Term to Maturity: | 120 months | ||||||
| Original Amortization Term: | 0 months | Underwriting and Financial Information | |||||
| IO Period: | 120 months | UW NOI: | $1,872,043 | ||||
| Seasoning: | 0 month | UW NOI Debt Yield: | 7.8% | ||||
| Prepayment Provisions: | LO (24); DEF (92); O (4) | UW NOI Debt Yield at Maturity: | 7.8% | ||||
| Lockbox/Cash Mgmt Status: | Springing/Springing | UW NCF DSCR: | 1.51x | ||||
| Additional Debt Type: | N/A | Most Recent NOI: | $1,901,038 (10/31/2017 TTM) | ||||
| Additional Debt Balance: | N/A | 2nd Most Recent NOI: | $1,807,739 (12/31/2016) | ||||
| Future Debt Permitted (Type): | No (N/A) | 3rd Most Recent NOI: | $ 1,602,131 (12/31/2015) | ||||
| Reserves | Most Recent Occupancy: | 100.0% (11/12/2017) | |||||
| Type | Initial | Monthly | Cap | 2nd Most Recent Occupancy: | 99.1% (12/31/2016) | ||
| RE Tax: | $30,616 | $30,616 | N/A | 3rd Most Recent Occupancy: | 98.9% (12/31/2015) | ||
| Insurance: | $74,130 | $6,739 | N/A | Appraised Value (as of): | $33,000,000 (11/9/2017) | ||
| Recurring Replacements: | $0 | $898 | N/A | Cut-off Date LTV Ratio: | 72.7% | ||
| TI/LC: | $50,000 | $2,992 | $150,000 | Maturity Date LTV Ratio: | 72.7% | ||
| Other(1): | $575,000 | Springing | N/A | ||||
| Sources and Uses | ||||||
| Sources | Proceeds | % of Total | Uses | Proceeds | % of Total | |
| Loan Amount: | $24,000,000 | 100.0% | Loan Payoff: | $18,470,754 | 77.0% | |
| Return of Equity: | $4,018,440 | 16.7% | ||||
| Closing Costs: | $781,061 | 3.3% | ||||
| Reserves: | $729,746 | 3.0% | ||||
| Total Sources: | $24,000,000 | 100.0% | Total Uses: | $24,000,000 | 100.0% | |
| (1) | Other Reserves consist of $575,000 which represents the estimated cost required for work to be completed in order to obtain a certificate of occupancy (the “260-272 Meserole Work”). The previous temporary certificate of occupancy has expired and the 260-272 Meserole Property (as defined below) does not currently have a permanent certificate of occupancy. The $575,000 reserve is required to be disbursed upon lender’s receipt of evidence that the required work has been completed to the lender’s satisfaction and the final, unconditional certificate of occupancy for the entire 260-272 Meserole Property. In addition, the 260-272 Meserole Mortgage Loan (as defined below) documents provide that: (i) the borrower agreed to perform the 260-272 Meserole Work within six months of the origination of the 260-272 Meserole Mortgage Loan, (ii) the 260-272 Meserole Mortgage Loan becomes full recourse to the non-recourse carve-out guarantors in the event that the 262-272 Meserole Borrower fails to perform the 260-272 Meserole Work and obtain a permanent certificate of occupancy by such deadline; (iii) the lender may reassess its estimate of the amount required to perform the 260-272 Meserole Work; and (iv) upon 30 days’ written notice to the 262-272 Meserole Borrower, the lender may require the 262-272 Meserole Borrower to increase the amount deposited in escrow if the lender determines in its reasonable discretion that an increase is necessary to pay the costs associated with the 260-272 Meserole Work. |
The Mortgage Loan. The twelfth largest mortgage loan (the “260-272 Meserole Mortgage Loan”) is evidenced by a promissory note in the original principal amount of $24,000,000 and is secured by a first priority fee mortgage encumbering a mixed use property located in Brooklyn, New York (the “260-272 Meserole Property”). The proceeds of the 260-272 Meserole Mortgage Loan were primarily used to refinance existing debt on the 260-272 Meserole Property, fund reserves and pay closing costs.
The Borrower and the Sponsors.The borrower is 270 Meserole LLC (the “260-272 Meserole Borrower”), a single-purpose, Delaware limited-liability company with one independent director. The borrower sponsors and non-recourse carve-out guarantors are Solomon Eidlisz and Samuel Stern. Solomon Eidlisz worked for the Internal Revenue Service as an auditor for approximately 30 years but is part of a family which has been active in the real estate industry for approximately 40 years. Solomon Eidlisz currently resides and works in Brooklyn, New York and specializes in multifamily and mixed use properties. Samuel Stern founded Future Care Consultants and several affiliated companies specializing in fiscal health care management in 1997. His company currently manages 70 nursing homes in eight states and has three offices with over 150 employees.
The Property.The 260-272 Meserole Property, located at 260-272 Meserole Street in Brooklyn, New York, consists of a five-story commercial loft and retail building totaling 70,475 SF. The 260-272 Meserole Property was constructed in 1900 and renovated in 2007. The 260-272 Meserole Property contains 155 loft units (“Loft Units”) on the upper floors of the building with an average unit size of 294 SF, in addition to the retail component on the
This is not a research report and was not prepared by any Underwriter’s research departments. Please see additional important information and qualifications at the end of this Term Sheet. |
T-120
| MSC 2017-HR2 | 260-272 Meserole |
ground and second floors. The square footage breakdown between the Loft Units and retail space is 64.7% and 35.3%, respectively. The lease expiration dates for the Loft Units range from month-to-month (7.0% of NRA and 6.8% of underwritten base rent) to November 30, 2018. The Loft Units are typically leased with 1-year lease terms. The majority of the Loft Units are leased by musicians who use the space to record and rehearse. The retail tenants are also generally music-oriented and include live music performance venues in addition to food and beverage. The 260-272 Meserole Property is currently 100.0% leased as of November 12, 2017.
Major Retail Tenants.
260 Meserole Corp (Breathnach, Burke, Caffrey) (“Meserole Rest Corp”) (9,000 SF, 12.8% of NRA, 11.1% of underwritten base rent). The Meserole Rest Corp space will be used as an entertainment venue and will replace the former tenant “The Wick”. Meserole Rest Corp is not yet in occupancy at the 260-272 Meserole Property but has commenced paying rent. Meserole Rest Corp is currently in the process of building out its premises and is expected to be in occupancy by the end of December 2017. Meserole Rest Corp’s lease expires in February 2026.
The Sweatshop, Inc. (“The Sweatshop”) (8,500 SF, 12.1% of NRA, 11.1% of underwritten base rent). The Sweatshop is a company that leases rehearsal studios hourly and as a complimentary amenity to tenants leasing the Loft Units. Aside from the rehearsal space, The Sweatshop also extends a full backline of equipment ready for musicians to utilize when they use the space. In addition, The Sweatshop offers a variety of other services including private studio rentals, various instrument lessons, session musicians for recording and/or shows, video shoots and editing, and photography sessions. The Sweatshop has been in occupancy at the 260-272 Meserole Property since May 2011 and expanded its space in May 2014.
The Well.05 (“The Well”) (5,400 SF, 7.7% of NRA, 12.9% of underwritten base rent). The Well is a curated bar, public house, and performance space. In addition to carrying a vast selection of beers on tap and in bottles as well as champagne, The Well’s adjacent 12,000 SF private outdoor space is designed to serve as a gathering space for the neighborhood, offering public activities, community events, and sports.
The following table presents a summary regarding retail tenants at the 260-272 Meserole Property:
| Tenant Summary(1) | |||||||
| Tenant Name | Credit Rating (Fitch/Moody’s/S&P) | Tenant SF | Approximate % of SF | Annual UW Rent | % of Total Annual UW Rent | Annual UW Rent PSF(2) | Lease Expiration |
| Major Tenants | |||||||
| Meserole Rest Corp(3) | NR/NR/NR | 9,000 | 12.8% | $288,000 | 11.1% | $32.00 | 2/28/2026 |
| The Sweatshop | NR/NR/NR | 8,500 | 12.1% | $288,364 | 11.1% | $33.93 | 10/30/2020 |
| The Well | NR/NR/NR | 5,400 | 7.7% | $334,335 | 12.9% | $61.91 | 2/28/2022 |
| Klun & Comess(4) | NR/NR/NR | 1,000 | 1.4% | $45,894 | 1.8% | $45.89 | 6/30/2019 |
| Les Schonfeld(5) | NR/NR/NR | 1,000 | 1.4% | $0 | 0.0% | $0 | 9/30/2024 |
| Subtotal/Wtd. Avg. | 24,900 | 35.3% | $956,593 | 36.9% | $40.02(6) | ||
| Loft Units(7) | 45,575 | 64.7% | $1,635,435 | 63.1% | $35.88 | ||
| Vacant Space | 0 | 0.0% | $0 | 0.0% | $0.00 | ||
| Total/Wtd. Avg. | 70,475 | 100.0% | $2,592,028 | 100.0% | $37.31(6) | ||
| (1) | Information is based on the underwritten rent roll dated November 12, 2017. |
| (2) | Annual UW Rent PSF figures includes contractual rent steps through June 2018. |
| (3) | Meserole Rest Corp is not yet in occupancy but is paying rent. Meserole Rest Corp is expected to be in occupancy at the end of December 2017. |
| (4) | Klun & Comess was shown as 01Comess.05,Klun.05 on the underwritten rent roll. |
| (5) | Les Schonfeld is a tenant affiliated with the previous owner and executed a lease prior to the 260-272 Meserole Borrower’s acquisition of the 260-272 Meserole Property in March 2015. Under the terms of its lease, the initial rent was $1,000 per year with increases of 1.5% per year. The appraiser concluded to a gross market rent of $40.00 PSF for this space but no base rent was underwritten for this tenant. Les Schonfeld was shown as Schonfeld.05,01.Les on the underwritten rent roll. |
| (6) | The Subtotal/Wtd. Avg. and Total/Wtd. Avg. Annual UW Rent PSF figures was calculated without accounting for the Les Schonfeld Tenant SF. |
| (7) | The lease expiration dates for the Loft Units range from month-to-month (7.0% of NRA and 6.8% of underwritten base rent) to November 30, 2018. The Loft Units are typically leased on a yearly basis. |
The Market. The 260-272 Meserole Property is located in Brooklyn, Kings County, New York. The 260-272 Meserole Property is specifically located on the border of East Williamsburg and Bushwick with easy access to subway lines, bus and ferry services to and from Manhattan. Historically, the Greenpoint-Williamsburg area was made up of warehouse and manufacturing facilities with residential housing for workers in the area. However, in recent years, many of these industrial properties have been torn down or converted to commercial and/or residential uses. Nearby land use consists mainly of industrial and multifamily units. According to the appraisal, the 260-272 Meserole Property is situated in the North Brooklyn Industrial submarket which has more than 2.5 million square feet of industrial space and as of the third quarter of 2017, a vacancy rate of 3.6% and average gross rent of $23.16 PSF. Also according to the appraisal, the 260-272 Meserole Property is located within the North Brooklyn Retail submarket which has over 45.4 million SF of retail space and as of the third quarter of 2017, a vacancy rate of 3.3% and average gross rent of $51.89 PSF. The appraiser concluded a stabilized occupancy rate of 96.0% for the 260-272 Meserole Property.
This is not a research report and was not prepared by any Underwriter’s research department. Please see additional important information and qualifications at the end of this Term Sheet. |
T-121
| MSC 2017-HR2 | 260-272 Meserole |
The following table presents recent leasing data with respect to competitive commercial loft rentals with respect to the 260-272 Meserole Property as identified in the appraisal:
| Competitive Property Summary | ||||||||
| Property Name/Location | Year Built | Size (SF) | Tenant Name | Lease Size (SF) | Lease Term (Yrs.) | Annual Rent PSF | Expense Basis | |
36 Waverly Avenue Brooklyn, New York | 1935 | 53,000 | Confidential | 240 | 1.0 | $32.50 | Mod. Gross | |
51-69 9thStreet Brooklyn, New York | 1923
| 166,000
| Creative Bionic
| 250
| 1.0
| $64.80
| Gross | |
476-498 Wythe Avenue Brooklyn, New York | 1915/2015
| 7,360
| Henrica Management Eastern Union Funding | 375 300 | 5.0 1.0 | $67.20 $64.00 | Gross Gross | |
117 Dobbin Street Brooklyn, New York | 1931 | 14,826 | Confidential | 280 | 0.5 | $55.00 | Mod. Gross | |
893 Bergen Street Brooklyn, New York | 1958/2014 | 4,920
| Sherwood Consulting LLC Ben Cowan | 450 450 | 1.0 1.0 | $37.22 $37.25 | Gross Gross | |
Source:Appraisal
Operating History and Underwritten Net Cash Flow. The following table presents certain information relating to the historical operating performance and Underwritten Net Cash Flow at the 260-272 Meserole Property:
| Cash Flow Analysis(1) | |||||
| 2015 | 2016 | 10/31/2017 TTM | UW | UW PSF | |
| Base Rent(2) | $2,216,834 | $2,327,445 | $2,430,248 | $2,592,028 | $36.78 |
| Total Recoveries | $0 | $39,914 | $40,748 | $35,787 | $0.51 |
| Other Income(3) | $0 | $0 | $49,440 | $49,440 | $0.70 |
| Less Vacancy & Credit Loss | $0 | $0 | $0 | ($131,391) | ($1.86) |
| Effective Gross Income | $2,216,834 | $2,367,359 | $2,520,436 | $2,545,864 | $36.12 |
| Total Operating Expenses | $614,703 | $559,620 | $619,398 | $673,821 | $9.56 |
| Net Operating Income | $1,602,131 | $1,807,739 | $1,901,038 | $1,872,043 | $26.56 |
| Capital Expenditures | $0 | $0 | $0 | $10,571 | $0.15 |
| TI/LC | $0 | $0 | $0 | $35,238 | $0.50 |
| Net Cash Flow | $1,602,131 | $1,807,739 | $1,901,038 | $1,826,235 | $25.91 |
| Occupancy % | 98.9% | 99.1% | 99.3% | 95.0% | |
| NOI DSCR | 1.33x | 1.50x | 1.58x | 1.55x | |
| NCF DSCR | 1.33x | 1.50x | 1.58x | 1.51x | |
| NOI Debt Yield | 6.7% | 7.5% | 7.9% | 7.8% | |
| NCF Debt Yield | 6.7% | 7.5% | 7.9% | 7.6% | |
| (1) | Historical cash flow information prior to the 260-272 Meserole Borrower’s acquisition of the 260-272 Meserole Property in 2015 was not available. |
| (2) | UW Base Rent includes $27,738 in contractual rent steps through June 2018. |
| (3) | Other Income consists of income from a billboard lease. |
This is not a research report and was not prepared by any Underwriter’s research department. Please see additional important information and qualifications at the end of this Term Sheet. |
T-122
(THIS PAGE INTENTIONALLY LEFT BLANK)
This is not a research report and was not prepared by any Underwriter’s research department. Please see additional important information and qualifications at the end of this Term Sheet. |
T-123
| MSC 2017-HR2 | Riverside Boulevard Garage Portfolio |
| Mortgage Loan No. 13 – Riverside Boulevard Garage Portfolio |
| Mortgage Loan Information | Mortgaged Property Information | ||||||
| Mortgage Loan Seller: | CREFI | Single Asset/Portfolio: | Portfolio | ||||
| Original Balance: | $24,000,000 | Location: | New York, NY 10069 | ||||
| Cut-off Date Balance: | $24,000,000 | General Property Type: | Other | ||||
| % of Initial Pool Balance: | 2.5% | Detailed Property Type: | Parking | ||||
| Loan Purpose: | Acquisition | Title Vesting: | Fee | ||||
| Sponsors: | Steven M. Levy; Peter B. Levy | Year Built/Renovated: | Various/N/A | ||||
| Mortgage Rate: | 4.2720% | Size: | 228,083 SF | ||||
| Note Date: | 11/21/2017 | Cut-off Date Balance per SF: | $105 | ||||
| First Payment Date: | 1/6/2018 | Maturity Date Balance per SF: | $105 | ||||
| Maturity Date: | 12/6/2027 | Property Manager: | Kamber Management Company, | ||||
| Original Term to Maturity: | 120 months | LLC (borrower-related) | |||||
| Original Amortization Term: | 0 months | Underwriting and Financial Information | |||||
| IO Period: | 120 months | UW NOI(4): | $2,354,240 | ||||
| Seasoning: | 0 months | UW NOI Debt Yield: | 9.8% | ||||
| Prepayment Provisions(1): | LO (24); DEF (92); O (4) | UW NOI Debt Yield at Maturity: | 9.8% | ||||
| Lockbox/Cash Mgmt Status: | Hard/In Place | UW NCF DSCR: | 2.13x | ||||
| Additional Debt Type: | N/A | Most Recent NOI(4): | $2,939,507 (9/30/2017 TTM) | ||||
| Additional Debt Balance: | N/A | 2nd Most Recent NOI: | $2,001,570 (12/31/2016) | ||||
| Future Debt Permitted (Type): | No (N/A) | 3rd Most Recent NOI: | $3,090,878 (12/31/2015) | ||||
| Reserves | Most Recent Occupancy: | 100.0% (12/6/2017) | |||||
| Type | Initial | Monthly | Cap | 2nd Most Recent Occupancy: | 100.0% (12/31/2016) | ||
| RE Tax: | $0 | $142,792 | N/A | 3rd Most Recent Occupancy: | 100.0% (12/31/2015) | ||
| Insurance: | $8,051 | $4,025 | N/A | Appraised Value (as of): | $49,100,000 (9/26/2017) | ||
| Recurring Replacements(2): | $0 | $4,752 | N/A | Cut-off Date LTV Ratio: | 48.9% | ||
| Other(3): | $112,688 | Springing | N/A | Maturity Date LTV Ratio: | 48.9% | ||
| Sources and Uses | ||||||
| Sources | Proceeds | % of Total | Uses | Proceeds | % of Total | |
| Loan Amount: | $24,000,000 | 49.4% | Purchase Price: | $47,200,000 | 97.1% | |
| Borrower Equity: | $24,610,630 | 50.6% | Closing Costs: | $1,203,890 | 2.5% | |
| Reserves: | $120,738 | 0.2% | ||||
| Other Uses: | $86,002 | 0.2% | ||||
| Total Sources: | $48,610,630 | 100.0% | Total Uses: | $48,610,630 | 100.0% | |
| (1) | Prior to the open prepayment date of September 6, 2027, the Riverside Boulevard Garage Portfolio Mortgage Loan (as defined below) can be defeased in whole or in part (as to each of the three separate Riverside Boulevard Garage Portfolio Properties) on or after the date that is two years after the Closing Date. |
| (2) | During any period that the Replacement Reserve Waiver Conditions (as defined below) are satisfied with respect to some, but not all, of certain specified leases, under the Riverside Garage Portfolio Mortgage Loan documents, the Riverside Boulevard Garage Portfolio Borrower is only required to make ongoing monthly reserves for recurring replacements in an amount equal to the replacements attributable to such specified tenant spaces where the Replacement Reserve Waiver Conditions are not then satisfied. “Replacement Reserve Waiver Conditions” mean each of the following: (i) no trigger period has occurred and is continuing under the Riverside Boulevard Garage Portfolio Mortgage Loan documents, (ii) the applicable specified tenant lease is in full force and effect with no defaults thereunder, (iii) the applicable specified tenant continues to make the payments and perform the obligations required under its lease and deliver evidence thereof in accordance with the Riverside Boulevard Garage Portfolio Mortgage Loan documents, (iv) the applicable specified tenant is not bankrupt or insolvent, and (v) the applicable specified tenant has not expressed its intention in writing to terminate, cancel or default under its lease. |
| (3) | Other upfront reserves represent $112,688 that was deposited on the origination date of the Riverside Boulevard Garage Portfolio Mortgage Loan for condominium common charges. Ongoing monthly reserves for condominium common charges are waived so long as the following conditions are satisfied: (i) no event of default exists under the Riverside Boulevard Garage Portfolio Mortgage Loan documents, (ii) the Riverside Boulevard Garage Portfolio Borrower (as defined below) is paying (or causing to be paid) the common charges directly to each of the condominiums, (iii) the Riverside Boulevard Garage Portfolio Borrower is not in material default of any obligations under the condominium documents, beyond any applicable notice and cure periods, and (iv) no trigger period has occurred and is continuing under the Riverside Boulevard Garage Portfolio Mortgage Loan documents. |
| (4) | The garages located at 100 Riverside Boulevard and 80 Riverside Boulevard are each currently subject to 421(a) tax exemptions expiring after the 2018-2019 and 2019-2020 tax years, respectively. The variation between the Most Recent NOI and UW NOI is primarily driven by the lack of vacancy or credit loss for historical reporting periods and the burn off of the 421(a) tax exemption paired with increases in real estate taxes, which are reassessed annually and phased in over a five-year period, for the five parking garages that secure the Riverside Boulevard Garage Portfolio Properties. |
The Mortgage Loan. The thirteenth largest mortgage loan (the “Riverside Boulevard Garage Portfolio Mortgage Loan”) is secured by a first mortgage encumbering three parking garage properties comprised of five total parking garages known as the Riverside Boulevard Garage Portfolio in New York, New York (the “Riverside Boulevard Garage Portfolio Properties”). The proceeds of the Riverside Boulevard Garage Portfolio Mortgage Loan were primarily used to finance the acquisition of the Riverside Boulevard Garage Portfolio Properties, pay closing costs and fund upfront reserves.
The Borrower and the Sponsors.The borrower is Riverside Garage Associates DE, LLC, a single-purpose, Delaware limited liability company with two independent directors (the “Riverside Boulevard Garage Portfolio Borrower”). The non-recourse carve-out guarantors under the Riverside Boulevard Garage Portfolio are Steven M. Levy and Peter B. Levy of Kamber Management Company LLC (“Kamber Management”).
This is not a research report and was not prepared by any Underwriter’s research department. Please see additional important information and qualifications at the end of this Term Sheet. |
T-124
| MSC 2017-HR2 | Riverside Boulevard Garage Portfolio |
Kamber Management, the Riverside Boulevard Garage Portfolio Properties’ property manager, is a family-owned commercial real estate company founded over 75 years ago. Kamber Management invests, owns and operates commercial real estate investments in office and mixed-use properties. Currently, the Kamber Management portfolio totals more than one million SF of commercial office and retail space in New York City, Long Island, Connecticut and Texas.
The Properties.The three Riverside Boulevard Garage Portfolio Properties comprise five parking garages in five condominium regimes totaling 893 parking spaces (228,083 SF) located along Riverside Boulevard in the Lincoln Square neighborhood of the Upper West Side of Manhattan (see“Property Summary” table below). Each property is governed by a condominium association, and within each condominium association, the borrower controls the “non-residential” board position on such condominium board. The “non-residential” board position is a minority position on each board. The “residential” board members of each board govern with respect to matters that affect only the residential areas of the condominium and do not adversely affect the non-residential areas; in any board meeting where the non-residential board member is not present and a decision is made that adversely affects the non-residential unit, there is not deemed to be a quorum and the non-residential board member can object to such decision.
The Riverside Boulevard Garage Portfolio Properties are 100.0% leased to Icon Parking Systems on three separate cross-defaulted, long-term leases expiring in 2035. Annual UW Base Rent for the three leases is equal to $3,010,000 and is subject to annual consumer price index (“CPI”) adjustments. In no event can the CPI adjustment be less than 1.0% or greater than 6.12%.
| Property Summary | |||||||||
| Property Name | Location | Allocated Cut- Off Date Principal Balance | % of Portfolio Cut-off Date Principal Balance | Occ.(1) | Year Built | Total Spaces(1) | Total GLA(1) | Appraised Value | UW NCF |
| 220-240 Riverside Boulevard | New York, NY | $12,610,998 | 52.5% | 100.0% | 2000 | 452 | 122,744 | $25,800,000 | $1,048,826 |
| 100-120 Riverside Boulevard | New York, NY | $6,696,538 | 27.9% | 100.0% | 2004, 2006 | 188 | 52,156 | $13,700,000 | $606,917 |
| 80 Riverside Boulevard | New York, NY | $4,692,464 | 19.6% | 100.0% | 2006 | 253 | 53,183 | $9,600,000 | $562,645 |
| Total/Wtd. Avg. | $24,000,000 | 100.0% | 100.0% | 893 | 228,083 | $49,100,000 | $2,218,387 | ||
| (1) | Information is based on the underwritten rent roll dated December 6, 2017. |
Major Tenant. Icon Parking Systems(228,083 SF, 100.0% of NRA, 100.0% of underwritten base rent). Icon Parking Systems is a major parking service provider with over 300 parking garages throughout New York City and over 40,000 cars parked on a daily basis. Icon Parking Systems, which has been majority owned by Macquarie Bank since November 2005, has been operating for over 50 years and offers daily, monthly and annual parking options to customers.
The following table presents a summary regarding the sole tenant, Icon Parking Systems, at the Riverside Boulevard Garage Portfolio Properties:
| Icon Parking Systems Tenant Summary(1) | |||||||
| Property Name | Credit Rating (Fitch/Moody’s/S&P) | Tenant SF | Approximate % of SF | Annual UW Base Rent | % of Total Annual UW Base Rent | Annual UW Base Rent PSF | Lease Expiration |
| 220-240 Riverside Boulevard | NR/NR/NR | 122,744 | 100.0% | $1,400,000 | 46.5% | $11.41 | 4/30/2035 |
| 100-120 Riverside Boulevard | NR/NR/NR | 52,156 | 100.0% | $840,000 | 27.9% | $16.11 | 6/30/2035 |
| 80 Riverside Boulevard | NR/NR/NR | 53,183 | 100.0% | $770,000 | 25.6% | $14.48 | 6/30/2035 |
| Subtotal/Wtd. Avg. | 228,083 | 100.0% | $3,010,000 | 100.0% | $13.20 | ||
| Vacant Space | 0 | 0.0% | $0 | 0.0% | $0.00 | ||
| Total/Wtd. Avg. | 228,083 | 100.0% | $3,010,000 | 100.0% | $13.20 | ||
| (1) | Information is based on the underwritten rent roll dated December 6, 2017. |
This is not a research report and was not prepared by any Underwriter’s research department. Please see additional important information and qualifications at the end of this Term Sheet. |
T-125
| MSC 2017-HR2 | Riverside Boulevard Garage Portfolio |
The following table presents certain information relating to the lease rollover schedule at the Riverside Boulevard Garage Portfolio Properties:
| Lease Rollover Schedule(1) | ||||||||
| Year | # of Leases Rolling | SF Rolling | UW Base Rent PSF Rolling | Approx. % of Total SF Rolling | Approx. Cumulative % of SF Rolling | Total UW Base Rent Rolling | Approx. % of Total UW Base Rent Rolling | Approx. Cumulative % of Total UW Base Rent Rolling |
| MTM | 0 | 0 | $0.00 | 0.0% | 0.0% | $0 | 0.0% | 0.0% |
| 2017 | 0 | 0 | $0.00 | 0.0% | 0.0% | $0 | 0.0% | 0.0% |
| 2018 | 0 | 0 | $0.00 | 0.0% | 0.0% | $0 | 0.0% | 0.0% |
| 2019 | 0 | 0 | $0.00 | 0.0% | 0.0% | $0 | 0.0% | 0.0% |
| 2020 | 0 | 0 | $0.00 | 0.0% | 0.0% | $0 | 0.0% | 0.0% |
| 2021 | 0 | 0 | $0.00 | 0.0% | 0.0% | $0 | 0.0% | 0.0% |
| 2022 | 0 | 0 | $0.00 | 0.0% | 0.0% | $0 | 0.0% | 0.0% |
| 2023 | 0 | 0 | $0.00 | 0.0% | 0.0% | $0 | 0.0% | 0.0% |
| 2024 | 0 | 0 | $0.00 | 0.0% | 0.0% | $0 | 0.0% | 0.0% |
| 2025 | 0 | 0 | $0.00 | 0.0% | 0.0% | $0 | 0.0% | 0.0% |
| 2026 | 0 | 0 | $0.00 | 0.0% | 0.0% | $0 | 0.0% | 0.0% |
| 2027 | 0 | 0 | $0.00 | 0.0% | 0.0% | $0 | 0.0% | 0.0% |
| 2028 & Beyond(2) | 3 | 228,083 | $13.20 | 100.0% | 100.0% | $3,010,000 | 100.0% | 100.0% |
| Vacant | 0 | 0 | $0.00 | 0.0% | 100.0% | $0 | 0.0% | 100.0% |
| Total/Wtd. Avg. | 3 | 228,083 | $13.20 | 100.0% | $3,010,000 | 100.0% | ||
| (1) | Information is based on the Riverside Boulevard Garage Portfolio underwritten rent roll date December 6, 2017. |
| (2) | Icon Parking Systems has three underlying leases at three separate properties. The Icon Parking Systems lease at the 220-240 Riverside Boulevard Property, which encompasses 122,744 SF, has a lease expiration date of April 30, 2035. The remaining two Icon Parking Systems leases at the 100-120 Riverside Boulevard and 80 Riverside Boulevard Properties, which collectively encompass 105,339 SF, each have a lease expiration date of June 30, 2035. |
The Markets. The Riverside Boulevard Garage Portfolio Properties are all located along Riverside Boulevard between 64thStreet and 71st Street on the Upper West Side of Manhattan and are in close proximity to the 72nd Street entrance of the West Side Highway, the 66th Street subway station, Lincoln Center, Central Park and the Time Warner Center. According to a third party report, the New York City central business district is the sixth most expensive monthly parking market in the world.
According to the appraisal, the estimated 2017 populations for the borough of Manhattan and New York City are 1,664,404 and 8,691,615, respectively, which represents population growth when compared against 2010 census numbers equal to 5.0% and 6.3%, respectively. According to the appraisal, the estimated 2017 median and average household incomes for the borough of Manhattan are $77,442 and $131,395, respectively. According to the appraisal, the estimated 2017 median and average household incomes for the 10069 zip code are $125,960 and $189,281, respectively.
| Market Rent Conclusions(1) | |||
| Category | 80 Riverside Boulevard Property | 100-120 Riverside Boulevard Property | 220-240 Riverside Boulevard Property |
| Market Rent (per Space) | $3,000 | $4,750 | $4,750 |
| Market Rent (per SF) | $14.27 | $17.12 | $17.49 |
| Market Reimbursements | NNN | NNN | NNN |
| UW Base Rent (per Space)(2) | $3,043 | $4,468 | $3,097 |
| UW Base Rent (per SF)(2) | $14.48 | $16.11 | $11.41 |
| (1) | Source: Appraisal |
| (2) | Based on the underwritten rent roll dated December 6, 2017. |
This is not a research report and was not prepared by any Underwriter’s research department. Please see additional important information and qualifications at the end of this Term Sheet. |
T-126
| MSC 2017-HR2 | Riverside Boulevard Garage Portfolio |
Operating History and Underwritten Net Cash Flow. The following table presents certain information relating to the historical operating performance and the Underwritten Net Cash Flow at the Riverside Boulevard Garage Portfolio Properties:
| Cash Flow Analysis | ||||||
| 2014 | 2015 | 2016 | 9/30/2017 TTM(1) | UW(1) | UW PSF | |
| Base Rent | $3,235,756 | $3,235,756 | $3,122,882 | $3,010,007 | $3,010,000 | $13.20 |
| Reimbursements(2) | $1,406,702 | $1,751,365 | $987,234 | $1,994,092 | $1,974,468 | $8.66 |
| Less Vacancy & Credit Loss | $0 | $0 | $0 | $0 | ($149,534) | ($0.66) |
| Effective Gross Income | $4,642,458 | $4,987,121 | $4,110,116 | $5,004,099 | $4,834,934 | $21.20 |
| Total Operating Expenses(3) | $1,543,697 | $1,896,243 | $2,108,546 | $2,064,592 | $2,480,694 | $10.88 |
| Net Operating Income | $3,098,761 | $3,090,878 | $2,001,570 | $2,939,507 | $2,354,240 | $10.32 |
| TI/LC | $0 | $0 | $0 | $0 | $78,832 | $0.35 |
| Replacement Reserves | $0 | $0 | $0 | $0 | $57,021 | $0.25 |
| Net Cash Flow | $3,098,761 | $3,090,878 | $2,001,570 | $2,939,507 | $2,218,387 | $9.73 |
| Occupancy %(4) | 100.0% | 100.0% | 100.0% | 100.0% | 97.0% | |
| NOI DSCR | 2.98x | 2.97x | 1.93x | 2.83x | 2.26x | |
| NCF DSCR | 2.98x | 2.97x | 1.93x | 2.83x | 2.13x | |
| NOI Debt Yield | 12.9% | 12.9% | 8.3% | 12.2% | 9.8% | |
| NCF Debt Yield | 12.9% | 12.9% | 8.3% | 12.2% | 9.2% | |
| (1) | The garages located at 100 Riverside Boulevard and 80 Riverside Boulevard are each currently subject to 421(a) tax exemptions expiring after the 2018-2019 and 2019-2020 tax years, respectively. The variation between the 9/30/2017 TTM Net Operating Income and UW Net Operating Income is primarily driven by the lack of vacancy or credit loss for historical reporting periods and the burn off of the 421(a) tax exemption paired with increases in real estate taxes, which are reassessed annually and phased in over a five-year period, for the five parking garages that secure the Riverside Boulevard Garage Portfolio Properties. |
| (2) | Reimbursements for 2014 and 2015 are shown inclusive of amounts that each respective tenant was obligated to pay directly to the taxing authority and condominium association for comparison purposes with 2016 Reimbursements. Effective beginning on July 1, 2016, the reimbursement obligation of the tenants was amended to a fixed amount for the remainder of the three separate lease terms which is reflected in UW Reimbursements. |
| (3) | Real estate taxes for the two garages currently subject to a 421(a) tax exemption were underwritten to the current abated tax amounts for the tax year ending June 30, 2018. The aggregate tax benefit from the two garages subject to a 421(a) tax exemption is currently $253,813 ($197,423 with respect to the 80 Riverside Boulevard Garage Portfolio Property and $56,390 with respect to the garage located at 100 Riverside Boulevard). |
| (4) | The underwritten economic occupancy is 97.0%. The Riverside Boulevard Garage Portfolio Properties were 100.0% physically occupied as of December 6, 2017. |
Release Provisions.At any time following the second anniversary of the Closing Date and prior to the monthly payment date in September 2027, the Riverside Boulevard Garage Portfolio Borrower is permitted to obtain the release of (A) the 80 Riverside Boulevard Property, (B) the 100-120 Riverside Boulevard Property or (C) the 220-240 Riverside Boulevard Property from the lien of the Riverside Boulevard Garage Portfolio Mortgage Loan documents, subject to satisfaction of the applicable conditions set forth therein, including, without limitation, that (i) no event of default has occurred and is continuing under the Riverside Boulevard Garage Portfolio Mortgage Loan documents, (ii) the Riverside Boulevard Garage Portfolio Borrower has delivered a REMIC opinion and rating agency confirmation with respect to the release, (iii) the Riverside Boulevard Garage Portfolio Borrower has delivered the partial defeasance collateral pursuant to the Riverside Boulevard Garage Portfolio Mortgage Loan documents and which provide payments in an amount equal to or greater than the greater of (a) 125% of the allocated loan amount of such Riverside Boulevard Garage Portfolio Property being released and (b) the net sales proceeds applicable to the Riverside Boulevard Garage Portfolio Property being released, (iv) the debt yield after giving effect to such release is greater than the greater of (1) the debt yield with respect to all properties securing the lien of the Riverside Boulevard Garage Portfolio Mortgage Loan immediately prior to the partial release notice date or consummation of the partial release and (2) 9.17%, (v) the loan-to-value ratio after giving effect to such release is no greater than the lesser of (1) 48.87% and (2) the loan-to-value ratio with respect to all properties securing the lien of the Riverside Boulevard Garage Portfolio Mortgage Loan immediately prior to the partial release notice date or the consummation of the partial release (with each loan-to-value ratio calculation being determined based upon updated appraisals for each Riverside Boulevard Garage Portfolio Property) and (vi) the delivery of certain new leases, as applicable, which account for the release of the released property and which are not cross-defaulted with the leases applicable to the released property.
This is not a research report and was not prepared by any Underwriter’s research department. Please see additional important information and qualifications at the end of this Term Sheet. |
T-127
| MSC 2017-HR2 | 250-290 East John Carpenter Freeway |
| Mortgage Loan No. 14 – 250-290 East John Carpenter Freeway |
| Mortgage Loan Information | Mortgaged Property Information | ||||||
| Mortgage Loan Seller: | AREF | Single Asset/Portfolio: | Single Asset | ||||
| Original Balance: | $23,250,000 | Location: | Irving, TX 75062 | ||||
| Cut-off Date Balance: | $23,250,000 | General Property Type: | Office | ||||
| % of Initial Pool Balance: | 2.5% | Detailed Property Type: | Suburban | ||||
| Loan Purpose: | Refinance | Title Vesting: | Fee | ||||
| Sponsors: | James C. Leslie; Cathy R. Sweeney | Year Built/Renovated: | 1981/2013-2014 | ||||
| Mortgage Rate: | 4.2600% | Size: | 277,776 SF | ||||
| Note Date: | 11/30/2017 | Cut-off Date Balance PSF: | $84 | ||||
| First Payment Date: | 1/6/2018 | Maturity Date Balance PSF: | $84 | ||||
| Maturity Date: | 12/6/2027 | Property Manager: | Fairways JC Services, LLC (borrower related) | ||||
| Original Term to Maturity: | 120 months | ||||||
| Original Amortization Term: | 0 months | Underwriting and Financial Information | |||||
| IO Period: | 120 months | UW NOI(3): | $2,895,513 | ||||
| Seasoning: | 0 months | UW NOI Debt Yield: | 12.5% | ||||
| Prepayment Provisions: | LO (24); D (93); O (3) | UW NOI Debt Yield at Maturity: | 12.5% | ||||
| Lockbox/Cash Mgmt Status: | Hard/Springing | UW NCF DSCR: | 2.22x | ||||
| Additional Debt Type: | N/A | Most Recent NOI(3): | $2,593,162 (9/30/2017 TTM) | ||||
| Additional Debt Balance: | N/A | 2nd Most Recent NOI(3): | $1,819,526 (12/31/2016) | ||||
| Future Debt Permitted (Type): | No (N/A) | 3rd Most Recent NOI(3): | $768,733 (12/31/2015) | ||||
| Reserves | Most Recent Occupancy(3): | 93.5% (11/1/2017) | |||||
| Type | Initial | Monthly | Cap | 2nd Most Recent Occupancy(3): | 77.0% (12/31/2016) | ||
| RE Tax: | $0 | $67,735 | N/A | 3rd Most Recent Occupancy(3): | 53.4% (12/31/2015) | ||
| Insurance: | $29,041 | $4,840 | N/A | Appraised Value (as of): | $43,000,000 (11/13/2017) | ||
| Recurring Replacements: | $0 | $3,472 | N/A | Cut-off Date LTV Ratio: | 54.1% | ||
| TI/LC(1): | $1,494,090 | $0 | N/A | Maturity Date LTV Ratio: | 54.1% | ||
| Deferred Maintenance: | $70,455 | $0 | N/A | ||||
| Other(2): | $45,222 | $0 | N/A | ||||
| Sources and Uses | ||||||
| Sources | Proceeds | % of Total | Uses | Proceeds | % of Total | |
| Loan Amount: | $23,250,000 | 100.0% | Loan Payoff: | $14,275,438 | 61.4% | |
| Return of Equity: | $6,082,865 | 26.2% | ||||
| Reserves: | $1,638,808 | 7.0% | ||||
| Closing Costs: | $1,252,889 | 5.4% | ||||
| Total Sources: | $23,250,000 | 100.0% | Total Uses: | $23,250,000 | 100.0% | |
| (1) | $1,494,090 was held back at loan closing for the outstanding TI allowance due to Wells Fargo Bank, N.A. for their new lease commencing September 2018. |
| (2) | Other Reserves consist of $45,222 in rent holdback. which represents one month of difference between the total gross rent due under the new Wells Fargo Bank, N.A. lease versus total gross rent due under Well Fargo’s sublease. Wells Fargo Bank, N.A. is currently in occupancy at the 250-290 East John Carpenter Freeway Property (as defined below) under a sublease but has recently executed a new lease for six years at $17.50 PSF on a triple net basis with annual increases commencing September 2018. |
| (3) | The borrower sponsor purchased the two buildings (250 and 290 East John Carpenter Freeway) in August 2012 when they were essentially vacant. The borrower sponsor subsequently commenced major renovations and leased up the two buildings in 2013-2014, increasing the occupancy of the 250-290 East John Carpenter Freeway Property to 93.5% as of November 1, 2017. The total cost of the renovations, tenant improvements and leasing commissions reportedly totaled approximately $31.5 million. The increase in UW NOI from the Most Recent NOI is primarily due to an increase in recoveries under Wells Fargo Bank, N.A.’s new lease, contractual rent steps through October 2018, and Wells Fargo Bank, N.A’s average contractual rent steps through August 30, 2024. |
The Mortgage Loan. The fourteenth largest mortgage loan (the “250-290 East John Carpenter Freeway Mortgage Loan”) is evidenced by a promissory note in the original principal amount of $23,250,000 and is secured by a first priority fee mortgage encumbering two commercial condominium units (“Condo Unit B and Condo Unit C”) within two office buildings located in Irving, Texas (the “250-290 East John Carpenter Freeway Property”). The proceeds of the 250-290 East John Carpenter Freeway Mortgage Loan were primarily used to refinance existing debt on the 250-290 East John Carpenter Freeway Property, return equity to the borrower sponsors, fund reserves and pay closing costs.
The Borrower and the Sponsors.The borrower is 250/290 B&C, LLC (the “250-290 East John Carpenter Freeway Borrower”), a single-purpose Delaware limited liability company with one independent director. The borrower sponsors and non-recourse carve-out guarantors are James C. Leslie and Cathy R. Sweeney.
Wolverine Interests LLC, is a Dallas, Texas commercial real estate investment firm focused exclusively on office, multi-family and single tenant development, acquisition and repositioning, primarily in northern Texas. The firm is led by a three-member senior management team with over 33 years of experience in commercial real estate development and management. James C. Leslie serves as a Managing Principal of Wolverine Interests LLC. Cathy R. Sweeney served as a Managing Principal of Wolverine Interests LLC until December 2016 and now serves as an advisor to the company.
This is not a research report and was not prepared by any Underwriter’s research department. Please see additional important information and qualifications at the end of this Term Sheet. |
T-128
| MSC 2017-HR2 | 250-290 East John Carpenter Freeway |
The Property.The 250-290 East John Carpenter Freeway Property is a Class A, multi-tenant office complex located in Irving, Texas. In August 2012, the borrower sponsor purchased two buildings (250 and 290 East John Carpenter Freeway) and converted them into a single condominium regime with three condominium units with Condo Unit A, B, and C having 48.5%, 24.2% and 27.3% of the undivided interests in the common elements, respectively. Only Condo Unit B and Condo Unit C represent collateral for the 250-290 East John Carpenter Freeway Mortgage Loan. Condo Unit A contains 261,593 SF of space in upper floors of the 290 East John Carpenter building which is currently fully occupied by Vizient, Inc. which also leases space in Condo Unit C. Condo Unit A is not part of the collateral for the 250-290 East John Carpenter Freeway Mortgage Loan and its value is not included in the appraised value for the 250-290 East John Carpenter Freeway Property. Condo Unit B represents floors one through three of the 290 East John Carpenter Freeway building. Condo Unit C contains 147,064 SF of space which represents the entire 250 East John Carpenter Freeway building.Thecondominium board is comprised of threedirectors. The owner of each condominium unit elects one director to the board. The250-290 East John Carpenter Freeway Borrower owns two of three units.
The 250-290 East John Carpenter Freeway Property was constructed in 1981 and underwent an approximately $8.4 million renovation between 2013 and 2014. The 250-290 East John Carpenter Freeway Property’s amenities include a large fitness center, a deli, a Starbucks kiosk, and a courtyard between the buildings. The 250-290 East John Carpenter Freeway Property has approximately 1,350 parking spaces (which equates to 4.86 parking spaces per 1,000 SF of net rentable area (“NRA”) and the improvements also include a seven-story pre-cast concrete parking garage (completed in 2014 with 659 spaces allocated between the office condo units) with automated card readers and corresponding access gates.
The 250-290 East John Carpenter Freeway Property sits in the primary office corridor for the area and the neighborhood is located just east of Dallas Fort Worth International Airport and between Northgate Drive and Interstate 635. The 250-290 East John Carpenter Freeway Property was 93.5% occupied as of November 1, 2017 by seven tenants. The two largest tenants at the 250-290 East John Carpenter Freeway Property, Wells Fargo Bank, N.A. (which currently subleases from Avelo Mortgage, L.L.C.) and Vizient, Inc., account for approximately 80.9% of the NRA. No other tenant represents more than 3.6% of the NRA.
Major Tenant.
Vizient, Inc. (125,024 SF, 45.0% of NRA, 32.2% of underwritten base rent). Vizient, Inc. (the new brand identity for VHA, University HealthSystem Consortium and Novation) is a health care performance improvement company. Vizient, Inc. serves a diverse membership that includes academic medical centers, pediatric facilities, community hospitals, integrated health care delivery networks and non-acute health care providers located across the country. The 290 East John Carpenter Freeway building serves as Vizient/VHA’s corporate headquarters in which it occupies 261,593 SF. This space does not serve as collateral for the 250-290 East John Carpenter Freeway Mortgage Loan. The company occupies 89,787 SF of space in the 250 East John Carpenter Freeway building under the Vizient name, and an additional 35,237 SF under the VHA Inc./Provista name. Both spaces within the 250 East John Carpenter Freeway building serve as collateral for the 250-290 East John Carpenter Freeway Mortgage Loan.
Wells Fargo (Avelo Mortgage, L.L.C.) (“Wells Fargo Bank, N.A.”). (99,606 SF, 35.9% of NRA, 46.9% of underwritten base rent). Wells Fargo Bank, N.A. is an American international banking and financial services holding company headquartered in San Francisco, California. Wells Fargo Bank, N.A. was founded in 1852 and is based in Sioux Falls, South Dakota. Wells Fargo Bank, N.A. operates as a subsidiary of WFC Holdings Corporation. Wells Fargo Bank, N.A. has been a tenant at the 250-290 East John Carpenter Freeway Property since November 2012 when it entered into an agreement to sublease 99,606 SF of space in the 250 East John Carpenter Freeway building from Avelo Mortgage, L.L.C. The sublease expires in August 2018 and Wells Fargo Bank, N.A. executed a permanent lease for the space for a period of six years ending in August 2024. Under the new lease, Wells Fargo Bank, N.A. will have two, five-year renewal options available that can be exercised by giving notice no later than 12 months prior to the end of the current term.
This is not a research report and was not prepared by any Underwriter’s research department. Please see additional important information and qualifications at the end of this Term Sheet. |
T-129
| MSC 2017-HR2 | 250-290 East John Carpenter Freeway |
The following table presents a summary regarding major tenants at the 250-290 East John Carpenter Freeway Property:
| Tenant Summary(1) | |||||||
| Tenant Name | Credit Rating (Fitch/Moody’s/S&P)(2) | Tenant SF | Approximate % of SF | Annual UW Rent | % of Total Annual UW Rent | Annual UW Rent PSF(3) | Lease Expiration |
| Tenants | |||||||
| Vizient, Inc. | NR/B2/B+ | 125,024 | 45.0% | $1,236,336 | 32.2% | $9.89 | 9/30/2033(4) |
| Wells Fargo Bank, N.A.(5) | A+/A2/A | 99,606 | 35.9% | $1,797,889(6) | 46.9% | $18.05(6) | 8/30/2024(7) |
| Smith & Roy Dentistry Partners | NR/NR/NR | 10,090 | 3.6% | $272,531 | 7.1% | $27.01 | 1/31/2032(8) |
| Republic Health Resources, LLC | NR/NR/NR | 9,778 | 3.5% | $220,005 | 5.7% | $22.50 | 1/31/2027(9) |
| Chamber of Commerce of the USA | NR/NR/NR | 7,271 | 2.6% | $181,775 | 4.7% | $25.00 | 4/30/2020(10) |
| Subtotal/Wtd. Avg. | 251,769 | 90.6% | $3,708,536 | 96.7% | $14.73 | ||
| Other Tenants | 8,021 | 2.9% | $126,864 | 3.3% | $15.82 | ||
| Vacant Space | 17,986 | 6.5% | $0 | 0.0% | $0.00 | ||
| Total/Wtd. Avg. | 277,776 | 100.0% | $3,835,400 | 100.0% | $14.76 | ||
| (1) | Information is based on the underwritten rent roll dated November 1, 2017. |
| (2) | Certain ratings are those of the parent company whether or not the parent guarantees the lease. |
| (3) | Annual UW Rent PSF figures exclude vacant space. |
| (4) | Vizient, Inc. has two, five-year renewal options remaining. |
| (5) | Wells Fargo Bank, N.A. currently subleases its space (from Avelo Mortgage, L.L.C.) and has been in occupancy for approximately three years on a modified gross basis. Wells Fargo Bank, N.A. has signed a new lease for six years at $17.50 PSF on a triple net basis with annual increases. Base rent will decrease by approximately $188,000 upon commencement of the new lease (base rent for the new lease has been underwritten). UW recovery income is calculated based on the terms of the new lease and represents an increase of $721,000 over the tenant’s annual expense recovery currently reflected on the rent roll. Lender held back one month of Wells Fargo Bank, N.A.’s higher total gross rent for the new lease at closing. |
| (6) | The Annual UW Rent and Annual UW Rent PSF reflects the straight line average of Wells Fargo Bank, N.A.’s contractual rent through August 30, 2024. The current Annual UW Rent and Annual UW Rent PSF are $1,743,106 and $17.50 PSF, respectively. |
| (7) | Wells Fargo Bank, N.A. has two, five-year renewal options remaining. |
| (8) | Smith & Roy Dentistry Partners has two, five-year renewal options remaining. |
| (9) | Republic Health Resources, LLC has one, five-year renewal option remaining. Republic Health Resources, LLC has a one-time option to terminate its lease on January 31, 2024, with 12 months’ notice and payment of a termination fee equal to the sum of (i) 24 times the monthly rent payable by the tenant as of the date the termination notice is delivered plus (ii) the unamortized portion as of the early termination date of the transactional costs upon or prior to that date which is three months prior to the early termination date. |
| (10) | Chamber of Commerce of the USA has one, five-year renewal option remaining. |
The following table presents certain information relating to the lease rollover schedule at the 250-290 East John Carpenter Freeway Property:
| Lease Rollover Schedule(1)(2) | ||||||||
| Year | # of Leases Rolling | SF Rolling | Approx. % of Total SF Rolling | Approx. Cumulative % of SF Rolling | Total UW Rent Rolling(3) | UW Rent PSF Rolling(4) | Approx. % of Total Rent Rolling | Approx. Cumulative % of Total Rent Rolling |
| MTM | 0 | 0 | 0.0% | 0.0% | $0 | $0.00 | 0.0% | 0.0% |
| 2017 | 0 | 0 | 0.0% | 0.0% | $0 | $0.00 | 0.0% | 0.0% |
| 2018 | 1 | 3,485 | 1.3% | 1.3% | $18,000 | $5.16 | 0.5% | 0.5% |
| 2019 | 0 | 0 | 0.0% | 1.3% | $0 | $0.00 | 0.0% | 0.5% |
| 2020 | 2 | 11,807 | 4.3% | 5.5% | $290,639 | $24.62 | 7.6% | 8.0% |
| 2021 | 0 | 0 | 0.0% | 5.5% | $0 | $0.00 | 0.0% | 8.0% |
| 2022 | 0 | 0 | 0.0% | 5.5% | $0 | $0.00 | 0.0% | 8.0% |
| 2023 | 0 | 0 | 0.0% | 5.5% | $0 | $0.00 | 0.0% | 8.0% |
| 2024 | 4 | 99,606 | 35.9% | 41.4% | $1,797,889 | $18.05 | 46.9% | 54.9% |
| 2025 | 0 | 0 | 0.0% | 41.4% | $0 | $0.00 | 0.0% | 54.9% |
| 2026 | 0 | 0 | 0.0% | 41.4% | $0 | $0.00 | 0.0% | 54.9% |
| 2027 | 1 | 9,778 | 3.5% | 44.9% | $220,005 | $22.50 | 5.7% | 60.7% |
| 2028 & Beyond | 5 | 135,114 | 48.6% | 93.5% | $1,508,867 | $11.17 | 39.3% | 100.0% |
| Vacant | 0 | 17,986 | 6.5% | 100.0% | $0 | $0.00 | 0.0% | 100.0% |
| Total/Wtd. Avg. | 13 | 277,776 | 100.0% | $3,835,400 | $14.76 | 100.0% | ||
| (1) | Information is based on the underwritten rent roll dated November 1, 2017. |
| (2) | Certain tenants may have lease termination options that are exercisable prior to the originally stated expiration date of the related lease and are not considered in the rollover schedule. |
| (3) | The Total UW Rent Rolling reflects the straight line average of Wells Fargo Bank, N.A.’s contractual rent through August 30, 2024 |
| (4) | UW Rent PSF Rolling figures exclude vacant space. |
This is not a research report and was not prepared by any Underwriter’s research department. Please see additional important information and qualifications at the end of this Term Sheet. |
T-130
| MSC 2017-HR2 | 250-290 East John Carpenter Freeway |
The Market. The 250-290 East John Carpenter Freeway Property is located in Irving, Texas in Western Dallas County. Western Dallas County is approximately 12-15 miles southwest of the Dallas central business district.
According to the appraisal, the 250-290 East John Carpenter Freeway Property is located in the Las Colinas office submarket. As of the third quarter of 2017, the Las Colinas office submarket had a total office inventory of over 30 million SF with a vacancy rate of 17.3% and market asking rent of $24.91 per SF. According to a third-party report, the estimated 2017 population within a one-, three- and five-mile radius of the 250-290 East John Carpenter Freeway Property was 11,157, 96,293 and 272,125, respectively. The estimated 2017 average household income within the same radii was $111,754, $79,344 and $71,492, respectively.
The following table presents recent leasing data at comparable office buildings with respect to the 250-290 East John Carpenter Freeway Property:
| Comparable Lease Summary | |||||||||
| Property Name/Address | Year Built | Class | Size (SF) | Tenant Name | Lease Size (SF) | Lease Date | Lease Term (Yrs.) | Initial Rent/SF | Lease Type |
Crestview Tower 105 Decker Court, Irving, TX | 1983 | A | 262,962 | Lowery Cottonwood V. H. Jackson | 5,693 2,072 1,242 | Jun 2017 April 2017 April 2017 | 6.0 5.3 5.3 | $25.12 $26.00 $26.50 | MG Base Yr. +E |
The Point at Las Colinas 300 East John Carpenter Freeway Irving, TX | 1983 | A | 401,220 | Quoted | - | - | - | $25.50 | MG Base Yr. +E |
Mandalay Tower One 220 East Las Colinas Boulevard Irving, TX | 1981 | A | 325,219 | GM Financial-expand GM Financial-expand Quoted | 22,337 2,534 - | Jun 2016 Jan 2016 - | 5.0 5.0 - | $24.00 $27.00 $28.00 | MG Base Yr. +E |
Canal Centre 400 East Las Colinas Boulevard Irving, TX | 1983 | A | 238,051 | Quoted | - | - | - | $27.50 | MG Base Yr. +E |
125 East John Carpenter Freeway Irving, TX | 1982 | A | 398,421 | F.L. Biomedical Quoted | 24,825 33,000 - | Dec 2016 April 2016 - | 10.8 10.8 - | $27.00 $28.00 $29.50 | MG Base Yr. +E |
Source:Appraisal
Operating History and Underwritten Net Cash Flow.The following table presents certain information relating to the historical operating performance and the Underwritten Net Cash Flow at the 250-290 East John Carpenter Freeway Property:
| Cash Flow Analysis | |||||
| 2015 | 2016 | 9/30/2017 TTM | UW | UW PSF | |
| Gross Potential Rent(1)(2) | $2,131,417 | $2,930,685 | $3,625,440 | $4,218,588 | $15.19 |
| Total Recoveries | $704,055 | $1,336,992 | $1,606,088 | $2,231,690 | $8.03 |
| Overage Rent | $923 | $5,152 | $9,627 | $0 | $0.00 |
| Total Other Income(3) | $14,676 | $19,010 | $23,523 | $65,648 | $0.24 |
| Less Vacancy & Credit Loss | $0 | $0 | $0 | ($877,238) | ($3.16) |
| Effective Gross Income | $2,851,070 | $4,291,839 | $5,264,678 | $5,638,689 | $20.30 |
| Total Operating Expenses | $2,082,337 | $2,472,313 | $2,671,516 | $2,743,176 | $9.88 |
| Net Operating Income(4) | $768,733 | $1,819,526 | $2,593,162 | $2,895,513 | $10.42 |
| Capital Expenditures | $0 | $0 | $0 | $55,555 | $0.20 |
| TI/LC | $0 | $0 | $0 | $609,580 | $2.19 |
| Net Cash Flow | $768,733 | $1,819,526 | $2,593,162 | $2,230,377 | $8.03 |
| Occupancy %(4) | 53.4% | 77.0% | 90.1%(5) | 86.4%(5) | |
| NOI DSCR | 0.77x | 1.81x | 2.58x | 2.88x | |
| NCF DSCR | 0.77x | 1.81x | 2.58x | 2.22x | |
| NOI Debt Yield | 3.3% | 7.8% | 11.2% | 12.5% | |
| NCF Debt Yield | 3.3% | 7.8% | 11.2% | 9.6% | |
| (1) | 2015 Gross Potential Rent includes rent abatements, totaling $15,000. |
| (2) | UW Gross Potential Rent includes rent steps through October 2018, totaling $52,303, an average of Wells Fargo Bank, N.A.’s contractual rent through August 30, 2024, totaling $54,783 and a vacancy gross up of $356,426. |
| (3) | Total Other Income includes $42,000 of parking income and other miscellaneous income. |
| (4) | The increase in Net Operating Income and Occupancy % from 2015 through 9/30/2017 TTM is primarily due to increase in occupancy from 53.4% to 90.1%. The borrower sponsor purchased the two buildings (250 and 290 East John Carpenter Freeway) in August 2012 when they were essentially vacant. The borrower sponsor subsequently commenced major renovations and leased up the two buildings in 2013-2014, increasing the occupancy of the 250-290 East John Carpenter Freeway Property to 90.1% as of 9/30/2017 TTM. The increase in UW Net Operating Income from the Most Recent Net Operating Income is primarily due to an increase in recoveries under Wells Fargo Bank, N.A.’s new lease, contractual rent steps through October 2018, and Wells Fargo Bank, N.A.’s average contractual rent steps through August 30, 2024. |
| (5) | The underwritten economic vacancy is 13.6%. Per a third party market report, submarket vacancy was 13.6% as of the third quarter of 2017. The 250-290 East John Carpenter Freeway Property was 93.5% occupied as of November 1, 2017. |
This is not a research report and was not prepared by any Underwriter’s research department. Please see additional important information and qualifications at the end of this Term Sheet. |
T-131
| MSC 2017-HR2 | Sheraton Novi |
| Mortgage Loan No. 15 – Sheraton Novi |
| Mortgage Loan Information | Property Information | ||||||
| Mortgage Loan Seller: | SMF III | Single Asset/Portfolio: | Single Asset | ||||
| Original Balance: | $23,100,000 | Location: | Novi, MI 48375 | ||||
| Cut-off Date Balance: | $23,100,000 | General Property Type: | Hospitality | ||||
| % of Initial Pool Balance: | 2.5% | Detailed Property Type: | Full Service | ||||
| Loan Purpose: | Acquisition | Title Vesting: | Fee | ||||
| Sponsors: | Driftwood Acquisition & Development | Year Built/Renovated: | 1985/2014 | ||||
| L.P.; Carlos J. Rodriguez; David | Size: | 238 Rooms | |||||
| Buddemeyer | Cut-off Date Balance per Room: | $97,059 | |||||
| Mortgage Rate: | 4.8280% | Maturity Date Balance per Room: | $79,529 | ||||
| Note Date: | 11/17/2017 | Property Manager: | Driftwood Hospitality Management, LLC (borrower affiliated) | ||||
| First Payment Date: | 1/6/2018 | ||||||
| Maturity Date: | 12/6/2027 | ||||||
| Original Term to Maturity: | 120 months | ||||||
| Original Amortization Term: | 360 months | Underwriting and Financial Information | |||||
| IO Period: | NAP | UW NOI: | $3,194,715 | ||||
| Seasoning: | 0 months | UW NOI Debt Yield: | 13.8% | ||||
| Prepayment Provisions: | LO (24); DEF/YM1 (91); O (5) | UW NOI Debt Yield at Maturity: | 16.9% | ||||
| Lockbox/Cash Mgmt Status: | Soft/Springing | UW NCF DSCR: | 1.87x | ||||
| Additional Debt Type: | N/A | Most Recent NOI: | $3,257,423 (8/31/2017 TTM) | ||||
| Additional Debt Balance: | N/A | 2nd Most Recent NOI: | $3,104,625 (12/31/2016) | ||||
| Future Debt Permitted (Type)(2): | Yes (Mezzanine) | 3rd Most Recent NOI: | $2,907,621 (12/31/2015) | ||||
| Most Recent Occupancy: | 71.2% (8/31/2017) | ||||||
| Reserves | 2nd Most Recent Occupancy: | 69.7% (12/31/2016) | |||||
| Type | Initial | Monthly | Cap | 3rd Most Recent Occupancy: | 74.1% (12/31/2015) | ||
| RE Tax: | $177,433 | $35,487 | N/A | Appraised Value (as of)(1): | $37,000,000 (11/1/2017) | ||
| Insurance: | $71,930 | $6,539 | N/A | Cut-off Date LTV Ratio(1): | 62.4% | ||
| Recurring Replacements: | $0 | $38,683 | N/A | Maturity Date LTV Ratio(1): | 51.2% | ||
| PIP: | $5,255,930 | $0 | N/A | ||||
| Sources and Uses | ||||||
| Sources | Proceeds | % of Total | Uses | Proceeds | % of Total | |
| Loan Amount: | $23,100,000 | 63.5% | Purchase Price: | $30,500,000 | 83.8% | |
| Borrower Sponsor Equity: | $13,282,901 | 36.5% | Reserves: | $5,505,293 | 15.1% | |
| Closing Costs: | $377,608 | 1.0% | ||||
| Total Sources: | $36,382,901 | 100.0% | Total Uses: | $36,382,901 | 100.0% | |
| (1) | The appraiser concluded to an “as-is” appraised value based on a hypothetical condition of $37,000,000 with an appraisal valuation date of November 1, 2017. The “as-is” appraised value based on a hypothetical condition assumes a PIP costing approximately $5,300,000 was completed as of November 1, 2017. At origination of the Sheraton Novi Mortgage Loan, the borrower deposited $5,255,930 for the required PIP. The “as-is” appraised value is $32,000,000 with a valuation date of November 1, 2017. The Cut-off Date LTV Ratio and Maturity Date LTV Ratio based on the “as-is” appraised value are 72.2% and 59.1%, respectively. |
| (2) | From and after November 17, 2022, mezzanine debt from an acceptable mezzanine lender is permitted under the following conditions, among others: (a) minimum combined debt service coverage ratio of 1.40x, (b) aggregate maximum loan-to-value ratio of 75.0%, (c) the Sheraton Novi Property will have satisfied a minimum debt yield of 13.75% for at least two consecutive non-overlapping trailing 12 month calendar periods, (d) minimum combined debt yield of 10.0%, (e) delivery of a satisfactory intercreditor agreement and (f) rating agency confirmation. |
The Mortgage Loan. The fifteenth largest mortgage loan (the “Sheraton Novi Mortgage Loan”) is evidenced by a promissory note in the original principal amount of $23,100,000 that is secured by a first priority fee mortgage encumbering a full service hospitality property known as Sheraton Novi in Novi, Michigan (the “Sheraton Novi Property”). The proceeds of the Sheraton Novi Mortgage Loan were primarily used to acquire the Sheraton Novi Property for the purchase price of $30.5 million, fund reserves of approximately $5.5 million and pay closing costs. The Sheraton Novi Property was previously securitized in the COMM 2012-CCRE5 transaction.
The Borrower and the Sponsors. The borrower is Haggerty Novi Owner, LLC (the “Sheraton Novi Borrower”), a Delaware limited-liability company. The non-recourse carve-out guarantors for the Sheraton Novi Mortgage Loan are Driftwood Acquisition & Development, L.P., Carlos J. Rodriguez and David Buddemeyer. Carlos J. Rodriguez and David Buddemeyer are both principals of Driftwood Hospitality Management, LLC (“Driftwood”). Presently, Driftwood operates 42 hotels with more than 8,000 rooms throughout the United States and Costa Rica, of which it owns 25 hotels totaling 5,300 rooms. Driftwood’s portfolio includes a number of brands that range from full-service hotels and resorts to mid-size select-service, extended stay and independent boutiques. Driftwood’s hotels include Marriott, Starwood, Hilton, Hyatt, IHG and Wyndham flagged properties. Driftwood has an ongoing relationship with Marriott, with 15 hotels totaling more than approximately 3,300 rooms that have been flagged with Marriott brands.
This is not a research report and was not prepared by any Underwriter’s research department. Please see additional important information and qualifications at the end of this Term Sheet. |
T-132
| MSC 2017-HR2 | Sheraton Novi |
The Property. The Sheraton Novi Property consists of a seven-story, full-service hotel comprised of 238 guestrooms located in Novi, Michigan, approximately 3.1 miles south of the I-275 and I-96 interchange, equidistant between Detroit, Ann Arbor and Pontiac/Auburn Hills. The Sheraton Novi Property is situated on a 9.9-acre parcel, and amenities include 19,966 square feet of meeting space, a 24-hour business center, restaurant, bar, café, fitness room, indoor pool and whirlpool spa. Additionally, the Sheraton Novi Property is located within walking distance to restaurants, shopping and entertainment. The Sheraton Novi Property contains 141 king guestrooms, 95 double/double guestrooms and two king suites.
All guestrooms feature a flat screen high definition television, mini refrigerator, desk and wireless internet access. The Sheraton Novi Property contains 573 parking spaces, accounting for a parking ratio of 2.4 spaces per room.
The Sheraton Novi Property was built in 1985 and most recently renovated in 2014. Since 2013, the Sheraton Novi Property has benefited from approximately $6.3 million ($26,471 per room) in renovations. Capital expenditures during this time period included upgrades to the guestrooms, corridors, meeting room, the Sheraton Club, pool bathrooms and public areas of the Sheraton Novi Property. Additionally, in connection with the acquisition of the Sheraton Novi Property, the property will undergo a change of ownership PIP totaling approximately $5.3 million ($22,269 per room).
According to the appraisal, the demand segmentation for the Sheraton Novi Property is 52% commercial, 20% leisure, and 28% meeting and group. In connection with the acquisition of the Sheraton Novi Property, the hotel franchise agreement was extended 20 years and expires on November 17, 2037.
| Historical Occupancy, ADR, RevPAR(1)(2)(3) | |||||||||
Competitive Set | Sheraton Novi Property | Penetration Factor | |||||||
| Year | Occupancy | ADR | RevPAR | Occupancy | ADR | RevPAR | Occupancy | ADR | RevPAR |
| 8/31/2015 TTM | 71.4% | $125.02 | $89.24 | 74.6% | $110.59 | $82.47 | 104.5% | 88.5% | 92.4% |
| 8/31/2016 TTM | 68.1% | $133.03 | $90.61 | 72.1% | $119.90 | $86.49 | 105.9% | 90.1% | 95.5% |
| 8/31/2017 TTM | 72.2% | $136.05 | $98.21 | 71.2% | $124.93 | $88.94 | 98.6% | 91.8% | 90.6% |
| (1) | Source:Industry Report and Underwritten Operating Statements. |
| (2) | The competitive set includes Renaissance The Baronette Detroit Novi Hotel, DoubleTree Hotel Detroit Novi, Marriott Detroit Livonia, Embassy Suites Livonia Detroit Novi, Hyatt Place Livonia and The Inn @ St Johns. |
| (3) | Variances between the underwriting, the appraisal and the above table with respect to Occupancy, ADR and RevPAR at Sheraton Novi Property are attributable to variances in reporting methodologies and/or timing differences. |
The Market.The Sheraton Novi Property is located off I-275, approximately 3.1 miles south of the I-96 interchange, with average daily traffic counts of approximately 190,000 cars. It is located equidistant between Detroit, Ann Arbor, Pontiac/Auburn Hills, and just an hour from the state capital, Lansing. Additionally, the Sheraton Novi Property has visibility at the I-275 and I-96 interchange, approximately 14.9 miles north of the Detroit Metropolitan Wayne County Airport. According to the appraisal, the Sheraton Novi Property’s meeting facilities are among the largest and most flexible in the market. With approximately 20,000 square feet of total meeting space, the Sheraton Novi Property is able to capitalize on corporate and group demand. The meeting space was recently renovated in 2014. Renovations included new carpeting, doors, chairs, tables, lighting and bathroom updates.
Competitive properties to the Sheraton Novi Property are shown in the table below:
| Competitive Property Summary(1) | ||||||||
| Property Name | Year Opened | No. of Rooms | Commercial Demand | Meeting & Group Demand | Leisure Demand | 2016 Occ. | 2016 ADR | 2016 RevPAR |
| Sheraton Novi Property(2) | 1985 | 238 | 52% | 28% | 20% | 69.7% | $122.32 | $85.32 |
| Renaissance The Baronette Detroit Novi Hotel | 1990 | 155 | 50% | 25% | 25% | 70%-75% | $155-$160 | $105-$110 |
| DoubleTree Hotel Detroit Novi | 1988 | 148 | 40% | 30% | 30% | 70%-75% | $120-$125 | $80-$85 |
| Marriott Detroit Livonia | 1989 | 224 | 55% | 15% | 30% | 70%-75% | $125-$130 | $85-$90 |
| Embassy Suites Livonia Detroit Novi | 1989 | 239 | 40% | 20% | 40% | 65%-70% | $120-$125 | $80-$85 |
| Hyatt Place Livonia | 1998 | 127 | 65% | 15% | 20% | 70%-75% | $125-$130 | $90-$95 |
| The Inn @ St Johns | 2006 | 118 | 65% | 15% | 20% | 65%-70% | $175-$180 | $115-$120 |
| (1) | Source:Appraisal. |
| (2) | Variances between the underwriting, the appraisal and the Historical Occupancy, ADR and RevPAR table with respect to Occupancy, ADR and RevPAR at Sheraton Novi Property are attributable to variances in reporting methodologies and/or timing differences. |
This is not a research report and was not prepared by any Underwriter’s research department. Please see additional important information and qualifications at the end of this Term Sheet. |
T-133
| MSC 2017-HR2 | Sheraton Novi |
Operating History and Underwritten Net Cash Flow. The following table presents certain information relating to the historical operating performance and the Underwritten Net Cash Flow at Sheraton Novi Property:
| Cash Flow Analysis(1) | ||||||
| 2014 | 2015 | 2016 | 8/31/2017 TTM | UW | UW per Room | |
| Occupancy | 73.2% | 74.1% | 69.7% | 71.2% | 71.2% | |
| ADR | $106.80 | $114.08 | $122.32 | $124.93 | $124.93 | |
| RevPAR | $78.13 | $84.58 | $85.32 | $88.94 | $88.94 | |
| Rooms Revenue | $6,786,827 | $7,347,562 | $7,431,745 | $7,726,368 | $7,726,368 | $32,464 |
| Food & Beverage | $3,545,824 | $3,981,455 | $3,668,315 | $3,664,919 | $3,664,919 | $15,399 |
| Other Income(2) | $221,970 | $173,161 | $200,280 | $213,597 | $213,597 | $897 |
| Total Revenue | $10,554,621 | $11,502,178 | $11,300,339 | $11,604,884 | $11,604,884 | $48,760 |
| Total Expenses | $8,068,963 | $8,594,558 | $8,195,714 | $8,347,461 | $8,410,169 | $35,337 |
| Net Operating Income | $2,485,658 | $2,907,621 | $3,104,625 | $3,257,423 | $3,194,715 | $13,423 |
| FF&E | $422,764 | $460,087 | $452,014 | $464,195 | $464,195 | $1,950 |
| Net Cash Flow | $2,062,893 | $2,447,533 | $2,652,612 | $2,793,227 | $2,730,520 | $11,473 |
| NOI DSCR | 1.70x | 1.99x | 2.13x | 2.23x | 2.19x | |
| NCF DSCR | 1.41x | 1.68x | 1.82x | 1.91x | 1.87x | |
| NOI Debt Yield | 10.8% | 12.6% | 13.4% | 14.1% | 13.8% | |
| NCF Debt Yield | 8.9% | 10.6% | 11.5% | 12.1% | 11.8% | |
| (1) | Occupancy, ADR and RevPAR figures are based on the underwriting, which have been taken from financial statements provided by the Sheraton Novi Borrower. Variances between the underwriting, the appraisal and the Historical Occupancy, ADR, RevPAR table with respect to Occupancy, ADR and RevPAR at Sheraton Novi Property are attributable to variances in reporting methodologies and/or timing differences. |
| (2) | Other Income includes audio/visual rental income, in-room internet and movie income, vending income, gift shop income and no show revenue. |
This is not a research report and was not prepared by any Underwriter’s research department. Please see additional important information and qualifications at the end of this Term Sheet. |
T-134
| MSC 2017-HR2 |
This material was prepared by sales, trading, banking or other non-research personnel of one of the following (or an affiliate thereof): Morgan Stanley & Co. LLC, Morgan Stanley & Co. International Limited, Morgan Stanley Japan Limited and/or Morgan Stanley Dean Witter Asia Limited (together with their affiliates, hereinafter “Morgan Stanley”), Citigroup Global Markets Inc. (together with its affiliates, hereinafter “Citigroup”) and The Williams Capital Group, L.P. (together with its affiliates, “WCG,” and together with Morgan Stanley and Citigroup, the “Underwriters”). This material was not produced by an Underwriter’s research analyst, although it may refer to an Underwriter’s research analyst or research report. Unless otherwise indicated, these views (if any) are the author’s and may differ from those of the fixed income or equity research departments of the Underwriters or others in those firms.
This material may have been prepared by or in conjunction with the respective trading desks of the Underwriters that may deal as principal in or own or act as market maker or liquidity provider for the securities/instruments (or related derivatives) mentioned herein. The trading desk may have accumulated a position in the subject securities/instruments based on the information contained herein. Trading desk materials are not independent of the proprietary interests of the Underwriters, which may conflict with your interests. Each of the Underwriters may also perform or seek to perform investment banking services for the issuers of the securities and instruments mentioned herein.
The information contained in this material is subject to change, completion or amendment from time to time, and the information in this material supersedes information in any other communication relating to the securities referred to in this material. This material is not a solicitation to participate in any trading strategy, and is not an offer to sell any security or instrument or a solicitation of an offer to buy or sell any security or instrument in any jurisdiction where an offer, solicitation or sale is not permitted. Unless otherwise set forth in this material, any securities referred to in this material maynot have been registered under the U.S. Securities Act of 1933, as amended, and, if not, may not be offered or sold absent an exemption therefrom. Recipients are required to comply with any legal or contractual restrictions on their purchase, holding, sale, exercise of rights or performance of obligations under any securities/instruments transaction.
The securities/instruments discussed in this material may not be suitable for all investors. This material has been prepared and issued by the Underwriters for intended distribution to market professionals and institutional investor clients. Other recipients should seek independent investment advice prior to making any investment decision based on this material. This material does not provide individually tailored investment advice or offer tax, regulatory, accounting or legal advice. Prior to entering into any proposed transaction, recipients should determine, in consultation with their own investment, legal, tax, regulatory and accounting advisors, the economic risks and merits, as well as the legal, tax, regulatory and accounting characteristics and consequences, of the transaction. You should consider this material as only a single factor in making an investment decision.
The value of and income from investments may vary because of changes in interest rates, foreign exchange rates, default rates, prepayment rates, securities/instruments prices, market indexes, operational or financial conditions of companies or other factors. There may be time limitations on the exercise of options or other rights in securities/instruments transactions. Past performance is not necessarily a guide to future performance. Estimates of future performance are based on assumptions that may not be realized. Actual events may differ from those assumed and changes to any assumptions may have a material impact on any projections or estimates. Other events not taken into account may occur and may significantly affect the projections or estimates. Certain assumptions may have been made for modeling purposes only to simplify the presentation and/or calculation of any projections or estimates, and the Underwriters do not represent that any such assumptions will reflect actual future events. Accordingly, there can be no assurance that estimated returns or projections will be realized or that actual returns or performance results will not materially differ from those estimated herein. Some of the information contained in this document may be aggregated data of transactions in securities or other financial instruments executed by an Underwriter that has been compiled so as not to identify the underlying transactions of any particular customer.
Notwithstanding anything herein to the contrary, the Underwriters and each recipient hereof (and their employees, representatives, and other agents) may disclose to any and all persons, without limitation of any kind from the commencement of discussions, the U.S. federal and state income tax treatment and tax structure of the transaction and all materials of any kind (including opinions or other tax analyses) that are provided to it relating to the tax treatment and tax structure (as such terms are defined in Treasury Regulation 1.6011-4). For this purpose, “tax structure” is limited to facts relevant to the U.S. federal and state income tax treatment of the transaction and does not include information relating to the identity of the parties, their affiliates, agents or advisors. This authorization of tax disclosure is retroactively effective to the commencement of discussions with prospective investors regarding the transactions contemplated herein.
THE DISTRIBUTION OF THIS MATERIAL (A) IF MADE BY A PERSON WHO IS NOT AN AUTHORIZED PERSON UNDER THE FINANCIAL SERVICES AND MARKETS ACT 2000 (“FSMA”), IS BEING MADE ONLY TO, OR DIRECTED ONLY AT, PERSONS WHO (I) ARE OUTSIDE THE UNITED KINGDOM, OR (II) HAVE PROFESSIONAL EXPERIENCE IN MATTERS RELATING TO INVESTMENTS AND QUALIFY AS INVESTMENT PROFESSIONALS IN ACCORDANCE WITH ARTICLE 19(5) OF THE FINANCIAL SERVICES AND MARKETS ACT 2000 (FINANCIAL PROMOTION) ORDER 2005 (THE “FINANCIAL PROMOTION ORDER”), OR (III) ARE PERSONS FALLING WITHIN ARTICLE 49(2)(A) THROUGH (D) (HIGH NET WORTH COMPANIES, UNINCORPORATED ASSOCIATIONS, ETC.) OF THE FINANCIAL PROMOTION ORDER; AND (B) IF MADE BY A PERSON WHO IS AN AUTHORIZED PERSON UNDER THE FSMA, IS BEING MADE ONLY TO, OR DIRECTED ONLY AT, PERSONS WHO (I) ARE OUTSIDE THE UNITED KINGDOM, OR (II) HAVE PROFESSIONAL EXPERIENCE IN MATTERS RELATING TO INVESTMENTS AND QUALIFY AS INVESTMENT PROFESSIONALS IN ACCORDANCE WITH ARTICLE 14(5) OF THE FINANCIAL SERVICES AND MARKETS ACT 2000 (PROMOTION OF COLLECTIVE INVESTMENT SCHEMES) (EXEMPTIONS) ORDER 2001 (THE “PROMOTION OF COLLECTIVE INVESTMENT SCHEMES EXEMPTIONS ORDER”), OR (III) ARE PERSONS FALLING WITHIN ARTICLE 22(2)(A) THROUGH (D) (“HIGH NET WORTH COMPANIES, UNINCORPORATED ASSOCIATIONS, ETC.”) OF THE PROMOTION OF COLLECTIVE INVESTMENT SCHEMES EXEMPTIONS ORDER, OR (IV) ARE PERSONS TO WHOM THE ISSUING ENTITY MAY LAWFULLY BE PROMOTED IN ACCORDANCE WITH CHAPTER 4.12 OF THE UK FINANCIAL CONDUCT AUTHORITY’S CONDUCT OF BUSINESS SOURCEBOOK.
THE OFFERED CERTIFICATES HAVE NOT BEEN AND WILL NOT BE REGISTERED UNDER THE FINANCIAL INSTRUMENTS EXCHANGE ACT OF JAPAN (LAW NO. 25 OF 1948, AS AMENDED (THE “FIEL”)), AND EACH OF MORGAN STANLEY & CO. LLC, CITIGROUP GLOBAL MARKETS INC. AND THE WILLIAMS CAPITAL GROUP, L.P. HAS AGREED THAT IT WILL NOT OFFER OR SELL ANY OFFERED CERTIFICATES, DIRECTLY OR INDIRECTLY, IN JAPAN OR TO, OR FOR THE BENEFIT OF, ANY JAPANESE PERSON, OR TO OTHERS FOR REOFFERING OR RESALE, DIRECTLY OR INDIRECTLY, IN JAPAN OR TO ANY JAPANESE PERSON, EXCEPT PURSUANT TO AN EXEMPTION FROM THE REGISTRATION REQUIREMENTS OF, AND OTHERWISE IN COMPLIANCE WITH, THE FIEL AND ANY OTHER APPLICABLE LAWS AND REGULATIONS. FOR THE PURPOSES OF THIS PARAGRAPH, “JAPANESE PERSON” SHALL MEAN ANY PERSON RESIDENT IN JAPAN, INCLUDING ANY CORPORATION OR OTHER ENTITY ORGANIZED UNDER THE LAWS AND REGULATIONS OF JAPAN.
This is not a research report and was not prepared by any Underwriter’s research department. Please see additional important information and qualifications at the end of this Term Sheet. |
T-135