| FREE WRITING PROSPECTUS | ||
| FILED PURSUANT TO RULE 433 | ||
| REGISTRATION FILE NO.: 333-206582-14 | ||
 |  |  |
BANK 2018-BNK11
Free Writing Prospectus
Structural and Collateral Term Sheet
$688,200,694
(Approximate Total Mortgage Pool Balance)
$576,153,000
(Approximate Offered Certificates)
Morgan Stanley Capital I Inc.
as Depositor
Wells Fargo Bank, National Association
Bank of America, National Association
Morgan Stanley Mortgage Capital Holdings LLC
National Cooperative Bank, N.A.
as Sponsors and Mortgage Loan Sellers
Commercial Mortgage Pass-Through Certificates
Series 2018-BNK11
April 5, 2018
MORGAN STANLEY Co-Lead Bookrunner Manager | BofA MERRILL LYNCH Co-Lead Bookrunner Manager | WELLS FARGO SECURITIES Co-Lead Bookrunner Manager |
Academy Securities, Inc. Co-Manager
| Drexel Hamilton Co-Manager
|
STATEMENT REGARDING THIS FREE WRITING PROSPECTUS
The depositor has filed a registration statement (including a prospectus) with the SEC (File No. 333-206582) for the offering to which this communication relates. Before you invest, you should read the prospectus in that registration statement and other documents the depositor has filed with the SEC for more complete information about the depositor, the issuing entity and this offering. You may get these documents for free by visiting EDGAR on the SEC web site atwww.sec.gov. Alternatively, the depositor or any underwriter or any dealer participating in the offering will arrange to send you the prospectus if you request it by calling toll free 1-866-718-1649 or by email toprospectus@ms.com.
This is not a research report and was not prepared by any Underwriter’s research department. It was prepared by the Underwriters’ sales, trading, banking or other non-research personnel. Please see additional important information and qualifications at the end of this Term Sheet. |
Neither this Term Sheet nor anything contained herein shall form the basis for any contract or commitment whatsoever.The information contained herein is preliminary as of the date hereof.This Term Sheet is subject to change, completion or amendment from time to time.The information contained herein will be superseded by similar information delivered to you as part of the Preliminary Prospectus.The information contained herein supersedes any such information previously delivered.The information contained herein should be reviewed only in conjunction with the entire Preliminary Prospectus.All of the information contained herein is subject to the same limitations and qualifications contained in the Preliminary Prospectus.The information contained herein does not contain all relevant information relating to the underlying mortgage loans or mortgaged properties.Such information is described in the Preliminary Prospectus.The information contained herein will be more fully described in the Preliminary Prospectus.The information contained herein should not be viewed as projections, forecasts, predictions or opinions with respect to value.Prior to making any investment decision, prospective investors are strongly urged to read the Preliminary Prospectus in its entirety.Neither the Securities and Exchange Commission nor any state securities commission has approved or disapproved of these securities or determined if this Term Sheet is truthful or complete.Any representation to the contrary is a criminal offense.
IMPORTANT NOTICE RELATING TO AUTOMATICALLY GENERATED EMAIL DISCLAIMERS
Any legends, disclaimers or other notices that may appear at the bottom of, or attached to, the email communication to which this Term Sheet may have been attached are not applicable to this Term Sheet and should be disregarded. Such legends, disclaimers or other notices have been automatically generated as a result of this Term Sheet having been sent via Bloomberg or another email system.
IMPORTANT NOTICE REGARDING THE CONDITIONS FOR THIS OFFERING OF ASSET-BACKED SECURITIES
THE ASSET-BACKED SECURITIES REFERRED TO IN THIS TERM SHEET ARE BEING OFFERED WHEN, AS AND IF ISSUED. IN PARTICULAR, YOU ARE ADVISED THAT THE ASSET-BACKED SECURITIES, AND THE ASSET POOL BACKING THEM, ARE SUBJECT TO MODIFICATION OR REVISION (INCLUDING, AMONG OTHER THINGS, THE POSSIBILITY THAT ONE OR MORE CLASSES OF SECURITIES MAY BE SPLIT, COMBINED OR ELIMINATED), AT ANY TIME PRIOR TO ISSUANCE OR AVAILABILITY OF A FINAL PROSPECTUS. AS A RESULT, YOU MAY COMMIT TO PURCHASE SECURITIES THAT HAVE CHARACTERISTICS THAT MAY CHANGE, AND YOU ARE ADVISED THAT ALL OR A PORTION OF THE SECURITIES MAY NOT BE ISSUED THAT HAVE THE CHARACTERISTICS DESCRIBED IN THIS TERM SHEET. OUR OBLIGATION TO SELL SECURITIES TO YOU IS CONDITIONED ON THE SECURITIES AND THE UNDERLYING TRANSACTION HAVING THE CHARACTERISTICS DESCRIBED IN THIS TERM SHEET. IF WE DETERMINE THAT THE FOREGOING CONDITION IS NOT SATISFIED IN ANY MATERIAL RESPECT, WE WILL NOTIFY YOU, AND NEITHER THE ISSUING ENTITY NOR ANY UNDERWRITER WILL HAVE ANY OBLIGATION TO YOU TO DELIVER ALL OR ANY PORTION OF THE SECURITIES WHICH YOU HAVE COMMITTED TO PURCHASE, AND THERE WILL BE NO LIABILITY BETWEEN US AS A CONSEQUENCE OF THE NON-DELIVERY.
This is not a research report and was not prepared by any Underwriter’s research department. Please see additional important information and qualifications at the end of this Term Sheet. |
| T-1 |
| BANK 2018-BNK11 | Structural Overview |
Offered Certificates
| Class | Expected Ratings (Fitch/S&P/KBRA)(1) | Approximate Initial Certificate Balance or Notional Amount(2) | Approximate Initial Credit Support(3) | Pass-Through Rate Description | Expected Weighted Average Life (Years)(4) | Expected Principal Window (Months)(4) | Certificate Principal UW NOI Debt Yield(5) | Certificate Principal to Value Ratio(6) |
| Class A-1 | AAAsf/AAA(sf)/AAA(sf) | $21,300,000 | 30.000% | (7) | 2.76 | 1 – 60 | 20.0% | 38.4% |
| Class A-SB | AAAsf/AAA(sf)/AAA(sf) | $31,500,000 | 30.000% | (7) | 7.47 | 60 – 117 | 20.0% | 38.4% |
| Class A-2 | AAAsf/AAA(sf)/AAA(sf) | (8) | 30.000% | (7) | (8) | (8) | 20.0% | 38.4% |
| Class A-3 | AAAsf/AAA(sf)/AAA(sf) | (8) | 30.000% | (7) | (8) | (8) | 20.0% | 38.4% |
| Class X-A | AAAsf/AAA(sf)/AAA(sf) | $457,653,000(9) | N/A | Variable IO(10) | N/A | N/A | N/A | N/A |
| Class X-B | AA-sf/NR/AA(sf) | $88,262,000(9) | N/A | Variable IO(10) | N/A | N/A | N/A | N/A |
| Class A-S | AAAsf/AAA(sf)/AAA(sf) | $38,410,000 | 24.125% | (7) | 9.97 | 120 – 120 | 18.5% | 41.6% |
| Class B | AA-sf/NR/AA(sf) | $49,852,000 | 16.500% | (7) | 9.97 | 120 – 120 | 16.8% | 45.8% |
| Class C | A-sf/NR/A(sf) | $30,238,000 | 11.875% | (7) | 9.97 | 120 – 120 | 15.9% | 48.3% |
Privately Offered Certificates(11)
| Class | Expected Ratings (Fitch/S&P/KBRA)(1) | Approximate Initial Certificate Balance or Notional Amount(2) | Approximate Initial Credit Support(3) | Pass-Through Rate Description | Expected Weighted Average Life (Years)(4) | Expected Principal Window (Months)(4) | Certificate Principal UW NOI Debt Yield(5) | Certificate Principal to Value Ratio(6) |
| Class X-D | BBB-sf/NR/BBB-(sf) | $34,324,000(9) | N/A | Variable IO(10) | N/A | N/A | N/A | N/A |
| Class X-E | BB-sf/NR/BB-(sf) | $13,893,000(9) | N/A | Variable IO(10) | N/A | N/A | N/A | N/A |
| Class D | BBB-sf/NR/BBB-(sf) | $34,324,000 | 6.625% | (7) | 9.97 | 120 – 120 | 15.0% | 51.2% |
| Class E | BB-sf/NR/BB-(sf) | $13,893,000 | 4.500% | (7) | 9.97 | 120 – 120 | 14.7% | 52.3% |
| Class F | B-sf/NR/B-(sf) | $8,172,000 | 3.250% | (7) | 9.97 | 120 – 120 | 14.5% | 53.0% |
| Class G | NR/NR/NR | $21,248,658 | 0.000% | (7) | 9.97 | 120 – 120 | 14.0% | 54.8% |
Non-Offered Eligible Vertical Interest(11)
| Class | Expected Ratings (Fitch/S&P/KBRA)(1) | Approximate Initial Certificate Balance or Notional Amount(2) | Approximate Initial Credit Support(3) | Pass-Through Rate Description | Expected Weighted Average Life (Years)(4) | Expected Principal Window (Months)(4) | Certificate Principal UW NOI Debt Yield | Certificate Principal to Value Ratio |
| RR Interest | NR/NR/NR | $34,410,034.68 | N/A | (12) | 9.54 | 1 – 120 | N/A | N/A |
| (1) | Ratings shown are those of Fitch Ratings, Inc. (“Fitch”), S&P Global Ratings, acting through Standard & Poor’s Financial Services LLC (“S&P”), and Kroll Bond Rating Agency, Inc. (“KBRA”). Certain nationally recognized statistical rating organizations that were not hired by the depositor may use information they receive pursuant to Rule 17g-5 under the Securities Exchange Act of 1934, as amended, or otherwise to rate the certificates. There can be no assurance as to what ratings a non-hired nationally recognized statistical rating organization would assign. See “Risk Factors—Other Risks Relating to the Certificates—Nationally Recognized Statistical Rating Organizations May Assign Different Ratings to the Certificates; Ratings of the Certificates Reflect Only the Views of the Applicable Rating Agencies as of the Dates Such Ratings Were Issued; Ratings May Affect ERISA Eligibility; Ratings May Be Downgraded” and “Ratings” in the Preliminary Prospectus to be dated on or about the date hereof (the “Preliminary Prospectus”). Capitalized terms used but not defined herein have the meanings assigned to such terms in the Preliminary Prospectus. |
| (2) | Approximate, subject to a permitted variance of plus or minus 5% and further subject to the discussion in footnote (8) below. In addition, the notional amounts of the Class X-A, Class X-B, Class X-D and Class X-E certificates may vary depending upon the final pricing of the classes of principal balance certificates whose certificate balances comprise such notional amounts, and, if as a result of such pricing the pass-through rate of any class of the Class X-A, Class X-B, Class X-D or Class X-E certificates, as applicable, would be equal to zero at all times, such class of certificates will not be issued on the closing date of this securitization. |
| (3) | The approximate initial credit support percentages set forth for the certificates are approximate and, for the Class A-1, Class A-SB, Class A-2 and Class A-3 certificates, are represented in the aggregate. The RR Interest provides credit support only to the limited extent that it is allocated a portion of any losses incurred on the underlying mortgage loans, which such losses are allocated between it, on the one hand, and to the Offered Certificates and the Non-Offered Certificates, on the other hand,pro rata in accordance with their respective Percentage Allocation Entitlements (as defined below). See “Credit Risk Retention” in the Preliminary Prospectus. |
| (4) | The Expected Weighted Average Life and Expected Principal Window during which distributions of principal would be received as set forth in the foregoing table with respect to each class of certificates having a certificate balance are based on the assumptions set forth under “Yield and Maturity Considerations—Weighted Average Life” in the Preliminary Prospectus and on the assumptions that there are no prepayments, modifications or losses in respect of the mortgage loans and that there are no extensions or forbearances of maturity dates or anticipated repayment dates of the mortgage loans. |
| (5) | Certificate Principal UW NOI Debt Yield for any class of principal balance certificates (other than the RR Interest) is calculated as the product of (a) the weighted average UW NOI Debt Yield for the mortgage pool, multiplied by (b) a fraction, the numerator of which is the total initial certificate balance of all the principal balance certificates (other than the RR Interest), and the denominator of which is the total initial certificate balance of the subject class of principal balance certificates and all other classes of principal balance certificates (other than the RR Interest), if any, that are senior to such class (without regard to |
This is not a research report and was not prepared by any Underwriter’s research department. Please see additional important information and qualifications at the end of this Term Sheet. |
| T-2 |
| BANK 2018-BNK11 | Structural Overview |
| the RR Interest). The Certificate Principal UW NOI Debt Yields of the Class A-1, Class A-SB, Class A-2 and Class A-3 certificates are calculated in the aggregate for those classes as if they were a single class. |
| (6) | Certificate Principal to Value Ratio for any class of principal balance certificates (other than the RR Interest) is calculated as the product of (a) the weighted average Cut-off Date LTV Ratio of the mortgage pool, multiplied by (b) a fraction, the numerator of which is the total initial certificate balance of the subject class of principal balance certificates and all other classes of principal balance certificates (other than the RR Interest), if any, that are senior to such class, and the denominator of which is the total initial certificate balance of all the principal balance certificates (other than the RR Interest). The Certificate Principal to Value Ratios of the Class A-1, Class A-SB, Class A-2 and Class A-3 certificates are calculated in the aggregate for those classes as if they were a single class. |
| (7) | The pass-through rate for each class of the Class A-1, Class A-SB, Class A-2, Class A-3, Class A-S, Class B, Class C, Class D, Class E, Class F and Class G certificates (which, together with the RR Interest, are referred to as the “principal balance certificates”) will be one of the following: (i) a fixed rateper annum, (ii) a variable rateper annum equal to the weighted average of the net mortgage interest rates on the mortgage loans for the related distribution date, (iii) a variable rateper annum equal to the lesser of (a) a fixed rate and (b) the weighted average of the net mortgage interest rates on the mortgage loans for the related distribution date or (iv) a variable rateper annum equal to the weighted average of the net mortgage interest rates on the mortgage loans for the related distribution date minus a specified percentage. For purposes of the calculation of the weighted average of the net mortgage interest rates on the mortgage loans for each distribution date, the net mortgage interest rates will be adjusted as necessary to a 30/360 basis. |
| (8) | The exact initial certificate balances of the Class A-2 and Class A-3 certificates are unknown and will be determined based on the final pricing of those classes of certificates. However, the initial certificate balances, weighted average lives and principal windows of the Class A-2 and Class A-3 certificates are expected to be within the applicable ranges reflected in the following chart. The aggregate initial certificate balance of the Class A-2 and Class A-3 certificates is expected to be approximately $404,853,000, subject to a variance of plus or minus 5%. |
| Class of Certificates | Expected Range of Initial Certificate Balance | Expected Range of Weighted Average Life (Years) | Expected Range of Principal Window (Months) |
| Class A-2 | $100,000,000 - $180,000,000 | 9.75 – 9.80 | 117 – 118 / 117 – 119 |
| Class A-3 | $224,853,000 - $304,853,000 | 9.88 – 9.89 | 118 – 120 / 119 – 120 |
| (9) | The Class X-A, Class X-B, Class X-D and Class X-E certificates (collectively referred to as the “Class X certificates”) are notional amount certificates and will not be entitled to distributions of principal. The notional amount of the Class X-A certificates will be equal to the aggregate certificate balance of the Class A-1, Class A-SB, Class A-2 and Class A-3 certificates. The notional amount of the Class X-B certificates will be equal to the aggregate certificate balance of the Class A-S and Class B certificates. The notional amount of each class of the Class X-D and Class X-E certificates will be equal to the certificate balance of the class of principal balance certificates that with the addition of “X-”, has the same alphabetical designation as the subject class of Class X certificates. |
| (10) | The pass-through rate for the Class X-A certificates for any distribution date will be aper annum rate equal to the excess, if any, of (a) the weighted average of the net mortgage interest rates on the mortgage loans for the related distribution date, over (b) the weighted average of the pass-through rates on the Class A-1, Class A-SB, Class A-2 and Class A-3 certificates for the related distribution date, weighted on the basis of their respective certificate balances outstanding immediately prior to that distribution date. The pass-through rate for the Class X-B certificates for any distribution date will be aper annum rate equal to the excess, if any, of (a) the weighted average of the net mortgage interest rates on the mortgage loans for the related distribution date, over (b) the weighted average of the pass-through rates on the Class A-S and Class B certificates for the related distribution date, weighted on the basis of their respective certificate balances outstanding immediately prior to that distribution date. The pass-through rate for each class of the Class X-D and Class X-E certificates for any distribution date will be aper annum rate equal to the excess, if any, of (a) the weighted average of the net mortgage interest rates on the mortgage loans for the related distribution date, over (b) the pass-through rate for the related distribution date of the class of principal balance certificates that, with the addition of “X-”, has the same alphabetical designation as the subject class of Class X certificates. For purposes of the calculation of the weighted average of the net mortgage interest rates on the mortgage loans for each distribution date, the net mortgage interest rates will be adjusted as necessary to a 30/360 basis. |
| (11) | Not offered pursuant to the Preliminary Prospectus or this Term Sheet. Information provided in this Term Sheet regarding the characteristics of these certificates is provided only to enhance your understanding of the offered certificates. The privately offered certificates also include the Class V and Class R certificates, which do not have a certificate balance, notional amount, credit support, pass-through rate, rating, assumed final distribution date or rated final distribution date, and which are not shown in the chart. The Class V certificates represent a beneficial ownership interest held through the grantor trust in a specified percentage of certain excess interest in respect of mortgage loans having anticipated repayment dates, if any. The Class R certificates represent the beneficial ownership of the residual interest in each of the real estate mortgage investment conduits, as further described in the Preliminary Prospectus. |
| (12) | Although it does not have a specified pass-through rate (other than for tax reporting purposes), the effective pass-through rate for the RR Interest will be a variable rateper annumequal to the weighted average of the net mortgage interest rates on the mortgage loans for the related distribution date (in each case adjusted, if necessary, to accrue on the basis of a 360-day year consisting of twelve 30-day months). |
This is not a research report and was not prepared by any Underwriter’s research department. Please see additional important information and qualifications at the end of this Term Sheet. |
| T-3 |
| BANK 2018-BNK11 | Structural Overview |
Issue Characteristics
| Offered Certificates: | $576,153,000 (approximate) monthly pay, multi-class, commercial mortgage pass-through certificates, consisting of seven principal balance classes (Class A-1, Class A-SB, Class A-2, Class A-3, Class A-S, Class B and Class C) and two interest-only classes (Class X-A and Class X-B) |
| Co-Lead Managers and Joint Bookrunners: | Morgan Stanley & Co. LLC, Wells Fargo Securities, LLC and Merrill Lynch, Pierce, Fenner & Smith Incorporated |
| Co-Managers: | Academy Securities, Inc. and Drexel Hamilton, LLC |
| Mortgage Loan Sellers: | Wells Fargo Bank, National Association, Bank of America, National Association, Morgan Stanley Mortgage Capital Holdings LLC and National Cooperative Bank, N.A. |
| Rating Agencies: | Fitch Ratings, Inc., S&P Global Ratings, acting through Standard & Poor’s Financial Services LLC, and Kroll Bond Rating Agency, Inc. |
| Master Servicers: | Wells Fargo Bank, National Association and National Cooperative Bank, N.A. |
| Special Servicers: | Midland Loan Services, a Division of PNC Bank, National Association and National Cooperative Bank, N.A. |
| Certificate Administrator/ Certificate Registrar/Custodian: | Wells Fargo Bank, National Association |
| Trustee: | Wilmington Trust, National Association |
| Operating Advisor: | Park Bridge Lender Services LLC |
| Asset Representations Reviewer: | Park Bridge Lender Services LLC |
| Initial Directing Certificateholder: | Eightfold Real Estate Capital Fund V, L.P. or an affiliate thereof |
| Risk Retention Consultation Party: | Morgan Stanley Mortgage Capital Holdings LLC |
| U.S. Credit Risk Retention: | For a discussion on the manner in which the U.S. credit risk retention requirements will be addressed by Morgan Stanley Mortgage Capital Holdings LLC, as the retaining sponsor, see “Credit Risk Retention” in the Preliminary Prospectus. |
| EU Risk Retention: | None of the sponsors, the depositor, the issuing entity or any other party intends to retain a material net economic interest in the securitization constituted by the issue of the Offered Certificates in accordance with the EU risk retention and due diligence requirements or to take any other action which may be required by EEA-regulated investors for the purposes of their compliance with the EU risk retention and due diligence requirements or similar requirements. |
| Cut-off Date: | The mortgage loans will be considered part of the trust fund as of their respective cut-off dates. The cut-off date with respect to each mortgage loan is the respective due date for the monthly debt service payment that is due in April 2018 (or, in the case of any mortgage loan that has its first due date after April 2018, the date that would have been its due date in April 2018 under the terms of that mortgage loan if a monthly debt service payment were scheduled to be due in that month). |
| Expected Pricing Date: | Week of April 9, 2018 |
| Expected Closing Date: | Week of April 23, 2018 |
| Determination Dates: | The 11th day of each month or, if the 11th day is not a business day, then the business day immediately following such 11th day. |
| Distribution Dates: | The 4th business day following each determination date. The first distribution date will be in May 2018. |
| Rated Final Distribution Date: | The distribution date in March 2061 |
| Interest Accrual Period: | Preceding calendar month |
| Payment Structure: | Sequential pay |
| Tax Treatment: | REMIC |
| Optional Termination: | 1.00% clean-up call |
| Minimum Denominations: | $10,000 for each class of Offered Certificates (other than Class X-A and Class X-B certificates); $1,000,000 for the Class X-A and Class X-B certificates |
| Settlement Terms: | DTC, Euroclear and Clearstream |
| Legal/Regulatory Status: | Each class of Offered Certificates is expected to be eligible for exemptive relief under ERISA. No class of Offered Certificates is SMMEA eligible. |
| Analytics: | The certificate administrator is expected to make available all distribution date statements, CREFC® reports and supplemental notices received by it to certain modeling financial services as described in the Preliminary Prospectus. |
| Bloomberg Ticker: | BANK 2018-BN11<MTGE><GO> |
| Risk Factors: | THE CERTIFICATES INVOLVE CERTAIN RISKS AND MAY NOT BE SUITABLE FOR ALL INVESTORS. SEE THE “RISK FACTORS” SECTION OF THE PRELIMINARY PROSPECTUS. |
This is not a research report and was not prepared by any Underwriter’s research department. Please see additional important information and qualifications at the end of this Term Sheet. |
| T-4 |
| BANK 2018-BNK11 | Structural Overview |
Structural Overview
| Allocation Between the RR Interest and the Non-Retained Certificates: | The aggregate amount available for distributions to the holders of the Certificates (including the RR Interest) on each distribution date (net of specified expenses of the issuing entity, including fees payable to, and costs and expenses reimbursable to, the master servicers, any primary servicers, the special servicers, the certificate administrator, the trustee, the operating advisor, the asset representations reviewer and CREFC®) will be allocated between amounts available for distribution to the holders of the RR Interest, on the one hand, and to all other Certificates, referred to herein as the “Non-Retained Certificates”, on the other hand. The portion of such amount allocable to (a) the RR Interest will at all times be the product of such amount multiplied by 5% and (b) the Non-Retained Certificates will at all times be the product of such amount multiplied by the difference between 100% and the percentage set forth in clause (a) (each, the respective “Percentage Allocation Entitlement”). |
| Accrual: | Each class of Offered Certificates will accrue interest on a 30/360 basis. |
| Amount and Order of Distributions: | On each distribution date, the Non-Retained Certificates’ Percentage Allocation Entitlement of funds available for distribution from the mortgage loans, net of (i) any yield maintenance charges and prepayment premiums and (ii) any excess interest, will be distributed in the following amounts and order of priority:
First, to the Class A-1, Class A-SB, Class A-2, Class A-3, Class X-A, Class X-B, Class X-D and Class X-E certificates, in respect of interest, up to an amount equal to, andpro rata in accordance with, the interest entitlements for those classes;
Second, to the Class A-1, Class A-SB, Class A-2 and Class A-3 certificates as follows, to the extent of applicable available funds allocated to principal: either (i)(a)first, to principal on the Class A-SB certificates, until the certificate balance of the Class A-SB certificates is reduced to the planned principal balance for the related distribution date set forth in Annex E to the Preliminary Prospectus, and (b)second, to principal on each class of the Class A-1, Class A-2, Class A-3 and Class A-SB certificates, in that order, in each case until the certificate balance of such class of certificates has been reduced to zero, or (ii) if the certificate balance of each class of principal balance certificates other than the Class A-1, Class A-SB, Class A-2 and Class A-3 certificates and the RR Interest has been reduced to zero as a result of the allocation of losses on the mortgage loans to those certificates, to principal on the Class A-1, Class A-SB, Class A-2 and Class A-3 certificates,pro rata, without regard to the distribution priorities described above or the planned principal balance of the Class A-SB certificates;
Third, to the Class A-1, Class A-SB, Class A-2 and Class A-3 certificates, first, up to an amount equal to, andpro rata based on, any previously unreimbursed losses on the mortgage loans allocable to principal that were previously borne by each such class and then in the amount of interest thereon;
Fourth, to each class of the Class A-S, Class B and Class C certificates, in that order, in each case as follows: (a) to interest on such class of certificates in the amount of its interest entitlement; (b) to the extent of applicable available funds allocable to principal remaining after distributions in respect of principal to each class with a higher priority (as set forth in this clause or prior enumerated clauses set forth above), to principal on such class of certificates until its certificate balance has been reduced to zero; and (c) to reimburse such class of certificates, first, in the amount of any previously unreimbursed losses on the mortgage loans that were previously allocated to those certificates, then in the amount of interest thereon;
Fifth, to the Non-Offered Certificates (other than the Class X-D, Class X-E, Class V and Class R certificates) in the amounts and order of priority described in “Description of the Certificates—Distributions” in the Preliminary Prospectus; and
Sixth, to the Class R certificates, any remaining amounts.
|
| Interest and Principal Entitlements: | The interest entitlement of each class of Offered Certificates on each distribution date generally will be the interest accrued during the related interest accrual period on the related certificate balance or notional amount at the related pass-through rate, net of any prepayment interest shortfalls allocated to that class for such distribution date as described below. If prepayment interest shortfalls arise from voluntary prepayments on serviced mortgage loans during any collection period, the applicable master servicer is required to make a limited compensating interest payment to offset those shortfalls. See “Description of the Certificates—Prepayment Interest Shortfalls” in the Preliminary Prospectus. The remaining amount of prepayment interest shortfalls will be allocated between the RR Interest, on one hand, and the Non-Retained Certificates, on the other hand, in accordance with their respective Percentage Allocation Entitlements. The prepayment interest shortfalls allocated to the Non-Retained Certificates (other than the Class V and Class R Certificates) will be allocated among such classes of certificates entitled to interest, on apro rata basis, based on their respective amounts of accrued interest for the related distribution date, to reduce the interest entitlement on each such class of certificates. If a class receives less than the entirety of its interest entitlement on any distribution date, then the shortfall (excluding any shortfall due to prepayment interest shortfalls), together with interest thereon, will be added to its interest entitlement for the next succeeding distribution date.
The aggregate principal distribution amount for each distribution date generally will be the aggregate amount of principal received or advanced in respect of the mortgage loans, net of any non-recoverable advances and interest thereon and any workout-delayed reimbursement amounts that are reimbursed to the applicable master servicer or the trustee during the related collection period. Non-recoverable advances and interest thereon are reimbursable from principal collections before reimbursement from other amounts. Workout-delayed reimbursement amounts will be reimbursable from principal collections. The Non-Retained Certificates and the RR Interest will be entitled to their respective Percentage Allocation Entitlements of the aggregate principal distribution amount. |
This is not a research report and was not prepared by any Underwriter’s research department. Please see additional important information and qualifications at the end of this Term Sheet. |
| T-5 |
| BANK 2018-BNK11 | Structural Overview |
| Special Servicer Compensation: | The principal compensation to be paid to a special servicer in respect of its special servicing activities will be the special servicing fee, the workout fee and the liquidation fee.
The special servicing fee for each distribution date is calculated based on the outstanding principal balance of each serviced mortgage loan that is a specially serviced mortgage loan (and any related serviced companion loan) or as to which the related mortgaged property has become an REO property at the special servicing fee rate, which will be a rate equal to (i) with respect to Midland Loan Services, a Division of PNC Bank, National Association, the greater of 0.25% and theper annum rate that would result in a special servicing fee for the related month of (x) $3,500 or (y) with respect to any mortgage loan with respect to which the risk retention consultation party is entitled to consult with the special servicer, for so long as the related mortgage loan is a specially serviced loan during the occurrence and continuance of a consultation termination event, $5,000, and (ii) with respect to National Cooperative Bank, N.A., the greater of 0.25% and theper annum rate that would result in a special servicing fee of $1,000 for the related month. The special servicing fee will be payable monthly,first, from liquidation proceeds, insurance and condemnation proceeds, and other collections in respect of the related specially serviced mortgage loan or REO property and,then, from general collections on all the mortgage loans and any REO properties.
Each special servicer will also be entitled to (i) liquidation fees generally equal to 1.0% (or, if such rate would result in an aggregate liquidation fee less than $25,000, then the liquidation fee rate will be equal to the lesser of (i) 3.0% and (ii) such lower rate as would result in an aggregate liquidation fee equal to $25,000) of liquidation proceeds and certain other collections in respect of a specially serviced mortgage loan (and any related serviced companion loan) or related REO property and of amounts received in respect of mortgage loan repurchases by the related mortgage loan sellers and (ii) workout fees generally equal to 1.0% of interest (other than post-ARD excess interest on mortgage loans with anticipated repayment dates and other than default interest) and principal payments made in respect of a rehabilitated mortgage loan (and any related serviced companion loan), subject to a floor of $25,000 with respect to any mortgage loan, whole loan or related REO property, and in the case of each of clause (i) and (ii), subject to certain adjustments and exceptions as described in the Preliminary Prospectus under “Pooling and Servicing Agreement—Servicing and Other Compensation and Payment of Expenses—Special Servicing Compensation”.
With respect to any non-serviced mortgage loan, the related special servicer under the related other pooling and servicing agreement pursuant to which such mortgage loan is being serviced will be entitled to similar compensation as that described above with respect to such non-serviced mortgage loan under such other pooling and servicing agreement as further described in the Preliminary Prospectus, although any related fees may accrue at a different rate and there may be a higher (or no) cap on liquidation and workout fees.
|
| Prepayment Premiums/Yield Maintenance Charges: | If any yield maintenance charge or prepayment premium is collected during any collection period with respect to any mortgage loan, then on the immediately succeeding distribution date, the certificate administrator will pay: (i)(a) to the holders of each class of the Class A-1, Class A-SB, Class A-2, Class A-3, Class A-S, Class B, Class C and Class D certificates, the product of (x) the Non-Retained Certificates’ Percentage Allocation Entitlement of such yield maintenance charge or prepayment premium, (y) the related Base Interest Fraction for such class and the applicable principal prepayment, and (z) a fraction, the numerator of which is equal to the amount of principal distributed to such class for that distribution date, and the denominator of which is the total amount of principal distributed to the Class A-1, Class A-SB, Class A-2, Class A-3, Class A-S, Class B, Class C and Class D certificates for that distribution date, (b) to the holders of the Class X-A certificates, the excess, if any, of (x) the product of (1) the Non-Retained Certificates’ Percentage Allocation Entitlement of such yield maintenance charge or prepayment premium and (2) a fraction, the numerator of which is equal to the amount of principal distributed to the Class A-1, Class A-SB, Class A-2 and Class A-3 certificates for that distribution date, and the denominator of which is the total amount of principal distributed to the Class A-1, Class A-SB, Class A-2, Class A-3, Class A-S, Class B, Class C and Class D certificates for that distribution date, over (y) the amount of such yield maintenance charge or prepayment premium distributed to the Class A-1, Class A-SB, Class A-2 and Class A-3 certificates as described above, (c) to the holders of the Class X-B certificates, the excess, if any, of (x) the product of (1) the Non-Retained Certificates’ Percentage Allocation Entitlement of such yield maintenance charge or prepayment premium and (2) a fraction, the numerator of which is equal to the amount of principal distributed to the Class A-S and Class B certificates for that distribution date, and the denominator of which is the total amount of principal distributed to the Class A-1, Class A-SB, Class A-2, Class A-3, Class A-S, Class B, Class C and Class D certificates for that distribution date, over (y) the amount of such yield maintenance charge or prepayment premium distributed to the Class A-S and Class B certificates as described above, and (d) to the holders of the Class X-D certificates, any remaining portion of the Non-Retained Certificates’ Percentage Allocation Entitlement of such yield maintenance charge or prepayment premium not distributed as described above, and (ii) to the RR Interest, its Percentage Allocation Entitlement of such yield maintenance charge or prepayment premium. No prepayment premiums or yield maintenance charges will be distributed to the holders of the Class X-E, Class E, Class F, Class G, Class V or Class R Certificates. “Base Interest Fraction” means, with respect to any principal prepayment of any mortgage loan that provides for the payment of a yield maintenance charge or prepayment premium, and with respect to any class of principal balance certificates (other than the RR Interest), a fraction (A) the numerator of which is the greater of (x) zero and (y) the difference between (i) the pass-through rate on that class, and (ii) the applicable discount rate and (B) the denominator of which is the difference between (i) the mortgage interest rate on the related mortgage loan and (ii) the applicable discount rate; provided, that: under no circumstances will the Base Interest Fraction be greater than one; if the discount rate referred to above is greater than or equal to both the mortgage interest rate on the related mortgage loan and the pass-through rate on that class, then the Base Interest Fraction will equal zero; and if the discount rate referred to above is greater than or equal to the |
This is not a research report and was not prepared by any Underwriter’s research department. Please see additional important information and qualifications at the end of this Term Sheet. |
| T-6 |
| BANK 2018-BNK11 | Structural Overview |
| mortgage interest rate on the related mortgage loan and is less than the pass-through rate on that class, then the Base Interest Fraction will be equal to 1.0. Consistent with the foregoing, the Base Interest Fraction is equal to: | |
(Pass-Through Rate – Discount Rate) (Mortgage Rate – Discount Rate) | |
| Realized Losses: | On each distribution date, immediately following the distributions to be made to the certificateholders on that date, the certificate administrator is required to calculate the amount, if any, by which (i) the aggregate stated principal balance of the mortgage loans, including any successor REO loans, expected to be outstanding immediately following that distribution date is less than (ii) the then aggregate certificate balance of the principal balance certificates after giving effect to distributions of principal on that distribution date. The Non-Retained Certificates’ Percentage Allocation Entitlement of such amount will be applied to the Class G, Class F, Class E, Class D, Class C, Class B and Class A-S certificates, in that order, in each case until the related certificate balance has been reduced to zero, and then to the Class A-1, Class A-SB, Class A-2 and Class A-3 certificates,pro rata based upon their respective certificate balances, until their respective certificate balances have been reduced to zero. The RR Interest’s Percentage Allocation Entitlement of such amount will be applied to the RR Interest until the related RR Interest balance has been reduced to zero. |
| Serviced Whole Loans: | Each of the following mortgaged properties or portfolio of mortgaged properties secures a mortgage loan and one or morepari passu promissory notes and, in some cases, one or more generally subordinate promissory notes (each, a “serviced companion loan”) that will be serviced pursuant to the related intercreditor agreement and the pooling and servicing agreement for this transaction: Airport Business Center and North Bay Portfolio. With respect to each such mortgaged property or portfolio of mortgaged properties, the related mortgage loan, together with the related serviced companion loan(s), is referred to herein (for so long as it is serviced under the pooling and servicing agreement for this transaction) as a “serviced whole loan.” Each serviced companion loan is not part of the mortgage pool and may be contributed to one or more future securitization transactions (if not already securitized) or may be otherwise transferred at any time, subject to compliance with the related intercreditor agreement. See the table below entitled “Mortgage Loans with Pari Passu Companion Loans,” as well as “Description of the Mortgage Pool—The Whole Loans” in the Preliminary Prospectus, for additional information regarding each such whole loan.
With respect to each of the One Dulles Tower whole loan, Northwest Hotel Portfolio whole loan and The Gateway whole loan (each, a “servicing shift whole loan”), the pooling and servicing agreement for this transaction will govern servicing of such whole loan until the securitization of the related control note (or, with respect to The Gateway whole loan, promissory note A-1-A); however, servicing of such whole loan will generally be directed by the holder of the related control note (which is not included in this securitization), and such holder will have the right to replace the special servicer with respect to the related whole loan with or without cause. With respect to each servicing shift whole loan, after the securitization of the related control note (or, with respect to The Gateway whole loan, promissory note A-1-A), such servicing shift whole loan will cease to be a serviced whole loan and will be serviced pursuant to the pooling and servicing agreement for another securitization transaction (see “—Non-Serviced Whole Loans” below).
|
| Non-Serviced Whole Loans: | Each of the following mortgaged properties or portfolio of mortgaged properties secures a mortgage loan (each, a “non-serviced mortgage loan”), one or morepari passu promissory notes and, in some cases, one or more generally subordinate promissory notes (each such promissory note, a “non-serviced companion loan”) that will be serviced pursuant to the related intercreditor agreement and the pooling and servicing agreement or trust and servicing agreement (referred to herein as a related “pooling and servicing agreement”) for another securitization transaction: Twelve Oaks Mall, Extra Space - TIAA Self Storage Portfolio, Apple Campus 3, One Dulles Tower (after the securitization of the related control note), Northwest Hotel Portfolio (after the securitization of the related control note) and The Gateway (after the securitization of promissory note A-1-A). With respect to each such mortgaged property or portfolio of mortgaged properties, the related mortgage loan, together with the related non-serviced companion loan(s), is referred to herein (for so long as it is serviced under the pooling and servicing agreement for another securitization transaction) as a “non-serviced whole loan.” Each non-serviced companion loan is not part of the mortgage pool and may be contributed to one or more future securitization transactions (if not already securitized) or may be otherwise transferred at any time, subject to compliance with the related intercreditor agreement. Servicing of each non-serviced whole loan will generally be directed by the holder of the related control note (or, if such control note is included in a securitization, the directing certificateholder thereunder (or other party designated thereunder to exercise the rights of such control note)), and such holder will have the right to replace the special servicer with respect to the related whole loan with or without cause. See the tables below entitled “Mortgage Loans with Pari Passu Companion Loans” and“Mortgage Loans with Subordinate Debt,” as well as “Description of the Mortgage Pool—The Whole Loans” in the Preliminary Prospectus, for additional information regarding each such whole loan. |
| Directing Certificateholder/ Controlling Class: | The “Directing Certificateholder” will be (i) with respect to a servicing shift mortgage loan, the related Loan-Specific Directing Certificateholder, and (ii) with respect to each other mortgage loan, the Controlling Class Certificateholder (or its representative) selected by more than 50% (by certificate balance) of the Controlling Class Certificateholders;provided, that (1) absent that selection, (2) until a Directing Certificateholder is so selected or (3) upon receipt of a notice from a majority of the Controlling Class Certificateholders (by certificate balance) that a Directing Certificateholder is no longer designated, the Controlling Class Certificateholder that owns the largest aggregate certificate balance of the Controlling Class (or its representative) will be the Directing Certificateholder;provided, that (a) in the case of clause (3), if no one holder owns the largest aggregate certificate balance of the Controlling Class, then there will be no Directing |
This is not a research report and was not prepared by any Underwriter’s research department. Please see additional important information and qualifications at the end of this Term Sheet. |
| T-7 |
| BANK 2018-BNK11 | Structural Overview |
Certificateholder until appointed in accordance with the terms of the pooling and servicing agreement, and (b) the certificate administrator and the other parties to the pooling and servicing agreement will be entitled to assume that the identity of the Directing Certificateholder has not changed until such parties receive written notice of a replacement of the Directing Certificateholder from a party holding the requisite interest in the Controlling Class (as confirmed by the certificate registrar), or the resignation of the then current Directing Certificateholder.
The “Loan-Specific Directing Certificateholder” with respect to a servicing shift mortgage loan is the “controlling holder”, the “directing certificateholder”, the “directing holder”, “directing lender” or any analogous concept under the related intercreditor agreement. Prior to the securitization of the related control note (or, with respect to The Gateway whole loan, promissory note A-1-A), the Loan-Specific Directing Certificateholder with respect to a servicing shift mortgage loan will be the holder of the related control note. On and after the securitization of the related control note (or, with respect to The Gateway whole loan, promissory note A-1-A), there will be no Loan-Specific Directing Certificateholder with respect to such servicing shift mortgage loan.
The “Controlling Class” will be, as of any time of determination, the most subordinate class of Control Eligible Certificates then outstanding that has an aggregate certificate balance (as notionally reduced by any Cumulative Appraisal Reduction Amounts (as defined below) allocable to such class) at least equal to 25% of the initial certificate balance of that class; provided, that if at any time the certificate balances of the certificates other than the Control Eligible Certificates and the RR Interest have been reduced to zero as a result of principal payments on the mortgage loans, then the Controlling Class will be the most subordinate class of Control Eligible Certificates that has a certificate balance greater than zero without regard to any Cumulative Appraisal Reduction Amounts. The Controlling Class as of the closing date will be the Class G certificates.
The “Control Eligible Certificates” will be any of the Class E, Class F and Class G certificates.
| |
| Control Rights: | Prior to a Control Termination Event, the Directing Certificateholder will have certain consent and consultation rights under the pooling and servicing agreement with respect to certain major decisions and other matters. A “Control Termination Event” will occur when (i) the Class E certificates have a certificate balance (taking into account the application of the allocable portion of any Cumulative Appraisal Reduction Amounts to notionally reduce the certificate balance thereof) of less than 25% of the initial certificate balance of that class; or (ii) a holder of the Class E certificates is the majority controlling class certificateholder and has irrevocably waived its right, in writing, to exercise any of the rights of the controlling class certificateholder and such rights have not been reinstated to a successor controlling class certificateholder; provided that no Control Termination Event may occur with respect to the Loan-Specific Directing Certificateholder, and the term “Control Termination Event” will not be applicable to the Loan-Specific Directing Certificateholder; provided, further, that a Control Termination Event will be deemed not continuing in the event that the certificate balances of the principal balance certificates other than the Control Eligible Certificates and the RR Interest have been reduced to zero as a result of principal payments on the mortgage loans.
After the occurrence of a Control Termination Event but prior to the occurrence of a Consultation Termination Event, the Directing Certificateholder will not have any consent rights, but the Directing Certificateholder will have certain non-binding consultation rights under the pooling and servicing agreement with respect to certain major decisions and other matters. A “Consultation Termination Event” will occur when (i) no class of Control Eligible Certificates has a certificate balance (without regard to the application of the allocable portion of any Cumulative Appraisal Reduction Amounts) at least equal to 25% of the initial certificate balance of that class; or (ii) a holder of a majority of the Class E certificates is the majority controlling class certificateholder and has irrevocably waived its right, in writing, to exercise any of the rights of the controlling class certificateholder and such rights have not been reinstated to a successor controlling class certificateholder (provided that no Consultation Termination Event resulting solely from the operation of clause (ii) will be deemed to have existed or be in continuance with respect to a successor holder of the Class E certificates that has not irrevocably waived its right to exercise any of the rights of the controlling class certificateholder); provided that no Consultation Termination Event may occur with respect to the Loan-Specific Directing Certificateholder, and the term “Consultation Termination Event” will not be applicable to the Loan-Specific Directing Certificateholder; provided, further, that a Consultation Termination Event will be deemed not continuing in the event that the certificate balances of the principal balance certificates other than the Control Eligible Certificates and the RR Interest have been reduced to zero as a result of principal payments on the mortgage loans.
After the occurrence of a Consultation Termination Event, the Directing Certificateholder will not have any consent or consultation rights, except with respect to any rights expressly set forth in the pooling and servicing agreement, and the operating advisor will retain certain non-binding consultation rights under the pooling and servicing agreement with respect to certain major decisions and other matters.
Notwithstanding the proviso to the definitions of “Control Termination Event” and “Consultation Termination Event”, a Control Termination Event and a Consultation Termination Event will each be deemed to have occurred with respect to any Excluded Loan with respect to the Directing Certificateholder or the holder of the majority of the Controlling Class, and neither the Directing Certificateholder nor any Controlling Class Certificateholder will have any consent or consultation rights with respect to the servicing of such Excluded Loan.
An “Excluded Loan” means (a) with respect to the Directing Certificateholder or the holder of the majority of the Controlling Class, a mortgage loan or whole loan with respect to which, as of any date of determination, the Directing Certificateholder or the holder of the majority of the Controlling Class is a Borrower Party or (b) with respect to the Risk Retention Consultation Party or the holder of the majority of the RR Interest, a mortgage loan or whole loan with respect to which, as of any date of determination, the Risk Retention Consultation Party or the holder of the majority of the RR Interest is a Borrower Party. It is expected that there will be no Excluded Loans with respect to this securitization on the Closing Date. |
This is not a research report and was not prepared by any Underwriter’s research department. Please see additional important information and qualifications at the end of this Term Sheet. |
| T-8 |
| BANK 2018-BNK11 | Structural Overview |
“Borrower Party” means a borrower, a mortgagor, a manager of a mortgaged property, the holder of a mezzanine loan that has been accelerated or as to which foreclosure or enforcement proceedings have been commenced against the equity collateral pledged to secure the related mezzanine loan, or any Borrower Party Affiliate. With respect to a mortgage loan secured by a residential cooperative property, a person will not be considered a “Borrower Party” solely by reason of such person holding one or more cooperative unit loans that are secured by direct equity interests in the related borrower or owning one or more residential cooperative units comprising the related mortgaged property as a result of any foreclosure, transfer in lieu of foreclosure or other exercise of remedies with respect to any such unit loan(s).
“Borrower Party Affiliate” means, with respect to a borrower, a mortgagor, a manager of a mortgaged property or the holder of a mezzanine loan that has been accelerated or as to which foreclosure or enforcement proceedings have been commenced against the equity collateral pledged to secure the related mezzanine loan, (a) any other person controlling or controlled by or under common control with such borrower, mortgagor, manager or mezzanine lender, as applicable, or (b) any other person owning, directly or indirectly, 25% or more of the beneficial interests in such borrower, mortgagor, manager or mezzanine lender, as applicable. For the purposes of this definition, “control” when used with respect to any specified person means the power to direct the management and policies of such person, directly or indirectly, whether through the ownership of voting securities, by contract or otherwise and the terms “controlling” and “controlled” have meanings correlative to the foregoing.
Notwithstanding any of the foregoing to the contrary, if any mortgage loan is part of a whole loan, the Directing Certificateholder’s consent and/or consultation rights with respect thereto may be limited as described in the Preliminary Prospectus. In particular, with respect to each non-serviced whole loan and each servicing shift whole loan, the Directing Certificateholder (other than a Loan-Specific Directing Certificateholder) will only have certain consultation rights with respect to certain major decisions and other matters related to such whole loan, in each case only prior to a Control Termination Event or Consultation Termination Event, as applicable, and the Loan-Specific Directing Certificateholder will be entitled to similar consent and/or consultation rights with respect to such whole loan. In addition, with respect to any serviced A/B whole loan, for so long as the holder of the related subordinate companion loan is the controlling note holder, the holder of such subordinate companion loan (rather than the Directing Certificateholder) will be entitled to exercise such consent and consultation rights with respect to such whole loan.
| |
| Appraisal Reduction Amounts and Collateral Deficiency Amounts: | An “Appraisal Reduction Amount” generally will be created in the amount, if any, by which the principal balance of a required appraisal loan (which is a mortgage loan with respect to which certain defaults, modifications or insolvency events have occurred as further described in the Preliminary Prospectus) plus other amounts overdue or advanced in connection with such mortgage loan exceeds 90% of the appraised value of the related mortgaged property plus certain escrows and reserves (including letters of credit) held with respect to the mortgage loan.
A mortgage loan will cease to be subject to an Appraisal Reduction Amount when it has been brought current for at least three consecutive months, no additional event of default is foreseeable in the reasonable judgment of the applicable special servicer and no other circumstances exist that would cause such mortgage loan or any related companion loan to be a specially serviced loan; however, a “Collateral Deficiency Amount” may exist with respect to any mortgage loan that is modified into an AB loan structure (an “AB Modified Loan”) and remains a corrected mortgage loan and, if so, will generally equal the excess of (i) the stated principal balance of such AB Modified Loan (taking into account the related junior note(s) and anypari passu notes included therein), over (ii) the sum of (in the case of a whole loan, solely to the extent allocable to the subject mortgage loan) (x) the most recent appraised value for the related mortgaged property or mortgaged properties, plus (y) solely to the extent not reflected or taken into account in such appraised value (or in the calculation of any related Appraisal Reduction Amount) and to the extent on deposit with, or otherwise under the control of, the lender as of the date of such determination, any capital or additional collateral contributed by the related borrower at the time the mortgage loan became (and as part of the modification related thereto) such AB Modified Loan for the benefit of the related mortgaged property or mortgaged properties (provided that in the case of an non-serviced mortgage loan, the amounts set forth in this clause (y) will be taken into account solely to the extent relevant information is received by the applicable master servicer), plus (z) any other escrows or reserves (in addition to any amounts set forth in the immediately preceding clause (y) and solely to the extent not reflected or taken into account in the calculation of any related Appraisal Reduction Amount) held by the lender in respect of such AB Modified Loan as of the date of such determination, which such excess, for the avoidance of doubt, will be determined separately from and exclude any related Appraisal Reduction Amounts.
As used herein, a “Cumulative Appraisal Reduction Amount” will be the sum of any Appraisal Reduction Amounts and any Collateral Deficiency Amounts.
Any Appraisal Reduction Amount in respect of any non-serviced mortgage loan generally will be calculated in accordance with the other servicing agreement pursuant to which such mortgage loan is being serviced, which calculations are expected to be generally similar to those provided for in the pooling and servicing agreement for this transaction.
If any mortgage loan is part of a whole loan, any Appraisal Reduction Amount or Collateral Deficiency Amount will (or effectively will) be calculated in respect of such whole loan taken as a whole and allocated, to the extent provided in the related intercreditor agreement and the related pooling and servicing agreement,first, to any related subordinate companion loan, andsecond, to the related mortgage loan and anypari passu companion loan on apro rata basis by unpaid principal balance. |
This is not a research report and was not prepared by any Underwriter’s research department. Please see additional important information and qualifications at the end of this Term Sheet. |
| T-9 |
| BANK 2018-BNK11 | Structural Overview |
| Appraisal Reduction Amounts will proportionately reduce the interest portion of debt service advances required to be made in respect of the related mortgage loan. Appraisal Reduction Amounts and Collateral Deficiency Amounts (in each case, to the extent of the Non-Retained Certificates’ Percentage Allocation Entitlement thereof) will be taken into account in determining the identity of the controlling class entitled to appoint the Directing Certificateholder, the existence of a Control Termination Event and the allocation and/or exercise of voting rights for certain purposes (see“Directing Certificateholder/Controlling Class” above). | |
| Appraised-Out Class: | An “Appraised-Out Class” is any class of Control Eligible Certificates, the certificate balance of which (taking into account the application of the Non-Retained Certificates’ Percentage Allocation Entitlement of any Appraisal Reduction Amounts or Collateral Deficiency Amounts to notionally reduce the certificate balance of such class) has been reduced to less than 25% of its initial certificate balance. Any Appraised-Out Class may not exercise any direction, control, consent and/or similar rights of the Controlling Class until such time, if any, as such class is reinstated as the Controlling Class, and the rights of the Controlling Class will be exercised by the next most senior class of Control Eligible Certificates that is not an Appraised-Out Class, if any, during such period. |
| Appraisal Remedy: | The holders of the majority (by certificate balance) of an Appraised-Out Class (such holders, the “Requesting Holders”) will have the right, at their sole expense, to require the applicable special servicer to order (or, with respect to a non-serviced mortgage loan, require the applicable master servicer to request from the applicable non-serviced special servicer) a second appraisal of any mortgage loan (or serviced whole loan) for which an appraisal reduction event has occurred or as to which there exists a Collateral Deficiency Amount. With respect to any serviced mortgage loan, the applicable special servicer will be required to use its reasonable efforts to ensure that such appraisal is delivered within 30 days from receipt of the Requesting Holders’ written request and will be required to cause such appraisal to be prepared on an “as-is” basis by an MAI appraiser. With respect to any non-serviced mortgage loan, the applicable master servicer will be required to use commercially reasonable efforts to obtain such second appraisal from the applicable non-serviced special servicer and to forward such second appraisal to the applicable special servicer. Upon receipt of such supplemental appraisal, the applicable master servicer (for Collateral Deficiency Amounts on non-serviced mortgage loans), the non-serviced special servicer (for Appraisal Reduction Amounts on non-serviced mortgage loans to the extent provided for in the applicable non-serviced pooling and servicing agreement and applicable intercreditor agreement) and the applicable special servicer (for any serviced mortgage loan) will be required to determine, in accordance with the Servicing Standard, whether, based on its assessment of such supplemental appraisal, any recalculation of the applicable Appraisal Reduction Amount or Collateral Deficiency Amount is warranted and, if so warranted, such person will be required to recalculate such Appraisal Reduction Amount or Collateral Deficiency Amount, as applicable, based upon such supplemental appraisal and (for any serviced mortgage loan) receipt of information from the applicable master servicer. If required by any such recalculation, the applicable Appraised-Out Class will be reinstated as the Controlling Class and each Appraised-Out Class will, if applicable, have its related certificate balance notionally restored to the extent required by such recalculation of the Appraisal Reduction Amount or Collateral Deficiency Amount, if applicable.
In addition, the Requesting Holders of any Appraised-Out Class will have the right to challenge the Appraisal Reduction Amount and to require the special servicer to order an additional appraisal of any serviced mortgage loan as to which there exists a Collateral Deficiency Amount if an event has occurred at, or with respect to, the related mortgaged property or mortgaged properties that would have a material effect on its or their appraised value, and the special servicer is required to use reasonable efforts to obtain an appraisal from an MAI appraiser reasonably acceptable to the special servicer within 30 days from receipt of the Requesting Holders’ written request.
|
| Sale of Defaulted Loans: | Under certain circumstances the applicable special servicer may be required to use reasonable efforts to solicit offers for a defaulted serviced mortgage loan (and any related companion loan (to the extent provided under the related intercreditor agreement) and/or related REO properties).
The Directing Certificateholder will not have a right of first refusal to purchase a defaulted loan.
If the applicable special servicer does not receive an offer at least equal to the outstanding principal balance plus all accrued and unpaid interest and outstanding costs and expenses and certain other amounts specified in the pooling and servicing agreement (the “Par Purchase Price”), the applicable special servicer may purchase the defaulted loan or REO property at the Par Purchase Price or may accept the first cash offer received from any person that is determined to be a fair price for such defaulted loan or REO property. If multiple offers are received during the period designated by the applicable special servicer for receipt of offers, such special servicer is generally required to select the highest offer. The applicable special servicer will be required to determine whether any cash offer constitutes a fair price for any defaulted loan or REO property if the highest offeror is a person other than a party to the pooling and servicing agreement for this transaction (the “PSA”), the Directing Certificateholder, the Risk Retention Consultation Party, any sponsor, any Borrower Party, any independent contractor engaged by a special servicer, the trustee for the securitization of a related companion loan (with respect to a whole loan if it is a defaulted loan), any related companion loan holder or its representative, any holder of a related mezzanine loan or any known affiliate of any of the preceding entities (each, an “Interested Person”). If an offer is made by an Interested Person, the trustee will be required to determine (based upon the most recent appraisal conducted in accordance with the terms of the PSA) whether the offer constitutes a fair price for the defaulted loan or REO property unless (i) the offer is equal to or greater than the applicable Par Purchase Price and (ii) the offer is the highest offer received. Absent an offer at least equal to the Par Purchase Price, no offer from an Interested Person will constitute a fair price unless (x) it is the highest offer received and (y) at least two other offers are received from independent third parties. Neither the trustee nor any of its affiliates may make an offer for or purchase any specially serviced loan or REO property. |
This is not a research report and was not prepared by any Underwriter’s research department. Please see additional important information and qualifications at the end of this Term Sheet. |
| T-10 |
| BANK 2018-BNK11 | Structural Overview |
Notwithstanding any of the foregoing to the contrary, the applicable special servicer is not required to accept the highest offer and may accept a lower offer for a defaulted loan or REO property if such special servicer determines, in accordance with the Servicing Standard (and subject to the requirements of any related intercreditor agreement), that a rejection of such offer would be in the best interests of the certificateholders and any related companion loan holders as a collective whole as if they constituted a single lender (and with respect to a serviced A/B whole loan, taking into account the subordinate nature of any related subordinate companion loan), so long as such lower offer was not made by such special servicer or any of its affiliates.
If title to any mortgaged property is acquired by the trust fund, the applicable special servicer will generally be required to sell such mortgaged property prior to the close of the third calendar year beginning after the year of acquisition.
The foregoing applies to mortgage loans serviced under the PSA. With respect to any non-serviced whole loan, if the special servicer under the applicable pooling and servicing agreement determines to sell the related controlling companion loan if it becomes a defaulted loan, then the applicable special servicer will be required to sell the related whole loan, including the related mortgage loan included in the BANK 2018-BNK11 securitization trust and the relatedpari passu companion loan(s) and, under certain circumstances, any subordinate companion loan(s), as a single loan. In connection with any such sale, the special servicer under the applicable pooling and servicing agreement will be required to follow procedures substantially similar to those set forth above.
| |
| Risk Retention Consultation Party: | A risk retention consultation party may be appointed by the holder or holders of more than 50% of the RR Interest, by certificate balance. The majority RR Interest holder will have a continuing right to appoint, remove or replace the risk retention consultation party in its sole discretion. This right may be exercised at any time and from time to time. Except with respect to an Excluded Loan as to such party, the risk retention consultation party will be entitled to consult with the applicable special servicer, upon request of the risk retention consultation party, with respect to certain material servicing actions proposed by such special servicer; provided, that prior to the occurrence and continuance of a Consultation Termination Event, such mortgage loan must also be a specially serviced mortgage loan. |
| Appointment and Replacement of Special Servicer: | The Directing Certificateholder will appoint the initial special servicers as of the closing date. Prior to the occurrence and continuance of a Control Termination Event, either special servicer may generally be replaced by the Directing Certificateholder with or without cause at any time.
After the occurrence and during the continuance of a Control Termination Event and upon (a) the written direction of holders of principal balance certificates evidencing not less than 25% of the voting rights of all classes of certificates (other than the RR Interest) entitled to principal (taking into account the application of Cumulative Appraisal Reduction Amounts to notionally reduce the certificate balances of classes to which such Cumulative Appraisal Reduction Amounts are allocable) requesting a vote to replace the applicable special servicer with a replacement special servicer, (b) payment by such requesting holders to the certificate administrator of all reasonable fees and expenses to be incurred by the certificate administrator in connection with administering such vote and (c) delivery by such holders of a rating agency confirmation from each applicable rating agency, the certificate administrator will be required to promptly post such notice on its internet website and by mail and conduct the solicitation of votes of all certificates in such regard, which requisite affirmative votes must be received within 180 days of the posting of such notice. Upon the written direction of holders of at least 66 2/3% of a Certificateholder Quorum, the trustee will be required to immediately replace the applicable special servicer with a qualified replacement special servicer designated by such holders of certificates.
After the occurrence and during the continuance of a Consultation Termination Event, if the operating advisor determines that the applicable special servicer is not performing its duties as required under the pooling and servicing agreement or is otherwise not acting in accordance with the Servicing Standard, the operating advisor may also recommend the replacement of such special servicer. The operating advisor’s recommendation to replace such special servicer must be confirmed by an affirmative vote of holders of principal balance certificates evidencing at least a majority of the aggregate voting rights (taking into account the application of any Cumulative Appraisal Reduction Amounts to notionally reduce the respective certificate balances) of all principal balance certificates on an aggregate basis.
A “Certificateholder Quorum” means, in connection with any solicitation of votes in connection with the replacement of a special servicer or the asset representations reviewer, the holders of certificates evidencing at least 50% of the aggregate voting rights (taking into account the application of realized losses and, other than with respect to the termination of the asset representations reviewer, any Cumulative Appraisal Reduction Amounts to notionally reduce the certificate balance of the certificates) of all classes of certificates entitled to principal (other than the RR Interest) on an aggregate basis.
With respect to each serviced whole loan, any holder of a relatedpari passu companion loan, following a servicer termination event with respect to the applicable special servicer that affects such holder, will be entitled to direct the trustee (and the trustee will be required) to terminate such special servicer solely with respect to such serviced whole loan. A replacement special servicer will be selected by the trustee or, prior to a Control Termination Event, by the Directing Certificateholder;provided, that any successor special servicer appointed to replace the special servicer with respect to such whole loan generally cannot be the entity (or its affiliate) that was terminated at the direction of the holder of the relatedpari passucompanion loan.
Notwithstanding any of the foregoing to the contrary, with respect to each servicing shift whole loan and any serviced A/B whole loans as to which a subordinate companion loan holder is the related controlling note holder, the holder of the related control note will be entitled to replace the applicable special servicer with respect to such whole loan at any time, with or without cause, and while it is a serviced whole loan, no other party may replace the applicable special servicer for such whole loan unless there is a servicer termination event with respect thereto. |
This is not a research report and was not prepared by any Underwriter’s research department. Please see additional important information and qualifications at the end of this Term Sheet. |
| T-11 |
| BANK 2018-BNK11 | Structural Overview |
| With respect to any non-serviced whole loan, the BANK 2018-BNK11 trust, as holder of the related mortgage loan, has the right to terminate the special servicer under the related pooling and servicing agreement if a servicer termination event occurs, with respect to such special servicer that affects the trust in its capacity as such holder. Such rights may be exercised by the Directing Certificateholder prior to a Control Termination Event (or the operating advisor, following the occurrence and during the continuance of a Control Termination Event). The successor special servicer will be selected pursuant to the applicable pooling and servicing agreement by the related directing holder prior to a control termination event under such pooling and servicing agreement. | |
| Servicing Standard: | Each master servicer and each special servicer is obligated to service and administer the mortgage loans (and, if applicable, the serviced companion loans) in accordance with the definition of the “Servicing Standard” described in the Preliminary Prospectus and the terms of the pooling and servicing agreement, provided that each non-serviced mortgage loan, if any, will be serviced by another master servicer or special servicer under the pooling and servicing agreement with respect to the securitization of a related companion loan, which entities will be obligated to service and administer such non-serviced mortgage loan pursuant to a similar standard set forth in the related pooling and servicing agreement. |
| Excluded Special Servicer: | If a special servicer obtains knowledge that it has become a Borrower Party with respect to any mortgage loan (an “Excluded Special Servicer Loan”), such special servicer will be required to resign as special servicer of that Excluded Special Servicer Loan. Prior to the occurrence of a Control Termination Event, the Directing Certificateholder will be required to appoint (and may remove and replace with or without cause) a separate special servicer that is not a Borrower Party (an “Excluded Special Servicer”) with respect to any Excluded Special Servicer Loan, unless such Excluded Special Servicer Loan is also an Excluded Loan with respect to the Directing Certificateholder or the holder of the majority of the Controlling Class. After the occurrence and during the continuance of a Control Termination Event, if at any time the applicable Excluded Special Servicer Loan is also an Excluded Loan with respect to the Directing Certificateholder or the holder of the majority of the Controlling Class or if the Directing Certificateholder is entitled to appoint the Excluded Special Servicer but does not so appoint within 30 days of notice of such resignation, the resigning special servicer will be required to use reasonable efforts to select the related Excluded Special Servicer. Any Excluded Special Servicer will be required to perform all of the obligations of the applicable special servicer and will be entitled to all special servicing compensation with respect to such Excluded Special Servicer Loan earned while the related mortgage loan is an Excluded Special Servicer Loan. |
| Liquidated Loan Waterfall: | On liquidation of any mortgage loan, all net liquidation proceeds related to the mortgage loan (but not any related companion loan) will be applied so that amounts allocated as a recovery of accrued and unpaid interest will not, in the first instance, include any delinquent interest that was not advanced as a result of Appraisal Reduction Amounts or accrued on the portion of the stated principal balance thereof equal to any related Collateral Deficiency Amount in effect from time to time and as to which no advance was made. After the adjusted interest amount is so allocated, any remaining liquidation proceeds will be allocated to pay principal on the mortgage loan until the unpaid principal amount of the mortgage loan has been reduced to zero. Any remaining liquidation proceeds will then be allocated to pay delinquent interest that was not advanced as a result of Appraisal Reduction Amounts or that accrued on the portion of the stated principal balance thereof equal to any related Collateral Deficiency Amount in effect from time to time and as to which no advance was made. |
| Operating Advisor: | The operating advisor will be required to perform certain review duties if a Control Termination Event has occurred and is continuing, which will generally include a limited annual review of, and the preparation of a report regarding, certain actions of the applicable special servicer with respect to the resolution and/or liquidation of specially serviced loans. The review and report generally will be based on any asset status reports and additional information delivered to the operating advisor by such special servicer. In addition, if a Control Termination Event has occurred and is continuing, the applicable special servicer must consult with the operating advisor (in addition to the Directing Certificateholder if no Consultation Termination Event has occurred and is continuing) in connection with major decisions with respect to mortgage loans. Furthermore, under certain circumstances, but only if a Consultation Termination Event has occurred and is continuing, the operating advisor may recommend the replacement of the applicable special servicer as described above under “—Appointment and Replacement of Special Servicer”; however, the operating advisor will not have any rights or obligations with respect to a non-serviced whole loan.
If a Consultation Termination Event has occurred and is continuing, the operating advisor may be removed and replaced without cause upon the affirmative direction of certificates owners holding not less than 75% of the voting rights of all certificates (taking into account the application of Cumulative Appraisal Reduction Amounts), following a proposal from certificate owners holding not less than 25% of the voting rights of all certificates (taking into account the application of Cumulative Appraisal Reduction Amounts). The certificateholders who initiate a vote on a termination and replacement of the operating advisor without cause must cause the payment of the fees and expenses incurred in the replacement. In addition, in the event there are no classes of certificates outstanding other than the Control Eligible Certificates, the RR Interest and the Class X-E, Class V and Class R certificates, then all of the rights and obligations of the operating advisor under the PSA will terminate without payment of any penalty or termination fee (other than any rights or obligations that accrued prior to the date of such termination (including accrued and unpaid compensation) and other than indemnification rights arising out of events occurring prior to such termination). See “Pooling and Servicing Agreement—The Operating Advisor—Termination of the Operating Advisor Without Cause” in the Preliminary Prospectus.
|
| Asset Representations Reviewer: | The asset representations reviewer will be required to review certain delinquent mortgage loans after a specified delinquency threshold has been met and the required percentage of certificateholders vote to direct |
This is not a research report and was not prepared by any Underwriter’s research department. Please see additional important information and qualifications at the end of this Term Sheet. |
| T-12 |
| BANK 2018-BNK11 | Structural Overview |
a review as described below. The asset representations reviewer will be entitled to the Asset Representations Reviewer Fee with respect to such review. See “Pooling and Servicing Agreement—The Asset Representations Reviewer” in the Preliminary Prospectus.
The certificate administrator will be required to notify certificateholders if the specified delinquency threshold has been met as described in the Preliminary Prospectus under “—The Asset Representations Reviewer”.
If certificateholders evidencing not less than 5.0% of the voting rights request a vote to commence an asset review, and if subsequently (i) a majority of those certificateholders who cast votes and (ii) a majority of an Asset Review Quorum authorizes an asset review within 150 days of the request for a vote, the asset representations reviewer will be required to conduct an asset review of delinquent loans.
The asset representations reviewer may be terminated and replaced without cause. Upon (i) the written direction of certificateholders evidencing not less than 25% of the voting rights (without regard to the application of any Cumulative Appraisal Reduction Amounts) requesting a vote to terminate and replace the asset representations reviewer with a proposed successor asset representations reviewer that is an eligible asset representations reviewer, and (ii) payment by such holders to the certificate administrator of the reasonable fees and expenses to be incurred by the certificate administrator in connection with administering such vote, the certificate administrator will be required to promptly provide notice to all certificateholders and the asset representations reviewer of such request by posting such notice on its internet website, and by mailing such notice to all certificateholders and the asset representations reviewer. Upon the written direction of certificateholders evidencing at least 75% of a Certificateholder Quorum (without regard to the application of any Cumulative Appraisal Reduction Amounts), the trustee will be required to terminate all of the rights and obligations of the asset representations reviewer under the pooling and servicing agreement (other than any rights or obligations that accrued prior to the date of such termination and other than indemnification rights arising out of events occurring prior to such termination) by written notice to the asset representations reviewer, and the proposed successor asset representations reviewer will be appointed. See “Pooling and Servicing Agreement—The Asset Representations Reviewer” in the Preliminary Prospectus.
An “Asset Review Quorum” means, in connection with any solicitation of votes to authorize an Asset Review as described above, the holders of certificates evidencing at least 5.0% of the aggregate voting rights represented by all certificates that have voting rights.
| |
| Dispute Resolution Provisions: | The mortgage loan sellers will be subject to the dispute resolution provisions set forth in the PSA to the extent those provisions are triggered with respect to any mortgage loan sold to the depositor by a mortgage loan seller, and such mortgage loan seller will be obligated under the related mortgage loan purchase agreement to comply with all applicable provisions and to take part in any mediation or arbitration proceedings that may result. Generally, in the event that a Repurchase Request is not “Resolved” within 180 days after the related mortgage loan seller receives such Repurchase Request, then the enforcing servicer will be required to send a notice to the first certificateholder (or beneficial owner) to deliver a certificateholder repurchase request with respect to the mortgage loan (the “Initial Requesting Certificateholder”) (if any) and to the certificate administrator (which will be required to make such notice available to certificateholders via the certificate administrator’s website) indicating the enforcing servicer’s intended course of action with respect to the Repurchase Request. If (a) the enforcing servicer’s intended course of action with respect to the Repurchase Request does not involve pursuing further action to exercise rights against the related mortgage loan seller with respect to the Repurchase Request and the Initial Requesting Certificateholder, if any, or any other certificateholder or certificate owner wishes to exercise its right to refer the matter to mediation (including nonbinding arbitration) or arbitration, or (b) the enforcing servicer’s intended course of action is to pursue further action to exercise rights against the related mortgage loan seller with respect to the Repurchase Request but the Initial Requesting Certificateholder, if any, or any other certificateholder or certificate owner does not agree with the dispute resolution method selected by the enforcing servicer, then the Initial Requesting Certificateholder, if any, or such other certificateholder or certificate owner may deliver a written notice to the enforcing servicer indicating its intent to exercise its right to refer the matter to either mediation or arbitration.
“Resolved” means, with respect to a Repurchase Request, (i) that the related material defect or breach has been cured, (ii) the related mortgage loan has been repurchased in accordance with the related mortgage loan purchase agreement, (iii) a mortgage loan has been substituted for the related mortgage loan in accordance with the related mortgage loan purchase agreement, (iv) the applicable mortgage loan seller has made a loss of value payment, (v) a contractually binding agreement has been entered into between the enforcing servicer, on behalf of the issuing entity, and the related mortgage loan seller that settles the related mortgage loan seller’s obligations under the related mortgage loan purchase agreement, or (vi) the related mortgage loan is no longer property of the issuing entity as a result of a sale or other disposition in accordance with the pooling and servicing agreement. See “Pooling and Servicing Agreement—Dispute Resolution Provisions” in the Preliminary Prospectus.
|
| Investor Communications: | The certificate administrator is required to include on any Form 10-D any request received from a certificateholder to communicate with other certificateholders related to certificateholders exercising their rights under the terms of the PSA. Any certificateholder wishing to communicate with other certificateholders regarding the exercise of its rights under the terms of the PSA will be able to deliver a written request signed by an authorized representative of the requesting investor to the certificate administrator. |
| Deal Website: | The certificate administrator will be required to maintain a deal website which will include, among other items: (a) summaries of asset status reports prepared by a special servicer, (b) inspection reports, (c) appraisals, (d) various “special notices” described in the Preliminary Prospectus, (e) the “Investor Q&A Forum” and (f) a voluntary “Investor Registry”. Investors may access the deal website following execution of a certification and confidentiality agreement. |
This is not a research report and was not prepared by any Underwriter’s research department. Please see additional important information and qualifications at the end of this Term Sheet. |
| T-13 |
| BANK 2018-BNK11 | Structural Overview |
| Mortgage Loan Sellers | No. of Mortgage Loans | No. of Mortgaged Properties | Aggregate Cut-off Date Balance | % of Pool(1) |
| Wells Fargo Bank, National Association | 9 | 15 | $329,981,029 | 47.9% |
| Bank of America, National Association | 12 | 38 | $198,219,232 | 28.8% |
| Morgan Stanley Mortgage Capital Holdings LLC | 8 | 10 | $107,994,183 | 15.7% |
| National Cooperative Bank, N.A.(2) | 13 | 13 | $52,006,249 | 7.6% |
| Total: | 42 | 76 | $688,200,694 | 100.0% |
Pool Statistics
| Aggregate Cut-off Date Balance: | $688,200,694 |
| Number of Mortgage Loans: | 42 |
| Average Cut-off Date Balance per Mortgage Loan: | $16,385,731 |
| Number of Mortgaged Properties: | 76 |
| Average Cut-off Date Balance per Mortgaged Property: | $9,055,272 |
| Weighted Average Mortgage Rate: | 4.4158% |
| % of Pool Secured by 5 Largest Mortgage Loans: | 45.3% |
| % of Pool Secured by 10 Largest Mortgage Loans: | 69.2% |
| % of Pool Secured by ARD Loans(3): | 18.3% |
| Weighted Average Original Term to Maturity (months)(3): | 120 |
| Weighted Average Remaining Term to Maturity (months)(3): | 119 |
| Weighted Average Seasoning (months): | 1 |
| % of Pool Secured by Single Tenant Mortgaged Properties: | 19.0% |
| % of Pool Secured by Refinance Loans: | 76.7% |
| % of Pool Secured by Acquisition Loans: | 22.6% |
| % of Pool Secured by Recapitalization Loans: | 0.7% |
Additional Debt
| % of Pool withPari Passu Mortgage Debt: | 60.2% |
| % of Pool with Subordinate Mortgage Debt(4): | 13.7% |
| % of Pool with Mezzanine Debt: | 16.9% |
Credit Statistics(5)(6)
| Weighted Average UW NOI DSCR: | 2.76x |
| Weighted Average UW NOI Debt Yield(7): | 14.0% |
| Weighted Average UW NCF DSCR: | 2.67x |
| Weighted Average UW NCF Debt Yield(7): | 13.5% |
| Weighted Average Cut-off Date LTV Ratio(7)(8): | 54.8% |
| Weighted Average Maturity Date LTV Ratio(3)(7)(8): | 50.4% |
Footnotes are set forth on the following page.
This is not a research report and was not prepared by any Underwriter’s research department. Please see additional important information and qualifications at the end of this Term Sheet. |
| T-14 |
| BANK 2018-BNK11 | Structural Overview |
Amortization
| Weighted Average Original Amortization Term (months)(9): | 359 |
| Weighted Average Remaining Amortization Term (months)(9): | 359 |
| % of Pool Amortizing Balloon: | 34.0% |
| % of Pool Interest Only through Maturity: | 30.9% |
| % of Pool Interest Only through ARD and Maturity: | 18.3% |
| % of Pool Interest Only followed by Amortizing Balloon: | 16.8% |
Lockboxes
| % of Pool with Hard Lockboxes: | 41.5% |
| % of Pool with Springing Lockboxes: | 45.1% |
| % of Pool with No Lockboxes: | 9.4% |
| % of Pool with Soft Lockboxes: | 4.0% |
| Reserves | |
| % of Pool Requiring Tax Reserves: | 68.7% |
| % of Pool Requiring Insurance Reserves: | 28.9% |
| % of Pool Requiring Replacement Reserves: | 47.9% |
| % of Pool Requiring TI/LC Reserves(10): | 67.3% |
Call Protection
| % of Pool with lockout period, followed by defeasance until open period: | 75.2% |
| % of Pool with lockout period, followed by the greater of a prepayment premium and yield maintenance until open period: | 11.8% |
| % of Pool with no lockout period. Greater of a prepayment premium and yield maintenance followed by prepayment premium until open period: | 5.3% |
| % of Pool with lockout period, followed by the greater of a prepayment premium and yield maintenance, followed by defeasance or the greater of a prepayment premium and yield maintenance until open period: | 4.0% |
| % of Pool with no lockout period. Greater of a prepayment premium and yield maintenance until open period: | 2.2% |
| % of Pool with lockout period, followed by defeasance or the greater of a prepayment premium and yield maintenance until open period: | 1.5% |
| (1) | Unless otherwise indicated, all references to “% of Pool” in this Term Sheet reflect a percentage of the aggregate principal balance of the mortgage pool as of the Cut-off Date, after application of all payments of principal due during or prior to April 2018. |
| (2) | Eleven (11) of the thirteen (13) mortgage loans for which National Cooperative Bank, N.A. is the mortgage loan seller were originated by its parent company, National Consumer Cooperative Bank, and transferred to National Cooperative Bank, N.A. Each such mortgage loan originated by National Consumer Cooperative Bank was underwritten pursuant to National Cooperative Bank, N.A.’s underwriting guidelines. |
| (3) | With respect to any ARD Loan, unless otherwise indicated, references in this Term Sheet to the applicable “maturity date” or “maturity” refer to the applicable anticipated repayment date with respect to such ARD Loan, and such applicable anticipated repayment date is treated as its maturity date for all purposes hereof. |
| (4) | Thirteen (13) of the mortgage loans, each of which is secured by a residential cooperative property, currently have in place subordinate secured lines of credit to the related mortgage borrowers that permit future advances (such loans, collectively, the “Subordinate Coop LOCs”). The percentage figure expressed as “% of Pool with Subordinate Mortgage Debt” is determined as a percentage of the initial pool balance and does not take into account any Subordinate Coop LOCs and future subordinate debt (whether or not secured by the mortgaged property), if any, that may be permitted under the terms of any mortgage loan or the pooling and servicing agreement. See “Description of the Mortgage Pool—Additional Indebtedness—Other Secured Indebtedness”and“Description of the Mortgage Pool—Additional Debt Financing for Mortgage Loans Secured by Residential Cooperatives” in the Preliminary Prospectus. |
| (5) | With respect to any mortgage loan that is part of a whole loan, unless otherwise indicated, all LTV, DSCR and Debt Yield calculations in this Term Sheet include any relatedpari passu companion loans and exclude any subordinate companion loans, as applicable. Additionally, LTV, DSCR and Debt Yield figures in this Term Sheet are calculated for mortgage loans without regard to any additional indebtedness that may be incurred at a future date. For mortgaged properties securing residential cooperative mortgage loans all LTV, DSCR and Debt Yield calculations do not take into account any subordinate debt (whether or not secured by the related mortgaged property), that currently exists or is allowed under the terms of any mortgage loan. With respect to any leased fee loans, the SF/Units and Balance per SF/Unit figures in this Term Sheet are based on the size of the non-collateral improvements. |
| (6) | For mortgaged properties securing residential cooperative mortgage loans, all DSCR and Debt Yield calculations for each such mortgaged property is calculated using underwritten net operating Income or underwritten net cash flow, as applicable, for the related residential cooperative property which is the projected net operating income or net cash flow, as applicable, reflected in the most recent appraisal obtained by or otherwise in the possession of the related mortgage loan seller as of the Cut-off Date. All LTV ratio calculations are based upon the appraised value of the residential cooperative property determined as if such residential cooperative property is operated as a residential cooperative, inclusive of the amount of the underlying debt encumbering such residential cooperative property. |
| (7) | With respect to certain mortgage loans, debt yields and LTVs (such as, for example, UW NOI Debt Yield, UW NCF Debt Yield or Cut-off Date LTV Ratio) have been calculated based on a principal balance that is net of a holdback or earnout reserve. Such mortgage loans are identified under the definitions of “Underwritten NOI Debt Yield”, “Underwritten NCF Debt Yield” and “Cut-off Date LTV Ratio” set forth under “Description of the Mortgage Pool—Certain Calculations and Definitions” in the Preliminary Prospectus. |
| (8) | The LTV ratios set forth in this Term Sheet are generally based on the “as-is” values of the related mortgaged properties; provided that the “as-is” value for a portfolio of mortgaged properties may include a premium relating to the valuation of the mortgaged properties as a whole rather than as the sum of individually valued mortgaged properties; provided, further, that such LTV ratios may be based on “as-stabilized”, “as complete” or other contingent values in certain cases in which reserves have been established at origination for the applicable condition or circumstance that is expected to result in stabilization provided, further, that such LTV ratios may have been calculated based on a principal balance that is net of a holdback or earnout reserve. See the definition of “Appraised Value” under“Description of the Mortgage Pool—Certain Calculations and Definitions”in the Preliminary Prospectus. |
| (9) | Excludes mortgage loans that provide for payments of interest only through the related maturity date or anticipated repayment date, as applicable. |
| (10) | Excludes hospitality, multifamily, manufactured housing and self storage properties. |
This is not a research report and was not prepared by any Underwriter’s research department. Please see additional important information and qualifications at the end of this Term Sheet. |
| T-15 |
| BANK 2018-BNK11 | Characteristics of the Mortgage Loans |
| Top 10 Mortgage Loans or Groups of Cross-Collateralized Mortgage Loans(1) | |||||||||||||
| Loan No. | Mortgage Loan Seller | Property Name | City | State | Property Type | Cut-off Date Balance | % of Pool | SF/Units/ Rooms | Cut-off Date Balance per SF/Unit/Room | UW NCF DSCR | UW NOI Debt Yield | Cut-off Date LTV | Maturity Date LTV |
| 1 | WFB | Twelve Oaks Mall | Novi | MI | Retail | $66,593,280 | 9.7% | 716,771 | $278.72 | 2.55x | 15.3% | 36.1% | 29.7% |
| 2 | BANA | Extra Space - TIAA Self Storage Portfolio | Various | Various | Self Storage | $66,000,000 | 9.6% | 1,614,702 | $141.82 | 1.97x | 9.2% | 58.1% | 58.1% |
| 3 | WFB | Apple Campus 3 | Sunnyvale | CA | Office | $63,000,000 | 9.2% | 882,657 | $385.20 | 3.55x | 12.2% | 44.0% | 44.0% |
| 4 | WFB | One Dulles Tower | Herndon | VA | Office | $63,000,000 | 9.2% | 403,622 | $376.59 | 2.17x | 8.8% | 71.5% | 71.5% |
| 5 | WFB | Airport Business Center | Irvine | CA | Industrial | $53,000,000 | 7.7% | 1,170,571 | $128.14 | 2.12x | 9.8% | 61.3% | 61.3% |
| 6 | WFB | Northwest Hotel Portfolio | Various | Various | Hospitality | $40,326,936 | 5.9% | 818 | $138,411.07 | 1.78x | 13.7% | 65.3% | 49.0% |
| 7 | BANA | North Bay Portfolio | Petaluma | CA | Various | $35,000,000 | 5.1% | 512,165 | $105.43 | 1.66x | 11.2% | 62.4% | 57.2% |
| 8 | BANA | Prescott Valley Crossroads | Prescott Valley | AZ | Retail | $32,010,000 | 4.7% | 251,163 | $127.45 | 1.49x | 10.1% | 65.3% | 57.7% |
| 9 | MSMCH | WMC Portfolio | Various | Various | Retail | $29,812,500 | 4.3% | 264,721 | $112.62 | 1.44x | 9.9% | 74.9% | 64.4% |
| 10 | BANA | The Gateway | San Francisco | CA | Multifamily | $27,500,000 | 4.0% | 1,254 | $263,157.89 | 3.00x | 11.4% | 38.0% | 38.0% |
| Total/Wtd. Avg. | $476,242,716 | 69.2% | 2.26x | 11.2% | 56.6% | 52.8% | |||||||
| (1) | With respect to any mortgage loan that is part of a whole loan, unless otherwise indicated, all LTV, DSCR, Debt Yield and Balance per SF/Unit/Room calculations in this Term Sheet include any relatedpari passu companion loans and exclude any subordinate companion loans, as applicable. Additionally, LTV, DSCR, Debt Yield and Balance per SF/Unit figures in this Term Sheet are calculated for mortgage loans without regard to any additional indebtedness that may be incurred at a future date. With respect to any leased fee loans, the SF/Units/Rooms and Balance per SF/Unit/Room figures in this Term Sheet are based on the size of the non-collateral improvements. |
This is not a research report and was not prepared by any Underwriter’s research department. Please see additional important information and qualifications at the end of this Term Sheet. |
| T-16 |
| BANK 2018-BNK11 | Characteristics of the Mortgage Loans |
| Mortgage Loans with Pari Passu Companion Loans | ||||||||||||
| Loan No. | Mortgage Loan Seller | Property Name | Mortgage Loan Cut-off Date Balance | Aggregate Pari Passu Companion Loan Cut-off Date Balance | Combined Cut-off Date Balance | Lead Servicing Agreement | Master Servicer | Special Servicer | Control Rights | Combined UW NCF DSCR(1) | Combined UW NOI Debt Yield(1) | Combined Cut-off Date LTV(1) |
| 1 | WFB | Twelve Oaks Mall | $66,593,280 | $133,186,563 | $199,779,843 | GSMS 2018-GS9 | Wells Fargo | Rialto | GSMS 2018-GS9 | 2.55x | 15.3% | 36.1% |
| 2 | BANA | Extra Space - TIAA Self Storage Portfolio | $66,000,000 | $163,000,000 | $229,000,000 | CGCMT 2018-B2 | Midland | LNR | CGCMT 2018-B2 | 1.97x | 9.2% | 58.1% |
| 3 | WFB | Apple Campus 3 | $63,000,000 | $277,000,000 | $340,000,000 | BANK 2018-BNK10 | Wells Fargo | Torchlight | BANK 2018-BNK10 | 3.55x | 12.2% | 44.0% |
| 4 | WFB | One Dulles Tower | $63,000,000 | $89,000,000 | $152,000,000 | BANK 2018-BNK11(2) | Wells Fargo(2) | Midland(2) | (2) | 2.17x | 8.8% | 71.5% |
| 5 | WFB | Airport Business Center | $53,000,000 | $97,000,000 | $150,000,000 | BANK 2018-BNK11 | Wells Fargo | Midland | BANK 2018-BNK11 | 2.12x | 9.8% | 61.3% |
| 6 | WFB | Northwest Hotel Portfolio | $40,326,936 | $72,893,322 | $113,220,258 | BANK 2018-BNK11(3) | Wells Fargo(3) | Midland(3) | (3) | 1.78x | 13.7% | 65.3% |
| 7 | BANA | North Bay Portfolio | $35,000,000 | $19,000,000 | $54,000,000 | BANK 2018-BNK11 | Wells Fargo | Midland | BANK 2018-BNK11 | 1.66x | 11.2% | 62.4% |
| 10 | BANA | The Gateway | $27,500,000 | $302,500,000 | $330,000,000 | BANK 2018-BNK11(4) | Wells Fargo(4) | Midland(4) | (4) | 3.00x | 11.4% | 38.0% |
| (1) | DSCR, Debt Yield and LTV calculations include any relatedpari passu companion loans and exclude any subordinate companion loans, as applicable. |
| (2) | The One Dulles Tower controlling pari passu companion loan is currently held by Wells Fargo Bank, National Association, and is expected to be contributed to one or more future securitization transactions. The One Dulles Tower whole loan will be serviced pursuant to the BANK 2018-BNK11 pooling and servicing agreement until the securitization of the related control note. |
| (3) | The Northwest Hotel Portfolio controlling pari passu companion loan is currently held by Wells Fargo Bank, National Association, and is expected to be contributed to one or more future securitization transactions. The Northwest Hotel Portfolio whole loan will be serviced pursuant to the BANK 2018-BNK11 pooling and servicing agreement until the securitization of the related control note. |
| (4) | The Gateway controlling pari passu companion loans, Note C-1 and Note C-2 are currently held by Teachers Insurance and Annuity Association of America. One or more of the related companion loans is expected to be contributed to one or more future securitization transactions. The Gateway whole loan will be serviced pursuant to the BANK 2018-BNK11 pooling and servicing agreement until the securitization of the related Note A-1-A. |
This is not a research report and was not prepared by any Underwriter’s research department. Please see additional important information and qualifications at the end of this Term Sheet. |
| T-17 |
| BANK 2018-BNK11 | Characteristics of the Mortgage Loans |
| Mortgage Loans with Subordinate Debt(1) | |||||||||||
| Loan No. | Mortgage Loan Seller | Property Name | Mortgage Loan Cut-off Date Balance | Cut-off Date Balance per Unit/SF | Subordinate Debt Cut-off Date Balance | UW NCF DSCR | UW NOI Debt Yield | Cut-off Date LTV | Total Debt UW NCF DSCR(2) | Total Debt UW NOI Debt Yield(2) | Total Debt Cut-off Date LTV(2) |
| 1 | WFB | Twelve Oaks Mall | $66,593,280 | $278.72 | $99,889,922 | 2.55x | 15.3% | 36.1% | 1.58x | 10.2% | 54.2% |
| 10 | BANA | The Gateway | $27,500,000 | $263,157.89 | $220,000,000 | 3.00x | 11.4% | 38.0% | 1.62x | 6.8% | 63.3% |
| (1) | In addition, thirteen (13) of the mortgage loans, each of which is secured by a residential cooperative property, currently have in place Subordinate Coop LOCs that permit future advances. See “Description of the Mortgage Pool—Additional Indebtedness—Other Secured Indebtedness” and “Description of the Mortgage Pool—Additional Debt Financing for Mortgage Loans Secured by Residential Cooperatives” in the Preliminary Prospectus. |
| (2) | Total Debt UW NCF DSCR, Total Debt UW NOI Debt Yield and Total Debt Cut-off Date LTV figures shown above are calculated based on any relatedpari passu notes and any related subordinate note(s) and the mezzanine debt. |
| Mortgage Loans with Mezzanine Debt | |||||||||||
| Loan No. | Mortgage Loan Seller | Property Name | Mortgage Loan Cut-off Date Balance | Cut-off Date Balance per Unit/SF | Mezzanine Debt Cut-off Date Balance | UW NCF DSCR | UW NOI Debt Yield | Cut-off Date LTV | Total Debt UW NCF DSCR(1) | Total Debt UW NOI Debt Yield(1) | Total Debt Cut-off Date LTV(1) |
| 3 | WFB | Apple Campus 3 | $63,000,000 | $385.20 | $235,000,000 | 3.55x | 12.2% | 44.0% | 1.70x | 7.2% | 74.3% |
| 5 | WFB | Airport Business Center | $53,000,000 | $128.14 | $20,000,000 | 2.12x | 9.8% | 61.3% | 1.74x | 8.6% | 69.5% |
| (1) | Total Debt UW NCF DSCR, Total Debt UW NOI Debt Yield and Total Debt Cut-off Date LTV figures shown above are calculated based on any relatedpari passu notes, any related subordinate note(s) and the mezzanine debt. |
This is not a research report and was not prepared by any Underwriter’s research department. Please see additional important information and qualifications at the end of this Term Sheet. |
| T-18 |
| BANK 2018-BNK11 | Characteristics of the Mortgage Loans |
| Prior Securitization History(1) | ||||||||||||||
| Loan No. | Mortgage Loan Seller | Property Name | City | State | Property Type | Cut-off Date Balance | % of Pool | SF/Units/ Pads | Cut-off Date Balance per SF/Unit/Pad | UW NCF DSCR(2) | UW NOI Debt Yield(2) | Cut-off Date LTV(2) | Maturity Date LTV(2) | Prior Securitization |
| 5 | WFB | Airport Business Center | Irvine | CA | Industrial | $53,000,000 | 7.7% | 1,170,571 | $128.14 | 2.12x | 9.8% | 61.3% | 61.3% | MSBAM 2014-C19 |
| 9 | MSMCH | WMC Portfolio | Various | Various | Retail | $29,812,500 | 4.3% | 264,721 | $112.62 | 1.44x | 9.9% | 74.9% | 64.4% | GSMS 2011-GC3 |
| 10 | BANA | The Gateway | San Francisco | CA | Multifamily | $27,500,000 | 4.0% | 1,254 | $263,157.89 | 3.00x | 11.4% | 38.0% | 38.0% | FREMF 2013-K33; FREMF 2013-K34 |
| 17.01 | BANA | StorageOne at Lone Mountain(3) | Las Vegas | NV | Self Storage | $5,748,503 | 0.8% | 61,160 | $70.75 | 1.79x | 9.3% | 59.9% | 59.9% | BSCMS 2007-PW15 |
| 22 | NCB | Bay Terrace Cooperative Section VIII, Inc. | Bayside | NY | Multifamily | $6,085,727 | 0.9% | 120 | $50,714.39 | 4.90x | 26.4% | 20.2% | 17.1% | WFRBS 2014-C22 |
| 33 | BANA | Skylark MHC | Bellflower | CA | Manufactured Housing | $2,550,000 | 0.4% | 47 | $54,255.32 | 2.52x | 11.8% | 56.4% | 56.4% | JPMCC 2007-LDPX |
| Total | $124,696,730 | 18.1% | ||||||||||||
| (1) | Includes mortgage loans for which all or a portion of the previously existing debt was most recently securitized in conduit securitizations, based on information provided by the related borrower or obtained through searches of a third-party database. The information has not otherwise been confirmed by the mortgage loan sellers. With respect to any mortgage loan that is part of a whole loan, unless otherwise indicated, all LTV, DSCR, Debt Yield and Cut-off Date Balance per SF/Unit/Pad calculations include any relatedpari passucompanion loans and exclude any related subordinate companion loans, as applicable. |
| (2) | For mortgaged properties securing residential cooperative mortgage loans, the UW NCF DSCR and UW NOI Debt Yield for each such mortgaged property is calculated using underwritten net operating income or underwritten net cash flow, as applicable, for the related residential cooperative property which is the projected net operating income or net cash flow, as applicable, reflected in the most recent appraisal obtained by or otherwise in the possession of the related mortgage loan seller as of the Cut-off Date. LTV calculations are based upon the appraised value of the residential cooperative property determined as if such residential cooperative property is operated as a residential cooperative, inclusive of the amount of the underlying debt encumbering such residential cooperative property. |
| (3) | For properties that are part of a portfolio, the Cut-off Date Balance Per SF/Unit/Pad, UW NCF DSCR, UW NOI Debt Yield, Cut-off Date LTV and Maturity Date LTV calculations reflect the values of the portfolio as a whole. |
This is not a research report and was not prepared by any Underwriter’s research department. Please see additional important information and qualifications at the end of this Term Sheet. |
| T-19 |
| BANK 2018-BNK11 | Characteristics of the Mortgage Loans |
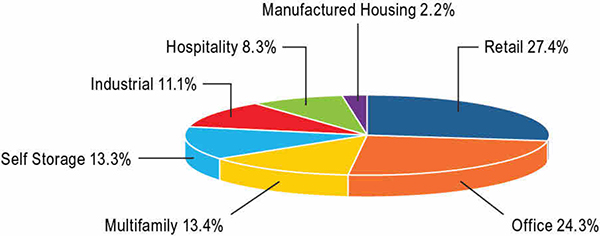
| Property Type Distribution(1) | ||||||||
| Property Type | Number of Mortgaged Properties | Aggregate Cut-off Date Balance | % of Pool | Wtd. Avg. Mortgage Rate | Wtd. Avg. UW NCF DSCR | Wtd. Avg. UW NOI Debt Yield | Wtd. Avg. Cut-off Date LTV | Wtd. Avg. Maturity Date LTV |
| Retail | 11 | $188,787,369 | 27.4% | 4.7038% | 1.83x | 11.8% | 56.9% | 47.9% |
| Anchored | 5 | $81,887,890 | 11.9% | 4.9277% | 1.41x | 9.8% | 67.4% | 56.7% |
| Super Regional Mall | 1 | $66,593,280 | 9.7% | 4.3985% | 2.55x | 15.3% | 36.1% | 29.7% |
| Shadow Anchored | 3 | $29,812,500 | 4.3% | 4.6900% | 1.44x | 9.9% | 74.9% | 64.4% |
| Unanchored | 1 | $5,993,699 | 0.9% | 5.0500% | 1.61x | 11.3% | 65.9% | 54.4% |
| Single Tenant | 1 | $4,500,000 | 0.7% | 4.7800% | 1.47x | 9.5% | 40.0% | 38.2% |
| Office | 5 | $167,019,124 | 24.3% | 3.9423% | 2.61x | 10.5% | 58.9% | 58.3% |
| Suburban | 4 | $164,895,954 | 24.0% | 3.9202% | 2.62x | 10.5% | 58.7% | 58.3% |
| Medical | 1 | $2,123,170 | 0.3% | 5.6600% | 1.40x | 10.6% | 74.5% | 57.4% |
| Multifamily | 15 | $92,506,249 | 13.4% | 4.0491% | 6.36x | 32.7% | 27.9% | 25.9% |
| Cooperative | 13 | $52,006,249 | 7.6% | 4.0669% | 9.39x | 50.1% | 11.2% | 9.9% |
| High-rise | 1 | $27,500,000 | 4.0% | 3.7218% | 3.00x | 11.4% | 38.0% | 38.0% |
| Low-rise | 1 | $13,000,000 | 1.9% | 4.6700% | 1.30x | 8.3% | 73.2% | 64.5% |
| Self Storage | 29 | $91,376,250 | 13.3% | 4.6255% | 1.94x | 9.4% | 58.2% | 57.0% |
| Self Storage | 29 | $91,376,250 | 13.3% | 4.6255% | 1.94x | 9.4% | 58.2% | 57.0% |
| Industrial | 3 | $76,104,046 | 11.1% | 4.4142% | 1.98x | 10.2% | 61.6% | 60.1% |
| Flex | 3 | $76,104,046 | 11.1% | 4.4142% | 1.98x | 10.2% | 61.6% | 60.1% |
| Hospitality | 9 | $57,074,673 | 8.3% | 4.9955% | 1.99x | 14.3% | 64.6% | 50.7% |
| Limited Service | 7 | $40,326,936 | 5.9% | 5.0180% | 1.78x | 13.7% | 65.3% | 49.0% |
| Full Service | 1 | $11,747,737 | 1.7% | 5.0800% | 1.79x | 13.3% | 67.1% | 55.5% |
| Select Service | 1 | $5,000,000 | 0.7% | 4.6150% | 4.12x | 21.3% | 52.6% | 52.6% |
| Manufactured Housing | 4 | $15,332,982 | 2.2% | 4.8392% | 1.96x | 10.5% | 58.4% | 53.6% |
| Manufactured Housing | 4 | $15,332,982 | 2.2% | 4.8392% | 1.96x | 10.5% | 58.4% | 53.6% |
| Total/Wtd. Avg. | 76 | $688,200,694 | 100.0% | 4.4158% | 2.67x | 14.0% | 54.8% | 50.4% |
| (1) | All numerical information concerning the mortgage loans is approximate and, in the case of mortgage loans secured by multiple properties, is based on allocated loan amounts with respect to such properties. All weighted average information regarding the mortgage loans reflects the weighting of the mortgage loans based on their outstanding principal balances as of the Cut-off Date or, in the case of mortgage loans secured by multiple properties, allocated loan amounts. The sum of numbers and percentages in columns may not match the “Total” due to rounding. With respect to any mortgage loan that is part of a whole loan, unless otherwise indicated, all LTV, DSCR and Debt Yield calculations include any relatedpari passu companion loans and exclude any related subordinate companion loans, as applicable. For mortgaged properties securing residential cooperative mortgage loans, the UW NCF DSCR and UW NOI Debt Yield for each such mortgaged property is calculated using underwritten net operating income or underwritten net cash flow, as applicable, for the related residential cooperative property which is the projected net operating income or net cash flow, as applicable, reflected in the most recent appraisal obtained by or otherwise in the possession of the related mortgage loan seller as of the Cut-off Date. LTV calculations are based upon the appraised value of the residential cooperative property determined as if such residential cooperative property is operated as a residential cooperative, inclusive of the amount of the underlying debt encumbering such residential cooperative property. |
This is not a research report and was not prepared by any Underwriter’s research department. Please see additional important information and qualifications at the end of this Term Sheet. |
| T-20 |
| BANK 2018-BNK11 | Characteristics of the Mortgage Loans |
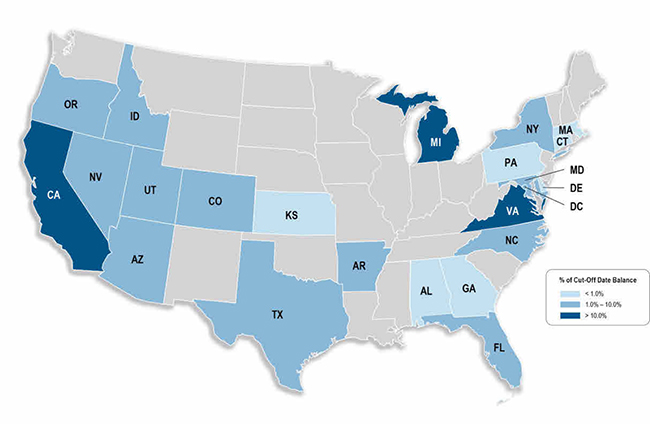
| Geographic Distribution(1) | ||||||||
| State or Other Jurisdiction | Number of Mortgaged Properties | Aggregate Cut-off Date Balance | % of Pool | Wtd. Avg. Mortgage Rate | Wtd. Avg. UW NCF DSCR | Wtd. Avg. UW NOI Debt Yield | Wtd. Avg. Cut-off Date LTV | Wtd. Avg. Maturity Date LTV |
| California | 20 | $236,199,952 | 34.3% | 4.1235% | 2.51x | 11.0% | 53.2% | 51.6% |
| California – Northern(2) | 8 | $137,440,707 | 20.0% | 3.8360% | 2.81x | 11.5% | 48.1% | 46.7% |
| California – Southern(2) | 12 | $98,759,245 | 14.4% | 4.5237% | 2.09x | 10.2% | 60.3% | 58.3% |
| Michigan | 2 | $79,593,280 | 11.6% | 4.4428% | 2.35x | 14.2% | 42.2% | 35.4% |
| Virginia | 2 | $73,112,280 | 10.6% | 4.0834% | 2.07x | 9.0% | 72.0% | 70.5% |
| New York | 13 | $52,006,249 | 7.6% | 4.0669% | 9.39x | 50.1% | 11.2% | 9.9% |
| Colorado | 2 | $34,350,000 | 5.0% | 4.8981% | 1.81x | 9.9% | 64.2% | 61.5% |
| Arizona | 3 | $34,142,009 | 5.0% | 4.8410% | 1.55x | 10.2% | 64.6% | 57.5% |
| Nevada | 3 | $22,985,776 | 3.3% | 4.9216% | 1.72x | 10.8% | 62.2% | 55.8% |
| Arkansas | 1 | $22,975,000 | 3.3% | 4.9250% | 1.23x | 8.6% | 71.0% | 58.4% |
| North Carolina | 2 | $19,700,220 | 2.9% | 4.6900% | 1.44x | 9.9% | 74.9% | 64.4% |
| Idaho | 4 | $19,454,551 | 2.8% | 5.0180% | 1.78x | 13.7% | 65.3% | 49.0% |
| Maryland | 3 | $16,685,056 | 2.4% | 4.9180% | 1.84x | 12.1% | 64.4% | 56.3% |
| Oregon | 2 | $14,085,373 | 2.0% | 5.0180% | 1.78x | 13.7% | 65.3% | 49.0% |
| Florida | 3 | $13,676,589 | 2.0% | 4.7911% | 1.69x | 9.2% | 60.5% | 55.2% |
| Utah | 2 | $12,787,012 | 1.9% | 4.7613% | 2.28x | 13.4% | 55.4% | 46.8% |
| Texas | 3 | $9,655,908 | 1.4% | 5.1016% | 1.62x | 10.8% | 66.5% | 55.6% |
| District of Columbia | 1 | $8,888,672 | 1.3% | 4.5325% | 1.97x | 9.2% | 58.1% | 58.1% |
| Massachusetts | 3 | $5,935,100 | 0.9% | 4.5325% | 1.97x | 9.2% | 58.1% | 58.1% |
| Pennsylvania | 1 | $2,683,231 | 0.4% | 4.5325% | 1.97x | 9.2% | 58.1% | 58.1% |
| Delaware | 1 | $2,361,301 | 0.3% | 4.5325% | 1.97x | 9.2% | 58.1% | 58.1% |
| Alabama | 1 | $2,073,668 | 0.3% | 4.5325% | 1.97x | 9.2% | 58.1% | 58.1% |
| Kansas | 2 | $2,057,817 | 0.3% | 4.5325% | 1.97x | 9.2% | 58.1% | 58.1% |
| Connecticut | 1 | $1,415,397 | 0.2% | 4.5325% | 1.97x | 9.2% | 58.1% | 58.1% |
| Georgia | 1 | $1,376,250 | 0.2% | 5.7200% | 1.42x | 10.4% | 74.4% | 65.6% |
| Total/Wtd. Avg. | 76 | $688,200,694 | 100.0% | 4.4158% | 2.67x | 14.0% | 54.8% | 50.4% |
| (1) | All numerical information concerning the mortgage loans is approximate and, in the case of mortgage loans secured by multiple properties, is based on allocated loan amounts with respect to such properties. All weighted average information regarding the mortgage loans reflects the weighting of the mortgage loans based on their outstanding principal balances as of the Cut-off Date or, in the case of mortgage loans secured by multiple properties, allocated loan amounts. The sum of numbers and percentages in columns may not match the “Total” due to rounding. With respect to any mortgage loan that is part of a whole loan, unless otherwise indicated, all LTV, DSCR and Debt Yield calculations include any relatedpari passu companion loans and exclude any related subordinate companion loans, as applicable. For mortgaged properties securing residential cooperative mortgage loans, the UW NCF DSCR and UW NOI Debt Yield for each such mortgaged property is calculated using underwritten net operating income or underwritten net cash flow, as applicable, for the related residential cooperative property which is the projected net operating income or net cash flow, as applicable, reflected in the most recent appraisal obtained by or otherwise in the possession of the related mortgage loan seller as of the Cut-off Date. LTV calculations are based upon the appraised value of the residential cooperative property determined as if such residential cooperative property is operated as a residential cooperative, inclusive of the amount of the underlying debt encumbering such residential cooperative property. |
| (2) | “California – Northern” includes zip codes above 93600, and “California – Southern” includes zip codes at or below 93600. |
This is not a research report and was not prepared by any Underwriter’s research department. Please see additional important information and qualifications at the end of this Term Sheet. |
| T-21 |
| BANK 2018-BNK11 | Collateral Statistics |
Collateral Statistics(1)
Cut-off Date Balance ($)
| No. of Mortgage Loans | Aggregate Cut-off Date Balance ($) | % of Pool | |||||
| 1,240,000 - 10,000,000 | 26 | 108,960,026 | 15.8 | ||||
| 10,000,001 - 20,000,000 | 4 | 53,022,952 | 7.7 | ||||
| 20,000,001 - 30,000,000 | 4 | 107,287,500 | 15.6 | ||||
| 30,000,001 - 40,000,000 | 2 | 67,010,000 | 9.7 | ||||
| 40,000,001 - 55,000,000 | 2 | 93,326,936 | 13.6 | ||||
| 55,000,001 - 65,000,000 | 2 | 126,000,000 | 18.3 | ||||
| 65,000,001 - 66,593,280 | 2 | 132,593,280 | 19.3 | ||||
| Total: | 42 | $688,200,694 | 100.0 | % | |||
| Min: $1,240,000 | Max: $66,593,280 | Avg: $16,385,731 | |||||
State or Other Jurisdiction(2)
| No. of Mortgaged Properties | Aggregate Cut-off Date Balance ($) | % of Pool |
| ||||
| California | 20 | 236,199,952 | 34.3 | ||||
| California – Northern(3) | 8 | 137,440,707 | 20.0 | ||||
| California – Southern(3) | 12 | 98,759,245 | 14.4 | ||||
| Michigan | 2 | 79,593,280 | 11.6 | ||||
| Virginia | 2 | 73,112,280 | 10.6 | ||||
| New York | 13 | 52,006,249 | 7.6 | ||||
| Colorado | 2 | 34,350,000 | 5.0 | ||||
| Arizona | 3 | 34,142,009 | 5.0 | ||||
| Nevada | 3 | 22,985,776 | 3.3 | ||||
| Arkansas | 1 | 22,975,000 | 3.3 | ||||
| North Carolina | 2 | 19,700,220 | 2.9 | ||||
| Idaho | 4 | 19,454,551 | 2.8 | ||||
| Maryland | 3 | 16,685,056 | 2.4 | ||||
| Oregon | 2 | 14,085,373 | 2.0 | ||||
| Florida | 3 | 13,676,589 | 2.0 | ||||
| Utah | 2 | 12,787,012 | 1.9 | ||||
| Texas | 3 | 9,655,908 | 1.4 | ||||
| District of Columbia | 1 | 8,888,672 | 1.3 | ||||
| Massachusetts | 3 | 5,935,100 | 0.9 | ||||
| Pennsylvania | 1 | 2,683,231 | 0.4 | ||||
| Delaware | 1 | 2,361,301 | 0.3 | ||||
| Alabama | 1 | 2,073,668 | 0.3 | ||||
| Kansas | 2 | 2,057,817 | 0.3 | ||||
| Connecticut | 1 | 1,415,397 | 0.2 | ||||
| Georgia | 1 | 1,376,250 | 0.2 | ||||
| Total: | 76 | $688,200,694 | 100.0 | % |
Property Type(2)
| No. of Mortgaged Properties | Aggregate Cut-off Date Balance ($) | % of Pool | |||||
| Retail | 11 | 188,787,369 | 27.4 | ||||
| Anchored | 5 | 81,887,890 | 11.9 | ||||
| Super Regional Mall | 1 | 66,593,280 | 9.7 | ||||
| Shadow Anchored | 3 | 29,812,500 | 4.3 | ||||
| Unanchored | 1 | 5,993,699 | 0.9 | ||||
| Single Tenant | 1 | 4,500,000 | 0.7 | ||||
| Office | 5 | 167,019,124 | 24.3 | ||||
| Suburban | 4 | 164,895,954 | 24.0 | ||||
| Medical | 1 | 2,123,170 | 0.3 | ||||
| Multfamily | 15 | 92,506,249 | 13.4 | ||||
| Cooperative | 13 | 52,006,249 | 7.6 | ||||
| High-rise | 1 | 27,500,000 | 4.0 | ||||
| Low-rise | 1 | 13,000,000 | 1.9 | ||||
| Self Storage | 29 | 91,376,250 | 13.3 | ||||
| Self Storage | 29 | 91,376,250 | 13.3 | ||||
| Industrial | 3 | 76,104,046 | 11.1 | ||||
| Flex | 3 | 76,104,046 | 11.1 | ||||
| Hospitality | 9 | 57,074,673 | 8.3 | ||||
| Limited Service | 7 | 40,326,936 | 5.9 | ||||
| Full Service | 1 | 11,747,737 | 1.7 | ||||
| Select Service | 1 | 5,000,000 | 0.7 | ||||
| Manufactured Housing | 4 | 15,332,982 | 2.2 | ||||
| Manufactured Housing | 4 | 15,332,982 | 2.2 | ||||
| Total: | 76 | $688,200,694 | 100.0 | % | |||
Mortgage Rate (%)
| No. of Mortgage Loans | Aggregate Cut-off Date Balance ($) | % of Pool | |||||
| 3.3650 - 4.4999 | 19 | 331,099,530 | 48.1 | ||||
| 4.5000 - 4.9999 | 15 | 274,923,276 | 39.9 | ||||
| 5.0000 - 5.7200 | 8 | 82,177,888 | 11.9 | ||||
| Total: | 42 | $688,200,694 | 100.0 | % | |||
| Min: 3.3650% | Max: 5.7200% | Wtd Avg: 4.4158% | |||||
Original Term to Maturity or ARD (mos.)
| No. of Mortgage Loans | Aggregate Cut-off Date Balance ($) | % of Pool | |||||
| 120 | 42 | 688,200,694 | 100.0 | ||||
| Total: | 42 | $688,200,694 | 100.0 | % | |||
| Min: 120 mos | Max: 120 mos. | Wtd Avg: 120 mos. | |||||
Remaining Term to Maturity or ARD (mos.)
| No. of Mortgage Loans | Aggregate Cut-off Date Balance ($) | % of Pool | |||||
| 117 – 120 | 42 | 688,200,694 | 100.0 | ||||
| Total: | 42 | $688,200,694 | 100.0 | % | |||
| Min: 117 mos. | Max: 120 mos. | Wtd Avg: 119 mos. | |||||
Original Amortization Term (mos.)
| No. of Mortgage Loans | Aggregate Cut-off Date Balance ($) | % of Pool | |||||
| Interest Only | 15 | 338,440,000 | 49.2 | ||||
| 300 | 4 | 50,634,334 | 7.4 | ||||
| 360 | 20 | 272,255,093 | 39.6 | ||||
| 420 | 1 | 6,085,727 | 0.9 | ||||
| 480 | 2 | 20,785,540 | 3.0 | ||||
| Total: | 42 | $688,200,694 | 100.0 | % | |||
| Min: 300 mos. | Max: 480 mos. | Wtd Avg: 359 mos. | |||||
Remaining Amortization Term (mos.)
| No. of Mortgage Loans | Aggregate Cut-off Date Balance ($) | % of Pool | |||||
| Interest Only | 15 | 338,440,000 | 49.2 | ||||
| 298 - 300 | 4 | 50,634,334 | 7.4 | ||||
| 358 - 360 | 20 | 272,255,093 | 39.6 | ||||
| 418 | 1 | 6,085,727 | 0.9 | ||||
| 479 | 2 | 20,785,540 | 3.0 | ||||
| Total: | 42 | $688,200,694 | 100.0 | % | |||
| Min: 298 mos. | Max: 479 mos. | Wtd Avg: 359 mos. | |||||
Mortgage Loan Sellers
| No. of Mortgage Loans | Aggregate Cut-off Date Balance ($) | % of Pool | |||||
| WFB | 9 | 329,981,029 | 47.9 | ||||
| BANA | 12 | 198,219,232 | 28.8 | ||||
| MSMCH | 8 | 107,994,183 | 15.7 | ||||
| NCB | 13 | 52,006,249 | 7.6 | ||||
| Total: | 42 | $688,200,694 | 100.0 | % |
Amortization Type
| No. of Mortgage Loans | Aggregate Cut-off Date Balance ($) | % of Pool | |||||
| Amortizing Balloon | 21 | 234,061,944 | 34.0 | ||||
| Interest Only | 13 | 212,440,000 | 30.9 | ||||
| Interest Only ARD | 2 | 126,000,000 | 18.3 | ||||
| Partial Interest Only | 6 | 115,698,750 | 16.8 | ||||
| Total: | 42 | $688,200,694 | 100.0 | % |
Cut-off Date LTV Ratio (%)
| No. of Mortgage Loans | Aggregate Cut-off Date Balance ($) | % of Pool | |||||
| 1.0 - 50.0 | 18 | 219,599,530 | 31.9 | ||||
| 50.1 - 55.0 | 3 | 11,090,000 | 1.6 | ||||
| 55.1 - 60.0 | 3 | 78,550,000 | 11.4 | ||||
| 60.1 - 65.0 | 6 | 142,678,758 | 20.7 | ||||
| 65.1 - 74.9 | 12 | 236,282,406 | 34.3 | ||||
| Total: | 42 | $688,200,694 | 100.0 | % | |||
| Min: 1.0% | Max: 74.9% | Wtd Avg: 54.8% | |||||
Maturity Date or ARD LTV Ratio (%)
| No. of Mortgage Loans | Aggregate Cut-off Date Balance ($) | % of Pool | |||||
| 0.8 - 40.0 | 16 | 150,599,530 | 21.9 | ||||
| 40.1 - 50.0 | 4 | 115,894,050 | 16.8 | ||||
| 50.1 - 55.0 | 7 | 44,762,457 | 6.5 | ||||
| 55.1 - 60.0 | 8 | 182,405,907 | 26.5 | ||||
| 60.1 - 65.0 | 5 | 130,162,500 | 18.9 | ||||
| 65.1 - 71.5 | 2 | 64,376,250 | 9.4 | ||||
| Total: | 42 | $688,200,694 | 100.0 | % | |||
| Min: 0.8% | Max: 71.5% | Wtd Avg: 50.4% | |||||
UW NCF DSCR (x)
| No. of Mortgage Loans | Aggregate Cut-off Date Balance ($) | % of Pool | |||||
| 1.23 - 1.40 | 7 | 66,708,266 | 9.7 | ||||
| 1.41 - 1.60 | 4 | 67,698,750 | 9.8 | ||||
| 1.61 - 1.80 | 6 | 116,054,148 | 16.9 | ||||
| 1.81 - 2.00 | 2 | 93,000,000 | 13.5 | ||||
| 2.01 - 2.20 | 2 | 116,000,000 | 16.9 | ||||
| 2.21 - 56.99 | 21 | 228,739,530 | 33.2 | ||||
| Total: | 42 | $688,200,694 | 100.0 | % | |||
| Min: 1.23x | Max: 56.99x | Wtd Avg: 2.67x | |||||
UW NOI Debt Yield (%)
| No. of Mortgage Loans | Aggregate Cut-off Date Balance ($) | % of Pool | |||||
| 8.3 - 9.0 | 5 | 114,325,000 | 16.6 | ||||
| 9.1 – 10.0 | 7 | 176,572,596 | 25.7 | ||||
| 10.1 - 11.0 | 5 | 67,359,420 | 9.8 | ||||
| 11.1 - 12.0 | 5 | 84,029,475 | 12.2 | ||||
| 12.1 - 13.0 | 1 | 63,000,000 | 9.2 | ||||
| 13.1 - 14.0 | 4 | 59,314,673 | 8.6 | ||||
| 14.1 - 16.0 | 1 | 66,593,280 | 9.7 | ||||
| 16.1 - 321.1 | 14 | 57,006,249 | 8.3 | ||||
| Total: | 42 | $688,200,694 | 100.0 | % | |||
| Min: 8.3% | Max: 321.1% | Wtd Avg: 14.0% | |||||
| (1) | All numerical information concerning the mortgage loans is approximate. All weighted average information regarding the mortgage loans reflects the weighting of the mortgage loans based on their outstanding principal balances as of the Cut-off Date. The sum of numbers and percentages in columns may not match the “Total” due to rounding. With respect to any mortgage loan that is part of a whole loan, unless otherwise indicated, all LTV, DSCR and Debt Yield calculations include any relatedpari passu companion loans and exclude any related subordinate companion loans, as applicable. For mortgaged properties securing residential cooperative mortgage loans, the UW DSCR and UW NOI Debt Yield for each such mortgaged property is calculated using underwritten net operating income or underwritten net cash flow, as applicable, for the related residential cooperative property which is the projected net operating income or net cash flow, as applicable, reflected in the most recent appraisal obtained by or otherwise in the possession of the related mortgage loan seller as of the Cut-off Date. LTV calculations are based upon the appraised value of the residential cooperative property determined as if such residential cooperative property is operated as a residential cooperative, inclusive of the amount of the underlying debt encumbering such residential cooperative property. |
| (2) | In the case of mortgage loans secured by multiple properties, cut-off date balance information is based on allocated loan amounts with respect to such properties. |
| (3) | “California – Northern” includes zip codes above 93600, and “California – Southern” includes zip codes at or below 93600. |
This is not a research report and was not prepared by any Underwriter’s research department. Please see additional important information and qualifications at the end of this Term Sheet. |
| T-22 |
(THIS PAGE INTENTIONALLY LEFT BLANK)
| T-23 |
| BANK 2018-BNK11 | Twelve Oaks Mall |
Mortgage Loan No. 1 – Twelve Oaks Mall
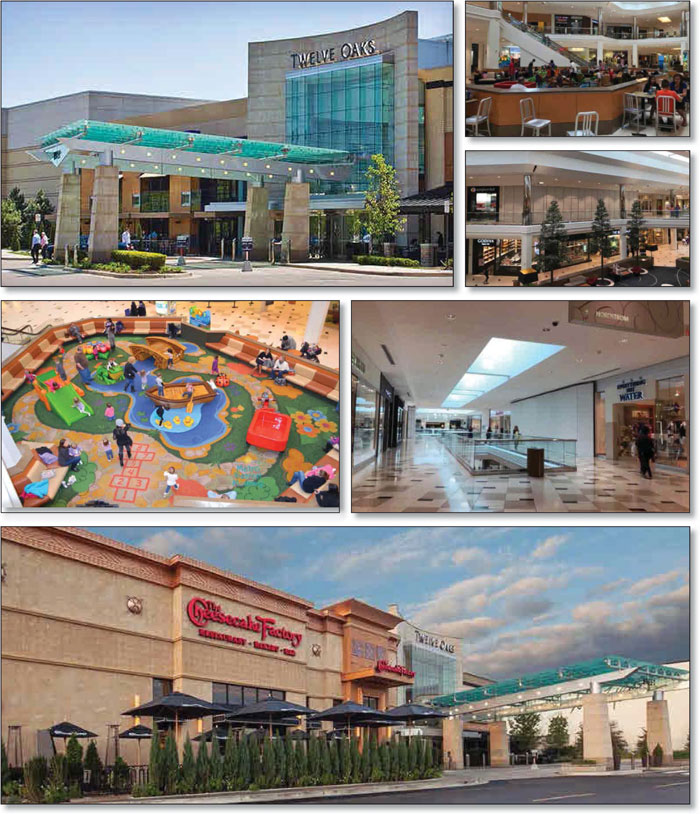
This is not a research report and was not prepared by any Underwriter’s research department. Please see additional important information and qualifications at the end of this Term Sheet. |
| T-24 |
| BANK 2018-BNK11 | Twelve Oaks Mall |
Mortgage Loan No. 1 – Twelve Oaks Mall
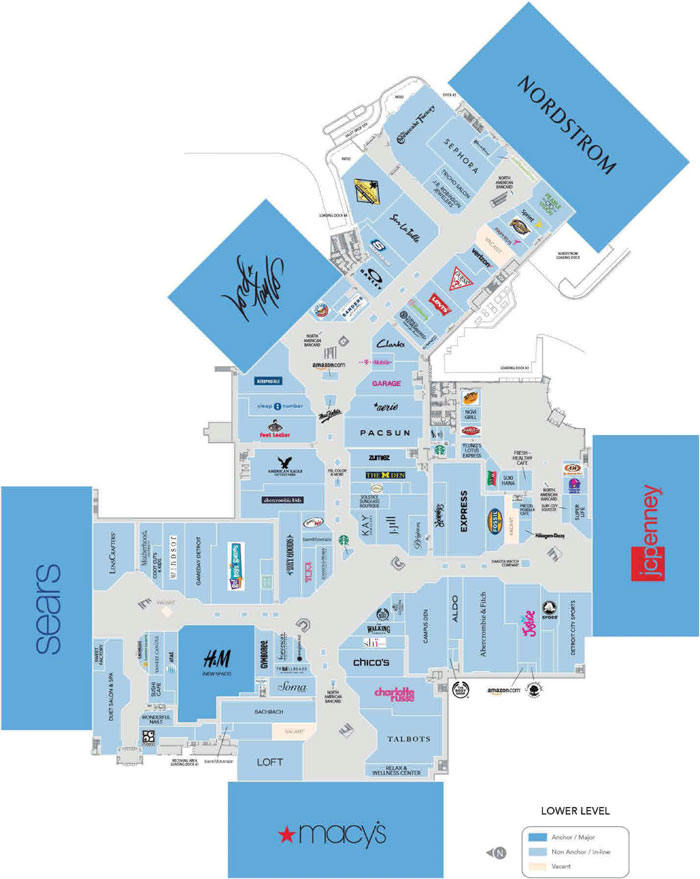
This is not a research report and was not prepared by any Underwriter’s research department. Please see additional important information and qualifications at the end of this Term Sheet. |
| T-25 |
| BANK 2018-BNK11 | Twelve Oaks Mall |
Mortgage Loan No. 1 – Twelve Oaks Mall
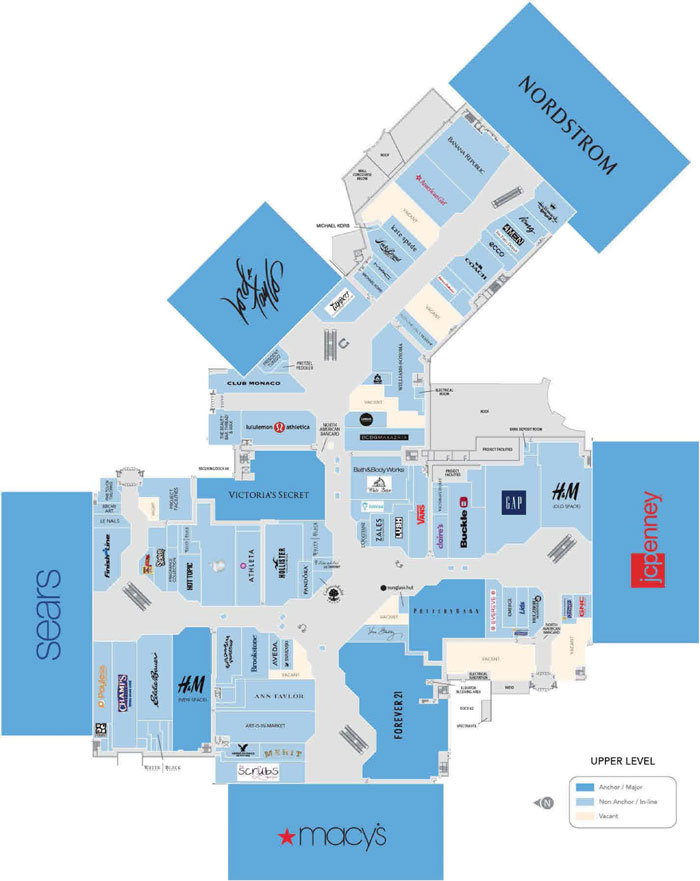
This is not a research report and was not prepared by any Underwriter’s research department. Please see additional important information and qualifications at the end of this Term Sheet. |
| T-26 |
| BANK 2018-BNK11 | Twelve Oaks Mall |
Mortgage Loan No. 1 – Twelve Oaks Mall

This is not a research report and was not prepared by any Underwriter’s research department. Please see additional important information and qualifications at the end of this Term Sheet. |
| T-27 |
| BANK 2018-BNK11 | Twelve Oaks Mall |
| Mortgage Loan No. 1 – Twelve Oaks Mall |
| Mortgage Loan Information | Property Information | |||||
| Mortgage Loan Seller: | WFB | Single Asset/Portfolio: | Single Asset | |||
| Original Balance(1): | $66,666,666 | Location: | Novi, MI 48377 | |||
| Cut-off Date Balance(1): | $66,593,280 | General Property Type: | Retail | |||
| % of Initial Pool Balance: | 9.7% | Detailed Property Type: | Super Regional Mall | |||
| Loan Purpose: | Refinance | Title Vesting: | Fee | |||
Sponsor: | The Taubman Realty Group Limited Partnership | Year Built/Renovated: | 1977/2007 | |||
| Size(5): | 716,771 SF | |||||
| Mortgage Rate: | 4.3985% | Cut-off Date Balance per SF(1): | $279 | |||
| Note Date: | 2/28/2018 | Maturity Date Balance per SF(1): | $229 | |||
| First Payment Date: | 4/6/2018 | Property Manager: | The Taubman Company LLC, (borrower-related) | |||
| Maturity Date: | 3/6/2028 | |||||
| Original Term to Maturity: | 120 months | |||||
| Original Amortization Term: | 360 months | Underwriting and Financial Information | ||||
| IO Period: | 0 months | UW NOI: | $30,594,826 | |||
| Seasoning: | 1 month | UW NOI Debt Yield(1): | 15.3% | |||
| Prepayment Provisions(2): | LO (25); DEF (91); O (4) | UW NOI Debt Yield at Maturity(1): | 18.6% | |||
| Lockbox/Cash Mgmt Status: | Hard/Springing | UW NCF DSCR(1): | 2.55x | |||
| Additional Debt Type(3): | Pari Passu/B Note | Most Recent NOI: | $34,136,114 (11/30/2017 TTM) | |||
| Additional Debt Balance(3): | $133,186,563/$99,889,922 | 2nd Most Recent NOI: | $36,269,109 (12/31/2016) | |||
| Future Debt Permitted (Type): | No (N/A) | 3rd Most Recent NOI: | $35,697,165 (12/31/2015) | |||
| Reserves(4) | Most Recent Occupancy(6)(7): | 91.9% (2/1/2018) | ||||
| Type | Initial | Monthly | Cap | 2nd Most Recent Occupancy(7): | 92.9% (11/30/2017) | |
| RE Tax: | $0 | Springing | N/A | 3rd Most Recent Occupancy(7): | 94.6% (12/31/2016) | |
| Insurance: | $0 | Springing | N/A | Appraised Value (as of): | $552,900,000 (12/14/2017) | |
| Replacement Reserves: | $0 | Springing | $274,500 | Cut-off Date LTV Ratio(1): | 36.1% | |
| TI/LC: | $0 | Springing | $1,647,000 | Maturity Date LTV Ratio(1): | 29.7% | |
| Tenant Specific TI/LC Reserve: | $4,627,403 | $0 | N/A | |||
Sources and Uses
| ||||||
| Sources | Proceeds | % of Total | Uses | Proceeds | % of Total | |
| Loan Amount(1): | $200,000,000 | 66.7% | Loan Payoff: | (8) | (8) | |
| Subordinate Companion Loan Amount: | $100,000,000 | 33.3% | Principal Equity Distribution: | (8) | (8) | |
| Reserves: | $4,627,403 | 1.5% | ||||
| Closing Costs: | $853,367 | 0.3% | ||||
| Total Sources: | $300,000,000 | 100.0% | Total Uses: | $300,000,000 | 100.0% | |
| (1) | The Twelve Oaks Mall Mortgage Loan (as defined below) is part of the Twelve Oaks Mall Whole Loan (as defined below), which is comprised of fourpari passusenior notes and three subordinate notes with an aggregate original principal balance of $300,000,000. The Twelve Oaks Mallpari passu senior notes have a combined original principal balance of $200,000,000 and the subordinate notes have a combined original principal balance of $100,000,000. The Cut-off Date Balance per SF, Maturity Date Balance per SF, UW NOI Debt Yield, UW NOI Debt Yield at Maturity, UW NCF DSCR, Cut-off Date LTV Ratio and Maturity Date LTV Ratio numbers presented above are based on the senior notes totaling $200,000,000 without regard to the subordinate notes. The Cut-off Date Balance per SF, Maturity Date Balance per SF, UW NOI Debt Yield, UW NOI Debt Yield at Maturity, UW NCF DSCR, Cut-off Date LTV Ratio and Maturity Date LTV Ratio based on the aggregate note balance of the Twelve Oaks Mall Whole Loan (including the subordinate notes) are $418, $343, 10.2%, 12.4%, 1.58x, 54.2%, and 44.5%, respectively. |
| (2) | Defeasance of the Twelve Oaks Mall Whole Loan is permitted at any time after the earlier of (i) February 28, 2021 and (ii) two years from the closing date of the securitization that includes the last pari passu note of the Twelve Oaks Mall Whole Loan to be securitized. The assumed lockout period of 25 payments is based on the closing date of this transaction in April 2018. |
| (3) | See “—The Mortgage Loan” and “--Additional Secured Indebtedness (not including trade payables)” below for a discussion of the additional debt. |
| (4) | See “—Escrows and Reserves” below for further discussion of reserve requirements. |
| (5) | The size shown represents the space that serves as collateral for the Twelve Oaks Mall Whole Loan. Including non-collateral space, the total square footage is 1,519,224 SF. |
| (6) | Most Recent Occupancy includes two tenants that are currently in occupancy and paying rent, have executed leases to relocate to new spaces, but are not yet in occupancy or paying rent on such new spaces (and as to which occupancy is based on the new spaces): H&M currently occupies a 9,171 SF space (1.3% of NRA), has executed a lease to relocate to a 24,440 SF space (3.4% of NRA) and is anticipated to take occupancy and begin paying rent on the new space in November 2018; and lululemon athletica currently occupies a 3,467 SF space (0.5% of NRA), has executed a lease to relocate to a 5,392 SF space (0.8% of NRA) and is anticipated to take occupancy and begin paying rent on the new space in June 2018. In addition, Most Recent Occupancy includes Pinkberry (718 SF, 0.1% of NRA), which has executed a new lease, is not yet in occupancy or paying rent and is expected to take occupancy and begin paying rent in March 2018. In addition, Most Recent Occupancy includes Bachrach (4,494 SF, 0.6% of NRA) that has filed for bankruptcy but is currently in-place. In addition, Most Recent Occupancy includes seven tenants totaling 14,673 SF (2.0% of NRA) that are currently in occupancy at the Twelve Oaks Mall Property and have lease renewals out for signature that have not been executed. These seven tenants include Sephora (5,700 SF, 0.8% of NRA), J Jill (4,075, 0.6% of NRA), Journeys (2,191 SF, 0.3% of NRA), Journeys Kidz (1,108 SF, 0.2% of NRA), GNC Live Well (954 SF, 0.1% of NRA), SGH Sunglass Hut (581 SF, 0.1% of NRA) and 3D Innovations (64 SF, 0.0% of NRA). We cannot assure you that these tenants will take occupancy, execute the renewals, begin paying rent or continue paying rent as anticipated or at all. |
| (7) | The occupancy rates shown represent the portion of the Twelve Oaks Mall (as defined below) that serves as collateral for the Twelve Oaks Mall Whole Loan. Including the non-collateral anchor stores (see “Tenant Summary” below), Most Recent Occupancy was 96.2% as of February 1, 2018; 2nd Most Recent Occupancy was 96.7% as of November 30, 2017; and 3rd Most Recent Occupancy was 97.5% as of December 31, 2016. |
| (8) | Prior to loan origination, the Twelve Oaks Mall Property did not secure a mortgage loan but was included in a pool of assets supporting corporate borrowing by The Taubman Realty Group Limited Partnership. The proceeds of the Twelve Oaks Mall Whole Loan were used to repay a portion of the outstanding corporate loan, fund reserves and pay origination costs. As of February 28, 2018, the Twelve Oaks Mall Property was no longer included in the pool of assets supporting the aforementioned corporate loan. |
This is not a research report and was not prepared by any Underwriter’s research department. Please see additional important information and qualifications at the end of this Term Sheet. |
| T-28 |
| BANK 2018-BNK11 | Twelve Oaks Mall |
The Mortgage Loan. The largest mortgage loan (the “Twelve Oaks Mall Mortgage Loan”) is part of a whole loan (the “Twelve Oaks Mall Whole Loan”) consisting of four senior pari passu promissory notes (Promissory Note A-1, Promissory Note A-2, Promissory Note A-3-1 and Promissory Note A-3-2) with an original principal balance of $200,000,000 (the “Twelve Oaks Mall Senior Loan”) and three promissory notes that are subordinate to the senior pari passu notes and pari passu with each other (Promissory Note B-1, Promissory Note B-2 and Promissory Note B-3) with an original principal balance of $100,000,000 (the “Twelve Oaks Mall Subordinate Loan”). The Twelve Oaks Mall Whole Loan had an aggregate original principal balance of $300,000,000 and is secured by a first mortgage encumbering the fee interest in a super regional mall located in Novi, Michigan (the “Twelve Oaks Mall Property”). The Twelve Oaks Mall Whole Loan was co-originated on February 28, 2018 by Goldman Sachs Mortgage Company, JP Morgan Chase Bank, National Association, and Wells Fargo Bank, National Association. The Twelve Oaks Mall Senior Loan has an interest rate of 4.3985% per annum and the Twelve Oaks Mall Subordinate Loan has an interest rate of 5.7500% per annum, resulting in a weighted average interest rate of 4.8490% per annum on the Twelve Oaks Mall Whole Loan.
The non-controlling Promissory Note A-2, which represents the Twelve Oaks Mall Mortgage Loan, will be contributed to the BANK 2018-BNK11 securitization trust, and has an original principal balance of $66,666,666. The non-controlling Note A-1 has an original principal balance of $66,666,668 and was contributed to the GSMS 2018-GS9 securitization trust. The non-controlling Note A-3-1 has an original principal balance of $50,000,000 and is currently held by JP Morgan Chase Bank, National Association and is expected to be contributed to one or more future securitization trusts. The non-controlling Note-A-3-2 has an original principal balance of $16,666,666, is currently held by JP Morgan Chase Bank, National Association and is expected to be contributed to one or more future securitization trusts. The mortgage loans evidenced by Promissory Notes A-1, A-3-1 and A-3-2 are collectively referred to herein as the “Twelve Oaks Mall Non-Serviced Pari Passu Companion Loans”. The Twelve Oaks Mall Whole Loan is serviced pursuant to the pooling and servicing agreement for the GSMS 2018-GS9 securitization trust. See “Description of the Mortgage Pool—The Whole Loans— The Twelve Oaks-MI Pari Passu-A/B Whole Loan” and “Pooling and Servicing Agreement—Servicing of the Non-Serviced Mortgage Loans” in the Preliminary Prospectus.
The proceeds of the Twelve Oaks Mall Whole Loan were used to partially prepay an existing corporate borrowing, fund reserves and pay origination costs.
| Twelve Oaks Mall Whole Loan Summary | ||||
| Note | Original Balance | Cut-off Date Balance | Note Holder | Controlling Piece |
| Twelve Oaks Mall Senior Loan Summary | ||||
| A-1 | $66,666,668 | $66,593,282 | GSMS 2018-GS9 | No |
| A-2 | $66,666,666 | $66,593,280 | BANK 2018-BNK11 | No |
| A-3-1 | $50,000,000 | $49,944,961 | Benchmark 2018-B3 | No |
| A-3-2 | $16,666,666 | $16,648,320 | JPMCB | No |
| Total Twelve Oaks Senior Loan | $200,000,000 | $199,779,843 | ||
| Twelve Oaks Mall Subordinate Loan Summary | ||||
| B-1 | $33,333,333 | $33,296,640 | Teachers Insurance and Annuity Association of America | Yes |
| B-2 | $33,333,334 | $33,296,641 | Teachers Insurance and Annuity Association of America | Yes |
| B-3 | $33,333,333 | $33,296,640 | Teachers Insurance and Annuity Association of America | Yes |
| Total Twelve Oaks Subordinate Loan | $100,000,000 | $99,889,922 | ||
| Total | $300,000,000 | $299,669,765 | ||
This is not a research report and was not prepared by any Underwriter’s research department. Please see additional important information and qualifications at the end of this Term Sheet. |
| T-29 |
| BANK 2018-BNK11 | Twelve Oaks Mall |
The following table presents certain information relating to the Twelve Oaks Mall Whole Loan:
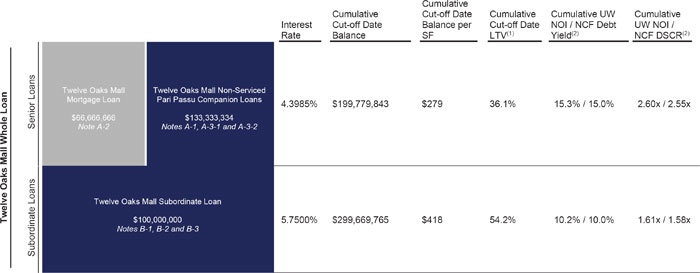
| (1) | Based on the appraised value of $552,900,000 as of December 14, 2017. |
| (2) | Based on the UW NOI of $30,594,826 and the UW NCF of $30,011,109. |
The Borrower and the Sponsor. The borrower is TVO Mall Owner LLC, a Delaware limited liability company and single purpose entity with two independent directors (the “Twelve Oaks Mall Borrower”). Legal counsel to the Twelve Oaks Mall Borrower delivered a non-consolidation opinion in connection with the origination of the Twelve Oaks Mall Whole Loan. The non-recourse carveout guarantor under the Twelve Oaks Mall Whole Loan is The Taubman Realty Group Limited Partnership, an indirect owner of the Twelve Oaks Mall Borrower.
Taubman Centers, Inc. (NYSE: TCO “Taubman”) is a Michigan corporation (incorporated in 1973) that operates as a self-administered and self-managed real estate investment trust. The Taubman Realty Group Limited Partnership (“TRG”) is a majority-owned partnership subsidiary of Taubman that owns direct or indirect interests in all of Taubman’s real estate properties. Taubman owns, leases, acquires, disposes of, develops, expands, and manages shopping centers and interests in shopping centers. As of March 2018, Taubman owned, managed and/or leased 27 regional, super-regional and outlet shopping centers in the United States and Asia.
The Property.The Twelve Oaks Mall Property comprises 716,771 SF of a 1,519,224 SF super regional mall located in Novi, Michigan (the “Twelve Oaks Mall”). The Twelve Oaks Mall Property was constructed in 1977 and renovated in 2007. The Twelve Oaks Mall is anchored by Nordstrom (pursuant to a ground lease), Macy’s, JCPenney, Sears and Lord & Taylor (of the five anchors, only Nordstrom serves as collateral for the Twelve Oaks Mall Whole Loan). Additional tenants at the Twelve Oaks Mall Property include Apple, Tumi, H&M, Soma, Banana Republic, lululemon athletica, Club Monaco, Hollister, Gap and Michael Kors. TRG has been the indirect owner of the Twelve Oaks Mall Property since it was constructed in 1977. The Twelve Oaks Mall Property underwent an expansion and renovation of approximately 322,000 SF in 2007 at a reported cost of approximately $63 million that included adding Nordstrom as a fifth anchor.
As of February 1, 2018, the Twelve Oaks Mall Property was 91.9% occupied by 163 tenants, excluding the four non-collateral anchor stores; and including non-collateral anchors, the overall Twelve Oaks Mall was 96.2% occupied. As of December 31, 2017, the comparable sales and occupancy cost for inline tenants (less than 10,000 SF (excluding Apple)) were approximately $534 per SF and 16.3%, respectively, while including Apple, the comparable sales and occupancy cost for inline tenants (less than 10,000 SF) were approximately $654 per SF and 13.4%, respectively.
The following table presents a summary of historical comparable in-line sales and occupancy costs:
Comparable In-line Tenant Sales PSF(1) | Comparable In-line Tenant Occupancy Cost(1) | ||||
| Year | w/ Apple | w/o Apple | w/ Apple | w/o Apple | |
| 2014 | $492 | $492 | 18.2% | 18.2% | |
| 2015 | $594 | $504 | 14.6% | 17.2% | |
| 2016 | $608 | $508 | 14.0% | 16.8% | |
| 2017 | $654 | $534 | 13.4% | 16.3% | |
| (1) | Comparable In-line Tenant Sales PSF and Comparable In-line Tenant Occupancy Cost reflect comparable in-line tenants that are less than 10,000 SF with at least 12 months of sales data. Sales PSF are as of December 31 unless otherwise indicated and excludes temporary tenants. |
This is not a research report and was not prepared by any Underwriter’s research department. Please see additional important information and qualifications at the end of this Term Sheet. |
| T-30 |
| BANK 2018-BNK11 | Twelve Oaks Mall |
The following table presents certain information relating to the anchors and junior anchors. Certain tenants may have co-tenancy provisions permitting the early termination of their leases based on sales performance and/or occupancy at the Twelve Oaks Mall Property:
| Tenant Summary | |||||||||
| Tenant Name | Credit Rating (Fitch/Moody’s/S&P)(1) | Tenant GLA | % of Total GLA | Total Rent(2) | Total Rent $ PSF(2) | Sales (12/31/2017TTM) | Occ. Cost %(3) | Lease Expiration | |
| $ | PSF | ||||||||
| Anchors | |||||||||
| Macy's (non-collateral) | BBB/Baa3/BBB- | 300,212 | 19.8% | $315,223 | $1.05 | N/A | N/A | N/A | N/A |
| Sears, Roebuck & Company (non-collateral) | C/Ca/CC | 228,429 | 15.0% | $6,000 | $0.03 | N/A | N/A | N/A | N/A |
| J.C. Penney (non-collateral) | B+/B1/B+ | 148,812 | 9.8% | $170,294 | $1.14 | N/A | N/A | N/A | N/A |
| Lord & Taylor (non-collateral) | NR/B3/B | 125,000 | 8.2% | $127,680 | $1.02 | N/A | N/A | N/A | N/A |
| Nordstrom (Ground Lease)(4) | BBB+/Baa1/BBB+ | 167,000 | 11.0% | $20,000 | $0.12 | N/A | N/A | N/A | 2/28/2023(5) |
| Total Anchors | 969,453 | 63.8% | |||||||
| Junior Anchors | |||||||||
| H&M(6) | NR/NR/NR | 24,440 | 1.6% | $725,000 | $29.66 | $2,565,364 | $280 | 18.6% | 1/31/2029(7) |
| Forever 21 | NR/NR/NR | 22,996 | 1.5% | $1,476,160 | $64.19 | $5,015,144 | $218 | 29.4% | 1/31/2025 |
| Victoria’s Secret | NR/NR/NR | 14,798 | 1.0% | $1,221,544 | $82.55 | $9,675,861 | $654 | 12.6% | 1/31/2025 |
| Pottery Barn | NR/NR/NR | 10,299 | 0.7% | $206,816 | $20.08 | $3,752,693 | $364 | 5.5% | 1/31/2020 |
| Total Junior Anchors | 72,533 | 4.8% | |||||||
| Occupied In-line(8) | 418,045 | 27.5% | $30,486,407 | $72.93 | |||||
| Occupied Kiosk | 747 | 0.0% | $223,433 | $299.11 | |||||
| Occupied Other | 50 | 0.0% | $43,200 | $864.00 | |||||
| Vacant | 58,396 | 3.8% | $0 | $0.00 | |||||
| Total Property Collateral SF | 716,771 | 47.2% | |||||||
| Total SF | 1,519,224 | 100.0% | |||||||
| (1) | Certain ratings are those of the parent company whether or not the parent company guarantees the lease. |
| (2) | Total Rent and Total Rent $ PSF represent the annual underwritten base rent plus underwritten operating expense reimbursements. |
| (3) | Occupancy cost shown is based on annual underwritten base rent plus operating expense reimbursements divided by 2017 sales. |
| (4) | Nordstrom’s lease is a ground lease with a base rental rate of $1.00 per year. Nordstrom prepaid its ground rent for its entire lease term. |
| (5) | Nordstrom has eight, 10-year extension options with 12-months’ notice at a base rental rate equal to $1.00 per year. |
| (6) | H&M (24,440 SF) has executed a lease to relocate to a new space at the Twelve Oaks Mall Property and is anticipated to take occupancy and begin paying rent for the new space in November 2018. Tenant Sales $ PSF and Occupancy Cost is based on the tenant’s current space (9,171 SF). All other information above is based on the new lease. H&M has the right to terminate its lease if the borrower does not deliver the new suite by March 2019. In addition, H&M has the right to terminate its lease effective as of the last day of the fifth lease year (ending December 2023) if gross sales during the fourth lease year do not exceed $6,500,000. |
| (7) | H&M has five, two-year extension options with 270-days notice. |
| (8) | Occupied In-Line Total Rent includes one tenant Bachrach (4,494 SF), which has filed for bankruptcy and is currently in occupancy. There can be no assurance that Bachrach will remain open or pay rent going forward. |
This is not a research report and was not prepared by any Underwriter’s research department. Please see additional important information and qualifications at the end of this Term Sheet. |
| T-31 |
| BANK 2018-BNK11 | Twelve Oaks Mall |
The following table presents certain information relating to the major tenants (of which, certain tenants may have co-tenancy provisions) at the Twelve Oaks Mall Property based on underwritten base rent:
| Ten Largest Tenants Based on Underwritten Base Rent | ||||||||||
| Tenant Name | Credit Rating (Fitch/Moody’s/S&P)(1) | Tenant GLA | % of Owned GLA | UW Base Rent | % of Total UW Base Rent | UW Base Rent $ per SF | Tenant Sales $ per SF | Occupancy Cost(2) | Lease Expiration | Renewal / Extension Options |
| Forever 21 | NR / NR / NR | 22,996 | 3.2% | $1,476,160 | 6.3% | $64.19 | $218 | 29.4% | 1/31/2025 | N/A |
| Victoria’s Secret | NR / NR / NR | 14,798 | 2.1% | $887,880 | 3.8% | $60.00 | $654 | 12.6% | 1/31/2025 | N/A |
| H&M(3) | NR / NR / NR | 24,440 | 3.4% | $725,000 | 3.1% | $29.66 | $280 | 18.6% | 1/31/2029 | 5, 2-year options |
| Apple | NR / Aa1 / AA+ | 7,018 | 1.0% | $501,575 | 2.1% | $71.47 | $6,692 | 1.6% | 1/31/2024 | 1, 5-year option |
| Express | NR / NR / NR | 8,000 | 1.1% | $480,000 | 2.0% | $60.00 | $408 | 14.7% | 1/31/2021 | N/A |
| American Eagle | NR / NR / NR | 5,796 | 0.8% | $465,975 | 2.0% | $80.40 | $703 | 16.5% | 1/31/2021 | N/A |
| Sephora(4) | NR / NR / A+ | 5,700 | 0.8% | $458,328 | 2.0% | $80.41 | $1,155 | 10.0% | 1/31/2028 | N/A |
| Hollister Co | NR / NR / BB- | 6,018 | 0.8% | $451,350 | 1.9% | $75.00 | $408 | 23.7% | 4/30/2022 | N/A |
| Abercrombie Fitch | NR / NR / BB- | 9,817 | 1.4% | $441,765 | 1.9% | $45.00 | $199 | 33.6% | 1/31/2021 | N/A |
| lululemon athletica(5) | NR / NR / NR | 5,392 | 0.8% | $412,488 | 1.8% | $76.50 | $2,673 | 3.1% | 1/31/2024 | 1, 5-year option |
| Ten Largest Owned Tenants | 109,975 | 15.3% | $6,300,522 | 26.8% | $57.29 | |||||
| Remaining Owned Tenants | 548,400 | 76.5% | $17,177,403 | 73.2% | $31.32 | |||||
| Vacant Spaces (Owned Space) | 58,396 | 8.1% | $0 | 0.0% | $0.00 | |||||
| Totals / Wtd. Avg. All Owned Tenants | 716,771 | 100.0% | $23,477,925 | 100.0% | $35.66 | |||||
| (1) | Certain ratings are those of the parent company whether or not the parent guarantees the lease. |
| (2) | Occupancy cost shown is based on annual underwritten base rent plus operating expense reimbursements divided by 2017 sales. |
| (3) | H&M has executed a lease to relocate to a new suite (24,440 SF) at the Twelve Oaks Mall Property and is anticipated to take occupancy and begin paying rent for the new suite in November 2018. Tenant Sales $ per SF and Occupancy Cost are based on the SF and total rent for the old suite of 9,171 SF. All other information above is based on the new lease. H&M has the right to terminate its lease if the borrower does not deliver the new suite by March 2019. In addition, H&M has the right to terminate its lease effective as of the last day of the fifth lease year (ending December 2023) if gross sales during the fourth lease year do not exceed $6,500,000. |
| (4) | Sephora is currently in occupancy and has a lease renewal out for signature that has not been executed. There can be no assurance that any such renewal lease will be executed. |
| (5) | lululemon athletica has executed a lease to relocate to a new suite (5,392 SF) at the Twelve Oaks Mall Property and is anticipated to take occupancy and begin paying rent for the new suite in June 2018. Tenant Sales $ per SF and Occupancy Cost based on the SF and total rent for the old suite of 3,467 SF. All other information above is based on the new lease. |
The following table presents certain information relating to the lease rollover schedule at the Twelve Oaks Mall Property:
| Lease Rollover Schedule(1)(2)(3) | ||||||||
| Year | # of Leases Rolling | SF Rolling | % of Total SF Rolling | Cumulative % of Total SF Rolling | Total UW Rent Rolling | UW Rent PSF Rolling | % of Total Rent Rolling | Cumulative % of Total Rent Rolling |
| MTM | 2 | 645 | 0.1% | 0.1% | $132,500 | $205.43 | 0.6% | 0.6% |
| 2018 | 16 | 48,525 | 6.8% | 6.9% | $120,932 | $2.49 | 0.5% | 1.1% |
| 2019 | 20 | 45,952 | 6.4% | 13.3% | $1,421,451 | $30.93 | 6.1% | 7.1% |
| 2020 | 28 | 68,621 | 9.6% | 22.8% | $2,995,226 | $43.65 | 12.8% | 19.9% |
| 2021 | 21 | 68,686 | 9.6% | 32.4% | $3,185,639 | $46.38 | 13.6% | 33.5% |
| 2022(4) | 19 | 48,335 | 6.7% | 39.2% | $3,048,766 | $63.08 | 13.0% | 46.4% |
| 2023 | 13 | 200,012 | 27.9% | 67.1% | $2,099,433 | $10.50 | 8.9% | 55.4% |
| 2024(5) | 9 | 37,022 | 5.2% | 72.2% | $2,193,775 | $59.26 | 9.3% | 64.7% |
| 2025 | 12 | 67,267 | 9.4% | 81.6% | $4,260,592 | $63.34 | 18.1% | 82.9% |
| 2026 | 7 | 10,866 | 1.5% | 83.1% | $754,087 | $69.40 | 3.2% | 86.1% |
| 2027 | 10 | 20,500 | 2.9% | 86.0% | $1,363,232 | $66.50 | 5.8% | 91.9% |
| 2028(6) | 4 | 9,079 | 1.3% | 87.3% | $798,168 | $87.91 | 3.4% | 95.3% |
| 2029 & Beyond(7) | 2 | 32,865 | 4.6% | 91.9% | $1,104,125 | $33.60 | 4.7% | 100.0% |
| Vacant | 0 | 58,396 | 8.1% | 100.0% | $0 | $0.00 | 0.0% | 100.0% |
| Total / Wtd. Avg.(8) | 163 | 716,771 | 100.0% | $23,477,925 | $35.66 | 100.0% | ||
| (1) | Based on the underwritten rent roll. Calculated based on approximate square footage occupied by each Owned Tenant. |
| (2) | Certain tenants may have lease termination options that are exercisable prior to the originally stated expiration date of the subject lease and that are not considered in the lease rollover schedule. |
| (3) | Seven tenants totaling 14,673 SF (2.0% of NRA) are currently in occupancy at the Twelve Oaks Mall Property and have lease renewals out for signature that have not been executed. The lease expiration dates reflected in in the Lease Rollover Schedule assume that these lease renewals have been executed. There can be no assurance that these lease renewals will be executed. These seven tenants include Sephora (5,700 SF, 0.8% of NRA), J Jill (4,075, 0.6% of NRA), Journeys (2,191 SF, 0.3% of NRA), Journeys Kidz (1,108 SF, 0.2% of NRA), GNC Live Well (954 SF, 0.1% of NRA), SGH Sunglass Hut (581 SF, 0.1% of NRA) and 3D Innovations (64 SF, 0.0% of NRA). |
| (4) | Includes one tenant Bachrach (4,494 SF, 0.6% of NRA), which has filed for bankruptcy and is currently in occupancy. There can be no assurance that Bachrach will remain open. |
| (5) | lululemon athletica currently occupies a 3,467 SF space (0.5% of NRA), has executed a lease to relocate to a 5,392 SF space (0.8% of NRA) and is expected to take occupancy and begin paying rent on its new space in June 2018. The information shown above reflects the tenant’s new lease and space. |
| (6) | Pinkberry (718 SF, 0.1% of NRA) has executed a lease but is not yet in occupancy or paying rent. The tenant is expected to take occupancy and begin paying rent in March 2018. |
| (7) | H&M currently occupies a 9,171 SF space (1.3% of NRA), has executed a lease to relocate to a 24,440 SF space (3.4% of NRA) and is expected to take occupancy and begin paying rent on its new space in November 2018. The information shown above reflects the tenant’s new lease and space. |
| (8) | Weighted Average UW Rent PSF Rolling excludes vacant space. |
This is not a research report and was not prepared by any Underwriter’s research department. Please see additional important information and qualifications at the end of this Term Sheet. |
| T-32 |
| BANK 2018-BNK11 | Twelve Oaks Mall |
The Market. According to the appraisal, the Twelve Oaks Mall Property is a super regional mall located in the Detroit-Warren-Livonia and Ann Arbor metropolitan statistical area. The Twelve Oaks Mall Property is located at the intersection of Twelve Mile Road and Novi Road and is less than one mile from Interstate 96 and approximately 25 miles northwest of the Detroit central business district. As of the fourth quarter of 2017, the total estimated population within a three- and five-mile radius of the Twelve Oaks Mall Property is 54,918 and 155,524 respectively. The average household income within a three- and five-mile radius of the Twelve Oaks Mall Property is approximately $116,114 and $115,649, respectively. Fortune 500 companies located in the Southeast Michigan region include Ally, Autoliv, BorgWarner, DTE Energy, Ford Motor Company, General Motors and Kelly Services, and over 350,000 daytime employees are within 10 miles of the Twelve Oaks Mall Property. In addition, Michigan State University, Eastern Michigan University and the University of Michigan are all within a 45-minute drive of the Twelve Oaks Mall Property, and have a combined student population of approximately 116,000.
According to the appraisal, the Twelve Oaks Mall Property is located within the South Oakland submarket of the Detroit Retail market. As of the fourth quarter of 2017, the Detroit Retail market reported a total inventory of approximately 34.4 million SF with a 10.9% vacancy rate. For the same period, the South Oakland Submarket reported a total inventory of approximately 7.2 million SF with a 6.7% vacancy rate. The South Oakland submarket exhibited the lowest vacancy of the five submarkets within the Detroit Retail market. The appraiser identified a competitive set comprising five super regional malls located within 35 miles of the Twelve Oaks Mall Property, which exhibited an average occupancy rate of approximately 92.2%. The appraiser concluded to a market rent for the in-line space at the Twelve Oaks Mall Property of $49.98 per square foot.
The following table presents certain information relating to the primary competition for the Twelve Oaks Mall Property:
| Competitive Property Summary | ||||||||
| Property Name | Center Type | Proximity | Total GLA | Year Built | Year Renovated | Anchor Tenants | Occupancy | In-line Sales PSF(1) |
| Twelve Oaks Mall | Super Regional | N/A | 1,519,224(2) | 1977 | 2007 | Macy’s, Sears, JCPenney, Lord & Taylor and Nordstrom | 96.2%(2) | $654 |
| The Somerset Collection | Super Regional | 20 miles | 1,790,000 | 1968 | 1992 | Macy’s, Neiman Marcus, Nordstrom and Saks Fifth Avenue | 98.0% | $820 |
| Westland Shopping Center | Super Regional | 16 miles | 1,055,000 | 1965 | 2000/2004 | JCPenney, Kohl’s, Sears and Macy’s (vacant) | 90.0% | $400 |
| Fairlane Town Center | Super Regional | 25 miles | 1,850,000 | 1976 | 2016 | JCPenney, Macy’s, Sears and AMC Theatres | 88.0% | $425 |
| Southland Center | Super Regional | 30 miles | 925,000 | 1970 | 2000 | JCPenney, Macy’s and Cinemark Theatres | 90.0% | $400 |
| Briarwood Mall | Super Regional | 35 miles | 1,040,000 | 1973 | 2013 | JCPenney, Macy’s, Sears and Von Maur | 95.0% | $550 |
Source: Appraisal
| (1) | Represents sales for comparable in-line tenants for most recent period from appraisal, or for the Twelve Oaks Mall Property, reported by the tenants to the Twelve Oaks Mall Borrower and not independently verified. |
| (2) | The Total GLA and Occupancy shown represent both collateral and non-collateral portions of the Twelve Oaks Mall. The collateral for the Twelve Oaks Mall Whole Loan comprises 716,771 SF and was 91.9% occupied as of February 1, 2018. |
This is not a research report and was not prepared by any Underwriter’s research department. Please see additional important information and qualifications at the end of this Term Sheet. |
| T-33 |
| BANK 2018-BNK11 | Twelve Oaks Mall |
Operating History and Underwritten Net Cash Flow.The following table presents certain information relating to the historical operating performance and Underwritten Net Cash Flow at the Twelve Oaks Mall Property:
| Cash Flow Analysis | ||||||||||
| 2015 | 2016 | 11/30/2017 TTM | UW(1)(2)(3) | UW PSF | ||||||
| Base Rent | $25,272,604 | $25,599,940 | $24,380,484 | $23,477,925 | $32.76 | |||||
| Overage / Percentage Rent | $1,008,401 | $770,060 | $785,905 | $519,807 | $0.73 | |||||
| Kiosks / Temporary / Specialty | $2,999,058 | $3,135,407 | $2,628,241 | $2,628,241 | $3.67 | |||||
| Total Recoveries | $17,492,057 | $17,512,986 | $16,920,527 | $16,245,303 | $22.66 | |||||
| Mark to Market Rental Adjustment | $0 | $0 | $0 | ($1,947,875) | ($2.72) | |||||
| Market Revenue from Vacant Units | $0 | $0 | $0 | $4,724,224 | $6.59 | |||||
| Other Income | $2,173,439 | $2,451,682 | $2,380,662 | $1,975,791 | $2.76 | |||||
| Less Vacancy & Credit Loss | $0 | $0 | $0 | ($4,724,224)(4) | ($6.59) | |||||
| Effective Gross Income | $48,945,558 | $49,470,075 | $47,095,819 | $42,899,192 | $59.85 | |||||
| Total Operating Expenses | $13,248,393 | $13,200,966 | $12,959,706 | $12,304,366 | $17.17 | |||||
| Net Operating Income | $35,697,165 | $36,269,109 | $34,136,114 | $30,594,826 | $42.68 | |||||
| Replacement Reserves | $0 | $0 | $0 | $137,443 | $0.19 | |||||
| Tenant Improvements | $0 | $0 | $0 | $223,137 | $0.31 | |||||
| Leasing Commissions | $0 | $0 | $0 | $223,137 | $0.31 | |||||
| Net Cash Flow | $35,697,165 | $36,269,109 | $34,136,114 | $30,011,109 | $41.87 | |||||
| Occupancy%(5) | 94.6% | 94.6% | 92.9% | 90.1%(4) | ||||||
| NOI DSCR(6) | 3.04x | 3.09x | 2.90x | 2.60x | ||||||
| NCF DSCR(6) | 3.04x | 3.09x | 2.90x | 2.55x | ||||||
| NOI Debt Yield(6) | 17.9% | 18.2% | 17.1% | 15.3% | ||||||
| NCF Debt Yield(6) | 17.9% | 18.2% | 17.1% | 15.0% | ||||||
| (1) | Underwritten base rent includes contractual rent steps through February 28, 2019. |
| (2) | Underwritten base rent includes 16 tenants that are paying reduced rent. The base rent in the leases is $2,349,960 for these 16 tenants, and the UW base rent for these tenants is $1,180,463. Underwritten base rent also includes one tenant Bachrach (4,494 SF, 0.6% of NRA) that has filed for bankruptcy but is currently in occupancy. There can be no assurance that Bachrach will remain open or pay rent going forward. |
| (3) | Underwritten base rent includes two tenants that are currently in occupancy and paying rent, have executed leases to relocate to new spaces, but are not yet in occupancy or paying rent on such new spaces (and as to which occupancy and underwritten rent is based on the new spaces): H&M currently occupies a 9,171 SF space (1.3% of NRA), has executed a lease to relocate to a 24,440 SF space (3.4% of NRA) and is anticipated to take occupancy and begin paying rent on the new space in November 2018; and lululemon athletica currently occupies a 3,467 SF space (0.5% of NRA), has executed a lease to relocate to a 5,392 SF space (0.8% of NRA) and is anticipated to take occupancy and begin paying rent on the new space in June 2018. In addition, underwritten base rent includes Pinkberry (718 SF, 0.1% of NRA), which has executed a new lease, is not yet in occupancy or paying rent and is expected to take occupancy and begin paying rent in March 2018. In addition, underwritten base rent includes Bachrach (4,494 SF, 0.6% of NRA) that has filed for bankruptcy but is currently in-place. In addition, underwritten base rent includes seven tenants totaling 14,673 SF (2.0% of NRA) that are currently in occupancy at the Twelve Oaks Mall Property and have lease renewals out for signature that have not been executed. These seven tenants include Sephora (5,700 SF, 0.8% of NRA), J Jill (4,075, 0.6% of NRA), Journeys (2,191 SF, 0.3% of NRA), Journeys Kidz (1,108 SF, 0.2% of NRA), GNC Live Well (954 SF, 0.1% of NRA), SGH Sunglass Hut (581 SF, 0.1% of NRA) and 3D Innovations (64 SF, 0.0% of NRA). The underwritten base rent for these seven tenants is based on the rental rate currently being paid by each respective tenant and not on the prospective rent of the leases out for signature. We cannot assure you that these tenants will take occupancy, execute the renewals, begin paying rent or continue paying rent as anticipated or at all. |
| (4) | The underwritten economic vacancy is 9.9%. The Twelve Oaks Mall Property was 91.9% leased as of February 1, 2018. |
| (5) | The occupancy rates shown represent the portion of the Twelve Oaks Mall that serves as collateral for the Twelve Oaks Mall Whole Loan. The Most Recent Occupancy of the Twelve Oaks Mall, including the non-collateral tenants Macy’s (300,212 SF), Sears, Roebuck & Company (228,429 SF), J.C. Penney (148,812 SF) and Lord & Taylor (125,000 SF), was 96.2% as of February 1, 2018. |
| (6) | Debt service coverage ratios and debt yields are based on the Twelve Oaks Mall Senior Loan, and exclude the Twelve Oaks Mall Subordinate Loan. |
Escrows and Reserves. The Twelve Oaks Mall Whole Loan documents provide for upfront reserves in the amount of $4,627,403 for outstanding tenant obligations related to eight tenants.
On each due date during a Twelve Oaks Mall Trigger Period (as defined below) or an event of default under the Twelve Oaks Mall Whole Loan, the Twelve Oaks Mall Borrower is required to fund certain reserve accounts including (i) a tax reserve in an amount equal to one-twelfth of the amount that the lender reasonably estimates will be necessary to pay taxes over the then succeeding 12-month period; (ii) an insurance reserve in an amount equal to one-twelfth of the amount that the lender reasonably estimates will be necessary to pay insurance premiums over the then succeeding 12-month period (unless no event of default has occurred and is continuing and the Twelve Oaks Mall Borrower has delivered evidence to the lender that the insurance required is maintained under an acceptable blanket insurance policy for which premiums have been paid in full); (iii) a tenant improvement and leasing commissions (“TI/LC”) reserve in an amount equal to $68,625, subject to a cap of $1,647,000 (excluding any termination fees deposited); and (iv) a capital expenditure reserve in an amount equal to $11,438, subject to a cap of $274,500. During a Twelve Oaks Mall Trigger Period or an event of default, the Twelve Oaks Mall Borrower is required to deposit all termination fees into the TI/LC reserve account, provided that during a Twelve Oaks Mall Trigger Period that is continuing solely due to a Twelve Oaks Mall Tier 1 Trigger Period (as defined below), the Twelve Oaks Mall Borrower may retain termination fees associated with any one lease that are less than $375,000. In lieu of such escrow amounts, the Twelve Oaks Mall Borrower may deposit with the lender a letter of credit in the maximum amount required for the applicable reserve above.
In addition, on each due date during the continuance of a Twelve Oaks Mall Trigger Period (other than a Twelve Oaks Mall Tier 1 Trigger Period), the related loan documents require an excess cash reserve as discussed under “—Lockbox and Cash Management” below.
This is not a research report and was not prepared by any Underwriter’s research department. Please see additional important information and qualifications at the end of this Term Sheet. |
| T-34 |
| BANK 2018-BNK11 | Twelve Oaks Mall |
A “Twelve Oaks Mall Trigger Period” will commence upon the earlier of the following:
| (i) | the trailing 12-month net operating income being less than $29,250,000 for two consecutive fiscal quarters (a “Twelve Oaks Mall Tier 1 Trigger Period”); |
| (ii) | the trailing 12-month net operating income being less than $26,000,000 for two consecutive fiscal quarters (a “Twelve Oaks Mall Tier 2 Trigger Period”); or |
| (iii) | the period during which a Twelve Oaks Mall Tier 1 Trigger Period is occurring (but not also a Tier 2 Trigger Period) and any two anchors (other than Sears) have gone dark in more than 20% of its premises for at least 60 consecutive days (excluding restoration, renovation or re-tenanting periods) (a “Dark Anchor Trigger Period”). |
A Twelve Oaks Mall Trigger Period will end upon the occurrence of the following:
| ● | with regard to clause (i), the trailing 12-month net operating income being equal to or greater than $29,250,000 for four consecutive fiscal quarters; and |
| ● | with regard to clause (ii), the trailing 12-month net operating income being equal to or greater than $26,000,000 for four consecutive fiscal quarters. |
Lockbox and Cash Management. The Twelve Oaks Mall Whole Loan is structured with a hard lockbox and springing cash management. The related loan documents require the Twelve Oaks Mall Borrower to direct tenants to pay rent directly to a lender-controlled lockbox account and all cash revenues relating to the Twelve Oaks Mall Property and all other money received by the Twelve Oaks Mall Borrower or the property manager with respect to the Twelve Oaks Mall Property (other than tenant security deposits required to be held in escrow accounts) be deposited into such lockbox account or cash management account within one business day of receipt.
The Twelve Oaks Mall Borrower is permitted to maintain a bank account (the “Kiosk Account”) into which rents from persons who are parties to a license agreement or miscellaneous amounts received by the Twelve Oaks Mall Borrower that are not rents, payments, reimbursements or other amounts paid under any lease may be deposited. Any funds in excess of $150,000 are required to be remitted from the Kiosk Account into a borrower-controlled account. During the continuance of a Twelve Oaks Mall Trigger Period (other than due to a Twelve Oaks Mall Tier 1 Trigger Period) or an event of default under the Twelve Oaks Mall Whole Loan, all amounts contained in the Kiosk Account that exceed $50,000 are required to be remitted to the cash management account.
During the continuance of a Twelve Oaks Mall Trigger Period or event of default under the Twelve Oaks Mall Whole Loan, all funds in the lockbox account are required to be swept into the cash management account on a daily basis and, so long as only a Twelve Oaks Mall Tier 1 Trigger Period is continuing, remitted to the Twelve Oaks Mall Borrower on each due date after payment of the monthly debt service payment and all required reserves. During a Twelve Oaks Mall Trigger Period (other than a Twelve Oaks Mall Tier 1 Trigger Period) under the Twelve Oaks Mall Whole Loan all amounts on deposit in the cash management account after payment of debt service, required reserves (if the lender so elects, with respect to the continuance of an event of default) and operating expenses, are required to be reserved in an excess cash flow reserve account. During the continuance of an event of default under the Twelve Oaks Mall Whole Loan, all amounts on deposit in the cash management account may be applied at lender’s sole discretion. In addition, provided no event of default has occurred and is continuing, the Twelve Oaks Mall Borrower may obtain the lender’s release of excess cash flow trapped during a Dark Anchor Trigger Period (see“Escrows and Reserves” above) for the purposes of exercising its right to purchase non-collateral anchor spaces (see“Release of Property” below).
Additional Secured Indebtedness (not including trade debts).In addition to the Twelve Oaks Mall Mortgage Loan, the Twelve Oaks Mall Property secures the Twelve Oaks Mall Non-ServicedPari Passu Companion Loans and the Twelve Oaks Mall Subordinate Loan. Amounts available to make payments of interest and principal on the Twelve Oaks Mall Whole Loan are generally applied (i)first, to accrued and unpaid interest on the Twelve Oaks Mall Mortgage Loan and Twelve Oaks Mall Non-ServicedPari Passu Companion Loans on apro rataandpari passubasis, (ii)second, to principal on the Twelve Oaks Mall Mortgage Loan and Twelve Oaks Mall Non-ServicedPari Passu Companion Loans on apro rataandpari passubasis until their principal balances have been reduced to zero, (iii)third, to accrued and unpaid interest on the Twelve Oaks Mall Subordinate Loan; and then (iv)fourth, to principal on the Twelve Oaks Mall Subordinate Loan until the principal balance has been reduced to zero. Such priorities and the allocation of collections on the Twelve Oaks Mall Whole Loan are set forth in an agreement between note holders governing the promissory notes comprising the Twelve Oaks Mall Whole Loan. See “Description of the Mortgage Pool—The Whole Loans— The Twelve Oaks-MI Passu-AB Whole Loan” in the Preliminary Prospectus.
Mezzanine Loan and Preferred Equity.Not Permitted
Release of Property. The loan documents permit the Twelve Oaks Mall Borrower to purchase any of the non-collateral anchor pads (Macy’s, Lord & Taylor, JC Penney and Sears) subject to certain conditions outlined in the Twelve Oaks Mall Whole Loan documents. Following the acquisition of an anchor pad, provided no event of default has occurred and is continuing, the Twelve Oaks Mall Borrower has the right to the free release of such anchor pad together with any or all of certain unimproved portions of the Twelve Oaks Mall Property adjacent to such anchor pad (such adjacent parcels, the “Anchor Pad Release Parcels”) to either a permitted joint venture or an unaffiliated third party, subject to certain conditions outlined in the Twelve Oaks Mall Whole Loan documents, including among other things (i) the delivery of a REMIC opinion and (ii) the Twelve Oaks Mall Borrower may not convey more than 10% in the aggregate of the total acreage of all the Anchor Pad Release Parcels to unaffiliated third parties (but such limitation does not apply to a permitted joint venture). In addition, provided no event of default has occurred and is continuing, the Twelve Oaks Mall Borrower is permitted to obtain the release of a 24.8-acre unimproved parcel of land subject to the satisfaction of certain conditions outlined in the Twelve Oaks Mall Whole Loan documents, including among other things (a) such release may not reasonably be expected to have a material adverse effect and (b) delivery of a REMIC opinion.
Terrorism Insurance.The Twelve Oaks Mall Whole Loan documents require the Twelve Oaks Mall Borrower to maintain terrorism insurance in an amount equal to the full replacement cost of the Twelve Oaks Mall Property, as well as 18 months of rental loss and/or business interruption coverage, together with a 12-month extended period of indemnity following restoration. If TRIPRA is no longer in effect, then the Twelve Oaks Mall Borrower’s requirement will be capped at insurance premiums equal to two times the amount of the insurance premium payable in respect of the property and business interruption/rental loss insurance required under the related loan documents (excluding the cost of terrorism and earthquake components of such premiums). See “Risk Factors—Risks Related to the Mortgage Loans-Terrorism Insurance May Not Be Available for All Mortgaged Properties” in the Preliminary Prospectus.
This is not a research report and was not prepared by any Underwriter’s research department. Please see additional important information and qualifications at the end of this Term Sheet. |
| T-35 |
| BANK 2018-BNK11 | Extra Space – TIAA Self Storage Portfolio |
Mortgage Loan No. 2 – Extra Space - TIAA Self Storage Portfolio
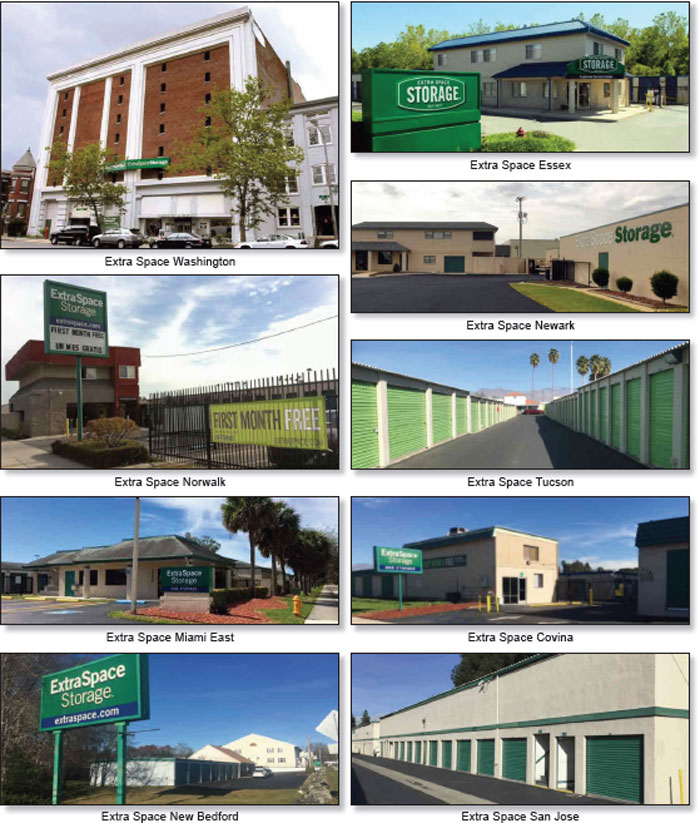
This is not a research report and was not prepared by any Underwriter’s research department. Please see additional important information and qualifications at the end of this Term Sheet. |
| T-36 |
| BANK 2018-BNK11 | Extra Space – TIAA Self Storage Portfolio |
Mortgage Loan No. 2 – Extra Space - TIAA Self Storage Portfolio
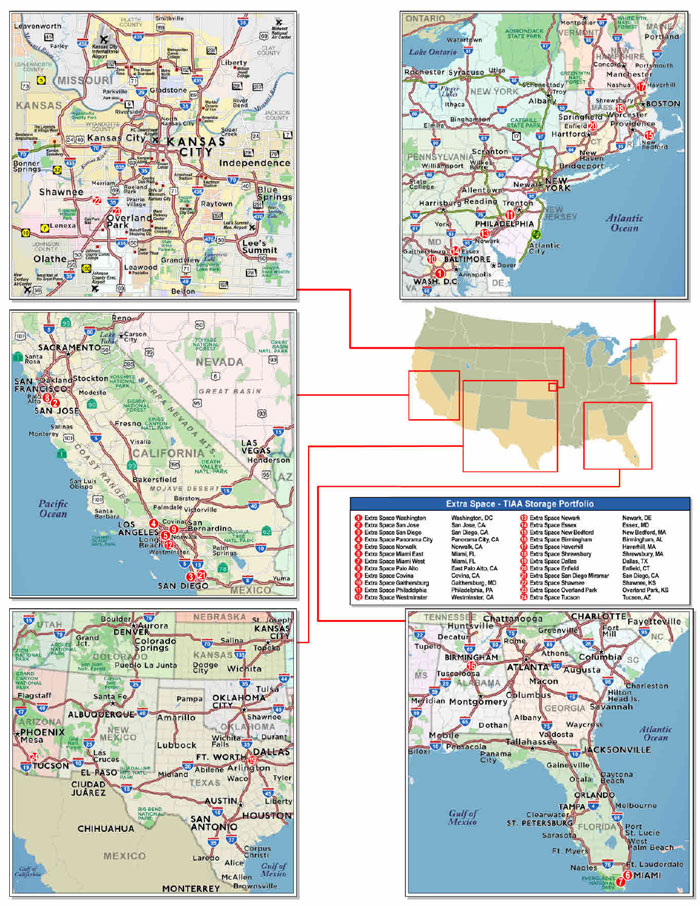
This is not a research report and was not prepared by any Underwriter’s research department. Please see additional important information and qualifications at the end of this Term Sheet. |
| T-37 |
| BANK 2018-BNK11 | Extra Space – TIAA Self Storage Portfolio |
| Mortgage Loan No. 2 – Extra Space - TIAA Self Storage Portfolio |
| Mortgage Loan Information | Property Information | ||||||
| Mortgage Loan Seller: | BANA | Single Asset/Portfolio: | Portfolio | ||||
| Original Balance(1): | $66,000,000 | Location: | Various | ||||
| Cut-off Date Balance(1): | $66,000,000 | General Property Type: | Self Storage | ||||
| % of Initial Pool Balance: | 9.6% | Detailed Property Type: | Self Storage | ||||
| Loan Purpose: | Refinance | Title Vesting: | Fee | ||||
| Sponsors: | Extra Space Storage Inc.; TH Real Estate | Year Built/Renovated: | Various/Various | ||||
| Mortgage Rate: | 4.5325% | Size: | 1,614,702 SF | ||||
| Note Date: | 2/2/2018 | Cut-off Date Balance per SF(1): | $142 | ||||
| First Payment Date: | 4/1/2018 | Maturity Date Balance per SF(1): | $142 | ||||
| Maturity Date: | 3/1/2028 | Property Manager: | Extra Space Management, Inc. | ||||
| Original Term to Maturity: | 120 months | (borrower-related) | |||||
| Original Amortization Term: | 0 months | Underwriting and Financial Information | |||||
| IO Period: | 120 months | UW NOI: | $20,956,607 | ||||
| Seasoning: | 1 month | UW NOI Debt Yield(1): | 9.2% | ||||
| Prepayment Provisions(2): | LO (25); DEF (88); O (7) | UW NOI Debt Yield at Maturity(1): | 9.2% | ||||
| Lockbox/Cash Mgmt Status: | Springing/Springing | UW NCF DSCR(1): | 1.97x | ||||
| Additional Debt Type(1)(3): | Pari Passu | Most Recent NOI: | $20,371,617 (12/31/2017) | ||||
| Additional Debt Balance(1)(3): | $163,000,000 | 2nd Most Recent NOI: | $19,178,286 (12/31/2016) | ||||
| Future Debt Permitted (Type): | No (N/A) | 3rd Most Recent NOI: | $17,582,312 (12/31/2015) | ||||
| Reserves(4) | Most Recent Occupancy: | 92.2% (12/31/2017) | |||||
| Type | Initial | Monthly | Cap | 2nd Most Recent Occupancy: | 92.9% (12/31/2016) | ||
| RE Tax: | $0 | Springing | N/A | 3rd Most Recent Occupancy: | 92.6% (12/31/2015) | ||
| Insurance: | $915 | $457 | N/A | Appraised Value (as of)(5): | $394,160,000 (Various) | ||
| Recurring Replacements: | $0 | $0 | N/A | Cut-off Date LTV Ratio(1)(5): | 58.1% | ||
| Maturity Date LTV Ratio(1)(5): | 58.1% | ||||||
| Sources and Uses | ||||||
| Sources | Proceeds | % of Total | Uses | Proceeds | % of Total | |
| Loan Amount(1): | $229,000,000 | 100.0% | Return of Equity: | $140,845,793 | 61.5% | |
| Loan Payoff: | $83,536,796 | 36.5% | ||||
| Closing Costs: | $4,616,496 | 2.0% | ||||
| Reserves: | $915 | 0.0% | ||||
| Total Sources: | $229,000,000 | 100.0% | Total Uses: | $229,000,000 | 100.0% | |
| (1) | The Extra Space - TIAA Self Storage Portfolio Mortgage Loan (as defined below) is part of the Extra Space - TIAA Self Storage Portfolio Whole Loan (as defined below), which is comprised of threepari passu promissory notes with an aggregate original principal balance of $229,000,000. The Cut-off Date Balance per SF, Maturity Date Balance per SF, UW NOI Debt Yield, UW NOI Debt Yield at Maturity, UW NCF DSCR, Cut-off Date LTV Ratio and Maturity Date LTV Ratio numbers presented above are based on the aggregate principal balance of the promissory notes comprising the Extra Space - TIAA Self Storage Portfolio Whole Loan. |
| (2) | Defeasance of the Extra Space – TIAA Self Storage Portfolio Whole Loan is permitted any time after the earlier of (i) February 2, 2022, or (ii) two years from the closing date of the securitization that includes the lastpari passupromissory note of the Extra Space – TIAA Self Storage Portfolio Whole Loan to be securitized. The assumed lockout period of 25 payments is based on the closing date of this transaction in April 2018. |
| (3) | See “The Mortgage Loan” and “Additional Secured Indebtedness (not including trade debts)” below for a discussion of additional debt. |
| (4) | See “Escrows and Reserves” below for further discussion of reserve requirements. |
| (5) | Appraised Value represents the “As Is Portfolio” combined appraised value based on individual valuations dated between November 25, 2017 and December 4, 2017, plus a $36,170,000 portfolio premium. The Cut-off Date LTV Ratio and Maturity Date LTV Ratio are calculated based upon the “As Is Portfolio” value of $394,160,000. The Cut-off Date LTV Ratio and Maturity Date LTV Ratio based on the sum of the individual “as-is” appraised values of $357,990,000 are each 64.0%. |
The Mortgage Loan. The second largest mortgage loan (the “Extra Space - TIAA Self Storage Portfolio Mortgage Loan”) is part of a whole loan (the “Extra Space - TIAA Self Storage Portfolio Whole Loan”) evidenced by threepari passupromissory notes in the aggregate original principal amount of $229,000,000, all of which are secured by the fee interest in a 24-property self-storage portfolio located across 11 states and Washington, D.C. totaling 1,614,702 SF (the “Extra Space - TIAA Self Storage Portfolio Properties”). The non-controlling Promissory Note A-2 in the original principal amount of $66,000,000 represents the Extra Space - TIAA Self Storage Portfolio Mortgage Loan and will be included in the BANK 2018-BNK11 securitization trust. A summary of the remaining promissory notes (the “Extra Space - TIAA Self Storage Portfolio Non-Serviced Pari Passu Companion Loans”) is shown in the table below. The Extra Space - TIAA Self Storage Portfolio Whole Loan will be serviced pursuant to the pooling and servicing agreement for the CGCMT 2018-B2 securitization trust. See “Description of the Mortgage Pool—The Whole Loans—The Non-Serviced Pari Passu Whole Loans” and“Pooling and Servicing Agreement—Servicing of the Non-Serviced Mortgage Loans” in the Preliminary Prospectus.
This is not a research report and was not prepared by any Underwriter’s research department. Please see additional important information and qualifications at the end of this Term Sheet. |
| T-38 |
| BANK 2018-BNK11 | Extra Space – TIAA Self Storage Portfolio |
| Extra Space - TIAA Self Storage Portfolio Whole Loan Summary | ||||
Notes | Original Balance | Note Holder(1) | Controlling Interest | |
| A-1 | $105,000,000 | CGCMT 2018-B2 | Yes | |
| A-2 | $66,000,000 | BANK 2018-BNK11 | No | |
| A-3 | $58,000,000 | Bank of America, N.A. | No | |
| Total | $229,000,000 | |||
Proceeds from the Extra Space - TIAA Self Storage Portfolio Whole Loan were primarily used to return equity to the Extra Space - TIAA Self Storage Portfolio Whole Loan sponsors to pay down a portion of the sponsors’ credit facility, fund upfront reserves, and pay closing costs.
The Borrower and the Sponsors. The borrower is Storage Portfolio I LLC (the “Extra Space – TIAA Self Storage Portfolio Borrower”), a single-purpose Delaware limited liability company with two independent directors. The Extra Space – TIAA Self Storage Portfolio Borrower is approximately 66.0% indirectly owned by Teachers Insurance and Annuity Association of America (“TIAA”) for the benefit of The Separate Real Estate Account (“TIAA Real Estate”) and approximately 34.0% indirectly owned by Extra Space Storage Inc. (“Extra Space Storage”). The borrower sponsors are Extra Space Storage and TH Real Estate. TH Real Estate is an affiliate of Nuveen, LLC, an investment management arm of TIAA. As of September 30, 2017, TH Real Estate had approximately $107 billion of assets under management globally.
The non-recourse carveout guarantor for the Extra Space - TIAA Self Storage Portfolio Whole Loan is Extra Space Storage. If a buy/sell event occurs or is anticipated to occur such that TIAA Real Estate becomes the sole indirect owner of the borrower, Teachers REA, LLC has been approved as a replacement guarantor so long as at the time of such replacement it satisfies a minimum net worth of $5 billion and minimum liquidity of $10 million and is acceptable to the lender based on the lender’s underwriting standards, and there has been no material adverse change in its financial conditions or status since the origination of the Extra Space - TIAA Self Storage Portfolio Whole Loan.
The Properties. The Extra Space - TIAA Self Storage Portfolio Properties consist of 24 Extra Space branded self-storage properties located in 11 states and Washington, D.C. The Extra Space - TIAA Self Storage Portfolio Properties consist of 15,465 traditional storage units (of which 1,100 units (approximately 7.1%) are climate controlled) and 303 parking spaces. The Extra Space - TIAA Self Storage Portfolio Properties range in size from 36,384 SF to 119,335 SF, inclusive of parking square footage, with an average size across the portfolio for traditional storage units of approximately 104 SF. Each of the Extra Space - TIAA Self Storage Portfolio Properties includes perimeter fencing, security cameras, gated entry, on-site managers and on-site leasing offices. The weighted average occupancy of the Extra Space - TIAA Self Storage Portfolio Properties was 92.2% as of December 31, 2017.
The Extra Space - TIAA Self Storage Portfolio Properties have been jointly owned by the Extra Space - TIAA Self Storage Portfolio Whole Loan sponsors since 2004 and since 2012, the sponsors have invested over $5.7 million in capital expenditures to the Extra Space - TIAA Self Storage Portfolio Properties. Under the Extra Space – TIAA Self Storage Portfolio Whole Loan sponsors’ ownership, historical occupancy has increased from 85.9% in 2010 to 92.2% in 2017, averaging 90.2% between 2010 and 2017, and the Extra Space - TIAA Self Storage Portfolio Properties’ effective gross income has grown each year since 2010 by between 2.2% and 6.3% with cumulative growth of 37.0% from 2010 to 2017.
The Extra Space - TIAA Self Storage Portfolio Properties’ revenue is diversely generated from 24 different properties across 17 various metropolitan statistical areas. Only five properties individually represent greater than 5.4% of the portfolio’s underwritten net cash flow. The five largest properties based on allocated Cut-off Date Balance account for approximately 37.6% of underwritten net cash flow while the 10 largest properties based on allocated Cut-off Date Balance account for approximately 61.9% of the portfolio’s underwritten net cash flow.
This is not a research report and was not prepared by any Underwriter’s research department. Please see additional important information and qualifications at the end of this Term Sheet. |
| T-39 |
| BANK 2018-BNK11 | Extra Space – TIAA Self Storage Portfolio |
The following table presents detailed information with respect to each of the Extra Space - TIAA Self Storage Portfolio Properties.
| Extra Space - TIAA Self Storage Portfolio Properties Summary | |||||||||
Property Name City State | Year Built/ Renovated | Total GLA | Total Units | Occupancy As of 12/31/2017 | Cut-off Date Allocated Loan Amount | % of Allocated Loan Amount | Appraised Value | % of Appraised Value | UW NCF |
| Extra Space Washington Washington, D.C. | 1910 / NAP | 104,382 | 1,689 | 92.1% | $30,841,000 | 13.5% | $47,490,000 | 13.3% | $2,752,474 |
| Extra Space San Jose San Jose, CA | 1985, 2016 / NAP | 66,854 | 795 | 89.9% | $14,955,000 | 6.5% | $24,750,000 | 6.9% | $1,355,104 |
| Extra Space San Diego San Diego, CA | 1986 / NAP | 119,335 | 898 | 88.1% | $14,730,000 | 6.4% | $21,760,000 | 6.1% | $1,325,851 |
| Extra Space Panorama City Panorama City, CA | 1987 / NAP | 77,395 | 900 | 92.7% | $12,980,000 | 5.7% | $21,550,000 | 6.0% | $1,182,697 |
| Extra Space Norwalk Norwalk, CA | 1977 / NAP | 79,529 | 893 | 92.8% | $12,885,000 | 5.6% | $22,150,000 | 6.2% | $1,174,461 |
| Extra Space Miami East Miami, FL | 1987 / 2009 | 80,390 | 831 | 91.8% | $12,126,000 | 5.3% | $19,600,000 | 5.5% | $1,111,182 |
| Extra Space Miami West Miami, FL | 1987 / 2009 | 75,564 | 684 | 95.7% | $12,105,000 | 5.3% | $19,000,000 | 5.3% | $1,107,307 |
| Extra Space Palo Alto East Palo Alto, CA | 1989 / NAP | 45,836 | 592 | 92.1% | $10,862,000 | 4.7% | $18,230,000 | 5.1% | $978,172 |
| Extra Space Covina Covina, CA | 1973 / NAP | 74,537 | 729 | 91.9% | $10,639,000 | 4.6% | $17,450,000 | 4.9% | $966,181 |
| Extra Space Gaithersburg Gaithersburg, MD | 1988 / NAP | 74,341 | 642 | 91.5% | $9,687,000 | 4.2% | $14,350,000 | 4.0% | $875,499 |
| Extra Space Philadelphia Philadelphia, PA | 1970, 1988 / NAP | 68,425 | 593 | 93.9% | $9,310,000 | 4.1% | $13,860,000 | 3.9% | $842,713 |
| Extra Space Westminster Westminster, CA | 1988 / NAP | 65,997 | 685 | 94.7% | $9,150,000 | 4.0% | $15,680,000 | 4.4% | $840,721 |
| Extra Space Newark Newark, DE | 1988 / NAP | 64,300 | 519 | 91.1% | $8,193,000 | 3.6% | $12,590,000 | 3.5% | $738,819 |
| Extra Space Essex Essex, MD | 1991 / NAP | 60,425 | 522 | 93.5% | $7,444,000 | 3.3% | $11,340,000 | 3.2% | $679,151 |
| Extra Space New Bedford New Bedford, MA | 1989, 2003 / NAP | 65,350 | 535 | 93.6% | $7,215,000 | 3.2% | $10,300,000 | 2.9% | $654,243 |
| Extra Space Birmingham Birmingham, AL | 1988 / NAP | 73,366 | 604 | 94.8% | $7,195,000 | 3.1% | $9,250,000 | 2.6% | $655,749 |
| Extra Space Haverhill Haverhill, MA | 1989 / NAP | 53,490 | 553 | 86.6% | $6,895,000 | 3.0% | $11,680,000 | 3.3% | $616,849 |
| Extra Space Shrewsbury Shrewsbury, MA | 1982 / NAP | 65,300 | 417 | 92.1% | $6,483,000 | 2.8% | $9,020,000 | 2.5% | $585,168 |
| Extra Space Dallas Dallas, TX | 1973 / NAP | 47,472 | 478 | 90.0% | $5,340,000 | 2.3% | $7,650,000 | 2.1% | $480,768 |
| Extra Space Enfield Enfield, CT | 1982 / NAP | 65,650 | 511 | 93.0% | $4,911,000 | 2.1% | $7,680,000 | 2.1% | $427,883 |
| Extra Space San Diego Miramar San Diego, CA | 1986 / NAP | 36,384 | 455 | 92.3% | $4,819,000 | 2.1% | $7,050,000 | 2.0% | $432,728 |
| Extra Space Shawnee Shawnee, KS | 1987 / NAP | 56,240 | 472 | 95.1% | $3,570,000 | 1.6% | $5,670,000 | 1.6% | $330,987 |
| Extra Space Overland Park Overland Park, KS | 1990 / NAP | 46,890 | 346 | 94.3% | $3,570,000 | 1.6% | $5,620,000 | 1.6% | $324,395 |
| Extra Space Tucson Tucson, AZ | 1984 / NAP | 47,250 | 425 | 91.3% | $3,095,000 | 1.4% | $4,270,000 | 1.2% | $275,296 |
| Total/Wtd. Avg. | 1,614,702 | 15,768 | 92.2% | $229,000,000 | 100.0% | $357,990,000(1) | 100.0% | $20,714,398 | |
| (1) | The sum of the individual “as-is” appraisal values of the Extra Space - TIAA Self Storage Portfolio Properties is $357,990,000. The appraiser also provided an “As-Is Portfolio” value based on individual valuations dated between November 25, 2017 and December 4, 2017 plus a $36,170,000 portfolio premium. |
This is not a research report and was not prepared by any Underwriter’s research department. Please see additional important information and qualifications at the end of this Term Sheet. |
| T-40 |
| BANK 2018-BNK11 | Extra Space – TIAA Self Storage Portfolio |
The following table presents certain information relating to the type of units offered at the Extra Space - TIAA Self Storage Portfolio Properties:
| Unit Summary | ||||||
| Property Name | Total GLA | % GLA | Total Number of Storage Units | Number of Parking Units | Number of Climate Controlled Units | % of Climate Controlled Units |
| Extra Space Washington | 104,382 | 6.5% | 1,689 | 0 | 121 | 7.2% |
| Extra Space San Jose | 66,854 | 4.1% | 791 | 4 | 0 | 0.0% |
| Extra Space San Diego | 119,335 | 7.4% | 877 | 21 | 0 | 0.0% |
| Extra Space Panorama City | 77,395 | 4.8% | 896 | 4 | 0 | 0.0% |
| Extra Space Norwalk | 79,529 | 4.9% | 871 | 22 | 0 | 0.0% |
| Extra Space Miami East | 80,390 | 5.0% | 789 | 42 | 193 | 24.5% |
| Extra Space Miami West | 75,564 | 4.7% | 653 | 31 | 214 | 32.8% |
| Extra Space Palo Alto | 45,836 | 2.8% | 592 | 0 | 0 | 0.0% |
| Extra Space Covina | 74,537 | 4.6% | 726 | 3 | 0 | 0.0% |
| Extra Space Gaithersburg | 74,341 | 4.6% | 622 | 20 | 0 | 0.0% |
| Extra Space Philadelphia | 68,425 | 4.2% | 586 | 7 | 137 | 23.4% |
| Extra Space Westminster | 65,997 | 4.1% | 681 | 4 | 0 | 0.0% |
| Extra Space Newark | 64,300 | 4.0% | 476 | 43 | 96 | 20.2% |
| Extra Space Essex | 60,425 | 3.7% | 502 | 20 | 155 | 30.9% |
| Extra Space New Bedford | 65,350 | 4.0% | 514 | 21 | 0 | 0.0% |
| Extra Space Birmingham | 73,366 | 4.5% | 592 | 12 | 13 | 2.2% |
| Extra Space Haverhill | 53,490 | 3.3% | 553 | 0 | 119 | 21.5% |
| Extra Space Shrewsbury | 65,300 | 4.0% | 414 | 3 | 0 | 0.0% |
| Extra Space Dallas | 47,472 | 2.9% | 474 | 4 | 0 | 0.0% |
| Extra Space Enfield | 65,650 | 4.1% | 498 | 13 | 0 | 0.0% |
| Extra Space San Diego Miramar | 36,384 | 2.3% | 455 | 0 | 0 | 0.0% |
| Extra Space Shawnee | 56,240 | 3.5% | 472 | 0 | 0 | 0.0% |
| Extra Space Overland Park | 46,890 | 2.9% | 317 | 29 | 52 | 16.4% |
| Extra Space Tucson | 47,250 | 2.9% | 425 | 0 | 0 | 0.0% |
| Total / Wtd. Avg. | 1,614,702 | 100.0% | 15,465 | 303 | 1,100 | 7.1% |
This is not a research report and was not prepared by any Underwriter’s research department. Please see additional important information and qualifications at the end of this Term Sheet. |
| T-41 |
| BANK 2018-BNK11 | Extra Space – TIAA Self Storage Portfolio |
The following table presents certain information relating to the historical occupancy at the Extra Space - TIAA Self Storage Portfolio Properties:
| Historical Occupancy(1) | ||||||||||
| Property Name | 2010 | 2011 | 2012 | 2013 | 2014 | 2015 | 2016 | 2017 | Average | |
| Extra Space Washington | 94.0% | 91.9% | 91.4% | 92.4% | 92.5% | 91.4% | 91.6% | 92.1% | 92.2% | |
| Extra Space San Jose | 89.5% | 88.9% | 92.0% | 92.8% | 92.9% | 95.7% | 94.3% | 89.9% | 92.0% | |
| Extra Space San Diego | 88.9% | 88.8% | 86.8% | 87.1% | 89.9% | 93.9% | 95.9% | 88.1% | 89.9% | |
| Extra Space Panorama City | 85.3% | 87.8% | 92.2% | 93.6% | 93.7% | 94.8% | 89.8% | 92.7% | 91.2% | |
| Extra Space Norwalk | 79.4% | 83.0% | 84.6% | 88.8% | 88.2% | 92.9% | 96.6% | 92.8% | 88.3% | |
| Extra Space Miami East | 85.4% | 81.2% | 88.7% | 91.3% | 92.1% | 93.7% | 92.9% | 91.8% | 89.6% | |
| Extra Space Miami West | 85.7% | 88.0% | 86.5% | 89.6% | 88.7% | 91.5% | 92.4% | 95.7% | 89.8% | |
| Extra Space Palo Alto | 80.0% | 86.2% | 92.7% | 92.3% | 93.7% | 95.2% | 96.3% | 92.1% | 91.1% | |
| Extra Space Covina | 85.5% | 85.5% | 88.7% | 90.4% | 91.8% | 93.7% | 95.1% | 91.9% | 90.3% | |
| Extra Space Gaithersburg | 85.4% | 91.2% | 92.5% | 92.8% | 90.7% | 92.6% | 93.3% | 91.5% | 91.3% | |
| Extra Space Philadelphia | 89.7% | 90.7% | 89.9% | 88.2% | 87.0% | 87.0% | 85.8% | 93.9% | 89.0% | |
| Extra Space Westminster | 79.8% | 84.1% | 88.9% | 91.8% | 90.4% | 93.4% | 95.3% | 94.7% | 89.8% | |
| Extra Space Newark | 90.7% | 89.3% | 92.4% | 91.8% | 91.9% | 87.5% | 84.6% | 91.1% | 89.9% | |
| Extra Space Essex | 87.1% | 89.3% | 91.0% | 94.3% | 92.9% | 93.7% | 93.6% | 93.5% | 91.9% | |
| Extra Space New Bedford | 78.0% | 80.4% | 75.2% | 87.3% | 91.7% | 92.4% | 95.9% | 93.6% | 86.8% | |
| Extra Space Birmingham | 83.4% | 83.3% | 89.1% | 89.7% | 90.8% | 93.8% | 92.9% | 94.8% | 89.7% | |
| Extra Space Haverhill | 87.4% | 90.0% | 90.9% | 94.2% | 92.2% | 91.6% | 92.1% | 86.6% | 90.6% | |
| Extra Space Shrewsbury | 85.3% | 88.0% | 90.9% | 91.6% | 93.0% | 95.1% | 92.5% | 92.1% | 91.1% | |
| Extra Space Dallas | 85.2% | 85.1% | 91.3% | 90.7% | 91.1% | 94.9% | 90.7% | 90.0% | 89.9% | |
| Extra Space Enfield | 87.7% | 92.5% | 89.1% | 92.4% | 91.9% | 91.3% | 94.6% | 93.0% | 91.6% | |
| Extra Space San Diego Miramar | 89.1% | 89.7% | 88.5% | 90.1% | 90.7% | 94.2% | 94.9% | 92.3% | 91.2% | |
| Extra Space Shawnee | 79.0% | 78.1% | 81.7% | 80.4% | 89.1% | 91.7% | 92.7% | 95.1% | 86.0% | |
| Extra Space Overland Park | 89.9% | 87.1% | 89.7% | 91.5% | 89.1% | 90.5% | 91.5% | 94.3% | 90.5% | |
| Extra Space Tucson | 84.2% | 84.5% | 94.4% | 91.0% | 89.5% | 90.4% | 92.2% | 91.3% | 89.7% | |
| Total / Wtd. Avg. | 85.9% | 87.0% | 89.0% | 90.6% | 91.1% | 92.6% | 92.9% | 92.2% | 90.2% | |
| (1) | As provided by the borrower and which represents occupancy as of December 31st for the indicated year. |
This is not a research report and was not prepared by any Underwriter’s research department. Please see additional important information and qualifications at the end of this Term Sheet. |
| T-42 |
| BANK 2018-BNK11 | Extra Space – TIAA Self Storage Portfolio |
The Markets. The Extra Space - TIAA Self Storage Portfolio Properties are geographically diverse, located across 22 cities in 11 states and Washington, D.C. The largest concentration is located in California (eight properties, 35.0% of SF, 39.9% of UW NCF), Massachusetts (three properties, 11.4% of SF, 9.0% of UW NCF), Florida (two properties, 9.7% of SF, 10.7% of UW NCF), and Maryland (two properties, 8.3% of SF, 7.5% of UW NCF), with the remaining properties (35.5% of SF, 33.0% of UW NCF) located in seven states and Washington, D.C.
The following table presents the geographical distribution of the Extra Space - TIAA Self Storage Portfolio Properties:
| State/Jurisdiction Summary | |||||||||
| State/Jurisdiction | Property Count | Allocated Loan Amount | % of Allocated Loan Amount | Total SF | % of SF | Total Units | Occupancy as of 12/31/2017 | UW NCF | % of UW NCF |
| California | 8 | $91,020,000 | 39.7% | 565,867 | 35.0% | 5,947 | 91.5% | $8,255,915 | 39.9% |
| Massachusetts | 3 | $20,593,000 | 9.0% | 184,140 | 11.4% | 1,505 | 91.0% | $1,856,260 | 9.0% |
| Florida | 2 | $24,231,000 | 10.6% | 155,954 | 9.7% | 1,515 | 93.7% | $2,218,489 | 10.7% |
| Maryland | 2 | $17,131,000 | 7.5% | 134,766 | 8.3% | 1,164 | 92.4% | $1,554,650 | 7.5% |
| Washington, D.C. | 1 | $30,841,000 | 13.5% | 104,382 | 6.5% | 1,689 | 92.1% | $2,752,474 | 13.3% |
| Kansas | 2 | $7,140,000 | 3.1% | 103,130 | 6.4% | 818 | 94.7% | $655,382 | 3.2% |
| Alabama | 1 | $7,195,000 | 3.1% | 73,366 | 4.5% | 604 | 94.8% | $655,749 | 3.2% |
| Pennsylvania | 1 | $9,310,000 | 4.1% | 68,425 | 4.2% | 593 | 93.9% | $842,713 | 4.1% |
| Connecticut | 1 | $4,911,000 | 2.1% | 65,650 | 4.1% | 511 | 93.0% | $427,883 | 2.1% |
| Delaware | 1 | $8,193,000 | 3.6% | 64,300 | 4.0% | 519 | 91.1% | $738,819 | 3.6% |
| Texas | 1 | $5,340,000 | 2.3% | 47,472 | 2.9% | 478 | 90.0% | $480,768 | 2.3% |
| Arizona | 1 | $3,095,000 | 1.4% | 47,250 | 2.9% | 425 | 91.3% | $275,296 | 1.3% |
| Total / Wtd. Avg. | 24 | $229,000,000 | 100.0% | 1,614,702 | 100.0% | 15,768 | 92.2% | $20,714,398 | 100.0% |
The following table presents local demographics data for the Extra Space - TIAA Self Storage Portfolio Properties:
| Local Demographics Summary | ||||
| Property Name | City | State/Jurisdiction | 2017 Population (within a 1-mi. / 3-mi. / 5-mi. Radius) | 2017 Median Income (within a 1-mi. / 3-mi. / 5-mi. Radius) |
| Extra Space Washington | Washington | D.C. | 103,098 / 396,332 / 776,753 | $91,607 / $86,799 / $85,537 |
| Extra Space San Jose | San Jose | CA | 29,673 / 250,116 / 604,289 | $73,531 / $85,535 / $90,169 |
| Extra Space San Diego | San Diego | CA | 11,296 / 89,230 / 231,408 | $82,606 / $90,172 / $95,726 |
| Extra Space Panorama City | Panorama City | CA | 70,965 / 337,834 / 757,901 | $36,615 / $47,468 / $52,390 |
| Extra Space Norwalk | Norwalk | CA | 29,213 / 257,233 / 682,041 | $61,064 / $59,950 / $59,825 |
| Extra Space Miami East | Miami | FL | 32,678 / 217,329 / 421,919 | $52,240 / $58,326 / $59,634 |
| Extra Space Miami West | Miami | FL | 18,416 / 209,400 / 486,980 | $57,632 / $43,368 / $44,671 |
| Extra Space Palo Alto | East Palo Alto | CA | 32,002 / 120,107 / 241,797 | $72,803 / $101,384 / $98,992 |
| Extra Space Covina | Covina | CA | 25,705 / 215,002 / 491,057 | $73,888 / $64,913 / $64,265 |
| Extra Space Gaithersburg | Gaithersburg | MD | 14,199 / 109,881 / 223,144 | $94,923 / $79,610 / $87,213 |
| Extra Space Philadelphia | Philadelphia | PA | 23,889 / 172,998 / 476,472 | $45,365 / $52,400 / $51,878 |
| Extra Space Westminster | Westminster | CA | 24,050 / 200,548 / 614,766 | $64,768 / $65,221 / $65,395 |
| Extra Space Newark | Newark | DE | 9,435 / 71,666 / 194,717 | $56,169 / $61,267 / $63,727 |
| Extra Space Essex | Essex | MD | 7,749 / 101,747 / 286,150 | $61,708 / $57,325 / $57,523 |
| Extra Space New Bedford | New Bedford | MA | 8,150 / 92,571 / 201,358 | $63,485 / $46,772 / $55,431 |
| Extra Space Birmingham | Birmingham | AL | 8,820 / 65,688 / 163,572 | $63,978 / $65,543 / $53,616 |
| Extra Space Haverhill | Haverhill | MA | 6,734 / 65,267 / 176,022 | $67,010 / $64,825 / $59,859 |
| Extra Space Shrewsbury | Shrewsbury | MA | 8,242 / 202,685 / 381,663 | $30,475 / $57,152 / $66,557 |
| Extra Space Dallas | Dallas | TX | 10,819 / 122,018 / 341,303 | $47,347 / $41,440 / $48,008 |
| Extra Space Enfield | Enfield | CT | 4,379 / 35,521 / 77,407 | $63,609 / $70,516 / $75,869 |
| Extra Space San Diego Miramar | San Diego | CA | 9,630 / 80,429 / 226,274 | $74,425 / $88,667 / $93,486 |
| Extra Space Shawnee | Shawnee | KS | 10,793 / 71,788 / 171,869 | $70,625 / $66,051 / $60,493 |
| Extra Space Overland Park | Overland Park | KS | 13,979 / 104,377 / 241,367 | $49,313 / $58,588 / $65,127 |
| Extra Space Tucson | Tucson | AZ | 15,994 / 122,452 / 201,345 | $39,867 / $47,082 / $47,238 |
Source: Appraisals.
This is not a research report and was not prepared by any Underwriter’s research department. Please see additional important information and qualifications at the end of this Term Sheet. |
| T-43 |
| BANK 2018-BNK11 | Extra Space – TIAA Self Storage Portfolio |
The following table presents certain information relating to certain self-storage lease comparables provided in the appraisals for the Extra Space – TIAA Self Storage Portfolio Properties:
| Competitive Set Summary | |||||
| Property Name | Metropolitan Statistical Area | Occupancy As of 12/31/2017 | Competitive Set Average Occupancy | Average Monthly Rent/Unit | Competitive Set Average Monthly Asking Rent/Unit |
| Extra Space Washington | Washington-Arlington-Alexandria, DC-VA-MD-WV | 92.1% | 81.5% | $188 | $181 |
| Extra Space San Jose | San Jose-Sunnyvale-Santa Clara, CA | 89.9% | 92.9% | $199 | $204 |
| Extra Space San Diego | San Diego-Carlsbad, CA | 88.1% | 94.4% | $159 | $170 |
| Extra Space Panorama City | Los Angeles-Long Beach-Santa Ana, CA | 92.7% | 94.8% | $172 | $172 |
| Extra Space Norwalk | Los Angeles-Long Beach-Santa Ana, CA | 92.8% | 93.4% | $159 | $160 |
| Extra Space Miami East | Miami-Fort Lauderdale-Pompano Beach, FL | 91.8% | 94.9% | $157 | $158 |
| Extra Space Miami West | Miami-Fort Lauderdale-Pompano Beach, FL | 95.7% | 91.5% | $181 | $182 |
| Extra Space Palo Alto | San Francisco-Oakland-Hayward, CA | 92.1% | 93.3% | $198 | $198 |
| Extra Space Covina | Los Angeles-Long Beach-Santa Ana, CA | 91.9% | 94.1% | $164 | $169 |
| Extra Space Gaithersburg | Washington-Arlington-Alexandria, DC-VA-MD-WV | 91.5% | 91.5% | $144 | $156 |
| Extra Space Philadelphia | Philadelphia-Camden-Wilmington, PA-NJ-DE | 93.9% | 91.4% | $162 | $167 |
| Extra Space Westminster | Los Angeles-Long Beach-Anaheim, CA | 94.7% | 94.0% | $155 | $160 |
| Extra Space Newark | Philadelphia-Camden-Wilmington, PA-NJ-DE | 91.1% | 88.3% | $182 | $183 |
| Extra Space Essex | Baltimore-Towson, MD | 93.5% | 90.4% | $149 | $152 |
| Extra Space New Bedford | Providence-Warwick, RI-MA | 93.6% | 95.5% | $145 | $156 |
| Extra Space Birmingham | Birmingham-Hoover, AL | 94.8% | 93.6% | $113 | $122 |
| Extra Space Haverhill | Boston-Cambridge-Newton, MA-NH | 86.6% | 91.4% | $150 | $154 |
| Extra Space Shrewsbury | Worcester, MA-CT | 92.1% | 91.2% | $161 | $184 |
| Extra Space Dallas | Dallas-Fort Worth-Arlington, TX | 90.0% | 92.2% | $120 | $126 |
| Extra Space Enfield | Hartford-West Hartford-East Hartford, CT | 93.0% | 92.8% | $119 | $124 |
| Extra Space San Diego Miramar | San Diego-Carlsbad, CA | 92.3% | 94.8% | $116 | $121 |
| Extra Space Shawnee | Kansas City, MO-KS | 95.1% | 94.2% | $106 | $112 |
| Extra Space Overland Park | Kansas City, MO-KS | 94.3% | 92.7% | $133 | $134 |
| Extra Space Tucson | Tucson, AZ | 91.3% | 89.5% | $90 | $100 |
| Total / Wtd. Avg. | 92.2% | 92.1% | $157 | $161 | |
Source: Appraisals.
Operating History and Underwritten Net Cash Flow.The following table presents certain information relating to the historical operating performance and Underwritten Net Cash Flow at the Extra Space - TIAA Self Storage Portfolio Properties:
| Cash Flow Analysis | |||||||
| 2013 | 2014 | 2015 | 2016 | 2017 | U/W | U/W PSF | |
| Base Rent | $25,753,599 | $26,338,467 | $27,783,482 | $29,791,412 | $32,117,467 | $32,379,189 | $20.05 |
| Concessions | ($1,133,033) | ($1,015,854) | ($801,904) | ($832,704) | ($1,001,751) | ($980,303) | ($0.61) |
| Vacancy & Credit Loss | ($2,818,702) | ($2,552,762) | ($2,677,225) | ($3,084,078) | ($4,104,590) | ($3,946,418) | ($2.44) |
| Other Income(1) | $1,845,128 | $1,854,466 | $1,861,602 | $1,894,673 | $1,980,586 | $1,965,702 | $1.22 |
| Effective Gross Income | $23,646,992 | $24,624,317 | $26,165,955 | $27,769,303 | $28,991,712 | $29,418,170 | $18.22 |
| Total Operating Expenses | $8,216,773 | $8,380,232 | $8,583,643 | $8,591,017 | $8,620,095 | $8,461,563 | $5.24 |
| Net Operating Income | $15,430,219 | $16,244,085 | $17,582,312 | $19,178,286 | $20,371,617 | $20,956,607 | $12.98 |
| Replacement Reserves | $0 | $0 | $0 | $0 | $0 | $242,209 | $0.15 |
| Net Cash Flow | $15,430,219 | $16,244,085 | $17,582,312 | $19,178,286 | $20,371,617 | $20,714,398 | $12.83 |
| Occupancy % | 90.6% | 91.1% | 92.6% | 92.9% | 92.2% | 92.2%(2) | |
| NOI DSCR(3) | 1.47x | 1.54x | 1.67x | 1.82x | 1.94x | 1.99x | |
| NCF DSCR(3) | 1.47x | 1.54x | 1.67x | 1.82x | 1.94x | 1.97x | |
| NOI Debt Yield(3) | 6.7% | 7.1% | 7.7% | 8.4% | 8.9% | 9.2% | |
| NCF Debt Yield(3) | 6.7% | 7.1% | 7.7% | 8.4% | 8.9% | 9.0% | |
| (1) | Other Income includes administrative fees, late fees, merchandise sales, parking income and cell tower and billboard commercial leases. |
| (2) | The underwritten economic vacancy is 12.0%. As of December 31, 2017, the Extra Space – TIAA Self Storage Portfolio Properties were 92.2% physically occupied. |
| (3) | Debt service coverage ratios and debt yields are based on the Extra Space – TIAA Self Storage Portfolio Whole Loan. |
This is not a research report and was not prepared by any Underwriter’s research department. Please see additional important information and qualifications at the end of this Term Sheet. |
| T-44 |
| BANK 2018-BNK11 | Extra Space – TIAA Self Storage Portfolio |
Escrows and Reserves. So long as Extra Space Storage Inc. is the nonrecourse carve-out guarantor, and provided (x) no event of default or Cash Sweep Period (as defined below) has occurred and is continuing, (y) the Extra Space – TIAA Self Storage Portfolio Borrower provides to lender evidence of direct payment of taxes and insurance premiums, and (z) as it relates to the insurance requirements, the Extra Space - TIAA Self Storage Portfolio Properties are covered by a blanket policy, monthly deposits of 1/12th of the real estate taxes and 1/12th of the property insurance premiums will be waived. Notwithstanding, the Extra Space – TIAA Self Storage Portfolio Borrower is required to escrow for flood insurance coverage as required under the National Flood Insurance Program.
Lockbox and Cash Management. The Extra Space - TIAA Self Storage Portfolio Whole Loan documents provide for a springing lockbox and springing cash management, in each case upon the occurrence of a Cash Sweep Period (as defined below). Upon the occurrence of a Cash Sweep Period, the borrower is required to establish (i) a lockbox account, into which, during a Cash Sweep Period, all rents are required to be deposited and (ii) a lender controlled cash management account, into which, during a Cash Sweep Period, all deposits in the lockbox account are required to be transferred on each business day.
Provided no event of default is continuing, funds in the cash management account are required to be applied to payment of de minimis revenue (tenant insurance premiums, sales tax and packing supply cash receipts) to the Extra Space – TIAA Self Storage Portfolio Borrower, to payment of debt service, operating expenses and extraordinary expenses, and to funding of required reserves, with the remainder being deposited to an excess cash flow reserve to be held as additional security for the Extra Space - TIAA Self Storage Portfolio Whole Loan until the discontinuance of the Cash Sweep Period at which time the excess cash is required to be swept to the Extra Space – TIAA Self Storage Portfolio Borrower’s operating account. Notwithstanding, should a Cash Sweep Period occur more than once during the Extra Space - TIAA Self Storage Portfolio Whole Loan term, excess cash will not be required to be returned to the Extra Space – TIAA Self Storage Portfolio Borrower’s operating account and is permitted to continue to be held by the lender for the remainder of the loan term.
A “Cash Sweep Period” will commence upon the earlier of (i) an event of default or (ii) the debt service coverage ratio being less than 1.10x for 12 consecutive months and will continue until; in the case of clause (i), the cure of such event of default, and in the case of clause (ii), the debt service coverage ratio being equal to or greater than 1.25x for the immediately preceding six consecutive months. Notwithstanding the foregoing, a Cash Sweep Period will not be deemed to expire in the event that a Cash Sweep Period then exists for any other reason.
Additional Secured Indebtedness (not including trade debts). The Extra Space - TIAA Self Storage Portfolio Properties also secure the Extra Space - TIAA Self Storage Portfolio Non-Serviced Pari Passu Companion Loans, which have an aggregate Cut-off Date principal balance of $163,000,000. The Extra Space - TIAA Self Storage Portfolio Non-Serviced Pari Passu Companion Loans accrue interest at the same rate as the Extra Space - TIAA Self Storage Portfolio Mortgage Loan. The Extra Space - TIAA Self Storage Portfolio Mortgage Loan is entitled to payments of interest on a pro rata and pari passu basis with the Extra Space - TIAA Self Storage Portfolio Non-Serviced Pari Passu Companion Loans. The holders of the Extra Space - TIAA Self Storage Portfolio Mortgage Loan and the Extra Space - TIAA Self Storage Portfolio Non-Serviced Pari Passu Companion Loans have entered into a co-lender agreement which sets forth the allocation of collections on the Extra Space - TIAA Self Storage Portfolio Whole Loan. See “Description of the Mortgage Pool—The Whole Loans—The Non-Serviced Pari Passu Whole Loans” in the Preliminary Prospectus.
Mezzanine Loan and Preferred Equity. Not permitted.
Release of Property. After the Release Date (as defined below) and prior to September 1, 2027, provided no event of default has occurred and is continuing, the Extra Space – TIAA Self Storage Portfolio Borrower may obtain a release of any of the individual properties comprising the Extra Space - TIAA Self Storage Portfolio Properties in connection with a sale to a third party upon defeasance of an amount equal to 125% of the allocated loan amount of such individual property; provided that the following conditions, among others, are satisfied: (i) after giving effect to the release, the debt yield with respect to the remaining Extra Space – TIAA Self Storage Portfolio Properties is not less than the greater of (a) 9.08% and (b) the debt yield of all of the Extra Space – TIAA Self Storage Portfolio Properties immediately prior to the related release; and (ii) the partial defeasance is permitted under REMIC requirements (and the lender receives an opinion of counsel that the partial defeasance will not cause a REMIC trust formed pursuant to a securitization of any portion of the Extra Space - TIAA Self Storage Portfolio Whole Loan to fail to maintain its status as a REMIC).
“Release Date” means the earlier to occur of (i) the fourth anniversary of the closing date of the Extra Space – TIAA Self Storage Portfolio Whole Loan and (ii) the date that is two years from the “startup day” of the REMIC trust established in connection with the last securitization involving any portion of the Extra Space - TIAA Self Storage Portfolio Whole Loan.
Substitution of Property.Not permitted.
Terrorism Insurance.The Extra Space - TIAA Self Storage Portfolio Borrower is required to maintain insurance coverage for perils and acts of terrorism in an amount equal to the full replacement cost of the Extra Space - TIAA Self Storage Portfolio Properties (plus 18 months of rental loss and/or business interruption coverage plus an additional period of indemnity covering (i) the 12 months following restoration or (ii) the period of time until such income returns to the same level it was at prior to the loss, whichever occurs first). See “Risk Factors—Risks Relating to the Mortgage Loans—Terrorism Insurance May Not Be Available for All Mortgaged Properties” in the Preliminary Prospectus.
This is not a research report and was not prepared by any Underwriter’s research department. Please see additional important information and qualifications at the end of this Term Sheet. |
| T-45 |
| BANK 2018-BNK11 | Apple Campus 3 |
Mortgage Loan No. 3 – Apple Campus 3

This is not a research report and was not prepared by any Underwriter’s research department. Please see additional important information and qualifications at the end of this Term Sheet. |
| T-46 |
| BANK 2018-BNK11 | Apple Campus 3 |
Mortgage Loan No. 3 – Apple Campus 3
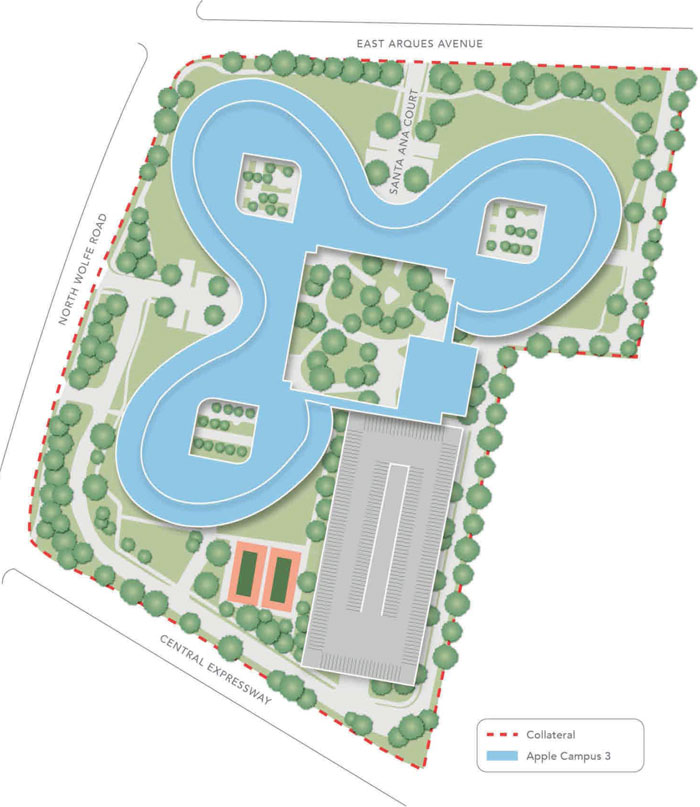
This is not a research report and was not prepared by any Underwriter’s research department. Please see additional important information and qualifications at the end of this Term Sheet. |
| T-47 |
| BANK 2018-BNK11 | Apple Campus 3 |
Mortgage Loan No. 3 – Apple Campus 3
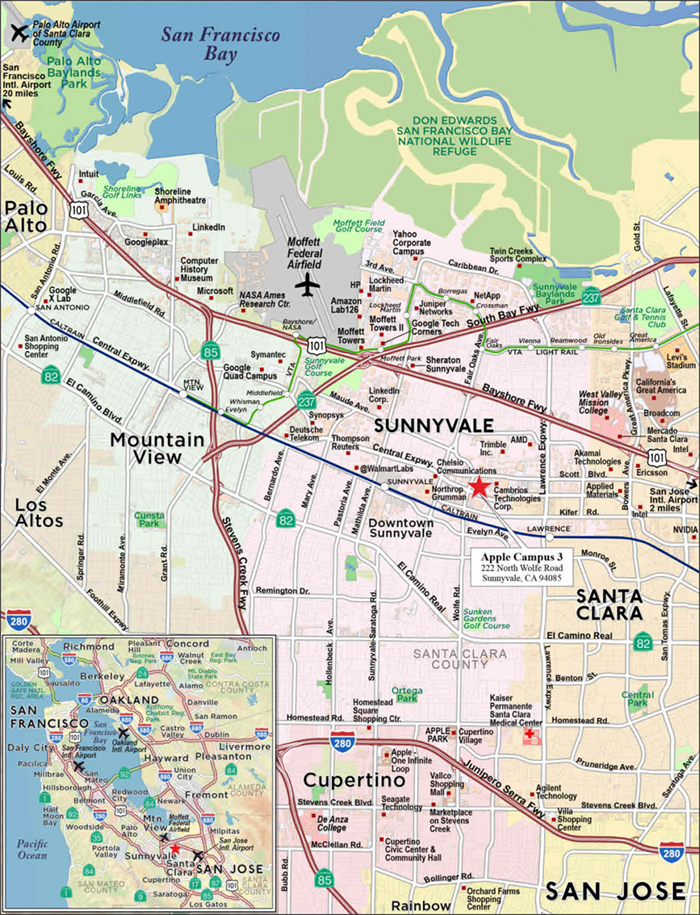
This is not a research report and was not prepared by any Underwriter’s research department. Please see additional important information and qualifications at the end of this Term Sheet. |
| T-48 |
| BANK 2018-BNK11 | Apple Campus 3 |
| Mortgage Loan No. 3 – Apple Campus 3 |
| Mortgage Loan Information | Property Information | |||||
| Mortgage Loan Seller: | WFB | Single Asset/Portfolio: | Single Asset | |||
| Original Balance(1): | $63,000,000 | Location: | Sunnyvale, CA 94085 | |||
| Cut-off Date Balance(1): | $63,000,000 | General Property Type: | Office | |||
| % of Initial Pool Balance: | 9.2% | Detailed Property Type: | Suburban | |||
| Loan Purpose: | Refinance | Title Vesting: | Fee | |||
| Sponsor: | Paul Guarantor LLC | Year Built/Renovated: | 2017/N/A | |||
| Mortgage Rate: | 3.364978% | Size: | 882,657 SF | |||
| Note Date: | 12/14/2017 | Cut-off Date Balance per SF(1): | $385 | |||
| First Payment Date: | 2/6/2018 | ARD Balance per SF(1): | $385 | |||
| Anticipated Repayment Date(2): | 1/6/2028 | Property Manager: | Paul Holdings, Inc. (borrower-related) | |||
| Maturity Date(2): | 4/6/2031 | |||||
| Original Term to ARD: | 120 months | |||||
| Original Amortization Term: | 0 months | Underwriting and Financial Information | ||||
| IO Period: | 120 months | UW NOI: | $41,385,613 | |||
| Seasoning: | 3 months | UW NOI Debt Yield(1): | 12.2% | |||
| Prepayment Provisions(3): | LO (27); DEF (86); O (7) | UW NOI Debt Yield at ARD(1): | 12.2% | |||
| Lockbox/Cash Mgmt Status: | Hard/In Place | UW NCF DSCR(1): | 3.55x | |||
| Additional Debt Type(1)(4): | Pari Passu/Mezzanine | Most Recent NOI(6): | N/A | |||
| Additional Debt Balance(1)(4): | $277,000,000/$235,000,000 | 2nd Most Recent NOI(6): | N/A | |||
| Future Debt Permitted (Type): | No (N/A) | 3rd Most Recent NOI(6): | N/A | |||
| Reserves(5) | Most Recent Occupancy: | 100.0% (4/1/2018) | ||||
| Type | Initial | Monthly | Cap | 2nd Most Recent Occupancy(6): | N/A | |
| Taxes: | $0 | $249,368 | N/A | 3rd Most Recent Occupancy(6): | N/A | |
| Insurance: | $0 | Springing | N/A | Appraised Value (as of)(7): | $773,600,000 (6/1/2019) | |
| Replacement Reserves: | $0 | Springing | N/A | Cut-off Date LTV Ratio(1)(7): | 44.0% | |
| TI/LC Reserves: | $2,979,839 | $0 | N/A | ARD LTV Ratio(1)(7): | 44.0% | |
| Rent Concession Reserve: | $42,706,326 | $0 | N/A | |||
| Punchlist Reserve: | $93,750 | Springing | N/A | |||
| Sources and Uses | ||||||
| Sources | Proceeds | % of Total | Uses | Proceeds | % of Total | |
| Loan Amount: | $340,000,000 | 59.1% | Loan payoff: | $385,679,999 | 67.1% | |
| Mezzanine Loan Amount: | $235,000,000 | 40.9% | Return of equity: | $140,904,070 | 24.5% | |
| Reserves: | $45,779,915 | 8.0% | ||||
| Closing costs: | $2,636,016 | 0.5% | ||||
| Total Sources: | $575,000,000 | 100.0% | Total Uses: | $575,000,000 | 100.0% | |
| (1) | The Apple Campus 3 Mortgage Loan (as defined below) is part of the Apple Campus 3 Whole Loan (as defined below), which is comprised of five pari passu notes with an aggregate original principal balance of $340,000,000. The Cut-off Date Balance per SF, ARD Balance per SF, UW NOI Debt Yield, UW NOI Debt Yield at ARD, UW NCF DSCR, Cut-off Date LTV Ratio and ARD LTV Ratio numbers presented are based on the Apple Campus 3 Whole Loan. |
| (2) | The Apple Campus 3 Mortgage Loan has an anticipated repayment date of January 6, 2028 (the “ARD”) and a final maturity date of April 6, 2031. See “The Mortgage Loan” for further discussion of the ARD. |
| (3) | Defeasance of the Apple Campus 3 Whole Loan is permitted any time after the earlier of (i) December 14, 2021, or (ii) two years after the closing date of the securitization that includes the lastpari passupromissory note of the Apple Campus Whole Loan to be securitized. The assumed lockout period of 27 payments is based on the closing date of this transaction in April 2018. |
| (4) | See “The Mortgage Loan”, “Additional Secured Indebtedness (not including trade debts)” and “Mezzanine Loan and Preferred Equity” for a discussion of the additional debt. The equity interest in the Apple Campus 3 Borrower has been pledged to secure senior mezzanine indebtedness with an original principal balance of $117,500,000 and junior mezzanine indebtedness with an original principal balance of $117,500,000. All statistical information related to the balance per square foot, loan-to-value ratios, debt service coverage ratios and debt yields are based solely on the Apple Campus 3 Whole Loan. As of the Cut-off Date, the UW NOI Debt Yield, UW NOI Debt Yield at ARD, UW NCF DSCR, Cut-off Date LTV Ratio and ARD LTV Ratio based on the Apple Campus 3 Total Debt (as defined below) are 7.2%, 7.2%, 1.70x, 74.3% and 74.3%, respectively. |
| (5) | See “Escrows and Reserves” below for further discussion of reserve requirements. |
| (6) | Historical occupancy and financial information is not applicable as the Apple Campus 3 Property (as defined below) was built in 2017. |
| (7) | The Appraised Value, Cut-off Date LTV Ratio and ARD LTV Ratio shown are based on the appraiser’s Prospective Market Value at Stabilization, which assumes that contractual tenant improvement and leasing commission (“TI/LC”) obligations have been fulfilled and there is no outstanding free rent. The Apple Campus 3 Borrower deposited upfront reserves totaling $45,779,915 for such contractual TI/LC obligations and free rent (see “Escrows and Reserves” below). Based on the as-is Appraised Value of $624,600,000 (as of November 7, 2017), the Cut-off Date LTV Ratio and ARD LTV Ratio are each 54.4% based on the Apple Campus 3 Whole Loan. The appraiser also concluded to a “Go Dark” value of $566,750,000 as of November 7, 2017. |
The Mortgage Loan. The third largest mortgage loan (the “Apple Campus 3 Mortgage Loan”) is part of a whole loan (the “Apple Campus 3 Whole Loan”) evidenced by fivepari passupromissory notes in the aggregate original principal amount of $340,000,000 which are secured by a first priority fee mortgage encumbering a 882,657 square foot, four-story, class A, single-tenant office building located in Sunnyvale, California (the “Apple Campus 3 Property”). The Apple Campus 3 Whole Loan was co-originated on December 14, 2017 by Wells Fargo Bank, National Association; Deutsche Bank AG, New York Branch; and Goldman Sachs Mortgage Company. The Apple Campus 3 Whole Loan has an anticipated repayment date of January 6, 2028 (the “ARD”) and a maturity date of April 6, 2031. Prior to the ARD, the Apple Campus 3 Whole Loan accrues interest at a fixed rate of 3.364978% per annum (the “Initial Interest Rate”) and requires payments of interest only through the ARD. In the event the Apple Campus 3 Whole Loan is not repaid in
This is not a research report and was not prepared by any Underwriter’s research department. Please see additional important information and qualifications at the end of this Term Sheet. |
| T-49 |
| BANK 2018-BNK11 | Apple Campus 3 |
full on or before the ARD, the Apple Campus 3 Borrower will be required to make (a) interest payments based on an interest rate equal to the greater of (i) the Initial Interest Rate plus 1.500% per annum, and (ii) the 10-year swap rate plus 1.500% per annum; provided, however, that upon the occurrence and continuance of an event of default, the interest rate will be equal to (1) the greater of (i) and (ii), plus (2) 5.000%; and (b) principal payments based on a 30-year amortization schedule assuming the Initial Interest Rate. The ARD automatically triggers a Cash Trap Event Period (see “Lockbox and Cash Management” section) whereby all excess cash flow, after payments of debt service on the Apple Campus 3 Mortgage Loan, required deposits to escrows and reserves, budgeted operating expenses and payments of debt service on the Apple Campus 3 Senior Mezzanine Loan and Apple Campus 3 Junior Mezzanine Loan (each as defined below) is required to be used to pay down the principal balance of the Apple Campus 3 Whole Loan. See “Description of the Mortgage Loans—Certain Terms of the Mortgage Loans—ARD Loans” in the Preliminary Prospectus.
The non-controlling Promissory Note A-1-1, which will be contributed to the BANK 2018-BNK11 securitization trust, has an original principal balance of $63,000,000. The controlling Promissory Note A-3, which was contributed to the BANK 2018-BNK10 securitization trust, has an original principal balance of $94,000,000. The non-controlling Promissory Note A-2, which was contributed to the WFCM 2018-C43 securitization trust, has an original principal balance of $30,000,000. The non-controlling Promissory Note A-4, which was contributed to the Benchmark 2018-B2 securitization trust, has an original principal balance of $68,000,000. The non-controlling Promissory Note A-5, which was contributed to the GSMC 2018-GS9 securitization trust, has an original principal balance of $68,000,000. The non-controlling Promissory Note A-1-2 has an original principal balance of $17,000,000, is currently held by Wells Fargo Bank, National Association and is expected to be contributed to a future securitization trust or trusts. The mortgage loans evidenced by Promissory Notes A-1-2, A-2, A-3, A-4 and A-5 are collectively referred to herein as the “Apple Campus 3 Non-Serviced Pari Passu Companion Loans”. The Apple Campus 3 Whole Loan will be serviced pursuant to the pooling and servicing agreement for the BANK 2018-BNK10 securitization trust. See “Description of the Mortgage Pool—The Whole Loans—The Non-Serviced Pari Passu Whole Loans” and “Pooling and Servicing Agreement—Servicing of the Non-Serviced Mortgage Loans” in the Preliminary Prospectus.
| Apple Campus 3 Whole Loan Summary | ||||
| Note | Original Balance | Cut-off Date Balance | Note Holder | Controlling Piece |
| A-1-1 | $63,000,000 | $63,000,000 | BANK 2018-BNK11 | No |
| A-1-2 | $17,000,000 | $17,000,000 | Wells Fargo Bank, N.A. | No |
| A-2 | $30,000,000 | $30,000,000 | WFCM 2018-C43 | No |
| A-3 | $94,000,000 | $94,000,000 | BANK 2018-BNK10 | Yes |
| A-4 | $68,000,000 | $68,000,000 | Benchmark 2018-B2 | No |
| A-5 | $68,000,000 | $68,000,000 | GSMC 2018-GS9 | No |
| Total | $340,000,000 | $340,000,000 | ||
The Borrower and the Sponsor. The borrower is CW SPE LLC, a Delaware limited liability company and single purpose entity with two independent directors (the “Apple Campus 3 Borrower”). Legal counsel to the Apple Campus 3 Borrower delivered a non-consolidation opinion in connection with the origination of the Apple Campus 3 Whole Loan. The sponsor and the nonrecourse carve-out guarantor of the Apple Campus 3 Whole Loan is Paul Guarantor LLC.
Paul Guarantor LLC is 100% directly owned by the Jay Paul Revocable Living Trust dated November 9, 1999, as amended and restated in its entirety on March 19, 2010, and as further amended from time to time, for which Joseph K. Paul a/k/a Jay Paul, is trustee. Jay Paul is the founder of the Jay Paul Company, a privately held real estate firm based in San Francisco, California. Founded in 1975, Jay Paul Company concentrates on the acquisition, development, and management of commercial properties throughout California. Jay Paul Company has developed over 11.0 million square feet of institutional quality space, and since 2000, has closed on more than $12.0 billion in debt and equity financings.
The Property. The Apple Campus 3 Property is a class A LEED Platinum office campus totaling 882,657 square feet and located in Sunnyvale, California. Built in 2017 and situated on a 17.8-acre site, the Apple Campus 3 Property comprises three interconnected, four-story office buildings totaling approximately 849,000 square feet, an amenities facility, outdoor common area and a seven-story parking structure. The Apple Campus 3 Property is 100.0% leased to Apple Inc. (“Apple”; NYSE: AAPL) through February 2031, with two, seven-year extension options and no termination options. Apple took possession of the Apple Campus 3 Property on December 1, 2017 and is currently constructing its interior improvements. As of January 2018, Apple is expected to begin taking occupancy of its space at the Apple Campus 3 Property in September 2018.
The interconnected office buildings within the Apple Campus 3 Property comprise Building A (308,659 square feet), Building B (269,997 square feet) and Building C (270,002 square feet), and the combined office floorplates average approximately 180,000 square feet. The amenities facility at the Apple Campus 3 Property totals approximately 34,000 square feet and is expected to serve as a cafeteria for Apple employees. Building A, Building B, the parking structure and the amenities building are collectively known as “Phase I” of the Apple Campus 3 Property; and Building C is known as “Phase 2”. Amenities at the Apple Campus 3 Property include a fitness/wellness center, coffee bar, general store, barber shop, bike repair shop, dry cleaning/laundry service and a conference center. Additional outdoor amenities at the Apple Campus 3 Property include a mini amphitheater situated in the center courtyard, outdoor seating, sport courts and athletic fields, bus/shuttle stops and green roof accessibility on the third floor of the office buildings.
According to the appraisal, as of 2016, Apple was the second largest employer in Sunnyvale, California, and the second largest space user in Silicon Valley. The Apple Campus 3 Property is situated approximately 3.5 miles north of both Apple Park and One Infinite Loop. Apple Park is Apple’s new 175-acre corporate headquarters campus, which comprises the 2.8 million square foot “spaceship” structure in addition to several associated research and development buildings. One Infinite Loop was originally developed as Apple’s headquarters in 1993 and totals approximately 850,000 square feet.
This is not a research report and was not prepared by any Underwriter’s research department. Please see additional important information and qualifications at the end of this Term Sheet. |
| T-50 |
| BANK 2018-BNK11 | Apple Campus 3 |
The following table presents certain information relating to the sole tenant at the Apple Campus 3 Property:
| Tenant Summary | |||||||
| Tenant Name | Credit Rating (Fitch/Moody's/S&P)(1) | Tenant SF | Approximate % of SF | Annual UW Rent(2) | % of Total Annual UW Rent | Annual UW Rent PSF(2) | Lease Expiration |
| Major Tenant | |||||||
| Apple(3) | NR/Aa1/AA+ | 882,657 | 100.0% | $42,675,300 | 100.0% | $48.35 | 2/28/2031(4) |
| Subtotal/Wtd. Avg. | 882,657 | 100.0% | $42,675,300 | 100.0% | $48.35 | ||
| Other Tenants | 0 | 0.0% | $0 | 0.0% | $0.00 | ||
| Vacant Space | 0 | 0.0% | $0 | 0.0% | $0.00 | ||
| Total/Wtd. Avg. | 882,657 | 100.0% | $42,675,300 | 100.0% | $48.35 | ||
| (1) | The entity on the lease is Apple Inc., which is the rated entity. |
| (2) | Annual UW Rent PSF and Annual UW Rent reflect the average rent over the remaining lease term. Apple is currently in a free rent period, as outlined in the footnote below, and is required to begin paying rent of $41.28 per square foot on Phase I in February 2019 and Phase II in June 2019. |
| (3) | Apple has taken possession of its space and is currently constructing its interior improvements. Apple is currently in a free rent period for (i) Phase 1 (approximately 69.4% of its space) through and including December 2018 and (ii) Phase 2 (approximately 30.6% of its space) through and including May 2019. In January 2019, Apple has the right to pay reduced rent of approximately $6.93 per square foot on Phase I only. Through and including February 2018, Apple is required to pay reimbursements for utilities only, and commencing March 2018, the tenant will be required to pay reimbursements for utilities, operating expenses, taxes and insurance. All future rent credits and abatements under the Apple lease were reserved at the origination of the Apple Campus 3 Whole Loan (see “Escrows and Reserves” section). |
| (4) | Apple has two, 7-year renewal options at 95% of fair market value with 360 days’ written notice. |
The following table presents certain information relating to the lease rollover schedule at the Apple Campus 3 Property:
| Lease Rollover Schedule(1) | ||||||||
| Year | # of Leases Rolling | SF Rolling | Annual UW Rent PSF Rolling | Approx. % of Total SF Rolling | Approx. Cumulative % of SF Rolling | Total UW Rent Rolling | Approx. % of Total Rent Rolling | Approx. Cumulative % of Total Rent Rolling |
| MTM | 0 | 0 | $0.00 | 0.0% | 0.0% | $0 | 0.0% | 0.0% |
| 2018 | 0 | 0 | $0.00 | 0.0% | 0.0% | $0 | 0.0% | 0.0% |
| 2019 | 0 | 0 | $0.00 | 0.0% | 0.0% | $0 | 0.0% | 0.0% |
| 2020 | 0 | 0 | $0.00 | 0.0% | 0.0% | $0 | 0.0% | 0.0% |
| 2021 | 0 | 0 | $0.00 | 0.0% | 0.0% | $0 | 0.0% | 0.0% |
| 2022 | 0 | 0 | $0.00 | 0.0% | 0.0% | $0 | 0.0% | 0.0% |
| 2023 | 0 | 0 | $0.00 | 0.0% | 0.0% | $0 | 0.0% | 0.0% |
| 2024 | 0 | 0 | $0.00 | 0.0% | 0.0% | $0 | 0.0% | 0.0% |
| 2025 | 0 | 0 | $0.00 | 0.0% | 0.0% | $0 | 0.0% | 0.0% |
| 2026 | 0 | 0 | $0.00 | 0.0% | 0.0% | $0 | 0.0% | 0.0% |
| 2027 | 0 | 0 | $0.00 | 0.0% | 0.0% | $0 | 0.0% | 0.0% |
| 2028 | 0 | 0 | $0.00 | 0.0% | 0.0% | $0 | 0.0% | 0.0% |
| 2029 & Beyond | 1 | 882,657 | $48.35 | 100.0% | 100.0% | $42,675,300 | 100.0% | 100.0% |
| Vacant | 0 | 0 | $0.00 | 0.0% | 100.0% | $0 | 0.0% | 100.0% |
| Total/Wtd. Avg. | 1 | 882,657 | $48.35 | 100.0% | $42,675,300 | 100.0% | ||
| (1) | Information is based on the underwritten rent roll. |
The Market. The Apple Campus 3 Property is located in Sunnyvale, California near the intersection of Central Expressway and Wolfe Road. Sunnyvale is the seventh most populous city in the San Francisco Bay Area and one of the major cities comprising Silicon Valley. According to a third party market research report, as of the third quarter of 2017, the San Jose/Sunnyvale/Santa Clara metropolitan statistical area had an unemployment rate of 3.2% and reported an 8.9% GDP growth rate over the past five years, compared to an overall 2.4% growth rate for the United States.
The Apple Campus 3 Property is centrally located within 1.4 miles of two Santa Clara Valley Transportation Authority Light Rail stations (the Sunnyvale station in the Heritage District Downtown and the Lawrence Station in eastern Sunnyvale), 3.9 miles from the Downtown Mountain View Caltrain Station, and within close proximity to highways 101, 280, 237 and 85. According to a third-party market research report, the 2017 estimated population within a one-, three- and five-mile radius of the Apple Campus 3 Property was 26,490, 193,228, and 466,901, respectively; while the 2017 estimated average household income within the same radii was $121,630, $133,362, and $141,198, respectively.
According to a third-party market research report, as of the third quarter of 2017, the Sunnyvale submarket contained approximately 10.9 million square feet of office space exhibiting a vacancy rate of approximately 3.1% and an average asking rental rate of $64.44 per square foot, gross. The appraiser identified 15 comparable class A office properties totaling approximately 2.4 million square feet, which reported a 99.7% occupancy rate and average asking rents of $50.58 per square foot, triple net.
This is not a research report and was not prepared by any Underwriter’s research department. Please see additional important information and qualifications at the end of this Term Sheet. |
| T-51 |
| BANK 2018-BNK11 | Apple Campus 3 |
The following table presents certain information relating to comparable office leases for the Apple Campus 3 Property:
| Comparable Leases Summary | ||||||||
| Property Name/Location | Year Built | Size SF | Total Occupancy | Tenant Name | Lease Date/Term | Lease Area (SF) | Annual In Place Rent PSF | Lease Type |
| Apple Campus 3 Property | 2017 | 882,657 | 100% | Apple | Dec. 2017/ 13.25 Yrs | 882,657 | $41.28(1) | NNN |
| Moffett Towers II 905 11th Avenue Sunnyvale, CA | 2016 | 350,663 | 100% | Lab 126 | March 2017/ 10.0 Yrs | 350,663 | $47.40 | NNN |
| Moffett Gateway 1225 Crossman Avenue Sunnyvale, CA | 2016 | 298,924 | 100% | Google, Inc. | Nov. 2016/ 11.0 Yrs | 298,924 | $44.40 | NNN |
| 10900 Tantau Avenue Cupertino, CA | 2008 | 102,540 | 100% | Panasonic | May 2017/ 5.0 Yrs | 43,034 | $51.00 | NNN |
| Tree Farm 4440 El Camino Real Los Altos, CA | 1999 | 96,562 | 100% | Toyota | March 2017/ 5.5 Yrs | 96,562 | $63.00 | NNN |
| Moffett Tower II Bldg. 2 905 11th Avenue Sunnyvale, CA | 2017 | 362,600 | 100% | Amazon | Dec. 2016/ 10.0 Yrs | 362,600 | $48.00 | NNN |
Source:Third party market research report
| (1) | Represents Apple’s rent payment on Phase I in February 2019 and Phase II in June 2019. Apple is currently in a free rent period for (i) Phase 1 (approximately 69.4% of its space) through and including December 2018 and (ii) Phase 2 (approximately 30.6% of its space) through and including May 2019. Through and including February 2018, Apple is required to pay reimbursements for utilities only, and commencing March 2018, the tenant will be required to pay reimbursements for utilities, operating expenses, taxes and insurance. All future rent credits and abatements under the Apple lease were reserved at the origination of the Apple Campus 3 Whole Loan (see “Escrows and Reserves” section). The tenant’s underwritten rent of $48.35 PSF represents the average rent over its remaining lease term. |
Underwritten Net Cash Flow.The following table presents certain information relating to the Underwritten Net Cash Flow at the Apple Campus 3 Property:
| Cash Flow Analysis(1) | ||
| UW | UW PSF | |
| Base Rent(2) | $42,675,300 | $48.35 |
| Total Recoveries | $3,981,816 | $4.51 |
| Other Income | $0 | $0.00 |
| Less Vacancy & Credit Loss | ($466,571)(3) | ($0.53) |
| Effective Gross Income | $46,190,545 | $52.33 |
| Total Operating Expenses | $4,804,932 | $5.44 |
| Net Operating Income | $41,385,613 | $46.89 |
| Replacement Reserves | $176,531 | $0.20 |
| Tenant Improvements | $0 | $0.00 |
| Leasing Commissions | $0 | $0.00 |
| Net Cash Flow | $41,209,082 | $46.69 |
| Occupancy %(3) | 100.0% | |
| NOI DSCR(4) | 3.57x | |
| NCF DSCR(4) | 3.55x | |
| NOI Debt Yield(4) | 12.2% | |
| NCF Debt Yield(4) | 12.1% | |
| (1) | Historical operating statements are not *applicable, as the Apple Campus 3 Property was built in 2017. |
| (2) | Base Rent reflects the average rent over the lease term (see “Tenant Summary” above). |
| (3) | The underwritten economic vacancy is 1.0%. The Apple Campus 3 Property was 100.0% leased as of April 1, 2018. |
| (4) | The debt service coverage ratios and debt yields are based on the Apple Campus 3 Whole Loan. |
Escrows and Reserves. The Apple Campus 3 Borrower deposited at loan origination $42,706,326 for rent abatement periods, $2,979,839 for outstanding TI/LCs, and $93,750 for the estimated cost to complete outstanding punchlist items. The Apple Campus 3 Whole Loan documents provide for ongoing monthly escrows of $249,368 for real estate taxes. The Apple Campus 3 Whole Loan documents provide for additional reserves in the amount of 125% of any additional punchlist items received from Apple (following origination, an additional $506,100 was deposited due to additional punchlist items identified by Apple).
The Apple Campus 3 Whole Loan documents do not require ongoing monthly escrows for insurance premiums as long as (i) no event of default has occurred and is continuing; (ii) the Apple Campus 3 Borrower provides the lender with evidence that the Apple Campus 3 Property’s insurance coverage is included in a blanket policy and such policy is in full force and effect; and (iii) the Apple Campus 3 Borrower pays all applicable insurance premiums and provides the lender with evidence of renewals. The Apple Campus 3 Whole Loan documents do not require ongoing monthly escrows for replacement reserves as long as no Cash Trap Event Period (as defined in “Lockbox and Cash Management” below) has occurred and is continuing.
This is not a research report and was not prepared by any Underwriter’s research department. Please see additional important information and qualifications at the end of this Term Sheet. |
| T-52 |
| BANK 2018-BNK11 | Apple Campus 3 |
Lockbox and Cash Management. The Apple Campus 3 Whole Loan requires a lender-controlled lockbox account, which is in place, and that the Apple Campus 3 Borrower directs the tenant to pay its rent directly into such lockbox account. The Apple Campus 3 Whole Loan documents also require that all rents received by the Apple Campus 3 Borrower or the property manager be deposited into the lockbox account within one business day of receipt. All funds in the lockbox account are required to be swept each business day into the cash management account controlled by the lender and disbursed on each payment date in accordance with the loan documents. Prior to the occurrence of a Cash Trap Event Period (as defined below), all excess funds are required to be distributed to the Apple Campus 3 Borrower. During a Cash Trap Event Period, all excess funds are required to be swept to a lender-controlled cash management account. During a Lease Sweep Period (as defined below), the Apple Campus 3 Borrower is required to make minimum monthly deposits of $1,838,869 into a leasing reserve (regardless of the amount of available excess cash flow).
A “Cash Trap Event Period” will commence upon the earlier of the following:
| (i) | the occurrence of an event of default under the Apple Campus 3 Whole Loan, the Apple Campus 3 Senior Mezzanine Loan or the Apple Campus 3 Junior Mezzanine Loan (see “Mezzanine Loan and Preferred Equity” section); |
| (ii) | the occurrence of a Lease Sweep Period (as defined below); |
| (iii) | the debt service coverage ratio based on the Apple Campus 3 Whole Loan falling below 1.85x (based on a hypothetical 30-year amortization period), or the debt service coverage ratio based on the Apple Campus 3 Total Debt (see “Mezzanine Loan and Preferred Equity” section) falling below 1.10x (based on a hypothetical 30-year amortization period) at the end of any calendar quarter; or |
| (iv) | the ARD. |
A Cash Trap Event Period will end upon the occurrence of the following:
| ● | with regard to clause (i), the cure of such event of default; |
| ● | with regard to clause (ii), a Lease Sweep Period Cure Event (as defined below); |
| ● | with regard to clause (iii), the debt service coverage ratio based on the Apple Campus 3 Whole Loan (based on a hypothetical 30-year amortization schedule) being equal to 1.85x or greater, and the debt service coverage ratio based on the Apple Campus 3 Total Debt (based on a hypothetical 30-year amortization schedule) being equal to 1.10x or greater for two consecutive calculation dates; or |
| ● | with regard to clause (iv), the Apple Campus 3 Whole Loan being repaid in full. |
A “Lease Sweep Period” will commence upon the earlier of the following (for clauses (i), (iii), (iv) and (v) below, the term ‘Apple’ includes any replacement tenant that occupies at least 75% of the space currently occupied by Apple):
| (i) | Apple cancels, terminates or gives notice of its intent to cancel or terminate its lease on at least 40,000 square feet; |
| (ii) | Apple is no longer an Investment Grade Entity (as defined below); |
| (iii) | Apple goes dark in 20% or more of its space; provided, however, that a Lease Sweep Period will not commence as long as Apple remains an Investment Grade Entity; |
| (iv) | Apple defaults under its lease beyond any applicable notice and cure period; or |
| (v) | Apple becomes insolvent or files for bankruptcy. |
A “Lease Sweep Period Cure Event” will occur upon the following:
| ● | with regard to clause (i), (a) a Qualified Re-Leasing Event (as defined below), or (b) total swept funds equating to $35.00 per square foot of such applicable space (or the Apple Campus 3 Borrower delivering to the lender an acceptable letter of credit in such amount); |
| ● | with regard to clauses (ii) or (iii), (a) a Qualified Re-Leasing Event, (b) Apple restoring its status as an Investment Grade Entity; (c) the applicable space being subleased to an Investment Grade Entity who has accepted delivery of the space and is paying unabated rent in an amount no less than the contract rate of the primary lease; or (d) total swept funds equating to $50.00 per square foot of (x) the Apple lease space with respect to clause (ii) and (y) the applicable space with respect to clause (iii) (or Apple Campus 3 Borrower delivering to the lender an acceptable letter of credit in such amount); provided, however, that once total swept funds in the leasing reserve equate to $35.00 per square foot of the applicable space, additional funds will be deposited into a debt service reserve account until such $50.00 per square foot cap is met; |
| ● | with regard to clause (iv), (a) the cure of such event of default and no other default occurring for a period of three consecutive months, or (b) total swept funds equating to $35.00 per square foot (or Apple Campus 3 Borrower delivering to the lender an acceptable letter of credit in such amount); |
| ● | with regard to clause (v), the bankruptcy or insolvency proceedings having terminated and the lease having been affirmed or assigned in a manner satisfactory to the lender. |
An “Investment Grade Entity” means an entity that is rated ‘BBB-’, or equivalent, or higher by at least two of Fitch, Moody’s and S&P.
A “Qualified Re-Leasing Event” will occur upon one or more replacement tenants acceptable to lender executing leases covering at least 75% of the space currently occupied by Apple with (i) terms extending at least three years beyond the maturity date of the Apple Campus 3 Whole Loan (April 6, 2031); (ii) economic terms at least as favorable as those in the lease being replaced; (iii) such replacement tenants having taken possession of such space and paying full unabated rent or any such abatement has been reserved; (iv) and all tenant improvements and leasing commissions having been paid or reserved.
Additional Secured Indebtedness (not including trade debts).The Apple Campus 3 Property also secures the Apple Campus 3 Non-Serviced Pari Passu Companion Loans, which have an aggregate Cut-off Date principal balance of $277,000,000. The Apple Campus 3 Non-Serviced Pari Passu Companion Loans accrue interest at the same rate as the Apple Campus 3 Mortgage Loan. The Apple Campus 3 Mortgage Loan is entitled to payments of interest and principal on a pro rata and pari passu basis with the Apple Campus 3 Non-Serviced Pari Passu Companion Loans. The holders of the Apple Campus 3 Mortgage Loan and the Apple Campus 3 Non-Serviced Pari Passu Companion Loans have entered into a co-lender agreement which sets forth the allocation of collections on the Apple Campus 3 Whole Loan. See “Description of the Mortgage Pool—The Whole Loans—The Non-Serviced Pari Passu Whole Loans” in the Preliminary Prospectus.
Mezzanine Loan and Preferred Equity. Wells Fargo Bank, National Association; Deutsche Bank AG, New York Branch; and Goldman Sachs Mortgage Company funded a $117,500,000 senior mezzanine loan (the “Apple Campus 3 Senior Mezzanine Loan”) to CW Mezz LLC (the “Apple Campus 3 Senior Mezzanine Loan Borrower”) and a $117,500,000 junior mezzanine loan (the “Apple Campus 3 Junior Mezzanine Loan”) to Central Wolfe LLC (the “Apple Campus 3 Junior Mezzanine Loan Borrower”)(collectively, the Apple Campus 3 Whole Loan, Apple Campus 3 Senior Mezzanine Loan and Apple Campus 3 Junior Mezzanine Loan are referred to herein as the “Apple Campus 3 Total Debt”). The Apple Campus 3 Senior Mezzanine loan has since been sold to Athene Annuity and Life Company American Equity Investment Life Insurance Company and Midland National Life Insurance Company and the Apple Campus 3 Junior Mezzanine Loan has since been sold to CPPIB Credit Investments II Inc. The Apple Campus 3 Senior
This is not a research report and was not prepared by any Underwriter’s research department. Please see additional important information and qualifications at the end of this Term Sheet. |
| T-53 |
| BANK 2018-BNK11 | Apple Campus 3 |
Mezzanine Loan and the Apple Campus 3 Junior Mezzanine Loan are coterminous with the Apple Campus 3 Whole Loan and require interest-only payments. The Apple Campus 3 Senior Mezzanine Loan is secured by a pledge of the 100% interest of the Apple Campus 3 Senior Mezzanine Loan Borrower in the Apple Campus 3 Borrower, and the Apple Campus 3 Junior Mezzanine loan is secured by a pledge of the 100% interest of the Apple Campus 3 Junior Mezzanine Loan Borrower in the Apple Campus 3 Senior Mezzanine Loan Borrower. The Apple Campus 3 Senior Mezzanine Loan accrues interest at a fixed interest rate equal to 4.620% per annum (the “Senior Mezzanine Initial Interest Rate”), and the Apple Campus 3 Junior Mezzanine Loan accrues interest at a fixed interest rate equal to 6.000% per annum (the “Junior Mezzanine Initial Interest Rate”). In the event the Apple Campus 3 Senior Mezzanine Loan and/or the Apple Campus 3 Junior Mezzanine Loan are not repaid in full on or before the ARD, the applicable mezzanine borrower will be required to make interest payments based on an interest rate equal to the greater of (i) the Senior Mezzanine Initial Interest Rate or the Junior Mezzanine Initial Interest Rate, as applicable, plus 1.500% per annum, and (ii) the 10-year swap rate plus 1.500% per annum; provided, however, that upon the occurrence and continuance of an event of default, the interest rate will be equal to (1) the greater of (i) and (ii), plus (2) 5.000%. An intercreditor agreement is in place with respect to the Apple Campus 3 Whole Loan, the Apple Campus 3 Senior Mezzanine Loan and the Apple Campus 3 Junior Mezzanine Loan.
The following table presents certain information relating to the Apple Campus 3 Senior Mezzanine Loan and Apple Campus 3 Junior Mezzanine Loan:
| Mezzanine Debt Summary | |||||||||
Mezzanine Debt Original Principal Balance | Mezzanine Debt Interest Rate | Original Term to | Original Amort. Term (mos.) | Original IO Term (mos.) | Total Debt UW NCF DSCR | Total Debt UW NOI Debt Yield | Total Debt Cutoff Date LTV | ||
| Senior Mezzanine Loan | $117,500,000 | 4.6200% | 120 | 0 | 120 | 2.41x | 9.0% | 59.1% | |
| Junior Mezzanine Loan | $117,500,000 | 6.0000% | 120 | 0 | 120 | 1.70x | 7.2% | 74.3% | |
Release of Property. Not permitted.
Right of First Offer.Apple has a right of first offer to purchase the Apple Campus 3 Property if the Apple Campus 3 Borrower markets the Apple Campus 3 Property for sale (the “Apple ROFO”). The Apple ROFO is not extinguished by foreclosure; however, the Apple ROFO does not apply to foreclosure or deed-in-lieu thereof.
Terrorism Insurance.The Apple Campus 3 Whole Loan documents require that the “all risk” insurance policy required to be maintained by the Apple Campus 3 Borrower provide coverage for terrorism in an amount equal to the full replacement cost of the Apple Campus 3 Property, as well as business interruption insurance covering no less than the 24-month period following the occurrence of a casualty event, together with a 12-month extended period of indemnity. See “Risk Factors—Risks Relating to the Mortgage Loans—Terrorism Insurance May Not Be Available for All Mortgaged Properties” in the Preliminary Prospectus.
This is not a research report and was not prepared by any Underwriter’s research department. Please see additional important information and qualifications at the end of this Term Sheet. |
| T-54 |
(THIS PAGE INTENTIONALLY LEFT BLANK)
| T-55 |
| BANK 2018-BNK11 | One Dulles Tower |
Mortgage Loan No. 4 – One Dulles Tower
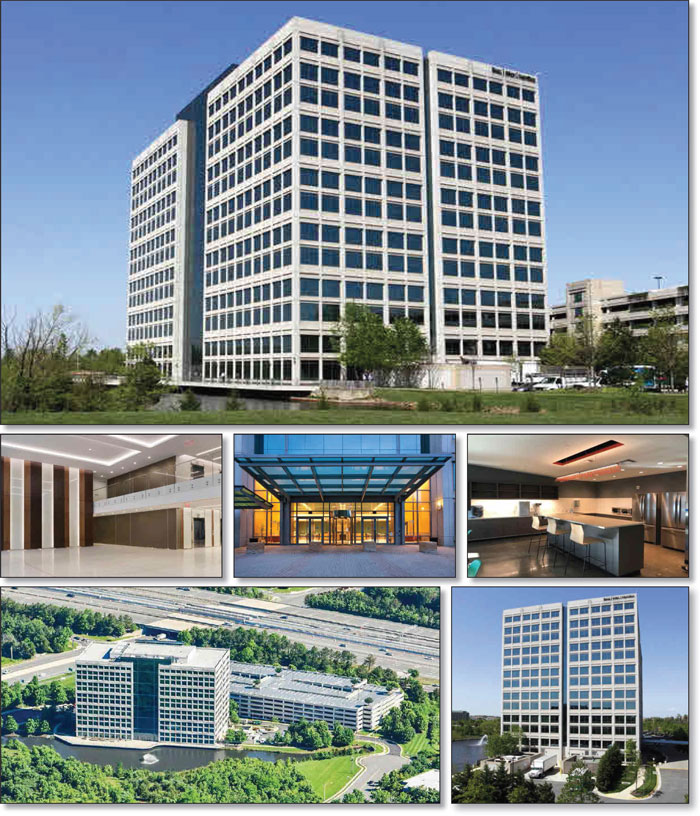
This is not a research report and was not prepared by any Underwriter’s research department. Please see additional important information and qualifications at the end of this Term Sheet. |
| T-56 |
| BANK 2018-BNK11 | One Dulles Tower |
Mortgage Loan No. 4 – One Dulles Tower
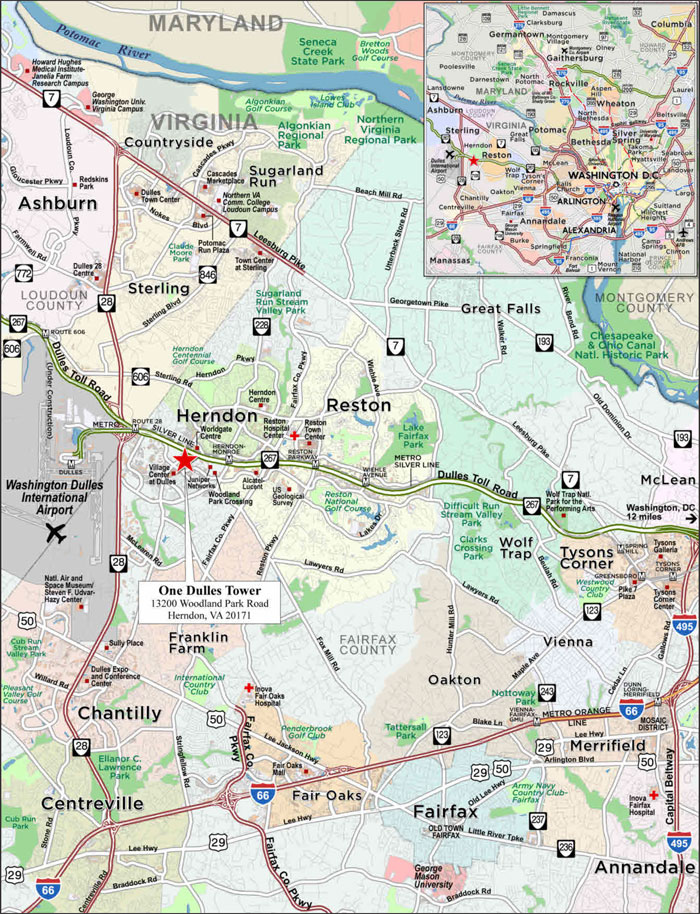
This is not a research report and was not prepared by any Underwriter’s research department. Please see additional important information and qualifications at the end of this Term Sheet. |
| T-57 |
| BANK 2018-BNK11 | One Dulles Tower |
| Mortgage Loan No. 4 – One Dulles Tower |
| Mortgage Loan Information | Property Information | |||||
| Mortgage Loan Seller: | WFB | Single Asset/Portfolio: | Single Asset | |||
| Original Balance(1): | $63,000,000 | Location: | Herndon, VA 20171 | |||
| Cut-off Date Balance(1): | $63,000,000 | General Property Type: | Office | |||
| % of Initial Pool Balance: | 9.2% | Detailed Property Type: | Suburban | |||
| Loan Purpose: | Acquisition | Title Vesting: | Fee | |||
| Sponsor: | HGGP Capital VIII, LLC; HGGP Capital IX, LLC; HGGP Capital X, LLC; HGGP Capital XI, LLC; HGGP Capital XII, LLC | Year Built/Renovated: Size: | 2002/2018 403,622 SF | |||
| Mortgage Rate: | 3.9860% | Cut-off Date Balance per SF(1): | $377 | |||
| Note Date: | 2/28/2018 | ARD Balance per SF(1): | $377 | |||
| First Payment Date: | 4/11/2018 | Property Manager: | Harbor Group Management Co., | |||
| Anticipated Repayment Date(2): | 3/11/2028 | LLC (borrower related) | ||||
| Maturity Date(2): | 9/30/2029 | |||||
| Original Term to ARD: | 120 months | |||||
| Original Amortization Term: | 0 months | Underwriting and Financial Information | ||||
| IO Period: | 120 months | UW NOI: | $13,412,732 | |||
| Seasoning: | 1 month | UW NOI Debt Yield(1): | 8.8% | |||
| Prepayment Provisions(3): | LO (25); DEF (91); O (4) | UW NOI Debt Yield at ARD(1): | 8.8% | |||
| Lockbox/Cash Mgmt Status: | Hard/In Place | UW NCF DSCR(1): | 2.17x | |||
| Additional Debt Type(1)(4): | Pari Passu | Most Recent NOI(6): | N/A | |||
| Additional Debt Balance(1)(4): | $89,000,000 | 2nd Most Recent NOI(6): | N/A | |||
| Future Debt Permitted (Type): | No (N/A) | 3rd Most Recent NOI(6): | N/A | |||
| Reserves(5) | Most Recent Occupancy: | 100.0% (4/1/2018) | ||||
| Type | Initial | Monthly | Cap | 2nd Most Recent Occupancy(6): | N/A | |
| Taxes: | $405,537 | $135,179 | N/A | 3rd Most Recent Occupancy(6): | N/A | |
| Insurance: | $0 | Springing | N/A | Appraised Value (as of)(7): | $212,500,000 (1/18/2018) | |
| Replacement Reserves: | $0 | Springing | N/A | Cut-off Date LTV Ratio(1)(7): | 71.5% | |
| TI/LC Reserves: | $0 | Springing | N/A | ARD LTV Ratio(1)(7): | 71.5% | |
| Rent Concession Reserve: | $15,974,928 | $0 | N/A | |||
| Existing TI/LC Reserve: | $26,466,135 | $0 | N/A | |||
| Sources and Uses | ||||||
| Sources | Proceeds | % of Total | Uses | Proceeds | % of Total | |
| Loan Amount: | $152,000,000 | 64.3% | Purchase Price: | $226,000,000 | 95.7% | |
| Borrower Sponsor Equity: | $84,255,427 | 35.7% | Reserves: | $42,846,600 | 18.1% | |
| Seller Tenant Improvement Allowance Credit(8): | ($26,466,136) | (11.2%) | ||||
| Other Seller Credit(9): | ($16,660,323) | (7.1%) | ||||
| Closing costs: | $10,535,285 | 4.5% | ||||
| Total Sources: | $236,255,427 | 100.0% | Total Uses: | $236,255,427 | 100.0% | |
| (1) | The One Dulles Tower Mortgage Loan (as defined below) is part of the One Dulles Tower Whole Loan (as defined below), which is comprised of two pari passu notes with an aggregate original principal balance of $152,000,000. The Cut-off Date Balance per SF, ARD Balance per SF, UW NOI Debt Yield, UW NOI Debt Yield at ARD, UW NCF DSCR, Cut-off Date LTV Ratio and ARD LTV Ratio numbers presented are based on the One Dulles Tower Whole Loan. |
| (2) | The One Dulles Tower Mortgage Loan has an anticipated repayment date of March 11, 2028 and a final maturity date of September 30, 2029. See “The Mortgage Loan” for further discussion of the ARD. |
| (3) | Defeasance of the One Dulles Tower Whole Loan is permitted at any time after the earlier of (i) April 11, 2021 and (ii) two years from the closing date of the securitization that includes the last pari passu note of the One Dulles Tower Whole Loan to be securitized. The assumed lockout period of 25 payments is based on the closing date of this transaction in April 2018. |
| (4) | See “The Mortgage Loan” and “Additional Secured Indebtedness (not including trade debts)” below for a discussion of the additional debt. |
| (5) | See “Escrows and Reserves” below for further discussion of reserve requirements. |
| (6) | Historical occupancy and financial information is not available as the borrower sponsor recently acquired the One Dulles Tower Property (as defined below) and such information was not provided by the seller. |
| (7) | The Appraised Value, Cut-off Date LTV Ratio and ARD LTV Ratio are based on the appraiser’s Market Value as if Stabilized, which assumes that contractual tenant improvement and leasing commission (“TI/LC”) obligations have been fulfilled and there is no outstanding free rent. The One Dulles Tower Borrower (as defined below) deposited upfront reserves totaling $42,441,063 for such contractual TI/LC obligations and free rent (see “Escrows and Reserves” below). The appraiser concluded to an as-is Appraised Value is $189,800,000 (as of January 18, 2018), which would result in a Cut-off Date LTV Ratio of 80.1% and ARD LTV Ratio of 80.1%. The appraiser also concluded to a Hypothetical Market Value (Go Dark Value) of $127,600,000 as of January 1, 2020, which assumes the completion of all tenant improvement work associated with the Amazon lease. |
| (8) | Represents outstanding tenant improvements related to Amazon Web Services. |
| (9) | Represents Estimated 2018 Unpaid Real Estate Taxes ($247,556), 2018 Real Estate Tax Credit ($394,261) and Income Support ($16,018,506). |
This is not a research report and was not prepared by any Underwriter’s research department. Please see additional important information and qualifications at the end of this Term Sheet. |
| T-58 |
| BANK 2018-BNK11 | One Dulles Tower |
The Mortgage Loan. The fourth largest mortgage loan (the “One Dulles Tower Mortgage Loan”) is part of a whole loan (the “One Dulles Tower Whole Loan”) evidenced by two pari passu promissory notes (Notes A-1 and A-2) in the aggregate original principal amount of $152,000,000 which are secured by a first priority fee mortgage encumbering a 403,622 square foot, 13-story, class A, single-tenant office building located in Herndon, Virginia (the “One Dulles Tower Property”).
The One Dulles Tower Whole Loan has an anticipated repayment date of March 11, 2028 (the “ARD”) and a maturity date of September 30, 2029. Prior to the ARD, the One Dulles Tower Whole Loan accrues interest at a fixed rate of 3.9860% (the “Initial Interest Rate”) and requires payments of interest only through the ARD. In the event the One Dulles Tower Whole Loan is not repaid in full on or before the ARD, the One Dulles Tower Borrower will be required to make interest payments based on an interest rate equal to 3.50% plus the greater of (a) the Initial Interest Rate and (b) the sum of (1) the 10-year treasury rate, (2) the mid market 10-year swap spread and (3) 1.64% (the “Adjusted Interest Rate”). The ARD automatically triggers a Cash Trap Event Period (see“Lockbox and Cash Management” section) whereby all excess cash flow after payment of debt service, budgeted operating expenses and required deposits to reserves is required to be used to pay down the principal balance of the One Dulles Tower Whole Loan. From and after the ARD, the portion of interest in excess of the Initial Interest Rate will not be included in the monthly debt service payment, but rather shall accrue and is payable once the principal balance of the One Dulles Tower Whole Loan is paid in full. See “Description of the Mortgage Pool—Certain Terms of the Mortgage Loans—ARD Loans” in the Preliminary Prospectus.
The non-controlling promissory Note A-1 in the original principal amount of $63,000,000 represents the One Dulles Tower Mortgage Loan and will be included in the BANK 2018-BNK11 securitization trust. The controlling promissory Note A-2 in the original principal amount of $89,000,000 (the “One Dulles Tower Pari Passu Companion Loan”), is currently held by Wells Fargo Bank, National Association and is expected to be contributed to a future securitization trust or trusts. The One Dulles Tower Mortgage Loan will initially be serviced pursuant to the pooling and servicing agreement for the BANK 2018-BNK11 securitization trust, and from and after the securitization of the controlling Note A-2, will be serviced pursuant to the pooling and servicing agreement for the securitization to which Note A-2 is contributed. See “Description of the Mortgage Pool—The Whole Loans— The Serviced Pari Passu Whole Loans” and “—The Non-Serviced Pari Passu Whole Loans” and “Pooling and Servicing Agreement” in the Preliminary Prospectus. The proceeds of the One Dulles Tower Whole Loan, along with cash equity from the One Dulles Tower Borrower, were primarily used to acquire the One Dulles Tower Property, fund reserves and pay closing costs.
| One Dulles Tower Whole Loan Summary | ||||
| Note | Original Balance | Cut-off Date Balance | Note Holder | Controlling Piece |
| A-1 | $63,000,000 | $63,000,000 | BANK 2018-BNK11 | No |
| A-2 | $89,000,000 | $89,000,000 | Wells Fargo Bank, N.A. | Yes |
| Total | $152,000,000 | $152,000,000 | ||
The Borrowers and the Sponsors. The borrowers comprise five tenants in common: One Dulles Associates, LLC; Madison One Dulles, LLC; EF One Dulles, LLC; FF One Dulles, LLC; and 255 West One Dulles, LLC (collectively, the “One Dulles Tower Borrower”), each a Delaware limited liability company and single purpose entity with two independent directors. Legal counsel to the One Dulles Tower Borrower delivered a non-consolidation opinion in connection with the origination of the One Dulles Tower Whole Loan. The sponsors and the nonrecourse carve-out guarantors of the One Dulles Tower Whole Loan comprise five limited liability companies related to Harbor Group International: HGGP Capital VIII, LLC; HGGP Capital IX, LLC; HGGP Capital X, LLC; HGGP Capital XI, LLC; and HGGP Capital XII, LLC.
Harbor Group International is a privately held real estate firm based in Norfolk, Virginia. Founded in 1981, Harbor Group International provides international real estate management and investment services. As of March 2018, Harbor Group International owned and managed more than 193 commercial real estate assets, 30,000 multifamily units, and 4.8 million square feet of commercial space.
The Property. The One Dulles Tower Property comprises a 13-story, LEED Silver, class A office building totaling 403,622 square feet and located in Herndon, Virginia, approximately four miles east of the Washington Dulles International Airport (“Dulles Airport”). The One Dulles Tower Property is situated atop a large fiber optic “backbone” line and has direct access to a “dark fiber” (high-capacity fiber optic infrastructure that is run on a private network rather than by an internet service provider) trunk line, enabling high data use throughout the building. The One Dulles Tower Property, which was built in 2002 and previously occupied by Booz Allen Hamilton through 2015, underwent an approximately $11.1 million renovation from 2016 to 2017, which included a new building lobby/entryway, fitness center, conference center, elevator cabs, restrooms, and garage resurfacing. The One Dulles Tower Property contains a dedicated 6-story parking structure totaling 1,590 spaces, resulting in a parking ratio of 3.9 spaces per 1,000 square feet of rentable area.
As of April 1, 2018, the One Dulles Tower Property was 100.0% leased to Amazon Fulfillment Services, Inc. with Amazon.com Inc. (“Amazon”; NYSE: AMZN; rated Baa1/AA- by Moody’s/S&P, respectively) as lease guarantor. Amazon provides a $53,600,646 lease guaranty, which is reduced monthly, to a minimum of $26,907,558 in August 2024. Amazon’s 12-year lease commenced on October 1, 2017 and has an expiration date of September 30, 2029 with four, 5-year renewal options. The One Dulles Tower Property is expected to serve as the east coast headquarters for Amazon Web Services (“AWS”), which is a secure cloud services platform offering more than 70 services for computation, storage, databases, analytics, mobile, Internet of Things, and enterprise applications. As of January 31, 2018, AWS had more than one million active customers throughout 190 countries across various sectors including web applications, big data, storage, media and gaming, and healthcare and life sciences. Notable customers currently running web applications on AWS include Expedia, Netflix, Coursera, and Unilever. As of the fourth quarter of 2017, AWS’ operating income reportedly grew by 39% from the previous year to $4.3 billion, which equates to approximately 105% of the total operating income for Amazon.com Inc. (due to an operating loss in a different segment of the parent company). The One Dulles Tower Property is expected to be primarily used by AWS for general office, research & development and training and testing related to software, hardware and electronic components.
The One Dulles Tower Property comprises two premises: “Tier 1” comprises floors 1-7, totaling 209,420 square feet, and “Tier 2” comprises floors 8-13, totaling 194,202 square feet. As of April 1, 2018, Amazon was in occupancy of Tier 1 and was constructing its interior improvements in Tier 2 with an expected completion date of May 2018. Amazon is required to commence rent payments on Tier 1 and Tier 2 in October 2018 and January 2020, respectively. Approximately $15,974,928 was reserved for rent abatement periods at origination of the One Dulles Tower Whole Loan (See“Escrows and Reserves” below).
This is not a research report and was not prepared by any Underwriter’s research department. Please see additional important information and qualifications at the end of this Term Sheet. |
| T-59 |
| BANK 2018-BNK11 | One Dulles Tower |
The following table presents certain information relating to the tenancy at the One Dulles Tower Property:
| Tenant Summary | |||||||
| Tenant Name | Credit Rating (Fitch/Moody's/S&P)(1) | Tenant SF | Approximate % of SF | Annual UW Rent | % of Total Annual UW Rent | Annual UW Rent PSF | Lease Expiration |
| Major Tenant | |||||||
| Amazon(2) | NR/Baa1/AA- | 403,622 | 100.0% | $16,537,837(3) | 100.0% | $40.97(3) | 9/30/2029(4)(5) |
| Subtotal/Wtd. Avg. | 403,622 | 100.0% | $16,537,837 | 100.0% | $40.97 | ||
| Vacant Space | 0 | 0.0% | $0 | 0.0% | $0.00 | ||
| Total/Wtd. Avg. | 403,622 | 100.0% | $16,537,837 | 100.0% | $40.97 | ||
| (1) | The lease guarantor is Amazon.com Inc., which is the rated entity. Amazon provides a $53,600,646 million lease guaranty, which is reduced monthly, to a minimum of $26,907,558 million in August 2024. |
| (2) | Amazon is currently in occupancy of Tier 1, and is currently constructing its interior improvements on Tier 2 with an expected completion date of May 2018 (see“The Property”section for definitions of Tier 1 and Tier 2). |
| (3) | Annual UW Rent and Annual UW Rent PSF reflect the average rent through the ARD. Amazon is currently in a free rent period for (i) Tier 1 (approximately 51.9% of its space) through and including September 2018 and (ii) Tier 2 (approximately 48.1% of its space) through and including December 2019. Amazon is required to begin paying Annual UW Rent PSF of $36.37 on Tier 1 in October 2018 and $37.32 on Tier 2 in January 2020. Approximately $15,974,928 was reserved at origination of the One Dulles Tower Whole Loan with respect to rent abatement periods (See“Escrows and Reserves” section). |
| (4) | Amazon has four, 5-year renewal options at fair market value with 16 months’ notice. |
| (5) | Amazon has a one-time contraction option of any contiguous floors within Tier 2 (floors 8-13), beginning with the 13th floor and moving down, effective on April 30, 2028 with 15 months’ notice and payment of a fee equal to $25.05 per square foot of contracted space, of which 50% will be due within 60 days of the delivery of the contraction notice and the remaining 50% will be due on the effective date. |
The following table presents certain information relating to the lease rollover schedule at the One Dulles Tower Property:
| Lease Rollover Schedule(1)(2) | ||||||||
| Year | # of Leases Rolling | SF Rolling | Annual UW Rent PSF Rolling | Approx. % of Total SF Rolling | Approx. Cumulative % of SF Rolling | Total UW Rent Rolling | Approx. % of Total Rent Rolling | Approx. Cumulative % of Total Rent Rolling |
| MTM | 0 | 0 | $0.00 | 0.0% | 0.0% | $0 | 0.0% | 0.0% |
| 2018 | 0 | 0 | $0.00 | 0.0% | 0.0% | $0 | 0.0% | 0.0% |
| 2019 | 0 | 0 | $0.00 | 0.0% | 0.0% | $0 | 0.0% | 0.0% |
| 2020 | 0 | 0 | $0.00 | 0.0% | 0.0% | $0 | 0.0% | 0.0% |
| 2021 | 0 | 0 | $0.00 | 0.0% | 0.0% | $0 | 0.0% | 0.0% |
| 2022 | 0 | 0 | $0.00 | 0.0% | 0.0% | $0 | 0.0% | 0.0% |
| 2023 | 0 | 0 | $0.00 | 0.0% | 0.0% | $0 | 0.0% | 0.0% |
| 2024 | 0 | 0 | $0.00 | 0.0% | 0.0% | $0 | 0.0% | 0.0% |
| 2025 | 0 | 0 | $0.00 | 0.0% | 0.0% | $0 | 0.0% | 0.0% |
| 2026 | 0 | 0 | $0.00 | 0.0% | 0.0% | $0 | 0.0% | 0.0% |
| 2027 | 0 | 0 | $0.00 | 0.0% | 0.0% | $0 | 0.0% | 0.0% |
| 2028 | 0 | 0 | $0.00 | 0.0% | 0.0% | $0 | 0.0% | 0.0% |
| 2029 & Beyond | 1 | 403,622 | $40.97 | 100.0% | 100.0% | $16,537,837 | 100.0% | 100.0% |
| Vacant | 0 | 0 | $0.00 | 0.0% | 100.0% | $0 | 0.0% | 100.0% |
| Total/Wtd. Avg. | 1 | 403,622 | $40.97 | 100.0% | $16,537,837 | 100.0% | ||
| (1) | Information is based on the underwritten rent roll. |
| (2) | Certain tenants may have lease termination options that are exercisable prior to the originally stated expiration date of the subject lease and that are not considered in the lease rollover schedule. |
The Market. The One Dulles Tower Property is located in Herndon, Virginia, approximately four miles east of the Dulles Airport and 25 miles northwest of Washington D.C. Situated at the intersection of Routes 267 and 657, the One Dulles Tower Property is less than one mile from two planned public transportation stations along the Silver Line Metrorail, which are anticipated for completion in 2020. Upon completion, the Silver Line is expected to provide access between Dulles Airport and Washington, D.C.
The One Dulles Tower Property is located along Route 267 (Dulles Toll Road), within the Dulles Technology Corridor, which comprises over 30,000 research-, technological-, and development-related companies and a concentration of telecom and satellite companies. According to the appraisal, the Dulles Technology Corridor provides approximately 380,000 jobs, or 27% of total employment in Fairfax County. Furthermore, according to a news publication, an estimated 70% of global internet traffic passes through the corridor daily. The One Dulles Tower Property is located in the Woodland Park neighborhood, which offers tenant amenities including restaurants, various retail options, and residential developments including Woodland Park Crossing, Worldgate Centre and Waterview at Woodland Park. Woodland Park Crossing is a 137,038 square foot mixed use community shopping center less than one mile southeast of the One Dulles Tower Property anchored by a Harris Teeter Grocery store with additional tenants including Panera Bread, Starbucks, Manhattan Pizza and Capital One Bank. Worldgate Centre is a 229,568 square foot lifestyle center featuring a 9-screen AMC movie theatre and a Sport&Health facility, located a half mile north of the One Dulles Tower Property. Waterview at Woodland Park is a planned residential development anticipated to open in May of 2018 that is expected to include 383 apartments and townhomes located on the opposite side of the lake behind the One Dulles Tower Property. According to a third-party market research report, the 2017 estimated population within a three- and five-mile radius of the One Dulles Tower Property was 112,706, and 217,098, respectively; while the 2017 estimated median household income within the same radii was $113,548, and $117,335, respectively.
This is not a research report and was not prepared by any Underwriter’s research department. Please see additional important information and qualifications at the end of this Term Sheet. |
| T-60 |
| BANK 2018-BNK11 | One Dulles Tower |
According to the appraisal, the One Dulles Tower Property is located within the Dulles Corridor submarket of the Washington, D.C. office market. As of the fourth quarter of 2017, the submarket contained approximately 58.1 million square feet of office space exhibiting a vacancy rate of approximately 15.3%. The appraiser identified 10 comparable office properties totaling approximately 2.2 million square feet, with a weighted average occupancy rate of 95.9% and average asking rent of $36.57 per square foot, full service. Each of the 10 comparable properties contains large block space with the largest tenant occupying greater than 30,000 SF and was built in 2000 or later.
The following table presents certain information relating to comparable office leases for the One Dulles Tower Property:
| Comparable Leases Summary | ||||||||
| Property Name/Location | Year Built | Size SF | Total Occupancy | Tenant Name | Lease Date/Term | Lease Area (SF) | Annual In Place Rent PSF | Lease Type |
| One Dulles Tower Property | 2002 | 403,622 | 100% | Amazon | Oct. 2017/ 12.0 Yrs | 403,622 | $36.37(1) | Full Service |
Monument III 12930 Worldgate Dr. Herndon, VA | 2006 | 193,138 | 62.2% | Serco | Dec. 2017/ 11.0 Yrs | 83,308 | $33.00 | Full Service |
Summit at Reston 1 & 2 2000-2002 Edmund Halley Reston, VA | 1988 | 293,606 | 100% | Noblis Inc. | Jan. 2017/ 12.0 Yrs | 155,048 | $29.00 | Full Service |
Dulles Station West 2300 Dulles Station Blvd. Herndon, VA | 2007 | 177,712 | 94.8% | National Student | Sep. 2016/ 17.8 Yrs | 45,165 | $37.41 | Full Service |
Confidential | 1998 | 323,243 | N/A | Confidential | Aug. 2016/ 11.0 Yrs | 32,481 | $35.50 | Full Service |
John Marshall Building 8283 Greensboro Dr. McLean, VA | 1996 | 223,000 | 100% | Booz Allen Hamilton | Feb. 2016/ 10.0 Yrs | 222,989 | $32.00 | Full Service |
Confidential | 2000 | 184,887 | N/A | Confidential | Aug. 2015/ 5.0 Yrs | 182,867 | $34.00 | Full Service |
Source:Appraisal and third party reports
| (1) | Represents Amazon’s rent payment on Tier 1 commencing in October 2018 (Amazon is required to commence paying rent of $37.32 PSF on Tier 2 in January 2020). Amazon is currently in a free rent period for (i) Tier 1 (approximately 51.9% of its space) through and including September 2018 and (ii) Tier 2 (approximately 48.1% of its space) through and including December 2019. Approximately $15,974,928 was reserved at origination of the One Dulles Tower Whole Loan with respect to rent abatement periods (See“Escrows and Reserves”section). The tenant’s underwritten rent of $40.97 PSF represents the average rent through the ARD. |
Underwritten Net Cash Flow.The following table presents certain information relating to the Underwritten Net Cash Flow at the One Dulles Tower Property:
| Cash Flow Analysis(1) | |||||
| UW | UW PSF | ||||
| Base Rent(2) | $16,537,837 | $40.97 | |||
| Total Recoveries | $405,102 | $1.00 | |||
| Other Income | $0 | $0.00 | |||
| Less Vacancy & Credit Loss | ($165,378)(3) | ($0.41) | |||
| Effective Gross Income | $16,777,561 | $41.57 | |||
| Total Operating Expenses | $3,364,829 | $8.34 | |||
| Net Operating Income | $13,412,732 | $33.23 | |||
| Replacement Reserves | $80,725 | $0.20 | |||
| Tenant Improvements | $0 | $0.00 | |||
| Leasing Commissions | $0 | $0.00 | |||
| Net Cash Flow | $13,332,007 | $33.03 | |||
| Occupancy %(3) | 99.0% | ||||
| NOI DSCR(4) | 2.18x | ||||
| NCF DSCR(4) | 2.17x | ||||
| NOI Debt Yield(4) | 8.8% | ||||
| NCF Debt Yield(4) | 8.8% | ||||
| (1) | Historical operating statements and occupancy are not available as the borrower sponsor recently acquired the One Dulles Tower Property and such information was not provided by the seller. |
| (2) | Base Rent reflects Amazon’s average rent through the ARD (see“Tenant Summary”above). |
| (3) | The underwritten economic vacancy is 1.0%. The One Dulles Tower Property was 100.0% leased as of April 1, 2018. |
| (4) | The debt service coverage ratios and debt yields are based on the One Dulles Tower Whole Loan. |
This is not a research report and was not prepared by any Underwriter’s research department. Please see additional important information and qualifications at the end of this Term Sheet. |
| T-61 |
| BANK 2018-BNK11 | One Dulles Tower |
Escrows and Reserves. The One Dulles Tower Borrower deposited into escrow at loan origination $405,537 for real estate taxes, $15,974,928 for rent abatement periods and $26,466,135 for outstanding TI/LCs related to Amazon. The One Dulles Tower Whole Loan documents provide for ongoing monthly escrows of $135,179 for real estate taxes.
The One Dulles Tower Whole Loan documents do not require ongoing monthly escrows for insurance premiums as long as (i) no event of default has occurred and is continuing; (ii) the One Dulles Tower Borrower provides the lender with evidence that the One Dulles Tower Property’s insurance coverage is included in a blanket policy and such policy is in full force and effect; and (iii) the One Dulles Tower Borrower pays all applicable insurance premiums and provides the lender with evidence of renewals. The One Dulles Tower Whole Loan documents do not require ongoing monthly escrows for replacement reserves or leasing reserves as long as no Cash Trap Event Period (as defined below) has occurred and is continuing. Upon the continuance of a Cash Trap Event Period, ongoing replacement and leasing reserves are required in an amount equal to $6,727 and $50,453, respectively.
Lockbox and Cash Management. The One Dulles Tower Whole Loan requires a lender-controlled lockbox account, which is already in-place, and that the One Dulles Tower Borrower direct the tenant to pay its rent directly into such lockbox account. The One Dulles Tower Whole Loan documents also require that all rents received by the One Dulles Tower Borrower or the property manager be deposited into the lockbox account within one business day of receipt. All funds in the lockbox account are required to be swept each business day into the cash management account controlled by the lender and disbursed on each payment date in accordance with the loan documents. Prior to the occurrence of a Cash Trap Event Period, all excess funds are required to be distributed to the One Dulles Tower Borrower. During a Cash Trap Event Period, all excess funds are required to be swept to an excess cash flow subaccount controlled by the lender.
A “Cash Trap Event Period” will commence upon the earlier of the following:
| (i) | the occurrence of an event of default; |
| (ii) | the occurrence of a Lease Sweep Period (as defined below); or |
| (iii) | the debt service coverage ratio falling below 1.25x (based on a hypothetical 30-year amortization period) at the end of any calendar quarter. |
A Cash Trap Event Period will end upon the occurrence of the following:
| ● | with regard to clause (i), the cure of such event of default; |
| ● | with regard to clause (ii), a Lease Sweep Period Cure Event (as defined below); or |
| ● | with regard to clause (iii), the debt service coverage ratio (based on a hypothetical 30-year amortization schedule) being equal to or greater than 1.25x for two consecutive calendar quarters. |
A “Lease Sweep Period” will commence upon the earlier of the following (for clauses (i), (ii), (iii), (iv) and (vi) below, the term ‘Amazon’ includes any replacement tenant leasing, subleasing, or otherwise occupying the space currently occupied by Amazon):
| (i) | Amazon surrenders, cancels, terminates or gives notice of its intent to surrender, cancel or terminate any material portion of its space; |
| (ii) | Amazon vacates greater than 20.0% of its space; |
| (iii) | Amazon goes dark or gives notice to go dark in 50% or more of its space at any time on or after the April 2021 payment date; |
| (iv) | Amazon becomes insolvent or files for bankruptcy; |
| (v) | Amazon is no longer an Investment Grade Entity (as defined below); or |
| (vi) | Amazon exercises its option to contract its space pursuant to its lease (see“Tenant Summary” above). |
A “Lease Sweep Period Cure Event” will occur upon the following:
| ● | with regard to clauses (i), (ii), (iii) or (vi), a Qualified Re-Leasing Event (as defined below); |
| ● | with regard to clause (iv), the bankruptcy or insolvency proceedings having terminated and the lease having been affirmed or assigned in a manner satisfactory to the lender; or |
| ● | with regard to clause (v), Amazon restoring its status as an Investment Grade Entity. |
An “Investment Grade Entity” means an entity that is rated ‘BBB-’, or equivalent, or higher by at least two of Fitch, Moody’s and S&P.
A “Qualified Re-Leasing Event” will occur upon one or more replacement tenants acceptable to lender executing leases covering all of the space leased to Amazon as of the loan closing date with (i) an initial term of no less than 10 years; (ii) market terms with respect to base rent, additional rent and recoveries and tenant improvements; (iii) such replacement tenants having taken possession of such space, commencing normal business operations and paying full unabated rent or any such abatement has been reserved; and (iv) all tenant improvements and leasing commissions having been paid or reserved.
Additional Secured Indebtedness (not including trade debts).The One Dulles Tower Property also secures the One Dulles Tower Pari Passu Companion Loan, which has a Cut-off Date principal balance of $89,000,000. The One Dulles Tower Pari Passu Companion Loan accrues interest at the same rate as the One Dulles Tower Mortgage Loan. The One Dulles Tower Mortgage Loan is entitled to payments of interest and principal on a pro rata and pari passu basis with the One Dulles Tower Serviced Pari Passu Companion Loan. The holders of the One Dulles Tower Mortgage Loan and the One Dulles Tower Pari Passu Companion Loan have entered into a co-lender agreement, which sets forth the allocation of collections on the One Dulles Tower Whole Loan. See “Description of the Mortgage Pool—The Whole Loans—The Serviced Pari Passu Whole Loans” and“—The Non-Serviced Pari Passu Whole Loans”in the Preliminary Prospectus.
Mezzanine Loan and Preferred Equity. Not permitted.
Release of Property. Not permitted.
Terrorism Insurance.The One Dulles Tower Whole Loan documents require that the “all risk” insurance policy required to be maintained by the One Dulles Tower Borrower provide coverage for terrorism in an amount equal to the full replacement cost of the One Dulles Tower Property, as well as business interruption insurance covering no less than the 18-month period following the occurrence of a casualty event, together with a 6-month extended period of indemnity. See “Risk Factors—Risks Relating to the Mortgage Loans—Terrorism Insurance May Not Be Available for All Mortgaged Properties” in the Preliminary Prospectus.
This is not a research report and was not prepared by any Underwriter’s research department. Please see additional important information and qualifications at the end of this Term Sheet. |
| T-62 |
(THIS PAGE INTENTIONALLY LEFT BLANK)
| T-63 |
| BANK 2018-BNK11 | Airport Business Center |
Mortgage Loan No. 5 – Airport Business Center
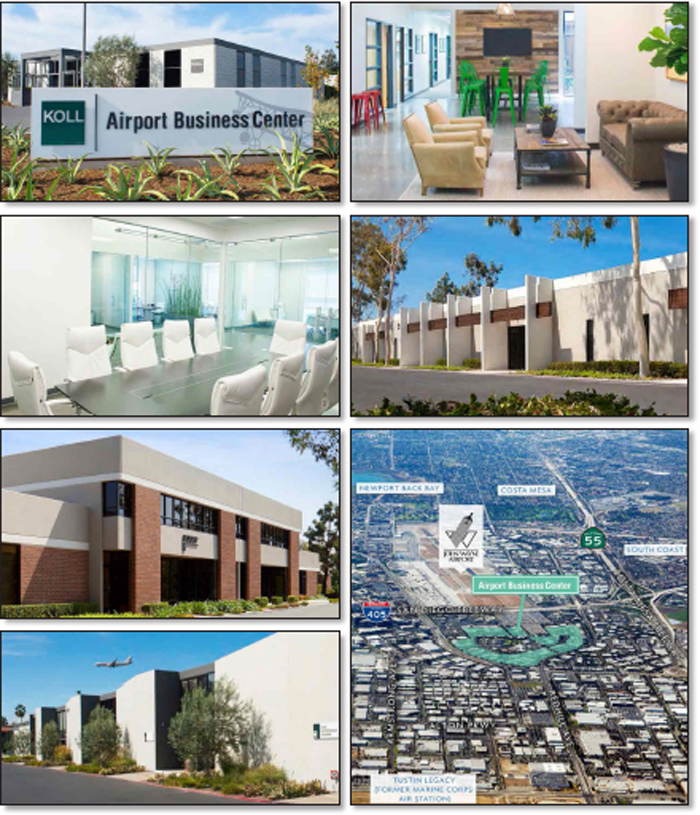
This is not a research report and was not prepared by any Underwriter’s research department. Please see additional important information and qualifications at the end of this Term Sheet. |
| T-64 |
| BANK 2018-BNK11 | Airport Business Center |
Mortgage Loan No. 5 – Airport Business Center
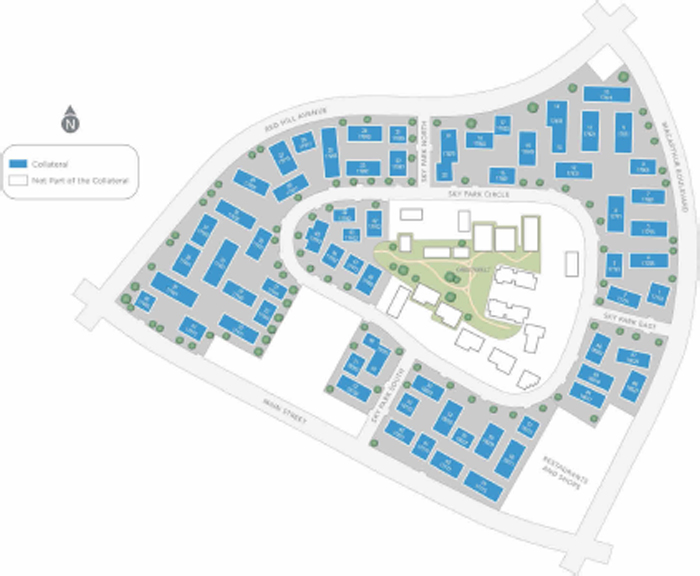
This is not a research report and was not prepared by any Underwriter’s research department. Please see additional important information and qualifications at the end of this Term Sheet. |
| T-65 |
| BANK 2018-BNK11 | Airport Business Center |
Mortgage Loan No. 5 – Airport Business Center
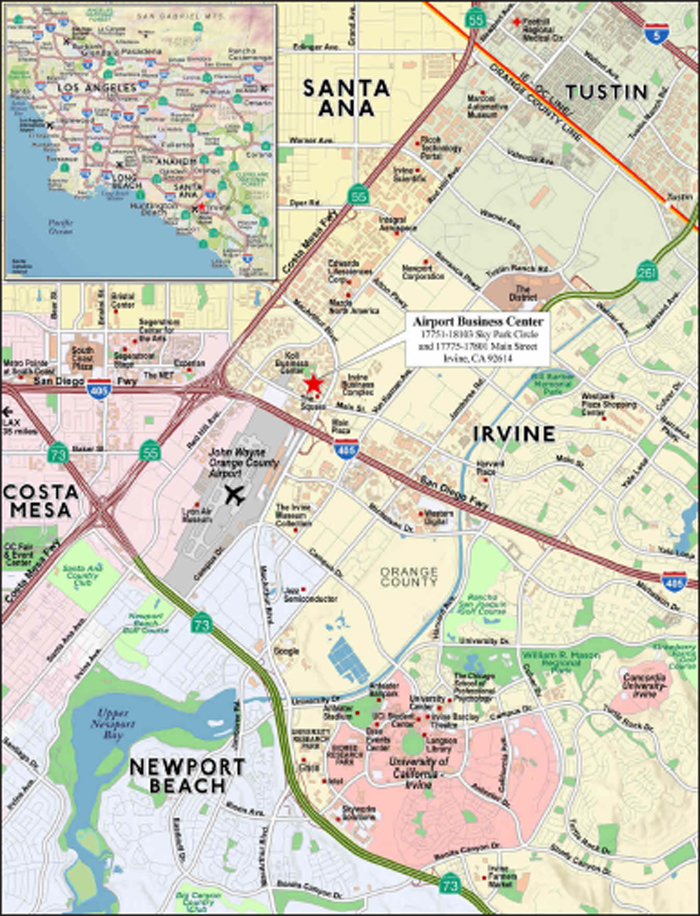
This is not a research report and was not prepared by any Underwriter’s research department. Please see additional important information and qualifications at the end of this Term Sheet. |
| T-66 |
| BANK 2018-BNK11 | Airport Business Center |
| Mortgage Loan No. 5 – Airport Business Center |
| Mortgage Loan Information | Property Information | |||||
| Mortgage Loan Seller: | WFB | Single Asset/Portfolio: | Single Asset | |||
| Original Balance(1): | $53,000,000 | Location: | Irvine, CA 92614 | |||
| Cut-off Date Balance(1): | $53,000,000 | General Property Type: | Industrial | |||
| % of Initial Pool Balance: | 7.7% | Detailed Property Type: | Flex | |||
| Loan Purpose: | Refinance | Title Vesting: | Fee | |||
| Sponsor: | DK Properties, L.P. | Year Built/Renovated: | 1969/2005 | |||
| Mortgage Rate: | 4.3750% | Size: | 1,170,571 SF | |||
| Note Date: | 1/24/2018 | Cut-off Date Balance per SF(1): | $128 | |||
| First Payment Date: | 3/7/2018 | Maturity Date Balance per SF(1): | $128 | |||
| Maturity Date: | 2/7/2028 | Property Manager: | Koll Industrial Properties, LLC (borrower-related) | |||
| Original Term: | 120 months | |||||
| Original Amortization Term: | 0 months | Underwriting and Financial Information | ||||
| IO Period: | 120 months | UW NOI: | $14,666,817 | |||
| Seasoning: | 2 months | UW NOI Debt Yield(1): | 9.8% | |||
| Prepayment Provisions(2): | LO (26); DEF (90); O (4) | UW NOI Debt Yield at Maturity(1): | 9.8% | |||
| Lockbox/Cash Mgmt Status: | Hard/In Place | UW NCF DSCR(1): | 2.12x | |||
| Additional Debt Type(3): | Pari Passu/Mezzanine | Most Recent NOI: | $13,635,662 (10/31/17 TTM) | |||
| Additional Debt Balance(3): | $97,000,000/$20,000,000 | 2nd Most Recent NOI: | $12,904,375 (12/31/2016) | |||
| Future Debt Permitted (Type): | No (N/A) | 3rd Most Recent NOI: | $12,153,147 (12/31/2015) | |||
| Reserves(4) | Most Recent Occupancy: | 96.8% (1/31/2018) | ||||
| Type | Initial | Monthly | Cap | 2nd Most Recent Occupancy: | 97.0% (12/31/2016) | |
| Taxes: | $52,146 | $52,144 | N/A | 3rd Most Recent Occupancy: | 96.0% (12/31/2015) | |
| Insurance: | $31,883 | $17,474 | N/A | Appraised Value (as of)(5): | $244,600,000 (12/13/2017) | |
| Replacement Reserves: | $0 | $21,418 | $525,000 | Cut-off Date LTV Ratio(1): | 61.3% | |
| TI/LC Reserves: | $0 | $73,015 | N/A | Maturity Date LTV Ratio(1): | 61.3% | |
| Sources and Uses | ||||||
| Sources | Proceeds | % of Total | Uses | Proceeds | % of Total | |
| Loan Amount: | $150,000,000 | 88.2% | Loan Payoff(6): | $166,738,568 | 98.1% | |
| Mezzanine debt(2): | $20,000,000 | 11.8% | Upfront reserves: | $84,029 | 0.0% | |
| Closing costs: | $1,652,636 | 1.0% | ||||
| Return of equity: | $1,524,767 | 0.9% | ||||
| Total Sources: | $170,000,000 | 100.0% | Total Uses: | $170,000,000 | 100.0% | |
| (1) | The Airport Business Center Mortgage Loan (as defined below) is part of the Airport Business Center Whole Loan (as defined below), which is comprised of three pari passu notes with an aggregate original principal balance of $150,000,000. All statistical information related to the Cut-off Date Balance per SF, Maturity Date Balance per SF, UW NOI Debt Yield, UW NOI Debt Yield at Maturity, UW NCF DSCR, Cut-off Date LTV Ratio and Maturity Date LTV Ratio numbers are based solely on the Airport Business Center Whole Loan. The equity interest in the Airport Business Center Borrower (as defined below) has been pledged to secure mezzanine indebtedness with an original principal balance of $20,000,000. As of the Cut-off Date, the UW NOI Debt Yield, UW NOI Debt Yield at Maturity, UW NCF DSCR, Cut-off Date LTV Ratio and Maturity Date LTV Ratio based on the Airport Business Center Total Debt (as defined below) are 8.6%, 8.6%, 1.74x, 69.5% and 69.5%, respectively. |
| (2) | Defeasance of the Airport Business Center Whole Loan is permitted at any time after the earlier of (i) July 7, 2021 and (ii) two years from the closing date of the securitization that includes the last pari passu note of the Airport Business Center Whole Loan to be securitized. The assumed lockout period of 26 payments is based on the closing date of this transaction in April 2018. |
| (3) | See “The Mortgage Loan”, “Additional Secured Indebtedness (not including trade debts)” and “Mezzanine Loan and Preferred Equity” for a discussion of additional debt. |
| (4) | See“Escrows and Reserves”below for further discussion of reserve requirements. |
| (5) | The appraiser concluded to a land value of $158,500,000 as of December 13, 2017. |
| (6) | The Airport Business Center Property was previously securitized in the MSBAM 2014-C19 transaction. Loan payoff includes the existing senior loan ($138,323,068) and existing mezzanine loan ($28,415,500). |
The Mortgage Loan. The fifth largest mortgage loan (the “Airport Business Center Mortgage Loan”) is part of a whole loan (the “Airport Business Center Whole Loan”) evidenced by threepari passu promissory notes in the aggregate original principal amount of $150,000,000 which are secured by a first priority fee mortgage encumbering an industrial flex business park located in Irvine, California (the “Airport Business Center Property”).
The controlling promissory Note A-1 in the original principal balance of $53,000,000 represents the Airport Business Center Mortgage Loan and will be included in the BANK 2018-BNK11 securitization trust. Promissory Note A-2 in the original principal balance of $50,000,000 was contributed to the WFCM 2018-C43 securitization trust. Promissory Note A-3, which has an original principal balance of $47,000,000 is currently held by Wells Fargo Bank, National Association and is expected to be contributed to a future securitization trust. Promissory Notes A-2 and A-3, in the aggregate original principal amount of $97,000,000, collectively represent thepari passu companion loans (the “Airport Business Center Serviced Pari Passu Companion Loans”). The Airport Business Center Whole Loan will be serviced pursuant to the pooling and servicing agreement for the BANK 2018-BNK11 securitization trust. See “Description of the Mortgage Pool—The Whole Loans—The Serviced Pari Passu Whole Loans” and “Pooling and Servicing Agreement” in the Preliminary Prospectus. The proceeds of the Airport Business Center Whole Loan, in addition to a $20,000,000 mezzanine loan (see “Mezzanine Loan and Preferred Equity” below), were primarily used to refinance previous debt totaling $166,738,568 secured by the Airport Business Center Property, return equity of $1,524,767 to the Airport Business Center Borrower (as defined below), fund reserves and pay closing costs.
This is not a research report and was not prepared by any Underwriter’s research department. Please see additional important information and qualifications at the end of this Term Sheet. |
| T-67 |
| BANK 2018-BNK11 | Airport Business Center |
| Airport Business Center Whole Loan Summary | ||||
| Note | Original Balance | Cut-off Date Balance | Note Holder | Controlling Piece |
| A-1 | $53,000,000 | $53,000,000 | BANK 2018-BNK11 | Yes |
| A-2 | $50,000,000 | $50,000,000 | WFCM 2018-C43 | No |
| A-3 | $47,000,000 | $47,000,000 | Wells Fargo Bank, N.A. | No |
| Total | $150,000,000 | $150,000,000 | ||
The Borrower and the Sponsor. The borrower is AIC Owner, LLC (the “Airport Business Center Borrower”), a Delaware limited liability company and single purpose entity with two independent directors. Legal counsel to the Airport Business Center Borrower delivered a non-consolidation opinion in connection with the origination of the Airport Business Center Whole Loan. The sponsor and the nonrecourse carve-out guarantor of the Airport Business Center Whole Loan is DK Properties, L.P.
DK Properties, L.P. is an affiliate of The Koll Company (“Koll”), a privately held full service real estate firm based in Irvine, California. Since formation in 1962, Koll has acquired and developed, in partnership with institutional and private investors, over 100 million SF of office, industrial, retail and resort properties throughout multiple markets. One of Koll’s primary focuses is on the acquisition and management of multi-tenant industrial properties. Koll has had continued ownership and management of the Airport Business Center Property since the company purchased the land and initiated construction in 1969.
The Property. The Airport Business Center Property is a class B industrial/flex and office development totaling 1,170,571 SF and located in Irvine, California. Originally built by the borrower sponsor in phases between 1969 and 1978 and most recently renovated in 2005, the Airport Business Center Property comprises 68 one- and two-story buildings spanning approximately 76.6 acres. The Airport Business Center Property is situated within the approximately 4,000-acre Irvine Business Complex, a master planned business park spanning five Orange County cities. The net rentable area of the Airport Business Center Property contains approximately 73.9% industrial/flex, 23.5% office and 2.1% retail tenants. Clear heights at the Airport Business Center Property range from 11 feet, 4 inches to 16 feet, 10 inches. The Airport Business Center Property includes 2,985 surface parking spaces, resulting in a parking ratio of 2.6 spaces per 1,000 SF of rentable area.
As of January 31, 2018, the Airport Business Center Property was 96.8% occupied by approximately 440 tenants with no single tenant accounting for more than 1.8% of the net rentable area or 1.5% of underwritten base rent. The Airport Business Center Property has averaged 94.8% occupancy over the past five years and 90.8% occupancy since 1990.
The following table presents certain information relating to the tenancy at the Airport Business Center Property:
| Tenant Summary | |||||||
| Tenant Name | Credit Rating (Fitch/Moody's/S&P) | Tenant SF | Approximate % of SF | Annual UW Rent(1) | % of Total Annual UW Rent | Annual UW Rent PSF(1) | Lease Expiration |
| Major Tenant | |||||||
| American Pacific Printers College, Inc. | NR/NR/NR | 21,240 | 1.8% | $266,400 | 1.4% | $12.54(2) | Various(2) |
| Just Food For Dogs, LLC | NR/NR/NR | 18,142 | 1.5% | $274,531 | 1.5% | $15.13(3) | 6/30/2028 |
| PAS MRO, Inc. | NR/NR/NR | 13,817 | 1.2% | $169,857 | 0.9% | $12.29(4) | Various(4) |
| AIDS Services Foundation | NR/NR/NR | 12,520 | 1.1% | $220,792 | 1.2% | $17.64(5) | Various(5) |
| Southwind Kayak Center, Inc. | NR/NR/NR | 10,431 | 0.9% | $177,623 | 1.0% | $17.03(6) | Various(6) |
| Subtotal/Wtd. Avg. | 76,150 | 6.5% | $1,109,203 | 6.0% | $14.57 | ||
| Other Tenants | 1,057,087 | 90.3% | $17,314,800 | 94.0% | $16.55(7) | ||
| Vacant Space | 37,334 | 3.2% | $0 | 0.0% | $0.00 | ||
| Total/Wtd. Avg. | 1,170,571 | 100.0% | $18,424,003 | 100.0% | $16.42(7) | ||
| (1) | Annual UW Rent and Annual UW Rent PSF include contractual rent steps through February 2019 totaling $555,991. |
| (2) | American Pacific Printers College, Inc. leases three spaces: 2,040 SF on a month-to-month basis with an UW Rent PSF of $12.00; 4,800 SF with an Annual UW Rent PSF of $12.60 and Lease Expiration Date of January 31, 2019; and 14,400 SF with an Annual UW Rent PSF of $12.60 and Lease Expiration Date of February 28, 2019. |
| (3) | Just Food For Dogs, LLC leases two spaces: 9,914 SF with an Annual UW Rent PSF of $14.40 and Lease Expiration Date of June 30, 2028; and 8,228 SF with an Annual UW Rent PSF of $16.01 and Lease Expiration Date of June 30, 2028. The lease covering the 9,914 SF space has a free rent period that expires on June 30, 2018. |
| (4) | PAS MRO, Inc. leases three spaces: 9,726 SF with an Annual UW Rent PSF of $11.04 and Lease Expiration Date of May 31, 2018; 1,466 SF with an Annual UW Rent PSF of $11.04 and Lease Expiration Date of May 31, 2018; and 2,625 SF with an Annual UW Rent PSF of $17.64 and Lease Expiration Date of January 31, 2020. |
| (5) | AIDS Services Foundation leases two spaces: 11,787 SF with an Annual UW Rent PSF of $17.40 and Lease Expiration Date of April 30, 2021; and 733 SF with an Annual UW Rent PSF of $21.42 and Lease Expiration Date of October 14, 2018. |
| (6) | Southwind Kayak Center, Inc. leases three spaces: 4,750 SF with an Annual UW Rent PSF of $18.00 and Lease Expiration Date of September 30, 2019; and 1,186 SF with an Annual UW Rent PSF of $14.00 and Lease Expiration Date of September 30, 2019; and 4,495 SF with an Annual UW Rent PSF of $16.80 and Lease Expiration Date of March 31, 2025. |
| (7) | Other Tenants includes approximately 10,962 SF related to the management office and engineer office, which have no attributed Annual UW Rent. The Annual UW Rent PSF for Other Tenants and Occupied Collateral Total excludes the space related to the management office and engineer office. |
This is not a research report and was not prepared by any Underwriter’s research department. Please see additional important information and qualifications at the end of this Term Sheet. |
| T-68 |
| BANK 2018-BNK11 | Airport Business Center |
The following table presents certain information relating to the lease rollover schedule at the Airport Business Center Property:
| Lease Rollover Schedule(1)(2) | ||||||||
| Year | # of Leases Rolling | SF Rolling | Annual UW Rent PSF Rolling | Approx. % of Total SF Rolling | Approx. Cumulative % of SF Rolling | Total UW Rent Rolling | Approx. % of Total Rent Rolling | Approx. Cumulative % of Total Rent Rolling |
| MTM(3) | 49 | 86,232 | $15.77 | 7.4% | 7.4% | $1,187,293 | 6.4% | 6.4% |
| 2018 | 141 | 303,924 | $15.93 | 26.0% | 33.3% | $4,842,038 | 26.3% | 32.7% |
| 2019 | 132 | 264,446 | $16.73 | 22.6% | 55.9% | $4,424,563 | 24.0% | 56.7% |
| 2020 | 92 | 218,474 | $16.41 | 18.7% | 74.6% | $3,584,549 | 19.5% | 76.2% |
| 2021 | 30 | 112,022 | $16.70 | 9.6% | 84.2% | $1,871,113 | 10.2% | 86.4% |
| 2022 | 33 | 87,897 | $17.64 | 7.5% | 91.7% | $1,550,280 | 8.4% | 94.8% |
| 2023 | 11 | 32,831 | $16.19 | 2.8% | 94.5% | $531,625 | 2.9% | 97.7% |
| 2024 | 0 | 0 | $0.00 | 0.0% | 94.5% | $0 | 0.0% | 97.7% |
| 2025 | 1 | 4,495 | $16.80 | 0.4% | 94.9% | $75,516 | 0.4% | 98.1% |
| 2026 | 0 | 0 | $0.00 | 0.0% | 94.9% | $0 | 0.0% | 98.1% |
| 2027 | 2 | 4,774 | $17.28 | 0.4% | 95.3% | $82,495 | 0.4% | 98.5% |
| 2028 | 2 | 18,142 | $15.13 | 1.5% | 96.8% | $274,531 | 1.5% | 100.0% |
| 2029 & Beyond | 0 | 0 | $0.00 | 0.0% | 96.8% | $0 | 0.0% | 100.0% |
| Vacant | 0 | 37,334 | $0.00 | 3.2% | 100.0% | $0 | 0.0% | 100.0% |
| Total/Wtd. Avg.(4) | 493 | 1,170,571 | $16.42 | 100.0% | $18,424,003 | 100.0% | ||
| (1) | Information is based on the underwritten rent roll. |
| (2) | Certain tenants may have lease termination options that are exercisable prior to the originally stated expiration date of the subject lease and that are not considered in the Lease Rollover Schedule. |
| (3) | MTM includes approximately 10,962 SF related to the management office and engineer office, which have no leases and no attributed Annual U/W Base Rent. The Annual UW Rent PSF Rolling for MTM excludes the space related to the management office and engineer office. |
| (4) | Total/Wtd. Avg. Annual UW Rent PSF Rolling excludes vacant, management office and engineer office spaces. |
The Market. The Airport Business Center Property is located in Irvine, California, within the Irvine Business Complex and approximately one mile northeast of John Wayne Airport. The Irvine Business Complex encompasses approximately 4,000 acres within the cities of Irvine, Newport Beach, Santa Ana, Costa Mesa and Tustin. The Airport Business Center Property is situated to the southeast of the intersection of Macarthur Boulevard and Red Hill Avenue with access to Costa Mesa Freeway (State Route 55) approximately 0.5 mile to the northwest, and access to the San Diego Freeway (Interstate 405) approximately 0.75 mile to the south.
The Airport Business Center Property is situated approximately 3.8 miles northwest of the University of California-Irvine, which had a 2017 total enrollment of approximately 36,000 students. In addition, the Airport Business Center Property is situated approximately 3.0 miles east of South Coast Plaza (one of the five highest grossing shopping malls in the United States) and 9.3 miles west of Irvine Spectrum Center (an outdoor shopping center with various shopping, restaurant and entertainment options). According to a third-party market research report, the estimated 2017 population within a one-, three- and five-mile radius of the Airport Business Center Property was approximately 4,339, 180,021, and 617,144, respectively; while the 2017 estimated average household income within the same radii was $103,619, $98,864, and $96,263, respectively.
According to the appraisal, the Airport Business Center Property is situated within the Airport Area submarket of the Orange County market. As of the third quarter of 2017, the submarket reported a total inventory of 1,590 industrial buildings totaling approximately 52.9 million SF with a 2.6% vacancy rate and 245 office buildings totaling approximately 18.9 million SF with an 11.4% vacancy rate. The appraiser identified five comparable industrial buildings for the Airport Business Center Property totaling 493,464 SF, which reported an average occupancy rate of approximately 97.9%; and the appraiser identified four comparable office buildings for the Airport Business Center Property totaling 179,262 SF, which reported an average occupancy rate of approximately 99.4%. The appraiser concluded to market rents for the Airport Business Center Property of $19.20 PSF for all spaces less than 1,000 SF, $16.20 PSF for industrial spaces from 1,000 SF to 3,999 SF, $16.20 PSF for office spaces from 1,000 SF to 6,999 SF, $15.00 PSF for industrial spaces from 4,000 SF to 6,999 SF and $14.40 PSF for all spaces over 7,000 SF.
This is not a research report and was not prepared by any Underwriter’s research department. Please see additional important information and qualifications at the end of this Term Sheet. |
| T-69 |
| BANK 2018-BNK11 | Airport Business Center |
The following table presents certain information relating to comparable industrial properties and leases for the Airport Business Center Property:
| Comparable Properties (Industrial) | ||||||
| Airport Business Center Property | McFadden Centre | Grand Commerce Center | Alton Plaza | Holland Business Center | Main & Red Hill Business Center | |
| Location | Irvine, CA | Santa Ana, CA | Santa Ana, CA | Irvine, CA | Irvine, CA | Irvine, CA |
| Distance from Subject | - | 4.0 miles | 4.1 miles | 9.9 miles | 10.3 miles | 1.0 mile |
| Year Built/Renovated | 1969/2005 | 1988/NAV | 1980/NAV | 1989/NAV | 2005/NAV | 1981/NAV |
| Total GLA | 1,170,571 SF | 184,737 SF | 99,160 SF | 15,100 SF | 10,575 SF | 183,892 SF |
| Total Occupancy | 96.8% | 100% | 95% | 100% | 100% | 97% |
Source:Appraisal and the underwritten rent roll.
Comparable Leases (Industrial) | ||||||
| Property Name/Location | Tenant Name | Lease Date/Term | Lease Area (SF) | Annual Base Rent PSF | Tenant Improvements PSF | Lease Type |
McFadden Centre SEC of McFadden Ave. and Lyon St. Santa Ana, CA | American Stitch Design | Apr. 2017 / 3.0 Years | 3,210 | $14.52 | $0.00 | Modified Gross |
Grand Commerce Center 600-650 S. Grand Avenue Santa Ana, CA | Mid America Sales | Feb. 2017 / 3.0 Years | 1,635 | $13.20 | $0.00 | Modified Gross |
Alton Plaza 15273 Alton Parkway Irvine, CA | Wachter, Inc. | Feb. 2016 / 5.3 Years | 5,238 | $14.16 | $0.00 | NNN |
Holland Business Center 5 Holland Irvine, CA | Evets Corporation | May 2016 / 3.0 Years | 5,070 | $16.80 | $0.00 | Modified Gross |
Main & Red Hill Business Center 1150 & 1200 Main Street Irvine, CA | Confidential | Sept. 2017 / 4.1 Years | 4,012 | $13.80 | $0.00 | NNN |
Source:Appraisal
The following table presents certain information relating to comparable office properties and leases for the Airport Business Center Property:
| Comparable Properties (Office) | |||||
| Airport Business Center Property | 16530 Bake Pkwy | Centerpointe 1, 2, 3 & 6 | Executive Park III | 15300 Barranca Parkway | |
| Location | Irvine, CA | Irvine, CA | Irvine, CA | Irvine, CA | Irvine, CA |
| Distance from Subject | - | 9.0 miles | 3.0 miles | 0.7 mile | 9.2 miles |
| Year Built/Renovated | 1969/2005 | 2006/NAV | 1979/NAV | 1985/NAV | 1997/NAV |
| Total GLA | 1,170,571 SF | 19,998 SF | 105,577 SF | 21,271 SF | 32,416 SF |
| Total Occupancy | 96.8% | 100% | 99% | 100% | 100% |
Source:Appraisal and the underwritten rent roll.
| Comparable Leases (Office) | ||||||
| Property Name/Location | Tenant Name | Lease Date/Term | Lease Area (SF) | Annual Base Rent PSF | Tenant Improvements PSF | Lease Type |
16530 Bake Pkwy 16530 Bake Pkwy Irvine, CA | Roka Sports | Mar. 2017 / 3.2 Years | 3,363 | $24.00 | $10.00 | Gross |
Centerpointe 1, 2, 3 & 6 19712, 19722, 19732, 19762 MacArthur Boulevard Irvine, CA | Sims Law Firm | Feb. 2017 / 4.1 Years | 2,889 | $26.40 | $0.00 | Gross |
Executive Park III 32 Executive Park Irvine, CA | Langan Engineering | Dec. 2016 / 3.0 Years | 1,001 | $26.40 | $0.00 | Gross |
15300 Barranca Parkway 15300 Barranca Parkway Irvine, CA | BBMC Mortgage | Mar. 2017 / 3.8 Years | 8,376 | $22.20 | $0.00 | Gross |
Source:Appraisal
This is not a research report and was not prepared by any Underwriter’s research department. Please see additional important information and qualifications at the end of this Term Sheet. |
| T-70 |
| BANK 2018-BNK11 | Airport Business Center |
Operating History and Underwritten Net Cash Flow.The following table presents certain information relating to the historical operating performance and Underwritten Net Cash Flow at the Airport Business Center Property:
| Cash Flow Analysis | ||||||
| 2014 | 2015 | 2016 | 10/31/2017 TTM | UW | UW PSF | |
| Base Rent | $13,840,135 | $15,111,231 | $15,773,702 | $16,464,277 | $18,424,003(1) | $15.74 |
| Grossed Up Vacant Space | $0 | $0 | $0 | $0 | $606,526 | $0.52 |
| Total Recoveries | $1,010,672 | $1,091,842 | $1,217,145 | $1,293,413 | $1,283,612 | $1.10 |
| Other Income | $241,346 | $131,003 | $155,864 | $159,400 | $159,400 | $0.14 |
| Less Vacancy & Credit Loss | $0 | $0 | $0 | $0 | ($1,584,192)(2) | ($1.35) |
| Effective Gross Income | $15,092,153 | $16,334,076 | $17,146,711 | $17,917,090 | $18,889,349 | $16.14 |
| Total Operating Expenses | $3,770,742 | $4,180,929 | $4,242,336 | $4,281,428 | $4,222,532 | $3.61 |
| Net Operating Income | $11,321,411 | $12,153,147 | $12,904,375 | $13,635,662 | $14,666,817 | $12.53 |
| TI/LC | $0 | $0 | $0 | $0 | $292,643 | $0.25 |
| Capital Expenditures | $0 | $0 | $0 | $0 | $257,526 | $0.22 |
| Net Cash Flow | $11,321,411 | $12,153,147 | $12,904,375 | $13,635,662 | $14,116,648 | $12.06 |
| Occupancy % | 93.0% | 96.0% | 97.0% | 96.8%(3) | 91.7%(2) | |
| NOI DSCR(4) | 1.70x | 1.83x | 1.94x | 2.05x | 2.20x | |
| NCF DSCR(4) | 1.70x | 1.83x | 1.94x | 2.05x | 2.12x | |
| NOI Debt Yield(4) | 7.5% | 8.1% | 8.6% | 9.1% | 9.8% | |
| NCF Debt Yield(4) | 7.5% | 8.1% | 8.6% | 9.1% | 9.4% | |
| (1) | UW Base Rent is higher than 10/31/2017 TTM due to the inclusion of rent steps through February 2019 totaling $555,991 in addition to the Airport Business Center Borrower signing 205 renewal leases totaling 42.4% of underwritten base rent and 7 new leases totaling 2.4% of underwritten base rent since January 2017. |
| (2) | The underwritten economic vacancy is 8.3%. The Airport Business Center Property was 96.8% physically occupied as of January 31, 2018. |
| (3) | 10/31/2017 TTM occupancy % is based on occupancy as of January 31, 2018. |
| (4) | The debt service coverage ratios and debt yields shown are based on the Airport Business Center Whole Loan. |
Escrows and Reserves. The Airport Business Center Borrower deposited at loan origination $52,146 for real estate taxes and $31,883 for insurance premiums. The Airport Business Center Whole Loan documents provide for ongoing monthly escrows in an amount equal to $52,144 for real estate taxes, $17,474 for insurance premiums, $73,015 for tenant improvements and leasing commissions (“TI/LCs”) and $21,418 for capital expenditures (subject to a cap of $525,000). The Airport Business Center Borrower has the right to use funds in the TI/LC reserve account for preparation of tenant-ready speculative spaces in an amount no more than $10.00 per rentable SF of such tenant-ready speculative space and no more than $250,000 in any 12-month period, subject to certain conditions outlined in the loan documents.
Lockbox and Cash Management. The Airport Business Center Whole Loan requires a lender-controlled lockbox account, which is already in-place, and that the Airport Business Center Borrower direct all tenants to pay rent directly into such lockbox account. The loan documents also require that all rents received by the Airport Business Center Borrower or the property manager be deposited into the lockbox account within one business day of receipt. All funds in the lockbox account are required to be swept each business day into the cash management account controlled by the lender and disbursed on each payment date in accordance with the loan documents. Prior to the occurrence of a Cash Trap Event Period (as defined below), all excess funds are required to be distributed to the Airport Business Center Borrower. During a Cash Trap Event Period, all excess funds are required to be swept to an excess cash flow subaccount.
A “Cash Trap Event Period” will commence upon the earlier of the following:
| (i) | the occurrence of an event of default under the Airport Business Center Whole Loan or the Airport Business Center Mezzanine Loan (see “Mezzanine Loan and Preferred Equity” section); |
| (ii) | the debt yield based on the Airport Business Center Total Debt (see “Mezzanine Loan and Preferred Equity” section) falling below 6.50% at the end of any fiscal quarter; or |
| (iii) | the property manager becoming insolvent or filing for bankruptcy. |
A Cash Trap Event Period will end upon the occurrence of the following:
| ● | with regard to clause (i), upon the cure of such event of default; |
| ● | with regard to clause (ii), upon the debt yield based on the Airport Business Center Total Debt being equal to or greater than 6.75% for two consecutive fiscal quarters; or |
| ● | with regard to clause (iii), upon the bankruptcy or insolvency proceedings having terminated or (b) a new approved property manager being appointed in accordance with the loan documents. |
Additional Secured Indebtedness (not including trade debts).The Airport Business Center Property also secures the Airport Business Center Serviced Pari Passu Companion Loans, which have an aggregate Cut-off Date principal balance of $97,000,000. The Airport Business Center Serviced Pari Passu Companion Loans accrue interest at the same rate as the Airport Business Center Mortgage Loan. The Airport Business Center Mortgage Loan is entitled to payments of interest and principal on a pro rata and pari passu basis with the Airport Business Center Serviced Pari Passu Companion Loans. The holders of the Airport Business Center Mortgage Loan and the Airport Business Center Serviced Pari Passu Companion Loans have entered into a co-lender agreement, which sets forth the allocation of collections on the Airport Business Center Whole Loan. See “Description of the Mortgage Pool—The Whole Loans—The Serviced Pari Passu Whole Loans” in the Preliminary Prospectus.
This is not a research report and was not prepared by any Underwriter’s research department. Please see additional important information and qualifications at the end of this Term Sheet. |
| T-71 |
| BANK 2018-BNK11 | Airport Business Center |
Mezzanine Loan and Preferred Equity. BSREF Holdings LLC, a Delaware limited liability company related to Brookfield Real Estate Financial Partners LLC, funded a $20,000,000 mezzanine loan (the “Airport Business Center Mezzanine Loan”) to AIC Mezz, LLC, a Delaware limited liability company (collectively, the Airport Business Center Whole Loan and the Airport Business Center Mezzanine Loan are referred to herein as the “Airport Business Center Total Debt”). The Airport Business Center Mezzanine Loan is secured by 100.0% of the direct equity interest in the Airport Business Center Borrower. The Airport Business Center Mezzanine Loan accrues interest at a rate of 7.206% per annum and requires interest-only payments through the maturity date of February 7, 2028 (co-terminous with the Airport Business Center Whole Loan).
The following table presents certain information relating to the Airport Business Center Mezzanine Loan:
| Mezzanine Debt Summary | |||||||
Mezzanine Debt Original Principal Balance | Mezzanine Debt Interest Rate | Original Term to Maturity (mos.) | Original Amort. Term (mos.) | Original IO Term (mos.) | Total Debt UW NCF DSCR | Total Debt UW NOI Debt Yield | Total Debt Cutoff Date LTV |
| $20,000,000 | 7.2060% | 120 | 0 | 120 | 1.74x | 8.6% | 69.5% |
Release of Property. Not permitted.
Terrorism Insurance.The Airport Business Center Whole Loan documents require that the “all risk” insurance policy required to be maintained by the Airport Business Center Borrower provide coverage for terrorism in an amount equal to the full replacement cost of the Airport Business Center Property, as well as business interruption insurance covering no less than the 12-month period following the occurrence of a casualty event, together with a 12-month extended period of indemnity (provided that if TRIPRA or a similar statute is not in effect, the Airport Business Center Borrower will not be obligated to pay terrorism insurance premiums in excess of two times the premium for the casualty and business interruption coverage on a stand-alone basis). See “Risk Factors—Risks Relating to the Mortgage Loans—Terrorism Insurance May Not Be Available for All Mortgaged Properties” in the Preliminary Prospectus.
This is not a research report and was not prepared by any Underwriter’s research department. Please see additional important information and qualifications at the end of this Term Sheet. |
| T-72 |
(THIS PAGE INTENTIONALLY LEFT BLANK)
| T-73 |
| BANK 2018-BNK11 | Northwest Hotel Portfolio |
Mortgage Loan No. 6 – Northwest Hotel Portfolio
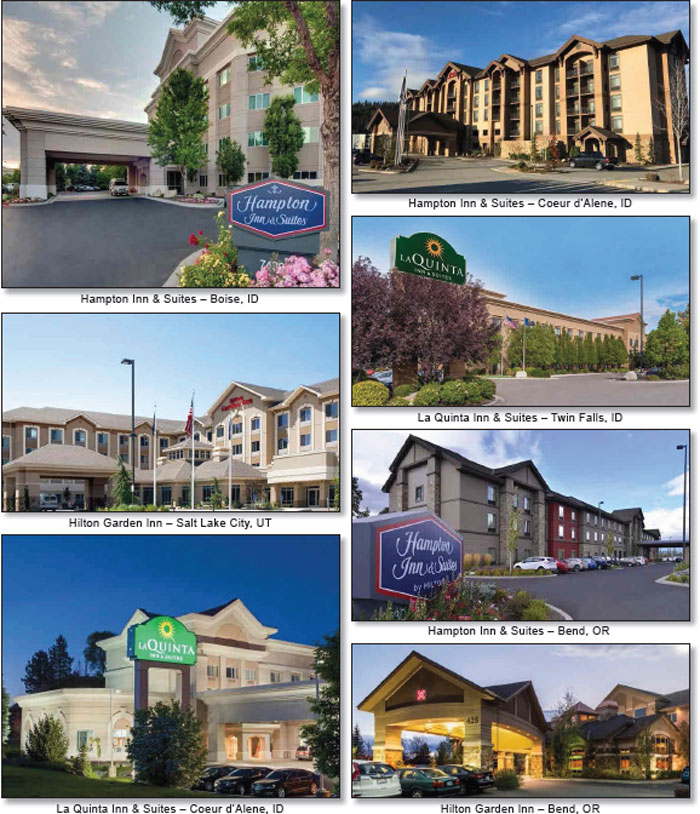
This is not a research report and was not prepared by any Underwriter’s research department. Please see additional important information and qualifications at the end of this Term Sheet. |
| T-74 |
| BANK 2018-BNK11 | Northwest Hotel Portfolio |
Mortgage Loan No. 6 – Northwest Hotel Portfolio
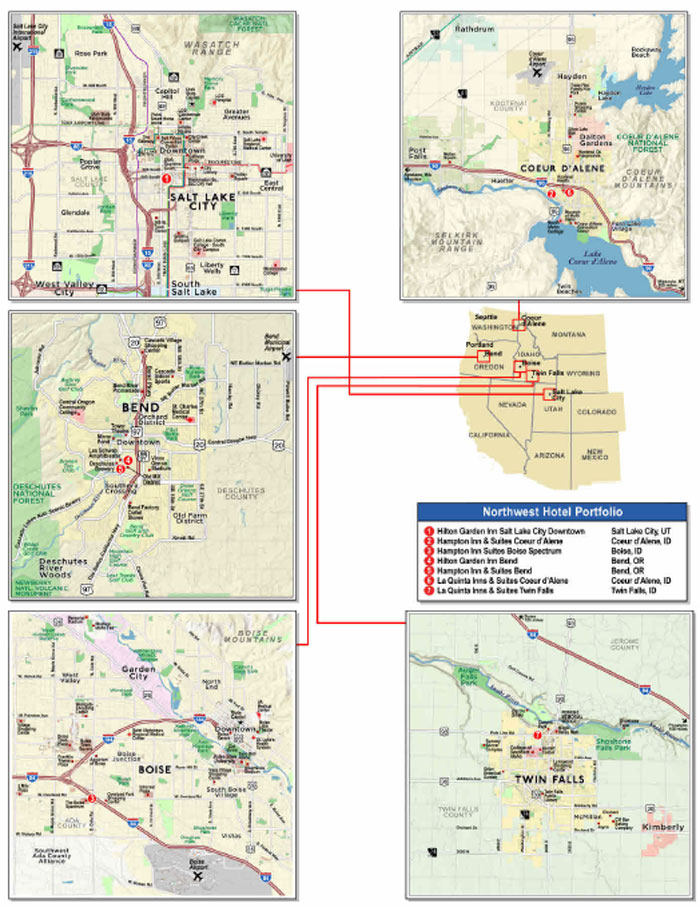
This is not a research report and was not prepared by any Underwriter’s research department. Please see additional important information and qualifications at the end of this Term Sheet. |
| T-75 |
| BANK 2018-BNK11 | Northwest Hotel Portfolio |
| Mortgage Loan No. 6 – Northwest Hotel Portfolio |
| Mortgage Loan Information | Property Information | |||||
| Mortgage Loan Seller: | WFB | Single Asset/Portfolio: | Portfolio | |||
| Original Balance(1): | $40,326,936 | Location: | Various | |||
| Cut-off Date Balance(1): | $40,326,936 | General Property Type: | Hospitality | |||
| % of Initial Pool Balance: | 5.9% | Detailed Property Type: | Limited Service | |||
| Loan Purpose: | Acquisition | Title Vesting: | Fee | |||
| Sponsors: | Jason R. Kotter; Ryan N. Van Alfen | Year Built/Renovated: | Various/Various | |||
| Mortgage Rate: | 5.0180% | Size: | 818 Rooms | |||
| Note Date: | 3/22/2018 | Cut-off Date Balance per Room(1): | $138,411 | |||
| First Payment Date: | 5/11/2018 | Maturity Date Balance per Room(1): | $103,934 | |||
| Maturity Date: | 4/11/2028 | Property Manager(5): | Hotel Management Services, LLC (borrower-related) | |||
| Original Term to Maturity: | 120 months | |||||
| Original Amortization Term: | 300 months | Underwriting and Financial Information | ||||
| IO Period: | 0 months | UW NOI: | $15,562,879 | |||
| Seasoning: | 0 months | UW NOI Debt Yield(1): | 13.7% | |||
| Prepayment Provisions(2): | LO (24); DEF (92); O (4) | UW NOI Debt Yield at Maturity(1): | 18.3% | |||
| Lockbox/Cash Mgmt Status: | Hard/Springing | UW NCF DSCR(1): | 1.78x | |||
| Additional Debt Type(3): | Pari Passu | Most Recent NOI: | $15,647,504 (12/31/2017) | |||
| Additional Debt Balance(3): | $72,893,322 | 2nd Most Recent NOI(6): | $15,834,792 (12/31/2016) | |||
| Future Debt Permitted (Type): | No (N/A) | 3rd Most Recent NOI(6): | $13,721,067 (12/31/2015) | |||
| Reserves(4) | Most Recent Occupancy: | 79.4% (12/31/2017) | ||||
| Type | Initial | Monthly | Cap | 2nd Most Recent Occupancy: | 80.5% (12/31/2016) | |
| RE Tax: | $518,257 | $94,555 | N/A | 3rd Most Recent Occupancy: | 77.6% (12/31/2015) | |
| Insurance: | $46,636 | $15,546 | N/A | Appraised Value (as of)(7): | $173,500,000 (Various) | |
| FF&E Reserve: | $0 | $119,435 | N/A | Cut-off Date LTV Ratio(1)(7): | 65.3% | |
| Seasonality: | $163,000 | (4) | N/A | Maturity Date LTV Ratio(1)(7): | 49.0% | |
| PIP Reserve: | $14,116,206 | $0 | N/A | |||
| Sources and Uses | ||||||
| Sources | Proceeds | % of Total | Uses | Proceeds | % of Total | |
| Loan Amount: | $113,220,258 | 68.3% | Purchase Price: | $146,852,823 | 88.6% | |
| Borrower’s Equity: | $52,507,853 | 31.7% | Upfront Reserves: | $14,844,099 | 9.0% | |
| Closing Costs: | $4,031,189 | 2.4% | ||||
| Total Sources: | $165,728,111 | 100.0% | Total Uses: | $165,728,111 | 100.0% | |
| (1) | The Northwest Hotel Portfolio Mortgage Loan (as defined below) is part of the Northwest Hotel Portfolio Whole Loan (as defined below), which comprises three pari passu notes with an aggregate original principal balance of $113,220,258. The Cut-off Date Balance per Room, Maturity Date Balance per Room, UW NOI Debt Yield, UW NOI Debt Yield at Maturity, UW NCF DSCR, Cut-off Date LTV Ratio and Maturity Date LTV Ratio numbers presented are based on the Northwest Hotel Portfolio Whole Loan. |
| (2) | Defeasance of the Northwest Hotel Portfolio Whole Loan is permitted at any time after the earlier of (i) May 11, 2022 and (ii) two years from the closing date of the securitization that includes the last pari passu note of the Northwest Hotel Portfolio Whole Loan to be securitized. The assumed lockout period of 24 payments is based on the closing date of this transaction in April 2018. |
| (3) | See “The Mortgage Loan”, and “Additional Secured Indebtedness (not including trade debts)” for a discussion of the additional debt. |
| (4) | See “Escrows and Reserves” below for further discussion of reserve requirements. |
| (5) | See“The Borrowers and the Sponsors” below. |
| (6) | The increase in NOI from 2015 to 2016 was due to an increase in Occupancy and ADR (see “Operating History and Underwritten Net Cash Flow” below). |
| (7) | The Appraised Value and LTVs shown are based on the “as-is” appraised value (as of October 1, 2017) for two of the Northwest Hotel Portfolio Properties (as defined below) and the “when complete” appraised value (as of October 1, 2018) for five of the Northwest Hotel Portfolio Properties, which assumes certain outstanding PIP work has been completed (see “The Properties” below). The related PIP work was reserved for upon the origination of the Northwest Hotel Portfolio Whole Loan (see “Escrows and Reserves” below). Based on the “as-is” appraised value for all of the Northwest Hotel Portfolio Properties of $155,700,000 (as of October 1, 2017), the Cut-off Date LTV Ratio and Maturity Date LTV Ratio are approximately 72.7% and 54.6%, respectively. |
The Mortgage Loan. The sixth largest mortgage loan (the “Northwest Hotel Portfolio Mortgage Loan”) is part of a whole loan (the “Northwest Hotel Portfolio Whole Loan”) evidenced by threepari passupromissory notes in the aggregate original principal amount of $113,220,258 which are secured by the first priority fee interest in a portfolio of seven limited-service hospitality properties located in Idaho, Utah and Oregon (the “Northwest Hotel Portfolio Properties”). The non-controlling promissory Note A-2 in the original principal amount of $40,326,936 represents the Northwest Hotel Portfolio Mortgage Loan and will be included in the BANK 2018-BNK11 securitization trust. The controlling promissory Note A-1 in the original principal amount of $39,900,000 and the non-controlling promissory Note A-3 in the original principal amount of $32,993,322 (collectively, the “Northwest Hotel Portfolio Pari Passu Companion Loans”), are expected to be contributed to a future securitization trust or trusts. The Northwest Hotel Portfolio Mortgage Loan will initially be serviced pursuant to the pooling and servicing agreement for the BANK 2018-BNK11 securitization trust, and from and after the securitization of the controlling Note A-1, will be serviced pursuant to the pooling and servicing agreement for the securitization to which Note A-1 is contributed. See “Description of the Mortgage Pool—The Whole Loans— The Serviced Pari Passu Whole Loans” and “—The Non-Serviced Pari Passu Whole Loans”and“Pooling and Servicing Agreement” in the Preliminary Prospectus. The proceeds of the Northwest Hotel Portfolio Whole Loan, along with cash equity from the Northwest Hotel Portfolio Borrower (as defined below), were primarily used to acquire the Northwest Hotel Portfolio Properties, pay closing costs and fund reserves.
This is not a research report and was not prepared by any Underwriter’s research department. Please see additional important information and qualifications at the end of this Term Sheet. |
| T-76 |
| BANK 2018-BNK11 | Northwest Hotel Portfolio |
| Northwest Hotel Portfolio Whole Loan Summary | ||||
| Note | Original Balance | Cut-off Date Balance | Note Holder | Controlling Piece |
| A-1 | $39,900,000 | $39,900,000 | Wells Fargo Bank, N.A. | Yes |
| A-2 | $40,326,936 | $40,326,936 | BANK 2018-BNK11 | No |
| A-3 | $32,993,322 | $32,993,322 | Wells Fargo Bank, N.A. | No |
| Total | $113,220,258 | $113,220,258 | ||
The Borrowers and the Sponsors. The borrowers are 600 South Salt Lake City Hotel, LLC; Bluff Bend Hotel, LLC; Columbia Bend Hotel, LLC; Ironwood Coeur d’Alene Hotel, LLC; Overland Boise Hotel, LLC; Pole Line Twin Falls Hotel, LLC; and Riverstone Coeur d’Alene Hotel, LLC (collectively, the “Northwest Hotel Portfolio Borrower”), each a single-purpose Delaware limited liability company structured to be bankruptcy remote with two independent directors. Legal counsel to the Northwest Hotel Portfolio Borrower delivered a non-consolidation opinion in connection with the origination of the Northwest Hotel Portfolio Whole Loan.
The two sponsors and non-recourse carveout guarantors, Jason R. Kotter and Ryan N. Van Alfen, are co-founders of Athlos Academies based in Boise, Idaho. Athlos Academies was founded in 2007 to provide charter schools with the financial tools necessary to acquire real estate and construct school buildings. As of June 2017, Athlos had completed 29 schools (for over $525 million), sold 20 schools and announced plans to expand into Louisiana, Utah and Minnesota.
Ameritel Inns, Inc. (“Ameritel”), the seller of the Northwest Hotel Portfolio Properties, currently acts as the sub-property manager of the Northwest Hotel Portfolio Properties, subject to a management agreement scheduled to expire on March 31, 2018, with three, 1-month extension periods. Following such expiration, the property manager of the Northwest Hotel Portfolio Properties will be Hotel Management Services, LLC (the “Northwest Hotel Portfolio Manager”), an affiliate of the Northwest Hotel Portfolio Borrower. The Northwest Hotel Portfolio Whole Loan documents require that either or both of J. Scott Ableman and Charles W. Everett are employed as Chief Financial Officer and Vice President of Operations, respectively, of the Northwest Hotel Portfolio Manager. Mr. Ableman is the Chief Financial Officer of Ameritel. Mr. Everett oversees management operations for Ameritel and also serves as the public relations director.
The Properties. The Northwest Hotel Portfolio Properties comprise seven limited-service hotels built between 1997 and 2014 totaling 818 rooms that, as of December 31, 2017, reported a weighted average occupancy rate of 79.4% with individual hotel occupancies ranging from 67.3% to 85.4%. The Northwest Hotel Portfolio Borrower is required to complete a property improvement plan (“PIP”) at each of the Northwest Hotel Portfolio Properties at a total estimated cost of $14,905,802 ($18,222 per room). At origination of the Northwest Hotel Portfolio Whole Loan, $14,116,206 was reserved for planned PIP renovations, which represents 110% of the total estimated cost at six of the Northwest Hotel Portfolio Properties, plus a portion of the estimated cost at the Hilton Garden Inn Salt Lake City Downtown property, where a portion of the planned PIP work has already been completed and certain FF&E and soft goods related to the PIP have already been purchased at origination. Each of the Northwest Hotel Portfolio Properties has a franchise agreement extending at least 15 years from the origination date of the Northwest Hotel Portfolio Whole Loan. If any of the franchise agreements terminates, or upon notice to terminate by either the franchisor or franchisee, the Northwest Hotel Portfolio Whole Loan will spring full recourse to the guarantors in the amount of 125% of the allocated loan amount of the applicable property or properties until such time the Northwest Hotel Portfolio Borrower enters into a replacement franchise agreement satisfactory to the lender.
The following table presents certain information relating to the Northwest Hotel Portfolio Properties:
Property Name | Allocated Cut-off Date Balance(1) | % of Portfolio Cut- off Date Balance | Occupancy (as of 12/31/2017) | Year Built/ Renovated | No. of Rooms | Appraised Value | UW Net Cash Flow | Allocated Cut-off Date LTV |
Hilton Garden Inn Bend Bend, OR | $19,838,016 | 17.5% | 85.4% | 2004/2012 | 96 | $30,400,000(2) | $2,387,736 | 65.3% |
Hampton Inn & Suites Bend Bend, OR | $19,707,503 | 17.4% | 80.0% | 2014/N/A | 114 | $30,200,000 | $2,367,646 | 65.3% |
Hilton Garden Inn Salt Lake City Downtown Salt Lake City, UT | $19,054,937 | 16.8% | 81.9% | 2006/N/A | 132 | $29,200,000(3) | $2,373,620 | 65.3% |
Hampton Inn & Suites Coeur d’Alene Coeur d’Alene, ID | $18,924,423 | 16.7% | 80.2% | 2007/N/A | 124 | $29,000,000(4) | $2,343,628 | 65.3% |
Hampton Inn & Suites Boise Spectrum Boise, ID | $18,076,087 | 16.0% | 80.7% | 1998/2011 | 133 | $27,700,000(5) | $2,125,491 | 65.3% |
| La Quinta Inns & Suites Coeur d’Alene Coeur d’Alene, ID | $9,135,930 | 8.1% | 67.3% | 1997/2014 | 118 | $14,000,000 | $1,397,480 | 65.3% |
La Quinta Inns & Suites Twin Falls Twin Falls, ID | $8,483,362 | 7.5% | 77.0% | 2008/N/A | 101 | $13,000,000(6) | $1,134,062 | 65.3% |
| Total/Weighted Average | $113,220,258 | 100.0% | 79.4% | 818 | $173,500,000(7) | $14,129,663 | 65.3% |
| (1) | Balances shown are for the Northwest Hotel Portfolio Whole Loan. |
| (2) | The appraised value shown is the “when complete” market value conclusion as of October 1, 2018. The “as is” market value as of October 1, 2017 is $27,700,000. |
| (3) | The appraised value shown is the “when complete” market value conclusion as of October 1, 2018. The “as is” market value as of October 1, 2017 is $24,700,000. |
| (4) | The appraised value shown is the “when complete” market value conclusion as of October 1, 2018. The “as is” market value as of October 1, 2017 is $24,900,000. |
| (5) | The appraised value shown is the “when complete” market value conclusion as of October 1, 2018. The “as is” market value as of October 1, 2017 is $23,400,000. |
| (6) | The appraised value shown is the “when complete” market value conclusion as of October 1, 2018. The “as is” market value as of October 1, 2017 is $10,800,000. |
| (7) | The total appraised value shown comprises the “when complete” market value conclusion as of October 1, 2018, where footnoted above. The total “as is” market value as of October 1, 2017 is $155,700,000. |
This is not a research report and was not prepared by any Underwriter’s research department. Please see additional important information and qualifications at the end of this Term Sheet. |
| T-77 |
| BANK 2018-BNK11 | Northwest Hotel Portfolio |
Hilton Garden Inn Bend
The Hilton Garden Inn Bend property is a 96-room, three-story, limited-service hotel located in Bend, Oregon. The Hilton Garden Inn Bend property is situated on a 2.34-acre parcel and contains 94 surface parking spaces, resulting in a parking ratio of approximately 1.0 space per room. The Hilton Garden Inn Bend property opened in 2004 as an Ameritel Inn and was renovated and rebranded as a Hilton Garden Inn in 2012. The hotel features the Garden Grill & Bar, adjacent to the lobby, where breakfast and dinner are served daily. The Northwest Hotel Portfolio Borrower is required to complete a PIP at the Hilton Garden Inn Bend property at an estimated cost of $1,936,652 ($20,173 per room), for which $2,130,317 was reserved at origination of the Northwest Hotel Portfolio Whole Loan. Planned PIP work includes upgrades to the guest bedrooms, guest bathrooms, pantry, business center, front desk, public restrooms, pool area and the parking lot. PIP work is required to be completed within 24 months of loan origination. The franchise agreement with Hilton Franchise Holding LLC (“Hilton Franchisor”) expires on March 31, 2033. The appraisal identified one proposed 120-room limited service hotel (the Best Western Premier) that is anticipated to open in October 2018 and is expected to compete directly with the Hilton Garden Inn Bend property.
The Hilton Garden Inn Bend property guestroom configuration includes 49 king rooms, 30 double-queen rooms and 17 suites. Amenities include a fitness center, business center, indoor swimming pool and whirlpool, market pantry, guest laundry area and a casual restaurant and lounge. The Hilton Garden Inn Bend property also provides two divisible meeting rooms, totaling 2,040 SF, on the first floor.
Hampton Inn & Suites Bend
The Hampton Inn & Suites Bend property is a 114-room, three-story, limited-service hotel located in Bend, Oregon. The Hampton Inn & Suites Bend property is situated on a 2.99-acre parcel and contains 114 surface parking spaces, resulting in a parking ratio of approximately 1.0 space per room. The Hampton Inn & Suites Bend property opened in 2014. The Northwest Hotel Portfolio Borrower is required to complete a PIP at the Hampton Inn & Suites Bend property at an estimated cost of $50,000 ($439 per room), for which $55,000 was reserved at origination of the Northwest Hotel Portfolio Whole Loan. Planned PIP work includes upgrades to guestrooms, corridors and public restrooms. PIP work is required to be completed within 12 months of loan origination. The franchise agreement with Hilton Franchisor expires on August 31, 2034.
The Hampton Inn & Suites Bend property guestroom configuration includes 24 king rooms, 64 double-queen rooms and 26 suites. Amenities include a fitness center, business center, indoor swimming pool and whirlpool, market pantry, guest laundry area and complimentary hot breakfast. The Hampton Inn & Suites Bend property also provides one divisible meeting room, totaling 2,263 SF, on the first floor.
Hilton Garden Inn Salt Lake City Downtown
The Hilton Garden Inn Salt Lake City Downtown property is a 132-room, four-story, limited-service hotel located in Salt Lake City, Utah. The Hilton Garden Inn Salt Lake City Downtown property is situated on a 2.28-acre parcel and contains 91 surface parking spaces, resulting in a parking ratio of approximately 0.7 spaces per room. The Hilton Garden Inn Salt Lake City Downtown property opened in 2006. The hotel features the Garden Grill restaurant, adjacent to the lobby, where breakfast and dinner are served daily. The Northwest Hotel Portfolio Borrower is required to complete a PIP at the Hilton Garden Inn Salt Lake City Downtown property at an estimated cost of $3,756,579 ($28,459 per room), for which $1,852,061 was reserved at origination of the Northwest Hotel Portfolio Whole Loan (a portion of the PIP work has already been completed and FF&E and soft goods related to the PIP were already purchased at loan origination). Planned PIP work includes upgrades to the guest bedrooms, guest bathrooms, lobby, public restrooms, exercise room, restaurant and landscaping. PIP work is required to be completed within 12 months of loan origination. The franchise agreement with Hilton Franchisor expires on March 31, 2033.
The Hilton Garden Inn Salt Lake City Downtown property guestroom configuration includes 64 king rooms, 58 double-queen rooms and 10 suites. Amenities include a fitness room, business center, indoor swimming pool and whirlpool, market pantry, guest laundry area and casual restaurant. The Hilton Garden Inn Salt Lake City Downtown property also provides one meeting room and one boardroom, totaling 3,255 SF, on the first floor.
Hampton Inn & Suites Coeur d’Alene
The Hampton Inn & Suites Coeur d’Alene property is a 124-room, five-story, limited-service hotel located in Coeur d’Alene, Idaho. The Hampton Inn & Suites Coeur d’Alene property is situated on a 3.07-acre parcel and contains 154 surface parking spaces, resulting in a parking ratio of approximately 1.2 spaces per room. The Hampton Inn & Suites Coeur d’Alene property opened in 2007. The Northwest Hotel Portfolio Borrower is required to complete a PIP at the Hampton Inn & Suites Coeur d’Alene property at an estimated cost of $3,343,050 ($26,960 per room), for which $3,677,355 was reserved at origination of the Northwest Hotel Portfolio Whole Loan. Planned PIP work includes upgrades to the guest bedrooms, guest bathrooms, breakfast area, guest laundry, meeting rooms, exercise room and the parking lot. PIP work is required to be completed within 36 months of loan origination. The franchise agreement with Hilton Franchisor expires on March 31, 2033.
The Hampton Inn & Suites Coeur d’Alene property guestroom configuration includes 38 king rooms, 49 double-queen rooms and 37 suites. Amenities include a fitness room, business center, indoor swimming pool and whirlpool, market pantry, guest laundry area and complimentary hot breakfast. The Hampton Inn & Suites Coeur d’Alene property also provides one meeting room and one boardroom, totaling 3,424 SF, on the first floor.
Hampton Inn & Suites Boise Spectrum
The Hampton Inn & Suites Boise Spectrum property is a 133-room, four-story, limited-service hotel located in Boise, Idaho. The Hampton Inn & Suites Boise Spectrum property is situated on a 2.94-acre parcel and contains 125 surface parking spaces, resulting in a parking ratio of approximately 0.9 spaces per room. The Hampton Inn & Suites Boise Spectrum property opened in 1998 and was renovated and rebranded to a Hampton Inn & Suites in 2011. The Northwest Hotel Portfolio Borrower is required to complete a PIP at the Hampton Inn & Suites Boise Spectrum property at an estimated cost of $3,754,121 ($28,226 per room), for which $4,129,533 was reserved at origination of the Northwest Hotel Portfolio Whole Loan. Planned PIP work includes upgrades to the guest bedrooms, guest bathrooms, front desk, breakfast area, corridors, exercise room and the building exterior. PIP work is required to be completed within 24 months of loan origination. The franchise agreement with Hilton Franchisor expires on March 31, 2033.
The Hampton Inn & Suites Boise Spectrum property guestroom configuration includes 49 king rooms, 55 double-queen rooms and 29 suites. Amenities include a fitness room, business center, indoor swimming pool and whirlpool, market pantry, guest laundry area, airport shuttle and complimentary hot breakfast. The Hampton Inn & Suites Boise Spectrum property also provides three meeting rooms, totaling 3,480 SF, on the first floor.
This is not a research report and was not prepared by any Underwriter’s research department. Please see additional important information and qualifications at the end of this Term Sheet. |
| T-78 |
| BANK 2018-BNK11 | Northwest Hotel Portfolio |
La Quinta Inns & Suites Coeur d’Alene
The La Quinta Inns & Suites Coeur d’Alene property is a 118-room, four-story, limited-service hotel located in Coeur d’Alene, Idaho. La Quinta Inns & Suites Coeur d’Alene property is situated on a 2.13-acre parcel and contains 120 surface parking spaces, resulting in a parking ratio of approximately 1.0 space per room. The La Quinta Inns & Suites Coeur d’Alene property opened in 1997 as an Ameritel Inn and was renovated and rebranded to a La Quinta Inns & Suites in 2014. The Northwest Hotel Portfolio Borrower is required to complete a PIP at the La Quinta Inns & Suites Coeur d’Alene property at an estimated cost of $315,400 ($2,673 per room), for which $346,940 was reserved at origination of the Northwest Hotel Portfolio Whole Loan. Planned PIP work includes upgrades to the guest bedrooms, guest bathrooms, lobby, board room, pool area and fitness center. The franchise agreement with La Quinta Franchising LLC (“La Quinta Franchisor”) expires in March 2038. The franchisor and franchisee each have the right to terminate the franchise agreement on the 5th, 10th and 15th anniversary of the effective date (March 2018) with 12 months’ notice.
The La Quinta Inns & Suites Coeur d’Alene property guestroom configuration includes 62 king rooms, 44 double-queen rooms and 12 suites. Amenities include a fitness room, indoor swimming pool and whirlpool, guest laundry area and complimentary hot breakfast. The La Quinta Inns & Suites Coeur d’Alene property also provides one divisible meeting room, totaling 1,500 SF, on the first floor.
La Quinta Inns & Suites Twin Falls
The La Quinta Inns & Suites Twin Falls property is a 101-room, three-story limited-service hotel located in Twin Falls, Idaho. The La Quinta Inns & Suites Twin Falls property is situated on a 2.88-acre parcel and contains 121 surface parking spaces, resulting in a parking ratio of approximately 1.2 spaces per room. The La Quinta Inns & Suites Twin Falls property opened in 2008 as an Ameritel Inn and was rebranded to a La Quinta Inns & Suites in 2010. The Northwest Hotel Portfolio Borrower is required to complete a PIP at the La Quinta Inns & Suites Twin Falls property at an estimated cost of $1,750,000 ($17,327 per room), for which $1,925,000 was reserved at origination of the Northwest Hotel Portfolio Whole Loan. Planned PIP work includes upgrades to the lobby, breakfast area, business center, stairways, guest bedrooms, guest bathrooms and landscaping. The franchise agreement with La Quinta Franchisor expires in March 2038. The franchisor and franchisee each have the right to terminate the franchise agreement on the 5th, 10th and 15th anniversary of the effective date (March 2018) with 12 months’ notice.
The La Quinta Inns & Suites Twin Falls property guestroom configuration includes 54 king rooms, 39 double-queen rooms and 8 suites. Amenities include a fitness room, business center, indoor swimming pool and whirlpool, market pantry, guest laundry area and complimentary breakfast. The La Quinta Inns & Suites Twin Falls property also provides two meeting rooms, totaling 2,706 SF, on the first floor.
2017 Accommodated Room Night Demand(1)
| ||||||
Property | Commercial/ | Meeting/Group | Leisure | |||
| Hilton Garden Inn Bend | 50% | 20% | 30% | |||
| Hampton Inn & Suites Bend | 55% | 10% | 35% | |||
| Hilton Garden Inn Salt Lake City Downtown | 60% | 25% | 15% | |||
| Hampton Inn & Suites Coeur d’Alene | 30% | 10% | 60% | |||
| Hampton Inn & Suites Boise Spectrum | 65% | 15% | 20% | |||
| La Quinta Inns & Suites Coeur d’Alene | 35% | 15% | 50% | |||
| La Quinta Inns & Suites Twin Falls | 65% | 15% | 20% | |||
| (1) | Information obtained from the appraisals. |
The Market. The Northwest Hotel Portfolio Properties are located in five distinct markets.
Hampton Inn & Suites Bend and Hilton Garden Inn Bend
The Hampton Inn & Suites Bend property and the Hilton Garden Inn Bend property are located in Bend, Deschutes County, Oregon, within the Bend-Redmond, Oregon metropolitan statistical area. Bend is located approximately 100 miles southeast of Portland, Oregon, situated on the Deschutes River. In 2016, the United States Census Bureau reported that the Bend-Redmond Metropolitan Area was the eighth fastest-growing metropolitan area in the nation. Major employers include St. Charles Medical Centers, Bend Memorial Clinic and Safeway. In 2016, St. Charles Bend announced plans to add a new $66-million patient tower in response to increasing demand. The project is expected to be completed in 2019. The tourism industry employs more than 9,200 residents in Central Oregon as of 2016 and is driven by the year-round recreational activities. According to the appraisal, the 2017 market segmentation for the Hampton Inn & Suites Bend property was approximately 55% commercial/government, 10% meeting & group and 35% leisure and the 2017 market segmentation for the Hilton Garden Inn Bend property was approximately 50% commercial/government, 20% meeting & group and 30% leisure.
The Hampton Inn & Suites Bend property is located in the Old Mill District, in the northeast quadrant of the intersection formed by Southwest Columbia Street and Southwest Shevlin Hixon Drive, along the Deschutes River and approximately 0.9 mile west of Highway 97. The Hilton Garden Inn Bend property is located west of the intersection formed by Southwest Bluff Drive and Southwest Wilson Avenue, approximately 0.5 mile west of Highway 97 and approximately 0.6 mile northeast of the Hampton Inn & Suites Bend property. The neighborhood is characterized by restaurants, retail stores, recreational facilities, and entertainment venues, as well as low-rise offices, residences and hotels. The area includes Les Schwab Amphitheater, OSUCascades Graduate Research Center, and Bend Park & Recreation District Office. Bend is served by the Redmond Municipal Airport, which is located approximately 14 miles northeast of both properties. According to the appraisal, the 2017 estimated population within a three-, and five-mile radius of the Hampton Inn & Suites Bend property was 66,863, and 96,282, respectively. The estimated average household income within the same radii was, $82,787, and $82,201. The 2017 estimated population within a three-, and five-mile radius of the Hilton Garden Inn Bend property was 71,037, and 96,765, respectively. The estimated average household income within the same radii was $81,077, and $82,285, respectively.
Hilton Garden Inn Salt Lake City Downtown
The Hilton Garden Inn Salt Lake City Downtown property is located in Salt Lake City, Salt Lake County, Utah, within the central business district submarket. Salt Lake City is the capital of Utah and the largest city in the state. The city’s major sectors include transportation, healthcare, education,
This is not a research report and was not prepared by any Underwriter’s research department. Please see additional important information and qualifications at the end of this Term Sheet. |
| T-79 |
| BANK 2018-BNK11 | Northwest Hotel Portfolio |
and government, as well as the technology, finance, and tourism and leisure industries. Major employers include Delta Airlines, Goldman Sachs, Intermountain Healthcare and Chevron. According to a third-party market research report, the 2017 estimated population within a three-, and five-mile radius of the Hilton Garden Inn Salt Lake City Downtown property was 140,661, and 249,984, respectively. The estimated average household income within the same radii was $65,927, and $70,023, respectively. According to the appraisal, the 2017 market segmentation for the Hilton Garden Inn Salt Lake City Downtown property was approximately 60% commercial/government, 25% meeting & group and 15% leisure.
The Hilton Garden Inn Salt Lake City Downtown property is located in the northeast quadrant of the intersection formed by West 600 South and 300 West, approximately 0.7 mile east of Interstates 80 and 15. The neighborhood is characterized by restaurants, office and mixed-use buildings, hotels, multi-family residences, and retail centers, including the Salt Palace Convention Center, Zions Bancorporation, The Church of Jesus Christ of Latter-day Saints headquarters and City Creek Center. According to the appraisal, Overstock.com announced plans to construct its global headquarters in Midvale, approximately 10.9 miles south of the Hilton Garden Inn Salt Lake City Downtown property. The estimated $100-million office project opened for business in October 2016. Salt Lake City International Airport is located approximately five miles to the northwest of the Hilton Garden Inn Salt Lake City Downtown property.
Hampton Inn & Suites Coeur d’Alene and La Quinta Inns & Suites Coeur d’Alene
The Hampton Inn & Suites Coeur d’Alene property and the La Quinta Inns & Suites Coeur d’Alene property are located in Coeur d’Alene, Kootenai County, Idaho, within the Coeur d’Alene metropolitan statistical area. Coeur d’Alene is the economic and political center of and the largest city in Kootenai County. The city features Lake Coeur d’Alene, one of the three largest inland bodies of water in the Pacific Northwest, and numerous outdoor recreational opportunities, including fishing, boating, golf, hiking, and camping. Major employers include Hagadone Corporation, Kootenai Health and the State of Idaho. Kootenai Health is a nonprofit community hospital serving over 13,000 inpatients and 180,000 outpatients each year. In the fall of 2014, construction began on the hospital’s first expansion in 30 years. According to the appraisal, by the time the facilities are anticipated to be at full capacity in 2018, the hospital expects to hire 100 to 150 new employees. Hagadone Corporation is a private corporation made up of many subsidiaries primarily focused on the publishing, newspaper, and hospitality industries. According to the appraisal, the 2017 market segmentation for the Hampton Inn & Suites Coeur d’Alene property was approximately 30% commercial/government, 10% meeting & group and 60% leisure; and the 2017 market segmentation for the La Quinta Inns & Suites Coeur d’Alene property was approximately 35% commercial/government, 15% meeting & group and 50% leisure.
The Hampton Inn & Suites Coeur d’Alene property is located in the Riverstone mixed-use development, in the southern quadrant of the intersection formed by West Riverstone Drive and North Beebe Boulevard, approximately 700 feet northeast of the Spokane River and 0.7 mile south of Interstate 90. The La Quinta Inns & Suites Coeur d’Alene property is located along the I-90 commercial corridor, southeast of the interchange formed by U.S. Highway 95 and Interstate 90 and approximately 1.0 mile east of the Hampton Inn & Suites Coeur d’Alene property. The neighborhood is characterized by restaurants, retail shops, hotels, and recreational facilities, as well as low-rise office buildings and multi-family residences and includes Coeur d’Alene Golf Club, Kootenai Health, and Umpqua Bank. Coeur d’Alene is served by the Spokane International Airport, which is located approximately 30 miles to the west of both the Hampton Inn & Suites Coeur d’Alene property and the La Quinta Inns & Suites Coeur d’Alene property. According to a third party market research report, the 2017 estimated population within a three-, and five-mile radius of the Hampton Inn & Suites Coeur d’Alene property was 47,095, and 79,927, respectively. The estimated average household income within the same radii was $58,096, and $64,484. The 2017 estimated population within a three-, and five-mile radius of the La Quinta Inns & Suites Coeur d’Alene property was 49,578, and 77,327, respectively. The estimated average household income within the same radii was $58,506, and $64,631, respectively.
Hampton Inn & Suites Boise Spectrum
The Hampton Inn & Suites Boise Spectrum property is located in Boise, Ada County, Idaho, within the Boise-Nampa metropolitan statistical area. Boise is the capital of Idaho and the largest city in the state. Major employers include St. Luke’s Health Systems, Micron Technology, Inc., West Ada School District, Boise School District and Boise State University, the state’s largest post-secondary institution. According to a third-party market research report, the 2017 estimated population within a three-, and five-mile radius of the Hampton Inn & Suites Boise Spectrum property was 87,701, and 221,502, respectively. The estimated average household income within the same radii was $60,058, and $64,917, respectively. According to the appraisal, the 2017 market segmentation for the Hampton Inn & Suites Boise Spectrum property was approximately 65% commercial/government, 15% meeting & group and 20% leisure.
The Hampton Inn & Suites Boise Spectrum property is located in the Boise Spectrum Center, in the southwest quadrant of the intersection formed by West Overland Road and South Cole Road. Interstate 84 is approximately 450 feet to the northeast and Interstate 184 is approximately 1.7 miles to the northwest. The Boise Spectrum Center features the Edwards Boise 21 & IMAX Theater and Cracker Barrel Restaurant. The Hampton Inn & Suites Boise Spectrum property is served by the Boise Airport, which is located approximately three miles to the southeast. The neighborhood is characterized by entertainment and retail shopping centers, as well as restaurants along the primary thoroughfares, with light-industrial and residential areas located along the secondary roadways.
La Quinta Inns & Suites Twin Falls
The La Quinta Inns & Suites Twin Falls property is located in Twin Falls, Twin Falls County, Idaho, within the Twin Falls submarket. The city of Twin Falls is located in south-central Idaho, approximately 125 miles southeast of Boise. As the largest city within Idaho’s Magic Valley region, Twin Falls serves as the regional commercial hub for south-central Idaho and northeastern Nevada. The Magic Valley denotes an agricultural region in south-central Idaho that is located along the Snake River Plain and Snake River, which serves as a water and power source for the region. One of the area’s largest employers is Chobani Yogurt, which opened the world’s largest yogurt production facility in December 2012, approximately 6.5 miles southeast of the La Quinta Inns & Suites Twin Falls property. According to a third-party market research report, the 2017 estimated population within a three-, and five-mile radius of the La Quinta Inns & Suites Twin Falls property was 39,824 and 55,944, respectively. The estimated average household income within the same radii was $58,358, and $60,263, respectively. According to the appraisal, the 2017 market segmentation for the La Quinta Inns & Suites Twin Falls property was approximately 65% commercial/government, 15% meeting & group and 20% leisure. Primary commercial demand generators for this market include major food-processing companies in the area, such as Chobani Yogurt, Clif Bar and Glanbia Food USA, as well as the healthcare sector.
The La Quinta Inns & Suites Twin Falls property is located in the northeast quadrant of the intersection formed by Pole Line Road (Highway 93) and Harrison Street. Snake River is located approximately 2.0 miles to the north and Interstate 84 is approximately 4.8 miles to the northeast. Twin Falls has outdoor recreation options, including activities at Snake River, Shoshone Falls and Sawtooth National Forest. Canyon Park West, approximately 1.5 miles northeast of the La Quinta Inns & Suites Twin Falls property, opened in 2016 and features major retailers such as Ross, Ulta Beauty, Dick’s
This is not a research report and was not prepared by any Underwriter’s research department. Please see additional important information and qualifications at the end of this Term Sheet. |
| T-80 |
| BANK 2018-BNK11 | Northwest Hotel Portfolio |
Sporting Goods, and Petco, as well as restaurants including Noodles & Company. The La Quinta Inns & Suites Twin Falls property is served by the Magic Valley Regional Airport, which is located approximately seven miles to the south.
The following tables present certain information relating to the Northwest Hotel Portfolio Properties historical occupancy, ADR RevPAR and penetration rates:
Historical Occupancy, ADR and RevPAR(1) | |||||||||||
2015 | 2016 | 2017 | |||||||||
Property | Occupancy | ADR | RevPAR | Occupancy | ADR | RevPAR | Occupancy | ADR | RevPAR | ||
| Hilton Garden Inn Bend | 85.9% | $162.17 | $139.24 | 88.7% | $176.25 | $156.30 | 85.5% | $180.15 | $153.95 | ||
| Hampton Inn & Suites Bend | 78.4% | $138.39 | $108.44 | 84.5% | $155.25 | $131.21 | 79.8% | $163.00 | $130.03 | ||
| Hilton Garden Inn Salt Lake City | 81.0% | $143.98 | $116.61 | 81.0% | $144.63 | $117.08 | 81.7% | $148.82 | $121.61 | ||
| Hampton Inn & Suites Coeur d’Alene | 74.0% | $140.25 | $103.76 | 79.7% | $141.16 | $112.50 | 80.3% | $144.18 | $115.83 | ||
| Hampton Inn & Suites Boise | 82.9% | $121.71 | $100.96 | 83.9% | $131.51 | $110.36 | 80.9% | $136.30 | $110.23 | ||
| La Quinta Inns & Suites Coeur d’Alene | 62.7% | $116.88 | $73.27 | 63.8% | $119.40 | $76.13 | 68.2% | $123.11 | $83.93 | ||
| La Quinta Inns & Suites Twin Falls | 77.9% | $100.11 | $78.00 | 80.6% | $108.66 | $87.54 | 78.6% | $111.13 | $87.32 | ||
| (1) | Information obtained from third party hospitality research reports dated January 18, 2018. |
Historical Penetration Rates(1) | |||||||||||
2015 | 2016 | 2017 | |||||||||
Property | Occupancy | ADR | RevPAR | Occupancy | ADR | RevPAR | Occupancy | ADR | RevPAR | ||
| Hilton Garden Inn Bend(2) | 108.9% | 126.8% | 138.0% | 110.1% | 127.8% | 140.7% | 115.6% | 126.4% | 146.1% | ||
| Hampton Inn & Suites Bend(3) | 99.0% | 111.4% | 110.3% | 103.4% | 116.7% | 120.6% | 105.8% | 117.7% | 124.5% | ||
| Hilton Garden Inn Salt Lake City(4) | 110.7% | 113.6% | 125.8% | 110.6% | 113.0% | 124.9% | 106.3% | 111.8% | 118.8% | ||
| Hampton Inn & Suites Coeur d’Alene(5) | 100.4% | 111.8% | 112.2% | 105.0% | 111.3% | 116.9% | 103.4% | 111.6% | 115.4% | ||
| Hampton Inn & Suites Boise(6) | 108.9% | 104.5% | 113.8% | 106.7% | 107.1% | 114.3% | 101.7% | 107.9% | 109.7% | ||
| La Quinta Inns & Suites Coeur d’Alene(7) | 102.8% | 103.8% | 106.7% | 104.7% | 105.3% | 110.3% | 111.5% | 104.7% | 116.8% | ||
| La Quinta Inns & Suites Twin Falls(8) | 107.7% | 103.5% | 111.5% | 103.4% | 101.9% | 105.4% | 101.4% | 105.0% | 106.5% | ||
| (1) | Information obtained from third party hospitality research reports dated January 18, 2018. |
| (2) | The competitive set for Hilton Garden Inn Bend comprises four limited service hotels totaling 367 rooms: Holiday Inn Express & Suites Bend (99 rooms), TownePlace Suites Bend Near Mount Bachelor (71 rooms), DoubleTree Bend (117 rooms) and Fairfield Inn & Suites Bend Downtown (80 rooms). |
| (3) | The competitive set for Hampton Inn & Suites Bend comprises five limited service hotels totaling 432 rooms: La Quinta Inns & Suites Bend (65 rooms), Holiday Inn Express & Suites Bend (99 rooms), TownePlace Suites Bend Near Mount Bachelor (71 rooms), DoubleTree Bend (117 rooms) and Fairfield Inn & Suites Bend Downtown (80 rooms). |
| (4) | The competitive set for Hilton Garden Inn Salt Lake City comprises six limited service hotels totaling 828 rooms: Holiday Inn Express Salt Lake City Downtown (212 rooms), Fairfield Inn & Suites Salt Lake City Downtown (120 rooms), Hampton Inn Salt Lake City Downtown (158 rooms), Homewood Suites Salt Lake City Downtown (124 rooms), Springhill Suites Salt Lake City Downtown (86 rooms) and Hyatt Place Salt Lake City Downtown The Gateway (128 rooms). |
| (5) | The competitive set for Hampton Inn & Suites Coeur d’Alene comprises three limited service hotels totaling 341 rooms: Best Western Plus Coeur d’Alene Inn (122 rooms), Holiday Inn Express & Suites Coeur d’Alene I 90 (101 rooms) and Springhill Suites Coeur d’Alene (118 rooms). |
| (6) | The competitive set for Hampton Inn & Suites Boise comprises six limited service hotels totaling 773 rooms: Hampton Inn Boise Airport (63 rooms), Hampton Inn Suites Boise Meridian (128 rooms), Oxford Suites Boise (132 rooms), Courtyard Boise West Meridian (145 rooms), Hampton Inn Suites Boise Downtown (186 rooms) and Holiday Inn Boise Airport (119 rooms). |
| (7) | The competitive set for La Quinta Inns & Suites Coeur d’Alene comprises four limited service hotels totaling 413 rooms: Best Western Plus Coeur d’Alene Inn (122 rooms), Quality Inn & Suites Coeur d’Alene (51 rooms), Shilo Inn Suites Coeur d’Alene (139 rooms) and Holiday Inn Express & Suites Coeur d’Alene (101 rooms). |
| (8) | The competitive set for La Quinta Inns & Suites Twin Falls comprises four limited service hotels totaling 378 rooms: Best Western Plus Twin Falls Hotel (120 rooms), Hampton Inn Twin Falls (75 rooms), Holiday Inn Express & Suites Twin Falls (91 rooms) and Fairfield Inn & Suites Twin Falls (92 rooms). |
This is not a research report and was not prepared by any Underwriter’s research department. Please see additional important information and qualifications at the end of this Term Sheet. |
| T-81 |
| BANK 2018-BNK11 | Northwest Hotel Portfolio |
Operating History and Underwritten Net Cash Flow. The following table presents certain information relating to the historical operating performance and the Underwritten Net Cash Flow at the Northwest Hotel Portfolio Properties:
| Cash Flow Analysis | ||||||
| 2014(1) | 2015(1)(2) | 2016(2) | 2017 | UW | UW per Room | |
| Occupancy | 65.6% | 77.6% | 80.5% | 79.4% | 79.4% | |
| ADR | $124.89 | $132.07 | $139.19 | $143.40 | $143.40 | |
| RevPAR | $90.29 | $102.43 | $112.11 | $113.84 | $113.84 | |
| Rooms Revenue | $24,457,602 | $30,582,242 | $33,549,147 | $33,990,444 | $33,990,444 | $41,553 |
| Food & Beverage | $1,153,365 | $1,341,412 | $1,317,979 | $1,310,934 | $1,310,934 | $1,603 |
| Other Income(3) | $347,361 | $504,104 | $503,988 | $529,028 | $529,028 | $647 |
| Total Revenue | $25,958,328 | $32,427,758 | $35,371,115 | $35,830,406 | $35,830,406 | $43,802 |
| Total Expenses | $16,358,775 | $18,706,692 | $19,536,323 | $20,182,901 | $20,267,527 | $24,777 |
| Net Operating Income | $9,599,553 | $13,721,067 | $15,834,792 | $15,647,504 | $15,562,879 | $19,026 |
| FF&E | $0 | $0 | $0 | $0 | $1,433,216 | $1,752 |
| Net Cash Flow | $9,599,553 | $13,721,067 | $15,834,792 | $15,647,504 | $14,129,663 | $17,273 |
| NOI DSCR(4) | 1.21x | 1.72x | 1.99x | 1.97x | 1.96x | |
| NCF DSCR(4) | 1.21x | 1.72x | 1.99x | 1.97x | 1.78x | |
| NOI Debt Yield(4) | 8.5% | 12.1% | 14.0% | 13.8% | 13.7% | |
| NCF Debt Yield(4) | 8.5% | 12.1% | 14.0% | 13.8% | 12.5% | |
| (1) | The increase in Rooms Revenue and Net Operating Income from 2014 to 2015 was due to Hampton Inn & Suites Bend not opening until September 2014. In addition, La Quinta Inns & Suites Coeur d’Alene was rebranded from an Ameritel Inn in May 2014. |
| (2) | The increase in Rooms Revenue and Net Operating Income from 2015 to 2016 was primarily due to an increase in Occupancy and ADR. |
| (3) | Other Income consists of valet, guest laundry, gift shop sales and miscellaneous other income. |
| (4) | The debt service coverage ratios and debt yields shown are based on the Northwest Hotel Portfolio Whole Loan. |
Escrows and Reserves. At origination, the Northwest Hotel Portfolio Borrower deposited upfront reserves of $518,257 for real estate taxes, $46,636 for insurance premiums and $14,116,206 ($17,257 per room) for planned PIP renovations and $163,000 for seasonality reserves. The Northwest Hotel Portfolio Whole Loan documents also provide for ongoing monthly reserves of $94,555 for real estate taxes, $15,546 for insurance premiums and $119,435 for furnishings, fixtures and equipment (“FF&E”).
The Northwest Hotel Portfolio Borrower is required to make annual deposits into the seasonality reserve of an amount equal to the net cash flow deficiency, calculated as the net cash flow shortfall, after debt service less the FF&E reserve monthly deposits, during each of the first and fourth calendar quarter of the preceding calendar year, less any seasonality reserve funds on deposit with the lender from the prior year for the applicable quarter. If at any time additional PIP work is required by franchisor under any franchise agreement, the Northwest Hotel Portfolio Borrower is required to deposit an amount equal to the PIP Reserve Shortfall (as defined below) within fifteen days after receipt of notice from franchisor.
The “PIP Reserve Shortfall” means an amount equal to 110% of the estimated costs to complete the applicable PIP, as reasonably determined by lender, less (i) the amount of FF&E reserve funds then on deposit with the lender and (ii) the amount of Franchise Trigger Event Reserve Funds (see “Lockbox and Cash Management” below) then on deposit with the lender.
Lockbox and Cash Management. The Northwest Hotel Portfolio Whole Loan requires a lender-controlled lockbox account, which is already in-place, and that the Northwest Hotel Portfolio Borrower deposits all rent and directs all credit card companies to pay all amounts due directly into such lockbox account. The loan documents also require that all rents received by the Northwest Hotel Portfolio Borrower or the property manager be deposited into the lockbox account within one business day of receipt. Prior to the occurrence of a Cash Trap Event Period (as defined below), all funds in the lockbox account are required to be distributed to the Northwest Hotel Portfolio Borrower. During a Cash Trap Event Period, funds in the lockbox account are required to be swept to a lender controlled cash management account and all excess funds are required to be swept to an excess cash flow subaccount controlled by the lender (provided, however, any excess cash flow swept in accordance with a Franchise Trigger Event Period (as defined below) will be deposited into a separate Franchise Trigger Event reserve funds subaccount (subject to a cap of 110% of contracted PIP work as long as (i) no event of default is continuing; (ii) the Northwest Hotel Portfolio Borrower has entered into a written contract with the franchisor for such work; and (iii) the sum of all excess cash flow held by the lender and PIP reserve funds is greater than 110% of such work)).
A “Cash Trap Event Period” will commence upon the earlier of the following:
| (i) | the occurrence of an event of default under the Northwest Hotel Portfolio Whole Loan; |
| (ii) | the aggregate net cash flow debt yield falling below 10.25%; or |
| (iii) | a Franchise Trigger Event Period (as defined below). |
A Cash Trap Event Period will end upon the occurrence of the following:
| ● | with regard to clause (i), upon the cure of such event of default; |
| ● | with regard to clause (ii), upon the net cash flow debt yield being equal to or greater than 10.25% for two consecutive calendar quarters; or |
| ● | with regard to clause (iii), upon a Franchise Trigger Event Period Cure (as defined below). |
This is not a research report and was not prepared by any Underwriter’s research department. Please see additional important information and qualifications at the end of this Term Sheet. |
| T-82 |
| BANK 2018-BNK11 | Northwest Hotel Portfolio |
A “Franchise Trigger Event Period” will commence upon the earlier of the following:
| (i) | the occurrence of a default or an event of default under any franchise agreement; or |
| (ii) | the cancellation, termination or expiration of any franchise agreement or notice to terminate any franchise agreement by either franchisor or franchisee. |
A “Franchise Trigger Event Period Cure” will occur upon the following:
| ● | with regard to Franchise Trigger Event Period clause (i), (A) upon lender’s receipt of satisfactory evidence that such event of default has been cured, such cure has been accepted by franchisor and that franchisee has remained in good standing under the franchise agreement, or (B) the Northwest Hotel Portfolio Borrower has entered into a replacement franchise agreement satisfactory to lender and in accordance with the loan documents; or |
| ● | with regard to Franchise Trigger Event Period clause (ii), (A) upon lender’s receipt of satisfactory evidence that such cancellation, termination or expiration has been nullified and/or any notice thereof has been retracted, franchisee has regained good standing status under the franchise agreement and that said franchise agreement is in full force and effect, or (B) the Northwest Hotel Portfolio Borrower has entered into a replacement franchise agreement satisfactory to lender and in accordance with the loan documents. |
Additional Secured Indebtedness (not including trade debts).The Northwest Hotel Portfolio Properties also secures the Northwest Hotel Portfolio Pari Passu Companion Loans, which have an aggregate Cut-off Date principal balance of $72,893,322. The Northwest Hotel Portfolio Pari Passu Companion Loans accrue interest at the same rate as the Northwest Hotel Portfolio Mortgage Loan. The Northwest Hotel Portfolio Mortgage Loan is entitled to payments of principal and interest on apro rata andpari passu basis with the Northwest Hotel Portfolio Pari Passu Companion Loans. The holders of the Northwest Hotel Portfolio Mortgage Loan and the Northwest Hotel Portfolio Pari Passu Companion Loans have entered into a co-lender agreement which sets forth the allocation of collections on the Northwest Hotel Portfolio Whole Loan. See “Description of the Mortgage Pool—The Whole Loans—The Serviced Pari Passu Whole Loans” and “The Non-Serviced Pari Passu Whole Loans” in the Preliminary Prospectus.
Mezzanine Loan and Preferred Equity. Not permitted.
Release of Property.Any time after the expiration of the defeasance lockout period, the Northwest Hotel Portfolio Borrower may obtain the release of any of the Northwest Hotel Portfolio Properties on up to six occasions, provided that, among other things, and in accordance with the Northwest Hotel Portfolio Whole Loan documents, (a) no event of default has occurred and is continuing, (b) the loan is defeased in an amount equal to the applicable Release Amount (as defined below), (c) a legal opinion covering compliance in all respects with all laws, rules and regulations governing REMICs has been delivered, and (d) rating agency confirmation that the sale and release will not result in a downgrade, withdrawal or qualification of the respective ratings assigned to the BANK 2018-BNK11 certificates and similar confirmations from each rating agency rating any securities backed by the Northwest Hotel Portfolio Pari Passu Companion Loans have been delivered.
The “Release Amount” for any property being released is an amount equal to the greatest of (a) 100% of the net sales proceeds for such release property, (b) 125% of the Allocated Cut-off Date Balance of such release property (identified in “The Properties” section chart above), (c) an amount that would result in the net cash flow debt service coverage ratio, after giving effect to the release of such property, being not less than the greater of (i) the net cash flow debt service coverage ratio for the Northwest Hotel Portfolio Whole Loan (including such release property) immediately prior to such release and (ii) 1.80x, (d) an amount that would result in the net cash flow debt yield, after giving effect to the release of such property, being not less than the greater of (i) the net cash flow debt yield for the Northwest Hotel Portfolio Whole Loan (including the release property) immediately prior to such release and (ii) 12.5% and (e) an amount that would result in the loan-to-value ratio, after giving effect to the release of such property, being not greater than the lesser of (i) the loan-to-value ratio for the Northwest Hotel Portfolio Whole Loan (including the release property) immediately prior to such release and (ii) 65.0%.
Terrorism Insurance.The Northwest Hotel Portfolio Whole Loan documents require that the “all risk” insurance policy required to be maintained by the Northwest Hotel Portfolio Borrower provide coverage for terrorism in an amount equal to the full replacement cost of the Northwest Hotel Portfolio Properties. The loan documents also require business interruption insurance covering no less than the eighteen month period following the occurrence of a casualty event, together with a six month extended period of indemnity. See “Risk Factors—Risks Relating to the Mortgage Loans—Terrorism Insurance May Not Be Available for All Mortgaged Properties” in the Preliminary Prospectus.
This is not a research report and was not prepared by any Underwriter’s research department. Please see additional important information and qualifications at the end of this Term Sheet. |
| T-83 |
| BANK 2018-BNK11 | North Bay Portfolio |
Mortgage Loan No. 7 – North Bay Portfolio
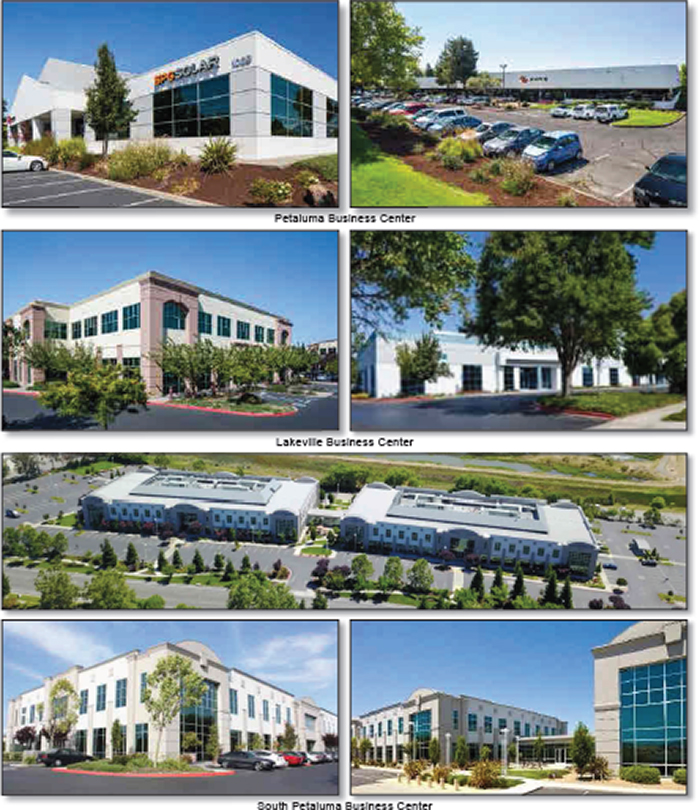
This is not a research report and was not prepared by any Underwriter’s research department. Please see additional important information and qualifications at the end of this Term Sheet. |
| T-84 |
| BANK 2018-BNK11 | North Bay Portfolio |
Mortgage Loan No. 7 – North Bay Portfolio
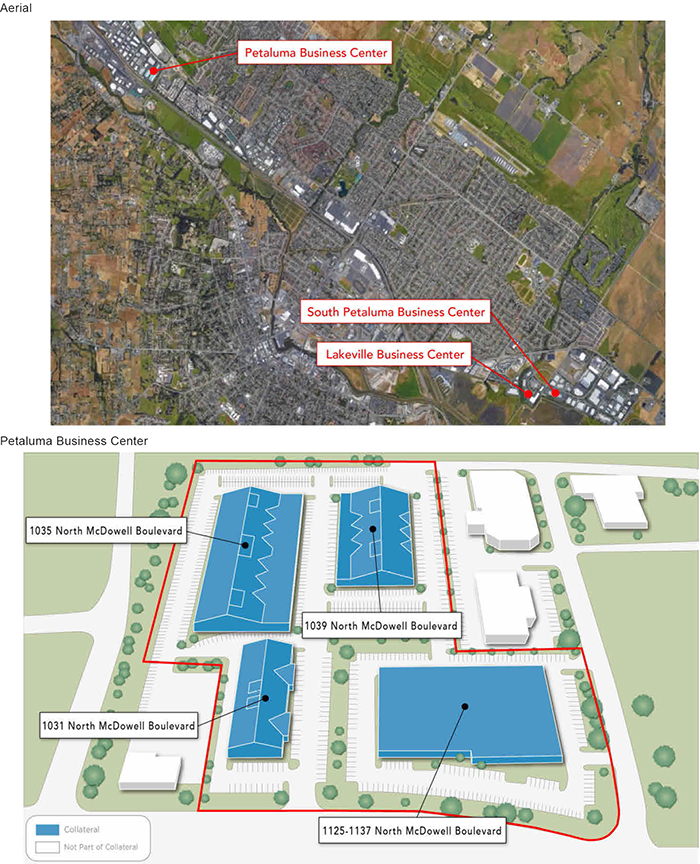
This is not a research report and was not prepared by any Underwriter’s research department. Please see additional important information and qualifications at the end of this Term Sheet. |
| T-85 |
| BANK 2018-BNK11 | North Bay Portfolio |
Mortgage Loan No. 7 – North Bay Portfolio
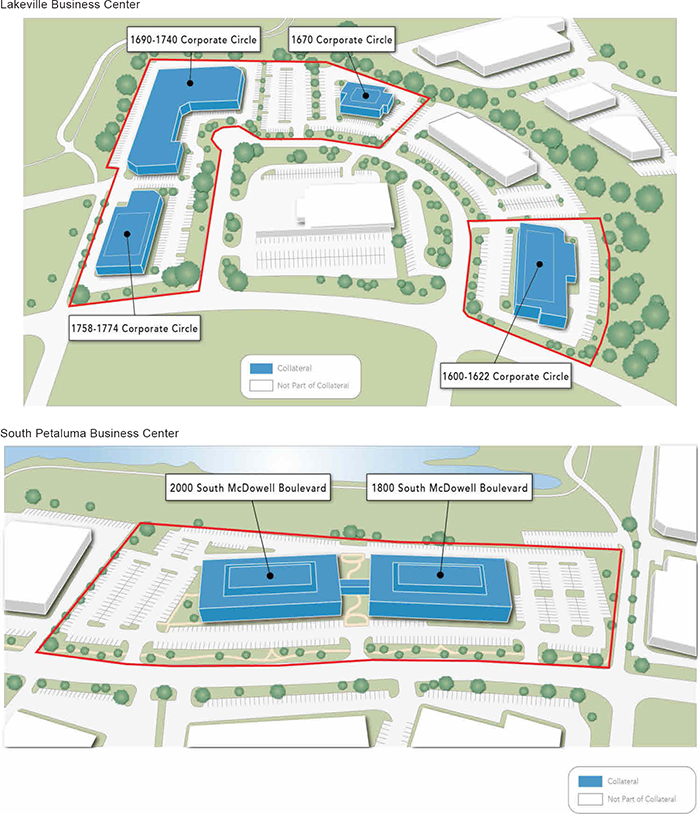
This is not a research report and was not prepared by any Underwriter’s research department. Please see additional important information and qualifications at the end of this Term Sheet. |
| T-86 |
| BANK 2018-BNK11 | North Bay Portfolio |
Mortgage Loan No. 7 – North Bay Portfolio
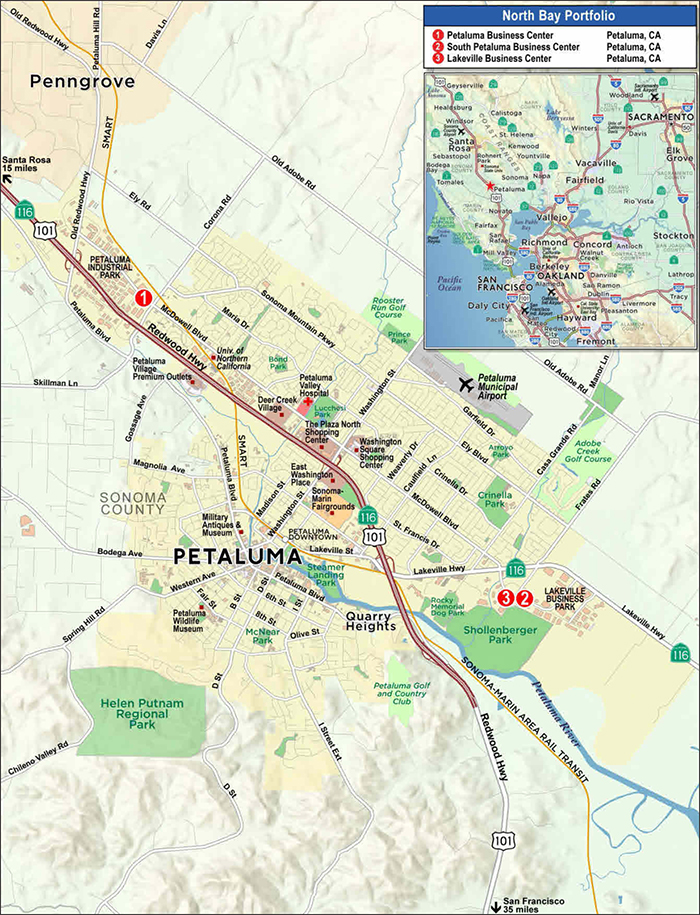
This is not a research report and was not prepared by any Underwriter’s research department. Please see additional important information and qualifications at the end of this Term Sheet. |
| T-87 |
| BANK 2018-BNK11 | North Bay Portfolio |
| Mortgage Loan No. 7 – North Bay Portfolio |
| Mortgage Loan Information | Property Information | ||||||
| Mortgage Loan Seller: | BANA | Single Asset/Portfolio: | Portfolio | ||||
| Original Balance(1): | $35,000,000 | Location: | Petaluma, CA 94954 | ||||
| Cut-off Date Balance(1): | $35,000,000 | General Property Type: | Various | ||||
| % of Initial Pool Balance: | 5.1% | Detailed Property Type: | Various | ||||
| Loan Purpose: | Refinance | Title Vesting: | Fee | ||||
| Sponsor: | Basin Street Properties | Year Built/Renovated: | Various/Various | ||||
| Mortgage Rate: | 4.5040% | Size: | 512,165 SF | ||||
| Note Date: | 3/8/2018 | Cut-off Date Balance per SF(1): | $105 | ||||
| First Payment Date: | 5/1/2018 | Maturity Date Balance per SF(1): | $97 | ||||
| Maturity Date: | 4/1/2028 | Property Manager: | Basin Street Properties | ||||
| Original Term to Maturity: | 120 months | (borrower-related) | |||||
| Original Amortization Term: | 360 months | ||||||
| IO Period: | 60 months | Underwriting and Financial Information | |||||
| Seasoning: | 0 months | UW NOI(4): | $6,065,732 | ||||
| Prepayment Provisions: | LO (24); YM1 (91); O (5) | UW NOI Debt Yield(1): | 11.2% | ||||
| Lockbox/Cash Mgmt Status: | Springing/Springing | UW NOI Debt Yield at Maturity(1): | 12.3% | ||||
| Additional Debt Type(1)(2): | Pari Passu | UW NCF DSCR(1): | 2.21x (IO) 1.66x (P&I) | ||||
| Additional Debt Balance(1)(2): | $19,000,000 | Most Recent NOI: | $5,385,065 (12/31/2017) | ||||
| Future Debt Permitted (Type): | No (N/A) | 2nd Most Recent NOI: | $4,926,558 (12/31/2016) | ||||
| Reserves(3) | 3rd Most Recent NOI: | $3,992,189 (12/31/2015) | |||||
| Type | Initial | Monthly | Cap | Most Recent Occupancy(4): | 92.2% (2/15/2018) | ||
| RE Tax: | $61,195 | $61,195 | N/A | 2nd Most Recent Occupancy(5): | 87.8% (12/31/2016) | ||
| Insurance: | $0 | Springing | N/A | 3rd Most Recent Occupancy(6): | 90.8% (12/31/2015) | ||
| Deferred Maintenance: | $28,000 | $0 | N/A | Appraised Value (as of)(7): | $86,500,000 (Various) | ||
| Recurring Replacements: | $0 | $10,670 | N/A | Cut-off Date LTV Ratio(1)(7): | 62.4% | ||
| TI/LC: | $500,000 | $42,680 | $1,536,495 | Maturity Date LTV Ratio(1)(7): | 57.2% | ||
| Other Reserves: | $2,553,168 | $0 | N/A | ||||
| Sources and Uses | ||||||
| Sources | Proceeds | % of Total | Uses | Proceeds | % of Total | |
| Loan Amount(1): | $54,000,000 | 99.0% | Loan Payoff: | $50,069,968 | 91.8% | |
| Borrower Equity: | $550,777 | 1.0% | Reserves: | $3,142,363 | 5.8% | |
| Closing Costs: | $1,338,446 | 2.5% | ||||
| Total Sources: | $54,550,777 | 100.0% | Total Uses: | $54,550,777 | 100.0% | |
| (1) | The North Bay Portfolio Mortgage Loan (as defined below) is part of the North Bay Portfolio Whole Loan (as defined below), which is comprised of twopari passu promissory notes with an aggregate original principal balance of $54,000,000. The Cut-off Date Balance per SF, Maturity Date Balance per SF, UW NOI Debt Yield, UW NOI Debt Yield at Maturity, UW NCF DSCR, Cut-off Date LTV Ratio and Maturity Date LTV Ratio numbers presented above are based on the aggregate principal balance of the promissory notes comprising the North Bay Portfolio Whole Loan. |
| (2) | See “The Mortgage Loan” and “Additional Secured Indebtedness (not including trade debts)” below for a discussion of additional debt. |
| (3) | See “Escrows and Reserves” below for further discussion of reserve requirements. |
| (4) | The North Bay Portfolio Properties (as defined below) as of February 15, 2018 were 92.2% leased by 25 tenants and 81.5% physically occupied. Most Recent Occupancy includes four tenants with signed leases who are not yet in occupancy: (i) a new 19,883 SF lease to TraumaFX (3.9% of NRA), as to which the tenant is expected to take occupancy by May 2018 that provides for abated rent through June 30, 2018 and $157,315 of tenant improvements), (ii) a new 19,046 SF lease to Kaiser (3.7% of NRA), as to which the tenant is expected to take occupancy by August 2018 that provides for $1,555,731 of tenant improvements and leasing commissions, (iii) an expansion lease for existing tenant Symbio, LLC (2.2% of NRA) for 11,053 SF, as to which the tenant is expected to take occupancy by April 2018 that provides for $428,145 of tenant improvements, and (iv) a replacement relocation lease to Courseco (0.9% of NRA) for 4,800 SF, as to which the tenant is expected to take occupancy by May 2018 that provides for abated rent through May 15, 2018 and $153,600 of tenant improvements. Any outstanding abated rent and tenant improvements owed have been fully reserved by the lender. See “Escrows and Reserves” below. |
| (5) | The North Bay Portfolio Properties as of December 31, 2016 were 87.8% leased and 86.1% physically occupied. |
| (6) | The North Bay Portfolio Properties as of December 31, 2015 were 90.8% leased and 85.5% physically occupied. |
| (7) | $86,500,000 represents the aggregate appraised value as of January 30, 2018 and January 31, 2018 for the North Bay Portfolio Properties. |
The Mortgage Loan. The seventh largest mortgage loan (the “North Bay Portfolio Mortgage Loan”) is part of a whole loan (the “North Bay Portfolio Whole Loan”) evidenced by twopari passu promissory notes in the aggregate original principal amount of $54,000,000, which are secured by first priority fee mortgages on a portfolio of three industrial and office properties totaling 512,165 SF and located in Petaluma, California (the “North Bay Portfolio Properties”). The controlling Promissory Note A-1 in the original principal amount of $35,000,000 represents the North Bay Portfolio Mortgage Loan and will be included in the BANK 2018-BNK11 securitization trust. The non-controlling Promissory Note A-2 in the original principal amount of $19,000,000 (the “North Bay Portfolio Serviced Pari Passu Companion Loan”) is currently being held by BANA and is expected to be contributed to one or more future securitization trusts. The North Bay Portfolio Whole Loan will be serviced pursuant to the pooling and servicing agreement for the BANK 2018-BNK11 securitization trust. See “Description of the Mortgage Pool—The Whole Loans—The Serviced Pari Passu Whole Loans” and“Pooling and Servicing Agreement” in the Preliminary Prospectus.
Proceeds from the North Bay Portfolio Whole Loan were used to refinance the previous loan secured by the North Bay Portfolio Properties, fund upfront reserves and pay closing costs.
This is not a research report and was not prepared by any Underwriter’s research department. Please see additional important information and qualifications at the end of this Term Sheet. |
| T-88 |
| BANK 2018-BNK11 | North Bay Portfolio |
The Borrower and the Sponsor. The borrower is SSCOP DE LLC, a Delaware limited liability company, structured to be bankruptcy-remote with at least one independent director (the “North Bay Portfolio Borrower”). The borrower-sponsor is Basin Street Properties. Basin Street Properties is a private real estate owner and operator focused on acquiring, developing and managing office, retail, multi-family, hospitality and mixed-use properties in California and northern Nevada. Basin Street Properties’ current portfolio includes 22 office properties and 3 retail centers in the California North Bay area, 13 of which (approximately 1.3 million SF) are located in Petaluma, California. Basin Street Properties’ other properties are located primarily in Sacramento, California and Reno, Nevada.
Matthew T. White is the Chairman and CEO of Basin Street Properties. William C. White is a co-founder of Basin Street Properties and the head of the company’s board of directors. Matthew T. White and William C. White are the nonrecourse carve-out guarantors for the North Bay Portfolio Whole Loan.
The Properties. The North Bay Portfolio Properties are comprised of two industrial/flex properties and one office property totaling ten buildings and 512,165 SF of which approximately 85.8% is currently used as office and approximately 14.2% is currently used as warehouse space. The Lakeville Business Park and South Petaluma Business Center properties are adjacent to each other, with the Petaluma Business Center property located approximately 4.3 miles north. The North Bay Portfolio Properties were built between 1990 and 2007 and as of February 15, 2018 were 92.2% leased by 25 tenants and 81.5% physically occupied. The North Bay Portfolio Properties serve as the corporate headquarters for Calix Networks, Inc. (16.0% of NRA, 13.2% of underwritten gross potential rent), Panamax, LLC (7.9% of NRA, 12.0% of underwritten gross potential rent), CamelBak Products, Inc. (7.7% of NRA, 11.8% of underwritten gross potential rent), AVRS, Inc. (4.9% of NRA, 4.2% of underwritten gross potential rent), Hydropoint Data Systems (5.2% of NRA, 4.1% of underwritten gross potential rent) and Frontrow Calypso LLC (4.4% of NRA, 3.0% of underwritten gross potential rent). Since acquiring the North Bay Portfolio Properties in February, 2015, the sponsor has signed 111,451 SF of new leases and 120,617 SF of renewal leases at the North Bay Portfolio Properties.
The following table presents detailed information with respect to each of the North Bay Portfolio Properties.
| North Bay Portfolio Properties Summary | |||||||
| Property Name, Location | Property Type | Year Built/ Renovated | SF | 2/15/2018 Occupancy(1) | Appraised Value | % of Appraised Value | UW NCF |
Petaluma Business Center 1031, 1035, 1039, 1125-1137 North McDowell Boulevard Petaluma, CA | Industrial/Flex | 1990,2000 / 2004 | 213,210 | 90.3% | $34,800,000 | 40.2% | $1,738,093 |
South Petaluma Business Center 1800 and 2000 South McDowell Boulevard | Office | 2007 / N/A | 149,634 | 100.0% | $29,400,000 | 34.0% | $2,461,690 |
Lakeville Business Center 1600-1622, 1670, 1690-1740, & 1758-1774 Corporate Circle | Industrial/Flex | 1997,2001 / N/A | 149,321 | 86.9% | $22,300,000 | 25.8% | $1,261,692 |
| Total/Wtd. Avg. | 512,165 | 92.2% | $86,500,000 | 100.0% | $5,461,476 | ||
| (1) | The North Bay Portfolio Properties as of February 15, 2018 were 92.2% leased by 25 tenants and 81.5% physically occupied. Occupancy includes four tenants with signed leases who are not yet in occupancy: TraumaFX (3.9% of NRA), Kaiser (3.7% of NRA), Symbio, LLC (2.2% of NRA) and Courseco (0.9% of NRA). |
Petaluma Business Center (213,210 SF, 41.6% of NRA, 31.8% of underwritten gross potential rent). The Petaluma Business Center property was built on a 14.07-acre site in 1990 and 2000, and renovated in 2004, and consists of four single-story buildings totaling 213,210 SF of rentable area, of which approximately 84.1% is used for office and approximately 15.9% is used for warehouse space. Each of the buildings includes 20 foot clear heights, at least three roll-up loading doors, and three of the buildings feature at least one loading dock. The Petaluma Business Center property includes 592 surface parking spaces (2.78 spaces per 1,000 SF). The Petaluma Business Center property was 90.3% leased by 7 tenants and 73.6% occupied as of February 15, 2018. Major tenants include Calix Networks, Inc. (NYSE: CALX) and AVRS, Inc. both headquartered at the Petaluma Business Center property, and USI Insurance Services. Three tenants have recently signed leases and are expected to take occupancy between April and May 2018: TraumaFX (19,883 SF expected to be occupied by May 2018) which is entitled to abated rent through June 30, 2018 and $157,315 of tenant improvements, Symbio, LLC (11,053 SF of expansion space expected to be occupied by April 2018) which is entitled to $428,145 of tenant improvements, and Courseco (4,800 SF of relocated space expected to be occupied by May 2018) which is entitled to abated rent through May 15, 2018 and $153,600 of tenant improvements. Any outstanding abated rent and tenant improvements owed have been fully reserved by the lender. See “Escrows and Reserves” below.
South Petaluma Business Center (149,634 SF, 29.2% of NRA, 46.9% of underwritten gross potential rent). The South Petaluma Business Center property was built on an 8.39-acre site in 2007 and consists of two double-story buildings totaling 149,634 SF of office space. Each of the buildings includes 10-12 foot clear heights, and one roll-up loading door. The South Petaluma Business Center property includes 442 surface parking spaces (2.95 spaces per 1,000 SF). The South Petaluma Business Center property was 100.0% leased by 5 tenants and 87.3% occupied as of February 15, 2018. Major tenants include Ygrene (under a 39,528 SF sublease from The GAP Inc. and a 4,075 SF direct lease), and Panamax, LLC and CamelBak Products, Inc. which are both headquartered at the North Bay Portfolio Properties. Additionally, Kaiser, the largest private employer in Sonoma County, has a signed lease for 19,046 SF which it is expected to take occupancy of in August 2018 upon completion of its space build out. Kaiser has begun rental payments and is entitled to $1,555,731 of tenant improvements and leasing commissions, which amount has been fully reserved by the lender. See “Escrows and Reserves” below.
Lakeville Business Center (149,321 SF, 29.2% of NRA, 21.3% of underwritten gross potential rent). The Lakeville Business Center property was built on a 10.26-acre site in 1997 and 2001 and consists of three single-story flex buildings and one double-story office building totaling 149,321 SF of rentable area, of which approximately 74.2% is office and approximately 25.8% is warehouse space. Three of the buildings include 20 foot clear heights, at least one roll-up loading door and at least one loading dock. The fourth building features 10-12 foot clear heights and one roll-up loading door. The Lakeville Business Center property includes 581 surface parking spaces (3.89 spaces per 1,000 SF). The Lakeville Business Center property was 86.9% leased and occupied by 15 tenants as of February 15, 2018. Major tenants include Hydropoint Data Systems and Frontrow Calypso LLC, both headquartered at the Lakeville Business Center property, and Collidion Inc. Hydropoint Data Systems (26,522 SF) is entitled to $144,575 of tenant improvements, which amount has been fully reserved by the lender. See “Escrows and Reserves” below.
The following table presents certain information relating to the major tenants at the North Bay Portfolio Properties:
This is not a research report and was not prepared by any Underwriter’s research department. Please see additional important information and qualifications at the end of this Term Sheet. |
| T-89 |
| BANK 2018-BNK11 | North Bay Portfolio |
| Tenant Summary(1) | ||||||||
| Tenant Name | Property Location | Tenant SF | Approx. % of Total SF | Annual UW Rent | % of Total Annual UW Rent | Annual UW Rent PSF(2) | Lease Expiration | Renewal Options |
| Calix Networks, Inc.(3) | Petaluma Business Center | 82,082 | 16.0% | $1,058,510 | 13.2% | $12.90 | 2/28/2019 | 1 x 5 Yrs |
| Ygrene Energy Fund CA LLC(4) | South Petaluma Business Center | 43,603 | 8.5% | $1,043,024 | 13.0% | $23.92 | 10/31/2021 | 2 x 5 Yrs |
| Panamax, LLC(5) | Lakeville Business Center / South Petaluma Business Center | 40,444 | 7.9% | $961,903 | 12.0% | $23.78 | 3/31/2020 | 1 x 5 Yrs |
| CamelBak Products, Inc.(6) | Lakeville Business Center / South Petaluma Business Center | 39,395 | 7.7% | $948,027 | 11.8% | $24.06 | 7/31/2024 | 2 x 5 Yrs |
| Hydropoint Data Systems(7) | Lakeville Business Center | 26,522 | 5.2% | $325,959 | 4.1% | $12.29 | 3/31/2023 | N/A |
| AVRS, Inc. | Petaluma Business Center | 24,865 | 4.9% | $333,360 | 4.2% | $13.41 | 10/31/2019 | 1 x 4 Yrs |
| USI Insurance Services | Petaluma Business Center | 24,424 | 4.8% | $357,567 | 4.5% | $14.64 | 3/31/2020 | 2 x 5 Yrs |
| Symbio, LLC(8) | Petaluma Business Center | 22,698 | 4.4% | $318,515 | 4.0% | $14.03 | 9/30/2027 | N/A |
| Frontrow Calypso LLC | Lakeville Business Center | 22,599 | 4.4% | $241,666 | 3.0% | $10.69 | 10/31/2018 | 1 x 5 Yrs |
| TraumaFX(9) | Petaluma Business Center | 19,883 | 3.9% | $262,456 | 3.3% | $13.20 | 6/30/2023 | N/A |
| Subtotal/Wtd. Avg. | 346,515 | 67.7% | $5,850,988 | 73.1% | $16.89 | |||
| Other Tenants | 125,496 | 24.5% | $2,152,770 | 26.9% | $17.15 | |||
| Total Occupied Space | 472,011 | 92.2% | $8,003,758 | 100.0% | $16.96 | |||
| Vacant Space(3) | 40,154 | 7.8% | $0 | 0.0% | $0.00 | |||
| Total/Wtd. Avg. | 512,165 | 100.0% | $8,003,758 | 100.0% | $16.96 | |||
| (1) | Information is based on the underwritten rent roll. |
| (2) | Wtd. Avg. Annual UW Rent PSF excludes vacant space. All leases for tenants individually shown are triple-net except for Ygrene Energy Fund CA LLC, Panamax, LLC, CamelBak Products, Inc., and AVRS, Inc. which are gross or full service gross leases. |
| (3) | Calix Networks, Inc. had one, 5-year renewal option that expired on February 28, 2018. Calix Networks, Inc. is currently in negotiations with the North Bay Portfolio Borrower to renew and occupy approximately 59,632 SF of its space and sublet the remaining approximate 22,450 SF. The 22,450 SF has been treated as vacant space in the lender’s underwriting. |
| (4) | Ygrene Energy Fund CA LLC leases 39,528 SF under a sublease from The GAP Inc. and 4,075 SF under a co-terminous direct lease. Ygrene Energy Fund CA LLC pays current annual rent under its sublease to The GAP Inc. of $22.20 per SF and annual rent under its direct lease of $27.81 per SF. The Annual UW Rent represents the actual rent as of March 2019 paid by The GAP Inc. and the rent paid by Ygrene Energy Fund CA LLC pursuant to their respective leases. |
| (5) | Panamax, LLC leases 36,701 SF at South Petaluma Business Center and 3,743 SF at Lakeville Business Center under co-terminous leases. |
| (6) | CamelBak Products, Inc. leases 32,730 SF at South Petaluma Business Center and 6,665 SF at Lakeville Business Center under co-terminous leases. |
| (7) | Hydropoint Data Systems is entitled to $144,575 of tenant improvements, which amount has been fully reserved by the lender. |
| (8) | Symbio, LLC currently occupies 11,645 SF and has a signed lease for an additional 11,053 SF which it is expected to occupy in April 2018. In connection with its expansion space, Symbio, LLC is entitled to $428,145 of tenant improvements, which amount has been fully reserved by the lender. |
| (9) | TraumaFX has a signed lease and is expected take occupancy by May 2018. The lease provides for abated rent through June 30, 2018 and $157,315 of tenant improvements, which amounts have been fully reserved by the lender. |
The following table presents certain information relating to the lease rollover schedule at the North Bay Portfolio Properties:
| Lease Rollover Schedule(1)(2) | ||||||||
| Year | # of Leases Rolling | SF Rolling | Approx. % of Total SF Rolling | Approx. Cumulative % of SF Rolling | UW GPR PSF Rolling(3) | Total UW GPR Rolling | Approx. % of Total GPR Rolling | Approx. Cumulative % of Total GPR Rolling |
| 2018 | 1 | 22,599 | 4.4% | 4.4% | $10.69 | $241,666 | 3.0% | 3.0% |
| 2019 | 4 | 120,510 | 23.5% | 27.9% | $12.92 | $1,556,499 | 19.4% | 22.5% |
| 2020 | 4 | 73,065 | 14.3% | 42.2% | $20.67 | $1,510,299 | 18.9% | 41.3% |
| 2021 | 3 | 52,766 | 10.3% | 52.5% | $21.98 | $1,159,677 | 14.5% | 55.8% |
| 2022 | 2 | 17,788 | 3.5% | 56.0% | $15.50 | $275,794 | 3.4% | 59.3% |
| 2023 | 5 | 72,248 | 14.1% | 70.1% | $12.29 | $888,176 | 11.1% | 70.4% |
| 2024 | 2 | 45,614 | 8.9% | 79.0% | $22.47 | $1,024,894 | 12.8% | 83.2% |
| 2025 | 2 | 8,123 | 1.6% | 80.6% | $13.82 | $112,246 | 1.4% | 84.6% |
| 2026 | 1 | 17,554 | 3.4% | 84.0% | $24.19 | $424,605 | 5.3% | 89.9% |
| 2027 | 1 | 22,698 | 4.4% | 88.4% | $14.03 | $318,515 | 4.0% | 93.9% |
| 2028 | 1 | 19,046 | 3.7% | 92.2% | $25.80 | $491,387 | 6.1% | 100.0% |
| 2029 & Beyond | 0 | 0 | 0.0% | 92.2% | $0.00 | $0 | 0.0% | 100.0% |
| Vacant | 0 | 40,154 | 7.8% | 100.0% | $0.00 | $0 | 0.0% | 100.0% |
| Total/Wtd. Avg. | 26 | 512,165 | 100.0% | $16.96 | $8,003,758 | 100.0% | ||
| (1) | Information is based on the underwritten rent roll. Certain tenants may have multiple leases which are consolidated as presented. |
| (2) | Certain tenants may have lease termination options that are exercisable prior to the originally stated expiration date of the subject lease and that are not considered in the lease rollover schedule. |
| (3) | Total/Wtd. Avg. UW GPR PSF Rolling excludes vacant space. |
The Market. The North Bay Portfolio Properties are located in Petaluma, Sonoma County, California. The City of Petaluma is located along a 5.5 mile stretch of U.S. Highway 101 (access approximately 0.5 miles west of the North Bay Portfolio Properties) and is the first city north of Marin County. In addition to the access provided by Highway 101, Petaluma is served by the recently completed first phase of the Sonoma-Marin Area Rail Transit (SMART) passenger train service which connects San Rafael, passing through Petaluma to Santa Rosa approximately 40 miles north.
This is not a research report and was not prepared by any Underwriter’s research department. Please see additional important information and qualifications at the end of this Term Sheet. |
| T-90 |
| BANK 2018-BNK11 | North Bay Portfolio |
According to a third party market data provider, the third quarter 2017 vacancy rates for the Petaluma office and industrial markets were 13.3% and 5.3%, respectively. Petaluma is a boutique office market that is home to companies including CamelBak, Lagunitas Brewery, Clover-Sonoma, Kala Music Company, and Mesa/Boogie. Petaluma’s industrial sector has historically been the most desired type of commercial space which has more recently been bolstered by the growth in the craft brewing and cannabis industries around Petaluma. The area benefits from its proximity to the Bay Area while offering slightly lower rents. Additionally, as the physical gateway to the Bay Area, Wine Country, and the coastal regions, Petaluma is well located for shipping and distribution uses.
According to the appraisal, the estimated 2017 population within a one-, three- and five-mile radius of the Petaluma Business Center property was 7,422, 48,783 and 88,378, respectively, and the 2017 average household income within the same radii was $107,867, $105,468 and $105,988, respectively. The estimated 2017 population within a one-, three- and five-mile radius of the Lakeville Business Center property and the South Petaluma Business Center property was 9,304, 56,874 and 67,261, respectively, and the 2017 average household income within the same radii was $104,792, $106,195 and $108,712, respectively.
The following table presents recent leasing data at comparable office properties with respect to the North Bay Portfolio Properties:
| Comparable Lease Summary | |||||||
Property Name Address | Property Size / Year Built | Tenant | Lease Area (SF) | Lease Date | NNN Base Rent PSF | Lease Term (Yrs.) | Rent Steps / TI / Free Rent |
Redwood Business Center 1383 N. McDowell Blvd. | 58,299 / 2007 | Amerifirst Financial | 2,819 | Oct 2017 | $15.20 | 3.3
| 3.0% / $0 / 3 mos |
Southpoint Business Park 740 Southpoint Boulevard | 42,926 / 1990 | Rustic Bakery | 10,750 | Jul 2017 | $12.00 | 1.0 | 0% / $0 / 0 mos |
Redwood Business Park 1318 Redwood Way | 35,076 / 1988 | Vista International | 3,495 | Jun 2017 | $11.60 | 5.0 | 3.0% / $0 / 0 mos |
Cader Corporate Center 1490 Cader Lane | 94,000 / 2016 | Tomales Bay Foods | 30,000 | Jul 2016 | $8.76 | 10.0 | 3.0% / $10 / 4 mos |
Source:Appraisal.
Operating History and Underwritten Net Cash Flow.The following table presents certain information relating to the historical operating performance and Underwritten Net Cash Flow at the North Bay Portfolio Properties:
| Cash Flow Analysis | |||||
| 2015 | 2016 | 2017 | UW | UW PSF | |
| Gross Potential Rent(1) | $5,319,595 | $6,669,313 | $6,959,409 | $8,557,147 | $16.71 |
| Reimbursements | $903,822 | $1,072,344 | $1,126,677 | $1,351,581 | $2.64 |
| Other Income(2) | $2,447 | $50,523 | $254,669 | $0 | $0.00 |
| Concessions | $0 | ($24,760) | ($10,000) | $0 | $0.00 |
| Vacancy | $0 | $0 | $0 | ($907,074) | ($1.77) |
| Effective Gross Income | $6,225,864 | $7,767,420 | $8,330,755 | $9,001,654 | $17.58 |
| Total Operating Expenses | $2,233,675 | $2,840,862 | $2,945,690 | $2,935,923 | $5.73 |
| Net Operating Income(3) | $3,992,189 | $4,926,558 | $5,385,065 | $6,065,732 | $11.84 |
| TI/LC | $0 | $0 | $0 | $501,823 | $0.98 |
| Capital Expenditures | $0 | $0 | $0 | $102,433 | $0.20 |
| Net Cash Flow | $3,992,189 | $4,926,558 | $5,385,065 | $5,461,476 | $10.66 |
| Occupancy %(4) | 90.8% | 87.8% | 88.7% | 92.2% | |
| NOI DSCR (IO)(5) | 1.62x | 2.00x | 2.18x | 2.46x | |
| NOI DSCR (P&I)(5) | 1.22x | 1.50x | 1.64x | 1.85x | |
| NCF DSCR (IO)(5) | 1.62x | 2.00x | 2.18x | 2.21x | |
| NCF DSCR (P&I)(5) | 1.22x | 1.50x | 1.64x | 1.66x | |
| NOI Debt Yield(5) | 7.4% | 9.1% | 10.0% | 11.2% | |
| NCF Debt Yield(5) | 7.4% | 9.1% | 10.0% | 10.1% | |
| (1) | UW Gross Potential Rent is based on the February 15, 2018 underwritten rent roll with rent steps taken through March 1, 2019 of $254,028. UW Gross Potential Rent also includes grossed up vacant space of $553,389. |
| (2) | Other Income includes one-time lease termination fees. |
| (3) | The increase in Net Operating Income is primarily a result of 227,116 SF of new or renewed leasing activity from 2016 to 2018. |
| (4) | Historical Occupancy as shown represents the leased SF with physical occupancy as of December 31, 2015, December 31, 2016 and December 31, 2017 being 85.5%, 86.1% and 82.7%, respectively. UW Occupancy represents the leased SF as of February 15, 2018, with physical occupancy being 81.5%. |
| (5) | Debt service coverage ratios and debt yields are based on the North Bay Portfolio Whole Loan. |
Escrows and Reserves. The North Bay Portfolio Borrower deposited at loan origination $61,195 to a tax reserve and is required to deposit monthly 1/12th of the estimated annual property taxes (initially $61,195) and 1/12th of the estimated annual insurance premiums (unless the North Bay Portfolio Properties are covered by an acceptable blanket policy). The North Bay Portfolio Borrower deposited at loan origination $28,000 for immediate repairs (125% of the estimated cost of completion) and is required to deposit monthly $10,670 (during the first five years of the loan term) and $8,536 (thereafter) for any replacements. Additionally, the North Bay Portfolio Borrower deposited at loan origination $500,000 for general tenant improvements and leasing commissions and is required to deposit monthly $42,680 ($1.00 per SF annually), capped at $1,536,495. The North Bay Portfolio Borrower
This is not a research report and was not prepared by any Underwriter’s research department. Please see additional important information and qualifications at the end of this Term Sheet. |
| T-91 |
| BANK 2018-BNK11 | North Bay Portfolio |
deposited at loan origination $2,439,366 for tenant improvements relating to the tenants Hydropoint Data Systems, TraumaFX, Courseco, Kaiser and Symbio, and $113,802 for free/gap rent related to the tenants TraumaFX and Courseco.
Lockbox and Cash Management. The North Bay Portfolio Whole Loan documents require a springing lockbox with springing cash management upon the occurrence of a Cash Sweep Period (as defined below). During the continuance of a Cash Sweep Period, all funds in the lockbox account are required to be swept each business day to a lender-controlled cash management account and disbursed in accordance with the North Bay Portfolio Whole Loan documents. All excess cash flow will be required to be held as additional security for the North Bay Portfolio Whole Loan until discontinuance of the Cash Sweep Period. A Cash Sweep Period may be cured twice, and thereafter if a Cash Sweep Period occurs, cash management will remain in place and excess cash flow will continue to be collected and held by the lender and not disbursed to the North Bay Portfolio Borrower for the remaining term of the North Bay Portfolio Whole Loan.
A “Cash Sweep Period” means the period commencing when the amortizing debt service coverage ratio for the immediately preceding six month period is less than 1.15x, ending when the amortizing debt service coverage ratio for the immediately preceding six month period equals or exceeds 1.15x for two consecutive calendar quarters.
Additional Secured Indebtedness (not including trade debts). The North Bay Portfolio Properties also secure the North Bay Portfolio Serviced Pari Passu Companion Loan, which has a Cut-off Date principal balance of $19,000,000, and accrues interest at the same rate as the North Bay Portfolio Mortgage Loan. The North Bay Portfolio Mortgage Loan is entitled to payments of interest and principal on apro rata andpari passu basis with the North Bay Portfolio Serviced Pari Passu Companion Loan. The holders of the North Bay Portfolio Mortgage Loan and the North Bay Portfolio Serviced Pari Passu Companion Loan have entered into a co-lender agreement which sets forth the allocation of collections on the North Bay Portfolio Whole Loan. See “Description of the Mortgage Pool—The Whole Loans—The Serviced Pari Passu Whole Loans” in the Preliminary Prospectus.
Mezzanine Loan and Preferred Equity. Not permitted.
Release of Property. Not permitted.
Terrorism Insurance.The North Bay Portfolio Borrower is required to obtain and maintain property insurance that covers perils of terrorism and acts of terrorism in an amount equal to the full replacement cost of the North Bay Portfolio Properties and business interruption insurance for 18 months with a 6 month extended period of indemnity. See “Risk Factors—Risks Relating to the Mortgage Loans—Terrorism Insurance May Not Be Available for All Mortgaged Properties” in the Preliminary Prospectus.
This is not a research report and was not prepared by any Underwriter’s research department. Please see additional important information and qualifications at the end of this Term Sheet. |
| T-92 |
(THIS PAGE INTENTIONALLY LEFT BLANK)
| T-93 |
| BANK 2018-BNK11 | Prescott Valley Crossroads |
Mortgage Loan No. 8 – Prescott Valley Crossroads
This is not a research report and was not prepared by any Underwriter’s research department. Please see additional important information and qualifications at the end of this Term Sheet. |
| T-94 |
| BANK 2018-BNK11 | Prescott Valley Crossroads |
Mortgage Loan No. 8 – Prescott Valley Crossroads
This is not a research report and was not prepared by any Underwriter’s research department. Please see additional important information and qualifications at the end of this Term Sheet. |
| T-95 |
| BANK 2018-BNK11 | Prescott Valley Crossroads |
Mortgage Loan No. 8 – Prescott Valley Crossroads

This is not a research report and was not prepared by any Underwriter’s research department. Please see additional important information and qualifications at the end of this Term Sheet. |
| T-96 |
| BANK 2018-BNK11 | Prescott Valley Crossroads |
| Mortgage Loan No. 8 – Prescott Valley Crossroads |
| Mortgage Loan Information | Property Information | ||||||
| Mortgage Loan Seller: | BANA | Single Asset/Portfolio: | Single Asset | ||||
| Original Balance: | $32,010,000 | Location: | Prescott Valley, AZ 86314 | ||||
| Cut-off Date Balance: | $32,010,000 | General Property Type: | Retail | ||||
| % of Initial Pool Balance: | 4.7% | Detailed Property Type: | Anchored | ||||
| Loan Purpose: | Refinance | Title Vesting: | Fee | ||||
| Sponsor: | Kitchell Corporation | Year Built/Renovated: | 2009-2016/N/A | ||||
| Mortgage Rate: | 4.8500% | Size: | 251,163 SF | ||||
| Note Date: | 3/15/2018 | Cut-off Date Balance PSF: | $127 | ||||
| First Payment Date: | 5/1/2018 | Maturity Date Balance PSF: | $113 | ||||
| Maturity Date: | 4/1/2028 | Property Manager: | Kitchell Property Management (borrower-related) | ||||
| Original Term to Maturity | 120 months | ||||||
| Original Amortization Term: | 360 months | Underwriting and Financial Information | |||||
| IO Period: | 36 months | UW NOI: | $3,227,077 | ||||
| Seasoning: | 0 months | UW NOI Debt Yield: | 10.1% | ||||
| Prepayment Provisions: | LO (24); YM1 (92); O (4) | UW NOI Debt Yield at Maturity: | 11.4% | ||||
| Lockbox/Cash Mgmt Status: | Springing/Springing | UW NCF DSCR: | 1.92x (IO) 1.49x( P&I) | ||||
| Additional Debt Type: | N/A | Most Recent NOI: | $3,035,676 (12/31/2017) | ||||
| Additional Debt Balance: | N/A | 2nd Most Recent NOI: | $2,668,233 (12/31/2016) | ||||
| Future Debt Permitted (Type): | No (N/A) | 3rd Most Recent NOI: | $2,315,715 (12/31/2015) | ||||
| Reserves(1) | Most Recent Occupancy(2): | 94.3% (2/1/2018) | |||||
| Type | Initial | Monthly | Cap | 2nd Most Recent Occupancy: | 93.8% (12/31/2016) | ||
| RE Tax: | $30,512 | $30,512 | N/A | 3rd Most Recent Occupancy(3): | 93.0% (12/31/2015) | ||
| Insurance: | $0 | Springing | N/A | Appraised Value (as of): | $49,000,000 (2/6/2018) | ||
| Recurring Replacements: | $0 | $4,186 | $200,928 | Cut-off Date LTV Ratio: | 65.3% | ||
| TI/LC: | $93,783 | $20,930 | $1,500,000 | Maturity Date LTV Ratio: | 57.7% | ||
| Borrower Obligations: | $138,510 | $0 | N/A | ||||
| Free Rent: | $36,671 | $0 | N/A | ||||
| Sources and Uses | |||||||
| Sources | Proceeds | % of Total | Uses | Proceeds | % of Total | ||
| Loan Amount: | $32,010,000 | 99.8% | Loan Payoff: | $31,113,123 | 97.0% | ||
| Borrower Equity: | $65,000 | 0.2% | Closing Costs: | $662,401 | 2.1% | ||
| Reserves: | $299,476 | 0.9% | |||||
| Total Sources: | $32,075,000 | 100.0% | Total Uses: | $32,075,000 | 100.0% | ||
| (1) | See “Escrows and Reserves” below for further discussion of reserve requirements. |
| (2) | Most Recent Occupancy includes two new tenants, Lindo Mexico and uBreakiFix (together 1.9% of NRA), that have executed leases and taken possession of their space but are not yet in occupancy. All gap rent between loan origination and rent commencement has been fully reserved by the lender. |
| (3) | The Prescott Valley Crossroads Property (as defined below) was built in phases between 2009 and 2016. 3rd Most Recent Occupancy is based on available built rentable area as of December 31, 2015. |
The Mortgage Loan.The eighth largest mortgage loan (the “Prescott Valley Crossroads Mortgage Loan”) is evidenced by a promissory note in the original principal amount of $32,010,000 and secured by a first priority fee mortgage encumbering an anchored retail power center in Prescott Valley, Arizona (the “Prescott Valley Crossroads Property”). Proceeds of the Prescott Valley Crossroads Mortgage Loan were used to refinance the previous loan secured by the Prescott Valley Crossroads Property, pay closing costs and fund upfront reserves.
The Borrower and the Sponsor. The borrower is SD Ranch, LLC (the “Prescott Valley Crossroads Borrower”), a single-purpose Arizona limited liability company with at least one independent director and a springing member under certain circumstances. Equity ownership in the Prescott Valley Crossroads Borrower is held by YK Commercial Realty, LLC, which is owned equally (50%/50%) by W Prescott Valley, L.L.C. and Prescott Valley Crossroads, LLC. W Prescott Valley, L.L.C. is indirectly held by Lisa Worthington US Trust (85%) and Worthington Family Trust (15%). Prescott Valley Crossroads, LLC is majority held (75%) by Kitchell Development Company, which is 100% owned by Kitchell Corporation.
Kitchell Development Company is the non-recourse carveout guarantor. If a buy/sell event occurs such that W Prescott Valley, L.L.C. becomes the sole indirect owner of the Prescott Valley Crossroads Borrower, then Lisa C. Worthington has been approved as a replacement guarantor provided that at the time of replacement she continues to satisfy a minimum net worth of $20,000,000 and liquidity of $2,000,000, and there has been no material adverse change since the origination of the Prescott Valley Crossroads Mortgage Loan.
Kitchell Corporation is an employee-owned holding company of several real estate companies including Kitchell Contractors, Inc., Kitchell Capital Expenditure Managers, Inc., Kitchell Development Company, hardison/downey Construction, Inc., Kitchell Facilities Management, Inc., American Refrigerations Supplies, and FDI Planning Consultants, Inc. The portfolio of companies offer real estate services including contracting and construction management, real estate development, engineering and architecture, and property management.
This is not a research report and was not prepared by any Underwriter’s research department. Please see additional important information and qualifications at the end of this Term Sheet. |
| T-97 |
| BANK 2018-BNK11 | Prescott Valley Crossroads |
The Property.The Prescott Valley Crossroads Property is a 251,163 SF anchored retail power center located in Prescott Valley, Arizona. The Prescott Valley Crossroads Property is comprised of 14 single story buildings and includes a total of 1,682 parking spaces (6.7 spaces per 1,000 SF of NRA). As of February 1, 2018, the Prescott Valley Crossroads Property was 94.3% leased by 22 tenants. The anchor tenants are Hobby Lobby, Dick’s Sporting Goods, Sprouts Farmers Market, Ross and TJ Maxx, with no other tenant accounting for more than 4.1% of NRA or 5.6% of underwritten rent. Other notable tenants include Cracker Barrel, ULTA Salon, Dollar Tree, rue21, Maurices and Chase Bank. The Prescott Valley Crossroads Property is shadow anchored by a 137,627 SF corporate-owned Home Depot and five pads including a Carl’s Jr., La-Z-Boy, Native Grill, Bridgestone and Chick Fil A. The Prescott Valley Crossroads Property was previously also shadow anchored by a Walmart corporate-owned Sam’s Club, which closed in January 2018 as a part of a 63-store nationwide contraction. Walmart maintains a presence in the immediate area with two Walmart Supercenters located off State Route 69 within four miles in both directions of the Prescott Valley Crossroads Property.
Historical occupancy at the Prescott Valley Crossroads Property was 94.3%, 95.3%, 93.0%, 93.8% and 92.4% as of the end of the calendar years 2013, 2014, 2015, 2016 and 2017 respectively, based on the available built rentable area. The Prescott Valley Crossroads Property was built in phases between 2009 and 2016. Recent leasing includes ten new or renewed leases (23.6% of NRA and 28.6% of underwritten rent) since 2016.
The Prescott Valley Crossroads Property is located on the west side of the city of Prescott Valley, with 1,223 feet of frontage on the north side of State Route 69 and 2,882 feet of frontage on the south side of State Route 69, which provides visibility and access for both Prescott Valley and the neighboring town of Prescott. According to a state transportation agency, the traffic count at the Prescott Valley Crossroads Property’s location on State Route 69 averages approximately 37,732 vehicles per day.
Major Tenants.
Hobby Lobby (54,295 SF, 21.6% of NRA, 14.2% ofunderwritten rent). Hobby Lobby is an original anchor tenant to the Prescott Valley Crossroads Property, opening in the first phase of the development. Hobby Lobby opened for business at the Prescott Valley Crossroads Property in 2009 and operates under a lease expiring on August 31, 2024 which includes three 5-year renewal options. Hobby Lobby reported annual sales at the Prescott Valley Crossroads Property of approximately $3.6 million ($67 PSF), $3.8 million ($70 PSF), $4.2 million ($77 PSF), $4.5 million ($84 PSF), $4.7 million ($86 PSF), $4.9 million ($90 PSF) and $4.9 million ($91 PSF) as of the end of the calendar years 2010, 2011, 2012, 2013, 2014, 2015 and 2016, respectively. Hobby Lobby is a large privately owned arts-and-crafts retailer, with over 800 stores across 47 states. The nearest Hobby Lobby is located approximately 85 miles from the Prescott Valley Crossroads Property in Phoenix.
Dick’s Sporting Goods (35,000 SF, 13.9% of NRA, 12.6% of underwritten rent). Dick’s Sporting Goods (NYSE: DKS) is an original anchor tenant to the Prescott Valley Crossroads Property, opening in 2013. Dick’s Sporting Goods’ lease expires on January 31, 2024 and includes four 5-year renewal options. Dick’s Sporting Goods is not required to report sales. Dick’s Sporting Goods is a sporting goods retailer which as of February 2018 was operating 716 stores in 47 states plus 94 Golf Galaxy and 35 Field & Stream specialty stores. Dick’s Sporting Goods reported 2017 revenue of $7.92 billion, increased from $7.27 billion the prior year. The nearest Dick’s Sporting Goods is located approximately 73 miles from the Prescott Valley Crossroads Property in Phoenix.
Sprouts Farmers Market (27,994 SF, 11.1% of NRA, 12.8% of underwritten rent).Sprouts Farmers Market (NASDAQ: SFM) is an original anchor tenant to the Prescott Valley Crossroads Property, opening in 2014. Sprouts Farmers Market’s lease expires on June 30, 2029 and includes three 5-year renewal options. Sprouts Farmers Market is not required to report sales. Sprouts Farmers Market is a healthy foods grocery store chain with more than 285 stores across 15 states (32 opened in 2017) and 4 distribution centers. Sprouts Farmers Market reported 2017 net sales of $4.7 billion, a 15% increase from 2016, and comparable store sales growth of 2.9%. The nearest Sprouts Farmers Market is located approximately 7 miles from the Prescott Valley Crossroads Property in Prescott.
The following table presents a summary regarding the major tenants at the Prescott Valley Crossroads Property (of which certain tenants may have co-tenancy provisions):
| Tenant Summary(1) | ||||||||||
| Tenant Name | Credit Rating (Fitch/Moody’s/S&P)(2) | Tenant SF | Approx. % of SF | Annual UW Rent | Annual UW Rent PSF(3) | % of Annual UW Rent | Occ. Cost %(4) | Lease Expiration | ||
Most Recent Sales PSF(4) | ||||||||||
| Major Tenants | ||||||||||
| Hobby Lobby | NR / NR/ NR | 54,295 | 21.6% | $466,937 | $8.60 | 14.2% | $91 | 9.5% | 8/31/2024 | |
| Dick’s Sporting Goods | NR / NR/ NR | 35,000 | 13.9% | $414,750 | $11.85 | 12.6% | N/A | N/A | 1/31/2024 | |
| Sprouts Farmers Market | NR / NR/ NR | 27,994 | 11.1% | $418,510 | $14.95 | 12.8% | N/A | N/A | 6/30/2029 | |
| Ross | NR / A3 / A- | 25,000 | 10.0% | $275,000 | $11.00 | 8.4% | N/A | N/A | 1/31/2027 | |
| TJ Maxx | NR / A2 / A+ | 23,024 | 9.2% | $241,752 | $10.50 | 7.4% | $230 | 4.6% | 9/30/2024 | |
| Subtotal/Wtd. Avg. | 165,313 | 65.8% | $1,816,949 | $10.99 | 55.4% | |||||
| Other Tenants | 71,646 | 28.5% | $1,462,026 | $20.41 | 44.6% | |||||
| Vacant Space | 14,204 | 5.7% | $0 | $0 | 0.0% | |||||
| Total/Wtd. Avg. | 251,163 | 100.0% | $3,278,975 | $13.84 | 100.0% | |||||
| (1) | Information is based on the underwritten rent roll as of February 1, 2018. |
| (2) | Certain ratings are those of the parent company whether or not the parent guarantees the lease. |
| (3) | Wtd. Avg. Annual UW Rent PSF excludes vacant space. |
| (4) | Most Recent Sales PSF and Occ. Cost % are shown for tenants that are required to report sales. Most Recent Sales PSF for Hobby Lobby are for the trailing twelve months ended December 2016. Most Recent Sales PSF for TJ Maxx are for the trailing twelve months ended January 2017. Occ. Cost % is based on the underwritten rent as of the February 1, 2018 rent roll divided by the most recently reported sales. |
This is not a research report and was not prepared by any Underwriter’s research department. Please see additional important information and qualifications at the end of this Term Sheet. |
| T-98 |
| BANK 2018-BNK11 | Prescott Valley Crossroads |
The following table presents certain information relating to the lease rollover at the Prescott Valley Crossroads Property:
| Lease Rollover Schedule(1)(2) | ||||||||
| Year | # of Leases Rolling | SF Rolling | Approx. % of Total SF Rolling | Approx. Cumulative % of SF Rolling | Total UW Rent Rolling | Annual UW Rent PSF Rolling(3) | Approx. % of Total Rent Rolling | Approx. Cumulative % of Total Rent Rolling |
| MTM | 0 | 0 | 0.0% | 0.0% | $0 | $0.00 | 0.0% | 0.0% |
| 2018 | 0 | 0 | 0.0% | 0.0% | $0 | $0.00 | 0.0% | 0.0% |
| 2019 | 0 | 0 | 0.0% | 0.0% | $0 | $0.00 | 0.0% | 0.0% |
| 2020 | 1 | 1,279 | 0.5% | 0.5% | $39,832 | $31.14 | 1.2% | 1.2% |
| 2021 | 1 | 3,000 | 1.2% | 1.7% | $64,500 | $21.50 | 2.0% | 3.2% |
| 2022 | 2 | 4,680 | 1.9% | 3.6% | $95,805 | $20.47 | 2.9% | 6.1% |
| 2023 | 4 | 24,145 | 9.6% | 13.2% | $354,651 | $14.69 | 10.8% | 16.9% |
| 2024 | 4 | 122,319 | 48.7% | 61.9% | $1,308,439 | $10.70 | 39.9% | 56.8% |
| 2025 | 3 | 9,918 | 3.9% | 65.8% | $285,876 | $28.82 | 8.7% | 65.5% |
| 2026 | 0 | 0 | 0.0% | 65.8% | $0 | $0.00 | 0.0% | 65.5% |
| 2027 | 3 | 36,587 | 14.6% | 80.4% | $469,236 | $12.83 | 14.3% | 79.9% |
| 2028 | 1 | 2,007 | 0.8% | 81.2% | $58,000 | $28.90 | 1.8% | 81.6% |
| 2029 & Beyond | 3 | 33,024 | 13.1% | 94.3% | $602,636 | $18.25 | 18.4% | 100.0% |
| Vacant | 0 | 14,204 | 5.7% | 100.0% | $0 | $0.00 | 0.0% | 100.0% |
| Total/Wtd. Avg. | 22 | 251,163 | 100.0% | $3,278,975 | $13.84 | 100.0% | ||
| (1) | Information is based on the underwritten rent roll as of February 1, 2018. |
| (2) | Certain tenants may have lease termination options that are exercisable prior to the stated expiration date of the subject lease or leases which are not considered in the lease rollover schedule. |
| (3) | Total/Wtd. Avg. Annual UW Rent PSF Rolling excludes vacant space. |
The Market. The Prescott Valley Crossroads Property is located in the City of Prescott Valley, Arizona in the Prescott core based statistical area (the “Prescott CBSA”). According to the appraisal, the Prescott CBSA is attracting new residents, has a growing gross metropolitan product and growing employment and income levels. The warm weather, below average living costs and abundance of 55+ communities make the metropolitan area home to the largest senior citizen population outside of Florida; the senior population has grown at more than 1.5 times the national pace since 2012. The October 2017 unemployment rate for the Prescott CBSA was 4.3%, with top employers including Yavapai Regional Medical Center, Veterans Affairs Medical Center and Freeport-McMoran Mine.
The City of Prescott Valley is located approximately 80 miles northwest of Phoenix and 9 miles east of the city of Prescott. Access to the city is provided by State Route 69, which connects to Interstate 17 (leading to Phoenix and Flagstaff) and Interstate 40. Prescott Valley is served by Ernest A. Love Field, the second-busiest airport in Arizona behind Sky Harbor Airport in Phoenix. Prescott Valley is home to the Yavapai Regional Medical Center’s East Campus, the largest private employer, as well as several colleges and universities including Yavapai College, Old Dominion University, Northern Arizona University/Yavapai, Embry-Riddle Aeronautical University and Prescott College. Prescott Valley features over 263 acres of developed parkland and is a destination for outdoor activities for use of its lakes, fishing, hiking and camping. Prescott Valley is located within 10 minutes of the Prescott National Forest.
Prescott Valley was incorporated in 1978 with a population of 1,520 and is the fastest growing municipality in Yavapai County. According to a town government division, from 2000 to 2016, Prescott Valley’s population grew 93% to 45,500 people and its retail sales have grown 268% to $439.6 million. For 2017, Prescott Valley had retail inventory of approximately 2.3 million SF with a vacancy rate of 9.3% and average NNN rents of $12.41 PSF. According to the appraisal, within a three-mile radius of the Prescott Valley Crossroads Property are 930 apartment units with a vacancy rate of 4.0%, approximately 384,315 SF of office space with a vacancy rate of 6.9% and approximately 256,068 SF of flex/industrial space with a vacancy rate of 0.9%. Daytime employment within a three-mile radius of the Prescott Valley Crossroads Property includes approximately 1,424 businesses and 10,350 employees.
According to the appraisal, the estimated 2017 population within a one-, three- and five-mile radius was 3,887, 23,465 and 48,328, respectively. The estimated 2017 average household income within a one-, three- and five-mile radius was $55,442, $57,549 and $58,412, respectively. Within a five-mile radius, the 2017 aggregate retail sales were $1,129,324 ($57,554 of retail sales per household).
According to the appraisal, there are no new retail properties under construction that would have a direct impact on the Prescott Valley Crossroads Property.
This is not a research report and was not prepared by any Underwriter’s research department. Please see additional important information and qualifications at the end of this Term Sheet. |
| T-99 |
| BANK 2018-BNK11 | Prescott Valley Crossroads |
The following table reflects the competitive retail properties with respect to the Prescott Valley Crossroads Property:
| Competitive Property Summary | ||||||
Property Name City. State | Center Type | Year Built/ Renovated | Size (SF) | Occupancy | Anchor Tenants | Distance (miles) |
Prescott Valley Crossroads Prescott Valley, AZ | Power Center | 2009-2016 / N/A | 251,163 | 94% | Hobby Lobby, Dick’s Sporting Goods, Sprout’s Farmers Market, Ross Dress for Less, TJ Maxx | N/A |
Frontier Village Prescott, AZ | Power Center | 1991 / N/A | 680,400 | 85% | Home Depot, Target, Ross Dress For Less, Office Max, At Home | 5.0 |
Prescott Gateway Mall Prescott, AZ | Regional Center | 2001 / 2004 | 549,939 | 87% | Dillard’s, JC Penney, Sears, Bed Bath & Beyond, Cost Plus World Market | 3.5 |
Village at the Boulders Prescott, AZ | Community Center | 1976 / 2005 | 330,243 | 98% | Walmart, Big Lots, Tuesday Morning, Jo-Ann | 9.0 |
Glassford Hill Marketplace Prescott Valley, AZ | Neighborhood Center | 2007 / N/A | 137,064 | 100% | Kohls | 2.7 |
Depot Marketplace Prescott, AZ | Neighborhood Center | 1966 / 1999 | 139,171 | 98% | Sprouts | 7.0 |
Source: Appraisal
The following table reflects comparable retail leases with respect to the Prescott Valley Crossroads Property:
| Comparable Lease Summary | |||||||
Property Name City. State | Year Built/ Renovated | Size (SF) | Tenant | Lease Area (SF) | Lease Date | Base Rent PSF NNN | Lease Term (Yrs.) |
| Anchor Tenants | |||||||
Prescott Valley Crossroads Prescott Valley, AZ | 2009-2016 / N/A | 251,163 | Ross Dress For Less | 25,000 | Mar -16 | $11.00 | 10 |
Depot Marketplace Prescott, AZ | 1993 / N/A | 91,461 | Sprouts | 44,237 | Jan – 17 | $9.04 | 15 |
Ocotillo Plaza – Goodwill Chandler, AZ | 2000 / 2017 | 121,829 | Goodwill Industries | 35,394 | Aug – 17 | $12.50 | 10 |
Sprouts – The Plant Chandler, AZ | 2016 / N/A | N/A | Sprouts | 28,806 | Jun -16 | $17.50 | 15 |
Artie’s Ace Hardware Phoenix, AZ | 1980 / 2016 | 25,766 | Artie’s Ace Hardware | 25,766 | Jan – 17 | $13.50 | 10 |
Sprouts Farmers Market – Mesa Shores Mesa, AZ | 1985 / 2016 | N/A | Sprouts | 24,970 | Sept - 16 | $15.74 | 10 |
| In-Line Tenants | |||||||
Prescott Valley Crossroads Prescott Valley, AZ | 2009-2016 / N/A | 251,163 | Rue 21 Maurice’s Mattress Firm Lindo Mexican Restaurant Kay Jewelers uBreakiFix | 6,503 5,084 4,200 3,663 2,007 1,128 | May -16 Nov – 16 Jun – 15 Jan – 18 Jan – 18 Dec – 17 | $16.50 $17.10 $32.00 $19.00 $28.90 $18.00 | 10 10 10 5 10 5 |
Town & Country Valley Center Prescott Valley, AZ | 1990 / N/A | 110,967 | Aspen Dental | 3,500 | Jun - 15 | $30.50 | 10 |
Glassford Hill Marketplace Prescott Valley, AZ | 2007 / N/A | 137,064 | Starbucks Digitell Cellular Firehouse Subs Sprint Wireless Generation (Cricket) Papa John’s Pizza Gadget Doc | 2,400 2,400 2,000 1,500 1,100 1,036 961 | Dec – 15 Mar – 15 Jun – 15 Jan – 15 Jan - 16 Jan - 16 Oct - 15 | $35.00 $27.00 $16.00 $21.00 $24.00 $25.50 $16.00 | 10 5 5 3 5 5 3 |
Depot Marketplace Prescott, AZ | 1993 / N/A | 91,461 | Subway | 1,500 | May - 17 | $21.00 | 7 |
Source: Appraisal
This is not a research report and was not prepared by any Underwriter’s research department. Please see additional important information and qualifications at the end of this Term Sheet. |
| T-100 |
| BANK 2018-BNK11 | Prescott Valley Crossroads |
Operating History and Underwritten Net Cash Flow. The following table presents certain information relating to the historical operating performance and the Underwritten Net Cash Flow at the Prescott Valley Crossroads Property:
Cash Flow Analysis | ||||||
| 2014(1) | 2015(1) | 2016 | 2017 | UW | UW PSF | |
| Gross Potential Rent(2) | $1,867,716 | $2,474,465 | $2,949,049 | $3,069,143 | $3,625,051 | $14.43 |
| Total Recoveries | $384,181 | $486,578 | $448,878 | $652,105 | $743,801 | $2.96 |
| Less Vacancy | $0 | $0 | $0 | $0 | $346,076 | $1.38 |
| Effective Gross Income | $2,251,897 | $2,961,043 | $3,397,927 | $3,721,248 | $4,022,775 | $16.02 |
| Total Expenses | $496,507 | $645,328 | $729,694 | $685,572 | $795,698 | $3.17 |
| Net Operating Income | $1,755,390 | $2,315,715 | $2,668,233 | $3,035,676 | $3,227,077 | $12.85 |
| Capital Expenditures | $0 | $0 | $0 | $0 | $50,233 | $0.20 |
| TI/LC | $0 | $0 | $0 | $0 | $149,122 | $0.59 |
| Net Cash Flow | $1,755,390 | $2,315,715 | $2,668,233 | $3,035,676 | $3,027,722 | $12.05 |
| Occupancy % | 95.3% | 93.0% | 93.8% | 94.3%(3) | 92.1% | |
| NOI DSCR (IO) | 1.12x | 1.47x | 1.70x | 1.93x | 2.05x | |
| NOI DSCR (P&I) | 0.87x | 1.14x | 1.32x | 1.50x | 1.59x | |
| NCF DSCR (IO) | 1.12x | 1.47x | 1.70x | 1.93x | 1.92x | |
| NCF DSCR (P&I) | 0.87x | 1.14x | 1.32x | 1.50x | 1.49x | |
| NOI Debt Yield | 5.5% | 7.2% | 8.3% | 9.5% | 10.1% | |
| NCF Debt Yield | 5.5% | 7.2% | 8.3% | 9.5% | 9.5% | |
| (1) | The Prescott Valley Crossroads Property was built in phases between 2009 and 2016. Historical cash flows and historical occupancy are based on available built rentable area as of December 31, 2015 or December 31, 2014, as applicable. |
| (2) | UW Gross Potential Rent is based on the rent roll dated February 1, 2018 and includes rent steps through March 1, 2019 totaling $20,552 and grossed up vacant space equal to $346,076. |
| (3) | Occupancy as of February 1, 2018 and includes two new tenants, Lindo Mexico and uBreakiFix (together 1.9% of NRA), that have executed leases and taken possession of their space but are not yet in occupancy. All gap rent between origination and rent commencement has been fully reserved by the lender. |
Escrows and Reserves. The Prescott Valley Crossroads Borrower is required to deposit monthly into escrow (i) 1/12 of the annual estimated real estate tax payments (currently $30,152) (unless any tenant is obligated pursuant to its lease to pay taxes directly, such tenant is not in default and the Prescott Valley Crossroads Borrower delivers to the lender evidence of such tenant’s current payment of taxes), (ii) 1/12 of the annual estimated insurance premiums (unless an acceptable blanket insurance policy is in place), and (iii) $4,186 for replacement reserves, subject to a cap of $200,928. At origination, the Prescott Valley Crossroads Borrower deposited $93,783 with lender for tenant improvements and leasing commissions (“TI/LC”) reserves, and is required to deposit monthly $20,930 as TI/LC reserves, subject to a cap of $1,500,000. Additionally, at origination, the Prescott Valley Crossroads Borrower deposited $138,510 with the lender for outstanding borrower obligations relating to the tenants Kay Jewelers, Lindo Mexican Restaurant and uBreakiFix and $36,671 for gap rent related to the tenants Lindo Mexican Restaurant and uBreakiFix.
Lockbox and Cash Management. The Prescott Valley Crossroads Mortgage Loan has a springing lockbox with springing cash management. Upon the occurrence of a Cash Sweep Event Period (as defined below), the Prescott Valley Crossroads Borrower is required to establish a lender-controlled lockbox account, and direct all tenants to pay rents directly into such lockbox account, and a lender-controlled cash management account. During the continuance of a Cash Sweep Event Period, funds in the lockbox account are required to be swept daily to the cash management account and, provided no event of default is continuing, applied on each monthly payment date to pay debt service on the Prescott Valley Crossroads Mortgage Loan, to fund required reserve deposits, to pay operating expenses consistent with the annual budget and extraordinary expenses approved by the lender, and to deposit any remaining cash flow and any Hobby Lobby Cash Sweep Cure Deposit (as defined below) to an account to be held by the lender as additional security for the Prescott Valley Crossroads Mortgage Loan.
A “Cash Sweep Event Period” will commence upon the occurrence of (a) an event of default, (b) the debt service coverage ratio (assuming a 30-year amortization schedule) being less than 1.10x for the immediately preceding six consecutive months, tested quarterly (a “DSCR Event”), and/or (c) a Hobby Lobby Tenant Event (as defined below).
A “Hobby Lobby Tenant Event” means the date that (i) Hobby Lobby vacates, goes dark, or gives notice to vacate, go dark or terminate its lease, (ii) Hobby Lobby is required to exercise its option to extend its lease term but has not exercised such option, or if no such date is specified, the date that is 12 months prior to the expiration of the Hobby Lobby lease, (iii) Hobby Lobby defaults in payment of rent beyond notice and cure periods, or (iv) Hobby Lobby or its lease guarantor has filed for bankruptcy or become the subject of a bankruptcy filing.
A Cash Sweep Event Period will terminate if (1) no event of default exists and (2) in the case of a DSCR Event, the debt service coverage ratio (assuming a 30-year amortization schedule) is equal to or greater than 1.10x for the immediately preceding six consecutive months, tested quarterly, for two consecutive quarters or (3) in the case of a Hobby Lobby Tenant Event, (x)(A) with respect to clause (i) or (ii) of the definition of a Hobby Lobby Tenant Event, Hobby Lobby has no longer vacated or gone dark, rescinds its notice to vacate, go dark or terminate its lease, or renews or extends its lease, (B) with respect to clause (iii) of the definition of a Hobby Lobby Tenant Event, the cure of the default, (C) with respect to clause (iv) of the definition of a Hobby Lobby Tenant Event, the Hobby Lobby lease is assumed without alteration of any material terms, or with respect to any bankruptcy proceeding, the assets of Hobby Lobby or its lease guarantor no longer being subject to bankruptcy and Hobby Lobby’s lease obligations remaining unaltered, or (y) if the Hobby Lobby lease is terminated, Hobby Lobby’s lease being replaced by a lease to a tenant acceptable to the lender for a minimum term of five years.
With respect to any Cash Sweep Period commencing as a result of a Hobby Lobby Tenant Event (a “Hobby Lobby Cash Sweep Period”), the Cash Sweep Period will be deemed not to have occurred or, if already commenced, will terminate upon the Prescott Valley Crossroads Borrower, at its election, depositing $800,000 to the excess cash reserve account or delivering to the lender a letter of credit in the same amount (the “Hobby Lobby Cash Sweep Cure Deposit”). The Hobby Lobby Cash Sweep Cure Deposit if posted, will be released at such time that the Hobby Lobby Cash Sweep Period is otherwise terminated but not for the Hobby Lobby Cash Sweep Cure Deposit.
This is not a research report and was not prepared by any Underwriter’s research department. Please see additional important information and qualifications at the end of this Term Sheet. |
| T-101 |
| BANK 2018-BNK11 | Prescott Valley Crossroads |
Additional Secured Indebtedness (not including trade debts). Not permitted.
Mezzanine Loan and Preferred Equity. Not permitted.
Release of Property. Not permitted.
Terrorism Insurance. The Prescott Valley Crossroads Borrower is required to obtain property insurance covering perils of terrorism and acts of terrorism in an amount equal to 100% of replacement cost, together with 12 months of business income insurance with a 6 month period of extended indemnity. See “Risk Factors—Risks Relating to the Mortgage Loans—Terrorism Insurance May Not Be Available for All Mortgaged Properties” in the Preliminary Prospectus.
This is not a research report and was not prepared by any Underwriter’s research department. Please see additional important information and qualifications at the end of this Term Sheet. |
| T-102 |
(THIS PAGE INTENTIONALLY LEFT BLANK)
| T-103 |
| BANK 2018-BNK11 | WMC Portfolio |
Mortgage Loan No. 9 – WMC Portfolio
This is not a research report and was not prepared by any Underwriter’s research department. Please see additional important information and qualifications at the end of this Term Sheet. |
| T-104 |
| BANK 2018-BNK11 | WMC Portfolio |
Mortgage Loan No. 9 – WMC Portfolio
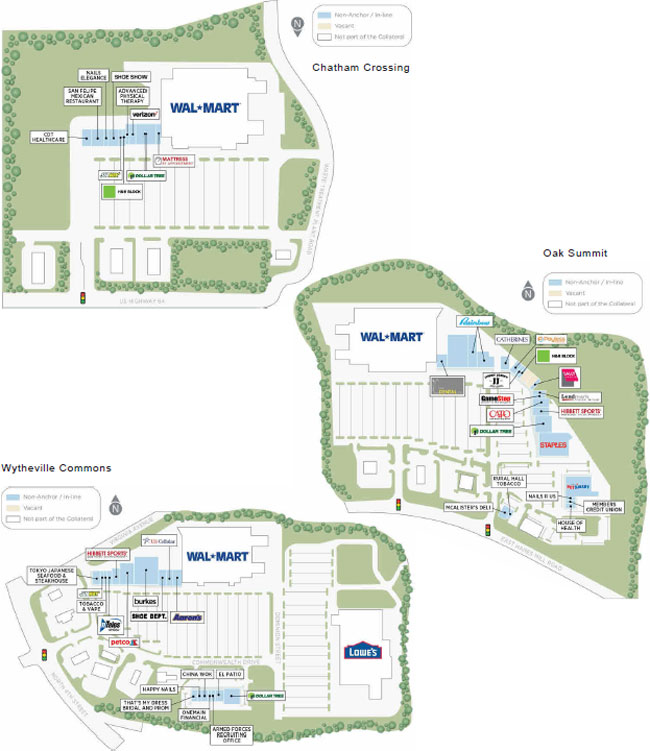
This is not a research report and was not prepared by any Underwriter’s research department. Please see additional important information and qualifications at the end of this Term Sheet. |
| T-105 |
| BANK 2018-BNK11 | WMC Portfolio |
Mortgage Loan No. 9 – WMC Portfolio
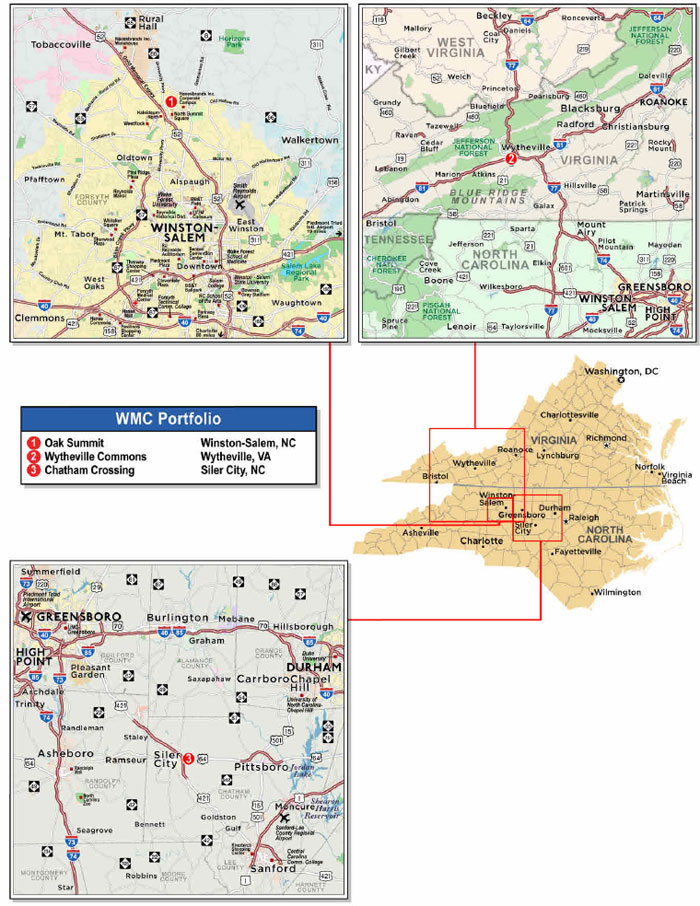
This is not a research report and was not prepared by any Underwriter’s research department. Please see additional important information and qualifications at the end of this Term Sheet. |
| T-106 |
| BANK 2018-BNK11 | WMC Portfolio |
| Mortgage Loan No. 9 – WMC Portfolio |
| Mortgage Loan Information | Property Information | ||||||
| Mortgage Loan Seller: | MSMCH | Single Asset/Portfolio: | Portfolio | ||||
| Original Balance: | $29,812,500 | Location: | Various | ||||
| Cut-off Date Balance: | $29,812,500 | General Property Type: | Retail | ||||
| % of Initial Pool Balance: | 4.3% | Detailed Property Type: | Shadow Anchored | ||||
| Loan Purpose: | Refinance | Title Vesting: | Fee | ||||
| Sponsor: | Stanley Werb; Jonathan Gaines | Year Built/Renovated: | 2001-2005/N/A | ||||
| Mortgage Rate: | 4.6900% | Size: | 264,721 SF | ||||
| Note Date: | 3/8/2018 | Cut-off Date Balance per SF: | $113 | ||||
| First Payment Date: | 5/1/2018 | Maturity Date Balance per SF: | $97 | ||||
| Maturity Date: | 4/1/2028 | Property Manager: | Rivercrest Realty Associates, LLC | ||||
| Original Term: | 120 months | (borrower related) | |||||
| Original Amortization Term: | 360 months | ||||||
| IO Period: | 24 months | Underwriting and Financial Information | |||||
| Seasoning: | 0 months | UW NOI: | $2,941,592 | ||||
| Prepayment Provisions: | LO (24); DEF (91); O (5) | UW NOI Debt Yield: | 9.9% | ||||
| Lockbox/Cash Mgmt Status: | Springing/Springing | UW NOI Debt Yield at Maturity: | 11.5% | ||||
| Additional Debt Type: | N/A | UW NCF DSCR: | 1.88x (IO) 1.44x (P&I) | ||||
| Additional Debt Balance: | N/A | Most Recent NOI: | $2,752,700 (12/31/2017) | ||||
| Future Debt Permitted (Type): | No (N/A) | 2nd Most Recent NOI: | $2,891,938 (12/31/2016) | ||||
| Reserves(1) | 3rd Most Recent NOI: | $2,915,374 (12/31/2015) | |||||
| Type | Initial | Monthly | Cap | Most Recent Occupancy(2): | 88.8% (3/1/2018) | ||
| RE Tax: | $192,988 | $25,868 | N/A | 2nd Most Recent Occupancy: | 92.2% (12/31/2016) | ||
| Insurance: | $0 | Springing | N/A | 3rd Most Recent Occupancy: | 91.8% (12/31/2015) | ||
| Recurring Replacements: | $0 | $6,476 | N/A | Appraised Value (as of): | $39,800,000 (February 2018) | ||
| TI/LC: | $400,000 | $18,750 | $850,000 | Cut-off Date LTV Ratio: | 74.9% | ||
| Other: | $178,744 | $0 | N/A | Maturity Date LTV Ratio: | 64.4% | ||
| Sources and Uses | ||||||
| Sources | Proceeds | % of Total | Uses | Proceeds | % of Total | |
| Loan Amount: | $29,812,500 | 100.0% | Loan Payoff: | $14,939,230 | 50.1% | |
| Return of Equity: | $13,538,561 | 45.4% | ||||
| Reserves: | $771,732 | 2.6% | ||||
| Closing Costs: | $562,977 | 1.9% | ||||
| Total Sources: | $29,812,500 | 100.0% | Total Uses: | $29,812,500 | 100.0% | |
| (1) | See “Escrows and Reserves” below for further discussion of reserve requirements. |
| (2) | Most Recent Occupancy excludes Staples (24,007 SF, 9.1% of NRA), which is currently in occupancy at the Oak Summit Property (as defined below), but not paying rent. Ross Dress for Less (“Ross”) has signed a letter of intent to lease the space currently occupied by Staples. Each of the WMC Portfolio Borrower (as defined below) and Staples has an active termination option. Staples is required to vacate upon exercise of the WMC Portfolio Borrower’s termination option, which the WMC Portfolio Borrower has indicated it will exercise upon delivery of the space to Ross. There is no assurance that any such lease will be signed. Including the Ross lease, the WMC Portfolio Properties (as defined below) would be 97.9% leased. |
The Mortgage Loan. The ninth largest mortgage loan (the “WMC Portfolio Mortgage Loan”) is evidenced by a promissory note in the original principal amount of $29,812,500 and is secured by a first priority fee mortgage encumbering a portfolio of three multi-tenant retail properties in North Carolina and Virginia (the “WMC Portfolio Properties”). The proceeds from the WMC Portfolio Mortgage Loan were primarily used to refinance the previous loan secured by the WMC Portfolio Properties, return equity to the WMC Portfolio Borrower (as defined below), pay closing costs and fund upfront reserves. The previous loan secured by the WMC Portfolio Properties was included in the GSMS 2011-GC3 transaction.
The Borrowers and the Sponsors. The borrowers are Winston-Salem (Oak Summit) WMC, LLC, Wytheville (Wytheville) WMC, LLC and Siler City (Chatham) WMC, LLC (together, the “WMC Portfolio Borrower”), each a single-purpose Delaware limited liability company with two independent directors. No individual other than Stanley Werb (21.9%) and Jonathan Gaines (20.5%) have an aggregate direct or indirect interest of 10.4% or greater in the WMC Portfolio Borrower. Stanley Werb and Jonathan Gaines are the managing members of the WMC Portfolio Borrower. The borrower sponsors and non-recourse carve-out guarantors are Stanley Werb and Jonathan Gaines.
Stanley Werb is the managing partner of Rivercrest Realty Associates, LLC (“Rivercrest”), a property management company, and has over 40 years of experience in real estate, including asset management, commercial lease negotiations, insurance analysis, debt financing and acquisitions. Jonathan Gaines joined Rivercrest in 1992 and his experience includes asset management, commercial lease negotiations and preparation, litigation management and property acquisition.
The Properties. The WMC Portfolio Properties are comprised of three multi-tenant retail properties totaling 264,721 SF that are shadow anchored by Walmart Supercenters. The WMC Portfolio Properties are 88.8% leased to 42 tenants on 47 leases as of March 1, 2018. The WMC Portfolio Mortgage Loan does not allow for the release of any of the WMC Portfolio Properties.
This is not a research report and was not prepared by any Underwriter’s research department. Please see additional important information and qualifications at the end of this Term Sheet. |
| T-107 |
| BANK 2018-BNK11 | WMC Portfolio |
The following table presents detailed information with respect to each of the WMC Portfolio Properties:
| WMC Portfolio Properties Summary(1) | ||||||||
| Property Name | Location | Property Type | SF | Year Built / Renovated | Allocated Loan Amount | % of Allocated Loan Amount | Appraised Value | UW NOI |
| Oak Summit | Winston-Salem, NC | Retail | 142,358 | 2001-2005 / NAP | $16,067,290 | 53.9% | $21,450,000 | $1,433,217 |
| Wytheville Commons | Wytheville, VA | Retail | 90,381 | 2001 / NAP | $10,112,280 | 33.9% | $13,500,000 | $1,102,874 |
| Chatham Crossing | Siler City, NC | Retail | 31,982 | 2001 / NAP | $3,632,930 | 12.2% | $4,850,000 | $405,501 |
| Total | 264,721 | $29,812,500 | 100.0% | $39,800,000 | $2,941,592 | |||
| (1) | Information is based on the underwritten rent roll as of March 1, 2018. |
WMC Portfolio Properties.
Oak Summit. (142,358 SF, 53.8% of NRA, 50.6% of underwritten base rent). Oak Summit(the“Oak Summit Property”) is a 142,358 SF shadow anchored retail center comprised of six one-story buildings located in Winston-Salem, North Carolina. Built between 2001 and 2005, the Oak Summit Property is situated on 26.4 acres and contains a total of 675 parking spaces (4.74 spaces per 1,000 SF of NRA). As of March 1, 2018, the Oak Summit Property was 79.2% leased by a mix of 20 national and local tenants, including Marshalls, Petsmart, Five Below, Dollar Tree, Hibbett Sports, H&R Block and Jimmy John's Gourmet Sandwiches. The Oak Summit Property is shadow anchored by a Walmart Supercenter, which abuts from one of the Oak Summit Property buildings and shares a parking lot with a McDonalds, Chick-Fil-A and Chili’s, none of which are collateral for the WMC Portfolio Mortgage Loan. Additionally, there is a Sam’s Club, Lowe’s Home Improvement and Home Depot in the area immediately surrounding the Oak Summit Property. Since purchasing the Oak Summit Property in December of 2011 the borrower sponsor has spent $2,585,093 in capital expenditures. From 2011 through 2017, the Oak Summit Property had an average occupancy of 85.2%.
Staples (24,007 SF, 9.1% of NRA), the largest tenant at the Oak Summit Property, is currently in occupancy at the Oak Summit Property on a lease that expires November 30, 2018, but is not paying rent. Staples has not paid rent since November 30, 2016, pursuant to a lease amendment. Rent from such tenant was not underwritten. Both the WMC Portfolio Borrower and Staples have an active termination option. Ross has signed a letter of intent to lease the space currently occupied by Staples. Staples is required to vacate upon exercise of the WMC Portfolio Borrower’s termination option, which the WMC Portfolio Borrower has indicated it will exercise upon delivery of the space to Ross. There is no assurance that any such lease will be signed. Including the Ross lease, the Oak Summit Property would be 96.1% leased.
Wytheville Commons. (90,381 SF, 34.1% of NRA, 35.7% of underwritten base rent). Wytheville Commons (the “Wytheville Commons Property”) is a 90,381 SF shadow anchored retail center comprised of two one-story buildings located in Wytheville, Virginia. Built in 2001, the Wytheville Commons Property is situated on 9.7 acres and contains a total of 478 parking spaces (5.29 spaces per 1,000 SF of NRA). As of March 1, 2018, the Wytheville Commons Property was 100.0% leased by a mix of 17 national and local tenants, including Burke's Outlet Store, Petco, Dollar Tree, Hibbett Sports and Subway. The Wytheville Commons Property is shadow anchored by a Walmart Supercenter, which abuts from one of the Wytheville Commons Property buildings, a Lowe’s Home Improvement and a Marquee Cinema. Additionally, the Wytheville Commons Property is adjacent to the Wythe County Community Hospital and a Food Lion. Since purchasing the Wytheville Commons Property in December of 2010, the borrower sponsor has spent $1,523,693 in capital expenditures. From 2011 through 2017, the Wytheville Commons Property had an average occupancy of 95.3%.
Chatham Crossing. (31,982 SF, 12.1% of NRA, 13.7% of underwritten base rent). Chatham Crossing (the “Chatham Crossing Property”) is a 31,982 SF shadow anchored retail center comprised of a one-story building located in Siler City, North Carolina. Built in 2001, the Chatham Crossing Property is situated on 4.0 acres and contains a total of 154 parking spaces (4.82 spaces per 1,000 SF of NRA). As of March 1, 2018, the Chatham Crossing Property was 100.0% leased by a mix of 10 national and local tenants, including Dollar Tree, Verizon Wireless, Subway and H&R Block. The Chatham Crossing Property is shadow anchored by a Walmart Supercenter, which abuts from the Chatham Crossing Property building. Since purchasing the Chatham Crossing Property in December of 2010, the borrower sponsor has spent $536,504 in capital expenditures. From 2011 through 2017, the Chatham Crossing Property had an average occupancy of 84.0%.
This is not a research report and was not prepared by any Underwriter’s research department. Please see additional important information and qualifications at the end of this Term Sheet. |
| T-108 |
| BANK 2018-BNK11 | WMC Portfolio |
The following table presents a summary regarding the major tenants at the WMC Portfolio Properties (of which certain tenants may have co-tenancy provisions, including co-tenancy provisions based on shadow anchors):
| Tenant Summary(1) | ||||||||||
| Tenant Name – Property | Credit Rating (Fitch/Moody’s/S&P)(2) | Tenant SF | Approx. % of SF | Annual UW Rent | Annual UW Rent PSF(3) | % of Annual UW Rent |
| Occ. Cost %(5) | Lease Expiration | |
| $ | PSF | |||||||||
| Major Tenants | ||||||||||
| Burke's Outlet Store – Wytheville | NR/NR/NR | 25,000 | 9.4% | $165,000 | $6.60 | 5.2% | $2,227,739 | $89 | 7.4% | 1/31/2021 |
| Marshalls – Oak Summit | NR/A2/A+ | 23,953 | 9.0% | $209,589 | $8.75 | 6.7% | $5,973,255 | $249 | 3.5% | 4/30/2023 |
| Petsmart – Oak Summit | NR/B1/CCC+ | 20,057 | 7.6% | $265,755 | $13.25 | 8.4% | NAV | NAV | NAV | 5/31/2020 |
| Petco – Wytheville | NR/B2/B- | 11,756 | 4.4% | $149,889 | $12.75 | 4.8% | NAV | NAV | NAV | 1/31/2023 |
| Five Below – Oak Summit(6) | NR/NR/NR | 10,959 | 4.1% | $142,467 | $13.00 | 4.5% | NAV | NAV | NAV | 1/31/2027 |
| Dollar Tree – Oak Summit | NR/Baa3/BBB- | 10,034 | 3.8% | $132,951 | $13.25 | 4.2% | NAV | NAV | NAV | 5/31/2023 |
| Dollar Tree – Wytheville | NR/Baa3/BBB- | 10,000 | 3.8% | $95,000 | $9.50 | 3.0% | NAV | NAV | NAV | 1/31/2023 |
| Rainbow – Oak Summit(7) | NR/NR/NR | 9,052 | 3.4% | $115,000 | $12.70 | 3.7% | $667,910 | $74 | 17.2% | 1/31/2021 |
| Dollar Tree – Chatham Crossing | NR/Baa3/BBB- | 9,000 | 3.4% | $90,000 | $10.00 | 2.9% | NAV | NAV | NAV | 6/30/2022 |
| Subtotal/Wtd. Avg. | 129,811 | 49.0% | $1,365,651 | $10.52 | 43.4% | |||||
| Other Tenants | 105,303 | 39.8% | $1,780,282 | $16.91 | 56.6% | |||||
| Vacant Space(8) | 29,607 | 11.2% | $0 | 0.0% | ||||||
| Total/Wtd. Avg. | 264,721 | 100.0% | $3,145,933 | $13.38 | 100.0% | |||||
| (1) | Information is based on the underwritten rent roll as of March 1, 2018. |
| (2) | Certain ratings are those of the parent company whether or not the parent guarantees the lease. |
| (3) | Wtd. Avg. Annual UW Rent PSF excludes vacant space. |
| (4) | Most Recent Sales are as of December 31, 2017 for Burke’s Outlet Store and January 31, 2017 for Marshalls and Rainbow. |
| (5) | Occ. Cost % is based on the underwritten rent as of the March 1, 2018 rent roll divided by the most recently reported sales. |
| (6) | If Five Below’s gross sales are less than $1,800,000 for the lease year starting July 30, 2021, it can terminate with 150 days written notice given no later than 90 days after July 29, 2022. |
| (7) | If Rainbow’s gross sales fail to reach or exceed $600,000 for the 2018 calendar year, it can terminate with 31 days written notice given at any time between January 1, 2019 and June 30, 2019. |
| (8) | Vacant Space includes Staples (24,007 SF, 9.1% of NRA), which is currently in occupancy at the Oak Summit Property, but not paying rent. Ross has signed a letter of intent to lease the space currently occupied by Staples. Staples is required to vacate upon exercise of the WMC Portfolio Borrower’s termination option, which the WMC Portfolio Borrower has indicated it will exercise upon delivery of the space to Ross. There is no assurance that any such lease will be signed. Including the Ross lease, the WMC Portfolio Properties would be 97.9% leased. |
The following table presents certain information with respect to the lease rollover at the WMC Portfolio Properties:
Lease Rollover Schedule(1)(2) | ||||||||
| Year | # of Leases Rolling | SF Rolling | % of Total SF Rolling | Cumulative % of SF Rolling | Annual UW Rent PSF Rolling(3) | Annual UW Rent Rolling | % of Annual Rolling | Cumulative % of Annual UW Rent Rolling |
| MTM | 1 | 3,640 | 1.4% | 1.4% | $16.00 | $58,240 | 1.9% | 1.9% |
| 2018 | 3 | 10,200 | 3.9% | 5.2% | $16.54 | $168,679 | 5.4% | 7.2% |
| 2019 | 7 | 20,769 | 7.8% | 13.1% | $14.52 | $301,655 | 9.6% | 16.8% |
| 2020 | 9 | 43,522 | 16.4% | 29.5% | $15.67 | $682,132 | 21.7% | 38.5% |
| 2021 | 8 | 49,673 | 18.8% | 48.3% | $11.65 | $578,653 | 18.4% | 56.9% |
| 2022 | 7 | 20,207 | 7.6% | 55.9% | $13.97 | $282,336 | 9.0% | 65.9% |
| 2023 | 8 | 64,336 | 24.3% | 80.2% | $11.60 | $746,527 | 23.7% | 89.6% |
| 2024 | 1 | 1,995 | 0.8% | 81.0% | $15.50 | $30,923 | 1.0% | 90.6% |
| 2025 | 1 | 5,000 | 1.9% | 82.9% | $14.50 | $72,500 | 2.3% | 92.9% |
| 2026 | 0 | 0 | 0.0% | 82.9% | $0.00 | $0 | 0.0% | 92.9% |
| 2027 | 1 | 10,959 | 4.1% | 87.0% | $13.00 | $142,467 | 4.5% | 97.4% |
| 2028 | 1 | 4,813 | 1.8% | 88.8% | $17.00 | $81,821 | 2.6% | 100.0% |
| 2029 & Beyond | 0 | 0 | 0.0% | 88.8% | $0.00 | $0 | 0.0% | 100.0% |
| Vacant(4) | 0 | 29,607 | 11.2% | 100.0% | $0.00 | $0 | 0.0% | 100.0% |
| Total / Wtd. Avg. | 47 | 264,721 | 100.0% | $13.38 | $3,145,933 | 100.0% | ||
| (1) | Information is based on the underwritten rent roll as of March 1, 2018. |
| (2) | Certain tenants may have lease termination options that may become exercisable prior to the originally stated expiration date of the tenant lease that are not considered in the lease rollover schedule. |
| (3) | Total Wtd. Avg. Annual UW Rent PSF Rolling excludes vacant space. |
| (4) | Vacant includes Staples (24,007 SF, 9.1% of NRA), which is currently in occupancy at the Oak Summit Property, but not paying rent. Ross has signed a letter of intent to lease the space currently occupied by Staples. Staples is required to vacate upon exercise of the WMC Portfolio Borrower’s termination option, which the WMC Portfolio Borrower has indicated it will exercise upon delivery of the space to Ross. There is no assurance that any such lease will be signed. Including the Ross lease, the WMC Portfolio Properties would be 97.9% leased. |
This is not a research report and was not prepared by any Underwriter’s research department. Please see additional important information and qualifications at the end of this Term Sheet. |
| T-109 |
| BANK 2018-BNK11 | WMC Portfolio |
The Markets. The WMC Portfolio Properties are located in two different markets in North Carolina and one market in Virginia. The Oak Summit Property is located in Winston Salem, North Carolina, in the Forsyth County retail submarket. According to the appraisal, as of the fourth quarter of 2017, the Forsyth County retail submarket had approximately 27.5 million SF of retail space with a 3.4% vacancy rate and average rental rate of $12.92 PSF. As of the fourth quarter of 2017, the Winston-Salem retail market had approximately 102.4 million SF of retail space with a 5.2% vacancy rate and average rental rate of $11.70 PSF. According to the appraisal, the 2017 estimated population within a one-, three- and five-mile radius is 2,506, 31,616 and 79,149, respectively. The 2017 estimated average household income within a one-, three- and five-mile radius is $47,998, $52,535 and $59,429, respectively.
The following table presents recent leasing data at comparable retail properties with respect to the Oak Summit Property:
| Oak Summit Property - Comparable Lease Summary | |||||||||
Property Name City, State | Distance from Subject | Year Built | Occupancy | Tenant | Lease Area (SF) | Lease Date | Base Rent PSF | Lease Term (Yrs.) | Reimbursements |
Hanes Commons Winston-Salem, NC
| 9 miles | 2001 | 100% | Affordable Dentures Nail Studio & Spa Sherwin Williams The Joint | 3,316 1,662 3,500 1,400 | May-18 Aug-15 Aug-14 Jun-14 | $24.00 $30.00 $23.00 $32.00 | 5.0 7.0 5.0 5.0 | NNN NNN NNN NNN |
Grandview Plaza Winston-Salem, NC | 5 miles | 1996 | 100% | Subway Gel Nails | 1,200 1,200 | Nov-17 Sep-16 | $14,14 $17.21 | 3.0 3.0 | NNN NNN |
Lexington II Shopping Center Lexington, NC | 27 miles | 2008 | 100% | H&R Block | 1,600 | Jul-09 | $15.00 | 3.0 | NNN |
Source: Appraisal.
The Wytheville Commons Property is located in Wytheville, Virginia in the Wythe County retail submarket. According to the appraisal, as of the fourth quarter of 2017, the surrounding counties of Tazewell County, Smyth County, Grayson County, Carroll County, Bland County, Washington County and Pulaski County had approximately 12.0 million SF of retail space with a 6.2% vacancy rate and average rental rate of $5.87 PSF. As of the fourth quarter of 2017, the Wythe County retail submarket had approximately 1.9 million SF of retail space with a 5.7% vacancy rate and average rental rate of $11.65 PSF. According to the appraisal, the 2017 estimated population within a one-, three- and five-mile radius is 3,773, 8,797 and 10,928, respectively. The 2017 estimated average household income within a one-, three- and five-mile radius is $58,882, $58,355 and $57,499, respectively.
The following table presents recent leasing data at comparable retail properties with respect to the Wytheville Commons Property:
| Wytheville Commons Property - Comparable Lease Summary | |||||||||
Property Name City, State | Distance from Subject | Year Built | Occupancy | Tenant | Lease Area (SF) | Lease Date | Base Rent PSF | Lease Term (Yrs.) | Reimbursements |
Wythe Plaza Shopping Center Wytheville, VA | 1 mile | 1976 | 89% | Confidential Backwoods Barbeque | 2,500 1,400 | Jan-18 Nov-16 | $16.80 $7.00 | 5.0 5.0 | NNN NNN |
Spradlin Farm's Shopping Center Christiansburg, VA | 40 miles | 2001 | 100% | Regional Finance Savana Tan | 1,050 1,030 | Jan-16 Aug-10 | $23.00 $20.60 | 5.0 5.0 | NNN NNN |
Twin City Shopping Center Bluefield, VA | 22 miles | 1984 | 93% | Family Dollar Aaron’s Rent | 7,600 10,200 | May-16 Mar-14 | $8.00 $8.24 | 5.0 7.0 | NNN NNN |
Towne Square Roanoke, VA | 68 miles | 1987 | 97% | Petco Five Below | 12,672 8,000 | Mar-15 Oct-14 | $18.50 $15.50 | 10.0 10.0 | NNN NNN |
Source: Appraisal.
The Chatham Crossing Property is located in Siler City, North Carolina, in the Chatham County retail submarket of the Raleigh-Durham retail market. According to the appraisal, as of the fourth quarter of 2017, the Chatham County retail submarket had approximately 2.2 million SF of retail space with a 6.2% vacancy rate and average rental rate of $13.68 PSF. As of the fourth quarter of 2017, the Raleigh-Durham retail market had approximately 99.6 million SF of retail space with a 3.4% vacancy rate and average rental rate of $16.98 PSF. According to the appraisal, the 2017 estimated population within a one-, three- and five-mile radius is 1,954, 10,281 and 14,481, respectively. The 2017 estimated average household income within a one-, three- and five-mile radius is $39,773, $46,755 and $50,885, respectively.
This is not a research report and was not prepared by any Underwriter’s research department. Please see additional important information and qualifications at the end of this Term Sheet. |
| T-110 |
| BANK 2018-BNK11 | WMC Portfolio |
The following table presents recent leasing data at comparable retail properties with respect to the Chatham Crossing Property:
| Chatham Crossing Property - Comparable Lease Summary | |||||||||
Property Name City, State | Distance from Subject | Year Built | Occupancy | Tenant | Lease Area (SF) | Lease Date | Base Rent PSF | Lease Term (Yrs.) | Reimbursements |
Shoppes at Sanford Sanford, NC | 26 miles | 2007 | 94% | Ultra Tan Wade Jurney Homes | 1,600 1,400 | Apr-17 Jan-17 | $22.00 $18.00 | 3.0 3.0 | NNN NNN |
Lexington II Shopping Center Lexington, NC | 47 miles | 2008 | 100% | H&R Block | 1,600 | Jul-09 | $15.00 | 3.0 | NNN |
Smithfield Plaza Smithfield, NC | 64 miles | 1997 | 100% | Happy Nails | 2,000 | Nov-13 | $22.19 | 5.0 | NNN |
Source: Appraisal.
Operating History and Underwritten Net Cash Flow.The following table presents certain information relating to the historical operating performance and Underwritten Net Cash Flow at the WMC Portfolio Properties:
| Cash Flow Analysis | ||||||
| 2014 | 2015 | 2016 | 2017 | UW | UW PSF | |
| Gross Potential Rent(1)(2) | $3,035,579 | $3,100,203 | $3,095,100 | $3,148,681 | $3,505,185 | $13.24 |
| Total Recoveries | $524,328 | $569,223 | $572,850 | $582,897 | $596,006 | $2.25 |
| Other Income | $7,376 | $18,852 | $12,499 | $16,742 | $4,800 | $0.02 |
| Less Vacancy & Credit Loss | $0 | ($4,448) | ($21,953) | ($275,351) | ($452,222) | ($1.71) |
| Effective Gross Income | $3,567,283 | $3,683,830 | $3,658,496 | $3,472,969 | $3,653,769 | $13.80 |
| Total Operating Expenses | $740,886 | $768,456 | $766,558 | $720,269 | $712,177 | $2.69 |
| Net Operating Income(1) | $2,826,397 | $2,915,374 | $2,891,938 | $2,752,700 | $2,941,592 | $11.11 |
| Capital Expenditures | $0 | $0 | $0 | $0 | $77,715 | $0.29 |
| TI/LC | $0 | $0 | $0 | $0 | $196,111 | $0.74 |
| Net Cash Flow | $2,826,397 | $2,915,374 | $2,891,938 | $2,752,700 | $2,667,766 | $10.08 |
| Occupancy % | 91.8% | 91.8% | 92.2% | 96.4% | 89.6%(3) | |
| NOI DSCR (IO) | 1.99x | 2.06x | 2.04x | 1.94x | 2.08x | |
| NOI DSCR | 1.53x | 1.57x | 1.56x | 1.49x | 1.59x | |
| NCF DSCR (IO) | 1.99x | 2.06x | 2.04x | 1.94x | 1.88x | |
| NCF DSCR | 1.53x | 1.57x | 1.56x | 1.49x | 1.44x | |
| NOI Debt Yield | 9.5% | 9.8% | 9.7% | 9.2% | 9.9% | |
| NCF Debt Yield | 9.5% | 9.8% | 9.7% | 9.2% | 8.9% | |
| (1) | UW Gross Potential Rent reflects contractual rents as of March 1, 2018 and includes rent steps of $24,196 through January 1, 2019. The increase in UW Net Operating Income from 2017 Net Operating Income can also be attributed to recent lease signings. Two tenants leased space totaling 6,808 SF (2.6% of NRA and 3.6% of underwritten base rent) in 2018. |
| (2) | Staples (24,007 SF, 9.1% of NRA) is currently in occupancy at the Oak Summit Property, but is not paying rent and has not paid rent since November 30, 2016, pursuant to a lease amendment. Rent from such tenant was not underwritten. Ross has signed a letter of intent to lease the space currently occupied by Staples. Staples is required to vacate upon exercise of the WMC Portfolio Borrower’s termination option, which the WMC Portfolio Borrower has indicated it will exercise upon delivery of the space to Ross. There is no assurance that any such lease will be signed. Staples is included in the historical Occupancy % for 2014 through 2017, but is not included in underwritten Occupancy %. |
| (3) | Represents economic occupancy. Physical occupancy, excluding the Staples space, is 88.8% as of March 1, 2018. |
Escrows and Reserves. In connection with the origination of the WMC Portfolio Mortgage Loan, the WMC Portfolio Borrower funded reserves of approximately (i) $192,988 for real estate taxes; (ii) $400,000 for future tenant improvements and leasing commissions obligations and (iii) $178,744 for outstanding tenant obligations, which includes $12,884 for free rent for one tenant and the remainder is for tenant improvement and leasing commissions obligations with respect to four tenants.
Additionally, on each due date, the WMC Portfolio Borrower is required to fund the following reserves with respect to the WMC Portfolio Properties: (i) a tax reserve in a monthly amount equal to one-twelfth of the amount that the lender estimates will be necessary to pay taxes over the then succeeding 12-month period, initially $25,868, (ii) an insurance reserve in a monthly amount equal to one-twelfth of the amount that the lender estimates will be necessary to pay insurance premiums over the then succeeding 12-month period, provided that the monthly insurance reserve deposit is waived if the WMC Portfolio Borrower is maintaining blanket insurance policies in accordance with the WMC Portfolio Mortgage Loan documents, (iii) a replacement reserve for capital expenditures in a monthly amount equal to $6,476; and (iv) a tenant improvements and leasing commissions reserve in a monthly amount equal to $18,750; provided that, so long as no Cash Sweep Period (as defined below) is continuing, the WMC Portfolio Borrower is not required to make the monthly deposit to the tenant improvements and leasing commissions reserve if it would cause the amount then on deposit (inclusive of the $400,000 initial deposit) to exceed a cap of $850,000.
Lockbox and Cash Management. The WMC Portfolio Mortgage Loan is structured with a springing hard lockbox with springing cash management. Upon the first occurrence of a Cash Sweep Period, the WMC Portfolio Borrower is required to establish a lender-controlled lockbox account, and the lender has the right to establish a lender-controlled cash management account. The WMC Portfolio Mortgage Loan documents require the WMC Portfolio Borrower to direct tenants to pay rent directly to the lockbox account and require that all other money received by the WMC Portfolio Borrower or property manager with respect to the WMC Portfolio Properties be deposited into such lockbox account within two business days following receipt. If no Cash Sweep Period is continuing, all funds in the lockbox account are required to be swept into the WMC Portfolio Borrower’s operating account. During the continuance of a Cash Sweep Period, all funds in the lockbox account are required to be swept from the lockbox account into the lender-controlled cash management account and applied in accordance with the WMC Portfolio Mortgage Loan documents to make deposits into reserve funds, as described under “Escrows and Reserves” above, to pay debt service on the WMC Portfolio Mortgage Loan; provided no event of default is
This is not a research report and was not prepared by any Underwriter’s research department. Please see additional important information and qualifications at the end of this Term Sheet. |
| T-111 |
| BANK 2018-BNK11 | WMC Portfolio |
continuing, to pay operating expenses in accordance with the annual budget (which is required to be approved by the lender during the continuance of a Cash Sweep Period), and to deposit the remainder into a cash sweep account to be held as additional collateral for the WMC Portfolio Mortgage Loan during the continuance of such Cash Sweep Period.
A “Cash Sweep Period” means the period:
| (i) | commencing upon the occurrence of an event of default under the WMC Portfolio Mortgage Loan and ending upon the acceptance by the lender to its sole satisfaction of a cure of such event of default; or |
| (ii) | commencing upon the debt service coverage ratio of the WMC Portfolio Mortgage Loan (based on principal and interest debt service payments) falling below 1.20x for the immediately preceding six calendar months based on the trailing six months operating statements and rent rolls and ending upon the debt service coverage ratio (based on principal and interest debt service payments) being at least 1.20x for the immediately preceding six calendar months based on the trailing six months operating statements and rent rolls; or |
| (iii) | commencing upon a Shadow Anchor (as defined below) going dark or vacating its Shadow Anchor Premises (as defined below) and ending upon either (x) such Shadow Anchor being open for business and in occupancy of the entirety of its space, or (y) a Replacement Shadow Anchor (as defined below) being open for business and in occupancy of not less than 75% of the Shadow Anchor Premises and no bankruptcy or insolvency petition has been filed with respect to such Replacement Shadow Anchor or its parent company; or |
| (iv) | commencing upon a Shadow Anchor, or any parent company of a Shadow Anchor, filing (or giving notice of its intent to file) a voluntary bankruptcy or insolvency petition or being the subject of an involuntary bankruptcy or insolvency petition and ending upon a Replacement Shadow Anchor being open for business and in occupancy of not less than 75% of the Shadow Anchor Premises and no bankruptcy or insolvency petition has been filed with respect to such Replacement Shadow Anchor or its parent company. |
A “Shadow Anchor” means Wal-Mart Stores, Inc. or any affiliate thereof (“Walmart”) or any Replacement Shadow Anchor with respect to any Shadow Anchor Premises occupied by Walmart as of the loan closing date.
"Replacement Shadow Anchor" means any national anchor that is rated not less than BBB- by Standard & Poor’s Ratings Group and not less than Baa3 by Moody's Investors Service, Inc.
"Shadow Anchor Premises" means any real property adjacent to any one of the WMC Portfolio Properties that is occupied by Walmart as of the loan closing date (i.e., any real property where Walmart is a "shadow anchor" with respect to such individual property as of the loan closing date).
Additional Secured Indebtedness (not including trade debts). Not permitted.
Mezzanine Loan and Preferred Equity. Not permitted.
Release of Property. Not Permitted.
Terrorism Insurance. The WMC Portfolio Borrower is required to obtain property insurance covering perils of terrorism and acts of terrorism in an amount equal to 100% of replacement cost, together with twelve months of business income insurance, to the extent such policies are commercially available. Notwithstanding the foregoing, for so long as the Terrorism Risk Insurance Program Reauthorization Act of 2015 (or subsequent statute, extension or reauthorization thereof) (“TRIPRA”) is in effect and covers both domestic and foreign acts of terrorism, the lender is required to accept terrorism insurance which covers acts which are “certified” (within the meaning of TRIPRA). See “Risk Factors—Risks Relating to the Mortgage Loans—Terrorism Insurance May Not Be Available for All Mortgaged Properties” in the Preliminary Prospectus.
This is not a research report and was not prepared by any Underwriter’s research department. Please see additional important information and qualifications at the end of this Term Sheet. |
| T-112 |
(THIS PAGE INTENTIONALLY LEFT BLANK)
| T-113 |
| BANK 2018-BNK11 | The Gateway |
Mortgage Loan No. 10 – The Gateway
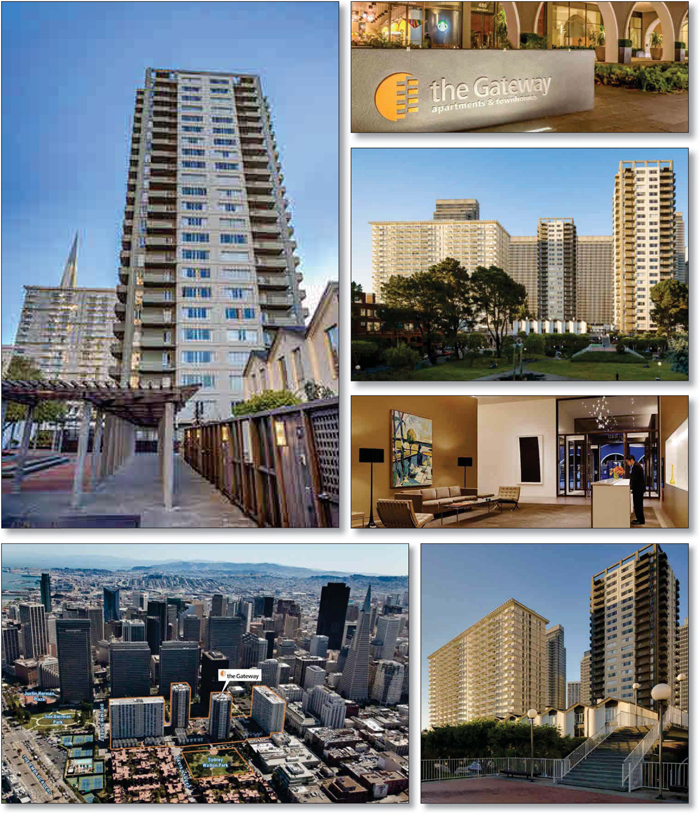
This is not a research report and was not prepared by any Underwriter’s research department. Please see additional important information and qualifications at the end of this Term Sheet. |
| T-114 |
| BANK 2018-BNK11 | The Gateway |
Mortgage Loan No. 10 – The Gateway

This is not a research report and was not prepared by any Underwriter’s research department. Please see additional important information and qualifications at the end of this Term Sheet. |
| T-115 |
| BANK 2018-BNK11 | The Gateway |
| Mortgage Loan No. 10 – The Gateway |
| Mortgage Loan Information | Property Information | ||||||
| Mortgage Loan Seller: | BANA | Single Asset/Portfolio: | Single Asset | ||||
| Original Balance(1): | $27,500,000 | Location: | San Francisco, CA 94111 | ||||
| Cut-off Date Balance(1): | $27,500,000 | General Property Type(6): | Multifamily | ||||
| % of Initial Pool Balance: | 4.0% | Detailed Property Type(6): | High Rise | ||||
| Loan Purpose: | Refinance | Title Vesting: | Fee | ||||
| Sponsors(2): | Prime Property Fund II, L.P.; CM | Year Built/Renovated: | 1965-1967/2010-2018 | ||||
| Golden Gate, Inc.; Oakhill Gateway | Size(6): | 1,254 Units | |||||
| Partners, L.P. | Cut-off Date Balance per Unit(1)(6): | $263,158 | |||||
| Mortgage Rate: | 3.721818% | Maturity Date Balance per Unit(1)(6): | $263,158 | ||||
| Note Date: | 3/16/2018 | Property Manager: | Golden Management, Inc. | ||||
| First Payment Date: | 5/6/2018 | (borrower-related) | |||||
| Maturity Date: | 4/6/2028 | Underwriting and Financial Information | |||||
| Original Term to Maturity: | 120 months | UW NOI: | $37,654,905 | ||||
| Original Amortization Term: | 0 months | UW NOI Debt Yield(1): | 11.4% | ||||
| IO Period: | 120 months | UW NOI Debt Yield at Maturity(1): | 11.4% | ||||
| Seasoning: | 0 months | UW NCF DSCR(1): | 3.00x | ||||
| Prepayment Provisions(3): | LO(11); YM1(13); DEF/YM1(89); O(7) | Most Recent NOI: | $37,344,275 (12/31/2017) | ||||
| Lockbox/Cash Mgmt Status: | Soft/Springing | 2ndMost Recent NOI: | $37,666,095 (12/31/2016) | ||||
| Additional Debt Type(1)(4): | Pari Passu/Subordinate Debt | 3rdMost Recent NOI: | $36,828,305 (12/31/2015) | ||||
| Additional Debt Balance(1)(4): | $302,500,000/$220,000,000 | Most Recent Occupancy(6): | 96.7% (1/25/2018) | ||||
| Future Debt Permitted (Type): | No (N/A) | 2ndMost Recent Occupancy(6): | 95.8% (12/31/2016) | ||||
| Reserves(5) | 3rdMost Recent Occupancy(6): | 97.1% (12/31/2015) | |||||
| Type | Initial | Monthly | Cap | Appraised Value (as of): | $868,800,000 (2/1/2018) | ||
| RE Tax: | $0 | Springing | N/A | Cut-off Date LTV Ratio(1): | 38.0% | ||
| Insurance: | $0 | Springing | N/A | Maturity Date LTV Ratio(1): | 38.0% | ||
| Recurring Replacements: | $0 | Springing | N/A | ||||
Sources and Uses
| ||||||
| Sources | Proceeds | % of Total | Uses | Proceeds | % of Total | |
| Loan Amount: | $550,000,000 | 100.0% | Loan Payoff: | $325,000,000 | 59.1% | |
| Return of Equity: | $208,395,272 | 37.9% | ||||
| Closing Costs: | $16,604,728 | 3.0% | ||||
| Total Sources: | $550,000,000 | 100.0% | Total Uses: | $550,000,000 | 100.0% | |
| (1) | The Gateway Mortgage Loan (as defined below) is part of The Gateway Whole Loan (as defined below), which is comprised of fourpari passusenior promissory notes with an aggregate original principal balance of $330,000,000 (“The Gateway Senior Notes”) and six subordinate promissory notes (fourpari passuB-Notes and twopari passuC-Notes) with an aggregate original principal balance of $220,000,000 (“The Gateway Subordinate Companion Loans”). The Cut-off Date Balance per Unit, Maturity Date Balance per Unit, UW NOI Debt Yield, UW NOI Debt Yield at Maturity, UW NCF DSCR, Cut-off Date LTV Ratio and Maturity Date LTV Ratio numbers presented above are based on the aggregate principal balance of the promissory notes comprising The Gateway Senior Notes, without regard to The Gateway Subordinate Companion Loans. The Cut-off Date Balance per Unit, Maturity Date Balance per Unit, UW NOI Debt Yield, UW NOI Debt Yield at Maturity, UW NCF DSCR, Cut-off Date LTV Ratio and Maturity Date LTV Ratio numbers based on The Gateway Whole Loan aggregate principal balance of $550,000,000 are $438,596, $438,596, 6.8%, 6.8%, 1.62x, 63.3% and 63.3%, respectively. |
| (2) | There is no non-recourse carve-out guarantor for The Gateway Whole Loan and no environmental indemnitor other than The Gateway Borrower. |
| (3) | Prior to the open prepayment date of October 6, 2027, The Gateway Whole Loan may be, (a) defeased in whole, but not in part, at any time after the earlier of (i) March 16, 2021, or (ii) two years from the closing date of the securitization that includes the lastpari passupromissory note of The Gateway Senior Notes to be securitized (the assumed lockout period of 24 payments is based on the closing date of this transaction in April 2018) or (b) prepaid in whole, but not in part, on and after April 6, 2019 with payment of the greater of 1% of the amount prepaid or a yield maintenance premium. |
| (4) | See “The Mortgage Loan” and “Additional Secured Indebtedness (not including trade debts)” below for a discussion of additional debt. |
| (5) | See “Escrows and Reserves” below for further discussion of reserve requirements. |
| (6) | The Gateway Property (as defined below) also includes 61,989 SF of ground floor commercial space which is not included in the unit count or occupancy figures. |
The Mortgage Loan. The tenth largest mortgage loan (“The Gateway Mortgage Loan”) is part of a whole loan (“The Gateway Whole Loan”) in the aggregate original principal amount of $550,000,000. The Gateway Whole Loan is secured by a first priority fee mortgage encumbering a residential community totaling 1,254 high-rise rent-controlled units, 58 low-rise townhouse rent-controlled units, 61,989 SF of commercial space, and 916 garage parking spaces located in San Francisco, California (“The Gateway Property”). The Gateway Whole Loan was co-originated by Deutsche Bank AG, New York Branch (“DBNY”) and Bank of America, N.A. (“BANA”). The Gateway Whole Loan is comprised of (i) four seniorpari passu promissory notes with an original aggregate principal balance of $330,000,000 (Notes A-1-A, A-1-B, A-2-A and A-2-B, collectively, “The Gateway Senior Notes”), (ii) four subordinatepari passu B-Notes with an original aggregate principal balance of $105,000,000 (Notes B-1-A, B-1-B, B-2-A and B-2-B, collectively, “The Gateway B-Notes”) that are subordinate to The Gateway Senior Notes, and (iii) two subordinatepari passu C-Notes with an original aggregate principal balance of $115,000,000 (Notes C-1 and C-2, collectively, “The Gateway C-Notes”) that are subordinate to both The Gateway Senior Notes and The Gateway B-Notes (and together with The Gateway B-Notes, “The Gateway Subordinate Companion Loans”). Promissory Note A-2-A, which is being contributed by BANA in the original principal amount of $27,500,000, represents The Gateway Mortgage Loan and will be included in the BANK 2018-BNK11 securitization trust. The remaining Gateway Senior Notes, evidenced by Notes A-1-A, A-1-B and A-2-B (collectively, “The Gateway Pari Passu Senior Companion Loans”), are currently held by DBNY and BANA and are expected to be contributed to one or more future securitization trusts or otherwise sold. The Gateway Subordinate Companion loans have been sold as described in the table below. The Gateway Whole Loan will initially be
This is not a research report and was not prepared by any Underwriter’s research department. Please see additional important information and qualifications at the end of this Term Sheet. |
| T-116 |
| BANK 2018-BNK11 | The Gateway |
serviced pursuant to the pooling and servicing agreement for the BANK 2018-BNK11 securitization trust, and from and after the securitization of Note A-1-A will be serviced pursuant to the pooling and servicing agreement for the securitization trust to which Note A-1-A is contributed. See “Description of the Mortgage Pool—The Whole Loans—The Gateway Pari Passu - A/B Whole Loan” and “Pooling and Servicing Agreement” in the Preliminary Prospectus.
Proceeds from The Gateway Whole Loan were used to pay off the existing debt of $325,000,000 that was securitized in two deals by Freddie Mac in 2013, FREMF 2013-K33 and FREMF 2013-K34.
| The Gateway Whole Loan Summary | ||||
| Notes | Original Balance | Cut-off Date Balance | Note Holder | Control Notes(1) |
| Note A-1-A | $197,500,000 | $197,500,000 | DBNY | No(2) |
| Note A-1-B | $50,000,000 | $50,000,000 | DBNY | No |
| Note A-2-A | $27,500,000 | $27,500,000 | BANK 2018-BNK11 | No |
| Note A-2-B | $55,000,000 | $55,000,000 | BANA | No |
| Note B-1-A | $39,375,000 | $39,375,000 | Prima Mortgage Investment Trust, LLC | No |
| Note B-1-B | $39,375,000 | $39,375,000 | New York State Teachers’ Retirement System | No |
| Note B-2-A | $13,125,000 | $13,125,000 | Prima Mortgage Investment Trust, LLC | No |
| Note B-2-B | $13,125,000 | $13,125,000 | New York State Teachers’ Retirement System | No |
| Note C-1 | $86,250,000 | $86,250,000 | Teachers Insurance and Annuity Association of America | Yes |
| Note C-2 | $28,750,000 | $28,750,000 | Teachers Insurance and Annuity Association of America | Yes |
| Total | $550,000,000 | $550,000,000 | ||
| (1) | The majority holder of The Gateway C Notes (by principal balance) will have certain control rights with respect to The Gateway Whole Loan and the right to appoint the special servicer with respect to The Gateway Whole Loan;provided that after a control appraisal period exists with respect to The Gateway C Notes, then the majority holder of The Gateway B Notes will have such rights and after a control appraisal period exists with respect to The Gateway B Notes, then the directing certificateholder with respect to the securitization trust holding the Note A-1-A will have such rights. |
| (2) | Note A-1-A is currently being held by DBNY and is expected to be contributed to a future securitization trust, at which time servicing of The Gateway Whole Loan will shift to such securitization trust. |
The Borrower and Sponsors. The borrower is Golden Gateway Center SPE, LLC, a single purpose Delaware limited liability company with two independent directors (“The Gateway Borrower”). The Gateway Borrower is indirectly owned by three general partners: Prime Property Fund II, L.P., an entity of the Prime Group; CM Golden Gate, Inc., an entity of CM Capital Corporation; and Oakhill Gateway Partners, L.P., an entity of Oak Hill Investments, Inc., (together, The Gateway Mortgage Loan sponsors) each owning approximately 23.9% of The Gateway Borrower, and a group of limited partners with no individual limited partner owning more than 13.8%. There is no non-recourse carve-out guarantor for The Gateway Whole Loan and no environmental indemnitor other than The Gateway Borrower.
Prime Group is a real estate platform that owns and manages over $7 billion in assets nationwide. Its subsidiary, Prime Residential, is a large owner of, multifamily rental communities with more than 16,000 residential units in its portfolio. CM Capital Corporation is based in Palo Alto, California, and is an investor in real estate and alternative asset classes. Oak Hill Investments, Inc. acts as managing general partner and has served in this capacity since 1992, overseeing day-to-day operations of The Gateway Property.
The Property.The Gateway Property is a “Class A” rent-controlled residential community situated on over 7.7-acres and encompassing four full city blocks in San Francisco, California. The Gateway Property was constructed in two phases from 1965 to 1967 and contains 940,823 SF of rentable living area across 1,254 apartment units in four high-rise buildings and 58 townhouse units in 19 low-rise buildings. The high-rise buildings are comprised of two 22-story structures and two 25-story structures. The low-rise buildings are each two stories and are interspersed among outdoor plazas and pedestrian walkways. The Gateway Property includes subterranean parking garages providing 884 vehicle spaces and 32 motorcycle stalls (0.73 spaces per unit (including motorcycle parking)) and includes a dedicated 1.665-acre park parcel known as Sydney G. Walton Square, which connects to the main portion of The Gateway Property via a sky bridge. The park parcel is required to remain a green belt and is prohibited from any development.
The Gateway Property also features 61,989 SF of ground floor commercial space, which commercial component contributed approximately 4.0% of the 2017 effective gross income at The Gateway Property. As of January 25, 2018, the commercial space was 88.6% leased to 14 tenants at a weighted average base rent of $34.33 PSF. The commercial tenants include Safeway Stores, Inc., which is the San Francisco Financial District’s only full service grocery store, national tenants including Bank of America, Baskin Robbins and Starbucks, and a collection of smaller local tenants including a dentist’s office, cleaners and beauty salon as well as a fitness center operated by an affiliate of The Gateway Borrower.
The Gateway Property offers its tenants controlled access, on-site maintenance and property management, attended security desks in each lobby, video surveillance in common areas, a landscaped courtyard and sundeck, bike racks, storage and parking for rental, as well as discounted fees for access to the on-site fitness center, swim and tennis club. The high rise apartments feature laundry on each floor. The townhome units offer two to four bedroom units, each with a fireplace and raised skylight above the bathrooms. Every unit features a balcony or patio space and a majority of the units have unobstructed city or water views of the San Francisco Bay. Over the past six years, The Gateway Borrower has invested over $21.5 million ($15,000/unit) on exterior, common areas and interior unit renovations. Currently, the common area hallways of the tower buildings are in the process of being replaced, with two of the four towers completed to date.
The residential component at The Gateway Property was 96.7% occupied as of January 25, 2018. The Gateway Property has averaged a 97.0% occupancy rate over the last 15 years and has experienced revenue growth, averaging 4.3% during that same span, despite being subject to San Francisco’s rent control ordinance. The rent control ordinance does not limit the starting rent on any new lease, but limits any rental increase that a landlord can charge to 60.0% of the annual increase in the consumer price index. There are no low income units at The Gateway Property.
This is not a research report and was not prepared by any Underwriter’s research department. Please see additional important information and qualifications at the end of this Term Sheet. |
| T-117 |
| BANK 2018-BNK11 | The Gateway |
The table below shows the apartment unit mix at The Gateway Property:
| The Gateway Apartment Unit Mix | |||||||||||
| Unit Type | Units | Occupied Units | % Occupied | Average Unit Size (SF) | Total Unit Size (SF) | Average Monthly In-Place Rent per Unit | Average Monthly Asking Rent per Unit | Market Monthly Rent per Unit | Average Monthly In-Place Rent PSF | Average Monthly Asking Rent PSF | Market Monthly Rent PSF |
| Studio | 391 | 380 | 97.2% | 541 | 211,682 | $2,477 | $3,124 | $3,000 | $4.58 | $5.77 | $5.55 |
| 1BD/1BA | 530 | 522 | 98.5% | 718 | 380,654 | $2,832 | $3,475 | $3,300 | $3.94 | $4.84 | $4.60 |
| 2BD/1BA | 159 | 152 | 95.6% | 908 | 144,383 | $3,501 | $4,453 | $4,250 | $3.86 | $4.90 | $4.68 |
| 2BD/2BA | 104 | 98 | 94.2% | 972 | 101,060 | $3,989 | $5,011 | $4,900 | $4.10 | $5.16 | $5.04 |
| 2BD/2BA PH | 4 | 4 | 100.0% | 1,498 | 5,991 | $6,132 | $7,472 | $7,500 | $4.09 | $4.99 | $5.01 |
| 2BD/2.5BA TH | 34 | 32 | 94.1% | 1,396 | 47,470 | $4,491 | $5,789 | $5,900 | $3.22 | $4.15 | $4.23 |
| 3BD/2BA | 4 | 4 | 100.0% | 1,272 | 5,086 | $4,386 | $5,684 | $5,700 | $3.45 | $4.47 | $4.48 |
| 3BD/2BA PH | 4 | 4 | 100.0% | 1,701 | 6,803 | $5,187 | $5,728 | $5,850 | $3.05 | $3.37 | $3.44 |
| 3BD/2.5BA TH | 20 | 20 | 100.0% | 1,533 | 30,650 | $7,552 | $8,285 | $8,450 | $4.93 | $5.40 | $5.51 |
| 4BD/2.5BA TH | 4 | 4 | 100.0% | 1,761 | 7,044 | $6,366 | $6,698 | $6,700 | $3.62 | $3.80 | $3.80 |
| Total/Wtd. Avg. | 1,254 | 1,220 | 97.4%(1) | 750 | 940,823 | $3,023 | $3,761 | $3,652 | $4.03 | $5.01 | $4.87 |
Source: Appraisal
| (1) | The Gateway Property was 96.7% occupied as of January 25, 2018, based on the 1,254 available residential units. |
The Market.The Gateway Property’s primary address is 460 Davis Court in San Francisco, California in the Northeast Waterfront area of the city, just southwest of The Embarcadero, north of the Downtown Financial District and east of the Jackson Square District. The Gateway Property is bound by Battery Street to the west, Drumm Street to the east, Jackson Street to the north and Washington Street to the south. The Gateway Property is accessible from San Francisco’s Bay Bridge, San Francisco International Airport, the Golden Gate Bridge and AT&T Park, home of the San Francisco Giants. There are many forms of public transportation within walking distance of The Gateway Property including the BART (Bay Area Rapid Transit), MUNI Metro, AC Transit and CalTrain.
San Francisco employers include various technology companies. In early 2016, Apple opened an office in the South Financial District with approximately 500 employees. At the end of 2016, the IBM Watson group opened a South Financial District office employing several hundred workers. Salesforce employs more than 6,600 workers in San Francisco, growing by 12% in 2016 to become the city’s second-largest employer behind Wells Fargo with approximately 8,200 in its San Francisco workforce. Uber has also been increasing its presence in the city increasing its employee base to 3,600 in January 2017, up from 2,000 a year earlier. San Francisco benefits from its proximity to higher learning institutions such as Stanford University (12,973 employees) and University of San Francisco (8,800 employees) approximately 36 miles and 4 miles, respectively, from The Gateway Property. The 2017 population within a one-, three- and five-mile radius of The Gateway Property was 63,096, 342,432 and 605,258, respectively. The 2017 estimated average household income within a one-, three- and five-mile radius of The Gateway Property was $117,355, $123,267 and $127,739, respectively.
The Gateway Property is located in the Russian Hill / Embarcadero submarket within the greater San Francisco multifamily market, located on the Northeast point of the San Francisco peninsula. The submarket is bound by California Street to the south, Polk Street to the west and extends to the San Francisco Bay in the north and east. According to the appraisal, the 9,853-unit submarket had a vacancy rate of 4.3% in the fourth quarter of 2017, with an average asking rent of $3,313 per unit, down 4.4% and up 0.2% from the third quarter 2017, respectively. The Gateway Property is also located in the San Francisco Downtown North Submarket within the greater San Francisco retail market. According to the appraisal, the 2,926,371 square foot retail submarket had a vacancy rate of 6.1% in the fourth quarter of 2017 with average asking rents of $55.83 per square foot (NNN) up from $55.33 in the third quarter of 2017.
The appraiser did not note any new supply recently completed or under construction that will be directly competitive with The Gateway Property.
This is not a research report and was not prepared by any Underwriter’s research department. Please see additional important information and qualifications at the end of this Term Sheet. |
| T-118 |
| BANK 2018-BNK11 | The Gateway |
Comparable rental properties to The Gateway Property are shown in the table below:
| Comparable Rental Properties | |||||||
| Property, Address | Year Built / Renovated | # Units | Occupancy | Average Unit Size (SF) | Average Monthly In-Place Rent per Unit | Average Monthly In-Place Rent PSF | Distance |
The Gateway 460 Davis Court(1), San Francisco, CA | 1965 – 1967 / 2010 – 2018 | 1,254 | 96.7%(2) | 750 | $3,023 | $4.03 | N/A |
Filmore Center 1475 Filmore Street, San Francisco, CA | 1989 | 1,114 | 97% | 753 | $3,123 | $4.15 | 2.0 Mi W |
Rincon Green Apartments 333 Harrison Street, San Francisco, CA | 2013 | 326 | 97% | 598 | $3,459 | $5.78 | 0.7 Mi S |
Carmel Rincon 88 Howard Street, San Francisco, CA | 1989 | 320 | 94% | 711 | $3,869 | $5.44 | 0.3 Mi S |
388 Beale Apartments 388 Beale Street, San Francisco, CA | 2000 | 226 | 95% | 1,111 | $4,850 | $4.36 | 0.7 Mi S |
Bayside Village 580 Beal Street, San Francisco, CA | 1988 | 862 | 97% | 767 | $3,357 | $4.37 | 1.0 Mi S |
Soma Square 1 St. Francis Place, San Francisco, CA | 1985 | 410 | 97% | 787 | $3,834 | $4.87 | 0.9 Mi S |
The Paramount 680 Mission Street, San Francisco, CA | 2001 | 486 | 97% | 797 | $4,450 | $5.58 | 0.7 Mi S |
NorthPoint 2211 Stockton Street, San Francisco, CA | 1967 | 514 | 99% | 672 | $2,716 | $4.04 | 1.0 Mi NW |
| Total/Wtd. Avg.(3) | 4,258 | 97% | 758 | $3,515 | $4.65 | ||
Source: Appraisal.
| (1) | The address above represents The Gateway Property’s primary address. The full address for The Gateway Property is “550/560 Battery Street, 440 Davis Court/100 Washington Street, 155 Jackson Street, 405 Davis Court, 200 Washington Street, 99 Jackson Street, 1-9 Boston Ship Plaza, 10-13 & 25-38 Hinckley Walk, 14-24 Whaleship Plaza and 39-58 Ironship Plaza”. |
| (2) | The Gateway Property was 96.7% occupied as of January 25, 2018, based on the 1,254 available residential units. |
| (3) | Total/Wtd. Avg. statistics exclude The Gateway Property. |
Operating History Underwritten Net Cash Flow.The following table presents certain information relating to the historical operating performance and Underwritten Net Cash Flow at The Gateway Property:
| Cash Flow Analysis | |||||||
| 2013 | 2014 | 2015 | 2016 | 2017 | UW | UW per Unit(1) | |
| Base Rent | $37,937,500(2) | $41,175,884 | $43,308,092 | $44,970,891 | $45,503,069 | $45,888,155 | $36,593 |
| Commercial Income | $1,800,200 | $1,871,377 | $2,004,157 | $2,023,910 | $1,935,551 | $1,935,551 | $1,544 |
| Parking | $1,964,400 | $2,019,443 | $2,038,759 | $2,002,455 | $1,898,201 | $1,898,201 | $1,514 |
| Other Income(3) | $1,204,100 | $1,254,913 | $1,393,330 | $1,376,571 | $1,415,608 | $1,415,608 | $1,129 |
| Less Vacancy & Credit Loss | $96,500(2) | $1,618,919 | $1,524,918 | $2,101,397 | $2,524,821 | $2,273,516 | $1,813 |
| Effective Gross Income | $42,809,700 | $44,702,698 | $47,219,420 | $48,272,429 | $48,227,609 | $48,863,999 | $38,967 |
| Total Operating Expenses | $10,274,300 | $10,237,030 | $10,391,115 | $10,606,334 | $10,883,334 | $11,209,094 | $8,939 |
| Net Operating Income | $32,535,400 | $34,465,668 | $36,828,305 | $37,666,095 | $37,344,275 | $37,654,905 | $30,028 |
| Capital Expenditures | $0 | $0 | $0 | $0 | $0 | $313,500 | $250 |
| Net Cash Flow | $32,535,400 | $34,465,668 | $36,828,305 | $37,666,095 | $37,344,275 | $37,341,405 | $29,778 |
| Occupancy %(1) | 97.4% | 97.1% | 97.1% | 95.8% | 96.7%(4) | 95.4% | |
| NOI DSCR(5) | 2.61x | 2.77x | 2.96x | 3.02x | 3.00x | 3.02x | |
| NCF DSCR(5) | 2.61x | 2.77x | 2.96x | 3.02x | 3.00x | 3.00x | |
| NOI Debt Yield(5) | 9.9% | 10.4% | 11.2% | 11.4% | 11.3% | 11.4% | |
| NCF Debt Yield(5) | 9.9% | 10.4% | 11.2% | 11.4% | 11.3% | 11.3% | |
| (1) | UW per Unit and Occupancy figures above are based on the 1,254 available residential units. |
| (2) | 2013 Base Rent is shown net of vacancy. Vacancy in 2013 was 2.6%. |
| (3) | Other Income includes utility reimbursements. |
| (4) | Occupancy as of January 25, 2018. |
| (5) | Debt service coverage ratios and debt yield figures are based on The Gateway Senior Notes and exclude The Gateway Subordinate Companion Loans. |
This is not a research report and was not prepared by any Underwriter’s research department. Please see additional important information and qualifications at the end of this Term Sheet. |
| T-119 |
| BANK 2018-BNK11 | The Gateway |
Escrows and Reserves. During the occurrence and continuance of an event of default, The Gateway Borrower is required to deposit monthly (i) 1/12 of the annual real estate taxes, (ii) 1/12 of the annual capital expenditures and (iii) 1/12 of the estimated annual insurance premiums (unless an acceptable blanket policy is in place), as estimated by the lender.
Lockbox and Cash Management. The Gateway Whole Loan documents require a soft lockbox for rents received from residential tenants and a hard lockbox for rents received from non-residential tenants which amounts are required to be transferred daily to The Gateway Borrower’s operating account unless an event of default has occurred and is continuing. Upon an event of default until the cure of the event of default, transfers to The Gateway Borrower’s operating account are required to cease and sums on deposit in the lockbox account are required to be swept daily into a lender-controlled cash management account and applied to payment of all monthly amounts due under The Gateway Whole Loan documents.
Additional Secured Indebtedness (not including trade debts). The Gateway Property also secures The Gateway Pari Passu Senior Companion Loans, in the aggregate original principal amount of $302,500,000 and The Gateway Subordinate Companion Loans in the aggregate original principal amount of $220,000,000. The Gateway Pari Passu Senior Companion Loans and The Gateway Subordinate Companion Loans are coterminous with The Gateway Mortgage Loan. The Gateway Pari Passu Senior Companion Loans accrue interest at the same rate as the Gateway Mortgage Loan. The Gateway B Notes accrue interest at the rate of 4.5000% per annum, and The Gateway C Notes accrue interest at the rate of 4.9300% per annum. The Gateway Mortgage Loan along with The Gateway Pari Passu Senior Companion Loans are eachpari passu in right of payment and together are senior in right of payment to The Gateway Subordinate Companion Loans. The holders of The Gateway Mortgage Loan, The Gateway Pari Passu Senior Companion Loans and The Gateway Subordinate Companion Loans have entered into a co-lender agreement which sets forth the allocation of collections on The Gateway Whole Loan. See “Description of the Mortgage Pool—The Whole Loans—The Gateway Pari Passu A/B Whole Loan” in the Preliminary Prospectus.
Mezzanine Loan and Preferred Equity.Not permitted.
Release of Property. Not permitted.
Substitution of Property.Not permitted.
Terrorism Insurance.The Gateway Borrower is required to maintain insurance coverage for perils and acts of terrorism in an amount equal to the full replacement cost of The Gateway Property (plus 24 months of rental loss and/or business interruption coverage plus an additional period of indemnity covering (i) the 12 months following restoration or (ii) the period of time until such income returns to the same level it was at prior to the loss, whichever occurs first),provided that the coverage is commercially available and if the Terrorism Risk Insurance Program Reauthorization Act of 2015 or extension thereof is not in effect, The Gateway Borrower will not be required to pay annual premiums in excess of two times the premium for a separate policy insuring The Gateway Property on a stand-alone basis. See “Risk Factors—Risks Relating to the Mortgage Loans—Terrorism Insurance May Not Be Available for All Mortgaged Properties” in the Preliminary Prospectus.
This is not a research report and was not prepared by any Underwriter’s research department. Please see additional important information and qualifications at the end of this Term Sheet. |
| T-120 |
(THIS PAGE INTENTIONALLY LEFT BLANK)
| T-121 |
| BANK 2018-BNK11 | One Lincoln Station |
| Mortgage Loan No. 11 – One Lincoln Station |
| Mortgage Loan Information | Mortgaged Property Information | ||||||
| Mortgage Loan Seller: | WFB | Single Asset/Portfolio: | Single Asset | ||||
| Original Balance: | $27,000,000 | Location: | Lone Tree, CO 80124 | ||||
| Cut-off Date Balance: | $27,000,000 | General Property Type: | Office | ||||
| % of Initial Pool Balance: | 3.9% | Detailed Property Type: | Suburban | ||||
| Loan Purpose: | Acquisition | Title Vesting: | Fee/Leasehold(6) | ||||
| Sponsor: | Brian E. Bergersen | Year Built/Renovated: | 2008/N/A | ||||
| Mortgage Rate: | 4.8050% | Size: | 147,184 SF | ||||
| Note Date: | 3/13/2018 | Cut-off Date Balance per SF: | $183 | ||||
| First Payment Date: | 5/11/2018 | Maturity Date Balance per SF: | $183 | ||||
| Maturity Date: | 4/11/2028 | Property Manager: | Westfield Property Services, LLC | ||||
| Original Term to Maturity: | 120 months | ||||||
| Original Amortization Term: | 0 months | ||||||
| IO Period: | 120 months | ||||||
| Seasoning: | 0 months | Underwriting and Financial Information | |||||
| Prepayment Provisions: | LO (24); DEF (92); O (4) | UW NOI(7): | $2,726,127 | ||||
| Lockbox/Cash Mgmt Status: | Springing/Springing | UW NOI Debt Yield: | 10.1% | ||||
| Additional Debt Type: | N/A | UW NOI Debt Yield at Maturity: | 10.1% | ||||
| Additional Debt Balance: | N/A | UW NCF DSCR: | 1.94x | ||||
| Future Debt Permitted (Type): | No (N/A) | Most Recent NOI (as of)(7): | $1,248,483 (12/31/2017) | ||||
| Reserves | 2nd Most Recent NOI (as of): | $1,053,938 (12/31/2016) | |||||
| Type | Initial | Monthly | Cap | 3rd Most Recent NOI(7): | N/A | ||
| RE Tax: | $95,672 | $95,672 | N/A | Most Recent Occupancy (as of)(8): | 97.1% (1/1/2018) | ||
| Insurance: | $0 | Springing(1) | N/A | 2nd Most Recent Occupancy (as of)(8): | 67.7% (12/31/2016) | ||
| Recurring Replacements: | $0 | $2,453(2) | $143,000(2) | 3rd Most Recent Occupancy (as of) : | 64.8% (12/31/2015) | ||
| TI/LC: | $0 | $12,265(3) | $425,000(3) | Appraised Value (as of): | $43,800,000 (1/4/2018) | ||
| Rent Concession: | $41,046(4) | $0 | N/A | Cut-off Date LTV Ratio: | 61.6% | ||
| Tenant Specific TI/LC: | $95,310(5) | $0 | N/A | Maturity Date LTV Ratio: | 61.6% | ||
Sources and Uses
| ||||||
| Sources | Proceeds | % of Total | Uses | Proceeds | % of Total | |
| Loan Amount: | $27,000,000 | 60.3% | Acquisition Price: | $43,750,000 | 97.7% | |
| Borrower Equity: | $17,788,092 | 39.7% | Closing Costs: | $806,064 | 1.8% | |
| Reserves: | $232,028 | 0.5% | ||||
| Total Sources: | $44,788,092 | 100.0% | Total Uses: | $44,788,092 | 100.0% | |
| (1) | The One Lincoln Station Mortgage Loan (as defined below) documents do not require ongoing monthly escrows for insurance premiums as long as (i) no event of default has occurred and is continuing; (ii) the One Lincoln Station Borrower (as defined below) provides the lender with evidence that the One Lincoln Station Property’s (as defined below) insurance coverage is included in a blanket policy and such policy is in full force and effect; and (iii) the One Lincoln Station Borrower pays all applicable insurance premiums and provides the lender with evidence of renewals. |
| (2) | Monthly impounds for ongoing recurring replacements are subject to cap of $143,000 so long as no event of default exists and the One Lincoln Station Property is adequately being maintained, as determined by the lender. |
| (3) | Monthly impounds for ongoing TI/LCs are subject to a cap of $425,000 so long as (i) no event of default exists; (ii) the One Lincoln Station Property maintains a minimum physical and economic occupancy of 90.0%; and (iii) the net cash flow debt yield is equal to or greater than 8.0%. |
| (4) | The rent concession reserve applies to existing leases related to the tenants Shea Homes, Cortland Partners and Upstream. |
| (5) | The tenant specific TI/LC applies to outstanding tenant improvements and leasing commissions related to the tenant Cortland Partners. |
| (6) | See “The Property” below. The One Lincoln Station Borrower’s interest in the parking structure adjacent to the office building is a ground leasehold interest. |
| (7) | See “Operating History and Underwritten Net Cash Flow” below for a discussion of the increase in UW NOI compared to Most Recent NOI. Historical financial information prior to 2016 is not available as the One Lincoln Station Borrower recently acquired the One Lincoln Station Property and such information was not provided by the seller. |
| (8) | The increase in occupancy from December 31, 2016 to January 1, 2018 was due to the following new tenants taking occupancy: Orbis Education (3,987 SF, 2.7% of NRA) took occupancy on May 1, 2017; Shea Homes (two spaces totaling 31,594 SF, 21.5% of NRA) took occupancy on August 25, 2017 and October 15, 2017; Cortland Partners (3,177 SF, 2.2% of NRA) took occupancy on October 1, 2017; and Upstream (4,538 SF, 3.1% of NRA) took occupancy on November 1, 2017. |
The Mortgage Loan. The eleventh largest mortgage loan (the “One Lincoln Station Mortgage Loan”) is evidenced by a promissory note in the original principal amount of $27,000,000 and secured by a first priority fee and leasehold mortgage encumbering a six-story, 147,184 SF Class A office building (the “One Lincoln Station Property”) located in Lone Tree, Colorado. The proceeds of the One Lincoln Station Mortgage Loan, together with approximately $17.8 million of borrower equity, were used to acquire the One Lincoln Station Property, fund reserves and pay closing costs.
The Borrowers and the Sponsor. The borrower comprises five tenants in common: OLS-Preston, LLC; OLS-Meadowstone, LLC; OLS-PPA, LLC; OLS-PPH, LLC; and OLS-1401, LLC (collectively the “One Lincoln Station Borrower”), each a single-purpose Delaware limited liability company. The borrower sponsor and non-recourse carve-out guarantor is Brian E. Bergersen, who has an ownership interest in the One Lincoln Station Borrower. Mr. Bergersen is the president and founder of Spectrum Properties, Ltd. (“Spectrum”). Since 1993, Spectrum has developed and managed over 345,000 SF of commercial, retail and office developments, 747 multifamily units and 570 independent senior living community units. In addition to the One Lincoln
This is not a research report and was not prepared by any Underwriter’s research department. Please see additional important information and qualifications at the end of this Term Sheet. |
| T-122 |
| BANK 2018-BNK11 | One Lincoln Station |
Station Property, Spectrum’s current commercial real estate portfolio includes three office properties in Illinois and Texas totaling 160,684 SF as well as three retail properties in Dallas, Texas.
The Property.The One Lincoln Station Property is a six-story, LEED certified Class A office building located in Lone Tree, Colorado, 17.0 miles southeast of the Denver central business district. Built in 2008 and situated on a 1.42-acre parcel, the One Lincoln Station Property contains amenities including conference rooms, a fitness center with locker rooms and showers, covered parking, 26 designated bicycle storage spaces and a large open outdoor plaza. The One Lincoln Station Property also features an energy efficient raised floor and underfloor air distribution system.
As of January 1, 2018, the One Lincoln Station Property was 97.1% occupied by eight tenants, including Nationwide Mutual Insurance Company (“Nationwide”; rated A1/A+ by Moody’s/S&P; 52.8% of NRA; 53.7% of underwritten rent). The One Lincoln Station Property was previously 100.0% occupied by Dex Media, which vacated the building in the first quarter of 2014 after filing for bankruptcy. In November 2014, Nationwide signed a lease and subsequently took occupancy in August 2015. Since Nationwide took occupancy at the One Lincoln Station Property, seven tenants totaling approximately 65,275 SF (44.3% of NRA, 46.3% of underwritten rent) have taken occupancy. The second largest tenant, Shea Homes, took occupancy at the One Lincoln Station Property in August 2017.
In total, the One Lincoln Station Property has access rights to 702 parking spaces, resulting in a parking ratio of 4.8 spaces per 1,000 SF of rentable area. The One Lincoln Station Borrower owns a 50% interest in the condominium regime of a parking structure known as the South Parking Structure (immediately south of the One Lincoln Station Property) in which the One Lincoln Station Property is allocated 195 parking spaces. In addition, the One Lincoln Station Property includes a 14.74% leasehold ownership interest in a parking garage known as the Lincoln Station RTD Parking Garage (immediately north of the One Lincoln Station Property), which is subject to a two-unit condominium regime in which the One Lincoln Station Borrower owns one unit, in which the One Lincoln Station Property is allocated 273 parking spaces. The lessor under the Lincoln Station RTD Parking Garage ground lease is Regional Transportation District, and the initial lease expiration is in March 2106. Additionally, there are 88 parking spaces below the One Lincoln Station Property and The One Lincoln Station Borrower licenses an additional 146 parking spaces within the Lincoln Station RTD Parking Garage. See “Risk Factors—Risks Relating to the Mortgage Loans—Condominium Ownership May Limit Use and Improvements”in the Preliminary Prospectus.
Major Tenants.
Nationwide (77,690 SF, 52.8% of NRA, 53.7% of underwritten rent, lease expires 1/31/2023). Nationwide (rated A1 and A+ by Moody’s and S&P, respectively) is an insurance and financial services company. Founded in 1926, Nationwide evolved from a regional auto insurer to a Fortune 100 company that offers a full range of insurance and financial services across the country and focuses on domestic property and casualty insurance, life insurance and retirement savings, asset management and strategic investments. As of December 31, 2016, Nationwide reported approximately $43.0 billion in total sales and $209.8 billion in total assets. The One Lincoln Station Property serves as a regional headquarters for Nationwide. Nationwide has over 450 employees at the One Lincoln Station Property.
Shea Homes (31,594 SF, 21.5% of NRA, 21.8% of underwritten rent, lease expires 8/24/2027). Founded in 1881, Shea Homes has built homes and master-planned communities for more than 105,000 families across the country. Shea Homes designs, builds and markets single-family detached and attached homes in various geographic markets in California, Arizona, Colorado, Washington, Nevada, Florida, Virginia, North Carolina and Texas. The One Lincoln Station Property serves as one of nine offices for Shea Homes in the country. As of December 31, 2017, Shea Homes had approximately 836 employees and, in 2017, Shea Homes delivered approximately 2,350 homes. Shea Homes has a lease contraction option in October 2019 for approximately 5,891 SF on the 5th floor. In addition, Shea Homes has a lease termination option in February 2025 for its space on both the 5th (5,891 SF) and 6th floor (25,703 SF). In order to exercise the 6th floor termination option, Shea Homes must provide the One Lincoln Station Borrower with 270 days’ notice and payment of a termination fee equal to unamortized leasing costs, abated base rent and three months of additional base rent. In order to exercise the 5th floor contraction or termination option, Shea Homes must provide the One Lincoln Station Borrower with 270 days’ notice and payment of a termination fee equal to unamortized leasing costs and abated base rent. Shea Homes has a total of $27,246 of free rent through July 11, 2018, which was reserved for at loan origination.
This is not a research report and was not prepared by any Underwriter’s research department. Please see additional important information and qualifications at the end of this Term Sheet. |
| T-123 |
| BANK 2018-BNK11 | One Lincoln Station |
The following table presents certain information relating to the leases at the One Lincoln Station Property:
| Tenant Summary(1) | |||||||
| Tenant Name | Credit Rating (Fitch/Moody's/S&P)(2) | Tenant SF | Approximate % of SF | Annual UW Rent(3) | % of Total Annual UW Rent | Annual UW Rent PSF(3) | Lease Expiration |
| Major Tenant | |||||||
| Nationwide | NR/A1/A+ | 77,690 | 52.8% | $1,476,110(4) | 53.7% | $19.00(4) | 1/31/2023(5) |
| Shea Homes | NR/B1/B+ | 31,594 | 21.5% | $600,286 | 21.8% | $19.00 | 8/24/2027(6)(7) |
| Crestone Holdings | NR/NR/NR | 13,710 | 9.3% | $278,998 | 10.1% | $20.35 | 2/28/2023(8) |
| Upstream | NR/NR/NR | 4,538 | 3.1% | $86,222 | 3.1% | $19.00 | 4/30/2025(9) |
| Alta Trust | NR/NR/NR | 4,323 | 2.9% | $88,621 | 3.2% | $20.50 | 12/31/2023(10) |
| Subtotal/Wtd. Avg. | 131,855 | 89.6% | $2,530,238 | 92.0% | $19.19 | ||
| Other Tenants | 11,110 | 7.5% | $218,628 | 8.0% | $19.68 | ||
| Vacant Space | 4,219 | 2.9% | $0 | 0.0% | $0.00 | ||
| Total/Wtd. Avg. | 147,184 | 100.0% | $2,748,866 | 100.0% | $19.23 | ||
| (1) | Information is based on the underwritten rent roll. |
| (2) | Certain ratings are those of the parent company whether or not the parent guarantees the lease. |
| (3) | Wtd. Avg. Annual UW Rent PSF excludes vacant space. |
| (4) | Nationwide’s Annual UW Rent and Annual UW Rent PSF are based on the tenant’s average rental rate over the lease term. Nationwide currently pays rent of $18.00 PSF. |
| (5) | Nationwide has two, five-year extension options, with at least 12 months’ notice, at fair market rental rate as determined in the lease. |
| (6) | Shea Homes has a total of $27,246 of free rent through July 11, 2018, which was reserved for at loan origination (see “Escrows and Reserves” below). Shea Homes has two, five-year extension options, with at least nine months’ notice, at fair market rental rate as determined in the lease. |
| (7) | Shea Homes has a lease contraction option in October 2019 for approximately 5,891 SF on the 5th floor. In addition, Shea Homes has a lease termination option in February 2025 for its space on both the 5th (5,891 SF) and 6th floor (25,703 SF). In order to exercise either option, Shea Homes must, with respect to the 6th floor, provide 270 days’ notice and payment of a termination fee equal to unamortized leasing costs, abated base rent and three months of additional base rent and, with respect to the 5th floor, 270 days’ notice and payment of a termination fee equal to unamortized leasing costs and abated base rent. |
| (8) | Crestone Holdings has two, five-year extension options, with at least nine months’ notice, at fair market rental rate as determined in the lease. Crestone Holdings is in a free rent period for 3,854 square feet of their space until May 1, 2018. |
| (9) | Upstream has one, five-year extension option, with at least nine months’ notice, at fair market rental rate as determined in the lease. |
| (10) | Alta Trust has one, three-year extension option, with at least 12 months’ notice, at fair market rental rate as determined in the lease. |
The following table presents certain information relating to the lease rollover schedule at the One Lincoln Station Property:
| Lease Rollover Schedule(1)(2) | ||||||||
| Year | # of Leases Rolling | SF | UW Rent PSF Rolling(3) | % of Total SF Rolling | Cumulative % of SF Rolling | Total UW Rent Rolling | Approx. % of Total Rent Rolling | Approx. Cumulative % |
| MTM | 0 | 0 | $0.00 | 0.0% | 0.0% | $0 | 0.0% | 0.0% |
| 2018 | 0 | 0 | $0.00 | 0.0% | 0.0% | $0 | 0.0% | 0.0% |
| 2019 | 0 | 0 | $0.00 | 0.0% | 0.0% | $0 | 0.0% | 0.0% |
| 2020 | 0 | 0 | $0.00 | 0.0% | 0.0% | $0 | 0.0% | 0.0% |
| 2021 | 1 | 3,946 | $19.75 | 2.7% | 2.7% | $77,933 | 2.8% | 2.8% |
| 2022 | 1 | 3,987 | $19.75 | 2.7% | 5.4% | $78,743 | 2.9% | 5.7% |
| 2023 | 4 | 98,900 | $19.27 | 67.2% | 72.6% | $1,905,681 | 69.3% | 75.0% |
| 2024 | 0 | 0 | $0.00 | 0.0% | 72.6% | $0 | 0.0% | 75.0% |
| 2025 | 1 | 4,538 | $19.00 | 3.1% | 75.7% | $86,222 | 3.1% | 78.2% |
| 2026 | 0 | 0 | $0.00 | 0.0% | 75.7% | $0 | 0.0% | 78.2% |
| 2027 | 1 | 31,594 | $19.00 | 21.5% | 97.1% | $600,286 | 21.8% | 100.0% |
| 2028 | 0 | 0 | $0.00 | 0.0% | 97.1% | $0 | 0.0% | 100.0% |
| 2029 & Beyond | 0 | 0 | $0.00 | 0.0% | 97.1% | $0 | 0.0% | 100.0% |
| Vacant | 0 | 4,219 | $0.00 | 2.9% | 100.0% | $0 | 0.0% | 100.0% |
| Total/Weighted Average | 8 | 147,184 | $19.23 | 100.0% | $2,748,866 | 100.0% | ||
| (1) | Information is based on the underwritten rent roll. |
| (2) | Certain tenants may have lease termination options that are exercisable prior to the originally stated expiration date of the subject lease and that are not considered in the lease rollover schedule. |
| (3) | Total Wtd. Avg. Annual UW Rent PSF Rolling excludes vacant space. |
This is not a research report and was not prepared by any Underwriter’s research department. Please see additional important information and qualifications at the end of this Term Sheet. |
| T-124 |
| BANK 2018-BNK11 | One Lincoln Station |
The Market. The One Lincoln Station Property is located in Lone Tree, Colorado, situated immediately adjacent to Interstate 25, approximately 1.5 miles northwest of US-87, approximately 2.7 miles south of the intersection of Interstates 25 and Colorado Highway 470 and approximately 17.0 miles southeast of the Denver central business district. The One Lincoln Station Property is immediately adjacent to the Lincoln Station RTD light rail station, which provides direct access to downtown Denver and Denver International Airport. The RTD rail system operates 365 days a year and services 53 stations with ten lines along Denver’s north, east, southeast, southwest and west rail corridors. The One Lincoln Station Property is proximate to over 9.0 million SF of retail, shopping, restaurants and entertainment options. The Park Meadows Mall, the second largest mall in Colorado with approximately 1.5 million SF, is located approximately 2.0 miles north of the One Lincoln Station Property and attracts over 9.0 million visitors each year. The City of Lone Tree has created the Lone Tree Link, which offers free shuttle rides during normal business hours to various destinations within the city, including Parkridge Corporate Center and Sky Ridge Medical Center. The One Lincoln Station Property is immediately adjacent to a shuttle stop. A separate program, Link on Demand offers free door-to-door on-demand rides within the city limits via the Uber app.
The One Lincoln Station Property is also situated approximately 3.0 miles southwest of the Vallagio at Inverness, one of Denver’s largest mixed-use transit oriented developments which features residences, shops, businesses and restaurants including Street Kitchen Asian Bistro, Marco’s Coal Fired Pizzeria, Russo’s Kitchen + Tavern and Amore Vino. According to the appraisal, the 2017 population within a one-, three- and five-mile radius of the One Lincoln Station Property was 7,578, 53,645 and 197,008, respectively. The 2017 average household income within the same radii was $137,275, $136,595 and $133,189, respectively.
According to a third party market research report, as of the fourth quarter of 2017, the Lone Tree Class A submarket reported a total inventory of approximately 2.3 million SF of office space with a 4.7% vacancy rate. The appraiser identified seven comparable office properties totaling approximately 2.4 million SF with an average occupancy rate of 96.6%, and concluded to an average market rent at the One Lincoln Station Property of $20.50 per square foot, triple net.
The following table presents recent leasing data at comparable office properties with respect to the One Lincoln Station Property:
| Comparable Lease Summary | ||||||||
| Property Name/Address | Year Built/ Renovated | Size (SF) | Tenant Name | Lease Size (SF) | Lease Date | Lease Term (Yrs.) | Rent/SF | Lease Type |
One Lincoln Station Property 9380 Station Street Lone Tree, Colorado | 2008/N/A | 147,184 | Nationwide | 77,690 | August 2015 | 7.3 | $18.00 | NNN |
Village Center Station II 6370 South Fiddlers Green Circle Greenwood Village, Colorado | 2018/N/A | 324,185 | Charter Communications | 324,185 | February 2018 | 10.0 | $23.00 | NNN |
Panorama Corporate Center SWC of I-25 and East Dry Creek Road Englewood, Colorado | 1996/2000 | 814,931 | Various(1) | 24,389 - 144,096 | June 2016 – Nov. 2016 | 10.0 -12.0 | $18.50 – $19.00 | NNN |
Park Ridge Four 10375 Park Meadows Drive Lone Tree, Colorado | 2001/N/A | 192,359 | Quoted | N/A | N/A | N/A | $17.00-18.50 | N/A |
CH2M Global Headquarters 9189, 9191, 9193 South Jamaica St. Englewood, Colorado | 2002/N/A | 370,485 | CH2M Hill, Inc. | 370,485 | January 2016 | 16.8 | $19.75 | NNN |
INOVA 1 7250 South Havana Street Centennial, Colorado | 2016/N/A | 211,578 | Comcast | 211,578 | March 2017 | 10.6 | $20.00 | NNN |
CoBank Center 6340 S. Fiddlers Green Circle Greenwood Village, Colorado | 2015/N/A | 274,287 | CoBank | 274,287 | December 2015 | 15.0 | $21.72 | NNN |
The Arrow Building 9151 East Panorama Circle Englewood, Colorado | 2017/N/A | 223,177 | Arrow Electronics | 223,177 | May 2017 | 15.0 | $21.90 | NNN |
Source:Appraisal
| (1) | The appraiser provided three comparable leases for the Panorama Corporate Center. The information shown represents the ranges of such leases. |
This is not a research report and was not prepared by any Underwriter’s research department. Please see additional important information and qualifications at the end of this Term Sheet. |
| T-125 |
| BANK 2018-BNK11 | One Lincoln Station |
Operating History and Underwritten Net Cash Flow.The following table presents certain information relating to the operating history and underwritten net cash flow at the One Lincoln Station Property:
| Cash Flow Analysis(1) | |||||||||
| 2016 | 2017 | UW | UW PSF | ||||||
| Base Rent | $1,374,917 | $1,694,702(2) | $2,748,866(3) | $18.68 | |||||
| Gross Up Vacant Space | $0 | $0 | $86,490 | $0.59 | |||||
| Total Recoveries | $921,139 | $1,516,517 | $2,089,248 | $14.19 | |||||
| Parking Income | $3,458 | $21,407 | $67,500 | $0.46 | |||||
| Other Income | $73,969 | $77,063 | $75,000 | $0.51 | |||||
| Less Vacancy & Credit Loss | $0 | $0 | ($141,768)(4) | ($0.96) | |||||
| Effective Gross Income | $2,373,484 | $3,309,690 | $4,925,336 | $33.46 | |||||
| Total Operating Expenses | $1,319,546 | $2,061,207 | $2,199,209 | $14.94 | |||||
| Net Operating Income | $1,053,938 | $1,248,483 | $2,726,127 | $18.52 | |||||
| Capital Expenditures | $0 | $0 | $29,437 | $0.20 | |||||
| TI/LC | $0 | $0 | $147,184 | $1.00 | |||||
| Net Cash Flow | $1,053,938 | $1,248,483 | $2,549,507 | $17.32 | |||||
| Occupancy % | 67.7% | 97.1% | 95.0%(4) | ||||||
| NOI DSCR | 0.80x | 0.95x | 2.07x | ||||||
| NCF DSCR | 0.80x | 0.95x | 1.94x | ||||||
| NOI Debt Yield | 3.9% | 4.6% | 10.1% | ||||||
| NCF Debt Yield | 3.9% | 4.6% | 9.4% | ||||||
| (1) | Historical financial information prior to 2016 is not available, as the One Lincoln Station Borrower recently acquired the One Lincoln Station Property and such information was not provided by the seller. |
| (2) | 2017 Base Rent is higher than 2016 Base Rent due to the addition of the following tenants: Crestone Holdings (13,710 SF, 10.1% of UW Base Rent) with a rent commencement date in March 2016 and Alta Trust (4,323 SF, 3.2% of UW Base Rent) with a rent commencement date in January 2017. |
| (3) | UW Base Rent is higher than 2017 due to the inclusion of rent steps through March 2019 totaling approximately $108,059, in addition to three new tenants signing leases totaling 26.4% of UW Base Rent since August 2017. Additionally, Shea Homes (31,594 SF, 21.8% of UW Base Rent) commenced its lease on August 25, 2017 and October 15, 2017 and had free rent periods of six months on the 6th floor (25,703 SF) and nine months on the 5th floor (5,891 SF). |
| (4) | The underwritten economic vacancy is 5.0%. As of January 1, 2018, the One Lincoln Station Property was 97.1% physically occupied. |
This is not a research report and was not prepared by any Underwriter’s research department. Please see additional important information and qualifications at the end of this Term Sheet. |
| T-126 |
(THIS PAGE INTENTIONALLY LEFT BLANK)
| T-127 |
| BANK 2018-BNK11 | Shoppes of Benton |
| Mortgage Loan No. 12 – Shoppes of Benton |
| Mortgage Loan Information | Property Information | ||||||
| Mortgage Loan Seller: | MSMCH | Single Asset/Portfolio: | Single Asset | ||||
| Original Balance: | $22,975,000 | Location: | Benton, AR 72019 | ||||
| Cut-off Date Balance: | $22,975,000 | General Property Type: | Retail | ||||
| % of Initial Pool Balance: | 3.3% | Detailed Property Type: | Anchored | ||||
| Loan Purpose: | Refinance | Title Vesting: | Fee | ||||
| Sponsor: | George B. Tomlin | Year Built/Renovated: | 2017/N/A | ||||
| Mortgage Rate: | 4.9250% | Size: | 173,764 SF | ||||
| Note Date: | 3/20/2018 | Cut-off Date Balance per SF: | $132 | ||||
| First Payment Date: | 5/1/2018 | Maturity Date Balance per SF: | $109 | ||||
| Maturity Date: | 4/1/2028 | Property Manager: | GBT Realty Corporation (borrower related) | ||||
| Original Term to Maturity: | 120 months | ||||||
| Original Amortization Term: | 360 months | Underwriting and Financial Information | |||||
| IO Period: | 0 months | UW NOI: | $1,977,422 | ||||
| Seasoning: | 0 months | UW NOI Debt Yield: | 8.6% | ||||
| Prepayment Provisions(1): | LO (24); DEF (91); O (5) | UW NOI Debt Yield at Maturity: | 10.5% | ||||
| Lockbox/Cash Mgmt Status: | Springing/Springing | UW NCF DSCR: | 1.23x | ||||
| Additional Debt Type: | N/A | Most Recent NOI: | N/A | ||||
| Additional Debt Balance: | N/A | 2nd Most Recent NOI: | N/A | ||||
| Future Debt Permitted (Type): | No (N/A) | 3rd Most Recent NOI: | N/A | ||||
| Reserves | Most Recent Occupancy: | 93.4% (3/1/2018) | |||||
| Type | Initial | Monthly | Cap | 2nd Most Recent Occupancy: | N/A | ||
| RE Tax: | $3,833 | $3,833 | N/A | 3rd Most Recent Occupancy: | N/A | ||
| Insurance: | $0 | Springing(2) | N/A | Appraised Value (as of): | $32,350,000 (1/4/2018) | ||
| Recurring Replacements: | $0 | $2,172 | N/A | Cut-off Date LTV Ratio: | 71.0% | ||
| TILC: | $0 | $10,859 | N/A | Maturity Date LTV Ratio: | 58.4% | ||
| Other(3): | $400,000 | $0 | N/A | ||||
| Sources and Uses | ||||||
| Sources | Proceeds | % of Total | Uses | Proceeds | % of Total | |
| Loan Amount: | $22,975,000 | 100.0% | Loan Payoff: | $18,084,816 | 78.7% | |
| Return of Equity: | $4,039,318 | 17.6% | ||||
| Closing Costs: | $447,033 | 1.9% | ||||
| Reserves: | $403,833 | 1.8% | ||||
| Total Sources: | $22,975,000 | 100.0% | Total Uses: | $22,975,000 | 100.0% | |
| (1) | The Shoppes of Benton Mortgage Loan (as defined below) may also be prepaid from a $400,000 earnout reserve as set forth in footnote (3) below. |
| (2) | Insurance reserves are waived for so long as insurance is maintained under blanket policies in accordance with the terms of the loan documents. If such condition is not met, a monthly insurance reserve in an amount equal to 1/12 of the estimated annual insurance premiums is required. |
| (3) | Other Reserve consists of a $400,000 earnout which may be released to the Shoppes of Benton Borrower (as defined below) in up to two disbursements provided that, (i) no event of default is continuing; (ii) 3,200 SF of space (or such portion thereof as shall cause the following clauses (iii) to (v) to be true) having been leased to one or more tenants pursuant to one or more leases that meet the requirements of the loan documents; (iii) the loan to value ratio is not greater than 75.0%; (iv) the debt service coverage ratio is at least 1.25x; (v) the debt yield is at least 7.90%; and (vi) the Shoppes of Benton Borrower has delivered to the lender an officer's certificate confirming all of the above conditions have been satisfied. In the event these conditions are not satisfied prior to the 24 month anniversary of the note date, the lender may apply the earnout reserve to prepay the Shoppes of Benton Mortgage Loan on the next payment date, and the Shoppes of Benton Borrower will be required to pay a prepayment fee equal to the greater of (i) 1.00% of the amount prepaid and (ii) a yield maintenance premium. In the event that the lender does not elect to use the earnout to prepay the Shoppes of Benton Mortgage Loan on such payment date, the Shoppes of Benton Borrower will continue to have the right to receive release of the earnout upon fulfillment of the conditions above. |
The Mortgage Loan.The twelfth largest mortgage loan (the “Shoppes of Benton Mortgage Loan”) is evidenced by a promissory note in the original principal amount of $22,975,000 and secured by a first priority fee mortgage encumbering an anchored retail property in Benton, Arkansas (the “Shoppes of Benton Property”). Proceeds of the Shoppes of Benton Mortgage Loan were primarily used to refinance the previous loan secured by the Shoppes of Benton Property, fund upfront reserves, pay closing costs and return equity to the Shoppes of Benton Borrower.
The Borrower and the Sponsor. The borrower is Benton SC Investment Partners, LLC (the “Shoppes of Benton Borrower”), a single-purpose, newly formed Delaware limited liability company with one independent director. The borrower sponsor and non-recourse carveout guarantor is George B. Tomlin.
George B. Tomlin has over 35 years of experience in commercial real estate. In 1987 he formed GBT Realty Corporation, the property manager, with regional focus in office and retail investment management services with a diverse client base. In recent years, the real estate company has completed over 6 million SF of development totaling over $1 billion of project costs in 27 states through its shopping center, net lease and diversified development platforms.
This is not a research report and was not prepared by any Underwriter’s research department. Please see additional important information and qualifications at the end of this Term Sheet. |
| T-128 |
| BANK 2018-BNK11 | Shoppes of Benton |
The Property.The Shoppes of Benton Property is a 173,764 SF anchored retail shopping center located in Benton, Arkansas approximately 20 miles southwest of Little Rock, Arkansas. The Shoppes of Benton Property is situated on an approximately 27.8-acre site and features 959 parking spaces (5.52 spaces per 1,000 SF).
The Shoppes of Benton Property consists of three one-story buildings built in 2017 and is anchored by Hobby Lobby, TJ Maxx, PetSmart and Tuesday Morning. As of March 1, 2018, the Shoppes of Benton Property was 93.4% leased by a mix of 4 anchor and 10 in-line tenants. The anchor tenants comprise 72.1% of the NRA and account for 63.9% of underwritten rent. Other than the anchor tenants, no tenant represents more than 5.7% of NRA or accounts for more than 9.5% of underwritten rent.
Major Tenants.
Hobby Lobby (55,000 SF, 31.7% of NRA, 22.4% ofunderwritten rent). Hobby Lobby leases 55,000 SF at the Shoppes of Benton Property. The lease began August 1, 2017, expires July 31, 2032 and has three, five-year extension options. Hobby Lobby is a large privately owned craft retailer operating more than 800 stores across the United States with more than 30,000 employees. Hobby Lobby sells various craft and home décor products including arts and crafts related supplies as well as home decorating accessories.
TJ Maxx (40,018 SF, 23.0% of NRA, 19.6% of underwritten rent). Best Buy leases 40,018 SF at the Shoppes of Benton Property. The original lease began September 1, 2017, expires August 31, 2027 and has four, five-year extension options. TJ Maxx is a leading off-price retailer of apparel and home fashions in the United States and worldwide, ranking No. 87 in the 2017 Fortune 500 listings. At the end of 2017, TJ Maxx had a reported over $33 billion in revenues, more than 3,800 stores in 9 countries, 3 e-commerce sites, and approximately 235,000 associates.
PetSmart (17,826 SF, 10.3% of NRA, 14.1% of underwritten rent).PetSmart leases 17,826 SF at the Shoppes of Benton Property. The original lease began June 1, 2017, expires May 31, 2027 and has four, five-year extension options. PetSmart is a specialty retailer of pet food and supplies, operates more than 1,430 stores in the United States, Canada, and Puerto Rico in addition to an e-commerce site and offers 11,000 products.
Tuesday Morning (12,412 SF, 7.1% of NRA, 7.7% of underwritten rent).Tuesday Morning leases 12,412 SF at the Shoppes of Benton Property. The original lease began August 1, 2017, expires January 31, 2027 and has two, five-year extension options.Tuesday Morning is a national retail chain established in 1974 specializing in both domestic and international closeouts of medium to high-end name brand gifts, luxury home textiles, home furnishings, housewares and seasonal décor.
Ulta (9,908 SF, 5.7% of NRA, 9.5% of underwritten rent).Ulta leases 9,908 SF at the Shoppes of Benton Property. The original lease began September 1, 2017, expires August 31, 2027 and has three, five-year extension options. Ulta offers more than 20,000 products from over 500 well-established and emerging beauty brands across all categories and price points, including ULTA Beauty's own private label. ULTA Beauty also offers a full-service salon in every store featuring hair, skin and brow services.
The following table presents a summary regarding the largest tenants at the Shoppes of Benton Property (of which certain tenants may have co-tenancy provisions):
| Tenant Summary(1) | |||||||
| Tenant Name | Credit Rating (Fitch/Moody's/S&P)(2) | Tenant SF | Approximate % of SF | Annual UW Rent | % of Total Annual UW Rent | Annual UW Rent PSF | Lease Expiration |
| Hobby Lobby | NR/NR/NR | 55,000 | 31.7% | $467,500 | 22.4% | $8.50 | 7/31/2032 |
| TJ Maxx | NR/A2/A+ | 40,018 | 23.0% | $408,710 | 19.6% | $10.21 | 8/31/2027 |
| PetSmart | NR/Caa1 /CCC+ | 17,826 | 10.3% | $294,129 | 14.1% | $16.50 | 5/31/2027 |
| Tuesday Morning | NR/NR/NR | 12,412 | 7.1% | $161,356 | 7.7% | $13.00 | 1/31/2027 |
| Ulta | NR/NR/NR | 9,908 | 5.7% | $197,665 | 9.5% | $19.95 | 8/31/2027 |
| Subtotal/Wtd. Avg. | 135,164 | 77.8% | $1,529,360 | 73.3% | $11.31 | ||
| Other Tenants | 27,100 | 15.6% | $555,800 | 26.7% | $20.51 | ||
| Vacant Space | 11,500 | 6.6% | $0 | 0.0% | $0.00 | ||
| Total/Wtd. Avg. | 173,764 | 100.0% | $2,085,160 | 100.0% | $12.85 | ||
| (1) | Information is based on the underwritten rent roll. |
| (2) | Certain ratings are those of the parent company whether or not the parent guarantees the lease. |
This is not a research report and was not prepared by any Underwriter’s research department. Please see additional important information and qualifications at the end of this Term Sheet. |
| T-129 |
| BANK 2018-BNK11 | Shoppes of Benton |
The following table presents certain information with respect to the lease rollover at the Shoppes of Benton Property:
| Lease Rollover Schedule(1)(2) | ||||||||
| Year | # of Leases Rolling | SF Rolling | % of Total SF Rolling | Cumulative % of SF Rolling | Annual UW Rent PSF Rolling(3) | Annual UW Rent Rolling | % of Annual UW Rent Rolling | Cumulative % of Annual UW Rent Rolling |
| MTM | 0 | 0 | 0.0% | 0.0% | $0.00 | $0 | 0.0% | 0.0% |
| 2018 | 0 | 0 | 0.0% | 0.0% | $0.00 | $0 | 0.0% | 0.0% |
| 2019 | 0 | 0 | 0.0% | 0.0% | $0.00 | $0 | 0.0% | 0.0% |
| 2020 | 0 | 0 | 0.0% | 0.0% | $0.00 | $0 | 0.0% | 0.0% |
| 2021 | 0 | 0 | 0.0% | 0.0% | $0.00 | $0 | 0.0% | 0.0% |
| 2022 | 7 | 18,600 | 10.7% | 10.7% | $20.66 | $384,300 | 18.4% | 18.4% |
| 2023 | 0 | 0 | 0.0% | 10.7% | $0.00 | $0 | 0.0% | 18.4% |
| 2024 | 0 | 0 | 0.0% | 10.7% | $0.00 | $0 | 0.0% | 18.4% |
| 2025 | 0 | 0 | 0.0% | 10.7% | $0.00 | $0 | 0.0% | 18.4% |
| 2026 | 0 | 0 | 0.0% | 10.7% | $0.00 | $0 | 0.0% | 18.4% |
| 2027 | 6 | 88,664 | 51.0% | 61.7% | $13.91 | $1,233,360 | 59.1% | 77.6% |
| 2028 | 0 | 0 | 0.0% | 61.7% | $0.00 | $0 | 0.0% | 77.6% |
| 2029 & Beyond | 1 | 55,000 | 31.7% | 93.4% | $8.50 | $467,500 | 22.4% | 100.0% |
| Vacant | 0 | 11,500 | 6.6% | 100.0% | $0.00 | 0 | 0.0% | 100.0% |
| Total/Wtd. Avg. | 14 | 173,764 | 100.0% | $12.85 | $2,085,160 | 100.0% | ||
| (1) | Information is based on the underwritten rent roll. |
| (2) | Certain tenants may have lease termination options that are exercisable prior to the stated expiration date of the subject lease or leases which are not considered in the lease rollover schedule. |
| (3) | Total/Wtd. Avg. Annual UW Rent PSF Rolling excludes vacant space. |
The Market. The Shoppes of Benton Property is located in the Little Rock retail market and the Saline County retail submarket. According to an industry report, as of the fourth quarter of 2017, the Little Rock retail market had approximately 54.1 million SF of retail space inventory, overall vacancy in the market was approximately 5.4% and asking rent was $12.62 PSF. There are 7 buildings totaling 78,148 SF currently under construction in the market that are approximately 65.3% preleased and expected to be complete by second quarter of 2018. According to an industry report, as of the fourth quarter of 2017, the Saline County retail submarket had approximately 5.9 million SF of retail space inventory, overall vacancy in the submarket was approximately 3.3% and asking rent was $9.86 PSF. There are currently 3 buildings under construction totaling 35,000 SF that were projected to be complete in March of 2018.
The estimated 2017 population within a one-, three- and five-mile radius of the Shoppes of Benton Property is 3,901, 33,545 and 63,689, respectively. The annual population growth within the three-mile trade area was 1.80% between 2010 and 2017. The estimated median household income within a one-, three- and five-mile radius of the Shoppes of Benton Property is $54,443, $56,116 and $56,217, respectively.
The following table presents recent leasing data at comparable retail rental properties with respect to the Shoppes of Benton Property:
| Comparable Retail Property Summary | |||||||
Property Name / City. State | Built | GLA | Tenant Name | Lease Area (SF) | Lease Date | Lease Term (Mos/) | Rent PSF |
Shoppes of Benton 20380 I-30 Frontage Road Benton, AR | 2017 | 173,764 | Various(1) | Various | Various | Various | $12.85(1) |
Hurricane Creek Village 20770 I-30 Frontage Road Benton, AR | 2015 | 206,157 | Academy, Ltd.
| 62,751
| Aug 2015
| 181 | $9.60 |
Alcoa Exchange 7307 Alcoa Boulevard Bryant, AR | 2006 | 127,500 | Best Buy PetCo Shipley Donuts | 32,625 11,475 1,400 | Nov 2008 Nov 2008 May 2016 | 120 120 12.0 | $14.25 $10.00 $24.00 |
Shackleford Crossing 2618 South Shackleford Little Rock, AR | 2008 | 295,036 | Haverty’s Jo-Ann Stores Scottrade | 35,000 14,000 1,614 | May 2009 Aug 2013 Mar 2013 | 120 126 67 | $13.00 $10.50 $22.00 |
Grove Plaza-Outparcel 10800 Bass Pro Parkway Little Rock, AR | 2016 | 9,621 | Taziki’s Pie 5 Pizza Sprint | 3,027 2,500 1,547 | Jan 2017 Aug 2016 Jan 2017 | 120 120 120 | $28.00 $28.50 $27.95 |
Source: Appraisal
| (1) | Represents the total anchor and in-line tenants at the Shoppes of Benton Property. Rent PSF for the Shoppes at Benton Property represents weighted average rent PSF. |
This is not a research report and was not prepared by any Underwriter’s research department. Please see additional important information and qualifications at the end of this Term Sheet. |
| T-130 |
| BANK 2018-BNK11 | Shoppes of Benton |
Underwritten Net Cash Flow. The following table presents certain information relating to the Underwritten Net Cash Flow at the Shoppes of Benton Property:
| Cash Flow Analysis | |||||
| UW(1) | UW PSF | ||||
| Base Rent(2) | $2,394,360 | $13.78 | |||
| Total Recoveries | $415,000 | $2.39 | |||
| Other Income | $0 | $0.00 | |||
| Less Vacancy & Credit Loss | ($309,200) | ($1.78) | |||
| Effective Gross Income | $2,500,160 | $14.39 | |||
| Total Expenses | $522,738 | $3.01 | |||
| Net Operating Income | $1,977,422 | $11.38 | |||
| Capital Expenditures | $25,196 | $0.15 | |||
| TI/LC | $144,224 | $0.83 | |||
| Net Cash Flow | $1,808,002 | $10.40 | |||
| Occupancy %(3) | 87.1% | ||||
| NOI DSCR | 1.35x | ||||
| NCF DSCR | 1.23x | ||||
| NOI Debt Yield | 8.6% | ||||
| NCF Debt Yield | 7.9% | ||||
| (1) | Historical cash flows are limited as the Shoppes of Benton Property was built in 2017. |
| (2) | UW Base Rent is based on the underwritten rent roll dated March 1, 2018 and includes $10,531 of straight-lined rent for TJ Maxx due to its investment grade rating. |
| (3) | UW Occupancy % represents economic occupancy. The Shoppes of Benton Property was 93.4% leased as of March 1, 2018. |
This is not a research report and was not prepared by any Underwriter’s research department. Please see additional important information and qualifications at the end of this Term Sheet. |
| T-131 |
| BANK 2018-BNK11 | 300 E. 85th Housing Corp. |
| Mortgage Loan No. 13 – 300 E. 85th Housing Corp. |
| Mortgage Loan Information | Property Information | ||||||
| Mortgage Loan Seller: | NCB | Single Asset/Portfolio: | Single Asset | ||||
| Original Balance: | $15,300,000 | Location: | New York, NY 10028 | ||||
| Cut-off Date Balance: | $15,289,439 | General Property Type: | Multifamily | ||||
| % of Initial Pool Balance: | 2.2% | Detailed Property Type: | Cooperative | ||||
| Loan Purpose: | Refinance | Title Vesting: | Fee | ||||
| Sponsor(1): | N/A | Year Built/Renovated: | 1985-1986/N/A | ||||
| Mortgage Rate: | 4.1900% | Size: | 176 Units | ||||
| Note Date: | 2/27/2018 | Cut-off Date Balance per Unit(2): | $86,872 | ||||
| First Payment Date: | 4/1/2018 | Maturity Date Balance per Unit(2): | $77,252 | ||||
| Maturity Date: | 3/1/2028 | Property Manager: | Rose-Terra Management LLC | ||||
| Original Term to Maturity: | 120 months | Underwriting and Financial Information | |||||
| Original Amortization Term: | 480 months | UW NOI(5): | $4,716,229 | ||||
| IO Period: | 0 months | UW NOI Debt Yield(2): | 30.8% | ||||
| Seasoning: | 1 month | UW NOI Debt Yield at Maturity(2): | 34.7% | ||||
| Prepayment Provisions: | YM1 (113); O (7) | UW NCF DSCR(2): | 5.89x | ||||
| Lockbox/Cash Mgmt Status: | None | Most Recent NOI(5): | N/A | ||||
| Additional Debt Type(2): | Floating | 2ndMost Recent NOI(5): | N/A | ||||
| Additional Debt Balance(2): | $0 | 3rdMost Recent NOI(5): | N/A | ||||
| Future Debt Permitted (Type)(3): | Yes (Secured) | Most Recent Occupancy(6): | N/A | ||||
| Reserves | 2ndMost Recent Occupancy(6): | N/A | |||||
| Type | Initial | Monthly | Cap | 3rdMost Recent Occupancy(6): | N/A | ||
| RE Tax: | $0 | Springing(4) | N/A | Appraised Value (as of)(7): | $235,000,000 (1/8/2018) | ||
| Insurance: | $0 | Springing(4) | N/A | Cut-off Date LTV Ratio(2)(7): | 6.5% | ||
| Maturity Date LTV Ratio(2)(7): | 5.8% | ||||||
| Coop-Rental Value(8): | $133,000,000 | ||||||
| Coop-LTV as Rental(8) | 11.5% | ||||||
| Sources and Uses | ||||||
| Sources | Proceeds | % of Total | Uses | Proceeds | % of Total | |
| Loan Amount: | $15,300,000 | 100.0% | Loan Payoff: | $13,049,312 | 85.3% | |
| Proceeds to Borrower: | $1,606,109 | 10.5% | ||||
| Closing Costs: | $644,579 | 4.2% | ||||
| Total Sources: | $15,300,000 | 100.0% | Total Uses: | $15,300,000 | 100.0% | |
| (1) | The 300 E. 85th Housing Corp. Property (as defined below) is owned by the 300 E. 85thHousing Corp. Borrower (as defined below), which is a cooperative housing corporation. No individual or entity (other than the 300 E. 85th Housing Corp. Borrower) has recourse obligations with respect to the 300 E. 85th Housing Corp. Mortgage Loan (as defined below), including pursuant to any guaranty or environmental indemnity. |
| (2) | The 300 E. 85th Housing Corp. Property also secures a subordinate second lien mortgage loan to the 300 E. 85th Housing Corp. Borrower in the amount of up to $500,000 (the “300 E. 85th Housing Corp. Subordinate Loan”) which permits advances from time to time. The outstanding balance of the 300 E. 85th Housing Corp. Subordinate Loan as of the cut-off date is $0. National Cooperative Bank, N.A is the holder of the 300 E. 85th Housing Corp. Subordinate Loan. With regard to the interest rate, term, payment terms and other statistical information relating to the 300 E. 85th Housing Corp. Subordinate Loan, see “Additional Debt Financing For Mortgage Loans Secured by Residential Cooperatives” in the Preliminary Prospectus. All statistical information presented above relating to balances per unit, debt yields, debt service coverage ratios and loan-to-value ratios are based solely on the 300 E. 85th Housing Corp. Mortgage Loan (as defined below). As of the Cut-off Date, on an aggregate basis (i.e., aggregating both the 300 E. 85th Housing Corp. Mortgage Loan and the 300 E. 85th Housing Corp. Subordinate Loan), the Cut-off Date Balance per Unit, Maturity Date Balance per Unit, UW NOI Debt Yield, UW NOI Debt Yield at Maturity, UW NCF DSCR, Cut-off Date LTV Ratio and Maturity Date LTV Ratio are $89,713, $80,093, 29.9%, 33.5%, 5.72x, 6.7% and 6.0%, respectively, with such figures being calculated assuming (with respect to the 300 E. 85th Housing Corp. Subordinate Loan) (i) that interest is accruing pursuant to the applicable loan document (with the applicable interest rate determined using the Prime Rate in effect as of March 9, 2018 and giving effect to any applicable interest rate floor), (ii) that the loan has been fully advanced and requires payments of interest only and (iii) that the entire amount of the loan is outstanding as of the Maturity Date. |
| (3) | In addition to 300 E. 85th Housing Corp. Subordinate Loan as described in footnote (2) above, National Cooperative Bank, N.A., the applicable master servicer of the 300 E. 85th Housing Corp. Mortgage Loan, will be permitted to waive the enforcement of the “due-on-encumbrance” clause in the related mortgage instrument to permit subordinate debt secured by the 300 E. 85th Housing Corp. Property, subject to the satisfaction of various conditions and subject to certain parameters set forth in the Pooling and Servicing Agreement. . See ““Description of the Mortgage Pool—Additional Indebtedness—Other Secured Indebtedness—Additional Debt Financing For Mortgage Loans Secured by Residential Cooperatives” in the Preliminary Prospectus. |
| (4) | The 300 E. 85th Housing Corp. Borrower is required to deposit, simultaneously with each monthly loan payment, 1/12 of the estimated annual real estate tax payments upon (i) failure to provide evidence of the payment of such taxes within 60 days following the date on which such payment is due to the applicable taxing authority or (ii) the occurrence of an event of default under the applicable loan documents. In addition, the 300 E. 85th Housing Corp. Borrower may be required to deposit, simultaneously with each monthly loan payment, 1/12 of the annual insurance premiums upon the occurrence of an event of default under the applicable loan documents. |
| (5) | Most Recent NOI, 2nd Most Recent NOI and 3rd Most Recent NOI are “not available”. Residential cooperatives are not-for-profit entities that set maintenance fees to cover current expenses and plan for future capital needs. A residential cooperative can increase or decrease maintenance fees according to its anticipated expenses and level of cash reserves. The historical NOI figures are not representative of the cash flow generated by the 300 E. 85th Housing Corp. Property if it were operated as a multifamily rental property. |
| (6) | Most Recent Occupancy, 2nd Most Recent Occupancy and 3rd Most Recent Occupancy is not reported as all residential units are owned by tenant-shareholders. |
| (7) | For purposes of determining the Appraised Value, the Cut-off Date LTV Ratio and the Maturity Date LTV Ratio, the value estimate reflected in the appraisal of the 300E.85th Housing Corp. Property is determined as if such residential cooperative property is operated as a residential cooperative and, in general, such value equals the sum of (i) the gross share value of all cooperative units in such residential cooperative property, based in part on various comparable sales of cooperative apartment units in the market, plus (ii) the amount of the underlying debt encumbering such residential cooperative property. See “Description of the Mortgage Pool-Certain Characteristics of Mortgage Loans Secured by Residential Cooperatives” in the Preliminary Prospectus. |
| (8) | The Coop-Rental Value and the Coop-LTV as Rental assumes the 300 E. 85th Housing Corp. Property is operated as a multifamily rental property. See“Risk Factors—Risks Relating to the Mortgage Loans—Residential Cooperative Properties Have Special Risks,” and “Description of the Mortgage Pool-Property Types-Multifamily Properties” in the Preliminary Prospectus. |
This is not a research report and was not prepared by any Underwriter’s research department. Please see additional important information and qualifications at the end of this Term Sheet. |
| T-132 |
| BANK 2018-BNK11 | 300 E. 85th Housing Corp. |
The Mortgage Loan.The thirteenth largest mortgage loan (the “300 E. 85th Housing Corp. Mortgage Loan”) is evidenced by a promissory note in the original principal amount of $15,300,000 secured by a first priority fee mortgage encumbering a 176-unit, high-rise cooperative apartment building with 1,734 SF of ground floor retail space, located in New York City, New York (the “300 E. 85th Housing Corp. Property”). The proceeds of the 300 E. 85th Housing Corp. Mortgage Loan were used to refinance existing debt secured by the 300 E. 85th Housing Corp. Property, fund reserves, and pay closing costs.
The Borrower. The borrower is 300 E. 85th Housing Corp., a cooperative housing corporation organized under the laws of the State of New York (the “300 E. 85th Housing Corp. Borrower”). The 300 E. 85th Housing Corp. Property is owned in fee simple by the 300 E. 85th Housing Corp. Borrower. No individual or entity (other than the 300 E. 85th Housing Corp. Borrower) has recourse obligations with respect to the 300 E. 85th Housing Corp. Mortgage Loan, including pursuant to any guaranty or environmental indemnity.
The Property.The 300 E. 85th Housing Corp. Property consists of 176 residential units in a 37-story plus basement residential cooperative apartment building located in New York, New York. The 300 E. 85th Housing Corp. Property was constructed between 1985 and 1986 and converted to cooperative ownership in 1986. The 300 E. 85th Housing Corp. Property is 100.0% owned by tenant-shareholders. Of the 176 residential units, 76 units have terraces. The 300 E. 85th Housing Corp. Property also contains one superintendent unit and two ground floor retail units without shares that are owned by the 300 E. 85th Housing Corp. Borrower. The retail units are 100.0% leased to Supercuts and Ivory Cleaners, Inc. The Ivory Cleaners, Inc. space is used only as a clothing pick-up and drop-off facility.
The 300 E. 85th Housing Corp. Property features an in-ground swimming pool with concrete deck, a fitness center, a common room and a party room, bike storage and locker rooms, and a paved courtyard. Parking is located in the basement and consists of 11 garage parking spaces. Floors 2 through 37 contain a commercial washer and a commercial dryer on each floor. Recent renovations at the 300 E. 85th Housing Corp. Property include façade pointing and brick replacement for over $1,000,000.
The table below shows the apartment unit mix at the 300 E. 85th Housing Corp. Property:
| 300 E. 85th Housing Corp. Unit Mix | ||||
| Unit Type | Units | % of Total Units | Average SF per Unit | Total SF |
| Studio | 23 | 13.1% | 700 | 16,100 |
| 1 Bedroom | 71 | 40.3% | 826 | 58,675 |
| 1 Bedroom with Terrace | 11 | 6.3% | 848 | 9,325 |
| 2 Bedroom | 6 | 3.4% | 1,646 | 9,875 |
| 2 Bedroom with Terrace | 51 | 29.0% | 1,143 | 58,300 |
| 3 Bedroom with Terrace | 13 | 7.4% | 2,056 | 26,725 |
| 5 Bedroom with Terrace | 1 | 0.6% | 2,850 | 2,850 |
| Total/Wtd. Avg. | 176 | 1,033 | 181,850 | |
| Source: Information obtained from the appraisal. |
The Market.The 300 E. 85th Housing Corp. Property is located on the southeast corner of Second Avenue and East 85th Street in the Yorkville neighborhood of the Upper East Side in Manhattan, New York.
According to the appraisal, the 300 E. 85th Housing Corp. Property is located within Manhattan’s District #8, which is bordered by East 96th Street at the north, by East 59th Street to the south, the East River to the east and Central Park along Fifth Avenue to the west. The district also encompasses the entirety of Roosevelt Island and Mill Rock. With a total land area of approximately 2.0 square miles, Manhattan Community District #8 comprises one of the most densely populated areas in the United States, with approximately 219,920 residents as of the 2010 United States census. The area has continued to grow with the replacement of older, low-rise apartment stock with high-rise residential structures.
In addition to Central Park, there are numerous smaller parks and playgrounds located throughout the district. East 86th Street from Lexington to First Avenues is a major regional shopping area with national chain stores such as Best Buy, and H&M. Barnes & Noble consolidated a number of neighborhood stores into a location on East 86th Street, east of Lexington Avenue. Bloomingdales is located at East 59th/60th Streets and Lexington/Third Avenues. The 300 E. 85th Housing Corp. Property has access to the major employment centers in New York City with the IRT Lexington Avenue Line (4, 5 and 6 trains) portion of the New York City subway system serving as the major north/south mode of transport for commuters to the Grand Central district and to lower Manhattan.
The district also contains several public elementary and high schools, as well as private and parochial schools to meet the educational needs of its younger residents. Post-secondary degree-granting institutions in the district include Hunter College (CUNY), Cornell University Medical Campus, Marymount Manhattan College, Rockefeller University and the Sackler School of Medicine. There are also several well-known hospitals within the district, including Beth Israel Medical Center-North Division, Lenox Hill Hospital, and Manhattan, Eye, Ear and Throat and New York Hospital.
The area has a high concentration of high-end apartments and townhouses as well as headquarters of foreign embassies and consulates, and a variety of specialty shops including boutiques, gourmet shops, bakeries, cheese shops and delicatessens. In addition, there are antique shops and decorator showrooms, numerous cafes, pubs and restaurants of every ethnic type. Many museums and art galleries in the area are recognized on a national and international level including the Metropolitan Museum of Art, the Neue Galerie New York, and the Guggenheim Museum, all located less than approximately 0.8 miles away from the 300 E. 85th Housing Corp. Property.
According to the appraisal, the 300 E. 85th Housing Corp. Property is located in the Upper East Side submarket. According to a third-party market research report, the Upper East Side submarket reported a 3.1% vacancy rate as of the third quarter of 2017.
This is not a research report and was not prepared by any Underwriter’s research department. Please see additional important information and qualifications at the end of this Term Sheet. |
| T-133 |
| BANK 2018-BNK11 | 300 E. 85th Housing Corp. |
Comparable rental properties to the 300 E. 85th Housing Corp. Property are shown in the table below:
| Comparable Rental Properties(1) | ||||||||
| Property | City/State | Distance | Year Built | # Units | Occupancy | Average SF per Unit | Average Rent per Unit | Average Rent PSF |
| The 300 E. 85th Housing Corp. | New York, NY | N/A | 1985-1986 | 176 | 97.0%(2) | 1,033 | $4,604(3) | $4.46(3) |
| 201 East 87th Street | New York, NY | 0.3 mi | 1978 | 419 | 99.5% | 748 | $4,032 | $5.50 |
| 350 East 82nd Street | New York, NY | 0.3 mi | 1999 | 151 | 98.7% | 593 | $3,100 | $5.23 |
| 171 East 84th Street | New York, NY | 0.2 mi | 1986 | 220 | 98.2% | 977 | $5,098 | $5.20 |
| 305 East 86th Street | New York, NY | 0.2 mi | 1964 | 693 | 99.1% | 1,083 | $5,168 | $4.74 |
| 340 East 80th Street | New York, NY | 0.4 mi | 1961 | 414 | N/A | N/A | $4,500 | N/A |
| 175 East 96th Street | New York, NY | 0.7 mi | 1992 | 522 | 99.0% | N/A | $7,138 | N/A |
| 1591 Second Avenue | New York, NY | 0.2 mi | 1920 | 3 | 100.0% | N/A | $7,200 | N/A |
| 401 East 80th Street | New York, NY | 0.4 mi | 1980 | 311 | 98.4% | 1,200 | $6,050 | $5.04 |
| (1) | Information obtained from the appraisal and third party reports. |
| (2) | Occupancy reported as of January 8, 2018 reflects the vacancy assumption in the related appraisal for purposes of determining the appraised value of the 300 E. 85th Housing Corp. Property as a multifamily rental property (i.e., the Coop-Rental Value) as of the appraisal valuation date. |
| (3) | The average rent for the 300 E. 85thHousing Corp. Property is estimated market rents as determined by the appraisal. |
Underwritten Net Cash Flow.The following table presents certain information relating to the Underwritten Net Cash Flow at the 300 E. 85th Housing Corp. Property:
| Cash Flow Analysis(1) | ||
| UW | UW per Unit | |
| Base Rent | $9,723,000 | $55,244 |
| Commercial Income | $259,410 | $1,474 |
| Other Income(2) | $90,000 | $511 |
| Less Vacancy & Credit Loss(3) | ($405,491) | ($2,304) |
| Effective Gross Income | $9,666,919 | $54,926 |
| Total Operating Expenses | $4,950,690 | $28,129 |
| Net Operating Income | $4,716,229 | $26,797 |
| Capital Expenditures | $71,600 | $407 |
| Net Cash Flow | $4,644,629 | $26,390 |
| Occupancy % | 97.0%(3) | |
| NOI DSCR(4) | 5.98x | |
| NCF DSCR(4) | 5.89x | |
| NOI Debt Yield(4) | 30.8% | |
| NCF Debt Yield(4) | 30.4% | |
| (1) | Residential cooperatives are generally organized and operated as not-for-profit entities that set maintenance fees to cover current expenses and plan for future capital needs. The UW Net Operating Income and the UW Net Cash Flow for the 300 E. 85th Housing Corp. Property is the projected net operating income and projected net cash flow reflected in the appraisal. UW Net Operating Income, in general, equals projected operating income at the 300 E. 85th Housing Corp. Property assuming such property is operated as a rental property with rents and other income set at the prevailing market rates, reduced by underwritten property operating expenses, a market-rate vacancy assumption– in each case as determined by the appraiser. UW Net Cash Flow equals the projected net operating income less projected replacement reserves – as determined by the appraiser. However, the projected net cash flow used in such determinations may differ materially from the scheduled monthly maintenance payments from the tenant-shareholders upon which residential cooperatives depend. |
| (2) | Other Income includes parking and laundry income. |
| (3) | The vacancy reported reflects the vacancy assumption in the related appraisal for purposes of determining the appraised value of the 300 E. 85th Housing Corp. Property as a multifamily rental property. |
| (4) | Debt service coverage ratios and debt yields are based on the 300 E. 85th Housing Corp. Mortgage Loan only and exclude any subordinate debt that may be advanced under the 300 E. 85th Housing Corp. Subordinate Loan or otherwise. |
This is not a research report and was not prepared by any Underwriter’s research department. Please see additional important information and qualifications at the end of this Term Sheet. |
| T-134 |
(THIS PAGE INTENTIONALLY LEFT BLANK)
| T-135 |
| BANK 2018-BNK11 | Peninsula Ridge |
| Mortgage Loan No. 14 – Peninsula Ridge |
| Mortgage Loan Information | Property Information | ||||||
| Mortgage Loan Seller: | MSMCH | Single Asset/Portfolio: | Single Asset | ||||
| Original Balance: | $13,000,000 | Location: | Brownstown, MI 48134 | ||||
| Cut-off Date Balance: | $13,000,000 | General Property Type: | Multifamily | ||||
| % of Initial Pool Balance: | 1.9% | Detailed Property Type: | Low-Rise | ||||
| Loan Purpose: | Refinance | Title Vesting: | Fee | ||||
| Sponsor: | David Conwill; Steven B. Kimmelman; Keith Ritz | Year Built/Renovated: | 2017/N/A | ||||
| Size: | 96 Units | ||||||
| Mortgage Rate: | 4.6700% | Cut-off Date Balance per Unit: | $135,417 | ||||
| Note Date: | 3/2/2018 | Maturity Date Balance per Unit: | $119,226 | ||||
| First Payment Date: | 5/1/2018 | Property Manager: | Redwood Living, Inc. (borrower-related) | ||||
| Maturity Date: | 4/1/2028 | Underwriting and Financial Information | |||||
| Original Term to Maturity: | 120 months | UW NOI: | $1,073,414 | ||||
| Original Amortization Term: | 360 months | UW NOI Debt Yield: | 8.3% | ||||
| IO Period: | 36 months | UW NOI Debt Yield at Maturity: | 9.4% | ||||
| Seasoning: | 0 months | UW NCF DSCR: | 1.70x (IO) 1.30x (P&I) | ||||
| Prepayment Provisions: | LO (24); DEF (91); O (5) | Most Recent NOI: | $648,292 (1/31/2018 TTM) | ||||
| Lockbox/Cash Mgmt Status: | Springing/Springing | 2ndMost Recent NOI(2): | $579,425 (12/31/2017) | ||||
| Additional Debt Type: | N/A | 3rdMost Recent NOI(2): | N/A | ||||
| Additional Debt Balance: | N/A | Most Recent Occupancy: | 99.0% (2/23/2018) | ||||
| Future Debt Permitted (Type): | No (N/A) | 2ndMost Recent Occupancy(2): | 86.6% (12/31/2017) | ||||
| Reserves | 3rdMost Recent Occupancy(2): | N/A | |||||
| Type | Initial | Monthly | Cap | Appraised Value (as of): | $17,750,000 (1/4/2018) | ||
| RE Tax: | $25,851 | $12,925 | N/A | Cut-off Date LTV Ratio: | 73.2% | ||
| Insurance: | $0 | Springing(1) | N/A | Maturity Date LTV Ratio: | 64.5% | ||
| Recurring Replacements: | $0 | $2,000 | N/A | ||||
| Sources and Uses | ||||||
| Sources | Proceeds | % of Total | Uses | Proceeds | % of Total | |
| Loan Amount: | $13,000,000 | 100.0% | Loan Payoff: | $12,288,664 | 94.5% | |
| Closing Costs: | $489,610 | 3.8% | ||||
| Return of Equity: | $195,876 | 1.5% | ||||
| Reserves: | $25,851 | 0.2% | ||||
| Total Sources: | $13,000,000 | 100.0% | Total Uses: | $13,000,000 | 100.0% | |
| (1) | Monthly deposits for insurance are springing upon the Peninsula Ridge Borrower (as defined below) failing to maintain an approved blanket policy or an event of default under the loan documents. |
| (2) | Historical cash flow and occupancy figures are limited as the Peninsula Ridge Property (as defined below) was completed in June of 2017. |
The Mortgage Loan. The fourteenth largest mortgage loan (the “Peninsula Ridge Mortgage Loan”) is evidenced by a promissory note in the original principal amount of $13,000,000 secured by a first priority fee mortgage encumbering a 96-unit, low-rise apartment complex, located in Brownstown, Michigan (the “Peninsula Ridge Property”). The proceeds of the Peninsula Ridge Mortgage Loan were used to refinance existing debt secured by the Peninsula Ridge Property, fund reserves, pay closing costs and return equity to the Peninsula Ridge Borrower.
The Borrower and Sponsors. The borrower is Peninsula Ridge One SPE LLC, a single purpose Delaware limited liability company, which does not have an independent director (the “Peninsula Ridge Borrower”). The Peninsula Ridge Borrower is indirectly 10% owned by preferred members and 90% owned by common members. The sponsors and nonrecourse carve-out guarantors are David Conwill, Steven B. Kimmelman and Keith Ritz. David Conwill, Steven B. Kimmelman and Keith Ritz are the managers of the Peninsula Ridge Borrower and are common members, each of which indirectly controls a 17% interest in the Peninsula Ridge Borrower. No preferred member owns more than 1.53% of the Peninsula Ridge Borrower.
Steve B. Kimmelman is the Chief Executive Officer and an owner of Redwood Living, Inc., which he founded in 1991. David Conwill is the President and co-owner of Redwood Living, Inc. Keith Ritz previously served as Vice President of Redwood Living, Inc. and was responsible for various aspects of development, including equity syndication; he has since retired from that position and is currently President of Perrysburg Development Company, which specializes in the development and construction management of multifamily apartments. Redwood Living, Inc. is a development and management company, with communities in Ohio, Michigan, Indiana, Iowa, North Carolina and South Carolina.
The Property.The Peninsula Ridge Property consists of 18 one-story apartment buildings totaling 96 units on 11.9 acres in Brownstown, Michigan. The Peninsula Ridge Property was developed in 2017 and was 99.0% occupied as of February 23, 2018. All of the units at the Peninsula Ridge Property include two bedrooms, two bathrooms and an attached private one or two car parking garage, with additional parking in each unit’s driveway. Each unit is equipped with stainless steel appliances including a refrigerator, dishwasher, disposal and double sink. Additional unit amenities include walk-in closets and out-door patios.
This is not a research report and was not prepared by any Underwriter’s research department. Please see additional important information and qualifications at the end of this Term Sheet. |
| T-136 |
| BANK 2018-BNK11 | Peninsula Ridge |
The table below shows the apartment unit mix at the Peninsula Ridge Property:
| Peninsula Ridge Unit Mix | |||||||
| Unit Type | Average SF per Unit | Units | Occupied Units | % Occupied | Total SF | Monthly Average Rent per Unit | Monthly Market Rent per Unit |
| 2 BR, 2 BA | 1,123 | 34 | 34 | 100.0% | 38,182 | $1,252 | $1,249 |
| 2 BR, 2 BA | 1,294 | 40 | 40 | 100.0% | 51,760 | $1,439 | $1,440 |
| 2 BR, 2 BA | 1,327 | 19 | 19 | 100.0% | 25,213 | $1,529 | $1,540 |
| 2 BR, 2 BA | 1,620 | 3 | 2 | 66.7% | 4,860 | $1,725 | $1,799 |
| Total/Wtd. Avg. | 1,250 | 96 | 95 | 99.0% | 120,015 | $1,396 | $1,403 |
Source: Borrower rent roll dated February 23, 2018 and appraisal
The Market.The Peninsula Ridge Property is located on Redwood Boulevard in Brownstown, Michigan approximately 18 miles southwest of Detroit. The Peninsula Ridge Property is located in the Downriver South submarket of the Detroit multifamily market. According to the appraisal, as of the third quarter of 2017, the Downriver South multifamily submarket had approximately 10,955 units with a 3.8% vacancy rate and average rental rate of $770 per unit. As of the third quarter of 2017, the Detroit multifamily market had approximately 212,996 units with a 4.3% vacancy rate and average rental rate of $918 per unit. The average rental rate per unit in both the Detroit market and Downriver South submarket has increased every quarter since the fourth quarter of 2014. The 2017 estimated population within a 1-, 3- and 5-mile radius was 8,650, 44,988 and 115,615, respectively. The 2017 estimated average household income within a 1-, 3- and 5-mile radius was $83,545, $80,483 and $72,301, respectively.
According to the appraisal, the immediate area surrounding the Peninsula Ridge Property is primarily made up of single-family residential properties, multi-family properties, retail properties, office and institutional uses (churches, schools, parkland). The top employers in the Detroit metropolitan statistical area include Ford (44,600 employees), Fiat Chrysler Automobiles (33,650 employees), General Motors (32,350 employees) and the University of Michigan (30,850 employees).
The sponsors have indicated that they plan to construct a 42 unit multifamily property adjacent to the Peninsula Ridge Property (“Peninsula Ridge - Phase II”). Construction of Peninsula Ridge - Phase II is anticipated to begin in April of 2018 and finish in 2019. The sponsors also own multiple comparable multifamily properties in close proximity to the Peninsula Ridge Property. SeeComparable Rental Properties table below.
Comparable rental properties to the Peninsula Ridge Property are shown in the table below:
| Comparable Rental Properties | ||||||||
| Property | City/State | Distance from Subject | Year Built | # Units | Occupancy | Unit Type | Average SF per Unit | Average Monthly Rent per Unit |
| Red Hawk Landing(1) | Brownstown, MI | 3.9 Miles | 2016 | 115 | 94.7% | 2 BR, 2 BA 2 BR, 2 BA | 1,294 1,327 | $1,440 $1,540 |
| Enclave at Brownstown(1) | Canton, MI | 13.8 Miles | 2015 | 93 | 97.8% | 2 BR, 2 BA | 1,294 | $1,649 |
| Enclave at Arbor Ridge Apartments | Ypsilanti, MI | 21.4 Miles | 2016 | 32 | 96.1% | 2 BR, 2.5 BA 3 BR, 2.5 BA | 1,200 1,450 | $1,475 $1,721 |
| Four Seasons(1) | Commerce, MI | 32.9 Miles | 2014 | 98 | 96.9% | 2 BR, 2 BA | 1,294 | $1,649 |
| Beechcrest Apartments Phase I(1) | Commerce, MI | 31.5 Miles | 2015 | 108 | 94.3% | 2 BR, 2 BA 2 BR, 2 BA 2 BR, 2 BA 2 BR, 2 BA | 1,294 1,327 1,343 1,427 | $1,445 $1,495 $1,545 $1645 |
| Stratford Place at Brownstown | Brownstown, MI | 2.0 Miles | 2004 | 180 | 98.3% | 1 BR, 1 BA 2 BR, 2 BA 2 BR, 2 BA 2 BR, 2 BA 2 BR, 2 BA 3 BR, 2 BA 3 BR, 2 BA | 775 1,042 1,047 1,115 1,137 1,182 1,280 | $910 $1,055 $1,070 $1,075 $1,125 $1,350 $1,363 |
Source: Appraisal.
| (1) | Owned by a borrower affiliate. |
This is not a research report and was not prepared by any Underwriter’s research department. Please see additional important information and qualifications at the end of this Term Sheet. |
| T-137 |
| BANK 2018-BNK11 | Peninsula Ridge |
Operating History and Underwritten Net Cash Flow.The following table presents certain information relating to the historical operating performance and the Underwritten Net Cash Flow at the Peninsula Ridge Property:
| Cash Flow Analysis(1) | ||||
| 2017 | 1/31/2018 TTM | UW | UW per Unit | |
| Base Rent | $936,984 | $1,025,196 | $1,613,224 | $16,804 |
| Other Income(2) | $98,303 | $91,590 | $139,181 | $1,450 |
| Less Vacancy & Credit Loss | $0 | $0 | ($103,341) | ($1,076) |
| Effective Gross Income | $1,035,287 | $1,116,786 | $1,649,064 | $17,178 |
| Total Operating Expenses | $455,862 | $468,495 | $575,650 | $5,996 |
| Net Operating Income | $579,425 | $648,292 | $1,073,414 | $11,181 |
| Capital Expenditures | $0 | $0 | $24,000 | $250 |
| Net Cash Flow | $579,425 | $648,292 | $1,049,414 | $10,931 |
| Occupancy % | 86.6% | 99.0%(3) | 95.0%(3) | |
| NOI DSCR (IO) | 0.94x | 1.05x | 1.74x | |
| NOI DSCR (P&I) | 0.72x | 0.80x | 1.33x | |
| NCF DSCR (IO) | 0.94x | 1.05x | 1.70x | |
| NCF DSCR (P&I) | 0.72x | 0.80x | 1.30x | |
| NOI Debt Yield | 4.5% | 5.0% | 8.3% | |
| NCF Debt Yield | 4.5% | 5.0% | 8.1% | |
| (1) | Historical cash flows are limited as the Peninsula Ridge Property was completed in June of 2017. The increase in UW Net Operating Income from 2017 and 1/31/2018 TTM Net Operating Income can be attributed to recent lease signings. |
| (2) | Other Income consists of property maintenance, reimbursements and miscellaneous fees. |
| (3) | The Peninsula Ridge Property was underwritten to an occupancy of 95.0%. 1/31/2018 TTM Occupancy represents occupancy as of February 23, 2018. |
This is not a research report and was not prepared by any Underwriter’s research department. Please see additional important information and qualifications at the end of this Term Sheet. |
| T-138 |
(THIS PAGE INTENTIONALLY LEFT BLANK)
| T-139 |
| BANK 2018-BNK11 | Warm Springs Promenade |
| Mortgage Loan No. 15 – Warm Springs Promenade |
| Mortgage Loan Information | Property Information | ||||||
| Mortgage Loan Seller: | MSMCH | Single Asset/Portfolio: | Single Asset | ||||
| Original Balance: | $13,000,000 | Location: | Henderson, NV 89014 | ||||
| Cut-off Date Balance: | $12,985,776 | General Property Type: | Retail | ||||
| % of Initial Pool Balance: | 1.9% | Detailed Property Type: | Anchored | ||||
| Loan Purpose: | Refinance | Title Vesting: | Fee | ||||
| Sponsor: | 3D Investments | Year Built/Renovated: | 2003/N/A | ||||
| Mortgage Rate: | 4.8750% | Size: | 176,081 SF | ||||
| Note Date: | 2/9/2018 | Cut-off Date Balance per SF(1): | $74 | ||||
| First Payment Date: | 4/1/2018 | Maturity Date Balance per SF(1): | $61 | ||||
| Maturity Date: | 3/1/2028 | Property Manager: | North American Commercial (borrower-related) | ||||
| Original Term to Maturity: | 120 months | ||||||
| Original Amortization Term: | 360 months | ||||||
| IO Period: | 0 months | Underwriting and Financial Information | |||||
| Seasoning: | 1 month | UW NOI: | $1,557,454 | ||||
| Prepayment Provisions: | LO (25); DEF (90); O (5) | UW NOI Debt Yield: | 12.0% | ||||
| Lockbox/Cash Mgmt Status: | Springing/Springing | UW NOI Debt Yield at Maturity: | 14.6% | ||||
| Additional Debt Type: | N/A | UW NCF DSCR: | 1.67x | ||||
| Additional Debt Balance: | N/A | Most Recent NOI: | $1,710,319 (12/31/2017) | ||||
| Future Debt Permitted (Type): | No (N/A) | 2nd Most Recent NOI: | $1,293,946 (12/31/2016) | ||||
| Reserves | 3rd Most Recent NOI: | $1,117,611 (12/31/2015) | |||||
| Type | Initial | Monthly | Cap | Most Recent Occupancy: | 91.3% (1/1/2018) | ||
| RE Tax: | $21,374 | $10,681 | N/A | 2nd Most Recent Occupancy(3): | NAV | ||
| Insurance: | $0 | Springing(1) | N/A | 3rd Most Recent Occupancy(3): | NAV | ||
| Recurring Replacements: | $0 | $2,184 | N/A | Appraised Value (as of): | $20,300,000 (12/15/2017) | ||
| TILC: | $275,000 | $9,538 | $400,000 | Cut-off Date LTV Ratio: | 64.0% | ||
| Other(2): | $170,373 | $10,000 | $300,000 | Maturity Date LTV Ratio: | 52.6% | ||
| Sources and Uses | ||||||
| Sources | Proceeds | % of Total | Uses | Proceeds | % of Total | |
| Loan Amount: | $13,000,000 | 100.0% | Loan Payoff: | $11,974,907 | 92.1% | |
| Reserves: | $466,747 | 3.6% | ||||
| Return of Equity: | $410,313 | 3.2% | ||||
| Closing Costs: | $148,033 | 1.1% | ||||
| Total Sources: | $13,000,000 | 100.0% | Total Uses: | $13,000,000 | 100.0% | |
| (1) | Monthly deposits for insurance are springing upon the Warm Springs Promenade Borrower (as defined below) failing to maintain an approved blanket policy. |
| (2) | Other reserves represent the Flip N’ Tag reserve ($20,373) and a Big Lots reserve ($150,000 upfront deposit, plus monthly deposits of $10,000, subject to $300,000 cap). The Flip N’ Tag reserve is required to be disbursed to the Warm Springs Promenade Borrower following the expiration of a free rent period in May 2018. The Big Lots reserve is required to be disbursed in full to the borrower upon any one of the following: (1) an estoppel that confirms co-tenancy currently tied to Sears and Levitz (which previously occupied the Flip N’ Tag space) is instead tied to both Sears (or a nationally recognized replacement tenant) and Flip N’ Tag (or any nationally recognized tenant occupying the former Levitz space), (2) a renewal of the Big Lots lease, Sears space has been relet to a nationally recognized tenant satisfying co-tenancy provisions, and tenant provides estoppel stating co-tenancy provisions with respect to Sears have been satisfied by the nationally recognized tenant, (3) an amendment to the Big Lots lease removing co-tenancy requirements tied to Sears, and (4) the Big Lots space has been relet to a replacement tenant on terms reasonably approved by the lender, with no co-tenancy requirements tied to Sears. In addition, if Big Lots vacates, the Warm Springs Promenade Borrower may be reimbursed for TI/LC costs for a replacement lease approved by the lender with no co-tenancy tied to Sears prior to full disbursement from the reserve. |
| (3) | The Warm Springs Promenade Property (as defined below) was purchased in November 2016 and historical occupancy rates were not provided. |
The Mortgage Loan.The fifteenth largest mortgage loan (the “Warm Springs Promenade Mortgage Loan”) is evidenced by a promissory note in the original principal amount of $13,000,000, and secured by a first priority fee mortgage encumbering a multi-tenant anchored retail property located in Henderson, Nevada (the “Warm Springs Promenade Property”). Proceeds of the Warm Springs Promenade Mortgage Loan were primarily used to refinance the previous loan secured by the Warm Springs Promenade Property, pay closing costs, fund upfront reserves and return equity to the Warm Springs Promenade Borrower.
The Borrower and the Sponsor. The borrower is Exeter 16290 NV LLC (the “Warm Springs Promenade Borrower”), a single-purpose, newly formed Nevada limited liability company, which does not have an independent director. The Warm Springs Promenade Borrower is 100.0% owned by View Equity, L.P., which is owned by George Daneshgar (33.0%), Joseph Daneshgar (33.0%) and Nader Daneshgar (33.0%) as trustees of their respective revocable trusts, and by its general partner, View Equity, LLC (1.0%), of which George Daneshgar is the manager. The borrower sponsor is 3D Investments and the non-recourse carve-out guarantor is George Daneshgar.
3D Investments is a privately held real estate partnership based in California and focused on investment, management, and development of commercial and residential properties. Founded in 1976, 3D Investments has acquired, sold, and/or managed over 105 properties. Since the formation of 3D Investments, George Daneshgar has been directly involved in and responsible for the financing and construction of numerous commercial and residential developments.
This is not a research report and was not prepared by any Underwriter’s research department. Please see additional important information and qualifications at the end of this Term Sheet. |
| T-140 |
| BANK 2018-BNK11 | Warm Springs Promenade |
The Property.The Warm Springs Promenade Property is a 176,081 SF Class B anchored retail shopping center located in Henderson, Nevada approximately 12 miles southeast of the Las Vegas central business district. The Warm Springs Promenade Property is situated on an approximately 23.2-acre site and features 1,187 parking spaces (6.7 spaces per 1,000 SF). The Warm Springs Promenade Property features 7 total points of ingress and egress along Marks street and Warm Springs Street.
The Warm Springs Promenade Property includes five one-story buildings built in 2003 and is anchored by Flip N’ Tag, Big Lots and TVI, Inc. dba Savers (“Savers”) and shadow anchored by a 121,870 SF Sears store (which occupies its non-collateral space under a lease that expires in 2021). As of January 1, 2018, the Warm Springs Promenade Property was 91.3% leased. The anchor tenants comprise 54.4% of the NRA and account for 47.8% of underwritten rent. Other than the anchor tenants, no tenant represents more than 6.8% of NRA or accounts for more than 6.9% of underwritten rent.
Major Tenant.
Flip N’ Tag (40,745 SF, 23.1% of NRA, 15.1% ofunderwritten rent). The Flip N’ Tag lease at the Warm Springs Promenade Property commenced on May 27, 2016, expires November 30, 2026, and has two, five year renewal options. Flip N’ Tag is a locally owned indoor trampoline park with two locations in Las Vegas. In addition to trampolines, the subject location offers a zip line, rock climbing wall, laser tag, mechanical bull, arcade, and climbing jungle gym area.
Big Lots (30,000 SF, 17.0% of NRA, 17.8% ofunderwritten rent). The Big Lots lease at the Warm Springs Promenade Property commenced on February 27, 2006, expires January 31, 2021, and has three, five year renewal options remaining. Founded in 1967, Big Lots offers an assortment of items and products, including food, furniture, seasonal items, electronics and accessories, home décor, toys, and gifts. Big Lots employs over 35,000 associates across the United States and operates approximately 1,400 stores in 47 states.
Savers (25,000 SF, 14.2% of NRA, 14.9% ofunderwritten rent). The Savers lease at the Warm Springs Promenade Property commenced on February 10, 2006, expires December 31, 2021, and has three, five year renewal options. Savers is a for-profit thrift store chain which purchases, resells and recycles goods. The Savers chain purchases donated goods from more than 120 nonprofit organizations.
The following table presents a summary regarding the largest tenants at the Warm Springs Promenade Property (of which certain tenants may have co-tenancy provisions):
| Tenant Summary(1) | ||||||||||
| Tenant Name | Credit Rating (Fitch/Moody’s/ S&P)(2) | Tenant SF | Approx% of SF | Annual UW Rent | Annual UW Rent PSF(3) | Most Recent Sales(4) | ||||
| App. % of Total Annual UW Rent | $ | PSF | Occ. Cost %(5) | Lease Expiration | ||||||
| Flip N' Tag | NR/NR/NR | 40,745 | 23.1% | $251,264 | $6.17 | 15.1% | $1,780,959 | $44 | 14.1% | 11/30/2026 |
| Big Lots | NR/NR/BBB | 30,000 | 17.0% | $297,000 | $9.90 | 17.8% | NAV | NAV | NAV | 1/31/2021 |
| Savers | NR/NR/NR | 25,000 | 14.2% | $247,500 | $9.90 | 14.9% | NAV | NAV | NAV | 12/31/2021 |
| At Home Furniture | NR/NR/NR | 12,000 | 6.8% | $72,000 | $6.00 | 4.3% | NAV | NAV | NAV | 12/31/2018 |
| Lakeshore Learning Center | NR/NR/NR | 8,640 | 4.9% | $114,048 | $13.20 | 6.9% | $1,543,269 | $179 | 7.4% | 4/30/2021 |
| Subtotal/Wtd. Avg. | 116,385 | 66.1% | $981,812 | $8.44 | 59.0% | |||||
| Other Tenants | 44,338 | 25.2% | $682,267 | $15.39 | 41.0% | |||||
| Vacant Space | 15,358 | 8.7% | $0 | $0.00 | 0.0% | |||||
| Total/Wtd. Avg. | 176,081 | 100.0% | $1,664,079 | $10.35 | 100.0% | |||||
| (1) | Information is based on the underwritten rent roll as of January 1, 2018. |
| (2) | Certain ratings are those of the parent company whether or not the parent guarantees the lease. |
| (3) | Total/Wtd. Avg. Annual UW Rent PSF excludes vacant space. |
| (4) | Most Recent Sales determined as of January 1, 2018. |
| (5) | Occ. Cost % is based on the underwritten rent as of the January 1, 2018 underwritten rent roll divided by most recently reported sales. |
This is not a research report and was not prepared by any Underwriter’s research department. Please see additional important information and qualifications at the end of this Term Sheet. |
| T-141 |
| BANK 2018-BNK11 | Warm Springs Promenade |
The following table presents certain information with respect to the lease rollover at the Warm Springs Promenade Property:
| Lease Rollover Schedule(1)(2) | ||||||||||||||||
| Year | # of Leases Rolling | SF Rolling | % of Total SF Rolling | Cumulative % of SF Rolling | Annual UW Rent PSF Rolling(3) | Annual UW Rent Rolling | Annual UW Rent Rolling | Cumulative % of Annual UW Rent Rolling | ||||||||
| MTM | 1 | 3,000 | 1.7% | 1.7% | $4.80 | $14,400 | 0.9% | 0.9% | ||||||||
| 2018 | 3 | 18,878 | 10.7% | 12.4% | $8.32 | $157,059 | 9.4% | 10.3% | ||||||||
| 2019 | 4 | 12,421 | 7.1% | 19.5% | $14.08 | $174,944 | 10.5% | 20.8% | ||||||||
| 2020 | 3 | 11,520 | 6.5% | 26.0% | $12.70 | $146,263 | 8.8% | 29.6% | ||||||||
| 2021 | 4 | 65,040 | 36.9% | 63.0% | $10.52 | $684,377 | 41.1% | 70.7% | ||||||||
| 2022 | 2 | 3,819 | 2.2% | 65.1% | $17.44 | $66,596 | 4.0% | 74.7% | ||||||||
| 2023 | 1 | 5,300 | 3.0% | 68.1% | $31.92 | $169,176 | 10.2% | 84.9% | ||||||||
| 2024 | 0 | 0 | 0.0% | 68.1% | $0.00 | $0 | 0.0% | 84.9% | ||||||||
| 2025 | 0 | 0 | 0.0% | 68.1% | $0.00 | $0 | 0.0% | 84.9% | ||||||||
| 2026 | 1 | 40,745 | 23.1% | 91.3% | $6.17 | $251,264 | 15.1% | 100.0% | ||||||||
| 2027 | 0 | 0 | 0.0% | 91.3% | $0.00 | $0 | 0.0% | 100.0% | ||||||||
| 2028 | 0 | 0 | 0.0% | 91.3% | $0.00 | $0 | 0.0% | 100.0% | ||||||||
| 2029 & Beyond | 0 | 0 | 0.0% | 91.3% | $0.00 | $0 | 0.0% | 100.0% | ||||||||
| Vacant | 0 | 15,358 | 8.7% | 100.0% | $0.00 | 0 | 0.0% | 100.0% | ||||||||
| Total/Wtd. Avg.(3) | 19 | 176,081 | 100.0% | $10.35 | $1,664,079 | 100.0% |
| |||||||||
| (1) | Information is based on the underwritten rent roll as of January 1, 2018. |
| (2) | Certain tenants may have lease termination options that are exercisable prior to the stated expiration date of the subject lease or leases which are not considered in the lease rollover schedule. |
| (3) | Total/Wtd. Avg. Annual UW Rent PSF excludes vacant space. |
The Market. The Warm Springs Promenade Property is located in the Southeast submarket of the Las Vegas retail market. According to the appraisal, as of the third quarter of 2017, the Southeast submarket had approximately 14.8 million SF of retail space, an 8.7% vacancy rate and asking rent of $18.48 PSF.According to the appraisal, as of the third quarter of 2017, the Las Vegas retail market had approximately 64.4 million SF of retail space, a 9.2% vacancy rate and asking rent of $18.00 PSF. The estimated 2017 population within a one-, three- and five-mile radius of the Warm Springs Prom enade Property is 14,454, 123,779 and 291,778, respectively. The estimated median household income within a one-, three- and five-mile radius of the Warm Springs Promenade Property is $54,677, $53,067 and $53,916, respectively.
The following table reflects the competitive retail properties with respect to the Warm Springs Promenade Property:
| Competitive Property Summary | |||||||||
| Property Name | Address | Year Built | Occ. | GLA | Distance from Subject | Base Rent PSF(1) | Reimbursements | ||
| Stephanie Street Power Center | 501-579 Stephanie Street Henderson, NV | 1996 | 100% | 378,972 | 0.5 Miles | $15.00 | NNN | ||
| Sunmark Plaza | 611-941 Marks Street Henderson, NV | 2001 | 91% | 278,498 | 0.7 Miles | $16.00 | NNN | ||
| Eastgate Power Center | 520 Marks Street Henderson, NV | 2002 | 92% | 311,589 | 0.4 Miles | $30.00 | NNN | ||
| Galleria Commons | 570 North Stephanie Street Henderson, NV | 1997 | 100% | 278,411 | 0.5 Miles | $27.00 | NNN | ||
| Sunset Stephanie Retail | 1321 West Sunset Road Henderson, NV | 2003 | 100% | 16,411 | 0.6 Miles | $36.00 | NNN | ||
| Whitney Ranch Center | 609 North Stephanie Street Henderson, NV | 1992 | 93% | 228,841 | 0.9 Miles | $27.00 | NNN | ||
Source: Appraisal
| (1) | Represents asking rent. |
This is not a research report and was not prepared by any Underwriter’s research department. Please see additional important information and qualifications at the end of this Term Sheet. |
| T-142 |
| BANK 2018-BNK11 | Warm Springs Promenade |
Operating History and Underwritten Net Cash Flow. The following table presents certain information relating to the historical operating performance and the Underwritten Net Cash Flow at the Warm Springs Promenade Property:
| Cash Flow Analysis | |||||||||||
| 2015 | 2016 | 2017 | UW | UW PSF | |||||||
| Gross Potential Rent(1) | $1,268,945 | $1,419,385 | $1,743,844 | $1,909,807 | $10.85 | ||||||
| Total Recoveries | $240,805 | $217,998 | $387,446 | $513,293 | $2.92 | ||||||
| Other Income | $30,287 | $3,762 | $4,475 | $0 | $0.00 | ||||||
| Less Vacancy & Credit Loss | ($15,400) | $0 | $0 | ($311,299) | ($1.77) | ||||||
| Effective Gross Income | $1,524,637 | $1,641,145 | $2,135,765 | $2,111,801 | $11.99 | ||||||
| Total Expenses | $407,026 | $347,199 | $425,445 | $554,347 | $3.15 | ||||||
| Net Operating Income | $1,117,611 | $1,293,946 | $1,710,319 | $1,557,454 | $8.85 | ||||||
| Capital Expenditures | $0 | $0 | $0 | $25,617 | $0.15 | ||||||
| TI/LC | $0 | $0 | $0 | $153,863 | $0.87 | ||||||
| Net Cash Flow | $1,117,611 | $1,293,946 | $1,710,319 | $1,377,973 | $7.83 | ||||||
| Occupancy %(3) | NAV | NAV | 91.3%(2) | 83.7%(2) | |||||||
| NOI DSCR | 1.35x | 1.57x | 2.07x | 1.89x | |||||||
| NCF DSCR | 1.35x | 1.57x | 2.07x | 1.67x | |||||||
| NOI Debt Yield | 8.6% | 10.0% | 13.2% | 12.0% | |||||||
| NCF Debt Yield | 8.6% | 10.0% | 13.2% | 10.6% | |||||||
| (1) | Gross Potential Rent is based on the underwritten rent roll dated January 1, 2018 and includes rent steps through February 1, 2019 totaling $17,344. UW Gross Potental Rent also includes grossed up rent for vacant space of $245,728. |
| (2) | UW Occupancy % represents economic occupancy. Physical occupancy as of January 1, 2018 was 91.3% and includes the MTM tenant, Best Floors, Ltd (1.7% of NRA). |
| (3) | The property was purchased in November 2016 and historical occupancy rates were not provided. |
This is not a research report and was not prepared by any Underwriter’s research department. Please see additional important information and qualifications at the end of this Term Sheet. |
| T-143 |
| BANK 2018-BNK11 |
This material was prepared by sales, trading, banking or other non-research personnel of one of the following: Morgan Stanley & Co. LLC, Morgan Stanley & Co. International Limited, Morgan Stanley Japan Limited and/or Morgan Stanley Dean Witter Asia Limited (together with their affiliates, hereinafter “Morgan Stanley”), Wells Fargo Securities, LLC (together with its affiliates, “Wells Fargo”), Merrill Lynch, Pierce, Fenner & Smith Incorporated (together with its affiliates, “BofA Merrill Lynch”), Academy Securities, Inc. (together with its affiliates, “Academy”) and Drexel Hamilton, LLC (together with its affiliates, “Drexel” and collectively with Morgan Stanley, Wells Fargo, BofA Merrill Lynch and Academy, the “Underwriters”). This material was not produced by an Underwriter’s research analyst, although it may refer to an Underwriter’s research analyst or research report. Unless otherwise indicated, these views (if any) are the author’s and may differ from those of the fixed income or equity research departments of the Underwriters or others in those firms.
This material may have been prepared by or in conjunction with the respective trading desks of the Underwriters that may deal as principal in or own or act as market maker or liquidity provider for the securities/instruments (or related derivatives) mentioned herein. The trading desk may have accumulated a position in the subject securities/instruments based on the information contained herein. Trading desk materials are not independent of the proprietary interests of the Underwriters, which may conflict with your interests. Each of the Underwriters may also perform or seek to perform investment banking services for the issuers of the securities and instruments mentioned herein.
The information contained in this material is subject to change, completion or amendment from time to time, and the information in this material supersedes information in any other communication relating to the securities referred to in this material. This material is not a solicitation to participate in any trading strategy, and is not an offer to sell any security or instrument or a solicitation of an offer to buy or sell any security or instrument in any jurisdiction where an offer, solicitation or sale is not permitted. Unless otherwise set forth in this material, any securities referred to in this material may not have been registered under the U.S. Securities Act of 1933, as amended, and, if not, may not be offered or sold absent an exemption therefrom. Recipients are required to comply with any legal or contractual restrictions on their purchase, holding, sale, exercise of rights or performance of obligations under any securities/instruments transaction.
The securities/instruments discussed in this material may not be suitable for all investors. This material has been prepared and issued by the Underwriters for intended distribution to market professionals and institutional investor clients. Other recipients should seek independent investment advice prior to making any investment decision based on this material. This material does not provide individually tailored investment advice or offer tax, regulatory, accounting or legal advice. Prior to entering into any proposed transaction, recipients should determine, in consultation with their own investment, legal, tax, regulatory and accounting advisors, the economic risks and merits, as well as the legal, tax, regulatory and accounting characteristics and consequences, of the transaction. You should consider this material as only a single factor in making an investment decision.
The value of and income from investments may vary because of changes in interest rates, foreign exchange rates, default rates, prepayment rates, securities/instruments prices, market indexes, operational or financial conditions of companies or other factors. There may be time limitations on the exercise of options or other rights in securities/instruments transactions. Past performance is not necessarily a guide to future performance. Estimates of future performance are based on assumptions that may not be realized. Actual events may differ from those assumed and changes to any assumptions may have a material impact on any projections or estimates. Other events not taken into account may occur and may significantly affect the projections or estimates. Certain assumptions may have been made for modeling purposes only to simplify the presentation and/or calculation of any projections or estimates, and the Underwriters do not represent that any such assumptions will reflect actual future events. Accordingly, there can be no assurance that estimated returns or projections will be realized or that actual returns or performance results will not materially differ from those estimated herein. Some of the information contained in this document may be aggregated data of transactions in securities or other financial instruments executed by an Underwriter that has been compiled so as not to identify the underlying transactions of any particular customer.
Notwithstanding anything herein to the contrary, the Underwriters and each recipient hereof (and their employees, representatives, and other agents) may disclose to any and all persons, without limitation of any kind from the commencement of discussions, the U.S. federal and state income tax treatment and tax structure of the transaction and all materials of any kind (including opinions or other tax analyses) that are provided to it relating to the tax treatment and tax structure (as such terms are defined in Treasury Regulation 1.6011-4). For this purpose, "tax structure" is limited to facts relevant to the U.S. federal and state income tax treatment of the transaction and does not include information relating to the identity of the parties, their affiliates, agents or advisors. This authorization of tax disclosure is retroactively effective to the commencement of discussions with prospective investors regarding the transactions contemplated herein.
THE DISTRIBUTION OF THIS MATERIAL (A) IF MADE BY A PERSON WHO IS NOT AN AUTHORIZED PERSON UNDER THE FINANCIAL SERVICES AND MARKETS ACT 2000 (“FSMA”), IS BEING MADE ONLY TO, OR DIRECTED ONLY AT, PERSONS WHO (I) ARE OUTSIDE THE UNITED KINGDOM, OR (II) HAVE PROFESSIONAL EXPERIENCE IN MATTERS RELATING TO INVESTMENTS AND QUALIFY AS INVESTMENT PROFESSIONALS IN ACCORDANCE WITH ARTICLE 19(5) OF THE FINANCIAL SERVICES AND MARKETS ACT 2000 (FINANCIAL PROMOTION) ORDER 2005 (THE “FINANCIAL PROMOTION ORDER”), OR (III) ARE PERSONS FALLING WITHIN ARTICLE 49(2)(A) THROUGH (D) (HIGH NET WORTH COMPANIES, UNINCORPORATED ASSOCIATIONS, ETC.) OF THE FINANCIAL PROMOTION ORDER; AND (B) IF MADE BY A PERSON WHO IS AN AUTHORIZED PERSON UNDER THE FSMA, IS BEING MADE ONLY TO, OR DIRECTED ONLY AT, PERSONS WHO (I) ARE OUTSIDE THE UNITED KINGDOM, OR (II) HAVE PROFESSIONAL EXPERIENCE IN MATTERS RELATING TO INVESTMENTS AND QUALIFY AS INVESTMENT PROFESSIONALS IN ACCORDANCE WITH ARTICLE 14(5) OF THE FINANCIAL SERVICES AND MARKETS ACT 2000 (PROMOTION OF COLLECTIVE INVESTMENT SCHEMES) (EXEMPTIONS) ORDER 2001 (THE “PROMOTION OF COLLECTIVE INVESTMENT SCHEMES EXEMPTIONS ORDER”), OR (III) ARE PERSONS FALLING WITHIN ARTICLE 22(2)(A) THROUGH (D) (“HIGH NET WORTH COMPANIES, UNINCORPORATED ASSOCIATIONS, ETC.”) OF THE PROMOTION OF COLLECTIVE INVESTMENT SCHEMES EXEMPTIONS ORDER, OR (IV) ARE PERSONS TO WHOM THE ISSUING ENTITY MAY LAWFULLY BE PROMOTED IN ACCORDANCE WITH CHAPTER 4.12 OF THE UK FINANCIAL CONDUCT AUTHORITY’S CONDUCT OF BUSINESS SOURCEBOOK.
THE OFFERED CERTIFICATES HAVE NOT BEEN AND WILL NOT BE REGISTERED UNDER THE FINANCIAL INSTRUMENTS EXCHANGE ACT OF JAPAN (LAW NO. 25 OF 1948, AS AMENDED (THE “FIEL”)), AND EACH OF MORGAN STANLEY & CO. LLC, WELLS FARGO SECURITIES, LLC, MERRILL LYNCH, PIERCE, FENNER & SMITH INCORPORATED, ACADEMY SECURITIES, INC. AND DREXEL HAMILTON, LLC HAS AGREED THAT IT WILL NOT OFFER OR SELL ANY OFFERED CERTIFICATES, DIRECTLY OR INDIRECTLY, IN JAPAN OR TO, OR FOR THE BENEFIT OF, ANY JAPANESE PERSON, OR TO OTHERS FOR RE-OFFERING OR RESALE, DIRECTLY OR INDIRECTLY, IN JAPAN OR TO ANY JAPANESE PERSON, EXCEPT PURSUANT TO AN EXEMPTION FROM THE REGISTRATION REQUIREMENTS OF, AND OTHERWISE IN COMPLIANCE WITH, THE FIEL AND ANY OTHER APPLICABLE LAWS AND REGULATIONS. FOR THE PURPOSES OF THIS PARAGRAPH, “JAPANESE PERSON” SHALL MEAN ANY PERSON RESIDENT IN JAPAN, INCLUDING ANY CORPORATION OR OTHER ENTITY ORGANIZED UNDER THE LAWS AND REGULATIONS OF JAPAN.
© 2018 Morgan Stanley