| FREE WRITING PROSPECTUS | ||
| FILED PURSUANT TO RULE 433 | ||
| REGISTRATION FILE NO.: 333-227446-03 | ||
 |  |  |
BANK 2019-BNK17
Free Writing Prospectus
Structural and Collateral Term Sheet
$833,026,562
(Approximate Total Mortgage Pool Balance)
$708,280,000
(Approximate Offered Certificates)
Morgan Stanley Capital I Inc.
as Depositor
Morgan Stanley Mortgage Capital Holdings LLC
Bank of America, National Association
Wells Fargo Bank, National Association
as Sponsors and Mortgage Loan Sellers
Commercial Mortgage Pass-Through Certificates
Series 2019-BNK17
March 18, 2019
MORGAN STANLEY Co-Lead Bookrunner Manager | WELLS FARGO SECURITIES Co-Lead Bookrunner Manager | BofA MERRILL LYNCH Co-Lead Bookrunner Manager |
Academy Securities, Inc. Co-Manager | Drexel Hamilton Co-Manager |
STATEMENT REGARDING THIS FREE WRITING PROSPECTUS
The depositor has filed a registration statement (including a prospectus) with the SEC (File No. 333-227446) for the offering to which this communication relates. Before you invest, you should read the prospectus in that registration statement and other documents the depositor has filed with the SEC for more complete information about the depositor, the issuing entity and this offering. You may get these documents for free by visiting EDGAR on the SEC web site atwww.sec.gov. Alternatively, the depositor or any underwriter or any dealer participating in the offering will arrange to send you the prospectus if you request it by calling toll free 1-866-718-1649 or by email toprospectus@ms.com.
This is not a research report and was not prepared by any Underwriter’s research department. Please see additional important information and qualifications at the end of this Term Sheet.
Neither this Term Sheet nor anything contained herein shall form the basis for any contract or commitment whatsoever.The information contained herein is preliminary as of the date hereof.This Term Sheet is subject to change, completion or amendment from time to time.The information contained herein will be superseded by similar information delivered to you as part of the Preliminary Prospectus.The information contained herein supersedes any such information previously delivered.The information contained herein should be reviewed only in conjunction with the entire Preliminary Prospectus.All of the information contained herein is subject to the same limitations and qualifications contained in the Preliminary Prospectus.The information contained herein does not contain all relevant information relating to the underlying mortgage loans or mortgaged properties.Such information is described in the Preliminary Prospectus.The information contained herein will be more fully described in the Preliminary Prospectus.The information contained herein should not be viewed as projections, forecasts, predictions or opinions with respect to value.Prior to making any investment decision, prospective investors are strongly urged to read the Preliminary Prospectus in its entirety.Neither the Securities and Exchange Commission nor any state securities commission has approved or disapproved of these securities or determined if this Term Sheet is truthful or complete.Any representation to the contrary is a criminal offense.
IMPORTANT NOTICE RELATING TO AUTOMATICALLY GENERATED EMAIL DISCLAIMERS
Any legends, disclaimers or other notices that may appear at the bottom of, or attached to, the email communication to which this Term Sheet may have been attached are not applicable to this Term Sheet and should be disregarded. Such legends, disclaimers or other notices have been automatically generated as a result of this Term Sheet having been sent via Bloomberg or another email system.
IMPORTANT NOTICE REGARDING THE CONDITIONS FOR THIS OFFERING OF ASSET-BACKED SECURITIES
THE ASSET-BACKED SECURITIES REFERRED TO IN THIS TERM SHEET ARE BEING OFFERED WHEN, AS AND IF ISSUED. IN PARTICULAR, YOU ARE ADVISED THAT THE ASSET-BACKED SECURITIES, AND THE ASSET POOL BACKING THEM, ARE SUBJECT TO MODIFICATION OR REVISION (INCLUDING, AMONG OTHER THINGS, THE POSSIBILITY THAT ONE OR MORE CLASSES OF SECURITIES MAY BE SPLIT, COMBINED OR ELIMINATED), AT ANY TIME PRIOR TO ISSUANCE OR AVAILABILITY OF A FINAL PROSPECTUS. AS A RESULT, YOU MAY COMMIT TO PURCHASE SECURITIES THAT HAVE CHARACTERISTICS THAT MAY CHANGE, AND YOU ARE ADVISED THAT ALL OR A PORTION OF THE SECURITIES MAY NOT BE ISSUED THAT HAVE THE CHARACTERISTICS DESCRIBED IN THIS TERM SHEET. OUR OBLIGATION TO SELL SECURITIES TO YOU IS CONDITIONED ON THE SECURITIES AND THE UNDERLYING TRANSACTION HAVING THE CHARACTERISTICS DESCRIBED IN THIS TERM SHEET. IF WE DETERMINE THAT THE FOREGOING CONDITION IS NOT SATISFIED IN ANY MATERIAL RESPECT, WE WILL NOTIFY YOU, AND NEITHER THE ISSUING ENTITY NOR ANY UNDERWRITER WILL HAVE ANY OBLIGATION TO YOU TO DELIVER ALL OR ANY PORTION OF THE SECURITIES WHICH YOU HAVE COMMITTED TO PURCHASE, AND THERE WILL BE NO LIABILITY BETWEEN US AS A CONSEQUENCE OF THE NON-DELIVERY.
This is not a research report and was not prepared by any Underwriter’s research department. Please see additional important information and qualifications at the end of this Term Sheet.
T-2
| BANK 2019-BNK17 | Structural Overview |
Offered Certificates
| Class | Expected Ratings (Fitch/S&P/KBRA)(1) | Approximate Initial Certificate Balance | Approximate Initial Credit Support(3) | Pass-Through Rate Description | Expected Weighted Average Life (Years)(4) | Expected Principal Window (Months)(4) | Certificate Principal UW NOI Debt Yield(5) | Certificate Principal to Value Ratio(6) | |||||||||||||
| Class A-1 | AAAsf/AAA(sf)/AAA(sf) | $16,000,000 | 30.000% | (7) | 2.96 | 1-59 | 17.9% | 38.6% | |||||||||||||
| Class A-2 | AAAsf/AAA(sf)/AAA(sf) | $6,500,000 | 30.000% | (7) | 4.95 | 59-59 | 17.9% | 38.6% | |||||||||||||
| Class A-SB | AAAsf/AAA(sf)/AAA(sf) | $28,600,000 | 30.000% | (7) | 7.49 | 59-117 | 17.9% | 38.6% | |||||||||||||
| Class A-3 | AAAsf/AAA(sf)/AAA(sf) | (8) | 30.000% | (7) | (8) | (8) | 17.9% | 38.6% | |||||||||||||
| Class A-4 | AAAsf/AAA(sf)/AAA(sf) | (8) | 30.000% | (7) | (8) | (8) | 17.9% | 38.6% | |||||||||||||
| Class X-A | AAAsf/AAA(sf)/AAA(sf) | $553,962,000 | (9) | N/A | Variable IO(10) | N/A | N/A | N/A | N/A | ||||||||||||
| Class X-B | AA-sf/AA-(sf)/AAA(sf) | $123,653,000 | (9) | N/A | Variable IO(10) | N/A | N/A | N/A | N/A | ||||||||||||
| Class A-S | AAAsf/AA+(sf)/AAA(sf) | $81,116,000 | 19.750% | (7) | 9.95 | 119-119 | 15.6% | 44.3% | |||||||||||||
| Class B | AA-sf/AA-(sf)/AA-(sf) | $42,537,000 | 14.375% | (7) | 9.95 | 119-119 | 14.6% | 47.3% | |||||||||||||
| Class C | A-sf/A-(sf)/A-(sf) | $30,665,000 | 10.500% | (7) | 10.01 | 119-120 | 14.0% | 49.4% | |||||||||||||
Privately Offered Certificates(12)
| Class | Expected Ratings (Fitch/S&P/KBRA)(1) | Approximate Initial Certificate Balance or Notional Amount(2) | Approximate Initial Credit Support(3) | Pass-Through Rate Description | Expected Weighted Average Life (Years)(4) | Expected Principal Window (Months)(4) | Certificate Principal UW NOI Debt Yield(5) | Certificate Principal to Value Ratio(6) | |||||||||||||
| Class X-D | BBB-sf/NR/BBB-(sf) | $34,623,000 | (9) | N/A | Variable IO(10) | N/A | N/A | N/A | N/A | ||||||||||||
| Class X-F | BB-sf/NR/BB-(sf) | $16,817,000 | (9) | N/A | Fixed IO(11) | N/A | N/A | N/A | N/A | ||||||||||||
| Class X-G | B-sf/NR/B-(sf) | $7,913,000 | (9) | N/A | Fixed IO(11) | N/A | N/A | N/A | N/A | ||||||||||||
| Class X-H | NR/NR/NR | $23,742,234 | (9) | N/A | Fixed IO(11) | N/A | N/A | N/A | N/A | ||||||||||||
| Class D | BBBsf/NR/BBB+(sf) | $20,774,000 | 7.875% | (7) | 10.03 | 120-120 | 13.6% | 50.9% | |||||||||||||
| Class E | BBB-sf/NR/BBB-(sf) | $13,849,000 | 6.125% | (7) | 10.03 | 120-120 | 13.3% | 51.8% | |||||||||||||
| Class F | BB-sf/NR/BB-(sf) | $16,817,000 | 4.000% | (7) | 10.03 | 120-120 | 13.0% | 53.0% | |||||||||||||
| Class G | B-sf/NR/B-(sf) | $7,913,000 | 3.000% | (7) | 10.03 | 120-120 | 12.9% | 53.5% | |||||||||||||
| Class H | NR/NR/NR | $23,742,234 | 0.000% | (7) | 10.03 | 120-120 | 12.5% | 55.2% | |||||||||||||
Non-Offered Eligible Vertical Interest(12)
| Class | Expected Ratings (Fitch/S&P/KBRA)(1) | Approximate Initial Certificate Balance or Notional Amount(2) | Approximate Initial Credit Support(3) | Pass-Through Rate Description | Expected Weighted Average Life (Years)(4) | Expected Principal Window (Months)(4) | Certificate Principal UW NOI Debt Yield | Certificate Principal to Value Ratio | |||||||||||||
| RR Interest | NR/NR/NR | $41,651,328.11 | N/A | (13) | 9.66 | 1-120 | N/A | N/A | |||||||||||||
| (1) | Ratings shown are those of Fitch Ratings, Inc. (“Fitch”), S&P Global Ratings, acting through Standard & Poor’s Financial Services LLC (“S&P”), and Kroll Bond Rating Agency, Inc. (“KBRA”). Certain nationally recognized statistical rating organizations that were not hired by the depositor may use information they receive pursuant to Rule 17g-5 under the Securities Exchange Act of 1934, as amended, or otherwise to rate the certificates. There can be no assurance as to what ratings a non-hired nationally recognized statistical rating organization would assign. See “Risk Factors—Other Risks Relating to the Certificates—Nationally Recognized Statistical Rating Organizations May Assign Different Ratings to the Certificates; Ratings of the Certificates Reflect Only the Views of the Applicable Rating Agencies as of the Dates Such Ratings Were Issued; Ratings May Affect ERISA Eligibility; Ratings May Be Downgraded” and “Ratings” in the Preliminary Prospectus to be dated on or about the date hereof (the “Preliminary Prospectus”). Capitalized terms used but not defined herein have the meanings assigned to such terms in the Preliminary Prospectus. |
| (2) | Approximate, subject to a permitted variance of plus or minus 5% and further subject to the discussion in footnote (8) below. In addition, the notional amounts of the Class X-A, Class X-B, Class X-D, Class X-F, Class X-G and Class X-H certificates may vary depending upon the final pricing of the classes of principal balance certificates whose certificate balances comprise such notional amounts, and, if as a result of such pricing the pass-through rate of any class of the Class X-A, Class X-B, Class X-D, Class X-F, Class X-G or Class X-H certificates, as applicable, would be equal to zero at all times, such class of certificates will not be issued on the closing date of this securitization. |
| (3) | The approximate initial credit support percentages set forth for the certificates are approximate and, for the Class A-1, Class A-2, Class A-SB, Class A-3 and Class A-4 certificates, are represented in the aggregate. The RR Interest provides credit support only to the limited extent that it is allocated a portion of any losses incurred on the underlying mortgage loans, which such losses are allocated between it, on the one hand, and to the Non-Retained Certificates, on the other hand,pro rata in accordance with their respective Percentage Allocation Entitlements (as defined below). See “Credit Risk Retention” in the Preliminary Prospectus. |
This is not a research report and was not prepared by any Underwriter’s research department. Please see additional important information and qualifications at the end of this Term Sheet.
T-3
| BANK 2019-BNK17 | Structural Overview |
| (4) | The Expected Weighted Average Life and Expected Principal Window during which distributions of principal would be received as set forth in the foregoing table with respect to each class of certificates having a certificate balance are based on the assumptions set forth under “Yield and Maturity Considerations—Weighted Average Life” in the Preliminary Prospectus and on the assumptions that there are no prepayments, modifications or losses in respect of the mortgage loans and that there are no extensions or forbearances of maturity dates or anticipated repayment dates of the mortgage loans. |
| (5) | Certificate Principal UW NOI Debt Yield for any class of principal balance certificates (other than the RR Interest) is calculated as the product of (a) the weighted average UW NOI Debt Yield for the mortgage pool, multiplied by (b) a fraction, the numerator of which is the total initial certificate balance of all the principal balance certificates, and the denominator of which is the sum of (x) the total initial certificate balance of the subject class of principal balance certificates and all other classes of principal balance certificates (other than the RR Interest), if any, that are senior to such class and (y) the outstanding certificate balance of the RR Interest, multiplied by the applicable RR Interest Computation Percentage. The Certificate Principal UW NOI Debt Yields of the Class A-1, Class A-2, Class A-SB, Class A-3 and Class A-4 certificates are calculated in the aggregate for those classes as if they were a single class. With respect to any class of principal balance certificates, the “RR Interest Computation Percentage” is equal to a fraction, expressed as a percentage, the numerator of which is the total initial certificate balance of the subject class of principal balance certificates and all other classes of principal balance certificates (other than the RR Interest), if any, that are senior to such class, and the denominator of which is the sum of the total initial certificate balance of all the principal balance certificates (other than the RR Interest). |
| (6) | Certificate Principal to Value Ratio for any class of principal balance certificates (other than the RR Interest) is calculated as the product of (a) the weighted average Cut-off Date LTV Ratio of the mortgage pool, multiplied by (b) a fraction, the numerator of which is the sum of (x) the total initial certificate balance of the subject class of principal balance certificates and all other classes of principal balance certificates (other than the RR Interest), if any, that are senior to such class and (y) the outstanding certificate balance of the RR Interest, multiplied by the applicable RR Interest Computation Percentage, and the denominator of which is the total initial certificate balance of all the principal balance certificates. The Certificate Principal to Value Ratios of the Class A-1, Class A-2, Class A-SB, Class A-3 and Class A-4 certificates are calculated in the aggregate for those classes as if they were a single class. |
| (7) | The pass-through rate for each class of the Class A-1, Class A-2, Class A-SB, Class A-3, Class A-4, Class A-S, Class B, Class C, Class D, Class E, Class F, Class G and Class H certificates (which, together with the RR Interest, are referred to as the “principal balance certificates”) will be one of the following: (i) a fixed rateper annum, (ii) a variable rateper annum equal to the weighted average of the net mortgage interest rates on the mortgage loans for the related distribution date, (iii) a variable rateper annum equal to the lesser of (a) a fixed rate and (b) the weighted average of the net mortgage interest rates on the mortgage loans for the related distribution date or (iv) a variable rateper annum equal to the weighted average of the net mortgage interest rates on the mortgage loans for the related distribution date minus a specified percentage. For purposes of the calculation of the weighted average of the net mortgage interest rates on the mortgage loans for each distribution date, the net mortgage interest rates will be adjusted as necessary to a 30/360 basis. |
| (8) | The exact initial certificate balances of the Class A-3 and Class A-4 certificates are unknown and will be determined based on the final pricing of those classes of certificates. However, the initial certificate balances, weighted average lives and principal windows of the Class A-3 and Class A-4 certificates are expected to be within the applicable ranges reflected in the following chart. The aggregate initial certificate balance of the Class A-3 and Class A-4 certificates is expected to be approximately $502,862,000, subject to a variance of plus or minus 5%. |
| Class of Certificates | Expected Range of Initial Certificate Balance | Expected Range of Weighted Average Life (Years) | Expected Range of Principal Window (Months) | |||
| Class A-3 | $116,000,000 - $250,000,000 | 9.84 – 9.85 | 117 – 119 / 117 – 118 | |||
| Class A-4 | $252,862,000 - $386,862,000 | 9.92 – 9.95 | 119 – 119 / 118 – 119 |
| (9) | The Class X-A, Class X-B, Class X-D, Class X-F, Class X-G and Class X-H certificates (collectively referred to as the “Class X certificates”) are notional amount certificates and will not be entitled to distributions of principal. The notional amount of the Class X-A certificates will be equal to the aggregate certificate balance of the Class A-1, Class A-2, Class A-SB, Class A-3 and Class A-4 certificates. The notional amount of the Class X-B certificates will be equal to the aggregate certificate balance of the Class A-S and Class B certificates. The notional amount of the Class X-D certificates will be equal to the aggregate certificate balance of the Class D and Class E certificates. The notional amount of each class of the Class X-F, Class X-G and Class X-H certificates will be equal to the certificate balance of the class of principal balance certificates that with the addition of “X-”, has the same alphabetical designation as the subject class of Class X certificates. |
| (10) | The pass-through rate for the Class X-A certificates for any distribution date will be aper annum rate equal to the excess, if any, of (a) the weighted average of the net mortgage interest rates on the mortgage loans for the related distribution date, over (b) the weighted average of the pass-through rates on the Class A-1, Class A-2, Class A-SB, Class A-3 and Class A-4 certificates for the related distribution date, weighted on the basis of their respective certificate balances outstanding immediately prior to that distribution date. The pass-through rate for the Class X-B certificates for any distribution date will be aper annum rate equal to the excess, if any, of (a) the weighted average of the net mortgage interest rates on the mortgage loans for the related distribution date, over (b) the weighted average of the pass-through rates on the Class A-S and Class B certificates for the related distribution date, weighted on the basis of their respective certificate balances outstanding immediately prior to that distribution date. The pass-through rate for the Class X-D certificates for any distribution date will be aper annum rate equal to the excess, if any, of (a) the weighted average of the net mortgage interest rates on the mortgage loans for the related distribution date, over (b) the weighted average of the pass-through rates on the Class D and Class E certificates for the related distribution date, weighted on the basis of their respective certificate balances outstanding immediately prior to that distribution date. For purposes of the calculation of the weighted average of the net mortgage interest rates on the mortgage loans for each distribution date, the net mortgage interest rates will be adjusted as necessary to a 30/360 basis. |
| (11) | The pass-through rate for each class of the Class X-F, Class X-G and Class X-H certificates will be a fixed rateper annum(described in the table as “Fixed IO”). |
| (12) | Not offered pursuant to the Preliminary Prospectus or this Term Sheet. Information provided in this Term Sheet regarding the characteristics of these certificates is provided only to enhance your understanding of the offered certificates. The privately offered certificates also include the Class V and Class R certificates, which do not have a certificate balance, notional amount, credit support, pass-through rate, rating, assumed final distribution date or rated final distribution date, and which are not shown in the chart. The Class V certificates represent a beneficial ownership interest held through the grantor trust in a specified percentage of certain excess interest in respect of mortgage loans having anticipated repayment dates, if any. The Class R certificates represent the beneficial ownership of the residual interest in each of the real estate mortgage investment conduits, as further described in the Preliminary Prospectus. |
| (13) | Although it does not have a specified pass-through rate (other than for tax reporting purposes), the effective pass-through rate for the RR Interest will be a variable rateper annumequal to the weighted average of the net mortgage interest rates on the mortgage loans for the related distribution date (in each case adjusted, if necessary, to accrue on the basis of a 360-day year consisting of twelve 30-day months). |
This is not a research report and was not prepared by any Underwriter’s research department. Please see additional important information and qualifications at the end of this Term Sheet.
T-4
| BANK 2019-BNK17 | Structural Overview |
Issue Characteristics
| Offered Certificates: | $708,280,000 (approximate) monthly pay, multi-class, commercial mortgage pass-through certificates, consisting of eight principal balance classes (Class A-1, Class A-2, Class A-SB, Class A-3, Class A-4, Class A-S, Class B and Class C) and two interest-only classes (Class X-A and Class X-B) | |
| Co-Lead Managers and Joint Bookrunners: | Morgan Stanley & Co. LLC, Merrill Lynch, Pierce, Fenner & Smith Incorporated and Wells Fargo Securities, LLC | |
| Co-Managers: | Academy Securities, Inc. and Drexel Hamilton, LLC | |
| Mortgage Loan Sellers: | Morgan Stanley Mortgage Capital Holdings LLC, Bank of America, National Association and Wells Fargo Bank, National Association | |
| Rating Agencies: | Fitch, S&P and KBRA | |
| Master Servicer: | Wells Fargo Bank, National Association | |
| Special Servicer: | Midland Loan Services, a Division of PNC Bank, National Association | |
| Certificate Administrator/ Certificate Registrar/Custodian: | Wells Fargo Bank, National Association | |
| Trustee: | Wilmington Trust, National Association | |
| Operating Advisor: | Pentalpha Surveillance LLC | |
| Asset Representations Reviewer: | Pentalpha Surveillance LLC | |
| Initial Directing Certificateholder: | Ellington Management Group, LLC or its affiliate | |
| Risk Retention Consultation Party: | Morgan Stanley Mortgage Capital Holdings LLC | |
| U.S. Credit Risk Retention: | For a discussion on the manner in which the U.S. credit risk retention requirements will be addressed by Morgan Stanley Mortgage Capital Holdings LLC, as the retaining sponsor, see “Credit Risk Retention” in the Preliminary Prospectus. | |
| EU Risk Retention: | None of the sponsors, the depositor or any other party intends to retain a material net economic interest in the securitization constituted by the issue of the Offered Certificates or to take any other action in connection with such transaction, in a manner prescribed or contemplated by the EU risk retention and due diligence requirements. | |
| Cut-off Date: | The mortgage loans will be considered part of the trust fund as of their respective cut-off dates. The cut-off date with respect to each mortgage loan is the respective due date for the monthly debt service payment that is due in April 2019 (or, in the case of any mortgage loan that has its first due date after April 2019, the date that would have been its due date in April 2019 under the terms of that mortgage loan if a monthly debt service payment were scheduled to be due in that month). | |
| Expected Pricing Date: | Week of March 18, 2019 | |
| Expected Closing Date: | April 4, 2019 | |
| Determination Dates: | The 11th day of each month or, if the 11th day is not a business day, then the business day immediately following such 11th day. | |
| Distribution Dates: | The 4th business day following each determination date. The first distribution date will be in May 2019. | |
| Rated Final Distribution Date: | The distribution date in April 2052 | |
| Interest Accrual Period: | Preceding calendar month | |
| Payment Structure: | Sequential pay | |
| Tax Treatment: | REMIC | |
| Optional Termination: | 1.00% clean-up call | |
| Minimum Denominations: | $10,000 for each class of Offered Certificates (other than Class X-A and Class X-B certificates); $1,000,000 for the Class X-A and Class X-B certificates | |
| Settlement Terms: | DTC, Euroclear and Clearstream | |
| Legal/Regulatory Status: | Each class of Offered Certificates is expected to be eligible for exemptive relief under ERISA. No class of Offered Certificates is SMMEA eligible. | |
| Analytics: | The certificate administrator is expected to make available all distribution date statements, CREFC® reports and supplemental notices received by it to certain modeling financial services as described in the Preliminary Prospectus. | |
| Bloomberg Ticker: | BANK 2019-BN17<MTGE><GO> | |
| Risk Factors: | THE CERTIFICATES INVOLVE CERTAIN RISKS AND MAY NOT BE SUITABLE FOR ALL INVESTORS. SEE THE “RISK FACTORS” SECTION OF THE PRELIMINARY PROSPECTUS. |
This is not a research report and was not prepared by any Underwriter’s research department. Please see additional important information and qualifications at the end of this Term Sheet.
T-5
| BANK 2019-BNK17 | Structural Overview |
Structural Overview
| Allocation Between the RR Interest and the Non-Retained Certificates: | The aggregate amount available for distributions to the holders of the Certificates (including the RR Interest) on each distribution date (net of specified expenses of the issuing entity, including fees payable to, and costs and expenses reimbursable to, the master servicer, any primary servicers, the special servicer, the certificate administrator, the trustee, the operating advisor, the asset representations reviewer and CREFC®) will be allocated between amounts available for distribution to the holders of the RR Interest, on the one hand, and to all other Certificates (other than the Class R Certificates), referred to herein as the “Non-Retained Certificates”, on the other hand. The portion of such amount allocable to (a) the RR Interest will at all times be the product of such amount multiplied by 5% and (b) the Non-Retained Certificates will at all times be the product of such amount multiplied by the difference between 100% and the percentage set forth in clause (a) (each, the respective “Percentage Allocation Entitlement”). | |
| Accrual: | Each class of Offered Certificates will accrue interest on a 30/360 basis. | |
| Amount and Order of Distributions: | On each distribution date, the Non-Retained Certificates’ Percentage Allocation Entitlement of funds available for distribution from the mortgage loans, net of (i) any yield maintenance charges and prepayment premiums and (ii) any excess interest, will be distributed in the following amounts and order of priority:
First, to the Class A-1, Class A-2, Class A-SB, Class A-3, Class A-4, Class X-A, Class X-B, Class X-D, Class X-F, Class X-G and Class X-H certificates, in respect of interest, up to an amount equal to, andpro rata in accordance with, the interest entitlements for those classes;
Second, to the Class A-1, Class A-2, Class A-SB, Class A-3 and Class A-4 certificates as follows, to the extent of applicable available funds allocated to principal: either (i)(a)first, to principal on the Class A-SB certificates, until the certificate balance of the Class A-SB certificates is reduced to the planned principal balance for the related distribution date set forth in Annex E to the Preliminary Prospectus, and (b)second, to principal on each class of the Class A-1, Class A-2, Class A-3, Class A-4 and Class A-SB certificates, in that order, in each case until the certificate balance of such class of certificates has been reduced to zero, or (ii) if the certificate balance of each class of principal balance certificates other than the Class A-1, Class A-2, Class A-SB, Class A-3 and Class A-4 certificates and the RR Interest has been reduced to zero as a result of the allocation of losses on the mortgage loans to those certificates, to principal on the Class A-1, Class A-2, Class A-SB, Class A-3 and Class A-4 certificates,pro rata, without regard to the distribution priorities described above or the planned principal balance of the Class A-SB certificates;
Third, to the Class A-1, Class A-2, Class A-SB, Class A-3 and Class A-4 certificates, first, up to an amount equal to, andpro rata based on, any previously unreimbursed losses on the mortgage loans allocable to principal that were previously borne by each such class and then in the amount of interest thereon;
Fourth, to each class of the Class A-S, Class B and Class C certificates, in that order, in each case as follows: (a) to interest on such class of certificates in the amount of its interest entitlement; (b) to the extent of applicable available funds allocable to principal remaining after distributions in respect of principal to each class with a higher priority (as set forth in this clause or prior enumerated clauses set forth above), to principal on such class of certificates until its certificate balance has been reduced to zero; and (c) to reimburse such class of certificates, first, in the amount of any previously unreimbursed losses on the mortgage loans that were previously allocated to those certificates, then in the amount of interest thereon;
Fifth, to the principal balance certificates (other than the Class A-1, Class A-2, Class A-SB, Class A-3, Class A-4, Class A-S, Class B and Class C certificates and the RR Interest) in the amounts and order of priority described in “Description of the Certificates—Distributions” in the Preliminary Prospectus; and
Sixth, to the Class R certificates, any remaining amounts. | |
| Interest and Principal Entitlements: | The interest entitlement of each class of Offered Certificates on each distribution date generally will be the interest accrued during the related interest accrual period on the related certificate balance or notional amount at the related pass-through rate, net of any prepayment interest shortfalls allocated to that class for such distribution date as described below. If prepayment interest shortfalls arise from voluntary prepayments on serviced mortgage loans during any collection period, the master servicer is required to make a limited compensating interest payment to offset those shortfalls. See “Description of the Certificates—Prepayment Interest Shortfalls” in the Preliminary Prospectus. The remaining amount of prepayment interest shortfalls will be allocated between the RR Interest, on one hand, and the Non-Retained Certificates, on the other hand, in accordance with their respective Percentage Allocation Entitlements. The prepayment interest shortfalls allocated to the Non-Retained Certificates (other than the Class V Certificates) will be allocated among such classes of certificates entitled to interest, on apro rata basis, based on their respective amounts of accrued interest for the related distribution date, to reduce the interest entitlement on each such class of certificates. If a class receives less than the entirety of its interest entitlement on any distribution date, then the shortfall (excluding any shortfall due to prepayment interest shortfalls), together with interest thereon, will be added to its interest entitlement for the next succeeding distribution date.
The aggregate principal distribution amount for each distribution date generally will be the aggregate amount of principal received or advanced in respect of the mortgage loans, net of any non-recoverable advances and interest thereon and any workout-delayed reimbursement amounts that are reimbursed to the master servicer |
This is not a research report and was not prepared by any Underwriter’s research department. Please see additional important information and qualifications at the end of this Term Sheet.
T-6
| BANK 2019-BNK17 | Structural Overview |
| or the trustee during the related collection period. Non-recoverable advances and interest thereon are reimbursable from principal collections before reimbursement from other amounts. Workout-delayed reimbursement amounts will be reimbursable from principal collections. The Non-Retained Certificates and the RR Interest will be entitled to their respective Percentage Allocation Entitlements of the aggregate principal distribution amount. | ||
| Special Servicer Compensation: | The principal compensation to be paid to the special servicer in respect of its special servicing activities will be the special servicing fee, the workout fee and the liquidation fee.
The special servicing fee for each distribution date is calculated based on the outstanding principal balance of each serviced mortgage loan that is a specially serviced mortgage loan (and any related serviced companion loan) or as to which the related mortgaged property has become an REO property at the special servicing fee rate, which will be a rate equal to 0.25%per annum. The special servicing fee will be payable monthly,first, from liquidation proceeds, insurance and condemnation proceeds, and other collections in respect of the related specially serviced mortgage loan or REO property and,then, from general collections on all the mortgage loans and any REO properties.
The special servicer will also be entitled to (i) liquidation fees generally equal to 1.0% (or, if such rate would result in an aggregate liquidation fee less than $25,000, then the liquidation fee rate will be equal to the lesser of (i) 3.0% and (ii) such lower rate as would result in an aggregate liquidation fee equal to $25,000) of liquidation proceeds and certain other collections in respect of a specially serviced mortgage loan (and any related serviced companion loan) or related REO property and of amounts received in respect of mortgage loan repurchases by the related mortgage loan sellers and (ii) workout fees generally equal to 1.0% of interest (other than post-ARD excess interest on mortgage loans with anticipated repayment dates and other than default interest) and principal payments made in respect of a rehabilitated mortgage loan (and any related serviced companion loan), subject to a floor of $25,000 with respect to any mortgage loan, whole loan or related REO property, and in the case of each of clause (i) and (ii), subject to certain adjustments and exceptions as described in the Preliminary Prospectus under “Pooling and Servicing Agreement—Servicing and Other Compensation and Payment of Expenses—Special Servicing Compensation”.
With respect to any non-serviced mortgage loan, the related special servicer under the related other pooling and servicing agreement pursuant to which such mortgage loan is being serviced will be entitled to similar compensation as that described above with respect to such non-serviced mortgage loan under such other pooling and servicing agreement as further described in the Preliminary Prospectus, although any related fees may accrue at a different rate and there may be a higher (or no) cap on liquidation and workout fees.
| |
Prepayment Premiums/Yield Maintenance Charges: | If any yield maintenance charge or prepayment premium is collected during any collection period with respect to any mortgage loan, then on the immediately succeeding distribution date, the certificate administrator will pay: (i)(a) to the holders of each class of the Class A-1, Class A-2, Class A-SB, Class A-3, Class A-4, Class A-S, Class B, Class C, Class D and Class E certificates, the product of (x) the Non-Retained Certificates’ Percentage Allocation Entitlement of such yield maintenance charge or prepayment premium, (y) the related Base Interest Fraction for such class and the applicable principal prepayment, and (z) a fraction, the numerator of which is equal to the amount of principal distributed to such class for that distribution date, and the denominator of which is the total amount of principal distributed to the Class A-1, Class A-2, Class A-SB, Class A-3, Class A-4, Class A-S, Class B, Class C, Class D and Class E certificates for that distribution date, (b) to the holders of the Class X-A certificates, the excess, if any, of (x) the product of (1) the Non-Retained Certificates’ Percentage Allocation Entitlement of such yield maintenance charge or prepayment premium and (2) a fraction, the numerator of which is equal to the amount of principal distributed to the Class A-1, Class A-2, Class A-SB, Class A-3 and Class A-4 certificates for that distribution date, and the denominator of which is the total amount of principal distributed to the Class A-1, Class A-2, Class A-SB, Class A-3, Class A-4, Class A-S, Class B, Class C, Class D and Class E certificates for that distribution date, over (y) the amount of such yield maintenance charge or prepayment premium distributed to the Class A-1, Class A-2, Class A-SB, Class A-3 and Class A-4 certificates as described above, (c) to the holders of the Class X-B certificates, the excess, if any, of (x) the product of (1) the Non-Retained Certificates’ Percentage Allocation Entitlement of such yield maintenance charge or prepayment premium and (2) a fraction, the numerator of which is equal to the amount of principal distributed to the Class A-S and Class B certificates for that distribution date, and the denominator of which is the total amount of principal distributed to the Class A-1, Class A-2, Class A-SB, Class A-3, Class A-4, Class A-S, Class B, Class C, Class D and Class E certificates for that distribution date, over (y) the amount of such yield maintenance charge or prepayment premium distributed to the Class A-S and Class B certificates as described above, and (d) to the holders of the Class X-D certificates, any remaining portion of the Non-Retained Certificates’ Percentage Allocation Entitlement of such yield maintenance charge or prepayment premium not distributed as described above, and (ii) to the RR Interest, its Percentage Allocation Entitlement of such yield maintenance charge or prepayment premium. All yield maintenance charges and prepayment premiums referred to above will be net of any liquidation fees payable therefrom. No prepayment premiums or yield maintenance charges will be distributed to the holders of the Class X-F, Class X-G, Class X-H, Class F, Class G, Class H, Class V or Class R Certificates. “Base Interest Fraction” means, with respect to any principal prepayment of any mortgage loan that provides for the payment of a yield maintenance charge or prepayment premium, and with respect to any class of principal balance certificates (other than the RR Interest), a fraction (A) the numerator of which is the greater of (x) zero and (y) the difference between (i) the pass-through rate on that class, and (ii) the applicable |
This is not a research report and was not prepared by any Underwriter’s research department. Please see additional important information and qualifications at the end of this Term Sheet.
T-7
| BANK 2019-BNK17 | Structural Overview |
| discount rate and (B) the denominator of which is the difference between (i) the mortgage interest rate on the related mortgage loan and (ii) the applicable discount rate; provided, that: under no circumstances will the Base Interest Fraction be greater than one; if the discount rate referred to above is greater than or equal to both the mortgage interest rate on the related mortgage loan and the pass-through rate on that class, then the Base Interest Fraction will equal zero; and if the discount rate referred to above is greater than or equal to the mortgage interest rate on the related mortgage loan and is less than the pass-through rate on that class, then the Base Interest Fraction will be equal to 1.0. Consistent with the foregoing, the Base Interest Fraction is equal to: | ||||
| (Pass-Through Rate – Discount Rate) | ||||
| (Mortgage Rate – Discount Rate) | ||||
| Realized Losses: | On each distribution date, immediately following the distributions to be made to the certificateholders on that date, the certificate administrator is required to calculate the amount, if any, by which (i) the aggregate stated principal balance of the mortgage loans, including any successor REO loans, expected to be outstanding immediately following that distribution date is less than (ii) the then aggregate certificate balance of the principal balance certificates after giving effect to distributions of principal on that distribution date. The Non-Retained Certificates’ Percentage Allocation Entitlement of such amount will be applied to the Class H, Class G, Class F, Class E, Class D, Class C, Class B and Class A-S certificates, in that order, in each case until the related certificate balance has been reduced to zero, and then to the Class A-1, Class A-2, Class A-SB, Class A-3 and Class A-4 certificates,pro rata based upon their respective certificate balances, until their respective certificate balances have been reduced to zero. The RR Interest’s Percentage Allocation Entitlement of such amount will be applied to the RR Interest until the related RR Interest balance has been reduced to zero. | |||
| Serviced Whole Loans: | Each of the following mortgaged properties or portfolio of mortgaged properties secures a mortgage loan and one or morepari passu promissory notes and, in some cases, one or more generally subordinate promissory notes (each, a “serviced companion loan”) that will be serviced pursuant to the related intercreditor agreement and the pooling and servicing agreement for this transaction: Tower 28 and Landmark West Loop. With respect to each such mortgaged property or portfolio of mortgaged properties, the related mortgage loan, together with the related serviced companion loan(s), is referred to herein (for so long as it is serviced under the pooling and servicing agreement for this transaction) as a “serviced whole loan.” Each serviced companion loan is not part of the mortgage pool and may be contributed to one or more future securitization transactions (if not already securitized) or may be otherwise transferred at any time, subject to compliance with the related intercreditor agreement. See the table below entitled “Mortgage Loans with Pari Passu Companion Loans,” as well as “Description of the Mortgage Pool—The Whole Loans” in the Preliminary Prospectus, for additional information regarding each such whole loan.
With respect to the Great Wolf Lodge Southern California whole loan (the “servicing shift whole loan”), the pooling and servicing agreement for this transaction will govern servicing of such whole loan until the securitization of the related promissory note designated Note A-1; however, servicing of such whole loan will generally be directed by the holder of the related control note (which is not included in this securitization), and such holder will have the right to replace the special servicer with respect to the related whole loan with or without cause. After the securitization of such promissory note, such loan will cease to be a serviced whole loan and will be serviced pursuant to the pooling and servicing agreement for another securitization transaction (see “—Non-Serviced Whole Loans” below). | |||
| Non-Serviced Whole Loans: | Each of the following mortgaged properties or portfolio of mortgaged properties secures a mortgage loan (each, a “non-serviced mortgage loan”), one or morepari passu promissory notes and, in some cases, one or more generally subordinate promissory notes (each such promissory note, a “non-serviced companion loan”) that will be serviced pursuant to the related intercreditor agreement and the pooling and servicing agreement or trust and servicing agreement (referred to herein as a related “pooling and servicing agreement”) for another securitization transaction: ILPT Hawaii Portfolio, Great Wolf Lodge Southern California (after the securitization of the related promissory note designated Note A-1) and Residence Inn National Portfolio. With respect to each such mortgaged property or portfolio of mortgaged properties, the related mortgage loan, together with the related non-serviced companion loan(s), is referred to herein (for so long as it is serviced under the pooling and servicing agreement for another securitization transaction) as a “non-serviced whole loan.” Each non-serviced companion loan is not part of the mortgage pool and may be contributed to one or more future securitization transactions (if not already securitized) or may be otherwise transferred at any time, subject to compliance with the related intercreditor agreement. Servicing of each non-serviced whole loan will generally be directed by the holder of the related control note (or, if such control note is included in a securitization, the directing certificateholder thereunder (or other party designated thereunder to exercise the rights of such control note)), and such holder will have the right to replace the special servicer with respect to the related whole loan with or without cause. See the tables below entitled “Mortgage Loans with Pari Passu Companion Loans” and“Mortgage Loans with Subordinate Debt,” as well as “Description of the Mortgage Pool—The Whole Loans” in the Preliminary Prospectus, for additional information regarding each such whole loan. | |||
Directing Certificateholder/ | The “Directing Certificateholder” will be (i) with respect to a servicing shift mortgage loan, the related Loan-Specific Directing Certificateholder, and (ii) with respect to each other mortgage loan, the Controlling Class | |||
This is not a research report and was not prepared by any Underwriter’s research department. Please see additional important information and qualifications at the end of this Term Sheet.
T-8
| BANK 2019-BNK17 | Structural Overview |
Certificateholder (or its representative) selected by more than 50% (by certificate balance) of the Controlling Class Certificateholders;provided, that (1) absent that selection, (2) until a Directing Certificateholder is so selected or (3) upon receipt of a notice from a majority of the Controlling Class Certificateholders (by certificate balance) that a Directing Certificateholder is no longer designated, the Controlling Class Certificateholder that owns the largest aggregate certificate balance of the Controlling Class (or its representative) will be the Directing Certificateholder;provided, that (a) in the case of clause (3), if no one holder owns the largest aggregate certificate balance of the Controlling Class, then there will be no Directing Certificateholder until appointed in accordance with the terms of the pooling and servicing agreement, and (b) the certificate administrator and the other parties to the pooling and servicing agreement will be entitled to assume that the identity of the Directing Certificateholder has not changed until such parties receive written notice of a replacement of the Directing Certificateholder from a party holding the requisite interest in the Controlling Class (as confirmed by the certificate registrar), or the resignation of the then current Directing Certificateholder.
As used herein, the term “Directing Certificateholder,” unless used in relation to a Servicing Shift Mortgage Loan, means the entity determined pursuant to clause (ii) of the definition of such term.
The “Loan-Specific Directing Certificateholder” with respect to a servicing shift mortgage loan is the “controlling holder”, the “directing certificateholder”, the “directing holder”, “directing lender” or any analogous concept under the related intercreditor agreement. Prior to the securitization of the related control note (or, with respect to the Great Wolf Lodge Southern California whole loan, promissory note A-1), the Loan-Specific Directing Certificateholder with respect to a servicing shift mortgage loan will be the holder of the related control note. On and after the securitization of the related control note (or, with respect to the Great Wolf Lodge Southern California whole loan, promissory note A-1), there will be no Loan-Specific Directing Certificateholder under the PSA with respect to such servicing shift mortgage loan.
The “Controlling Class” will be, as of any time of determination, the most subordinate class of Control Eligible Certificates then outstanding that has an aggregate certificate balance (as notionally reduced by any Cumulative Appraisal Reduction Amounts (as defined below) allocable to such class) at least equal to 25% of the initial certificate balance of that class; provided, that if at any time the certificate balances of the certificates other than the Control Eligible Certificates and the RR Interest have been reduced to zero as a result of principal payments on the mortgage loans, then the Controlling Class will be the most subordinate class of Control Eligible Certificates that has a certificate balance greater than zero without regard to any Cumulative Appraisal Reduction Amounts. The Controlling Class as of the closing date will be the Class H certificates.
The “Control Eligible Certificates” will be any of the Class F, Class G and Class H certificates. | ||
| Control Rights: | Prior to a Control Termination Event, the Directing Certificateholder will have certain consent and consultation rights under the pooling and servicing agreement with respect to certain major decisions and other matters. A “Control Termination Event” will occur when (i) the Class F certificates have a certificate balance (taking into account the application of the allocable portion of any Cumulative Appraisal Reduction Amounts to notionally reduce the certificate balance thereof) of less than 25% of the initial certificate balance of that class; or (ii) a holder of the Class F certificates is the majority controlling class certificateholder and has irrevocably waived its right, in writing, to exercise any of the rights of the controlling class certificateholder and such rights have not been reinstated to a successor controlling class certificateholder; provided that no Control Termination Event may occur with respect to the Loan-Specific Directing Certificateholder, and the term “Control Termination Event” will not be applicable to the Loan-Specific Directing Certificateholder; provided, further, that a Control Termination Event will be deemed not continuing in the event that the certificate balances of the principal balance certificates other than the Control Eligible Certificates and the RR Interest have been reduced to zero as a result of principal payments on the mortgage loans.
After the occurrence of a Control Termination Event but prior to the occurrence of a Consultation Termination Event, the Directing Certificateholder will not have any consent rights, but the Directing Certificateholder will have certain non-binding consultation rights under the pooling and servicing agreement with respect to certain major decisions and other matters. A “Consultation Termination Event” will occur when (i) no class of Control Eligible Certificates has a certificate balance (without regard to the application of the allocable portion of any Cumulative Appraisal Reduction Amounts) at least equal to 25% of the initial certificate balance of that class; or (ii) a holder of a majority of the Class F certificates is the majority controlling class certificateholder and has irrevocably waived its right, in writing, to exercise any of the rights of the controlling class certificateholder and such rights have not been reinstated to a successor controlling class certificateholder (provided that no Consultation Termination Event resulting solely from the operation of clause (ii) will be deemed to have existed or be in continuance with respect to a successor holder of the Class F certificates that has not irrevocably waived its right to exercise any of the rights of the controlling class certificateholder); provided that no Consultation Termination Event may occur with respect to the Loan-Specific Directing Certificateholder, and the term “Consultation Termination Event” will not be applicable to the Loan-Specific Directing Certificateholder; provided, further, that a Consultation Termination Event will be deemed not continuing in the event that the certificate balances of the principal balance certificates other than the Control Eligible Certificates and the RR Interest have been reduced to zero as a result of principal payments on the mortgage loans.
After the occurrence of a Consultation Termination Event, the Directing Certificateholder will not have any consent or consultation rights, except with respect to any rights expressly set forth in the pooling and servicing agreement, and the operating advisor will retain certain non-binding consultation rights under the pooling and servicing agreement with respect to certain major decisions and other matters.
Notwithstanding the proviso to the definitions of “Control Termination Event” and “Consultation Termination Event”, a Control Termination Event and a Consultation Termination Event will each be deemed to have occurred |
This is not a research report and was not prepared by any Underwriter’s research department. Please see additional important information and qualifications at the end of this Term Sheet.
T-9
| BANK 2019-BNK17 | Structural Overview |
with respect to any Excluded Loan with respect to the Directing Certificateholder or the holder of the majority of the Controlling Class, and neither the Directing Certificateholder nor any Controlling Class Certificateholder will have any consent or consultation rights with respect to the servicing of such Excluded Loan.
An “Excluded Loan” means (a) with respect to the Directing Certificateholder or the holder of the majority of the Controlling Class, a mortgage loan or whole loan with respect to which, as of any date of determination, the Directing Certificateholder or the holder of the majority of the Controlling Class is a Borrower Party or (b) with respect to the Risk Retention Consultation Party or the holder of the majority of the RR Interest, a mortgage loan or whole loan with respect to which, as of any date of determination, the Risk Retention Consultation Party or the holder of the majority of the RR Interest is a Borrower Party. It is expected that there will be no Excluded Loans with respect to this securitization on the Closing Date.
“Borrower Party” means a borrower, a mortgagor, a manager of a mortgaged property, the holder of a mezzanine loan that has been accelerated or as to which foreclosure or enforcement proceedings have been commenced against the equity collateral pledged to secure the related mezzanine loan, or any Borrower Party Affiliate. With respect to a mortgage loan secured by a residential cooperative property, a person will not be considered a “Borrower Party” solely by reason of such person holding one or more cooperative unit loans that are secured by direct equity interests in the related borrower or owning one or more residential cooperative units comprising the related mortgaged property as a result of any foreclosure, transfer in lieu of foreclosure or other exercise of remedies with respect to any such unit loan(s).
“Borrower Party Affiliate” means, with respect to a borrower, a mortgagor, a manager of a mortgaged property or the holder of a mezzanine loan that has been accelerated or as to which foreclosure or enforcement proceedings have been commenced against the equity collateral pledged to secure the related mezzanine loan, (a) any other person controlling or controlled by or under common control with such borrower, mortgagor, manager or mezzanine lender, as applicable, or (b) any other person owning, directly or indirectly, 25% or more of the beneficial interests in such borrower, mortgagor, manager or mezzanine lender, as applicable. For the purposes of this definition, “control” when used with respect to any specified person means the power to direct the management and policies of such person, directly or indirectly, whether through the ownership of voting securities, by contract or otherwise and the terms “controlling” and “controlled” have meanings correlative to the foregoing.
Notwithstanding any of the foregoing to the contrary, if any mortgage loan is part of a whole loan, the Directing Certificateholder’s consent and/or consultation rights with respect thereto may be limited as described in the Preliminary Prospectus. In particular, with respect to each non-serviced whole loan and each servicing shift whole loan, the Directing Certificateholder (other than a Loan-Specific Directing Certificateholder) will only have certain consultation rights with respect to certain major decisions and other matters related to such whole loan, in each case only prior to a Control Termination Event or Consultation Termination Event, as applicable, and the Loan-Specific Directing Certificateholder will be entitled to similar consent and/or consultation rights with respect to such whole loan. In addition, with respect to any serviced A/B whole loan, for so long as the holder of the related subordinate companion loan is the controlling note holder, the holder of such subordinate companion loan (rather than the Directing Certificateholder) will be entitled to exercise such consent and consultation rights with respect to such whole loan.
| ||
Appraisal Reduction Amounts and Collateral Deficiency Amounts: |
An “Appraisal Reduction Amount” generally will be created in the amount, if any, by which the principal balance of a required appraisal loan (which is a mortgage loan with respect to which certain defaults, modifications or insolvency events have occurred as further described in the Preliminary Prospectus) plus other amounts overdue or advanced in connection with such mortgage loan exceeds 90% of the appraised value of the related mortgaged property plus certain escrows and reserves (including letters of credit) held with respect to the mortgage loan.
A mortgage loan will cease to be subject to an Appraisal Reduction Amount when it has been brought current for at least three consecutive months, no additional event of default is foreseeable in the reasonable judgment of the special servicer and no other circumstances exist that would cause such mortgage loan or any related companion loan to be a specially serviced loan; however, a “Collateral Deficiency Amount” may exist with respect to any mortgage loan that is modified into an AB loan structure (an “AB Modified Loan”) and remains a corrected mortgage loan and, if so, will generally equal the excess of (i) the stated principal balance of such AB Modified Loan (taking into account the related junior note(s) and anypari passu notes included therein), over (ii) the sum of (in the case of a whole loan, solely to the extent allocable to the subject mortgage loan) (x) the most recent appraised value for the related mortgaged property or mortgaged properties, plus (y) solely to the extent not reflected or taken into account in such appraised value (or in the calculation of any related Appraisal Reduction Amount) and to the extent on deposit with, or otherwise under the control of, the lender as of the date of such determination, any capital or additional collateral contributed by the related borrower at the time the mortgage loan became (and as part of the modification related thereto) such AB Modified Loan for the benefit of the related mortgaged property or mortgaged properties (provided that in the case of an non-serviced mortgage loan, the amounts set forth in this clause (y) will be taken into account solely to the extent relevant information is received by the master servicer), plus (z) any other escrows or reserves (in addition to any amounts set forth in the immediately preceding clause (y) and solely to the extent not reflected or taken into account in the calculation of any related Appraisal Reduction Amount) held by the lender in respect of such AB Modified Loan as of the date of such determination, which such excess, for the avoidance of doubt, will be determined separately from and exclude any related Appraisal Reduction Amounts. |
This is not a research report and was not prepared by any Underwriter’s research department. Please see additional important information and qualifications at the end of this Term Sheet.
T-10
| BANK 2019-BNK17 | Structural Overview |
As used herein, a “Cumulative Appraisal Reduction Amount” will be the sum of any Appraisal Reduction Amounts and any Collateral Deficiency Amounts.
Any Appraisal Reduction Amount in respect of any non-serviced mortgage loan generally will be calculated in accordance with the other servicing agreement pursuant to which such mortgage loan is being serviced, which calculations are expected to be generally similar to those provided for in the pooling and servicing agreement for this transaction.
If any mortgage loan is part of a whole loan, any Appraisal Reduction Amount or Collateral Deficiency Amount will (or effectively will) be calculated in respect of such whole loan taken as a whole and allocated, to the extent provided in the related intercreditor agreement and the related pooling and servicing agreement,first, to any related subordinate companion loan, andsecond, to the related mortgage loan and anypari passu companion loan on apro rata basis by unpaid principal balance.
Appraisal Reduction Amounts will proportionately reduce the interest portion of debt service advances required to be made in respect of the related mortgage loan. Appraisal Reduction Amounts and Collateral Deficiency Amounts (in each case, to the extent of the Non-Retained Certificates’ Percentage Allocation Entitlement thereof) will be taken into account in determining the identity of the controlling class entitled to appoint the Directing Certificateholder, the existence of a Control Termination Event and the allocation and/or exercise of voting rights for certain purposes (see“Directing Certificateholder/Controlling Class” above). | ||
| Appraised-Out Class: | An “Appraised-Out Class” is any class of Control Eligible Certificates, the certificate balance of which (taking into account the application of the Non-Retained Certificates’ Percentage Allocation Entitlement of any Appraisal Reduction Amounts or Collateral Deficiency Amounts to notionally reduce the certificate balance of such class) has been reduced to less than 25% of its initial certificate balance. Any Appraised-Out Class may not exercise any direction, control, consent and/or similar rights of the Controlling Class until such time, if any, as such class is reinstated as the Controlling Class, and the rights of the Controlling Class will be exercised by the next most senior class of Control Eligible Certificates that is not an Appraised-Out Class, if any, during such period. | |
| Appraisal Remedy: | The holders of the majority (by certificate balance) of an Appraised-Out Class (such holders, the “Requesting Holders”) will have the right, at their sole expense, to require the special servicer to order (or, with respect to a non-serviced mortgage loan, require the master servicer to request from the applicable non-serviced special servicer) a second appraisal of any mortgage loan (or serviced whole loan) for which an appraisal reduction event has occurred or as to which there exists a Collateral Deficiency Amount. With respect to any serviced mortgage loan, the special servicer will be required to use its reasonable efforts to ensure that such appraisal is delivered within 30 days from receipt of the Requesting Holders’ written request and will be required to cause such appraisal to be prepared on an “as-is” basis by an MAI appraiser. With respect to any non-serviced mortgage loan, the master servicer will be required to use commercially reasonable efforts to obtain such second appraisal from the applicable non-serviced special servicer and to forward such second appraisal to the special servicer. Upon receipt of such supplemental appraisal, the master servicer (for Collateral Deficiency Amounts on non-serviced mortgage loans), the non-serviced special servicer (for Appraisal Reduction Amounts on non-serviced mortgage loans to the extent provided for in the related pooling and servicing agreement and applicable intercreditor agreement) and the special servicer (for any serviced mortgage loan) will be required to determine, in accordance with the Servicing Standard, whether, based on its assessment of such supplemental appraisal, any recalculation of the applicable Appraisal Reduction Amount or Collateral Deficiency Amount is warranted and, if so warranted, such person will be required to recalculate such Appraisal Reduction Amount or Collateral Deficiency Amount, as applicable, based upon such supplemental appraisal and (for any serviced mortgage loan) receipt of information from the master servicer as described above. If required by any such recalculation, the applicable Appraised-Out Class will be reinstated as the Controlling Class and each Appraised-Out Class will, if applicable, have its related certificate balance notionally restored to the extent required by such recalculation of the Appraisal Reduction Amount or Collateral Deficiency Amount, if applicable.
In addition, the Requesting Holders of any Appraised-Out Class will have the right to challenge the Appraisal Reduction Amount and to require the special servicer to order an additional appraisal of any serviced mortgage loan as to which there exists a Collateral Deficiency Amount if an event has occurred at, or with respect to, the related mortgaged property or mortgaged properties that would have a material effect on its or their appraised value, and the special servicer is required to use reasonable efforts to obtain an appraisal from an MAI appraiser reasonably acceptable to the special servicer within 30 days from receipt of the Requesting Holders’ written request. | |
| Sale of Defaulted Loans: | Under certain circumstances the special servicer may be required to use reasonable efforts to solicit offers for a defaulted serviced mortgage loan (and any related companion loan (to the extent provided under the related intercreditor agreement) and/or related REO properties).
The Directing Certificateholder will not have a right of first refusal to purchase a defaulted loan.
If the special servicer does not receive an offer at least equal to the outstanding principal balance plus all accrued and unpaid interest and outstanding costs and expenses and certain other amounts specified in the pooling and servicing agreement (the “Par Purchase Price”), the special servicer may purchase the defaulted loan or REO property at the Par Purchase Price or may accept the first cash offer received from any person that is determined to be a fair price for such defaulted loan or REO property. If multiple offers are received during the period designated by the special servicer for receipt of offers, the special servicer is generally required to select the highest offer. The special servicer will be required to determine whether any cash offer constitutes a fair price for any defaulted loan or REO property if the highest offeror is a person other than a |
This is not a research report and was not prepared by any Underwriter’s research department. Please see additional important information and qualifications at the end of this Term Sheet.
T-11
| BANK 2019-BNK17 | Structural Overview |
party to the pooling and servicing agreement for this transaction (the “PSA”), the Directing Certificateholder, the Risk Retention Consultation Party, any sponsor, any Borrower Party, any independent contractor engaged by the special servicer, the trustee for the securitization of a related companion loan (with respect to a whole loan if it is a defaulted loan), any related companion loan holder or its representative, any holder of a related mezzanine loan or any known affiliate of any of the preceding entities (each, an “Interested Person”). If an offer is made by an Interested Person, the trustee will be required to determine (based upon the most recent appraisal conducted in accordance with the terms of the PSA) whether the offer constitutes a fair price for the defaulted loan or REO property unless (i) the offer is equal to or greater than the applicable Par Purchase Price and (ii) the offer is the highest offer received. Absent an offer at least equal to the Par Purchase Price, no offer from an Interested Person will constitute a fair price unless (x) it is the highest offer received and (y) at least two other offers are received from independent third parties. Neither the trustee nor any of its affiliates may make an offer for or purchase any specially serviced loan or REO property.
Notwithstanding any of the foregoing to the contrary, the special servicer is not required to accept the highest offer and may accept a lower offer for a defaulted loan or REO property if the special servicer determines, in accordance with the Servicing Standard (and subject to the requirements of any related intercreditor agreement), that a rejection of such offer would be in the best interests of the certificateholders and any related companion loan holders as a collective whole as if they constituted a single lender (and with respect to a serviced A/B whole loan, taking into account the subordinate nature of any related subordinate companion loan), so long as such lower offer was not made by the special servicer or any of its affiliates.
If title to any mortgaged property is acquired by the trust fund, the special servicer will generally be required to sell such mortgaged property prior to the close of the third calendar year beginning after the year of acquisition.
The foregoing applies to mortgage loans serviced under the PSA. With respect to any non-serviced whole loan, if the special servicer under the applicable pooling and servicing agreement determines to sell the related controlling companion loan if it becomes a defaulted loan, then the applicable special servicer will be required to sell the related whole loan, including the related mortgage loan included in the BANK 2019-BNK17 securitization trust and the relatedpari passucompanion loan(s) and, under certain circumstances, any subordinate companion loan(s), as a single loan. In connection with any such sale, the special servicer under the applicable pooling and servicing agreement will be required to follow procedures substantially similar to those set forth above. | ||
| Risk Retention Consultation Party: | A risk retention consultation party may be appointed by the holder or holders of more than 50% of the RR Interest, by certificate balance. The majority RR Interest holder will have a continuing right to appoint, remove or replace the risk retention consultation party in its sole discretion. This right may be exercised at any time and from time to time. Except with respect to an Excluded Loan as to such party or the holder of the majority of the RR Interest, the risk retention consultation party will be entitled to consult with the special servicer, upon request of the risk retention consultation party, with respect to certain material servicing actions proposed by the special servicer; provided, that prior to the occurrence and continuance of a Consultation Termination Event, such mortgage loan must also be a specially serviced mortgage loan. | |
Appointment and Replacement of Special Servicer: |
The Directing Certificateholder will appoint the initial special servicer as of the closing date. Prior to the occurrence and continuance of a Control Termination Event, the special servicer may generally be replaced by the Directing Certificateholder with or without cause at any time.
After the occurrence and during the continuance of a Control Termination Event and upon (a) the written direction of holders of principal balance certificates evidencing not less than 25% of the voting rights of all classes of certificates (other than the RR Interest) entitled to principal (taking into account the application of Cumulative Appraisal Reduction Amounts to notionally reduce the certificate balances of classes to which such Cumulative Appraisal Reduction Amounts are allocable) requesting a vote to replace the special servicer with a replacement special servicer, (b) payment by such requesting holders to the certificate administrator of all reasonable fees and expenses to be incurred by the certificate administrator in connection with administering such vote and (c) delivery by such holders of a rating agency confirmation from each applicable rating agency, the certificate administrator will be required to promptly post such notice on its internet website and by mail and conduct the solicitation of votes of all certificates in such regard, which requisite affirmative votes must be received within 180 days of the posting of such notice. Upon the written direction of holders of at least 66 2/3% of a Certificateholder Quorum, the trustee will be required to immediately replace the special servicer with a qualified replacement special servicer designated by such holders of certificates.
After the occurrence and during the continuance of a Consultation Termination Event, if the operating advisor determines that the special servicer is not performing its duties as required under the pooling and servicing agreement or is otherwise not acting in accordance with the Servicing Standard, the operating advisor may also recommend the replacement of the special servicer. The operating advisor’s recommendation to replace the special servicer must be confirmed by an affirmative vote of holders of principal balance certificates evidencing at least a majority of the aggregate voting rights (taking into account the application of any Cumulative Appraisal Reduction Amounts to notionally reduce the respective certificate balances) of all principal balance certificates on an aggregate basis (which requisite affirmative vote must be received within 180 days of posting of the notice of the operating advisor’s recommendation to the certificate administrator’s website).
A “Certificateholder Quorum” means, in connection with any solicitation of votes in connection with the replacement of the special servicer or the asset representations reviewer, the holders of certificates |
This is not a research report and was not prepared by any Underwriter’s research department. Please see additional important information and qualifications at the end of this Term Sheet.
T-12
| BANK 2019-BNK17 | Structural Overview |
evidencing at least 50% of the aggregate voting rights (taking into account the application of realized losses and, other than with respect to the termination of the asset representations reviewer, any Cumulative Appraisal Reduction Amounts to notionally reduce the certificate balance of the certificates) of all classes of certificates entitled to principal (other than the RR Interest) on an aggregate basis.
With respect to each serviced whole loan, any holder of a relatedpari passu companion loan, following a servicer termination event with respect to the special servicer that affects such holder, will be entitled to direct the trustee (and the trustee will be required) to terminate the special servicer solely with respect to such serviced whole loan. A replacement special servicer will be selected by the trustee or, prior to a Control Termination Event, by the Directing Certificateholder;provided, that any successor special servicer appointed to replace the special servicer with respect to such whole loan cannot be the entity (or its affiliate) that was terminated at the direction of the holder of the relatedpari passucompanion loan.
Notwithstanding any of the foregoing to the contrary, with respect to each servicing shift whole loan and any serviced A/B whole loans as to which a subordinate companion loan holder is the related controlling note holder, the holder of the related control note will be entitled to replace the special servicer with respect to such whole loan at any time, with or without cause, and while it is a serviced whole loan, no other party may replace the special servicer for such whole loan unless there is a servicer termination event with respect thereto.
With respect to any non-serviced whole loan, the BANK 2019-BNK17 trust, as holder of the related mortgage loan, has the right to terminate the special servicer under the related pooling and servicing agreement if a servicer termination event occurs, with respect to such special servicer that affects the trust in its capacity as such holder. Such rights may be exercised by the Directing Certificateholder prior to a Consultation Termination Event (or the operating advisor, following the occurrence and during the continuance of a Consultation Termination Event). The successor special servicer will be selected pursuant to the applicable pooling and servicing agreement by the related directing holder prior to a control termination event under such pooling and servicing agreement. | ||
| Servicing Standard: | Each of the master servicer and special servicer is obligated to service and administer the mortgage loans (and, if applicable, the serviced companion loans) in accordance with the definition of the “Servicing Standard” described in the Preliminary Prospectus and the terms of the pooling and servicing agreement, provided that each non-serviced mortgage loan, if any, will be serviced by another master servicer or special servicer under the pooling and servicing agreement with respect to the securitization of a related companion loan, which entities will be obligated to service and administer such non-serviced mortgage loan pursuant to a similar standard set forth in the related pooling and servicing agreement. | |
| Excluded Special Servicer: | If the special servicer obtains knowledge that it has become a Borrower Party with respect to any mortgage loan (an “Excluded Special Servicer Loan”), the special servicer will be required to resign as special servicer of that Excluded Special Servicer Loan. Prior to the occurrence of a Control Termination Event, the Directing Certificateholder will be required to appoint (and may remove and replace with or without cause) a separate special servicer that is not a Borrower Party (an “Excluded Special Servicer”) with respect to any Excluded Special Servicer Loan, unless such Excluded Special Servicer Loan is also an Excluded Loan with respect to the Directing Certificateholder or the holder of the majority of the Controlling Class. After the occurrence and during the continuance of a Control Termination Event, if at any time the applicable Excluded Special Servicer Loan is also an Excluded Loan with respect to the Directing Certificateholder or the holder of the majority of the Controlling Class or if the Directing Certificateholder is entitled to appoint the Excluded Special Servicer but does not so appoint within 30 days of notice of such resignation, the resigning special servicer will be required to use reasonable efforts to select the related Excluded Special Servicer. Any Excluded Special Servicer will be required to perform all of the obligations of the special servicer and will be entitled to all special servicing compensation with respect to such Excluded Special Servicer Loan earned while the related mortgage loan is an Excluded Special Servicer Loan. | |
| Liquidated Loan Waterfall: |
On liquidation of any mortgage loan, all net liquidation proceeds related to the mortgage loan (but not any related companion loan) will be applied so that amounts allocated as a recovery of accrued and unpaid interest will not, in the first instance, include any delinquent interest that was not advanced as a result of Appraisal Reduction Amounts or accrued on the portion of the stated principal balance thereof equal to any related Collateral Deficiency Amount in effect from time to time and as to which no advance was made. After the adjusted interest amount is so allocated, any remaining liquidation proceeds will be allocated to pay principal on the mortgage loan until the unpaid principal amount of the mortgage loan has been reduced to zero. Any remaining liquidation proceeds will then be allocated to pay delinquent interest that was not advanced as a result of Appraisal Reduction Amounts or that accrued on the portion of the stated principal balance thereof equal to any related Collateral Deficiency Amount in effect from time to time and as to which no advance was made. | |
| Operating Advisor: | The operating advisor will be required to perform certain review duties if a Control Termination Event has occurred and is continuing, which will generally include a limited annual review of, and the preparation of a report regarding, certain actions of the special servicer with respect to the resolution and/or liquidation of specially serviced loans. The review and report generally will be based on any asset status reports and additional information delivered to the operating advisor by the special servicer. In addition, if a Control Termination Event has occurred and is continuing, the special servicer must consult with the operating advisor (in addition to the Directing Certificateholder if no Consultation Termination Event has occurred and is continuing) in connection with major decisions with respect to mortgage loans. Furthermore, under certain circumstances, but only if a Consultation Termination Event has occurred and is continuing, the operating |
This is not a research report and was not prepared by any Underwriter’s research department. Please see additional important information and qualifications at the end of this Term Sheet.
T-13
| BANK 2019-BNK17 | Structural Overview |
advisor may recommend the replacement of the special servicer as described above under “—Appointment and Replacement of Special Servicer”; however, the operating advisor will not have any rights or obligations with respect to a non-serviced whole loan.
If a Consultation Termination Event has occurred and is continuing, the operating advisor may be removed and replaced without cause upon the affirmative direction of certificates owners holding not less than 75% of the voting rights of all certificates (taking into account the application of Cumulative Appraisal Reduction Amounts), following a proposal from certificate owners holding not less than 25% of the voting rights of all certificates (taking into account the application of Cumulative Appraisal Reduction Amounts). The certificateholders who initiate a vote on a termination and replacement of the operating advisor without cause must cause the payment of the fees and expenses incurred in the replacement. In addition, in the event there are no classes of certificates outstanding other than the Control Eligible Certificates, the RR Interest and the Class X-F, Class X-G, Class X-H, Class V and Class R certificates, then all of the rights and obligations of the operating advisor under the PSA will terminate without payment of any penalty or termination fee (other than any rights or obligations that accrued prior to the date of such termination (including accrued and unpaid compensation) and other than indemnification rights arising out of events occurring prior to such termination). See “Pooling and Servicing Agreement—The Operating Advisor—Termination of the Operating Advisor Without Cause” in the Preliminary Prospectus. | ||
| Asset Representations Reviewer: | The asset representations reviewer will be required to review certain delinquent mortgage loans after a specified delinquency threshold has been met and the required percentage of certificateholders vote to direct a review as described below. The asset representations reviewer will be entitled to the Asset Representations Reviewer Fee with respect to such review. See “Pooling and Servicing Agreement—The Asset Representations Reviewer” in the Preliminary Prospectus.
The certificate administrator will be required to notify certificateholders if the specified delinquency threshold has been met as described in the Preliminary Prospectus under “—The Asset Representations Reviewer”.
If certificateholders evidencing not less than 5.0% of the voting rights request a vote to commence an asset review, and if subsequently (i) a majority of those certificateholders who cast votes and (ii) a majority of an Asset Review Quorum authorizes an asset review within 150 days of the request for a vote, the asset representations reviewer will be required to conduct an asset review of delinquent loans.
The asset representations reviewer may be terminated and replaced without cause. Upon (i) the written direction of certificateholders evidencing not less than 25% of the voting rights (without regard to the application of any Cumulative Appraisal Reduction Amounts) requesting a vote to terminate and replace the asset representations reviewer with a proposed successor asset representations reviewer that is an eligible asset representations reviewer, and (ii) payment by such holders to the certificate administrator of the reasonable fees and expenses to be incurred by the certificate administrator in connection with administering such vote, the certificate administrator will be required to promptly provide notice to all certificateholders and the asset representations reviewer of such request by posting such notice on its internet website, and by mailing such notice to all certificateholders and the asset representations reviewer. Upon the written direction of certificateholders evidencing at least 75% of a Certificateholder Quorum (without regard to the application of any Cumulative Appraisal Reduction Amounts), the trustee will be required to terminate all of the rights and obligations of the asset representations reviewer under the pooling and servicing agreement (other than any rights or obligations that accrued prior to the date of such termination and other than indemnification rights arising out of events occurring prior to such termination) by written notice to the asset representations reviewer, and the proposed successor asset representations reviewer will be appointed. See “Pooling and Servicing Agreement—The Asset Representations Reviewer” in the Preliminary Prospectus.
An “Asset Review Quorum” means, in connection with any solicitation of votes to authorize an Asset Review as described above, the holders of certificates evidencing at least 5.0% of the aggregate voting rights represented by all certificates that have voting rights. | |
| Dispute Resolution Provisions: | The mortgage loan sellers will be subject to the dispute resolution provisions set forth in the PSA to the extent those provisions are triggered with respect to any mortgage loan sold to the depositor by a mortgage loan seller, and such mortgage loan seller will be obligated under the related mortgage loan purchase agreement to comply with all applicable provisions and to take part in any mediation or arbitration proceedings that may result. Generally, in the event that a Repurchase Request is not “Resolved” within 180 days after the related mortgage loan seller receives such Repurchase Request, then the enforcing servicer will be required to send a notice to the first certificateholder (or beneficial owner) to deliver a certificateholder repurchase request with respect to the mortgage loan (the “Initial Requesting Certificateholder”) (if any) and to the certificate administrator (which will be required to make such notice available to certificateholders via the certificate administrator’s website) indicating the enforcing servicer’s intended course of action with respect to the Repurchase Request. If (a) the enforcing servicer’s intended course of action with respect to the Repurchase Request does not involve pursuing further action to exercise rights against the related mortgage loan seller with respect to the Repurchase Request and the Initial Requesting Certificateholder, if any, or any other certificateholder or certificate owner wishes to exercise its right to refer the matter to mediation (including nonbinding arbitration) or arbitration, or (b) the enforcing servicer’s intended course of action is to pursue further action to exercise rights against the related mortgage loan seller with respect to the Repurchase Request but the Initial Requesting Certificateholder, if any, or any other certificateholder or certificate owner does not agree with the dispute resolution method selected by the enforcing servicer, then the Initial Requesting Certificateholder, if any, or such other certificateholder or certificate owner may deliver a written notice to the enforcing servicer indicating its intent to exercise its right to refer the matter to either mediation or arbitration. |
This is not a research report and was not prepared by any Underwriter’s research department. Please see additional important information and qualifications at the end of this Term Sheet.
T-14
| BANK 2019-BNK17 | Structural Overview |
| “Resolved” means, with respect to a Repurchase Request, (i) that the related material defect or breach has been cured, (ii) the related mortgage loan has been repurchased in accordance with the related mortgage loan purchase agreement, (iii) a mortgage loan has been substituted for the related mortgage loan in accordance with the related mortgage loan purchase agreement, (iv) the applicable mortgage loan seller has made a loss of value payment, (v) a contractually binding agreement has been entered into between the enforcing servicer, on behalf of the issuing entity, and the related mortgage loan seller that settles the related mortgage loan seller’s obligations under the related mortgage loan purchase agreement, or (vi) the related mortgage loan is no longer property of the issuing entity as a result of a sale or other disposition in accordance with the pooling and servicing agreement. See “Pooling and Servicing Agreement—Dispute Resolution Provisions” in the Preliminary Prospectus. | ||
| Investor Communications: | The certificate administrator is required to include on any Form 10-D any request received from a certificateholder to communicate with other certificateholders related to certificateholders exercising their rights under the terms of the PSA. Any certificateholder wishing to communicate with other certificateholders regarding the exercise of its rights under the terms of the PSA will be able to deliver a written request signed by an authorized representative of the requesting investor to the certificate administrator. | |
| Deal Website: | The certificate administrator will be required to maintain a deal website which will include, among other items: (a) summaries of asset status reports prepared by the special servicer, (b) inspection reports, (c) appraisals, (d) various “special notices” described in the Preliminary Prospectus, (e) the “Investor Q&A Forum” and (f) a voluntary “Investor Registry”. Investors may access the deal website following execution of a certification and confidentiality agreement. |
This is not a research report and was not prepared by any Underwriter’s research department. Please see additional important information and qualifications at the end of this Term Sheet.
T-15
| BANK 2019-BNK17 | Collateral Overview |
| Mortgage Loan Sellers | No. of Mortgage Loans | No. of Mortgaged Properties | Aggregate Cut-off Date Balance | % of Pool(1) | ||||
| Morgan Stanley Mortgage Capital Holdings LLC | 19 | 207 | $346,665,593 | 41.6% | ||||
| Bank of America, National Association | 13 | 15 | $261,367,117 | 31.4% | ||||
| Wells Fargo Bank, National Association | 17 | 17 | $224,993,852 | 27.0% | ||||
| Total: | 49 | 239 | $833,026,562 | 100.0% |
Pool Statistics
| Aggregate Cut-off Date Balance: | $833,026,562 |
| Number of Mortgage Loans: | 49 |
| Average Cut-off Date Balance per Mortgage Loan: | $17,000,542 |
| Number of Mortgaged Properties: | 239 |
| Average Cut-off Date Balance per Mortgaged Property: | $3,485,467 |
| Weighted Average Mortgage Rate: | 4.6181% |
| % of Pool Secured by 5 Largest Mortgage Loans: | 34.7% |
| % of Pool Secured by 10 Largest Mortgage Loans: | 57.2% |
| % of Pool Secured by ARD Loans(2): | 0.0% |
| Weighted Average Original Term to Maturity (months)(2): | 119 |
| Weighted Average Remaining Term to Maturity (months)(2): | 118 |
| Weighted Average Seasoning (months): | 1 |
| % of Pool Secured by Single Tenant Mortgaged Properties: | 12.2% |
| % of Pool Secured by Refinance Loans: | 43.1% |
| % of Pool Secured by Acquisition Loans: | 50.9% |
| % of Pool Secured by Recapitalization Loans: | 6.0% |
Additional Debt
| % of Pool withPari Passu Mortgage Debt: | 16.9% |
| % of Pool with Subordinate Mortgage Debt(3): | 14.5% |
| % of Pool with Mezzanine Debt: | 11.5% |
Credit Statistics(4)(5)
| Weighted Average UW NOI DSCR: | 2.41x |
| Weighted Average UW NOI Debt Yield(6): | 12.5% |
| Weighted Average UW NCF DSCR(6): | 2.31x |
| Weighted Average UW NCF Debt Yield(6): | 12.0% |
| Weighted Average Cut-off Date LTV Ratio(6)(7): | 55.2% |
| Weighted Average Maturity Date LTV Ratio(2)(6)(7): | 51.9% |
Footnotes are set forth on the following page.
This is not a research report and was not prepared by any Underwriter’s research department. Please see additional important information and qualifications at the end of this Term Sheet.
T-16
| BANK 2019-BNK17 | Collateral Overview |
Amortization
| Weighted Average Original Amortization Term (months)(8): | 359 |
| Weighted Average Remaining Amortization Term (months)(8): | 358 |
| % of Pool Interest Only through Maturity: | 60.2% |
| % of Pool Interest Only followed by Amortizing Balloon: | 22.9% |
| % of Pool Amortizing Balloon: | 16.9% |
Lockboxes
| % of Pool with Springing Lockboxes: | 44.1% |
| % of Pool with Hard Lockboxes: | 36.0% |
| % of Pool with Soft Lockboxes: | 16.5% |
| % of Pool with No Lockboxes: | 3.4% |
Reserves
| % of Pool Requiring Tax Reserves: | 69.2% |
| % of Pool Requiring Insurance Reserves: | 26.0% |
| % of Pool Requiring Replacement Reserves: | 60.8% |
| % of Pool Requiring TI/LC Reserves(9): | 57.6% |
Call Protection
| % of Pool with lockout period, followed by defeasance until open period: | 73.4% |
| % of Pool with lockout period, followed by defeasance or the greater of a prepayment premium and yield maintenance until open period: | 15.3% |
| % of Pool with lockout period, followed by the greater of a prepayment premium and yield maintenance until open period: | 11.4% |
| (1) | Unless otherwise indicated, all references to “% of Pool” in this Term Sheet reflect a percentage of the aggregate principal balance of the mortgage pool as of the Cut-off Date, after application of all payments of principal due during or prior to April 2019. |
| (2) | With respect to any ARD Loan, unless otherwise indicated, references in this Term Sheet to the applicable “maturity date” or “maturity” refer to the applicable anticipated repayment date with respect to such ARD Loan, and such applicable anticipated repayment date is treated as its maturity date for all purposes hereof. |
| (3) | One (1) of the mortgage loans, which is secured by a residential cooperative property, currently has in place subordinate secured lines of credit to the related mortgage borrower that permits future advances (such loans, collectively, the “Subordinate Coop LOCs”). The percentage figure expressed as “% of Pool with Subordinate Mortgage Debt” is determined as a percentage of the initial pool balance and does not take into account any Subordinate Coop LOCs or future subordinate debt (whether or not secured by the mortgaged property), if any, that may be permitted under the terms of any mortgage loan or the pooling and servicing agreement. See “Description of the Mortgage Pool—Additional Indebtedness—Other Secured Indebtedness”and“Description of the Mortgage Pool—Additional Debt Financing for Mortgage Loans Secured by Residential Cooperatives” in the Preliminary Prospectus. |
| (4) | With respect to any mortgage loan that is part of a whole loan, unless otherwise indicated, all LTV, DSCR and Debt Yield calculations in this Term Sheet include any relatedpari passu companion loans and exclude any subordinate companion loans, as applicable. Additionally, LTV, DSCR and Debt Yield figures in this Term Sheet are calculated for mortgage loans without regard to any additional indebtedness that may be incurred at a future date. For mortgaged properties securing residential cooperative mortgage loans all LTV, DSCR and Debt Yield calculations do not take into account any subordinate debt (whether or not secured by the related mortgaged property), that currently exists or is allowed under the terms of any mortgage loan. With respect to any leased fee loans, the SF/Units and Balance per SF/Unit figures in this Term Sheet are based on the size of the non-collateral improvements. |
| (5) | For mortgaged properties securing residential cooperative mortgage loans, all DSCR and Debt Yield calculations for each such mortgaged property is calculated using underwritten net operating income or underwritten net cash flow, as applicable, for the related residential cooperative property which is the projected net operating income or net cash flow, as applicable, reflected in the most recent appraisal obtained by or otherwise in the possession of the related mortgage loan seller as of the Cut-off Date. All LTV ratio calculations are based upon the appraised value of the residential cooperative property determined as if such residential cooperative property is operated as a residential cooperative, inclusive of the amount of the underlying debt encumbering such residential cooperative property. |
| (6) | With respect to certain mortgage loans, DSCRs, debt yields and LTVs (such as, for example, UW NOI Debt Yield, UW NCF Debt Yield or Cut-off Date LTV Ratio) have been calculated based on a principal balance that is net of a holdback or earnout reserve. Such mortgage loans are identified under the definitions of “Underwritten NOI Debt Yield”, “Underwritten NCF Debt Yield” and “Cut-off Date LTV Ratio” set forth under “Description of the Mortgage Pool—Certain Calculations and Definitions” in the Preliminary Prospectus. |
| (7) | The LTV ratios set forth in this Term Sheet are generally based on the “as-is” values of the related mortgaged properties; provided that the “as-is” value for a portfolio of mortgaged properties may include a premium relating to the valuation of the mortgaged properties as a whole rather than as the sum of individually valued mortgaged properties; provided, further, that such LTV ratios may be based on “as-stabilized”, “as complete” or other contingent values in certain cases in which reserves have been established at origination for the applicable condition or circumstance that is expected to result in stabilization provided, further, that such LTV ratios may have been calculated based on a principal balance that is net of a holdback or earnout reserve. See the definition of “Appraised Value” under“Description of the Mortgage Pool—Certain Calculations and Definitions”in the Preliminary Prospectus. |
| (8) | Excludes mortgage loans that provide for payments of interest only through the related maturity date or anticipated repayment date, as applicable. |
| (9) | Excludes hospitality, multifamily, manufactured housing and self storage properties. |
This is not a research report and was not prepared by any Underwriter’s research department. Please see additional important information and qualifications at the end of this Term Sheet.
T-17
| BANK 2019-BNK17 | Characteristics of the Mortgage Loans |
| Top 10 Mortgage Loans or Groups of Cross-Collateralized Mortgage Loans(1) | ||||||||||||||||||||||||||
| Loan No. | Mortgage Loan Seller | Property Name | City | State | Property Type | Cut-off Date Balance | % of Pool | SF/Units/ Rooms | Cut-off Date Balance per SF/Unit/Room | UW NCF DSCR | UW NOI Debt Yield | Cut-off Date LTV | Maturity Date LTV | |||||||||||||
| 1 | BANA | Newport Office Center VI | Jersey City | NJ | Office | $63,500,000 | 7.6% | 430,239 | $147.59 | 2.13x | 10.1% | 49.2% | 49.2% | |||||||||||||
| 2 | BANA | 350 Rhode Island South | San Francisco | CA | Office | $62,500,000 | 7.5% | 138,393 | $451.61 | 2.40x | 10.7% | 51.7% | 51.7% | |||||||||||||
| 3 | MSMCH | Tower 28 | Long Island City | NY | Multifamily | $56,000,000 | 6.7% | 450 | $248,888.89 | 2.31x | 13.0% | 33.4% | 28.8% | |||||||||||||
| 4 | WFB | 131 Albright | Los Gatos | CA | Office | $55,000,000 | 6.6% | 113,520 | $484.50 | 1.79x | 8.7% | 62.1% | 62.1% | |||||||||||||
| 5 | MSMCH | Grand Oaks Business Park | Eagan | MN | Office | $52,362,896 | 6.3% | 551,551 | $94.94 | 1.45x | 11.0% | 74.8% | 61.5% | |||||||||||||
| 6 | MSMCH | ILPT Hawaii Portfolio | Honolulu | HI | Various | $50,000,000 | 6.0% | 9,591,512 | $67.77 | 2.40x | 10.6% | 45.2% | 45.2% | |||||||||||||
| 7 | BANA | Vista Village Shopping Center | Vista | CA | Retail | $44,000,000 | 5.3% | 195,009 | $225.63 | 2.14x | 10.1% | 64.1% | 64.1% | |||||||||||||
| 8 | MSMCH | Landmark West Loop | Chicago | IL | Multifamily | $40,000,000 | 4.8% | 300 | $133,333.33 | 3.63x | 14.6% | 28.7% | 28.7% | |||||||||||||
| 9 | MSMCH | Southgate Owners Corp | New York | NY | Multifamily | $27,916,043 | 3.4% | 402 | $69,442.89 | 10.28x | 59.4% | 5.1% | 4.0% | |||||||||||||
| 10 | WFB | Great Wolf Lodge Southern California | Garden Grove | CA | Hospitality | $25,000,000 | 3.0% | 603 | $248,756.22 | 2.41x | 14.6% | 49.5% | 49.5% | |||||||||||||
| Total/Wtd. Avg. | $476,278,938 | 57.2% | 2.72x | 14.0% | 48.6% | 46.6% | ||||||||||||||||||||
| (1) | With respect to any mortgage loan that is part of a whole loan, unless otherwise indicated, all LTV, DSCR, Debt Yield and Balance per SF/Unit/Room calculations in this Term Sheet include any relatedpari passu companion loans and exclude any subordinate companion loans, as applicable. Additionally, LTV, DSCR, Debt Yield and Balance per SF/Unit figures in this Term Sheet are calculated for mortgage loans without regard to any additional indebtedness that may be incurred at a future date. With respect to any leased fee loans, the SF/Units/Rooms and Balance per SF/Unit/Room figures in this Term Sheet are based on the size of the non-collateral improvements. |
This is not a research report and was not prepared by any Underwriter’s research department. Please see additional important information and qualifications at the end of this Term Sheet.
T-18
| BANK 2019-BNK17 | Characteristics of the Mortgage Loans |
| Mortgage Loans with Pari Passu Companion Loans | ||||||||||||||||||||||||
| Loan No. | Mortgage Loan Seller | Property Name | Mortgage Loan Cut-off Date Balance | Aggregate Pari Passu Companion Loan Cut-off Date Balance | Combined Cut-off Date Balance | Lead Servicing Agreement | Master Servicer | Special Servicer | Control Rights | Combined UW NCF DSCR(1) | Combined UW NOI Debt Yield(1) | Combined Cut-off Date LTV(1) | ||||||||||||
| 3 | MSMCH | Tower 28 | $56,000,000 | $56,000,000 | $112,000,000 | BANK 2019-BNK17 | Wells Fargo | Midland | (2) | 2.31x | 13.0% | 33.4% | ||||||||||||
| 6 | MSMCH | ILPT Hawaii Portfolio | $50,000,000 | $600,000,000 | $650,000,000 | ILPT Trust 2019-SURF | Midland | Rialto | ILPT Trust 2019-SURF | 2.40x | 10.6% | 45.2% | ||||||||||||
| 10 | WFB | Great Wolf Lodge Southern California | $25,000,000 | $125,000,000 | $150,000,000 | BANK 2019-BNK17(3) | Wells Fargo(3) | Midland(3) | (3) | 2.41x | 14.6% | 49.5% | ||||||||||||
| 28 | MSMCH | Residence Inn National Portfolio | $10,000,000 | $27,050,000 | $37,050,000 | BANK 2018-BNK16 | Wells Fargo | KeyBank | BANK 2018-BNK16 | 2.49x | 18.0% | 65.0% | ||||||||||||
| (1) | DSCR, Debt Yield and LTV calculations include any relatedpari passu companion loans and exclude any subordinate companion loans, as applicable. |
| (2) | The Tower 28 controlling companion loan is currently held by Morgan Stanley Mortgage Capital Holding LLC and is expected to be sold to a third party. |
| (3) | The Great Wolf Lodge Southern California controlling companion loan is currently held by Wells Fargo Bank, National Association, and is expected to be sold to a third party or contributed to one or more future securitization transactions. The Great Wolf Lodge Southern California whole loan will be serviced pursuant to the BANK 2019-BNK17 pooling and servicing agreement until the securitization of the related promissory note A-1. |
This is not a research report and was not prepared by any Underwriter’s research department. Please see additional important information and qualifications at the end of this Term Sheet.
T-19
| BANK 2019-BNK17 | Characteristics of the Mortgage Loans |
| Mortgage Loans with Subordinate Debt(1) | ||||||||||||||||||||||
| Loan No. | Mortgage Loan Seller | Property Name | Mortgage Loan Cut-off Date Balance | Cut-off Date Balance per Unit/SF | Subordinate Debt Cut-off Date Balance | UW NCF DSCR | UW NOI Debt Yield | Cut-off Date LTV | Total Debt UW NCF DSCR(2) | Total Debt Debt Yield(2) | Total Debt Cut-off Date LTV(2) | |||||||||||
| 3 | MSMCH | Tower 28 | $56,000,000 | $248,888.89 | $53,000,000 | 2.31x | 13.0% | 33.4% | 1.07x | 6.8% | 64.2% | |||||||||||
| 8 | MSMCH | Landmark West Loop | $40,000,000 | $133,333.33 | $45,000,000 | 3.63x | 14.6% | 28.7% | 1.11x | 5.6% | 75.3% | |||||||||||
| 10 | WFB | Great Wolf Lodge Southern California | $25,000,000 | $248,756.22 | $20,000,000 | 2.41x | 14.6% | 49.5% | 1.89x | 12.9% | 56.1% | |||||||||||
| (1) | In addition, one (1) of the mortgage loans, each of which is secured by a residential cooperative property, currently have in place Subordinate Coop LOCs that permit future advances. See “Description of the Mortgage Pool—Additional Indebtedness—Other Secured Indebtedness” and “Description of the Mortgage Pool—Additional Debt Financing for Mortgage Loans Secured by Residential Cooperatives” in the Preliminary Prospectus. |
| (2) | Total Debt UW NCF DSCR, Total Debt UW NOI Debt Yield and Total Debt Cut-off Date LTV figures shown above are calculated based on any relatedpari passu notes and any related subordinate note(s) and the mezzanine debt. |
| Mortgage Loans with Mezzanine Debt | ||||||||||||||||||||||
| Loan No. | Mortgage Loan Seller | Property Name | Mortgage Loan Cut-off Date Balance | Cut-off Date Balance per Unit/SF | Mezzanine Debt Cut-off Date Balance | UW NCF DSCR | UW NOI Debt Yield | Cut-off Date LTV | Total Debt UW NCF DSCR(1) | Total Debt UW NOI Debt Yield(1) | Total Debt Cut-off Date LTV(1) | |||||||||||
| 3 | MSMCH | Tower 28 | $56,000,000 | $248,888.89 | $50,000,000 | 2.31x | 13.0% | 33.4% | 1.07x | 6.8% | 64.2% | |||||||||||
| 8 | MSMCH | Landmark West Loop | $40,000,000 | $133,333.33 | $20,000,000 | 3.63x | 14.6% | 28.7% | 1.11x | 5.6% | 75.3% | |||||||||||
| (1) | Total Debt UW NCF DSCR, Total Debt UW NOI Debt Yield and Total Debt Cut-off Date LTV figures shown above are calculated based on any relatedpari passu notes, any related subordinate note(s) and the mezzanine debt. |
This is not a research report and was not prepared by any Underwriter’s research department. Please see additional important information and qualifications at the end of this Term Sheet.
T-20
| BANK 2019-BNK17 | Characteristics of the Mortgage Loans |
| Prior Securitization History(1) | ||||||||||||||||||||||||||||
| Loan No. | Mortgage Loan Seller | Property Name | City | State | Property Type | Cut-off Date Balance | % of Pool | SF/Units/ | Cut-off Date Balance per SF/Unit/Pad | UW NCF DSCR | UW NOI Debt Yield | Cut-off Date LTV | Maturity Date LTV | Prior Securitization | ||||||||||||||
| 11 | MSMCH | Seekonk Crossing | Seekonk | MA | Retail | $23,000,000 | 2.8% | 227,078 | $101.29 | 1.93x | 10.0% | 65.2% | 65.2% | COMM 2014-CR17 | ||||||||||||||
| 17 | WFB | The Village at Eldorado | Little Elm | TX | Retail | $14,800,000 | 1.8% | 59,820 | $247.41 | 1.89x | 9.7% | 57.5% | 57.5% | MSBAM 2013-C10 | ||||||||||||||
| 38 | WFB | Airship Self Storage - NJ | Manchester Township | NJ | Self Storage | $4,425,000 | 0.5% | 41,085 | $107.70 | 1.83x | 9.8% | 65.1% | 65.1% | WFRBS 2014-LC14 | ||||||||||||||
| 39 | MSMCH | Walgreens Broadway Everett | Everett | WA | Retail | $4,300,000 | 0.5% | 13,750 | $312.73 | 1.70x | 9.3% | 65.2% | 65.2% | WFRBS 2014-C20 | ||||||||||||||
| Total | $46,525,000 | 5.6% | ||||||||||||||||||||||||||
| (1) | Includes mortgage loans for which all or a portion of the previously existing debt was most recently securitized in conduit securitizations, based on information provided by the related borrower or obtained through searches of a third-party database. The information has not otherwise been confirmed by the mortgage loan sellers. With respect to any mortgage loan that is part of a whole loan, unless otherwise indicated, all LTV, DSCR, Debt Yield and Cut-off Date Balance per SF/Unit/Pad calculations include any relatedpari passucompanion loans and exclude any related subordinate companion loans, as applicable. |
This is not a research report and was not prepared by any Underwriter’s research department. Please see additional important information and qualifications at the end of this Term Sheet.
T-21
| BANK 2019-BNK17 | Characteristics of the Mortgage Loans |
Mortgage Loans with Scheduled Balloon Payments and Related Classes(1)
| Class A-2 ($6,500,000) | ||||||||||||||||||||||||||||||||
| Loan No. | Mortgage Loan Seller | Property Name | State | Property Type | Cut-off Date Balance | % of Pool | Maturity Date Balance | % of Class A-2 Certificate Principal Balance | SF/ Units | Cut-off Date Balance per SF/Unit | UW NCF DSCR | UW NOI Debt Yield | Cut-off Date LTV | Maturity Date LTV | Rem. IO Period (mos.) | Rem. Term to Maturity (mos.) | ||||||||||||||||
| 30 | BANA | Hillcrest Apartments | IA | Multifamily | $7,250,000 | 0.9% | $6,830,188 | 105.1% | 108 | $67,129.63 | 1.57x | 10.6% | 66.0% | 62.1% | 11 | 59 | ||||||||||||||||
| Total/Wtd. Avg. | $7,250,000 | 0.9% | $6,830,188 | 105.1% | 1.57x | 10.6% | 66.0% | 62.1% | 11 | 59 | ||||||||||||||||||||||
| (1) | The table above reflects the mortgage loans whose balloon payments will be applied to pay down the Class A-2 certificates, assuming (i) that none of the mortgage loans experience prepayments, defaults or losses; (ii) there are no extensions of maturity dates; and (iii) each mortgage loan is paid in full on its stated maturity date or, in the case of any mortgage loan with an anticipated repayment date, on such anticipated repayment date. The table above is otherwise based on the Structuring Assumptions set forth under “Yield and Maturity Considerations—Weighted Average Life” in the Preliminary Prospectus. |
This is not a research report and was not prepared by any Underwriter’s research department. Please see additional important information and qualifications at the end of this Term Sheet.
T-22
| BANK 2019-BNK17 | Characteristics of the Mortgage Loans |

| Property Type Distribution(1) | |||||||||||||||||
| Property Type | Number of Mortgaged Properties | Aggregate Cut-off Date Balance | % of Pool | Wtd. Avg. Mortgage Rate | Wtd. Avg. UW NCF DSCR | Wtd. Avg. UW NOI Debt Yield | Wtd. Avg. Cut-off Date LTV | Wtd. Avg. Maturity Date LTV | |||||||||
| Office | 8 | $253,524,284 | 30.4% | 4.5997% | 1.95x | 10.3% | 59.3% | 55.8% | |||||||||
| CBD | 2 | $126,000,000 | 15.1% | 4.3935% | 2.26x | 10.4% | 50.4% | 50.4% | |||||||||
| Suburban | 4 | $114,532,134 | 13.7% | 4.7599% | 1.63x | 10.0% | 68.0% | 61.4% | |||||||||
| Medical | 2 | $12,992,150 | 1.6% | 5.1886% | 1.67x | 11.9% | 68.7% | 58.4% | |||||||||
| Retail | 20 | $213,966,533 | 25.7% | 4.7748% | 1.95x | 10.6% | 62.6% | 59.4% | |||||||||
| Anchored | 8 | $128,297,047 | 15.4% | 4.7048% | 1.87x | 10.6% | 67.9% | 63.1% | |||||||||
| Shadow Anchored | 4 | $54,221,000 | 6.5% | 4.8004% | 2.13x | 10.7% | 54.4% | 54.4% | |||||||||
| Free-Standing | 4 | $16,800,000 | 2.0% | 4.8850% | 2.02x | 10.1% | 54.1% | 54.1% | |||||||||
| Single Tenant | 3 | $8,854,098 | 1.1% | 5.0212% | 2.30x | 11.8% | 46.1% | 46.1% | |||||||||
| Unanchored | 1 | $5,794,387 | 0.7% | 5.3900% | 1.22x | 8.8% | 71.5% | 59.8% | |||||||||
| Multifamily | 11 | $194,755,043 | 23.4% | 4.2519% | 3.48x | 18.7% | 39.5% | 36.7% | |||||||||
| High Rise | 2 | $96,000,000 | 11.5% | 3.8408% | 2.86x | 13.7% | 31.4% | 28.8% | |||||||||
| Garden | 7 | $56,750,000 | 6.8% | 4.9020% | 1.71x | 9.6% | 61.5% | 58.6% | |||||||||
| Cooperative | 1 | $27,916,043 | 3.4% | 4.0000% | 10.28x | 59.4% | 5.1% | 4.0% | |||||||||
| Mid-Rise | 1 | $14,089,000 | 1.7% | 4.9340% | 1.33x | 8.6% | 73.4% | 67.7% | |||||||||
| Industrial | 11 | $48,678,839 | 5.8% | 4.9254% | 1.64x | 10.0% | 68.7% | 60.8% | |||||||||
| Flex | 4 | $28,408,768 | 3.4% | 4.8863% | 1.76x | 10.0% | 66.2% | 61.2% | |||||||||
| Warehouse | 1 | $18,355,702 | 2.2% | 5.0500% | 1.39x | 10.0% | 74.9% | 61.9% | |||||||||
| Warehouse/Distribution | 6 | $1,914,368 | 0.2% | 4.3100% | 2.40x | 10.6% | 45.2% | 45.2% | |||||||||
| Leased Fee | 177 | $47,200,436 | 5.7% | 4.3100% | 2.40x | 10.6% | 45.2% | 45.2% | |||||||||
| Leased Fee | 177 | $47,200,436 | 5.7% | 4.3100% | 2.40x | 10.6% | 45.2% | 45.2% | |||||||||
| Hospitality | 5 | $35,000,000 | 4.2% | 5.0895% | 2.43x | 15.6% | 53.9% | 52.4% | |||||||||
| Full Service | 1 | $25,000,000 | 3.0% | 5.2533% | 2.41x | 14.6% | 49.5% | 49.5% | |||||||||
| Extended Stay | 4 | $10,000,000 | 1.2% | 4.6800% | 2.49x | 18.0% | 65.0% | 59.8% | |||||||||
| Mixed Use | 1 | $20,700,000 | 2.5% | 5.4200% | 1.26x | 9.7% | 60.5% | 56.3% | |||||||||
| Office/Multifamily | 1 | $20,700,000 | 2.5% | 5.4200% | 1.26x | 9.7% | 60.5% | 56.3% | |||||||||
| Self Storage | 5 | $19,025,000 | 2.3% | 5.0895% | 1.60x | 10.1% | 63.9% | 59.3% | |||||||||
| Self Storage | 5 | $19,025,000 | 2.3% | 5.0895% | 1.60x | 10.1% | 63.9% | 59.3% | |||||||||
| Parking | 1 | $176,428 | 0.0% | 4.3100% | 2.40x | 10.6% | 45.2% | 45.2% | |||||||||
| Parking | 1 | $176,428 | 0.0% | 4.3100% | 2.40x | 10.6% | 45.2% | 45.2% | |||||||||
| Total/Wtd. Avg. | 239 | $833,026,562 | 100.0% | 4.6181% | 2.31x | 12.5% | 55.2% | 51.9% | |||||||||
| (1) | All numerical information concerning the mortgage loans is approximate and, in the case of mortgage loans secured by multiple properties, is based on allocated loan amounts with respect to such properties. All weighted average information regarding the mortgage loans reflects the weighting of the mortgage loans based on their outstanding principal balances as of the Cut-off Date or, in the case of mortgage loans secured by multiple properties, allocated loan amounts. The sum of numbers and percentages in columns may not match the “Total” due to rounding. With respect to any mortgage loan that is part of a whole loan, unless otherwise indicated, all LTV, DSCR and Debt Yield calculations include any relatedpari passu companion loans and exclude any related subordinate companion loans, as applicable. For mortgaged properties securing residential cooperative mortgage loans, the UW NCF DSCR and UW NOI Debt Yield for each such mortgaged property is calculated using underwritten net operating income or underwritten net cash flow, as applicable, for the related residential cooperative property which is the projected net operating income or net cash flow, as applicable, reflected in the most recent appraisal obtained by or otherwise in the possession of the related mortgage loan seller as of the Cut-off Date. LTV calculations are based upon the appraised value of the residential cooperative property determined as if such residential cooperative property is operated as a residential cooperative, inclusive of the amount of the underlying debt encumbering such residential cooperative property. |
This is not a research report and was not prepared by any Underwriter’s research department. Please see additional important information and qualifications at the end of this Term Sheet.
T-23
| BANK 2019-BNK17 | Characteristics of the Mortgage Loans |

| Geographic Distribution(1) | ||||||||
| State or Other Jurisdiction | Number of Mortgaged Properties | Aggregate Cut-off Date Balance | % of Pool | Wtd. Avg. Mortgage Rate | Wtd. Avg. UW NCF DSCR | Wtd. Avg. UW NOI Debt Yield | Wtd. Avg. Cut-off Date LTV | Wtd. Avg. Maturity Date LTV |
| California | 11 | $249,900,000 | 30.0% | 4.6038% | 2.05x | 10.2% | 58.6% | 57.9% |
| California – Northern(2) | 4 | $135,800,000 | 16.3% | 4.4674% | 2.04x | 9.9% | 58.4% | 57.2% |
| California – Southern(2) | 7 | $114,100,000 | 13.7% | 4.7662% | 2.06x | 10.6% | 58.8% | 58.8% |
| New York | 3 | $90,394,160 | 10.9% | 3.9595% | 4.75x | 27.6% | 26.9% | 22.6% |
| New Jersey | 2 | $67,925,000 | 8.2% | 4.6778% | 2.11x | 10.1% | 50.2% | 50.2% |
| Minnesota | 1 | $52,362,896 | 6.3% | 4.8500% | 1.45x | 11.0% | 74.8% | 61.5% |
| Hawaii | 186 | $50,000,000 | 6.0% | 4.3100% | 2.40x | 10.6% | 45.2% | 45.2% |
| Illinois | 3 | $47,504,098 | 5.7% | 4.0846% | 3.42x | 14.1% | 31.5% | 31.5% |
| Texas | 4 | $32,016,420 | 3.8% | 4.8999% | 2.11x | 11.5% | 54.4% | 52.7% |
| Georgia | 6 | $31,855,067 | 3.8% | 4.9212% | 1.65x | 11.4% | 71.9% | 62.3% |
| Massachusetts | 2 | $30,592,150 | 3.7% | 4.8042% | 1.89x | 10.6% | 65.0% | 62.2% |
| Michigan | 2 | $30,213,155 | 3.6% | 5.0500% | 1.41x | 10.1% | 74.5% | 61.6% |
| Nevada | 3 | $25,500,000 | 3.1% | 4.5405% | 2.12x | 10.2% | 57.7% | 57.1% |
| Missouri | 1 | $20,700,000 | 2.5% | 5.4200% | 1.26x | 9.7% | 60.5% | 56.3% |
| Florida | 3 | $19,000,000 | 2.3% | 5.0176% | 1.82x | 10.8% | 67.2% | 64.7% |
| Washington | 2 | $16,800,000 | 2.0% | 4.6766% | 2.30x | 11.6% | 53.0% | 53.0% |
| Arizona | 1 | $15,000,000 | 1.8% | 4.9500% | 1.43x | 9.7% | 75.0% | 63.4% |
| Ohio | 1 | $14,089,000 | 1.7% | 4.9340% | 1.33x | 8.6% | 73.4% | 67.7% |
| Pennsylvania | 3 | $11,557,950 | 1.4% | 5.0083% | 1.91x | 11.4% | 60.2% | 53.5% |
| Tennessee | 1 | $11,500,000 | 1.4% | 5.2500% | 1.25x | 8.5% | 70.4% | 62.8% |
| Iowa | 1 | $7,250,000 | 0.9% | 5.0970% | 1.57x | 10.6% | 66.0% | 62.1% |
| North Carolina | 1 | $4,250,000 | 0.5% | 4.8900% | 1.54x | 10.0% | 54.5% | 50.3% |
| Colorado | 1 | $3,266,667 | 0.4% | 4.6800% | 2.49x | 18.0% | 65.0% | 59.8% |
| Maryland | 1 | $1,350,000 | 0.2% | 5.3500% | 2.31x | 12.6% | 43.5% | 43.5% |
| Total/Wtd. Avg. | 239 | $833,026,562 | 100.0% | 4.6181% | 2.31x | 12.5% | 55.2% | 51.9% |
| (1) | All numerical information concerning the mortgage loans is approximate and, in the case of mortgage loans secured by multiple properties, is based on allocated loan amounts with respect to such properties. All weighted average information regarding the mortgage loans reflects the weighting of the mortgage loans based on their outstanding principal balances as of the Cut-off Date or, in the case of mortgage loans secured by multiple properties, allocated loan amounts. The sum of numbers and percentages in columns may not match the “Total” due to rounding. With respect to any mortgage loan that is part of a whole loan, unless otherwise indicated, all LTV, DSCR and Debt Yield calculations include any relatedpari passu companion loans and exclude any related subordinate companion loans, as applicable. For mortgaged properties securing residential cooperative mortgage loans, the UW NCF DSCR and UW NOI Debt Yield for each such mortgaged property is calculated using underwritten net operating income or underwritten net cash flow, as applicable, for the related residential cooperative property which is the projected net operating income or net cash flow, as applicable, reflected in the most recent appraisal obtained by or otherwise in the possession of the related mortgage loan seller as of the Cut-off Date. LTV calculations are based upon the appraised value of the residential cooperative property determined as if such residential cooperative property is operated as a residential cooperative, inclusive of the amount of the underlying debt encumbering such residential cooperative property. |
| (2) | “California – Northern” includes zip codes above 93600, and “California – Southern” includes zip codes at or below 93600. |
This is not a research report and was not prepared by any Underwriter’s research department. Please see additional important information and qualifications at the end of this Term Sheet.
T-24
| BANK 2019-BNK17 | Collateral Statistics |
Collateral Statistics(1)
Cut-off Date Balance ($)
| No. of Mortgage Loans | Aggregate Cut-off Date Balance ($) | % of Pool | |
| 1,350,000 - 10,000,000 | 22 | $109,199,469 | 13.1 |
| 10,000,001 - 20,000,000 | 15 | $203,848,155 | 24.5 |
| 20,000,001 - 30,000,000 | 4 | $96,616,043 | 11.6 |
| 30,000,001 - 40,000,000 | 1 | $40,000,000 | 4.8 |
| 40,000,001 - 50,000,000 | 2 | $94,000,000 | 11.3 |
| 50,000,001 - 60,000,000 | 3 | $163,362,896 | 19.6 |
| 60,000,001 – 63,500,000 | 2 | $126,000,000 | 15.1 |
| Total: | 49 | $833,026,562 | 100.0% |
Min: $1,350,000 | Max: $63,500,000 | Avg: $17,000,542 | |
State or Other Jurisdiction(2)
| No. of Mortgaged Properties | Aggregate Cut-off Date Balance ($) | % of Pool | |
| California | 11 | 249,900,000 | 30.0 |
| California – Northern(3) | 4 | 135,800,000 | 16.3 |
| California – Southern(3) | 7 | 114,100,000 | 13.7 |
| New York | 3 | 90,394,160 | 10.9 |
| New Jersey | 2 | 67,925,000 | 8.2 |
| Minnesota | 1 | 52,362,896 | 6.3 |
| Hawaii | 186 | 50,000,000 | 6.0 |
| Illinois | 3 | 47,504,098 | 5.7 |
| Texas | 4 | 32,016,420 | 3.8 |
| Georgia | 6 | 31,855,067 | 3.8 |
| Massachusetts | 2 | 30,592,150 | 3.7 |
| Michigan | 2 | 30,213,155 | 3.6 |
| Nevada | 3 | 25,500,000 | 3.1 |
| Missouri | 1 | 20,700,000 | 2.5 |
| Florida | 3 | 19,000,000 | 2.3 |
| Washington | 2 | 16,800,000 | 2.0 |
| Arizona | 1 | 15,000,000 | 1.8 |
| Ohio | 1 | 14,089,000 | 1.7 |
| Pennsylvania | 3 | 11,557,950 | 1.4 |
| Tennessee | 1 | 11,500,000 | 1.4 |
| Iowa | 1 | 7,250,000 | 0.9 |
| North Carolina | 1 | 4,250,000 | 0.5 |
| Colorado | 1 | 3,266,667 | 0.4 |
| Maryland | 1 | 1,350,000 | 0.2 |
| Total: | 239 | $833,026,562 | 100.0% |
Property Type(2)
| No. of Mortgaged Properties | Aggregate Cut-off Date Balance ($) | % of Pool | |
| Office | 8 | 253,524,284 | 30.4 |
| CBD | 2 | 126,000,000 | 15.1 |
| Suburban | 4 | 114,532,134 | 13.7 |
| Medical | 2 | 12,992,150 | 1.6 |
| Retail | 20 | 213,966,533 | 25.7 |
| Anchored | 8 | 128,297,047 | 15.4 |
| Shadow Anchored | 4 | 54,221,000 | 6.5 |
| Free-Standing | 4 | 16,800,000 | 2.0 |
| Single Tenant | 3 | 8,854,098 | 1.1 |
| Unanchored | 1 | 5,794,387 | 0.7 |
| Multifamily | 11 | 194,755,043 | 23.4 |
| High Rise | 2 | 96,000,000 | 11.5 |
| Garden | 7 | 56,750,000 | 6.8 |
| Cooperative | 1 | 27,916,043 | 3.4 |
| Mid-Rise | 1 | 14,089,000 | 1.7 |
| Industrial | 11 | 48,678,839 | 5.8 |
| Flex | 4 | 28,408,768 | 3.4 |
| Warehouse | 1 | 18,355,702 | 2.2 |
| Warehouse/Distribution | 6 | 1,914,368 | 0.2 |
| Leased Fee | 177 | 47,200,436 | 5.7 |
| Leased Fee | 177 | 47,200,436 | 5.7 |
| Hospitality | 5 | 35,000,000 | 4.2 |
| Full Service | 1 | 25,000,000 | 3.0 |
| Extended Stay | 4 | 10,000,000 | 1.2 |
| Mixed Use | 1 | 20,700,000 | 2.5 |
| Office/Multifamily | 1 | 20,700,000 | 2.5 |
| Self Storage | 5 | 19,025,000 | 2.3 |
| Self Storage | 5 | 19,025,000 | 2.3 |
| Parking | 1 | $176,428 | 0.0 |
| Parking | 1 | $176,428 | 0.0 |
| Total: | 239 | $833,026,562 | 100.0% |
Mortgage Rate (%)
| No. of Mortgage Loans | Aggregate Cut-off Date Balance ($) | % of Pool | |
| 3.7842 - 4.4999 | 7 | 299,416,043 | 35.9 |
| 4.5000 - 4.9999 | 22 | 352,751,994 | 42.3 |
| 5.0000 - 5.4200 | 20 | 180,858,526 | 21.7 |
| Total: | 49 | $833,026,562 | 100.0% |
| Min: 3.7842% | Max: 5.4200% | Wtd Avg: 4.6181% | |
Original Term to Maturity or ARD (mos.)
| No. of Mortgage Loans | Aggregate Cut-off Date Balance ($) | % of Pool | |
| 60 | 1 | 7,250,000 | 0.9 |
| 120 | 48 | 825,776,562 | 99.1 |
| Total: | 49 | $833,026,562 | 100.0% |
| Min: 60 mos. | Max: 120 mos. | Wtd Avg: 119 mos. | |
Remaining Term to Maturity or ARD (mos.)
| No. of Mortgage Loans | Aggregate Cut-off Date Balance ($) | % of Pool | |
| 59 | 1 | 7,250,000 | 0.9 |
| 117 - 120 | 48 | 825,776,562 | 99.1 |
| Total: | 49 | $833,026,562 | 100.0% |
| Min: 59 mos. | Max: 120 mos. | Wtd Avg: 118 mos. | |
Original Amortization Term (mos.)
| No. of Mortgage Loans | Aggregate Cut-off Date Balance ($) | % of Pool | |
| Interest Only | 24 | 501,300,098 | 60.2 |
| 300 | 1 | 6,478,117 | 0.8 |
360 | 24 | 325,248,347 | 39.0 |
| Total: | 49 | $833,026,562 | 100.0% |
| Min: 300 mos. | Max: 360 mos. | Wtd Avg: 359 mos. | |
Remaining Amortization Term (mos.)
| No. of Mortgage Loans | Aggregate Cut-off Date Balance ($) | % of Pool | |
| Interest Only | 24 | 501,300,098 | 60.2 |
| 298 - 300 | 1 | 6,478,117 | 0.8 |
| 358 - 360 | 24 | 325,248,347 | 39.0 |
| Total: | 49 | $833,026,562 | 100.0% |
| Min: 298 mos. | Max: 360 mos. | Wtd Avg: 358 mos. | |
Mortgage Loan Sellers
| No. of Mortgage Loans | Aggregate Cut-off Date Balance ($) | % of Pool | |
| MSMCH | 19 | 346,665,593 | 41.6 |
| BANA | 13 | 261,367,117 | 31.4 |
| WFB | 17 | 224,993,852 | 27.0 |
| Total: | 49 | $833,026,562 | 100.0% |
Amortization Type
| No. of Mortgage Loans | Aggregate Cut-off Date Balance ($) | % of Pool | |
| Interest Only | 24 | 501,300,098 | 60.2 |
| Partial Interest Only | 16 | 190,964,000 | 22.9 |
| Amortizing Balloon | 9 | 140,762,464 | 16.9 |
| Total: | 49 | 833,026,562 | 100.0% |
Cut-off Date LTV Ratio (%)
| No. of Mortgage Loans | Aggregate Cut-off Date Balance ($) | % of Pool | |
| 5.1 - 55.0 | 17 | 385,441,141 | 46.3 |
| 55.1 - 60.0 | 5 | 54,000,000 | 6.5 |
| 60.1 - 65.0 | 8 | 163,270,267 | 19.6 |
| 65.1 - 70.0 | 7 | 60,811,477 | 7.3 |
| 70.1 - 75.0 | 12 | 169,503,677 | 20.3 |
| Total: | 49 | $833,026,562 | 100.0% |
| Min: 5.1% | Max: 75.0% | Wtd Avg: 55.2% | |
Maturity Date or ARD LTV Ratio (%)
| No. of Mortgage Loans | Aggregate Cut-off Date Balance ($) | % of Pool | |
| 4.0 - 40.0 | 3 | 123,916,043 | 14.9 |
| 40.1 - 50.0 | 10 | 183,099,117 | 22.0 |
| 50.1 - 55.0 | 8 | 99,696,248 | 12.0 |
| 55.1 - 60.0 | 9 | 98,130,865 | 11.8 |
| 60.1 - 65.0 | 13 | 265,970,290 | 31.9 |
| 65.1 - 68.8 | 6 | 62,214,000 | 7.5 |
| Total: | 49 | $833,026,562 | 100.0% |
| Min: 4.0% | Max: 68.8% | Wtd Avg: 51.9% | |
UW NCF DSCR (x)
| No. of Mortgage Loans | Aggregate Cut-off Date Balance ($) | % of Pool | |
| 1.22 - 1.40 | 5 | 70,439,090 | 8.5 |
| 1.41 - 1.60 | 11 | 136,570,348 | 16.4 |
| 1.61 - 1.80 | 11 | 115,276,964 | 13.8 |
| 1.81 - 2.00 | 4 | 47,825,000 | 5.7 |
| 2.01 - 2.20 | 5 | 137,978,117 | 16.6 |
| 2.21 - 10.28 | 13 | 324,937,043 | 39.0 |
| Total: | 49 | $833,026,562 | 100.0% |
| Min: 1.22x | Max: 10.28x | Wtd Avg: 2.31x | |
UW NOI Debt Yield (%)
| No. of Mortgage Loans | Aggregate Cut-off Date Balance ($) | % of Pool | |
| 7.8 - 9.0 | 7 | 115,137,485 | 13.8 |
| 9.1 – 10.0 | 12 | 133,080,702 | 16.0 |
| 10.1 - 12.0 | 17 | 373,701,065 | 44.9 |
| 12.1 - 14.0 | 8 | 101,713,150 | 12.2 |
| 14.1 - 16.0 | 2 | 65,000,000 | 7.8 |
| 16.1 – 59.4 | 3 | 44,394,160 | 5.3 |
| Total: | 49 | $833,026,562 | 100.0% |
| Min: 7.8% | Max: 59.4% | Wtd Avg: 12.5% | |
| (1) | All numerical information concerning the mortgage loans is approximate. All weighted average information regarding the mortgage loans reflects the weighting of the mortgage loans based on their outstanding principal balances as of the Cut-off Date. The sum of numbers and percentages in columns may not match the “Total” due to rounding. With respect to any mortgage loan that is part of a whole loan, unless otherwise indicated, all LTV, DSCR and Debt Yield calculations include any relatedpari passu companion loans and exclude any related subordinate companion loans, as applicable. For mortgaged properties securing residential cooperative mortgage loans, the UW DSCR and UW NOI Debt Yield for each such mortgaged property is calculated using underwritten net operating income or underwritten net cash flow, as applicable, for the related residential cooperative property which is the projected net operating income or net cash flow, as applicable, reflected in the most recent appraisal obtained by or otherwise in the possession of the related mortgage loan seller as of the Cut-off Date. LTV calculations are based upon the appraised value of the residential cooperative property determined as if such residential cooperative property is operated as a residential cooperative, inclusive of the amount of the underlying debt encumbering such residential cooperative property. |
| (2) | In the case of mortgage loans secured by multiple properties, cut-off date balance information is based on allocated loan amounts with respect to such properties. |
| (3) | “California – Northern” includes zip codes above 93600, and “California – Southern” includes zip codes at or below 93600. |
This is not a research report and was not prepared by any Underwriter’s research department. Please see additional important information and qualifications at the end of this Term Sheet.
T-25
| Office - CBD | Loan #1 | Cut-off Date Balance: | $63,500,000 | |
| 570 Washington Boulevard | Newport Office Center VI | Cut-off Date LTV: | 49.2% | |
| Jersey City, NJ 07310 | U/W NCF DSCR: | 2.13x | ||
| U/W NOI Debt Yield: | 10.1% | |||

This is not a research report and was not prepared by any Underwriter’s research department. Please see additional important information and qualifications at the end of this Term Sheet.
T-26
| Office - CBD | Loan #1 | Cut-off Date Balance: | $63,500,000 | |
| 570 Washington Boulevard | Newport Office Center VI | Cut-off Date LTV: | 49.2% | |
| Jersey City, NJ 07310 | U/W NCF DSCR: | 2.13x | ||
| U/W NOI Debt Yield: | 10.1% | |||

This is not a research report and was not prepared by any Underwriter’s research department. Please see additional important information and qualifications at the end of this Term Sheet.
T-27
| Office - CBD | Loan #1 | Cut-off Date Balance: | $63,500,000 | |
| 570 Washington Boulevard | Newport Office Center VI | Cut-off Date LTV: | 49.2% | |
| Jersey City, NJ 07310 | U/W NCF DSCR: | 2.13x | ||
| U/W NOI Debt Yield: | 10.1% | |||
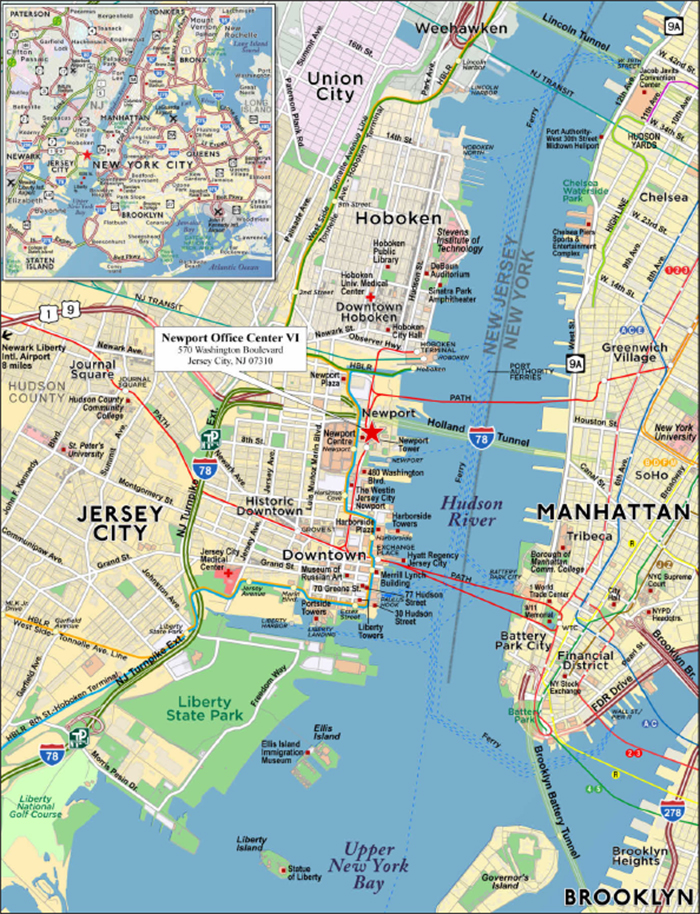
This is not a research report and was not prepared by any Underwriter’s research department. Please see additional important information and qualifications at the end of this Term Sheet.
T-28
| Mortgage Loan No. 1 – Newport Office Center VI |
| Mortgage Loan Information | Property Information | ||||||
| Mortgage Loan Seller: | BANA | Single Asset/Portfolio: | Single Asset | ||||
| Credit Assessment (KBRA/Fitch/S&P): | NR/NR/NR | Location: | Jersey City, NJ 07310 | ||||
| Original Balance: | $63,500,000 | General Property Type: | Office | ||||
| Cut-off Date Balance: | $63,500,000 | Detailed Property Type: | CBD | ||||
| % of Initial Pool Balance: | 7.6% | Title Vesting: | Leasehold | ||||
| Loan Purpose: | Acquisition | Year Built/Renovated: | 2002/2012 | ||||
| Sponsor: | iStar Inc. | Size: | 430,239 SF | ||||
| Guarantor: | iStar Inc. | Cut-off Date Balance per SF: | $148 | ||||
| Mortgage Rate: | 4.6400% | Maturity Date Balance per SF: | $148 | ||||
| Note Date: | 2/26/2019 | Property Manager: | CBRE, Inc. | ||||
| First Payment Date: | 4/1/2019 | ||||||
| Maturity Date: | 3/1/2029 | ||||||
| Original Term to Maturity: | 120 months | ||||||
| Original Amortization Term: | 0 months | ||||||
| IO Period: | 120 months | Underwriting and Financial Information | |||||
| Seasoning: | 1 month | UW NOI: | $6,445,085 | ||||
| Prepayment Provisions: | LO (25); DEF (91); O (4) | UW NOI Debt Yield: | 10.1% | ||||
| Lockbox/Cash Mgmt Status: | Hard/In Place | UW NOI Debt Yield at Maturity: | 10.1% | ||||
| Additional Debt Type: | N/A | UW NCF DSCR: | 2.13x | ||||
| Additional Debt Balance: | N/A | Most Recent NOI(1): | N/A | ||||
| Future Debt Permitted (Type): | No (N/A) | 2nd Most Recent NOI(1): | N/A | ||||
| Reserves(2) | 3rd Most Recent NOI(1): | N/A | |||||
| Type | Initial | Monthly | Cap | Most Recent Occupancy: | 98.8% (2/18/2019) | ||
| RE Tax: | $4,750 | $2,375 | N/A | 2nd Most Recent Occupancy(1): | N/A | ||
| Insurance(3): | $1,700 | $283 | N/A | 3rd Most Recent Occupancy(1): | N/A | ||
| Recurring Replacements: | $0 | Springing | N/A | Appraised Value (as of): | $129,000,000 (2/1/2019) | ||
| TI/LC: | $0 | Springing | N/A | Appraised Value per SF: | $300 | ||
| Ground Rent Reserve: | $215,833 | $215,833 | N/A | Cut-off Date LTV Ratio: | 49.2% | ||
| DTCC TI/LC Reserve: | $0 | Springing | N/A | Maturity Date LTV Ratio: | 49.2% | ||
| Sources and Uses | ||||||
| Sources | Proceeds | % of Total | Uses | Proceeds | % of Total | |
| Loan Amount: | $63,500,000 | 64.5% | Purchase Price(4): | $96,422,369 | 98.0% | |
| Borrower Equity: | $34,927,270 | 35.5% | Closing Costs: | $1,782,617 | 1.8% | |
| Reserves: | $222,283 | 0.2% | ||||
| Total Sources: | $98,427,270 | 100.0% | Total Uses: | $98,427,270 | 100.0% | |
| (1) | Historical financial statements were not available at the time of the Newport Office Center VI Property acquisition. |
| (2) | See “Escrows and Reserves” below for further discussion of reserves requirements. |
| (3) | The current monthly Insurance reserve collected is for flood insurance premiums. Monthly requirements for property and liability insurance reserves are springing. |
| (4) | The borrower sponsor purchased the leasehold interest in the Newport Office Center VI Property, simultaneously with the non-collateral fee interest, for an allocated purchase price of $96,422,369. The purchase price including the non-collateral fee interest was $164,772,369. |
The Mortgage Loan. The largest mortgage loan (the “Newport Office Center VI Mortgage Loan”) is evidenced by a promissory note in the original principal amount of $63,500,000 and secured by a first priority leasehold mortgage on a 430,239 SF, twelve-story office building located in Jersey City, New Jersey (the “Newport Office Center VI Property”).
The Borrower and the Borrower Sponsor. The borrower is STAR 570 Washington LH Owner LLC, a Delaware limited liability company structured to be bankruptcy-remote with at least two independent directors (the “Newport Office Center VI Borrower”). The borrower sponsor and nonrecourse carve-out guarantor is iStar Inc., a Maryland corporation (“iStar”).
iStar (NYSE: STAR) is a real estate investment company, with a portfolio as of September 2018 of approximately $5.5 billion, that finances, invests in and develops real estate and related projects. The borrower sponsor also manages entities focused on ground lease and net lease investments. iStar is rated Ba3, BB- and BB- by Moody’s, S&P and Fitch, respectively. iStar is investing over $34.9 million to purchase the Newport Office Center VI Property.
The Property. The Newport Office Center VI Property is comprised of a twelve-story, Class A office building and an attached two-level parking garage. Total parking available at the Newport Office Center VI Property is 206 spaces (approximately 0.5 spaces per 1,000 SF), housed on the second floor of the office building and in the parking garage. Such parking is available only to the tenants at the Newport Office Center VI Property, and the tenants also have non-exclusive access via a perpetual easement to 122 additional parking spaces at 60 Mall Drive East (0.3 miles from the Newport Office Center VI Property). The office improvements were constructed in 2002, renovated in 2012, and contain 430,239 SF of rentable area which as of February 18, 2019 was 98.8% leased to four tenants: The Depository Trust & Clearing Corp. (“DTCC”) and three ground-floor restaurant tenants, operating as Chef Tan, Menya Sandaime and Caffe Bene.
This is not a research report and was not prepared by any Underwriter’s research department. Please see additional important information and qualifications at the end of this Term Sheet.
T-29
| Office - CBD | Loan #1 | Cut-off Date Balance: | $63,500,000 | |
| 570 Washington Boulevard | Newport Office Center VI | Cut-off Date LTV: | 49.2% | |
| Jersey City, NJ 07310 | U/W NCF DSCR: | 2.13x | ||
| U/W NOI Debt Yield: | 10.1% |
DTCC occupies 415,164 SF, representing 96.5% of NRA and 95.2% of underwritten base rent. DTCC is headquartered at the Newport Office Center VI Property and provides clearance, settlement, asset servicing, and global data management and information services for securities products including equities, corporate and municipal bonds, government and mortgage-backed securities, derivatives, mutual funds, money market instruments and alternative investment products. DTCC processes approximately 90 million financial transactions daily, and serves as the centralized clearinghouse for more than 50 exchanges and equity platforms. DTCC employs approximately 4,400 employees across fifteen countries. DTCC is rated Aa3 by Moody’s and AA- by S&P.
DTCC has been a tenant at the Newport Office Center VI Property since November 2009, with a direct long-term lease for 83,478 SF on a portion of the ground floor and the entire second and third floors. DTCC also has a sublease for 331,686 SF on floors four through twelve from JPMorgan Chase Bank, National Association (“JPMorgan”), which JPMorgan vacated after purchasing 575 Washington Boulevard across the street. Between the direct lease and the sublease, DTCC is the sole office tenant, with a total footprint of 415,164 SF. The sublease with JPMorgan expires on June 30, 2022 and DTCC has already signed a direct lease for the entire subleased space commencing immediately upon expiration of the sublease, which new direct lease will have the same terms as DTCC’s lease for the second and third floors. DTCC’s direct leases will expire December 31, 2032 with one ten-year renewal option with 24 months’ prior notice.
The current annual rent being collected for DTCC’s space is comprised of (i) direct rent being paid by DTCC of $18.19 PSF (increasing every four years with the next increase to $21.19 PSF on January 1, 2021) for 48,289 SF of office space on the ground and third floors, (ii) direct rent being paid by DTCC of $345,006 (increasing 2.0% annually) for the parking space on the second floor and the two-level parking garage, and (iii) direct rent being paid by JPMorgan of $23.64 PSF for 331,686 SF of office space on floors four through twelve. Upon taking the subleased space directly on July 1, 2022, DTCC will pay the same annual rent of $21.19 PSF for its entire 415,164 SF, with rental increases every four years.
DTCC has the option to cause the buildout of the current second floor parking garage space into office space (as was previously done on the third floor). Such office space expansion has already been approved by the Planning Board in Jersey City. Upon DTCC exercising such office expansion option, the Newport Office Center VI Borrower is required to (i) deposit with the lender $2,900,000 as security for the payment of any landlord obligations and all costs to be incurred as a result of the expansion (unless the expansion option is exercised after January 1, 2022, from which time DTCC is responsible for reimbursing for the actual cost of the work) (ii) deliver to the lender a completion guaranty from the guarantor and (iii) deposit with the lender any free rent due to DTCC in connection with the expansion option. Upon completion of the office expansion, the annual rent for the second floor will be $534,506 (after one year of rent abatement), increasing every four years.
The following table presents certain information relating to the tenants at the Newport Office Center VI Property:
| Tenant Summary | |||||||||
| Tenant Name | Moody’s/S&P/ Fitch Ratings | Tenant SF | Approx. % of Total SF | Annual UW Rent | % of Total Annual UW Rent | Annual UW Rent PSF | Lease Expiration | Renewal Options | Termination Options |
| Office Tenants | |||||||||
| The Depository Trust & Clearing Corp.(1) | Aa3/AA-/NR | 415,164 | 96.5% | $9,278,772 | 95.2% | $22.35 | Various(1) | 1 x 10 Yrs | N/A |
| Office Subtotal/Wtd. Avg. | 415,164 | 96.5% | $9,278,772 | 95.2% | $22.35 | ||||
| Retail Tenants | |||||||||
| Xiang Hunan Inc (Chef Tan) | NR/NR/NR | 4,300 | 1.0% | $202,100 | 2.1% | $47.00 | 5/31/2028 | 1 x 5 Yrs | N/A |
| Menya Sandaime 1 Inc | NR/NR/NR | 3,600 | 0.8% | $162,585 | 1.7% | $45.16 | 8/31/2032 | N/A | N/A |
| Entity 4 Dimensions (d/b/a Caffe Bene) | NR/NR/NR | 1,813 | 0.4% | $99,056 | 1.0% | $54.64 | 2/28/2026 | 1 x 5 Yrs | N/A |
| Retail Subtotal/Wtd. Avg. | 9,713 | 2.3% | $463,741 | 4.8% | $47.74 | ||||
| Occupied Space Total /Wtd. Avg. | 424,877 | 98.8% | $9,742,513 | 100.0% | $22.93 | ||||
| Vacant Space - Office | 0 | 0.0% | $0 | 0.0% | $0.0 | ||||
| Vacant Space - Retail | 5,362 | 1.2% | $0 | 0.0% | $0.0 | ||||
| Total/Wtd. Avg. | 430,239 | 100.0% | $9,742,513 | 100.0% | $22.93 | ||||
Information is based on the underwritten rent roll.
| (1) | DTCC has a direct lease for 83,478 SF through December 31, 2032 and a sublease from JPMorgan for 331,686 SF through June 30, 2022. DTCC has signed a direct lease for the subleased space that will commence on July 1, 2022 and will be co-terminus with its other lease. The lender underwrote the 10-year average of the direct rent being paid by DTCC and by JPMorgan. |
This is not a research report and was not prepared by any Underwriter’s research department. Please see additional important information and qualifications at the end of this Term Sheet.
T-30
| Office - CBD | Loan #1 | Cut-off Date Balance: | $63,500,000 | |
| 570 Washington Boulevard | Newport Office Center VI | Cut-off Date LTV: | 49.2% | |
| Jersey City, NJ 07310 | U/W NCF DSCR: | 2.13x | ||
| U/W NOI Debt Yield: | 10.1% |
The following table presents certain information relating to the lease rollover schedule at the Newport Office Center VI Property:
| Lease Rollover Schedule(1)(2) | ||||||||
| Year | # of Leases Rolling | SF Rolling | UW Rent PSF Rolling | Approx. % of Total SF Rolling | Approx. Cumulative % of SF Rolling | Total UW Rent Rolling | Approx. % of Total Rent Rolling | Approx. Cumulative % of Total Rent Rolling |
| 2019 | 0 | 0 | $0.00 | 0.0% | 0.0% | $0 | 0.0% | 0.0% |
| 2020 | 0 | 0 | $0.00 | 0.0% | 0.0% | $0 | 0.0% | 0.0% |
| 2021 | 0 | 0 | $0.00 | 0.0% | 0.0% | $0 | 0.0% | 0.0% |
| 2022 | 0 | 0 | $0.00 | 0.0% | 0.0% | $0 | 0.0% | 0.0% |
| 2023 | 0 | 0 | $0.00 | 0.0% | 0.0% | $0 | 0.0% | 0.0% |
| 2024 | 0 | 0 | $0.00 | 0.0% | 0.0% | $0 | 0.0% | 0.0% |
| 2025 | 0 | 0 | $0.00 | 0.0% | 0.0% | $0 | 0.0% | 0.0% |
| 2026 | 1 | 1,813 | $54.64 | 0.4% | 0.4% | $99,056 | 1.0% | 1.0% |
| 2027 | 0 | 0 | $0.00 | 0.0% | 0.4% | $0 | 0.0% | 1.0% |
| 2028 | 1 | 4,300 | $47.00 | 1.0% | 1.4% | $202,100 | 2.1% | 3.1% |
| 2029 | 0 | 0 | $0.00 | 0.0% | 1.4% | $0 | 0.0% | 3.1% |
| 2030 & Beyond(3) | 2 | 418,764 | $22.55 | 97.3% | 98.8% | $9,441,357 | 96.9% | 100.0% |
| Vacant | 0 | 5,362 | $0.00 | 1.2% | 100.0% | $0 | 0.0% | 100.0% |
| Total/Wtd. Avg. | 4 | 430,239 | $22.93(4) | 100.0% | $9,742,513 | 100.0% | ||
| (1) | Information is based on the underwritten rent roll. |
| (2) | Certain tenants may have lease termination options that are exercisable prior to the stated expiration date of the subject lease or leases which are not considered in the lease rollover schedule. |
| (3) | DTCC has a direct lease for 83,478 SF through December 31, 2032 and a sublease from JPMorgan for 331,686 SF through June 30, 2022. DTCC has signed a direct lease for the subleased space that will commence on July 1, 2022 and will be co-terminus with its other lease. The lender underwrote the 10-year average of the direct rent being paid by DTCC and by JPMorgan. The DTCC direct lease expiration dates are being presented for purposes of the Lease Rollover Schedule. |
| (4) | Wtd. Avg. UW Rent PSF Rolling excludes vacant space. |
The Market. The Newport Office Center VI Property is located at 570 Washington Boulevard in the northern part of Jersey City’s Waterfront district, known as Newport. Jersey City is the second largest city in the state of New Jersey, located on the Hudson River, directly across the water from New York City’s Financial District.
Jersey City has various routes of access from points in New Jersey and Manhattan, New York. Public transit options include the Port Authority Trans-Hudson (“PATH”) system, providing 24-hour direct subway and train access to New York City’s midtown and downtown (with three of its seven New Jersey stations within the Jersey City Waterfront), the Hudson-Bergen light rail transit system (with thirteen stations within the Jersey City Waterfront), ferry service connecting to lower Manhattan’s Financial District (with four locations in Jersey City), NJ Transit bus service, and Conrail and NJ Transit passenger rail. Jersey City is served by US Routes 1 and 9, the New Jersey Turnpike/I-95 (feeding to the Holland Tunnel, the entrance to which is located one block from the Newport Office Center VI Property) and Interstates 280 and 80.
Jersey City’s Waterfront district has become one of New Jersey’s fastest growing areas since its redevelopment; since the early 1980’s there has been more than 24,000 residential units built and nearly 10.0 million SF of office space and over 2.0 million SF of retail space added.
Newport was developed in 1984 from a former rail yard and is now comprised of eight high rise, mixed use office towers (5.9 million SF of commercial space), all built along Washington Boulevard and immediately surrounding the Newport PATH train station and the Newport Centre super-regional mall. The area also has 5,872 residential units completed or under construction. Immediately south of the Newport Office Center VI Property is a mixed use 48.5-acre development known as Harborside, which contains 3.5 million SF of office space across six properties, a 350 room Hyatt Regency Hotel and a 297-unit apartment complex. To the southeast is Exchange Place which consists of two office properties that immediately surround the Exchange Place PATH Station, a mixed use building containing 258 hotel rooms and 10,000 SF of ground floor retail. Further south is the Colgate Center, a 42-acre mixed use development with 3.5 million SF of office space in four towers and 1,733 residential units. In addition, Colgate Center includes three other large scale office properties, including 30 Hudson Street, which was completed in 2004 and represents the newest office supply in the Jersey City Waterfront district.
According to the appraisal, the estimated 2018 population within a one-, three- and five-mile radius of the Newport Office Center VI Property was 74,004, 811,123 and 1,823,991, respectively. The 2018 average household income within the same radii was $151,155, $136,778 and $135,856, respectively.
The Newport Office Center VI Property is located in the Waterfront office submarket of the Northern New Jersey office market. As of year-end 2018, the Waterfront submarket contained approximately 18.9 million SF of inventory across 38 buildings, with a vacancy rate of 18.8% and average asking gross rents of $43.36 PSF. The office properties situated along Washington Boulevard reported occupancy levels between 78% and 100% with an average of 95%.
This is not a research report and was not prepared by any Underwriter’s research department. Please see additional important information and qualifications at the end of this Term Sheet.
T-31
| Office - CBD | Loan #1 | Cut-off Date Balance: | $63,500,000 | |
| 570 Washington Boulevard | Newport Office Center VI | Cut-off Date LTV: | 49.2% | |
| Jersey City, NJ 07310 | U/W NCF DSCR: | 2.13x | ||
| U/W NOI Debt Yield: | 10.1% |
The following table presents recent leasing data at comparable office properties with respect to the Newport Office Center VI Property:
| Comparable Lease Summary | |||||||||
| Property, Address | Year Built | Distance from Subject | Tenant | Lease Area (SF) | Lease Date | Initial Rent PSF(1) | Lease Term (Yrs.) | TI PSF | |
Exchange Place Center 10 Exchange Place | 1988 | 1.0 miles | Nuts.com | 24,372 | Jul-18 | $32.00 | 11.0 | $60.00 | |
Newport Office Tower 525 Washington Blvd | 1992 | 0.2 miles | Fresh Inc. | 18,304 | Apr-18 | $23.50 | 11.0 | $60.00 | |
| 70 Hudson Street | 2000 | 1.1 miles | Federal Home Loan Fidessa
| 51,824
78,000
| Jan-18
Mar-17
| $28.00
$26.00
| 15.0
15.8
| $62.00
$60.00
| |
Harborside Financial Center Plaza 10 10 Harborside Financial Center | 2002 | 0.7 miles | CPG AMH Property, LP Citco Mizuho | 35,328
34,781
105,657
| Sept-14
Oct-17
Oct-17
| $16.38
$25.00
$24.00
| 30.3
4.3
15.0
| $0
$0
$40.70
| |
Newport Office Center III 499 Washington Boulevard | 1999 | 0.2 miles | Tory Burch | 92,720 | Dec-16 | $18.00 | 16.0 | $50.00 | |
Source: Appraisal.
| (1) | Initial Rent PSF is shown on a NNN basis. |
The following table presents the appraiser’s market rent conclusions:
| Market Rent Summary | ||
| Office | Retail | |
| Market Rent | $25 | $45 |
| Lease Term | 10 year | 7 year |
| Rental Increase Projection | 2.0% | 3.0% |
This is not a research report and was not prepared by any Underwriter’s research department. Please see additional important information and qualifications at the end of this Term Sheet.
T-32
| Office - CBD | Loan #1 | Cut-off Date Balance: | $63,500,000 | |
| 570 Washington Boulevard | Newport Office Center VI | Cut-off Date LTV: | 49.2% | |
| Jersey City, NJ 07310 | U/W NCF DSCR: | 2.13x | ||
| U/W NOI Debt Yield: | 10.1% |
Underwritten Net Cash Flow.The following table presents certain information relating to the Underwritten Net Cash Flow at the Newport Office Center VI Property:
| Cash Flow Analysis(1) | ||
| UW | UW PSF | |
| Gross Potential Rent(2) | $9,983,803 | $23.21 |
| Reimbursements | $4,297,401 | 9.99 |
| Net Rental Income | $14,281,204 | $33.19 |
| Other Income(3) | $199,520 | $0.46 |
| Vacancy and Concessions | ($629,688) | (4.40%) |
| Effective Gross Income | $13,851,036 | $32.19 |
| Taxes | $1,067,381 | $2.48 |
| Insurance | $213,167 | $0.50 |
| Ground Lease Expense(4) | $2,835,978 | $6.59 |
| Other Operating Expenses | $3,289,425 | $7.65 |
| Total Operating Expenses | $7,405,951 | $17.21 |
| Net Operating Income | $6,445,085 | $14.98 |
| TI/LC | $0 | $0.00 |
| Capital Expenditures | $86,048 | $0.20 |
| Net Cash Flow | $6,359,037 | $14.78 |
| NOI DSCR | 2.16x | |
| NCF DSCR | 2.13x | |
| NOI Debt Yield | 10.1% | |
| NCF Debt Yield | 10.0% | |
| (1) | Historical financial statements were not available at the time of the Newport Office Center VI Property acquisition. |
| (2) | UW Gross Potential Rent is based on the 10-year average of the direct rent being paid by DTCC and JPMorgan plus grossed up vacant space equal to $241,290. |
| (3) | Other Income includes POA fees, storage fees, marketing fees, rent-project maintenance fees, extra labor/freight elevator/HVAC overtime, excess office cleaning, lease administration, and other miscellaneous income. |
| (4) | UW Ground Lease Expense is based on the 10-year average ground lease payment. The current annual ground rent is $2,590,000, with annual increases of 2.0% and consumer price index adjustments every ten years after year 20. |
Escrows and Reserves.
Taxes and Insurance Reserves.The Newport Office Center VI Borrower is required to reserve monthly 1/12th of the estimated property taxes and 1/12th of the estimated insurance premiums (waived if a blanket policy is in place). The monthly tax and insurance reserve requirements will be reduced by the percentage of taxes and insurance that DTCC (or any replacement tenant) is obligated to directly pay during the next twelve months provided (i) no event of default is continuing, (ii) the tenant is expressly obligated to directly pay taxes or insurance premiums, does so prior to the date taxes would become delinquent or insurance would expire, and provides evidence of payment to the lender, (iii) the tenant’s lease is in force and full effect and (iv) no Cash Sweep Period (as defined below) is continuing as a result of a DTCC Trigger Event (as defined below).
Replacement Reserve.During the continuance of any of (i) an event of a default, (ii) DTCC’s (or any replacement tenant’s) failure to pay for the replacements directly, (iii) DTCC’s (or any replacement tenant’s) lease failing to be in force and full effect or (iv) a Cash Sweep Period due to a DTCC Trigger Event, the Newport Office Center VI Borrower is required to reserve monthly $7,171 for replacement reserves.
Tenant Improvements and Leasing Commissions Reserve.Upon DTCC’s direct lease no longer being in force and full effect, the Newport Office Center VI Borrower is required to deposit monthly an amount reasonably estimated by the lender to be necessary for leasing commissions and tenant improvement costs anticipated during the remaining term of the Newport Office Center VI Mortgage Loan based on an occupancy rate at the Newport Office Center VI Property of 90%. Additionally, upon DTCC exercising its office expansion option (see“The Property” above), the Newport Office Center VI Borrower is required to (i) deposit with the lender $2,900,000 as security for the payment of any landlord obligations and all costs to be incurred as a result of the expansion (unless the expansion option is exercised after January 1, 2022, from which time DTCC is responsible for reimbursing for the actual cost of the work), (ii) deliver to the lender a completion guaranty from the guarantor and (iii) deposit with the lender any free rent due to DTCC in connection with the expansion option.
Ground Rent Reserve.The Newport Office Center VI Borrower was required to deposit to a ground rent reserve $215,833 at loan closing, and is required to deposit monthly the ground rent due for the immediately following month. The lender will apply the ground rent reserve funds to the payments of ground rent required to be made by the Newport Office Center VI Borrower pursuant to the ground lease.
DTCC TI/LC Reserve.During a DTCC Trigger Event, the Newport Office Center VI Borrower is required to deposit all excess cash to the DTCC TI/LC Reserve which funds are required to be disbursed solely for tenant improvement and leasing commissions costs incurred in connection with a related lease extension or DTCC Re-Tenanting Event (as defined below). When the DTCC Trigger Event is cured, any excess cash collected in the DTCC TI/LC
This is not a research report and was not prepared by any Underwriter’s research department. Please see additional important information and qualifications at the end of this Term Sheet.
T-33
| Office - CBD | Loan #1 | Cut-off Date Balance: | $63,500,000 | |
| 570 Washington Boulevard | Newport Office Center VI | Cut-off Date LTV: | 49.2% | |
| Jersey City, NJ 07310 | U/W NCF DSCR: | 2.13x | ||
| U/W NOI Debt Yield: | 10.1% |
Reserve will be disbursed to the Newport Office Center VI Borrower, provided a Cash Sweep Period does not then exist for any other reason, in which case the excess cash will be held by the lender as additional security for the Newport Office Center VI Mortgage Loan.
A “Cash Sweep Period” will occur during (i) a DTCC Trigger Event until cured, (ii) the period when the debt service coverage ratio is less than 1.15x for two calendar quarters until at least 1.25x for two calendar quarters, or (iii) an event of default under the ground lease until cured.
A “DTCC Trigger Event” will occur upon DTCC (or its replacement tenant) (i) vacating or going dark, or giving notice to vacate or go dark in at least 25% of its leased space, (ii) having its lease terminated, (iii) failing to renew on or prior to the date required under its lease or the date that is twelve months prior to the final expiration date of the lease, (iv) defaulting in payment, (v) becoming, or having its lease guarantor become, the subject of any bankruptcy proceeding, or (vi) being, or having its lease guarantor be, downgraded below “BBB-” by any NRSRO, or if currently rated “BBB-”, thereafter ceasing to be rated by any NRSRO.
A DTCC Trigger Event will end upon a DTCC Re-Tenanting Event, or (a) if triggered by (i) above, the earlier of (x) the aggregate amount swept to the DTCC TI/LC Reserve Account being equal to the product of $20 times the rentable SF of the dark space and (y) DTCC (or its replacement tenant) conducting normal business in at least 75% of its leased space and having revoked any notice to vacate or go dark, (b) if triggered by (ii) or (iii) above, DTCC (or its replacement tenant) having renewed its lease on its entire leased space and all related tenant improvements and leasing commissions being satisfied or reserved, (c) if triggered by (iv) above, the cure of the event of default, (d) if triggered by (v) above, the lease or guaranty being assumed without material alteration and the tenant’s and guarantor’s obligations remaining unaltered, or (e) if triggered by (vi) above, the earlier of (x) the aggregate amount swept to the DTCC TI/LC Reserve Account being equal to $17,100,000 and (y) the credit rating being raised (or reinstated) to at least “BBB-”.
A “DTCC Re-Tenanting Event” will occur when all of (i) at least 90% of the DTCC space (excluding its subleased space) is directly leased to DTCC or one or more replacement tenants acceptable to the lender, (ii) all tenant improvement costs and leasing commissions related to the DTCC space are satisfied or reserved, and (iii) the replacement tenant(s) are conducting normal business operations in the DTCC space.
Lockbox and Cash Management. The Newport Office Center VI Mortgage Loan documents require a hard lockbox with in-place cash management. Upon the occurrence and continuance of a Cash Sweep Period triggered by the debt service coverage ratio being less than 1.15x for two calendar quarters or by an event of default under the ground lease, all excess cash is required to be held by the lender as additional security for the Newport Office Center VI Mortgage Loan. Upon the occurrence and continuance of a Cash Sweep Period triggered by a DTCC Trigger Event, all excess cash is required to be held in the DTCC TI/LC Reserve to be disbursed solely for tenant improvement and leasing commissions costs incurred in connection with a related lease extension or DTCC Re-Tenanting Event.
Additional Secured Indebtedness (not including trade debts). Not permitted.
Mezzanine Loan and Preferred Equity.Not permitted.
Release of Property. Not permitted.
Right of First Refusal.None.
Letter of Credit.None.
Ground Lease.The Newport Office Center VI Property is comprised of a ground leasehold interest under a ground lease with 570 Washington Ground Owner LLC (the “Ground Lessor”), dated February 26, 2019 and expiring February 25, 2117. The Ground Lessor is an affiliate of Safety, Income & Growth, Inc. (NYSE: SAFE), which is an affiliate of the borrower sponsor. Under certain circumstances the Newport Office Center VI Property Mortgage Loan is recourse to the Newport Office Center VI Borrower and borrower sponsor if the Ground Lease is amended, modified, canceled, surrendered or terminated without lender’s prior written consent. See “Descriptions of the Mortgage Pool—Mortgage Pool Characteristics—Fee & Leasehold Estates; Ground Leases” in the Preliminary Prospectus. The ground lease requires current annual payments of $2,590,000, increasing 2% annually (with consumer price index increases every ten years starting after year 20).
Terrorism Insurance.The Newport Office Center VI Borrower is required to obtain and maintain property insurance that covers perils of terrorism and acts of terrorism in an amount equal to the full replacement cost of the Newport Office Center VI Property and business interruption insurance for eighteen months with a twelve month extended period of indemnity. See “Risk Factors—Risks Relating to the Mortgage Loans—Terrorism Insurance May Not Be Available for All Mortgaged Properties” in the Preliminary Prospectus.
This is not a research report and was not prepared by any Underwriter’s research department. Please see additional important information and qualifications at the end of this Term Sheet.
T-34
(THIS PAGE INTENTIONALLY LEFT BLANK)
T-35
| Office - CBD | Loan #2 | Cut-off Date Balance: | $62,500,000 | |
| 350 Rhode Island Street | 350 Rhode Island South | Cut-off Date LTV: | 51.7% | |
| San Francisco, CA 94103 | U/W NCF DSCR: | 2.40x | ||
| U/W NOI Debt Yield: | 10.7% |

This is not a research report and was not prepared by any Underwriter’s research department. Please see additional important information and qualifications at the end of this Term Sheet.
T-36
| Office - CBD | Loan #2 | Cut-off Date Balance: | $62,500,000 | |
| 350 Rhode Island Street | 350 Rhode Island South | Cut-off Date LTV: | 51.7% | |
| San Francisco, CA 94103 | U/W NCF DSCR: | 2.40x | ||
| U/W NOI Debt Yield: | 10.7% |

This is not a research report and was not prepared by any Underwriter’s research department. Please see additional important information and qualifications at the end of this Term Sheet.
T-37
| Mortgage Loan No. 2 – 350 Rhode Island South |
| Mortgage Loan Information | Property Information | ||||||
| Mortgage Loan Seller: | BANA | Single Asset/Portfolio: | Single Asset | ||||
| Credit Assessment (KBRA/Fitch/S&P): | NR/NR/NR | Location: | San Francisco, CA 94103 | ||||
| Original Balance: | $62,500,000 | General Property Type: | Office | ||||
| Cut-off Date Balance: | $62,500,000 | Detailed Property Type: | CBD | ||||
| % of Initial Pool Balance: | 7.5% | Title Vesting: | Fee | ||||
| Loan Purpose: | Acquisition | Year Built/Renovated: | 2002/N/A | ||||
| Sponsor: | CalSTRS; PCCP | Size: | 138,393 SF | ||||
| Guarantor: | 350 Rhode Island South Owner, LLC | Cut-off Date Balance per SF: | $452 | ||||
| Mortgage Rate: | 4.1430% | Maturity Date Balance per SF: | $452 | ||||
| Note Date: | 2/4/2019 | Property Manager: | LPC West, Inc. | ||||
| First Payment Date: | 4/1/2019 | ||||||
| Maturity Date: | 3/1/2029 | ||||||
| Original Term to Maturity: | 120 months | ||||||
| Original Amortization Term: | 0 months | Underwriting and Financial Information | |||||
| IO Period: | 120 months | UW NOI: | $6,679,227 | ||||
| Seasoning: | 1 month | UW NOI Debt Yield: | 10.7% | ||||
| Prepayment Provisions: | LO (25); DEF/YM1 (88); O (7) | UW NOI Debt Yield at Maturity: | 10.7% | ||||
| Lockbox/Cash Mgmt Status: | Hard/Springing | UW NCF DSCR: | 2.40x | ||||
| Additional Debt Type: | N/A | Most Recent NOI: | $3,919,912 (12/31/2018) | ||||
| Additional Debt Balance: | N/A | 2nd Most Recent NOI: | $4,162,418 (6/30/2018 TTM) | ||||
| Future Debt Permitted (Type): | No (N/A) | 3rd Most Recent NOI: | $4,869,682 (6/30/2017 TTM) | ||||
| Reserves(1) | Most Recent Occupancy: | 100.0% (12/31/2018) | |||||
| Type | Initial | Monthly | Cap | 2nd Most Recent Occupancy: | 99.6% (12/31/2017) | ||
| RE Tax: | $0 | Springing | N/A | 3rd Most Recent Occupancy: | 99.6% (12/31/2016) | ||
| Insurance: | $0 | Springing | N/A | Appraised Value (as of): | $121,000,000 (1/7/2019) | ||
| Recurring Replacements: | $0 | Springing | $27,684 | Appraised Value per SF: | $874 | ||
| TI/LC: | $0 | Springing | $1,000,000 | Cut-off Date LTV Ratio: | 51.7% | ||
| Samsara Reserve: | $561,870 | Springing | $2,519,040 | Maturity Date LTV Ratio: | 51.7% | ||
| Sources and Uses | ||||||
| Sources | Proceeds | % of Total | Uses | Proceeds | % of Total | |
| Loan Amount: | $62,500,000 | 51.5% | Purchase Price: | $120,000,000 | 98.8% | |
| Borrower Equity: | $58,919,455 | 48.5% | Closing Costs: | $857,585 | 0.7% | |
| Reserves: | $561,870 | 0.5% | ||||
| Total Sources: | $121,419,455 | 100.0% | Total Uses: | $121,419,455 | 100.0% | |
| (1) | See “Escrows and Reserves” below for further discussion of reserves requirements. |
The Mortgage Loan. The second largest mortgage loan (the “350 Rhode Island South Mortgage Loan”) is evidenced by a promissory note in the original principal amount of $62,500,000 and secured by the first priority fee mortgage on a 138,393 SF mid-rise office building located in San Francisco, California (the “350 Rhode Island South Property”).
The Borrower and the Borrower Sponsor. The borrower is 350 Rhode Island South Owner, LLC, a Delaware limited liability company, structured to be bankruptcy-remote with at least one independent director (the “350 Rhode Island South Borrower”). There is no nonrecourse carve-out guarantor and no separate environmental indemnitor for the 350 Rhode Island South Mortgage Loan.
The borrower sponsors are a joint venture between California State Teachers’ Retirement System (“CalSTRS”) (98%) and Pacific Coast Capital Partners (“PCCP”) (2%). CalSTRS is the second largest public pension fund in the United States with assets valued at approximately $223.8 billion as of January 31, 2019. PCCP is an investment manager with approximately $8.6 billion of assets under management. The borrower sponsors are investing approximately $58.9 million to purchase the 350 Rhode Island South Property.
The Property. The 350 Rhode Island South Property is comprised of a four-story, Class A office building containing 138,393 SF of creative office space and a three-level subterranean garage containing 323 parking spaces with capacity for 466 cars through valet operations. The 350 Rhode Island South Property is located at the base of Potrero Hill’s north slope, in the Showplace Square District of San Francisco, California and has frontage along Rhode Island Street, 17th Street and Kansas Street.
The 350 Rhode Island South Property is located near Highways 101 and 280 and is accessible via public transportation options including city buses (MUNI) available along 16th and Rhode Island Streets, CalTrain available approximately one mile northeast at the corner of 4th and Townsend Streets, and BART regional light rail, to which the 350 Rhode Island South Property offers shuttle service to its Civic Center station.
This is not a research report and was not prepared by any Underwriter’s research department. Please see additional important information and qualifications at the end of this Term Sheet.
T-38
| Office - CBD | Loan #2 | Cut-off Date Balance: | $62,500,000 | |
| 350 Rhode Island Street | 350 Rhode Island South | Cut-off Date LTV: | 51.7% | |
| San Francisco, CA 94103 | U/W NCF DSCR: | 2.40x | ||
| U/W NOI Debt Yield: | 10.7% |
The 350 Rhode Island South Property is part of a larger two-building development comprised of the 350 Rhode Island South Property and the non-collateral 350 Rhode Island North building, which is substantially leased to the San Francisco District Attorney and Police Investigations. The buildings are separated by a landscaped multi-level courtyard, creating through-block public access to both buildings. The buildings are also connected by an open-air bridge over the courtyard. The garage is available for use by both buildings, however, parking revenues belong to the 350 Rhode Island South Property.
Historical year-end occupancy at the 350 Rhode Island South Property has been 100.0% every year since 2013 except 2015, when Sega terminated the lease on its former headquarters space at the building. The 350 Rhode Island South Property is currently 100.0% leased and occupied. The four tenants at the property include: Samsara, Service Employees International Union, Regus and Sutter West Bay Medical.
Major Tenants.
Samsara (89,701 SF, 64.8% of NRA, 68.3% of underwritten base rent). Samsara Networks Inc. (“Samsara”) provides hardware and cloud-based software using sensor data to improve safety, efficiency and quality of operations in a variety of industries including transportation, logistics, construction, food production, energy and manufacturing. Samsara has over 5,000 customers and over 700 employees. In addition to Samsara’s campus at the 350 Rhode Island South Property, Samsara also has offices at 444 De Haro Street (one block from the 350 Rhode Island South Property) and in San Jose, California, Atlanta, Georgia and London, England.
Samsara has been a tenant at the 350 Rhode Island South Property since June 2018, having replaced Sega which was previously headquartered at the 350 Rhode Island South Property, and DoubleDutch. Samsara occupies 12,486 SF on the second floor and the entire third and fourth floors, under a lease that requires annual rental increases each June and expires July 31, 2025 with one three-year renewal option with twelve months’ prior notice. As a security deposit for its lease, Samsara delivered a letter of credit in the amount of $4,538,165 (see “Letter of Credit” below). Samsara is entitled to $561,870 of tenant improvements, which amount has been fully reserved by the lender (see “Escrows and Reserves” below).
Samsara also subleases an additional 5,733 SF on the first floor of the 350 Rhode Island South Property from TATCHA through March 31, 2020 at a rental rate of $60.00 PSF. The lender has underwritten TATCHA’s contract rent as of May 1, 2019 of $59.65 PSF.
Service Employees International Union (25,308 SF, 18.3% of NRA, 20.3% of underwritten base rent).Service Employees International Union (“SEIU”) is an organization of two million members across the United States, Canada and Puerto Rico who work in healthcare, public services and property services industries. SEIU has been a tenant at the 350 Rhode Island South Property since October 2006, occupying 25,308 SF on the first floor. The SEIU lease was renewed in February 2017, increasing the rental rate from $33.00 PSF to $65.00 PSF with annual increases, and expires January 31, 2024.
Regus (16,147 SF, 11.7% of NRA, 8.5% of underwritten base rent). Regus is a provider of flexible workspace solutions with a network of almost 3,000 business centers in almost 900 cities. Regus, which leases the space to shared workspace users, has been a tenant at the 350 Rhode Island South Property since August 2013, occupying 16,147 SF on the second floor. The Regus lease includes annual rental increases each September, and expires August 31, 2023, with one five-year renewal option with 270 days’ prior notice.
Sutter West Bay Medical (6,932 SF, 5.0% of NRA, 2.9% of underwritten base rent). Sutter West Bay Medical is one of three medical groups that make up the Sutter Pacific Medical Foundation, which is a network of over 230 physicians that provide primary and specialty medical care, research and education. Sutter West Bay Medical has been a tenant at the 350 Rhode Island South Property since November 2010 occupying a 6,932 SF state-of-the-art facility for primary medical care on the second floor, under a lease that expires October 31, 2020 with two five-year renewal options with 270 days’ prior notice.
The following table presents certain information relating to the tenants at the 350 Rhode Island South Property:
| Tenant Summary | |||||||||
| Tenant Name | Moody’s/S&P/ Fitch Ratings | Tenant SF | Approx. % of Total SF | Annual UW Rent | % of Total Annual UW Rent | Annual UW Rent PSF | Lease Expiration | Renewal Options | Termination Options |
| Samsara(1) | NR/NR/NR | 89,701 | 64.8% | $6,062,990 | 68.3% | $67.59 | 7/31/2025 | 1 x 3 Yrs | N/A |
| Service Employees International Union | NR/NR/NR | 25,308 | 18.3% | $1,797,627 | 20.3% | $71.03 | 1/31/2024 | N/A | N/A |
| Regus | NR/NR/NR | 16,147 | 11.7% | $758,909 | 8.5% | $47.00 | 8/31/2023 | 1 x 5 Yrs | N/A |
| Sutter West Bay Medical | NR/NR/NR | 6,932 | 5.0% | $257,385 | 2.9% | $37.13 | 10/31/2020 | 2 x 5 Yrs | N/A |
| Subtotal/Wtd. Avg. | 138,088 | 99.8% | 8,876,911 | 100.0% | $64.28 | ||||
| Management Office | 305 | 0.2% | $0 | 0.0% | $0.0 | ||||
| Vacant Space | 0 | 0.0% | $0 | 0.0% | $0.0 | ||||
| Total/Wtd. Avg. | 138,393 | 100.0% | $8,876,911 | 100.0% | $64.28 | ||||
Information is based on the underwritten rent roll.
| (1) | Samsara leases three suites (83,968 SF at a blended Annual UW Rent PSF of $68.13) under a lease expiring July 31, 2025 that includes one three-year renewal option. Samsara also subleases an additional 5,733 SF through March 31, 2020 at a rental rate of $60.00 PSF. For the subleased space, the lender has underwritten the direct lease rent as of May 1, 2019 of $59.65 PSF. |
This is not a research report and was not prepared by any Underwriter’s research department. Please see additional important information and qualifications at the end of this Term Sheet.
T-39
| Office - CBD | Loan #2 | Cut-off Date Balance: | $62,500,000 | |
| 350 Rhode Island Street | 350 Rhode Island South | Cut-off Date LTV: | 51.7% | |
| San Francisco, CA 94103 | U/W NCF DSCR: | 2.40x | ||
| U/W NOI Debt Yield: | 10.7% |
The following table presents certain information relating to the lease rollover schedule at the 350 Rhode Island South Property:
| Lease Rollover Schedule(1)(2) | ||||||||
| Year | # of Leases Rolling | SF Rolling | UW Rent PSF Rolling | Approx. % of Total SF Rolling | Approx. Cumulative % of SF Rolling | Total UW Rent Rolling | Approx. % of Total Rent Rolling | Approx. Cumulative % of Total Rent Rolling |
| 2019 | 0 | 0 | $0.00 | 0.0% | 0.0% | $0 | 0.0% | 0.0% |
| 2020 | 1 | 6,932 | $37.13 | 5.0% | 5.0% | $257,385 | 2.9% | 2.9% |
| 2021 | 0 | 0 | $0.00 | 0.0% | 5.0% | $0 | 0.0% | 2.9% |
| 2022 | 0 | 0 | $0.00 | 0.0% | 5.0% | $0 | 0.0% | 2.9% |
| 2023 | 1 | 16,147 | $47.00 | 11.7% | 16.7% | $758,909 | 8.5% | 11.4% |
| 2024 | 1 | 25,308 | $71.03 | 18.3% | 35.0% | $1,797,627 | 20.3% | 31.7% |
| 2025(3) | 1 | 89,701 | $67.59 | 64.8% | 99.8% | $6,062,990 | 68.3% | 100.0% |
| 2026 | 0 | 0 | $0.00 | 0.0% | 99.8% | $0 | 0.0% | 100.0% |
| 2027 | 0 | 0 | $0.00 | 0.0% | 99.8% | $0 | 0.0% | 100.0% |
| 2028 | 0 | 0 | $0.00 | 0.0% | 99.8% | $0 | 0.0% | 100.0% |
| 2029 | 0 | 0 | $0.00 | 0.0% | 99.8% | $0 | 0.0% | 100.0% |
| 2030 & Beyond | 0 | 0 | $0.00 | 0.0% | 99.8% | $0 | 0.0% | 100.0% |
| Management Office | 0 | 305 | $0.00 | 0.2% | 100.0% | $0.00 | 0.0% | 100.0% |
| Vacant | 0 | 0 | $0.00 | 0.0% | 100.0% | $0 | 0.0% | 100.0% |
| Total/Wtd. Avg. | 4 | 138,393 | $64.28(4) | 100.0% | $8,876,911 | 100.0% | ||
| (1) | Information is based on the underwritten rent roll. |
| (2) | Certain tenants may have lease termination options that are exercisable prior to the stated expiration date of the subject lease or leases which are not considered in the lease rollover schedule. |
| (3) | Samsara leases 83,968 SF that expires on July 31, 2025 and subleases 5,733 SF that expires on March 31, 2020. The Samsara leases have been consolidated as presented. |
| (4) | Wtd. Avg. UW Rent PSF Rolling excludes the 305 SF Management Office for which no rent is collected. |
The Market. The 350 Rhode Island South Property is located in the Potrero/Showplace Square District of San Francisco, California, south of the South of Market (SOMA) District and approximately three miles southwest of the San Francisco central business district. The Potrero Hill area is an established neighborhood community with high residential demand that has also attracted a number of technology firms including Adobe Systems, Dolby Laboratories, Airbnb, Zynga, Pinterest and various technology startups. The Showplace Square area has historically been the center of San Francisco’s Design District, featuring the San Francisco Design Center and the Galleria Design Center, located two blocks from the 350 Rhode Island South Property. The surrounding area to the 350 Rhode Island South Property is mixed use, featuring restaurants, pubs and cafes, grocery stores, furniture stores and retailers, and design firms and office tenants.
According to the appraisal, the San Francisco office market continued to be one of the strongest in the nation for the first three quarters of 2018, with 4.5 million SF of absorption due to continued demand from technology companies of all sizes. As of the third quarter of 2018, city-wide average asking rent was $74.72 PSF, vacancy was 6.8%, and year-to-date leasing activity totaled more than 6.5 million SF.
The 350 Rhode Island South Property is located in the Showplace Square/Potrero Hill office submarket of the San Francisco office market. For the third quarter 2018, the submarket had total inventory of approximately 3.9 million SF with a vacancy rate of 3.5% and Class A average asking rents of $65.00 PSF. Since the third quarter of 2016, the submarket increased inventory by 763,000 SF, had vacancy decline by 8.2%, and Class A asking rent increase by 4.7%.
According to the appraisal, the estimated 2018 population within a one-, three- and five-mile radius of the 350 Rhode Island South Property was 63,762, 505,046 and 815,253, respectively. The 2018 average household income within the same radii was $171,185, $150,545 and $152,438, respectively. Within a one-mile radius, population and average household income have grown at a compound annual rate of 2.4% and 4.2%, respectively, from 2000 to 2018.
This is not a research report and was not prepared by any Underwriter’s research department. Please see additional important information and qualifications at the end of this Term Sheet.
T-40
| Office - CBD | Loan #2 | Cut-off Date Balance: | $62,500,000 | |
| 350 Rhode Island Street | 350 Rhode Island South | Cut-off Date LTV: | 51.7% | |
| San Francisco, CA 94103 | U/W NCF DSCR: | 2.40x | ||
| U/W NOI Debt Yield: | 10.7% |
The following table presents recent leasing data at comparable office properties with respect to the 350 Rhode Island South Property:
| Comparable Lease Summary | ||||||||||
| Property | Year Built/ Renovated | Distance from Subject | Property Size | Tenant | Lease Area (SF) | Lease Date | Initial Rent PSF(1) | Lease Term (Yrs.) | Rent Steps / TI PSF/ Free Rent | |
| 350 Rhode Island South | 2002 / N/A | N/A | 138,393 / A | Samsara(2) | 89,701(2) | Jun-18(2) | $67.59(2) | 7.0(2) | 3.0% / $40 / 0 mos(2) | |
| 444 De Haro Street | 1927 / 1984 | 0.1 miles | 135,524 / B | Samsara(3) | 13,378 | Dec-18 | $79.00 | 4.6 | 3.0% / $15 / 0 mos | |
| 1000 Brannan Street | 1924 / N/A | 0.9 miles | 90,000 / B | BAMO | 10,926 | Sept-18 | $54.00 | 7.0 | 3.0% / $15 / 0 mos | |
| 100 Hooper Street | 2017 / N/A | 0.4 miles | 423,000 / A | Adobe | 104,667 | Apr-18 | $72.00 | 12.0 | 3.0% / $70 / 9 mos | |
| 99 Rhode Island Street | 1948 / 1970 | 0.2 miles | 60,000 / B | Dexafit | 60,000 | Feb-17 | $51.00 | 7.0 | 3.0% / $10 / 1 mos | |
| 2300 Harrison Street | 1913 / 1999 | 0.9 miles | 65,493 / B | AdRoll | 66,112 | Jan-17 | $63.50 | 3.0 | 3.0% / $0 / 0 mos | |
Source: Appraisal.
| (1) | Initial Rent PSF is shown on an industrial gross basis. |
| (2) | Information obtained from the underwritten rent roll. |
| (3) | Samsara is also a tenant at the 350 Rhode Island South Property. |
The following table presents the appraiser’s market rent conclusions:
| Market Rent Summary | |||
| 1stFloor | 2ndFloor | 3rd/4thFloors | |
| Market Rent | $68 | $70 | $75 |
| Lease Term | 7 years | 7 years | 7 years |
| Rental Increase Projection | 3.0% | 3.0% | 3.0% |
This is not a research report and was not prepared by any Underwriter’s research department. Please see additional important information and qualifications at the end of this Term Sheet.
T-41
| Office - CBD | Loan #2 | Cut-off Date Balance: | $62,500,000 | |
| 350 Rhode Island Street | 350 Rhode Island South | Cut-off Date LTV: | 51.7% | |
| San Francisco, CA 94103 | U/W NCF DSCR: | 2.40x | ||
| U/W NOI Debt Yield: | 10.7% |
Operating History and Underwritten Net Cash Flow.The following table presents certain information relating to the historical operating performance and Underwritten Net Cash Flow at the 350 Rhode Island South Property:
| Cash Flow Analysis | ||||||
| 6/30/2016(1) | 6/30/2017(1) | 6/30/2018(1) | 12/31/2018 | UW | UW PSF | |
| Gross Potential Rent(2) | $5,171,461 | $6,413,928 | $6,040,223 | $6,440,136 | $8,876,911 | $64.14 |
| Reimbursements | $405,923 | $726,224 | $283,971 | $239,626 | $1,166,376 | $8.43 |
| Parking Income | $501,268 | $509,352 | $609,213 | $883,301 | $827,412 | $5.98 |
| Other Income(3) | $690,190 | $753,941 | $666,375 | $758,669 | $686,911 | $4.96 |
| Vacancy and Concessions | ($334,451) | ($137,085) | ($266,801) | ($1,134,870) | ($502,164) | ($3.63) |
| Effective Gross Income | $6,434,391 | $8,266,360 | $7,332,981 | $7,186,862 | $11,055,446 | $79.88 |
| Taxes(4) | $722,904 | $833,030 | $754,103 | $764,619 | $1,793,556 | $12.96 |
| Insurance | $134,573 | $148,482 | $183,879 | $219,276 | $160,400 | $1.16 |
| Other Operating Expenses | $2,237,930 | $2,415,166 | $2,232,581 | $2,283,055 | $2,422,263 | $17.50 |
| Total Operating Expenses | $3,095,407 | $3,396,678 | $3,170,563 | $3,266,950 | $4,376,219 | $31.62 |
| Net Operating Income(2) | $3,338,984 | $4,869,682 | $4,162,418 | $3,919,912 | $6,679,227 | $48.26 |
| TI/LC | $0 | $0 | $0 | $0 | $349,638 | $2.53 |
| Capital Expenditures | $57,747 | $20,607 | $0 | $97,298 | $34,598 | $0.25 |
| Net Cash Flow | $3,281,237 | $4,849,075 | $4,162,418 | $3,822,614 | $6,294,990 | $45.49 |
| Occupancy %(5) | 99.6% | 99.6% | 100.0% | 100.0% | 95.0% | |
| NOI DSCR | 1.27x | 1.85x | 1.59x | 1.49x | 2.54x | |
| NCF DSCR | 1.25x | 1.85x | 1.59x | 1.46x | 2.40x | |
| NOI Debt Yield | 5.3% | 7.8% | 6.7% | 6.3% | 10.7% | |
| NCF Debt Yield | 5.2% | 7.8% | 6.7% | 6.1% | 10.1% | |
| (1) | Historical periods shown are as of the June fiscal year end for each year. |
| (2) | UW Gross Potential Rent is based on the December 31, 2018 rent roll, with rent steps taken through February 2020 of $302,828. The increase in UW Gross Potential Rent and Net Operating income from historical Gross Potential Rent and Net Operating Income is primarily attributable to the largest tenant, Samsara, the lease for which commenced in June 2018, replacing two below-market tenants. |
| (3) | Other Income includes reimbursements related to the non-collateral 350 Rhode Island North building. |
| (4) | UW Taxes includes budgeted re-assessed taxes following the acquisition and Proposition C (3.5%) taxes which went into effect January 1, 2019. |
| (5) | Occupancy is shown as of December 31, of the corresponding year. |
Escrows and Reserves.
Taxes and InsuranceReserves.During a DSCR Event (as defined below) or the continuance of an event of default, the 350 Rhode Island South Borrower is required to reserve monthly 1/12 of the estimated property taxes and 1/12 of the estimated insurance premiums (waived if a blanket policy is in place).
Replacement Reserve.During a DSCR Event, the 350 Rhode Island South Borrower is required to reserve monthly $2,307 for replacement reserves until a cap of $27,684 is reached.
Tenant Improvements and Leasing Commissions Reserve.During a DSCR Event, the 350 Rhode Island South Borrower is required to reserve monthly $11,533 for leasing reserves until a cap of $1,000,000 is reached.
Samsara Reserve.The 350 Rhode Island South Borrower reserved at loan closing $561,870 for outstanding tenant improvements owed to Samsara. Additionally, during a Samsara Event (as defined below), all excess cash flow from the 350 Rhode Island South Property is required to be deposited to a reserve for tenant improvements and leasing commissions associated with re-tenanting the Samsara space, until a cap of $2,519,040 is reached. Provided no event of default is continuing, the excess cash collected will be released to the 350 Rhode Island South Borrower upon Samsara (or a replacement tenant acceptable to the lender) being in full occupancy of and paying full rent for the Samsara space.
A “DSCR Event” means the period commencing when the debt service coverage ratio is less than 1.30x for two consecutive quarters and ending when the debt service coverage ratio is equal to or greater than 1.30x for two consecutive quarters
A “Samsara Event” will exist during the earlier of (i) a Samsara Bankruptcy Event (as defined below), (ii) a Samsara Operations Event (as defined below) or (iii) a Samsara Renewal Event (as defined below). In all events a Samsara Event will end when the balance of the Samsara Reserve equals or exceeds $2,519,040 or the applicable cure is met.
A “Samsara Bankruptcy Event” means the period commencing when Samsara avails itself of any creditors rights laws and ending when Samsara (or a replacement tenant acceptable to the lender) (a) has assumed its lease, (b) is paying full rent and (c) is operating and in full occupancy for at least 45 consecutive days (or if not in full occupancy, only applicable to a replacement tenant, the debt yield is at least 10.7%).
This is not a research report and was not prepared by any Underwriter’s research department. Please see additional important information and qualifications at the end of this Term Sheet.
T-42
| Office - CBD | Loan #2 | Cut-off Date Balance: | $62,500,000 | |
| 350 Rhode Island Street | 350 Rhode Island South | Cut-off Date LTV: | 51.7% | |
| San Francisco, CA 94103 | U/W NCF DSCR: | 2.40x | ||
| U/W NOI Debt Yield: | 10.7% |
A “Samsara Operations Event” means the period commencing when Samsara ceases to operate or vacates more than 50.0% of its leased space and ending when Samsara (or a replacement tenant acceptable to the lender) is paying full rent and continuously operating for at least 60 consecutive days in at least 50.0% of the Samsara space.
A “Samsara Renewal Event” means the period commencing the earlier of twelve months prior to Samsara’s lease expiration or upon Samsara giving notice of non-renewal, and ending when Samsara renews its lease or a replacement tenant acceptable to the lender commences rent and is in full occupancy of the Samsara space.
Lockbox and Cash Management. The 350 Rhode Island South Mortgage Loan documents require a hard lockbox with springing cash management upon the occurrence of a DSCR Event or a Samsara Event. During the continuance of a DSCR Event or a Samsara Event, all funds in the lockbox account are required to be swept each business day to a lender-controlled cash management account and disbursed in accordance with the 350 Rhode Island South Mortgage Loan documents. Additionally, during a DSCR Event all excess cash flow is required to be held as additional security for the 350 Rhode Island South Mortgage Loan until the discontinuance of the DSCR Event. And during a Samsara Event, all excess cash flow is required to be deposited to the Samsara Reserve until a cap of $2,519,040 is reached. Provided no event of default is continuing, the excess cash collected to the Samsara Reserve will be released to the 350 Rhode Island South Borrower upon Samsara (or a replacement tenant acceptable to the lender) being in full occupancy of and paying full rent for the Samsara space.
Additional Secured Indebtedness (not including trade debts). Not permitted.
Mezzanine Loan and Preferred Equity.Not permitted.
Release of Property. Not permitted.
Right of First Refusal.None.
Letter of Credit.A letter of credit issued by Silicon Valley Bank in the amount of $4,538,165 was delivered by Samsara as a security deposit for its lease. Provided no event of default on the part of Samsara then exists, on the last day of the 60th full month of its lease term, the letter of credit will be reduced to $2,016,958. The letter of credit has been assigned to the 350 Rhode Island South Borrower. Upon an event of default by Samsara, the 350 Rhode Island South Borrower is entitled to draw on the letter of credit, subject to the lender’s determination of the draw amount. Any proceeds drawn from the letter of credit are required to be deposited with the lender and disbursed to the 350 Rhode Island South Borrower (i) for the payment of any rent or amount due to the landlord as a result of Samsara’s event of default or (ii) if the Samsara lease has been terminated, to reimburse the borrower for re-tenanting costs for the Samsara leased space with any remaining amounts disbursed to the 350 Rhode Island South Borrower.
Terrorism Insurance.The 350 Rhode Island South Borrower is required to obtain and maintain property insurance that covers perils of terrorism and acts of terrorism in an amount equal to the full replacement cost of the 350 Rhode Island South Property and business interruption insurance for eighteen months with a twelve month extended period of indemnity. See “Risk Factors—Risks Relating to the Mortgage Loans—Terrorism Insurance May Not Be Available for All Mortgaged Properties” in the Preliminary Prospectus.
This is not a research report and was not prepared by any Underwriter’s research department. Please see additional important information and qualifications at the end of this Term Sheet.
T-43
| Multifamily – High Rise | Loan #3 | Cut-off Date Balance: | $56,000,000 | |
| 42-12 28th Street | Tower 28 | Cut-off Date LTV: | 33.4% | |
| Long Island City, NY 11249 | U/W NCF DSCR: | 2.31x | ||
| U/W NOI Debt Yield: | 13.0% |

This is not a research report and was not prepared by any Underwriter’s research department. Please see additional important information and qualifications at the end of this Term Sheet.
T-44
| Multifamily – High Rise | Loan #3 | Cut-off Date Balance: | $56,000,000 | |
| 42-12 28th Street | Tower 28 | Cut-off Date LTV: | 33.4% | |
| Long Island City, NY 11249 | U/W NCF DSCR: | 2.31x | ||
| U/W NOI Debt Yield: | 13.0% |

This is not a research report and was not prepared by any Underwriter’s research department. Please see additional important information and qualifications at the end of this Term Sheet.
T-45
| Mortgage Loan No. 3 – Tower 28 |
| Mortgage Loan Information | Property Information | ||||||
| Mortgage Loan Seller: | MSMCH | Single Asset/Portfolio: | Single Asset | ||||
| Credit Assessment (KBRA/Fitch/S&P): | A/BBB-sf/NR | Location: | Long Island City, NY 11101 | ||||
| Original Balance(1): | $56,000,000 | General Property Type: | Multifamily | ||||
| Cut-off Date Balance(1): | $56,000,000 | Detailed Property Type: | High Rise | ||||
| % of Initial Pool Balance: | 6.7% | Title Vesting: | Fee | ||||
| Loan Purpose: | Refinance | Year Built/Renovated: | 2018/N/A | ||||
| Sponsor: | Heatherwood Luxury Rentals | Size: | 450 Units | ||||
| Guarantor: | Douglas S. Partrick | Cut-off Date Balance per Unit(1): | $248,889 | ||||
| Mortgage Rate(2): | 3.7842% | Maturity Date Balance per Unit(1): | $214,616 | ||||
| Note Date: | 3/11/2019 | Property Manager: | Dovedale Sales Corp and DSP | ||||
| First Payment Date: | 5/1/2019 | Managing Corp. | |||||
| Maturity Date: | 4/1/2029 | (borrower-related) | |||||
| Original Term to Maturity: | 120 months | Underwriting and Financial Information
| |||||
| Original Amortization Term: | 360 months | UW NOI: | $14,566,007 | ||||
| IO Period: | 36 months | UW NOI Debt Yield(1): | 13.0% | ||||
| Seasoning: | 0 months | UW NOI Debt Yield at Maturity(1): | 15.1% | ||||
| Prepayment Provisions: | LO (24); YM1 (89); O (7) | UW NCF DSCR(1): | 2.31x (P&I) 3.36x (IO) | ||||
| Lockbox/Cash Mgmt Status: | Hard/In Place | Most Recent NOI: | $12,125,689 (12/31/2018 T-3 Ann.) | ||||
| Additional Debt Type(1)(3): | Pari passu/Subordinate/Mezzanine | 2nd Most Recent NOI: | $9,436,635 (12/31/2018 T-6 Ann.) | ||||
| Additional Debt Balance(1)(3): | $56,000,000/$53,000,000/$50,000,000 | 3rd Most Recent NOI(5): | $4,244,404 (12/31/2018) | ||||
| Future Debt Permitted (Type): | No (N/A) | Most Recent Occupancy: | 93.6% (2/25/2019) | ||||
| Reserves(4) | 2nd Most Recent Occupancy: | N/A | |||||
| Type | Initial | Monthly | Cap | 3rd Most Recent Occupancy: | N/A | ||
| RE Tax: | $0 | Springing | N/A | Appraised Value (as of)(6): | $335,000,000 (1/10/2019) | ||
| Insurance: | $0 | Springing | N/A | Appraised Value per SF: | $744,444 | ||
| Deferred Maintenance: | $60,000 | $0 | N/A | Cut-off Date LTV Ratio(1): | 33.4% | ||
| Residential Recurring Replacements: | $0 | Springing | N/A | Maturity Date LTV Ratio(1): | 28.8% | ||
| Non-Residential Recurring Replacements: | $0 | Springing | N/A | ||||
| Sources and Uses | ||||||
| Sources | Proceeds | % of Total | Uses | Proceeds | % of Total | |
| Whole Loan Amount(1): | $112,000,000 | 52.1% | Loan Payoff: | $154,636,300 | 71.9% | |
| Subordinate Companion Loan: | $53,000,000 | 24.7% | Return of Equity: | $55,137,898 | 25.7% | |
| Mezzanine Loan: | $50,000,000 | 23.3% | Closing Costs: | $5,165,802 | 2.4% | |
| Reserves: | $60,000 | 0.0% | ||||
| Total Sources: | $215,000,000 | 100.0% | Total Uses: | $215,000,000 | 100.0% | |
| (1) | The Tower 28 Mortgage Loan (as defined below) is part of the Tower 28 Whole Loan (as defined below), which is comprised of twopari passusenior promissory notes with an aggregate principal balance of $112,000,000 (the “Senior Notes”, and collectively the “Tower 28 Senior Loan”) and one promissory note that is subordinate to the Senior Notes with a principal balance of $53,000,000 (the “Tower 28 Subordinate Companion Loan”, and together with the Tower 28 Senior Loan, the “Tower 28 Whole Loan”). The Cut-off Date Balance per Unit, Maturity Date Balance per Unit, UW NOI Debt Yield, UW NOI Debt Yield at Maturity, UW NCF DSCR, Cut-off Date LTV Ratio and Maturity Date LTV Ratio numbers presented above are based on the aggregate principal balance of the Tower 28 Senior Loan, without regard to the Tower 28 Subordinate Companion Loan or the mezzanine loan. The Cut-off Date Balance per Unit, Maturity Date Balance per Unit, UW NOI Debt Yield, UW NOI Debt Yield at Maturity, UW NCF DSCR, Cut-off Date LTV Ratio and Maturity Date LTV Ratio numbers based on the entire $165,000,000 Tower 28 Whole Loan are $366,667, $319,270, 8.8%, 10.1%, 1.49x, 49.3% and 42.9%, respectively. The Cut-off Date Balance per Unit, Maturity Date Balance per Unit, UW NOI Debt Yield, UW NOI Debt Yield at Maturity, UW NCF DSCR, Cut-off Date LTV Ratio and Maturity Date LTV Ratio numbers based on the combined balance of the Tower 28 Whole Loan and the related mezzanine loan are $477,778, $420,792, 6.8%, 7.7%, 1.07x, 64.2% and 56.5%, respectively. |
| (2) | Reflects the Tower 28 Mortgage Loan only. The Tower 28 Subordinate Companion Loan bears interest at the rate of 5.0900%per annum. |
| (3) | See “The Mortgage Loan”, “Additional Secured Indebtedness (not including trade debts)”and “Mezzanine Loan and Preferred Equity” below, for a discussion of additional debt. |
| (4) | See “Escrows and Reserves” below for further discussion of reserve requirements. |
| (5) | Financial information prior to December 31, 2018 is not available because the Tower 28 Property (as defined below) was constructed in 2018. |
| (6) | The appraised value includes $55,000,000 attributable to the net present value of a 421-a tax abatement applicable to the Tower 28 Property (as defined below). |
This is not a research report and was not prepared by any Underwriter’s research department. Please see additional important information and qualifications at the end of this Term Sheet.
T-46
| Multifamily – High Rise | Loan #3 | Cut-off Date Balance: | $56,000,000 | |
| 42-12 28th Street | Tower 28 | Cut-off Date LTV: | 33.4% | |
| Long Island City, NY 11101 | U/W NCF DSCR: | 2.31x | ||
| U/W NOI Debt Yield: | 13.0% |
The Mortgage Loan. The third largest mortgage loan (the “Tower 28 Mortgage Loan”) is part of the Tower 28 Whole Loan in the original principal balance of $165,000,000. The Tower 28 Whole Loan is secured by a first priority fee mortgage encumbering a multifamily property located in Long Island City, New York (the “Tower 28 Property”). The Tower 28 Whole Loan was originated by Morgan Stanley Bank, N.A. as to the Tower 28 Senior Loan and by Morgan Stanley Mortgage Capital Holdings LLC, as to the Tower 28 Subordinate Companion Loan. The Tower 28 Whole Loan is comprised of twopari passu senior promissory notes in the aggregate original principal balance of $112,000,000 (Promissory Notes A-1 and A-2, together the “Tower 28 Senior Loan”) and one subordinate promissory note in the original principal balance of $53,000,000 (the “Tower 28 Subordinate Companion Loan”). The controlling senior Promissory Note A-1, which will be contributed to the BANK 2019-BNK17 securitization transaction, had an original principal balance of $56,000,000. The non-controlling senior Promissory Note A-2 (the “Tower 28Pari passu Senior Companion Loan”), with an original principal balance of $56,000,000, is currently held by Morgan Stanley Bank, N.A. and is expected to be contributed to one or more future securitization transactions. The Tower 28 Whole Loan will be serviced pursuant to the pooling and servicing agreement for the BANK 2019-BNK17 securitization transaction. See “Description of the Mortgage Pool—The Whole Loans—The Tower 28 Pari Passu A/B Whole Loan” and “Pooling and Servicing Agreement” in the Preliminary Prospectus.
| Tower 28 Whole Loan Summary | ||||
| Notes(1) | Original Balance | Cut-off Date Balance | Note Holder | Lead Servicing Interest |
| A-1 | $56,000,000 | $56,000,000 | BANK 2019-BNK17 | Yes(1) |
| A-2 | $56,000,000 | $56,000,000 | Morgan Stanley Bank, N.A. | No |
| B | $53,000,000 | $53,000,000 | Morgan Stanley Mortgage Capital Holdings LLC | No(1) |
| Total | $165,000,000 | $165,000,000 | ||
| (1) | The holder of the Subordinate Companion Loan will have the right to appoint the special servicer of the Tower 28 Whole Loan and to direct certain decisions with respect to the Tower 28 Whole Loan, unless a control appraisal event exists under the related co-lender agreement. |
The Borrower and the Borrower Sponsor.The borrower is 4212 28ST DE LLC (the “Tower 28 Borrower”), a single-purpose Delaware limited liability company with two independent directors. The borrower sponsor is Heatherwood Luxury Rentals (“Heatherwood”) and the non-recourse carve-out guarantor is Douglas S. Partrick. The Tower 28 Borrower is indirectly owned by Douglas S. Partrick (50.0%), The Partrick Family 2012 Irrevocable Trust (24.5%), Donald G. Partrick Sr. 2012 Irrevocable Trust (24.5%) and Donald G. Partrick (1.0%). Heatherwood is a privately owned, family run company with over 60 years of experience in building residential rental communities, commercial properties and urban spaces. Heatherwood’s portfolio spans rental properties from Brooklyn and Queens to the east end of Long Island.
The Property.The Tower 28 Property is comprised of a 58-story, Class A, multifamily tower totaling 450 units located in Long Island City, New York. Construction of the Tower 28 Property was completed in 2018 and, as of February 25, 2019, the Tower 28 Property was 93.6% leased. Standing at 647 feet in height, the Tower 28 Property is the tallest residential building in Queens and Brooklyn, giving the building views of the East River, the Manhattan skyline and the surrounding cityscape.Amenities at the Tower 28 Propertyinclude a 24-hour lobby attendant and concierge service, package room, bike storage, resident storage, common laundry room, on-site parking, and on-site leasing. In addition, there is a club level on the third floor that includes a resident lounge and game room, demonstration kitchen, children’s playroom, business center and conference room, landscaped roof deck with grilling stations, an indoor pool and lounge chairs. The 4th floor includes a fitness center and the 5th floor includes two movement studios, steam room, and sauna. In addition, the building contains a terrace and resident lounge on the 45th floor, an observation deck and an observation room on the 57th floor.In-unit amenities include washers/dryers and floor to ceiling windows in every unit and access to a private balcony or terrace in 67 units. In addition to the residential component, the Tower 28 Property contains a commercial component that consists of two grade level retail suites totaling 5,031 SF and a parking garage on the second floor that contains 50 parking spaces.
The following table presents certain information relating to the unit mix at the Tower 28 Property:
| Unit Mix | |||||||||||
| Unit Mix / Type | Units | Occupied Units | % Occupied | Average SF per Unit | Total SF | Monthly Average Rent per Unit | |||||
| Studio | 131 | 127 | 96.9% | 455 | 59,611 | $2,616 | |||||
| One-Bedroom | 136 | 122 | 89.7% | 688 | 93,626 | $3,305 | |||||
| 1.5-Bedroom | 50 | 49 | 98.0% | 744 | 37,195 | $3,682 | |||||
| Two-Bedroom | 104 | 100 | 96.2% | 975 | 101,410 | $4,697 | |||||
| Three-Bedroom | 28 | 23 | 82.1% | 1,329 | 37,222 | $6,417 | |||||
| Four-Bedroom | 1 | 0 | 0.0% | 1,644 | 1,644 | $7,329 | |||||
| Total/Wtd. Avg. | 450 | 421 | 93.6% | 735 | 330,708 | $3,671 | |||||
Source:Borrower rent roll dated February 25, 2019.
Tax Abatement and Rent Stabilization. The Tower 28 Property has a 15-year tax abatement, which commenced July 1, 2018, under New York City’s 421-a tax abatement program. The 15-year 421-a tax abatement program allows the Tower 28 Property’s increase in assessed value to be 100% exempt for 11 years (through the 2028-2029 tax year). Thereafter, an increase in the assessment is phased in with 20% increments every year beginning in the 12th year of the abatement (the 2029-2030 tax year), with full taxes commencing in the 2033-2034 tax year. The 421-a exemption is capped at an amount equal to $87,355 per dwelling unit, which cap increases by 3.00% annually each January 5. The abated taxes for the 2018-2019 tax year are $436,539, compared to unabated taxes of $5,402,619.
Pursuant to the 421-a program, all units at the Tower 28 Property are required to be rent stabilized for the duration of the 421-a benefits. Accordingly, rent increases will be subject to limitations set by the New York City Rent Guidelines Board.
This is not a research report and was not prepared by any Underwriter’s research department. Please see additional important information and qualifications at the end of this Term Sheet.
T-47
| Multifamily – High Rise | Loan #3 | Cut-off Date Balance: | $56,000,000 | |
| 42-12 28th Street | Tower 28 | Cut-off Date LTV: | 33.4% | |
| Long Island City, NY 11101 | U/W NCF DSCR: | 2.31x | ||
| U/W NOI Debt Yield: | 13.0% |
The Markets. The Tower 28 Property is located in Long Island City, New York, within the borough of Queens in New York City. The Tower 28 Property is located within a neighborhood that was previously zoned as a light industrial district and was rezoned by the City of New York in 2001. This rezoning represented an effort by the City to revitalize an aging mixed use/industrial district and allows alternative uses, including residential and commercial uses. The immediate area surrounding the Tower 28 Property contains a mix of commercial, residential and light industrial uses. There are numerous residential buildings that were or are being built as a result of the rezoning. In addition to new residential uses, there are several large commercial buildings in the immediate vicinity, including the JetBlue Airways headquarters, One Court Square, and Silvercup Studios. The Tower 28 Property featuresfrontage along 27th and 28th Streets and is positioned one block from Queensboro Plaza Station, which provides direct access to Manhattan and the surrounding boroughs via six different subway lines (7, N, W, E, M and R).
According to a third party report, the Tower 28 Property is in the Long Island City multifamily submarket of the New York City multifamily market. As of the third quarter of 2018, the Long Island City multifamily submarket consisted of 17,116 units, had an average vacancy of 6.7% and average asking rents of $3,601 per unit. As of the third quarter of 2018, the New York City multifamily market consisted of 1,348,165 units, had an average vacancy of 2.2% and average asking rents of $2,750 per unit. The appraisal concluded to a market rental rate of $62.00 per SF for the residential units at the Tower 28 Property and $70.00 per SF for the retail units at the Tower 28 Property.
The following table presents certain information relating to comparable rental properties to the Tower 28 Property:
| Comparable Rental Properties | |||||||
| Tower 28 Property | 2222 Jackson Avenue | 1 QPS | The Forge | The Hayden | Halo LIC | Linc LIC | |
| Year Built | 2018 | 2016 | 2017 | 2017 | 2017 | 2016 | 2013 |
| Number of units | 450 | 343 | 390 | 272 | 974 | 284 | 591 |
| Occupancy | 93.6%(1) | 99.7% | 99.2% | 98.5% | 97.8% | 99.6% | 99.0% |
| Unit size (SF)(2): | |||||||
| - Studio | 455 | 468 | 465 | 455 | 490 | 438 | 546 |
| - 1-BR | 688 | 596 | 707 | 717 | 692 | 693 | 685 |
| - 1.5-BR | 744 | N/A | N/A | N/A | N/A | N/A | N/A |
| - 2-BR | 975 | 823 | 1,013 | 941 | 939 | 986 | 1,014 |
| - 3-BR | 1329 | 1,159 | N/A | N/A | N/A | 1,246 | 1,348 |
| - 4-BR | 1644 | N/A | N/A | N/A | N/A | N/A | N/A |
| Monthly Rent per Unit(2): | |||||||
| - Studio | $2,616 | $2,613 | $2,505 | $2,812 | $2,807 | $2,264 | $2,658 |
| - 1-BR | $3,305 | $3,473 | $3,149 | $3,633 | $3,616 | $3,207 | $3,417 |
| - 1.5-BR | $3,682 | N/A | N/A | N/A | N/A | N/A | N/A |
| - 2-BR | $4,697 | $4,423 | $5,329 | $5,070 | $4,845 | $5,118 | $4,538 |
| - 3-BR | $6,417 | $5,773 | N/A | N/A | N/A | $5,749 | $6,100 |
| - 4-BR | $7,329 | N/A | N/A | N/A | N/A | N/A | N/A |
| Monthly Rent per SF(2): | |||||||
| - Studio | $5.75 | $5.58 | $5.39 | $6.18 | $5.73 | $5.17 | $4.87 |
| - 1-BR | $4.80 | $5.83 | $4.45 | $5.07 | $5.23 | $4.63 | $4.99 |
| - 1.5-BR | $4.95 | N/A | N/A | N/A | N/A | N/A | N/A |
| - 2-BR | $4.82 | $5.37 | $5.26 | $5.39 | $5.16 | $5.19 | $4.48 |
| - 3-BR | $4.83 | $4.98 | N/A | N/A | N/A | $4.61 | $4.53 |
| - 4-BR | $4.46 | N/A | N/A | N/A | N/A | N/A | N/A |
Source:Appraisal
| (1) | As of the borrower rent roll dated February 25, 2019. |
| (2) | Represents the average for each unit size at the Tower 28 Property. |
This is not a research report and was not prepared by any Underwriter’s research department. Please see additional important information and qualifications at the end of this Term Sheet.
T-48
| Multifamily – High Rise | Loan #3 | Cut-off Date Balance: | $56,000,000 | |
| 42-12 28th Street | Tower 28 | Cut-off Date LTV: | 33.4% | |
| Long Island City, NY 11101 | U/W NCF DSCR: | 2.31x | ||
| U/W NOI Debt Yield: | 13.0% |
Operating History and Underwritten Net Cash Flow. The following table presents certain information relating to the historical operating performance and Underwritten Net Cash Flow at the Tower 28 Property:
| Cash Flow Analysis(1) | |||||
| 12/31/2018 TTM | 12/31/2018 T-6 Ann. | 12/31/2018 T-3 Ann. | UW | UW per unit | |
| Gross Potential Rent | $10,838,851 | $16,079,807 | $17,858,742 | $20,139,863 | $44,755.25 |
| Other Income(2) | $333,177 | $466,095 | $524,021 | $406,810 | $904.02 |
| Concessions | ($1,476,905) | ($1,556,640) | ($898,624) | $0 | $0.00 |
| Less Vacancy & Credit Loss | $0 | $0 | $0 | ($1,006,993) | ($2,237.76) |
| Effective Gross Income | $9,695,123 | $14,989,262 | $17,484,140 | $19,539,680 | $43,421.51 |
| Real Estate Taxes(3) | $265,695 | $437,537 | $437,537 | $436,539 | $970.09 |
| Insurance | $168,000 | $168,000 | $168,000 | $172,000 | $382.22 |
| Other Expenses | $5,017,025 | $4,947,090 | $4,752,914 | $4,365,134 | $9,700.30 |
| Total Expenses | $5,450,720 | $5,552,627 | $5,358,451 | $4,973,673 | $11,052.61 |
| Net Operating Income(4) | $4,244,404 | $9,436,635 | $12,125,689 | $14,566,007 | $32,368.91 |
| Capital Expenditures | $0 | $0 | $0 | $113,255 | $251.68 |
| TI/LC | $0 | $0 | $0 | $14,529 | $32.29 |
| Net Cash Flow | $4,244,404 | $9,436,635 | $12,125,689 | $14,438,224 | $32,084.94 |
| Occupancy % | N/A | N/A | 93.6%(5) | 95.0%(5) | |
| NOI DSCR (IO)(6) | 0.99x | 2.20x | 2.82x | 3.39x | |
| NOI DSCR (P&I)(6) | 0.68x | 1.51x | 1.94x | 2.33x | |
| NCF DSCR (IO)(6) | 0.99x | 2.20x | 2.82x | 3.36x | |
| NCF DSCR (P&I)(6) | 0.68x | 1.51x | 1.94x | 2.31x | |
| NOI Debt Yield(6) | 3.8% | 8.4% | 10.8% | 13.0% | |
| NCF Debt Yield(6) | 3.8% | 8.4% | 10.8% | 12.9% | |
| (1) | Financial information prior to December 31, 2018 is not available because the Tower 28 Property was constructed in 2018. |
| (2) | Other Income is comprised mainly of amenity and parking revenue. |
| (3) | UW Real Estate Taxes represent 2018/2019 abated taxes. See “The Property—Tax Abatement and Rent Stabilization” above. |
| (4) | The Increase in Net Operating Income from 12/31/2018 TTM to UW is due to lease up at the Tower 28 Property. The Tower 28 Property was constructed in 2018. |
| (5) | 12/31/2018 T-3 Ann. Occupancy is as of the borrower rent roll dated February 25, 2019. UW Occupancy represents economic occupancy. |
| (6) | The debt service coverage ratios and debt yields are based on the Tower 28 Senior Loan, and excludes the Tower 28 Subordinate Companion Loan. |
Escrows and Reserves.
Real Estate Taxes – The Tower 28 Whole Loan documents provide for monthly deposits to an ongoing monthly real estate tax reserve in an amount equal to 1/12th of the annual estimated real estate taxes (however, such monthly deposits are waived if (a) no event of default has occurred and is continuing, (b) the combined debt service coverage ratio (based on the aggregate annual actual interest only or amortizing, as then applicable, debt service due under both the Tower 28 Whole Loan and Tower 28 Mezzanine Loan (as defined below) is equal to or greater than 1.20x (clauses (a) and (b), together, the “Reserve Waiver Conditions”)) and (c) the Tower 28 Borrower provides the lender with evidence that all taxes then due and payable in connection therewith have been paid in full at least five business days prior to their delinquency).
Insurance – The Tower 28 Whole Loan documents provide for monthly deposits to an insurance reserve in a monthly amount equal to 1/12 of the annual estimated insurance premiums ( however, such monthly deposits are waived if (a) no event of default has occurred and is continuing, (b) the Tower 28 Borrower maintains a blanket policy which complies with the requirements under the Tower 28 Whole Loan documents and includes the liability and casualty policies required therein and (c) the Tower 28 Borrower provides the lender with evidence of renewal of such policies prior to the expiration dates of the policies and provides paid receipts for the payment of the insurance premiums by no later than ten days prior to the expiration dates of the policies).
Required Repairs – The Tower 28 Whole Loan documents provide for an upfront required repairs reserve of $60,000.
Residential Capital Expenditure Funds – The Tower 28 Whole Loan documents provide for monthly deposits to a residential capital expenditure reserve of $9,375 (however, such monthly deposits are waived if the Reserve Waiver Conditions are satisfied).
Non-Residential Capital Expenditure Funds – The Tower 28 Whole Loan documents provide for monthly deposits to a non-residential capital expenditure reserve of $1,274 (however, such monthly deposits are waived if the Reserve Waiver Conditions are satisfied).
Lockbox and Cash Management. The Tower 28 Whole Loan is structured with a hard lockbox with respect to any tenants under a Major Lease (as defined below) and a soft lockbox with respect to any other tenants. The Tower 28 Whole Loan has in place cash management. The Tower 28 Borrower agreed to provide a fully executed cash management agreement within 10 business days after the loan origination date. The Tower 28 Borrower and property manager are required to deposit all rents received by them into the lockbox account within one business day of receipt. All funds in the lockbox
This is not a research report and was not prepared by any Underwriter’s research department. Please see additional important information and qualifications at the end of this Term Sheet.
T-49
| Multifamily – High Rise | Loan #3 | Cut-off Date Balance: | $56,000,000 | |
| 42-12 28th Street | Tower 28 | Cut-off Date LTV: | 33.4% | |
| Long Island City, NY 11101 | U/W NCF DSCR: | 2.31x | ||
| U/W NOI Debt Yield: | 13.0% |
account are required to be swept on each business day to a cash management account controlled by the lender, and applied, provided that no event of default is continuing under the Tower 28 Whole Loan, on each monthly payment date to fund the required tax and insurance reserves deposits as described above under “Escrows and Reserves”, to pay debt service on the Tower 28 Whole Loan, to fund the required residential capital expenditure and non-residential capital expenditure reserves deposits as described above under “Escrows and Reserves”, to pay monthly operating expenses referenced in the lender-approved annual budget and extraordinary expenses approved by the lender, to pay debt service on the Tower 28 Mezzanine Loan and to disburse the remainder,first if no Cash Sweep Event Period has occurred and is continuing and an event of default is continuing under the Tower 28 Mezzanine Loan, to be deposited into a mezzanine excess payment account controlled by the Tower 28 Mezzanine Lender (as defined below) to pay any other amount then due and payable under the Tower 28 Mezzanine Loan until such event of default no longer exists, andsecond to disburse the remainder (i) if a Cash Sweep Event Period is then in effect, to be deposited into the excess cash flow sweep account to be held as additional collateral for the Tower 28 Whole Loan during the continuance of such Cash Sweep Event Period (as defined below) (upon the termination of any Cash Sweep Event Period, all amounts then on deposit in the excess cash flow sweep account are required to be disbursed to the Tower 28 Borrower); and (ii) if no Cash Sweep Event Period is then continuing, to be disbursed to the Tower 28 Borrower.
A “Cash Sweep Event Period” means the period: (i) commencing upon the occurrence of an event of default under the Tower 28 Whole Loan and ending upon the cure of such event of default in accordance with the Tower 28 Whole Loan documents; or (ii) commencing upon the combined debt service coverage ratio (based on the aggregate annual actual interest only or amortizing, as then applicable, debt service due under both the Tower 28 Whole Loan and Tower 28 Mezzanine Loan and tested as of the end of each calendar quarter), being less than 1.05x for six consecutive calendar months and ending upon the combined debt service coverage ratio (calculated on the same basis) being at least 1.05x for six consecutive calendar months.
A “Major Lease” means (i) any lease which, individually or when aggregated with all other leases at the Tower 28 Property with the same tenant or its affiliate, accounts for 10% or more of apartments and/or units at the Tower 28 Property, assuming the exercise of all fixed expansion rights and other preferential rights to lease additional space at the Tower 28 Property (as distinguished from rights of first offer), (ii) any lease which contains any option, offer, right of first refusal or other similar entitlement to acquire all or any portion of the Tower 28 Property (which such rights will be deemed to be exclusive of any rights under any lease to extend the term thereof or to lease additional space at the Tower 28 Property), (iii) any lease entered, or to be entered, into during the continuance of an event of default under the Tower 28 Whole Loan (iv) any lease with an affiliate of the Tower 28 Borrower, (v) any lease for commercial and/or retail use, (vi) that certain parking lease, dated as of December 19, 2018, by and between 4212 28ST LLC (as predecessor in interest to the Tower 28 Borrower) and LIC 27 ST LLC, as tenant or (vii) any instrument guaranteeing or providing credit support for any lease meeting the requirements of clauses (i) through (vi) above.
Additional Secured Indebtedness (not including trade debts). In addition to the Tower 28 Mortgage Loan, the Tower 28 Property also secures the Tower 28Pari passu Senior Companion Loan, which has a Cut-off Date principal balance of $56,000,000 and the Tower 28 Subordinate Companion Loan which has a Cut-off Date principal balance of $53,000,000. The Tower 28Pari passu Senior Companion Loan accrues interest at the same rate as the Tower 28 Mortgage Loan. The Tower 28 Subordinate Companion Loan accrues interest at the rate of 5.0900%per annum. The Tower 28 Senior Loan is generally senior in right of payment to the Tower 28 Subordinate Companion Loan. The holders of the Tower 28 Mortgage Loan, the Tower 28Pari passu Senior Companion Loan and the Tower 28 Subordinate Companion Loan have entered into a co-lender agreement which sets forth the allocation of collections on the Tower 28 Whole Loan. See “Description of the Mortgage Pool—The Whole Loans—The Tower 28 Pari Passu A/B Whole Loan” in the Preliminary Prospectus.
Mezzanine Loan and Preferred Equity.Morgan Stanley Mortgage Capital Holdings LLC (in such capacity, the “Tower 28 Mezzanine Lender”) made a $50,000,000 mezzanine loan (the “Tower 28 Mezzanine Loan”) to 4212 28ST Mezz DE, LLC on the loan origination date, secured by 100% of the equity interest in the Tower 28 Borrower. The Tower 28 Mezzanine Loan accrues interest at a rate of 6.5100%per annum, provides for interest-only payments for the first three years of the mezzanine loan term (until the monthly payment date occurring in May, 2022) with 30-year amortization thereafter, and is coterminous with the Tower 28 Whole Loan. The lender and the Tower 28 Mezzanine Lender have entered into an intercreditor agreement.
The Tower 28 Total Debt is summarized in the following table.
| Tower 28 Total Debt Summary | |||||
| Note | Original Balance | Interest Rate | Cumulative UW NCF DSCR | Cumulative UW NOI Debt Yield | Cumulative Cut-off Date LTV |
| Senior Loan | $112,000,000 | 3.7842% | 2.31x | 13.0% | 33.4% |
| Junior Loan | $53,000,000 | 5.0900% | 1.49x | 8.8% | 49.3% |
| Mezzanine Loan | $50,000,000 | 6.5100% | 1.07x | 6.8% | 64.2% |
| Total Debt | $215,000,000 | 4.7400% | 1.07x | 6.8% | 64.2% |
Release of Property. Not Permitted.
Right of First Refusal.None.
Letter of Credit. None.
Terrorism Insurance. The Tower 28 Borrower is required to obtain “all risk” property insurance covering perils of terrorism and acts of terrorism in an amount equal to 100% of the then replacement cost, together with twenty-four months of business income/loss insurance, to the extent such policies are commercially available. Notwithstanding the foregoing, for so long as the Terrorism Risk Insurance Act of 2002, as extended and modified by the Terrorism Risk Insurance Program Reauthorization Act of 2015 (“TRIPRA”) is in effect (including any extensions thereof or if another federal governmental program is in effect relating to “acts of terrorism” which provides substantially similar protections as TRIPRA), and covers both domestic and foreign acts of terrorism, the lender is required to accept terrorism insurance which insures against “covered acts” as defined by TRIPRA (or such other program). See“Risk Factors—Risks Relating to the Mortgage Loans—Terrorism Insurance May Not Be Available for All Mortgaged Properties” in the Preliminary Prospectus.
This is not a research report and was not prepared by any Underwriter’s research department. Please see additional important information and qualifications at the end of this Term Sheet.
T-50
(THIS PAGE INTENTIONALLY LEFT BLANK)
T-51
| Office - Suburban | Loan #4 | Cut-off Date Balance: | $55,000,000 | |
| 131 Albright Way | 131 Albright | Cut-off Date LTV: | 62.1% | |
| Los Gatos, CA 95032 | UW NCF DSCR: | 1.79x | ||
| UW NOI Debt Yield: | 8.7% |

This is not a research report and was not prepared by any Underwriter’s research department. Please see additional important information and qualifications at the end of this Term Sheet.
T-52
| Office - Suburban | Loan #4 | Cut-off Date Balance: | $55,000,000 | |
| 131 Albright Way | 131 Albright | Cut-off Date LTV: | 62.1% | |
| Los Gatos, CA 95032 | UW NCF DSCR: | 1.79x | ||
| UW NOI Debt Yield: | 8.7% |

This is not a research report and was not prepared by any Underwriter’s research department. Please see additional important information and qualifications at the end of this Term Sheet.
T-53
| Mortgage Loan No. 4 – 131 Albright |
| Mortgage Loan Information | Property Information | |||||
| Mortgage Loan Seller: | WFB | Single Asset/Portfolio: | Single Asset | |||
| Credit Assessment (KBRA/Fitch/S&P): | NR/NR/NR | Location: | Los Gatos, CA 95032 | |||
| Original Balance: | $55,000,000 | General Property Type: | Office | |||
| Cut-off Date Balance: | $55,000,000 | Detailed Property Type: | Suburban | |||
| % of Initial Pool Balance: | 6.6% | Title Vesting: | Fee | |||
| Loan Purpose: | Acquisition | Year Built/Renovated: | 2015/N/A | |||
| Sponsors: | Farshid Steve Shokouhi; | Size: | 113,520 SF | |||
| Brett Michael Lipman | Cut-off Date Balance per SF: | $485 | ||||
| Guarantors: | Farshid Steve Shokouhi; | Maturity Balance per SF: | $485 | |||
| Brett Michael Lipman | Property Manager: | Preylock Real Estate Holdings, LLC | ||||
| Mortgage Rate: | 4.6500% | (borrower-related); Davis Property | ||||
| Note Date: | 2/22/2019 | Management, Inc. (sub-manager) | ||||
| First Payment Date: | 4/11/2019 | Underwriting and Financial Information | ||||
| Maturity Date: | 3/11/2029 | UW NOI: | $4,792,917 | |||
| Original Term to Maturity: | 120 months | UW NOI Debt Yield: | 8.7% | |||
| Original Amortization Term: | 0 months | UW NOI Debt Yield at Maturity: | 8.7% | |||
| IO Period: | 120 months | UW NCF DSCR: | 1.79x | |||
| Seasoning: | 1 month | Most Recent NOI: | $4,921,582 (12/31/2018) | |||
| Prepayment Provisions: | LO (25); DEF (91); O (4) | 2nd Most Recent NOI(2): | $4,777,973 (12/31/2017) | |||
| Lockbox/Cash Mgmt Status: | Hard/In Place | 3rd Most Recent NOI(2): | $3,104,225 (12/31/2016) | |||
| Additional Debt Type: | N/A | Most Recent Occupancy: | 100.0% (4/1/2019) | |||
| Additional Debt Balance: | N/A | 2nd Most Recent Occupancy: | 100.0% (12/31/2018) | |||
| Future Debt Permitted (Type): | No (N/A) | 3rd Most Recent Occupancy: | 100.0% (12/31/2017) | |||
| Reserves(1) | Appraised Value (as of)(3): | $88,500,000 (11/27/2018) | ||||
| Type | Initial | Monthly | Cap | Appraised Value per SF: | $780 | |
| Taxes: | $0 | Springing | N/A | Cut-off Date LTV Ratio(3): | 62.1% | |
| Insurance: | $0 | Springing | N/A | Maturity LTV Ratio(3): | 62.1% | |
| Replacement Reserves: | $0 | $2,365 | N/A | |||
| TI/LC Reserves: | $0 | Springing | N/A | |||
| Sources and Uses | ||||||
| Sources | Proceeds | % of Total | Uses | Proceeds | % of Total | |
| Loan Amount: | $55,000,000 | (4) | Loan Payoff Amount(4): | $55,000,000 | 98.9% | |
| Borrower Sponsor Equity: | (4) | (4) | Closing costs: | $621,697 | 1.1% | |
| Total Sources: | $55,621,697(4) | 100.0%(4) | Total Uses: | $55,621,697 | 100.0% | |
| (1) | See“Escrows and Reserves” below for further discussion of reserve requirements. |
| (2) | See“Cash Flow Analysis” below for details regarding the increase from 3rd Most Recent NOI to 2nd Most Recent NOI. |
| (3) | The appraisal also concluded to a “Go Dark” value of $79,660,000 as of November 27, 2018. |
| (4) | The 131 Albright Mortgage Loan (as defined below in the “The Mortgage Loan” section) was used to pay off a balance sheet loan of $55,000,000 originated by Wells Fargo Bank, National Association in January 2019 (the “Acquisition Loan”). The Acquisition Loan, along with $27,586,617 in borrower sponsor equity facilitated the purchase of the 131 Albright Property (as defined below in the “The Mortgage Loan” section) in January 2019 for a purchase price of $85,000,000 and paid closing costs. The 131 Albright Mortgage Loan required an additional $621,697 in borrower sponsor equity to cover closing costs. In total, the 131 Albright Borrower contributed approximately $28,208,314 in equity in relation to the January 2019 Acquisition Loan and the 131 Albright Mortgage Loan. |
The Mortgage Loan. The fourth largest mortgage loan (the “131 Albright Mortgage Loan”) is evidenced by a single promissory note in the original principal amount of $55,000,000, which is secured by a first priority fee mortgage encumbering a suburban office building located in Los Gatos, California (the “131 Albright Property”).
The Borrower and the Sponsors. The borrower is Preylock Los Gatos, LLC (the “131 Albright Borrower”), a Delaware limited liability company and single purpose entity with one independent director. Legal counsel to the 131 Albright Borrower delivered a non-consolidation opinion in connection with the origination of the 131 Albright Mortgage Loan.
The borrower sponsors and non-recourse carveout guarantors are Brett Michael Lipman and Farshid Steve Shokouhi, both of whom are principals of Preylock Real Estate Holdings (“Preylock”), a real estate acquisition and management company. Founded in Los Angeles, California in 2016, Preylock’s current portfolio comprises approximately 1.9 million SF of office space in California and Washington.
Prior to founding Preylock, Mr. Lipman was most recently a portfolio manager and a partner at RMA Real Estate Investment Advisors (“RMA”), a real estate private equity fund. At RMA, he was responsible for portfolio management, asset management and sourcing direct real estate investment opportunities. Prior to joining RMA, Mr. Lipman worked for JP Morgan, most recently on the Global Real Assets platform, a large institutional real estate investor. Previously, Mr. Shokouhi was the Managing Principal of the Kalimian Organization, a real estate family office based in New York. Mr. Shokouhi focused on the firm’s business development and asset repositioning, as well as assembling a management team.
This is not a research report and was not prepared by any Underwriter’s research department. Please see additional important information and qualifications at the end of this Term Sheet.
T-54
| Office - Suburban | Loan #4 | Cut-off Date Balance: | $55,000,000 | |
| 131 Albright Way | 131 Albright | Cut-off Date LTV: | 62.1% | |
| Los Gatos, CA 95032 | UW NCF DSCR: | 1.79x | ||
| UW NOI Debt Yield: | 8.7% |
The Property. The 131 Albright Property is a 113,520 SF, three-story, Class A office building located in Los Gatos, California, within the southern portion of Silicon Valley, approximately 9.6 miles southwest of the San Jose central business district. Constructed in 2015 and situated on a 1.0-acre site, the 131 Albright Property was 100.0% occupied by Netflix, Inc. (“Netflix”) as of April 1, 2019. The 131 Albright Property is located within a four-building development totaling approximately 485,000 SF, all of which is leased to Netflix as its corporate headquarters campus (only one building serves as collateral for the 131 Albright Mortgage Loan). Netflix began occupying its current headquarters campus in 2015, relocating from its previous headquarters campus also located in Los Gatos, directly across Highway 85 from the 131 Albright Property. The 131 Albright Property was built-to-suit for Netflix’s engineering division, and amenities include 11-foot finished ceilings, a cafeteria, an outdoor basketball court, outdoor patios, rooftop solar panels, a proprietary audio-visual testing facility and an auditorium that is used for hosting original programming premieres. The shared common area includes a surface parking lot and a three-story parking garage (with 1,805 total shared parking spaces for the four-building development, resulting in a parking ratio of approximately 3.7 spaces per 1,000 SF of net rentable area) as well as areas between buildings used for staff gathering areas. Pursuant to a reciprocal easement agreement and parking license agreement, the 131 Albright Property has access to the shared surface and garage parking. See“Description of the Mortgage Pool—Mortgage Pool Characteristics—Property Types—Office Properties” in the Preliminary Prospectus.
Major Tenant.Founded by Marc Randolph and Wilmot Reed Hastings Jr. in August 1997 and headquartered at the 4-building office campus of which the 131 Albright Property is a part, Netflix is an internet subscription service company, which provides streaming commercial-free movies and television episodes over the internet and also sends discs by mail. According to a third party news provider, Netflix had approximately 139 million paying subscribers in 190 countries globally, as of January 2019. According to Netflix’s fourth quarter 2018 earnings report, the company spent over $12 billion on content in 2018, up approximately 35% from $8.9 billion in 2017. Netflix, which is rated BB- by S&P and Ba3 by Moody’s, reported $4.2 billion in revenue in the fourth quarter of 2018, indicating a 28% year-over-year increase. Netflix also reported $1.2 billion in net income in 2018, indicating a 116.5% increase from 2017 net income. Netflix’s studio tied for the most 2018 Emmy Awards wins and its filmRoma won 2019 Academy Awards for Best Director and Best Foreign Language Film. Netflix’s lease for the 131 Albright Property was executed in August 2013, commenced in July 2015 and has two 5-year extension options following its expiration in November 2025. The 131 Albright Borrower and Netflix are currently in negotiations to extend the Netflix lease by 25 months at the 131 Albright Property (with a lease expiration date of December 31, 2027). The lease amendment is expected to include two months of free rent in December 2025 and January 2026. The lender provides no assurances that the lease extension will be executed or effectuated.
The following table presents certain information relating to the tenancy at the 131 Albright Property:
| Tenant Summary(1) | ||||||||
| Tenant Name | Credit Rating (Fitch/Moodys/S&P)(2) | Tenant SF | Approximate % of SF | Annual UW Rent(3) | % of Total Annual UW Rent | Annual UW Rent PSF(3) | Termination Option (Y/N) | Lease Expiration |
| Netflix, Inc. | NR/Ba3/BB- | 113,520 | 100.0% | $5,136,264 | 100.0% | $45.25 | N | 11/30/2025(1)(4) |
| Subtotal/Wtd. Avg. | 113,520 | 100.0% | $5,136,264 | 100.0% | $45.25 | |||
| Vacant Space | 0 | 0.0% | $0 | 0.0% | $0.00 | |||
| Total/Wtd. Avg. | 113,520 | 100.0% | $5,136,264 | 100.0% | $45.25 | |||
| (1) | The 131 Albright Borrower and Netflix are currently in negotiations to extend the Netflix lease by 25 months at the 131 Albright Property (with a lease expiration date of December 31, 2027). The lease amendment is expected to include two months of free rent in December 2025 and January 2026. The lender provides no assurances that the lease extension will be executed or effectuated. |
| (2) | The entity on the lease is Netflix, Inc., which has the credit ratings shown above. |
| (3) | Annual UW Rent PSF and Annual UW Rent include a contractual rent step in December 2019. Netflix Inc.’s current rent is $43.93 per SF and increases by approximately 3.0% annually in December until the lease maturity date. |
| (4) | Netflix, Inc. has two, 5-year renewal options with nine months’ notice at the then prevailing fair market rental rate. |
This is not a research report and was not prepared by any Underwriter’s research department. Please see additional important information and qualifications at the end of this Term Sheet.
T-55
| Office - Suburban | Loan #4 | Cut-off Date Balance: | $55,000,000 | |
| 131 Albright Way | 131 Albright | Cut-off Date LTV: | 62.1% | |
| Los Gatos, CA 95032 | UW NCF DSCR: | 1.79x | ||
| UW NOI Debt Yield: | 8.7% |
The following table presents certain information relating to the lease rollover schedule at the 131 Albright Property:
| Lease Rollover Schedule(1)(2) | ||||||||
| Year | # of Leases Rolling | SF Rolling | Annual UW Rent PSF Rolling | Approx. % of Total SF Rolling | Approx. Cumulative % of SF Rolling | Total UW Rent Rolling | Approx. % of Total Rent Rolling | Approx. Cumulative % of Total Rent Rolling |
| MTM | 0 | 0 | $0.00 | 0.0% | 0.0% | $0 | 0.0% | 0.0% |
| 2019 | 0 | 0 | $0.00 | 0.0% | 0.0% | $0 | 0.0% | 0.0% |
| 2020 | 0 | 0 | $0.00 | 0.0% | 0.0% | $0 | 0.0% | 0.0% |
| 2021 | 0 | 0 | $0.00 | 0.0% | 0.0% | $0 | 0.0% | 0.0% |
| 2022 | 0 | 0 | $0.00 | 0.0% | 0.0% | $0 | 0.0% | 0.0% |
| 2023 | 0 | 0 | $0.00 | 0.0% | 0.0% | $0 | 0.0% | 0.0% |
| 2024 | 0 | 0 | $0.00 | 0.0% | 0.0% | $0 | 0.0% | 0.0% |
| 2025 | 1 | 113,520 | $45.25 | 100.0% | 100.0% | $5,136,264 | 100.0% | 100.0% |
| 2026 | 0 | 0 | $0.00 | 0.0% | 100.0% | $0 | 0.0% | 100.0% |
| 2027 | 0 | 0 | $0.00 | 0.0% | 100.0% | $0 | 0.0% | 100.0% |
| 2028 | 0 | 0 | $0.00 | 0.0% | 100.0% | $0 | 0.0% | 100.0% |
| 2029 | 0 | 0 | $0.00 | 0.0% | 100.0% | $0 | 0.0% | 100.0% |
| 2030 & Beyond | 0 | 0 | $0.00 | 0.0% | 100.0% | $0 | 0.0% | 100.0% |
| Vacant | 0 | 0 | $0.00 | 0.0% | 100.0% | $0 | 0.0% | 100.0% |
| Total/Wtd. Avg. | 1 | 113,520 | $45.25 | 100.0% | $5,136,264 | 100.0% | ||
| (1) | Information is based on the underwritten rent roll. |
| (2) | Certain tenants may have lease termination options that are exercisable prior to the stated expiration date of the subject lease or leases which are not considered in the lease rollover schedule. |
The Market. The 131 Albright Property is located in Los Gatos, Santa Clara County, California, approximately one block from the on/off ramps for Highway 85 and two blocks from the on/off ramps for Highway 17/Interstate 880, providing access to the communities of Cupertino, San Jose, Sunnyvale and Mountain View; while also connecting to other freeways serving Palo Alto and San Francisco. The 131 Albright Property is situated approximately 9.6 miles southwest of the San Jose central business district (“CBD”) and 49.2 miles southeast of the San Francisco CBD. In addition, Stanford University is approximately 18.9 miles to the northwest, and Westfield Valley Fair Mall is 6.5 miles to the northeast. Westfield Valley Fair Mall is an approximately 1.4 million SF Unibail-Rodamco-Westfield-owned super regional mall anchored by Nordstrom and Macy’s with approximately 250 boutiques and shops in addition to various dining and entertainment options. According to a third-party news provider, the Westfield Valley Fair Mall is currently undergoing an approximate $1.1 billion, 650,000 SF expansion and renovation.
According to the appraisal, Santa Clara County is known internationally as “Silicon Valley” due to its high concentration of semiconductor manufacturers and other high-technology employers. According to the appraisal, the San Jose-Sunnyvale-Santa Clara, California metropolitan statistical area’s top employers are Apple (approximately 25,000 employees) and Alphabet Inc./Google (“Google”, approximately 20,000 employees) and include Tesla Motors Inc. (approximately 10,000 employees) and Facebook Inc. (“Facebook”, approximately 9,385 employees). Apple’s headquarters in Cupertino, Google’s headquarters in Mountain View and Facebook’s headquarters in Menlo Park are each respectively located approximately 8.3, 14.7 and 20.7 miles northwest of the 131 Albright Property.
According to a third party market research provider, the estimated 2018 population within a three- and five-mile radius of the 131 Albright Property was approximately 154,249 and 394,530, respectively; and the estimated 2018 average household income within the same radii was approximately $153,947 and $151,151, respectively.
According to a third-party market research report, the 131 Albright Property is situated within the Los Gatos submarket of the San Jose Office Market. As of March 4, 2019, the Los Gatos Office submarket reported a total inventory of approximately 2.8 million SF with a 2.5% vacancy rate, which has decreased from 8.8% in 2015 and has averaged 4.8% from 2013 through 2018.
The appraiser identified six directly competitive office properties totaling approximately 1.0 million SF with an average occupancy rate of 95.2% and direct asking rents ranging from $40.56 to $51.00 PSF, triple net (with one competitive property reporting a rental rate of $55.80 PSF full service gross).
This is not a research report and was not prepared by any Underwriter’s research department. Please see additional important information and qualifications at the end of this Term Sheet.
T-56
| Office - Suburban | Loan #4 | Cut-off Date Balance: | $55,000,000 | |
| 131 Albright Way | 131 Albright | Cut-off Date LTV: | 62.1% | |
| Los Gatos, CA 95032 | UW NCF DSCR: | 1.79x | ||
| UW NOI Debt Yield: | 8.7% |
The following table presents certain information relating to the appraisal’s market rent conclusion for the 131 Albright Property:
| Market Rent Summary | |
| Single Tenant Office | |
| Market Rent (PSF) | $48.00 |
| Lease Term (Years) | 7 |
| Concessions | 3 months |
| Lease Type (Reimbursements) | Triple Net |
| Rent Increase Projection | 3.0% per annum |
| Tenant Improvements (New Tenant) (PSF) | $15.00 |
| Tenant Improvements (Renewal) (PSF) | $5.00 |
Source:Appraisal
The following table presents information relating to comparable office property sales for the 131 Albright Property:
| Comparable Property Sale Summary | ||||||
| Property Name/Location | Sale Date | Year Built/ Renovated | Total NRA (SF) | Total Occupancy | Sale Price | Sale Price PSF |
131 Albright (subject) Los Gatos, CA | Jan. 2019 | 2015/N/A | 113,520 | 100.0% | $85,000,000 | $748.77 |
Middlefield Station Mountain View, CA | Sept. 2018 | 2012/N/A | 99,880 | 100.0% | $80,000,000 | $800.96 |
1001 N Shoreline Office Building Mountain View, CA | Mar. 2018 | 2017/N/A | 125,889 | 100.0% | $169,946,278 | $1,349.97 |
Torre Plaza Cupertino, CA | May 2017 | 1983/2015 | 88,580 | 100.0% | $66,250,000 | $747.91 |
Crossroads Courtyard Ctr Sunnyvale, CA | Feb. 2017 | 1989/2010 | 349,758 | 100.0% | $290,700,000 | $831.15 |
Cupertino Crossing Cupertino, CA | Feb. 2017 | 2009/N/A | 100,481 | 100.0% | $78,000,000 | $776.27 |
Embarcadero Center Palo Alto, CA | Jan. 2017 | 1974/1997 | 100,734 | 94.5% | $77,000,000 | $764.39 |
Source: Appraisal.
The following table presents certain information relating to comparable office leases for the 131 Albright Property:
| Comparable Leases Summary | |||||||||
| Property Name/Location | Year Built/ Renovated | Total GLA (SF) | Occ. % | Distance from Subject | Tenant Name | Lease Date/Term (Yrs.) | Lease Area (SF) | Annual Base Rent PSF | Lease Type |
131 Albright Property 131 Albright Way Los Gatos, California | 2015/N/A | 113,520 | 100.0% | - | Netflix, Inc. | July 2015 / 10.3 | 113,520 | $43.93(1) | Triple Net |
River Corporate Center 353 W Julian Street San Jose, California | 2019/N/A | 204,000 | 100.0% | 6.6 miles | Santa Clara County | March 2019 / 12.0 | 204,000 | $40.56 | Triple Net |
The Offices at Santana Row 700 Santana Row San Jose, California | 2019/N/A | 321,398 | 100.0% | 4.4 miles | Splunk Inc. | Jan. 2019/ 7.0 | 301,000 | $47.40 | Triple Net |
Cupertino City Center 20400 Stevens Creek Boulevard Cupertino, California | 1987/2006 | 190,041 | 95.7% | 5.8 miles | Amazon | Sept. 2018 / 7.0 | 70,620 | $51.00 | Triple Net |
The Cannery 300 Orchard City Drive Campbell, California | 1976/2018 | 89,994 | 75.2% | 2.3 miles | Wave Systems | June 2018 / 7.0 | 40,175 | $55.80 | FSG |
Torre Plaza 10201 Torre Avenue Cupertino, California | 1983/2015 | 88,580 | 100.0% | 5.7 miles | Amazon | Feb. 2018 / 7.0 | 88,580 | $46.20 | Triple Net |
Cupertino Crossing 10900 N Tantau Avenue Cupertino, California | 2009/N/A | 100,481 | 100.0% | 5.8 miles | Panasonic Corporation of North America | June 2017 / 7.0 | 43,000 | $51.00 | Triple Net |
Source:Appraisal
| (1) | Information is based on the underwritten rent roll. Netflix has a current annual base rental rate of $43.93 PSF and was underwritten to $45.25 PSF based on its contractual escalation in December 2019. |
This is not a research report and was not prepared by any Underwriter’s research department. Please see additional important information and qualifications at the end of this Term Sheet.
T-57
| Office - Suburban | Loan #4 | Cut-off Date Balance: | $55,000,000 | |
| 131 Albright Way | 131 Albright | Cut-off Date LTV: | 62.1% | |
| Los Gatos, CA 95032 | UW NCF DSCR: | 1.79x | ||
| UW NOI Debt Yield: | 8.7% |
Operating History and Underwritten Net Cash Flow.The following table presents certain information relating to the historical operating performance and Underwritten Net Cash Flow at the 131 Albright Property:
| Cash Flow Analysis(1) | |||||
| 2016(2) | 2017(2) | 2018 | UW | UW PSF | |
| Gross Potential Rent | $4,574,913 | $4,712,160 | $4,853,525 | $5,136,264 | $45.25 |
| Free Rent Adjustment | ($1,369,051) | $0 | $0 | $0 | $0 |
| Total Recoveries | $177,311 | $1,263,097 | $1,310,097 | $1,155,777 | $10.18 |
| Construction Amortization(3) | $65,812 | $65,812 | $65,812 | $65,812 | $0.58 |
| Less Vacancy & Credit Loss | $0 | $0 | $0 | ($256,813)(4) | ($2.26) |
| Effective Gross Income | $3,448,985 | $6,041,069 | $6,229,434 | $6,101,039 | $53.74 |
| Real Estate Taxes | $0 | $984,133 | $1,025,873 | $1,025,536 | $9.03 |
| Insurance | $146,854 | $132,290 | $132,597 | $22,976 | $0.20 |
| Other Operating Expenses | $197,906 | $146,673 | $149,382 | $259,610 | $2.29 |
| Total Expenses | $344,760 | $1,263,096 | $1,307,852 | $1,308,122 | $11.52 |
| Net Operating Income | $3,104,225 | $4,777,973 | $4,921,582 | $4,792,917 | $42.22 |
| Capital Expenditures | $0 | $0 | $0 | $28,380 | $0.25 |
| TI/LC | $0 | $0 | $0 | $113,520 | $1.00 |
| Net Cash Flow | $3,104,225 | $4,777,973 | $4,921,582 | $4,651,017 | $40.97 |
| Occupancy % | 100.0% | 100.0% | 100.0% | 95.0%(4) | |
| NOI DSCR | 1.20x | 1.84x | 1.90x | 1.85x | |
| NCF DSCR | 1.20x | 1.84x | 1.90x | 1.79x | |
| NOI Debt Yield | 5.6% | 8.7% | 8.9% | 8.7% | |
| NCF Debt Yield | 5.6% | 8.7% | 8.9% | 8.5% | |
| (1) | UW Gross Potential Base Rent PSF and UW Gross Potential Base Rent include a contractual rent step in December 2019. Netflix Inc.’s current rent is $43.93 per SF. |
| (2) | The increase in Effective Gross Income and Net Operating Income from 2016 to 2017 was driven in part by the Free Rent Adjustment attributable to the free rent period from January to April 2016 (the free rent period commenced in November 2015). |
| (3) | Construction Amortization is based on the straight-line amortization of the landlord’s costs to construct certain structural upgrades at the 131 Albright Property, per the terms of the lease. |
| (4) | The underwritten economic vacancy is 5.0%. The 131 Albright Property was 100.0% physically occupied as of April 1, 2019. |
Escrows and Reserves.
Real Estate Taxes – The 131 Albright Mortgage Loan documents do not require ongoing monthly escrows for real estate taxes as long as (i) no event of default has occurred and is continuing; (ii) the Netflix lease obligates Netflix to directly pay taxes; (iii) Netflix actually pays all taxes directly; (iv) the Netflix lease remains in full force and effect and neither Netflix nor the 131 Albright Borrower defaults under any of their obligations under the lease beyond any applicable notice or cure periods; and (v) the 131 Albright Borrower delivers evidence that all taxes have been paid within 30 days after payment thereof.
Insurance – The 131 Albright Mortgage Loan documents do not require ongoing monthly escrows for insurance premiums as long as (i) no event of default has occurred and is continuing; (ii) the 131 Albright Borrower or an affiliate provides the lender with evidence that the 131 Albright Property’s insurance coverage is included in a blanket policy and such policy is in full force and effect; and (iii) the 131 Albright Borrower pays all applicable insurance premiums and provides the lender with evidence of timely payment of insurance premiums/renewals.
Replacement Reserve – The 131 Albright Mortgage Loan documents require ongoing monthly replacement reserves of $2,365, which the lender may require the 131 Albright Borrower to increase (not more than once per year) if the lender reasonably determines such increase is necessary to maintain the proper operation of the 131 Albright Property.
Rollover Reserve – Upon the occurrence and continuance of a Cash Trap Event Period (as defined in the “Lockbox and Cash Management” section below), the 131 Albright Mortgage Loan documents require ongoing monthly rollover reserves of $9,460.
Lockbox and Cash Management. The 131 Albright Mortgage Loan requires a lender-controlled cash management account, which is already in-place, and that the 131 Albright Borrower directs the tenant to pay rent directly into such cash management account. The loan documents also require that all rents received by the 131 Albright Borrower or the property manager be deposited into the cash management account within two business days of receipt. On each payment date in accordance with the 131 Albright Mortgage Loan documents, all funds in the cash management account are required to be applied (i) to make deposits into the tax and insurance escrows (if any are then required) as described above under “Escrows and Reserves”, (ii) to pay debt service on the 131 Albright Mortgage Loan, (iii) to make deposits into the replacement reserve and/or the rollover reserve (if then required), as described above under “Escrows and Reserves,” and (iv) any other amounts then due and payable under the 131 Albright Mortgage Loan documents (collectively, the “Waterfall Items”) and, prior to the occurrence of a Cash Trap Event Period (as defined below), any excess funds will be disbursed to the 131 Albright Borrower. During a Cash Trap Event Period, any excess funds remaining after satisfaction of the Waterfall Items and payment of monthly operating expenses are required to be swept to an excess cash flow subaccount to be held by the lender as additional security for the 131 Albright Mortgage Loan during the continuance of the Cash Sweep Event Period.
This is not a research report and was not prepared by any Underwriter’s research department. Please see additional important information and qualifications at the end of this Term Sheet.
T-58
| Office - Suburban | Loan #4 | Cut-off Date Balance: | $55,000,000 | |
| 131 Albright Way | 131 Albright | Cut-off Date LTV: | 62.1% | |
| Los Gatos, CA 95032 | UW NCF DSCR: | 1.79x | ||
| UW NOI Debt Yield: | 8.7% |
A “Cash Trap Event Period” will commence upon the earlier of the following:
| (i) | the occurrence of an event of default; |
| (ii) | the net cash flow debt service coverage ratio (based on a hypothetical 30-year amortization term) being less than 1.20x at the end of any calendar quarter; or |
| (iii) | the occurrence of a Major Tenant Event Period (as defined below). |
A Cash Trap Event Period will end upon the occurrence of the following:
| ● | with regard to clause (i), the cure of such event of default; |
| ● | with regard to clause (ii), (x) the amortizing net cash flow debt service coverage ratio being equal to or greater than 1.25x for two consecutive calendar quarters; or |
| ● | with regard to clause (iii), a Major Tenant Event Period Cure (as defined below). |
A “Major Tenant Event Period” will commence upon the earlier of the following:
| (i) | The 131 Albright Borrower committing a monetary or material non-monetary default under the Netflix lease beyond any applicable notice and cure period; |
| (ii) | Netflix going dark, vacating or otherwise failing to occupy 50% or more of its space or giving notice thereof; |
| (iii) | any bankruptcy or insolvency of Netflix; |
| (iv) | Netflix failing to renew or extend the term of its lease for at least five years prior to 24 months before the lease expiration date (Netflix’s lease has a nine-month renewal notice period); or |
| (v) | Netflix’s long-term debt credit rating being downgraded below ‘B’ (or equivalent rating) by any one of Fitch, Moody’s or S&P. |
A “Major Tenant Event Period Cure” will occur upon the following:
| ● | with regard to clause (i), the lender receiving satisfactory evidence that such default has been cured to Netflix’s satisfaction, including receipt of a satisfactory estoppel; |
| ● | with regard to clause (ii), (x) a Major Tenant Re-Leasing Event or (y) Netflix having resumed occupancy of and normal business operations in at least 51% of its space for two consecutive calendar quarters; |
| ● | with regard to clause (iii), (x) a Major Tenant Re-Leasing Event or (y) the bankruptcy proceedings having been terminated in a manner reasonably satisfactory to the lender, the Netflix lease being affirmed and the terms of such lease being reasonably satisfactory to the lender; |
| ● | with regard to clause (iv), (x) a Major Tenant Re-Leasing Event or (y) Netflix having renewed or extended the term of its lease for at least five years pursuant to the terms of the lease or otherwise on terms reasonably acceptable to the lender; or |
| ● | with regard to clause (v), (x) a Major Tenant Re-Leasing Event or (y) the long-term debt credit rating for Netflix having been upgraded to B/B2/B or higher by Fitch/Moody’s/S&P. |
A “Major Tenant Re-Leasing Event” will occur upon one or more replacement tenants satisfactory to lender executing leases covering all of the space currently occupied by Netflix in accordance with its lease and the 131 Albright Mortgage Loan documents with (i) such replacement tenants having taken occupancy of such space, conducting normal business operations and paying full unabated rent or any such abatement having been reserved; (ii) all tenant improvements, leasing commissions or other similar landlord obligations having been paid or reserved; and (iii) delivery of a satisfactory estoppel.
Additional Secured Indebtedness (not including trade debts).None.
Mezzanine Loan and Preferred Equity. The lender, in its sole discretion, may allow the 131 Albright Borrower to obtain a preferred equity investment from a third-party investor in an amount not to exceed $5,000,000; provided, however, that such preferred equity investor and the investment structure will be subject to the lender’s approval on terms acceptable to the lender, including but not limited to (i) no hard maturity date, (ii) ability to fully accrue (i.e., that such investment structure cannot require a change of ownership of any direct or indirect ownership interest in the 131 Albright Borrower or a change of control in the 131 Albright Borrower) and (iii) no intercreditor agreement required with the lender.
Release of Property.Not permitted.
Right of First Refusal.None.
Letter of Credit.None.
Terrorism Insurance.The 131 Albright Mortgage Loan documents require that the “all risk” insurance policy required to be maintained by the 131 Albright Borrower provide coverage for terrorism in an amount equal to the full replacement cost of the 131 Albright Property, as well as business interruption insurance covering no less than the 18-month period following the occurrence of a casualty event, together with a 6-month extended period of indemnity (provided that if TRIPRA or a similar statute is not in effect, the 131 Albright Borrower will not be obligated to pay terrorism insurance premiums in excess of two times the premium for the casualty and business interruption coverage on a stand-alone basis).
Earthquake Insurance.The loan documents do not require earthquake insurance; however, at the time of closing, earthquake insurance coverage is in-place through a blanket policy for the 131 Albright Property. The seismic report indicated a probable maximum loss of 9% for the 131 Albright Property and 12% for the adjacent parking structure, which is utilized by the 131 Albright Property as well as the three adjacent office buildings.
This is not a research report and was not prepared by any Underwriter’s research department. Please see additional important information and qualifications at the end of this Term Sheet.
T-59
| Office - Suburban | Loan #5 | Cut-off Date Balance: | $52,362,896 | |
| Various | Grand Oaks Business Park | Cut-off Date LTV: | 74.8% | |
| Eagan, MN 55121 | U/W NCF DSCR: | 1.45x | ||
| U/W NOI Debt Yield: | 11.0% | |||
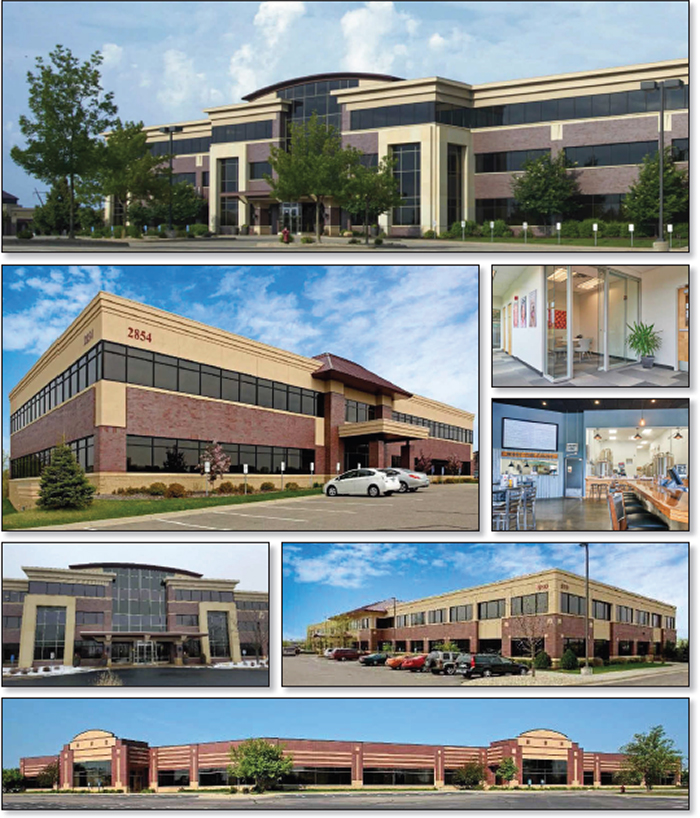
This is not a research report and was not prepared by any Underwriter’s research department. Please see additional important information and qualifications at the end of this Term Sheet.
T-60
| Office - Suburban | Loan #5 | Cut-off Date Balance: | $52,362,896 | |
| Various | Grand Oaks Business Park | Cut-off Date LTV: | 74.8% | |
| Eagan, MN 55121 | U/W NCF DSCR: | 1.45x | ||
| U/W NOI Debt Yield: | 11.0% | |||

This is not a research report and was not prepared by any Underwriter’s research department. Please see additional important information and qualifications at the end of this Term Sheet.
T-61
| Office - Suburban | Loan #5 | Cut-off Date Balance: | $52,362,896 | |
| Various | Grand Oaks Business Park | Cut-off Date LTV: | 74.8% | |
| Eagan, MN 55121 | U/W NCF DSCR: | 1.45x | ||
| U/W NOI Debt Yield: | 11.0% | |||

This is not a research report and was not prepared by any Underwriter’s research department. Please see additional important information and qualifications at the end of this Term Sheet.
T-62
| Mortgage Loan No. 5 – Grand Oaks Business Park |
| Mortgage Loan Information | Property Information | |||||||
| Mortgage Loan Seller: | MSMCH | Single Asset/Portfolio: | Single Asset | |||||
| Credit Assessment (KBRA/Fitch/S&P): | NR/NR/NR | Location: | Eagan, MN 55121 | |||||
| Original Balance: | $52,500,000 | General Property Type: | Office | |||||
| Cut-off Date Balance: | $52,362,896 | Detailed Property Type: | Suburban | |||||
| % of Initial Pool Balance: | 6.3% | Title Vesting: | Fee | |||||
| Loan Purpose: | Acquisition | Year Built/Renovated: | 1999-2007/N/A | |||||
| Sponsor: | Group RMC Corporation | Size: | 551,551 SF | |||||
| Guarantor: | Raymond Massa | Cut-off Date Balance per SF: | $95 | |||||
| Mortgage Rate: | 4.8500% | Maturity Date Balance per SF: | $78 | |||||
| Note Date: | 1/23/2019 | Property Manager: | Equity Transwestern, L.L.C. | |||||
| First Payment Date: | 3/1/2019 | Underwriting and Financial Information | ||||||
| Maturity Date: | 2/1/2029 | UW NOI: | $5,774,969 | |||||
| Original Term to Maturity: | 120 months | UW NOI Debt Yield: | 11.0% | |||||
| Original Amortization Term: | 360 months | UW NOI Debt Yield at Maturity: | 13.4% | |||||
| IO Period: | 0 months | UW NCF DSCR: | 1.45x | |||||
| Seasoning: | 2 months | Most Recent NOI: | $4,856,145 (10/31/2018 TTM) | |||||
| Prepayment Provisions: | LO (26); DEF (89); O (5) | 2nd Most Recent NOI: | $5,430,838 (12/31/2017) | |||||
| Lockbox/Cash Mgmt Status: | Springing/Springing | 3rd Most Recent NOI: | $5,047,536 (12/31/2016) | |||||
| Additional Debt Type: | N/A | Most Recent Occupancy(2): | 90.4% (12/5/2018) | |||||
| Additional Debt Balance: | N/A | 2nd Most Recent Occupancy: | 83.7% (12/31/2017) | |||||
| Future Debt Permitted (Type): | No (N/A) | 3rd Most Recent Occupancy: | 84.2% (12/31/2016) | |||||
| Reserves(1) | Appraised Value (as of): | $70,000,000 (12/13/2018) | ||||||
| Type | Initial | Monthly | Cap | Appraised Value per SF: | $127 | |||
| RE Tax: | $681,114 | $113,519 | N/A | Cut-off Date LTV Ratio: | 74.8% | |||
| Insurance: | $0 | Springing | N/A | Maturity Date LTV Ratio: | 61.5% | |||
| Deferred Maintenance: | $48,381 | $0 | N/A | |||||
| Recurring Replacements: | $780,030 | $9,193 | N/A | |||||
| TI/LC: | $1,500,000 | Springing | $1,500,000 | |||||
| Other: | $390,760 | $0 | N/A | |||||
| Sources and Uses | ||||||
| Sources | Proceeds | % of Total | Uses | Proceeds | % of Total | |
| Loan Amount: | $52,500,000 | 70.7% | Purchase Price: | $69,609,240 | 93.7% | |
| Borrower Equity: | $21,794,444 | 29.3% | Reserves: | $3,400,285 | 4.6% | |
| Closing Costs: | $1,284,919 | 1.7% | ||||
| Total Sources: | $74,294,444 | 100.0% | Total Uses: | $74,294,444 | 100.0% | |
| (1) | See “Escrows and Reserves” below for further discussion of reserve requirements. |
| (2) | Most Recent Occupancy includes 42,053 SF occupied by Silicon Graphics, Inc. which has the right to terminate on February 29, 2020 with notice by April 15, 2019. Without Silicon Graphics, Inc. occupancy would be 82.8%. Rent from such tenant was not underwritten. |
The Mortgage Loan. The fifth largest mortgage loan (the “Grand Oaks Business Park Mortgage Loan”) is evidenced by a promissory note in the original principal amount of $52,500,000 and secured by a first priority fee mortgage encumbering an office property located in Eagan, Minnesota (the “Grand Oaks Business Park Property”). The proceeds of the Grand Oaks Business Park Mortgage Loan, together with borrower equity, were used to acquire the Grand Oaks Business Park Property, fund reserves, and pay closing costs.
The Borrower and the Borrower Sponsor.The borrower is Grand Oak Minnesota Realty LP (the “Grand Oaks Business Park Borrower”), a single-purpose Delaware limited partnership with one independent director. The borrower sponsor is Group RMC Corporation and the non-recourse carve-out guarantor is Raymond Massa. Raymond Massa is the co-founder of Group RMC Corporation. Group RMC Corporation, a real estate co-investment and management company based in New York City, targets investments in office assets in suburban markets throughout the United States. Group RMC Corporation’s portfolio includes approximately 13.0 million SF of office space.
The Property.The Grand Oaks Business Park Property is a Class A suburban office park consisting of eight office buildings and two retail buildings, totaling 551,551 SF, on an approximately 83.6-acre site in Eagan, Minnesota. The Grand Oaks Business Park Property also includes two lots of unusable land that are primarily pond areas. The Grand Oaks Business Park Property was built in phases between 1999 and 2007. Grand Oak I and Grand Oak X are three-story office buildings that have common area corridors and amenities such as conference rooms, fitness center, executive underground parking, vending room, and elevator service. Grand Oak II and Grand Oak IX are two-story offices with Class A corridors, and are elevator served. Grand Oak II also has executive underground parking. Grand Oak III, Grand Oak IV, Grand Oak VII and Grand Oak VIII are single-story office buildings with no interior common areas but the interior build out of each tenant suite is consistent with the other buildings. There are walking paths, grilling areas, and a golf putting green along the pond in the middle of the business park. The Grand Oaks Business Park Property contains approximately 2,739 surface and 74 underground parking spaces (5.1 spaces per 1,000 SF).
This is not a research report and was not prepared by any Underwriter’s research department. Please see additional important information and qualifications at the end of this Term Sheet.
T-63
| Office - Suburban | Loan #5 | Cut-off Date Balance: | $52,362,896 | |
| Various | Grand Oaks Business Park | Cut-off Date LTV: | 74.8% | |
| Eagan, MN 55121 | U/W NCF DSCR: | 1.45x | ||
| U/W NOI Debt Yield: | 11.0% | |||
The Grand Oaks Business Park Property was 90.4% leased as of December 5, 2018 to 57 tenants and has had an average occupancy of 80.1% over the last five years. 23 tenants leasing 195,538 SF (35.5% of NRA) have extended or renewed at least once at the Grand Oaks Business Park Property. In 2017 and 2018, 15 new leases totaling 97,168 SF (17.6% of NRA) and 12 renewals totaling 64,870 SF (11.8% of NRA) were executed at the Grand Oaks Business Park Property.
The following table presents detailed information with respect to each of the buildings at the Grand Oaks Business Park:
| Grand Oaks Business Park Properties Summary(1) | ||||||
| Building | Address | Occupancy | Year Built | NRA | % of Total NRA(3) | Stories |
| Grand Oak I | 860 Blue Gentian Road | 82.2% | 1999 | 100,708 | 18.3% | 3 |
| Grand Oak II | 880 Blue Gentian Road | 94.7% | 2002 | 56,373 | 10.2% | 2 |
| Grand Oak III | 930 Blue Gentian Road | 91.4% | 2000 | 67,603 | 12.3% | 1 |
| Grand Oak IV | 950 Blue Gentian Road | 100.0% | 2000 | 42,828 | 7.8% | 1 |
| Grand Oak VII(2) | 2750 Blue Water Road | 96.6% | 2002 | 109,650 | 19.9% | 1 |
| Grand Oak VIII | 2770 Blue Water Road | 92.6% | 2002 | 40,117 | 7.3% | 1 |
| Grand Oak IX | 2854 Highway 55 | 84.7% | 2005 | 28,457 | 5.2% | 2 |
| Grand Oak X | 2805 Dodd Road | 83.7% | 2007 | 92,889 | 16.8% | 3 |
| Grand Oak Retail | 2874 and 2864 Highway 55 | 100.0% | 2006 | 12,926 | 2.3% | 1 |
| Total | 90.4% | 551,551 | 100.0% | |||
| (1) | Information obtained from the underwritten rent roll dated December 5, 2018. |
| (2) | Occupancy includes 42,053 SF occupied by Silicon Graphics, Inc. which has the right to terminate its lease on February 29, 2020 with notice by April 15, 2019. Without Silicon Graphics, Inc. occupancy would be 82.8%. Rent from such tenant was not underwritten. |
Major Tenants.
Nelnet DiversifiedSolutions, LLC (49,802 SF, 9.0% of NRA, 9.0% of underwritten rent).Nelnet Diversified Solutions, LLC provides educational services in loan servicing, payment processing, education planning, and asset management. Nelnet Diversified Solutions, LLC has offices around the United States and Canada, and employs more than 2,250 associates who serve customers throughout the education life cycle. Nelnet Diversified Solutions, LLC assists more than 5 million borrowers with their student loans and administers tuition payment plans for approximately 5,500 schools, colleges and universities. Nelnet Diversified Solutions, LLC has been a tenant at the Grand Oaks Business Park Property since 2012, has a lease expiration date of January 31, 2024 and no renewal options remaining. Nelnet Diversified Solutions, LLC extended its space by 11,925 SF in 2013.
Enclos Corp (37,129 SF, 6.7% of NRA, 7.4% of underwritten rent).Enclos Corp designs, engineers, fabricates and installs curtainwall and building façade systems. Enclos Corp has been a tenant at the Grand Oaks Business Park Property since 2002, has a lease expiration date of October 31, 2019 and has two, five-year renewal options remaining. Enclos Corp is required to provide notice of renewal no later than nine months and no earlier than twelve months prior to the expiration of its lease. The renewal deadline for Enclos Corp occurred on January 31, 2019, and the borrower and the tenant have been negotiating regarding the terms of a renewal lease. There is no assurance the lease will be renewed.
American Cancer Society (22,512 SF, 4.1% of NRA, 4.0% of underwritten rent). American Cancer Society focuses on funding and conducting research, sharing information, supporting patients, and promoting cancer prevention. American Cancer Society has been a tenant at the Grand Oaks Business Park Property since 2014, has a lease expiration date of July 31, 2025 and has one, five year renewal option remaining. American Cancer Society has a one-time option to terminate its lease on April 30, 2022, subject to payment of an early termination fee equal to the unamortized portion of all concessions.
Farmers Insurance Exchanges (21,817 SF, 4.0% of NRA, 5.5% of underwritten rent). Farmers Insurance Exchanges are three reciprocal insurers (Farmers Insurance Exchange, Fire Insurance Exchange and Truck Insurance Exchange) owned by their policyholders who, together with their subsidiaries and affiliates, comprise the Farmers Insurance Group of Companies. Farmers Insurance Exchanges has been a tenant at the Grand Oaks Business Park Property since January 2019, has a lease expiration date of March 31, 2024 and has one, five-year renewal option remaining. Farmers Insurance Exchanges has the right to terminate its lease, in whole or in part (with respect to either of two specified portions of the premises), on March 31, 2022, subject to prior notice by March 31, 2021 and payment of a termination fee equal to six months’ rent, additional rent and the unamortized portion of all concessions.
Explore Information Services (21,407 SF, 3.9% of NRA, 3.4% of underwritten rent). Explore Information Serviceshas been a leading provider of risk management information toinsurancecompanies, government agencies and commercial fleets for over 25 years.Explore Information Services has been a tenant at the Grand Oaks Business Park Property since 2014, has a lease expiration date of August 31, 2024 and has one, five-year renewal option remaining.
This is not a research report and was not prepared by any Underwriter’s research department. Please see additional important information and qualifications at the end of this Term Sheet.
T-64
| Office - Suburban | Loan #5 | Cut-off Date Balance: | $52,362,896 | |
| Various | Grand Oaks Business Park | Cut-off Date LTV: | 74.8% | |
| Eagan, MN 55121 | U/W NCF DSCR: | 1.45x | ||
| U/W NOI Debt Yield: | 11.0% | |||
The following table presents certain information relating to the major tenants at the Grand Oaks Business Park Property:
| Tenant Summary(1) | ||||||||
| Tenant Name | Credit Rating (Fitch/Moody’s/S&P) | Tenant SF | Approximate % of SF | Annual UW Rent | Annual UW Rent PSF(2) | % of Total Annual UW Rent | Lease Expiration | Termination Option (Y/N) |
| Tenant | ||||||||
| Nelnet Diversified Solutions, LLC(3) | NR/Ba1/BBB- | 49,802 | 9.0% | $572,678 | $11.50 | 9.0% | 1/31/2024 | N |
| Enclos Corp(4) | NR/NR/NR | 37,129 | 6.7% | $473,395 | $12.75 | 7.4% | 10/31/2019 | N |
| American Cancer Society(5) | NR/NR/NR | 22,512 | 4.1% | $254,386 | $11.30 | 4.0% | 7/31/2025 | Y |
| Farmers Insurance Exchanges(6) | NR/NR/NR | 21,817 | 4.0% | $350,630 | $16.07 | 5.5% | 3/31/2024 | Y |
| Explore Information Services | NR/NR/NR | 21,407 | 3.9% | $217,923 | $10.18 | 3.4% | 8/31/2024 | N |
| Subtotal/Wtd. Avg. | 152,667 | 27.7% | $1,869,012 | $12.24 | 29.2% | |||
| Other Tenants | 303,962 | 55.1% | $4,524,291 | $14.88 | 70.8% | |||
| Vacant Space(7) | 94,922 | 17.2% | $0 | $0.00 | 0.0% | |||
| Total/Wtd. Avg. | 551,551 | 100.0% | $6,393,303 | $14.00 | 100.0% | |||
| (1) | Information is based on the underwritten rent roll as of December 5, 2018. |
| (2) | Total/Wtd. Avg. Annual UW Rent PSF excludes vacant space. |
| (3) | Nelnet Diversified Solutions, LLC has 11,925 SF expiring January 31, 2021. |
| (4) | The renewal deadline for Enclos Corp occurred on January 31, 2019, and the borrower and the tenant have been negotiating regarding the terms of a renewal lease. There is no assurance the lease will be renewed. |
| (5) | American Cancer Society has the one-time option to terminate its lease on April 30, 2022, subject to payment of an early termination fee equal to the unamortized portion of all concessions. |
| (6) | Farmers Insurance Exchanges has the right to terminate its lease, in whole or in part (with respect to either of two specified portions of the premises), on March 31, 2022, subject to prior notice by March 31, 2021 and payment of a termination fee equal to six months’ rent, additional rent and the unamortized portion of all concessions. |
| (7) | Vacant Space includes 42,053 SF occupied by Silicon Graphics, Inc. which has the right to terminate its lease on February 29, 2020 with notice by April 15, 2019. Without Silicon Graphics, Inc. occupancy would be 82.8%. Rent from such tenant was not underwritten. |
The following table presents information with respect to the largest tenant at each building of the Grand Oaks Business Park Property:
| Grand Oaks Business Park Largest Tenant by Building Summary(1) | |||||||
| Building | SF | Building Occupancy | Building Largest Tenant | Largest Tenant SF | Largest Tenant % Building SF | Lease Expiration Date | |
| Grand Oak I | 100,708 | 82.2% | Scottsdale Insurance Company | 13,436 | 13.3% | 12/31/2023 | |
| Grand Oak II | 56,373 | 94.7% | Environmental Systems Research | 21,049 | 37.3% | 2/28/2021 | |
| Grand Oak III | 67,603 | 91.4% | Nelnet Diversified Solutions, LLC(2) | 49,802 | 73.7% | 1/31/2024 | |
| Grand Oak IV | 42,828 | 100.0% | American Cancer Society(3) | 22,512 | 52.6% | 7/31/2025 | |
| Grand Oak VII | 109,650 | 96.6% | Silicon Graphics, Inc.(4) | 42,053 | 38.4% | 2/28/2022 | |
| Grand Oak VIII | 40,117 | 92.6% | Enclos Corp(5) | 37,129 | 92.6% | 10/31/2019 | |
| Grand Oak IX | 28,457 | 84.7% | Vivint, Inc. | 10,567 | 37.1% | 8/31/2022 | |
| Grand Oak X | 92,889 | 83.7% | Farmers Insurance Exchanges(6) | 21,817 | 23.5% | 3/31/2024 | |
| Grand Oak Retail | 12,926 | 100.0% | Final Brewing Company LL | 7,720 | 59.7% | 9/30/2022 | |
| Total / Wtd. Avg. | 551,551 | 90.4% | 226,085 | 41.0% | |||
| (1) | Information is based on the underwritten rent roll dated December 5, 2018. |
| (2) | Nelnet Diversified Solutions, LLC has 11,925 SF expiring January 31, 2021. |
| (3) | American Cancer Society has the one-time option to terminate its lease on April 30, 2022, subject to payment of an early termination fee equal to the unamortized portion of all concessions. |
| (4) | Silicon Graphics, Inc. has the right to terminate its lease on February 29, 2020, provided that the tenant gives notice no later than April 15, 2019. Without Silicon Graphics, Inc. occupancy would be 82.8%. Rent from such tenant was not underwritten. |
| (5) | The renewal deadline for Enclos Corp occurred on January 31, 2019, and the borrower and the tenant have been negotiating regarding the terms of a renewal lease. There is no assurance the lease will be renewed. |
| (6) | Farmers Insurance Exchanges has the right to terminate its lease, in whole or in part (with respect to either of two specified portions of the premises), on March 31, 2022, subject to prior notice by March 31, 2021 and payment of a termination fee equal to six months’ rent, additional rent and the unamortized portion of all concessions. |
This is not a research report and was not prepared by any Underwriter’s research department. Please see additional important information and qualifications at the end of this Term Sheet.
T-65
| Office - Suburban | Loan #5 | Cut-off Date Balance: | $52,362,896 | |
| Various | Grand Oaks Business Park | Cut-off Date LTV: | 74.8% | |
| Eagan, MN 55121 | U/W NCF DSCR: | 1.45x | ||
| U/W NOI Debt Yield: | 11.0% | |||
The following table presents certain information relating to the lease rollover schedule at the Grand Oaks Business Park Property:
| Lease Rollover Schedule(1)(2) | ||||||||
| Year | # of Leases Rolling | SF Rolling | UW Rent PSF Rolling(3) | Approx. % of Total SF Rolling | Approx. Cumulative % of SF Rolling | Total UW Rent Rolling | Approx. % of Total Rent Rolling | Approx. Cumulative % of Total Rent Rolling |
| MTM | 0 | 0 | $0.00 | 0.0% | 0.0% | $0 | 0.0% | 0.0% |
| 2019 | 7 | 74,710 | $13.30 | 13.5% | 13.5% | $993,948 | 15.5% | 15.5% |
| 2020 | 5 | 20,474 | $15.54 | 3.7% | 17.3% | $318,108 | 5.0% | 20.5% |
| 2021 | 12 | 68,827 | $15.48 | 12.5% | 29.7% | $1,065,226 | 16.7% | 37.2% |
| 2022 | 10 | 52,903 | $14.39 | 9.6% | 39.3% | $761,240 | 11.9% | 49.1% |
| 2023 | 10 | 70,644 | $14.14 | 12.8% | 52.1% | $998,679 | 15.6% | 64.7% |
| 2024 | 5 | 100,237 | $12.96 | 18.2% | 70.3% | $1,298,583 | 20.3% | 85.0% |
| 2025 | 2 | 28,200 | $12.12 | 5.1% | 75.4% | $341,696 | 5.3% | 90.4% |
| 2026 | 3 | 15,361 | $16.68 | 2.8% | 78.2% | $256,272 | 4.0% | 94.4% |
| 2027 | 0 | 0 | $0.00 | 0.0% | 78.2% | $0 | 0.0% | 94.4% |
| 2028 | 2 | 25,273 | $14.23 | 4.6% | 82.8% | $359,551 | 5.6% | 100.0% |
| 2029 | 0 | 0 | $0.00 | 0.0% | 82.8% | $0 | 0.0% | 100.0% |
| 2030 & Beyond | 0 | 0 | $0.00 | 0.0% | 82.8% | $0 | 0.0% | 100.0% |
| Vacant Space(4) | 0 | 94,922 | $0.00 | 17.2% | 100.0% | $0 | 0.0% | 100.0% |
| Total/Wtd. Avg. | 56 | 551,551 | $14.00 | 100.0% | $6,393,303 | 100.0% | ||
| (1) | Information is based on the underwritten rent roll as of December 5, 2018. |
| (2) | Certain tenants may have lease termination options that are exercisable prior to the stated expiration date of the subject lease or leases which are not considered in the lease rollover schedule. |
| (3) | Total/Wtd. Avg. UW Rent PSF Rolling excludes vacant space. |
| (4) | Vacant Space includes 42,053 SF occupied by Silicon Graphics, Inc. which has the right to terminate its lease on February 29, 2020 with notice by April 15, 2019. Rent from such tenant was not underwritten. Without Silicon Graphics, Inc. occupancy would be 82.8%. The expiration date for Silicon Graphics, Inc.’s lease is February 28, 2022. |
The Market. The Grand Oaks Business Park Property is located in Eagan, Minnesota, in Dakota County, approximately 14 miles south of Saint Paul, 19 miles southeast of Minneapolis and 8.0 miles southeast of the Minneapolis-Saint Paul International Airport. The Grand Oaks Business Park Property is situated adjacent to Interstate 35E, Interstate 494 and State Routes 3, 13, 55, and 77. Located a block from the Grand Oak Business Park Property is Viking Lakes, a 200-acre development that opened in February 2018, that includes the 40-acre TCO Performance Center and TCO Stadium. This development is expected to serve as the NFL’s Minnesota Vikings’ new practice facility and team headquarters. An additional 160 acres is expected to serve the community through mixed use development for residential, retail, restaurant, office and hotel/conference center spaces anticipated to be developed over the next 10 to 15 years.
The Grand Oaks Business Park Property is located in the Burnsville/Eagan/Apple Valley submarket of the Minneapolis/Saint Paul market. According to the appraisal, as of the third quarter of 2018, the vacancy rate in the Burnsville/Eagan/Apple Valley submarket was approximately 4.2%, with average asking rents of $19.09 PSF and inventory of approximately $13.7 million SF. According to the appraisal, as of the third quarter of 2018, the vacancy rate in the Minneapolis/Saint Paul market was approximately 7.2%, with average asking rents of $21.62 PSF and inventory of approximately $201 million SF. The Minneapolis/Saint Paul retail market and Burnsville/Eagan/Apple Valley retail submarket reported retail vacancy rates of 3.2% and 3.6%, respectively, as of the third quarter of 2018. Vacancy rates for retail space in the market have been below 5.0% since 2013, and vacancy rates for retail space in the submarket have been below 5.0% since 2009.
According to the appraisal, the 2018 population within a one-, three- and five-mile radius of the Grand Oaks Business Park Property was 1,618, 34,825 and 154,599, respectively. The 2018 average household income within the same one-, three- and five-mile radius was $147,522, $128,403 and $105,305, respectively.
This is not a research report and was not prepared by any Underwriter’s research department. Please see additional important information and qualifications at the end of this Term Sheet.
T-66
| Office - Suburban | Loan #5 | Cut-off Date Balance: | $52,362,896 | |
| Various | Grand Oaks Business Park | Cut-off Date LTV: | 74.8% | |
| Eagan, MN 55121 | U/W NCF DSCR: | 1.45x | ||
| U/W NOI Debt Yield: | 11.0% | |||
The following table presents certain information relating to the appraiser’s market rent conclusion for the Grand Oaks Business Park Property:
| Market Rent Summary | |||
| Building | Market Rent (PSF) | Lease Term (Years) | Rent Increase Projection |
| Grand Oak I | $15.50 | 5.0 | $0.5 / SF / Year |
| Grand Oak X | $15.50 | 5.0 | $0.5 / SF / Year |
| Grand Oak II | $14.50 | 5.0 | $0.5 / SF / Year |
| Grand Oak IX | $14.50 | 5.0 | $0.5 / SF / Year |
| Grand Oak III | $13.50 | 5.0 | $0.5 / SF / Year |
| Grand Oak IV | $13.50 | 5.0 | $0.5 / SF / Year |
| Grand Oak VII | $13.50 | 5.0 | $0.5 / SF / Year |
| Grand Oak VIII | $13.50 | 5.0 | $0.5 / SF / Year |
| High-End Retail | $30.00 | 5.0 | $0.5 / SF / Year |
| Standard Retail | $18.00 | 5.0 | $0.5 / SF / Year |
| Restaurant | $9.00 | 5.0 | $0.5 / SF / Year |
Source:Appraisal.
The following table presents information relating to comparable office property sales for the Grand Oaks Business Park Property:
| Comparable Property Sale Summary | ||||||
| Property Name/Location | Sale Date | Year Built | Total NRA (SF) | Total Occupancy | Sale Price | Sale Price PSF |
Grand Oaks Business Park (subject) Eagan, MN | Nov. 2018 | 1999-2007 | 551,551 | 90.4%(1) | $70,000,000(2) | $126.91 |
Edinborough Corporate Center Edina, MN | April 2018 | 1986 | 101,206 | 91.0% | $14,450,000 | $142.78 |
Southpoint Office Center Bloomington, MN | Dec. 2017 | 1984 | 365,515 | 91.0% | $47,775,000 | $130.71 |
Norman Pointe I Bloomington, MN | Dec. 2017 | 1999 | 213,851 | 70.0% | $35,500,000 | $166.00 |
Crosstown Corporate Center Bloomington, MN | Mar. 2017 | 1999 | 60,000 | 100.0% | $8,200,000 | $136.67 |
Norman Pointe II Bloomington, MN | Aug. 2016 | 2007 | 322,551 | 92.0% | $52,500,000 | $162.76 |
Northland Plaza Bloomington, MN | Aug. 2015 | 1984 | 298,171 | 94.0% | $52,500,000 | $176.07 |
Source:Appraisal.
| (1) | Information is based on the underwritten rent roll as of December 5, 2018. Total Occupancy includes 42,053 SF occupied by Silicon Graphics, Inc. which has the right to terminate its lease on February 29, 2020 with notice by April 15, 2019. Without Silicon Graphics, Inc. occupancy would be 82.8%. Rent from such tenant was not underwritten. |
| (2) | The gross acquisition price of the Grand Oaks Business Park Property was $126.91 PSF and the net acquisition price was $126.21 PSF. |
This is not a research report and was not prepared by any Underwriter’s research department. Please see additional important information and qualifications at the end of this Term Sheet.
T-67
| Office - Suburban | Loan #5 | Cut-off Date Balance: | $52,362,896 | |
| Various | Grand Oaks Business Park | Cut-off Date LTV: | 74.8% | |
| Eagan, MN 55121 | U/W NCF DSCR: | 1.45x | ||
| U/W NOI Debt Yield: | 11.0% | |||
The following table presents comparable leases with respect to the Grand Oaks Business Park Property:
| Comparable Lease Summary | ||||||||
| Property/Location | Year Built | SF | Tenant Name | Lease Date | Lease Term (Yrs.) | Rent PSF | Lease Type | |
| Size (SF) | ||||||||
Eagan Woods Office Center Eagan, MN | 1986 | 94,750 | Confidential | 3,449 | Sept. 2016
| 7.0
| $12.25
| NNN |
Eagan Place Professional Eagan, MN | 2008 | 32,800 | St. Paul Eye Clinic | 8,405
| April 2018
| 12.0
| $21.42
| NNN |
| Power Systems Office Building Eagan, MN | 1998 | 23,736 | Emerson Technology Inc. Blythco, LLC | 1,665 2,688 | Dec. 2018 Dec. 2018 | 5.0 5.0 | $11.00 $13.50 | NNN NNN |
Richfield Retail Richfield, MN | 2018 | 10,110 | Orange Theory | 3,000
| June 2018 | 10.0 | $33.00 | NNN |
Ridgecrest Marketplace Savage, MN | 2016 | 12,062 | Tim Horton’s Noodles & Company | 2,400 2,600 | June 2017 Feb. 2017 | 10.0 9.0 | $36.00 $32.00 | NNN NNN |
Woodbury Lakes Woodbury, MN | 2005 | 305,303 | Club Pilates | 2,137 | Sept. 2017 | 8.0 | $27.00 | NNN |
Savage Crossings Savage, MN | 2003 | 15,400 | Massage Retreat | 2,950 | Oct. 2017 | 5.0 | $21.00 | NNN |
Oxboro Plaza Bloomington, MN | 1987 | 38,990 | Totally Tan | 3,461 | Feb. 2019 | 7.0 | $16.00 | NNN |
| The Shoppes at Gateway NorthCottage Grove, MN | 2005 | 16,898 | Rustic Floral Boutique | 1,321 | Oct. 2018 | 3.0 | $12.00 | NNN |
Source:Appraisal.
Operating History and Underwritten Net Cash Flow. The following table presents certain information relating to the operating history and Underwritten Net Cash Flow at the Grand Oaks Business Park Property:
| Cash Flow Analysis(1) | ||||||
| 2015 | 2016 | 2017 | 10/31/2018 TTM | UW | UW PSF | |
| Gross Potential Rent(2) | $5,363,840 | $5,825,061 | $6,057,473 | $6,050,557 | $7,679,062 | $13.92 |
| Total Recoveries | $2,750,224 | $2,981,914 | $3,286,205 | $3,097,482 | $3,391,557 | $6.15 |
| Discounts Concessions | ($560,714) | ($155,278) | ($219,835) | ($391,127) | $0 | $0.00 |
| Other Income | $28,027 | $32,153 | $35,675 | $36,895 | $36,895 | $0.07 |
| Less Vacancy & Credit Loss | $0 | $0 | $0 | $0 | ($1,574,061) | ($2.85) |
| Effective Gross Income | $7,581,378 | $8,683,849 | $9,159,518 | $8,793,807 | $9,533,453 | $17.28 |
| Real Estate Taxes | $1,499,515 | $1,479,280 | $1,289,827 | $1,362,228 | $1,376,934 | $2.50 |
| Insurance | $126,715 | $117,645 | $108,392 | $109,934 | $97,537 | $0.18 |
| Other Expenses | $1,973,608 | $2,039,389 | $2,330,461 | $2,465,500 | $2,284,014 | $4.14 |
| Total Expenses | $3,599,838 | $3,636,314 | $3,728,680 | $3,937,662 | $3,758,485 | $6.81 |
| Net Operating Income(2) | $3,981,539 | $5,047,536 | $5,430,838 | $4,856,145 | $5,774,969 | $10.47 |
| Capital Expenditures | $0 | $0 | $0 | $0 | $110,310 | $0.20 |
| TI/LC | $0 | $0 | $0 | $0 | $853,823 | $1.55 |
| Net Cash Flow | $3,981,539 | $5,047,536 | $5,430,838 | $4,856,145 | $4,810,836 | $8.72 |
| Occupancy %(2) | 80.3% | 84.2% | 83.7% | 90.4%(3) | 83.3% | |
| NOI DSCR | 1.20x | 1.52x | 1.63x | 1.46x | 1.74x | |
| NCF DSCR | 1.20x | 1.52x | 1.63x | 1.46x | 1.45x | |
| NOI Debt Yield | 7.6% | 9.6% | 10.4% | 9.3% | 11.0% | |
| NCF Debt Yield | 7.6% | 9.6% | 10.4% | 9.3% | 9.2% | |
| (1) | UW Gross Potential Rent is based on the underwritten rent roll dated December 5, 2018 and includes rent steps through January 31, 2020 totaling $198,338. |
| (2) | The increase in Gross Potential Rent and Net Operating Income from 10/31/2018 TTM to UW is primarily driven by new leases including the Farmers Insurance Exchanges(21,817 SF, $350,630 UW rent) and Nelnet Diversified Solutions, LLC (11,925 SF, $149,063 UW rent) leases, rent increases of $198,338 through January 31, 2020 and straight line average rent in the aggregate amount of $98,553. |
| (3) | 10/31/2018 TTM Occupancy % is as of December 5, 2018 and includes 42,053 SF occupied by Silicon Graphics, Inc., which has the right to terminate its lease on February 29, 2020 with notice by April 15, 2019. Without Silicon Graphics, Inc. occupancy would be 82.8%. Rent from such tenant was not underwritten. |
This is not a research report and was not prepared by any Underwriter’s research department. Please see additional important information and qualifications at the end of this Term Sheet.
T-68
| Office - Suburban | Loan #5 | Cut-off Date Balance: | $52,362,896 | |
| Various | Grand Oaks Business Park | Cut-off Date LTV: | 74.8% | |
| Eagan, MN 55121 | U/W NCF DSCR: | 1.45x | ||
| U/W NOI Debt Yield: | 11.0% | |||
Escrows and Reserves.
Immediate Repair Reserve - The Grand Oaks Business Park Mortgage Loan documents provide for an upfront reserve of $48,381 for required repairs.
Real Estate Taxes - The Grand Oaks Business Park Mortgage Loan documents provide for an upfront real estate tax reserve of $681,114 and an ongoing monthly real estate tax reserve in an amount equal to 1/12 of the annual estimated real estate taxes, which currently equates to $113,519.
Insurance - The Grand Oaks Business Park Mortgage Loan documents provide for an insurance reserve in a monthly amount equal to 1/12 of the amount that the lender estimates will be necessary to pay insurance premiums over the then succeeding 12-month period, provided that the monthly insurance reserve deposit is waived if the Grand Oaks Business Park Borrower is maintaining an acceptable blanket insurance policy.
Replacement Reserve - The Grand Oaks Business Park Mortgage Loan documents provide for an upfront reserve of $780,030 for capital expenditures and an ongoing monthly replacement reserve for capital expenditures in an amount equal to $9,193.
Rollover Reserve - The Grand Oaks Business Park Mortgage Loan documents provide for an upfront reserve of $1,500,000 for rollover reserves and an ongoing monthly rollover reserve in an amount equal to $45,963. However, so long as no event of default has occurred and is continuing under the Grand Oaks Business Park Mortgage Loan documents, the Grand Oaks Business Park Borrower will not be required to deposit any portion of the monthly rollover reserve deposit if the amount then on deposit in the rollover reserve is equal to or exceeds $1,500,000 (the “Rollover Cap”), and at such time as the amounts on deposit in the rollover reserve equal the Rollover Cap, the Grand Oaks Business Park Borrower’s obligations to make such deposit will be suspended until the next Rollover Trigger Date, at which point such deposit will be required to be made until the funds on deposit in the rollover reserve equal the Rollover Cap. “Rollover Trigger Date” means each date during the term of the Grand Oaks Business Park Mortgage Loan on which the funds on deposit in the rollover reserve are less than $500,000.
Outstanding TI/LC Reserve - The Grand Oaks Business Park Mortgage Loan documents provide for an upfront reserve of $186,675 for existing tenant improvements and leasing commissions.
Outstanding Free Rent Reserve - The Grand Oaks Business Park Mortgage Loan documents provide for an upfront reserve of $204,085 for existing free rent.
Lockbox and Cash Management. The Grand Oaks Business Park Mortgage Loan is structured with a springing lockbox and springing cash management. Upon the first occurrence of a Cash Sweep Event Period (as defined below) the Grand Oaks Business Park Borrower is required to establish a lockbox account, to direct tenants to pay rents directly into the lockbox account, and, if notwithstanding such direction, the Grand Oaks Business Park Borrower or property manager receive any rents, to deposit such rents into the lockbox account within three business days of receipt. Upon the first occurrence of a Cash Sweep Event Period, the lender is required to establish, and the Grand Oaks Business Park Borrower is required to cooperate with a cash management bank chosen by the lender, to establish, a lender-controlled cash management account, into which all funds in the lockbox account will be required to be deposited periodically so long as a Cash Sweep Event Period is continuing. So long as a Cash Sweep Event Period is continuing, and provided no event of default under the Grand Oaks Business Park Mortgage Loan is continuing, funds in the cash management account are required to be applied (i) to make deposits into the tax and insurance escrows (if any are then required) as described above under “Escrows and Reserves”, (ii) to pay debt service on the Grand Oaks Business Park Mortgage Loan, (iii) to make deposits into the capital expenditure reserve and the rollover reserve, as described above under “Escrows and Reserves,” (iv) to pay operating expenses set forth in the annual budget (which is required to be approved by the lender) and extraordinary operating or capital expenses reasonably approved by the lender, and (v) to pay any remainder into an excess cash flow account to be held by the lender as additional security for the Grand Oaks Business Park Mortgage Loan during the continuance of the Cash Sweep Event Period. If no Cash Sweep Event Period is continuing, all funds in the lockbox account are required to be disbursed to the Grand Oaks Business Park Borrower.
A “Cash Sweep Event Period” means the period: (i) commencing upon the occurrence of an event of default under the Grand Oaks Business Park Mortgage Loan and ending upon the cure of such event of default in accordance with the Grand Oaks Business Park Mortgage Loan documents; or (ii) commencing upon the date on which the lender notifies the Grand Oaks Business Park Borrower that the debt service coverage ratio of the Grand Oaks Business Park Mortgage Loan has fallen below 1.25x for six consecutive calendar months and ending upon the debt service coverage ratio being at least 1.25x for six consecutive calendar months.
Additional Secured Indebtedness (not including trade debts). Not permitted.
Mezzanine Loan and Preferred Equity.Not permitted.
Release of Property. Not Permitted.
Right of First Refusal.None.
Letter of Credit. None.
Terrorism Insurance. The Grand Oaks Business Park Borrower is required to obtain “all risk” property insurance covering perils of terrorism and acts of terrorism in an amount equal to 100% of the full replacement cost, together with twelve months of business interruption insurance, to the extent such policies are commercially available. Notwithstanding the foregoing, for so long as the Terrorism Risk Insurance Program Reauthorization Act of 2002 as extended and modified by the Terrorism Risk Insurance Program Reauthorization Act of 2015 (“TRIPRA”) is in effect (including any extensions thereof or if another federal governmental program is in effect relating to “acts of terrorism” which provides substantially similar protections as TRIPRA), and covers both domestic and foreign acts of terrorism, the lender is required to accept terrorism insurance which insures against “covered acts” as defined by TRIPRA (or such other program); provided that if TRIPRA is not available, the Grand Oaks Business Park Borrower is only required to maintain such coverage as is available for a premium equal to 200% of the all-risk premium that exists at the time the terrorism coverage is excluded from the comprehensive all-risk policy. See“Risk Factors—Risks Relating to the Mortgage Loans—Terrorism Insurance May Not Be Available for All Mortgaged Properties”in the Preliminary Prospectus.
This is not a research report and was not prepared by any Underwriter’s research department. Please see additional important information and qualifications at the end of this Term Sheet.
T-69
| Various | Loan #6 | Cut-off Date Balance: | $50,000,000 | |
| Various | ILPT Hawaii Portfolio | Cut-off Date LTV: | 45.2% | |
| Honolulu, HI Various | U/W NCF DSCR: | 2.40x | ||
| U/W NOI Debt Yield: | 10.6% | |||
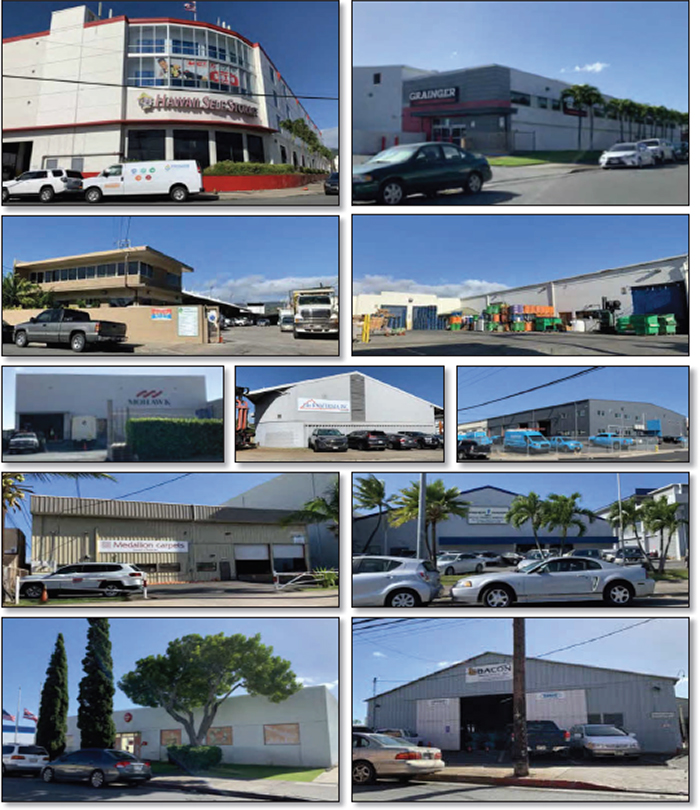
This is not a research report and was not prepared by any Underwriter’s research department. Please see additional important information and qualifications at the end of this Term Sheet.
T-70
| Various | Loan #6 | Cut-off Date Balance: | $50,000,000 | |
| Various | ILPT Hawaii Portfolio | Cut-off Date LTV: | 45.2% | |
| Honolulu, HI Various | U/W NCF DSCR: | 2.40x | ||
| U/W NOI Debt Yield: | 10.6% | |||
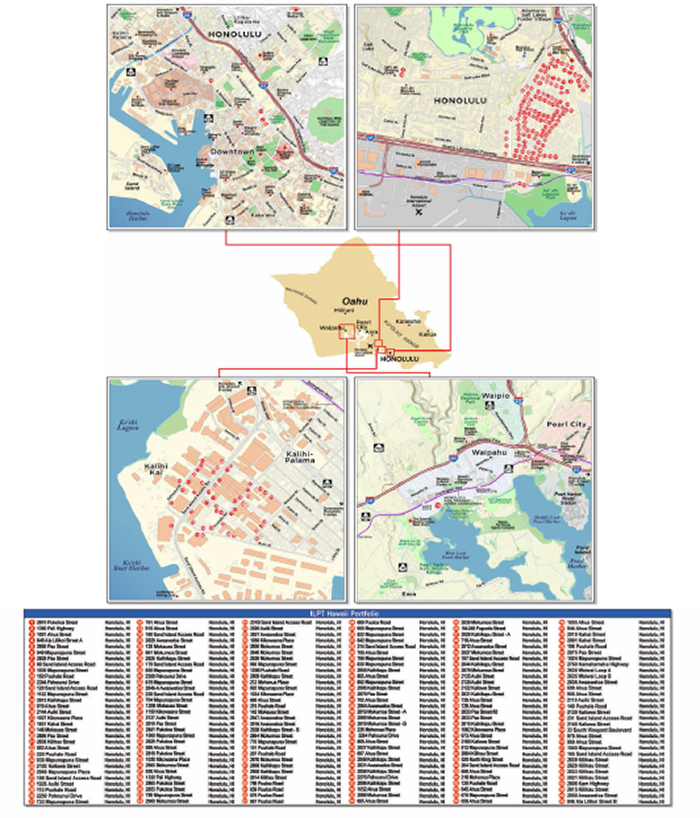
This is not a research report and was not prepared by any Underwriter’s research department. Please see additional important information and qualifications at the end of this Term Sheet.
T-71
| Mortgage Loan No. 6 – ILPT Hawaii Portfolio |
| Mortgage Loan Information | Property Information | |||||||
| Mortgage Loan Seller: | MSMCH | Single Asset/Portfolio: | Portfolio | |||||
| Credit Assessment (KBRA/Fitch/S&P): | A+/BBBsf/NR | Location: | Honolulu, HI Various | |||||
| Original Balance(1): | $50,000,000 | General Property Type(4): | Various | |||||
| Cut-off Date Balance(1): | $50,000,000 | Detailed Property Type(4): | Various | |||||
| % of Initial Pool Balance: | 6.0% | Title Vesting: | Fee | |||||
| Loan Purpose: | Recapitalization | Year Built/Renovated: | Various/N/A | |||||
| Sponsor: | Industrial Logistics Properties Trust | Size(4): | 9,591,512 SF | |||||
| Guarantor: | Industrial Logistics Properties Trust | Cut-off Date Balance per SF(1): | $68 | |||||
| Mortgage Rate: | 4.3100% | Maturity Date Balance per SF(1): | $68 | |||||
| Note Date: | 1/29/2019 | Property Manager: | The RMR Group LLC | |||||
| First Payment Date: | 3/7/2019 | (borrower-related) | ||||||
| Maturity Date: | 2/7/2029 | Underwriting and Financial Information | ||||||
| Original Term to Maturity: | 120 months | UW NOI: | $68,763,789 | |||||
| Original Amortization Term: | 0 months | UW NOI Debt Yield(1): | 10.6% | |||||
| IO Period: | 120 months | UW NOI Debt Yield at Maturity(1): | 10.6% | |||||
| Seasoning: | 2 months | UW NCF DSCR(1): | 2.40x | |||||
| Prepayment Provisions(2): | LO (26); DEF/YM1 (87); O (7) | Most Recent NOI: | $57,840,197 (10/31/2018 TTM) | |||||
| Lockbox/Cash Mgmt Status: | Hard/Springing | 2nd Most Recent NOI: | $56,877,354 (12/31/2017) | |||||
| Additional Debt Type(1): | Pari passu | 3rd Most Recent NOI: | $55,544,563 (12/31/2016) | |||||
| Additional Debt Balance(1): | $600,000,000 | Most Recent Occupancy: | 99.9% (12/13/2018) | |||||
| Future Debt Permitted (Type): | No (N/A) | 2nd Most Recent Occupancy: | 100.0% (10/31/2017) | |||||
| Reserves(3) | 3rd Most Recent Occupancy: | 99.5% (12/31/2016) | ||||||
| Type | Initial | Monthly | Cap | Appraised Value (as of)(5): | $1,439,117,000 (Various) | |||
| RE Tax: | $0 | Springing | N/A | Appraised Value per SF(5): | $150 | |||
| Insurance: | $0 | Springing | N/A | Cut-off Date LTV Ratio(1)(5): | 45.2% | |||
| Recurring Replacements: | $0 | $0 | N/A | Maturity Date LTV Ratio(1)(5): | 45.2% | |||
| TI/LC: | $0 | $0 | N/A | |||||
| Sources and Uses | ||||||
| Sources | Proceeds | % of Total | Uses | Proceeds | % of Total | |
| Whole Loan Amount(1): | $650,000,000 | 100.0% | Paydown of Corporate Revolver(6): | $380,000,000 | 58.5% | |
| Return of Equity: | $267,194,938 | 41.1% | ||||
| Closing Costs: | $2,805,063 | 0.4% | ||||
| Total Sources: | $650,000,000 | 100.0% | Total Uses: | $650,000,000 | 100.0% | |
| (1) | The ILPT Hawaii Portfolio Mortgage Loan (as defined below) is part of the ILPT Hawaii Portfolio Whole Loan (as defined below), which is comprised of 18pari passu promissory notes with an aggregate original principal balance of $650,000,000. The Cut-off Date Balance per SF, Maturity Date Balance per SF, UW NOI Debt Yield, UW NOI Debt Yield at Maturity, UW NCF DSCR, Cut-off Date LTV Ratio and Maturity Date LTV Ratio numbers presented above are based on the aggregate principal balance of the promissory notes comprising the ILPT Hawaii Portfolio Whole Loan. |
| (2) | Following the lockout period, the ILPT Hawaii Portfolio Borrowers (as defined below) have the right to defease the entire ILPT Hawaii Portfolio Whole Loan, on any date after the earlier to occur of (i) two years after the closing date of the securitization that includes the lastpari passu note to be securitized and (ii) January 29, 2022 (the “Lockout Expiration Date”). After the Lockout Expiration Date, prepayment in full is permitted with payment of a prepayment fee equal to the greater of (a) 1% of the outstanding principal amount of the ILPT Hawaii Portfolio Whole Loan or (b) the “Yield Maintenance Amount”, which is the present value as of the prepayment date of the remaining monthly interest only payments that would be due through August 7, 2028 (the “Open Prepayment Date”) based on the principal amount of the ILPT Hawaii Portfolio Whole Loan being prepaid, discounted at an interest rate equal to the difference between (i) 4.3100% and (ii) the yield maintenance treasury rate (as defined in the ILPT Hawaii Portfolio Whole Loan documents). The ILPT Hawaii Portfolio Whole Loan is prepayable in full without penalty on or after the Open Prepayment Date. |
| (3) | See “Escrows and Reserves” below for further discussion of reserve requirements. |
| (4) | The ILPT Hawaii Portfolio Whole Loan is secured by the fee simple interests of the ILPT Hawaii Portfolio Borrowers (as defined below) in an approximately 9,591,512 SF portfolio of 177 leased fee parcels (the “Leased Fee Properties”) and nine fee simple parcels (the “Fee Simple Properties”) located in Honolulu, Hawaii. |
| (5) | The Appraised Value, Appraised Value per SF, Cut-off Date LTV Ratio and Maturity Date LTV Ratio are based on the aggregate of the individual “as-is” appraised values of leased fee interests in the ILPT Hawaii Portfolio as of December 2018 of $1,439,117,000. |
| (6) | Prior to the origination of the ILPT Hawaii Portfolio Whole Loan, the ILPT Hawaii Portfolio (as defined below) was unencumbered. According to the borrower sponsor, the proceeds of the ILPT Hawaii Portfolio Whole Loan were used to, among other things, repay all outstanding borrowings under its unsecured revolving credit facility. As of September 30, 2018, the balance of the unsecured revolving credit facility was $380,000,000. |
The Mortgage Loan. The sixth largest mortgage loan (the “ILPT Hawaii Portfolio Mortgage Loan”) is part of a whole loan (the “ILPT Hawaii Portfolio Whole Loan”) in the original principal balance of $650,000,000. The ILPT Hawaii Portfolio Whole Loan is secured by a first priority fee mortgage encumbering 177 Leased Fee Properties and 9 Fee Simple Properties located in Honolulu, Hawaii (the “ILPT Hawaii Portfolio”). The ILPT Hawaii Portfolio Whole Loan was co-originated by Morgan Stanley Bank, N.A, Citi Real Estate Funding Inc. (“CREFI”), UBS AG, by and through its branch office at 1285 Avenue of the Americas, New York, New York (“UBS AG”) and JPMorgan Chase Bank, National Association (“JPMCB”) . The ILPT Hawaii Portfolio Whole Loan is comprised of 18 promissory notes, which arepari passu with each other, with an aggregate original principal balance of $650,000,000. Promissory Note A-5-2, in the original principal balance of $50,000,000, represents the ILPT Hawaii Portfolio Mortgage Loan and will be included in the BANK 2019-BNK17 securitization trust. Of the remaining promissory notes representing the ILPT Hawaii Portfolio Whole Loan(collectively, the “ILPT Hawaii Portfolio Non-ServicedPari passuCompanion Loans”), the ILPT Hawaii Portfolio Non-ServicedPari passuCompanion Loans evidenced by Promissory Notes A-1, A2, A-3, A-4, A-5-1, A-6-1, A-7-1, A-8-1 and A-9, in the aggregate original principal balance of
This is not a research report and was not prepared by any Underwriter’s research department. Please see additional important information and qualifications at the end of this Term Sheet.
T-72
| Various | Loan #6 | Cut-off Date Balance: | $50,000,000 | |
| Various | ILPT Hawaii Portfolio | Cut-off Date LTV: | 45.2% | |
| Honolulu, HI Various | U/W NCF DSCR: | 2.40x | ||
| U/W NOI Debt Yield: | 10.6% | |||
$390,000,000, were contributed to the ILPT Hawaii Portfolio Trust 2019-SURF securitization trust. The ILPT Hawaii Portfolio Whole Loan will be serviced pursuant to the trust and servicing agreement for the ILPT Trust 2019-SURF securitization trust. The remaining ILPT Hawaii Portfolio Non-ServicedPari passuCompanion Loans, which had an aggregate original principal balance of $210,000,000, are expected to be contributed to one or more future securitization transactions or may be otherwise transferred at any time. See “Description of the Mortgage Pool—The Whole Loans—The ILPT Hawaii Portfolio Whole Loans” and “Pooling and Servicing Agreement—Servicing of the Non-Serviced Mortgage Loans” in the Preliminary Prospectus.
| ILPT Hawaii Portfolio Whole Loan Summary | ||||
| Notes | Original Balance | Cut-off Date Balance | Anticipated Note Holder | Controlling Piece(1) |
| ILPT Hawaii Portfolio Mortgage Loan | ||||
| A-5-2 | $50,000,000 | $50,000,000 | BANK 2019-BNK17 | No |
| ILPT Hawaii Portfolio Non-ServicedPari passu Companion Loans | ||||
| A-1 | $162,500,000 | $162,500,000 | ILPT Trust 2019-SURF | Yes |
| A-2 | $65,000,000 | $65,000,000 | ILPT Trust 2019-SURF | No |
| A-3 | $35,000,000 | $35,000,000 | ILPT Trust 2019-SURF | No |
| A-4 | $32,500,000 | $32,500,000 | ILPT Trust 2019-SURF | No |
| A-5-1 | $32,500,000 | $32,500,000 | ILPT Trust 2019-SURF | No |
| A-5-3 | $40,000,000 | $40,000,000 | MSBNA | No |
| A-5-4 | $40,000,000 | $40,000,000 | MSBNA | No |
| A-6-1 | $13,000,000 | $13,000,000 | ILPT Trust 2019-SURF | No |
| A-6-2 | $22,000,000 | $22,000,000 | CREFI | No |
| A-6-3 | $30,000,000 | $30,000,000 | CREFI | No |
| A-7-1 | $13,000,000 | $13,000,000 | ILPT Trust 2019-SURF | No |
| A-7-2 | $23,000,000 | $23,000,000 | UBS AG | No |
| A-8-1 | $6,500,000 | $6,500,000 | ILPT Trust 2019-SURF | No |
| A-8-2 | $26,000,000 | $26,000,000 | JPMCB | No |
| A-9 | $30,000,000 | $30,000,000 | ILPT Trust 2019-SURF | No |
| A-10 | $28,000,000 | $28,000,000 | UBS AG | No |
| A-11 | $1,000,000 | $1,000,000 | UBS AG | No |
| Total | $650,000,000 | $650,000,000 | ||
| (1) | All notes held under ILPT Trust 2019-SURF together constitute the controlling noteholders for the ILPT Hawaii Portfolio Whole Loan. |
The proceeds of the ILPT Hawaii Portfolio Whole Loan were used to pay down the borrower sponsor’s unsecured revolving credit facility, pay closing costs and return equity to the borrower sponsor.
The Borrower and the Sponsor. The borrowers are Higgins Properties LLC, Masters Properties LLC, Robin 1 Properties LLC, Tanaka Properties LLC, ILPT TSM Properties LLC, Z&A Properties LLC, LTMAC Properties LLC, ILPT Orville Properties LLC, RFRI Properties LLC, and TEDCAL Properties LLC (collectively, the “ILPT Hawaii Portfolio Borrowers”), each a Delaware limited liability company structured to be bankruptcy-remote with two independent directors. Legal counsel to the ILPT Hawaii Portfolio Borrowers delivered a non-consolidation opinion in connection with the origination of the ILPT Hawaii Portfolio Whole Loan. Industrial Logistics Properties Trust (“ILPT”) is the borrower sponsor and non-recourse carveout guarantor with respect to the ILPT Hawaii Portfolio Whole Loan. The obligations of ILPT for any guaranteed obligations for which the ILPT Hawaii Portfolio Whole Loan documents provide full recourse (consisting generally of bankruptcy related events) is capped at 15% of the outstanding principal balance of the ILPT Hawaii Portfolio Whole Loan.
ILPT is a real estate investment trust (“REIT”) formed to own and lease industrial and logistics properties throughout the United States. As of September 30, 2018, ILPT owned 269 industrial and logistics properties with approximately 29.2 million rentable SF, which were approximately 99.3% leased to 245 tenants with a weighted average remaining lease term of approximately 10.9 years. Approximately 58.8% of ILPT’s annualized rental revenues as of September 30, 2018 come from 226 properties (buildings, leasable land parcels and easements) with approximately 16.8 million SF located on the island of Oahu, Hawaii, most of which are long-term ground leases to tenants that have constructed buildings and operate businesses on land owned by ILPT.
The Properties. The ILPT Hawaii Portfolio consists of a total of 186 properties that are wholly owned in fee by the borrower sponsor, consisting of 177 Leased Fee Properties (where the ILPT Hawaii Portfolio Borrowers own the land but not any of the related improvements, which improvements are owned by the applicable ground lessees) comprised of 9,266,124 SF of land and nine Fee Simple Properties (where the ILPT Hawaii Portfolio Borrowers own both the land and the related improvements) comprised of 325,388 SF of building square footage. References herein to “SF” mean square feet of land with respect to the Leased Fee Properties and building square feet with respect to the Fee Simple Properties. Of the properties, 176 properties, comprising approximately 91.7% of ILPT Hawaii Portfolio SF, are primarily improved with industrial/warehouse distribution facilities that contribute 91.1% of underwritten base rent. The remaining properties are improved with (i) six retail properties comprising approximately 5.6% of ILPT Hawaii Portfolio SF and contributing 6.3% of underwritten base rent, and (ii) four office properties comprising approximately 2.7% of ILPT Hawaii Portfolio SF and 2.6% of underwritten base rent, along with a 30,000 SF fee simple-owned parking lot serving one such property. The ILPT Hawaii Portfolio has an average historical occupancy of 99.5% from 2003 (when the ILPT Hawaii Portfolio was acquired by the borrower sponsor) through 2018. References herein to “occupancy” mean the percentage of the ILPT Hawaii Portfolio SF (including both land SF and building SF) that is occupied. During the same time period, ILPT has renewed ground leases with existing tenants at an annual rent increase of 20% above prior levels and has entered into ground leases
This is not a research report and was not prepared by any Underwriter’s research department. Please see additional important information and qualifications at the end of this Term Sheet.
T-73
| Various | Loan #6 | Cut-off Date Balance: | $50,000,000 | |
| Various | ILPT Hawaii Portfolio | Cut-off Date LTV: | 45.2% | |
| Honolulu, HI Various | U/W NCF DSCR: | 2.40x | ||
| U/W NOI Debt Yield: | 10.6% | |||
with new tenants at an average rent premium of 28% above the prior comparable lease. Tenants of the ILPT Hawaii Portfolio have typically signed longer term leases and/or renewed their leases, with a weighted average tenancy of approximately 20.5 years as of the Cut-off Date.
Based on the rent roll as of December 13, 2018, the ILPT Hawaii Portfolio was approximately 99.9% leased by a diverse mix of both national and local tenants. The largest tenant, Servco Pacific, Inc., occupies 5.6% of the ILPT Hawaii Portfolio SF and contributes approximately 5.5% of underwritten base rent. The top 10 largest tenants by SF occupy 30.9% of the ILPT Hawaii Portfolio SF and contribute approximately 28.4% of underwritten base rent, and the top 20 largest tenants by SF occupy 43.9% of the ILPT Hawaii Portfolio SF and contribute approximately 42.7% of underwritten base rent. Overall, the ILPT Hawaii Portfolio has more than 170 tenants, with only one vacant suite totaling 900 SF. The ILPT Hawaii Portfolio benefits from well distributed rollover during the loan term, with the largest amount of rollover occurring in 2022, when leases comprising 22.7% of the ILPT Hawaii Portfolio SF and 22.3% of underwritten base rent expire. The weighted average remaining lease term at the ILPT Hawaii Portfolio is approximately 14.4 years as of March 2019, and approximately 52.9% of the ILPT Hawaii Portfolio SF and 50.2% of underwritten base rent rolls after the maturity of the ILPT Hawaii Portfolio Whole Loan.
The following table presents certain information relating to the ILPT Hawaii Portfolio:
| Property Type | Net Rentable Area (SF) | % SF | Occupancy | UW Base Rent(1) | UW Base Rent PSF(1) | % of UW Base Rent | Appraised Value(2) | Allocated Loan Amount |
| Leased Fee Industrial | 8,498,906 | 88.6% | 100.0% | $56,700,212 | $6.67 | 85.2% | $1,227,695,000 | $554,507,903 |
| Fee Simple Industrial(3) | 295,388 | 3.1% | 99.7% | $3,946,788 | $13.40 | 5.9% | $75,500,000 | $34,100,772 |
| Sub-total Industrial: | 8,794,294 | 91.7% | 100.0% | $60,647,000 | $6.90 | 91.1% | $1,303,195,000 | $588,608,675 |
| Leased Fee Retail | 533,736 | 5.6% | 100.0% | $4,204,900 | $7.88 | 6.3% | $96,265,000 | $43,479,613 |
| Leased Fee Office(4) | 263,482 | 2.7% | 100.0% | $1,699,820 | $6.45 | 2.6% | $39,657,000 | $17,911,713 |
| Total/Wtd. Avg.: | 9,591,512 | 100.0% | 100.0% | $66,551,720 | $6.94 | 100.0% | $1,439,117,000 | $650,000,000 |
(1) UW Base Rent and UW Base Rent PSF include $3,723,524 ($0.39 PSF) of rent steps through January 15, 2020.
(2) Based on the appraisals as of December 2018.
(3) Fee Simple Industrial UW Base Rent PSF excludes 900 SF of vacant space.
(4) Leased Fee Office also includes a 30,000 SF fee simple-owned parking lot at 1052 Ahua Street, which serves as additional parking for the Leased Fee office asset at 2828 Paa Street.
The following table presents certain information relating to the leases at the ILPT Hawaii Portfolio:
| Tenant Summary(1) | |||||||||
| Tenant Name | Credit Rating (Fitch/Moody’s/S&P)(2) | Tenant SF | Approximate % of SF | Annual UW Base Rent(3) | Annual UW Base Rent PSF(3) | % of Total Annual UW Base Rent | Lease Expiration | Termination Option | |
| Tenants | |||||||||
| Servco Pacific, Inc. | NR/NR/NR | 537,302 | 5.6% | $3,672,284 | $6.83 | 5.5% | 1/31/2064 | N | |
| Coca-Cola Bottling of Hawaii, LLC | NR/NR/NR | 350,869 | 3.7% | $2,014,399 | $5.74 | 3.0% | Various(4) | N | |
| Manheim Remarketing, Inc. | BBB+/Baa2/BBB | 337,734 | 3.5% | $2,450,346 | $7.26 | 3.7% | 4/30/2021(5) | N | |
| Bradley Shopping Center Company | NR/NR/NR | 333,887 | 3.5% | $1,515,847 | $4.54 | 2.3% | 4/22/2033 | N | |
| Honolulu Warehouse Co., Ltd. | NR/NR/NR | 298,384 | 3.1% | $1,775,385 | $5.95 | 2.7% | 1/31/2044 | N | |
| Warehouse Rentals, Inc. | NR/NR/NR | 277,830 | 2.9% | $1,877,409 | $6.76 | 2.8% | 12/31/2049 | N | |
| A.L. Kilgo Company, Inc. | NR/NR/NR | 276,283 | 2.9% | $1,913,320 | $6.93 | 2.9% | 12/31/2028 | N | |
| Kaiser Foundation Health Plan, Inc. | NR/NR/AA- | 217,264 | 2.3% | $1,393,324 | $6.41 | 2.1% | Various(6) | N | |
| Pahounui Partners, LLC | NR/NR/NR | 190,836 | 2.0% | $1,269,059 | $6.65 | 1.9% | 6/30/2027 | N | |
| New Age Service Hawaii, Inc. | NR/NR/NR | 147,444 | 1.5% | $1,039,548 | $7.05 | 1.6% | Various(7) | N | |
| Subtotal/Wtd. Avg. | 2,967,833 | 30.9% | $18,920,921 | $6.38 | 28.4% | ||||
| Other Tenants | 6,621,709 | 69.0% | $47,630,799 | $7.19 | 71.6% | ||||
| Vacant Space(8) | 1,970 | 0.0% | $0 | $0.00 | 0.0% | ||||
| Total/Wtd. Avg. | 9,591,512 | 100.0% | $66,551,720 | $6.94 | 100.0% | ||||
| (1) | Information is based on the underwritten rent roll. |
| (2) | Certain ratings are those of the parent company, whether or not the parent guarantees the lease. |
| (3) | Annual UW Base Rent PSF and Annual UW Base Rent include contractual rent escalations of $3,723,524 ($0.39 PSF) through January 15, 2020. |
| (4) | Coca-Cola Bottling of Hawaii, LLC leases 34,755 SF through December 31, 2022 and 316,114 SF through July 31, 2039. |
| (5) | Manheim Remarketing, Inc. has one lease extension option through March 31, 2026 with an annual rent during the lease extension of (i) the greater of fair market rent and (ii) $7.40 PSF annually. |
| (6) | Kaiser Foundation Health Plan, Inc. leases 30,000 SF through April 30, 2026 and 187,264 SF through June 30, 2046. Kaiser Foundation Health Plan, Inc. has two, ten-year lease extension options for its 30,000 SF lease through April 30, 2046 at fixed rent and two, ten-year lease extension options for its 187,264 SF lease through June 30, 2066 at fixed rent. |
| (7) | New Age Service Hawaii, Inc. leases 52,250 SF through May 31, 2032, 38,294 SF through April 30, 2033 and 56,900 SF through June 30, 2035. |
| (8) | Vacant Space includes 1,070 of structurally non-rentable SF and 900 SF of rentable space. |
This is not a research report and was not prepared by any Underwriter’s research department. Please see additional important information and qualifications at the end of this Term Sheet.
T-74
| Various | Loan #6 | Cut-off Date Balance: | $50,000,000 | |
| Various | ILPT Hawaii Portfolio | Cut-off Date LTV: | 45.2% | |
| Honolulu, HI Various | U/W NCF DSCR: | 2.40x | ||
| U/W NOI Debt Yield: | 10.6% | |||
The following table presents certain information relating to the lease rollover schedule at the ILPT Hawaii Portfolio:
| Lease Rollover Schedule(1)(2) | ||||||||
| Year | # of Leases Rolling | SF Rolling | Approx. % of Total SF Rolling | Approx. Cumulative % of SF Rolling | UW Base Rent PSF Rolling(3) | Total UW Base Rent Rolling(3) | Approx. % of Total Rent Rolling | Approx. Cumulative % of Total Rent Rolling |
| MTM | 0 | 0 | 0.0% | 0.0% | $0.00 | $0 | 0.0% | 0.0% |
| 2019 | 3 | 15,075 | 0.2% | 0.2% | $11.86 | $178,748 | 0.3% | 0.3% |
| 2020 | 13 | 134,341 | 1.4% | 1.6% | $10.01 | $1,344,996 | 2.0% | 2.3% |
| 2021 | 18 | 423,540 | 4.4% | 6.0% | $8.19 | $3,468,102 | 5.2% | 7.5% |
| 2022 | 66 | 2,179,785 | 22.7% | 28.7% | $6.80 | $14,813,268 | 22.3% | 29.8% |
| 2023 | 9 | 158,095 | 1.6% | 30.3% | $8.14 | $1,286,858 | 1.9% | 31.7% |
| 2024 | 3 | 116,146 | 1.2% | 31.6% | $8.19 | $951,543 | 1.4% | 33.1% |
| 2025 | 5 | 96,154 | 1.0% | 32.6% | $8.47 | $814,396 | 1.2% | 34.3% |
| 2026 | 2 | 56,000 | 0.6% | 33.1% | $9.53 | $533,599 | 0.8% | 35.1% |
| 2027 | 3 | 338,166 | 3.5% | 36.7% | $7.49 | $2,534,423 | 3.8% | 39.0% |
| 2028 | 22 | 1,002,799 | 10.5% | 47.1% | $7.20 | $7,222,059 | 10.9% | 49.8% |
| 2029 | 3 | 122,819 | 1.3% | 48.4% | $7.48 | $918,544 | 1.4% | 51.2% |
| Thereafter | 79 | 4,946,622 | 51.6% | 100.0% | $6.57 | $32,485,183 | 48.8% | 100.0% |
| Vacant(4) | 0 | 1,970 | 0.0% | 100.0% | $0.00 | $0 | 0.0% | 100.0% |
| Total/Wtd. Avg.(5) | 226 | 9,591,512 | 100.0% | $6.94 | $66,551,720 | 100.0% | ||
| (1) | Information is based on the underwritten rent roll. |
| (2) | Certain tenants may have lease termination options that are exercisable prior to the originally stated expiration date of the related lease and that are not considered in the lease rollover schedule. |
| (3) | UW Base Rent PSF Rolling and Total UW Base Rent Rolling include $3,723,524 ($0.39 PSF) of rent steps through January 15, 2020. |
| (4) | Vacant space includes 1,070 SF of structurally non-rentable SF and 900 SF of rentable space. |
| (5) | Wtd. Avg. UW Base Rent PSF Rolling excludes vacant space. |
The Market. The properties that comprise the ILPT Hawaii Portfolio are primarily located in Honolulu’s industrial/commercial district, and comprise approximately 220 contiguous acres adjacent to Honolulu International Airport with direct access to the H-1 Freeway, Moanalua Freeway and Nimitz Highway, and a 2-mile drive from Honolulu Harbor. The ILPT Hawaii Portfolio is concentrated in two substantial infill locations and benefits from their proximity to Honolulu International Airport and Honolulu Harbor. Hawaii imports approximately 80% of what it consumes and approximately 95% of its imports enter through its commercial harbors. The ILPT Hawaii Portfolio’s location is a last-mile location for many institutional entities located in Oahu and an important one for many local businesses. The Oahu industrial market exhibited a 1.85% vacancy rate as of the third quarter 2018 and has remained under 2% for the last three years. At the same time, rents have grown, with the market achieving a 5.9% average annual rent increase from 2011 to 2017.
| Oahu Industrial Market Statistics | |||||||||
| Period | Number of Buildings | Building Area (SF) | Available Space (SF) | YTD Net Absorption (SF) | Vacancy Rate | Wtd. Avg. (Monthly) | Wtd. Avg. Asking Rent (Annually) | Avg. Net Op. Exp. (Monthly) | Avg. Net Op. Exp. (Annually) |
| 2009 | 1,760 | 38,197,898 | 1,834,993 | -210,641 | 4.80% | $0.99 | $11.88 | $0.32 | $3.84 |
| 2010 | 1,777 | 38,530,034 | 1,828,951 | 6,042 | 4.75% | $0.99 | $11.88 | $0.32 | $3.84 |
| 2011 | 1,798 | 38,896,094 | 1,860,883 | -32,267 | 4.78% | $0.92 | $11.04 | $0.31 | $3.72 |
| 3Q2012(1) | 1,809 | 39,211,146 | 1,674,614 | 186,269 | 4.27% | $0.98 | $11.76 | $0.34 | $4.08 |
| 2013 | 1,854 | 40,372,428 | 1,093,009 | 375,959 | 2.71% | $0.99 | $11.88 | $0.37 | $4.44 |
| 2014 | 1,843 | 39,230,336 | 830,303 | 262,706 | 2.12% | $1.10 | $13.20 | $0.43 | $5.16 |
| 2015 | 1,799 | 39,768,281 | 657,117 | 173,186 | 1.65% | $1.13 | $13.56 | $0.35 | $4.20 |
| 2016 | 1,804 | 39,950,156 | 638,535 | 64,582 | 1.60% | $1.21 | $14.52 | $0.35 | $4.20 |
| 2017 | 1,781 | 40,193,894 | 795,757 | -157,222 | 1.98% | $1.30 | $15.60 | $0.37 | $4.44 |
| 3Q2018 | 1,788 | 40,415,322 | 746,038 | 49,719 | 1.85% | $1.23 | $14.76 | $0.40 | $4.80 |
Source:Appraisal
| (1) | Year end 2012 figures were unavailable. |
This is not a research report and was not prepared by any Underwriter’s research department. Please see additional important information and qualifications at the end of this Term Sheet.
T-75
| Various | Loan #6 | Cut-off Date Balance: | $50,000,000 | |
| Various | ILPT Hawaii Portfolio | Cut-off Date LTV: | 45.2% | |
| Honolulu, HI Various | U/W NCF DSCR: | 2.40x | ||
| U/W NOI Debt Yield: | 10.6% | |||
170 of the 177 Leased Fee Properties, as well as all 9 Fee Simple Properties, are in the Honolulu Industrial node, which consists of the Kalihi, Sand Island, Mapunapuna and Airport submarkets, which are comprised of a range of commercial and industrial uses.
| Oahu Industrial Market Statistics | ||||||||
| Submarket | Number of Buildings | Building Area (SF) | Tenure | Available Space (SF) | 3Q 2018 Net Absorption (SF) | Vacancy Rate | Wtd. Avg. Asking Rent PSF (Monthly) | Avg. Net Op. Exp. PSF (Monthly) |
| Kalihi | 707 | 9,612,549 | Fee Simple | 215,094 | (9,129) | 2.24% | $1.19 | $0.42 |
| Sand Island | 74 | 663,005 | Leasehold | 1,125 | 1,240 | 0.17% | $1.40 | $0.33 |
| Mapunapuna | 107 | 4,214,301 | Leasehold | 20,900 | 0 | 0.50% | $1.41 | $0.31 |
| Airport | 125 | 4,641,933 | Fee Simple | 22,000 | 12,579 | 0.47% | $1.00 | $0.28 |
Source: Appraisal
| Kalihi Submarket Area | Sand Island Submarket Area | |||||||||
| Period | Quarterly Net Absorption | Vacancy Rate | Wtd. Avg. Asking Rent PSF (Monthly) | Avg. Net Op. Exp. (Monthly) | Period | Quarterly Net Absorption | Vacancy Rate | Wtd. Avg. Asking Rent PSF (Monthly) | Avg. Net Op. Exp. (Monthly) | |
| 1Q2016 | 15,890 | 1.81% | $1.22 | $0.36 | 1Q2016 | (4,500) | 2.56% | $0.82 | $0.30 | |
| 2Q2016 | 19,548 | 1.60% | $1.12 | $0.33 | 2Q2016 | 0 | 2.56% | $0.82 | $0.30 | |
| 3Q2016 | (22,471) | 1.83% | $1.09 | $0.38 | 3Q2016 | (14,443) | 0.00% | $0.00 | $0.30 | |
| 4Q2016 | (32,539) | 2.17% | $1.17 | $0.41 | 4Q2016 | (5,500) | 0.97% | $1.36 | $0.30 | |
| 1Q2017 | 8,603 | 2.08% | $1.11 | $0.40 | 1Q2017 | 0 | 0.97% | $1.36 | $0.30 | |
| 2Q2017 | (73,547) | 2.85% | $1.29 | $0.48 | 2Q2017 | (4,080) | 1.68% | $1.36 | $0.30 | |
| 3Q2017 | 28,007 | 2.55% | $1.27 | $0.50 | 3Q2017 | 9,580 | 0.00% | $1.36 | $0.30 | |
| 4Q2017 | 30,749 | 2.23% | $1.28 | $0.38 | 4Q2017 | (5,097) | 0.77% | $1.36 | $0.32 | |
| 1Q2018 | (23,764) | 2.46% | $1.17 | $0.40 | 1Q2018 | 3,857 | 0.19% | $1.40 | $0.32 | |
| 2Q2018 | 28,970 | 2.16% | $1.17 | $0.40 | 2Q2018 | (1,125) | 0.36% | $1.40 | $0.32 | |
| 3Q2018 | (9,129) | 2.24% | $1.19 | $0.42 | 3Q2018 | 1,240 | 0.17% | $1.40 | $0.33 | |
| Mapunapuna Submarket Area | Airport Submarket Area | ||||||||
| Period | Quarterly Net Absorption | Vacancy Rate | Wtd. Avg. Asking Rent PSF (Monthly) | Avg. Net Op. Exp. (Monthly) | Period | Quarterly Net Absorption | Vacancy Rate | Wtd. Avg. Asking Rent PSF (Monthly) | Avg. Net Op. Exp. (Monthly) |
| 1Q2016 | 15,124 | 0.66% | $1.22 | $0.43 | 1Q2016 | 29,527 | 0.11% | $1.20 | $0.30 |
| 2Q2016 | (6,852) | 0.83% | $1.21 | $0.40 | 2Q2016 | 0 | 0.11% | $1.20 | $0.30 |
| 3Q2016 | 8,248 | 0.63% | $1.35 | $0.40 | 3Q2016 | (35,800) | 0.88% | $1.20 | $0.30 |
| 4Q2016 | 18,250 | 0.19% | $1.20 | $0.35 | 4Q2016 | 5,300 | 0.77% | $1.02 | $0.28 |
| 1Q2017 | (3,020) | 0.27% | $1.22 | $0.35 | 1Q2017 | 13,300 | 0.48% | $0.85 | $0.28 |
| 2Q2017 | 0 | 0.27% | $1.22 | $0.35 | 2Q2017 | 0 | 0.48% | $0.85 | $0.28 |
| 3Q2017 | 41,404 | 1.25% | $1.27 | $0.40 | 3Q2017 | 22,500 | 0.00% | $0.85 | $0.28 |
| 4Q2017 | 34,072 | 0.44% | $1.08 | $0.33 | 4Q2017 | 0 | 0.00% | $0.85 | $0.28 |
| 1Q2018 | 3,086 | 0.37% | $1.41 | $0.26 | 1Q2018 | (29,520) | 0.64% | $1.08 | $0.28 |
| 2Q2018 | (5,480) | 0.50% | $1.41 | $0.31 | 2Q2018 | (5,059) | 0.74% | $1.08 | $0.28 |
| 3Q2018 | 0 | 0.50% | $1.41 | $0.31 | 3Q2018 | 12,579 | 0.47% | $1.00 | $0.28 |
This is not a research report and was not prepared by any Underwriter’s research department. Please see additional important information and qualifications at the end of this Term Sheet.
T-76
| Various | Loan #6 | Cut-off Date Balance: | $50,000,000 | |
| Various | ILPT Hawaii Portfolio | Cut-off Date LTV: | 45.2% | |
| Honolulu, HI Various | U/W NCF DSCR: | 2.40x | ||
| U/W NOI Debt Yield: | 10.6% | |||
Summaries of the appraiser’s market ground rent conclusions for the Mapunapuna and Sand Island submarkets is presented in the below chart. The appraiser concluded market ground rent of $8.59 PSF for Mapunapuna and $7.75 PSF for Sand Island. The weighted average underwritten base rent for the 177 Leased Fee Properties is approximately $6.73 PSF, which is below market.
| Summary of Comparable Ground Rents - Mapunapuna | ||||||
| Property Location | Transaction Type | Reset Date | Size (Acres) | Size (SF) | Actual Annual Rent PSF | MC Adjusted Annual Rent PSF(1) |
| 1000 Mapunapuna Street | Ground Rent Reset | July 2017 | 0.960 | 41,833 | $8.23 | $8.58 |
| 803 Ahua Street | Ground Rent Reset | May 2018 | 1.676 | 73,013 | $8.88 | $8.88 |
| 669 Ahua Street | Ground Rent Reset | June 2018 | 0.803 | 35,000 | $8.25 | $8.25 |
| 842 Mapunapuna Street | Ground Rent Reset | November 2022 | 0.803 | 35,000 | $9.64 | $8.59 |
| 822 Mapunapuna Street | Ground Rent Reset | November 2022 | 0.803 | 35,000 | $9.64 | $8.59 |
| 692 Mapunapuna Street | Ground Rent Reset | January 2023 | 0.803 | 35,000 | $9.74 | $8.63 |
| 819 Ahua Street | Ground Rent Reset | January 2023 | 2.411 | 105,013 | $9.64 | $8.54 |
| Summary of Comparable Ground Rents – Sand Island(1) | ||||||
| Property Location | Transaction Type | Reset Date | Size (Acres) | Size (SF) | Actual Annual Rent PSF | MC Adjusted Annual Rent PSF |
| 158 Sand Island Access Road | Ground Rent Reset | January 2019 | 2.307 | 100,500 | $7.58 | $7.58 |
| 2250 Pahounui Drive | Ground Rent Reset | January 2019 | 1.736 | 75,627 | $7.70 | $7.70 |
| 2019 Kahai Street | Ground Rent Reset | January 2019 | 0.619 | 26,954 | $7.73 | $7.73 |
| 165 Sand Island Access Road | Ground Rent Reset | January 2019 | 0.359 | 15,677 | $7.73 | $7.73 |
| 218 Mohonua Place | Ground Rent Reset | January 2019 | 0.783 | 34,096 | $7.75 | $7.75 |
| 125 Puuhale Road | Ground Rent Reset | January 2019 | 0.712 | 31,006 | $7.75 | $7.75 |
| 2135 Auiki Street | Ground Rent Reset | January 2019 | 0.765 | 33,328 | $7.75 | $7.75 |
| 2264 Pahounui Drive | Ground Rent Reset | January 2019 | 0.760 | 33,103 | $7.75 | $7.75 |
| 2276 Pahounui Drive | Ground Rent Reset | January 2019 | 0.754 | 32,841 | $7.75 | $7.75 |
| 180 Sand Island Access Road | Ground Rent Reset | January 2019 | 1.534 | 66,828 | $7.89 | $7.89 |
| 2020 Auiki Street | Ground Rent Reset | January 2019 | 1.072 | 46,705 | $7.62 | $7.62 |
| 204 Sand Island Access Road | Ground Rent Reset | January 2019 | 0.759 | 33,078 | $7.75 | $7.75 |
Source: Appraisal
| (1) | MC Adjusted Annual Rent PSF is equal to Actual Annual Rent PSF adjusted 3% annually for market conditions. |
This is not a research report and was not prepared by any Underwriter’s research department. Please see additional important information and qualifications at the end of this Term Sheet.
T-77
| Various | Loan #6 | Cut-off Date Balance: | $50,000,000 | |
| Various | ILPT Hawaii Portfolio | Cut-off Date LTV: | 45.2% | |
| Honolulu, HI Various | U/W NCF DSCR: | 2.40x | ||
| U/W NOI Debt Yield: | 10.6% | |||
Operating History and Underwritten Net Cash Flow.The following table presents certain information relating to the historical operating performance and the Underwritten Net Cash Flow of the ILPT Hawaii Portfolio:
| Cash Flow Analysis | ||||||
| 2015 | 2016 | 2017 | 10/31/2018 TTM | UW | UW PSF | |
| Total Rental Income | $57,794,802 | $59,050,133 | $60,614,287 | $62,463,516 | $72,071,712 | $7.51 |
| Total Recoveries | $11,804,235 | $12,418,670 | $13,144,715 | $13,907,140 | $14,798,912 | $1.54 |
| Total Other Income | $194,061 | $125,710 | $152,497 | $58,150 | $114,598 | $0.01 |
| Effective Gross Income | $69,793,098 | $71,594,513 | $73,911,499 | $76,428,806 | $86,985,222 | $9.07 |
| Real Estate Taxes | $11,203,237 | $11,786,584 | $12,396,068 | $13,111,618 | $14,032,983 | $1.46 |
| Insurance | $47,193 | $34,176 | $31,368 | $29,834 | $30,915 | $0.00 |
| Other Expenses | $2,871,227 | $4,229,190 | $4,606,709 | $5,447,157 | $4,157,535 | $0.43 |
| Total Expenses | $14,121,657 | $16,049,950 | $17,034,145 | $18,588,609 | $18,221,433 | $1.90 |
| Net Operating Income(1) | $55,671,441 | $55,544,563 | $56,877,354 | $57,840,197 | $68,763,789 | $7.17 |
| Capital Expenditures | $0 | $0 | $0 | $0 | $59,078 | $0.01 |
| TI/LC | $0 | $0 | $0 | $0 | $498,822 | $0.05 |
| Net Cash Flow | $55,671,441 | $55,544,563 | $56,877,354 | $57,840,197 | $68,205,889 | $7.11 |
| Occupancy %(2) | 100.0% | 99.5% | 100.0% | 99.9% | 100.0% | |
| NOI DSCR(3) | 1.96x | 1.96x | 2.00x | 2.04x | 2.42x | |
| NCF DSCR(3) | 1.96x | 1.96x | 2.00x | 2.04x | 2.40x | |
| NOI Debt Yield(3) | 8.6% | 8.5% | 8.8% | 8.9% | 10.6% | |
| NCF Debt Yield(3) | 8.6% | 8.5% | 8.8% | 8.9% | 10.5% | |
| (1) | The increase in UW Net Operating Income from 10/31/2018 TTM Net Operating Income is primarily attributed to (i) $3,723,524 ($0.39 PSF) of rent steps through January 15, 2020, (ii) $259,026 in percentage rent from three tenants based on certain sales/revenue figures: Bank of Hawaii (2969 Mapunapuna Street), SLSS Partners (808 Ahua Street), and Honolulu Warehouse Co., Ltd. (2850 Paa Street) and (iii) $5,260,967 in straight-line average of ground rent steps from January 2020 through January 2030. |
| (2) | As of the underwritten rent roll dated December 13, 2018, the ILPT Hawaii Portfolio is 99.9% occupied. |
| (3) | Debt service coverage ratios and debt yields are based on the ILPT Hawaii Portfolio Whole Loan. |
Escrows and Reserves.
Real Estate Taxes - Solely during the continuance of a Cash Management Sweep Period (as defined below), the ILPT Hawaii Portfolio Borrowers are required to escrow monthly 1/12th of the annual estimated real estate taxes.
Insurance - Solely during the continuance of a Cash Management Sweep Period, the ILPT Hawaii Portfolio Borrowers are required to escrow monthly 1/12th of the annual estimated insurance premiums (unless the ILPT Hawaii Portfolio Borrowers maintain acceptable blanket insurance policies and the insurance premiums payable in connection therewith have been prepaid for not less than one year in advance, or, for the period of coverage under the insurance policies as to which certificates are delivered at loan origination, such period, if less than one year).
Lockbox and Cash Management.The ILPT Hawaii Portfolio Whole Loan is structured with a hard lockbox and springing cash management. The ILPT Hawaii Portfolio Borrowers are required to direct each tenant of the ILPT Hawaii Portfolio to deposit funds directly into the lockbox account, and to deposit any funds received by the ILPT Hawaii Portfolio Borrowers and property manager, notwithstanding such direction, into the lockbox account within two business days of receipt. If no Cash Management Sweep Period exists, amounts on deposit in the lockbox account are required to be disbursed to the ILPT Hawaii Portfolio Borrowers’ operating account on each business day. Upon the first occurrence of a Cash Management Sweep Period, the lender is required to establish, and the ILPT Hawaii Portfolios are required to cooperate to establish, a lender-controlled cash management account. If a Cash Management Sweep Period exists, funds on deposit in the lockbox account are required to be transferred to a lender-controlled cash management account, and applied to make monthly deposits to the tax reserve and insurance reserve as described above under “Escrows and Reserves,” insurance reserve, to pay debt service on the ILPT Hawaii Portfolio Whole Loan, to pay approved operating expenses in accordance with the annual budget (which is required to be reasonably approved by the lender during the continuance of a Cash Management Sweep Period) and extraordinary expenses approved by the lender, and to pay any remainder (i) during any Cash Management Sweep Period not caused by a Partial Debt Yield Event (as defined below) into a cash trap account or (ii) during a Cash Management Sweep Period caused by a Partial Debt Yield Event, 50% into the cash trap account, and 50% to the ILPT Hawaii Portfolio Borrowers. In each case the amounts deposited in the cash trap account are required to be held as additional collateral for the ILPT Hawaii Portfolio Whole Loan during the continuance of the Cash Management Sweep Period; provided that, so long as no event of default is continuing under the ILPT Hawaii Portfolio Whole Loan, funds in the cash trap account are required to be applied to pay any shortfalls in debt service, to make deposits into the tax and insurance reserves to the extent amounts on deposit in the cash management account are insufficient, and, if requested by the ILPT Hawaii Portfolio Borrowers, to pay tenant improvements costs and allowances and leasing commissions for leases approved or deemed approved by the lender, capital expenditures set forth in the approved annual budget, management fees not to exceed 3.0% of operating income for the ILPT Hawaii Portfolio, and (subject to an annual cap of $100,000) REIT distributions to owners of the ILPT Hawaii Portfolio Borrowers.
A “Cash Management Sweep Period” will commence (a) upon the occurrence of an event of default under the loan documents, (b) upon the occurrence of a Debt Yield Event or (c) upon the occurrence of a Partial Debt Yield Event and will terminate upon (x) with respect to clause (a), the cure of such
This is not a research report and was not prepared by any Underwriter’s research department. Please see additional important information and qualifications at the end of this Term Sheet.
T-78
| Various | Loan #6 | Cut-off Date Balance: | $50,000,000 | |
| Various | ILPT Hawaii Portfolio | Cut-off Date LTV: | 45.2% | |
| Honolulu, HI Various | U/W NCF DSCR: | 2.40x | ||
| U/W NOI Debt Yield: | 10.6% | |||
event of default, (y) with respect to clause (b), the termination of such Debt Yield Event, or (z) with respect to clause (c), the termination of such Partial Debt Yield Event.
A “Debt Yield Event” will commence if the debt yield for the ILPT Hawaii Portfolio Whole Loan is less than 6.75% at the end of two consecutive calendar quarters and will end if (i) the debt yield for the ILPT Hawaii Portfolio Whole Loan is equal to or greater than 6.75% for two consecutive calendar quarters, or (ii) the ILPT Hawaii Portfolio Borrowers have delivered to the lender a letter of credit in accordance with the loan documents in a face amount such that, if applied to reduce the principal balance of the ILPT Hawaii Portfolio Whole Loan, would result in a debt yield of at least 6.75%.
A “Partial Debt Yield Event” will occur if the debt yield for the ILPT Hawaii Portfolio Whole Loan is less than 7.25% at the end of two consecutive calendar quarters (and a Debt Yield Event does not exist) and will end if (i) the debt yield for the ILPT Hawaii Portfolio Whole Loan is equal to or greater than 7.25% for two consecutive calendar quarters, or (ii) the ILPT Hawaii Portfolio Borrowers have delivered to the lender a letter of credit in accordance with the loan documents in a face amount such that, if applied to reduce the principal balance of the ILPT Hawaii Portfolio Whole Loan, would result in a debt yield of at least 7.25%.
Additional Secured Indebtedness (not including trade debts).In addition to the ILPT Hawaii Portfolio Mortgage Loan, the ILPT Hawaii Portfolio also secures the ILPT Hawaii Portfolio Non-ServicedPari passu Companion Loans, which have a Cut-off Date principal balance of $600,000,000. The ILPT Hawaii Portfolio Non-ServicedPari passu Companion Loans accrue interest at the same rate as the ILPT Hawaii Portfolio Mortgage Loan. The ILPT Hawaii Portfolio Mortgage Loan ispari passu in right of payment with the ILPT Hawaii Portfolio Non-ServicedPari passu Companion Loans. The holders of the ILPT Hawaii Portfolio Mortgage Loan and the ILPT Hawaii Portfolio Non-ServicedPari passu Companion Loans have entered into a co-lender agreement which sets forth the allocation of collections on the ILPT Hawaii Portfolio Whole Loan. See “Description of the Mortgage Pool—The Whole Loans—The Non-Serviced Pari Passu Whole Loans” in the Preliminary Prospectus.
Mezzanine Loan and Preferred Equity.None.
Release of Property.Not permitted.
Right of First Refusal.A tenant at each of the 1052 Ahua Street, 2828 Paa Street, 2831 Kaihikapu Street, 2826 Kaihikapu Street, 1045 Mapunapuna Street and 918 Ahua Street Mortgaged Properties has a right of first refusal to purchase the related Mortgaged Property in the event of a proposed transfer of such Mortgaged Property. None of such rights of first refusal are applicable to a transfer of (i) any of the related Mortgaged Properties in connection with a foreclosure or deed-in-lieu of foreclose or (ii) the entire portfolio of Mortgaged Properties.
Letter of Credit.None.
Terrorism Insurance.The ILPT Hawaii Portfolio Whole Loan documents require that the “all risk” insurance policy required to be maintained by the ILPT Hawaii Portfolio Borrowers provide coverage for terrorism in an amount equal to the full replacement cost of the ILPT Hawaii Portfolio and 24 months of business interruption insurance (in each case, subject to a cap with respect to non-owned improvements); provided that if the Terrorism Risk Insurance Program Reauthorization Act of 2015 or extension thereof or substantially similar program (“TRIPRA”) is in effect and continues to cover both foreign and domestic acts of terrorism, the lender is required to accept terrorism insurance with coverage against “covered acts” within the meaning of TRIPRA.
This is not a research report and was not prepared by any Underwriter’s research department. Please see additional important information and qualifications at the end of this Term Sheet.
T-79
| Retail - Anchored | Loan #7 | Cut-off Date Balance: | $44,000,000 | |
| 225, 307, 347, 401 Vista Village Drive | Vista Village Shopping Center | Cut-off Date LTV: | 64.1% | |
| & 15, 20, 25, 30, 35, 40 Main Street | U/W NCF DSCR: | 2.14x | ||
| Vista, CA 92083 | U/W NOI Debt Yield: | 10.1% |
This is not a research report and was not prepared by any Underwriter’s research department. Please see additional important information and qualifications at the end of this Term Sheet.
T-80
| Retail - Anchored | Loan #7 | Cut-off Date Balance: | $44,000,000 | |
| 225, 307, 347, 401 Vista Village Drive | Vista Village Shopping Center | Cut-off Date LTV: | 64.1% | |
| & 15, 20, 25, 30, 35, 40 Main Street | U/W NCF DSCR: | 2.14x | ||
| Vista, CA 92083 | U/W NOI Debt Yield: | 10.1% |

This is not a research report and was not prepared by any Underwriter’s research department. Please see additional important information and qualifications at the end of this Term Sheet.
T-81
| Retail - Anchored | Loan #7 | Cut-off Date Balance: | $44,000,000 | |
| 225, 307, 347, 401 Vista Village Drive | Vista Village Shopping Center | Cut-off Date LTV: | 64.1% | |
| & 15, 20, 25, 30, 35, 40 Main Street | U/W NCF DSCR: | 2.14x | ||
| Vista, CA 92083 | U/W NOI Debt Yield: | 10.1% |
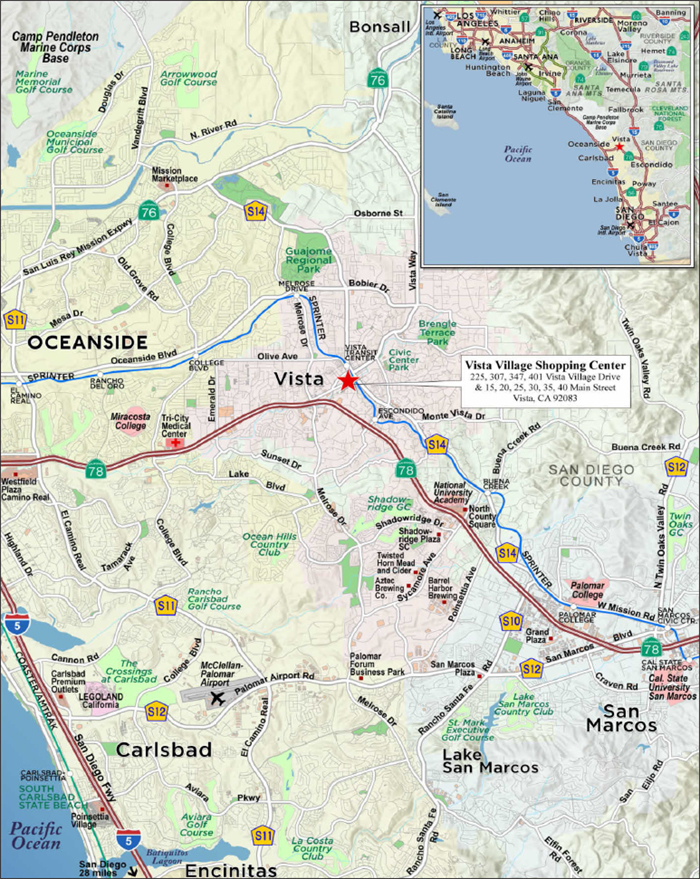
This is not a research report and was not prepared by any Underwriter’s research department. Please see additional important information and qualifications at the end of this Term Sheet.
T-82
| Mortgage Loan No. 7 – Vista Village Shopping Center |
| Mortgage Loan Information | Property Information | ||||||
| Mortgage Loan Seller: | BANA | Single Asset/Portfolio: | Single Asset | ||||
| Credit Assessment (KBRA/Fitch/S&P): | NR/NR/NR | Location: | Vista, CA 92083 | ||||
| Original Balance: | $44,000,000 | General Property Type: | Retail | ||||
| Cut-off Date Balance: | $44,000,000 | Detailed Property Type: | Anchored | ||||
| % of Initial Pool Balance: | 5.3% | Title Vesting(2): | Fee | ||||
| Loan Purpose: | Acquisition | Year Built/Renovated: | 2003/N/A | ||||
| Sponsor: | Cherng Family | Size: | 195,009 SF | ||||
| Guarantor: | CFT NV Developments, LLC | Cut-off Date Balance per SF: | $226 | ||||
| Mortgage Rate: | 4.3800% | Maturity Date Balance per SF: | $226 | ||||
| Note Date: | 3/8/2019 | Property Manager: | Vestar Properties, Inc. | ||||
| First Payment Date: | 5/1/2019 | ||||||
| Maturity Date: | 4/1/2029 | ||||||
| Original Term to Maturity: | 120 months | ||||||
| Original Amortization Term: | 0 months | ||||||
| IO Period: | 120 months | ||||||
| Seasoning: | 0 months | Underwriting and Financial Information | |||||
| Prepayment Provisions: | LO (24); DEF (91); O (5) | UW NOI: | $4,451,485 | ||||
| Lockbox/Cash Mgmt Status: | Soft/Springing | UW NOI Debt Yield: | 10.1% | ||||
| Additional Debt Type: | N/A | UW NOI Debt Yield at Maturity: | 10.1% | ||||
| Additional Debt Balance: | N/A | UW NCF DSCR: | 2.14x | ||||
| Future Debt Permitted (Type): | No (N/A) | Most Recent NOI: | $4,306,505 (12/31/2018) | ||||
| Reserves(1) | 2nd Most Recent NOI: | $4,037,161 (12/31/2017) | |||||
| Type | Initial | Monthly | Cap | 3rd Most Recent NOI: | $3,876,862 (12/31/2016) | ||
| RE Tax: | $123,260 | $61,630 | N/A | Most Recent Occupancy: | 94.7% (2/15/2019) | ||
| Insurance: | $0 | Springing | N/A | 2nd Most Recent Occupancy: | 92.7% (12/31/2017) | ||
| Immediate Repairs: | $127,050 | $0 | N/A | 3rd Most Recent Occupancy: | 87.3% (12/31/2016) | ||
| Recurring Replacements: | $500,000 | $10,000 | $500,000 | Appraised Value (as of): | $68,600,000 (2/17/2019) | ||
| TI/LC: | $500,000 | $16,251 | $500,000 | Appraised Value per SF: | $352 | ||
| Landlord Obligations: | $185,758 | $0 | N/A | Cut-off Date LTV Ratio: | 64.1% | ||
| Roof Replacement: | $0 | Springing | N/A | Maturity Date LTV Ratio: | 64.1% | ||
| Sources and Uses | ||||||
| Sources | Proceeds | % of Total | Uses | Proceeds | % of Total | |
| Loan Amount: | $44,000,000 | 64.7% | Purchase Price: | $66,200,000 | 97.3% | |
| Borrower Equity: | $24,024,670 | 35.3% | Reserves: | $1,436,068 | 2.1% | |
| Closing Costs: | $388,602 | 0.6% | ||||
| Total Sources: | $68,024,670 | 100.0% | Total Uses: | $68,024,670 | 100.0% | |
| (1) | See “Escrows and Reserves” below for further discussion of reserves requirements. |
| (2) | The Vista Village Shopping Center Property (as defined below) includes an approximate 698 SF plot of vacant land at the corner of Vista Village Drive and State Route 78 that is ground leased from the City of Vista and used for signage (see “Ground Lease” below). |
The Mortgage Loan. The seventh largest mortgage loan (the “Vista Village Shopping Center Mortgage Loan”) is evidenced by a promissory note in the original principal amount of $44,000,000 and secured by the first priority fee mortgage on a 195,009 SF portion of an anchored retail center located in Vista, California (the “Vista Village Shopping Center Property”). See“Ground Lease” below.
The Borrower and the Borrower Sponsor. The borrower is CFT Vista, LLC, a Delaware limited liability company structured to be bankruptcy-remote with at least one independent director (the “Vista Village Shopping Center Borrower”).
CFT NV Developments, LLC is the nonrecourse carve-out guarantor, which is owned by family trusts of Andrew Jin-Chan Cherng and Peggy Tsiang Cherng. The Cherng Family is the borrower sponsor for the Vista Village Shopping Center Mortgage Loan. Andrew Jin-Chan Cherng and Peggy Tsiang Cherng are the co-founders of the Chinese fast-food chain Panda Express and have investments in other restaurant chains as well as a real estate portfolio of nearly 700 residential and commercial properties. The borrower sponsor is investing approximately $24.0 million to purchase the Vista Village Shopping Center Property.
This is not a research report and was not prepared by any Underwriter’s research department. Please see additional important information and qualifications at the end of this Term Sheet.
T-83
| Retail - Anchored | Loan #7 | Cut-off Date Balance: | $44,000,000 | |
| 225, 307, 347, 401 Vista Village Drive | Vista Village Shopping Center | Cut-off Date LTV: | 64.1% | |
| & 15, 20, 25, 30, 35, 40 Main Street | U/W NCF DSCR: | 2.14x | ||
| Vista, CA 92083 | U/W NOI Debt Yield: | 10.1% |
The Property. The Vista Village Shopping Center Property is a ten-building anchored retail center built in 2003 on 22.4 acres located in Vista, California, immediately south of State Route 78. The Vista Village Shopping Center Property contains 195,009 SF of rentable area and 1,110 surface parking spaces (approximately 5.7 spaces per 1,000 SF). The Vista Village Shopping Center Property is a part of a larger 235,822 SF shopping center featuring non-collateral tenants including Staples, Chili’s, US Bank, Raising Cane’s and Burger King. The shopping center surrounds the non-collateral The Wave Waterpark and a non-collateral 41-unit apartment complex.
The Vista Village Shopping Center Property had year-end occupancy rates of 88.8%, 87.3%, 92.7% and 92.7% for 2015, 2016, 2017 and 2018, respectively. As of February 15, 2019, the Vista Village Shopping Center Property was 94.7% leased to 28 tenants. Cinepolis and Frazier Farms are the anchor tenants, with junior anchors being Crunch Fitness and Pets Plus. Other than the anchors, no single tenant occupies more than 3.1% of NRA or represents more than 5.8% of underwritten base rent. Notable in-line tenants include Coldwell Banker, Panera Bread, AT&T, Massage Envy, Five Guys Burgers and Fries, Sprint, Wings N Things, Starbucks Coffee, Great Clips and Cold Stone Creamery. Eighteen of the tenants (69.2% of NRA) have been in occupancy for over ten years with ten tenants (9.8% of NRA) having signed renewal leases within the last six months.
Major Tenants.
Cinepolis (69,654 SF, 35.7% of NRA, 37.1% of underwritten base rent).Cinepolis is a Mexican chain of movie theaters with over 5,400 screens. Cinepolis is the fourth largest multiplex chain in the world, behind AMC, Regal and Cinemark, and operates 19 movie theaters in the United States. Cinepolis at the Vista Village Shopping Center Property features fifteen screens, including two large format screens, one screen equipped with a Dolby Atmos audio system, a Cinepolis Junior (family-catered theater space and play space) and 4DX auditorium (featuring motion chairs and environmental effects). Cinepolis has been a tenant at the Vista Village Shopping Center Property since assuming the lease from MetroPlex Theaters in 2015. After assuming the lease, Cinepolis invested an estimated $5 million, adding reclining leather seats, state-of-the-art digital projection, premium audio and sound, stadium seating, and 3D viewing. Additionally, in November 2018, Cinepolis received approval from the City of Vista for a beer and wine license. The Cinepolis lease expires November 30, 2023, with five five-year renewal options at fixed rent with six months’ notice. The Cinepolis lease is guaranteed by USA Cinema Investments Holding Inc. At the Vista Village Shopping Center Property, Cinepolis reported sales of $486,987 per screen for 2016, $644,131 per screen for 2017 and $810,225 per screen for the trailing twelve months ended September 2018.
Frazier Farms (25,000 SF, 12.8% of NRA, 9.8% of underwritten base rent). Frazier Farms is a natural grocer established in 1971. Currently Frazier Farms has two locations within 7.5 miles; one at the Vista Village Shopping Center Property and a second location in Oceanside, California. Frazier Farms has been a tenant at the Vista Village Shopping Center Property since September 2005, occupying a 25,000 SF building under a lease that expires September 30, 2025, with four five-year renewal options at fixed rent with six months’ prior notice. The Frazier Farms lease requires rental increases every five years, with the next increase in October, 2020. The Frazier Farms lease is guaranteed by Norman Frazier. At the Vista Village Shopping Center Property, Frazier Farms reported sales of $1,154 PSF for 2016, $1,204 PSF for 2017 and $1,241 PSF for the trailing twelve months ended September 2018.
The following table presents certain information relating to the major tenants at the Vista Village Shopping Center Property:
| Tenant Summary | |||||||||
| Tenant Name | Moody’s/S&P/ Fitch Ratings | Tenant SF | Approx. % of Total SF | Annual UW Rent | % of Total Annual UW Rent | Annual UW Rent PSF | Lease Expiration | Renewal Options | Termination Options |
| Anchor Tenants | |||||||||
| Cinepolis | NR/NR/NR | 69,654 | 35.7% | $1,761,550 | 37.1% | $25.29 | 11/30/2023 | 5 x 5 Yrs | N/A |
| Frazier Farms | NR/NR/NR | 25,000 | 12.8% | $466,500 | 9.8% | $18.66 | 9/30/2025 | 4 x 5 Yrs | N/A |
| Junior Anchor Tenants | |||||||||
| Crunch Fitness | NR/NR/NR | 19,000 | 9.7% | $274,550 | 5.8% | $14.45 | 11/30/2025 | 2 x 5 Yrs | N/A |
| Pets Plus | NR/NR/NR | 10,477 | 5.4% | $122,266 | 2.6% | $11.67 | 9/30/2027 | 1 x 5 Yrs | N/A |
| Anchor Subtotal/Wtd. Avg. | 124,131 | 63.7% | $2,624,865 | 55.3% | $21.15 | ||||
| In-Line Tenants(1) | 60,591 | 31.1% | $2,125,542 | 44.7% | $35.08 | ||||
| Vacant Space | 10,287 | 5.3% | $0 | 0.0% | $0.00 | ||||
| Total/Wtd. Avg. | 195,009 | 100.0% | $4,750,407 | 100.0% | $25.72 | ||||
Information is based on the underwritten rent roll.
| (1) | In-Line Tenants includes 502 SF leased to San Diego County Sheriff for which no rent is collected. |
This is not a research report and was not prepared by any Underwriter’s research department. Please see additional important information and qualifications at the end of this Term Sheet.
T-84
| Retail - Anchored | Loan #7 | Cut-off Date Balance: | $44,000,000 | |
| 225, 307, 347, 401 Vista Village Drive | Vista Village Shopping Center | Cut-off Date LTV: | 64.1% | |
| & 15, 20, 25, 30, 35, 40 Main Street | U/W NCF DSCR: | 2.14x | ||
| Vista, CA 92083 | U/W NOI Debt Yield: | 10.1% |
The following table presents certain information relating to the lease rollover schedule at the Vista Village Shopping Center Property:
| Lease Rollover Schedule(1)(2) | ||||||||
| Year | # of Leases Rolling | SF Rolling | UW Rent PSF Rolling | Approx. % of Total SF Rolling | Approx. Cumulative % of SF Rolling | Total UW Rent Rolling | Approx. % of Total Rent Rolling | Approx. Cumulative % of Total Rent Rolling |
| MTM | 1 | 1,465 | $27.01 | 0.8% | 0.8% | 39,570 | 0.8% | 0.8% |
| 2019 | 1 | 5,042 | $30.00 | 2.6% | 3.3% | 151,260 | 3.2% | 4.0% |
| 2020 | 3 | 9,794 | $44.16 | 5.0% | 8.4% | 432,522 | 9.1% | 13.1% |
| 2021 | 5 | 9,992 | $33.28 | 5.1% | 13.5% | 332,521 | 7.0% | 20.1% |
| 2022 | 2 | 5,327 | $42.70 | 2.7% | 16.2% | 227,438 | 4.8% | 24.9% |
| 2023 | 6 | 79,768 | $26.20 | 40.9% | 57.1% | 2,089,865 | 44.0% | 68.9% |
| 2024 | 3 | 8,486 | $34.12 | 4.4% | 61.5% | 289,536 | 6.1% | 75.0% |
| 2025 | 3 | 45,300 | $17.68 | 23.2% | 84.7% | 800,850 | 16.9% | 91.9% |
| 2026 | 0 | 0 | $0.00 | 0.0% | 84.7% | 0 | 0.0% | 91.9% |
| 2027 | 1 | 10,477 | $11.67 | 5.4% | 90.1% | 122,266 | 2.6% | 94.4% |
| 2028 | 0 | 0 | $0.00 | 0.0% | 90.1% | 0 | 0.0% | 94.4% |
| 2029 | 2 | 8,569 | $30.88 | 4.4% | 94.5% | 264,580 | 5.6% | 100.0% |
| 2030 & Beyond(3) | 1 | 502 | $0.00 | 0.3% | 94.7% | 0 | 0.0% | 100.0% |
| Vacant | 0 | 10,287 | $0.00 | 5.3% | 100.0% | $0 | 0.0% | 100.0% |
| Total/Wtd. Avg. | 28 | 195,009 | $25.72(4) | 100.0% | $4,750,408 | 100.0% | ||
| (1) | Information is based on the underwritten rent roll. |
| (2) | Certain tenants may have lease termination options that are exercisable prior to the stated expiration date of the subject lease or leases which are not considered in the lease rollover schedule. |
| (3) | San Diego County Sheriff leases 502 SF through July 31, 2027 for which no rent is collected. |
| (4) | Wtd. Avg. UW Rent PSF Rolling excludes vacant space. |
The Market. The Vista Village Shopping Center Property is located in the City of Vista, an established community in North San Diego County, along the 15-mile State Route 78 (SR-78) corridor. The SR-78 corridor is the primary route for inland North County commuters accessing the coast, and vice versa, connecting Vista to nearby Carlsbad, Escondido, Oceanside and San Marcos.
According to the appraisal, the Vista Village Shopping Center Property is located within the Northwest County submarket of the San Diego retail market. As of year-end 2018, the submarket contained approximately 11.9 million SF of inventory, with a vacancy rate of 7.1% and average annual asking rents of $34.92 PSF. The Vista Village Shopping Center Property is considered by the appraiser to be a community shopping center. As of year-end 2018, community shopping centers in the Northwest County submarket totaled approximately 7.9 million SF of inventory, with a vacancy rate of 5.4% and average annual asking rents of $37.32 PSF.
According to the appraisal, the estimated 2018 population within a one-, three- and five-mile radius of the Vista Village Shopping Center Property was 25,467, 149,782 and 264,602, respectively. The 2018 average household income within the same radii was $69,412, $86,194 and $93,472, respectively. Within the three-mile trade area radius, population and average household income have grown at a compound annual rate of 0.7% and 2.3%, respectively, from 2000 to 2018. The three-mile trade area posted 2018 retail sales per household of $69,076.
This is not a research report and was not prepared by any Underwriter’s research department. Please see additional important information and qualifications at the end of this Term Sheet.
T-85
| Retail - Anchored | Loan #7 | Cut-off Date Balance: | $44,000,000 | |
| 225, 307, 347, 401 Vista Village Drive | Vista Village Shopping Center | Cut-off Date LTV: | 64.1% | |
| & 15, 20, 25, 30, 35, 40 Main Street | U/W NCF DSCR: | 2.14x | ||
| Vista, CA 92083 | U/W NOI Debt Yield: | 10.1% |
The following table presents competitive properties with respect to the Vista Village Shopping Center Property:
| Competitive Property Summary | |||||||
| Property, Address | Property Type | Year Built/ Renovated | Property Size / Anchor Ratio | Occupancy | Distance from Subject | Anchor Tenants | |
| Vista Village Shopping Center | Community Center | 2003 / N/A | 195,009 / 49%(1) | 94.7%(1) | N/A | Cinepolis, Frazier Farms | |
| Primary Competition | |||||||
Vista Town Center 500-550 Hacienda Drive Vista, CA | Neighborhood Center | 1977 / N/A | 149,259 / 49% | 97% | 0.4 miles | Food 4 Less, Petco | |
Vista Shopping Center 912-996 S Santa Fe Avenue Vista, CA | Neighborhood Center | 1972 / N/A | 129,163 / 54% | 94% | 0.8 miles | Vons, Trendy, Yardage Town
| |
Foothill Center 1211-1381 E Vista Way Vista, CA | Community Center | 1986 / N/A | 116,851 / 62% | 92% | 1.6 miles | Albertsons, Rite Aid | |
| Secondary Competition | |||||||
North County Square 1711-1990 University Drive Vista, CA | Power Center | 1994 / 2005 | 623,106 / 67% | 99% | 2.3 miles | Walmart, Target, Living Spaces, Old Navy, Ross | |
Palm Tree Plaza 3501-3555 Cannon Road Oceanside, CA | Neighborhood Center | 1991 / N/A | 98,262 / 60% | 91% | 1.8 miles | Ralphs, Walgreens | |
Source: Appraisal.
| (1) | Information obtained from the underwritten rent roll and does not include the non-collateral portion of the larger shopping center. |
The following table presents the appraiser’s market rent conclusions:
| Market Rent Summary | ||||
| Anchor | Junior Anchor | Inline | Pad | |
| Market Rent | $18-24 | $15-18 | $27-42 | $27-48 |
| Lease Term | 10.3 year | 10.3 year | 5.2 year | 7.2 year |
| Rental Increase Projection | 10.0% / 5 Yrs | 10.0% / 5 Yrs | 3.0% / Yr | 3.0% / Yr |
This is not a research report and was not prepared by any Underwriter’s research department. Please see additional important information and qualifications at the end of this Term Sheet.
T-86
| Retail - Anchored | Loan #7 | Cut-off Date Balance: | $44,000,000 | |
| 225, 307, 347, 401 Vista Village Drive | Vista Village Shopping Center | Cut-off Date LTV: | 64.1% | |
| & 15, 20, 25, 30, 35, 40 Main Street | U/W NCF DSCR: | 2.14x | ||
| Vista, CA 92083 | U/W NOI Debt Yield: | 10.1% |
Operating History and Underwritten Net Cash Flow.The following table presents certain information relating to the historical operating performance and Underwritten Net Cash Flow at the Vista Village Shopping Center Property:
| Cash Flow Analysis | ||||||
| 2015 | 2016 | 2017 | 2018 | UW | UW PSF | |
| Gross Potential Rent(1) | $3,966,980 | $4,189,012 | $4,323,074 | $4,461,573 | $5,129,214 | $26.30 |
| Reimbursements | $1,473,651 | $1,558,210 | $1,604,451 | $1,827,676 | $1,939,184 | $9.94 |
| Other Income | $10,360 | $11,377 | $12,324 | $11,766 | $0 | $0.00 |
| Vacancy and Concessions | $0 | $0 | $0 | $0 | ($488,701) | ($2.51) |
| Effective Gross Income | $5,450,991 | $5,758,599 | $5,939,849 | $6,301,015 | $6,579,697 | $33.74 |
| Taxes | $671,321 | $676,768 | $682,413 | $696,172 | $847,038 | $4.34 |
| Insurance | $119,218 | $113,834 | $112,842 | $116,821 | $116,820 | $0.60 |
| Other Operating Expenses | $1,036,080 | $1,091,135 | $1,107,433 | $1,181,517 | $1,164,354 | $5.97 |
| Total Operating Expenses | $1,826,619 | $1,881,737 | $1,902,688 | $1,994,510 | $2,128,212 | $10.91 |
| Net Operating Income | $3,624,372 | $3,876,862 | $4,037,161 | $4,306,505 | $4,451,485 | $22.83 |
| TI/LC | $0 | $0 | $0 | $0 | $239,005 | $1.23 |
| Capital Expenditures | $0 | $0 | $0 | $0 | $39,002 | $0.20 |
| Net Cash Flow | $3,624,372 | $3,876,862 | $4,037,161 | $4,306,505 | $4,173,478 | $21.40 |
| Occupancy % | 88.8% | 87.3% | 92.7% | 92.7% | 93.1% | |
| NOI DSCR | 1.85x | 1.98x | 2.07x | 2.20x | 2.28x | |
| NCF DSCR | 1.85x | 1.98x | 2.07x | 2.20x | 2.14x | |
| NOI Debt Yield | 8.2% | 8.8% | 9.2% | 9.8% | 10.1% | |
| NCF Debt Yield | 8.2% | 8.8% | 9.2% | 9.8% | 9.5% | |
| (1) | UW Gross Potential Rent is based on the February 15, 2019 rent roll, with rent steps taken through January 2020 of $302,828. |
Escrows and Reserves.
Taxes and Insurance Reserves.The Vista Village Shopping Center Borrower deposited $123,260 for property taxes and is required to reserve monthly 1/12th of the estimated property taxes (currently $61,630) and 1/12th of the estimated insurance premiums (unless waived due to a blanket policy in place).
Immediate Repairs.The Vista Village Shopping Center Borrower deposited $127,050 at loan origination for immediate repairs which amount is equal to 110% of the estimated cost for completion.
Replacement Reserve.The Vista Village Shopping Center Borrower deposited $500,000 at loan origination for replacement reserves and is required to reserve monthly $10,000 when the reserve balance is below $500,000.
Tenant Improvements and Leasing Commissions Reserve.The Vista Village Shopping Center Borrower deposited $500,000 at loan origination for tenant improvements and leasing commissions and is required to reserve monthly $16,251 when the reserve balance is below $500,000.
Landlord Obligations Reserve.The Vista Village Shopping Center Borrower deposited at loan origination $185,758 for outstanding tenant improvements and leasing commissions owed to Culichi Town ($159,463) and Wings N Things ($26,295).
Roof Replacement Reserve. On May 1, 2022, the Vista Village Shopping Center Borrower is required to deposit $826,000 to the Roof Replacement Reserve, which amount is equal to 100% of the estimated cost for completion. The required deposit will be reduced as determined by the lender to the extent that the Vista Village Shopping Center Borrower has completed and fully paid for any roof replacements without the use of any reserve funds prior to May 1, 2022.
Lockbox and Cash Management. The Vista Village Shopping Center Mortgage Loan documents require a soft lockbox with springing cash management upon the occurrence of a Cash Sweep Period (as defined below). During the continuance of a Cash Sweep Period, all funds in the lockbox account are required to be swept each business day to a lender-controlled cash management account and disbursed in accordance with the Vista Village Shopping Center Mortgage Loan documents. Also during a Cash Sweep Period, all excess cash flow is required to be held as additional security for the Vista Village Shopping Center Mortgage Loan.
A “Cash Sweep Period” will occur during (i) the debt service coverage ratio being less than 1.20x for two consecutive quarters (tested quarterly) until equal to or greater than 1.20x for two consecutive quarters (tested quarterly), (ii) a Cinepolis Trigger Event (as defined below) until cured or (iii) the Vista Village Shopping Center Borrower’s failure to make the required deposit to the Roof Replacement Reserve until the required deposit amount has accumulated through the collection of excess cash and has been transferred to the Roof Replacement Reserve.
A “Cinepolis Trigger Event” will occur during (i) a Cinepolis Credit Event (as defined below), (ii) a Cinepolis Lease Expiration Event (as defined below) or (iii) upon a Cinepolis payment default (after the expiration of any notice and cure periods). Any Cinepolis Trigger Event may be cured by a Cinepolis Re-Tenanting Event (as defined below).
This is not a research report and was not prepared by any Underwriter’s research department. Please see additional important information and qualifications at the end of this Term Sheet.
T-87
| Retail - Anchored | Loan #7 | Cut-off Date Balance: | $44,000,000 | |
| 225, 307, 347, 401 Vista Village Drive | Vista Village Shopping Center | Cut-off Date LTV: | 64.1% | |
| & 15, 20, 25, 30, 35, 40 Main Street | U/W NCF DSCR: | 2.14x | ||
| Vista, CA 92083 | U/W NOI Debt Yield: | 10.1% |
A “Cinepolis Credit Event” will occur when Cinepolis (or its lease guarantor) avails itself of any creditors��� rights laws or has any of its assets made subject to bankruptcy, until (i) the Cinepolis Lease is affirmed in bankruptcy without alteration of any material terms and Cinepolis is in occupancy, open for business and paying full, unabated rent or (ii) Cinepolis’ (or its lease guarantor’s) assets are no longer subject to bankruptcy and Cinepolis’ (or its lease guarantor’s) obligations under its lease are unaltered.
A “Cinepolis Lease Expiration Event” will occur when Cinepolis (i) vacates or gives notice to vacate, (ii) terminates or gives notice to terminate, or (iii) on the date that is 24 months prior to the expiration date of the Cinepolis lease (unless the Vista Village Shopping Center Borrower has deposited as cash or a letter of credit with the lender the amount of rent and reimbursements due under the Cinepolis lease for the succeeding twelve month period), until the date that Cinepolis has renewed its lease and is in occupancy, open for business and paying full, unabated rent.
A “Cinepolis Re-Tenanting Event” will occur when the Cinepolis leased space is re-leased to a replacement tenant (or tenants) acceptable to the lender and such replacement tenant (or tenants) is in occupancy, open for business and paying full, unabated rent.
Additional Secured Indebtedness (not including trade debts). Not permitted.
Mezzanine Loan and Preferred Equity.Not permitted.
Release of Property.Not permitted.
Right of First Refusal.None.
Ground Lease.The Vista Village Shopping Center Borrower has a ground lease with the City of Vista for an approximate 698 SF plot of vacant land at the corner of Vista Village Drive and State Route 78 used to display property signage. The ground lease commenced August 15, 2003 with an initial 20-year term and three ten-year renewal options plus one five-year renewal option. The annual ground rent due is $1.00.
Letter of Credit.None.
Terrorism Insurance.The Vista Village Shopping Center Borrower is required to obtain and maintain property insurance that covers perils of terrorism and acts of terrorism in an amount equal to the full replacement cost of the Vista Village Shopping Center Property and business interruption insurance for eighteen months with a six month extended period of indemnity. See “Risk Factors—Risks Relating to the Mortgage Loans—Terrorism Insurance May Not Be Available for All Mortgaged Properties” in the Preliminary Prospectus.
This is not a research report and was not prepared by any Underwriter’s research department. Please see additional important information and qualifications at the end of this Term Sheet.
T-88
(THIS PAGE INTENTIONALLY LEFT BLANK)
T-89
| Multifamily – High Rise | Loan #8 | Cut-off Date Balance: | $40,000,000 | |
| 1035 West Van Buren Street | Landmark West Loop | Cut-off Date LTV: | 28.7% | |
| Chicago, IL 60607 | U/W NCF DSCR: | 3.63x | ||
| U/W NOI Debt Yield: | 14.6% |

This is not a research report and was not prepared by any Underwriter’s research department. Please see additional important information and qualifications at the end of this Term Sheet.
T-90
| Multifamily – High Rise | Loan #8 | Cut-off Date Balance: | $40,000,000 | |
| 1035 West Van Buren Street | Landmark West Loop | Cut-off Date LTV: | 28.7% | |
| Chicago, IL 60607 | U/W NCF DSCR: | 3.63x | ||
| U/W NOI Debt Yield: | 14.6% |
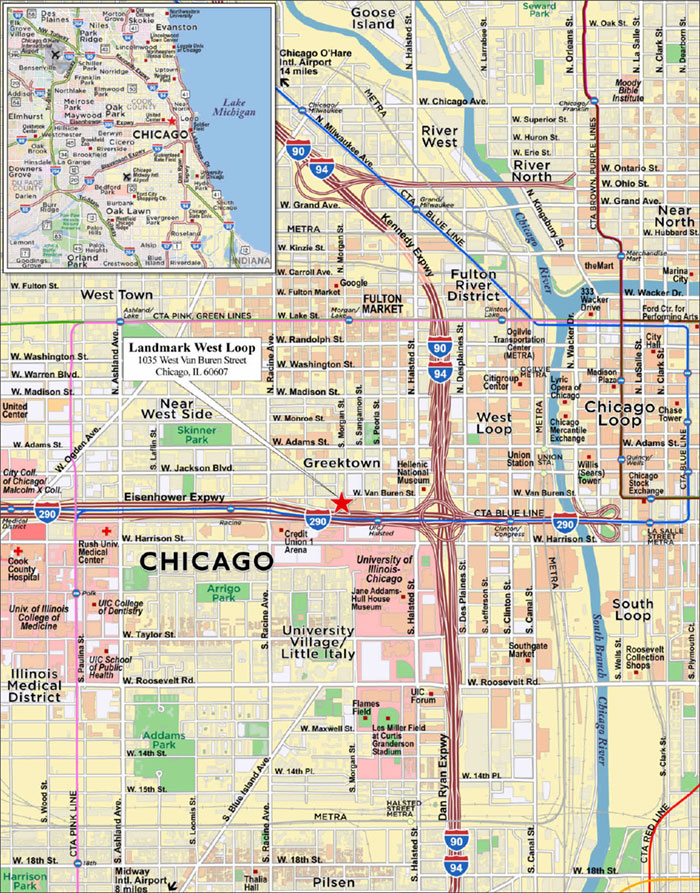
This is not a research report and was not prepared by any Underwriter’s research department. Please see additional important information and qualifications at the end of this Term Sheet.
T-91
| Mortgage Loan No. 8 – Landmark West Loop |
| Mortgage Loan Information | Mortgaged Property Information |
| Mortgage Loan Seller: | MSMCH | Single Asset/Portfolio: | Single Asset | |||
| Credit Assessment (KBRA/Fitch/S&P): | AA-/BBBsf/NR | Location: | Chicago, IL 60607 | |||
| Original Balance(1): | $40,000,000 | General Property Type: | Multifamily | |||
| Cut-off Date Balance(1): | $40,000,000 | Detailed Property Type: | High Rise | |||
| % of Initial Pool Balance: | 4.8% | Title Vesting: | Fee | |||
| Loan Purpose: | Refinance | Year Built/Renovated: | 2017/N/A | |||
| Sponsor: | GMS Finance LLC; The Related | Size(5): | 300 Units | |||
| Companies, L.P. | Cut-off Date Balance per Unit(1): | $133,333 | ||||
| Guarantor: | The Related Companies, L.P. | Maturity Date Balance per Unit(1): | $133,333 | |||
| Mortgage Rate(2): | 3.9200% | Property Manager: | Related Management Company, | |||
| Note Date: | 2/14/2019 | L.P. (borrower related) | ||||
| First Payment Date: | 4/5/2019 | |||||
| Maturity Date: | 3/5/2029 | |||||
| Original Term to Maturity: | 120 months | Underwritingand Financial Information | ||||
| Original Amortization Term: | 0 months | UW NOI: | $5,842,944 | |||
| IO Period: | 120 months | UW NOI Debt Yield(1): | 14.6% | |||
| Seasoning: | 1 month | UW NOI Debt Yield at Maturity(1): | 14.6% | |||
| Prepayment Provisions: | LO (25); DEF (90); O (5) | UW NCF DSCR(1): | 3.63x | |||
| Lockbox/Cash Mgmt Status: | Soft/In Place | Most Recent NOI: | $5,965,634 (12/31/2018 T-3 Ann.) | |||
| Additional Debt Type(1)(3): | Subordinate/Mezzanine | 2nd Most Recent NOI(6): | $5,550,887 (12/31/2018 T-6 Ann.) | |||
| Additional Debt Balance(1)(3): | $45,000,000/$20,000,000 | 3rd Most Recent NOI(6): | $3,150,170 (12/31/2018) | |||
| Future Debt Permitted (Type): | No (N/A) | Most Recent Occupancy: | 98.0% (2/12/2019) | |||
Reserves(4) | 2nd Most Recent Occupancy(6)(7): | 96.6% (12/1/2018 T-3 Ann.) | ||||
| Type | Initial | Monthly | Cap | 3rd Most Recent Occupancy(6)(7): | 96.2% (12/1/2018 T-6 Ann.) | |
| RE Tax: | $300,000 | $100,000 | N/A | Appraised Value (as of): | $139,500,000 (11/28/2018) | |
| Insurance: | $0 | Springing | N/A | Appraised Value per Unit: | $465,000 | |
| Recurring Replacements: | $0 | $5,131 | N/A | Cut-off Date LTV Ratio(1): | 28.7% | |
| TI/LC: | $0 | $875 | N/A | Maturity Date LTV Ratio(1): | 28.7% | |
| Sources and Uses | ||||||
| Sources | Proceeds | % of Total | Uses | Proceeds | % of Total | |
| Loan Amount: | $40,000,000 | 38.1% | Loan Payoff: | $92,093,474 | 87.7% | |
| Subordinate Companion Loan: | $45,000,000 | 42.9% | Return of Equity: | $11,922,518 | 11.4% | |
| Mezzanine Loan: | $20,000,000 | 19.0% | Closing Costs: | $684,008 | 0.7% | |
| Reserves: | $300,000 | 0.3% | ||||
| Total Sources: | $105,000,000 | 100.0% | Total Uses: | $105,000,000 | 100.0% | |
| (1) | The Landmark West Loop Mortgage Loan (as defined below) is part of the Landmark West Loop Whole Loan (as defined below), which is comprised of the Landmark West Loop Mortgage Loan evidenced by a senior promissory note with an original principal balance of $40,000,000 (the “Landmark West Loop Senior Loan”) and one subordinate loan evidenced by a subordinate promissory note with an original principal balance of $45,000,000 (the “Landmark West Loop Subordinate Companion Loan”). The Cut-off Date Balance per Unit, Maturity Date Balance per Unit, UW NOI Debt Yield, UW NOI Debt Yield at Maturity, UW NCF DSCR, Cut-off Date LTV Ratio and Maturity Date LTV Ratio numbers presented above are based on the Landmark West Loop Mortgage Loan. The Cut-off Date Balance per Unit, Maturity Date Balance per Unit, UW NOI Debt Yield, UW NOI Debt Yield at Maturity, UW NCF DSCR, Cut-off Date LTV Ratio and Maturity Date LTV Ratio numbers based on the Landmark West Loop Whole Loan are $283,333, $283,333, 6.9%, 6.9%,1.54x, 60.9% and 60.9%, respectively. The Landmark West Loop Whole Loan and the Landmark West Loop Mezzanine Loan (as defined below) together comprise the “Landmark West Loop Total Debt”. The Cut-off Date Balance per Unit, Maturity Date Balance per Unit, UW NOI Debt Yield, UW NOI Debt Yield at Maturity, UW NCF DSCR, Cut-off Date LTV Ratio and Maturity Date LTV Ratio numbers based on the Landmark West Loop Total Debt are $350,000, $350,000, 5.6%, 5.6%,1.11x, 75.3% and 75.3%, respectively. |
| (2) | Reflects the Landmark West Loop Mortgage Loan only. The Landmark West Loop Subordinate Companion Loan bears interest at the rate of 4.734%per annum. |
| (3) | See “Additional Secured Indebtedness (not including trade debts)” and “Mezzanine Loan and Preferred Equity” for further discussion of additional debt. |
| (4) | See “Escrows and Reserves” below for further discussion of reserve requirements. |
| (5) | The Landmark West Loop Property (as defined below) also includes 10,500 SF of retail space that is not included in the unit count of occupancy figures. The retail component is 100% vacant and is being marketed with an asking rent of $35.07 PSF, on a triple-net basis. |
| (6) | Historical occupancy and financial information prior to 2018 is not applicable as the Landmark West Loop Property (as defined below) was built in 2017. |
| (7) | 2nd Most Recent Occupancy and 3rd Most Recent Occupancy represent average occupancy for the period shown. Average occupancy for the year ended December 31, 2018 was 76.8%. |
The Mortgage Loan.The eighth largest mortgage loan (the “Landmark West Loop Mortgage Loan”) is part of a whole loan (the “Landmark West Loop Whole Loan”) in the original principal balance of $85,000,000. The Landmark West Loop Whole Loan is secured by a first priority fee mortgage encumbering a high rise multifamily property in the West Loop area of Chicago, Illinois (the “Landmark West Loop Property”). The Landmark West Loop Whole Loan is comprised of (i) the Landmark West Loop Mortgage Loan, evidenced by the senior promissory Note A with an original principal balance of $40,000,000 and (ii) the Landmark West Loop Subordinate Companion Loan, evidenced by the subordinate promissory Note B, with an original principal balance of $45,000,000. The proceeds of the Landmark West Loop Whole Loan, in addition to a mezzanine loan of $20,000,000, were used to refinance existing debt of approximately $92.1 million, return equity to the Landmark West Loop Borrower (as defined below), pay closing costs and fund reserves. The Landmark West Loop Whole Loan was originated by Morgan Stanley Bank, N.A. as to the Landmark West Loop Mortgage Loan and by Morgan Stanley Mortgage Capital Holdings LLC as to the Landmark West Loop Subordinate Companion Loan. The Landmark West Loop Whole Loan will be
This is not a research report and was not prepared by any Underwriter’s research department. Please see additional important information and qualifications at the end of this Term Sheet.
T-92
| Multifamily – High Rise | Loan #8 | Cut-off Date Balance: | $40,000,000 | |
| 1035 West Van Buren Street | Landmark West Loop | Cut-off Date LTV: | 28.7% | |
| Chicago, IL 60607 | U/W NCF DSCR: | 3.63x | ||
| U/W NOI Debt Yield: | 14.6% |
serviced under the Pooling and Servicing Agreement for the BANK 2019-BNK17 securitization transaction. See “Description of the Mortgage Pool—The Whole Loans—The Landmark West Loop A/B Whole Loan” and “Pooling and Servicing Agreement” in the Preliminary Prospectus.
Landmark West Loop Whole Loan Summary | ||||
Notes | Original Balance | Cut-off Date Balance | Note Holder | Lead Servicing Interest |
| A | $40,000,000 | $40,000,000 | BANK 2019-BNK17 | Yes(1) |
| B | $45,000,000 | $45,000,000 | Morgan Stanley Mortgage Capital Holdings LLC | No(1) |
| Total | $85,000,000 | $85,000,000 | ||
| (1) | The holder of the Subordinate Companion Loan will have the right to appoint the special servicer of the Landmark West Loop Whole Loan and to direct certain decisions with respect to the Landmark West Loop Whole Loan, unless a control appraisal event exists under the related co-lender agreement. |
The Borrower and the Sponsor. The borrower is 1035 Van Buren, L.L.C. (the “Landmark West Loop Borrower”), a Delaware limited liability company and single purpose entity with two independent directors in its organizational structure. The borrower sponsor and non-recourse carveout guarantor of the Landmark West Loop Whole Loan is The Related Companies, L.P. (“Related”). The Landmark West Loop Borrower is owned by Related and GMS Finance LLC (“GMS”). Headquartered in New York City, Related is a real estate developer, investor, advisor and property manager with a portfolio of real estate assets made up of mixed use, residential, retail and office properties. As a part of the Sirazi Family Office, GMS INVESTMENTS, L.P. was formed as a limited partnership, which is owned by Semir D. Sirazi Revocable Trust as the general partner and Semir D. Sirazi Irrevocable Trust as the limited partner. Semir D. Sirazi has managed the Sirazi Family Office for over 20 years. His commercial real estate portfolio consists of retail property, a parking lot and over 3 acres of undeveloped land.
The Property.The Landmark West Loop Property is a 31- story, Class A, multifamily tower totaling 300 units located in Chicago, Illinois, within the West Loop neighborhood of Chicago, Illinois. The Landmark West Loop Property was built in 2017. As of February 12th, 2019, the Landmark West Loop Property was 97.3% leased. Amenities at the Landmark West Loop Property include a 24-hour concierge, multi-story lobby, dry cleaners, library-styled co-working space, pet spa, yoga studio, high-end fitness center, game room, sundeck with a swimming pool and a hot tub, indoor and outdoor kitchen stations and resident lounge area. The Landmark West Loop Property features 334 parking spaces in a garage for residents for a monthly fee as well as a secure bicycle storage room. Additionally, the Landmark West Loop Property includes approximately 10,500 SF of ground floor retail space that is currently vacant and being marketed, with an asking rent of $35.07 PSF on a triple-net basis.
The following table presents certain information relating to the unit mix at the Landmark West Loop Property:
| Unit Mix | |||||||
| Type | Units | Occupied Units | % Occupied | Average SF per Unit | Total SF | Monthly Average Rent per Unit | Monthly Market Rent per Unit |
| Studio | 84 | 82 | 97.6% | 521 | 43,722 | $1,877 | $1,875 |
| One-Bedroom | 147 | 147 | 100.0% | 726 | 106,722 | $2,449 | $2,450 |
| Two-Bedroom | 65 | 62 | 95.4% | 1,117 | 72,629 | $3,559 | $3,554 |
| Three-Bedroom | 4 | 3 | 75.0% | 1,936 | 7,744 | $6,683 | $6,738 |
| Total/Wtd. Avg. | 300 | 294 | 98.0% | 769 | 230,817 | $2,567 | $2,585 |
Source:Borrower rent roll dated February 12, 2018 and appraisal.
The Market.The Landmark West Loop Property is located in Chicago, Illinois, within the West Loop neighborhood. The Landmark West Loop Property is in close proximity to the Illinois Medical district, the University of Illinois at Chicago, and major employer headquarters and offices including, Google, Hillshire Brands, McDonalds, JPMorgan Chase, Uber and Twitter. The West Loop submarket is located just blocks away from Chicago’s popular restaurants and night life destinations, making it a culturally active area of the city. According to the appraisal, a new CTA train station has been added at Morgan Street and Lake Street, in addition to the train station located at Halsted Street, just a three minute walk from the Landmark West Loop Property.
According to the appraisal, the Landmark West Loop Property is in the City West Multifamily submarket of the Downtown Chicago Multifamily Market. As of the second quarter of 2018, the City West Multifamily submarket had an average vacancy of 12.3% and average asking rents of $1,538 per unit. As of the second quarter of 2018, the Downtown Chicago Multifamily Market had an average vacancy of 4.9% and average asking rents of $1,392 per unit.
The estimated 2018 population within a one-, three- and five-mile radius of the Landmark West Loop Property is 42,833, 434,903 and 918,523, respectively, according to the appraisal. The estimated 2018 average household income within a one-, three- and five-mile radius of the Landmark West Loop Property is $90,509, $74,136, and $60,775, respectively, according to the appraisal.
This is not a research report and was not prepared by any Underwriter’s research department. Please see additional important information and qualifications at the end of this Term Sheet.
T-93
| Multifamily – High Rise | Loan #8 | Cut-off Date Balance: | $40,000,000 | |
| 1035 West Van Buren Street | Landmark West Loop | Cut-off Date LTV: | 28.7% | |
| Chicago, IL 60607 | U/W NCF DSCR: | 3.63x | ||
| U/W NOI Debt Yield: | 14.6% |
The following table presents certain information relating to the appraisal’s market rent conclusion for the Landmark West Loop Property:
| Market Rent Summary | |||||||
| Unit Type | Total Units | Average Size | Market Rent/SF | Avg Monthly Contract Rent per Unit | Avg Monthly Asking Rent per Unit | Avg Monthly Market Rent per Unit | |
| Studio | 84 | 521 | $3.60 | $1,884 | $1,881 | $1,875 | |
| 1BD/1BA | 147 | 726 | $3.37 | $2,451 | $2,452 | $2,450 | |
| 2BD/1BA | 21 | 946 | $3.21 | $3,040 | $3,044 | $3,040 | |
| 2BD/2BA | 44 | 1,197 | $3.17 | $3,801 | $3,795 | $3,800 | |
| PH 3BD/2.5BA | 3 | 1,928 | $3.51 | $6,762 | $6,713 | $6,775 | |
| PH 3BD/3BA | 1 | 1,960 | $3.38 | $6,625 | $6,625 | $6,625 | |
Source: Appraisal
The following table presents certain information relating to comparable rental properties to the Landmark West Loop Property:
| Comparable Rental Summary | |||||||
| Property | Year Built | # of Stories | # Units | Unit Mix | Average SF per Unit | Market Rent per SF | Average Market Rent per Unit |
| Landmark West Loop | 2017 | 31 | 300 | 0BR 1BR/1BA 2BR/1BA 2BR/2BA 3BR/2.5BA 3BR/3BA | 521 726 946 1,197 1,928 1,960 | $3.60 $3.37 $3.21 $3.17 $3.51 $3.38 | $1,875 $2,450 $3,040 $3,800 $6,775 $6,625 |
| Jeff Jack | 2015 | 15 | 229 | 0BR 1BR/1BA 2BR/1BA 2BR/2BA 3BR/2.5BA 3BR/3BA | 497 728 N/A 1,072 N/A N/A | $3.82 $3.14 N/A $3.12 N/A N/A | $1,898 $2,287 N/A $3,340 N/A N/A |
| Arkadia Tower | 2015 | 33 | 350 | 0BR 1BR/1BA 2BR/1BA 2BR/2BA 3BR/2BA 3BR/3BA | 525 699 N/A 1,094 1,500 N/A | $3.44 $3.14 N/A $3.10 $4.22 N/A | $1,804 $2,197 $N/A $3,395 6,337 N/A |
| Madison at Racine | 2014 | 9 | 216 | 0BR 1BR/1BA 2BR/1BA 2BR/2BA 3BR/2.5BA 3BR/3BA | 606 723 N/A 1,196 N/A N/A | $3.61 $3.28 N/A $2.99 N/A N/A | $2,186 $2.371 N/A $3,572 N/A N/A |
| Circa 922 | 2015 | 10 | 149 | 0BR 1BR/1BA 2BR/1BA 2BR/2BA 3BR/2BA 3BR/3BA | 563 694 N/A 1,056 1,616 N/A | $3.29 $3.60 N/A $3.18 $3.72 N/A | $1,854 $2,500 N/A $3,362 $6,042 N/A |
| Gateway West Loop | 2015 | 17 | 167 | 0BR 1BR/1BA 2BR/1BA 2BR/2BA 3BR/2.5BA 3BR/3BA | 435 679 N/A 1,139 N/A N/A | $4.46 $3.64 N/A $3.07 N/A N/A | $1,939 $2,474 N/A $3,492 N/A N/A |
| The Parker | 2016 | 29 | 227 | 0BR 1BR/1BA 2BR/1BA 2BR/2BA 3BR/2BA 3BR/3BA | 522 758 N/A 1,084 1,501 N/A | $3.75 $3.61 N/A $3.15 $3.13 N/A | $1,960 $2,733 N/A $3,418 $4,693 N/A |
| Catalyst Apartments | 2014 | 15 | 223 | 0BR 1BR/1BA 2BR/1BA 2BR/2BA 3BR/2BA 3BR/3BA | 594 785 N/A 1,117 1,570 N/A | $3.74 $3.25 N/A $3.24 $2.82 N/A | $2,220 $2,554 N/A $3,616 $4,434 N/A |
| EMME Chicago | 2017 | 14 | 199 | 0BR 1BR/1BA 2BR/1BA 2BR/2BA 3BR/2.5BA 3BR/3BA | 478 622 N/A 941 N/A N/A | $5.00 $4.28 N/A $3.87 N/A N/A | $2,390 $2,664 N/A $3,640 N/A N/A |
This is not a research report and was not prepared by any Underwriter’s research department. Please see additional important information and qualifications at the end of this Term Sheet.
T-94
| Multifamily – High Rise | Loan #8 | Cut-off Date Balance: | $40,000,000 | |
| 1035 West Van Buren Street | Landmark West Loop | Cut-off Date LTV: | 28.7% | |
| Chicago, IL 60607 | U/W NCF DSCR: | 3.63x | ||
| U/W NOI Debt Yield: | 14.6% |
Operating History and Underwritten Net Cash Flow. The following table presents certain information relating to the historical operating performance and Underwritten Net Cash Flow at the Landmark West Loop Property.
| Cash Flow Analysis(1) | |||||
| 12/31/2018 | 12/31/2018 T-6 Ann. | 12/31/2018 T-3 Ann. | UW | UW per unit | |
| Base Rent | $9,298,973 | $9,341,782 | $9,328,061 | $9,338,640 | $31,128.80 |
| Total Recoveries | $0 | $0 | $0 | $0 | $0.00 |
| Other Income | $1,036,789 | $1,404,682 | $1,466,600 | $1,267,196 | $4,223.99 |
| Less Vacancy & Credit Loss | ($2,158,053) | ($357,234) | ($315,542) | ($466,932) | ($1,556.44) |
| Effective Gross Income | $7,385,752 | $9,696,375 | $10,259,894 | $10,138,904 | $33,796.35 |
| Real Estate Taxes | $1,156,700 | $1,156,700 | $1,156,700 | $1,197,000 | $3,990.00 |
| Insurance | $206,927 | $95,946 | $139,335 | $144,159 | $480.53 |
| Other Expenses | $2,871,955 | $2,892,842 | $2,998,225 | $2,954,801 | $9,849.34 |
| Total Expenses | $4,235,582 | $4,145,488 | $4,294,259 | $4,295,960 | $14,319.87 |
| Net Operating Income | $3,150,170 | $5,550,887 | $5,965,634 | $5,842,944 | $19,476.48 |
| Capital Expenditures | $262,306 | $114,538 | $170,505 | $75,000 | $250.00 |
| TI/LC | $0 | $0 | $0 | $0 | $0.00 |
| Net Cash Flow | $2,887,864 | $5,436,350 | $5,795,129 | $5,767,944 | $19,226.48 |
| Occupancy %(2) | 76.8% | 96.2% | 98.0% | 95.0% | |
| NOI DSCR(3) | 1.98x | 3.49x | 3.75x | 3.68x | |
| NCF DSCR(3) | 1.82x | 3.42x | 3.65x | 3.63x | |
| NOI Debt Yield(3) | 7.90% | 13.9% | 14.90% | 14.6% | |
| NCF Debt Yield(3) | 7.20% | 13.6% | 14.50% | 14.4% | |
| (1) | Financial information prior to the year ending December 31, 2018 is not available because the Landmark West Loop Property was constructed in 2017. |
| (2) | 12/31/2018 and 12/31/2018 T-6 Ann. Occupancy % is the average occupancy for the period shown. 12/31/2018 T-3 Ann. Occupancy % is as of the borrower rent roll dated February 12, 2019. |
| (3) | The debt service coverage ratios and debt yields are based on the Landmark West Loop Senior Loan, and exclude the Landmark West Loop Subordinate Companion Loan. |
Escrows and Reserves.
Real Estate Taxes – The Landmark West Loop Whole Loan documents provide for an upfront real estate tax reserve of $300,000 and an ongoing monthly real estate tax reserve in an amount equal to 1/12th of the annual estimated real estate taxes (initially $100,000).
Insurance – The Landmark West Loop Whole Loan documents provide for an insurance reserve in a monthly amount equal to 1/12 of the annual estimated insurance premiums (unless (a) no event of default has occurred and is continuing, (b) the Landmark West Loop Borrower maintains a blanket policy which complies with the requirements under the Landmark West Loop Whole Loan documents and (c) the Landmark West Loop Borrower provides the lender with evidence that the insurance premiums payable in connection therewith have been prepaid at least one year in advance (or, for the period of coverage under the related policies)).
Replacement Reserve - The Landmark West Loop Whole Loan documents provide for a monthly capital expenditure reserve of $5,131.
Rollover Reserve - The Landmark West Loop Whole Loan documents provide for a monthly rollover reserve of $875.
Lockbox and Cash Management. The Landmark West Loop Whole Loan is structured with a soft lockbox with respect to residential tenants and a hard lockbox with respect to any Landmark West Loop Property non-residential tenants. The Landmark West Loop Whole Loan has in place cash management. The Landmark West Loop Borrower and property manager are required to deposit all rents into the lockbox account within two business days of receipt. All funds in the lockbox account are required to be swept on each business day to a cash management account controlled by the lender, and applied, provided that no event of default is continuing under the Landmark West Loop Whole Loan, on each monthly payment date to fund the required tax and insurance reserves deposits as described above under “Escrows and Reserves”, to pay debt service on the Landmark West Loop Whole Loan, to fund the required capital expenditures and rollover reserves deposits as described above under “Escrows and Reserves”, to pay monthly operating expenses referenced in the lender-approved annual budget and extraordinary expenses approved by the lender, to pay debt service on the Landmark West Loop Mezzanine Loan (as defined below), and to disburse the remainder (i) if a Cash Sweep Period (as defined below) is then in effect, to be deposited into an excess cash flow sweep account to be held as additional collateral for the Landmark West Loop Whole Loan during the continuance of such Cash Sweep Period (upon the termination of any Cash Sweep Period, provided that no event of default has occurred and is continuing, all amounts then on deposit in the excess cash flow sweep account are required to be disbursed to the Landmark West Loop Mezzanine Lender (as defined below), if the Landmark West Loop Mezzanine Loan is outstanding, and if not, to the Landmark West Loop Borrower); and (ii) if no Cash Sweep Period is then continuing, (x) if the Landmark West Loop Mezzanine Loan (or any portion thereof) is outstanding, into an account designated by the Landmark West Loop Mezzanine Lender and (y) if the Landmark West Loop Mezzanine Loan has been paid in full, to the Landmark West Loop Borrower.
This is not a research report and was not prepared by any Underwriter’s research department. Please see additional important information and qualifications at the end of this Term Sheet.
T-95
| Multifamily – High Rise | Loan #8 | Cut-off Date Balance: | $40,000,000 | |
| 1035 West Van Buren Street | Landmark West Loop | Cut-off Date LTV: | 28.7% | |
| Chicago, IL 60607 | U/W NCF DSCR: | 3.63x | ||
| U/W NOI Debt Yield: | 14.6% |
A “Cash Sweep Period” means the period:
(i) commencing upon an event of default under the Landmark West Loop Whole Loan and ending if the lender, in its sole discretion, accepts a cure of such event of default; or
(ii) commencing six months after the loan origination date (which loan origination date was February 14, 2019), the failure by the Landmark West Loop Borrower, after the end of a calendar quarter, to maintain the debt service coverage ratio (based on the actual interest-only payments due under both the Landmark West Loop Whole Loan and Landmark West Loop Mezzanine Loan and on the trailing twelve months, or for the first year following the origination date, the trailing three months, net operating income) of at least 1.10x and ending upon the date such debt service coverage ratio (based on the same basis) has been at least equal to 1.15x for six consecutive months; or
(iii) commencing upon an event of default under the Landmark West Loop Mezzanine Loan and ending upon receipt of notice by the lender from the Landmark West Loop Mezzanine Lender that such event of default has been cured or waived.
Additional Secured Indebtedness (not including trade debts). In addition to the Landmark West Loop Mortgage Loan, the Landmark West Loop Property also secures the Landmark West Loop Subordinate Companion Loan which has a Cut-off Date principal balance of $45,000,000. The Landmark West Loop Subordinate Companion Loan accrues interest at the rate of 4.7340%per annum. The Landmark West Loop Mortgage Loan is generally senior in right of payment to the Landmark West Loop Subordinate Companion Loan; however, if no event of default exists, the Landmark West Loop Senior Loan and Landmark West Loop Subordinate Companion Loan receive interest pro rata, prior to any application of principal to the Landmark West Loop Senior Loan. The holders of the Landmark West Loop Mortgage Loan and the Landmark West Loop Subordinate Companion Loan have entered into a co-lender agreement which sets forth the allocation of collections on the Landmark West Loop Whole Loan. See “Description of the Mortgage Pool—The Whole Loans—The Landmark West Loop A/B Whole Loan” in the Preliminary Prospectus.
Mezzanine Loan and Preferred Equity.Morgan Stanley Mortgage Capital Holdings LLC (in such capacity, the “Landmark West Loop Mezzanine Lender”) made a $20,000,000 mezzanine loan (the “Landmark West Loop Mezzanine Loan”) to 1035 Van Buren Holdings, L.L.C. on the loan origination date, secured by 100% of the equity interest in the Landmark West Loop Borrower. The Landmark West Loop Mezzanine Loan accrues interest at a rate of 7.2340%per annum, provides for interest-only payments until its maturity date, and is coterminous with the Landmark West Loop Whole Loan. The lender and the Landmark West Loop Mezzanine Lender have entered into an intercreditor agreement. The Landmark West Loop Mezzanine Loan has been sold to a third party investor.
The Landmark West Loop Total Debt is summarized in the following table.
| Landmark West Loop Total Debt Summary | |||||
| Note | Original Balance | Interest Rate | Cumulative UW NCF DSCR | Cumulative UW NOI Debt Yield | Cumulative Cut-off Date LTV |
| Senior Loan | $40,000,000 | 3.9200% | 3.63x | 14.6% | 28.7% |
| Junior Loan | $45,000,000 | 4.7340% | 1.54x | 6.9% | 60.9% |
| Mezzanine Loan | $20,000,000 | 7.2340% | 1.11x | 5.6% | 75.3% |
| Total Debt | $105,000,000 | 4.9001% | 1.11x | 5.6% | 75.3% |
Release of Property. Not Permitted.
Right of First Refusal.None.
Letter of Credit. None.
Terrorism Insurance. The Landmark West Loop Borrower is required to obtain “all risk” property insurance covering perils of terrorism and acts of terrorism in an amount equal to the greater of (A) 100% of the then replacement cost of the improvements without deduction for physical depreciation and (B) such amount as is necessary so that the insurer would not deem the Landmark West Loop Borrower a co-insurer under such policies, together with eighteen months of business income/loss insurance, to the extent such policies are commercially available. Notwithstanding the foregoing, if the Terrorism Risk Insurance Program Reauthorization Act of 2015 (or any subsequent statute, extension, or reauthorization) (“TRIPRA”), is no longer in existence, the Landmark West Loop Borrower will not be required to pay in respect to terrorism coverage an amount greater than 200% of the insurance premium (without giving effect to the cost of the terrorism, flood, earthquake and windstorm components) that is payable at such time on a stand-alone basis in respect of the Landmark West Loop Property and business interruption/rental loss insurance required under the Landmark West Loop Mortgage Loan documents (excluding the cost of terrorism coverage). See“Risk Factors—Risks Relating to the Mortgage Loans—Terrorism Insurance May Not Be Available for All Mortgaged Properties”in the Preliminary Prospectus.
This is not a research report and was not prepared by any Underwriter’s research department. Please see additional important information and qualifications at the end of this Term Sheet.
T-96
(THIS PAGE INTENTIONALLY LEFT BLANK)
T-97
| Multifamily - Cooperative | Loan #9 | Cut-off Date Balance: | $27,916,043 | |
| 400, 414, 424, 434 East 52 Street, | Southgate Owners Corp | Cut-off Date LTV: | 5.1% | |
| 433 East 51 Street | U/W NCF DSCR: | 10.28x | ||
| New York, NY 10022 | U/W NOI Debt Yield: | 59.4% |
This is not a research report and was not prepared by any Underwriter’s research department. Please see additional important information and qualifications at the end of this Term Sheet.
T-98
| Multifamily - Cooperative | Loan #9 | Cut-off Date Balance: | $27,916,043 | |
| 400, 414, 424, 434 East 52 Street, | Southgate Owners Corp | Cut-off Date LTV: | 5.1% | |
| 433 East 51 Street | U/W NCF DSCR: | 10.28x | ||
| New York, NY 10022 | U/W NOI Debt Yield: | 59.4% |
This is not a research report and was not prepared by any Underwriter’s research department. Please see additional important information and qualifications at the end of this Term Sheet.
T-99
| Mortgage Loan No. 9 – Southgate Owners Corp |
| Mortgage Loan Information | Mortgaged Property Information |
| Mortgage Loan Seller: | MSMCH | Single Asset/Portfolio: | Single Asset | ||||
| Credit Assessment (KBRA/Fitch/S&P): | AAA/AAAsf/NR | Location: | New York, NY 10022 | ||||
| Original Balance: | $28,000,000 | General Property Type: | Multifamily | ||||
| Cut-off Date Balance: | $27,916,043 | Detailed Property Type: | Cooperative | ||||
| % of Initial Pool Balance: | 3.4% | Title Vesting: | Fee | ||||
| Loan Purpose: | Refinance | Year Built/Renovated: | 1930/N/A | ||||
| Sponsor(1): | N/A | Size: | 402 Units | ||||
| Guarantor(1): | N/A | Cut-off Date Balance per Unit: | $69,443 | ||||
| Mortgage Rate: | 4.0000% | Maturity Date Balance per Unit: | $55,467 | ||||
| Note Date: | 1/2/2019 | Property Manager: | FirstService Residential New York, Inc. | ||||
| First Payment Date: | 3/1/2019 | Underwriting and Financial Information | |||||
| Maturity Date: | 2/1/2029 | UW NOI(4): | $16,594,171 | ||||
| Original Term to Maturity: | 120 months | UW NOI Debt Yield(4): | 59.4% | ||||
| Original Amortization Term: | 360 months | UW NOI Debt Yield at Maturity(4): | 74.4% | ||||
| IO Period: | 0 months | UW NCF DSCR(4): | 10.28x | ||||
| Seasoning: | 2 months | Most Recent NOI(5): | N/A | ||||
| Prepayment Provisions: | LO (26); DEF (90); O (4) | 2nd Most Recent NOI(5): | N/A | ||||
| Lockbox/Cash Mgmt Status: | None | 3rd Most Recent NOI(5): | N/A | ||||
| Additional Debt Type: | N/A | Most Recent Occupancy(6): | N/A | ||||
| Additional Debt Balance: | N/A | 2nd Most Recent Occupancy(6): | N/A | ||||
| Future Debt Permitted (Type)(2): | Yes (Subordinate Secured) | 3rd Most Recent Occupancy(6): | N/A | ||||
| Reserves(3) | Appraised Value (as of)(7): | $551,000,000 (10/31/2018) | |||||
| Type | Initial | Monthly | Cap | Appraised Value per Unit: | $1,370,647 | ||
| RE Tax: | $763,264 | $381,632 | N/A | Cut-off Date LTV Ratio(8): | 5.1% | ||
| Insurance: | $119,048 | $14,881 | N/A | Maturity Date LTV Ratio(7): | 4.0% | ||
| Coop-Rental Value(8): | $495,000,000 (10/31/2018) | ||||||
| Coop-Rental Value per Unit: | $1,231,343 | ||||||
| Coop-LTV as Rental(8): | 5.6% | ||||||
| Sourcesand Uses | ||||||
| Sources | Proceeds | % of Total | Uses | Proceeds | % of Total | |
| Loan Amount: | $28,000,000 | 98.5% | Loan Payoff: | $27,345,125 | 96.2% | |
| Borrower Equity: | $417,761 | 1.5% | Reserves: | $882,312 | 3.1% | |
| Closing Costs: | $190,324 | 0.7% | ||||
| Total Sources: | $28,417,761 | 100.0% | Total Uses: | $28,417,761 | 100.0% | |
| (1) | The Southgate Owners Corp Property (as defined below) is owned by the Southgate Owners Corp Borrower (as defined below), which is a cooperative housing corporation. No individual or entity (other than the Southgate Owners Corp Borrower) has recourse obligations with respect to the Southgate Owners Corp Mortgage Loan (as defined below), including pursuant to any guaranty or environmental indemnity. |
| (2) | See “Additional Secured Indebtedness (not including trade debts)” for information regarding the future permitted subordinate debt. |
| (3) | See “Escrows and Reserves” below for further discussion of reserve requirements. |
| (4) | See “Underwritten Net Cash Flow” section. |
| (5) | Most Recent NOI, 2nd Most Recent NOI and 3rd Most Recent NOI are not available. Residential cooperatives are not-for-profit entities that set maintenance fees to cover current expenses and plan for future capital needs. A residential cooperative can increase or decrease maintenance fees according to its anticipated expenses and level of cash reserves. The historical NOI figures are not representative of the cash flow generated by the Southgate Owners Corp Property if it were operated as a multifamily rental property. |
| (6) | Occupancy is not reported as all residential units are owned by tenant-shareholders or the original cooperative sponsor. |
| (7) | For purposes of determining the Appraised Value, the Cut-off Date LTV Ratio and the Maturity Date LTV Ratio, the value estimate reflected in the appraisal of the Southgate Owners Corp Property is determined as if such residential cooperative property is operated as a residential cooperative and, in general, such value equals the sum of (i) the gross sellout value of all cooperative units in such residential cooperative property, based in part on various comparable sales of cooperative apartment units in the market, plus (ii) the amount of the underlying debt encumbering such residential cooperative property. |
| (8) | The Coop-Rental Value and the Coop-LTV as Rental assumes the Southgate Owners Corp Property is operated as a multifamily rental property. |
The Mortgage Loan.The ninth largest mortgage loan (the “Southgate Owners Corp Mortgage Loan”) is evidenced by a promissory note in the original principal amount of $28,000,000 and secured by a first priority fee mortgage encumbering a cooperative apartment complex comprised of 402 units across five buildings, located in New York, New York (the “Southgate Owners Corp Property”). The proceeds of the Southgate Owners Corp Mortgage Loan were used to refinance existing debt, pay closing costs and fund reserves.
The Borrower. The borrower is Southgate Owners Corp., a cooperative housing corporation organized under the laws of the State of New York (the “Southgate Owners Corp Borrower”). The Southgate Owners Corp Property is owned in fee simple by the Southgate Owners Corp Borrower. No individual or entity (other than the Southgate Owners Corp Borrower) has recourse obligations with respect to the Southgate Owners Corp Mortgage Loan, including pursuant to any guaranty or environmental indemnity.
This is not a research report and was not prepared by any Underwriter’s research department. Please see additional important information and qualifications at the end of this Term Sheet.
T-100
| Multifamily - Cooperative | Loan #9 | Cut-off Date Balance: | $27,916,043 | |
| 400, 414, 424, 434 East 52 Street, | Southgate Owners Corp | Cut-off Date LTV: | 5.1% | |
| 433 East 51 Street | U/W NCF DSCR: | 10.28x | ||
| New York, NY 10022 | U/W NOI Debt Yield: | 59.4% |
The Property.The Southgate Owners Corp Property is a cooperative apartment complex consisting of 402 residential units, situated within five buildings, located in New York, New York. The Southgate Owners Corp Property was constructed in 1930 and converted into a cooperative in 1986 and totals 549,997 gross SF with 402 residential units, of which 21 remain sponsor-owned, and one retail suite. Currently, 17 of the sponsor-owned units are rented at below-market rates to rent controlled or rent stabilized tenants, and the remaining sponsor owned units are rented at market rates. Amenities at the Southgate Owners Corp Property include a 24-hour doorman, laundry room, storage, as well as a landscaped courtyard with seating areas behind the buildings that certain tenants can access. Some units have access to private outdoor terraces. Historical capital expenditures since 2014 totaled approximately $5.7 million and include facade restoration and roof work, as well as upgrades to the LED lighting and heat timer systems, and replacements of steam traps, compactors, and boiler vacuums. The 1,000 SF retail suite has frontage on First Avenue and is subject to a master lease with Classic Retail Equities LLC through November 2035, with an annual rent of $81,600. Classic Retail Equities LLC has entered into a sublease, dated November 14, 2003, for the entire retail portion to Zeze Choice Flowers Inc.
The table below shows the apartment unit mix at the Southgate Owners Corp Property:
| Unit Mix | ||||||
| Unit Type | Units | % of Total Units | Sponsor Owned Units | Average SF per Unit | Total SF | Market Rent(1) |
| Studio | 67 | 16.7% | 4 | 632 | 42,375 | $4,200 |
| 1 Bedroom | 175 | 43.5% | 9 | 923 | 161,513 | $6,200 |
| 2 Bedroom | 98 | 24.4% | 7 | 1,202 | 117,784 | $8,000 |
| 3 Bedroom | 23 | 5.7% | 1 | 1,501 | 34,523 | $10,000 |
| 4 Bedroom | 15 | 3.7% | 0 | 1,904 | 28,566 | $12,700 |
| 5 Bedroom | 21 | 5.2% | 0 | 2,185 | 45,895 | $14,600 |
| 6 Bedroom | 3 | 0.7% | 0 | 3,114 | 9,341 | $20,800 |
| Total/Wtd. Avg. | 402 | 100.0% | 21 | 1,094 | 439,997 | $7,313 |
Source: Appraisal
| (1) | Market rent assumes units are not rent restricted. However, all or substantially all of the cooperative units at the Southgate Owners Corp Property were rent controlled or rent stabilized prior to the cooperative conversion and accordingly would again be subject to such rent restrictions if the Southgate Owners Corp Property were operated as a multifamily rental property. See“Risk Factors-Risks Relating to the Mortgage Loans-Residential Cooperative Properties Have Special Risks.” |
The Market.The Southgate Owners Corp Property is located in the Midtown Manhattan neighborhood of Turtle Bay, just one block south of the Sutton Place neighborhood. Midtown includes a wide variety of office, retail, and residential amenities, as well as transportation access. Midtown includes many landmarks and attractions, such as Rockefeller Center, Radio City Music Hall, Carnegie Hall, Central Park, Lincoln Center, Grand Central Terminal, the Chrysler Building, the Empire State building, the United Nations, and St. Patrick’s Cathedral. The Midtown neighborhood is also known for its retail areas. Combined the Midtown Office District contains a total of 241,231,327 SF of office space. In addition to the office properties that dominate the Midtown area, smaller residential communities such as Tudor City, Sutton Place, Turtle Bay, Clinton, and Lower Park Avenue are also located within the Midtown neighborhood. According to a third party report, the Southgate Owners Corp Property is located in the Midtown East multifamily submarket of the New York City multifamily market. As of the fourth quarter of 2018, the Midtown East multifamily submarket was comprised of 13,004 total units, the overall vacancy rate for the submarket was 2.2%, and average asking rental rate was $4,069 per unit. As of the fourth quarter of 2018, the New York City multifamily market was comprised of 1,345,112 total units, the overall vacancy rate for the market was 2.3%, and the average asking rental rate was $2,749 per unit.
This is not a research report and was not prepared by any Underwriter’s research department. Please see additional important information and qualifications at the end of this Term Sheet.
T-101
| Multifamily - Cooperative | Loan #9 | Cut-off Date Balance: | $27,916,043 | |
| 400, 414, 424, 434 East 52 Street, | Southgate Owners Corp | Cut-off Date LTV: | 5.1% | |
| 433 East 51 Street | U/W NCF DSCR: | 10.28x | ||
| New York, NY 10022 | U/W NOI Debt Yield: | 59.4% |
Rental properties comparable to the Southgate Owners Corp Property are shown in the table below:
| Comparable Rental Properties(1) | |||||||
| Property | Year Built | # of Stories | # Units | Unit Mix | Average SF per Unit | Average Rent per Unit | Average Annual Rent PSF |
| The Metropolis | 2001 | 52 | 360 | Studio 1BR 2BR 3BR | 518 868 1,018 N/A | $3,620 $4,721 $6,279 N/A | $83.86 $65.27 $74.02 N/A |
| Oriana at River Tower | 1982 | 38 | 311 | Studio 1BR 2BR 3 BR | N/A 791 1,227 1,704 | N/A $5,500 $8,942 $9,723 | N/A $83.44 $87.45 $68.47 |
| 136 East 55thStreet | 1948 | 14 | 191 | Studio 1BR 2BR | 550 800 915 | $3,308 $4,089 $6,073 | $72.17 $61.34 $79.65 |
| Kenton Place | 1931 | 17 | 110 | Studio 1BR 2BR 3BR | 500 750 1,312 1,643 | $2,957 $3,948 $7,243 $8,046 | $70.97 $63.17 $66.25 $58.77 |
| The Bristol | 1975 | 33 | 387 | Studio 1BR 2BR 3BR | N/A 642 906 1,159 | N/A $5,698 $7,580 $8,049 | N/A $106.50 $100.40 $83.34 |
Source: Appraisal
| (1) | The comparable properties are not rent restricted. However, all or substantially all of the cooperative units at the Southgate Owners Corp Property were rent controlled or rent stabilized prior to the cooperative conversion and accordingly would again be subject to such rent restrictions if the Southgate Owners Corp Property were operated as a multifamily rental property.See “Risk Factors-Risks Relating to the Mortgage Loans-Residential Cooperative Properties Have Special Risks.” |
This is not a research report and was not prepared by any Underwriter’s research department. Please see additional important information and qualifications at the end of this Term Sheet.
T-102
| Multifamily - Cooperative | Loan #9 | Cut-off Date Balance: | $27,916,043 | |
| 400, 414, 424, 434 East 52 Street, | Southgate Owners Corp | Cut-off Date LTV: | 5.1% | |
| 433 East 51 Street | U/W NCF DSCR: | 10.28x | ||
| New York, NY 10022 | U/W NOI Debt Yield: | 59.4% |
Underwritten Net Cash Flow.The following table presents certain information relating to the Underwritten Net Cash Flow at the Southgate Owners Corp Property:
| Cash Flow Analysis(1) | ||
| UW | UW per Unit | |
| Gross Potential Rent | $34,335,538 | $85,412 |
| Other Income(2) | $221,445 | $551 |
| Less Vacancy & Credit Loss(3) | ($2,575,165) | ($6,406) |
| Effective Gross Income | $31,981,818 | $79,557 |
| Real Estate Taxes | $6,995,412 | $17,402 |
| Insurance | $329,998 | $821 |
| Other Expenses | $8,062,237 | $20,055 |
| Total Expenses | $15,387,647 | $38,278 |
| Net Operating Income | $16,594,171 | $41,279 |
| Capital Expenditures | $100,500 | $250 |
| Net Cash Flow | $16,493,671 | $41,029 |
| Occupancy % | 92.5%(3) | |
| NOI DSCR | 10.34x | |
| NCF DSCR | 10.28x | |
| NOI Debt Yield | 59.4% | |
| NCF Debt Yield | 59.1% | |
| (1) | Residential cooperatives are generally organized and operated as not-for-profit entities that set maintenance fees to cover current expenses and plan for future capital needs. The UW Net Operating Income and the UW Net Cash Flow for the Southgate Owners Corp Property are the projected net operating income and the projected net cash flow, respectively, reflected in the appraisal. The projected net operating income, in general, equals projected effective gross income at the Southgate Owners Corp Property assuming that it is operated as a multifamily rental property with rents and other income set at the prevailing market rates, reduced by underwritten property operating expenses and a market-rate vacancy assumption – in each case as determined by the appraiser. The projected net cash flow equals the projected net operating income reduced by the projected replacement reserves – as determined by the appraiser. The projected rental income used in such determinations differs materially from the scheduled monthly maintenance payments from the tenant-shareholders at the Southgate Owners Corp Property. See “Risk Factors—Risks Relating to the Mortgage Loans—Residential Cooperative Properties Have Special Risks.” |
| (2) | Other Income includes laundry income, commercial rent, transfer fees and other miscellaneous income. |
| (3) | Occupancy % and Vacancy & Credit Loss reported reflects the vacancy assumption in the related appraisal for purposes of determining the appraised value of the Southgate Owners Corp Property as a multifamily rental property. |
Escrows and Reserves.
Real Estate Taxes - The Southgate Owners Corp Mortgage Loan documents provide for an upfront real estate tax reserve in an amount equal to $763,264 and ongoing real estate tax reserves in an amount equal to 1/12 of the annual estimated real estate taxes (initially $381,632).
Insurance - The Southgate Owners Corp Mortgage Loan documents provide for an upfront insurance reserve in an amount equal to $119,048 and ongoing insurance reserves in an amount equal to one-twelfth of the estimated annual insurance premiums (initially $14,881).
Lockbox and Cash Management. The Southgate Owners Corp Mortgage Loan does not have a lockbox and does not have cash management.
Additional Secured Indebtedness (not including trade debts). Subordinate debt secured by the Southgate Owners Corp Property is permitted, subject to the lender’s consent (not to be unreasonably withheld, conditioned or delayed); provided that (i) at no time may the aggregate loan-to-value ratio of the Southgate Owners Corp Mortgage Loan and such subordinate debt exceed 40% as determined by the lender based upon an updated appraisal of the Southgate Owners Corp Property acceptable to the lender; (ii) no event of default under the Southgate Owners Corp Mortgage Loan documents has occurred and is continuing; (iii) the subordinate lender enters into a subordination and standstill agreement in form and substance reasonably acceptable to the lender; (iv) such additional subordinate financing has a maturity date that is either co-terminous with or extends beyond the term of the Southgate Owners Corp Mortgage Loan and (v) the Southgate Owners Corp Borrower deliver a rating agency confirmation to the lender.
Mezzanine Loan and Preferred Equity.None.
Release of Property. Not Permitted. However, tenant-shareholders are permitted to freely transfer and pledge interests in their individual units.
Right of First Refusal.None.
Letter of Credit. None.
This is not a research report and was not prepared by any Underwriter’s research department. Please see additional important information and qualifications at the end of this Term Sheet.
T-103
| Multifamily - Cooperative | Loan #9 | Cut-off Date Balance: | $27,916,043 | |
| 400, 414, 424, 434 East 52 Street, | Southgate Owners Corp | Cut-off Date LTV: | 5.1% | |
| 433 East 51 Street | U/W NCF DSCR: | 10.28x | ||
| New York, NY 10022 | U/W NOI Debt Yield: | 59.4% |
Terrorism Insurance. The Southgate Owners Corp Borrower is required to obtain “all risk” property insurance covering perils of terrorism and acts of terrorism in an amount equal to 100% of the full replacement cost (which means actual replacement value, exclusive of costs of excavations, foundations, underground utilities and footings), together with twelve months of business income/loss insurance, to the extent such policies are commercially available. Notwithstanding the foregoing, for so long as the Terrorism Risk Insurance Act of 2002, as extended and modified by the Terrorism Risk Insurance Program Reauthorization Act of 2015 (“TRIPRA”) is in effect (including any extensions thereof or if another federal governmental program is in effect relating to “acts of terrorism” which provides substantially similar protections as TRIPRA), and covers both domestic and foreign acts of terrorism, the lender is required to accept terrorism insurance which insures against “covered acts” as defined by TRIPRA (or such other program). See“Risk Factors—Risks Relating to the Mortgage Loans—TerrorismInsuranceMay Not Be Available for All Mortgaged Properties” in the Preliminary Prospectus.
This is not a research report and was not prepared by any Underwriter’s research department. Please see additional important information and qualifications at the end of this Term Sheet.
T-104
(THIS PAGE INTENTIONALLY LEFT BLANK)
T-105
| Hospitality – Full Service | Loan #10 | Cut-off Date Balance: | $25,000,000 | |
| 12681 Harbor Boulevard | Great Wolf Lodge Southern California | Cut-off Date LTV: | 49.5% | |
| Garden Grove, CA 92840 | U/W NCF DSCR: | 2.41x | ||
| U/W NOI Debt Yield: | 14.6% |
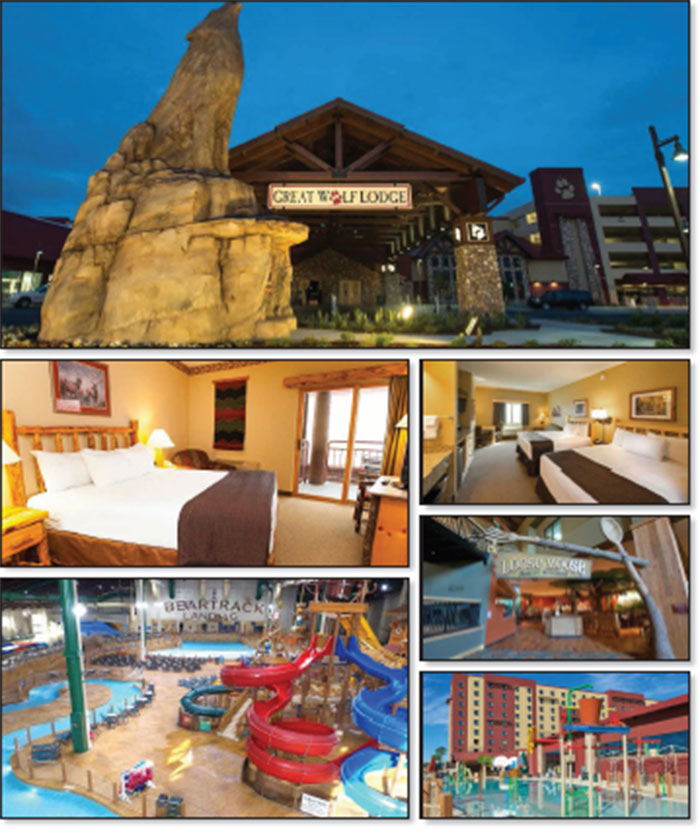
This is not a research report and was not prepared by any Underwriter’s research department. Please see additional important information and qualifications at the end of this Term Sheet.
T-106
| Hospitality – Full Service | Loan #10 | Cut-off Date Balance: | $25,000,000 | |
| 12681 Harbor Boulevard | Great Wolf Lodge Southern California | Cut-off Date LTV: | 49.5% | |
| Garden Grove, CA 92840 | U/W NCF DSCR: | 2.41x | ||
| U/W NOI Debt Yield: | 14.6% |

This is not a research report and was not prepared by any Underwriter’s research department. Please see additional important information and qualifications at the end of this Term Sheet.
T-107
| Mortgage Loan No. 10 – Great Wolf Lodge Southern California |
| Mortgage Loan Information | Property Information | ||||||
| Mortgage Loan Seller: | WFB | Single Asset/Portfolio: | Single Asset | ||||
| Credit Assessment (KBRA/Fitch/S&P): | NR/NR/NR | Location: | Garden Grove, CA 92840 | ||||
| Original Balance(1): | $25,000,000 | General Property Type: | Hospitality | ||||
| Cut-off Date Balance(1): | $25,000,000 | Detailed Property Type: | Full Service | ||||
| % of Initial Pool Balance: | 3.0% | Title Vesting: | Fee | ||||
| Loan Purpose: | Refinance | Year Built/Renovated: | 2016/N/A | ||||
| Sponsor: | McWhinney Real Estate Services, Inc.; | Size: | 603 Rooms | ||||
| Chad McWhinney; Troy McWhinney; | Cut-off Date Balance per Room(1): | $248,756 | |||||
| Great Wolf Resorts, Inc. | Maturity Date Balance per Room(1): | $248,756 | |||||
| Guarantor: | McWhinney Holding Company, LLLP | Property Manager: | GWR Manager LLC | ||||
| Mortgage Rate(2): | 5.2533% | (borrower-related) | |||||
| Note Date: | 3/11/2019 | Underwriting and Financial Information | |||||
| First Payment Date: | 4/11/2019 | UW NOI: | $21,885,939 | ||||
| Maturity Date: | 3/11/2029 | UW NOI Debt Yield(1): | 14.6% | ||||
| Original Term to Maturity: | 120 months | UW NOI Debt Yield at Maturity(1): | 14.6% | ||||
| Original Amortization Term: | 0 months | UW NCF DSCR(1): | 2.41x | ||||
| IO Period: | 120 months | Most Recent NOI: | $22,017,852 (1/31/2019 TTM) | ||||
| Seasoning: | 1 month | 2nd Most Recent NOI(6): | $21,673,034 (12/31/2018) | ||||
| Prepayment Provisions(3): | LO (25); DEF (88); O (7) | 3rd Most Recent NOI(6): | $16,784,192 (12/31/2017) | ||||
| Lockbox/Cash Mgmt Status: | Soft/Springing | Most Recent Occupancy: | 80.8% (1/31/2019) | ||||
| Additional Debt Type(1)(4): | Pari passu / Subordinate | 2nd Most Recent Occupancy(6): | 80.3% (12/31/2018) | ||||
| Additional Debt Balance(1)(4): | $125,000,000 / $20,000,000 | 3rd Most Recent Occupancy(6): | 69.6% (12/31/2017) | ||||
| Future Debt Permitted (Type): | No (N/A) | Appraised Value (as of): | $302,900,000 (11/28/2018) | ||||
| Reserves(5) | Appraised Value per Room(7): | $502,322 | |||||
| Type | Initial | Monthly | Cap | Cut-off Date LTV Ratio(7)(1): | 49.5% | ||
| RE Tax: | $0 | $244,016 | N/A | Maturity Date LTV Ratio(1): | 49.5% | ||
| Insurance: | $0 | Springing | N/A | ||||
| FF&E: | $0 | Springing | N/A | ||||
| Excess FF&E: | $2,000,000 | N/A | N/A | ||||
| Seasonality: | $0 | (5) | (5) | ||||
| Amortization: | $0 | Springing | N/A | ||||
| Sources and Uses | ||||||
| Sources | Proceeds | % of Total | Uses | Proceeds | % of Total | |
| Senior Loan(1): | $150,000,000 | 81.1% | Loan Payoff: | $180,192,917 | 97.4% | |
| Subordinate Loan(1): | $20,000,000 | 10.8% | Reserves: | $2,000,000 | 1.1% | |
| Cash Equity Contribution | $15,010,961 | 8.1% | Closing Costs: | $2,818,045 | 1.5% | |
| Total Sources: | $185,010,961 | 100.0% | Total Uses: | $185,010,961 | 100.0% | |
| (1) | The Cut-off Date Balance per Room, Maturity Date Balance per Room, UW NOI Debt Yield, UW NOI Debt Yield at Maturity, UW NCF DSCR, Cut-off Date LTV Ratio and Maturity Date LTV Ratio numbers presented above are based on the Great Wolf Lodge Southern California Senior Loan (as defined below). The Cut-off Date Balance per Room, Maturity Date Balance per Room, UW NOI Debt Yield, UW NOI Debt Yield at Maturity, UW NCF DSCR, Cut-off Date LTV Ratio and Maturity Date LTV Ratio numbers based on the Great Wolf Lodge Southern California Whole Loan (as defined below) are $281,924, $281,924, 12.9%, 12.9%, 1.89x, 56.1% and 56.1%, respectively. |
| (2) | The Great Wolf Lodge Southern California Mortgage Loan (as defined below) has an interest rate of 5.2533% and the Great Wolf Lodge Southern California Subordinate Companion Loan (as defined below) has an interest rate of 10.7500%. |
| (3) | Defeasance of the Great Wolf Lodge Southern California Whole Loan is permitted at any time after the earlier to occur of (a) the end of the two-year period commencing on the closing date of the securitization of the last Great Wolf Lodge Southern California Whole Loan to be securitized and (b) April 11, 2022. The assumed defeasance lockout period of 25 payments is based on the closing date of this transaction in April 2019. |
| (4) | See “The Mortgage Loan” and “Additional Secured Indebtedness (not including trade debts)” below for further discussion of additional debt. |
| (5) | See “Escrows and Reserves” below for further discussion of reserve requirements. |
| (6) | The increase in NOI and Occupancy from 2017 to 2018 was partly due to the fact that the Great Wolf Lodge Southern California Property opened in 2016 and was ramping up in performance over such time period. |
| (7) | The appraised value shown assumes that the Great Wolf Lodge Southern California Property is encumbered by the Disposition and Development Agreement and Transient Occupancy Tax rebates are due (See“Disposition and Development Agreement and Transient Occupancy Tax” below). The appraiser also concluded to a value of $293,300,000, which assumes that the Great Wolf Lodge Southern California Property is not encumbered by the Disposition and Development Agreement and no Transient Occupancy Tax rebates are due, which would equate to (i) a Cut-off Date LTV Ratio based on the Great Wolf Lodge Southern California Senior Loan of 51.1% and (ii) a Cut-off Date LTV Ratio based on the Great Wolf Lodge Southern California Whole Loan of 58.0%. |
This is not a research report and was not prepared by any Underwriter’s research department. Please see additional important information and qualifications at the end of this Term Sheet.
T-108
| Hospitality – Full Service | Loan #10 | Cut-off Date Balance: | $25,000,000 | |
| 12681 Harbor Boulevard | Great Wolf Lodge Southern California | Cut-off Date LTV: | 49.5% | |
| Garden Grove, CA 92840 | U/W NCF DSCR: | 2.41x | ||
| U/W NOI Debt Yield: | 14.6% |
The Mortgage Loan. The tenth largest mortgage loan (the “Great Wolf Lodge Southern California Mortgage Loan”) is part of a whole loan (the “Great Wolf Lodge Southern California Whole Loan”) in the original principal balance of $170,000,000. The Great Wolf Lodge Southern California Whole Loan is secured by a first priority fee mortgage encumbering a full service hospitality property located in Garden Grove, California (the “Great Wolf Lodge Southern California Property”). The Great Wolf Lodge Southern California Whole Loan consists of (i) five senior notes totaling $150,000,000, which arepari passu with each other (collectively, the “Great Wolf Lodge Southern California Senior Loan”), and (ii) a subordinate promissory note with an original principal balance of $20,000,000 (the “Great Wolf Lodge Southern California Subordinate Companion Loan”), which is held by KSL Capital Partners Co Trust II and is subordinate to the Great Wolf Lodge Southern California Senior Loan. The Great Wolf Lodge Southern California Mortgage Loan will initially be serviced pursuant to the pooling and servicing agreement for the BANK 2019-BNK17 securitization trust, and from and after the securitization of the Note A-1, will be serviced pursuant to the pooling and servicing agreement for the securitization to which Note A-1 is contributed. The Great Wolf Lodge Southern California Mortgage Loan represents the non-controlling Note A-2, which has an original principal balance of $25,000,000. The remaining Great Wolf Lodge Southern California Senior Loanpari passu notes are referred to herein as the “Great Wolf Lodge Southern CaliforniaPari passuCompanion Loans”. See “Description of the Mortgage Pool—The Whole Loans—The Great Wolf Lodge Southern California Pari Passu A/B Whole Loan” and “Pooling and Servicing Agreement—Servicing of the Non-Serviced Mortgage Loans”in the Preliminary Prospectus.
| Great Wolf Lodge Southern California Whole Loan Summary | |||||
| Notes(1) | Original Balance | Cut-off Date Balance | Note Holder | Controlling Piece | |
| Great Wolf Lodge Southern California Mortgage Loan | |||||
| A-2 | $25,000,000 | $25,000,000 | BANK 2019-BNK17 | No | |
| Great Wolf Lodge Southern California ServicedPari passu Companion Loans | |||||
| A-1 | $30,000,000 | $30,000,000 | Wells Fargo Bank, National Association | (2) | |
| A-3 | $25,000,000 | $25,000,000 | Wells Fargo Bank, National Association | No | |
| A-4(3) | $50,000,000 | $50,000,000 | Column Financial, Inc. | No | |
| A-5 | $20,000,000 | $20,000,000 | Wells Fargo Bank, National Association | No | |
| Great Wolf Lodge Southern California Subordinate Companion Loan | |||||
| B-1 | $20,000,000 | $20,000,000 | KSL Capital Partners Co Trust II | (2) | |
| Total Great Wolf Lodge Southern California Whole Loan | $170,000,000 | $170,000,000 | |||
| (1) | The Great Wolf Lodge Southern California Subordinate Companion Loan is subordinate to the A-Notes. |
| (2) | The holder of the Great Wolf Lodge Southern California Subordinate Companion Loan will have the right to appoint the special servicer of the Great Wolf Lodge Southern California Whole Loan and to direct certain decisions with respect to the Great Wolf Lodge Southern California Whole Loan, unless a control appraisal event exists under the related co-lender agreement; provided that after the occurrence of a control appraisal event with respect to the Great Wolf Lodge Southern California Subordinate Companion Loan, the holder of the Great Wolf Lodge Southern California Note A-1 (or the directing certificate holder for the securitization trust that holds Note A-1) will have such rights. |
| (3) | The A-4 Note was sold to Column Financial, Inc. |
The Borrower and the Borrower Sponsors.The borrower is GWGG, LLC (the “Great Wolf Lodge Southern California Borrower”), a single-purpose Delaware limited liability company with two independent directors. The borrower sponsors are McWhinney Real Estate Services, Inc. (“McWhinney”), Chad McWhinney, Troy McWhinney, and Great Wolf Resorts, Inc. (“Great Wolf”); and the non-recourse carve-out guarantor is McWhinney Holding Company, LLLP. The Great Wolf Lodge Southern California Borrower is owned by GWGG JV, LLC, a joint venture between MGWGG Investments, LLC (84.7% ownership interest), an entity managed by McWhinney and in which affiliates of McWhinney hold an ownership interest of at least 70.3%; and GWR Garden Grove, LLC (15.3% ownership interest), an affiliate of Great Wolf.
Founded in 1991 by Chad McWhinney, McWhinney’s holdings include approximately 1.2 million square feet of commercial space (office, industrial, retail and mixed use), 2,293 hotel keys, 708 multifamily units and more than 2,700 acres of land. McWhinney holds ownership interest in three other hotels in the Anaheim area including the Hilton Garden Inn – Anaheim, Homewood Suites – Anaheim, and Hampton Inn – Anaheim.
Founded in 1997, Great Wolf is the largest indoor water park family resort company in North America and currently operates 15 properties across the United States and Canada, as well as two additional properties under construction and land owned for potential future developments. Great Wolf caters to family travelers, particularly those seeking a resort atmosphere that caters to both children and adults.
The Property.The Great Wolf Lodge Southern California Property is a nine-story, 603-room, full service water park resort hotel located in Garden Grove, California, approximately 2.2 miles south of Disneyland. Built in 2016, the Great Wolf Lodge Southern California Property is situated on an 11.7-acre site and amenities include a 105,000-square-foot indoor waterpark, fitness center, outdoor pool area, miniature golf course, bowling alley, movie theater, arcade, kid-friendly spa, 21,226 square feet of meeting space, and multiple restaurants and retail outlets. The indoor waterpark includes a four-story treehouse water fort, 14 water slides, four splash pads and play pools, a surf simulator and large wave pool. In addition, the Great Wolf Lodge Southern California Property offers planned family activities and live performances.
The Great Wolf Lodge Southern California Property guestroom configuration includes 452 standard suites which sleep up to six people; 133 themed suites, including six-person Wolf Den suites with bunk beds and seven-person Kid Cabin suites with bunk beds and a day bed; and 18 premium suites which sleep six to eight people. The Great Wolf Lodge Southern California Property also contains a five-story parking garage with 1,048 parking spaces, equating to a parking ratio of 1.7 spaces per room. According to the appraisal, the demand segmentation at the Great Wolf Lodge Southern California Property is 91% leisure and 9% meeting & group.
The Great Wolf Lodge Southern California Property is not subject to a franchise agreement; however, a management and license agreement is in-place with GWR Manager LLC (an affiliate of Great Wolf) through February 2041. The loan documents require that the Great Wolf Lodge Southern California Property is managed by a “Qualified Manager”, which means one of the following entities: an affiliate of the current manager, Walt Disney Parks and Resorts, Kalahari, Wilderness, Marriott International, Hyatt Hotels Corporation, MGM Resorts International, Hilton Worldwide, IHG, Cedar Fair, Six Flags Great Adventure, SeaWorld Parks and Entertainment, Merlin Entertainment, Wyndham, or an affiliate controlled by one of the foregoing operating any
This is not a research report and was not prepared by any Underwriter’s research department. Please see additional important information and qualifications at the end of this Term Sheet.
T-109
| Hospitality – Full Service | Loan #10 | Cut-off Date Balance: | $25,000,000 | |
| 12681 Harbor Boulevard | Great Wolf Lodge Southern California | Cut-off Date LTV: | 49.5% | |
| Garden Grove, CA 92840 | U/W NCF DSCR: | 2.41x | ||
| U/W NOI Debt Yield: | 14.6% |
full service flag or brand with a STR Chainscale rating “Upscale” or higher, if such Qualified Manager has experience operating a substantial water amenity, or “Upper Upscale”, if such Qualified Manager does not have experience operating a substantial water amenity (or, in the case of IHG, “Upper Upscale” or higher), or a reputable and experienced organization possessing experience in managing or franchising full-service hotels (with waterpark) similar to the Great Wolf Lodge Southern California Property. Any replacement management agreement with a Qualified Manager is subject to written approval by the lender in the lender’s reasonable discretion, and such approval may be conditioned upon the lender’s receipt of rating agency confirmation.
The following table presents historical occupancy, ADR, and RevPAR penetration rates of the Great Wolf Lodge Southern California Property.
| Historical Occupancy, ADR, RevPAR(1)(2) | ||||||||||||
| Competitive Set | Great Wolf Lodge Southern California Property | Penetration Factor | ||||||||||
| Year | Occupancy | ADR | RevPAR | Occupancy | ADR(3) | RevPAR | Occupancy | ADR(3) | RevPAR | |||
| 1/31/2017 TTM(4) | 84.7% | $232.72 | $197.16 | 55.8% | $281.50 | $157.01 | 65.9% | 121.0% | 79.6% | |||
| 1/31/2018 TTM(4) | 84.8% | $238.85 | $202.59 | 71.2% | $264.26 | $188.19 | 84.0% | 110.6% | 92.9% | |||
| 1/31/2019 TTM | 84.3% | $249.47 | $210.31 | 82.1% | $251.45 | $206.42 | 97.4% | 100.8% | 98.2% | |||
Source:Industry Report
| (1) | According to a third party research report, the competitive set includes Anaheim Majestic Garden Hotel, Hilton Anaheim, Disney’s Disneyland Hotel, Sheraton Park Hotel @ The Anaheim Resort, Disney’s Paradise Pier Hotel, Hyatt Regency Orange County, Delta Hotel Anaheim Garden Grove, Hyatt Regency Huntington Beach & Spa, Disney’s Grand Californian Hotel & Spa, DoubleTree by Hilton Suites Anaheim Resort Convention Center, Legoland California Resort Hotel, and Courtyard Anaheim Theme Park Entrance. |
| (2) | Variances between the underwriting, the appraisal, and third party research report with respect to Occupancy, ADR and RevPAR at the Great Wolf Lodge Southern California Property are attributable to variances in reporting methodologies and/or timing differences. |
| (3) | The ADRs shown above for the Great Wolf Lodge Southern California Property exclude the daily resort fee. The historical and underwritten ADRs represented in the“Operating History and Underwritten Net Cash Flow” section below are inclusive of the daily resort fee. |
| (4) | The increase in performance from 1/31/2017 TTM to 1/31/2018 TTM is partly due to the fact that the Great Wolf Lodge Southern California Property opened in 2016 and was ramping up in performance over such time period. |
The Market. The Great Wolf Lodge Southern California Property is located in Garden Grove, California, Orange County, approximately 4.3 miles south of downtown Anaheim, 2.2 miles south of Disneyland, 11.1 miles north of John Wayne Airport, 30.3 miles southeast of downtown Los Angeles, and 35.0 miles southeast of the Los Angeles International Airport. The Great Wolf Lodge Southern California Property is situated on Harbor Boulevard, which is a main north/south thoroughfare that connects the Great Wolf Lodge Southern California Property to the Anaheim Resort Area, Disneyland and the Interstate 5 on-ramp to the north. Additional attractions in the area include Knott’s Berry Farm (8.8 miles northwest), Angel Stadium (home to Major League Baseball’s Los Angeles Angels; 2.9 miles northeast) and the Anaheim Convention Center (1.7 miles north). The Anaheim Convention Center is the largest convention center on the West Coast and recently completed a $190.0 million expansion.
According to the appraisal, the Anaheim/Garden Grove market is experiencing a period of expansion, primarily led by the tourism and leisure industry. According to the appraisal, the Orange County economy is primarily driven by the tourism industry, which employs more than 140,000 people in the area. Orange County hosted approximately 49.5 million visitors in 2017, a 2.7% increase from 2016, which led to an economic impact of more than $12.5 billion, marking a 3.1% increase in visitor spending from 2016. The Walt Disney Corporation is the largest private-sector employer in Orange County, with approximately 31,000 employees, and Disneyland is one of the largest demand generators in the area. While Disney does not publish attendance data, a 2018 third party research report estimated that Disneyland hosted approximately 18.3 million visitors in 2017, which surpassed the previous peak in 2015 when the park celebrated its 60th anniversary.
According to the appraisal, the 2018 population within a three- and five-mile radius of the Great Wolf Lodge Southern California Property was 305,784 and 856,177, respectively. The 2018 average household income within the same radii was $76,916 and $76,996, respectively.
The appraisal identified six new hotels totaling approximately 2,000 rooms that are expected to have some degree of competitive interaction with the Great Wolf Lodge Southern California Property and are expected to be constructed in 2019 and 2020; however, none of these hotels are anticipated to compete directly with the Great Wolf Lodge Southern California Property.
This is not a research report and was not prepared by any Underwriter’s research department. Please see additional important information and qualifications at the end of this Term Sheet.
T-110
| Hospitality – Full Service | Loan #10 | Cut-off Date Balance: | $25,000,000 | |
| 12681 Harbor Boulevard | Great Wolf Lodge Southern California | Cut-off Date LTV: | 49.5% | |
| Garden Grove, CA 92840 | U/W NCF DSCR: | 2.41x | ||
| U/W NOI Debt Yield: | 14.6% |
Operating History and Underwritten Net Cash Flow. The following table presents certain information relating to the operating history and Underwritten Net Cash Flow at the Great Wolf Lodge Southern California Property:
| Cash Flow Analysis | ||||||
| 2016(1) | 2017(1) | 2018(1) | TTM 1/31/2019 | UW | UW per Room | |
| Occupancy | 56.0% | 69.6% | 80.3% | 80.8% | 80.8% | |
| ADR | $302.82 | $293.48 | $280.43 | $280.55 | $280.55 | |
| RevPAR | $174.35 | $204.29 | $225.14 | $226.80 | $226.80 | |
| Room Revenue | $37,321,683 | $44,962,428 | $49,532,819 | $49,916,915 | $49,916,915 | $82,781 |
| Food & Beverage Revenue | 12,651,097 | 15,786,521 | 18,549,243 | 18,659,206 | 18,659,206 | 30,944 |
| Other Income(2) | 9,801,978 | 12,432,751 | 15,836,332 | 16,156,718 | 16,156,718 | 26,794 |
| Total Revenue | $59,774,758 | $73,181,700 | $83,918,394 | $84,732,839 | $84,732,839 | $140,519 |
| Room Expense | 8,229,012 | 9,459,551 | 11,101,315 | 11,308,530 | 11,308,530 | 18,754 |
| Food & Beverage Expense | 10,057,613 | 11,069,358 | 11,906,573 | 12,095,948 | 12,095,948 | 20,060 |
| Other Departmental Expenses | 9,251,797 | 9,750,793 | 11,103,942 | 11,333,895 | 11,333,895 | 18,796 |
| Total Departmental Expenses | 27,538,422 | 30,279,702 | 34,111,830 | 34,738,373 | 34,738,373 | 57,609 |
| Gross Operating Income | $32,236,336 | $42,901,998 | $49,806,564 | $49,994,466 | $49,994,466 | $82,910 |
| Total Undistributed Expenses | 17,738,878 | 22,740,580 | 24,239,081 | 24,085,395 | 24,085,395 | 39,943 |
| Gross Operating Profit | $14,497,458 | $20,161,418 | $25,567,483 | $25,909,071 | $25,909,071 | $42,967 |
| Total Fixed Charges | 4,226,049 | 3,377,226 | 3,894,449 | 3,891,219 | 4,023,132 | 6,672 |
| Total Operating Expenses | $49,503,349 | $56,397,508 | $62,245,360 | $62,714,987 | $62,846,900 | $104,224 |
| Net Operating Income | $10,271,409 | $16,784,192 | $21,673,034 | $22,017,852 | $21,885,939 | $36,295 |
| FF&E | 0 | 0 | 0 | 0 | (3,389,314) | (5,621) |
| TOT Reimbursement(3) | 560,083 | 667,889 | 743,272 | 749,023 | 748,754 | 1,242 |
| Net Cash Flow | $10,831,492 | $17,452,081 | $22,416,306 | $22,766,875 | $19,245,379 | $31,916 |
| NOI DSCR(4) | 1.29x | 2.10x | 2.71x | 2.76x | 2.74x | |
| NCF DSCR(4) | 1.36x | 2.18x | 2.81x | 2.85x | 2.41x | |
| NOI Debt Yield(4) | 6.8% | 11.2% | 14.4% | 14.7% | 14.6% | |
| NCF Debt Yield(4) | 7.2% | 11.6% | 14.9% | 15.2% | 12.8% | |
| (1) | The increases in Net Operating Income from 2016 to 2018 were driven primarily by increases in Occupancy, Food & Beverage Revenue, and Other Income. The Great Wolf Lodge Southern California Property opened for business in 2016 and was ramping up performance over such time period. |
| (2) | Other Income consists of revenue from the waterpark, miniature golf, arcade games and other attractions, gift shop revenue, parking revenue, spa revenue, and other miscellaneous income. |
| (3) | Underwritten TOT Reimbursement is based on underwritten Room Revenue of $49,916,915 multiplied by the 2018 TOT Differential (as defined below) of 1.5% See“Disposition and Development Agreement and Transient Occupancy Tax” section below for further details on TOT reimbursement. |
| (4) | The debt service coverage ratios and debt yields shown are based on the Great Wolf Lodge Southern California Senior Loan, and excludes the Great Wolf Lodge Southern California Subordinate Companion Loan. |
Escrows and Reserves.
Real Estate Taxes - The Great Wolf Lodge Southern California Borrower is required to deposit ongoing monthly escrows for real estate taxes in an amount equal to one-twelfth of the real estate taxes that the lender estimates will be payable during the next twelve months (initially $244,016).
Insurance - The Great Wolf Lodge Southern California Borrower is not required to deposit ongoing monthly escrows for insurance as long as (i) no event of default has occurred and is continuing, (ii) the Great Wolf Lodge Southern California Borrower provides the lender with evidence that the insurance coverage for the Great Wolf Lodge Southern California Property is included in a blanket policy and such policy is in full force and effect, and (iii) the Great Wolf Lodge Southern California Borrower provides the lender with evidence of timely payment of the insurance premiums and renewals.
FF&E Reserve - The Great Wolf Lodge Southern California Borrower is not required to deposit ongoing monthly escrows for capital expenditures as long as (i) the current manager (or any affiliates) is the manager and the management agreement is in full force and effect, (ii) the manager reserves funds for capital expenditures which will be disbursed pursuant to the terms of the management agreement, and (iii) there is no default beyond any applicable notice and cure period under the management agreement
Excess FF&E Reserve - The Great Wolf Lodge Southern California Borrower was required to deposit an upfront capital expenditure reserve of $2,000,000.
Seasonality Reserve - Upon the request of the lender, the Great Wolf Lodge Southern California Borrower is required to deposit monthly deposits from June 2019 through August 2019 and commencing in 2020 and each year thereafter, from March through August during the term of the Great Wolf Lodge Southern California Whole Loan, into the seasonality reserve in an amount equal to the lesser of (a) $280,000 and (b) available net cash flow after all
This is not a research report and was not prepared by any Underwriter’s research department. Please see additional important information and qualifications at the end of this Term Sheet.
T-111
| Hospitality – Full Service | Loan #10 | Cut-off Date Balance: | $25,000,000 | |
| 12681 Harbor Boulevard | Great Wolf Lodge Southern California | Cut-off Date LTV: | 49.5% | |
| Garden Grove, CA 92840 | U/W NCF DSCR: | 2.41x | ||
| U/W NOI Debt Yield: | 14.6% |
expenses and payments required under the loan documents. The Seasonality Reserve will be capped at an amount equal to two months of debt service (exclusive of any amortization payments).
Amortization Reserve – Based on the conditions outlined below, the Great Wolf Lodge Southern California Borrower will be required to commence depositing monthly payments into a reserve account consistent with the applicable hypothetical amortization schedules:
| (i) | As of April 1, 2022, if the net cash flow debt yield of the Great Wolf Lodge Southern California Whole Loan (inclusive of the Great Wolf Lodge Southern California Subordinate Companion Loan) is less than 12.0%, the Great Wolf Lodge Southern California Borrower will be required to deposit monthly payments consistent with a 30-year amortization schedule; |
| (ii) | As of April 1, 2024, if the net cash flow debt yield of the Great Wolf Lodge Southern California Whole Loan (inclusive of the Great Wolf Lodge Southern California Subordinate Companion Loan) is less than 13.0%, the Great Wolf Lodge Southern California Borrower will be required to deposit monthly payments consistent with a 27-year amortization schedule; and |
| (iii) | As of April 1, 2026, if the net cash flow debt yield of the Great Wolf Lodge Southern California Whole Loan (inclusive of the Great Wolf Lodge Southern California Subordinate Companion Loan) is less than 14.0%, the Great Wolf Lodge Southern California Borrower will be required to deposit monthly payments consistent with a 25-year amortization schedule; |
Lockbox and Cash Management. A soft lockbox with springing cash management is in-place with respect to the Great Wolf Lodge Southern California Whole Loan. The borrower and manager are required to deposit into the lockbox account (i) prior to a Great Wolf Cash Management Trigger Event (as defined below), only amounts payable (after operating expenses, management fees and transfers to the reserves) by the manager to the Great Wolf Lodge Southern California Borrower pursuant to the hotel management agreement on a weekly basis; and (ii) from and after a Great Wolf Cash Management Trigger Event, all income within three business days after receipt. Following a Great Wolf Cash Management Trigger Event, credit card providers are required to deposit rents and income directly into the lockbox account. Upon the occurrence and during the continuance of a Great Wolf Cash Management Trigger Event, all funds on deposit in the lockbox account are required to be transferred to the cash management account on a daily basis. Prior to a Cash Trap Event Period (as defined below), all funds on deposit in the cash management account will be disbursed (a) prior to a Great Wolf Cash Management Trigger Event, to the borrower’s operating account, and (b) after the date of a Great Wolf Cash Management Trigger Event, to the manager’s operating account. During a Cash Trap Event Period, all funds on deposit in the cash management account are required to be applied to the payment of, among other things, monthly escrows, debt service, operating expenses set forth in the lender-approved annual budget and extraordinary expenses approved by the lender; and all excess cash flow is required to be held in the excess cash flow subaccount as additional security for the Great Wolf Lodge Southern California Whole Loan.
A “Great Wolf Cash Management Trigger Event” will commence upon the earlier of the following:
| (i) | any Great Wolf Entity (as defined below) owning more than 25% of the direct or indirect interest in the Great Wolf Lodge Southern California Borrower; or |
| (ii) | any Great Wolf Entity controlling the Great Wolf Lodge Southern California Borrower. |
A “Great Wolf Entity” means (a) an entity that is controlled (directly or indirectly) by Great Wolf or any entity that controls Great Wolf; or (b) any entity that is under common control with Great Wolf.
A “Cash Trap Event Period” will commence upon the earlier of the following:
| (i) | the occurrence and continuance of an event of default; or |
| (ii) | the net cash flow debt yield of the Great Wolf Lodge Southern California Whole Loan (inclusive of the Great Wolf Lodge Southern California Subordinate Companion Loan) falling below 9.0% at the end of any calendar quarter. |
A Cash Trap Event Period will end upon the occurrence of the following:
| ● | with regard to clause (i), the cure of such event of default; or |
| ● | with regard to clause (ii), upon the net cash flow debt yield of the Great Wolf Lodge Southern California Whole Loan (inclusive of the Great Wolf Lodge Southern California Subordinate Companion Loan) being equal to or greater than 9.5% for two consecutive calendar quarters. |
Disposition and Development Agreement and Transient Occupancy Tax.McWhinney obtained the site to construct the Great Wolf Lodge Southern California Property through a disposition and development agreement (“DDA”) with the Garden Grove Agency of Community Development (“Agency”), which was signed in May 2009 and amended in April 2010. As part of the DDA, the Agency has the right to approve any transfer of the Great Wolf Lodge Southern California Property to a non-related entity, but such approval right does not apply to a foreclosure or deed in lieu of foreclosure or to a transfer by lender to a third party purchaser after foreclosure. In exchange for these protective covenants, the Agency provided approximately $47.0 million to McWhinney, with $5.0 million paid at the commencement of construction of the parking garage and $42.0 million at the opening of the Great Wolf Lodge Southern California Property. In addition, the Agency agreed to pay McWhinney, on an ongoing basis, an annual transient occupancy tax (“TOT”) reimbursement, which is based on the TOT Differential (as defined below) between the City of Anaheim and the City of Garden Grove and applied to total annual room revenue. See “Description of the Mortgage Pool—Mortgage Pool Characteristics—Property Types—Hospitality Properties” in the Preliminary Prospectus.
The “TOT Differential” is equal to (i) 2.0% (the “Benchmark TOT Variance”), minus (ii) the current TOT of the City of Anaheim minus the current TOT of the City of Garden Grove (the “Current TOT Variance”). In 2018, the TOTs of the City of Anaheim and the City of Garden Grove were 15.0% and 14.5%, respectively, resulting in a Current TOT Variance of 0.5% and a TOT Differential of 1.5% (TOT Differential calculated by subtracting the TOT Variance of 0.5% from the Benchmark TOT Variance of 2.0%). In 2018, based on room revenue of $49,532,819 and the TOT Differential of 1.5%, the TOT reimbursement was $743,272.
Additional Secured Indebtedness (not including trade debts). The Great Wolf Lodge Southern California Property also secures the Great Wolf Lodge Southern CaliforniaPari passuCompanion Loans, which have an aggregate Cut-off Date principal balance of $125,000,000 and the Great Wolf Lodge Southern California Subordinate Companion Loan, which has a Cut-off Date principal balance of $20,000,000. The Great Wolf Lodge Southern CaliforniaPari passuCompanion Loans and the Great Wolf Lodge Southern California Subordinate Companion Loan are coterminous with the Great Wolf Lodge Southern California Mortgage Loan. The Great Wolf Lodge Southern CaliforniaPari passuCompanion Loans accrue interest at the same rate as the Great Wolf Lodge Southern California Mortgage Loan, and the Great Wolf Lodge Southern California Subordinate Companion Loan accrues
This is not a research report and was not prepared by any Underwriter’s research department. Please see additional important information and qualifications at the end of this Term Sheet.
T-112
| Hospitality – Full Service | Loan #10 | Cut-off Date Balance: | $25,000,000 | |
| 12681 Harbor Boulevard | Great Wolf Lodge Southern California | Cut-off Date LTV: | 49.5% | |
| Garden Grove, CA 92840 | U/W NCF DSCR: | 2.41x | ||
| U/W NOI Debt Yield: | 14.6% |
interest at an interest rate of 10.7500%. The Great Wolf Lodge Southern California Mortgage Loan and the Great Wolf Lodge Southern CaliforniaPari passuCompanion Loans are eachpari passuin right of payment and together are senior in right of payment to the Great Wolf Lodge Southern California Subordinate Companion Loan. The holders of the Great Wolf Lodge Southern California Mortgage Loan, the Great Wolf Lodge Southern CaliforniaPari passuCompanion Loans and the Great Wolf Lodge Southern California Subordinate Companion Loan have entered into a co-lender agreement which sets forth the allocation of collections on the Great Wolf Lodge Southern California Whole Loan. See “Description of the Mortgage Pool—The Whole Loans—The Great Wolf Lodge Southern California Pari Passu A/B Whole Loan” in the Preliminary Prospectus. The Great Wolf Lodge Southern California Subordinate Companion Loan is held by KSL Capital Partners Co Trust II.
The following table presents certain information relating to the Great Wolf Lodge Southern California Subordinate Companion Loan:
| B-Note Summary | |||||||||
B-Note Original Principal Balance | B-Note Interest Rate | Original Term (mos.) | Original Amort. Term (mos.) | Original IO Term (mos.) | Total Debt UW NCF DSCR | Total Debt UW NOI Debt Yield | Total Debt Cutoff Date LTV | ||
| Great Wolf Lodge Southern California Subordinate Companion Loan | $20,000,000 | 10.7500% | 120 | 0 | 120 | 1.89x | 12.9% | 56.1% | |
Mezzanine Loan and Preferred Equity.Not permitted.
Release of Property. Not Permitted.
Right of First Refusal.None.
Letter of Credit.None.
Terrorism Insurance. The Great Wolf Lodge Southern California Whole Loan documents require that the “all risk” insurance policy required to be maintained by the Great Wolf Lodge Southern California Borrower provide coverage for terrorism in an amount equal to the full replacement cost of the Great Wolf Lodge Southern California Property. The loan documents also require business interruption insurance covering no less than the 18-month period following the occurrence of a casualty event, together with a six month extended period of indemnity.See “Risk Factors—Risks Relating to the Mortgage Loans—Terrorism Insurance May Not Be Available for All Mortgaged Properties” in the Prospectus.
Earthquake Insurance.The loan documents do not require earthquake insurance; however, at the time of closing, earthquake insurance coverage is in-place for the Great Wolf Lodge Southern California Property through a blanket policy. The seismic report indicated a probable maximum loss of 4% for the Great Wolf Lodge Southern California Property.
This is not a research report and was not prepared by any Underwriter’s research department. Please see additional important information and qualifications at the end of this Term Sheet.
T-113
| Mortgage Loan No. 11 – Seekonk Crossing |
| Mortgage Loan Information | Mortgaged Property Information | ||||||
| Mortgage Loan Seller: | MSMCH | Single Asset/Portfolio: | Single Asset | ||||
| Credit Assessment (KBRA/Fitch/S&P): | NR/NR/NR | Location: | Seekonk, MA 02771 | ||||
| Original Balance: | $23,000,000 | General Property Type: | Retail | ||||
| Cut-off Date Balance: | $23,000,000 | Detailed Property Type: | Anchored | ||||
| % of Initial Pool Balance: | 2.8% | Title Vesting: | Fee | ||||
| Loan Purpose: | Refinance | Year Built/Renovated: | 1993/2012 | ||||
| Sponsor: | Time Equities, Inc. | Size: | 227,078 SF | ||||
| Guarantor: | Francis Greenburger | Cut-off Date Balance per SF: | $101 | ||||
| Mortgage Rate: | 4.7000% | Maturity Date Balance per SF: | $101 | ||||
| Note Date: | 1/30/2019 | Property Manager: | Time Equities, Inc. | ||||
| First Payment Date: | 3/5/2019 | (borrower-related) | |||||
| Maturity Date: | 2/5/2029 | Underwriting and Financial Information | |||||
| Original Term to Maturity: | 120 months | UW NOI: | $2,291,752 | ||||
| Original Amortization Term: | 0 months | UW NOI Debt Yield: | 10.0% | ||||
| IO Period: | 120 months | UW NOI Debt Yield at Maturity: | 10.0% | ||||
| Seasoning: | 2 months | UW NCF DSCR: | 1.93x | ||||
| Prepayment Provisions: | LO (26); DEF (90); O (4) | Most Recent NOI: | $2,379,674 (11/30/2018 TTM) | ||||
| Lockbox/Cash Mgmt Status: | Springing/Springing | 2nd Most Recent NOI: | $2,259,999 (12/31/2017) | ||||
| Additional Debt Type: | N/A | 3rd Most Recent NOI: | $2,060,586 (12/31/2016) | ||||
| Additional Debt Balance: | N/A | Most Recent Occupancy: | 100.0% (11/14/2018) | ||||
| Future Debt Permitted (Type): | No (N/A) | 2nd Most Recent Occupancy: | 98.7% (12/31/2017) | ||||
| Reserves | 3rd Most Recent Occupancy: | 96.8% (12/31/2016) | |||||
| Type | Initial | Monthly | Cap | Appraised Value (as of): | $35,250,000 (12/5/2018) | ||
| RE Tax: | $58,809 | $58,809 | N/A | Appraised Value per SF: | $155 | ||
| Insurance(1): | $0 | Springing | N/A | Cut-off Date LTV Ratio: | 65.2% | ||
| Recurring Replacements: | $0 | $3,597 | $102,000 | Maturity Date LTV Ratio: | 65.2% | ||
| TI/LC: | $200,000 | $18,923 | $200,000 | ||||
| Sources and Uses | ||||||
| Sources | Proceeds | % of Total | Uses | Proceeds | % of Total | |
| Loan Amount: | $23,000,000 | 100.0% | Loan Payoff: | $21,523,779 | 93.6% | |
| Return of Equity: | $1,114,164 | 4.8% | ||||
| Reserves: | $258,809 | 1.1% | ||||
| Closing Costs: | $103,248 | 0.4% | ||||
| Total Sources: | $23,000,000 | 100.0% | Total Uses: | $23,000,000 | 100.0% | |
| (1) | Monthly deposits for insurance are springing upon (i) an event of default occurring, (ii) the Seekonk Crossing Borrower (as defined below) failing to maintain an approved blanket policy and (iii) the Seekonk Crossing Borrower failing to provide evidence of renewal and paid receipts of insurance premiums. |
The Mortgage Loan.The eleventh largest mortgage loan (the “Seekonk Crossing Mortgage Loan”) is evidenced by a promissory note in the original principal amount of $23,000,000 and secured by a first priority fee mortgage encumbering an anchored retail center located in Seekonk, Massachusetts (the “Seekonk Crossing Property”). Proceeds from the Seekonk Crossing Mortgage Loan were used to refinance the previous loan secured by the Seekonk Crossing Property, return equity to the Seekonk Crossing Borrower, fund upfront reserves and pay closing costs.
The Borrower and the Sponsors. The borrower is Seekonk Shopping Center Equities II LLC (the “Seekonk Crossing Borrower”), a Delaware limited liability company with no independent directors. The borrower sponsor is Time Equities, Inc. and the non-recourse carveout guarantor is Francis Greenburger. The Seekonk Crossing Borrower is wholly owned by Seekonk Shopping Center Equities LLC, a Massachusetts limited liability company, which is managed by Francis Greenburger and Robert Kantor.
Francis Greenburger is the founder and CEO of Time Equities, Inc. Time Equities, Inc. currently holds in its portfolio approximately 31.1 million SF of residential, industrial, office and retail property, including approximately 4,000 multi-family apartment units. In addition, Time Equities, Inc is in various stages of development and pre-development of constructing approximately 1.4 million SF of various property types which includes at least 1,447 residential units. Time Equities, Inc. owns properties in 30 states, five Canadian provinces, Germany, the Netherlands, and Anguilla, British Virgin Islands.
The Property.The Seekonk Crossing Property is an anchored neighborhood retail center comprised of five, one-story buildings totaling 227,078 SF located in Seekonk, Massachusetts approximately 6 miles east of the Providence, Rhode Island central business district and 40 miles south of the Boston central business district. The Seekonk Crossing Property is situated on an approximately 40.7-acre site and features 1,070 parking spaces (4.7 spaces per 1,000 SF).
This is not a research report and was not prepared by any Underwriter’s research department. Please see additional important information and qualifications at the end of this Term Sheet.
T-114
| Retail - Anchored | Loan #11 | Cut-off Date Balance: | $23,000,000 | |
| 145, 165, 175, 179, 181 and 191 | Seekonk Crossing | Cut-off Date LTV: | 65.2% | |
| Highland Avenue | U/W NCF DSCR: | 1.93x | ||
| Seekonk, MA 02771 | U/W NOI Debt Yield: | 10.0% |
The Seekonk Crossing Property was built in 1993 and renovated in 2012. The renovation included relocating two existing tenants, Big Lots and Staples, in order to facilitate the addition of 12,220 SF and the renovation of approximately 34,000 SF. The renovations included a new roof, landscaping, storm-water management systems, repaving and striping of the parking lot as well as new signage. The total costs associated with these improvements were reported to be $12.7 million. As of November 14, 2018, the Seekonk Crossing Property was 100.0% occupied by 10 tenants, including the anchors, BJs Wholesale, Hobby Lobby, Big Lots and Staples. The anchor tenants comprise 88.3% of the NRA and account for 75.3% of underwritten rent. Other than the anchor tenants, no tenant represents more than 3.8% of NRA or accounts for more than 8.7% of underwritten rent. Nine tenants, totaling 98.1% of the NRA, have been at the Seekonk Crossing Property for more than five years, while six tenants totaling 28.3% of the NRA have renewed or extended their lease at least once.
Major Tenants.
BJs Wholesale (112,338 SF, 49.5% of NRA, 43.5% ofunderwritten rent). BJs Wholesale is a membership-only warehouse club chain operating on the east coast of the United States. The retail chain offers a wide variety of discounted products, including food, beverages, cleaning supplies, pet products, toys and electronics. BJs Wholesale has been a tenant at the Seekonk Crossing Property since 2011, has a lease expiration of August 24, 2032 with 8% rent increases in 2022 and 2027, and has five, 5-year renewal options remaining. BJs Wholesale also operates a gas station at the Seekonk Crossing Property.
Hobby Lobby(42,549 SF, 18.7% of NRA, 14.6% of underwritten rent).Hobby Lobby is a chain of arts and craft stores in the United States that was founded in 1972. Based in Oklahoma City, Hobby Lobby has 32,000 employees and over 800 stores. Hobby Lobby has been a tenant at the Seekonk Crossing Property since 2014, has a lease expiration of March 31, 2024 and has three, 5-year renewal options remaining.
Big Lots(27,620 SF, 12.2% of NRA, 10.5% of underwritten rent).Big Lots is a retail company that offers an assortment of brand-name closeout items at discount prices. The selection of merchandise includes consumables, seasonal products, furniture, housewares, toys and gifts. Founded in 1967 and headquartered in Columbus, Ohio, Big Lots operates 1,416 retail stores in 47 states. Big Lots has been a tenant at the Seekonk Crossing Property since 1999, has a lease expiration of January 31, 2022 and has two, 5-year renewal options remaining.
Staples(18,098 SF, 8.0% of NRA, 6.8% of underwritten rent).Staples is a multinational office supply company, providing various products such as office supplies, office machines, technology, and business services both online and in stores. Founded in 1986, Staples operates 1,600 stores in North America and has 77,000 employees. Staples has been a tenant at the Seekonk Crossing Property since 2000, has a lease expiration of February 28, 2022 and has two, 5-year renewal options remaining.
Pier One Imports(8,658 SF, 3.8% of NRA, 8.7% of underwritten rent).Pier One Imports is a Fort Worth, Texas based multi-channel retailer that sells imported home furnishings and decor, particularly furniture, table-top items, decorative accessories, and seasonal decor. Founded in 1962, Pier One Imports employs approximately 20,000 people and operates over 1,000 locations. Pier One Imports has been a tenant at the Seekonk Crossing Property since 1999, has a lease expiration of February 28, 2022 and has one, 3-year renewal option remaining.
The following table presents a summary regarding the largest tenants at the Seekonk Crossing Property:
| Tenant Summary(1) | ||||||||||
| Tenant Name | Credit Rating (Fitch/Moody’s/S&P)(2) | Tenant SF | Approx.% of SF | Annual UW Rent | Annual UW Rent PSF | Most Recent Sales(3) | ||||
| App. % of Total Annual UW Rent | $ | PSF | Occ. Cost %(4) | Lease Expiration | ||||||
| BJs Wholesale | NR/NR/B | 112,338 | 49.5% | $1,143,765 | $10.18 | 43.5% | NAV | NAV | NAV | 8/24/2032 |
| Hobby Lobby | NR/NR/NR | 42,549 | 18.7% | $382,941 | $9.00 | 14.6% | NAV | NAV | NAV | 3/31/2024 |
| Big Lots | NR/NR/BBB- | 27,620 | 12.2% | $276,200 | $10.00 | 10.5% | $3,634,652 | $131.59 | 7.6% | 1/31/2022 |
| Staples | NR/B3/B+ | 18,098 | 8.0% | $178,200 | $9.85 | 6.8% | NAV | NAV | NAV | 2/28/2022 |
| Pier One Imports | NR/NR/NR | 8,658 | 3.8% | $229,437 | $26.50 | 8.7% | NAV | NAV | NAV | 2/28/2022 |
| Subtotal/Wtd. Avg. | 209,263 | 92.2% | $2,210,543 | $10.56 | 84.1% | |||||
| Other Tenants | 17,815 | 7.8% | $418,804 | $23.51 | 15.9% | |||||
| Vacant Space | 0 | 0.0% | $0 | $0.00 | 0.0% | |||||
| Total/Wtd. Avg. | 227,078 | 100.0% | $2,629,347 | $11.58 | 100.0% | |||||
| (1) | Information is based on the underwritten rent roll dated as of November 14, 2018. |
| (2) | Certain ratings are those of the parent company whether or not the parent guarantees the lease. |
| (3) | Most Recent Sales determined as of October 11, 2018. |
| (4) | Occ. Cost % is based on the underwritten rent as of the October 11, 2018 underwritten rent roll divided by most recently reported sales. |
This is not a research report and was not prepared by any Underwriter’s research department. Please see additional important information and qualifications at the end of this Term Sheet.
T-115
| Retail - Anchored | Loan #11 | Cut-off Date Balance: | $23,000,000 | |
| 145, 165, 175, 179, 181 and 191 | Seekonk Crossing | Cut-off Date LTV: | 65.2% | |
| Highland Avenue | U/W NCF DSCR: | 1.93x | ||
| Seekonk, MA 02771 | U/W NOI Debt Yield: | 10.0% |
The following table presents certain information with respect to the lease rollover at the Seekonk Crossing Property:
| Lease Rollover Schedule(1)(2) | ||||||||
| Year | # of Leases Rolling | SF Rolling | Annual UW Rent PSF Rolling | % of Total SF Rolling | Cumulative % of SF Rolling | Annual UW Rent Rolling | % of Annual UW Rent Rolling | Cumulative % of Annual UW Rent Rolling |
| 2019 | 1 | 1,210 | $24.90 | 0.5% | 0.5% | $30,129 | 1.1% | 1.1% |
| 2020 | 1 | 4,420 | $18.46 | 1.9% | 2.5% | $81,600 | 3.1% | 4.2% |
| 2021 | 0 | 0 | $0.00 | 0.0% | 2.5% | $0 | 0.0% | 4.2% |
| 2022 | 4 | 57,976 | $14.19 | 25.5% | 28.0% | $822,437 | 31.3% | 35.5% |
| 2023 | 1 | 1,485 | $25.00 | 0.7% | 28.7% | $37,125 | 1.4% | 36.9% |
| 2024 | 1 | 42,549 | $9.00 | 18.7% | 47.4% | $382,941 | 14.6% | 51.5% |
| 2025 | 0 | 0 | $0.00 | 0.0% | 47.4% | $0 | 0.0% | 51.5% |
| 2026 | 0 | 0 | $0.00 | 0.0% | 47.4% | $0 | 0.0% | 51.5% |
| 2027 | 1 | 7,100 | $18.50 | 3.1% | 50.5% | $131,350 | 5.0% | 56.5% |
| 2028 | 0 | 0 | $0.00 | 0.0% | 50.5% | $0 | 0.0% | 56.5% |
| 2029 | 0 | 0 | $0.00 | 0.0% | 50.5% | $0 | 0.0% | 56.5% |
| 2030 & Beyond | 1 | 112,338 | $10.18 | 49.5% | 100.0% | $1,143,765 | 43.5% | 100.0% |
| Vacant | 0 | 0 | $0.00 | 0.0% | 100.0% | $0 | 0.0% | 100.0% |
| Total/Wtd. Avg. | 10 | 227,078 | $11.58 | 100.0% | $2,629,347 | 100.0% | ||
| (1) | Information is based on the underwritten rent roll dated as of November 14, 2018. |
| (2) | Certain tenants may have lease termination options that are exercisable prior to the originally stated expiration date of the subject lease and that are not considered in the Lease Rollover Schedule. |
The Market. The Seekonk Crossing Property is located in Seekonk, Massachusetts approximately 6 miles east of the Providence, Rhode Island central business district and 40 miles south of the Boston central business district. The area immediately surrounding the Seekonk Crossing Property is developed with retail property that includes tenants such as community shopping centers, a Home Depot store, a multi-screen movie theater, Wal-Mart, Super Stop & Shop and an At Home store. Other commercial uses include fast food and office uses. Additionally, the Seekonk Crossing Property is approximately 12 miles northeast of the T.F. Green Airport, which serves as Providence’s primary commercial airport. Regional access to the Seekonk Crossing Property is provided primarily by Interstate 95, Interstate 195, US Route 6 and Route 146.
The Seekonk Crossing Property is located in the Boston retail market and the Southwest/Bristol retail submarket. According to the appraisal, as of the fourth quarter of 2018, the Boston retail market had approximately 37.4 million SF of retail space inventory, overall vacancy in the market was approximately 6.9% and asking rent was $24.03 PSF. According to the appraisal, as of the fourth quarter of 2018, the Southwest/Bristol retail submarket had approximately 6.3 million SF of retail space inventory, overall vacancy in the submarket was approximately 6.2% and asking rent was $22.37 PSF.
The estimated 2017 population within a one-, five- and ten-mile radius of the Seekonk Crossing Property was 3,143, 187,729 and 681,087, respectively. The estimated 2017 average household income within a one-, five- and ten-mile radius of the Seekonk Crossing Property was $80,257, $83,882 and $77,651, respectively.
The following table presents certain information relating to the appraiser’s market rent conclusion for the Seekonk Crossing Property:
| Market Rent Summary | |||||
| Inline Retail <2,500 | Inline Retail | Freestanding Retail | Junior Anchor | Anchor | |
| Market Rent (PSF) | $26.00 | $20.00 | $26.00 | $10.00 | $10.00 |
| Lease Term (Years) | 5 | 5 | 10 | 10 | 10 |
| Lease Type (Reimbursements) | Net | Net | Net | Net | Net |
| Rent Increase Projection | 3.0% per annum | 3.0% per annum | 10.0% in year 6 | 10.0% in year 6 | 10.0% in year 6 |
This is not a research report and was not prepared by any Underwriter’s research department. Please see additional important information and qualifications at the end of this Term Sheet.
T-116
| Retail - Anchored | Loan #11 | Cut-off Date Balance: | $23,000,000 | |
| 145, 165, 175, 179, 181 and 191 | Seekonk Crossing | Cut-off Date LTV: | 65.2% | |
| Highland Avenue | U/W NCF DSCR: | 1.93x | ||
| Seekonk, MA 02771 | U/W NOI Debt Yield: | 10.0% |
The following table presents recent leasing data at comparable retail properties with respect to the Seekonk Crossing Property:
| Comparable Retail Property Summary | |||||||
Property Name / City, State | Built | GLA | Tenant Name | Lease Area (SF) | Lease Date | Lease Term (Yrs.) | Rent PSF |
Seekonk Crossing 145-191 Highland Avenue Seekonk, MA | 1993 | 227,078 | Various | Various | Various | Various | $11.58 |
Gloucester Crossing Gloucester Crossing Road Gloucester, MA | 2019 | 207,400 | Home Goods
| 19,000 | Jan. 2019
| 10 | $12.00 |
The Ridge 80 Main Street Westbrook, ME | 2018 | 300,000 | Hobby Lobby
| 55,000 | Jan. 2019
| 15 | $9.50 |
Rhode Island Mall 650 Bald Hill Road Warwick, RI | 1968 | 600,000 | Raymour & Flanigan BJ’s Restaurant | 77,430 7,362 | July 2018 April 2018 | 10 10 | $6.72 $30.00 |
Cumberland Plaza 40 Cumberland Avenue North Attleboro, MA | 1999 | 59,305 | Planet Fitness
| 16,900 | June 2018 | 10 | $9.25 |
25 Pace Boulevard 25 Pace Boulevard Warwick, RI | 2012 | 110,000 | At Home | 110,000 | April 2017 | 10 | $5.00 |
Shops at Mayfair 220 Washington Street Attleboro, MA | 2017 | 54,665 | Smashburger
| 2,500 | July 2017
| 10 | $34.00 |
Augustine Plaza 124 Broadway Saugus, MA | 1973 | 25,444 | ATI Physical Therapy | 3,708 | June 2017 | 10 | $21.50 |
Cushing Plaza 739 Chief Justice Cushing Hwy Cohasset, MA | 1960 | 71,210 | Buttonwood Books | 4,150 | March 2017 | 10 | $27.03 |
Wampanoang Plaza 1925 Pawtucket Avenue East Providence, RI | 1970 | 220,758 | Sprint | 1,600 | Nov. 2016 | 5 | $25.00 |
Clocktower Square 80 Lambert Lind Highway Warwick, RI | 1987 | 31,151 | D’Angelo’s | 2,400 | Sept. 2016 | 5 | $19.22 |
Source: Appraisal
This is not a research report and was not prepared by any Underwriter’s research department. Please see additional important information and qualifications at the end of this Term Sheet.
T-117
| Retail - Anchored | Loan #11 | Cut-off Date Balance: | $23,000,000 | |
| 145, 165, 175, 179, 181 and 191 | Seekonk Crossing | Cut-off Date LTV: | 65.2% | |
| Highland Avenue | U/W NCF DSCR: | 1.93x | ||
| Seekonk, MA 02771 | U/W NOI Debt Yield: | 10.0% |
Operating History and Underwritten Net Cash Flow. The following table presents certain information relating to the historical operating performance and Underwritten Net Cash Flow at the Seekonk Crossing Property:
| Cash Flow Analysis | ||||||
| 2015 | 2016 | 2017 | 11/30/2018 TTM | UW | UW PSF | |
| Gross Potential Rent(1) | $2,273,577 | $2,316,913 | $2,434,317 | $2,567,621 | $2,629,347 | $11.58 |
| Total Recoveries | $801,322 | $866,828 | $964,573 | $1,015,750 | $1,053,421 | $4.64 |
| Other Income | $0 | $0 | $0 | $0 | $0 | $0.00 |
| Less Vacancy & Credit Loss | $0 | $0 | $0 | $0 | ($184,138) | ($0.81) |
| Effective Gross Income | $3,074,899 | $3,183,741 | $3,398,890 | $3,583,371 | $3,498,630 | $15.41 |
| Real Estate Taxes | $607,916 | $669,196 | $688,989 | $700,247 | $697,618 | $3.07 |
| Insurance | $39,065 | $29,429 | $28,186 | $27,666 | $29,699 | $0.13 |
| Other Expenses | $536,312 | $424,530 | $421,716 | $475,784 | $479,561 | $2.11 |
| Total Expenses | $1,183,293 | $1,123,155 | $1,138,891 | $1,203,697 | $1,206,878 | $5.31 |
| Net Operating Income | $1,891,606 | $2,060,586 | $2,259,999 | $2,379,674 | $2,291,752 | $10.09 |
| Capital Expenditures | $0 | $0 | $0 | $0 | $43,164 | $0.19 |
| TI/LC | $0 | $0 | $0 | $0 | $136,247 | $0.60 |
| Net Cash Flow | $1,891,606 | $2,060,586 | $2,259,999 | $2,379,674 | $2,112,341 | $9.30 |
| Occupancy %(2) | 96.6% | 96.8% | 98.7% | 100.0% | 95.0% | |
| NOI DSCR | 1.73x | 1.88x | 2.06x | 2.17x | 2.09x | |
| NCF DSCR | 1.73x | 1.88x | 2.06x | 2.17x | 1.93x | |
| NOI Debt Yield | 8.2% | 9.0% | 9.8% | 10.3% | 10.0% | |
| NCF Debt Yield | 8.2% | 9.0% | 9.8% | 10.3% | 9.2% |
|
| (1) | UW Gross Potential Rent is based on the underwritten rent roll dated November 14, 2018 and includes rent steps through January 2020 totaling $33,625. |
| (2) | UW Occupancy % represents economic occupancy. The Seekonk Crossing Property was 100.0% leased as of November 14, 2018. |
This is not a research report and was not prepared by any Underwriter’s research department. Please see additional important information and qualifications at the end of this Term Sheet.
T-118
(THIS PAGE INTENTIONALLY LEFT BLANK)
T-119
| Mortgage Loan No. 12 – Century Towers |
| Mortgage Loan Information | Property Information | ||||||
| Mortgage Loan Seller: | BANA | Single Asset/Portfolio: | Single Asset | ||||
| Credit Assessment (KBRA/Fitch/S&P): | NR/NR/NR | Location: | Kansas City, MO 64124 | ||||
| Original Balance: | $20,700,000 | General Property Type: | Mixed Use | ||||
| Cut-off Date Balance: | $20,700,000 | Detailed Property Type: | Multifamily/Office | ||||
| % of Initial Pool Balance: | 2.5% | Title Vesting: | Fee | ||||
| Loan Purpose: | Acquisition | Year Built/Renovated: | 1971/2001; 2018 | ||||
| Sponsors: | Tony Shen; Haoyu Wang; Gaocai | Size(4): | 308,924 SF | ||||
| Chen | Cut-off Date Balance per SF: | $67 | |||||
| Guarantors: | Tony Shen; Haoyu Wang; Gaocai | Maturity Date Balance per SF: | $62 | ||||
| Chen; Harmonia Hopkins, LLC; | Property Manager: | Red Stone Properties LLC (borrower-related) | |||||
| Hopkins Holding, Inc. | Underwriting and Financial Information | ||||||
| Mortgage Rate: | 5.4200% | UW NOI: | $2,000,505 | ||||
| Note Date: | 2/25/2019 | UW NOI Debt Yield: | 9.7% | ||||
| First Payment Date: | 4/1/2019 | UW NOI Debt Yield at Maturity: | 10.4% | ||||
| Maturity Date: | 3/1/2029 | UW NCF DSCR: | 1.55x (IO) 1.26x (P&I) | ||||
| Original Term to Maturity: | 120 months | Most Recent NOI: | $2,134,675 (12/31/2018) | ||||
| Original Amortization Term: | 360 months | 2nd Most Recent NOI: | $2,142,591 (12/31/2017) | ||||
| IO Period: | 60 months | 3rd Most Recent NOI: | $2,257,452 (12/31/2016) | ||||
| Seasoning: | 1 month | Most Recent Occupancy: | 99.7% (1/31/2019) | ||||
| Prepayment Provisions: | LO (25); DEF (91); O (4) | 2nd Most Recent Occupancy: | 99.7% (12/31/2017) | ||||
| Lockbox/Cash Mgmt Status(1): | Springing/Springing | 3rd Most Recent Occupancy: | 99.7% (12/31/2016) | ||||
| Additional Debt Type: | N/A | Appraised Value (as of): | $34,200,000 (11/15/2018) | ||||
| Additional Debt Balance: | N/A | Appraised Value per SF: | $111 | ||||
| Future Debt Permitted (Type): | No (N/A) | Cut-off Date LTV Ratio: | 60.5% | ||||
| Reserves | Maturity Date LTV Ratio: | 56.3% | |||||
| Type | Initial | Monthly | Cap | ||||
| RE Tax(2): | $37,673 | $7,535 | N/A | ||||
| Insurance: | $0 | Springing(3) | N/A | ||||
| Immediate Repairs: | $36,563 | $0 | N/A | ||||
| Recurring Replacements: | $61,128 | $9,283 | N/A | ||||
| TI/LC: | $0 | $10,164 | N/A | ||||
| Sources and Uses | ||||||
| Sources | Proceeds | % of Total | Uses | Proceeds | % of Total | |
| Loan Amount: | $20,700,000 | 58.8% | Purchase Price: | $34,000,000 | 96.5% | |
| Borrower Equity: | $14,520,316 | 41.2% | Closing Costs: | $1,084,953 | 3.1% | |
| Reserves: | $135,364 | 0.4% | ||||
| Total Sources: | $35,220,316 | 100.0% | Total Uses: | $35,220,316 | 100.0% | |
| (1) | Springing upon the occurrence of (i) an event of default, (ii) DSCR less than 1.18x on a trailing twelve month basis or (iii) City of Kansas City, Missouri or any of its affiliates (1) vacates or gives notice to vacate, (2) defaults in the payment of rent, (3) is subject to a bankruptcy proceeding or (4) experiences a downgrade in long-term unsecured debt rating below BBB- by S&P. |
| (2) | The Century Towers Property (as defined below) benefits from a Chapter 353 tax abatement which provides 100% and 50% tax abatement for the first 10 years and subsequent 15 years, respectively. During the first 10 years, the Century Towers Property is not subject to real property taxes except in the amount of taxes assessed on the land, exclusive of improvements during the calendar year preceding implementation of the program. During the next 15 years, the Century Towers Property may be assessed up to 50% of its market value. The Century Towers Property is currently in Year 17 of the program, and as such, it benefits from tax savings based on 50% of the market value until expiration in 2026. |
| (3) | The Century Towers Mortgage Loan (as defined below) documents do not require ongoing monthly insurance deposits so long as a blanket policy is in place. |
| (4) | The Century Towers Property is comprised of 237 multifamily units totaling 158,165 SF and office space totaling 150,759 SF. |
The Mortgage Loan. The twelfth largest mortgage loan (the “Century Towers Mortgage Loan”) is evidenced by a promissory note in the original principal amount of $20,700,000 and secured by the first priority fee mortgage on a 308,924 SF mixed use multifamily/office property located in Kansas City, Missouri (the “Century Towers Property”).
The Borrower and the Sponsors. The borrower is HH CT Property LLC, a Delaware limited liability company, structured to be bankruptcy-remote with at least one independent director (the “Century Towers Borrower”).
Tony Shen, Haoyu Wang, Gaocai Chen, Harmonia Hopkins, LLC and Hopkins Holding, Inc. are the nonrecourse carve-out guarantors for the Century Towers Mortgage Loan. Tony Shen, Haoyu Wang and Gaocai Chen are the borrower sponsors for the Century Towers Mortgage Loan. Haoyu Wang is the founder and CEO of HH Fund, a private equity firm focusing on investment and management of student housing as well as post-study abroad services. The Century Towers Borrower is contributing approximately $14.5 million to purchase the Century Towers Property.
The Property. The Century Towers Property is a mixed-use multifamily and office building located across the street from the Kansas City University of Medicine & Biosciences (“KCUMB”) in Kansas City, Missouri. The Century Towers Property was originally constructed in 1971 as the teaching hospital
This is not a research report and was not prepared by any Underwriter’s research department. Please see additional important information and qualifications at the end of this Term Sheet.
T-120
| Mixed Use – Multifamily/Office | Loan #12 | Cut-off Date Balance: | $20,700,000 | |
| 612 Garfield Avenue | Century Towers | Cut-off Date LTV: | 60.5% | |
| Kansas City, MO 64124 | U/W NCF DSCR: | 1.26x | ||
| U/W NOI Debt Yield: | 9.7% |
for the University of Health Sciences and was converted in 2001 into a mixed use building containing 224 one- and two-bedroom multifamily units as well as 150,759 SF of office space on the bottom two floors. In 2018, an additional 13 apartment units were completed bringing the total unit count to 237. There is also an additional 20,000 SF of unused space that can be developed (no potential income from this space was underwritten). Rent from multifamily units at the Century Towers Property accounts for approximately 60% of net rental income with the remaining 40% coming from tenants occupying office space.
Founded in 1916, KCUMB is one of the nation’s founding colleges of osteopathic medicine and is home to over 1,100 students on its 23-acre campus, across Independence Avenue from the Century Towers Property. Approximately 70% of the multifamily tenants at the Century Towers Property are affiliated with the university. KCUMB announced in February 2017 plans for a $60 million expansion to upgrade the clinical training center, provide additional offices and classrooms and add a medical simulation building. KCUMB is the largest medical school in Missouri, the 10th largest medical school in the nation and the second leading producer of physicians for Missouri and Kansas.
Multifamily unit amenities at the Century Towers Property include kitchens which are fully equipped with modern appliances, built-in shelving and separate bathrooms for the two-bedroom units. Building amenities include a fitness center, coffee bar, lounge with a private covered balcony, dog park, dog wash room, group study room, library with private study alcoves, picnic areas with grilling stations and skyline views. The Century Towers Property has 454 parking spaces which equates to 1.92 parking spaces per multifamily unit. Parking spaces are provided to tenants at no additional charge. All multifamily leases at the Century Towers Property are signed for 12-month terms. Historical occupancy for the multifamily space has been at or near 100% since it was developed in 2001.
The following table presents certain information relating to the multifamily unit mix at the Century Towers Property:
| Unit Mix | ||||||
| Unit Type | # Units | Unit Size (SF) | Avg. Market Rent | Avg. Market Rent PSF | Avg. Contract Rent | Avg. Contract Rent PSF |
| 1BR, 1BA | 164 | 550 | $726 | $1.32 | $716 | $1.30 |
| 1BR, 1BA | 3 | 831-1,018 | $935 | $1.00 | $925 | $0.99 |
| 2BR, 2BA | 48(1) | 822 | $978 | $1.19 | $968 | $1.18 |
| 2BR, 2BA | 12 | 1,087 | $1,165 | $1.07 | $1,155 | $1.06 |
| 2BR, 2BA | 10 | 1,193-1,440 | $1,515 | $1.20 | $1,502 | $1.19 |
| Total/Wtd. Avg. | 237 | 667 | $835 | $1.25 | $825 | $1.24 |
Information is based on the borrower rent roll.
| (1) | One 822 SF unit is currently used as a model unit and is underwritten as vacant. |
The office space at the Century Towers Property has been 100% leased to the City of Kansas City Missouri (rated Aa2/AA by Moody’s/S&P) since 2002 and is utilized by various life/safety municipal services, including the police department, fire department and the city’s emergency operations command center. The City of Kansas City Missouri’s original lease commenced in February 2002 through February 2018 and the City recently executed 21, one-year automatic renewal options that extends the term through February 2039. The office lease has a landlord lease income protection provision, whereby at any time the tenant declines a one-year renewal option, or does not budget and appropriate funds sufficient to pay all rent due during such one-year extension of the term, it is required to pay to the landlord a termination charge equal to 50% of the total sum of the (a) annual base rent, (b) annual roof areas rent and (c) adjustment rent (CAM), that would otherwise be payable through the fully extended lease term of February 2039.
The Market. The Century Towers Property is located in the Kansas City market and the Downtown/East Kansas City multifamily submarket and the Kansas City office submarket and is located within the city limits of Kansas City in Jackson County, Missouri. The Century Towers Property is located at 612 Garfield Avenue with primary access to the area provided by Interstate 70, a major east/west arterial across the Kansas City metro area. Access to the Century Towers Property from Interstate 70 is provided by The Paseo, Prospect Avenue and Independence Avenue and approximate travel time from Interstate 70 to the Century Towers Property is less than five minutes. The Century Towers Property is located approximately 20.7 miles from the Kansas City International Airport and approximately 2.9 miles from the Kansas City central business district.
According to the appraisal, the major employers in the area include Cerner Corp. (12,890 employees), HCA Midwest Health System (9,924 employees), The University of Kansas Hospital (9,469 employees), Saint Luke’s Health System (8,123 employees), Ford Motor Co. (7,220 employees), Children’s Mercy Hospital & Clinics (6,969 employees), Sprint Corp. (6,000 employees), DST Systems Inc. (3,631 employees), General Motors Corp. (3,400 employees), and Garmin International Inc. (3,329 employees). According to the appraisal, Downtown Kansas City is experiencing significant development and revitalization in its history, with nearly $10 billion in economic development since 2000 and an expanding employee and resident base of nearly 80,000 and 25,000 people, respectively. In addition, Downtown is home to the metro’s top entertainment and cultural amenities, including the Power & Light Entertainment District, Sprint Center Arena, the Kaufmann Center for the Performing Arts, and the Historic River Market.
According to the appraisal, as of the third quarter 2018, the Kansas City metro multifamily vacancy rate and asking rents per unit are 4.7% and $867, respectively. According to the appraisal, as of the third quarter 2018, the Kansas City metro office vacancy rate and asking rents PSF are 6.8% and $19.62, respectively. According to a third party research report, the estimated 2018 population within a one-, three- and five-mile radius of the Century Towers Property was 14,571, 84,044 and 205,581, respectively. According to a third party research report, the 2018 average household income within the same radii was $43,161, $46,434 and $50,297, respectively.
This is not a research report and was not prepared by any Underwriter’s research department. Please see additional important information and qualifications at the end of this Term Sheet.
T-121
| Mixed Use – Multifamily/Office | Loan #12 | Cut-off Date Balance: | $20,700,000 | |
| 612 Garfield Avenue | Century Towers | Cut-off Date LTV: | 60.5% | |
| Kansas City, MO 64124 | U/W NCF DSCR: | 1.26x | ||
| U/W NOI Debt Yield: | 9.7% |
The following table presents competitive multifamily properties with respect to the Century Towers Property:
| Summary of Competitive Multifamily Properties | |||||||||
| Property Name Address City, State | Year Built/ Renovated # Stories | Distance From Subject | Occ. | Units | Beds / Bath | Units | Avg. Unit SF | Avg. Rent/Month | Avg. Rent/ SF |
Century Towers 612 Garfield Ave. Kansas City | 1971/2001;2018 9 stories
| N/A | 99.5%(1) | 237 | 1BR / 1BA 1BR / 1BA 2BR / 2BA 2BR / 2BA 2BR / 2BA | 164 3 48 12 10 | 550 831-1,018 822 1,087 1,193-1,440 | $716 $925 $968 $1,155 $1,502 | $1.30 $0.99 $1.18 $1.06 $1.19 |
Olive Park Village 2310 E. 9th St. Kansas City, MO | 1973/2017 2 stories | 0.5 miles | 98% | 137 | 1BR / 1BA 2BR / 1BA 3BR / 1BA 4BR / 1.5BA | 41 74 11 11 | 475 525 975 1,075 | $631 $762 $1,027 $1,159 | $1.33 $1.45 $1.05 $1.08 |
Stonewall Court Apartments 2500 Independence Ave. Kansas City, MO | 1916/N/A 2 stories | 0.5 miles | 94% | 108 | 1BR / 1BA 1BR / 1BA | 68 40 | 500 600 | $475 $505 | $0.95 $0.84 |
Dorson Apartments 912 Benton Blvd. Kansas City, MO | 1920/2016 3 stories | 1.1 miles | 93% | 29 | 1BR / 1BA 2BR / 1BA | 14 15 | 500 675 | $720 $821 | $1.44 $1.22 |
Walnut Tower 722 Walnut St. Kansas City, MO | 1963/2012 12 stories
| 1.6 miles | 97% | 180 | Studio Studio 1BR / 1BA 1BR / 1BA 1BR / 1BA 2BR / 1BA | 24 12 49 47 24 24 | 440 465 590 610 630 725 | $769 $789 $889 $909 $949 $1,119 | $1.75 $1.70 $1.51 $1.49 $1.51 $1.54 |
Library Lofts 1004 Baltimore Ave. Kansas City, MO | 1904/2002 10 stories
| 1.7 miles | 96% | 118 | Studio 1BR / 1BA 2BR / 2BA | 57 49 12 | 537 726 1,239 | $828 $1,048 $1,559 | $1.54 $1.44 $1.26 |
KC Highline 929 Jefferson St. Kansas City, MO | 1961/2018 N/A
| 2.4 miles | 87% | 96 | Studio Studio Studio 1BR / 1BA 1BR / 1BA 1BR / 1BA 1BR / 1BA 2BR / 1BA 2BR / 1BA | 10 10 16 29 18 10 1 1 1 | 375 385 400 490 504 524 630 732 1,067 | $790 $760 $770 $850 $865 $885 N/A $1,125 $1,250 | $2.11 $1.97 $1.93 $1.73 $1.72 $1.69 N/A $1.54 $1.17 |
Source: Appraisal for the competitive set and borrower rent roll for the Century Towers Property.
| (1) | Occupancy reflects multifamily portion of the Century Towers Property. |
The following table presents comparable office leases with respect to the Century Towers Property:
| Summary of Comparable Office Leases | |||||||||
Property Name Address City, State | Year Built/ Renovated # Stories | Distance From Subject | Bldg. SF | Tenant | Tenant SF | Lease Start/Term | Rent/SF | TI/SF | Lease Type |
Century Towers 612 Garfield Ave. Kansas City | 1971/2001;2018 9 stories | N/A | 308,924 | City of Kansas City Missouri | 150,759 | Feb. 2002/ 444 months | $6.54 | N/A | Modified Gross |
Sprint Campus 6100 Sprint Pky. Overland Park, KS | 2001/N/A 3 stories
| 20.5 miles | 3,577,878 | Physician’s Office Group | 104,714 | Aug. 2019/ 72 months
| $7.08 | $12.00 | Full Service |
Sprint Campus 6100 Sprint Pky. Overland Park, KS | 2001/N/A 3 stories | 20.5 miles | 3,577,878 | Sprint | 1,012,933 | Jan. 2019/ 120 months | $3.67 | $0 | Triple Net |
Office Building 701A & 801A NW Plaza St. Ann, MO | 2016/N/A 2 stories
| 233 miles | 140,082 | St. Louis County | 140,082 | Jan. 2017/ 240 months
| $12.98 | N/A | Triple Net |
Source: Appraisal and rent roll.
This is not a research report and was not prepared by any Underwriter’s research department. Please see additional important information and qualifications at the end of this Term Sheet.
T-122
| Mixed Use – Multifamily/Office | Loan #12 | Cut-off Date Balance: | $20,700,000 | |
| 612 Garfield Avenue | Century Towers | Cut-off Date LTV: | 60.5% | |
| Kansas City, MO 64124 | U/W NCF DSCR: | 1.26x | ||
| U/W NOI Debt Yield: | 9.7% |
Operating History and Underwritten Net Cash Flow.The following table presents certain information relating to the historical operating performance and Underwritten Net Cash Flow at the Century Towers Property:
| Cash Flow Analysis | ||||||
| 2015 | 2016 | 2017 | 2018 | UW | UW PSF | |
| Gross Potential Rent(1) | $2,017,560 | $2,058,616 | $2,068,160 | $2,305,385 | $2,363,880 | $7.65 |
| Office Income(2) | $1,660,253 | $1,704,706 | $1,683,264 | $1,605,842 | $1,588,521 | $5.14 |
| Other Income(3) | $65,330 | $100,664 | $124,453 | $110,160 | $110,160 | $0.36 |
| Vacancy and Credit Loss | ($55,554) | ($50,161) | ($27,549) | ($122,189)(4) | ($130,013) | ($0.42) |
| Effective Gross Income | $3,687,589 | $3,813,825 | $3,848,328 | $3,899,198 | $3,932,548 | $12.73 |
| Taxes(5) | $85,166 | $21,939 | $167,836 | $86,938 | $378,390 | $1.22 |
| Insurance | $89,981 | $101,565 | $94,344 | $94,030 | $94,985 | $0.31 |
| Other Operating Expenses | $1,401,481 | $1,432,869 | $1,443,557 | $1,583,555 | $1,458,668 | $4.72 |
| Total Operating Expenses | $1,576,628 | $1,556,373 | $1,705,737 | $1,764,523 | $1,932,043 | $6.25 |
| Net Operating Income | $2,110,961 | $2,257,452 | $2,142,591 | $2,134,675 | $2,000,505 | $6.48 |
| Capital Expenditures | $0 | $0 | $0 | $114,256 | $111,390 | $0.36 |
| TI/LC | $0 | $0 | $0 | $0 | $121,964 | $0.39 |
| Net Cash Flow | $2,110,961 | $2,257,452 | $2,142,591 | $2,020,419 | $1,767,151 | $5.72 |
| Occupancy % | 99.7% | 99.7% | 99.7% | 99.7%(6) | 96.7% | |
| NOI DSCR (IO) | 1.86x | 1.98x | 1.88x | 1.88x | 1.76x | |
| NOI DSCR (P&I) | 1.51x | 1.61x | 1.53x | 1.53x | 1.43x | |
| NCF DSCR (IO) | 1.86x | 1.98x | 1.88x | 1.78x | 1.55x | |
| NCF DSCR (P&I) | 1.51x | 1.61x | 1.53x | 1.45x | 1.26x | |
| NOI Debt Yield | 10.2% | 10.9% | 10.4% | 10.3% | 9.7% | |
| NCF Debt Yield | 10.2% | 10.9% | 10.4% | 9.8% | 8.5% |
|
| (1) | UW Gross Potential Rent is for multifamily only and is based on the October 31, 2018 rent roll. |
| (2) | Office Income represents gross potential rent from the office space of $1,672,127 net of an applied 5% vacancy reduction (despite the office space being 100% occupied). |
| (3) | Other Income includes utility reimbursements, late fees, application fees, pet fees and other miscellaneous income. |
| (4) | The increase in Vacancy and Credit Loss in 2018 was due to 13 additional multifamily units coming online. |
| (5) | The Century Towers Property benefits from a Chapter 353 tax abatement which provides 100% and 50% tax abatement for the first 10 years and subsequent 15 years, respectively. During the first 10 years, the Century Towers Property is not subject to real property taxes except in the amount of taxes assessed on the land, exclusive of improvements during the calendar year proceeding implementation of the program. During the next 15 years, the Century Towers Property may be assessed up to 50% of its market value. The Century Towers Property is currently in Year 17 of the program, and as such, it benefits from tax savings based on 50% of the market value until expiration in 2026. Taxes have been underwritten based on a net present value basis across the loan term. |
| (6) | The Century Towers Property is 99.7% occupied as of January 31, 2019. |
This is not a research report and was not prepared by any Underwriter’s research department. Please see additional important information and qualifications at the end of this Term Sheet.
T-123
| Mortgage Loan No. 13 – Esplanade Apartments |
| Mortgage Loan Information | Property Information | ||||||
| Mortgage Loan Seller: | MSMCH | Single Asset/Portfolio: | Single Asset | ||||
| Credit Assessment (KBRA/Fitch/S&P): | NR/NR/NR | Location: | Las Vegas, NV 89148 | ||||
| Original Balance: | $19,000,000 | General Property Type: | Multifamily | ||||
| Cut-off Date Balance: | $19,000,000 | Detailed Property Type: | Garden | ||||
| % of Initial Pool Balance: | 2.3% | Title Vesting: | Fee | ||||
| Loan Purpose: | Refinance | Year Built/Renovated: | 2007/N/A | ||||
| Sponsor: | WTI Inc. | Size: | 194 Units | ||||
| Guarantor: | WTI Inc. | Cut-off Date Balance per Unit: | $97,938 | ||||
| Mortgage Rate: | 4.4000% | Maturity Date Balance per Unit: | $97,938 | ||||
| Note Date: | 3/8/2019 | Property Manager: | ConAm Management Corporation | ||||
| First Payment Date: | 5/1/2019 | Underwriting and Financial Information | |||||
| Maturity Date: | 4/1/2029 | UW NOI: | $1,963,754 | ||||
| Original Term to Maturity: | 120 months | UW NOI Debt Yield: | 10.3% | ||||
| Original Amortization Term: | 0 months | UW NOI Debt Yield at Maturity: | 10.3% | ||||
| IO Period: | 120 months | UW NCF DSCR: | 2.26x | ||||
| Seasoning: | 0 months | Most Recent NOI: | $1,985,063 (12/31/2018) | ||||
| Prepayment Provisions: | LO (24); DEF (92); O (4) | 2nd Most Recent NOI: | $1,847,694 (12/31/2017) | ||||
| Lockbox/Cash Mgmt Status: | Springing/Springing | 3rd Most Recent NOI: | $1,572,493 (12/31/2016) | ||||
| Additional Debt Type: | N/A | Most Recent Occupancy: | 99.0% (1/28/2019) | ||||
| Additional Debt Balance: | N/A | 2nd Most Recent Occupancy: | 97.7% (12/31/2018) | ||||
| Future Debt Permitted (Type): | No (N/A) | 3rd Most Recent Occupancy: | 96.0% (12/31/2017) | ||||
| Reserves | Appraised Value (as of): | $32,600,000 (11/29/2018) | |||||
| Type | Initial | Monthly | Cap | Appraised Value per Unit: | $168,041 | ||
| RE Tax: | $16,332 | $16,332 | N/A | Cut-off Date LTV Ratio: | 58.3% | ||
| Insurance: | $23,603 | $3,388 | N/A | Maturity Date LTV Ratio: | 58.3% | ||
| Recurring Replacements: | $0 | $4,042 | N/A | ||||
| Deferred Maintenance: | $5,000 | $0 | N/A | ||||
| Condominium Charges(1): | $0 | Springing | N/A | ||||
| Sources and Uses | ||||||
| Sources | Proceeds | % of Total | Uses | Proceeds | % of Total | |
| Loan Amount: | $19,000,000 | 100.0% | Loan Payoff: | $9,116,720 | 48.0% | |
| Return of Equity: | $9,409,324 | 49.5% | ||||
| Closing Costs: | $429,020 | 2.3% | ||||
| Reserves: | $44,935 | 0.2% | ||||
| Total Sources: | $19,000,000 | 100.0% | Total Uses: | $19,000,000 | 100.0% | |
| (1) | Monthly deposits into the Condominium Charges reserve will occur upon (a) an event of default, (b) the debt service coverage ratio dropping below 1.15x for three consecutive calendar quarters based on the trailing three (3) calendar quarter period |
The Mortgage Loan. The thirteenth largest mortgage loan (the ���Esplanade Apartments Mortgage Loan”) is evidenced by a promissory note in the original principal amount of $19,000,000 secured by a first priority fee mortgage encumbering 194 units in a garden-style apartment community in Las Vegas, Nevada known as Esplanade Apartments (the “Esplanade Apartments Property”). The proceeds of the Esplanade Apartments Mortgage Loan were primarily used to refinance a previous loan of approximately $9.1 million, fund reserves, pay closing costs and return equity of approximately $9.4 million to the Esplanade Apartments Borrowers (as defined below).
The Borrowers and Borrower Sponsor. The borrowers are Fivex Capital, LLC, a single purpose Nevada limited liability company, Esplanade 2095, LLC, a single purpose Nevada limited liability company and Riverview Development Nevada, LLC, a single purpose Delaware limited liability company (collectively, the “Esplanade Apartments Borrowers”), with each having no independent directors. WTI Inc. is the nonrecourse carve-out guarantor and the borrower sponsor of the Esplanade Apartments Mortgage Loan. The Esplanade Apartments Borrowers are wholly owned by WTI Inc.
WTI Inc. was established in San Jose, California over 25 years ago and completed its first real estate transaction in 1992 when it acquired a 32.6 acre office campus in San Jose. WTI Inc. also owns over 1,200 apartments in three residential communities (Renaissance Villas, the Esplanade Apartments Property, and Avalon at Seven Hills) and an approximate 50-acre development project in Las Vegas. WTI Inc. is controlled by Christine Ma, who is an investor based in Hong Kong. The president and chief financial officer of WTI Inc. is Lumin Chang, who is domiciled in Taiwan.
The Property.The Esplanade Apartments Property encompasses 194 Class A, garden-style apartment units built in 2007 and located in Las Vegas, Nevada. The Esplanade Apartments Property is part of a larger complex comprised of 382 units originally built as separate condominium units in a condominium. Of the 382 total units, 194 units will serve as the collateral for the Esplanade Apartments Mortgage Loan, which represents 50.8% of the total condominium interests. The remaining 188 units are owned by individual condominium owners and are scattered throughout the site. The units are contained within 26 two and three-story buildings on an approximate 18.4-acre site. Amenities at the Esplanade Apartments Property include upgraded kitchens, custom cabinetry, design color schemes, tech stations with high speed internet, pantry, private patio/balcony, oversized walk-in closets,
This is not a research report and was not prepared by any Underwriter’s research department. Please see additional important information and qualifications at the end of this Term Sheet.
T-124
| Multifamily - Garden | Loan #13 | Cut-off Date Balance: | $19,000,000 | |
| 8777 West Maule Avenue | Esplanade Apartments | Cut-off Date LTV: | 58.3% | |
| Las Vegas, NV 89148 | U/W NCF DSCR: | 2.26x | ||
| U/W NOI Debt Yield: | 10.3% |
gated/controlled access, clubhouse, fitness center, swimming pool and spa, extra storage facilities and 16 elevators. Each unit features a kitchen with a dishwasher, a garbage disposal, a built in microwave, a washing machine and a dryer. The Esplanade Apartments Property also includes 262 total parking spaces (1.4 parking spaces per unit). Of the entire 420 parking spaces at the community, 92 spaces are located in an attached garage, 194 are covered and 134 are open surfaces spaces. As of January 28, 2019 the Esplanade Apartments Property is 99.0% occupied and has a total of two model units. Since acquiring the Esplanade Apartments Property, the Esplanade Apartments Borrowers spent approximately $281,000 on capital expenditures, which included new A/C compressors, appliance purchases, carpet and floor renovation, water heater renovations and more.
The table below shows the apartment unit mix at the Esplanade Apartments Property:
| Esplanade Apartments Unit Mix Summary | ||||||
Floor Plan
| No. of Units
| % of Total Units
| Average Unit Size (SF) | Total SF
| Monthly Asking Rent Per Unit | Market Rent |
| 1 Bed / 1 Bath - Metro | 6 | 3.1% | 903 | 5,416 | $1,068 | $1,050 |
| 1 Bed / 1 Bath - Oxford | 26 | 13.4% | 941 | 24,466 | $1,117 | $1,100 |
| 2 Bed / 2 Bath - Henley | 16 | 8.2% | 1,191 | 19,056 | $1,213 | $1,200 |
| 2 Bed / 2 Bath - Shea | 24 | 12.4% | 1,199 | 28,776 | $1,242 | $1,225 |
| 2 Bed / 2 Bath - Soho | 8 | 4.1% | 1,212 | 9,696 | $1,363 | $1,335 |
| 2 Bed / 2 Bath - Grier | 28 | 14.4% | 1,238 | 34,664 | $1,244 | $1,275 |
| 2 Bed / 2 Bath - Chelsea | 18 | 9.3% | 1,295 | 23,310 | $1,367 | $1,360 |
| 2 Bed / 3 Bath - Manhattan | 16 | 8.2% | 1,508 | 24,128 | $1,536 | $1,500 |
| 2 Bed / 3 Bath - Tribeca | 17 | 8.8% | 1,693 | 28,789 | $1,614 | $1,575 |
| 3 Bed / 2 Bath - Kent | 35 | 18.0% | 1,381 | 48,335 | $1,349 | $1,400 |
| Total/Wtd. Avg. | 194 | 100.0% | 1,271 | 246,636 | $1,310 | $1,311 |
Source: Appraisal.
The Market.According to the appraisal, the Esplanade Apartments Property is located in the southwest area of Las Vegas. Primary access to the Esplanade Apartments Property is provided by Interstate 215, a major freeway arterial that crosses the Las Vegas metro area from the southeast to the northwest. Public transportation is provided by RTC and provides access to various areas throughout the Las Vegas Valley. The Esplanade Apartments Property is in close proximity to the McCarran International Airport. The Esplanade Apartments Property is located within the West multifamily submarket of the Las Vegas multifamily market. According to the appraisal, as of the third quarter of 2018 the Las Vegas multifamily market contains 147,829 inventory units, has an average vacancy of 3.6% and asking rents of $1,017 per month. According to the appraisal, as of the third quarter of 2018 the West multifamily submarket contains 26,658 inventory units, has an average vacancy of 6.4% and asking rents of $1,283 per month.
The estimated 2018 population within a one-, three- and five-mile radius of the Esplanade Apartments Property is 16,084, 116,260 and 295,318, respectively, according to the appraisal. The estimated 2018 median household income within a one-, three- and five-mile radius of the Esplanade Apartments Property is $57,553, $66,712 and $62,560, respectively.
This is not a research report and was not prepared by any Underwriter’s research department. Please see additional important information and qualifications at the end of this Term Sheet.
T-125
| Multifamily - Garden | Loan #13 | Cut-off Date Balance: | $19,000,000 | |
| 8777 West Maule Avenue | Esplanade Apartments | Cut-off Date LTV: | 58.3% | |
| Las Vegas, NV 89148 | U/W NCF DSCR: | 2.26x | ||
| U/W NOI Debt Yield: | 10.3% |
Comparable rental properties to the Esplanade Apartments Property are shown in the table below:
| Esplanade Apartments Property Comparable Rentals Summary | ||||||
| Address City, State | Year Built | Occupancy | Beds/Bath | Units | Unit Size (SF) | Rent per Month |
Esplanade Apartments 8777 West Maule Avenue Las Vegas, NV | 2007 | 99% | 1 BD/1 BA 2 BD/2 BA 2 BD/3 BA 3 BD/3 BA | 32 94 33 35 | 934 1,229 1,603 1,381 | 1,108 1,272 1,576 1,349 |
Cantera At Coronado Ranch 7600 South Rainbow Boulevard Las Vegas, NV | 2005 | 98% | 1 BD/1 BA 1 BD/1 BA 1 BD/1 BA 1 BD/1 BA 1 BD/1 BA 2 BD/1 BA 2 BD/2 BA 2 BD/2 BA 2 BD/2 BA 2 BD/2 BA 3 BD/2 BA 3 BD/2 BA | 22 24 45 24 22 10 28 29 29 29 14 14 | 715 799 862 928 982 981 959 1,036 1,259 1,321 1,310 1,321 | $1,010 $1,135 $1,151 $1,086 $1,185 $1,362 $1,170 $1,210 $1,365 $1,452 $1,432 $1,490 |
Cabrillo 7955 West Badura Avenue Las Vegas, NV | 2008 | 92% | 1BD/1BA 1BD/1BA 2BD/2BA 2BD/2BA 3BD/2BA | 24 42 66 86 24 | 695 771 1,053 1,124 1,218 | $1,043 $1,093 $1,238 $1,253 $1,418 |
The Covington at Coronado 7800 South Rainbow Boulevard Las Vegas, NV | 2004 | 96% | 1 BD/1 BA 1 BD/1 BA 1 BD/1 BA 2 BD/1 BA 2 BD/2 Bath + Gar 2 BD/2 BA 2 BD/2 BA 3 BD/2 BA | 36 36 84 16 7 84 82 16 | 683 747 752 926 1,010 1,138 1,144 1,188 | $960 $1,050 $1,067 $1,201 $1,375 $1,235 $1,275 $1,395 |
Resort at Coronado Ranch 7777 South Jones Boulevard Las Vegas, NV | 2004 | 98% | 1BD/1.5BA 1BD/1.5BA 2BD/2BA 2BD/2BA 2BD/2.5BA 3BD/3BA | 36 73 38 77 97 69 | 788 898 1,074 1,202 1,098 1,310 | $1,105 $1,100 $1,264 $1,341 $1,400 $1,475 |
Resort at the Lakes 9999 West Katie Avenue Las Vegas, NV | 2000 | 95% | 1BD/1BA 1BD/1BA 2BD/2BA 2BD/2BA 2BD/2.5BA 3BD/2.5BA | 27 53 42 85 123 97 | 788 898 1,074 1,202 1,097 1,310 | $1,050 $1,125 $1,270 $1,270 $1,350 $1,495 |
Source: Appraisal.
This is not a research report and was not prepared by any Underwriter’s research department. Please see additional important information and qualifications at the end of this Term Sheet.
T-126
| Multifamily - Garden | Loan #13 | Cut-off Date Balance: | $19,000,000 | |
| 8777 West Maule Avenue | Esplanade Apartments | Cut-off Date LTV: | 58.3% | |
| Las Vegas, NV 89148 | U/W NCF DSCR: | 2.26x | ||
| U/W NOI Debt Yield: | 10.3% |
Operating History and Underwritten Net Cash Flow.The following table presents certain information relating to the historical operating performance and the Underwritten Net Cash Flow at the Esplanade Apartments Property:
| Cash Flow Analysis | |||||
| 2016 | 2017 | 2018 | UW | UW per Unit | |
| Gross Potential Rent | $2,725,511 | $2,878,344 | $2,939,808 | $2,983,740 | $15,380.10 |
| Other Income(1) | $247,513 | $243,510 | $266,533 | $266,533 | $1,373.88 |
| Concessions | ($59,835) | ($40,756) | ($16,101) | ($16,101) | $82.99 |
| Less Vacancy & Credit Loss | ($231,008) | ($173,080) | ($140,368) | ($149,187) | ($769.01) |
| Effective Gross Income | $2,682,181 | $2,908,018 | $3,049,871 | $3,084,985 | $15,901.98 |
| Real Estate Taxes | $143,232 | $144,437 | $139,756 | $190,275 | $980.80 |
| Insurance | $19,725 | $15,788 | $19,614 | $15,780 | $81.34 |
| Other Expenses | $946,731 | $900,099 | $905,438 | $915,176 | $4,717.40 |
| Total Expenses | $1,109,688 | $1,060,324 | $1,064,808 | $1,121,231 | $5,779.54 |
| Net Operating Income | $1,572,493 | $1,847,694 | $1,985,063 | $1,963,754 | $10,122.44 |
| Capital Expenditures | $0 | $0 | $0 | $48,500 | $250.00 |
| Net Cash Flow | $1,572,493 | $1,847,694 | $1,985,063 | $1,915,254 | $9,872.44 |
| Occupancy % | 94.7% | 96.0% | 99.0%(2) | 95.0% | |
| NOI DSCR | 1.86x | 2.18x | 2.34x | 2.32x | |
| NCF DSCR | 1.86x | 2.18x | 2.34x | 2.26x | |
| NOI Debt Yield | 8.3% | 9.7% | 10.4% | 10.3% | |
| NCF Debt Yield | 8.3% | 9.7% | 10.4% | 10.1% | |
| (1) | Other Income is comprised of residential reimbursements, laundry and parking. |
| (2) | Occupancy % as of January 28, 2019. |
This is not a research report and was not prepared by any Underwriter’s research department. Please see additional important information and qualifications at the end of this Term Sheet.
T-127
| Mortgage Loan No. 14 – Pontiac West Industrial |
| Mortgage Loan Information | Mortgaged Property Information | ||||||
| Mortgage Loan Seller: | WFB | Single Asset/Portfolio: | Single Asset | ||||
| Credit Assessment (KBRA/Fitch/S&P): | NR/NR/NR | Location: | Pontiac, MI 48341 | ||||
| Original Balance: | $18,375,000 | General Property Type: | Industrial | ||||
| Cut-off Date Balance: | $18,355,702 | Detailed Property Type: | Warehouse | ||||
| % of Initial Pool Balance: | 2.2% | Title Vesting: | Fee | ||||
| Loan Purpose: | Refinance | Year Built/Renovated: | 1946/2018 | ||||
| Sponsors: | Christopher Semarjian; Stuart Lichter | Size: | 551,400 SF | ||||
| Guarantor: | Christopher Semarjian; Stuart Lichter | Cut-off Date Balance per SF: | $33 | ||||
| Mortgage Rate: | 5.0500% | Maturity Date Balance per SF: | $28 | ||||
| Note Date: | 3/8/2019 | Property Manager: | IRG Realty Advisors, LLC (borrower-related)
| ||||
| First Payment Date: | 4/11/2019 | ||||||
| Maturity Date: | 3/11/2029 | Underwriting and Financial Information | |||||
| Original Term to Maturity: | 120 months | UW NOI(3): | $1,837,012 | ||||
| Original Amortization Term: | 360 months | UW NOI Debt Yield: | 10.0% | ||||
| IO Period: | 0 months | UW NOI Debt Yield at Maturity: | 12.1% | ||||
| Seasoning: | 1 month | UW NCF DSCR: | 1.39x | ||||
| Prepayment Provisions: | LO (25); DEF (91); O (4) | Most Recent NOI(3): | $1,521,093 (12/31/2018) | ||||
| Lockbox/Cash Mgmt Status: | Springing/Springing | 2nd Most Recent NOI(3): | $176,081 (12/31/2017) | ||||
| Additional Debt Type: | N/A | 3rd Most Recent NOI(4): | N/A | ||||
| Additional Debt Balance: | N/A | Most Recent Occupancy: | 97.9% (2/7/2019) | ||||
| Future Debt Permitted (Type): | No (N/A) | 2nd Most Recent Occupancy: | 89.0% (12/31/2018) | ||||
| Reserves | 3rd Most Recent Occupancy: | 82.0% (12/31/2017) | |||||
| Type | Initial | Monthly | Cap | Appraised Value (as of): | $24,500,000 (1/18/2019) | ||
| RE Tax: | $29,654 | $4,743 | N/A | Appraised Value per SF: | $44 | ||
| Insurance: | $0 | $4,218 | N/A | Cut-off Date LTV Ratio: | 74.9% | ||
| Deferred Maintenance: | $1,783,936(1) | $0 | N/A | Maturity Date LTV Ratio: | 61.9% | ||
| Recurring Replacements: | $0 | $7,352 | N/A | ||||
| General TI/LC: | $0 | $8,334 | $300,000(2) | ||||
| Sources and Uses | ||||||
| Sources | Proceeds | % of Total | Uses | Proceeds | % of Total | |
| Loan Amount: | $18,375,000 | 100.0% | Loan Payoff: | $8,537,810 | 46.5% | |
| Return of Equity: | $7,834,345 | 42.6% | ||||
| Reserves: | $1,813,590 | 9.9% | ||||
| Closing Costs: | $189,255 | 1.0% | ||||
| Total Sources: | $18,375,000 | 100.0% | Total Uses: | $18,375,000 | 100.0% | |
| (1) | The Deferred Maintenance Reserve includes $1,749,686 reserved for roof repairs and replacements. The Pontiac West Industrial Mortgage Loan (as defined in “The Mortgage Loan” section below) documents require the Pontiac West Industrial Borrower (as defined in “The Borrower and the Sponsors” section below) to complete the roof repairs and replacements within nine months of the Note Date. |
| (2) | The cap for monthly deposits for TI/LC will not apply (i) upon the occurrence and continuance of an event of default or (ii) if the lender is not provided satisfactory evidence (including an estoppel certificate) that each space currently occupied by Posco Daewoo America Corp. or Penske Vehicle Services, Inc. has been renewed or leased by a replacement tenant (on terms reasonably satisfactory to the lender), which is actually in occupancy, open for business and paying full unabated rent with all applicable tenant improvements and leasing commissions having also been paid. |
| (3) | See“Cash Flow Analysis” below for details regarding the increases from 2nd Most Recent NOI to the Most Recent NOI and from the Most Recent NOI to UW NOI. |
| (4) | Historical financial statements prior to 2017 are not available as the Pontiac West Industrial Property (as defined in “The Mortgage Loan” section below) was vacant until mid-2016. Leases with the two largest tenants, Mahindra North American Technical Center and Penske Vehicle Services, Inc. were not executed until 2017 (see “The Property” section below for a further discussion of the historical vacancy). |
The Mortgage Loan.The fourteenth largest mortgage loan (the “Pontiac West Industrial Mortgage Loan”) is evidenced by a single promissory note in the original principal amount of $18,375,000 and secured by a first priority fee mortgage encumbering an industrial warehouse property located in Pontiac, Michigan (the “Pontiac West Industrial Property”). Proceeds from the Pontiac West Industrial Mortgage Loan were used to refinance the previous loan secured by the Pontiac West Industrial Property, return equity to the Pontiac West Industrial Borrower (as defined below), fund upfront reserves and pay closing costs.
The Borrower and the Sponsors. The borrowers comprise two tenants-in-common, Pontiac West Building, LLC and ICP Pontiac West Building, LLC (collectively, the “Pontiac West Industrial Borrower”), each a Delaware limited liability company and single purpose entity. The borrower sponsors and the non-recourse carveout guarantors are Christopher Semarjian and Stuart Lichter (collectively, the “Pontiac West Industrial Property Sponsors”).
Mr. Semarjian has over 30 years of real estate experience and is the owner of Industrial Commercial Properties, LLC (“ICP”), areal estate development company headquartered in Cleveland, Ohio. Founded in 1996, ICP engages in commercial and industrial rehabilitation, build-to-suits and economic redevelopment. ICP currently owns over 40 million square feet of industrial and commercial space in Ohio, Michigan and Pennsylvania.
This is not a research report and was not prepared by any Underwriter’s research department. Please see additional important information and qualifications at the end of this Term Sheet.
T-128
| Industrial – Warehouse | Loan #14 | Cut-off Date Balance: | $18,355,702 | |
| 660 South Boulevard East | Pontiac West Industrial | Cut-off Date LTV: | 74.9% | |
| Pontiac, MI 48341 | U/W NCF DSCR: | 1.39x | ||
| U/W NOI Debt Yield: | 10.0% | |||
Mr. Lichter is the President and Chairman of Industrial Realty Group (“IRG”), a privately-held real estate development and investment firm engaging in the acquisition, development and management of commercial and industrial real estate across the United States. IRG is a large private holder of industrial and commercial real estate and currently manages more than 150 properties in 28 states, with over 100 million square feet of rentable space.
The Property.The Pontiac West Industrial Property is a 551,400 SF industrial warehouse building located in Pontiac, Michigan approximately 26.0 miles northwest of the Detroit central business district. The Pontiac West Industrial Property is situated on an approximately 44.3-acre site and includes 591 parking spaces, resulting in a parking ratio of approximately 1.1 spaces per 1,000 SF of net rentable area.
According to the appraisal, the Pontiac West Industrial Property formerly served as the GM Pontiac Truck Assembly Center, which shut down operations in 2009 as part of the government mandated corporate restructuring associated with the bailout of the same year. The Pontiac West Industrial Property sat vacant until it was purchased by the Pontiac West Industrial Property Sponsors in January 2015. Since the 2015 acquisition, the Pontiac West Industrial Property has undergone extensive renovation to reposition the asset from an automotive manufacturing center to a multi-tenant warehouse. These improvements include filling in large machinery pits, leveling floors, the removal of mezzanine areas, and the repair of deferred maintenance. Capital improvements total approximately $9,675,000 and were largely performed in association with the tenant build-out allowance to convert the Pontiac West Industrial Property to use by logistics users.
As of February 7, 2019, the Pontiac West Industrial Property was 97.9% occupied by three tenants, and approximately 40.5% of the net rentable area and 41.2% of underwritten base rent at the Pontiac West Industrial Property is attributed to investment grade tenants.
Major Tenants.
Mahindra North American Technical Center(316,519 SF, 57.4% of NRA, 58.8% ofunderwritten rent).In 2013, the Mahindra North American Technical Center (“Mahindra”) was founded to aid in the conception and engineering of Mahindra vehicles. The tenant focuses on designing and delivering original, vehicle platforms across continents and market sectors. In 2017, the company expanded and became Mahindra Automotive North America and became the first automotive original equipment manufacturer in Southeast Michigan in approximately 25 years, having invested approximately $230 million in the region. Mahindra took occupancy at the Pontiac West Industrial Property in 2018 andthe tenant’s headquarters is located approximately 3.1 miles northeast of the Pontiac West Industrial Property in Auburn Hills, Michigan. Mahindra has a lease expiration of December 31, 2024 and has one, 5-year renewal option remaining.
Mahindra has a right of first offer to purchase the Pontiac West Industrial Property in the event that the Pontiac West Industrial Borrower lists or markets the Pontiac West Industrial Property for sale (the “Mahindra ROFO”). The Mahindra ROFO is subordinate to the Pontiac West Industrial Mortgage Loan and is not extinguished by foreclosure; however, the Mahindra ROFO does not apply to foreclosure or deed-in-lieu thereof.
Penske Vehicle Services, Inc.(rated BBB+/Baa2/BBB by Fitch/Moody’s/S&P, 113,742 SF, 20.6% of NRA, 25.2% of underwritten rent).Penske Vehicle Services, Inc. (“Penske”) provides solutions for vehicle lifecycle management and manages company owned assets for its clients from inventory through finaldisposition. Penske has a full service milling center and can produce a single mold or multi-part mold for small quantity to small production runs. Penske employs more than 700 people and operates from over 50 locations across the United States and Canada and uses its space at the Pontiac West Industrial Property for fleet maintenance and technical repair, fabrication, body repair and production and refinishing painting. Penske has a lease expiration of February 28, 2021 and has two, 1-year renewal options remaining.
Posco Daewoo America Corp.(“Daewoo”, rated Baa1/BBB+ by Moody’s/S&P, 109,805 SF, 19.9% of NRA, 16.0% of underwritten rent). Daewoo engagesin the trading of a wide range of products from steel, automotive and components, machinery and industrial electronics to non-ferrous metal, food resources, chemicals, commodities and textiles, with both local and international customers. Daewoo has engaged in overseas resource development projects in oil, gas, mineral and food resources, including bituminous coal in Narrabri, Australia and palm oil in Indonesia. Daewoo has a lease expiration of November 12, 2022 and has one, 5-year renewal option remaining.
The following table presents a summary regarding the tenants at the Pontiac West Industrial Property:
| Tenant Summary(1) | |||||||||
| Tenant Name | Credit Rating (Fitch/Moody’s/S&P)(2) | Tenant SF | Approx. % of SF | Annual UW Rent(3) | % of Total Annual UW Rent | Annual UW Rent PSF(3) | Termination Option (Y/N) | Lease Expiration | Lease Expiration |
| Mahindra | NR/NR/NR | 316,519 | 57.4% | $1,060,339 | 58.8% | $3.35 | N | 12/31/2024 | 1, 5-year |
| Penske | BBB+/Baa2/BBB | 113,742 | 20.6% | $453,590 | 25.2% | $3.99 | N | 2/28/2021 | 2, 1-year |
| Daewoo | NR/Baa1/BBB+ | 109,805 | 19.9% | $289,153 | 16.0% | $2.63 | N | 11/12/2022 | 1, 5-year |
| Subtotal/Wtd. Avg. | 540,066 | 97.9% | $1,803,082 | 100.0% | $3.34 | ||||
| Vacant Space | 11,334 | 2.1% | $0 | 0.0% | $0.00 | ||||
| Total/Wtd. Avg. | 551,400 | 100.0% | $1,803,082 | 100.0% | $3.34(4) | ||||
| (1) | Information is based on the underwritten rent roll dated as of February 7, 2019. |
| (2) | Certain ratings are those of the parent company whether or not the parent guarantees the lease. |
| (3) | Annual UW Rent and Annual UW Rent PSF include a contractual rent step in March 2020 for Penske totaling $11,977 and straight-line rent averaging for the investment grade tenant Daewoo over its remaining lease term totaling $9,150. Penske’s current rent is $3.88 PSF. |
| (4) | Wtd. Avg. Annual UW Rent PSF excludes vacant space. |
This is not a research report and was not prepared by any Underwriter’s research department. Please see additional important information and qualifications at the end of this Term Sheet.
T-129
| Industrial – Warehouse | Loan #14 | Cut-off Date Balance: | $18,355,702 | |
| 660 South Boulevard East | Pontiac West Industrial | Cut-off Date LTV: | 74.9% | |
| Pontiac, MI 48341 | U/W NCF DSCR: | 1.39x | ||
| U/W NOI Debt Yield: | 10.0% | |||
The following table presents certain information with respect to the lease rollover at the Pontiac West Industrial Property:
| Lease Rollover Schedule(1)(2) | ||||||||
| Year | # of Leases Rolling | SF Rolling | Annual UW Rent PSF Rolling | % of Total SF Rolling | Cumulative % of SF Rolling | Annual UW Rent Rolling | % of Annual Rolling | Cumulative % of Annual UW Rent Rolling |
| MTM | 0 | 0 | $0.00 | 0.0% | 0.0% | $0 | 0.0% | 0.0% |
| 2019 | 0 | 0 | $0.00 | 0.0% | 0.0% | $0 | 0.0% | 0.0% |
| 2020 | 0 | 0 | $0.00 | 0.0% | 0.0% | $0 | 0.0% | 0.0% |
| 2021 | 1 | 113,742 | $3.99 | 20.6% | 20.6% | $453,590 | 25.2% | 25.2% |
| 2022 | 1 | 109,805 | $2.63 | 19.9% | 40.5% | $289,153 | 16.0% | 41.2% |
| 2023 | 0 | 0 | $0.00 | 0.0% | 40.5% | $0 | 0.0% | 41.2% |
| 2024 | 1 | 316,519 | $3.35 | 57.4% | 97.9% | $1,060,339 | 58.8% | 100.0% |
| 2025 | 0 | 0 | $0.00 | 0.0% | 97.9% | $0 | 0.0% | 100.0% |
| 2026 | 0 | 0 | $0.00 | 0.0% | 97.9% | $0 | 0.0% | 100.0% |
| 2027 | 0 | 0 | $0.00 | 0.0% | 97.9% | $0 | 0.0% | 100.0% |
| 2028 | 0 | 0 | $0.00 | 0.0% | 97.9% | $0 | 0.0% | 100.0% |
| 2029 | 0 | 0 | $0.00 | 0.0% | 97.9% | $0 | 0.0% | 100.0% |
| Thereafter | 0 | 0 | $0.00 | 0.0% | 97.9% | $0 | 0.0% | 100.0% |
| Vacant | 0 | 11,334 | $0.00 | 2.1% | 100.0% | $0 | 0.0% | 100.0% |
| Total/Wtd. Avg. | 3 | 551,400 | $3.34(3) | 100.0% | $1,803,082 | 100.0% | ||
| (1) | Information is based on the underwritten rent roll. |
| (2) | Certain tenants may have lease termination options that are exercisable prior to the originally stated expiration date of the subject lease and that are not considered in the Lease Rollover Schedule. |
| (3) | Total/Weighted Average UW Rent PSF Rolling excludes vacant space. |
The Market. The Pontiac West Industrial Property is located in Pontiac, Michigan approximately 1.7 miles north of Highway 24 and 3.0 miles west of Interstate 75, 29.2 miles northwest of the Detroit central business district and 35.4 miles northeast of the Detroit Metropolitan Airport. The Pontiac West Industrial Property is situated approximately 15.3 miles northwest of the Canadian National Railway (“CNR”) stop in Ferndale, Michigan. The CNR provides access from the Midwestern United States south to Louisiana, northeast to the Canadian provinces of Quebec and Ontario and northwest into the Canadian provinces of Alberta and British Columbia. Approximately 3.1 miles southwest of the Pontiac West Industrial Property is the Bloomfield Town Square Shopping Center, which features a Costco Wholesale store and fuel station, HomeGoods, Best Buy, Chase Bank, T.J. Maxx and Dick’s Sporting Goods.
According to a third party market research provider, the estimated 2018 population within a three- and five-mile radius of the Pontiac West Industrial Property was approximately 61,566 and 165,325, respectively; and the estimated 2018 average household income within the same radii was approximately $82,559 and $99,072, respectively.
According to a third-party market research report, the Pontiac West Industrial Property is situated within the I-75 Corr/N Oakland Industrial submarket of the Detroit Market. As of year-to-date March 2019, the I-75 Corr/N Oakland Industrial submarket reported a total inventory of approximately 46.3 million SF with a 5.0% vacancy rate, which has decreased from 15.1% in 2010 and has averaged 5.9% from 2013 through 2018. The submarket reported a $7.69 per SF, triple net market rent.
The appraiser identified five directly competitive industrial properties totaling approximately 1.6 million SF with an average occupancy rate of 96.6% and rents ranging from $3.50 to $4.40 PSF, triple net (with one competitive property reporting a rental rate of $4.45 PSF net).
The following table presents certain information relating to the appraisal’s market rent conclusion for the Pontiac West Industrial Property:
| Market Rent Summary | |
| Industrial | |
| Market Rent (PSF) | $3.85 |
| Lease Term (Years) | 5 |
| Lease Type (Reimbursements) | Triple Net |
| Rent Increase Projection | 3.0% per annum |
| Tenant Improvements (New Tenant) (PSF) | $1.00 |
| Tenant Improvements (Renewal) (PSF) | $0.50 |
| Source:Appraisal |
This is not a research report and was not prepared by any Underwriter’s research department. Please see additional important information and qualifications at the end of this Term Sheet.
T-130
| Industrial – Warehouse | Loan #14 | Cut-off Date Balance: | $18,355,702 | |
| 660 South Boulevard East | Pontiac West Industrial | Cut-off Date LTV: | 74.9% | |
| Pontiac, MI 48341 | U/W NCF DSCR: | 1.39x | ||
| U/W NOI Debt Yield: | 10.0% | |||
The following table presents recent leasing data at comparable industrial properties with respect to the Pontiac West Industrial Property:
| Comparable Leases Summary | |||||||||
Property Name / City. State | Built | GLA | Distance from Subject | Occ. % | Tenant Name | Lease Area (SF) | Lease Date | Rent PSF | Lease Type |
Pontiac West Industrial 660 South Boulevard East Pontiac, MI | 1946/2018 | 551,400(1) | - | 97.9%(1) | Various(1) | Various(1) | Various/ Various(1) | $3.34(1) | Triple Net(1) |
Centerpoint Parkway 2011 Centerpoint Parkway Pontiac, MI | 1995/2017 | 887,843 | 0.8 miles | 100.0% | ERAE AMS USA | 156,950 | Oct. 2018/10.0 Yrs
| $4.40 | Triple Net |
Former Kamax Facility 500 W. Long Lake Road Troy, MI | 1978/1999 | 139,997 | 7.7 miles | 100.0% | Paslin | 139,997 | Nov. 2017/5.0 Yrs
| $4.00 | Triple Net |
Manufacturing Facility 275 Rex Boulevard Auburn Hills, MI | 1986/NAV | 151,200 | 3.1 miles | 100.0% | Mahindra | 151,200 | Aug. 2017/2.0 Yrs | $3.50 | Triple Net |
Ferndale Business Park 1450 Academy St. Ferndale, MI | 1945/1961 | 137,133 | 14.8 miles | 83.2% | Casper Corporation
| 80,000 | Jul. 2017/3.0 Yrs | $4.25 | Triple Net |
Industrial Facility 36555 Ecorse Road Romulus, MI | 1998/NAV | 268,000 | 35.8 miles | 100.0% | Bay Logistics | 268,000 | Apr. 2017/10.0 Yrs | $4.45 | Net |
Source: Appraisal and third party market research provider
| (1) | Information is based on the underwritten rent roll. |
This is not a research report and was not prepared by any Underwriter’s research department. Please see additional important information and qualifications at the end of this Term Sheet.
T-131
| Industrial – Warehouse | Loan #14 | Cut-off Date Balance: | $18,355,702 | |
| 660 South Boulevard East | Pontiac West Industrial | Cut-off Date LTV: | 74.9% | |
| Pontiac, MI 48341 | U/W NCF DSCR: | 1.39x | ||
| U/W NOI Debt Yield: | 10.0% | |||
Operating History and Underwritten Net Cash Flow. The following table presents certain information relating to the historical operating performance and Underwritten Net Cash Flow at the Pontiac West Industrial Property:
| Cash Flow Analysis(1)(2) | ||||
| 2017(3) | 2018(3)(4) | UW(4) | UW PSF | |
| Gross Potential Rent(1) | $409,423 | $1,505,824 | $1,846,718 | $3.35 |
| Total Recoveries | $385,051 | $905,907 | $1,010,535 | $1.83 |
| Other Income(5) | $83,731 | $153,628 | $135,816 | $0.25 |
| Less Vacancy & Credit Loss | $0 | $0 | ($92,336)(6) | ($0.17) |
| Effective Gross Income | $878,205 | $2,565,359 | $2,900,734 | $5.26 |
| Real Estate Taxes | $54,229 | $49,123 | $54,208 | $0.10 |
| Insurance | $29,803 | $40,039 | $42,005 | $0.08 |
| Other Operating Expenses | $618,092 | $955,104 | $967,508 | $1.75 |
| Total Expenses | $702,124 | $1,044,266 | $1,063,721 | $1.93 |
| Net Operating Income | $176,081 | $1,521,093 | $1,837,012 | $3.33 |
| Capital Expenditures | $0 | $0 | $88,224 | $0.16 |
| TI/LC | $0 | $0 | $100,000 | $0.18 |
| Net Cash Flow | $176,081 | $1,521,093 | $1,648,788 | $2.99 |
| Occupancy % | 82.0% | 89.0% | 97.9% | |
| NOI DSCR | 0.15x | 1.28x | 1.54x | |
| NCF DSCR | 0.15x | 1.28x | 1.39x | |
| NOI Debt Yield | 1.0% | 8.3% | 10.0% | |
| NCF Debt Yield | 1.0% | 8.3% | 9.0% | |
| (1) | Historical financial statements prior to 2017 are not available as the Pontiac West Industrial Property was vacant until mid-2016. Leases with the two largest tenants, Mahindra North American Technical Center and Penske Vehicle Services, Inc. were not executed until 2017. |
| (2) | UW Gross Potential Base Rent PSF and UW Gross Potential Base Rent include a contractual rent step in March 2020 for Penske totaling $11,977 and straight-line rent averaging for the investment grade tenant Daewoo over its remaining lease term totaling $9,150. |
| (3) | The increase in Effective Gross Income and Net Operating Income from 2017 to 2018 was driven partly by two new leases totaling approximately 84.0% of UW Gross Potential Base Rent signed from August 2017 to November 2017. |
| (4) | The increase in Effective Gross Income and Net Operating Income from 2018 to UW was driven partly by (i) Mahindra’s 27,432 SF expansion on December 1, 2018 and its additional 50,777 SF expansion on January 1, 2019, (ii) Penske’s 7,809 SF expansion on November 1, 2018, (iii) Penske’s contractual rent step occurring in March 2020 totaling $11,977 and (iv) straight-line rent averaging for the investment grade tenant Daewoo over its remaining lease term totaling $9,150. |
| (5) | Other Income is includes parking revenue associated with the Mahindra and Penske leases. |
| (6) | The underwritten economic vacancy is 5.0%. The Pontiac West Industrial Property was 97.9% physically occupied as of February 7, 2019. |
This is not a research report and was not prepared by any Underwriter’s research department. Please see additional important information and qualifications at the end of this Term Sheet.
T-132
(THIS PAGE INTENTIONALLY LEFT BLANK)
T-133
| Mortgage Loan No. 15 – Artisan Square |
| Mortgage Loan Information | Mortgaged Property Information | |||||
| Mortgage Loan Seller: | WFB | Single Asset/Portfolio: | Single Asset | |||
| Credit Assessment (KBRA/Fitch/S&P): | NR/NR/NR | Location: | Bakersfield, CA 93314 | |||
| Original Balance: | $15,500,000 | General Property Type: | Retail | |||
| Cut-off Date Balance: | $15,500,000 | Detailed Property Type: | Shadow Anchored | |||
| % of Initial Pool Balance: | 1.9% | Title Vesting: | Fee | |||
| Loan Purpose: | Refinance | Year Built/Renovated: | 2017/N/A | |||
| Sponsors: | Ronald G. Froehlich, Jr.; Sherie A. | Size: | 67,013 SF | |||
| Roberts; Sherie A. Roberts Separate | Cut-off Date Balance per SF: | $231 | ||||
| Property Trust; Froehlich Living Trust | Maturity Date Balance per SF: | $231 | ||||
| Guarantors: | Ronald G. Froehlich, Jr.; Sherie A. | Property Manager: | M.D. Atkinson Company, Inc. | |||
| Roberts; Sherie A. Roberts Separate | Underwriting and Financial Information | |||||
| Property Trust; Froehlich Living Trust | UW NOI(3): | $1,398,090 | ||||
| Mortgage Rate: | 4.8750% | UW NOI Debt Yield: | 9.0% | |||
| Note Date: | 3/8/2019 | UW NOI Debt Yield at Maturity: | 9.0% | |||
| First Payment Date: | 4/11/2019 | UW NCF DSCR: | 1.78x | |||
| Maturity Date: | 3/11/2029 | Most Recent NOI: | $748,765 (12/31/2018) | |||
| Original Term to Maturity: | 120 months | 2nd Most Recent NOI(3): | $380,318 (12/31/2017) | |||
| Original Amortization Term: | 0 months | 3rd Most Recent NOI(3): | N/A | |||
| IO Period: | 120 months | Most Recent Occupancy: | 92.7% (3/1/2019) | |||
| Seasoning: | 1 month | 2nd Most Recent Occupancy(4): | 74.7% (12/31/2018) | |||
| Prepayment Provisions: | LO (25); DEF (91); O (4) | 3rd Most Recent Occupancy(4): | 47.7% (12/31/2017) | |||
| Lockbox/Cash Mgmt Status: | Springing/Springing | Appraised Value (as of)(5): | $24,000,000 (9/1/2019) | |||
| Additional Debt Type: | N/A | Appraised Value per SF(5): | $358 | |||
| Additional Debt Balance: | N/A | Cut-off Date LTV Ratio(5): | 64.6% | |||
| Future Debt Permitted (Type): | No (N/A) | Maturity Date LTV Ratio(5): | 64.6% | |||
| Reserves | ||||||
| Type | Initial | Monthly | Cap | |||
| RE Tax: | $4,622 | $4,622 | N/A | |||
| Insurance: | $2,203 | $2,203 | N/A | |||
| Replacement Reserves: | $0 | $538 | (1) | |||
| General TI/LC: | $150,000 | $3,385 | $150,000 | |||
| Existing TI/LC(2): | $902,228 | N/A | N/A | |||
| Sources and Uses | ||||||
| Sources | Proceeds | % of Total | Uses | Proceeds | % of Total | |
| Loan Amount: | $15,500,000 | 100.0% | Loan Payoff: | $12,015,417 | 77.5% | |
| Return of Equity: | $2,270,788 | 14.7% | ||||
| Reserves: | $1,059,053 | 6.8% | ||||
| Closing Costs: | $154,742 | 1.0% | ||||
| Total Sources: | $15,500,000 | 100.0% | Total Uses: | $15,500,000 | 100.0% | |
| (1) | Replacement Reserves are capped at $12,912 unless (i) an event of default has occurred and is continuing; or (ii) the Artisan Square Property (as defined below) is not being maintained as reasonably determined by the lender. |
| (2) | Represents outstanding rent concessions, gap rent and tenant improvement costs related to three new leases totaling 7,339 SF (10.9% NRA): Rancho Grande Restaurant ($274,367), Priority Urgent Care, Inc. ($564,607), and Cigars & More ($63,254). |
| (3) | See “Cash Flow Analysis” section below for explanations on historical fluctuations in NOI. Historical NOI prior to 2016 is not available as the property was constructed in 2017. |
| (4) | See “Historical Occupancy” section below for explanations on historical fluctuations in occupancy. The Artisan Square Property was built in 2017. |
| (5) | The Appraised Value (as of), Appraised Value Per SF, Cut-off Date LTV Ratio and Maturity Date LTV Ratio are based on the appraiser’s prospective “as stabilized” value as of September 1, 2019 , which assumes completion of currently ongoing tenant improvements. The appraiser concluded to an “as-is” appraised value of $20,800,000 as of December 7, 2018, which would result in a Cut-off Date LTV Ratio and Maturity Date LTV Ratio of 74.5%. |
The Mortgage Loan.The fifteenth largest mortgage loan (the “Artisan Square Mortgage Loan”) is evidenced by a promissory note in the original principal amount of $15,500,000 and secured by a first priority fee mortgage encumbering a shadow anchored retail center located in Bakersfield, California (the “Artisan Square Property”).
The Borrower and the Sponsors. The borrower is Froehlich Ranch, LLC (the “Artisan Square Borrower”), a California limited liability company. The borrower sponsors and the non-recourse carveout guarantors are Ronald G. Froehlich, Jr., Sherie A. Roberts, Sherie A. Roberts Separate Property Trust, and Froehlich Living Trust. The Artisan Square Borrower is managed by Ronald G. Froehlich, Jr. and Sherie A. Roberts.
Ronald G. Froehlich, Jr. is the founder and President of Froehlich Development. Since inception in 1987, Froehlich Development has developed residential and commercial properties in Bakersfield, including luxury and semi-custom single-family homes, luxury apartment buildings, and various commercial and retail properties.
This is not a research report and was not prepared by any Underwriter’s research department. Please see additional important information and qualifications at the end of this Term Sheet.
T-134
| Retail – Shadow Anchored | Loan #15 | Cut-off Date Balance: | $15,500,000 | |
| Various | Artisan Square | Cut-off Date LTV: | 64.6% | |
| Bakersfield, CA 93314 | U/W NCF DSCR: | 1.78x | ||
| U/W NOI Debt Yield: | 9.0% | |||
The Property.The Artisan Square Property is a shadow anchored neighborhood retail center comprising nine, one-story buildings totaling 67,013 SF located in Bakersfield, California. Built in 2017, the Artisan Square Property is situated on an approximately 10.35-acre site and is part of the larger Artisan Square Shopping Center anchored by a Walmart Neighborhood Market, which is not part of the collateral for the Artisan Square Mortgage Loan. The Artisan Square Property contains 467 parking spaces, resulting in a parking ratio of 7.0 spaces per 1,000 SF of rentable area.
As of March 1, 2019, the Artisan Square Property was 92.7% occupied by 21 tenants, including three pad site tenants which ground lease land and own their improvements (19.4% of underwritten base rent). The largest tenant at the Artisan Square Property is Body Xchange Fitness (ground lease tenant; 30.0% of NRA; 8.5% of underwritten base rent), and no other tenant accounts for more than 7.4% of the NRA or 9.7% of underwritten base rent. Excluding the three pad sites (ground leased to the related tenants), approximately 50.0% of the NRA at the Artisan Square Property was pre-leased prior to construction; an additional 27.8% of the NRA was signed within two months of the completion of construction; and the remaining leases in-place were signed within eight months of the completion of construction.
Major Tenants.
Body Xchange Fitness (20,114 SF, 30.0% of NRA, 8.5% ofunderwritten rent). Body Xchange Fitness is a health club chain operating in Bakersfield and Moorpark, California. Founded in 2003, Body Xchange Fitness has grown to seven clubs, offering state-of-the-art equipment, cardio and resistance training, high-energy group exercise classes, personal trainers, basketball courts, and child care. Body Xchange Fitness is subject to a ground lease with a lease expiration of April 30, 2047 with six, 5-year renewal options remaining. The tenant’s lease is structured with 13.5% rent increases every five years throughout the lease term, with the first rent increase effective on April 1, 2022. In addition, the tenant has the right to terminate its lease on April 30, 2037 with 365 days’ prior written notice.
The following table presents a summary regarding the largest tenants at the Artisan Square Property:
| Tenant Summary(1) | |||||||||||
| Tenant Name | Credit Rating (Fitch/Moody’s/S&P) | Tenant SF | App.% of SF | Annual UW Rent(2) | Annual UW Rent PSF(2) | Most Recent Sales | |||||
| App. % of Total Annual UW Rent | $ | PSF | Occ. Cost % | Term. Option(Y/N) | Lease Expiration | ||||||
| Body Xchange Fitness(3) | NR/NR/NR | 20,114 | 30.0% | $125,000 | $6.21 | 8.5% | NAV | NAV | NAV | Y | 4/30/2047 |
| Dentists of Bakersfield | NR/NR/NR | 4,971 | 7.4% | $134,217 | $27.00 | 9.1% | NAV | NAV | NAV | N | 11/30/2028 |
| Kern Schools Federal Credit Union | NR/NR/NR | 4,222 | 6.3% | $80,000 | $18.95 | 5.4% | NAV | NAV | NAV | N | 6/30/2027 |
| Priority Urgent Care, Inc.(4) | NR/NR/NR | 3,984 | 5.9% | $142,740 | $35.83 | 9.7% | NAV | NAV | NAV | N | 6/30/2029 |
| The Habit Restaurant | NR/NR/NR | 2,484 | 3.7% | $102,838 | $41.40 | 7.0% | NAV | NAV | NAV | N | 6/30/2027 |
| Subtotal/Wtd. Avg. | 35,775 | 53.4% | $584,795 | $16.35 | 39.8% | ||||||
| Other Tenants | 26,376 | 39.4% | 884,756 | $33.54 | 60.2% | ||||||
| Vacant Space | 4,862 | 7.3% | $0 | $0.00 | 0.0% | ||||||
| Total/Wtd. Avg. | 67,013 | 100.0% | $1,469,551 | $23.64 | 100.0% | ||||||
| (1) | Information is based on the underwritten rent roll dated March 1, 2019 |
| (2) | Annual U/W Rent PSF and Annual U/W Rent include contractual rent steps through March 2020 for 6 tenants totaling $7,844. |
| (3) | Body Xchange Fitness has the one-time right to terminate its lease on April 30, 2037, with 365 days’ prior written notice. |
| (4) | Priority Urgent Care, Inc. took possession of its space on February 1, 2019 and is currently building out its improvements. Rent is expected to commence on July 1, 2019, and an upfront reserve of $564,607 was taken for gap rent and outstanding tenant improvement obligations. |
This is not a research report and was not prepared by any Underwriter’s research department. Please see additional important information and qualifications at the end of this Term Sheet.
T-135
| Retail – Shadow Anchored | Loan #15 | Cut-off Date Balance: | $15,500,000 | |
| Various | Artisan Square | Cut-off Date LTV: | 64.6% | |
| Bakersfield, CA 93314 | U/W NCF DSCR: | 1.78x | ||
| U/W NOI Debt Yield: | 9.0% | |||
The following table presents certain information with respect to the lease rollover at the Artisan Square Property:
| Lease Rollover Schedule(1)(2) | ||||||||
| Year | # of Leases Rolling | SF Rolling | Annual UW Rent PSF Rolling(3) | % of Total SF Rolling | Cumulative % of SF Rolling | Annual UW Rent Rolling(3) | % of Annual UW Rent Rolling | Cumulative % of Annual UW Rent Rolling |
| 2019 | 0 | 0 | $0.00 | 0.0% | 0.0% | $0 | 0.0% | 0.0% |
| 2020 | 0 | 0 | $0.00 | 0.0% | 0.0% | $0 | 0.0% | 0.0% |
| 2021 | 0 | 0 | $0.00 | 0.0% | 0.0% | $0 | 0.0% | 0.0% |
| 2022 | 0 | 0 | $0.00 | 0.0% | 0.0% | $0 | 0.0% | 0.0% |
| 2023 | 7 | 10,327 | $30.21 | 15.4% | 15.4% | $312,027 | 21.2% | 21.2% |
| 2024 | 1 | 1,210 | $27.00 | 1.8% | 17.2% | $32,670 | 2.2% | 23.5% |
| 2025 | 0 | 0 | $0.00 | 0.0% | 17.2% | $0 | 0.0% | 23.5% |
| 2026 | 0 | 0 | $0.00 | 0.0% | 17.2% | $0 | 0.0% | 23.5% |
| 2027 | 3 | 8,706 | $29.27 | 13.0% | 30.2% | $254,838 | 17.3% | 40.8% |
| 2028 | 6 | 13,612 | $32.79 | 20.3% | 50.5% | $446,343 | 30.4% | 71.2% |
| 2029 | 2 | 6,129 | $35.68 | 9.1% | 59.7% | $218,673 | 14.9% | 86.1% |
| 2030 & Beyond | 2 | 22,167 | $9.25 | 33.1% | 92.7% | $205,000 | 13.9% | 100.0% |
| Vacant | 0 | 4,862 | $0.00 | 7.3% | 100.0% | $0 | 0.0% | 100.0% |
| Total/Wtd. Avg. | 21 | 67,013 | $23.64 | 100.0% | $1,469,551 | 100.0% | ||
| (1) | Information is based on the underwritten rent roll. |
| (2) | Certain tenants may have lease termination options that are exercisable prior to the originally stated expiration date of the subject lease and that are not considered in the Lease Rollover Schedule. |
| (3) | Total/Weighted Average Annual U/W Rent Rolling and Annual U/W Rent PSF Rolling exclude vacant space. |
The following table presents historical occupancy percentages at the Artisan Square Property:
Historical Occupancy(1) | ||||
12/31/2015(2) | 12/31/2016(2) | 12/31/2017(3) | 12/31/2018(4) | 3/1/2019(5)(6) |
| N/A | N/A | 47.7% | 74.7% | 92.7% |
| (1) | Information obtained from the borrower. |
| (2) | Further historical occupancy is not available as the Artisan Square Property was constructed in 2017. |
| (3) | Occupancy increased from 2016 to 2017 due to eight tenants totaling 31,963 SF (47.7% NRA) taking occupancy in 2017. |
| (4) | Occupancy increased from 2017 to 2018 due to 11 tenants totaling 14,138 SF (21.0% NRA) taking occupancy in 2018, and five tenants completing their buildout for 3,981 SF (5.9% NRA). |
| (5) | Occupancy increased from 2018 to 3/1/2019 due to two tenants totaling 6,129 SF (9.1% NRA) taking occupancy in 2019, and 10 tenants completing their buildout for 5,940 SF (8.9% NRA). |
| (6) | Information obtained from the underwritten rent roll. |
The Market. The Artisan Square Property is located in Bakersfield, California. According to a government census bureau, Bakersfield experienced a 40.7% population increase from 2000 to 2010 from 247,000 to 347,500 people, and had a population of approximately 380,900 people as of 2017, a 9.6% increase from 2010. The Artisan Square Property is located in the western portion of Bakersfield where, according to the appraisal, there is growth and expanding city limits, due to physical and municipal constraints to the North and East. According to the appraisal, the average daily traffic volume adjacent to the Artisan Square Property is approximately 30,000 cars per day, and the area immediately surrounding the Artisan Square Property is developed with residential subdivisions and has limited material vacant land for commercial growth. The 2018 population within a one-, three- and five-mile radius of the Artisan Square Property was 9,335, 71,447 and 157,277, respectively. The estimated 2018 median household income within a one-, three- and five-mile radius of the Artisan Square Property was $113,203, $94,919 and $89,849, respectively.
The Artisan Square Property is located within the Northwest Bakersfield submarket of the Bakersfield retail market. According to a third party market research report, as of the fourth quarter of 2018, the submarket reported total inventory of approximately 3.8 million SF of retail space with a 2.0% vacancy rate and asking rent of $20.42 PSF. The appraiser identified six comparable properties totaling 950,478 SF within 7.5 miles of the Artisan Square Property, which reported occupancy rates ranging from 95.0% to 100.0% with an average of 98.8%.
This is not a research report and was not prepared by any Underwriter’s research department. Please see additional important information and qualifications at the end of this Term Sheet.
T-136
| Retail – Shadow Anchored | Loan #15 | Cut-off Date Balance: | $15,500,000 | |
| Various | Artisan Square | Cut-off Date LTV: | 64.6% | |
| Bakersfield, CA 93314 | U/W NCF DSCR: | 1.78x | ||
| U/W NOI Debt Yield: | 9.0% | |||
The following table presents certain information relating to the appraiser’s market rent conclusion for the Artisan Square Property:
| Market Rent Summary(1) | |||
| Ground Lease | Drive Thru | Shop Space | |
| Market Rent (PSF) | $6.21 - $37.75 | $39.00 | $28.20 - $37.20 |
| Lease Term (Years) | 20 | 10 | 5 |
| Lease Type (Reimbursements) | Net | Net | Net |
| Rent Increase Projection | 10.0% / 5 years | 10.0% / 5 years | 3.0% per annum |
| (1) | Information obtained from the appraisal. |
The following table presents certain information relating to comparable properties to the Artisan Square Property, as identified by the appraisal:
| Comparable Properties(1) | |||||||
Artisan Square (Subject) | Smart & Final Plaza | California Pavilion | Shops at River Walk | The Marketplace | Rosedale Village | Riverlakes Village | |
| Location | Bakersfield, CA | Bakersfield, CA | Bakersfield, CA | Bakersfield, CA | Bakersfield, CA | Bakersfield, CA | Bakersfield, CA |
| Distance from Subject | -- | 6.3 miles | 7.5 miles | 2.8 miles | 4.1 miles | 1.5 miles | 5.0 miles |
| Property Type | Neighborhood Center | Neighborhood Center | Retail portion of a Power Center | Neighborhood Center | Neighborhood Center | Neighborhood Center | Neighborhood Center |
| Year Built/Renovated | 2017/N/A | 2018/N/A | 2016/N/A | 2009/N/A | 1996/N/A | 1990/N/A | 1998/N/A |
| Anchors | Walmart Neighborhood Market (Shadow Anchored) | Smart & Final Extra | N/A | Target, Nordstrom Rack, Sprouts Farmers Market, T.J. Maxx | Vons and Edwards Theatres | Dollar Tree | Vons and CVS |
| Total GLA | 67,013 SF(2) | 39,017 SF | 104,300 SF | 194,917 SF | 298,619 SF | 221,414 SF | 92,211 SF |
| Total Occupancy | 92.7%(2) | 100.0% | 100.0% | 100.0% | 98.0% | 95.0% | 100.0% |
(1) Information is obtained from the appraisal.
(2) Information is obtained from the underwritten rent roll.
This is not a research report and was not prepared by any Underwriter’s research department. Please see additional important information and qualifications at the end of this Term Sheet.
T-137
| Retail – Shadow Anchored | Loan #15 | Cut-off Date Balance: | $15,500,000 | |
| Various | Artisan Square | Cut-off Date LTV: | 64.6% | |
| Bakersfield, CA 93314 | U/W NCF DSCR: | 1.78x | ||
| U/W NOI Debt Yield: | 9.0% | |||
Operating History and Underwritten Net Cash Flow. The following table presents certain information relating to historical operating performance and the Underwritten Net Cash Flow at the Artisan Square Property:
| Cash Flow Analysis(1) | ||||
| 2017 | 2018(2) | UW(3) | UW PSF | |
| Gross Potential Rent(4) | $341,665 | $851,641 | $1,650,417 | $24.63 |
| Total Recoveries | $36,292 | $133,485 | $500,017 | $7.46 |
| Other Income | $109,746 | $75 | $0 | $0.00 |
| Less Vacancy & Credit Loss | $0 | $0 | ($180,866) | ($2.70) |
| Effective Gross Income | $487,703 | $985,201 | $1,969,567 | $29.39 |
| Real Estate Taxes | $8,268 | $34,425 | $280,157 | $4.18 |
| Insurance | $9,149 | $14,827 | $25,176 | $0.38 |
| Other Operating Expenses | $89,969 | $187,184 | $266,144 | $3.97 |
| Total Expenses | $107,385 | $236,436 | $571,477 | $8.53 |
| Net Operating Income | $380,318 | $748,765 | $1,398,090 | $20.86 |
| Capital Expenditures | $0 | $0 | $6,450 | $0.10 |
| TI/LC | $0 | $0 | $26,925 | $0.40 |
| Net Cash Flow | $380,318 | $748,765 | $1,364,715 | $20.36 |
| Occupancy %(5) | 47.7% | 74.7% | 89.0% | |
| NOI DSCR | 0.50x | 0.98x | 1.82x | |
| NCF DSCR | 0.50x | 0.98x | 1.78x | |
| NOI Debt Yield | 2.5% | 4.8% | 9.0% | |
| NCF Debt Yield | 2.5% | 4.8% | 8.8% | |
| (1) | Historical Net Cash Flow statements prior to 2017 are not available as the Artisan Square Property was constructed in 2017. |
| (2) | Gross Potential Rent and Net Operating Income increased from 2017 to 2018 partially due to 17 new leases totaling 52,759 SF (78.7% NRA, 77.5% UW rent) with lease commencement dates ranging from April 2017 to November 2018. |
| (3) | Gross Potential Rent and Net Operating Income increased from 2018 to UW partially due to ten new leases totaling 18,868 SF (28.2% NRA, 38.4% UW rent) with lease commencement dates ranging from May 2018 to March 2019, two new leases totaling 6,129 SF (9.1% NRA, 14.9% UW rent) expected to commence rent in July 2019, and grossed up market rent for vacant space totaling 4,862 SF (7.3% NRA). |
| (4) | UW Gross Potential Rent is based on the underwritten rent roll dated March 1, 2019 and includes rent steps through March 2020 totaling $7,844. |
| (5) | UW Occupancy % represents economic occupancy. The Artisan Square Property was 92.7% physically occupied as of March 1, 2019. |
This is not a research report and was not prepared by any Underwriter’s research department. Please see additional important information and qualifications at the end of this Term Sheet.
T-138
| BANK 2019-BNK17 |
This material was prepared by sales, trading, banking or other non-research personnel of one of the following: Morgan Stanley & Co. LLC, Morgan Stanley & Co. International Limited, Morgan Stanley Japan Limited and/or Morgan Stanley Dean Witter Asia Limited (together with their affiliates, hereinafter “Morgan Stanley”), Wells Fargo Securities, LLC (together with its affiliates, “Wells Fargo”), Merrill Lynch, Pierce, Fenner & Smith Incorporated (together with its affiliates, “BofA Merrill Lynch”), Academy Securities, Inc. (together with its affiliates, “Academy”) and Drexel Hamilton, LLC (together with its affiliates, “Drexel” and collectively with Morgan Stanley, Wells Fargo, BofA Merrill Lynch and Academy, the “Underwriters”). This material was not produced by an Underwriter’s research analyst, although it may refer to an Underwriter’s research analyst or research report. Unless otherwise indicated, these views (if any) are the author’s and may differ from those of the fixed income or equity research departments of the Underwriters or others in those firms.
This material may have been prepared by or in conjunction with the respective trading desks of the Underwriters that may deal as principal in or own or act as market maker or liquidity provider for the securities/instruments (or related derivatives) mentioned herein. The trading desk may have accumulated a position in the subject securities/instruments based on the information contained herein. Trading desk materials are not independent of the proprietary interests of the Underwriters, which may conflict with your interests. Each of the Underwriters may also perform or seek to perform investment banking services for the issuers of the securities and instruments mentioned herein.
The information contained in this material is subject to change, completion or amendment from time to time, and the information in this material supersedes information in any other communication relating to the securities referred to in this material. This material is not a solicitation to participate in any trading strategy, and is not an offer to sell any security or instrument or a solicitation of an offer to buy or sell any security or instrument in any jurisdiction where an offer, solicitation or sale is not permitted. Unless otherwise set forth in this material, any securities referred to in this material may not have been registered under the U.S. Securities Act of 1933, as amended, and, if not, may not be offered or sold absent an exemption therefrom. Recipients are required to comply with any legal or contractual restrictions on their purchase, holding, sale, exercise of rights or performance of obligations under any securities/instruments transaction.
The securities/instruments discussed in this material may not be suitable for all investors. This material has been prepared and issued by the Underwriters for intended distribution to market professionals and institutional investor clients. Other recipients should seek independent investment advice prior to making any investment decision based on this material. This material does not provide individually tailored investment advice or offer tax, regulatory, accounting or legal advice. Prior to entering into any proposed transaction, recipients should determine, in consultation with their own investment, legal, tax, regulatory and accounting advisors, the economic risks and merits, as well as the legal, tax, regulatory and accounting characteristics and consequences, of the transaction. You should consider this material as only a single factor in making an investment decision. The value of and income from investments may vary because of changes in interest rates, foreign exchange rates, default rates, prepayment rates, securities/instruments prices, market indexes, operational or financial conditions of companies or other factors. There may be time limitations on the exercise of options or other rights in securities/instruments transactions. Past performance is not necessarily a guide to future performance. Estimates of future performance are based on assumptions that may not be realized. Actual events may differ from those assumed and changes to any assumptions may have a material impact on any projections or estimates. Other events not taken into account may occur and may significantly affect the projections or estimates. Certain assumptions may have been made for modeling purposes only to simplify the presentation and/or calculation of any projections or estimates, and the Underwriters do not represent that any such assumptions will reflect actual future events. Accordingly, there can be no assurance that estimated returns or projections will be realized or that actual returns or performance results will not materially differ from those estimated herein.
Some of the information contained in this document may be aggregated data of transactions in securities or other financial instruments executed by an
Underwriter that has been compiled so as not to identify the underlying transactions of any particular customer.
Notwithstanding anything herein to the contrary, the Underwriters and each recipient hereof (and their employees, representatives, and other agents) may disclose to any and all persons, without limitation of any kind from the commencement of discussions, the U.S. federal and state income tax treatment and tax structure of the transaction and all materials of any kind (including opinions or other tax analyses) that are provided to it relating to the tax treatment and tax structure (as such terms are defined in Treasury Regulation 1.6011-4). For this purpose, “tax structure” is limited to facts relevant to the U.S. federal and state income tax treatment of the transaction and does not include information relating to the identity of the parties, their affiliates, agents or advisors. This authorization of tax disclosure is retroactively effective to the commencement of discussions with prospective investors regarding the transactions contemplated herein.
This material has been prepared by the Underwriters for information purposes only and does not constitute, in whole or in part, a prospectus for the purposes of Directive 2003/71/EC (as amended or superseded) and/or Part VI of the Financial Services and Markets Act 2000, as amended, or other offering document.
THE DISTRIBUTION OF THIS MATERIAL (A) IF MADE BY A PERSON WHO IS NOT AN AUTHORIZED PERSON UNDER THE FINANCIAL SERVICES AND MARKETS ACT 2000 (“FSMA”), IS BEING MADE ONLY TO, OR DIRECTED ONLY AT, PERSONS WHO (I) HAVE PROFESSIONAL EXPERIENCE OF MATTERS RELATING TO INVESTMENTS AND QUALIFY AS INVESTMENT PROFESSIONALS IN ACCORDANCE WITH ARTICLE 19(5) OF THE FINANCIAL SERVICES AND MARKETS ACT 2000 (FINANCIAL PROMOTION) ORDER 2005 (THE “FINANCIAL PROMOTION ORDER”), OR (II) ARE PERSONS FALLING WITHIN ARTICLE 49(2)(A) THROUGH (D) (HIGH NET WORTH COMPANIES, UNINCORPORATED ASSOCIATIONS, ETC.) OF THE FINANCIAL PROMOTION ORDER OR (III) ARE PERSONS TO WHOM THIS MATERIAL MAY OTHERWISE LAWFULLY BE COMMUNICATED; AND (B) IF MADE BY A PERSON WHO IS AN AUTHORIZED PERSON UNDER THE FSMA, IS BEING MADE ONLY TO, OR DIRECTED ONLY AT, PERSONS WHO (I) HAVE PROFESSIONAL EXPERIENCE OF PARTICIPATING IN UNREGULATED SCHEMES (AS DEFINED FOR PURPOSES OF THE FINANCIAL SERVICES AND MARKETS ACT 2000 (PROMOTION OF COLLECTIVE INVESTMENT SCHEMES) (EXEMPTIONS) ORDER 2001 (THE “PROMOTION OF COLLECTIVE INVESTMENT SCHEMES EXEMPTIONS ORDER”)) AND QUALIFY AS INVESTMENT PROFESSIONALS IN ACCORDANCE WITH ARTICLE 14(5) OF THE PROMOTION OF COLLECTIVE INVESTMENT SCHEMES EXEMPTIONS ORDER, OR (II) ARE PERSONS FALLING WITHIN ARTICLE 22(2)(A) THROUGH (D) (“HIGH NET WORTH COMPANIES, UNINCORPORATED ASSOCIATIONS, ETC.”) OF THE PROMOTION OF COLLECTIVE INVESTMENT SCHEMES EXEMPTIONS ORDER, OR (III) ARE PERSONS TO WHOM THE ISSUING ENTITY MAY LAWFULLY BE PROMOTED IN ACCORDANCE WITH CHAPTER 4.12 OF THE UK FINANCIAL CONDUCT AUTHORITY’S CONDUCT OF BUSINESS SOURCEBOOK.
THE OFFERED CERTIFICATES HAVE NOT BEEN AND WILL NOT BE REGISTERED UNDER THE FINANCIAL INSTRUMENTS EXCHANGE ACT OF JAPAN (LAW NO. 25 OF 1948, AS AMENDED (THE “FIEL”)), AND EACH OF MORGAN STANLEY & CO. LLC, WELLS FARGO SECURITIES, LLC, MERRILL LYNCH, PIERCE, FENNER & SMITH INCORPORATED, ACADEMY SECURITIES, INC. AND DREXEL HAMILTON, LLC HAS AGREED THAT IT WILL NOT OFFER OR SELL ANY OFFERED CERTIFICATES, DIRECTLY OR INDIRECTLY, IN JAPAN OR TO, OR FOR THE BENEFIT OF, ANY JAPANESE PERSON, OR TO OTHERS FOR RE-OFFERING OR RESALE, DIRECTLY OR INDIRECTLY, IN JAPAN OR TO ANY JAPANESE PERSON, EXCEPT PURSUANT TO AN EXEMPTION FROM THE REGISTRATION REQUIREMENTS OF, AND OTHERWISE IN COMPLIANCE WITH, THE FIEL AND ANY OTHER APPLICABLE LAWS AND REGULATIONS. FOR THE PURPOSES OF THIS PARAGRAPH, “JAPANESE PERSON” SHALL MEAN ANY PERSON RESIDENT IN JAPAN, INCLUDING ANY CORPORATION OR OTHER ENTITY ORGANIZED UNDER THE LAWS AND REGULATIONS OF JAPAN.
©2019 Morgan Stanley